WEB GRAPHS (Chap 3 of Baldi) Wen-Hsiang Lu ( 盧文祥 ) Department of Computer Science and...
41
WEB GRAPHS (Chap 3 of Baldi) Wen-Hsiang Lu ( 盧盧盧 ) Department of Computer Science and Information Engineering, National Cheng Kung University 2005/10/6
-
date post
19-Dec-2015 -
Category
Documents
-
view
224 -
download
3
Transcript of WEB GRAPHS (Chap 3 of Baldi) Wen-Hsiang Lu ( 盧文祥 ) Department of Computer Science and...
WEB GRAPHS(Chap 3 of Baldi)
Wen-Hsiang Lu (盧文祥 )Department of Computer Science and Information Engineering,
National Cheng Kung University2005/10/6
Internet/Web as Graphs• Graph of the physical layer with routers ,
computers etc as nodes and physical connections as edges– It is limited– Does not capture the graphical connections
associated with the information on the Internet
• Web Graph where nodes represent web pages and edges are associated with hyperlinks
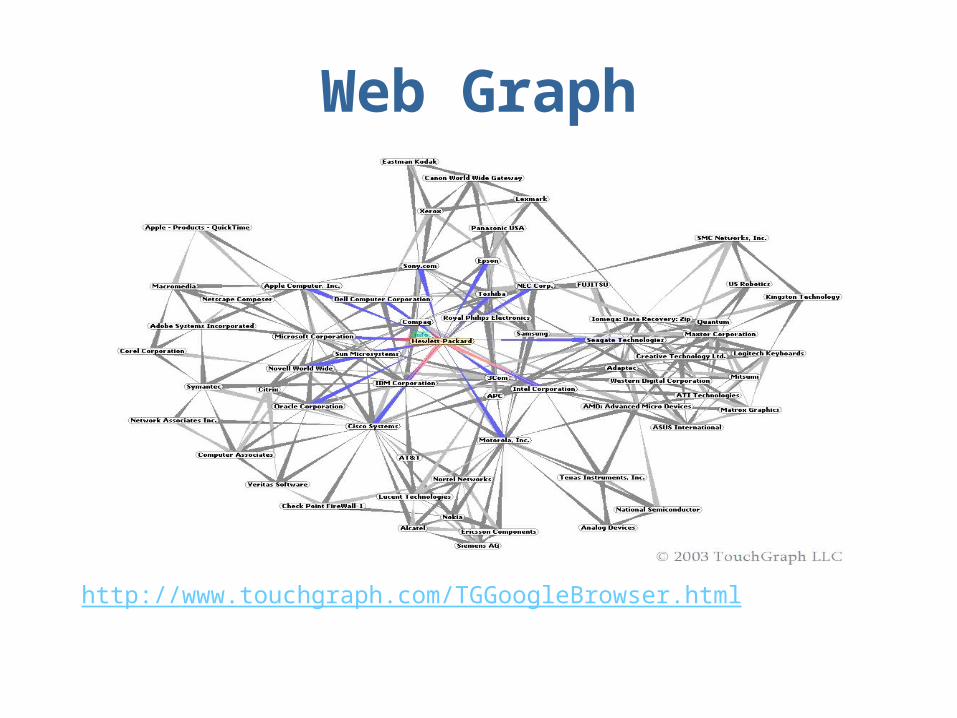
Web Graph
http://www.touchgraph.com/TGGoogleBrowser.html
Web Graph Considerations
• Edges can be directed or undirected• Graph is highly dynamic
– Nodes and edges are added/deleted often– Content of existing nodes is also subject to
change– Pages and hyperlinks created on the fly
• Apart from primary connected component there are also smaller disconnected components

Why the Web Graph?• Example of a large,dynamic and
distributed graph• Possibly similar to other complex graphs in
social, biological and other systems• Reflects how humans organize information
(relevance, ranking) and their societies• Efficient navigation algorithms • Study behavior of users as they traverse
the web graph (e-commerce)
Statistics of Interest
• Size and connectivity of the graph
• Number of connected components
• Distribution of pages per site
• Distribution of incoming and outgoing connections per site
• Average and maximal length of the shortest path between any two vertices (diameter)

Properties of Web Graphs
• Connectivity follows a power law distribution– f (x) = Cx-r, r>1, x[1, )
• The graph is sparse– |E| = O(n) or at most o(n2)– Average number of hyperlinks per page
roughly a constant
• A small world graph
Power Law Size• Simple estimates suggest over a billion
nodes
• Distribution of site sizes measured by the number of pages follow a power law distribution
• Observed over several orders of magnitude with an exponent in the 1.6-1.9 range
Power Law Connectivity
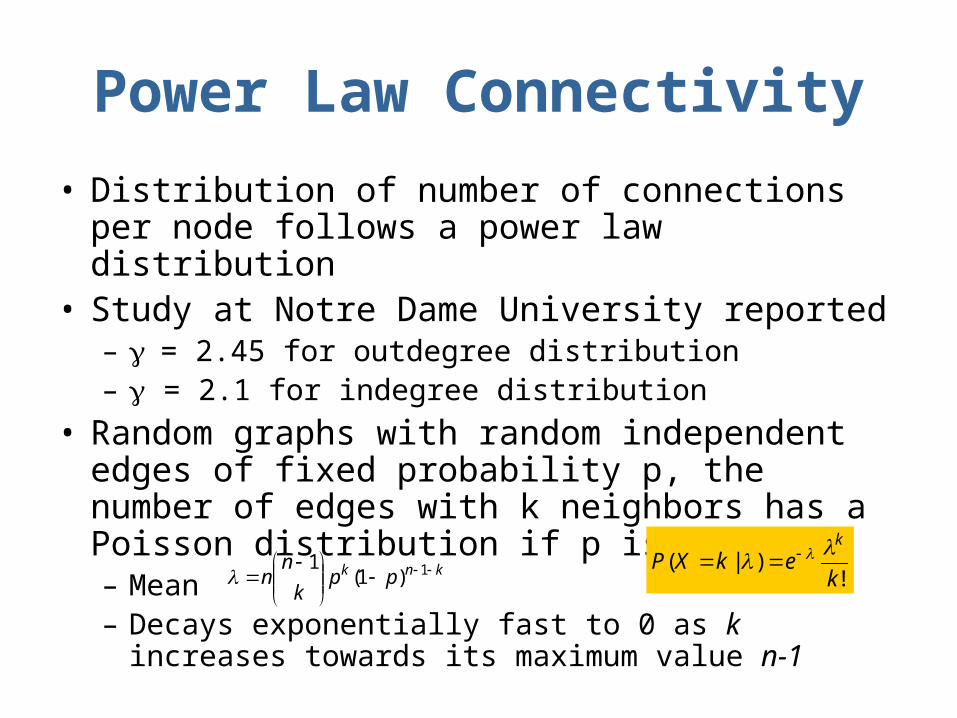
• Distribution of number of connections per node follows a power law distribution
• Study at Notre Dame University reported – = 2.45 for outdegree distribution– = 2.1 for indegree distribution
• Random graphs with random independent edges of fixed probability p, the number of edges with k neighbors has a Poisson distribution if p is small.– Mean – Decays exponentially fast to 0 as k increases towards
its maximum value n-1
knk ppk
nn
1)1(
1 !
)|(k
ekXPk
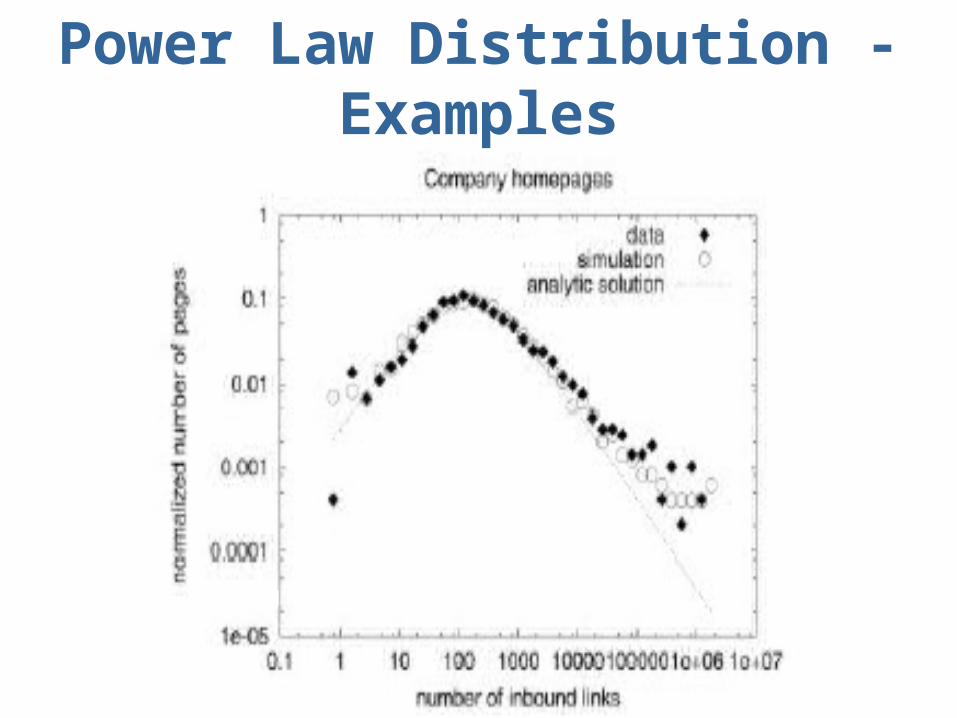
Power Law Distribution -Examples
http://www.pnas.org/cgi/reprint/99/8/5207.pdf
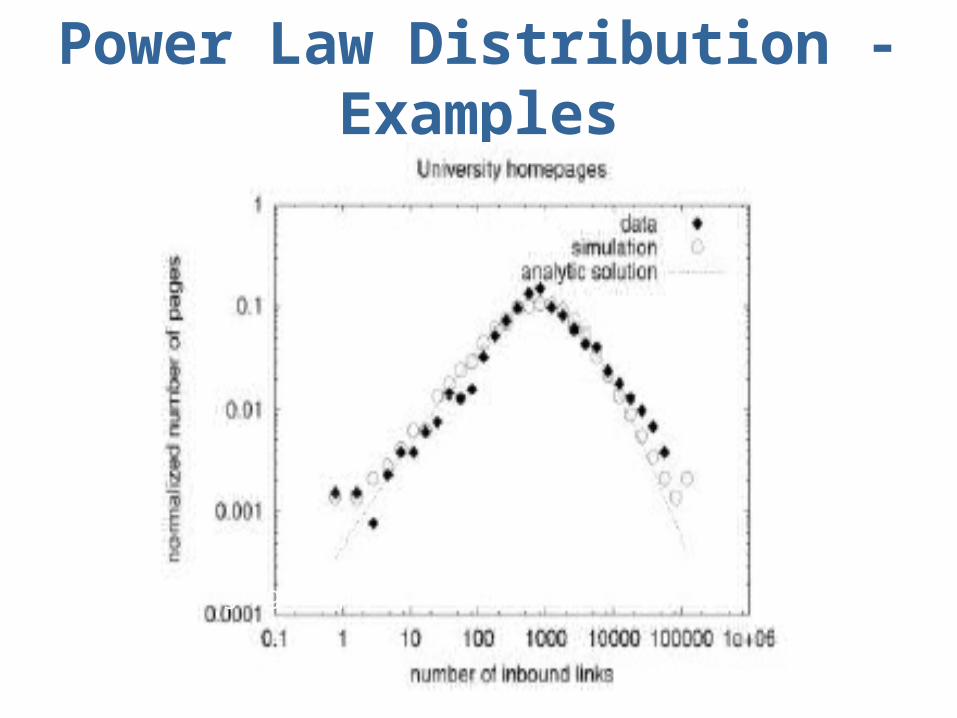
Power Law Distribution -Examples
http://www.pnas.org/cgi/reprint/99/8/5207.pdf
Examples of networks with Power Law Distribution
• Internet at the router and interdomain level• Citation network• Collaboration network of actors• Networks associated with metabolic
pathways• Networks formed by interacting genes and
proteins• Network of nervous system connection in
C. elegans
Small World Networks
• It is a ‘small world’– Millions of people. Yet, separated by “six
degrees” of acquaintance relationships– Popularized by Milgram’s famous experiment
• Mathematically– Diameter of graph is small (log N) as
compared to overall size • Property seems interesting given ‘sparse’ nature of
graph but … • This property is ‘natural’ in ‘pure’ random graphs
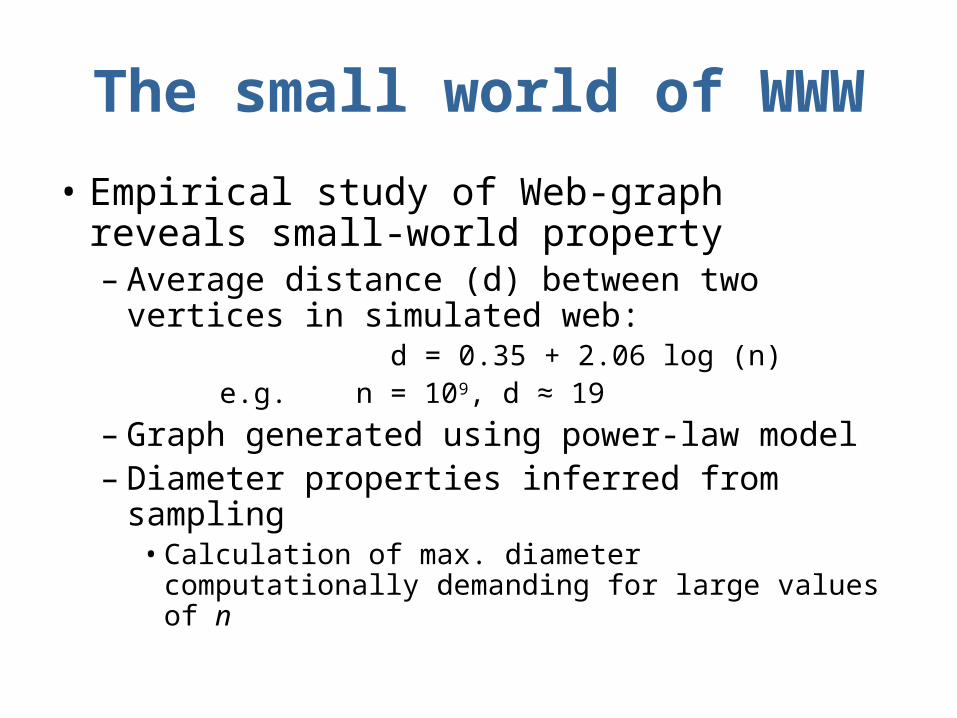
The small world of WWW
• Empirical study of Web-graph reveals small-world property– Average distance (d) between two vertices in
simulated web: d = 0.35 + 2.06 log (n) e.g. n = 109, d ≈ 19
– Graph generated using power-law model– Diameter properties inferred from sampling
• Calculation of max. diameter computationally demanding for large values of n
Implications for Web
• Logarithmic scaling of diameter makes future growth of web manageable– 10-fold increase of web pages results in only
2 more additional ‘clicks’, but …– Users may not take shortest path, may use
bookmarks or just get distracted on the way– Therefore search engines play a crucial role
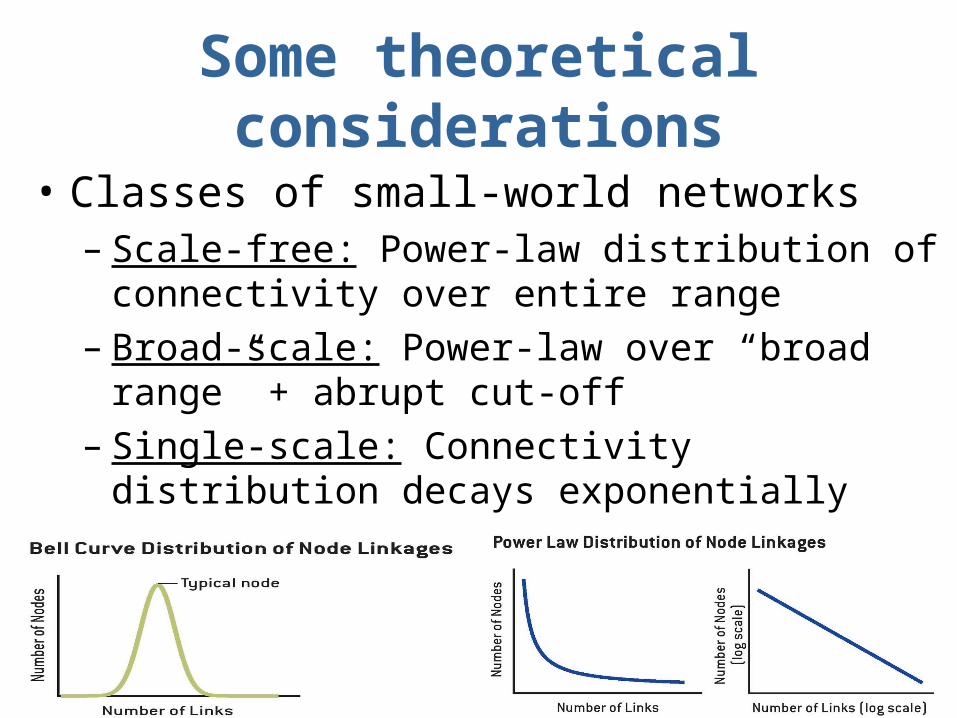
Some theoretical considerations
• Classes of small-world networks– Scale-free: Power-law distribution of connectivity
over entire range– Broad-scale: Power-law over “broad range” +
abrupt cut-off– Single-scale: Connectivity distribution decays
exponentially
Power Law of PageRank
• Assess importance of a page relative to a query and rank pages accordingly– Importance measured by indegree– Not reliable since it is entirely local
• PageRank – proportion of time a random surfer would spend on that page at steady state
• A random first order Markov surfer at each time step travels from one page to another
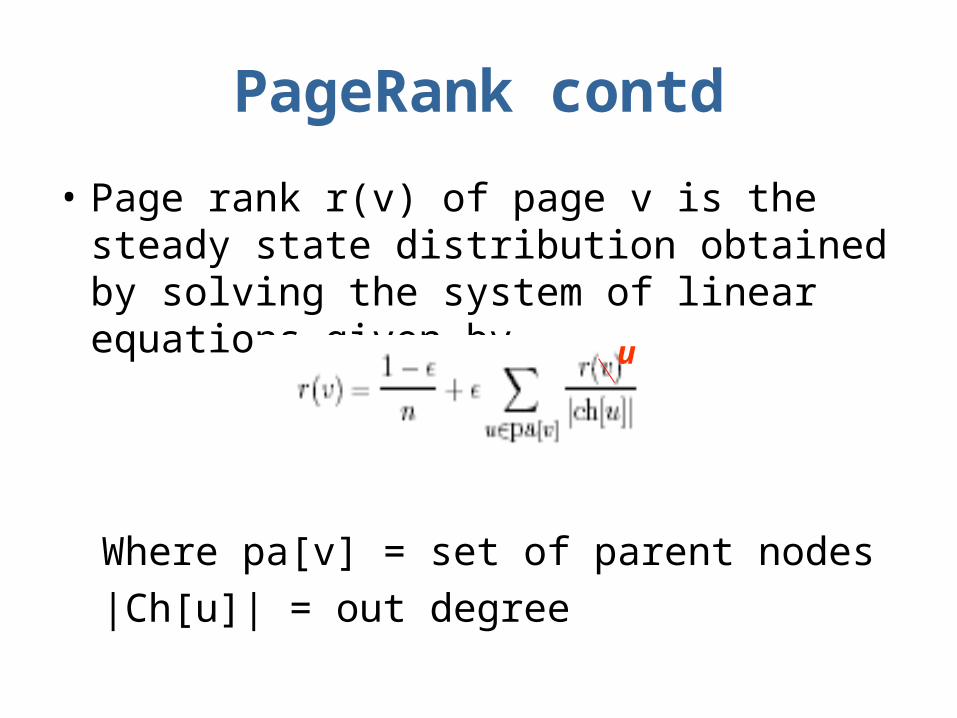
PageRank contd
• Page rank r(v) of page v is the steady state distribution obtained by solving the system of linear equations given by
Where pa[v] = set of parent nodes
|Ch[u]| = out degree
u
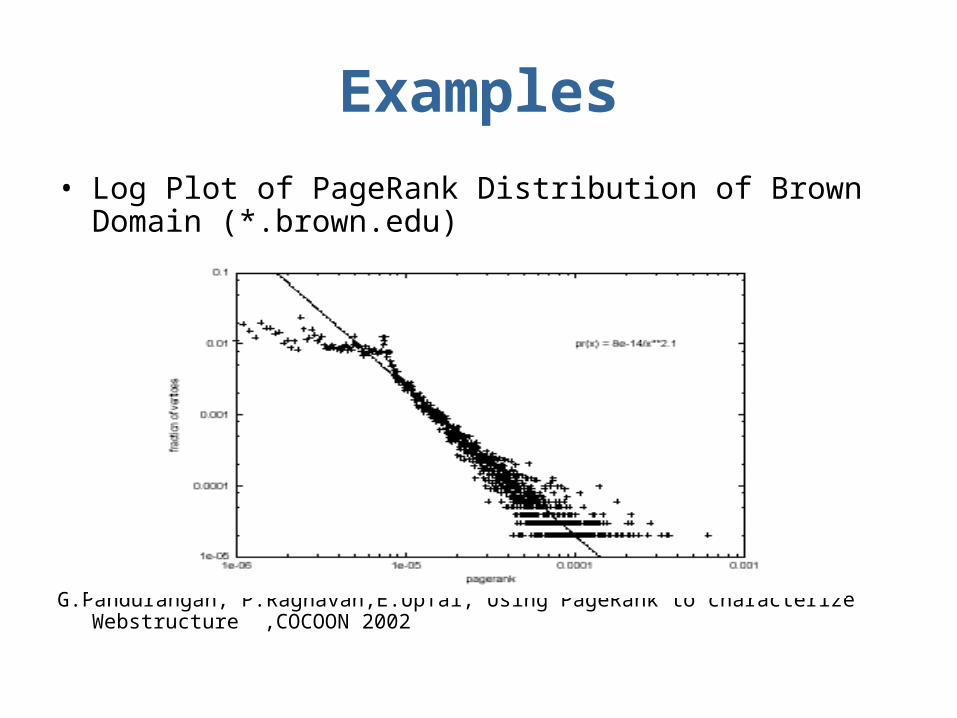
Examples
• Log Plot of PageRank Distribution of Brown Domain (*.brown.edu)
G.Pandurangan, P.Raghavan,E.Upfal,”Using PageRank to characterize Webstructure” ,COCOON 2002
Bow-tie Structure of Web
• A large scale study (Altavista crawls) reveals interesting properties of web– Study of 200 million nodes & 1.5 billion links– Small-world property not applicable to entire
web• Some parts unreachable• Others have long paths
– Power-law connectivity holds though• Page indegree ( = 2.1), outdegree ( = 2.72)
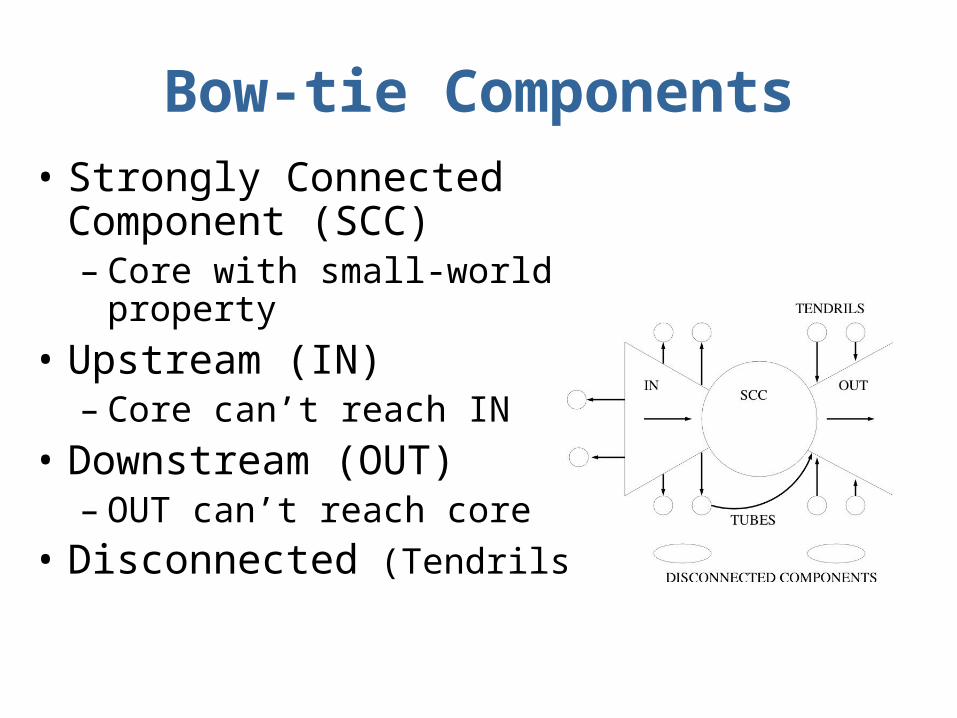
Bow-tie Components• Strongly Connected
Component (SCC)– Core with small-world
property
• Upstream (IN)– Core can’t reach IN
• Downstream (OUT)– OUT can’t reach core
• Disconnected (Tendrils)
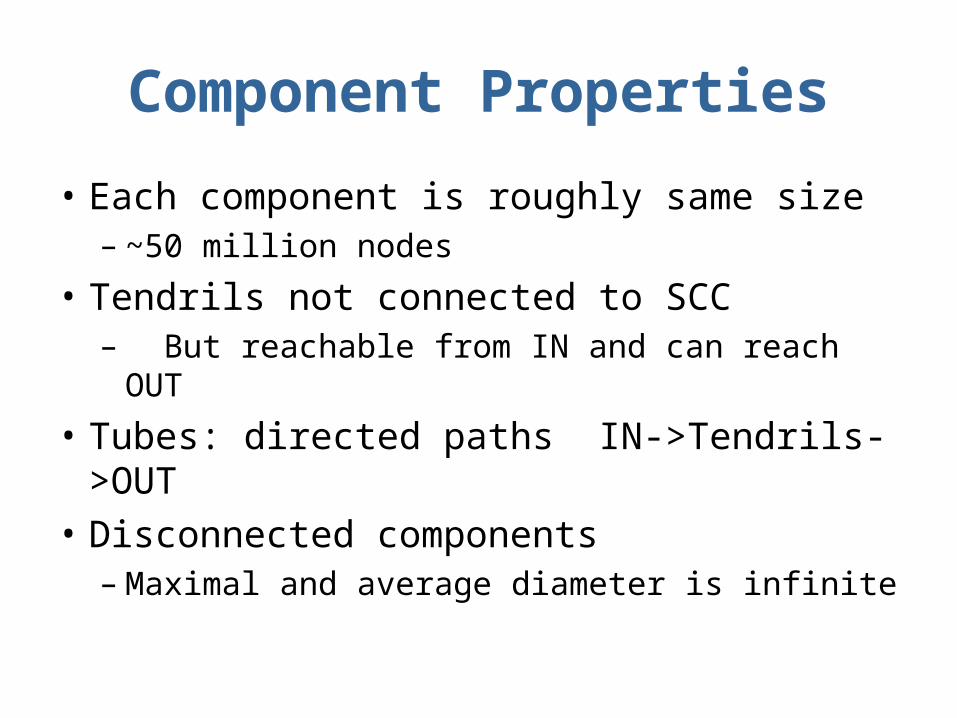
Component Properties
• Each component is roughly same size– ~50 million nodes
• Tendrils not connected to SCC– But reachable from IN and can reach OUT
• Tubes: directed paths IN->Tendrils->OUT
• Disconnected components– Maximal and average diameter is infinite
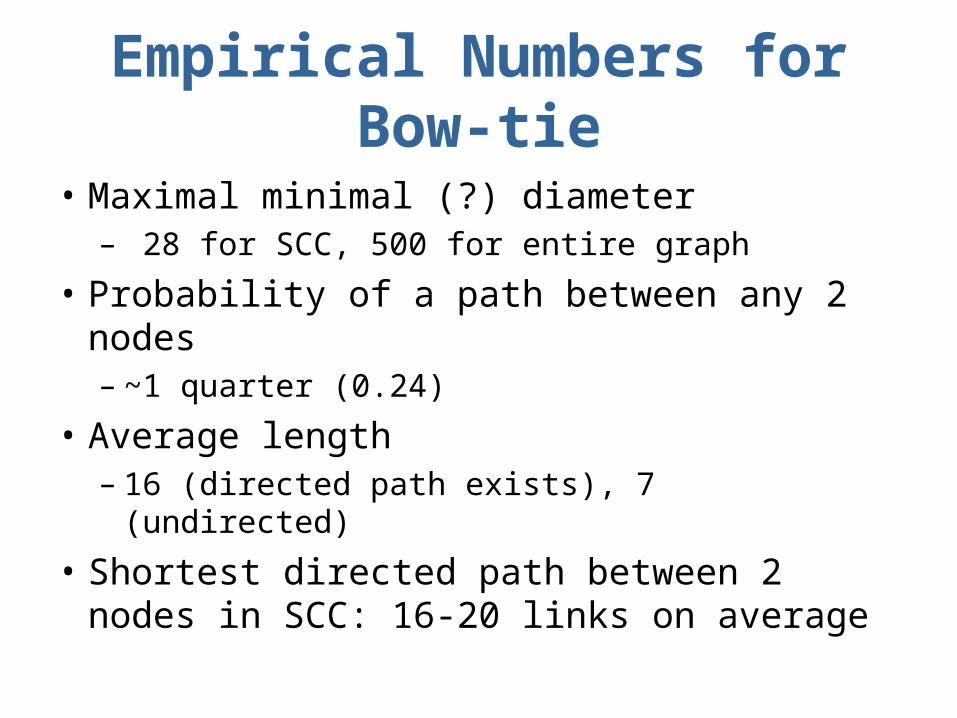
Empirical Numbers for Bow-tie
• Maximal minimal (?) diameter– 28 for SCC, 500 for entire graph
• Probability of a path between any 2 nodes– ~1 quarter (0.24)
• Average length – 16 (directed path exists), 7 (undirected)
• Shortest directed path between 2 nodes in SCC: 16-20 links on average
Models for the Web Graph
• Stochastic models that can explain or at least partially reproduce properties of the web graph– The model should follow the power law
distribution properties– Represent the connectivity of the web– Maintain the small world property
Web Page Growth
• Empirical studies observe a power law distribution of site sizes – Size includes size of the Web, number of IP
addresses, number of servers, average size of a page etc
• A Generative model is being proposed to account for this distribution
Component One of the Generative Model
• The first component of this model is that “ sites have short-term size fluctuations up or down that are proportional to the size of the site “
• A site with 100,000 pages may gain or lose a few hundred pages in a day whereas the effect is rare for a site with only 100 pages
Component Two of the Generative Model
• There is an overall growth rate so that the size S(t) satisfies
S(t+1) = (1+t)S(t)
where
- t is the realization of a 1 Bernoulli random variable at time t with probability 0.5
- is the absolute rate of the daily fluctuations
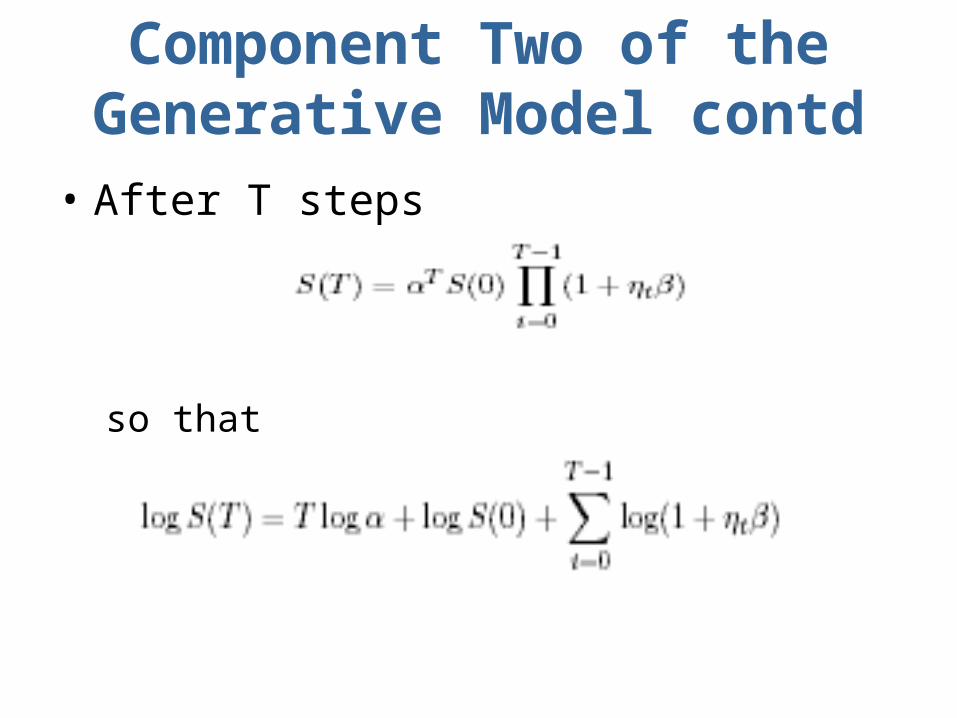
Component Two of the Generative Model contd
• After T steps
so that

Theoretical Considerations
• Assuming t independent, by central limit theorem it is clear that for large values of T, log S(T) is normally distributed– The central limit theorem states that given a
distribution with a mean μ and variance σ2, the sampling distribution of the mean approaches a normal distribution with a mean (μ) and a variance σ2/N as N, the sample size, increases.
http://davidmlane.com/hyperstat/A14043.html
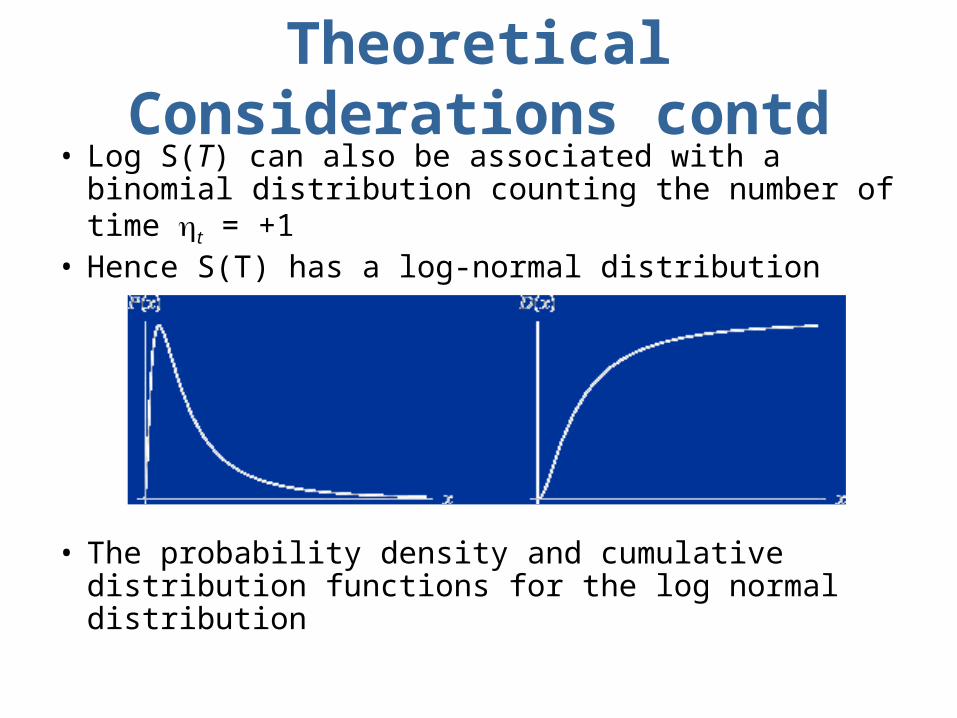
Theoretical Considerations contd
• Log S(T) can also be associated with a binomial distribution counting the number of time t = +1
• Hence S(T) has a log-normal distribution
• The probability density and cumulative distribution functions for the log normal distribution
Modified Model
• Can be modified to obey power law distribution
• Model is modified to include the following in order to obey power law distribution– A wide distribution of growth rates across
different sites and/or– The fact that sites have different ages
Capturing Power Law Property
• In order to capture Power Law property it is sufficient to consider that – Web sites are being continuously created– Web sites grow at a constant rate during a growth
period after which their size remains approximately constant
– The periods of growth follow an exponential distribution
• This will give a relation = 0.8between the rate of exponential distribution and the growth rage when power law exponent = 1.08
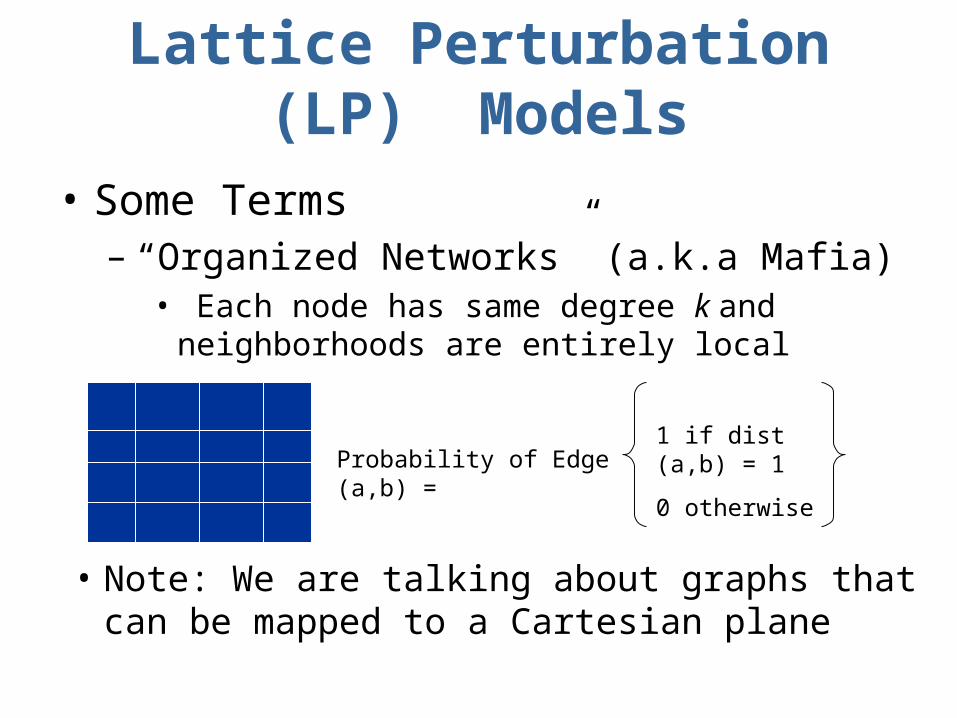
Lattice Perturbation (LP) Models
• Some Terms– “Organized Networks” (a.k.a Mafia)
• Each node has same degree k and neighborhoods are entirely local
Probability of Edge (a,b) =1 if dist (a,b) = 1
0 otherwise
• Note: We are talking about graphs that can be mapped to a Cartesian plane
Terms (Cont’d)
• Organized Networks– Are ‘cliquish’ (Subgraph that is fully
connected) in local neighborhood– Probability of edges across neighborhoods is
almost non existent (p=0 for fully organized)
• “Disorganized” Networks– ‘Long-range’ edges exist– Completely Disorganized <=> Fully Random
(Erdos Model) : p=1
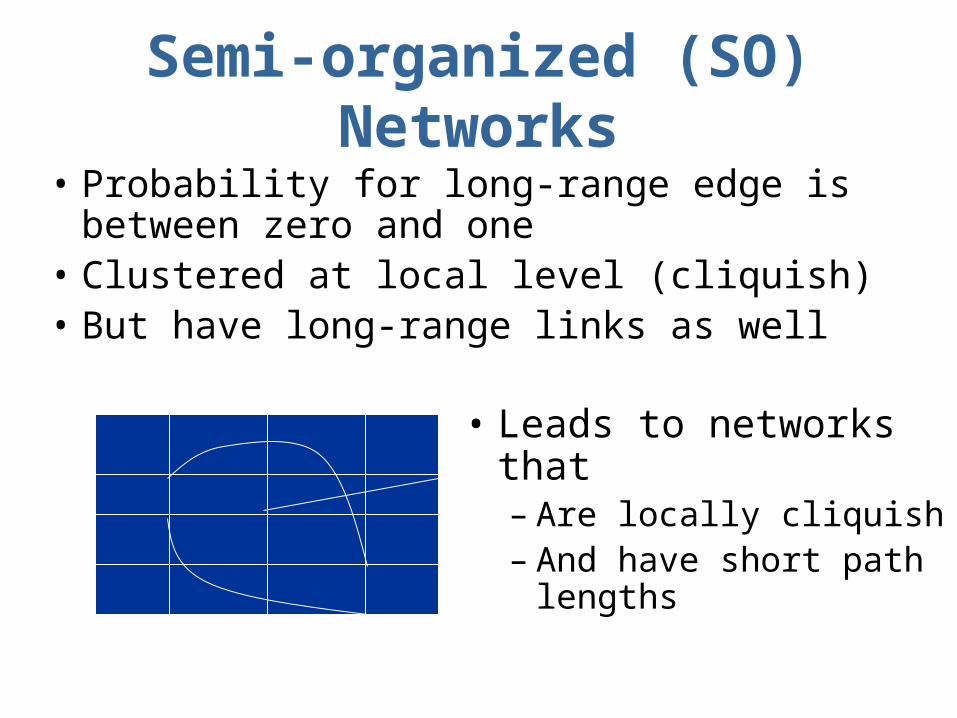
Semi-organized (SO) Networks
• Probability for long-range edge is between zero and one
• Clustered at local level (cliquish)• But have long-range links as well
• Leads to networks that– Are locally cliquish– And have short path
lengths
Creating SO Networks
• Step 1:– Take a regular network (e.g. lattice)
• Step 2:– Shake it up (perturbation)
• Step 2 in detail:– For each vertex, pick a local edge– ‘Rewire’ the edge into a long-range edge with
a probability (p)– p=0: organized, p=1: disorganized
Statistics of SO Networks
• Average Diameter (d): Average distance between two nodes
• Average Clique Fraction (c)– Given a vertex v, kv: neighbors of v– Max edges among kv = k(k-1)/2– Clique Fraction (cv): (Edges present) / (Max)– Average clique fraction: average over all
nodes– Measures: Degree to which “my friends are
friends of each other”
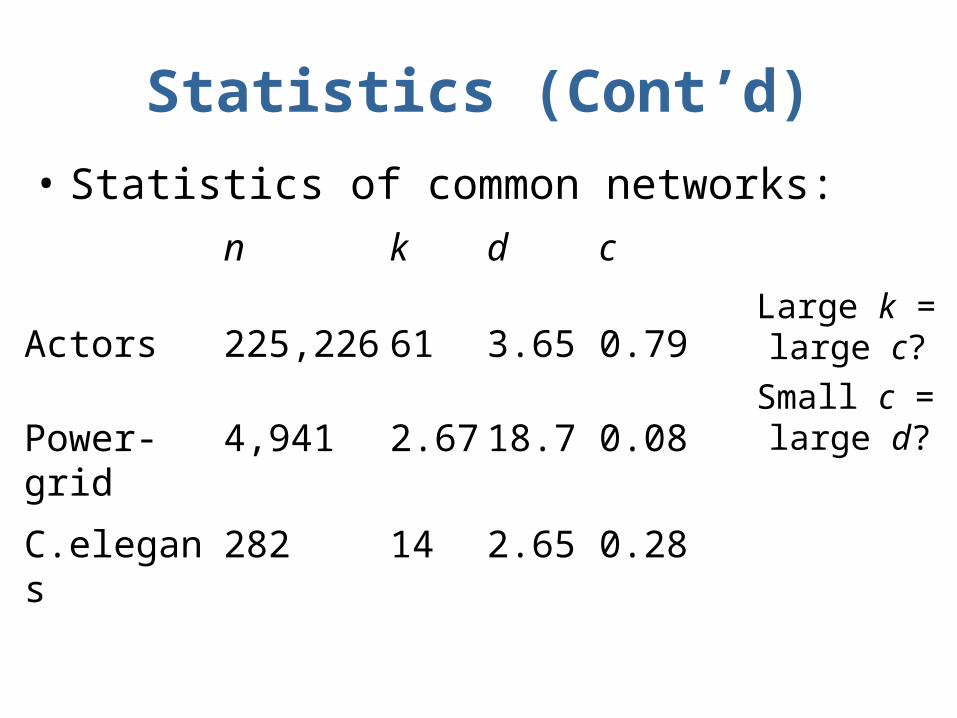
Statistics (Cont’d)
• Statistics of common networks:
n k d c
Actors 225,226 61 3.65 0.79
Power-grid 4,941 2.67 18.7 0.08
C.elegans 282 14 2.65 0.28
Large k = large c?
Small c = large d?
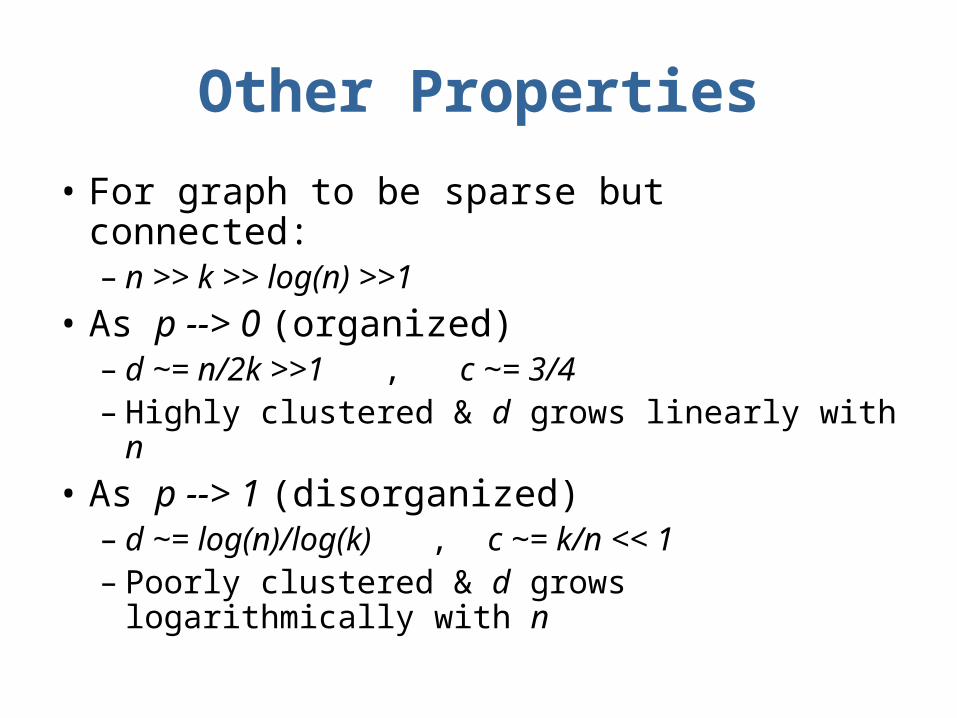
Other Properties
• For graph to be sparse but connected:– n >> k >> log(n) >>1
• As p --> 0 (organized)– d ~= n/2k >>1 , c ~= 3/4– Highly clustered & d grows linearly with n
• As p --> 1 (disorganized)– d ~= log(n)/log(k) , c ~= k/n << 1– Poorly clustered & d grows logarithmically
with n

Effect of ‘Shaking it up’
• Small shake (p close to zero)– High cliquishness AND short path lengths
• Larger shake (p increased further from 0)– d drops rapidly (increased small world
phenomena_– c remains constant (transition to small world
almost undetectable at local level)
• Effect of long-range link:– Addition: non-linear decrease of d– Removal: small linear decrease of c
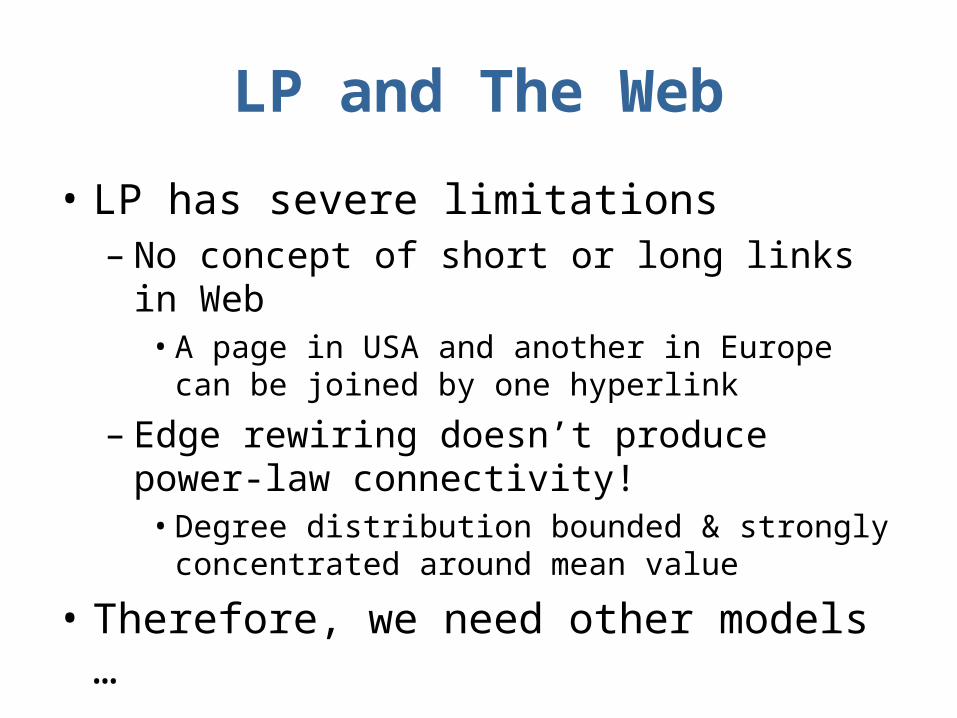
LP and The Web
• LP has severe limitations– No concept of short or long links in Web
• A page in USA and another in Europe can be joined by one hyperlink
– Edge rewiring doesn’t produce power-law connectivity!
• Degree distribution bounded & strongly concentrated around mean value
• Therefore, we need other models …