We study the occurrence of holdout litigation in the context of … · · 2016-06-18We study the...
51
econstor www.econstor.eu Der Open-Access-Publikationsserver der ZBW – Leibniz-Informationszentrum Wirtschaft The Open Access Publication Server of the ZBW – Leibniz Information Centre for Economics Standard-Nutzungsbedingungen: Die Dokumente auf EconStor dürfen zu eigenen wissenschaftlichen Zwecken und zum Privatgebrauch gespeichert und kopiert werden. Sie dürfen die Dokumente nicht für öffentliche oder kommerzielle Zwecke vervielfältigen, öffentlich ausstellen, öffentlich zugänglich machen, vertreiben oder anderweitig nutzen. Sofern die Verfasser die Dokumente unter Open-Content-Lizenzen (insbesondere CC-Lizenzen) zur Verfügung gestellt haben sollten, gelten abweichend von diesen Nutzungsbedingungen die in der dort genannten Lizenz gewährten Nutzungsrechte. Terms of use: Documents in EconStor may be saved and copied for your personal and scholarly purposes. You are not to copy documents for public or commercial purposes, to exhibit the documents publicly, to make them publicly available on the internet, or to distribute or otherwise use the documents in public. If the documents have been made available under an Open Content Licence (especially Creative Commons Licences), you may exercise further usage rights as specified in the indicated licence. zbw Leibniz-Informationszentrum Wirtschaft Leibniz Information Centre for Economics Schumacher, Julian; Trebesch, Christoph; Enderlein, Henrik Working Paper What Explains Sovereign Debt Litigation? CESifo Working Paper, No. 5319 Provided in Cooperation with: Ifo Institute – Leibniz Institute for Economic Research at the University of Munich Suggested Citation: Schumacher, Julian; Trebesch, Christoph; Enderlein, Henrik (2015) : What Explains Sovereign Debt Litigation?, CESifo Working Paper, No. 5319 This Version is available at: http://hdl.handle.net/10419/110830
-
Upload
nguyenthuan -
Category
Documents
-
view
228 -
download
1
Transcript of We study the occurrence of holdout litigation in the context of … · · 2016-06-18We study the...
econstor www.econstor.eu
Der Open-Access-Publikationsserver der ZBW – Leibniz-Informationszentrum WirtschaftThe Open Access Publication Server of the ZBW – Leibniz Information Centre for Economics
Standard-Nutzungsbedingungen:
Die Dokumente auf EconStor dürfen zu eigenen wissenschaftlichenZwecken und zum Privatgebrauch gespeichert und kopiert werden.
Sie dürfen die Dokumente nicht für öffentliche oder kommerzielleZwecke vervielfältigen, öffentlich ausstellen, öffentlich zugänglichmachen, vertreiben oder anderweitig nutzen.
Sofern die Verfasser die Dokumente unter Open-Content-Lizenzen(insbesondere CC-Lizenzen) zur Verfügung gestellt haben sollten,gelten abweichend von diesen Nutzungsbedingungen die in der dortgenannten Lizenz gewährten Nutzungsrechte.
Terms of use:
Documents in EconStor may be saved and copied for yourpersonal and scholarly purposes.
You are not to copy documents for public or commercialpurposes, to exhibit the documents publicly, to make thempublicly available on the internet, or to distribute or otherwiseuse the documents in public.
If the documents have been made available under an OpenContent Licence (especially Creative Commons Licences), youmay exercise further usage rights as specified in the indicatedlicence.
zbw Leibniz-Informationszentrum WirtschaftLeibniz Information Centre for Economics
Schumacher, Julian; Trebesch, Christoph; Enderlein, Henrik
Working Paper
What Explains Sovereign Debt Litigation?
CESifo Working Paper, No. 5319
Provided in Cooperation with:Ifo Institute – Leibniz Institute for Economic Research at the University ofMunich
Suggested Citation: Schumacher, Julian; Trebesch, Christoph; Enderlein, Henrik (2015) : WhatExplains Sovereign Debt Litigation?, CESifo Working Paper, No. 5319
This Version is available at:http://hdl.handle.net/10419/110830
What Explains Sovereign Debt Litigation?
Julian Schumacher Christoph Trebesch Henrik Enderlein
CESIFO WORKING PAPER NO. 5319 CATEGORY 7: MONETARY POLICY AND INTERNATIONAL FINANCE
APRIL 2015
An electronic version of the paper may be downloaded • from the SSRN website: www.SSRN.com • from the RePEc website: www.RePEc.org
• from the CESifo website: Twww.CESifo-group.org/wp T
ISSN 2364-1428
CESifo Working Paper No. 5319
What Explains Sovereign Debt Litigation?
Abstract We study the occurrence of holdout litigation in the context of sovereign defaults. The number of creditor lawsuits against foreign governments has strongly increased over the past decades, but there is a large variation across crisis events. Why are some defaults followed by a “run to the courthouse” and others not? What explains the general increase in lawsuits? We address these questions based on an economic model of litigation and a new dataset capturing the near-universe of cases filed against defaulting sovereigns. We find that creditors are more likely to litigate in large debt restructurings, when governments impose high losses (“haircuts”), and when the defaulting country is more vulnerable to litigation (open economies and those with a low legal capacity). We conclude that sovereign debt lawsuits can be predicted reasonably well with a simple framework from the law and economics literature.
JEL-Code: F340.
Keywords: sovereign debt, sovereign default, legal disputes, creditor lawsuits.
Julian Schumacher Johannes Gutenberg University Mainz
Dpt. of Law, Management & Economics Jakob Welder-Weg 4
Germany - 55128 Mainz, [email protected]
Christoph Trebesch* Ludwig-Maximilians-University Munich
Center for Economic Studies Schackstrasse 4
Germany – 80539 Munich [email protected]
Henrik Enderlein Political Economy
Hertie School of Governance Friedrichstrasse 180
Germany – 10177 Berlin [email protected]
*corresponding author This version: February 20, 2015 The authors gratefully acknowledge financial support from the German Research Foundation (DFG) under the Collaborative Research Centre 700. We also benefited from very helpful comments by Laura Alfaro, Charles Blitzer, Patrick Bolton, Chad Bown, Elias Brumm, Lee Buchheit, Russell Cooper, Till Cordes, Anna Gelpern, Mitu Gulati, Marcus Miller, Gernot Mueller, Carmen Reinhart, Felix Salmon, Martin Uribe, and Jeromin Zettelmeyer, as well as from participants at the ASSA Meeting in Philadelphia, the NBER Summer Institute (IFM), the EEA Conference in Gothenberg, the CEPR meeting in London, the Government Debt Crises Conference in Geneva, the ECB Global Sovereign Debt Workshop, the IPES meeting in Boston, the RES Annual Conference in London, and at seminars at Columbia University and at the Universities of Berlin, Bonn and Osnabrueck. We thank Inga Karrer, Said Khalid Scharaf, and Lilly Schoen for excellent research assistance. All remaining errors are our own.
1 Introduction
On October 3, 2012, a subsidiary of the US hedge fund Elliott Associates succeeded
in seizing the crown jewel of the Argentine navy in a Ghanaian port, the vessel ARA
Libertad with 300 sailors on board.1 This drastic legal maneuver is just one of the many
repercussions of the Argentinean default of 2001. Over the past decade, creditors have tried
countless strategies to legally force Argentina to repay the debt it defaulted on. This paper
is an attempt to better understand the occurrence of creditor litigation against sovereign
debtors. We study situations in which banks or investment funds refuse to participate in a
sovereign debt exchange offer and, instead, sue a defaulting government for full repayment
in New York or London courts.
Legal disputes are now a standard ingredient of sovereign debt renegotiations, including
the 2012 Greek debt exchange.2 It is also well-known that litigation can be costly and
disruptive. Countries like Argentina devote substantial resources to defend against lawsuits
and attachment attempts, despite the fact that sovereign assets are very difficult to seize.
Moreover, litigious creditors can cause considerable externalities, such as a disruption of
international trade flows, or by blocking government access to international capital markets
(Sturzenegger and Zettelmeyer, 2006; Alfaro et al., 2010).
The rise of creditor litigation has triggered an international debate and many policy
initiatives. Governments have advocated against litigious creditors3 and concerns about
holdouts have motivated proposals on introducing collective action clauses (CACs) or
a new bancruptcy regime such as the IMF’s Sovereign Debt Restructuring Mechanism
(SDRM) (see Rogoff and Zettelmeyer, 2002; IMF, 2003; Bolton, 2003).4 The European
1See Financial Times, October 3, 2012, “Argentine navy ship seized in asset fight”.2“Fund threatens to sue over Greek bond losses”, Financial Times, 15 December 2011; “Bet on Greek
Bonds Paid Off for ‘Vulture Fund”’, New York Times, 15 May 2012; and “Slovak bank sues Greece over2012 bond swap”, Kathimerini, 9 May 2013.
3In a speech to the United Nations, the former UK finance minister Gordon Brown called creditorlitigation by distressed debt funds “morally outrageous” (BBC, 10 May 2002), while Hank Paulson, hisformer US colleague, said that he “deplore[s] what the vulture funds are doing” (Bloomberg, 8 January2008). The World Bank, the Paris Club, and the IMF, as well as NGOs such as Jubilee also warned of thedangers of holdout litigation (see Alfaro et al., 2010), and they have recently been joined by the EuropeanCommission (2012).
4Additional initiatives include a 2010 law passed in the UK to ban creditor lawsuits against the poorestcountries undergoing debt relief. Two Channel Islands, Jersey and Guernsey, are currently preparinglegislation that resembles the UK bill, while Belgium passed a bill to prevent the seizure of assets bylitigious creditors in 2008. The African Development Bank has also recently set up the “African LegalSupport facility” to support debtor countries facing litigation.
1
debt crisis has revived the debate on litigation and related creditor coordination problems
(see Gianviti et al., 2010; Roubini, 2010; Weder Di Mauro and Zettelmeyer, 2010; Tirole,
2012; Mody, 2013). Buchheit et al. (2013b), for example, argue that the threat of holdout
litigation is a main explanation for the large scale bailouts of Eurozone countries. Because
governments want to avoid a “messy” default as in Argentina, they may have become less
prone to impose (high) haircuts on their private creditors. Also, the recent reports by
the IMF (2013) and Buchheit et al. (2013a) suggest that creditor litigation has become a
serious stumbling block for sovereign debt restructurings.
Others do not necessarily see creditor holdouts and litigation as a reason for concern.
Shleifer (2003) and Scott (2006) argue that stronger creditor rights could have a positive
effect on sovereign debt markets, because governments will be less likely to overborrow
and default.5 A similar argument is made by Dooley (2000) and Pitchford and Wright
(2007), who conclude that it can be welfare-reducing to make debt renegotiation less costly
ex-post, e.g. by reducing holdout litigation. More generally, Bolton and Jeanne (2007)
analyse the welfare effects of “easy” versus “hard” sovereign debt restructuring.
This study is motivated by the fact that there is only little empirical knowledge on
the phenomenon of sovereign debt litigation and related creditor coordination problems,
despite the many policy initiatives and a large body of related theoretical work. The
existing literature has predominantly focused on a few high profile litigation cases, like
Elliott v. Peru or Argentina, while systematic evidence has been missing.
Our analysis builds on a new dataset by Schumacher et al. (2014) that comes close
to a census of all debt-crisis related lawsuits filed between 1978 and 2010 in the US and
the UK, the two most relevant jurisdictions for international sovereign debt disputes.6
The data are hand-coded from electronic court records from the comprehensive PACER7
database as well as from documents from Lexis Nexis Law, Westlaw, Casetrack, Justis,
and BAILII. Altogether, we evaluated more than 10,000 pages of legal documents and
verified each data entry across all sources available, including previous data collections and
5Similarly, Fisch and Gentile (2004) suggest that holdout creditors can foster the functioning of creditmarkets in distress and thereby facilitate the restructuring process.
6Recent research confirms the continued dominance of English and New York law in cross-border bondand loan markets, see IMF (2002), Das et al. (2012), and Gulati and Scott (2012).
7Public Access to Court Electronic Records, http://www.pacer.gov.
2
academic research.8 This coding approach allows us to tackle one of the main hurdles in
quantitative legal research: sample selection bias. For the US, we are able to identify the
universe of initiated lawsuits following a default or restructuring, including those that are
settled out-of-court or those which remain unresolved. The data reveal new insights:
� Stylized Fact 1: The probability of litigation has strongly increased.
We find that the total number of lawsuits is only 121 (not counting multiple lawsuits
by the same creditor), but more than half of these cases have been filed since the
year 2000. The likelihood that a debt crisis is accompanied by creditor litigation has
increased from less than 10% in the 1980s to more than 40% in recent years.
� Stylized fact 2: There is a large variation across debt crisis cases.
We find that some defaults trigger dozens of lawsuit in foreign courts, others none.
Overall, litigation affected only 31 of the 174 sovereign debt restructurings with
foreign banks and bondholders between 1978 and 2010 (18 % of all cases). Similarly,
we find that only 26 debtor governments were affected, out of a total of 69 defaulters.
The aim of this paper is to rationalize the above stylized facts on litigation occurrence.
Why are some debt crises followed by a veritable “run to the courthouse”, while most cases
see no litigation at all? Is it true that poorer countries are more likely to be sued, as often
suggested in the policy debate? And what explains the general rise in litigation occurrence
over the past decades? We address these questions with a standard model from the law and
economics literature and by estimating probit and count models using litigation measures
as our dependent variable. The resulting framework is a first attempt to develop an “early
warning system” of creditor lawsuits in the context of sovereign defaults.
To guide the econometric analysis, we draw on an established framework on the
economics of litigation that goes back to Coase (1960), Landes (1971) and Posner (1973)
and is surveyed by Cooter and Rubinfeld (1989). The model predicts litigation to be
determined (i) by the expected probability of winning a lawsuit (landmark judgments and
changes in legal doctrine), (ii) by the cost of litigation to creditors and debtors, and (iii) by
8In particular, the cases identified in the HIPC initiative reports by the IMF and the World Bank(various issues), and those listed in Cleary Gottlieb Steen & Hamilton and Clifford Chance (1992), Buchheit(1999), EMTA (2009), IIF (2009) and in the academic literature (Singh, 2003; Sturzenegger and Zettelmeyer,2006; Alfaro et al., 2010; Trebesch, 2010).
3
the scope of damage suffered by creditors. Moreover, we draw on theories from international
finance and international trade disputes to further discipline our choice of explanatory
variables. The seminal paper by Bulow and Rogoff (1989a) suggests that banks can impose
legal sanctions on defaulting sovereigns and that the resulting asset seizures will disrupt
international trade. If this is true, economies that are more open will be more vulnerable
to litigation. We therefore include measures of trade and financial openness as a proxy
for the creditor’s probability of winning. We also account for the characteristics of each
debt restructuring. First, we include the amount of restructured debt, as a proxy for the
number of creditors. This is in line with the model by Pitchford and Wright (2012a), which
predicts that more creditors increase negotiation delays and the probability of litigious
holdouts. Second, we include the size of haircuts, which is in line with the related paper by
Bi et al. (2011). High creditor losses make it more attractive to reject the exchange offer
and instead sue for repayment of 100% of face value (see also Buchheit, 1999; Roubini and
Setser, 2004). Finally, we control for the legal capacity of debtor governments, the cost of
litigation to creditors, and for the existence of liquid secondary markets.
The results are in line with the theoretical priors. Landmark judgments are important
in explaining the observed number of lawsuits. But legal factors become less relevant
once we control for economic and financial variables. In particular, we find that trade
openness, deal size (amounts restructured), and the scope of creditor losses (“haircuts”) are
economically and statistically significant predictors of creditor litigation after a sovereign
default. A one standard deviation increase in haircut size or in the amount restructured
more than doubles the probability of litigation (from 6% to more than 12%). These findings
are robust to including time fixed effects, restricting the sample to the 2000s, and excluding
outliers (Argentina, Brazil, Peru). The results also hold when estimating IV regressions
that account for the potential endogeneity of haircut size. We conclude that both legal
and economic variables help to explain the occurrence and rise of sovereign debt litigation
in the past decades.
Related literature: The paper contributes to the literature in several ways. First
and foremost, we conduct the first broad-based empirical analysis on the occurrence of
sovereign debt litigation, an issue that has received considerable attention in economic
4
research. Many recent theory papers have analyzed creditor holdouts, litigation, and the
legal framework of sovereign restructurings, including Miller and Zhang (2000), Ghosal and
Miller (2003), Weinschelbaum and Wynne (2005), Gai et al. (2004), Haldane et al. (2005),
Bolton and Jeanne (2007), Pitchford and Wright (2007, 2012a), Engelen and Lambsdorff
(2009), Bi et al. (2011), Lanau (2011), and Ghosal and Thampanishvong (2013). Our
paper differs from these contributions in that we use a modeling framework from law and
economics which has proven successful in many fields, but has so far not been used to
study litigation in sovereign debt markets. More importantly, we expand the empirical
literature on creditor litigation, which has been lagging behind theory and remains scarce.
Sturzenegger and Zettelmeyer (2006) summarize the history of sovereign debt law, Miller
and Thomas (2007) analyze the Argentine litigation episode, Alfaro et al. (2010) and
Bradley et al. (2010) test the impact of major court decisions on sovereign bond prices,
while Schumacher et al. (2014) study the consequences of litigation on government access
to capital markets, trade, and delays in crisis resolution.9 We are not aware of any previous
paper that tests under which circumstances litigation is most likely to occur.
Second, we expand the literature on the general economics of litigation (e.g. Lanjouw
and Lerner, 1997; Lerner, 2010). We are among the first to empirically analyze litigation
in the context of financial distress and default. Methodologically, we avoid the “tip of the
iceberg” problem, a central obstacle in the quantitative analysis of litigation (Priest and
Klein, 1984). Researchers on litigation typically only observe cases brought to court, but
not the underlying sample of harmful events, such as the total pool of car accidents. In
contrast, we observe the full sample of sovereign debt restructurings that could potentially
have resulted in legal action by using the data collections by Enderlein et al. (2012), Das
et al. (2012), and Cruces and Trebesch (2013). This allows us to draw unbiased inference
on the decision to litigate.
Third, we add to a literature on international economic disputes involving sovereign
states. Many recent papers have studied trade litigation and related enforcement problems
(e.g. the models by Maggi and Staiger, 2011, 2013; Beshkar, 2013). Unlike in the sovereign
9There are also dozens of legal studies on the implications of individual cases or on the development oflegal doctrine in the field, e.g. Hurlock (1984a,b), Goldman (2000), Wheeler and Attaran (2003), Fisch andGentile (2004), Gelpern (2005), Blackman and Mukhi (2010), Broomfield (2010), Waibel (2011), and manyothers.
5
debt context, however, theory work in this field has been accompanied by a rich body of
empirical papers on the determinants and effects of trade disputes, mostly using WTO data
(e.g. Bown, 2004, 2005a,b; Busch and Reinhardt, 2006; Grinols and Perrelli, 2006; Davis
and Bermeo, 2009). Here we exploit previously unavailable data to add empirical insights
on sovereign debt litigation – an increasingly important type of cross-border disputes.
2 Background and stylized facts
This section describes the legal framework and characteristics of sovereign debt litigation
over the past decades. We summarize insights from the legal literature and present
stylized facts from our new database, which captures the near-universe of lawsuits filed
by institutional investors in the US and the UK in the context of sovereign defaults and
restructurings since 1978 (Schumacher et al., 2014). We focus on the period after 1978,
since this is the year in which the UK implemented the State Immunity Act, which followed
the US Foreign Sovereign Immunities Act (FSIA) of 1976. It was thus only in the late
1970s that sovereign debt lawsuits became possible in these two countries.
2.1 Sovereign immunity and creditor litigation: past and present10
Historically, private creditors had no legal device to force foreign governments to repay in
the event of a default. Unlike corporations, governments cannot be liquidated and sovereign
debt is typically not backed by collateral. In addition, debtor governments were protected
from litigation and asset seizures by the doctrine of “absolute” sovereign immunity, which
states that a government cannot be sued in foreign courts.
Since the 1950s, however, sovereign immunity has eroded and lawsuits against defaulting
governments in foreign jurisdictions have become possible (Weidemaier, 2014). In the
second half of the 1970s, however, both the US and the UK implemented the above
mentioned legislation that allowed private individuals to take foreign governments to court
over commercial disputes. These reforms opened the gate for today’s era of sovereign debt
litigation, which was shaped by four main court decisions.
10This section is largely based on Fisch and Gentile (2004), Sturzenegger and Zettelmeyer (2006), Foster(2008), Alfaro et al. (2010), Blackman and Mukhi (2010), Waibel (2011), and Weidemaier (2014). Parts arealso taken from Schumacher et al. (2014), who provide a more detailed overview.
6
The first benchmark case on sovereign debt litigation was Allied Bank v. Costa Rica11
in 1982, when a group of banks went to court in the US after refusing to accept a haircut
in Costa Rica’s debt restructuring. The New York court granted a ruling in favor of
Allied and established that Costa Rican government assets could in principle be subject
to attachment in the US. The case significantly weakened the classic debtor defense of
sovereign immunity, as well as further prominent defenses such as the act of state doctrine
and the principle of international comity (see Sturzenegger and Zettelmeyer, 2006).
A second landmark decision was Weltover v. Republic of Argentina12 in 1992, when
the US Supreme Court interpreted the issuance of external sovereign debt as a commercial
activity. This decision was fundamental, since it effectively granted US courts jurisdiction
over sovereign debt issued under US governing law. Three years later, CIBC v. Banco
Central do Brazil13 achieved the first major litigation success by a professional distressed
debt investor. The fund owned by the Dart family acquired USD 1.4 bn of Brazilian debt,
refused to participate in Brazil’s Brady deal of 1992, received a favorable judgment in
court, and then sold the debt again at a substantial profit. The case demonstrated the
possibly large rewards of holdout litigation. It also weakened the so called champerty
defense, which prohibited the purchase of debt with the primary intent of filing a lawsuit.
The demise of champerty set the stage for litigation by distressed debt funds, which buy
debt at depressed prices in the secondary market and then sue for full repayment in court.
Our data show that hedge funds are now the dominant player in this market, accounting
for more than 75% of lawsuits filed since 2000.
Elliott v. Peru14 in 2000 marks a fourth landmark decision in this field of law. The
case is in many ways representative for the past two decades of sovereign litigation, which
can be described as a “hunt for assets”. The main challenge for litigious creditors today is
not to achieve a favorable judgment, but to execute it and to collect assets. This is because
US law only allows attachments on government property that is both located in the United
States and used for commercial purposes.15 In the lawsuit against Peru, Elliott argued that
the pari passu clause forces Peru to pay all creditors on an equal basis, including holdout
11Allied Bank International v. Banco Credito Agricola de Cartago, 757 F.2d 516.12Republic of Argentina v. Weltover, Inc, 504 U.S. 607.13CIBC Bank and Trust Co. (Cayman) Ltd. v. Banco Central do Brasil, 886 F. Supp. 1105.14Elliott Associates L.P., General Docket No. 2000/QR192 (Ct. App. of Brussels)15Similar constraints apply in the UK, France, or Germany (Foster, 2008).
7
creditors who refused to participate in a past restructuring. Based on this strategy, Elliott
succeeded in blocking an interest payment on Peru’s Brady bonds. To avoid a default, Peru
then quickly settled at face value. The same pari passu interpretation has been invoked in
numerous other cases, most notably in 2011 by a subsidiary of Elliott which eventually led
to Argentina’s 2014 default.16 As of early 2015, however, no other plaintiff has succeeded
in blocking interest or principal debt payments on sovereign bonds.17
The challenge of enforcing sovereign debt judgments has led distressed debt funds
to attempt a variety of attachment strategies – including on assets such as government
airplanes, oil tankers, export revenues, or central bank assets and social security funds in
overseas accounts. Many of these seizure attempts are primarily aimed at disrupting a
country’s trade and capital flows, so as to increase the pressure on governments to negotiate
a favorable out of court settlement.
Besides these spillover costs, governments and creditors are also faced with direct
legal fees. While systematic data on the cost of litigation is missing, anecdotal evidence
suggests that they can be very high.18 In the context of the 2006 Iraq restructuring, which
involved large-scale litigation, the government paid reportedly USD 6.5m in fees to its legal
advisor,19 while Greece is said to have paid USD 8.5m for legal counsel in the context of
the 2012 debt restructuring, including for advice against holdouts and litigation.20 Even
higher fees are reported for Argentina, which is estimated to have paid about USD 400m
for its defense.21 On the creditor side, the hedge fund Elliott claims to have paid “tens
of millions of in legal fees” to sue Argentina over the past 12 years,22 initiating “over 900
seizure attempts over Argentine assets”.23 Similarly, the investment fund FG Hemisphere
claims to have spent USD 20m in its legal dispute with the Democratic Republic of Congo
16NML Capital, Ltd. v. Republic of Argentina, 08 Civ. 6978 (S.D.N.Y.)17Another recent case based on pari passu, led by Export-Import Bank of China v. Grenada, 13 Civ.
1450 (S.D.N.Y.), was settled in January 2015 before a similar injunction had been made (“Grenada cutsloan deal with Taiwan”, International Financing Review, 7 January 2015).
18Pitchford and Wright (2012a) provide a detailed overview on the cost of sovereign debt renegotiations,including legal expenses.
19“Cleary Plays Key Role in Easing Iraq’s Private Debt”, New York Law Journal, 14 April 2006.20“Greece Discloses Fees Paid to Cleary During Sovereign Debt Crisis”, The American Lawyer Daily, 22
March 2012; “Greece Details Payments to Advisers Used in Debt Restructuring”, Bloomberg Business, 22March 2012.
21“Buitres: el paıs gasto en abogados unos USD 400 millones”, La Nacion, 2 November 2014.22“Last Tango in Buenos Aires”, Times Magazine, 14 August 2014.23“Argentina and hedge fund NML Capital ratify their commitment to keep fighting”, Mercopress, 6
November 2014.
8
(Brown Rudnick, 2012).
2.2 Stylized facts: a puzzling variation across crises
Figure 1 shows the evolution of sovereign debt litigation 1978-2010, in two ways. First,
by counting the total number of cases pending in each year (left axis).24 This data series
is obviously influenced by individual crises, in particular the large number of cases filed
against Argentina. We therefore also match the litigation cases to the related debt crisis
events and show the share of restructurings affected, i.e. the subset of restructurings which
involved at least one sovereign debt lawsuit (as five year moving average, right axis). Both
ways to cut the data confirm that the prevalence of litigation has strongly increased since
the 1980s.
A further key insight from the data is the large variation across crises, as shown in
Table 6. Only 18% of restructuring events since 1978 were affected by litigation. The
majority of crises involve only a single lawsuit, while others are followed by a veritable
‘run to the courthouse’. Argentina faced lawsuits by 41 institutional creditors after its 2001
default, as well as dozens of suits by retail investors (which are not considered here).25
Other restructurings with large-scale litigation were Peru’s Brady debt exchange, which
triggered 13 lawsuits in the US, as well as Iraq 2006, Liberia 2009 and Congo 2007, which
involved 10, 9 and 7 cases, respectively. Generally, we find that most cases are filed against
middle-income countries in the emerging market world, albeit a third of all cases targeted
highly indebted poor countries (HIPCs).
What explains the startling variation in litigation across restructuring events? Before
conducting our own analysis below, we review the existing literature in search for explana-
tions. We find no systematic study on the drivers of sovereign debt litigation, but various
hints:
� A study on sovereign debt litigation by the financial sector groups IIF and EMTA
emphasizes that investors will be likely to agree to a restructuring if the offer contains
“mutually acceptable terms”. Litigation is supposedly least likely in “cooperative
24We merge multiple suits by the same creditor against the same country into one observation, so thatthe data are structured in creditor-debtor conflict pairs.
25Retail investors typically sue for small amounts and are typically not successful in achieving favorablesettlements (or in attaching assets).
9
agreements performed in good faith” that are considered as “fair by the parties
involved” (IIF, 2009, p. 3). This suggests that unilateral defaults with high haircuts
may be more prone to litigation. Similarly, engaging in talks with a representative
creditor committee is regarded as helpful to prevent legal disputes.
� In her proposal for an SDRM, Anne Krueger (2002) famously suggests that “the
increasingly diverse and diffuse creditor community poses coordination and collective
action problems” in sovereign debt restructurings, including litigation. Restructurings
with a large number of diverse creditors could therefore be more affected by litigation.
� Moreover, in a memorandum to the IMF, Buchheit (1999) explains that litigious
creditors partly select their “target” country based on the following criteria: (i) it must
be easy to purchase and sell the country’s debt on secondary markets, (ii) the debt
must be in default and available at a deep discount, and (iii) the restructuring must
involve debt issued under New York or English law, or in other ways be potentially
subject to jurisdiction in New York or England.
Neither of these propositions, however, has been tested or brought to the data. We
therefore have only limited empirical knowledge on what drives sovereign debt litigation.
The next sections will try to shed new light on the issue.
3 Theoretical framework and hypotheses
This section proposes a theoretical framework to structure our empirical analysis. We
start with a standard litigation model as reviewed by Cooter and Rubinfeld (1989) and
Spier (2007) but apply it to the context of sovereign default and restructurings. The
central trade-off in this framework is that creditors will only start a lawsuit if the expected
value of going to court exceeds the expected value of not doing so.26 More specifically,
we view a creditor’s decision to file suit as a function of three terms: First, the full value
of the claim in case she wins the case, multiplied by the expected probability of success.
Second, the recovery value that she will be left with if she loses, multiplied by the expected
26Coase (1960) famously suggested that a conflict between two negotiating parties is most likely toresult in a private settlement instead of a lawsuit in order to avoid the unnecessary costs of a legal battle.This assertion is reflected in sovereign debt markets as well: Most debt exchange offers achieve creditorparticipation of more than 90% (see Das et al., 2012).
10
probability of losing. And third, the costs associated with conducting a trial, which occur
independently from the trial’s outcome. Since the government can influence this trade-off by
setting the terms of the restructuring offer, our model consists of a single period two-stage
game, which we solve by backward induction.
Suppose the government owes debt to external creditors and for some exogenous reason,
e.g. a negative income shock, it decides to fully default or restructure this debt. This
implies an exchange offer on the entire stock of outstanding debt, which is reduced by a
haircut h ∈ [0, 1]. A government has some discretion in its choice of h, but it is also subject
to external pressure, in particular if it has requested official sector bailout money, which
is the case in the vast majority of debt crises (Marchesi, 2003). The IMF and the Paris
Club, for example, can demand a minimum haircut on commercial creditors to reduce
the risk of a future default and to assure fair burden-sharing between the private and the
official sector (Erce, 2013). We thus assume that the overall haircut h has two components:
first, an exogenous part he, which is determined by ability-to-pay constraints and external
pressure. Second, an endogenous component δ ∈ [0, 1− he], which is freely chosen by the
government and can be interpreted as the willingness-to-pay variable. The lower δ, the
more “creditor friendly” the offer, so that the overall haircut is given by h = he + δ.
The government faces a trade-off when it decides about δ: increasing the haircut reduces
the payment to the creditors who accept the restructuring, but at the same time induces
more investors to litigate by reducing the recovery value. If the government cannot find a
haircut which allows repayment out of its available resources, it will go into full default,
without any repayments to foreign creditors. This outside option implies that an increase
in the creditors’ legal rights can become detrimental if too many choose to hold out and
litigate instead of accepting the offer.
Importantly, we assume that the government cannot discriminate among creditors. The
haircut offer h is identical for all investors. This implies that the universal (one-size-fits-all)
offer can trigger different reactions among heterogeneous creditors.
3.1 Creditor decision
The market consists of n creditors, each of which holds an identical claim against the
government equal to d, such that the aggregate debt the government owes is given by
11
D = nd. Creditors are heterogeneous in the costs they face when going to court. For
instance, highly specialized distressed investors are more experienced in suing debtor
governments and in locating attachable assets and could thus face lower costs of litigating
(rejecting the offer). We therefore denote creditor litigation costs c with a subscript i, where
each ci is a realization of c ∈ [0, c]. f(c) and F (c) describe the density and cumulative
distribution functions of c, respectively. We assume that f ′(c) > 0 in order to describe a
cost distribution with fewer creditors with low costs of litigating than creditors with high
costs. This is in line with the relatively limited number of creditors engaging in litigation
that we observe in the data.27
After receiving the restructuring offer, creditors decide whether to accept or not.
Accepting implies that the debt claim is reduced by the size of the haircut to (1 − h)d.
This claim will be paid out for sure. The alternative choice is to reject the offer and go to
court to demand full repayment. This litigation decision is denoted by a binary variable
Li = {0, 1}, where L = 0 if the creditor participates in the restructuring and L = 1 if she
litigates instead.
Litigating is risky, because the full claim will only be recovered with success probability
p ∈ [0, 1]. The lawsuit will thus fail with probability (1 − p), in which case the creditor
receives nothing. As in Spier (2007), we assume that the plaintiff’s probability of winning
p increases in the opportunity cost of the defendant. In the sovereign debt context, one
can think of p as a function of the strength of creditor rights at the time of default lt,
and the government’s cost of facing litigation, denoted as cg, so that p ≡ p(lt, cg), with
∂p∂lt
> 0 and ∂p∂cg
> 0. We assume that both lt and cg are exogenously given. Government
costs will arise due to legal fees but also due to litigation externalities such as the cost of
losing access to international capital markets or due to asset seizures abroad. Changes
in legal doctrine also play a crucial role. As we discuss above, landmark judgments have
strengthened creditor rights since the 1980s, thus pushing up lt.
Creditors maximize profits subject to a budget constraint. Their profits consist of
income from the recovery value of defaulted government debt if they participate in the
27We do not make a specific assumption about the cost distribution in order to keep the analysis general.However, it is reasonable to think about the distribution of litigation costs as having a small mass of creditorswith low costs, and a relatively large mass with high costs. An example would be a beta distribution withparameter specification α > β.
12
restructuring, (1−h)d, and cash savings, si. Creditors will thus invest their full endowment
wi into savings or into expenses for litigation ci, so that:
maxLi
Πi = si + Li(pd) + (1− Li)(1− h)d
s.t. wi = si + Lici
(1)
Combining objective and constraint yields Πi = wi +Li(pd− ci) + (1−Li)(1− h)d. Hence,
the individual expected value of litigating is pd− ci. Creditor i will only choose Li = 1 and
litigate if this expected value exceeds the return of accepting the exchange offer, (1− h)d:
pd− ci ≥ (1− h)d (2)
Conditional on h and p, there can be a creditor for which eq. (2) holds with equality. This
marginal creditor i∗ is indifferent between litigating and accepting the haircut so that:
c∗i = (p− (1− h)) d (3)
The intuition is that for this marginal creditor, the probability of winning has to exactly
offset the loss from accepting the offer, so that she is indifferent between her two options.
In case c∗i < 0, it is not optimal for any existing creditor to file suit, resulting in full
participation. However, if there is a c∗i ≥ 0 such that eq. (3) is fulfilled, there will be a
non-negative share of litigating creditors. This creditor group, with costs smaller than
the marginal creditor i∗, is equal to Prob(ci ≤ c∗i ) = F (c∗i ) ≡ Φ. Put differently, Φ is
the share of creditors that will reject the restructuring offer and litigate instead, while
(1−Φ) = Prob(c∗i ) is the share of creditors that accept the haircut. We denote the density
at the marginal creditor f(c∗i ) as ϕ.
3.2 Government decision
The government can choose to offer a debt restructuring with a haircut h and receive
its income less repayments, V R, or go into full default and refuse any payments to its
creditors (this is equivalent to the government’s problem in Bolton and Jeanne, 2007, 2009).
Going into full default represents the government’s outside option with value V FD. If the
13
j.schumacher
Sticky Note
c_i > c_i^*
government chooses this option, creditors receive nothing. The outside option presents
essentially a participation constraint limiting the government’s willingness to repay more
than its available resources (see e.g. Aguiar and Amador, 2013; Sandleris, 2012, for a
detailed exposition of such a framework). The government’s payoff is given by:
V = max{V R, V FD} (4)
We normalize V FD = 0 for simplicity, although assuming a different autarky payoff does
not affect the results. If the government chooses to make an exchange offer, it can anticipate
the creditors’ reaction to the haircut h. Moreover, we follow previous work and assume
that a default causes an additional output cost κ, which increases in the magnitude of the
discretionary haircut, κ′(δ) > 0, κ′′(δ) > 0 (a similar assumption is made e.g. by Calvo,
1988; Bolton and Jeanne, 2007; Bi et al., 2011). This additional output cost can be thought
of as other costs of default considered in the literature, for example reputational costs,
trade sanctions, or damages to the domestic banking system. The government’s payoff
from offering a restructuring is thus given by:
V R = maxδ
y −D
( ∫ c∗i
0f(c)p dc︸ ︷︷ ︸
Repayment to holdouts
−∫ c∗i
0f(c)cg dc︸ ︷︷ ︸
Gov’t cost of litigation
−∫ c
c∗i
f(c)(1− h) dc︸ ︷︷ ︸Repayment to participants
)− κ(δ)
= y −D(
Φ(p+ cg) + (1− Φ)(1− h))− κ(δ) (5)
where y ∈ [yL, yH ] denotes the government’s uncertain exogenous income. The government
will choose to make a restructuring offer as long as the sum of the second and third term in
(5), the expected repayments and additional costs, do not exceed the realized income. Let
y denote the income equal to these costs of a restructuring offer. Then the probability of
full default is given by the probability that y ≤ y, which can be written as π =∫ yf(y)dy.
An implication of the full default outside option is that a change in the variables increasing
the expected repayments is beneficial for investors only as long as the government does
not go into full default. But an increase in the expected repayments also increases the
probability π. For instance, stronger legal creditor rights may increase the probability of
successful litigation p, and thus raise expected repayments. However, this can also lead to
14
a higher π by making an inorderly full default more attractive than a debt exchange whose
costs could exceed the government’s resources.
Empirically, the latter case is an unlikely situation. In our sample period, all defaulting
countries restructured their debt rather than going into complete autarky. We are therefore
more concerned with predictions about the share of creditors litigating, conditional on a
debt restructuring.
In designing the terms of a debt exchange, the government can anticipate the share of
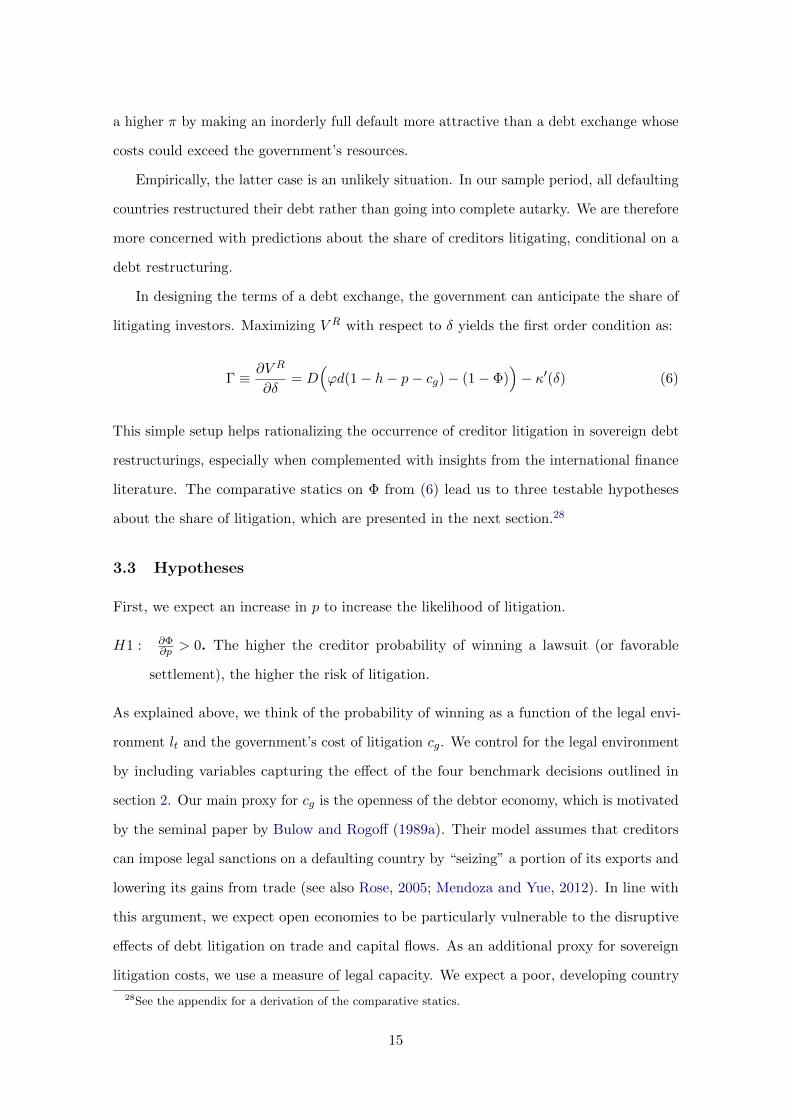
litigating investors. Maximizing V R with respect to δ yields the first order condition as:
Γ ≡ ∂V R
∂δ= D
(ϕd(1− h− p− cg)− (1− Φ)
)− κ′(δ) (6)
This simple setup helps rationalizing the occurrence of creditor litigation in sovereign debt
restructurings, especially when complemented with insights from the international finance
literature. The comparative statics on Φ from (6) lead us to three testable hypotheses
about the share of litigation, which are presented in the next section.28
3.3 Hypotheses
First, we expect an increase in p to increase the likelihood of litigation.
H1 : ∂Φ∂p > 0. The higher the creditor probability of winning a lawsuit (or favorable
settlement), the higher the risk of litigation.
As explained above, we think of the probability of winning as a function of the legal envi-
ronment lt and the government’s cost of litigation cg. We control for the legal environment
by including variables capturing the effect of the four benchmark decisions outlined in
section 2. Our main proxy for cg is the openness of the debtor economy, which is motivated
by the seminal paper by Bulow and Rogoff (1989a). Their model assumes that creditors
can impose legal sanctions on a defaulting country by “seizing” a portion of its exports and
lowering its gains from trade (see also Rose, 2005; Mendoza and Yue, 2012). In line with
this argument, we expect open economies to be particularly vulnerable to the disruptive
effects of debt litigation on trade and capital flows. As an additional proxy for sovereign
litigation costs, we use a measure of legal capacity. We expect a poor, developing country
28See the appendix for a derivation of the comparative statics.
15
to be ill-prepared for a protracted legal dispute in New York or London, and also to be
less able to shield its assets from attachment by experienced distressed investors. This
intuition is in line with Davis and Bermeo (2009), who argue that developing countries
face high fixed costs in WTO disputes, as well as Maggi and Staiger (2013) and Busch and
Reinhardt (2003), who find that poorer countries tend to settle their trade disputes earlier
and are also less successful in extracting concessions. Accordingly, we expect an increase
in debtor legal capacity to lower cg and thereby p, resulting in less litigation.
Second, we focus on those parameters that vary across debt crises, in particular the
haircut and the scope of the restructuring D.
H2 : ∂Φ∂he
> 0, ∂Φ∂D > 0. Higher exogenous haircuts and larger restructurings increase the
risk of litigation.
It is intuitive that a higher haircut increases the incentives to reject an exchange offer
and litigate for full repayment, i.e. for 100% of face value. The higher the haircut, the
lower the break-even cost of going to court. A similar rationale applies when investors buy
defaulted debt on the secondary market, because the wedge between face value and market
value of traded debt is likely to increase in the (expected) haircut on that debt. In line
with Bi et al. (2011), we therefore expect a higher haircut to increase litigation occurrence.
Since the endogenous haircut is the choice variable of the government, in the empirical
analysis we will allow haircuts to be both exogenously and endogenously determined.
Furthermore, we expect larger debt restructurings to be more affected by litigation.
One reason is that larger restructurings typically affect a larger number of creditors.29
More creditors make coordination more difficult and increase the probability that at least
some creditors hold out and litigate. This simple rationale is consistent with the model of
Pitchford and Wright (2012a,b), which predicts that a higher number of creditors results
in longer delay in sovereign debt renegotiation. Another potential reason why larger deals
involve more litigation are economies of scale. To see this, recall that we have assumed
a fixed cost of litigation for creditors, meaning that ci is independent of the size of debt
involved. A larger D will then translate into a higher share of litigating creditors because
29Trebesch (2010) codes the number of creditors for a sample of 90 sovereign bank debt exchanges in the“London Club” era, i.e. between 1980 and 1997. He finds a close relationship between deal size (amountrestructured in USD) and the number of banks affected by the exchange (the correlation coefficient is 0.46).
16
the ratio of cost to potential return (full repayment of d) decreases.
Third, we expect litigation to decrease in c.
H3 : ∂Φ∂c < 0. Higher legal costs for creditors decrease the risk of litigation.
To account for this, it is useful to think of ci as the opportunity costs of holding out. When
credit is cheap for all investors (and the distribution of creditor costs bound by a low c),
it is less costly to buy and hold non-performing debt for litigious purposes. In contrast,
holdout litigation is a costly activity in times of high borrowing cost (high c), such as the
high-yield period of the 1980s.
In the next section, we bring these theoretical predictions to the data.
4 Empirical approach and results
4.1 Estimation strategy and data
Empirically, we do not observe the marginal creditor’s cost c∗i . However, we do observe the
actual occurrence of litigation in debt restructurings, Y . For this purpose, we use the full
list of sovereign restructuring events between 1978 and 2010 from Cruces and Trebesch
(2013), and match it with our dataset on litigation events, accounting for lawsuits filed
either before or after the respective debt exchange. This leaves us with a cross-section of
174 restructuring events, of which 31 involved creditor litigation.30
As a baseline we estimate the probability of a restructuring being affected by legal
disputes. Put differently, we are looking for debt crises in which c∗i ≥ 0, so that the
marginal creditor’s cost of litigation is within the bounds of c (non-negative), resulting in
at least one lawsuit. Translated into a standard latent variable model, this implies that
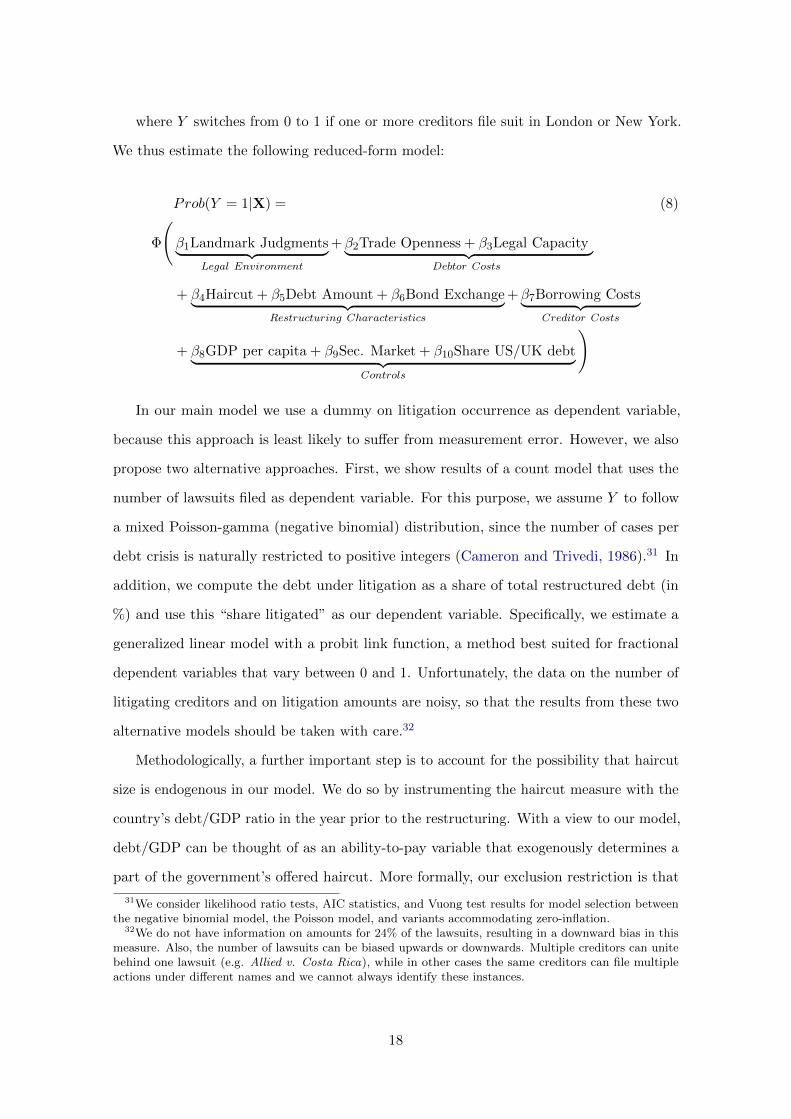
Y =
1 if c∗i ≥ 0
0 if c∗i < 0
(7)
30The original dataset by Cruces and Trebesch (2013) listed 180 debt exchanges. We use their recentlyupdated version, which includes four previously omitted cases (Congo 1988, Mozambique 2007, Nicaragua2007 and Liberia 2009,) and drops two deals which turned out to not have been implemented (Mozambique1987 and Cameroon 2002). Note also that a few countries saw two debt restructurings in the same year. Incase the court documents do not allows us to uniquely match a litigation case to one of the two events, wemerge them into one observation per country and year. This yields a final sample of 174 cases.
17
where Y switches from 0 to 1 if one or more creditors file suit in London or New York.
We thus estimate the following reduced-form model:
Prob(Y = 1|X) = (8)
Φ
(β1Landmark Judgments︸ ︷︷ ︸
Legal Environment
+β2Trade Openness + β3Legal Capacity︸ ︷︷ ︸Debtor Costs
+ β4Haircut + β5Debt Amount + β6Bond Exchange︸ ︷︷ ︸Restructuring Characteristics
+β7Borrowing Costs︸ ︷︷ ︸Creditor Costs
+ β8GDP per capita + β9Sec. Market + β10Share US/UK debt︸ ︷︷ ︸Controls
)
In our main model we use a dummy on litigation occurrence as dependent variable,
because this approach is least likely to suffer from measurement error. However, we also
propose two alternative approaches. First, we show results of a count model that uses the
number of lawsuits filed as dependent variable. For this purpose, we assume Y to follow
a mixed Poisson-gamma (negative binomial) distribution, since the number of cases per
debt crisis is naturally restricted to positive integers (Cameron and Trivedi, 1986).31 In
addition, we compute the debt under litigation as a share of total restructured debt (in
%) and use this “share litigated” as our dependent variable. Specifically, we estimate a
generalized linear model with a probit link function, a method best suited for fractional
dependent variables that vary between 0 and 1. Unfortunately, the data on the number of
litigating creditors and on litigation amounts are noisy, so that the results from these two
alternative models should be taken with care.32
Methodologically, a further important step is to account for the possibility that haircut
size is endogenous in our model. We do so by instrumenting the haircut measure with the
country’s debt/GDP ratio in the year prior to the restructuring. With a view to our model,
debt/GDP can be thought of as an ability-to-pay variable that exogenously determines a
part of the government’s offered haircut. More formally, our exclusion restriction is that
31We consider likelihood ratio tests, AIC statistics, and Vuong test results for model selection betweenthe negative binomial model, the Poisson model, and variants accommodating zero-inflation.
32We do not have information on amounts for 24% of the lawsuits, resulting in a downward bias in thismeasure. Also, the number of lawsuits can be biased upwards or downwards. Multiple creditors can unitebehind one lawsuit (e.g. Allied v. Costa Rica), while in other cases the same creditors can file multipleactions under different names and we cannot always identify these instances.
18
the level of indebtedness will only affect creditor litigation through its effect on haircut
size (after controlling for the amount restructured, and per capita GDP). As we confirm
below, we find that the debt/GDP ratio is an important determinant of haircut size, but
not significantly correlated with litigation occurrence.
The ordering of the explanatory variables follows our theoretical discussion above.
As before, we start with proxies for p, the creditor’s expected probability of winning, in
particular measures for the legal environment and the cost of litigation for debtor countries.
To account for changes in legal doctrine, we follow a similar approach as Bradley et al. (2010)
and use time dummies on particularly important landmark judgments and their aftermath.
The first dummy captures the period after the first significant sovereign litigation case
Allied Bank v. Costa Rica, and takes the value 1 for each year between 1985 and 1991.
The second indicator captures the time after Weltover v. Argentina (1992-1994), a decision
that paved the way for US-based creditor litigation. The third dummy covers 1995-1999,
the period after CIBC v. Brazil, which was the first major “vulture” success against a
defaulting sovereign. Finally, we include a dummy for the year 2000 onwards, when Elliott
v. Peru set a precedent on how judgments could actually be enforced. Our reference
category is the time pre-1985, which means that we expect the coefficient of each dummy
to be positive. To proxy for debtor litigation cost, we include measures of trade openness,
in particular (Imports+Exports)/GDP, for which we use data from the World Bank and
the IMF Direction of Trade Statistics. In addition, we measure financial openness based on
Lane and Milesi-Ferretti (2007) and compute (Foreign Assets+Foreign Liabilities)/GDP.
With a view to the above, we expect more open economies to be more prone to litigation.
The same is true for those debtor countries with a weak bureaucratic and legal capacity. To
proxy for legal capacity, we draw on a standard measure from the World Bank Governance
Indicators (Kaufmann et al., 2010), because there is no cross-country measure of actual
legal capacity. Specifically, we use the “Government Effectiveness” subindicator, which
captures the sophistication of a country’s public administration and its institutional and
bureaucratic effectiveness.33
The second set of explanatory variables vary across debt restructurings, in particular
33For reasons of data availability and to reduce potential endogeneity, we use average governmenteffectiveness over the entire sample period.
19
proxies for h and D. We rely on the data on haircuts (creditor losses) and restructuring
amounts as coded by Cruces and Trebesch (2013) for all deals since the 1970s. In our
benchmark regressions, we use the present value (PV) haircut estimates where h = 1−PVnewPVold
,
but the results are very similar when using haircuts in face value terms (reduction in
principal). The amount of debt restructured is computed in real 2005 USD. In line with the
arguments outlined above, we expect larger restructurings and those with higher haircuts
to trigger more litigation. Figure 2 provides preliminary indication that this is indeed the
case. For completeness, we also include a dummy indicating whether the restructuring
involved sovereign bonds, as opposed to deals that only involved bank debt. In line with
the literature on creditor coordination problems, we expect bond exchanges to affect a
more dispersed creditor population, resulting in more holdouts.
Third, we introduce a proxy for creditor litigation costs. We use Barclays’ US Corporate
High Yield Bond Index, a measure of corporate borrowing costs which goes back to the
late 1970s. Since higher borrowing costs decrease the returns to litigation, we expect a
negative relationship between this yield index and the probability of lawsuits.
Finally, we aim to account for additional heterogeneity across countries and default
cases. First, we include per capita GDP in 1980.34 Second, we construct a dummy variable
for the presence of secondary market debt trading. It takes the value 1 if a country’s
sovereign bonds or loans are actively traded on secondary markets.35 However, the role of
secondary markets trading in our context is not straightforward. Buchheit (1999) argues
that liquid secondary markets make it easier for specialized investors to buy defaulted
bonds and then litigate for full repayment. In contrast, Pitchford and Wright (2010) show
that the effects of secondary markets on debt renegotiation are ambiguous. The impact of
secondary market trading is therefore an empirical question. As a last control, we account
for the legal characteristics of a country’s sovereign debt portfolio, by measuring the share
of outstanding external debt that was issued under either US/New York or English law.
34We use beginning-of-sample values instead of time-varying GDP data in order to avoid endogenouseffects of debt crises on GDP. The results, however, are robust to using yearly lags of GDP per capita.
35For the 1990s and 2000s we check whether a country’s bonds are included in the JP Morgan EmergingMarket Bond Index, which was launched in 1993 and only includes debt instruments that meet a range ofliquidity conditions. For the late 1980s and early 1990s we account for secondary market trading of sovereignloans using data by Sawada (2001). The data show that during the 1980s only 15% of the countries in oursample had a liquid debt market. This number rises to over 40% for restructurings during the 1990s and2000s.
20
We construct this measure from Dealogic whenever possible, using the information on the
legal characteristics of more than 20,000 sovereign bonds and loans issued in international
primary markets.36 In line with Buchheit (1999), we expect a higher ratio of US or English
law debt to increase the probability of litigation in US and UK courts. Table 1 provides
an overview of all variables used in the analysis, their sources, as well as their respective
summary statistics.
4.2 Main results
Table 2 reports our main results, displayed as average marginal effects. All main explanatory
variables have the expected sign. Landmark judgments are clearly significant, with a large
quantitative effect on the propensity of litigation (column 1). This finding is consistent
with our theoretical prediction that a higher creditor probability of winning results in
more lawsuits. The erosion of sovereign immunity since the early 1980s was an important
precondition for the strong increase in litigation which we observe in the data. Our other
proxies of creditors’ winning probability are economic openness and government legal
capacity. As shown in column (2) both variables are significant and have the expected sign.
The more open the country and the weaker its legal and administrative capacity, the more
likely a restructuring will be accompanied by litigation.
Next, we show results for the role of restructuring characteristics, in particular the
amount restructured and haircut size (column 3). Both are positively correlated with
the probability of litigation. This is consistent with our own theoretical argument above,
as well as with the models by Pitchford and Wright (2012a,b) and Bi et al. (2011).
Surprisingly, however, we do not find a statistically significant coefficient for the bond
restructuring dummy. Corporate borrowing costs, on the other hand, have a significant
negative correlation with litigation (column 4), although this finding is not robust to all
changes in model specifications that we attempt later on.
Column (5) shows our full model including all main explanatory variables and additional
country-specific factors. As expected, we find countries with a higher share of debt issuances
36Specifically, we use the sample average share of sovereign bonds issued under US or UK law relativeto the total amount of externally issued bonds. For countries with missing observations, we use data ongoverning laws of corporate bonds. Finally, for the subset of countries for which we do not have any data,we interpolate the variable from countries with the same legal origins according to Glaeser and Shleifer(2002).
21
under US or UK governing law to be more likely to be sued in New York or London, but we
do not find a significant effect of secondary market trading or GDP per capita. Arguably,
the most notable insight from our full model is that the dummies on landmark judgments
are now clearly insignificant, both individually and as a group, as confirmed by a standard
Wald test for joint significance. Taken at face value, this result suggests that the legal
environment is only a weak predictor of creditor litigation during debt crises. However, we
are fully aware that our approach to capture legal doctrine is imperfect. What we can say
with some confidence is that it does not suffice to account for legal factors only. Instead, we
find that economic fundamentals and restructuring characteristics are surprisingly powerful
predictors of litigation occurrence.
In terms of effect size, the variables on trade openness, haircuts, and restructuring
volume seem to be particularly relevant. To see this, we refer to the marginal effect
estimates in column (6), which shows how a one standard deviation increase in each of the
variables (around their sample mean) changes the predicted probability of litigation, while
holding all other variables constant at mean values. A one standard deviation increase
in haircut size around the sample mean of 38% (from 24% to 52%) is associated with an
increase in the probability of litigation of 7 percentage points, i.e. from 7 to 14%. Similarly,
we find that an increase in deal size by one standard deviation increases the probability of
litigation by 12 percentage points, while increasing the trade to GDP ratio from 45% to
83% raises the litigation probability by 5 percentage points.
The results are quantitatively and qualitatively similar when using our alternative
dependent variables and estimation techniques. This is evident in columns (7) and (8), which
use the number of lawsuits filed and the amount under litigation (in % of total restructured
debt), respectively. One notable change is that the coefficient for bond restructurings turns
significant, suggesting that a more dispersed group of creditors increases case numbers
and the amount under dispute. In addition, we now find the dummy for secondary market
trading to be significant, although with a negative sign.
There are considerable time trends in our explanatory variables through the sample
period. The predicted probability of litigation at the sample means for all variables is
9.7%. However, this value disguises significant changes over time. For example, global
average trade openness has increased from 38% during the average 1980s to 52% since
22
2000. Using the 1980s trade openness value and keeping all other variables constant at
their sample mea), the predicted probability of litigation is 6.6%. Using the average 2000s
trade openness value, on the other hand, results in a predicted litigation risk of 8.2%.
This means that the change in global trade openness over the sample period corresponds
to a two-percentage point increase in the estimated risk of litigation. Similar to the
developments in trade openness, there has been an upward trend in haircuts. The average
haircut size has increased from 26% in the 1980s to 62% in recent years. Comparing the
predicted probability at these two values implies a 10 percentage point increase in the
predicted probability of litigation (from 7.0% to 16.7%, again keeping the other variables
at their sample mean). Finally, borrowing rates for high-yield debt have dropped from
an average of about 15% during the 1980s to less than 10% in the 2000s. According to
our baseline estimates, this drop in borrowing costs is associated with a 13 percentage
point increase in the predicted risk of litigation (from 6% to 19%). Considering these
three variables together, the predicted probability of litigation at the average 1980s values
amounted to only 3%, compared to 27% at the average 2000s values.
Importantly, however, we find that time trends do not appear to drive our main findings.
Column (4) of Table 3 shows that the estimates are stable in a post-2000 sample, i.e.
after the landmark Elliott judgment and during the ‘modern’ era of sovereign borrowing,
featuring bond debt and increasing secondary market trading. The findings are also similar
in the pre-2000 sample and when including decade fixed effects. We therefore conclude
that the results discussed above are not spurious, and that our empirical model is robust
to changes in market structure or global economic developments.
4.3 Performance as “Early Warning System”
How does the model perform as an early warning tool of creditor litigation? As a first
assessment, we can apply the customary binary classification rule with a predicted prob-
ability threshold of 0.5. This shows that our benchmark model of column (5) in Table
2 correctly predicts litigation occurrence in 88% of restructuring events since the 1970s.
However, litigation is a rare event, with an unconditional probability of just 18% (base
rate=82%), so that the 88% number masks the true model performance. Moreover, it is
not clear a priori, whether the 0.5 threshold is appropriate for the data at hand: we face
23
the classic trade-off between maximizing the sensitivity of the model (by trying to correctly
predict each observed litigation case) or maximizing the model’s specificity (by avoiding
false positives, i.e. litigation predictions when it did in fact not occur).
A more objective evaluation tool is to estimate a receiver operating characteristic (ROC)
curve, which does not require choosing an (arbitrary) classification probability cut-off,
as illustrated for financial crisis prediction in Schularick and Taylor (2012). The ROC
curve plots the true positive rate against the false positive rate for all possible probability
cut-offs between 0 and 1. The area under the curve (AUROC) can thus be interpreted as a
generalized measure of model performance. An AUC value of 0.5 means that the model
does not perform any better than tossing a coin for prediction (45-degree line), while a
value of 1 indicates perfect classification. Thus, intuitively, the ROC curve illustrates how
well the model predicts the outcome of interest compared to a random classification.
Figure 3 shows the ROC curve for our full benchmark model. The AUROC is 0.86 and
it outperforms the benchmark coin-toss model at the 1% significance level. The AUROC is
also notably higher than in any of the crisis prediction classifications in Schularick and
Taylor (2012), who explain that values above 0.75 can be regarded as high, e.g. in medical
trials. The second ROC curve shown is based on column (1) and includes only the legal era
variables, i.e. the court decision time dummies, to account for the rising trend in litigation.
The legal-only model also does well, with an AUROC statistic of 0.77, but our full model
has a statistically significantly higher AUROC value. We thus conclude that our main
specification with legal and economic variables performs reasonably well in explaining
litigation events across the debt crises of the past decades.
4.4 Robustness
In Table 3 we conduct a series of robustness checks. For this purpose, we depart from our
most conservative specification (column 5 of Table 2), which is the model that also shows
the highest log likelihood. Overall, our main results remain stable.
Column (1) replaces trade openness with financial openness, which also turns out to be
a statistically and economically significant predictor of litigation. Column (2) includes an
indicator that captures whether the debt renegotiations were coordinated with a recognized
creditor committee, as during most exchanges in the “London Club” era (data on creditor
24
committees is taken from Trebesch (2010) and Das et al. (2012)). This dummy does not
have a significant correlation with litigation risk and including it does not affect the results
in any meaningful way.
The results also hold if we exclude the main outlier cases, in particular Argentina 2005
(column 4), or additionally Brazil 1994 and Peru 1997, which together account for more
than two-thirds of the restructured debt in our sample period alone (column 5). Likewise,
we find all main results to be stable when controlling for regional effects, i.e. dummies for
Latin American and African countries, which are the two continents with most sovereign
debt litigation cases (column 6). In column (7) we exclude cases of strictly pre-emptive
restructurings based on a new dataset by Asonuma and Trebesch (2014). Strictly pre-
emptive deals are those in which no payments are missed during the restructuring process.
The results remain stable when dropping these non-default cases. The same is true when
we consider the forum where litigation takes place. Of the 121 lawsuits in our sample,
104 were filed in the US, 14 in the UK, and 3 were brought to international arbitration
tribunals. Column (8) presents results when restricting the sample only to lawsuits filed in
US courts. While the marginal effect on the government effectiveness variable is no longer
significant, the effect direction does not change and its size remains at a considerable level.
In a next step, we interact the main variables of interest with our measure of deal size
(column 3). The idea is to check whether there is an interaction between the volume of
the debt restructuring and the correlation of the main variables with the probability of
litigation. Such an interaction could arise, for instance, if the government suffers a fixed
cost from litigating creditors. In that case, the value of settling with litigating holdout
creditors would be larger for larger debt volumes. A holdout creditor disrupting a large
debt restructuring would then have greater leverage, making these deals more attractive
targets for distressed debt investors. Empirically, we estimate a variation of our benchmark
model as:
Prob(Y = 1|X, Z,Debt Amount) =
Φ
(β1Z + β2Debt Amount + β3Z ×Debt Amount + X′β
)(9)
Table 4 shows the results. All main results remain consistent with the previous findings
25
after controlling for interactions with the deal size. Haircut size appears irrelevant for small
debt restructurings (less than USD 200 m), but its marginal effect increases strongly with
the volume of debt involved. For example, for very large debt exchanges (more than USD
3 bn), a one standard deviation increase in haircuts can be associated with a more than 16
percentage points higher risk of litigation (from 13 to 29%). This result suggests that a high
haircut is much more likely to end up in court if the number of affected creditors is also
high. Since the coefficient on the interaction term in non-linear models cannot be sensibly
interpreted,37 we also show the marginal effects obtained from the interaction models as a
function of the debt volume in figure 4. The marginal effects for all main variables except
the bond restructuring indicator keep their sign for all observed deal volumes. However, the
statistical significance varies slightly. Whereas the trade/GDP ratio and the government
effectiveness have a significant effect for medium-sized restructurings, the haircut and the
corporate yield are significant for the restructurings above the median debt volume in our
sample. As in the main results, the marginal effect on the bond restructuring variable is
insignificant throughout.
Finally, we account for endogeneity of the haircut. In line with our theoretical framework,
haircuts could be partly endogenous, because governments anticipate creditors to file suit
when facing high losses. This would result in a downward bias in the estimated haircut
coefficient, since our main result is based on a sample of debt restructurings with high
haircuts that were imposed despite the threat of creditor litigation. Table 5 shows results
when running instrumental variable regressions using the lagged debt/GDP ratio as an
instrument for haircut size, for both probit and linear probability models in the second
stage. The results indicate that our baseline haircut coefficients are indeed downward
biased. The average marginal effect of haircut size is about twice as large compared to our
benchmark model. The instrument performs well with respect to standard specification
statistics. We are able to reject the null of a weak instrument, which further increases our
37In non-linear models with interactions between independent variables, the marginal effect of theinteracted variables depend non-linearly on the level of the other variable. This implies that the coefficienton the interaction term cannot be meaningfully interpreted, see the discussion by Greene (2010). In equation(9), the marginal effect for a change in Z is given by
∂Pr(Y = 1)
∂Z= φ(β1Z + β2Debt Amount + β3Z × Debt Amount + X′β)(β1 + β3Debt Amount)
where φ represents the p.d.f. of the probit function. We therefore show the marginal effects in table 4instead of the raw coefficients, and supplement the results with the graphs in figure 4.
26
confidence in the regression results.38
5 Conclusion
This paper studies a prominent type of creditor coordination problems in the context
of sovereign debt defaults: holdout litigation. We find that litigation against defaulting
sovereigns can be explained reasonably well within a simple framework from the law and
economics literature. Similar to other fields of law, sovereign debt lawsuits are more likely
(i) when the damage is large, i.e. in case of high haircuts and larger restructuring amounts,
(ii) when litigation costs are low for the plaintiffs, i.e. when borrowing costs are low, and
(iii) when the defendant is vulnerable, e.g. when the defaulting country has a high degree
of financial and trade openness. These insights may be relevant for the ongoing reform
debate on sovereign debt and default, for theory work in international finance, and for
scholars working on litigation in other fields.
Looking forward, our findings suggest that creditor litigation will remain relevant
and potentially increase further. Most debtor countries are open economies, which facili-
tates attachments and increases the chance of creditors to achieve a favorable settlement.
Borrowing costs continue to be low, which means that holding out is relatively cheap.
Moreover, we are witnessing an increase in government indebtedness worldwide, which
makes it likely that future debt restructurings may involve large debt amounts and also
result in high haircuts, thus raising the probability of creditor litigation. Besides these
economic trends, recent litigation successes against Argentina and Ireland have arguably
strengthened creditor rights further, and may thus encourage more distressed debt funds
to hold out and litigate in future debt exchanges (see Buchheit et al., 2013b). At the same
time, the issuance of debt under New York and English law could become an increasingly
relevant commitment device for sovereigns, since defaults on these types of bonds can have
costly legal consequences. This has already happened in Greece, which issued its new
bonds under English law to signal its willingness to pay (Gulati and Zettelmeyer, 2012).
38We also considered using IMF programs at the time of restructuring as an instrument, to capture theeffect of IMF pressure on haircut size. The instrument performed very weakly, which is why we do not showthe results. However, including both the debt/GDP ratio and the IMF indicator as instruments allowstesting the exclusion restriction. Based on the resulting Hansen’s J statistic, we could not reject the null ofvalid instruments, which supports our choice of the debt/GDP ratio as an instrument for haircuts.
27
References
Abbas, Ali, Nazim Belhocine, Asmaa El Ganainy, and Mark Horton. 2010. A HistoricalPublic Debt Database, IMF Working Paper No. 10/245.
Aguiar, Mark and Manuel Amador. 2013. Sovereign debt, Handbook of InternationalEconomics, 4.
Alfaro, Laura, Noel Maurer, and Ahmed Faisal. 2010. Gunboats and Vultures: MarketReaction to the “Enforcement” of Sovereign Debt , mimeo, UCLA.
Asonuma, Tamon and Christoph Trebesch. 2014. Sovereign Debt Restructurings: Preemptiveor Post-Default , mimeo, University of Munich.
Beshkar, Mostafa. 2013. Arbitration and Renegotiation in Trade Agreements, mimeo,University of New Hampshire.
Bi, Ran, Marcos Chamon, and Jeromin Zettelmeyer. 2011. The Problem that Wasn’t:Coordination Failures in Sovereign Debt Restructurings, IMF Working Paper No. 11/265.
Blackman, Jonathan I. and Rahul Mukhi. 2010. The evolution of modern sovereign debtlitigation: Vultures, alter egos, and other legal fauna, Law and Contemporary Problems,73(4), 47–62.
Bolton, Patrick. 2003. Toward a Statutory Approach to Sovereign Debt Restructuring:Lessons from Corporate Bankruptcy Practice around the World , IMF Working Paper No.03/13.
Bolton, Patrick and Olivier Jeanne. 2007. Structuring and restructuring sovereign debt:The role of a bankruptcy regime, Journal of Political Economy , 115(6), 901–924.
Bolton, Patrick and Olivier Jeanne. 2009. Structuring and restructuring sovereign debt:The role of seniority, The Review of Economic Studies, 76(3), 879–902.
Bown, Chad. 2004. On the economic success of GATT/WTO dispute settlement, Reviewof Economics and Statistics, 86(3), 811–823.
Bown, Chad. 2005a. Participation in WTO dispute settlement: Complainants, interestedparties and free riders, World Bank Economic Review , 19(2), 287–310.
Bown, Chad. 2005b. Trade remedies and World Trade Organization dispute settlement:Why are so few challenged?, Journal of Legal Studies, 34(2), 515–555.
Bradley, Michael, James Cox, and G. Mitu Gulati. 2010. The market reaction to legalshocks and their antidotes: Lessons from the sovereign debt market, Journal of LegalStudies, 39(1), 289–324.
Broomfield, Elizabeth. 2010. Subduing the vultures: Assessing government caps on recoveryin sovereign debt litigation, Columbia Business Law Review , 473–528.
Brown Rudnick. 2012. Vulture funds take note, Strong Suit Alert , URLhttp://www.brownrudnick.com/uploads/114/doc/Brown_Rudnick_Vulture_Funds_
Take_Note.pdf.
Buchheit, Lee C. 1999. Sovereign debt litigation, Memorandum for the InternationalMonetary Fund , February 04, 1999.
28
Buchheit, Lee C., Anna Gelpern, G. Mitu Gulati, Ugo Panizza, Beatrice Weder Di Mauro,and Jeromin Zettelmeyer. 2013a. Revisiting Sovereign Bankruptcy , Washington D.C.:Brookings Institution.
Buchheit, Lee C., G. Mitu Gulati, and Ignacio Tirado. 2013b. The Problem of HoldoutCreditors in Eurozone Sovereign Debt Restructurings, mimeo, Duke University.
Bulow, Jeremy and Kenneth Rogoff. 1989a. A constant recontracting model of sovereigndebt, Journal of Political Economy , 97(1), 155–178.
Busch, Marc and Eric Reinhardt. 2003. Developing countries and General Agreement onTariffs and Trade/World Trade Organization dispute settlement, Journal of WorldTrade, 37(4), 719–735.
Busch, Marc L. and Eric Reinhardt. 2006. Three’s a crowd: Third parties and WTOdispute settlement, World Politics, 58(3), 446–477.
Calvo, Guillermo. 1988. Servicing the public debt: The role of expectations, AmericanEconomic Review , 78(4), 647–661.
Cameron, A. and P. Trivedi. 1986. Econometric models based on count data: Comparisonsand applications of some estimators and tests, Journal of Applied Econometrics, 46,347–364.
Cleary Gottlieb Steen & Hamilton and Clifford Chance. 1992. Avoiding the nightmarescenario, International Financial Law Review , 11, 19–22.
Coase, Ronald. 1960. The problem of social cost, Journal of Law and Economics, 3(1),1–44.
Cooter, Robert D. and Daniel L. Rubinfeld. 1989. Economic analysis of legal disputes andtheir resolution, Journal of Economic Literature, 27, 1067–1097.
Cruces, Juan J. and Christoph Trebesch. 2013. Sovereign defaults: The price of haircuts,American Economic Journal: Macroeconomics, 5(3), 1–34.
Das, Udaibir, Michael Papaioannou, and Christoph Trebesch. 2012. Sovereign Debt Re-structurings 1950-2010: Literature Survey, Data, and Stylized Facts , IMF Working PaperNo. 12/203.
Davis, Christina and Sarah Bermeo. 2009. Who files? Developing country participation inGATT/WTO adjudication, Journal of Politics, 71(3), 1033–1049.
Dooley, Michael P. 2000. International financial architecture and strategic default: Canfinancial crises be less painful?, Carnegie-Rochester Conference Series on Public Policy ,53(1), 361–377.
EMTA. 2009. Creditor Litigation in the Non-HIPC Sovereign Debt Restructuring Context ,Paper prepared for Club de Paris Meeting.
Enderlein, Henrik, Christoph Trebesch, and Laura von Daniels. 2012. Sovereign debtdisputes, Journal of International Money and Finance, 31(2), 250–266.
Engelen, Christian and Johann Lambsdorff. 2009. Hares and stags in Argentinean debtrestructuring, Journal of International Economics, 78(1), 141–148.
29
Erce, Aitor. 2013. Sovereign Debt Restructurings and the IMF: Implications for FutureOfficial Interventions, Federal Reserve Bank of Dallas Working Paper No. 143.
European Commission. 2012. EU accountability report 2012 on financ-ing for development, Staff Working Paper , URL http://ec.europa.eu/
europeaid/what/development-policies/financing_for_development/documents/
swp-199-main-report.pdf.
Fisch, Jill E. and Caroline M. Gentile. 2004. Vultures or vanguards? The role of litigationin sovereign debt restructuring, Emory Law Journal , 53, 1043–1114.
Foster, George K. 2008. Collecting from sovereigns: The current legal framework forenforcing arbitral awards and court judgments against states and their instrumentalities,and some proposals for its reform, Arizona Journal of International & Comparative Law ,25(3), 666–731.
Gai, Prasanna, Somon Hayes, and Hyun Song Shin. 2004. Crisis costs and debtor discipline:The efficacy of public policy in sovereign debt crises, Journal of International Economics ,62(2), 245–262.
Gelpern, Anna. 2005. After Argentina, Institute for International Economics Policy BriefNo. 05/02.
Ghosal, Sayantan and Marcus Miller. 2003. Co-ordination failure, moral hazard andsovereign bankruptcy procedures, Economic Journal , 113(487), 276–304.
Ghosal, Sayantan and Kannika Thampanishvong. 2013. Does strengthening CollectiveAction Clauses (CACs) help?, Journal of International Economics, 89(1), 68–78.
Gianviti, Francois, Anne Krueger, Jean Pisany-Ferry, Andre Sapir, and Jurgen von Hagen.2010. A European Mechanism for Sovereign Debt Crisis Resolution: A Proposal , Brussels:Bruegel.
Glaeser, E. L. and A. Shleifer. 2002. Legal origins, The Quarterly Journal of Economics,117(4), 1193–1229.
Goldman, Samuel E. 2000. Mavericks in the market. The emerging problem of hold-outs insovereign debt restructuring, UCLA Journal of International and Foreign Affairs, 5(1),159–198.
Greene, William H. 2010. Testing hypotheses about interaction terms in nonlinear models,Economics Letters, 107(2), 291–296.
Grinols, Earl L. and Roberto Perrelli. 2006. The WTO impact on international tradedisputes: An event history analysis, Review of Economics and Statistics, 88(4), 613–624.
Gulati, Mitu and Robert E. Scott. 2012. The Three and a Half Minute Transaction:Boilerplate and the Limits of Contract Design, Chicago: University of Chicago Press.
Gulati, Mitu and Jeromin Zettelmeyer. 2012. Making a voluntary Greek debt exchangework, Capital Markets Law Journal , 7, 169–183.
Haldane, Andrew, Adrian Penalver, Victoria Saporta, and Hyung Shin. 2005. The analyticsof sovereign debt restructuring, Journal of International Economics, 65(2), 315–333.
30
Hurlock, James B. 1984a. Advising sovereign clients on the renegotiation of their externalindebtedness, Columbia Journal of Transnational Law , 23, 29–48.
Hurlock, James B. 1984b. The legal treatment of sovereign default: The borrower’sperspective, in David Suratgar, (Ed.) Default and Rescheduling: Corporate and SovereignBorrowers in Difficulty , Washington D.C.: Euromoney Publications, Chapter 12.
IIF. 2009. Creditor Litigation in Low-Income Countries Benefiting from the Enhanced-HIPCand MDRI , Paper prepared for Club de Paris Meeting.
IMF. 2002. Global Financial Stability Report , Washington D.C.: IMF.
IMF. 2003. Proposed Features of a Sovereign Debt Restructuring Mechanism, WashingtonD.C.: IMF.
IMF. 2013. Sovereign Debt Restructuring. Recent Developments and Implications for theFund’s Legal and Policy Framework , Washington D.C.: IMF.
Kaufmann, Daniel, Aart Kraay, and Massimo Mastruzzi. 2010. The Worldwide GovernanceIndicators: A Summary of Methodology, Data and Analytical Issues , World Bank PolicyResearch Working Paper No. 5430, URL http://info.worldbank.org/governance/
wgi/index.asp.
Krueger, Anne. 2002. A New Approach to Sovereign Debt Restructuring , Washington D.C.:IMF, URL http://www.imf.org/external/pubs/ft/exrp/sdrm/eng/index.htm.
Lanau, Sergi. 2011. The Contractual Approach to Sovereign Debt Restructuring , Bank ofEngland Working Paper No. 409.
Landes, William. 1971. An economic analysis of the courts, Journal of Law and Economics ,14(1), 61–107.
Lane, Philip R. and Gian Maria Milesi-Ferretti. 2007. The external wealth of nations markII: Revised and extended estimates of foreign assets and liabilities, 1970–2004, Journalof International Economics, 73(2), 223–250.
Lanjouw, Jean and Josh Lerner. 1997. The Enforcement of Intellectual Property Rights: ASurvey of the Empirical Literature, NBER Working Paper Series No. 6296.
Lerner, Josh. 2010. The litigation of financial innovations, Journal of Law and Economics,53(4), 807–831.
Maggi, Giovanni and Robert W. Staiger. 2011. The role of dispute settlement procedures ininternational trade agreements, The Quarterly Journal of Economics, 126(1), 475–515.
Maggi, Giovanni and Robert W. Staiger. 2013. Trade Disputes and Settlement , mimeo,Yale University.
Marchesi, Silvia. 2003. Adoption of an IMF programme and debt rescheduling. an empiricalanalysis, Journal of Development Economics, 70(2), 403–423.
Mendoza, Enrique G. and Vivian Z. Yue. 2012. A general equilibrium model of sovereigndefault and business cycles, Quarterly Journal of Economics, 127(2), 889–946.
Miller, Marcus and Dania Thomas. 2007. Sovereign debt restructuring: The judge, thevultures and creditor rights, The World Economy , 30(10), 1491–1509.
31
Miller, Marcus and Lei Zhang. 2000. Sovereign liquidity crises: The strategic case for apayments standstill, Economic Journal , 110(460), 335–362.
Mody, Ashoka. 2013. Sovereign Debt and its Restructuring Framework in the Euro Area,Bruegel Working Paper 2013/05.
Pitchford, Rohan and Mark L. J. Wright. 2007. Restructuring the Sovereign Debt Re-structuring Mechanism, mimeo, UCLA, URL http://www.econ.ucla.edu/mlwright/
research/workingpapers/RSDRM.pdf.
Pitchford, Rohan and Mark L. J. Wright. 2010. Holdouts in Sovereign Debt Restructuring:A Theory of Negotiation in a Weak Contractual Environment , NBER Working PaperNo. 16632.
Pitchford, Rohan and Mark L. J. Wright. 2012a. Holdouts in sovereign debt restructurings:A theory of negotiations in a weak contractual environment, Review of Economic Studies ,79(2), 1–26.
Pitchford, Rohan and Mark L. J. Wright. 2012b. Strategic Behavior in Sovereign DebtRestructuring: Impact and Policy Responses, mimeo, UCLA.
Posner, Richard. 1973. An economic approach to legal procedure and judicial administration,Journal of Legal Studies, 2(2), 399–458.
Priest, George and Benjamin Klein. 1984. The selection of disputes for litigation, Journalof Legal Studies, 13(1), 1–56.
Rogoff, Kenneth and Jeromin Zettelmeyer. 2002. Bankruptcy procedures for sovereigns: Ahistory of ideas, 1976-2001, IMF Staff Papers, 49(3), 470–507.
Rose, A. K. 2005. One reason countries pay their debts: Renegotiation and internationaltrade, Journal of Development Economics, 77(1), 189–206.
Roubini, Nouriel. 2010. An orderly market-based approach to the restructuring of Eurozonesovereign debts obviates the need for statutory approaches, RGE Analysis , 15 Nov. 2010,URL http://www.roubini.com/analysis/138863.php.
Roubini, Nouriel and Brad Setser. 2004. Bailouts or Bail-ins? Responding to FinancialCrises in Emerging Economies , Washington D.C.: Institute for International Economics.
Sandleris, Guido. 2012. The Costs of Sovereign Defaults: Theory and Empirical Evidence,Universidad Torcuato Di Tella Working Paper No. 02/2012.
Sawada, Yasuyuki. 2001. Secondary market efficiency for LDC bank loans and internationalprivate lending, 1985–1993, Journal of International Money and Finance, 20(4), 549–562.
Schularick, Moritz and Alan M. Taylor. 2012. Credit booms gone bust: Monetary policy,leverage cycles, and financial crises, 1870–2008, American Economic Review , 102(2),1029–1061.
Schumacher, Julian, Christoph Trebesch, and Henrik Enderlein. 2014. Sovereign Defaultsin Court , mimeo, University of Munich.
Scott, Hal S. 2006. Sovereign Debt Default: Cry for the United States, Not Argentina,Washington Legal Foundation Working Paper Series No. 140.
32
Shleifer, Andrei. 2003. Will the sovereign debt market survive?, American Economic Review- Papers and Proceedings, 93(2), 85–90.
Singh, Manmohan. 2003. Recovery Rates from Distressed Debt - Empirical Evidence fromChapter 11 Filings, International Litigation, and Recent Sovereign Debt Restructurings,IMF Working Paper No. 03/161.
Spier, Kathryn. 2007. Litigation, in Mitchell Polinsky and Steven Shavell, (Eds.) Handbookof Law and Economics, Amsterdam: Elsevier, vol. 1, 265–345.
Sturzenegger, Federico and Jeromin Zettelmeyer. 2006. Debt Defaults and Lessons from aDecade of Crises, Cambridge: MIT Press.
Sturzenegger, Federico and Jeromin Zettelmeyer. 2008. Haircuts: Estimating investor lossesin sovereign debt restructurings, 1998-2005, Journal of International Money and Finance,27, 780–805.
Tirole, Jean. 2012. The Euro crisis: Some reflexions on institutional reform, FinancialStability Review , 16, 225–242.
Trebesch, Christoph. 2010. Delays in Sovereign Debt Restructurings , mimeo, Free UniversityBerlin.
Waibel, Michael. 2011. Sovereign Defaults before International Courts and Tribunals,Cambridge: Cambridge Univ. Press.
Weder Di Mauro, Beatrice and Jeromin Zettelmeyer. 2010. Euro-pean debt restructuring mechanism as a tool for crisis prevention,VoxEU , November 26, 2010, URL http://www.voxeu.org/article/
european-debt-restructuring-mechanism-tool-crisis-prevention.
Weidemaier, Mark C. 2014. Sovereign immunity and sovereign debt, University of IllinoisLaw Review , forthcoming.
Weinschelbaum, Federico and Josef Wynne. 2005. Renegotiation, collective action clausesand sovereign debt markets, Journal of International Economics, 67(1), 47–72.
Wheeler, Christopher and Amir Attaran. 2003. Declawing the vulture funds: Rehabilitationof a comity defense in sovereign debt litigation, Stanford Journal of International Law ,39, 253–284.
33
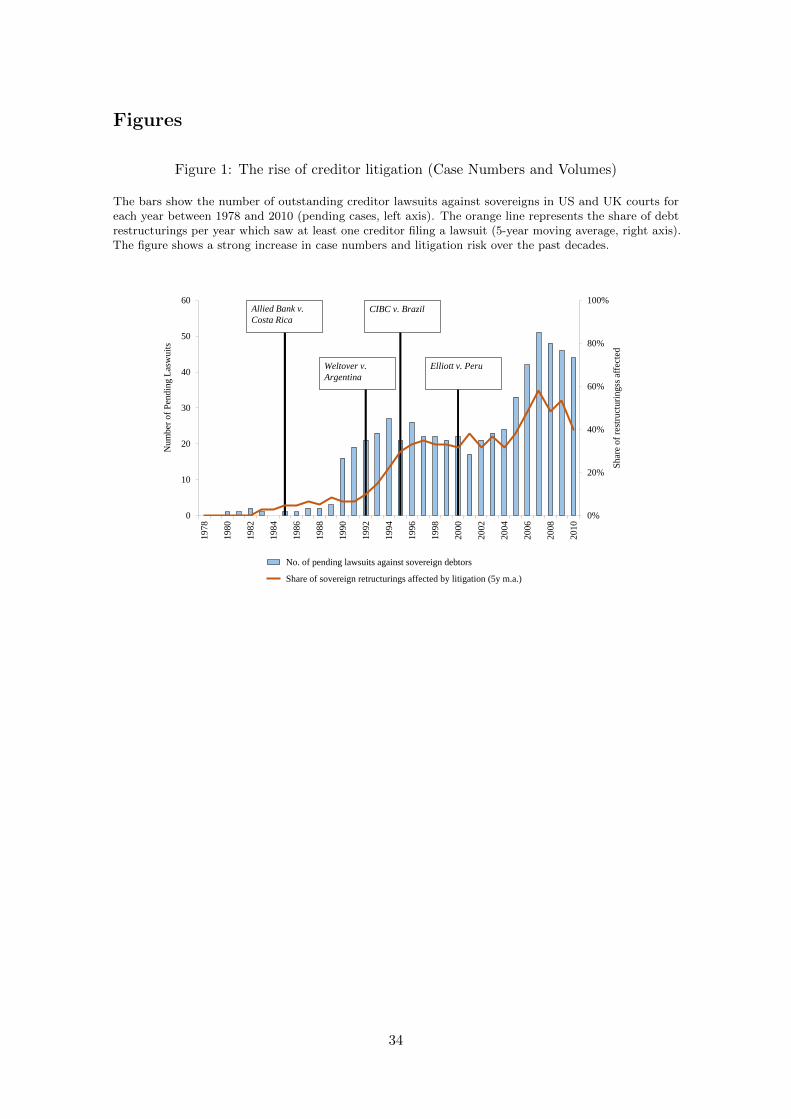
Figures
Figure 1: The rise of creditor litigation (Case Numbers and Volumes)
The bars show the number of outstanding creditor lawsuits against sovereigns in US and UK courts foreach year between 1978 and 2010 (pending cases, left axis). The orange line represents the share of debtrestructurings per year which saw at least one creditor filing a lawsuit (5-year moving average, right axis).The figure shows a strong increase in case numbers and litigation risk over the past decades.
0%
20%
40%
60%
80%
100%
0
10
20
30
40
50
60
19
78
19
80
19
82
19
84
19
86
19
88
19
90
19
92
19
94
19
96
19
98
20
00
20
02
20
04
20
06
20
08
20
10
Shar
e o
f re
stru
cturi
ngss
aff
ecte
d
Nu
mb
er o
f P
end
ing L
asw
uit
s
No. of pending lawsuits against sovereign debtors
Share of sovereign retructurings affected by litigation (5y m.a.)
Weltover v.
Argentina
CIBC v. Brazil
Elliott v. Peru
Allied Bank v.
Costa Rica
34
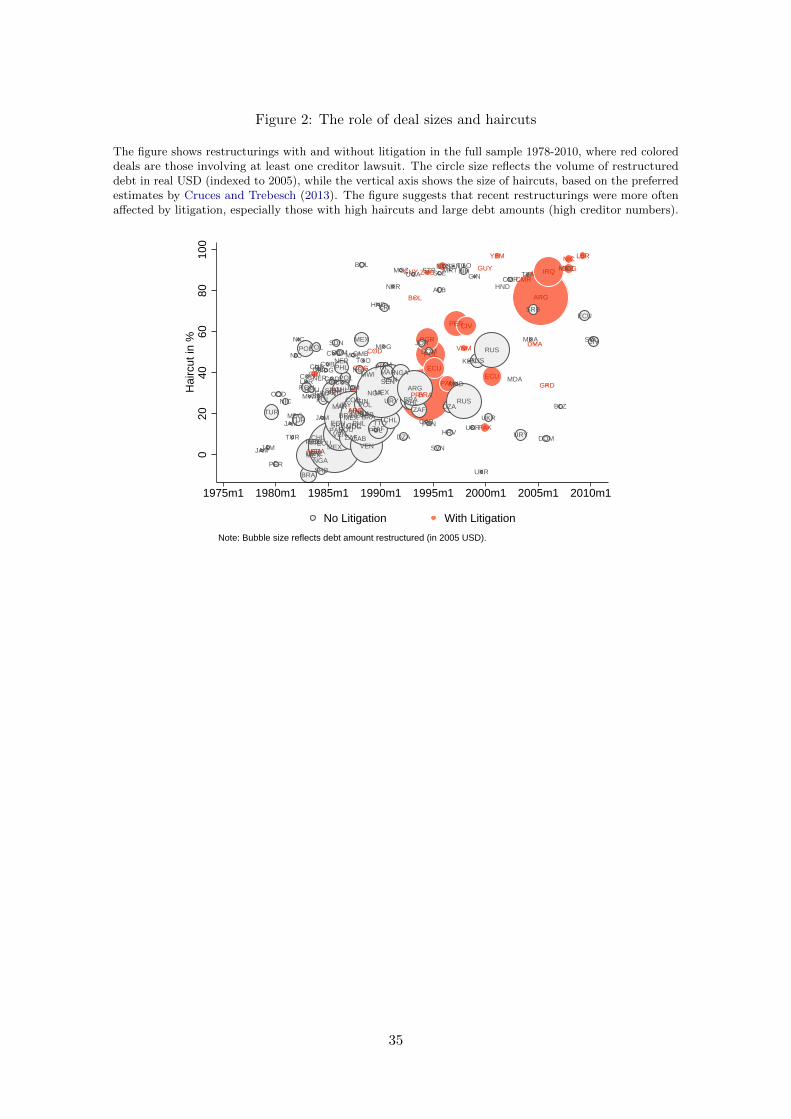
Figure 2: The role of deal sizes and haircuts
The figure shows restructurings with and without litigation in the full sample 1978-2010, where red coloreddeals are those involving at least one creditor lawsuit. The circle size reflects the volume of restructureddebt in real USD (indexed to 2005), while the vertical axis shows the size of haircuts, based on the preferredestimates by Cruces and Trebesch (2013). The figure suggests that recent restructurings were more oftenaffected by litigation, especially those with high haircuts and large debt amounts (high creditor numbers).
NGA
CRI
JAM
ARG
COG
COD
GUY
BOL
PRY
POL
ZMB
BGR
BRA
NIC
ECU
PAN
PER
VNM
CIV
PAK
GUY
ECU
YEM
CMR
DMA
ARG
GRD
IRQ
NICCOG
LBR
JAM
TUR
JAM
NIC
PER
COD
NIC
JAMMDG
TUR
NIC
ROU
TUR
POL
LBR
ECU
BRA
CODCUB
MEXCHL
PER
URY
ROUMWI
SRB
POL
MDG
CHL
NER
POL
ECU
CUB
SEN
SRB
COD
NIC
BRANGA
JAM
SEN
ECU
CUB
SRB
ARG
PAN
CRI
SDN
COD
MEX
MARURY
BRA
POL
CHL
NER
VENROU
PHL
DOM
COD
NGA
GAB
PHL
JAM
COD
MEX
MOZ
MAR
ZAF
MDGCHL
VEN
URY
MEX
SRBBRA
GINPOL
BOL
MWI
GMB
NGATGO
NGA
TTO
HND
ZAFPOL
PHL
CHL
VEN
CRI
MEX
SEN
JAM
MDG
MAR
MOZ
NGA
NER
URY BRAPHL
DZA
ZAF
UGA
JOR
ARG
STP
GAB
DOM
PAN
SVN
SLE
ALB
MRT
HRV
ETHSEN
DZARUS
MKD
BIHTGO
KEN
UKR
GIN
UKR
RUS
UKR
RUS
HND
MDA
CMR
URY
SRB
MDA
TZA
DOM
BLZ
MOZ
ECU
CIVSYC
020
4060
8010
0H
airc
ut in
%
1975m1 1980m1 1985m1 1990m1 1995m1 2000m1 2005m1 2010m1
No Litigation With Litigation
Note: Bubble size reflects debt amount restructured (in 2005 USD).
35
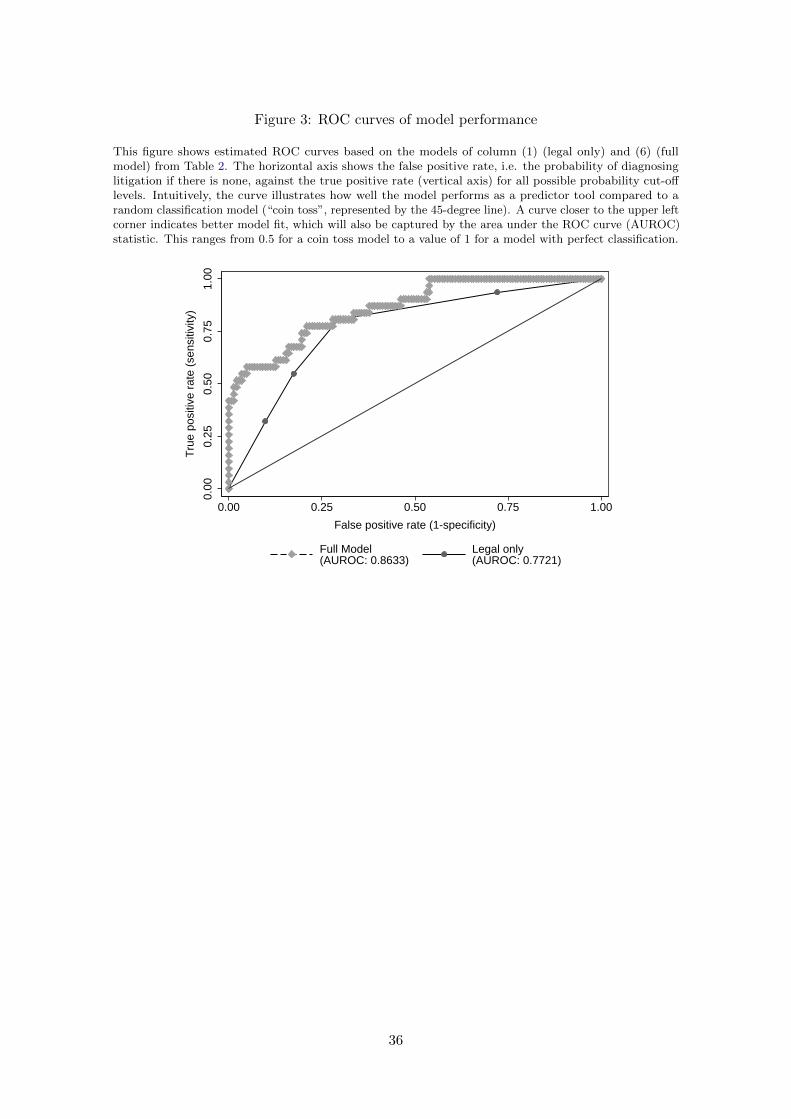
Figure 3: ROC curves of model performance
This figure shows estimated ROC curves based on the models of column (1) (legal only) and (6) (fullmodel) from Table 2. The horizontal axis shows the false positive rate, i.e. the probability of diagnosinglitigation if there is none, against the true positive rate (vertical axis) for all possible probability cut-offlevels. Intuitively, the curve illustrates how well the model performs as a predictor tool compared to arandom classification model (“coin toss”, represented by the 45-degree line). A curve closer to the upper leftcorner indicates better model fit, which will also be captured by the area under the ROC curve (AUROC)statistic. This ranges from 0.5 for a coin toss model to a value of 1 for a model with perfect classification.
0.00
0.25
0.50
0.75
1.00
Tru
e po
sitiv
e ra
te (
sens
itivi
ty)
0.00 0.25 0.50 0.75 1.00
False positive rate (1-specificity)
Full Model(AUROC: 0.8633)
Legal only(AUROC: 0.7721)
36
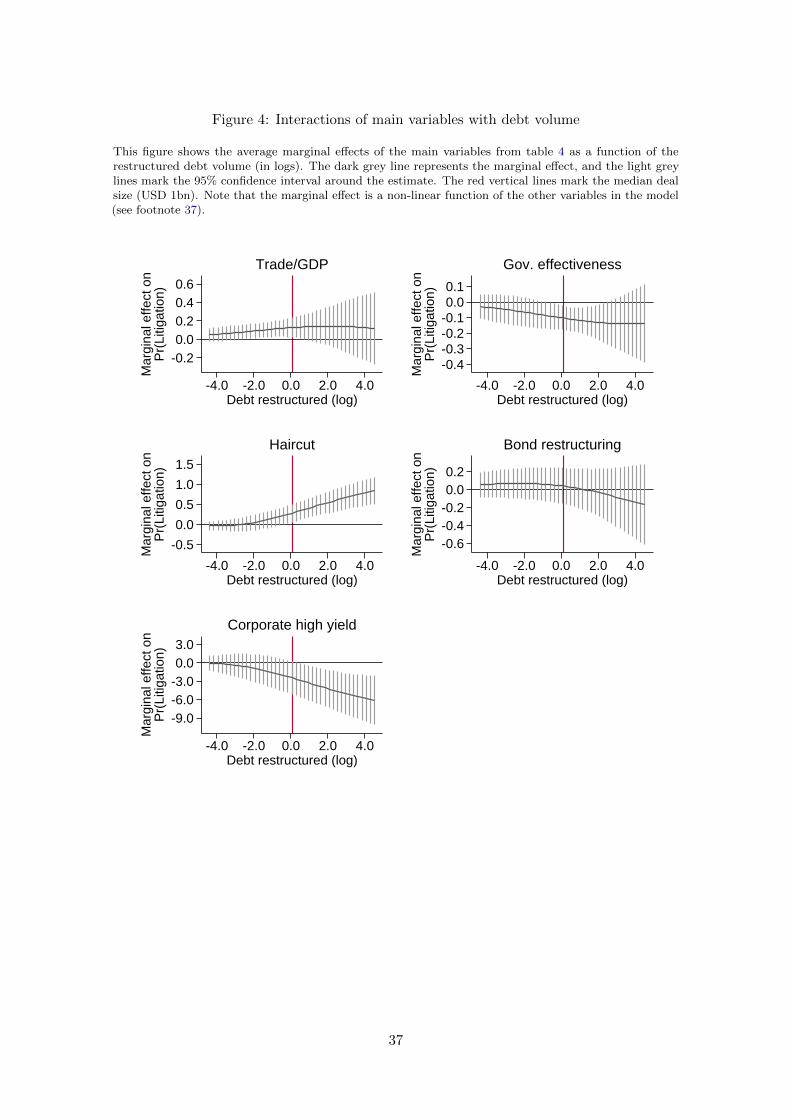
Figure 4: Interactions of main variables with debt volume
This figure shows the average marginal effects of the main variables from table 4 as a function of therestructured debt volume (in logs). The dark grey line represents the marginal effect, and the light greylines mark the 95% confidence interval around the estimate. The red vertical lines mark the median dealsize (USD 1bn). Note that the marginal effect is a non-linear function of the other variables in the model(see footnote 37).
-0.20.00.20.40.6
Mar
gina
l effe
ct o
nP
r(Li
tigat
ion)
-4.0 -2.0 0.0 2.0 4.0Debt restructured (log)
Trade/GDP
-0.4-0.3-0.2-0.10.00.1
Mar
gina
l effe
ct o
nP
r(Li
tigat
ion)
-4.0 -2.0 0.0 2.0 4.0Debt restructured (log)
Gov. effectiveness
-0.5
0.0
0.5
1.0
1.5
Mar
gina
l effe
ct o
nP
r(Li
tigat
ion)
-4.0 -2.0 0.0 2.0 4.0Debt restructured (log)
Haircut
-0.6-0.4-0.20.00.2
Mar
gina
l effe
ct o
nP
r(Li
tigat
ion)
-4.0 -2.0 0.0 2.0 4.0Debt restructured (log)
Bond restructuring
-9.0-6.0-3.00.03.0
Mar
gina
l effe
ct o
nP
r(Li
tigat
ion)
-4.0 -2.0 0.0 2.0 4.0Debt restructured (log)
Corporate high yield
37
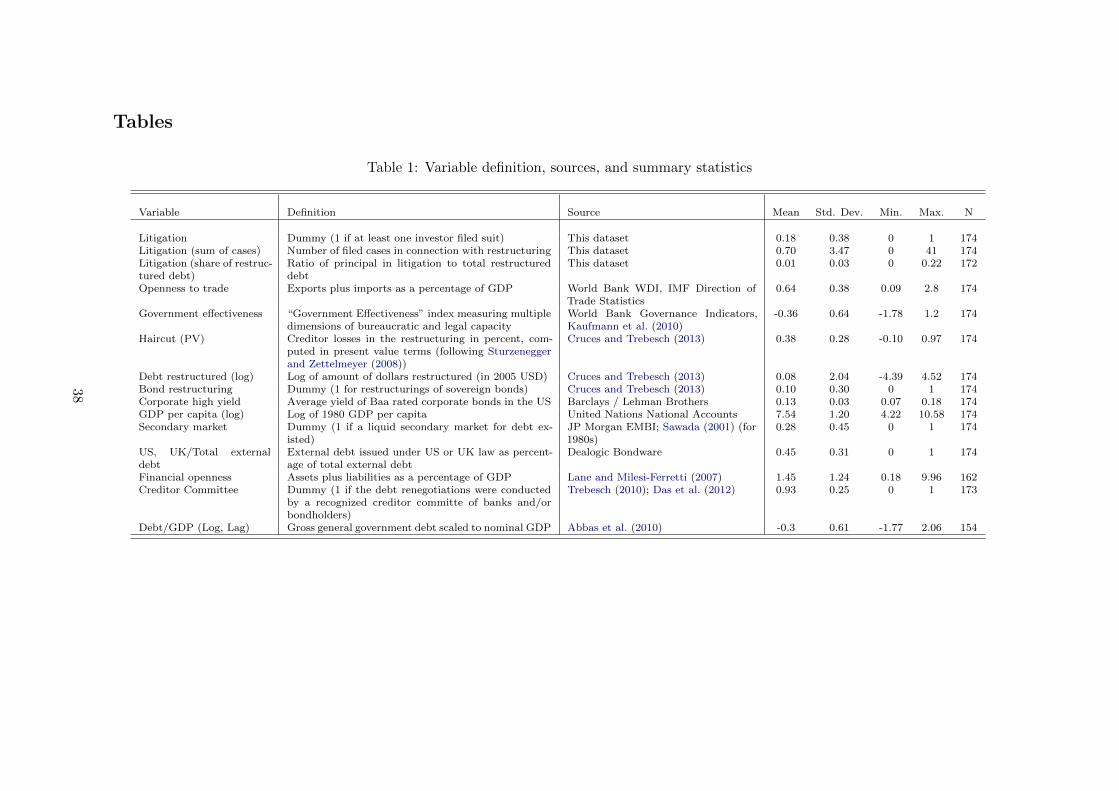
Tables
Table 1: Variable definition, sources, and summary statistics
Variable Definition Source Mean Std. Dev. Min. Max. N
Litigation Dummy (1 if at least one investor filed suit) This dataset 0.18 0.38 0 1 174Litigation (sum of cases) Number of filed cases in connection with restructuring This dataset 0.70 3.47 0 41 174Litigation (share of restruc-tured debt)
Ratio of principal in litigation to total restructureddebt
This dataset 0.01 0.03 0 0.22 172
Openness to trade Exports plus imports as a percentage of GDP World Bank WDI, IMF Direction ofTrade Statistics
0.64 0.38 0.09 2.8 174
Government effectiveness “Government Effectiveness” index measuring multipledimensions of bureaucratic and legal capacity
World Bank Governance Indicators,Kaufmann et al. (2010)
-0.36 0.64 -1.78 1.2 174
Haircut (PV) Creditor losses in the restructuring in percent, com-puted in present value terms (following Sturzeneggerand Zettelmeyer (2008))
Cruces and Trebesch (2013) 0.38 0.28 -0.10 0.97 174
Debt restructured (log) Log of amount of dollars restructured (in 2005 USD) Cruces and Trebesch (2013) 0.08 2.04 -4.39 4.52 174Bond restructuring Dummy (1 for restructurings of sovereign bonds) Cruces and Trebesch (2013) 0.10 0.30 0 1 174Corporate high yield Average yield of Baa rated corporate bonds in the US Barclays / Lehman Brothers 0.13 0.03 0.07 0.18 174GDP per capita (log) Log of 1980 GDP per capita United Nations National Accounts 7.54 1.20 4.22 10.58 174Secondary market Dummy (1 if a liquid secondary market for debt ex-
isted)JP Morgan EMBI; Sawada (2001) (for1980s)
0.28 0.45 0 1 174
US, UK/Total externaldebt
External debt issued under US or UK law as percent-age of total external debt
Dealogic Bondware 0.45 0.31 0 1 174
Financial openness Assets plus liabilities as a percentage of GDP Lane and Milesi-Ferretti (2007) 1.45 1.24 0.18 9.96 162Creditor Committee Dummy (1 if the debt renegotiations were conducted
by a recognized creditor committe of banks and/orbondholders)
Trebesch (2010); Das et al. (2012) 0.93 0.25 0 1 173
Debt/GDP (Log, Lag) Gross general government debt scaled to nominal GDP Abbas et al. (2010) -0.3 0.61 -1.77 2.06 154
38
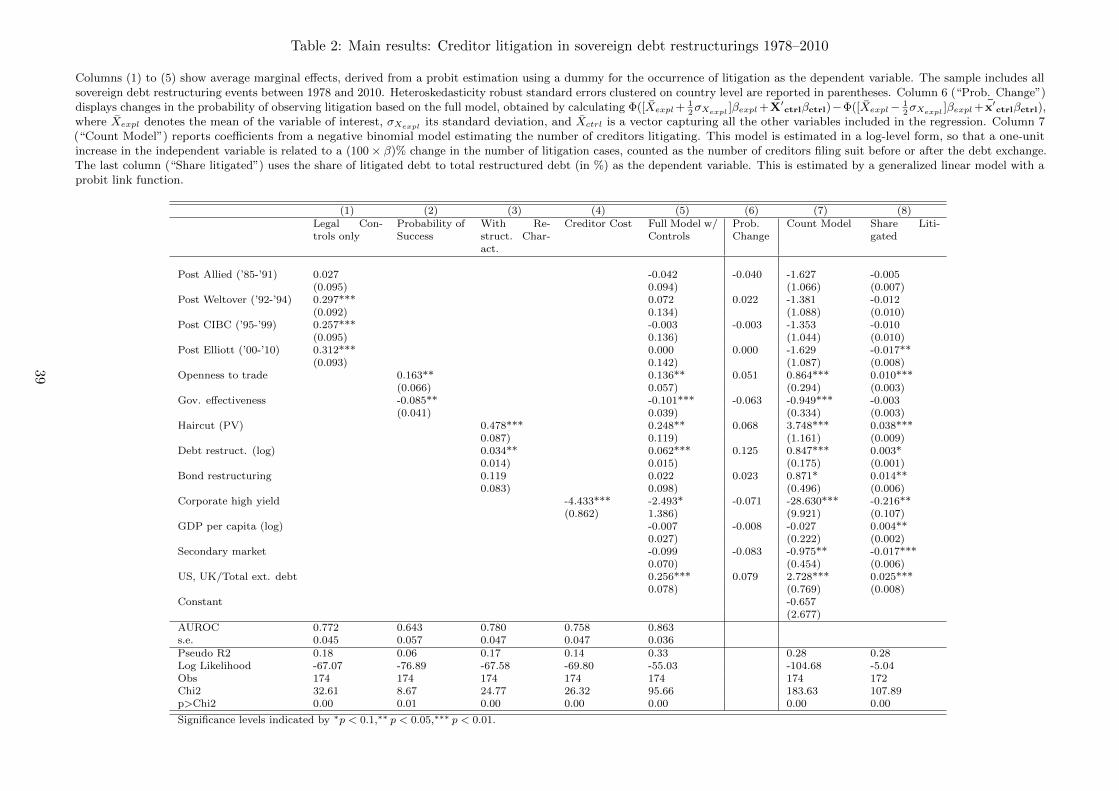
Table 2: Main results: Creditor litigation in sovereign debt restructurings 1978–2010
Columns (1) to (5) show average marginal effects, derived from a probit estimation using a dummy for the occurrence of litigation as the dependent variable. The sample includes allsovereign debt restructuring events between 1978 and 2010. Heteroskedasticity robust standard errors clustered on country level are reported in parentheses. Column 6 (“Prob. Change”)displays changes in the probability of observing litigation based on the full model, obtained by calculating Φ([Xexpl + 1
2σXexpl ]βexpl +X′ctrlβctrl)−Φ([Xexpl− 1
2σXexpl ]βexpl + x′ctrlβctrl),
where Xexpl denotes the mean of the variable of interest, σXexpl its standard deviation, and Xctrl is a vector capturing all the other variables included in the regression. Column 7(“Count Model”) reports coefficients from a negative binomial model estimating the number of creditors litigating. This model is estimated in a log-level form, so that a one-unitincrease in the independent variable is related to a (100 × β)% change in the number of litigation cases, counted as the number of creditors filing suit before or after the debt exchange.The last column (“Share litigated”) uses the share of litigated debt to total restructured debt (in %) as the dependent variable. This is estimated by a generalized linear model with aprobit link function.
(1) (2) (3) (4) (5) (6) (7) (8)Legal Con-trols only
Probability ofSuccess
With Re-struct. Char-act.
Creditor Cost Full Model w/Controls
Prob.Change
Count Model Share Liti-gated
Post Allied (’85-’91) 0.027 -0.042 -0.040 -1.627 -0.005(0.095) 0.094) (1.066) (0.007)
Post Weltover (’92-’94) 0.297*** 0.072 0.022 -1.381 -0.012(0.092) 0.134) (1.088) (0.010)
Post CIBC (’95-’99) 0.257*** -0.003 -0.003 -1.353 -0.010(0.095) 0.136) (1.044) (0.010)
Post Elliott (’00-’10) 0.312*** 0.000 0.000 -1.629 -0.017**(0.093) 0.142) (1.087) (0.008)
Openness to trade 0.163** 0.136** 0.051 0.864*** 0.010***(0.066) 0.057) (0.294) (0.003)
Gov. effectiveness -0.085** -0.101*** -0.063 -0.949*** -0.003(0.041) 0.039) (0.334) (0.003)
Haircut (PV) 0.478*** 0.248** 0.068 3.748*** 0.038***0.087) 0.119) (1.161) (0.009)
Debt restruct. (log) 0.034** 0.062*** 0.125 0.847*** 0.003*0.014) 0.015) (0.175) (0.001)
Bond restructuring 0.119 0.022 0.023 0.871* 0.014**0.083) 0.098) (0.496) (0.006)
Corporate high yield -4.433*** -2.493* -0.071 -28.630*** -0.216**(0.862) 1.386) (9.921) (0.107)
GDP per capita (log) -0.007 -0.008 -0.027 0.004**0.027) (0.222) (0.002)
Secondary market -0.099 -0.083 -0.975** -0.017***0.070) (0.454) (0.006)
US, UK/Total ext. debt 0.256*** 0.079 2.728*** 0.025***0.078) (0.769) (0.008)
Constant -0.657(2.677)
AUROC 0.772 0.643 0.780 0.758 0.863s.e. 0.045 0.057 0.047 0.047 0.036Pseudo R2 0.18 0.06 0.17 0.14 0.33 0.28 0.28Log Likelihood -67.07 -76.89 -67.58 -69.80 -55.03 -104.68 -5.04Obs 174 174 174 174 174 174 172Chi2 32.61 8.67 24.77 26.32 95.66 183.63 107.89p>Chi2 0.00 0.01 0.00 0.00 0.00 0.00 0.00
Significance levels indicated by ∗p < 0.1,∗∗ p < 0.05,∗∗∗ p < 0.01.
39
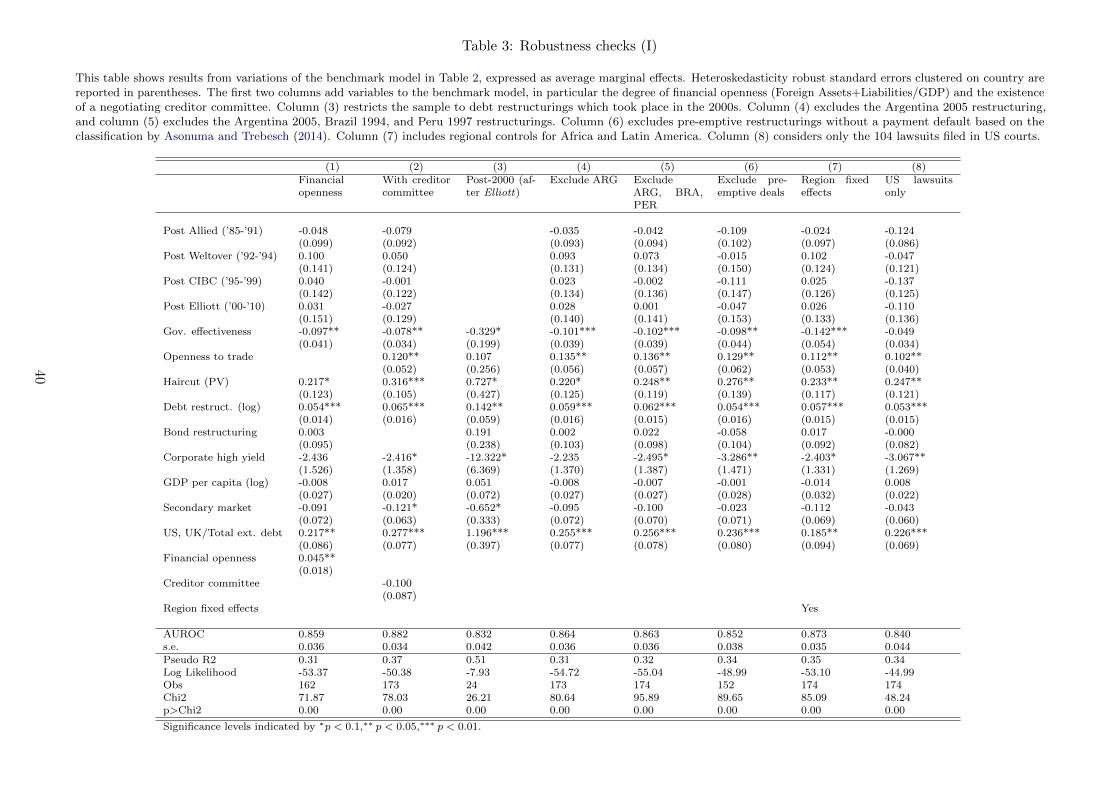
Table 3: Robustness checks (I)
This table shows results from variations of the benchmark model in Table 2, expressed as average marginal effects. Heteroskedasticity robust standard errors clustered on country arereported in parentheses. The first two columns add variables to the benchmark model, in particular the degree of financial openness (Foreign Assets+Liabilities/GDP) and the existenceof a negotiating creditor committee. Column (3) restricts the sample to debt restructurings which took place in the 2000s. Column (4) excludes the Argentina 2005 restructuring,and column (5) excludes the Argentina 2005, Brazil 1994, and Peru 1997 restructurings. Column (6) excludes pre-emptive restructurings without a payment default based on theclassification by Asonuma and Trebesch (2014). Column (7) includes regional controls for Africa and Latin America. Column (8) considers only the 104 lawsuits filed in US courts.
(1) (2) (3) (4) (5) (6) (7) (8)Financialopenness
With creditorcommittee
Post-2000 (af-ter Elliott)
Exclude ARG ExcludeARG, BRA,PER
Exclude pre-emptive deals
Region fixedeffects
US lawsuitsonly
Post Allied (’85-’91) -0.048 -0.079 -0.035 -0.042 -0.109 -0.024 -0.124(0.099) (0.092) (0.093) (0.094) (0.102) (0.097) (0.086)
Post Weltover (’92-’94) 0.100 0.050 0.093 0.073 -0.015 0.102 -0.047(0.141) (0.124) (0.131) (0.134) (0.150) (0.124) (0.121)
Post CIBC (’95-’99) 0.040 -0.001 0.023 -0.002 -0.111 0.025 -0.137(0.142) (0.122) (0.134) (0.136) (0.147) (0.126) (0.125)
Post Elliott (’00-’10) 0.031 -0.027 0.028 0.001 -0.047 0.026 -0.110(0.151) (0.129) (0.140) (0.141) (0.153) (0.133) (0.136)
Gov. effectiveness -0.097** -0.078** -0.329* -0.101*** -0.102*** -0.098** -0.142*** -0.049(0.041) (0.034) (0.199) (0.039) (0.039) (0.044) (0.054) (0.034)
Openness to trade 0.120** 0.107 0.135** 0.136** 0.129** 0.112** 0.102**(0.052) (0.256) (0.056) (0.057) (0.062) (0.053) (0.040)
Haircut (PV) 0.217* 0.316*** 0.727* 0.220* 0.248** 0.276** 0.233** 0.247**(0.123) (0.105) (0.427) (0.125) (0.119) (0.139) (0.117) (0.121)
Debt restruct. (log) 0.054*** 0.065*** 0.142** 0.059*** 0.062*** 0.054*** 0.057*** 0.053***(0.014) (0.016) (0.059) (0.016) (0.015) (0.016) (0.015) (0.015)
Bond restructuring 0.003 0.191 0.002 0.022 -0.058 0.017 -0.000(0.095) (0.238) (0.103) (0.098) (0.104) (0.092) (0.082)
Corporate high yield -2.436 -2.416* -12.322* -2.235 -2.495* -3.286** -2.403* -3.067**(1.526) (1.358) (6.369) (1.370) (1.387) (1.471) (1.331) (1.269)
GDP per capita (log) -0.008 0.017 0.051 -0.008 -0.007 -0.001 -0.014 0.008(0.027) (0.020) (0.072) (0.027) (0.027) (0.028) (0.032) (0.022)
Secondary market -0.091 -0.121* -0.652* -0.095 -0.100 -0.023 -0.112 -0.043(0.072) (0.063) (0.333) (0.072) (0.070) (0.071) (0.069) (0.060)
US, UK/Total ext. debt 0.217** 0.277*** 1.196*** 0.255*** 0.256*** 0.236*** 0.185** 0.226***(0.086) (0.077) (0.397) (0.077) (0.078) (0.080) (0.094) (0.069)
Financial openness 0.045**(0.018)
Creditor committee -0.100(0.087)
Region fixed effects Yes
AUROC 0.859 0.882 0.832 0.864 0.863 0.852 0.873 0.840s.e. 0.036 0.034 0.042 0.036 0.036 0.038 0.035 0.044Pseudo R2 0.31 0.37 0.51 0.31 0.32 0.34 0.35 0.34Log Likelihood -53.37 -50.38 -7.93 -54.72 -55.04 -48.99 -53.10 -44.99Obs 162 173 24 173 174 152 174 174Chi2 71.87 78.03 26.21 80.64 95.89 89.65 85.09 48.24p>Chi2 0.00 0.00 0.00 0.00 0.00 0.00 0.00 0.00
Significance levels indicated by ∗p < 0.1,∗∗ p < 0.05,∗∗∗ p < 0.01.
40
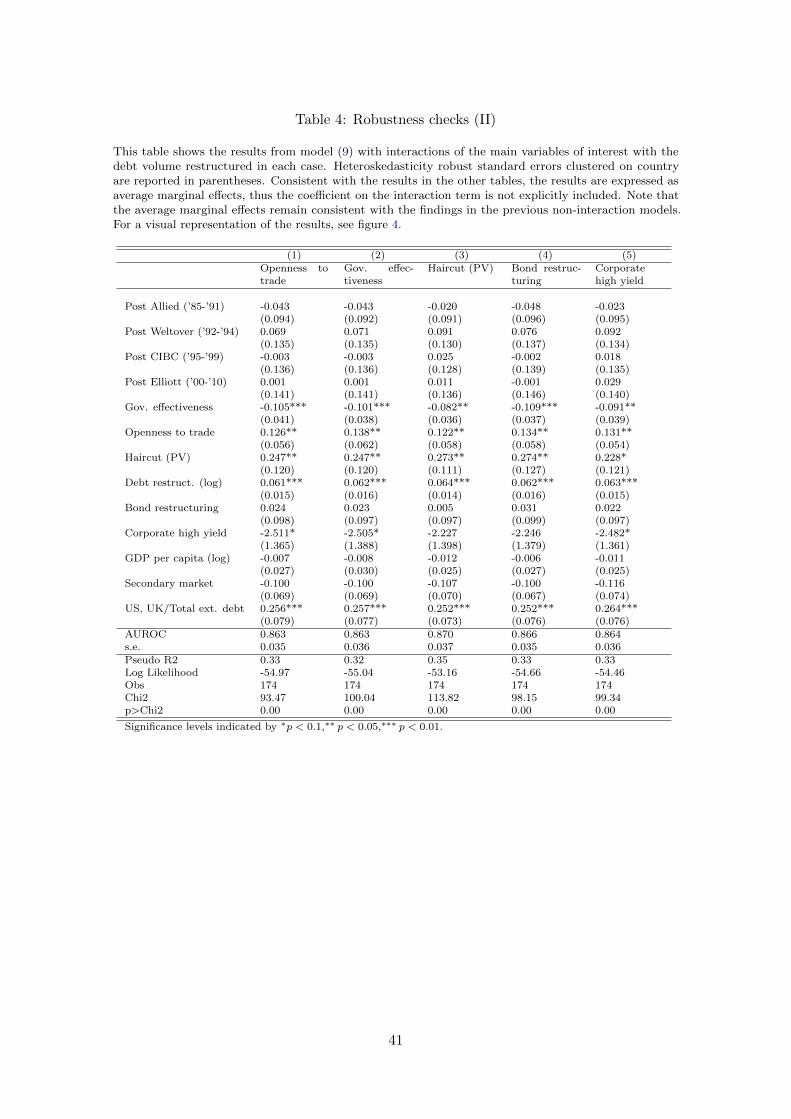
Table 4: Robustness checks (II)
This table shows the results from model (9) with interactions of the main variables of interest with thedebt volume restructured in each case. Heteroskedasticity robust standard errors clustered on countryare reported in parentheses. Consistent with the results in the other tables, the results are expressed asaverage marginal effects, thus the coefficient on the interaction term is not explicitly included. Note thatthe average marginal effects remain consistent with the findings in the previous non-interaction models.For a visual representation of the results, see figure 4.
(1) (2) (3) (4) (5)Openness totrade
Gov. effec-tiveness
Haircut (PV) Bond restruc-turing
Corporatehigh yield
Post Allied (’85-’91) -0.043 -0.043 -0.020 -0.048 -0.023(0.094) (0.092) (0.091) (0.096) (0.095)
Post Weltover (’92-’94) 0.069 0.071 0.091 0.076 0.092(0.135) (0.135) (0.130) (0.137) (0.134)
Post CIBC (’95-’99) -0.003 -0.003 0.025 -0.002 0.018(0.136) (0.136) (0.128) (0.139) (0.135)
Post Elliott (’00-’10) 0.001 0.001 0.011 -0.001 0.029(0.141) (0.141) (0.136) (0.146) (0.140)
Gov. effectiveness -0.105*** -0.101*** -0.082** -0.109*** -0.091**(0.041) (0.038) (0.036) (0.037) (0.039)
Openness to trade 0.126** 0.138** 0.122** 0.134** 0.131**(0.056) (0.062) (0.058) (0.058) (0.054)
Haircut (PV) 0.247** 0.247** 0.273** 0.274** 0.228*(0.120) (0.120) (0.111) (0.127) (0.121)
Debt restruct. (log) 0.061*** 0.062*** 0.064*** 0.062*** 0.063***(0.015) (0.016) (0.014) (0.016) (0.015)
Bond restructuring 0.024 0.023 0.005 0.031 0.022(0.098) (0.097) (0.097) (0.099) (0.097)
Corporate high yield -2.511* -2.505* -2.227 -2.246 -2.482*(1.365) (1.388) (1.398) (1.379) (1.361)
GDP per capita (log) -0.007 -0.008 -0.012 -0.006 -0.011(0.027) (0.030) (0.025) (0.027) (0.025)
Secondary market -0.100 -0.100 -0.107 -0.100 -0.116(0.069) (0.069) (0.070) (0.067) (0.074)
US, UK/Total ext. debt 0.256*** 0.257*** 0.252*** 0.252*** 0.264***(0.079) (0.077) (0.073) (0.076) (0.076)
AUROC 0.863 0.863 0.870 0.866 0.864s.e. 0.035 0.036 0.037 0.035 0.036Pseudo R2 0.33 0.32 0.35 0.33 0.33Log Likelihood -54.97 -55.04 -53.16 -54.66 -54.46Obs 174 174 174 174 174Chi2 93.47 100.04 113.82 98.15 99.34p>Chi2 0.00 0.00 0.00 0.00 0.00
Significance levels indicated by ∗p < 0.1,∗∗ p < 0.05,∗∗∗ p < 0.01.
41
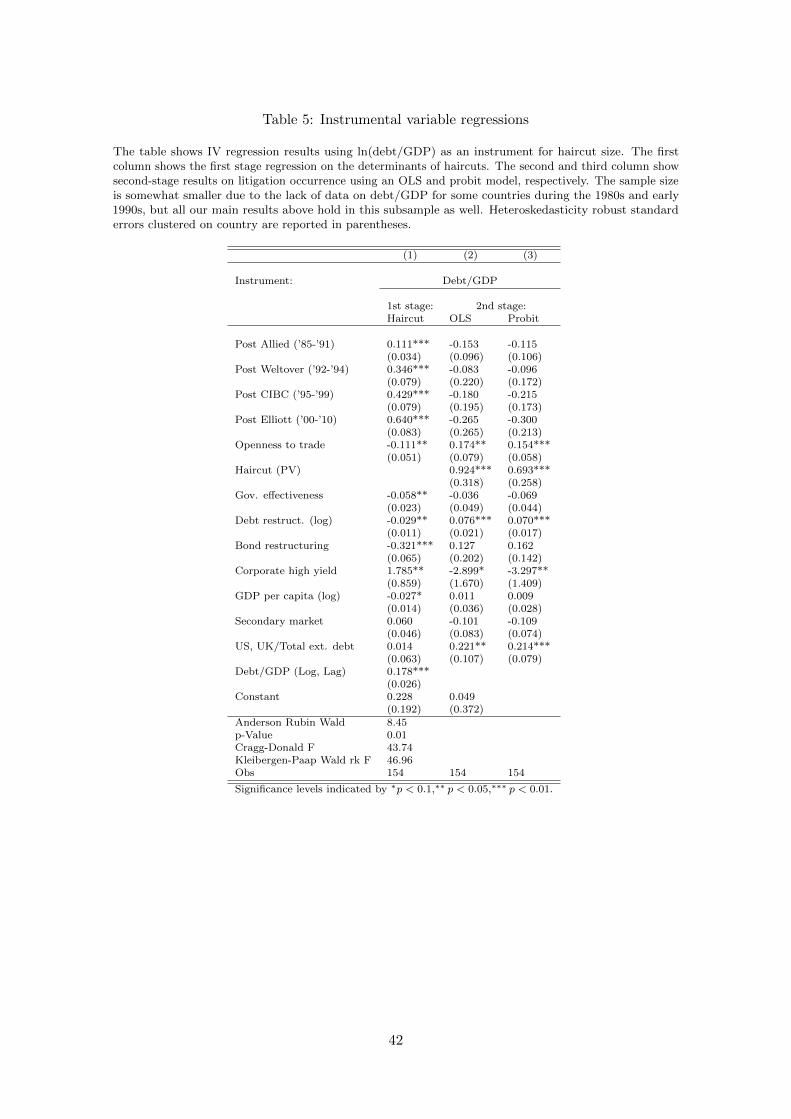
Table 5: Instrumental variable regressions
The table shows IV regression results using ln(debt/GDP) as an instrument for haircut size. The firstcolumn shows the first stage regression on the determinants of haircuts. The second and third column showsecond-stage results on litigation occurrence using an OLS and probit model, respectively. The sample sizeis somewhat smaller due to the lack of data on debt/GDP for some countries during the 1980s and early1990s, but all our main results above hold in this subsample as well. Heteroskedasticity robust standarderrors clustered on country are reported in parentheses.
(1) (2) (3)
Instrument: Debt/GDP
1st stage: 2nd stage:Haircut OLS Probit
Post Allied (’85-’91) 0.111*** -0.153 -0.115(0.034) (0.096) (0.106)
Post Weltover (’92-’94) 0.346*** -0.083 -0.096(0.079) (0.220) (0.172)
Post CIBC (’95-’99) 0.429*** -0.180 -0.215(0.079) (0.195) (0.173)
Post Elliott (’00-’10) 0.640*** -0.265 -0.300(0.083) (0.265) (0.213)
Openness to trade -0.111** 0.174** 0.154***(0.051) (0.079) (0.058)
Haircut (PV) 0.924*** 0.693***(0.318) (0.258)
Gov. effectiveness -0.058** -0.036 -0.069(0.023) (0.049) (0.044)
Debt restruct. (log) -0.029** 0.076*** 0.070***(0.011) (0.021) (0.017)
Bond restructuring -0.321*** 0.127 0.162(0.065) (0.202) (0.142)
Corporate high yield 1.785** -2.899* -3.297**(0.859) (1.670) (1.409)
GDP per capita (log) -0.027* 0.011 0.009(0.014) (0.036) (0.028)
Secondary market 0.060 -0.101 -0.109(0.046) (0.083) (0.074)
US, UK/Total ext. debt 0.014 0.221** 0.214***(0.063) (0.107) (0.079)
Debt/GDP (Log, Lag) 0.178***(0.026)
Constant 0.228 0.049(0.192) (0.372)
Anderson Rubin Wald 8.45p-Value 0.01Cragg-Donald F 43.74Kleibergen-Paap Wald rk F 46.96Obs 154 154 154
Significance levels indicated by ∗p < 0.1,∗∗ p < 0.05,∗∗∗ p < 0.01.
42
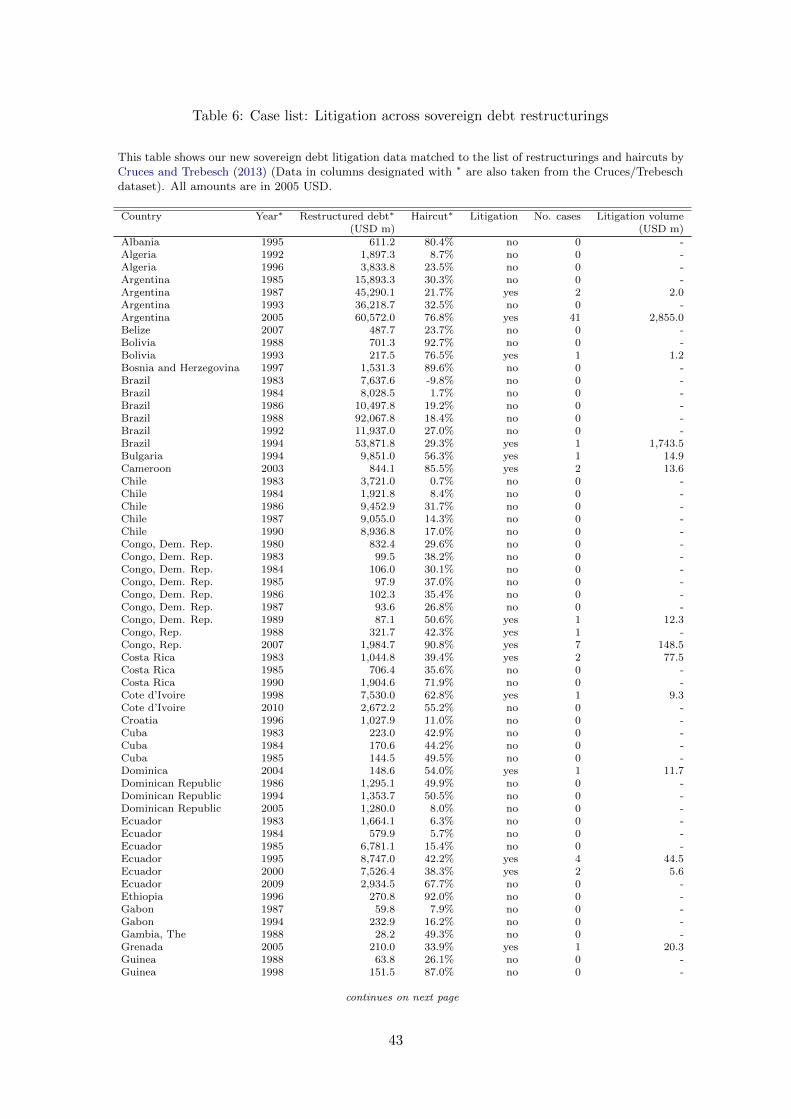
Table 6: Case list: Litigation across sovereign debt restructurings
This table shows our new sovereign debt litigation data matched to the list of restructurings and haircuts byCruces and Trebesch (2013) (Data in columns designated with ∗ are also taken from the Cruces/Trebeschdataset). All amounts are in 2005 USD.
Country Year∗ Restructured debt∗ Haircut∗ Litigation No. cases Litigation volume(USD m) (USD m)
Albania 1995 611.2 80.4% no 0 -Algeria 1992 1,897.3 8.7% no 0 -Algeria 1996 3,833.8 23.5% no 0 -Argentina 1985 15,893.3 30.3% no 0 -Argentina 1987 45,290.1 21.7% yes 2 2.0Argentina 1993 36,218.7 32.5% no 0 -Argentina 2005 60,572.0 76.8% yes 41 2,855.0Belize 2007 487.7 23.7% no 0 -Bolivia 1988 701.3 92.7% no 0 -Bolivia 1993 217.5 76.5% yes 1 1.2Bosnia and Herzegovina 1997 1,531.3 89.6% no 0 -Brazil 1983 7,637.6 -9.8% no 0 -Brazil 1984 8,028.5 1.7% no 0 -Brazil 1986 10,497.8 19.2% no 0 -Brazil 1988 92,067.8 18.4% no 0 -Brazil 1992 11,937.0 27.0% no 0 -Brazil 1994 53,871.8 29.3% yes 1 1,743.5Bulgaria 1994 9,851.0 56.3% yes 1 14.9Cameroon 2003 844.1 85.5% yes 2 13.6Chile 1983 3,721.0 0.7% no 0 -Chile 1984 1,921.8 8.4% no 0 -Chile 1986 9,452.9 31.7% no 0 -Chile 1987 9,055.0 14.3% no 0 -Chile 1990 8,936.8 17.0% no 0 -Congo, Dem. Rep. 1980 832.4 29.6% no 0 -Congo, Dem. Rep. 1983 99.5 38.2% no 0 -Congo, Dem. Rep. 1984 106.0 30.1% no 0 -Congo, Dem. Rep. 1985 97.9 37.0% no 0 -Congo, Dem. Rep. 1986 102.3 35.4% no 0 -Congo, Dem. Rep. 1987 93.6 26.8% no 0 -Congo, Dem. Rep. 1989 87.1 50.6% yes 1 12.3Congo, Rep. 1988 321.7 42.3% yes 1 -Congo, Rep. 2007 1,984.7 90.8% yes 7 148.5Costa Rica 1983 1,044.8 39.4% yes 2 77.5Costa Rica 1985 706.4 35.6% no 0 -Costa Rica 1990 1,904.6 71.9% no 0 -Cote d’Ivoire 1998 7,530.0 62.8% yes 1 9.3Cote d’Ivoire 2010 2,672.2 55.2% no 0 -Croatia 1996 1,027.9 11.0% no 0 -Cuba 1983 223.0 42.9% no 0 -Cuba 1984 170.6 44.2% no 0 -Cuba 1985 144.5 49.5% no 0 -Dominica 2004 148.6 54.0% yes 1 11.7Dominican Republic 1986 1,295.1 49.9% no 0 -Dominican Republic 1994 1,353.7 50.5% no 0 -Dominican Republic 2005 1,280.0 8.0% no 0 -Ecuador 1983 1,664.1 6.3% no 0 -Ecuador 1984 579.9 5.7% no 0 -Ecuador 1985 6,781.1 15.4% no 0 -Ecuador 1995 8,747.0 42.2% yes 4 44.5Ecuador 2000 7,526.4 38.3% yes 2 5.6Ecuador 2009 2,934.5 67.7% no 0 -Ethiopia 1996 270.8 92.0% no 0 -Gabon 1987 59.8 7.9% no 0 -Gabon 1994 232.9 16.2% no 0 -Gambia, The 1988 28.2 49.3% no 0 -Grenada 2005 210.0 33.9% yes 1 20.3Guinea 1988 63.8 26.1% no 0 -Guinea 1998 151.5 87.0% no 0 -
continues on next page
43
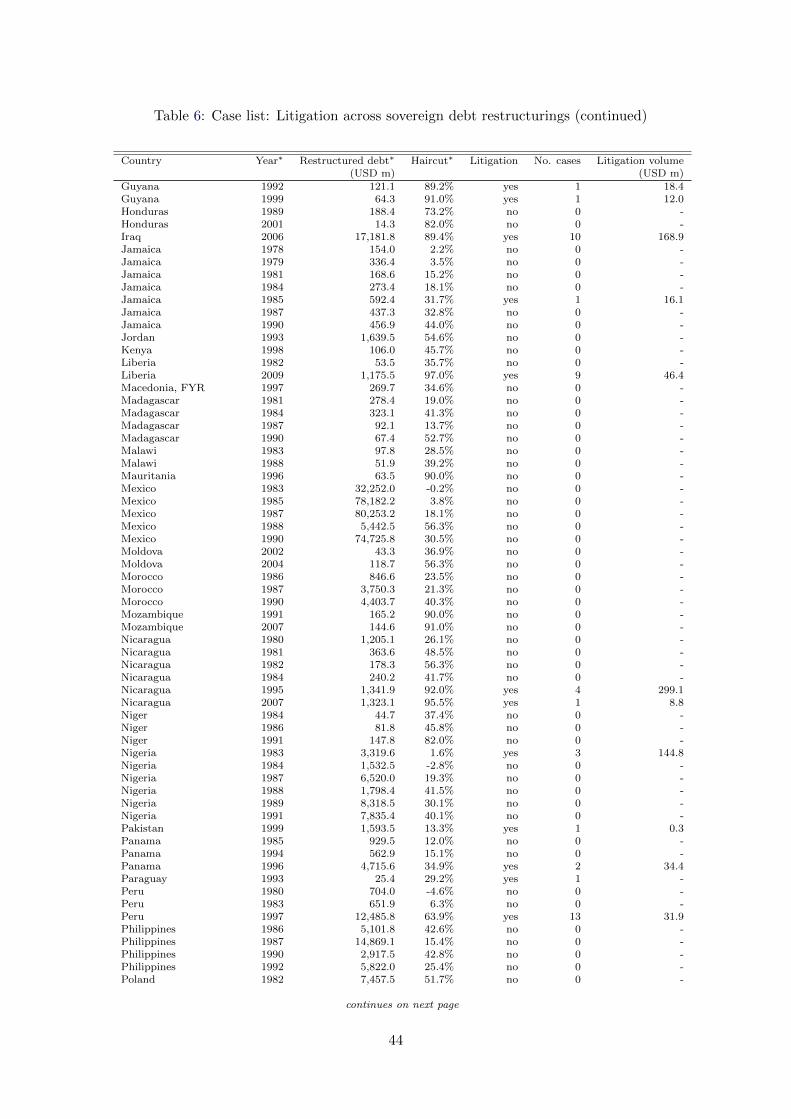
Table 6: Case list: Litigation across sovereign debt restructurings (continued)
Country Year∗ Restructured debt∗ Haircut∗ Litigation No. cases Litigation volume(USD m) (USD m)
Guyana 1992 121.1 89.2% yes 1 18.4Guyana 1999 64.3 91.0% yes 1 12.0Honduras 1989 188.4 73.2% no 0 -Honduras 2001 14.3 82.0% no 0 -Iraq 2006 17,181.8 89.4% yes 10 168.9Jamaica 1978 154.0 2.2% no 0 -Jamaica 1979 336.4 3.5% no 0 -Jamaica 1981 168.6 15.2% no 0 -Jamaica 1984 273.4 18.1% no 0 -Jamaica 1985 592.4 31.7% yes 1 16.1Jamaica 1987 437.3 32.8% no 0 -Jamaica 1990 456.9 44.0% no 0 -Jordan 1993 1,639.5 54.6% no 0 -Kenya 1998 106.0 45.7% no 0 -Liberia 1982 53.5 35.7% no 0 -Liberia 2009 1,175.5 97.0% yes 9 46.4Macedonia, FYR 1997 269.7 34.6% no 0 -Madagascar 1981 278.4 19.0% no 0 -Madagascar 1984 323.1 41.3% no 0 -Madagascar 1987 92.1 13.7% no 0 -Madagascar 1990 67.4 52.7% no 0 -Malawi 1983 97.8 28.5% no 0 -Malawi 1988 51.9 39.2% no 0 -Mauritania 1996 63.5 90.0% no 0 -Mexico 1983 32,252.0 -0.2% no 0 -Mexico 1985 78,182.2 3.8% no 0 -Mexico 1987 80,253.2 18.1% no 0 -Mexico 1988 5,442.5 56.3% no 0 -Mexico 1990 74,725.8 30.5% no 0 -Moldova 2002 43.3 36.9% no 0 -Moldova 2004 118.7 56.3% no 0 -Morocco 1986 846.6 23.5% no 0 -Morocco 1987 3,750.3 21.3% no 0 -Morocco 1990 4,403.7 40.3% no 0 -Mozambique 1991 165.2 90.0% no 0 -Mozambique 2007 144.6 91.0% no 0 -Nicaragua 1980 1,205.1 26.1% no 0 -Nicaragua 1981 363.6 48.5% no 0 -Nicaragua 1982 178.3 56.3% no 0 -Nicaragua 1984 240.2 41.7% no 0 -Nicaragua 1995 1,341.9 92.0% yes 4 299.1Nicaragua 2007 1,323.1 95.5% yes 1 8.8Niger 1984 44.7 37.4% no 0 -Niger 1986 81.8 45.8% no 0 -Niger 1991 147.8 82.0% no 0 -Nigeria 1983 3,319.6 1.6% yes 3 144.8Nigeria 1984 1,532.5 -2.8% no 0 -Nigeria 1987 6,520.0 19.3% no 0 -Nigeria 1988 1,798.4 41.5% no 0 -Nigeria 1989 8,318.5 30.1% no 0 -Nigeria 1991 7,835.4 40.1% no 0 -Pakistan 1999 1,593.5 13.3% yes 1 0.3Panama 1985 929.5 12.0% no 0 -Panama 1994 562.9 15.1% no 0 -Panama 1996 4,715.6 34.9% yes 2 34.4Paraguay 1993 25.4 29.2% yes 1 -Peru 1980 704.0 -4.6% no 0 -Peru 1983 651.9 6.3% no 0 -Peru 1997 12,485.8 63.9% yes 13 31.9Philippines 1986 5,101.8 42.6% no 0 -Philippines 1987 14,869.1 15.4% no 0 -Philippines 1990 2,917.5 42.8% no 0 -Philippines 1992 5,822.0 25.4% no 0 -Poland 1982 7,457.5 51.7% no 0 -
continues on next page
44
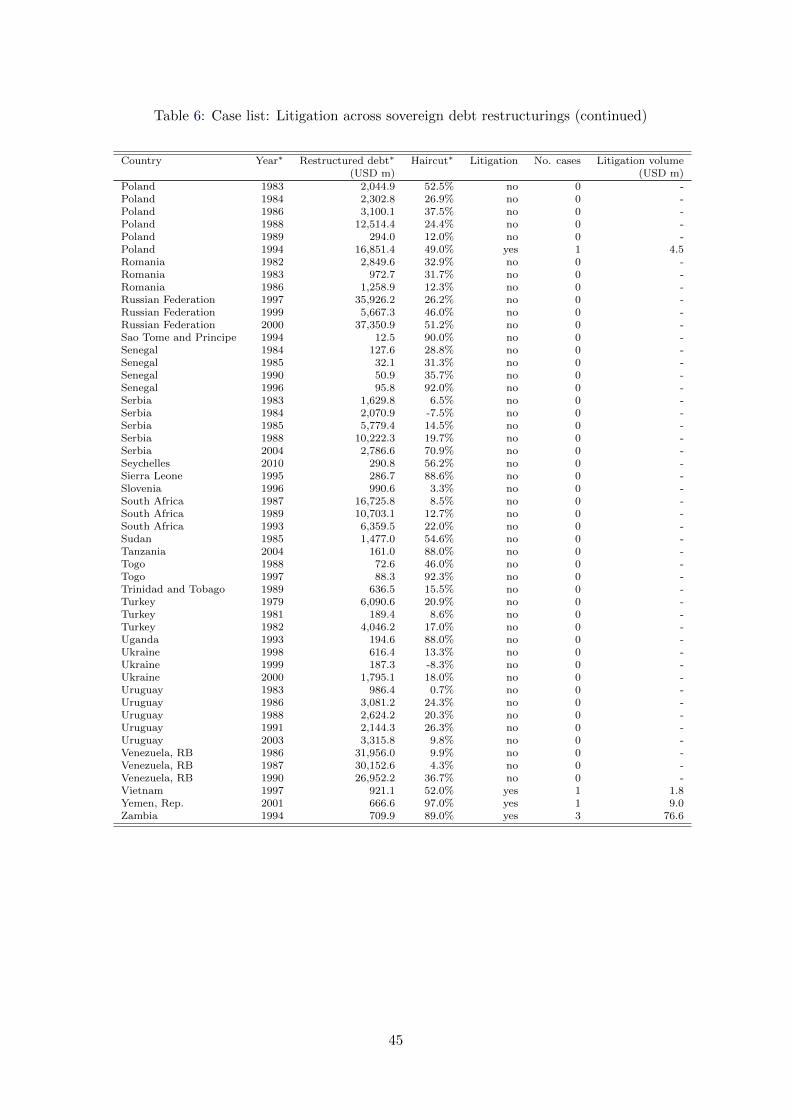
Table 6: Case list: Litigation across sovereign debt restructurings (continued)
Country Year∗ Restructured debt∗ Haircut∗ Litigation No. cases Litigation volume(USD m) (USD m)
Poland 1983 2,044.9 52.5% no 0 -Poland 1984 2,302.8 26.9% no 0 -Poland 1986 3,100.1 37.5% no 0 -Poland 1988 12,514.4 24.4% no 0 -Poland 1989 294.0 12.0% no 0 -Poland 1994 16,851.4 49.0% yes 1 4.5Romania 1982 2,849.6 32.9% no 0 -Romania 1983 972.7 31.7% no 0 -Romania 1986 1,258.9 12.3% no 0 -Russian Federation 1997 35,926.2 26.2% no 0 -Russian Federation 1999 5,667.3 46.0% no 0 -Russian Federation 2000 37,350.9 51.2% no 0 -Sao Tome and Principe 1994 12.5 90.0% no 0 -Senegal 1984 127.6 28.8% no 0 -Senegal 1985 32.1 31.3% no 0 -Senegal 1990 50.9 35.7% no 0 -Senegal 1996 95.8 92.0% no 0 -Serbia 1983 1,629.8 6.5% no 0 -Serbia 1984 2,070.9 -7.5% no 0 -Serbia 1985 5,779.4 14.5% no 0 -Serbia 1988 10,222.3 19.7% no 0 -Serbia 2004 2,786.6 70.9% no 0 -Seychelles 2010 290.8 56.2% no 0 -Sierra Leone 1995 286.7 88.6% no 0 -Slovenia 1996 990.6 3.3% no 0 -South Africa 1987 16,725.8 8.5% no 0 -South Africa 1989 10,703.1 12.7% no 0 -South Africa 1993 6,359.5 22.0% no 0 -Sudan 1985 1,477.0 54.6% no 0 -Tanzania 2004 161.0 88.0% no 0 -Togo 1988 72.6 46.0% no 0 -Togo 1997 88.3 92.3% no 0 -Trinidad and Tobago 1989 636.5 15.5% no 0 -Turkey 1979 6,090.6 20.9% no 0 -Turkey 1981 189.4 8.6% no 0 -Turkey 1982 4,046.2 17.0% no 0 -Uganda 1993 194.6 88.0% no 0 -Ukraine 1998 616.4 13.3% no 0 -Ukraine 1999 187.3 -8.3% no 0 -Ukraine 2000 1,795.1 18.0% no 0 -Uruguay 1983 986.4 0.7% no 0 -Uruguay 1986 3,081.2 24.3% no 0 -Uruguay 1988 2,624.2 20.3% no 0 -Uruguay 1991 2,144.3 26.3% no 0 -Uruguay 2003 3,315.8 9.8% no 0 -Venezuela, RB 1986 31,956.0 9.9% no 0 -Venezuela, RB 1987 30,152.6 4.3% no 0 -Venezuela, RB 1990 26,952.2 36.7% no 0 -Vietnam 1997 921.1 52.0% yes 1 1.8Yemen, Rep. 2001 666.6 97.0% yes 1 9.0Zambia 1994 709.9 89.0% yes 3 76.6
45
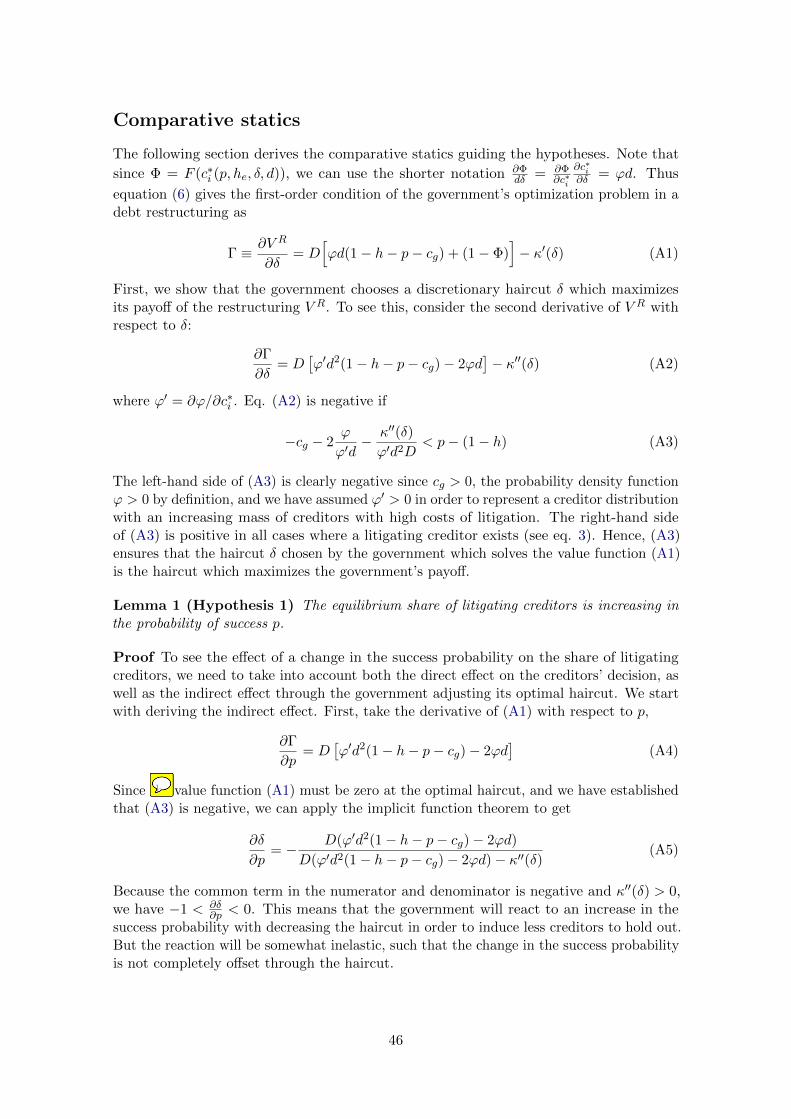
Comparative statics
The following section derives the comparative statics guiding the hypotheses. Note that
since Φ = F (c∗i (p, he, δ, d)), we can use the shorter notation ∂Φdδ = ∂Φ
∂c∗i
∂c∗i∂δ = ϕd. Thus
equation (6) gives the first-order condition of the government’s optimization problem in adebt restructuring as
Γ ≡ ∂V R
∂δ= D
[ϕd(1− h− p− cg) + (1− Φ)
]− κ′(δ) (A1)
First, we show that the government chooses a discretionary haircut δ which maximizesits payoff of the restructuring V R. To see this, consider the second derivative of V R withrespect to δ:
∂Γ
∂δ= D
[ϕ′d2(1− h− p− cg)− 2ϕd
]− κ′′(δ) (A2)
where ϕ′ = ∂ϕ/∂c∗i . Eq. (A2) is negative if
−cg − 2ϕ
ϕ′d− κ′′(δ)
ϕ′d2D< p− (1− h) (A3)
The left-hand side of (A3) is clearly negative since cg > 0, the probability density functionϕ > 0 by definition, and we have assumed ϕ′ > 0 in order to represent a creditor distributionwith an increasing mass of creditors with high costs of litigation. The right-hand sideof (A3) is positive in all cases where a litigating creditor exists (see eq. 3). Hence, (A3)ensures that the haircut δ chosen by the government which solves the value function (A1)is the haircut which maximizes the government’s payoff.
Lemma 1 (Hypothesis 1) The equilibrium share of litigating creditors is increasing inthe probability of success p.
Proof To see the effect of a change in the success probability on the share of litigatingcreditors, we need to take into account both the direct effect on the creditors’ decision, aswell as the indirect effect through the government adjusting its optimal haircut. We startwith deriving the indirect effect. First, take the derivative of (A1) with respect to p,
∂Γ
∂p= D
[ϕ′d2(1− h− p− cg)− 2ϕd
](A4)
Since the value function (A1) must be zero at the optimal haircut, and we have establishedthat (A3) is negative, we can apply the implicit function theorem to get
∂δ
∂p= − D(ϕ′d2(1− h− p− cg)− 2ϕd)
D(ϕ′d2(1− h− p− cg)− 2ϕd)− κ′′(δ)(A5)
Because the common term in the numerator and denominator is negative and κ′′(δ) > 0,we have −1 < ∂δ
∂p < 0. This means that the government will react to an increase in thesuccess probability with decreasing the haircut in order to induce less creditors to hold out.But the reaction will be somewhat inelastic, such that the change in the success probabilityis not completely offset through the haircut.
46
j.schumacher
Sticky Note
A2 is negative
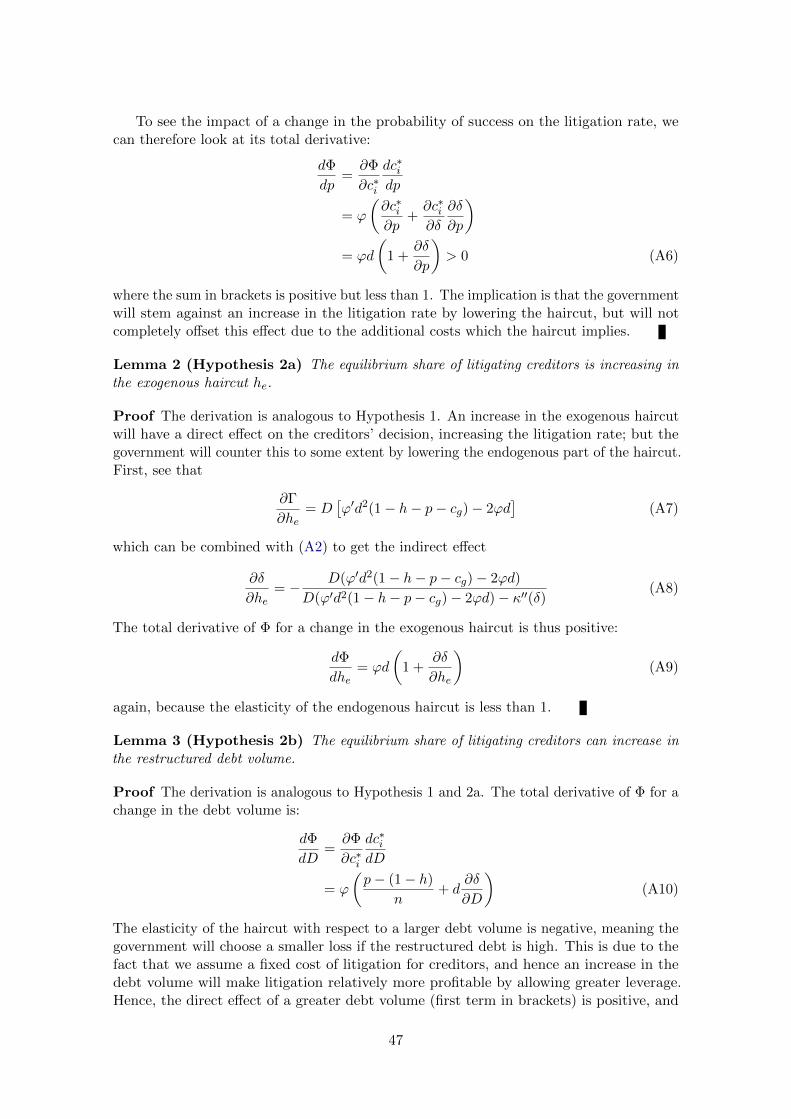
To see the impact of a change in the probability of success on the litigation rate, wecan therefore look at its total derivative:
dΦ
dp=∂Φ
∂c∗i
dc∗idp
= ϕ
(∂c∗i∂p
+∂c∗i∂δ
∂δ
∂p
)= ϕd
(1 +
∂δ
∂p
)> 0 (A6)
where the sum in brackets is positive but less than 1. The implication is that the governmentwill stem against an increase in the litigation rate by lowering the haircut, but will notcompletely offset this effect due to the additional costs which the haircut implies.
Lemma 2 (Hypothesis 2a) The equilibrium share of litigating creditors is increasing inthe exogenous haircut he.
Proof The derivation is analogous to Hypothesis 1. An increase in the exogenous haircutwill have a direct effect on the creditors’ decision, increasing the litigation rate; but thegovernment will counter this to some extent by lowering the endogenous part of the haircut.First, see that
∂Γ
∂he= D
[ϕ′d2(1− h− p− cg)− 2ϕd
](A7)
which can be combined with (A2) to get the indirect effect
∂δ
∂he= − D(ϕ′d2(1− h− p− cg)− 2ϕd)
D(ϕ′d2(1− h− p− cg)− 2ϕd)− κ′′(δ)(A8)
The total derivative of Φ for a change in the exogenous haircut is thus positive:
dΦ
dhe= ϕd
(1 +
∂δ
∂he
)(A9)
again, because the elasticity of the endogenous haircut is less than 1.
Lemma 3 (Hypothesis 2b) The equilibrium share of litigating creditors can increase inthe restructured debt volume.
Proof The derivation is analogous to Hypothesis 1 and 2a. The total derivative of Φ for achange in the debt volume is:
dΦ
dD=∂Φ
∂c∗i
dc∗idD
= ϕ
(p− (1− h)
n+ d
∂δ
∂D
)(A10)
The elasticity of the haircut with respect to a larger debt volume is negative, meaning thegovernment will choose a smaller loss if the restructured debt is high. This is due to thefact that we assume a fixed cost of litigation for creditors, and hence an increase in thedebt volume will make litigation relatively more profitable by allowing greater leverage.Hence, the direct effect of a greater debt volume (first term in brackets) is positive, and
47
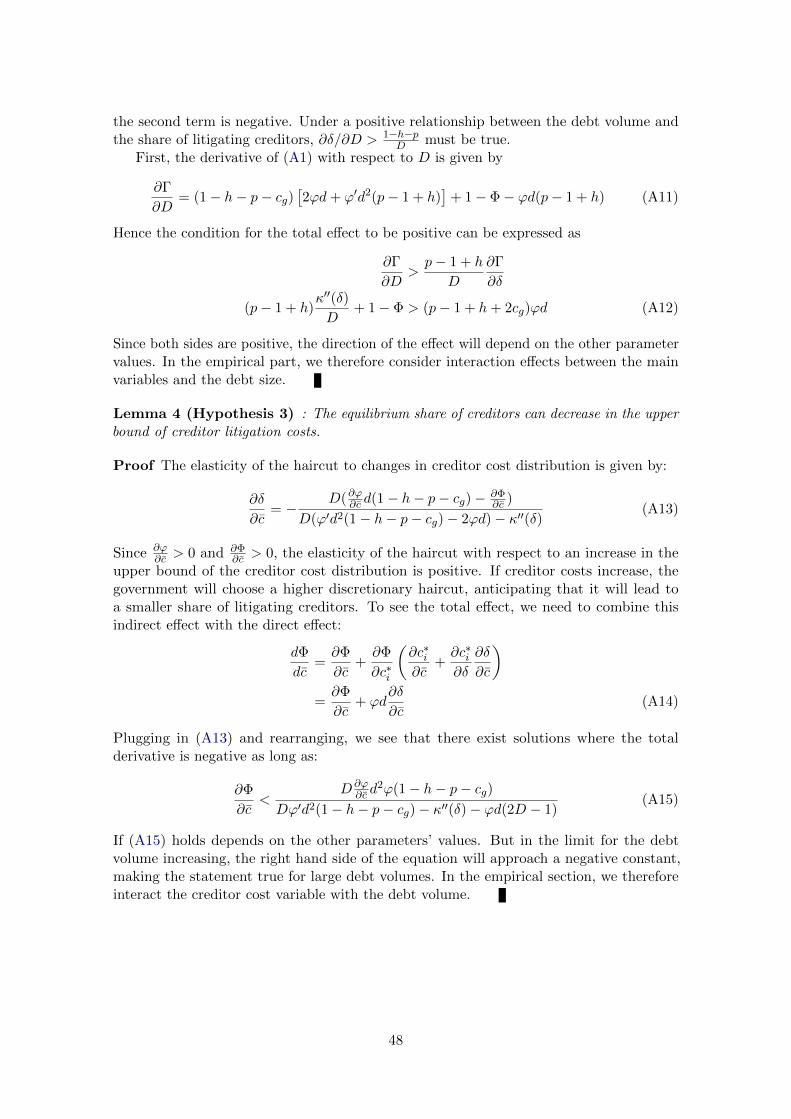
the second term is negative. Under a positive relationship between the debt volume andthe share of litigating creditors, ∂δ/∂D > 1−h−p
D must be true.First, the derivative of (A1) with respect to D is given by
∂Γ
∂D= (1− h− p− cg)
[2ϕd+ ϕ′d2(p− 1 + h)
]+ 1− Φ− ϕd(p− 1 + h) (A11)
Hence the condition for the total effect to be positive can be expressed as
∂Γ
∂D>p− 1 + h
D
∂Γ
∂δ
(p− 1 + h)κ′′(δ)
D+ 1− Φ > (p− 1 + h+ 2cg)ϕd (A12)
Since both sides are positive, the direction of the effect will depend on the other parametervalues. In the empirical part, we therefore consider interaction effects between the mainvariables and the debt size.
Lemma 4 (Hypothesis 3) : The equilibrium share of creditors can decrease in the upperbound of creditor litigation costs.
Proof The elasticity of the haircut to changes in creditor cost distribution is given by:
∂δ
∂c= −
D(∂ϕ∂c d(1− h− p− cg)− ∂Φ∂c )
D(ϕ′d2(1− h− p− cg)− 2ϕd)− κ′′(δ)(A13)
Since ∂ϕ∂c > 0 and ∂Φ
∂c > 0, the elasticity of the haircut with respect to an increase in theupper bound of the creditor cost distribution is positive. If creditor costs increase, thegovernment will choose a higher discretionary haircut, anticipating that it will lead toa smaller share of litigating creditors. To see the total effect, we need to combine thisindirect effect with the direct effect:
dΦ
dc=∂Φ
∂c+∂Φ
∂c∗i
(∂c∗i∂c
+∂c∗i∂δ
∂δ
∂c
)=∂Φ
∂c+ ϕd
∂δ
∂c(A14)
Plugging in (A13) and rearranging, we see that there exist solutions where the totalderivative is negative as long as:
∂Φ
∂c<
D ∂ϕ∂c d
2ϕ(1− h− p− cg)Dϕ′d2(1− h− p− cg)− κ′′(δ)− ϕd(2D − 1)
(A15)
If (A15) holds depends on the other parameters’ values. But in the limit for the debtvolume increasing, the right hand side of the equation will approach a negative constant,making the statement true for large debt volumes. In the empirical section, we thereforeinteract the creditor cost variable with the debt volume.
48