Vol. pp. 2- ,**2 ,1- ,13 The E ects of Negative Stress ... · slip at each location, i.e., rupture...
7
腏 腎 腌 腋 腍 腑 腐 腃 腄 腂 腂 ῌ ῌ ῌῌ ῌ 273 w Bull. Earthq. Res. Inst. Univ. Tokyo Vol. pp. * e-mail : [email protected] ( , Yayoi, Bunkyo-ku, Tokyo , Japan) Earthquake Research Institute, University of Tokyo We investigate spatiotemporal distribution in a kinematic slip model of the mid-Niigata (Chuetsu) earthquake, focusing on the relationship between rupture time and stress drop. Stress drop distribution is calculated from the final slip distribution inferred from waveform inversion. There are negative stress drop regions near the edges of inferred asperities. Rupture delays were detected in the mean slip rate time functions. Combining the above distribution, we found delayed rupture within regions of negative stress drop. In these negative stress drop regions, rupture prop- agation is expected to arrest because a positive stress drop promotes rupture. It should be em- phasized that our results were obtained without reconstructing the dynamic faulting process. : Rupture Process, The mid-Niigata earthquake, Stress drop teri and Spudich ( ) demonstrated that two key The faulting process, i.e., space-time distributions dynamic parameters, Dc and peak stress, cannot be of fault slips of past earthquakes, have been esti- uniquely estimated from band-limited waveforms. mated by many seismologists ( Liu, , In this manuscript, we study the details of the Liu and Archuleta, ; Wald and Heaton, ; kinematic model of the mid-Niigata (Chuetsu) Yagi, ). In addition to these kinematic fault earthquake, which occurred within a dense network models, dynamic models of earthquakes have also of seismographs (Fig. ), and obtained important in- been constructed with the constraints of the kine- formation on physical faulting process of the event matic parameters ( Quin, ; Miyatake, ab; without reconstructing a sophisticated dynamic Mikumo and Miyatake, ; Miyatake ; model. Olsen ; Peyrat ). Knowledge of dynamic parameters is important not only to under- stand earthquake source physics, but also strong The mid-Niigata earthquake of M . oc- ground motion simulations, which require realistic curred in the back-arc area of the main Japanese source models for probabilistic modeling (Irikura island as a shallow inland dip-slip earthquake. The ). However, the dynamic model depends on source region was located in the eastern margin of a the kinematic model selected. Several di erent kine- thick sedimentary basin (Kato ). It caused matic models often exist for a single earthquake, serious damage in and around the source region. The each obtained with a di erent inversion method, main shock was followed by significant aftershock waveform data set, or modeling of kinematic source. activity, and the number of large aftershocks was Depending on numerous additional factors includ- significantly greater than those associated with ing computational method and computational pa- other recent inland earthquakes in Japan. rameters adopted, dynamic models based on kine- matic models are also not unique. As one example of Several inversion studies have been performed on the additional complexity of dynamic models, Guat- the mid-Niigata earthquake, each of which has Takashi Miyatake*, Aitaro Kato, Kazuhito Hikima and Takeshi Kimura e.g., et al., e.g., et al., et al. et al., et al., et al. Kinematic model of the mid-Niigata earthquake . Introduction Abstract Key words . The mid-Niigata earthquake The E ects of Negative Stress Drop on Fault Rupture The mid-Niigata (Chuetsu), Japan, earthquake 2- ,**2 ,1- ,13 +++ ++- **-, ,**. ,**. ,*** ,**0 ,**. +33. ,**. ,**. + +33* +33, +332 ,**. +331 ,**+ ,**. 00 ,**. # ,**0 # ,**. ,**. + , ,**. # ,**.
Transcript of Vol. pp. 2- ,**2 ,1- ,13 The E ects of Negative Stress ... · slip at each location, i.e., rupture...

� � � � � � �
� �
�
�
� � �
273
w
Bull. Earthq. Res. Inst.
Univ. Tokyo
Vol. pp.
* e-mail : [email protected] ( , Yayoi, Bunkyo-ku, Tokyo , Japan)
Earthquake Research Institute, University of Tokyo
We investigate spatiotemporal distribution in a kinematic slip model of the mid-Niigata
(Chuetsu) earthquake, focusing on the relationship between rupture time and stress drop. Stress
drop distribution is calculated from the final slip distribution inferred from waveform inversion.
There are negative stress drop regions near the edges of inferred asperities. Rupture delays were
detected in the mean slip rate time functions. Combining the above distribution, we found delayed
rupture within regions of negative stress drop. In these negative stress drop regions, rupture prop-
agation is expected to arrest because a positive stress drop promotes rupture. It should be em-
phasized that our results were obtained without reconstructing the dynamic faulting process.
: Rupture Process, The mid-Niigata earthquake, Stress drop
teri and Spudich ( ) demonstrated that two key
The faulting process, i.e., space-time distributions dynamic parameters, Dc and peak stress, cannot be
of fault slips of past earthquakes, have been esti- uniquely estimated from band-limited waveforms.
mated by many seismologists ( Liu, , In this manuscript, we study the details of the
Liu and Archuleta, ; Wald and Heaton, ; kinematic model of the mid-Niigata (Chuetsu)
Yagi, ). In addition to these kinematic fault earthquake, which occurred within a dense network
models, dynamic models of earthquakes have also of seismographs (Fig. ), and obtained important in-
been constructed with the constraints of the kine- formation on physical faulting process of the event
matic parameters ( Quin, ; Miyatake, ab ; without reconstructing a sophisticated dynamic
Mikumo and Miyatake, ; Miyatake ; model.
Olsen ; Peyrat ). Knowledge of
dynamic parameters is important not only to under-
stand earthquake source physics, but also strong The mid-Niigata earthquake of M . oc-
ground motion simulations, which require realistic curred in the back-arc area of the main Japanese
source models for probabilistic modeling (Irikura island as a shallow inland dip-slip earthquake. The
). However, the dynamic model depends on source region was located in the eastern margin of a
the kinematic model selected. Several di erent kine- thick sedimentary basin (Kato ). It caused
matic models often exist for a single earthquake, serious damage in and around the source region. The
each obtained with a di erent inversion method, main shock was followed by significant aftershock
waveform data set, or modeling of kinematic source. activity, and the number of large aftershocks was
Depending on numerous additional factors includ- significantly greater than those associated with
ing computational method and computational pa- other recent inland earthquakes in Japan.
rameters adopted, dynamic models based on kine-
matic models are also not unique. As one example of Several inversion studies have been performed on
the additional complexity of dynamic models, Guat- the mid-Niigata earthquake, each of which has
Takashi Miyatake*, Aitaro Kato, Kazuhito Hikima and Takeshi Kimura
e.g., et al.,
e.g.,
et al.,
et al. et al.,
et
al.,
et al.
Kinematic model of the mid-Niigata earthquake
. Introduction
Abstract
Key words
. The mid-Niigata earthquake
The E ects of Negative Stress Drop on Fault Rupture
The mid-Niigata (Chuetsu), Japan, earthquake
2- ,**2 ,1- ,13
+ + + ++- **-,
,**.
,**.
,***
,**0
,**. +33. ,**.
,**.
+
+33* +33,
+332 ,**.
+331 ,**+
,**. 0 0
,**.
# ,**0
#
,**.
,**.
+
, ,**.
#
,**.

� �274
plotted as a black star. Red triangles represent KiK-
T. Miyatake, A. Kato, K. Hikima and T. Kimura
Fig. . Slip distribution inferred from waveform in-
version results obtained by Hikima and Koketsu
( ).
Fig. . Hypocenter of the Chuetsu earthquake is
net stations that recorded data compared to syn-
thetic seismograms (see also Fig. ).
Fig. . Static stress change distribution calculated
using Okada’s ( ) Green’s functions.
yielded slightly di erent results ( Hikima and
Koketsu, ; Honda ; Asano and Iwata,
). In general, the waveform inversion results
di er because of specific choices made regarding, for
instance, the inclusion of geodetic data or teleseismic
data, the inversion algorithm itself, and di erent
Green’s functions ( D, hybrid D, or D). The
above three studies did not use geodetic nor teleseis-
mic data, but used near-field ground motion records,
although number of waveforms are di erent. On the
other hand, the Green’s functions or the structure the time windows used in their inversion is . km/s,
models for the functions di ered. This earthquake which is fast enough coupled with the relatively long
occurred along a structural boundary between low time window ( sec) to estimate rupture delay times.
seismic velocity sediments in a hanging wall and In their approach, rupture time is not an estimated
basement rocks in the footwall (Kato ). The parameter. Instead, the amplitudes of subfault slip
source region is structurally heterogeneous, and rate time functions at successive time steps, which
many of the di erences among the results of the propagate at a constant speed from a starting point,
three groups listed above may stem from di erences are obtained. If the velocity of the moving window is
in the Green’s functions used for inversion. There- greater than rupture velocity, and if the total dura-
fore, a well-calibrated Green’s function is indispensa- tion of the time windows is su ciently long, it is
ble for building a precise kinematic model (Graves possible to detect a delayed rupture. The waveform
and Wald, ). inversion results obtained by Hikima and Koketsu
We chose to use the results obtained by Hikima ( ) are amenable for detecting rupture delay. Al-
and Koketsu ( ) because : ) they estimated hybrid though Asano and Iwata ( ) also computed a hy-
D structures for each station via inversion of the brid D crustal structure when obtaining well-
waveforms of aftershocks to calculate accurate calibrated Green’s functions, the time window propa-
Green’s functions, and ) the propagation speed of gation speed of . km/s is too slow to detect any
e.g.,
et al.,
e.g.
et al.
,
,**/
+ ,**.
/
-
+33,
#
,**/ ,**/
,**3
#
#
+ + -
#
, 3
#
2
,**0
#
#
$
,**+
,**/
,**/ + ,**1
+ +
, + 3

� �275
The E ects of Negative Stress Drop on Fault Rupture
Fig. . Stress change distribution and mean slip rate time functions on the fault plane. Arrows indicate
rupture time delays. The yellow star indicates the initial point of fault rupture. Solid orange lines
demarcate negative stress drop zones. Dashed orange lines encompass zones of negative stress drop
and “shadow” regions. See text for further details.
The kinematic slip distribution obtained by Hikima
rupture delay. It is worth noting, however, that the and red color indicates stress rises, or negative stress
slip distributions of Hikima and Koketsu ( ) and drops. A maximum stress drop of about MPa oc-
Asano and Iwata ( ) are very similar. Honda curred at the deeper asperity of maximum slip,
( ) used a similar inversion algorithm to that of which is comparable with those for other inland
Asano and Iwata ( ), but di erent crustal models. Japanese earthquakes (Miyatake, b), but much
Honda ( ) used only three separate crustal lower than the MPa maximum stress drops ob-
models, i.e., two velocity structure models for sta- tained by Bouchon ( ) for several earthquakes in
tions on the hanging wall and one model for footwall California.
side stations. In contrast, Asano and Iwata ( ) and Negative stress drop regions are evident in the
Hikima and Koketsu ( ) inferred the structure for shallower half of the fault and also on the eastern
each station separately using a genetic algorithm part of the fault (around km along strike and km
and waveform inversion, respectively. from the bottom in Fig. , see also B in Fig. ). At
shallow depths, a negative stress drop (Fig. , see also
B in Fig. ) separates the positive stress drop re-
and Koketsu ( ) is illustrated in Fig. . It pos- gions A from A (Fig. ). This negative stress drop
sesses a maximum slip value of . m at deeper por- (B ) corresponds to a slip deficit (Fig. ). There is also
tions of the fault. The shallower ( km along the a corresponding slip deficit in the kinematic model
strike and km up-dip from the bottom) of the two estimated by Asano and Iwata ( ) and Honda
main asperities is narrow and has a slip of m con- ( ). Therefore, the inference that negative stress
necting the deeper asperity. Based on this slip distri- drops correspond to locations of slip defect seems
bution, we calculated the stress change due to the reasonable.
earthquake (Fig. ) using Green’s functions derived
by Okada ( ). Blue color indicates stress drops The moment rate (or mean slip rate) time functions
et al.
et al.
Slip and stress change distribution
et al.
Delay of rupture propagation
#
.
,**/ 3
,**1
,**/
,**1 # +33,
,**/ +**
+331
,**1
,**/
- .
- - .
-
+ .
,**/ , + * .
+ 1 + ,
+3
+* ,**1
+ ,**.
-
+33,

�
of the subfaults estimated by Hikima and Koketsu namic modeling. Despite the procedure adopted, we
( ) are superimposed on the stress change distri- successfully obtained physically meaningful results.
bution in Fig. . Each plot starts at the arrival time In general, negative stress drops are caused by one
of the first time window used in the inversion or more of the following factors : ) frictional proper-
process, which propagates at a speed of . km/s as ties of the fault, ) inappropriate or inaccurate pre-
noted above. Arrows indicate the delayed onset of sumed fault geometry, or ) poor inversion resolu-
slip at each location, i.e., rupture delay, which we tion. In the first explanation, rate-dependent fric-
measured. There are delays at many subfaults, par- tional properties possibly account for negative stress
ticularly in the upper half part of the fault. Regard- drops (Cochard and Madariaga, ). According to
ing the relation to stress drop, delayed ruptures are the rate-and state friction law, if A-B , slip harden-
in both positive ( A and A ; Fig. ) and negative ing, and therefore negative stress drop occur where
stress drop regions (i.e., B , B , and B ). A and B are parameters of the rate-and state friction
Accounting for rupture delays at negative stress law (see, Scholz, ). Likewise, a discrepancy
drop regions is straightforward. Because a positive between the fault’s true geometry and that used for
stress drop promotes rupture, a negative stress drop modeling may generate negative stress drops (Ando,
(such as in regions B and B ) would be expected to ), particularly if fault kinks or o sets decrease
arrest or decelerate rupture propagation. On the slip locally. If we calculate stress distribution on the
other hand, rupture onset delays in positive stress assumption of a planar fault, a negative stress drop
drop regions, for example, A and A , can be ex- will be obtained, and in this case the region sur-
plained as follows : a negative stress drop at B will rounding a fault kink or step will act as a rupture
cause delays not only there but also within the as- barrier (Harris and Archuleta, ). The third expla-
perities, A and A , because the onset of rupture at nation for negative stress drops is poor model resolu-
those two locations is a ected by any delays at B . tion in the source inversion process. Poor resolution
In other words, regions A and A are “shaded” by causes fault slip to leak towards the periphery of the
B with respect to the hypocenter (yellow star in Fig. fault. This smoothing around the fault edge pro-
), and the delays measured there on the region de- duces the negative stress drop. In the case of the
pend on the delay at B . On the analogy of travel mid-Niigata earthquake, the event occurred within a
time calculation, the delays at A and A are the dense seismic network with several seismographs
integration of (positive or negative) delay times located very close to the fault, so inversion resolution
along the “propagation paths”. is not considered likely to be a significant factor.
A similar argument may be made for A lying Kato, Miyatake, and Hirata ( ) observed that the
within the “shadow” of the negative stress drop re- negative stress drop region is located near an abrupt
gion B . Another important factor controlling rup- transition in sediment thickness (see Fig. and Fig.
ture delay may be peak stress (or fracture energy). of Kato ), above the mainshock hypocen-
This could account for the delays at A and A if ter. They also suggested that the ductile flow of
peak stresses were high enough locally. However, sediments above the mainshock hypocenter might
given that delays within positive stress drop regions act as a soft barrier against coseismic rupture be-
are consistently observed to occur in the “shadows” cause the low-velocity sediments would not sustain
cast by negative stress drops, we consider that nega- high stresses. This argument implies that stresses
tive stress drops play a key role in determining the prior to the earthquake were low. Low stress or
rupture onset of the earthquake. ductile flows themselves produce a low or zero stress
drop, and would easily raise the residual stress level,
so cause negative stress drop when combined with
We carefully studied the stress drop and the delay the above ) fault friction property or the above ) :
of moment rate time functions on the fault of the kink or bend (or small bump on the fault plane)
mid-Niigata earthquake, Japan, and found that corresponding to the macroscopic assumption.
rupture delay is related to the negative stress drop We investigated rupture delay. However, to what
on the fault. In our approach, we did not use dy- extent a
e.g.
e.g.,
et al.,
. Discussion
,**/
.
+
, 3 ,
-
+33.
*
+ , .
+ , -
,**,
+ , ,**/ #
+ ,
+
+33+
+ ,
# +
+ ,
+
. ,**.
+
+ ,
- ,**1
, -
1 ,**0
+ ,
+ ,
,**.
-
� �276
T. Miyatake, A. Kato, K. Hikima and T. Kimura
re di erences in waveform produced by de-#

� �277
The E ects of Negative Stress Drop on Fault Rupture
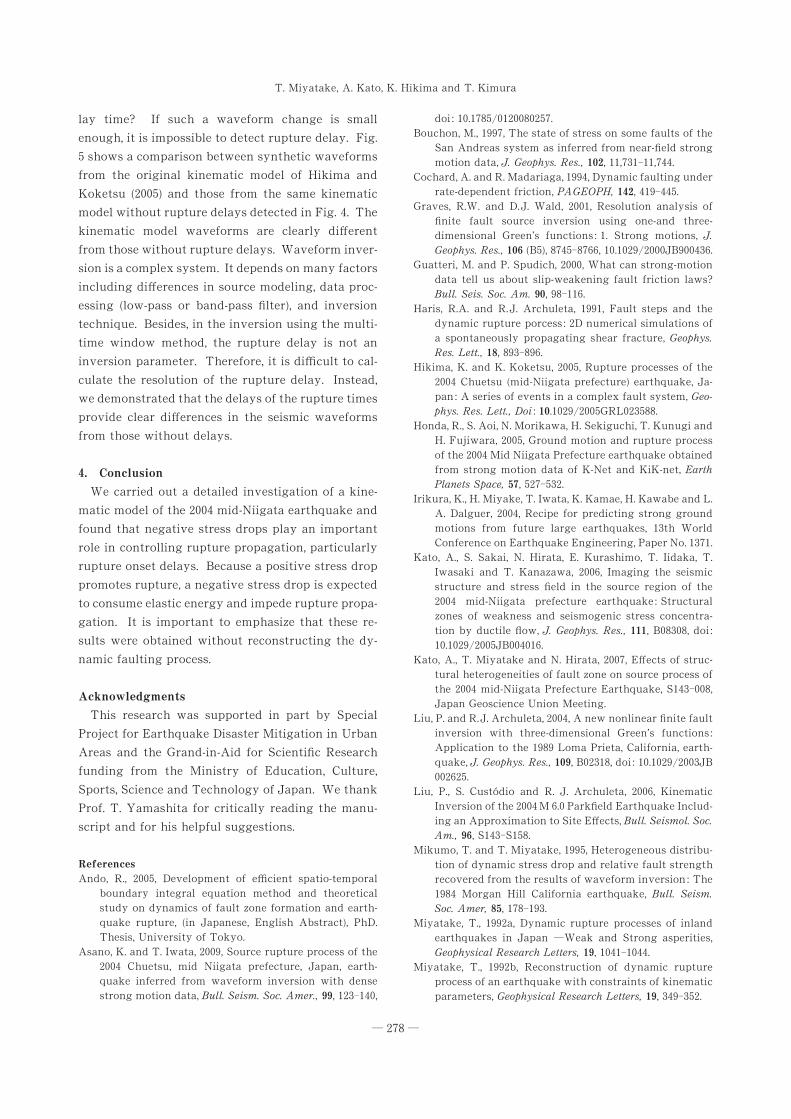
Fig. . Comparison between synthetic velocity waveforms from the kinematic model (Hikima and Koketsu, )
and those from same kinematic model without rupture delays detected in Fig. . Red and green lines indicate
kinematic model waveforms and those without indicate rupture delays, respectively. The observed waveforms
are also plotted as black lines. Numerals are peak amplitudes in cm/s.
#
/ ,**/
-
�
�
�
�
�
�
�
�
doi : . / .
Bouchon, M., , The state of stress on some faults of the
San Andreas system as inferred from near-field strong
motion data, , , , .
Cochard, A. and R. Madariaga, , Dynamic faulting under
rate-dependent friction, , .
Graves, R.W. and D. J. Wald, , Resolution analysis of
finite fault source inversion using one-and three-
dimensional Green’s functions : . Strong motions,
(B ), , . / JB .
Guatteri, M. and P. Spudich, , What can strong-motion
data tell us about slip-weakening fault friction laws?
, .
Haris, R.A. and R. J. Archuleta, , Fault steps and the
dynamic rupture porcess : D numerical simulations of
a spontaneously propagating shear fracture,
, .
Hikima, K. and K. Koketsu, , Rupture processes of the
Chuetsu (mid-Niigata prefecture) earthquake, Ja-
pan : A series of events in a complex fault system,
: . / GRL .
Honda, R., S. Aoi, N. Morikawa, H. Sekiguchi, T. Kunugi and
H. Fujiwara, , Ground motion and rupture process
of the Mid Niigata Prefecture earthquake obtained
from strong motion data of K-Net and KiK-net,
, .
Irikura, K., H. Miyake, T. Iwata, K. Kamae, H. Kawabe and L.
A. Dalguer, , Recipe for predicting strong ground
motions from future large earthquakes, th World
Conference on Earthquake Engineering, Paper No. .
Kato, A., S. Sakai, N. Hirata, E. Kurashimo, T. Iidaka, T.
Iwasaki and T. Kanazawa, , Imaging the seismic
structure and stress field in the source region of the
mid-Niigata prefecture earthquake : Structural
zones of weakness and seismogenic stress concentra-
tion by ductile flow, , B , doi :
. / JB .
Kato, A., T. Miyatake and N. Hirata, , E ects of struc-
tural heterogeneities of fault zone on source process of
the mid-Niigata Prefecture Earthquake, S ,
Japan Geoscience Union Meeting.
Liu, P. and R. J. Archuleta, , A new nonlinear finite fault
inversion with three-dimensional Green’s functions :
Application to the Loma Prieta, California, earth-
quake, , B , doi : . / JB
.
Liu, P., S. Custodio and R. J. Archuleta, , Kinematic
Inversion of the M . Parkfield Earthquake Includ-
ing an Approximation to Site E ects,
Ando, R., , Development of e cient spatio-temporal
boundary integral equation method and theoretical
study on dynamics of fault zone formation and earth-
quake rupture, (in Japanese, English Abstract), PhD.
Thesis, University of Tokyo.
Asano, K. and T. Iwata, , Source rupture process of the
Chuetsu, mid Niigata prefecture, Japan, earth-
quake inferred from waveform inversion with dense
strong motion data, , ,
lay time? If such a waveform change is small
enough, it is impossible to detect rupture delay. Fig.
shows a comparison between synthetic waveforms
from the original kinematic model of Hikima and
Koketsu ( ) and those from the same kinematic
model without rupture delays detected in Fig. . The
kinematic model waveforms are clearly di erent
from those without rupture delays. Waveform inver-
sion is a complex system. It depends on many factors
including di erences in source modeling, data proc-
essing (low-pass or band-pass filter), and inversion
technique. Besides, in the inversion using the multi-
time window method, the rupture delay is not an
inversion parameter. Therefore, it is di cult to cal-
culate the resolution of the rupture delay. Instead,
we demonstrated that the delays of the rupture times
provide clear di erences in the seismic waveforms
from those without delays.
We carried out a detailed investigation of a kine-
matic model of the mid-Niigata earthquake and
found that negative stress drops play an important
role in controlling rupture propagation, particularly
rupture onset delays. Because a positive stress drop
promotes rupture, a negative stress drop is expected
to consume elastic energy and impede rupture propa-
gation. It is important to emphasize that these re-
sults were obtained without reconstructing the dy-
namic faulting process.
This research was supported in part by Special
Project for Earthquake Disaster Mitigation in Urban
Areas and the Grand-in-Aid for Scientific Research
funding from the Ministry of Education, Culture,
Sports, Science and Technology of Japan. We thank
Prof. T. Yamashita for critically reading the manu-
script and for his helpful suggestions.
J. Geophys. Res.,
PAGEOPH,
J.
Geophys. Res.,
Bull. Seis. Soc. Am.
Geophys.
Res. Lett.,
Geo-
phys. Res. Lett., Doi
Earth
Planets Space,
J. Geophys. Res.,
J. Geophys. Res.,
Bull. Seism
Bull. Seism. Soc. Amer.,
References
. Conclusion
Acknowledgments
+* +12/ *+,**2*,/1
+331
++ 1-+ ++ 1..
+33.
.+3 ../
,**+
+
/ 21./ 2100 +* +*,3 ,*** 3**.-0
,***
32 ++0
+33+
,
23- 230
,**/
,**.
+*,3 ,**/ *,-/22
,**/
,**.
/,1 /-,
,**.
+-
+-1+
,**0
,**.
*2-*2
+* +*,3 ,**/ **.*+0
,**1 #
,**. +.- **2
,**.
+323
*,-+2 +* +*,3 ,**-
**,0,/
,**0
,**. 0 *
#
,**/ $
,**3
,**.
+,- +.*
/
,**/
.
#
#
$
#
,**.
+*,
+.,
+*0
3*
+2
+*
/1
+++
+*3
33
.
�
� �
�
�
�
�
278
T. Miyatake, A. Kato, K. Hikima and T. Kimura
, S S .
Mikumo, T. and T. Miyatake, , Heterogeneous distribu-
tion of dynamic stress drop and relative fault strength
recovered from the results of waveform inversion : The
Morgan Hill California earthquake,
, .
Miyatake, T., a, Dynamic rupture processes of inland
earthquakes in Japan Weak and Strong asperities,
, .
Miyatake, T., b, Reconstruction of dynamic rupture
process of an earthquake with constraints of kinematic
parameters, , .
ol. Soc.
Am.,
Bull. Seism.
Soc. Amer,
Geophysical Research Letters,
Geophysical Research Letters,
+.- +/2
+33/
+32.
+12 +3-
+33,
+*.+ +*..
+33,
-.3 -/,
30
2/
+3
+3

� �
�
� �
��
�
279
The E ects of Negative Stress Drop on Fault Rupture
Miyatake, T., Y. Yagi. and T. Yasuda, , The dynamic the October , Imperial Valley, California, earth-
rupture process of the Geiyo, quake, , .
, L , doi : . / GL Scholz, C. H., , The mechanics of earthquakes and fault-
. ing, second edition, Cambridge University Press.
Okada, Y., , Internal deformation due to shear and Wald, D. and T. H. Heaton, , Spatial and Temporal
tensile faults in a half-space, , Distribution of Slip for the Landers, California,
. Earthquake, , .
Olsen, K.B., R. Madariaga and R. J. Archuleta, , Three- Yagi, Y., , Source rupture process of the Tokachi-
dimensional dynamic simulation of the Landers oki earthquake determined by joint inversion of tele-
earthquake, , . seismic body wave and strong ground motion data,
Peyrat, S., K. B. Olsen and R. Madariaga, , Dynamic , , .
modeling of the Landers earthquake, (Received June , )
, , , . (Accepted March , )
Quin, H., , Dynamic stress drop and rupture dynamics of
Japan, earthquake, Tectonophysics,
Geophys. Res. Lett.,
Bull. Seism. Soc. Amer.,
Bull. Seism. Soc. Am.,
Science,
Earth Planet and Space,
J. Geophys.
Res.
#
,**. +/ +313
,**+ 3- ++1
+,0+, +* +*,3 ,**. ,**,
*+31,+
+33, +33.
+33,
+*+2 +*.* 002 03+
+331 ,**. ,**-
+33,
2-. 2-2
,**+ -++ -+0 ,**.
+33, ,/ ,**2
,0 .01 ,0 .2, ,- ,**3
+33*
+1/
-+
2,
2.
,12
/0
+*0