Vision and Mission Statement - Sutron Corporation and Mission Statement It is Sutron Corporation’s...
44
Transcript of Vision and Mission Statement - Sutron Corporation and Mission Statement It is Sutron Corporation’s...

>>Vision and Mission Statement
It is Sutron Corporation’s VISION to become the world’s market leader in providing innovative, reliable and quality Hydrologic, Meteorologic and Oceanic real-time data collection and control products, systems, software and services. We will achieve our VISION by continually offering state-of-the-art products and services that meet or exceed our customer’s needs and expectations. At Sutron, we are dedicated to building a world-class organization that is committed to being the very best. It is Sutron Corporation’s MISSION to provide complete satisfaction to our customers, employees and shareholders. We are dedicated to understanding and meeting our customers’ needs and we will provide complete satisfaction to our customers as we set the standards for reliability, quality, on-time delivery, low cost and dependability. To our employees, we will provide complete satisfaction by promoting a workplace that is exciting, challenging and rewarding. Lastly, to our shareholders, we will provide complete satisfaction through a continual focus on profitability.
Financial HighlightsIn thousands, except per share data
Years ended December 31 2005 2004 2003
Operations:
Revenues. . . . . . . . . . . . . . . . . . $ 15,434 $ 16,679 $ 11,016
Gross profit . . . . . . . . . . . . . . . 6,319 6,426 3,357
Operating income (loss) . . . 2,203 3,010 73
Net income (loss) . . . . . . . . . $ 1,470 $ 1,902 $ 95
Net basic income (loss) per share . . . . . . . . . . . . . . . . . . . . . . . . . . . . . . . . . . . . . . . . . . . . . . . . . . . . . . . . . $ .34 $ .44 $ .02
Net diluted income (loss) per share . . . . . . . . . . . . . . . . . . . . . . . . . . . . . . . . . . . . . . . . . . . . . . . . . . . . . . . $ .30 $ .38 $ .02
Financial Position:
Cash . . . . . . . . . . . . . . . . . . . . . . $ 2,095 $ 1,419 $ 389
Working capital . . . . . . . . . . . 6,844 5,352 3,407
Stockholders’ equity . . . . . . . 7,322 5,852 3,946
Operating Income(in thousands)
Net Income(in thousands)
Earnings Per Share
0
5
10
15
$20
’03 ’04 ’050
5
10
15
20
25
30
$35
’03 ’04 ’050
5
10
15
$20
’03 ’04 ’050
0.10
0.20
0.30
0.40
$0.50
’03 ’04 ’05
Revenues(in millions)
Operating Income(in millions)
Net Income(in millions)
Earnings Per Share(in millions)
Revenues(in millions)
0
5000
10000
15000
20000
0
500
1000
1500
2000
0.0
0.1
0.2
0.3
0.4
0.5
0
500
1000
1500
2000
2500
3000
3500
1
>
>

We are pleased to report that 2005 was a good year as
we continued to “Expand our Capabilities” in the hydro-
logic, meteorologic and oceanic markets. In 2005, we set
a new annual record for customer orders in the amount
of $20,900,230 as compared with the previous record
of $17,904,800 in 2004. We were awarded two large
international contracts, one from the India Meteorological
Department and the other from the Central Water
Commission of India, in the fourth quarter of 2005 that
totaled approximately $6,067,600. We worked diligently
with these customers throughout the year to answer
technical questions and negotiate prices. We had pro-
jected receiving both contracts earlier in 2005, which
would have improved our operating results significantly.
The timing of both contract awards, however, was late
in the year and our 2006 results will benef it as the
Company enters 2006 with a backlog of approximately
$10,840,000 of which approximately $7,800,000 will be
shipped in 2006.
Financial Results:
Our net sales and revenues for 2005 were $15,434,255,
which was down 7.5% from 2004. Our net income was
$1,470,294, which was down 23% from 2004. Earnings
per share were $0.34 in 2005 compared to earnings of
$0.44 per share in 2004. Customer orders for 2005 were
a record $20,900,230 and can be divided into the fol-
lowing areas: HydroMet Products Division—$10,110,564,
Integrated Systems Division—$3,464,840, Hydrological
Services Division—$3,810,836, Airport Weather Systems
—$300,405, Special Projects—$67,521, and our India
operations—$3,146,064. We received approximately
$3,000,000 in customer orders for tides and tsunami
systems in 2005. We submitted proposals and quotations
in 2005 totaling a record of $58,882,912 and therefore
anticipate that 2006 domestic and international orders
will increase over 2005.
HydroMet Products:
Our HydroMet Products Division (HPD), which has the
responsibility of manufacturing all of our standard prod-
ucts, had 2005 net sales and revenues of approximately
$9,305,000 with a gross profit margin of approximately
51% . Our products yield our highest margins with our
tides and tsunami systems and our Satlink2 Satellite
Transmitter/Loggers yielding margins in excess of 51% .
HPD delivered approximately $3,000,000 of tides and
tsunami systems in 2005. We anticipate continued
demand for these systems throughout the world in 2006.
HPD delivered approximately 2,000 Satlink2’s in 2005.
Satlink2 is certif ied to operate on all operational geo-
stationary satellites around the world and we are the
leading supplier of satellite transmitters. We anticipate
increased demand in 2006 for satellite transmitters. It is
our goal to continue to increase our gross margins on all
standard products.
Integrated Systems:
Integrated Systems Division (ISD) net sales and revenues
for 2005, which included revenues from sales of airport
Dear Shareholders:
2
>

weather systems and special projects, totaled approxi-
mately $3,490,000 with a gross profit margin of approxi-
mately 41%. ISD continued to upgrade 170 stations for
the U.S. Bureau of Reclamation’s Alamosa Closed Basin
Salvage Well Control project. The upgrade of these sta-
tions is expected to be completed in 2006. ISD delivered
a stream gauging network of 22 stations to measure
water level and rainfall in the Niger River basin using the
EUMETSAT satellite system. These stations were installed
in nine African countries in 2005. ISD also installed a
LRIT Ground Station in Ukraine for receiving real-time
EUMETSAT messages from the Satlink2’s installed by
the U.S. Geological Survey as part of a f lood warning
system. ISD received a contract in 2005 from the U.S.
Army Corps of Engineers New England Division to assist
in the installation of dam safety equipment. This project
consists of monitoring 32 dams in the New England region
and should be completed in 2006.
Hydrological Services:
Hydrological Services Division (HSD) net sales and reve-
nues for 2005 were approximately $2,639,000. Net sales
and revenues increased slightly in 2005, but we anticipate
a greater increase in sales and revenues and gross profit
in 2006. HSD was awarded several long-term contracts
in 2005 that continue to solidify our position in providing
water resources engineering and services. Under two
contracts totaling approximately $1,000,000 that were
received from the South Florida Water Management
District’s SCADA Information Management Division, we
will maintain Motorola MOSCAD control and telemetry
systems at 142 sites for three years. HSD was also
awarded two five-year contracts to provide engineering
services in the areas of hydrology and hydraulics, water
chemistry, modeling, and data quality assurance services.
Our HSD staff continues to provide high quality services
and has been recognized by the following customers:
South Florida Water Management District, Leon County
and Environmental Technology Consulting.
Airport Weather Systems:
Net sales and revenues from providing airport weather
systems in 2005 totaled approximately $564,000 with a
gross profit margin of approximately 46%. We delivered
Airpor t Weather Observation Systems (AWOS) to
Colombia and to the Netherlands Antilles in 2005 that
have been installed at seven airports. Ten airports now
have Sutron AWOS systems. In 2006, we anticipate
significant growth and believe that we will be awarded
AWOS systems contracts from India, the Netherlands
Antilles, Venezuela, Columbia, Vietnam and Taiwan.
India Operations:
We opened a branch office in New Delhi, India in 2004.
In 2005, we set up a wholly owned subsidiary in New
Delhi, Sutron HydroMet Systems Private Ltd., in order to
bid on both international and national tenders and in
order to be more cost competitive in India. With the
award of the contracts from the India Meteorological
Department and the Central Water Commission of India,
3
>
we have increased our staff in India to 25 employees and
operate from five offices. The offices are located in New
Delhi, Hyderabad, Jaipur, Burla and Guwahati. In 2005,
we provided eight remote radio telemetry systems and
a digital direct read-out ground station to the Snow
Avalanche Study Establishment (SASE) of India. SASE
now operates approximately 50 Sutron weather stations.
We anticipate additional contracts from SASE in 2006.
We currently have several proposals under evaluation by
government entities in India and we expect several ten-
ders to be released in 2006. We also expect to complete
both the India Meteorological Department and the
Central Water Commission of India contracts in 2006.
Business Strategy:
We will continue to enhance our products, to invest
in the development of new products and to provide
services that meet the needs of our customers in the
hydrologic, meteorologic and oceanic markets. We are
committed to growing sales of airport weather systems
significantly in 2006 and we will continue to take advan-
tage of our dominant position to provide more state-
of-the-art satellite data collection products around the
world. We expect to continue to dominate the tides
and tsunami systems market by providing our systems to
other critical regions in the world. Management will con-
tinue to focus on profitability f irst and growth second.
Our goal is to follow what we have accomplished in 2004
and 2005 and to increase our revenue and profitability
in 2006.
Future:
The future continues to be even brighter for our Company
and our Shareholders. There has never been a time when
the demand for real-time data collection products and
related services has been so great. We anticipate pro-
viding quotations and proposals in 2006 that will exceed
$100 million. We are recognized around the world as
a leader in providing reliable, real-time data collection
systems. Our Satlink2 is cer tif ied to operate on all
geo stationary satellite systems in the world. We expect
HPD to have revenue of $11,000,000 in 2006. We
expect ISD to have revenue of $6,000,000 in 2006.
We expect HSD to have revenue of $3,000,000 in 2006.
We expect to have revenue of $1,000,000 from air-
port weather systems. We expect to have revenue of
$2,000,000 from our India operations. We believe that
our international revenue will grow substantially in 2006
due to significant opportunities in India, China, Venezuela,
Guatemala, Brazil and other countries. We believe that
we will achieve double-digit growth in revenue and
increased profitability in 2006. We are grateful for the
dedication, innovation, and hard work of our employees.
We also thank you, our shareholders, for your continued
support and confidence.
Raul S. McQuiveyChairman, President and Chief Executive Off icer
4
>
>

1
UNITED STATES SECURITIES AND EXCHANGE COMMISSION
Washington, D.C. 20549
FORM 10-KSB
Annual Report Pursuant to Section 13 or 15(d) of the Securities Exchange Act Of 1934 For the fiscal year ended: December 31, 2005
Commission file number: 0-12227
SUTRON CORPORATION (Exact name of registrant as specified in its charter.)
Virginia 54-1006352 (State or other jurisdiction of (I.R.S. Employer incorporation or organization) Identification No.)
21300 Ridgetop Circle, Sterling Virginia 20166 (Address of principal executive offices)
(703) 406-2800
(Registrants telephone number, including area code)
Securities registered under Section 12(g) of the Act: Common Stock, $.01 par value (Title of class)
Check whether the issuer is not required to file reports pursuant to Section 13 or 15(d) for the Exchange Act. Check whether the Registrant (1) has filed all reports required to be filed by Section 13 or 15(d) of the Securities Exchange Act of 1934 during the preceding 12 months (or for such shorter period that the Registrant was required to file such reports), and (2) has been subject to such filing requirements for the past 90 days. Yes No Check if there is no disclosure of delinquent filers in response to Item 405 of Regulation S-B contained in this form, and no disclosure will be contained, to the best of registrants knowledge, in definitive proxy or information statements incorporated by reference in Part III of this Form 10-KSB or any amendments to this Form 10-KSB. Indicate by check mark whether the Registrant is an accelerated filer (as defined in Rule 12b-2 of the Exchange Act). Yes No Indicate by check mark whether the Registrant is a shell company (as defined in Rule 12b-2 of the Exchange Act). Yes No Issuers’ revenues for its most recent fiscal year were $15,434,255. The aggregate market value of the voting and non-voting common equity held by non-affiliates as of March 24, 2006 was approximately $22,821,000 based on the last sale price of such stock. The number of shares outstanding of the issuers Common Stock, $.01 par value, as of March 24, 2006 was 4,295,551.

2
Transitional Small Business Disclosure format (check one): Yes No DOCUMENTS INCORPORATED BY REFERENCE Portions of the registrants’ definitive proxy statement for the 2006 Annual Meeting of Shareholders, which will be filed within 120 days after the end of the year covered by this Form 10-KSB, are incorporated in Part III as set forth herein.

3
SUTRON CORPORATION FORM 10-KSB ANNUAL REPORT
FOR THE YEAR ENDED DECEMBER 31, 2005
TABLE OF CONTENTS Part I Item 1. Description of Business 4 Item 2. Description of Property 9 Item 3. Legal Proceedings 9 Item 4. Submission of Matters to a Vote of Security Holders 9 Part II Item 5. Market for Common Equity and Related Stockholder Matters and Small Business Issuer 9 Purchases of Equity Securities Item 6. Management's Discussion and Analysis of Financial Condition and Results of Operations 10 Item 7. Financial Statements 18 Item 8. Changes in and Disagreements with Accountants on Accounting and Financial Disclosure 34 Item 8A. Controls and Procedures Item 8B. Other Information Part III Item 9. Directors, Executive Officers, Promoters and Control Persons; Compliance with Section 16(a) of 35 the Exchange Act Item 10. Executive Compensation 35 Item 11. Security Ownership of Certain Beneficial Owners and Management and Related Stockholder 35 Matters Item 12. Certain Relationships and Related Transactions 35 Item 13. Exhibits 35 Item 14. Principal Accountant Fees and Services 36
4
PART I
This Form 10-KSB includes forward-looking statements regarding our expected future financial position, results of operations, cash flows, financing plans, business strategy, products and services, competitive positions, growth opportunities, plans and objectives of management for future operations. Statements that include words such as "anticipate," "if," "believe," "plan," "estimate," "expect," "intend," may," “should” and other similar expressions are forward-looking statements. All forward-looking statements involve risks, uncertainties and contingencies which may cause actual results, performance, or achievements to differ materially from anticipated results, performance, or achievements. Factors that may cause actual results to differ materially from those in the forward-looking statements include those discussed under “Management’s Discussion and Analysis of Financial Condition and Results of Operations” and elsewhere in this report. All forward-looking statements speak only to events as of the date on which the statements are made. All subsequent written and oral forward-looking statements attributable to us or any person acting on our behalf are qualified by the cautionary statements in this section. We undertake no obligation to update or publicly release any revisions to forward-looking statements to reflect events, circumstances or changes in expectations after the date on which the statement is made. ITEM 1 - Description of Business Sutron Corporation was incorporated on December 30, 1975 under the General Laws of the Commonwealth of Virginia. Our headquarters is located at 21300 Ridgetop Circle, Sterling, Virginia 20166, and the telephone number at that location is (703) 406-2800. We maintain a worldwide web address at www.sutron.com . The information contained on our website is not incorporated by reference into this Form 10-KSB and shall not be considered a part of this Form 10-KSB. We design, manufacture and market products and solutions that enable government and commercial entities to monitor and collect hydrological, meteorological and oceanic data for the management of critical water resources, for early warning of potentially disastrous floods, storms or tsunamis and for the optimization of hydropower plants. We provide real-time solutions and services to our customers in three areas of the hydrological, meteorological and oceanic markets. First, we provide real-time data collection and control products consisting primarily of dataloggers, satellite transmitters and sensors. Second, we provide turnkey integrated systems for hydrological networks, meteorological networks including airport weather systems and oceanic networks. Third, we provide services consisting of installation, maintenance of hydrological, meteorological and oceanic systems, and other related engineering services. Our customers include a diversified base of federal, state, local and foreign governments, engineering companies, universities, and hydropower companies. Our ongoing, principal strategic business units consist of the HydroMet Products Division, the Integrated Systems Division and the Hydrological Services Division. The Integrated Services Division includes the results of providing airport weather systems, special projects, the Sutron India Branch Office and Sutron HydroMet Systems Private Limited, our wholly owned subsidiary in India. Each unit includes a range of products and services designed to meet the specific needs of a particular customer segment. Our branch office was established in order to comply with India tax laws and the India subsidiary was established in order to gain access to local market. Principal Products and Services HydroMet Products Division The HydroMet Products Division manufactures dataloggers, satellite transmitters/loggers and sensors. Dataloggers collect sensor data and transmit the data to central facilities primarily by satellite radio but also by telephone, fiber optics or microwave. Our sensors support the collection of hydrological and meteorological data and include a tipping bucket rain gauge, a barometric pressure sensor, a temperature sensor, and several water level sensors. Our equipment is compatible with sensors from other companies. We have long-standing relationships with suppliers for wind speed and wind direction, water quality, humidity and solar radiation sensors. The principal products that are manufactured by the HydroMet Products Division are described below.

5
8210 Data Logger The 8210 Data Logger/Transmitter is a simple-to-operate, low-cost data collection platform which supports a wide variety of telemetry applications. The 8210 is environmentally hardened, capable of operating from -40 C to 60 C, making it ideal for remote locations. As a data recorder, the 8210 will store over 65,000 readings in battery-backed memory. The 8210 supports a wide variety of communications, including radio, satellite, and telephone. The Telephone/Voice Synthesis option allows communications over standard telephone circuits using either a synthesized voice message or a modem connected to a computer terminal. Xpert and XLite Dataloggers The Xpert Datalogger/controller is our next generation datalogger. The Xpert is also environmentally hardened and capable of operating from -40 C to 60 C. It is built upon a Microsoft CE operating system, has a 486 microprocessor, C++ programming and standard 2 MB memory that is expandable to over 1 gigabyte. It has enabled the Company to enter closely related environmental markets such as oceanic monitoring and airport weather monitoring. The XLite, a derived product based on the Xpert, does not have a display but is similarly capable. The XLite was released at the end of 2001. SatLink2 In January 2004, the SatLink2 was certified by the National Environmental Satellite, Data and Information Services (NESDIS). The SatLink2 is a redesign of the original SatLink transmitter in order to provide the latest features, to improve functionality and to lower manufacturing costs. The SatLink2 is a high data rate satellite transmitter/logger that transmits at 100, 300 and 1200 baud, incorporates GPS and functions as a logger. The SatLink transmitter was certified by the NESDIS in July 2001 for operation on the Geostationary Operational Environment Satellite (GOES) system. NESDIS operates two U.S. Government environmental satellites on this system. All GOES customers are mandated by NESDIS to purchase high data rate satellite transmitters and to replace all old 100 baud transmitters within a ten-year period beginning in July 2001. NESDIS made this a requirement in order to increase the amount of data that the two GOES satellites can handle. SatLink2 is certified on all major satellite systems around the world and works with virtually all dataloggers. SatLink2 is programmable from any PC or PDA using software provided with the unit. Accubar Gauge Pressure Sensor The Accubar Gauge Pressure sensor is used in water level monitoring systems and is a highly accurate solid state pressure transducer capable of measuring air/dry gas pressures from 0 to 22 psi with a maximum pressure of 35 psi. It is housed in an aluminum case and with its low power consumption and low maintenance requirements, it is ideal for remote monitoring applications. AccuBubble Self-Contained Bubbler System The AccuBubble Self-Contained Bubbler is a mercury-free and nitrogen-free bubbler apparatus designed for low maintenance water level measuring. Using the Sutron Accubar Pressure Sensor as the control and sensing element makes the AccuBubble a very stable and highly accurate water level measuring device. The AccuBubble uses power conservation techniques to minimize current consumption. The bubbler purges the orifice line prior to each measurement. This eliminates the need for a constant bubble rate, which has been known to consume excessive power. In addition, the purging sequence prevents debris build up in the orifice line. The AccuBubble uses an oil-less, non-lubricated piston and cylinder compressor. This type of compressor is designed to give consistent air delivery without the use of a diaphragm which can rupture over time. The AccuBubble uses the SDI-12 communications protocol as the control interface. This allows the unit to be configured by any data loggers supporting the SDI-12 standard. Tides and Ports Systems The National Ocean Survey (NOS), part of the National Oceanic and Atmospheric Administration (NOAA), has the responsibility to accurately measure tide levels around the perimeter of the United States. NOS ensures that

6
measurements are the most accurate possible by using the best water level instruments available. In 2005 and 2004, the HydroMet Products Division provided state-of-the-art tide stations to the National Ocean Survey valued at approximately $2,374,000 and $900,000. Tide stations are based on the Xpert data logger and SatLink2. Xperts run the powerful Windows CE multi-tasking operating system. Sutron has taken advantage of Windows CE to equip each tide station with software that meets and exceeds all of the NOS requirements. In 2004, we enhanced the capabilities of tides systems by adding Storm Surge/Tsumani software. This software provides added capability to tides stations to detect and provide tsunami warnings. Integrated Systems Division The Integrated Systems Division provides system integration services consisting of the design and development of customer-specific hardware configurations and software applications for hydrological and meteorological monitoring and control systems, the sale of our XConnect database systems software, and long-term software support for XConnect users. This capability allows us to provide turnkey hydrological and meteorological systems to a variety of users. Projects may range in size from one station to hundreds of stations. Projects usually require design, equipment integration, software application development and installation and training. Projects can range in duration from several days to twelve months depending on the scope and complexity of the system. Airport weather systems, special projects and the India operations are included in the Integrated Services Division’s results. We have contracted with a seasoned manager with over 20 years experience in the Automatic Weather Observation System (AWOS) market. Typically, an AWOS includes a sensor suite to measure wind direction and speed, temperature, relative humidity, precipitation, and barometric pressure as well as cloud height and horizontal visibility/RVR. Sensors are connected to a Sutron datalogger, which processes the data, stores it in a relational database and transmits real-time weather parameters to all designated users, regardless of location. The system produces weather reports for aviation and meteorological use, virtually automatically and without need of human intervention. Special projects are customer funded projects for the development of specific products or systems. Our India operations consist primarily of selling hydrological and meteorological monitoring systems. Hydrological Services Division The Hydrological Services Division provides hydrologic services including data interpretation and analysis, flow modeling (low flow, rainfall runoff, unsteady flow routing, water surface profiles), field studies (time of travel, diffusion, dispersion, calibration of flow control structures, site location), hydrologic studies (water budget, regression analysis, basin inventory studies), environmental permitting, legal or expert witness and equipment installation and maintenance. Sales and Marketing We market our products and services both domestically and internationally. Domestic sales are conducted by our internal sales staff that consists of five salaried sales personnel who are directly engaged in direct sales activities. The sales staff is assisted by two other employees in marketing and sales support functions. Internationally, we have two employees who cover the world and who work closely with our international sales network that consists of 35 resellers and agents in Canada, Latin and South America, Europe, Africa, Asia and Australia. Competition We compete in the hydrological, meteorological and oceanic monitoring markets and are aware of both domestic and foreign competitors who offer products, systems, and services of their own as well as companies that are systems integrators who primarily offer real-time networks from components manufactured by others. We are aware of numerous firms, ranging in size, that offer competitive dataloggers, high data rate satellite transmitters, sensors and other instruments and software. Several of these companies have financial, research and development, marketing, management and technical resources substantially greater than ours. We may also be at a competitive disadvantage because we purchase certain sensors and other equipment components, as well as computer hardware and peripheral equipment, from manufacturers who are or may become competitors with respect to one or more of our products.
7
With respect to our professional engineering and technical services, we are in competition with numerous diverse engineering and consulting firms, many of which have larger staffs and facilities, and are better known, have greater financial resources, and have more experience. As to hydrological services, we are aware that many firms offer maintenance services; some of these companies have larger staffs, are better equipped, and have greater financial, marketing and management resources. Price, features, product quality, promptness of delivery, customer service and performance are believed to be the primary competitive factors with respect to all of our products and services. Customers During 2005, approximately 44% of our products and services were sold to the Federal Government. Net sales and revenues in 2005 among the various agencies were as follows: Department of the Interior, 22%; Department of Commerce, 16%, Department of Defense, 4% and other agencies of the federal government, 2%. The revenues from the Department of the Interior were among the U.S. Geological Survey and the Bureau of Reclamation. Approximately all revenues with the Department of Commerce were from sales of tides systems to NOS. We also performed on various contracts of foreign origin. Total revenues from foreign customers amounted to approximately 25% of total revenues in 2005, 32% of total revenues in 2004 and 28% in 2003. Research and Development During the three years ended December 31, 2005, 2004, and 2003, we incurred expenses of approximately $1,321,591, $1,018,874 and $1,065,559 respectively, on activities relating to the development of new products and the improvement of existing products. In 2005, our product development focus was on the development of a stage discharge recorder, improvement of the SatLink2 user interface software and continual improvement of our water level sensors. The stage discharge recorder is an ultra-reliable SDI-12 optical encoder fused with logger technology from our state-of-the art SatLink2 transmitter/logger to create an encoder that never forgets due to data being saved in flash memory and uses proven float-tape-counterweight technology. All setup is done from the front panel of the encoder, and download utilities are available for Pocket PC compatible PDAs and Windows laptops. Patents, Trademarks, Copyrights and Agreements Although we do not deem patent protection to be of significant importance to our industry, we have and may in the future seek patents for certain products, real-time networks, and technology as well as software products, real-time networks, and technology. Our software products and innovations may not be patentable but may be subject to automatic but limited copyright protection. We treat our products, real-time networks, technology and software as proprietary and rely on trade secret laws and internal non-disclosure safeguards rather than making our designs and processes generally available to the public by applying for patents. Further, we believe that, because of the rapid pace of technological change in the computer, electronics and telecommunications industries, patent and copyright protection is of less significance than factors such as the knowledge and experience of our personnel and their ability to design and develop enhanced and new products, real-time networks and their components. Manufacturing Our manufacturing operations consist of materials planning and procurement, final assembly, product assurance testing, quality control, and packaging and shipping. We currently use several independent manufacturers to provide certain printed circuit boards, chassis and subassemblies. We believe that the efficiency of our manufacturing process to date is largely due to our product architecture and our commitment to manufacturing process design. We have spent significant engineering resources producing customized software to assure consistent high product quality. Products are tested after the assembly process using internally developed automated product assurance testing procedures.

8
Our products use certain components, such as microprocessors, memory chips and pre-formed enclosures that are acquired or available from one or a limited number of sources. We have generally been able to procure adequate supplies of these components in a timely manner from existing sources. While most components are standard items, certain application-specific integrated circuit chips used in many of our products are customized to our specifications. None of the suppliers of components operate under contract. Additionally, availability of some standard components may be affected by market shortages and allocations. Our inability to obtain a sufficient quantity of components when required or to develop alternative sources at acceptable prices and within a reasonable time could result in delays or reductions in product shipments which could materially affect our operating results in any given period. In addition, as referenced above, we rely heavily on outsourcing subcontractors for production. The inability of such subcontractors to deliver products in a timely fashion or in accordance with our quality standards could materially affect our operating results and business. We received an ISO 9001 certification on March 12, 1999 and an ISO 9001:2000 certification on August 13, 2003. We continued to be certified during fiscal year 2005. Government Regulation We manufacture some of our products and provide some of our services under contracts with the United States government. We manufacture other products under contracts with private third parties who utilize our products to satisfy United States government contracts to which they are a party. Federal acquisition regulations and other federal regulations govern these relationships. Some of these regulations relate specifically to the seller-purchaser relationship with the government (which may exist on our own account, or that of one or more of our clients), such as the bidding and pricing rules. Under regulations of this type, we must observe pricing restrictions, produce and maintain detailed accounting data, and meet various other requirements. Other regulations relate to the conduct of our business generally, such as regulations and standards established by the Occupational Safety and Health Act or similar state laws and relating to employee health and safety. In particular, regulations governing these contracts require that we comply with federal laws and regulations, in general, or face civil liability, cancellation or suspension of existing contracts, or ineligibility for future contracts or subcontracts funded in whole or in part with federal funds. In addition, loss of governmental certification (affirming that we are eligible to participate on government contracted work) could cause some of our customers to reduce or cease making purchases from us, which would adversely impact our business. Foreign Operations We opened a branch office in New Delhi, India in December 2004. The branch office was established in order to comply with India tax law. The Advance Tax Court of India determined that we had a Permanent Establishment in India as a result of the employment of a full-time Country Manager. The branch office can perform sales and marketing and installation and maintenance activities but is restricted from bidding on domestic Indian tenders. We began the process of forming a wholly owned subsidiary in India in 2004 in order to bid on domestic India tenders. Formal approval of the wholly owned subsidiary was given in February 2005. Employees As of December 31, 2005, we and our wholly owned subsidiary had a total of 71 employees, of which 70 were full time. We also from time to time employ part-time employees and hires independent contractors. Our employees are not represented by any collective bargaining agreement and we have never experienced a work stoppage. We believe that our employee relations are good. Backlog At December 31, 2005, our backlog was $10,839,778 as compared with $5,620,968 at December 31, 2004. We anticipate that 72% of our 2005 year-end backlog will be shipped in 2006.
9
Item 2 - Properties Our corporate headquarters are located at 21300 Ridgetop Circle, Sterling, Virginia. We lease this 17,000 square foot facility and it contains our administrative offices, sales and marketing offices and manufacturing facilities. The lease expires in March 2009. We lease an additional 7,000 square feet of space in Sterling, Virginia for our Research and Development group and Integrated Services Division. The lease for this facility expires in March 2009 as well. We lease 5300 square feet of office and warehouse space in West Palm Beach, Florida. The four-year lease expires in August 2008. The Hydrological Services division uses this space which consists of both office and warehouse space. The Hydrological Services Division also occupies 1500 square feet of leased office space in Brandon, Florida. The lease expires in December 2008. This space is used for sales and marketing and engineering offices. We entered into a lease agreement for approximately 1800 square feet of office space in New Delhi, India in September 2004. The lease is month to month. The India branch office and wholly owned subsidiary use this space for offices. We believe that our facilities are adequate for our present needs and that our properties are in good condition, well maintained and adequately insured. Item 3 - Legal Proceedings Various legal claims can arise from time to time in the normal course of business which, in the opinion of management, will have no material effect on our financial statements. We have been named in a compensation claim under the Indian Anti-Trust Law that is pending before The Monopolies and Restrictive Trade Practices Commission in New Delhi, India. Management believes that the case is unsubstantiated and intends to vigorously defend itself. Item 4 - Submission Of Matters To A Vote Of Security Holders No matter was submitted to a vote of security holders in the fourth quarter of 2005.
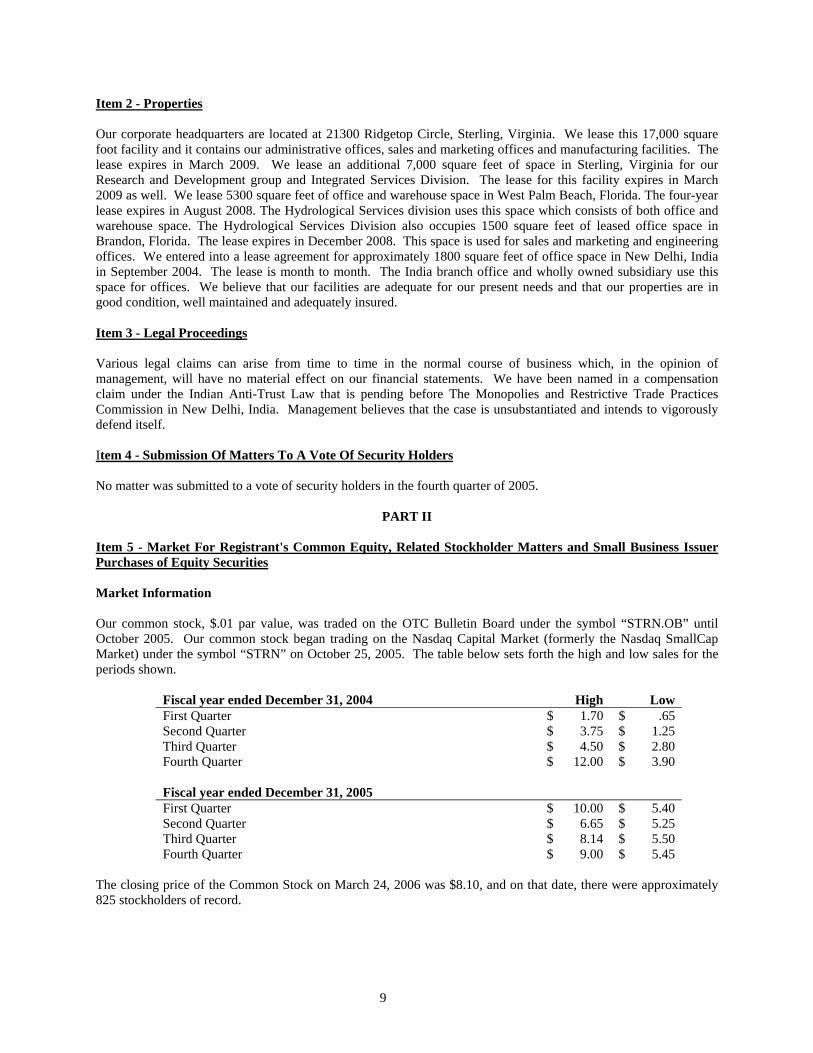
PART II Item 5 - Market For Registrant's Common Equity, Related Stockholder Matters and Small Business Issuer Purchases of Equity Securities Market Information Our common stock, $.01 par value, was traded on the OTC Bulletin Board under the symbol “STRN.OB” until October 2005. Our common stock began trading on the Nasdaq Capital Market (formerly the Nasdaq SmallCap Market) under the symbol “STRN” on October 25, 2005. The table below sets forth the high and low sales for the periods shown.
Fiscal year ended December 31, 2004 High Low First Quarter $ 1.70 $ .65 Second Quarter $ 3.75 $ 1.25 Third Quarter $ 4.50 $ 2.80 Fourth Quarter $ 12.00 $ 3.90 Fiscal year ended December 31, 2005 First Quarter $ 10.00 $ 5.40 Second Quarter $ 6.65 $ 5.25 Third Quarter $ 8.14 $ 5.50 Fourth Quarter $ 9.00 $ 5.45
The closing price of the Common Stock on March 24, 2006 was $8.10, and on that date, there were approximately 825 stockholders of record.

10
Dividends We have never declared or paid a dividend on our common stock. We intend to retain future earnings to fund development and growth of our business. Recent Sales of Unregistered Securities There were no issuances of unregistered securities in fiscal 2005 that have not been reported previously in a quarterly report on Form 10-QSB or a current report on Form 8-K. Issuer Purchases of Equity Securities No purchases of Sutron equity securities were made by or on behalf of Sutron in the fourth quarter of our fiscal year ended December 31, 2005.
Equity Compensation Plan Information
The following table summarizes the securities authorized for issuance under equity compensation plans as of December 31, 2005:
Number of Securities to be
Issued Upon Exercise of
Outstanding Options, Warrants
and rights
Weighted Average
Exercise Price of Outstanding
Options, Warrants and
Rights
Number of Securities Remaining
Available for Future Issuance
Equity compensation plans approved by stockholders - - -
Equity compensation plans not approved by stockholders 739,333 $.98 225,667
Total 739,333 $.98 225,667 Item 6 - Management's Discussion And Analysis Of Financial Condition And Results Of Operations The following discussion contains forward-looking statements, which reflect the current views of the Company with respect to future events that could have an effect on its future financial performance. These statements may include such words as "expects," "believes," "estimates," and similar expressions. These forward-looking statements are subject to various risks and uncertainties that could cause actual results to differ materially from historical results or those currently anticipated. Readers are cautioned not to place undue reliance on these forward-looking statements. Background and Overview Our primary focus is to provide real-time systems solutions, including equipment and software, and services to our customers in the areas of hydrological monitoring and control, meteorological monitoring including airport weather systems, oceanic monitoring and control systems and hydrological services. We design, manufacture and market these products and services to a diversified customer base consisting of federal, state, local and foreign governments, engineering companies, universities, and hydropower companies. Our products and services enable these entities to monitor and collect hydrological, meteorological and oceanic data for the management of critical water resources, for early warning of potentially disastrous floods, storms or tsunamis, for the optimization of hydropower plants and for providing real-time weather conditions at airports. Our key products are our SatLink2 Transmitter/Logger, our Xpert and XLite dataloggers, our water level sensors and our XConnect systems software. These are the essential components of most systems and are provided to customers as off-the-shelf equipment or as part of a custom system. The SatLink2 is a key product because it functions both as a transmitter and also as a datalogger. It is an excellent solution for small systems that do not

11
require a significant number of sensors or communications options. The Xpert and XLite are more powerful dataloggers that have significant more logging capability and communications options than the SatLink2. Net sale and revenues from hydrological services has grown steadily since the establishment of our Hydrological Services Division in 2001. The principal customer of this division has been the South Florida Water Management District (SFWMD) which is a regional agency of the state of Florida that is charged with managing and protecting water resources in a 16 county area. We provide a variety of services to SFWMD as well as other entities including flood and stormwater management, river and stream analysis, equipment installation and maintenance and modeling. We are committed in our ongoing sales, marketing and research and development activities to sustain and grow our sales and revenues from our products and services. In 2006, we expect to derive a significant amount of our revenues from systems to be installed in India that were awarded late in 2005 and we are committed to expanding our airport weather systems and our hydrological services. We are beginning fiscal year 2006 with a significantly higher backlog of $10,839,778 as compared to beginning fiscal year 2005 with a backlog of $5,620,968 that is primarily due to the India awards. We anticipate moderate growth in net sales and revenues in 2006 due to increased concern over the management of vital water resources and increased governmental efforts to provide earlier warnings of flooding, storms and tsunamis. In 2006, we anticipate that we will continue to experience significant quarterly fluctuations in our net sales and revenues. Operating results will depend upon the product mix and upon the timing of project awards. Export sales, which totaled 25% of net sales and revenues for 2005, constitute a significant portion of our net sales and revenues but are difficult to project. We expect our sales and marketing, research and development and general and administrative expenses to increase moderately in 2006 as compared to 2005. Critical Accounting Policies and Estimates The discussion and analysis of financial condition and results of operations is based upon the consolidated financial statements, which have been prepared in accordance with accounting principles generally accepted in the United States. The preparation of these financial statements requires us to make estimates and judgments that affect the reported amounts of assets, liabilities, revenues and expenses, and related disclosure of contingent assets and liabilities. We evaluate, on an on-going basis, our estimates and judgments, including those related to bad debts, excess and obsolete inventories, warranty obligations, income taxes, contingencies and litigation. Our estimates are based on historical experience and assumptions that we believe to be reasonable under the circumstances, the results of which form the basis for making judgments about the carrying values of assets and liabilities that are not readily apparent from other sources. Actual results may differ from these estimates under different assumptions or conditions.
We believe the following critical accounting policies, among others, affect its more significant judgments and estimates used in the preparation of its consolidated financial statements.
• Revenue recognition; • Allowance for doubtful accounts; • Allowances for excess and obsolete inventories; • Accounting for warranty obligations; • Accounting for income taxes; • Accounting and valuation of stock option compensation.
Revenue Recognition - Our revenue recognition policy is consistent with the requirements of Staff Accounting Bulletin No. 101 (SAB 101), “Revenue Recognition in Financial Statements,” Statement of Position No. 97-2 (SOP 97-2), “Software Revenue Recognition,” and other applicable revenue recognition guidance and interpretations. In general, we record revenue when it is realized, or realizable, and earned. We consider these requirements met when persuasive evidence of an arrangement exists, the products or services have been provided to the customer, the sales price is fixed or determinable and collectibility is reasonably assured. Our revenue reflects reductions attributable to discounts and customer returns.
12
For our products, consisting of both equipment and software, revenue is recognized upon shipment, delivery, installation or customer acceptance of the product, as agreed in the customer order or contract. We do sell our software products without the related equipment although software products are integral to systems. Our typical system requires no significant production, modification or customization of the software or hardware. For complex systems, revenue is deferred until customer acceptance. We do provide customer discounts and do allow for product returns. We do not do consignment sales or bill and hold. Revenue reflects reductions due to discounts and product returns. Product returns have historically been insignificant in amount. Our sales arrangements for systems often include services in addition to equipment and software. These services could include equipment integration, software customization, installation, maintenance, training, and customer support. For sales arrangements that include bundled hardware, software and services, we account for any undelivered service offering as a separate element of a multiple-element arrangement. Amounts allocated to each element are based on its objectively determined fair value, such as the sales price for the product or service when it is sold separately. Revenue for these services is typically recognized ratably over the period benefited or when the services are complete. We use the percentage of completion method for recognizing revenue and profits when we perform on fixed price contracts that extend over a number of years. Under the percentage of completion method, revenue and profits are recorded as costs are incurred based on estimates of total sales value and costs at completion where total profit can be estimated with reasonable accuracy and ultimate realization is reasonably assured. Profit estimates are revised periodically based upon changes and facts, and any losses on contracts are recognized immediately. Contracts may contain provisions to earn incentive and award fees if targets are achieved. Incentive and award fees that can be reasonably estimated are recorded over the performance period of the contract. Incentive and award fees that cannot be reasonably estimated are recorded when awarded. We recognize revenue from time-and-materials contracts to the extent of billable rates, times hours delivered, plus direct materials costs incurred. Some of the contracts include provisions to withhold a portion of the contract value as retainage. Our policy is to take into revenue the full value of the contract, including any retainage, as we perform against the contract.
Allowance for Doubtful Accounts - Accounts receivable arise from the normal course of selling products on credit to customers. An allowance for doubtful accounts has been provided for estimated uncollectable accounts. Accounts receivable balances, historical bad debts, customer concentrations, customer creditworthiness, current economic trends and changes in customer payment terms and practices are analyzed when evaluating the adequacy of the allowance for doubtful accounts. Individual accounts are charged against the allowance when collection efforts have been exhausted.
Inventory Valuation - Our inventories are stated at the lower of cost or market. We provide allowances on inventories for any material that has become obsolete or may become unsaleable based on estimates of future demand and sale price in the market. Judgments with respect to saleability and usage of inventories, estimated market value, and recoverability upon sale are complex and subjective. Such assumptions are reviewed periodically and adjustments are made, as necessary, to reflect changed conditions.
Warranty Obligations - We warranty our products for up to two years and estimated warranty costs are based upon management’s best estimate of the amounts necessary to settle future and existing claims on equipment sold as of the balance sheet date. Factors considered include actual past experience of product returns and the related estimated cost of labor and material to make the necessary repairs as well as technological advances and enhanced design and manufacturing processes. If actual future product return rates or the actual costs of material and labor differ from the estimates, adjustments to the accrued warranty liability are made.
Income Taxes – We are taxed as a domestic U.S. corporation under the Internal Revenue Code. Deferred income tax assets and liabilities are recognized for the expected future tax consequences of events that have been included in the consolidated financial statements or tax returns. Deferred income tax assets and liabilities are determined based on the differences between the financial statement and tax basis of assets and liabilities using currently enacted tax rates in effect for the years in which the differences are expected to reverse. Deferred tax assets are evaluated and a valuation allowance is established if it is more likely than not that all or a portion of the tax asset will not be utilized.

13
Stock Option Compensation – We account for our stock-based employee compensation plan in accordance with the provisions of Accounting Principles Board Opinion No. 25, “Accounting for Stock Issued to Employees,” whereby the difference between the exercise price and the fair market value on the date of grant is recognized as compensation expense. Under the intrinsic value method of accounting, no compensation expense is recognized in our consolidated statement of operations when the exercise price of the employee/director stock option and warrant grants equals the market price of the underlying common stock on the date of grant, and the measurement date of the option or warrant grant is certain. The measurement date is certain when the date of grant is fixed and determinable. Compensation cost for employee/director stock options and warrants is measured as the excess, if any, of the quoted market price of our stock at the date of grant over the amount that the employee/director is required to pay for the stock. Options and warrants to non-employees are accounted for as required by Statement of Financial Accounting Standards (SFAS) No. 123, “Accounting for Stock-Based Compensation.” This Statement, for small business issuers is effective as of the beginning of the Company's next fiscal year. Accordingly, we will adopt SFAS 123(R) in the first quarter of fiscal 2006. We expect it to have a material impact on our financial statements during the fiscal year 2006 and thereafter.
Results of Operations
The following table sets forth, for the periods presented, certain income statement data of the Company expressed as a percentage of revenues: Year Ended December 31,
2005 2004 2003 Net sales and revenues
100.0%
100.0%
100.0%
Cost of sales and revenues 59.1 61.5 69.5 Gross profit 40.9 38.5 30.5 Selling, general and administrative expenses 18.1 14.4 20.1 Research and Development expenses 8.5 6.1 9.7 Operating income 14.3 18.0 .7 Interest (income) expense (.1) .1 .3 Income before income taxes 14.4 17.9 .4 Income taxes (benefit) 4.9 6.5 (.5) Net income 9.5% 11.4% .9%
Fiscal 2005 Compared to Fiscal 2004 Net Sales and Revenues Our net sales and revenues for 2005 decreased 7.5% to $15.4 million from $16.7 million in 2004, primarily as a result of a decrease in export sales of standard products in our HydroMet Products Division. Our revenues are broken down between our principal operating divisions or profit centers which include the HydroMet Products Division, the Integrated Services Division, which includes special projects, airport weather systems and our India operations, and the Hydrological Services Division. The HydroMet Products Division, which is responsible for sales of standard products, had a revenue decrease of 12.9% to $9.3 million from $10.7 million in 2004. In 2004, we shipped approximately $2.4 million of dataloggers and sensors to a Canadian consortium for a flood warning project in Poland. We also shipped approximately $1.3 million FMQ-13(v)2 Wind Sensor systems to Hanscom Air Force Base. The decrease in project shipments was partially offset by increased shipments of NOS tides systems. Integrated Systems revenues decreased 3.9% to $3.5 million from $3.6 million in 2004 due to a decrease in project deliveries. Revenues from the Hydrological Services Division increased to $2.6 million from $2.4 million in 2004 due to increased activity in Florida.
14
Domestic net sales and revenues increased in 2005 to $11.6 million from $11.3 million in 2004, an increase of 2.6%. Net sales and revenues from standard products increased to $7.5 million in 2005 from $6.96 million in 2004. This increase was primarily due to increased sales of NOS tides systems which increased to approximately $2.4 million from approximately $900,000 in 2004 and increased sales of SatLink2 transmitters/loggers. These increases offset decreased revenues from deliveries of FMQ-13(v)2 Wind Sensor systems to Hanscom Air Force Base in 2004 that totaled approximately $1.3 million. Net sales and revenues from Integrated Systems decreased to $1.45 million compared to $1.95 million in 2004 primarily due to decreased project activity. Net sales and revenues from hydrological services increased to $2.6 million from $2.4 million in 2004 due to the expansion of operations in Florida. International net sales and revenues decreased 29% to $3.8 million in 2005 from $5.4 million in 2004. Net sales and revenues from standard products decreased to $1.8 million from $3.7 million in 2004 due to decreased project shipments. In 2004, we shipped approximately $2.4 million of dataloggers and sensors to a Canadian consortium for a flood warning project in Poland. This was a significant project but was partially offset in 2005 by revenues from new international project shipments. Net sales and revenues from Integrated Systems increased to $2.0 million from $1.7 million due primarily to increased revenues from projects and operations in India. We were awarded two contracts from customers in India in the fourth quarter of 2005 that totaled approximately $6,067,600. We had projected receiving both awards earlier in 2005 which, if that had occurred, would have improved the 2005 twelve month operating results. The timing of both contract awards, however, was in late 2005 and we expect 2006 results to benefit from the increased backlog. Our largest customer in each of years 2005 and 2004 was the Department of the Interior, the principal agencies being the US Geological Survey and the Bureau of Reclamation, which accounted for 22% and 20% of revenues, respectively. Non-federal government, commercial and international revenues represented 56% of revenues in 2005 and in 2004. Cost of Sales and Revenues Cost of sales as a percentage of revenues was 59.1% for 2005 as compared to 61.5% for 2004. The decrease in cost of sales reflects improvements in manufacturing efficiencies as well as changes in the product mix. In 2005, we had a full year of sales of the SatLink2 transmitter/logger as compared to approximately seven months of sales in 2004. SatLink was redesigned to add features and reduce costs and the SatLink2, its replacement, was certified by NESDIS in January 2004. The SatLink2 has significantly reduced material costs, subcontract assembly costs and final assembly and testing labor costs. The increase in sales of NOS tides systems also contributed to reduce cost of sales as we was able to purchase materials in greater quantities and improve labor efficiency via larger production runs. Cost of sales for both 2005 and 2004 include provisions for inventory obsolescence, physical inventory adjustments and inventory valuation adjustments. We continually pursues product cost reductions through continual review of procurement sourcing based on quality and cost goals, product value engineering and improvements in manufacturing processes. Selling, General and Administrative Expenses Selling, general and administrative expenses were $2.8 million in 2005 as compared with $2.4 million in 2004. Selling, general and administrative expenses as a percentage of revenues increased to 18.1% in 2005 from 14.4% in 2004. The increase was due primarily to increased costs associated with sales and marketing efforts of our India operations, increased legal costs associated with compliance requirements, increased insurance costs for directors and officers’ coverage and increased stock exchange fees associated with our listing on the Nasdaq Capital Market. Research and Development Expenses Research and development expenses increased 30% to $1.3 million in 2005 from $1 million in 2004. Research and development expenses as a percentage of revenues decreased to 8.6% in 2005 from 6.1% in 2004. In 2004, engineers worked directly on certain contracts including the Hanscom Air Force Base AN-FMQ-13(V)2 Wind Sensor System resulting in significant engineering costs being included in cost of sales.
15
In 2005, our product development focus was on the development of a stage discharge recorder, improvement of the SatLink2 user interface software and continual improvement of our water level sensors. The stage discharge recorder is an ultra-reliable SDI-12 optical encoder fused with logger technology from our state-of-the art SatLink2 transmitter/logger to create an encoder that never forgets due to data being saved in flash memory and uses proven float-tape-counterweight technology. All setup is done from the front panel of the encoder, and download utilities are available for Pocket PC compatible PDAs and Windows laptops. Interest Income and Expense, Net We earned net interest income of $22,708 in 2005 as compared with net interest expenses of $30,411 in 2004. Lower levels of debt combined with higher cash and cash equivalent balances were responsible for the net interest income. Income Taxes Income tax expense for 2005 was $755,000 compared to $1,078,000 for 2004. The provision for income taxes for 2005 represents an effective tax rate of approximately 34% compared with 36% for 2004. The decrease is primarily due to an increase in research and development and manufacturer tax credits that offset income taxes. Fiscal 2004 Compared to Fiscal 2003 Net Sales and Revenues Our net sales and revenues for 2004 increased 51% to $16.7 million from $11 million in 2003. Domestic net sales and revenues increased in 2004 to $11.3 million from $7.9 million in 2003, an increase of 42%. Standard products sales increased to $6.96 million in 2004 from $5.65 million in 2003. Net sales and revenues from integrated systems increased significantly to $1.95 million compared to $1.3 million in 2003 primarily due to increased software services projects and engineering services provided to Hanscom Air Force Base to develop the AN-FMQ-13(v)2 wind sensor system. Net sales and revenues for hydrological services increased to $2.36 million from $1 million in 2003 due to the expansion of operations in Florida. International net sales and revenues increased 74% to $5.4 million in 2004 from $3.1 million in 2003. Standard products net sales and revenues increased to $3.73 million from $944,000 in 2003 due to our providing dataloggers, sensors and other equipment totaling $2.4 million to a Canadian consortium for a flow monitoring and flood warning system in Poland. Net sales and revenues from integrated systems decreased to $1.7 million from $2.0 million due to fewer international systems projects. Our largest customer in each of years 2004 and 2003 was the Department of the Interior, the principal agencies being the US Geological Survey and the Bureau of Reclamation, which accounted for 20% and 28% of revenues, respectively. Non-federal government, commercial and international revenues represented 56% of revenues in 2003 versus 55% in 2002. Cost of Sales and Revenues Cost of sales as a percentage of revenues was 61.5% for 2004 as compared to 69.5% for 2003. Cost of sales decreased in 2004 due to the increase in revenues and due to improvements in the design and manufacturability of the SatLink2 Satellite Transmitter/Logger. We certified the Satlink2 in January 2004 and began shipping units in May 2004. The SatLink2 was designed to have fewer parts, improved manufacturability and improved features compared to the SatLink. We also benefited from large project awards with Hanscom Air Force Base and a Canadian consortium for a flow monitoring and flood warning system in Poland. Both contracts required significant quantities that allowed us to obtain supplier pricing discounts that greatly improved margins. Our gross margin is dependent on product volumes, product mix, overhead expenses and projects that vary in terms of size, complexity and pricing competitiveness. All of these factors fluctuate from year to year.

16
Selling, General and Administrative Expenses Selling, general and administrative expenses were $2.4 million in 2004 as compared with $2.2 million in 2003. Selling, general and administrative expenses as a percentage of revenues decreased to 14.4 in 2004 from 20.1% in 2003 due to the increase in revenues. Research and Development Expenses Research and development expenses decreased 4% to $1.02 million in 2004 from $1.06 million in 2003. Research and development expenses as a percentage of revenues decreased to 6.1% in 2004 from 9.7% in 2003. In 2004, engineers worked directly on certain contracts including the Hanscom Air Force Base AN-FMQ-13(V)2 Wind Sensor System resulting in engineering costs being included in cost of sales. In 2004, our product development focus was on continual improvement of the SatLink2 and other core products. We certified the SatLink2 to operate on Chinas environmental satellite, FY-2C. We expect China to be a significant market. We also worked towards certification of a 40 Watt SatLink2 Satellite Transmitter/Logger that can be installed on existing and new ocean system buoys to send ocean and weather parameters including tsunami warnings through the global geostationary satellite systems in near real-time. Certification of the 40-Watt SatLink2 Satellite Transmitter/Logger was received from NESDIS in March 2005. We also continued its development efforts in 2004 relating to tides monitoring systems by adding Storm Surge/Tsunami software. Tides systems are based on the Xpert datalogger and the SatLink2 transmitter. We received orders for tides systems totaling $900,000 in 2004 and $676,000 in 2003. Interest Expense, Net Other income and expenses consisted of interest expenses of $30,411 in 2004 and $29,778 in 2003. Income Taxes Income tax expense for 2004 was $1,078,000 compared to an income tax benefit of $52,000 for 2003. The provision for income taxes for 2004 represents an effective tax rate of approximately 36%. The increase is primarily due to our increased profitability. Liquidity and Capital Resources Cash and cash equivalents was $1,861,627 at December 31, 2005 compared to $1,419,171 at December 31, 2004. Working capital increased to $6.84 million at December 31, 2005 compared with $5.35 million at December 31, 2004. The increase resulted from the earnings in 2005. Net cash provided by operating activities was $840,634 for the year ended December 31, 2005 as compared to cash provided by operating activities of $2,133,859 for the year ended December 31, 2004 and cash used by operations of $526,355 for the year ended December 31, 2003. The decrease was due to lower net income, to an increase in deferred taxes and to a decrease in accrued expenses. Net cash provided by investing activities was $47,034 for the year ended December 31, 2005, compared to cash used by investing activities of $322,277 and $434,437 for the years ended December 31, 2004 and 2003. The increase in 2005 resulted from an increase in restricted cash, which is cash used for bid securities, that was offset primarily by purchases of property and equipment. The decreases in 2004 and 2003 were due primarily due to purchases of property and equipment. Net cash used by financing activities was $53,370 for the year ended December 31, 2005 due primarily to payments on term notes. Net cash used by financing activities was $893,740 for the year ended December 31, 2004 due to payments on the line of credit and on shareholder and term notes. Net cash provided by financing activities was $670,210 for the year ended December 31, 2003 due to proceeds from the line of credit, term notes and shareholder notes.
17
We have a revolving credit facility of $2,000,000 with BB&T Bank. We are permitted to borrow based on accounts receivable and inventory according to pre-established criteria. The credit facility expires on August 5, 2006 and is secured by substantially all assets of the Company. Borrowings bear interest at the bank’s prime rate plus one-half. During 2005, there were no borrowings on the line of credit. We frequently bid on and enter into international contracts that require bid and performance bonds. At December 31, 2005 and 2004, a commercial bank had issued standby letters of credit in the amount of $751,725 and $186,354 that served as either bid or performance bonds. The amount available to borrow under the line of credit was reduced by these amounts.
Management believes that its existing cash resources, cash flow from operations and short-term borrowings on the existing credit line will provide adequate resources for supporting operations during fiscal 2006. Although there can be no assurance that our revolving credit facility will be renewed, management believes that, if needed, it would be able to find alternative sources of funds on commercially acceptable terms. Recent Accounting Pronouncements In December 2004, the FASB issued SFAS No. 123(R), Share-Based Payment. This statement revises FASB Statement No. 123, Accounting for Stock-Based Compensation and supersedes APB Opinion No. 25, Accounting for Stock Issued to Employees. SFAS No. 123(R) focuses primarily on the accounting for transactions in which an entity obtains employee services in share-based payment transactions. SFAS No. 123(R) requires companies to recognize in the statement of operations the cost of employee services received in exchange for awards of equity instruments based on the grant-date fair value of those awards (with limited exceptions). This Statement, for small business issuers is effective as of the beginning of our next fiscal year. Accordingly, we will adopt SFAS 123(R) in its first quarter of fiscal 2006. The impact of this new standard, if it had been in effect, on the net income and related per share amounts for the year ended December 31, 2005 is disclosed in Note 1 – Stock Based Compensation. It is expected to have a material impact on our financial statements during the fiscal year 2006 and thereafter. In May 2005, the FASB issued SFAS 154, Accounting Changes and Error Corrections. This new standard replaces APB Opinion 20, Accounting Changes and SFAS 3, Reporting Accounting Changes in Interim Financial Statements. Among other changes, SFAS 154 requires that a voluntary change in accounting principle be applied retrospectively with all prior period financial statements presented on the new accounting principle, unless it is impracticable to do so. SFAS 154 also provides that a change in method of depreciating or amortizing a long-lived non-financial asset be accounted for as a change in estimate (prospectively) that was effected by a change in accounting principle, and that corrections of previously issued financial statements should be termed a restatement. The new standard is effective for accounting changes and corrections of errors made in fiscal years beginning after December 15, 2005. Adoption of this standard is not expected to have a material impact on our financial position or results of operations.
18
Item 7 - Financial Statements
SUTRON CORPORTION
INDEX TO CONSOLIDATED FINANCIAL STATEMENTS Report of Independent Registered Public Accounting Firm 19 Consolidated Balance Sheets at December 31, 2005 and 2004 20 Consolidated Statements of Operations for the Years ended December 31, 2005, 2004 and 2003 21 Consolidated Statements of Changes in Stockholders' Equity for the Years ended December 31, 2005, 2004 and 2003 22 Consolidated Statements of Cash Flows for the Years ended December 31, 2005, 2004 and 2003 23 Notes to Consolidated Financial Statements 24
19
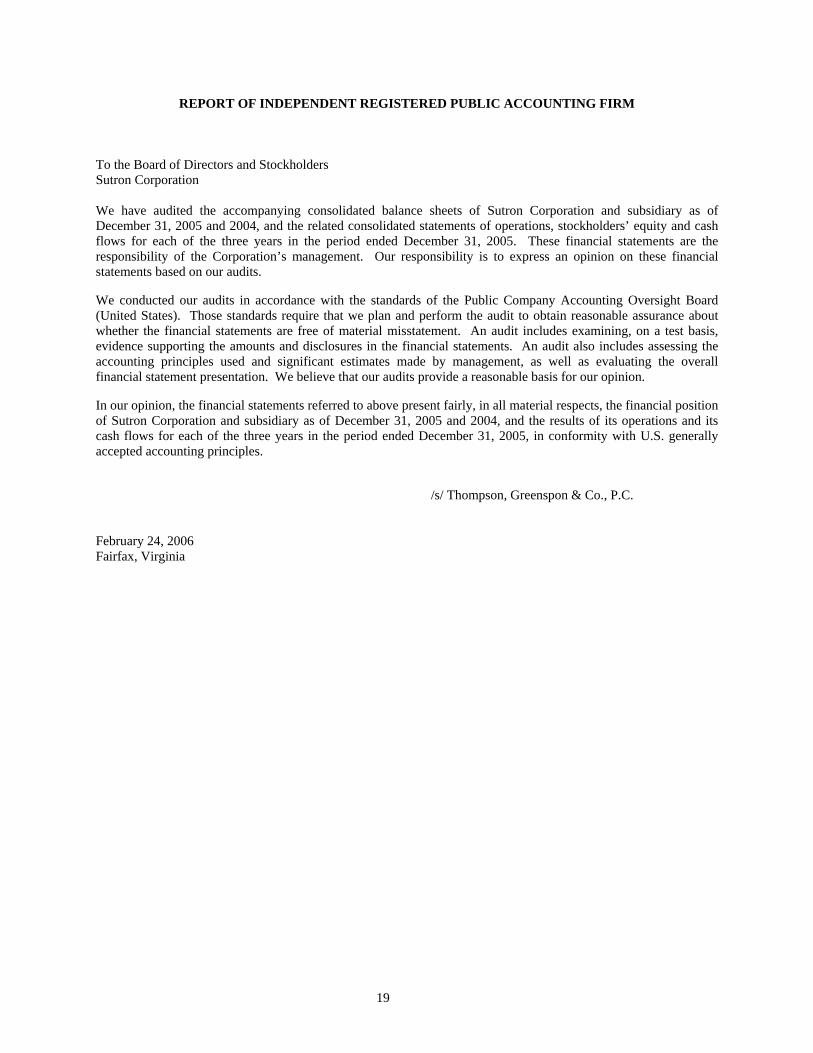
REPORT OF INDEPENDENT REGISTERED PUBLIC ACCOUNTING FIRM To the Board of Directors and Stockholders Sutron Corporation We have audited the accompanying consolidated balance sheets of Sutron Corporation and subsidiary as of December 31, 2005 and 2004, and the related consolidated statements of operations, stockholders’ equity and cash flows for each of the three years in the period ended December 31, 2005. These financial statements are the responsibility of the Corporation’s management. Our responsibility is to express an opinion on these financial statements based on our audits.
We conducted our audits in accordance with the standards of the Public Company Accounting Oversight Board (United States). Those standards require that we plan and perform the audit to obtain reasonable assurance about whether the financial statements are free of material misstatement. An audit includes examining, on a test basis, evidence supporting the amounts and disclosures in the financial statements. An audit also includes assessing the accounting principles used and significant estimates made by management, as well as evaluating the overall financial statement presentation. We believe that our audits provide a reasonable basis for our opinion.
In our opinion, the financial statements referred to above present fairly, in all material respects, the financial position of Sutron Corporation and subsidiary as of December 31, 2005 and 2004, and the results of its operations and its cash flows for each of the three years in the period ended December 31, 2005, in conformity with U.S. generally accepted accounting principles.
/s/ Thompson, Greenspon & Co., P.C.
February 24, 2006 Fairfax, Virginia

20
SUTRON CORPORATION AND SUBSIDIARY CONSOLIDATED BALANCE SHEETS
December 31, 2005
December 31, 2004
ASSETS Current Assets: Cash and cash equivalents $ 1,861,627 $ 1,033,149 Restricted cash and cash equivalents 233,375 386,022 Accounts receivable 3,711,426 3,755,439 Inventory 2,532,524 2,371,476 Prepaid items and other assets 493,947 270,014 Deferred income taxes 278,000 179,000 Total current assets 9,110,899 7,995,100 Property and Equipment, at Cost 3,222,086 3,038,168 Less: Accumulated depreciation and amortization (2,534,854) (2,328,496) Property and equipment, net 687,232 709,672 Other Assets 48,623 51,133 Total Assets $ 9,846,754 $ 8,755,905 LIABILITIES AND STOCKHOLDERS’ EQUITY Current Liabilities: Accounts payable $ 844,511 $ 943,616 Accrued payroll 195,153 272,601 Other accrued expenses 1,179,925 1,400,779 Notes payable – current 47,663 25,613 Total current liabilities 2,267,252 2,642,609 Long-Term Liabilities Notes payable, net of current maturities 88,773 89,666 Deferred income taxes 169,000 172,000 Total Liabilities 2,525,025 2,904,275 Stockholders’ Equity Common stock 42,946 42,896 Additional paid-in capital 2,312,230 2,306,655 Retained earnings 4,968,224 3,497,930 Accumulated other comprehensive (loss) income (1,671) 4,149 Total Stockholders’ Equity 7,321,729 5,851,630 Total Liabilities and Stockholders’ Equity $ 9,846,754 $ 8,755,905
See accompanying notes to consolidated financial statements.
21
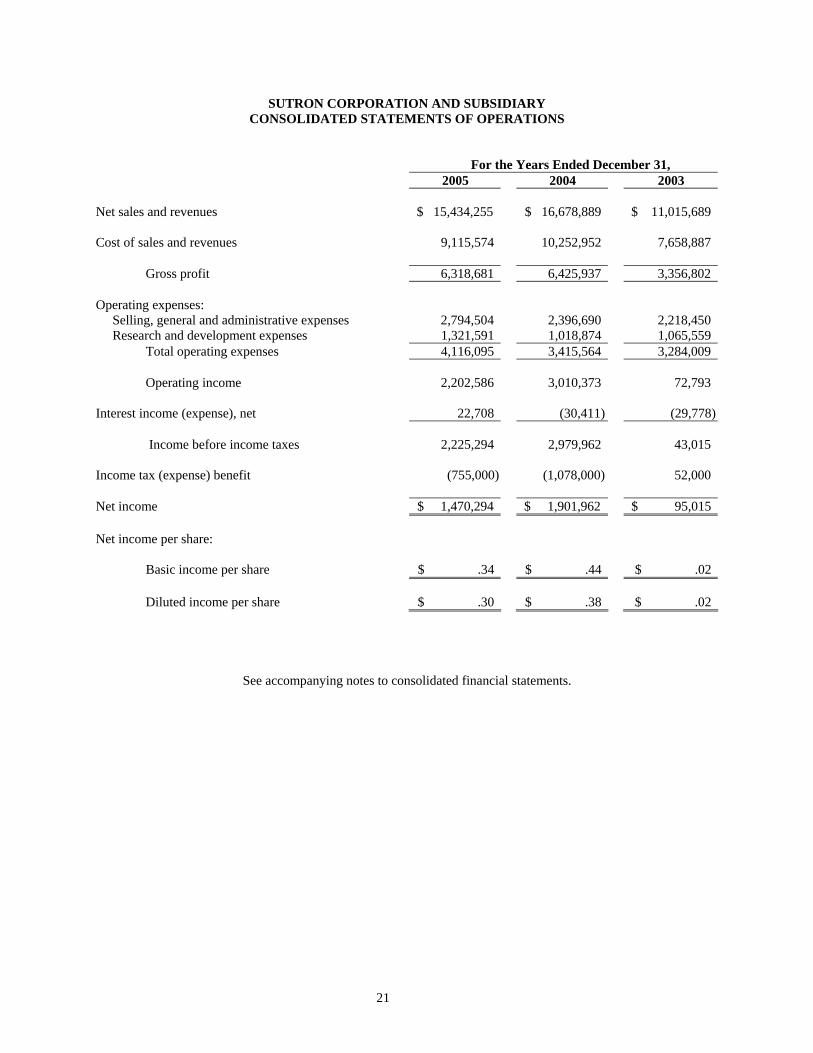
SUTRON CORPORATION AND SUBSIDIARY CONSOLIDATED STATEMENTS OF OPERATIONS
For the Years Ended December 31, 2005 2004 2003 Net sales and revenues $ 15,434,255 $ 16,678,889 $ 11,015,689 Cost of sales and revenues 9,115,574 10,252,952 7,658,887 Gross profit 6,318,681 6,425,937 3,356,802 Operating expenses: Selling, general and administrative expenses 2,794,504 2,396,690 2,218,450 Research and development expenses 1,321,591 1,018,874 1,065,559 Total operating expenses 4,116,095 3,415,564 3,284,009 Operating income 2,202,586 3,010,373 72,793 Interest income (expense), net 22,708 (30,411) (29,778) Income before income taxes 2,225,294 2,979,962 43,015 Income tax (expense) benefit (755,000) (1,078,000) 52,000 Net income $ 1,470,294 $ 1,901,962 $ 95,015 Net income per share: Basic income per share $ .34 $ .44 $ .02 Diluted income per share $ .30 $ .38 $ .02
See accompanying notes to consolidated financial statements.
22
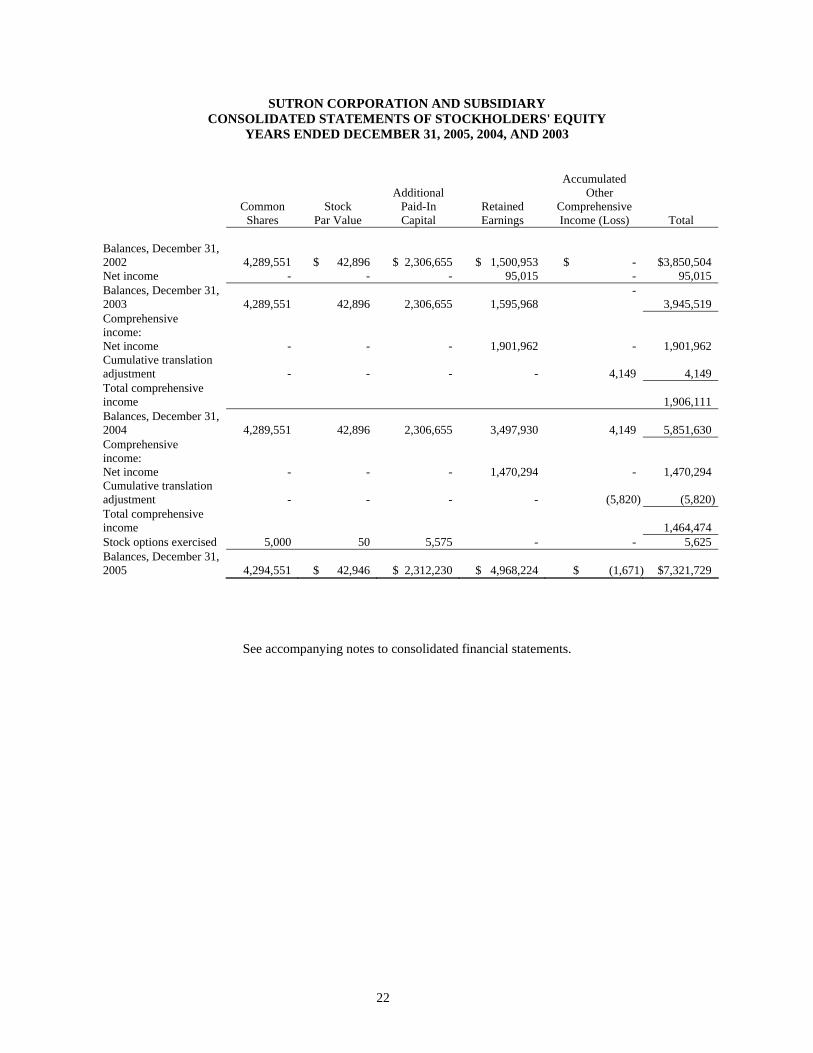
SUTRON CORPORATION AND SUBSIDIARY CONSOLIDATED STATEMENTS OF STOCKHOLDERS' EQUITY
YEARS ENDED DECEMBER 31, 2005, 2004, AND 2003
Accumulated Additional Other Common Stock Paid-In Retained Comprehensive Shares Par Value Capital Earnings Income (Loss) Total
Balances, December 31, 2002
4,289,551
$ 42,896
$ 2,306,655
$ 1,500,953
$ -
$3,850,504
Net income - - - 95,015 - 95,015 Balances, December 31, 2003
4,289,551
42,896
2,306,655
1,595,968
- 3,945,519
Comprehensive income:
Net income - - - 1,901,962 - 1,901,962 Cumulative translation adjustment
-
-
-
-
4,149
4,149
Total comprehensive income
1,906,111
Balances, December 31, 2004
4,289,551
42,896
2,306,655
3,497,930
4,149
5,851,630
Comprehensive income:
Net income - - - 1,470,294 - 1,470,294 Cumulative translation adjustment
-
-
-
-
(5,820) (5,820)
Total comprehensive income
1,464,474
Stock options exercised 5,000 50 5,575 - - 5,625 Balances, December 31, 2005
4,294,551
$ 42,946
$ 2,312,230
$ 4,968,224
$ (1,671)
$7,321,729
See accompanying notes to consolidated financial statements.

23
SUTRON CORPORTION AND SUBSIDIARY CONSOLIDATED STATEMENTS OF CASH FLOWS
For the Years Ended December 31, 2005 2004 2003 Cash Flows from Operating Activities: Net income $ 1,470,294 $ 1,901,962 $ 95,015 Noncash items included in net income: Depreciation and amortization 209,646 202,873 196,205 Deferred income taxes (102,000) 135,000 62,000 Loss on disposal of property 2,931 - - Changes in current assets and liabilities: Accounts receivable 44,013 (693,234) (1,247,936) Inventory (161,048) 66,799 (409,290) Prepaid items and other assets (225,795) (147,864) 60,624 Accounts payable (99,105) (104,189) 564,153 Accrued expenses (298,302) 772,512 152,874 Net Cash Provided (Used) by Operating Activities 840,634 2,133,859 (526,355) Cash Flows from Investing Activities: Restricted cash and cash equivalents 152,647 (108,568) (277,454) Purchase of property and equipment (111,985) (185,562) (155,686) Other assets 4,372 (28,147) (1,297) Proceeds from the sale of property and equipment 2,000 - -Net Cash Provided (Used) by Investing Activities 47,034 (322,277) (434,437) Cash Flows from Financing Activities: Payments on notes payable (58,995) (164,286) (224,816) Proceeds from stock options exercised 5,625 - - (Payments on) proceeds from line of credit, net - (399,454) 399,454 Proceeds from term notes payable - - 165,572 (Payments on) proceeds from stockholder notes - (330,000) 330,000 Net Cash Provided (Used) by Financing Activities (53,370) (893,740) 670,210 Effect of exchange rate changes on cash (5,820) 4,149 - Net increase (decrease) in cash and cash equivalents 828,478 921,991 (290,582)Cash and cash equivalents at beginning of year 1,033,149 111,158 401,740 Cash and cash equivalents at end of year $ 1,861,627 $ 1,033,149 $ 111,158 Noncash Investing/Financing Activities Purchase of property and equipment via Issuance of note payable $ 80,152 $ 129,500 $ -
See accompanying notes to consolidated financial statements.
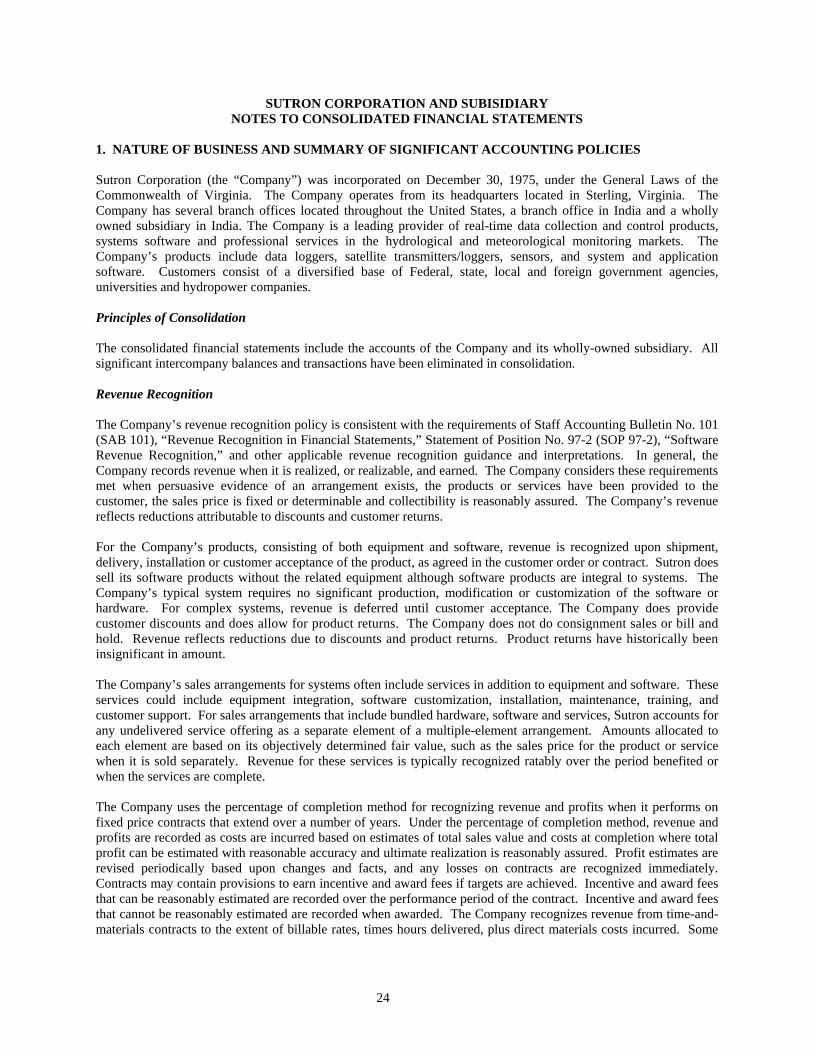
24
SUTRON CORPORATION AND SUBISIDIARY NOTES TO CONSOLIDATED FINANCIAL STATEMENTS
1. NATURE OF BUSINESS AND SUMMARY OF SIGNIFICANT ACCOUNTING POLICIES Sutron Corporation (the “Company”) was incorporated on December 30, 1975, under the General Laws of the Commonwealth of Virginia. The Company operates from its headquarters located in Sterling, Virginia. The Company has several branch offices located throughout the United States, a branch office in India and a wholly owned subsidiary in India. The Company is a leading provider of real-time data collection and control products, systems software and professional services in the hydrological and meteorological monitoring markets. The Company’s products include data loggers, satellite transmitters/loggers, sensors, and system and application software. Customers consist of a diversified base of Federal, state, local and foreign government agencies, universities and hydropower companies. Principles of Consolidation The consolidated financial statements include the accounts of the Company and its wholly-owned subsidiary. All significant intercompany balances and transactions have been eliminated in consolidation. Revenue Recognition The Company’s revenue recognition policy is consistent with the requirements of Staff Accounting Bulletin No. 101 (SAB 101), “Revenue Recognition in Financial Statements,” Statement of Position No. 97-2 (SOP 97-2), “Software Revenue Recognition,” and other applicable revenue recognition guidance and interpretations. In general, the Company records revenue when it is realized, or realizable, and earned. The Company considers these requirements met when persuasive evidence of an arrangement exists, the products or services have been provided to the customer, the sales price is fixed or determinable and collectibility is reasonably assured. The Company’s revenue reflects reductions attributable to discounts and customer returns. For the Company’s products, consisting of both equipment and software, revenue is recognized upon shipment, delivery, installation or customer acceptance of the product, as agreed in the customer order or contract. Sutron does sell its software products without the related equipment although software products are integral to systems. The Company’s typical system requires no significant production, modification or customization of the software or hardware. For complex systems, revenue is deferred until customer acceptance. The Company does provide customer discounts and does allow for product returns. The Company does not do consignment sales or bill and hold. Revenue reflects reductions due to discounts and product returns. Product returns have historically been insignificant in amount. The Company’s sales arrangements for systems often include services in addition to equipment and software. These services could include equipment integration, software customization, installation, maintenance, training, and customer support. For sales arrangements that include bundled hardware, software and services, Sutron accounts for any undelivered service offering as a separate element of a multiple-element arrangement. Amounts allocated to each element are based on its objectively determined fair value, such as the sales price for the product or service when it is sold separately. Revenue for these services is typically recognized ratably over the period benefited or when the services are complete. The Company uses the percentage of completion method for recognizing revenue and profits when it performs on fixed price contracts that extend over a number of years. Under the percentage of completion method, revenue and profits are recorded as costs are incurred based on estimates of total sales value and costs at completion where total profit can be estimated with reasonable accuracy and ultimate realization is reasonably assured. Profit estimates are revised periodically based upon changes and facts, and any losses on contracts are recognized immediately. Contracts may contain provisions to earn incentive and award fees if targets are achieved. Incentive and award fees that can be reasonably estimated are recorded over the performance period of the contract. Incentive and award fees that cannot be reasonably estimated are recorded when awarded. The Company recognizes revenue from time-and-materials contracts to the extent of billable rates, times hours delivered, plus direct materials costs incurred. Some
25
of the contracts include provisions to withhold a portion of the contract value as retainage. The Company’s policy is to take into revenue the full value of the contract, including any retainage, as it performs against the contract. Cash and Cash Equivalents For purposes of the statements of cash flows, cash equivalents include time deposits and all highly liquid debt instruments with original maturities of three months or less. Interest paid approximated $100, $32,500, and $27,900 for the years ended December 31, 2005, 2004 and 2003, respectively. Income taxes paid approximated $1,292,000 and $600,000 for the years ended 2005 and 2004, respectively. No income taxes were paid in 2003. Foreign income tax paid approximated $24,000 and $5,000 for the years ended December 31, 2005 and 2004, respectively.
Restricted Cash
For the years ended December 31, 2005 and 2004, the Company submitted contract proposals that require bid bonds or bank guarantees. At December 31, 2005 and 2004, $233,375 and $108,568, respectively, of the cash and cash equivalents balance is restricted for these bid bonds.
During 2004, the Company entered into international contracts that required standby letters of credit, which expired March 2005. At December 31, 2004, $277,454 of the cash and cash equivalents balance is restricted for these standby letters of credit. Restrictions on cash are typically released within three to nine months.
Inventory Inventory is stated at the lower of cost or market. Electronic components costs, work in process and finished goods costs consist of materials, labor and overhead and are recorded at a standard cost that approximates the average cost method. The Company provides allowances on inventories for any material that has become obsolete or may become unsaleable based on estimates of future demand and sale price in the market. Accounts Receivable Based on management’s evaluation of uncollected accounts receivable at the end of each year, bad debts are provided for utilizing the allowance method. The allowance for doubtful accounts as of December 31, 2005 and 2004 approximate $40,000 and $32,000, respectively. At December 31, 2005 and 2004, the Company’s investment in accounts 90 days or more past due is $701,218 and $434,818, respectively, net of contract retainages.
Property and Equipment Equipment is recorded at cost and depreciated over their estimated useful lives, ranging from 3 to 7 years, using the straight-line method for financial statement purposes, and the straight-line and accelerated methods for income tax purposes. Expenditures for maintenance, repairs, and improvements that do not materially extend the useful lives of the assets are charged to earnings as incurred. When items of property and equipment are disposed of, the cost of the asset and the related accumulated depreciation are removed from the accounts. Any gain or loss resulting from the removal from service is taken into the current period earnings. Income Taxes
The Company utilizes an asset and liability approach to accounting for income taxes. The objective is to recognize the amount of income taxes payable or refundable in the current year based on the Company’s income tax return and the deferred tax liabilities and assets for the expected future tax consequences of events that have been recognized in the Company’s financial statements or tax returns.
The asset and liability method accounts for deferred income taxes by applying enacted statutory rates to temporary differences, the difference between financial statement amounts and tax basis of assets and liabilities. The resulting deferred tax liabilities or assets are classified as current or noncurrent based on the classification of the related asset or liability. Deferred income tax liabilities or assets are adjusted to reflect changes in tax laws or rates in the year of enactment.
26
Foreign Currency Translation
Results of operations for the Company’s foreign branch office and foreign wholly-owned subsidiary are translated from the designated functional currency to the U.S. dollar using average exchange rates during the period, while assets and liabilities of the foreign branch office are translated at the exchange rate in effect at the reporting date. Resulting gains or losses from translating foreign currency financial statements are included in other comprehensive income, net of any related tax effect.
Financial Instruments
The estimated fair value of cash and cash equivalents, accounts receivable, accounts payable, other accrued expenses, and short term notes payable approximate their carrying amounts in the financial statements.
Based on the borrowing rates currently available to the Company for debt with similar maturity dates and collateral, the estimated fair value of long-term debt is $89,000 and $90,000 at December 31, 2005 and 2004, respectively.
Use of Estimates
The preparation of financial statements in conformity with accounting principles generally accepted in the United States of America, requires management to make estimates and assumptions that affect the reported amounts of assets and liabilities and disclosure of contingent assets and liabilities at the date of the financial statements and the reported amounts of revenue and expenses during the reporting period. Actual results could vary from the estimates that were used.
Capital
The Company has 12,000,000, $.01 par value, shares authorized. There were 4,294,551 shares issued and outstanding at December 31, 2005, and 4,289,551 shares issued and outstanding at December 31, 2004 and 2003.
Earnings per Share
The Company has adopted Statement of Financial Accounting Standards (SFAS) No. 128 that establishes standards for computing and presenting earnings per share (EPS) for entities with publicly held common stock. The standard requires presentation of two categories of earnings per share, basic EPS and diluted EPS. Basic EPS excludes dilution and is computed by dividing income available to common stockholders by the weighted-average number of common shares outstanding for the year. Diluted EPS reflects the potential dilution that could occur if securities or other contracts to issue common stock were exercised or converted into common stock or resulted in the issuance of common stock that then shared in the earnings of the Company.
Stock Compensation Plans
Statement of Financial Accounting Standards (SFAS) No. 123, Accounting for Stock-Based Compensation, encourages all entities to adopt a fair value based method of accounting for employee stock compensation plans, whereby compensation cost is measured at the grant date based on the value of the award and is recognized over the service period, which is usually the vesting period. However, it also allows an entity to continue to measure compensation cost for those plans using the intrinsic value based method of accounting prescribed by Accounting Principles Board Opinion No. 25, Accounting for Stock Issued to Employees, whereby compensation cost is the excess, if any, of the quoted market price at the stock grant date (or other measurement date) over the amount an employee must pay to acquire the stock. Stock options issued under the Company’s stock option plan have no intrinsic value at the grant date, and under Opinion No. 25 no compensation cost is recognized for them. The Company has elected to continue with the accounting methodology in Opinion No. 25 and, as a result, has provided pro forma disclosures of net income and earnings per share and other disclosures, as if the fair value based method of accounting had been applied.
In December 2004, the FASB issued SFAS No. 123(R), Share-Based Payment, which is a revision of SFAS No. 123, Accounting for Stock-Based Compensation. SFAS No. 123(R) is effective for public companies for interim or annual periods beginning after June 15, 2005, supersedes APB Opinion No. 25, Accounting for Stock Issued to Employees, and amends SFAS No. 95, Statement of Cash Flows. SFAS No. 123(R) requires all share-based

27
payments to employees, including grants of employee stock options, to be recognized in the income statement based on their fair values. Pro forma disclosure is no longer an alternative.
If the Company had elected to recognize compensation cost for the plan based on the fair value at the grant dates for awards under those plans, consistent with the method prescribed by SFAS No. 123(R), net income and earnings per share would have been changed to the pro forma amounts indicated below:
2005 2004 2003 Net income As reported $1,470,294 $1,901,962 $95,015 Pro forma 1,418,960 1,857,958 69,010 Earnings per share - Basic As reported $.34 $.44 $.02 - Basic Pro forma $.33 $.43 $.02 - Diluted As reported $.30 $.38 $.02 - Diluted Pro forma $.29 $.38 $.02
The fair value of Sutron Corporation stock options used to compute pro forma net income and earnings per share disclosures is the estimated present value at grant date using the Black-Scholes pricing model, with the following assumptions:
Risk free rate 4.1% 3.4% 3.0% Expected volatility 32% 30% 30% Dividend yield 0% 0% 0% Holding period 5 years 5 years 9 years
Reclassifications The accompanying consolidated financial statements for prior fiscal years contain certain reclassifications to conform to the presentation used in Fiscal 2005. These reclassifications of prior fiscal year balances have no impact on net income. 2. ACCOUNTS RECEIVABLE Accounts receivable at December 31, consists of the following:
2005 2004 Current $ 2,390,421 $ 2,617,094 Costs in excess of billings and estimated earnings 1,321,005 730,120 Contract retainage - 408,225 Totals $ 3,711,426 $ 3,755,439
3. INVENTORY Inventory consists of the following at December 31:
2005 2004 Electronic components $ 1,064,385 $ 786,296 Work in process 933,008 1,077,091 Finished goods 535,131 508,089 Totals $ 2,532,524 $ 2,371,476
4. PROPERTY AND EQUIPMENT
A summary of property and equipment at December 31 is as follows:

28
2005 2004 Furniture, fixtures and equipment $ 2,740,177 $ 2,649,294 Vehicles 391,974 301,056 Leasehold improvements 89,935 87,818 Totals $ 3,222,086 $ 3,038,168
Accumulated depreciation and amortization at December 31, is as follows:
2005 2004 Furniture, fixtures and equipment $ 2,331,972 $ 2,190,991 Vehicles 163,477 101,714 Leasehold improvements 39,405 35,791 Totals $ 2,534,854 $ 2,328,496
Depreciation and amortization expense totaled $209,646, $202,873 and $196,205 for the years ended December 31, 2005, 2004 and 2003, respectively.
5. LINE OF CREDIT
The Company has a $2,000,000 line of credit with a commercial bank. The line of credit is collateralized by substantially all of the assets of the Company and expires August 2006. Under the terms of the line of credit, the Company is required to maintain certain financial covenants. Interest is charged at the bank’s prime rate plus one-half percent and is payable monthly. There was no balance outstanding at December 31, 2005 or 2004.
The Company frequently bids on and enters into international contracts that require bid and performance bonds. At December 31, 2005 and 2004, a commercial bank had issued standby letters of credit in the amount of $751,725 and $186,354 that served as either bid or performance bonds. The amount available under the line of credit is reduced by this amount.
6. OTHER ACCRUED EXPENSES
Components of other accrued expenses consist of the following at December 31:
2005 2004 Accrued vacation pay $ 207,905 $ 186,131 Accrued profit sharing 188,000 175,000 Accrued warranty costs 288,000 272,000 Subcontractor costs 384,821 343,496 Federal income taxes - 336,786 Other accruals 111,199 87,366 Totals $ 1,179,925 $ 1,400,779
7. ACCRUED WARRANTY COSTS The Company warranties its products for up to two years and estimated warranty costs are based upon management’s best estimate of the amounts necessary to settle future and existing claims on equipment sold as of the balance sheet date. Factors considered include actual past experience of product returns and the related estimated cost of labor and material to make the necessary repairs as well as technological advances and enhanced design and manufacturing processes. If actual future product return rates or the actual costs of material and labor differ from the estimates, adjustments to the accrued warranty liability are made. Changes to the product warranty reserve are identified below and represent adjustments to the reserve based on management estimates and other factors as noted above:
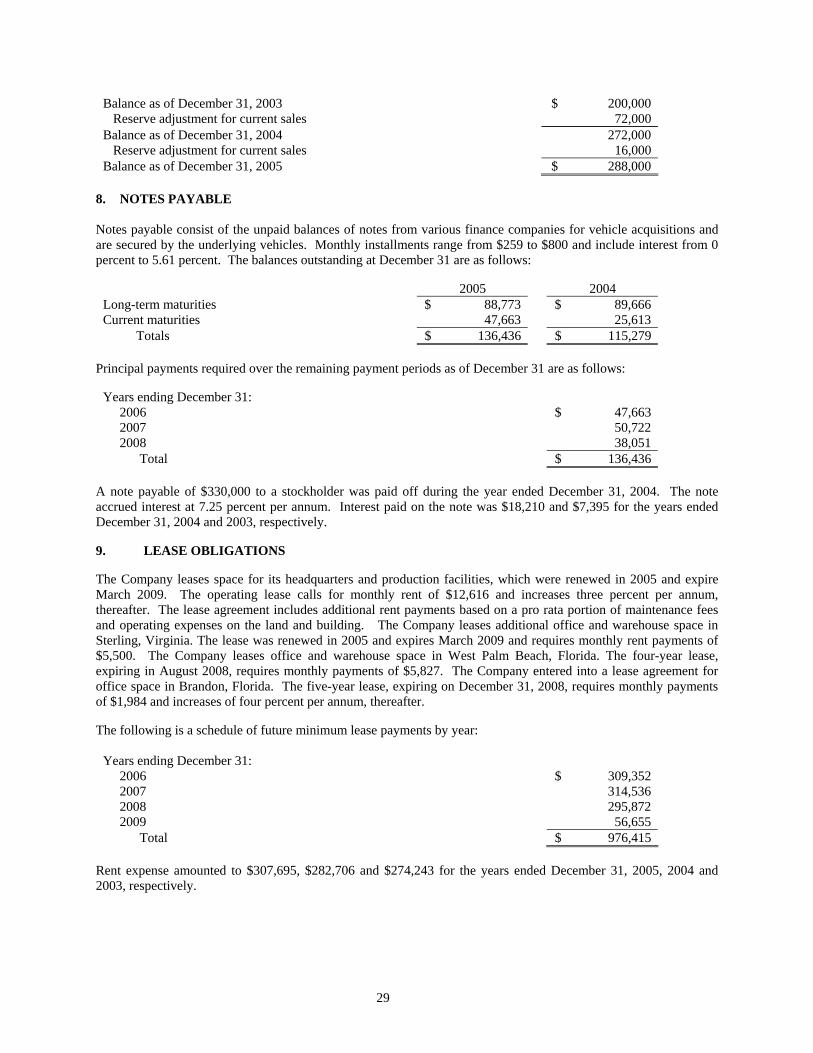
29
Balance as of December 31, 2003 $ 200,000 Reserve adjustment for current sales 72,000 Balance as of December 31, 2004 272,000 Reserve adjustment for current sales 16,000 Balance as of December 31, 2005 $ 288,000
8. NOTES PAYABLE Notes payable consist of the unpaid balances of notes from various finance companies for vehicle acquisitions and are secured by the underlying vehicles. Monthly installments range from $259 to $800 and include interest from 0 percent to 5.61 percent. The balances outstanding at December 31 are as follows:
2005 2004 Long-term maturities $ 88,773 $ 89,666 Current maturities 47,663 25,613 Totals $ 136,436 $ 115,279
Principal payments required over the remaining payment periods as of December 31 are as follows:
Years ending December 31: 2006 $ 47,663 2007 50,722 2008 38,051 Total $ 136,436
A note payable of $330,000 to a stockholder was paid off during the year ended December 31, 2004. The note accrued interest at 7.25 percent per annum. Interest paid on the note was $18,210 and $7,395 for the years ended December 31, 2004 and 2003, respectively.
9. LEASE OBLIGATIONS
The Company leases space for its headquarters and production facilities, which were renewed in 2005 and expire March 2009. The operating lease calls for monthly rent of $12,616 and increases three percent per annum, thereafter. The lease agreement includes additional rent payments based on a pro rata portion of maintenance fees and operating expenses on the land and building. The Company leases additional office and warehouse space in Sterling, Virginia. The lease was renewed in 2005 and expires March 2009 and requires monthly rent payments of $5,500. The Company leases office and warehouse space in West Palm Beach, Florida. The four-year lease, expiring in August 2008, requires monthly payments of $5,827. The Company entered into a lease agreement for office space in Brandon, Florida. The five-year lease, expiring on December 31, 2008, requires monthly payments of $1,984 and increases of four percent per annum, thereafter.
The following is a schedule of future minimum lease payments by year:
Years ending December 31: 2006 $ 309,352 2007 314,536 2008 295,872 2009 56,655 Total $ 976,415
Rent expense amounted to $307,695, $282,706 and $274,243 for the years ended December 31, 2005, 2004 and 2003, respectively.

30
10. INCOME TAXES
The income tax (expense) benefit charged to operations for the years ended December 31, were as follows: 2005 2004 2003 Current income tax expense $ (857,000) $ (943,000) $ (37,000)Deferred tax benefit (expense) 102,000 (135,000) 89,000 Total income tax (expense) benefit $ (755,000) $ (1,078,000) $ 52,000
Deferred tax assets, are comprised of the following at December 31:
2005 2004 2003 Accrued vacation and warranty $ 193,000 $ 179,000 $ 120,000 Accounts receivable and inventory allowances 85,000 - - Business tax credits - - 133,000 Gross deferred tax assets 278,000 179,000 253,000 Gross deferred tax liability – depreciation (169,000) (172,000) (111,000) Net deferred tax assets $ 109,000 $ 7,000 $ 142,000
The realization of the deferred tax assets is dependent on future taxable earnings. The Company has not provided for a deferred tax asset valuation allowance due to their current and anticipated future earnings. A reconciliation between the amount of reported income tax expense and the amount computed by multiplying the applicable statutory Federal income tax rate is as follows:
2005 2004 2003 Income before income taxes $ 2,225,294 $ 2,979,962 $ 43,015 Applicable statutory tax rate 34% 34% 34% Computed “expected” Federal income tax Expense (757,000) (1,013,000) (15,000)Adjustments to Federal income tax resulting from: State income tax expense (111,000) (115,000) (2,000) Tax credits 113,000 50,000 69,000 Income tax (expense) benefit $ (755,000) $ (1,078,000) $ 52,000
11. MAJOR CUSTOMERS
Set forth below are customers, including agencies of the U.S. Government, from which the Company received more than ten percent of total revenue, for the years ended December 31:
2005 2004 2003 Department of Interior 22% 20% 27% International 25% 32% 28% Commercial 31% 24% 27% Department of Commerce 16% - - Department of Defense - 16% 10%
Set forth below are customers, including agencies of the U.S. Government, from which the Company had more than ten percent of total accounts receivable outstanding for the years ended December 31, 2005 and 2004:
2005 2004 South Florida Water Management $ 855,896 $ 479,060 National Oceanic and Atmospheric Administration $ - $ 879,791
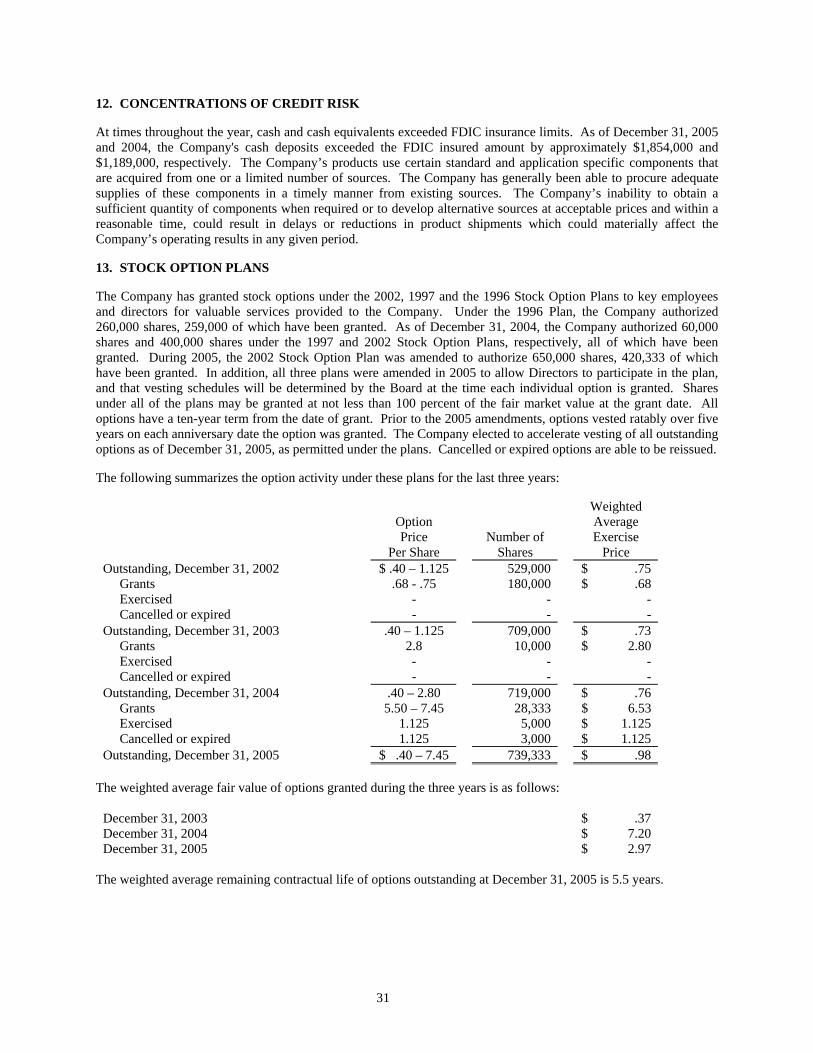
31
12. CONCENTRATIONS OF CREDIT RISK
At times throughout the year, cash and cash equivalents exceeded FDIC insurance limits. As of December 31, 2005 and 2004, the Company's cash deposits exceeded the FDIC insured amount by approximately $1,854,000 and $1,189,000, respectively. The Company’s products use certain standard and application specific components that are acquired from one or a limited number of sources. The Company has generally been able to procure adequate supplies of these components in a timely manner from existing sources. The Company’s inability to obtain a sufficient quantity of components when required or to develop alternative sources at acceptable prices and within a reasonable time, could result in delays or reductions in product shipments which could materially affect the Company’s operating results in any given period.
13. STOCK OPTION PLANS
The Company has granted stock options under the 2002, 1997 and the 1996 Stock Option Plans to key employees and directors for valuable services provided to the Company. Under the 1996 Plan, the Company authorized 260,000 shares, 259,000 of which have been granted. As of December 31, 2004, the Company authorized 60,000 shares and 400,000 shares under the 1997 and 2002 Stock Option Plans, respectively, all of which have been granted. During 2005, the 2002 Stock Option Plan was amended to authorize 650,000 shares, 420,333 of which have been granted. In addition, all three plans were amended in 2005 to allow Directors to participate in the plan, and that vesting schedules will be determined by the Board at the time each individual option is granted. Shares under all of the plans may be granted at not less than 100 percent of the fair market value at the grant date. All options have a ten-year term from the date of grant. Prior to the 2005 amendments, options vested ratably over five years on each anniversary date the option was granted. The Company elected to accelerate vesting of all outstanding options as of December 31, 2005, as permitted under the plans. Cancelled or expired options are able to be reissued.
The following summarizes the option activity under these plans for the last three years:
Weighted Option Average Price Number of Exercise Per Share Shares Price
Outstanding, December 31, 2002 $ .40 – 1.125 529,000 $ .75 Grants .68 - .75 180,000 $ .68 Exercised - - - Cancelled or expired - - - Outstanding, December 31, 2003 .40 – 1.125 709,000 $ .73 Grants 2.8 10,000 $ 2.80 Exercised - - - Cancelled or expired - - - Outstanding, December 31, 2004 .40 – 2.80 719,000 $ .76 Grants 5.50 – 7.45 28,333 $ 6.53 Exercised 1.125 5,000 $ 1.125 Cancelled or expired 1.125 3,000 $ 1.125 Outstanding, December 31, 2005 $ .40 – 7.45 739,333 $ .98
The weighted average fair value of options granted during the three years is as follows:
December 31, 2003 $ .37 December 31, 2004 $ 7.20 December 31, 2005 $ 2.97
The weighted average remaining contractual life of options outstanding at December 31, 2005 is 5.5 years.

32
14. EARNINGS PER SHARE
The following table shows the weighted average number of shares used in computing earnings per share and the effect on weighted average number of shares of potential dilutive common stock.
Years Ended December 31, 2005 2004 2003
Net income $1,470,294 $1,901,962 $ 95,015 Shares used in calculation of income per share: Basic 4,292,051 4,289,551 4,289,551 Effect of dilutive options 641,761 661,558 35,743 Diluted 4,933,812 4,951,109 4,325,294 Net income per share: Basic $.34 $.44 $.02 Diluted $.30 $.38 $.02
Contracts to issue common stock that are anti-dilutive in nature are not included in the earnings per share calculations.
15. PROFIT SHARING PLAN
The 401(k) Profit Sharing Plan covers substantially all full time employees. Contributions to the plan are determined each year by the Board of Directors based on profits. The Company made a profit sharing contribution for the years ended December 31, 2005 and 2004 of $188,000 and $175,000, respectively. No contribution was made for the year ended December 31, 2003. 16. SEGMENT INFORMATION Statement of Financial Accounting Standards (SFAS) No. 131, Disclosures about Segments of an Enterprise and Related Information establishes standards for the manner in which public companies report information about operating segments in annual and interim financial statements. It also establishes standards for related disclosures about products and services, geographic areas, and major customers. The method for determining what information to report is based on the way management organizes the operating segments within the Company for making operating decisions and assessing financial performance. The Company’s chief operating decision-maker is considered to be the Company’s chief executive officer (CEO). The CEO reviews financial information presented based on divisions, comprised of products and/or services. Nearly all of the Company’s operations and assets are located at its headquarters location. Therefore, indirect costs are not allocated among segments. The Company currently reports its results in three divisions: Hydromet Products, Integrated Systems and Hydrological Services. Hydromet Products division is responsible for the manufacture and sale of the Company’s products including dataloggers, satellite transmitters and sensors. The Integrated Systems division is responsible for systems design, integration and installation of turnkey hydrometeorological systems. The Company’s Hydrological Services division provides data interpretation and analysis services including modeling, flood forecasting and hydrologic studies. The results of these segments are shown below (in thousands):
2005 2004 2003 Revenue HydroMet Products $ 9,305 $ 10,689 $ 6,592 Integrated Systems 3,490 3,631 3,432 Hydrological Services 2,639 2,359 992 Totals $ 15,434 $ 16,679 $ 11,016

33
2005 2004 2003 Cost of Goods Sold HydroMet Products $ 4,576 $ 6,030 $ 4,414 Integrated Systems 2,064 2,063 2,441 Hydrological Services 2,476 2,160 804 Totals $ 9,116 $ 10,253 $ 7,659 Gross Margin HydroMet Products $ 4,729 $ 4,659 $ 2,178 Integrated Systems 1,426 1,568 991 Hydrological Services 163 199 188 Totals $ 6,318 $ 6,426 $ 3,357
17. EXPORT SALES Export sales from the Company’s operations at December 31, were as follow (in thousands):
2005 2004 2003 Central and South America $ 1,238 $ 695 $ 1,597 Canada 750 246 175 Asia 1,363 1,266 850 Australia/New Zealand 47 63 35 Europe and other 438 3,141 415 $ 3,836 $ 5,411 $ 3,072
18. LEGAL CONTINGENCIES Various legal claims can arise from time to time in the normal course of business which, in the opinion of management, will have no material effect on the Company’s financial statements. The Company has been named in a compensation claim under the Indian Anti-Trust Law that is pending before The Monopolies and Restrictive Trade Practices Commission in New Delhi, India. Management feels strongly that the case is unsubstantiated and does not anticipate that any losses will occur.
34
Item 8 - Changes In and Disagreements With Accountants On Accounting And Financial Disclosure Not applicable. Item 8A - Controls And Procedures Evaluation of Disclosure Controls and Procedures Our management (with the participation of our Chief Executive Officer and Chief Financial Officer) evaluated the effectiveness of our disclosure controls and procedures (as defined in Rules 13a-15(e) and 15d-15(e) under the Securities Exchange Act of 1934, as amended (the “Exchange Act”)), as of December 31, 2005, the end of the fiscal period covered by this report on Form 10-KSB. Securities and Exchange Commission, or SEC, rules define the term “disclosure controls and procedures” to mean a company’s controls and other procedures that are designed to ensure that information required to be disclosed in the reports it files or submits under the Exchange Act is recorded, processed, summarized and reported within the time period specified in the SEC’s rules and forms. Disclosure controls and procedures include, without limitation, controls and procedures designed to ensure that information required to be disclosed by a company in its reports filed under the Exchange Act is accumulated and communicated to the company’s management, including its principal executive and principal financial officers, or persons performing similar functions, as appropriate to allow timely decisions regarding required disclosure. As previously discussed in our report as amended on Form 10-KSB/A for the fiscal year ended December 31, 2004 and our reports on Form 10-QSB for the quarters ended March 31, June 30 and September 30, 2005, we identified control weaknesses relating to our non-compliance with certain disclosure requirements in the SEC’s rules relating to periodic reports. Our control weaknesses related to our failure to devote sufficient resources to keep abreast of changing disclosure requirements, including those requirements that were imposed after the passage of the Sarbanes-Oxley Act of 2002. We have corrected the identified weaknesses by, among other things, allocating additional personnel to the disclosure process including a review of all quarterly earnings news releases by the Company’s audit committee that is comprised of independent directors, and by engaging outside counsel to review our SEC filings on a more frequent basis. Based on the evaluation of the effectiveness of our disclosure controls and procedures by our management with the participation of the Chief Executive Officer and Chief Financial Officer, our Chief Executive Officer and Chief Financial Officer has concluded that, as of the end of the period covered by this report, our disclosure controls and procedures were effective. A control system, no matter how well designed and operated, can provide only reasonable, not absolute, assurance that the objectives of the control system are met. Further, because of the inherent limitations in all control systems, no evaluation of controls can provide absolute assurance that all control issues and instances of fraud, if any, have been or will be detected. These inherent limitations include the fact that there are resource constraints, and that the benefits of controls must be considered relative to their costs. Because of its inherent limitations, internal control over financial reporting may not prevent or detect misstatements. Projections of any evaluation of effectiveness to future periods are subject to the risk that controls may become inadequate because of changes in conditions, or that the degree of compliance with the policies or procedures may deteriorate. Changes in Internal Controls over Financial Reporting There have been no changes in our internal control over financial reporting that occurred during the quarter ended December 31, 2005 that have materially affected, or are reasonably likely to materially affect, our internal control over financial reporting. Item 8B – Other Information None

35
PART III Item 9 – Directors, Executive Officers, Promoters and Control Persons; Compliance with Section 16(a) of the Exchange Act The Board has adopted a Code of Conduct and Ethics that applies to Sutron’s principal executive officer, principal financial officer and all other employees of the Company. This Code of Conduct and Ethics is posted on the Company’s website at http://www.sutron.com on the investors’ page. Any amendments to the Code of Ethics and waivers of the Code of Ethics for our principal executive, accounting or financial officers will be published on our website. The remainder of information required for this Item is incorporated by reference to the Proxy Statement to be filed in connection with our 2006 Annual Meeting of Shareholders. Item 10 - Executive Compensation The information required for this Item is incorporated by reference to the Proxy Statement to be filed in connection with our 2006 Annual Meeting of Shareholders. Item 11 - Security Ownership Of Certain Beneficial Owners And Management The information required for this Item is incorporated by reference to the Proxy Statement to be filed in connection with our 2006 Annual Meeting of Shareholders. Item 12 - Certain Relationships And Related Transactions The information required for this Item is incorporated by reference to the Proxy Statement to be filed in connection with our 2006 Annual Meeting of Shareholders. Item 13 - Exhibits 3(a) Copy of Articles of Incorporation of Sutron Corporation, received and approved December 30, 1975 3(b) Copy of Articles of Amendment to the Articles of Incorporation and Articles of Reduction of Stated Capital
of Sutron Corporation received and approved September 7, 1983 3(c) By-Laws of the Registrant 3(d) Copy of Articles of Amendment to the Articles of Incorporation received and approved June 8, 1995 4(g) 1996 Stock Option Plan 4(h) 2002 Stock Option Plan 10(x) Stock Option Agreement between The Company and Raul S. McQuivey dated October 18, 2002 10(y) Stock Option Agreement between The Company and Daniel W. Farrell dated October 18, 2002 10(z) Stock Option Agreement between The Company and Sidney C. Hooper October 18, 2002 10.1 Stock Option Agreement between The Company and Thomas N. Keefer dated October 18, 2002 10.2 Stock Option Agreement between The Company and Robert F. Roberts, Jr. dated December 18, 2003 10.3 Stock Option Agreement between The Company and Robert F. Roberts, Jr. dated May 13, 2004 10.4 Stock Option Agreement between The Company and Andrew D. Lipman dated December 22, 2005 (filed
herewith) 10.5 Stock Option Agreement between The Company and Thomas R. Porter dated December 22, 2005 (filed
herewith) 10.6 Stock Option Agreement between The Company and Robert F. Roberts, Jr. dated December 22, 2005 (filed
herewith) 10.7 Amendment to Stock Option Agreements between the Company and Raul S. McQuivey dated December
22, 2005 (filed herewith) 10.8 Amendment to Stock Option Agreements between the Company and Daniel W. Farrell dated December 22,
2005 (filed herewith) 10.9 Amendment to Stock Option Agreements between the Company and Sidney C. Hooper dated December
22, 2005 (filed herewith)
36
10.9 Amendment to Stock Option Agreement between the Company and Thomas N. Keefer dated December 22, 2005 (filed herewith)
Item 14 - Principal Accountant Fees And Services The information required for this Item is incorporated by reference to the Proxy Statement to be filed in connection with our 2006 Annual Meeting of Shareholders.
SIGNATURES In accordance with Section 13 or 15(d) of the Exchange Act, the Registrant caused this report to be signed on its behalf by the undersigned, thereunto duly authorized. Sutron Corporation (Registrant) /s/ Raul S. McQuivey Date: March 30, 2006 By: Raul S. McQuivey, Chairman of the Board of Directors and President and Chief Executive Officer In accordance with the Securities Exchange Act, this report has been signed by the following persons on behalf of the Registrant and in the capacities and on the dates indicated. /s/ Raul S. McQuivey Date: March 30, 2006 By: Raul S. McQuivey, Chairman of the Board of Directors and President and Chief Executive Officer /s/ Daniel W. Farrell Date: March 30, 2006 By: Daniel W. Farrell, Director and Vice President /s/ Andrew D. Lipman Date: March 30, 2006 By: Andrew D. Lipman, Director /s/ Thomas R. Porter Date: March 30, 2006 By: Thomas R. Porter, Director /s/ Robert F. Roberts, Jr. Date: March 30, 2006 By: Robert F. Roberts, Jr., Director /s/ Sidney C. Hooper Date: March 30, 2006 By: Sidney C. Hooper, Chief Financial Officer (Chief Financial and Accounting Officer)
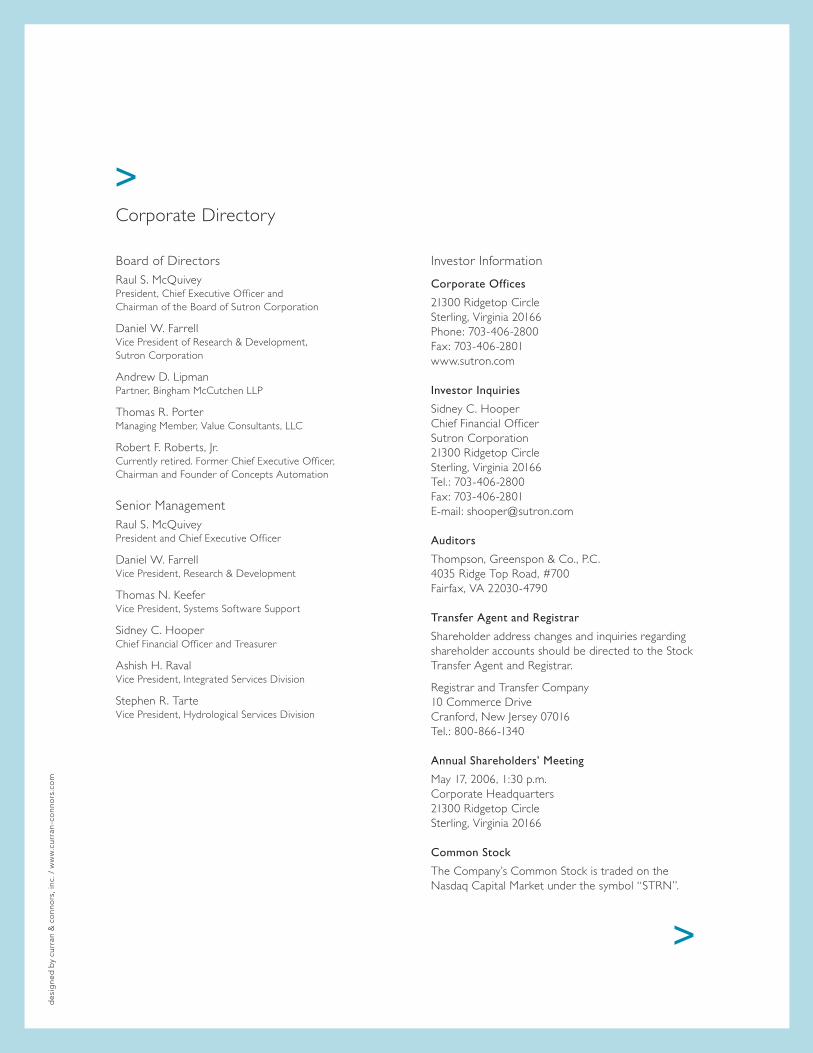
de
sig
ned
by
curr
an &
co
nno
rs, i
nc. /
ww
w.c
urra
n-c
onn
ors
.co
m
Corporate Directory
Board of DirectorsRaul S. McQuiveyPresident, Chief Executive Officer and Chairman of the Board of Sutron Corporation
Daniel W. FarrellVice President of Research & Development, Sutron Corporation
Andrew D. LipmanPartner, Bingham McCutchen LLP
Thomas R. PorterManaging Member, Value Consultants, LLC
Robert F. Roberts, Jr.Currently retired. Former Chief Executive Officer, Chairman and Founder of Concepts Automation
Senior ManagementRaul S. McQuiveyPresident and Chief Executive Officer
Daniel W. FarrellVice President, Research & Development
Thomas N. KeeferVice President, Systems Software Support
Sidney C. HooperChief Financial Officer and Treasurer
Ashish H. RavalVice President, Integrated Services Division
Stephen R. TarteVice President, Hydrological Services Division
Investor Information
Corporate Offices
21300 Ridgetop CircleSterling, Virginia 20166Phone: 703-406-2800Fax: 703-406-2801www.sutron.com
Investor Inquiries
Sidney C. HooperChief Financial OfficerSutron Corporation21300 Ridgetop CircleSterling, Virginia 20166Tel. : 703-406-2800Fax: 703-406-2801E-mail: [email protected]
Auditors
Thompson, Greenspon & Co., P.C.4035 Ridge Top Road, #700Fairfax, VA 22030-4790
Transfer Agent and Registrar
Shareholder address changes and inquiries regarding shareholder accounts should be directed to the Stock Transfer Agent and Registrar.
Registrar and Transfer Company10 Commerce DriveCranford, New Jersey 07016Tel. : 800-866-1340
Annual Shareholders’ Meeting
May 17, 2006, 1:30 p.m.Corporate Headquarters21300 Ridgetop CircleSterling, Virginia 20166
Common Stock
The Company’s Common Stock is traded on the Nasdaq Capital Market under the symbol “STRN”.
>
>