Verma 2007
2
34 GEO ExPro October 2007 RESEVoIR MANAGEMENT Mahendra K. Verma, u.s. Geological srvey Reserve growth is the increase in suc- cessive estimates of recoverable crude oil, natural gas, and natural liquids in discov- ered accumulations. Such increases have been observed in almost all existing fields, with large fields in mature petroleum provinces generally hav- ing the largest relative gains . In these mature petroleum provinces, the contribution from reserve growth in existing fields increases over time while that from newly discovered fields decrease. For example, reserve growth is the most important source for additional reserves in the United States. In 1960, Arrington 2 was probably the first to publish a method to model or esti- mate reserve growth. In 1994, Attanasi and Root 3 were the first to attempt to forecast the growth of oil and gas fields for the conterminous United States. Since then, interest in reserve growth has been gain- ing momentum, more so in recent years as petroleum experts around the world speculate on the remaining oil and gas reserves. Accordingly, understanding and evaluating this growth is a critical compo- nent of energy resource analysis. Between 1995 and 2003, reserve grwth frm existing fields wrldwide added three times mre il t cnventinal reserves than new field discveries 1 . Estimatin f future reserve grwth will be a critical factr fr energy resurce analysis. The Reality f Reser ve Gr wth As part of the U. S. Geological Survey’s (USGS) domestic and international assess- ment projects, an extensive study has been initiated to evaluate and develop reserve growth models for all major petroleum provinces and countries around the world. The goal is to make better estimates of future reserve growth potential. Influening Fators Reserve growth results from five main factors: 1) additional reservoir and geo- logic information leading to an increase in in-place-hydrocarbon volumes in exist- ing reservoirs or pools; 2) discovery of new reservoirs or pools in the existing fields; 3) improvements in recovery factor owing to better understanding of reservoir characteristics and behavior through use of improved technology in various areas, including better logging techniques, hori- zontal drilling, and reservoir simulation; 4) application of enhanced oil recovery (EOR) methods; and 5) economics. Of these factors, the application of the EOR process has probably contributed the most to reserve growth. Of all the EOR processes, thermal recovery and carbon dioxide injection are technically and eco- nomically the most successful processes (Figure 1) 4 . Although other factors (reserve report- ing policies, proximity to infrastructure and oil/gas prices) impact reserve growth, the quantification of their impact is difficult. Therefore, most studies have focused on evaluating the reserve growth sensitiv- ity to geologic and reservoir engineering parameters. Models The first attempts to estimate reserve growth potential for countries outside the United States used reserve growth func- tions developed for U.S. fields. However, as more data were collected from other oil provinces around the world, it became obvious that use of the U.S. model would “Reserve growth is the most important source for additional reserves in the United States AdvanceddrillingtechnologiesandEORtechniquesfind newoilandgasreservesinexisting fieldslikethose f oundintheLosAngelesbasinofsouthern California.
-
Upload
jimmyjimmyc13 -
Category
Documents
-
view
224 -
download
0
Transcript of Verma 2007
8/2/2019 Verma 2007
http://slidepdf.com/reader/full/verma-2007 1/234 GEO ExPro October 2007
R E S E V o I R M A N A G E M E N T
Mahendra K. Verma, u.s. Geological srvey
Reserve growth is the increase in suc-
cessive estimates of recoverable crude oil,
natural gas, and natural liquids in discov-
ered accumulations.
Such increases have been observed in
almost all existing fields, with large fields in
mature petroleum provinces generally hav-ing the largest relative gains. In these mature
petroleum provinces, the contribution from
reserve growth in existing fields increases
over time while that from newly discovered
fields decrease. For example, reserve growth
is the most important source for additional
reserves in the United States.
In 1960, Arrington2
was probably the
first to publish a method to model or esti-
mate reserve growth. In 1994, Attanasi and
Root3
were the first to attempt to forecast
the growth of oil and gas fields for the
conterminous United States. Since then,interest in reserve growth has been gain-
ing momentum, more so in recent years
as petroleum experts around the world
speculate on the remaining oil and gas
reserves. Accordingly, understanding and
evaluating this growth is a critical compo-
nent of energy resource analysis.
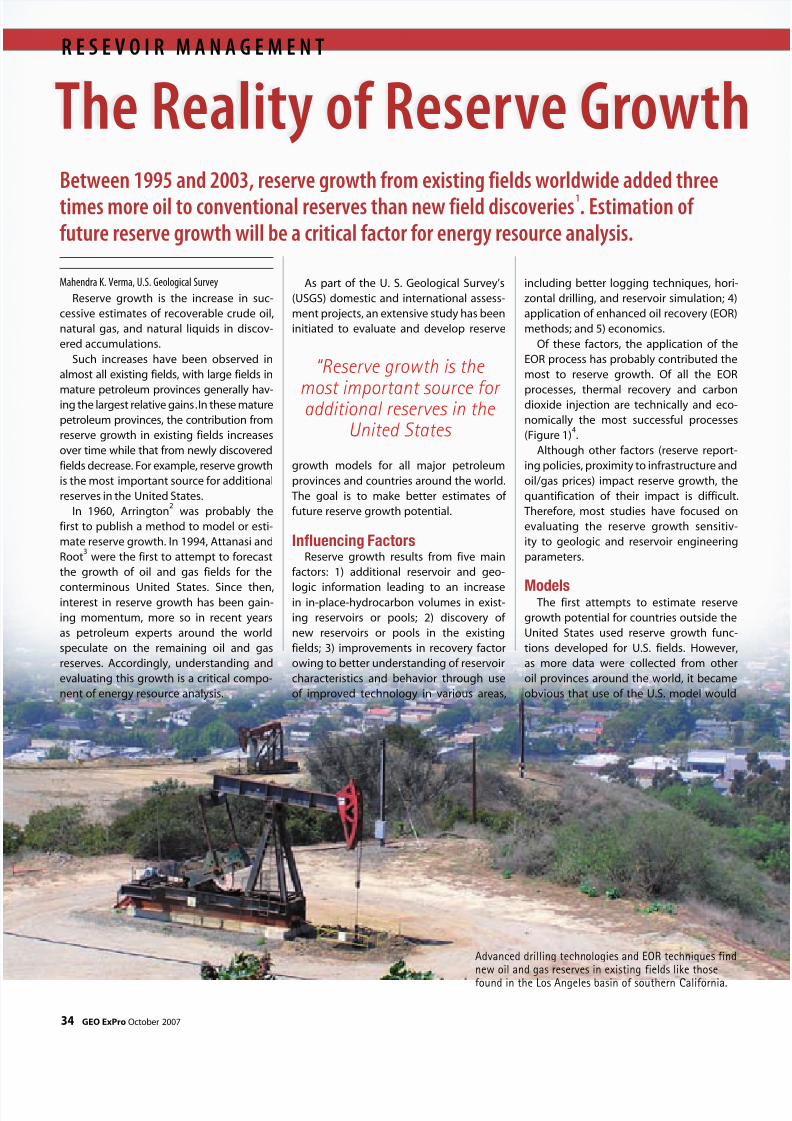
Between 1995 and 2003, reserve grwth frm existing fields wrldwide added threetimes mre il t cnventinal reserves than new field discveries1. Estimatin f future reserve grwth will be a critical factr fr energy resurce analysis.
The Reality f Reserve Grwth
As part of the U. S. Geological Survey’s
(USGS) domestic and international assess-
ment projects, an extensive study has been
initiated to evaluate and develop reserve
growth models for all major petroleum
provinces and countries around the world.
The goal is to make better estimates of
future reserve growth potential.
Influening FatorsReserve growth results from five main
factors: 1) additional reservoir and geo-
logic information leading to an increasein in-place-hydrocarbon volumes in exist-
ing reservoirs or pools; 2) discovery of
new reservoirs or pools in the existing
fields; 3) improvements in recovery factor
owing to better understanding of reservoir
characteristics and behavior through use
of improved technology in various areas,
including better logging techniques, hori-
zontal drilling, and reservoir simulation; 4)
application of enhanced oil recovery (EOR)
methods; and 5) economics.
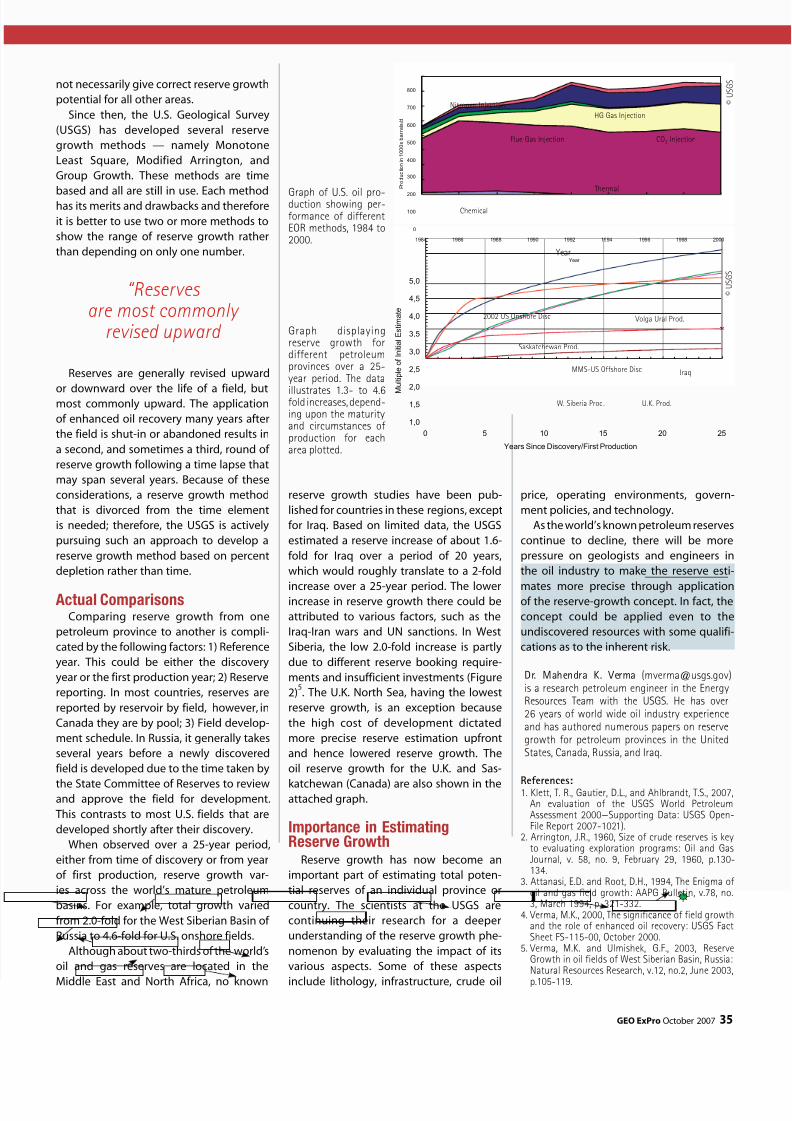
Of these factors, the application of the
EOR process has probably contributed the
most to reserve growth. Of all the EOR
processes, thermal recovery and carbondioxide injection are technically and eco-
nomically the most successful processes
(Figure 1)4.
Although other factors (reserve report-
ing policies, proximity to infrastructure and
oil/gas prices) impact reserve growth, the
quantification of their impact is difficult.
Therefore, most studies have focused on
evaluating the reserve growth sensitiv-
ity to geologic and reservoir engineering
parameters.
Models The first attempts to estimate reserve
growth potential for countries outside the
United States used reserve growth func-
tions developed for U.S. fields. However,
as more data were collected from other
oil provinces around the world, it became
obvious that use of the U.S. model would
“Reserve growth is the
most important source for additional reserves in the United States
AdvanceddrillingtechnologiesandEORtechniquesfindnewoilandgasreservesinexistingfieldslikethose
f oundintheLosAngelesbasinofsouthernCalifornia.
8/2/2019 Verma 2007
http://slidepdf.com/reader/full/verma-2007 2/2GEO ExPro October 2007 35
not necessarily give correct reserve growth
potential for all other areas.
Since then, the U.S. Geological Survey
(USGS) has developed several reserve
growth methods — namely Monotone
Least Square, Modified Arrington, and
Group Growth. These methods are time
based and all are still in use. Each methodhas its merits and drawbacks and therefore
it is better to use two or more methods to
show the range of reserve growth rather
than depending on only one number.
Reserves are generally revised upward
or downward over the life of a field, butmost commonly upward. The application
of enhanced oil recovery many years after
the field is shut-in or abandoned results in
a second, and sometimes a third, round of
reserve growth following a time lapse that
may span several years. Because of these
considerations, a reserve growth method
that is divorced from the time element
is needed; therefore, the USGS is actively
pursuing such an approach to develop a
reserve growth method based on percent
depletion rather than time.
Atual comparisonsComparing reserve growth from one
petroleum province to another is compli-
cated by the following factors: 1) Reference
year. This could be either the discovery
year or the first production year; 2) Reserve
reporting. In most countries, reserves are
reported by reservoir by field, however, in
Canada they are by pool; 3) Field develop-
ment schedule. In Russia, it generally takes
several years before a newly discovered
field is developed due to the time taken by
the State Committee of Reserves to reviewand approve the field for development.
This contrasts to most U.S. fields that are
developed shortly after their discovery.
When observed over a 25-year period,
either from time of discovery or from year
of first production, reserve growth var-
ies across the world’s mature petroleum
basins. For example, total growth varied
from 2.0-fold for the West Siberian Basin of
Russia to 4.6-fold for U.S. onshore fields.
Although about two-thirds of the world’s
oil and gas reserves are located in the
Middle East and North Africa, no known
reserve growth studies have been pub-
lished for countries in these regions, except
for Iraq. Based on limited data, the USGS
estimated a reserve increase of about 1.6-
fold for Iraq over a period of 20 years,
which would roughly translate to a 2-fold
increase over a 25-year period. The lowerincrease in reserve growth there could be
attributed to various factors, such as the
Iraq-Iran wars and UN sanctions. In West
Siberia, the low 2.0-fold increase is partly
due to different reserve booking require-
ments and insufficient investments (Figure
2)5. The U.K. North Sea, having the lowest
reserve growth, is an exception because
the high cost of development dictated
more precise reserve estimation upfront
and hence lowered reserve growth. The
oil reserve growth for the U.K. and Sas-
katchewan (Canada) are also shown in theattached graph.
Importane in EstimatingReserve Growth
Reserve growth has now become an
important part of estimating total poten-
tial reserves of an individual province or
country. The scientists at the USGS are
continuing their research for a deeper
understanding of the reserve growth phe-
nomenon by evaluating the impact of its
various aspects. Some of these aspects
include lithology, infrastructure, crude oil
price, operating environments, govern-
ment policies, and technology.
As the world’s known petroleum reserves
continue to decline, there will be more
pressure on geologists and engineers in
the oil industry to make the reserve esti-
mates more precise through applicationof the reserve-growth concept. In fact, the
concept could be applied even to the
undiscovered resources with some qualifi-
cations as to the inherent risk.
Dr. Mahendra K. Verma ([email protected])is a research petroleum engineer in the EnergyResources Team with the USGS. He has over26 years of world wide oil industry experienceand has authored numerous papers on reservegrowth for petroleum provinces in the UnitedStates, Canada, Russia, and Iraq.
References:
1. Klett, T. R., Gautier, D.L., and Ahlbrandt, T.S., 2007,An evaluation of the USGS World PetroleumAssessment 2000—Supporting Data: USGS Open-File Report 2007-1021).
2. Arrington, J.R., 1960, Size of crude reserves is keyto evaluating exploration programs: Oil and GasJournal, v. 58, no. 9, February 29, 1960, p.130-134.
3. Attanasi, E.D. and Root, D.H., 1994, The Enigma of oil and gas field growth: AAPG Bulletin, v.78, no.3, March 1994, p. 321-332.
4. Verma, M.K., 2000, The significance of field growthand the role of enhanced oil recovery: USGS FactSheet FS-115-00, October 2000.
5. Verma, M.K. and Ulmishek, G.F., 2003, ReserveGrowth in oil fields of West Siberian Basin, Russia:Natural Resources Research, v.12, no.2, June 2003,
p.105-119.
“Reserves are most commonly
revised upward
0
100
200
300
400
500
600
700
800
1984 1986 1988 1990 1992 1994 1996 1998 2000
Year
P r o d u c t i o n i n
1 0 0 0 s b a r r e l s / d
©
U S G S
Graph of U.S. oil pro-duction showing per-formance of differentEOR methods, 1984 to2000.
1,0
1,5
2,0
2,5
3,0
3,5
4,0
4,5
5,0
0 5 10 15 20 25
Years Since Discovery/First Production
M
u l t i p l e o f I n i t i a l E s t i m a t e
©
U S G S
Graph displayingreserve growth fordifferent petroleumprovinces over a 25-year period. The data
illustrates 1.3- to 4.6fold increases, depend-ing upon the maturityand circumstances of production for eacharea plotted.
Year
2002 US Onshore Disc
Saskatchewan Prod.
MMS-US Offshore Disc
W. Siberia Prod. U.K. Prod.
Iraq
Volga Ural Prod.
Nitrogen Injection
HG Gas Injection
Chemical
Flue Gas Injection CO2 Injection
Thermal