United for Better Future - Varitronix for Better Future The board of directors of the Company is...
99
Varitronix International Limited Stock Code 710 Annual Report 2016 United for Better Future
Transcript of United for Better Future - Varitronix for Better Future The board of directors of the Company is...

Varitronix International Limited Stock Code 710
Annual Report 2016
United for Better Future

United for Better Future
The board of directors of the Company is pleased to announce that, on 23 March 2017,
Link Score Investment Limited (a wholly-owned subsidiary of the Company) and Chengdu
High-Tech Industrial Development Zone Management Committee 《成都高新技術產業開發區管理委員會》 entered into an investment cooperation agreement in relation to, among other
things, the investment of automobile TFT (thin film transistor) display module production lines
and related business operations (the “Project”). Varitronix (Chengdu) Display Technology Co.
Ltd. (“Varitronix Chengdu”), a wholly-owned subsidiary of the Company, is the project company
for the construction and operation of the Project. Varitronix Chengdu is to be registered in
Chengdu High-Tech Industrial Development Zone for industry and commerce, and tax registration
procedures. The total investment amount of the Project is RMB1,000 million and the Project will
be constructed in two phases. The operation of the first phase and the second phase starts at
the fourth quarter of 2017 and the third quarter of 2020 respectively. The mass production of
the first phase and the second phase is the first quarter of 2018 and the fourth quarter of 2020
respectively.

Content
2 CHAIRMAN’S STATEMENT
6 MANAGEMENT DISCUSSION AND ANALYSIS
8 REVIEW OF OPERATIONS
12 ENVIRONMENTAL, SOCIAL AND GOVERNANCE REPORT
24 BOARD OF DIRECTORS AND SENIOR MANAGEMENT
28 CORPORATE GOVERNANCE REPORT
36 REPORT OF THE DIRECTORS
45 REPORT OF THE INDEPENDENT AUDITOR
50 CONSOLIDATED STATEMENT OF PROFIT OR LOSS
51 CONSOLIDATED STATEMENT OF PROFIT OR LOSS AND OTHER COMPREHENSIVE INCOME
52 CONSOLIDATED STATEMENT OF FINANCIAL POSITION
53 CONSOLIDATED STATEMENT OF CHANGES IN EQUITY
54 CONSOLIDATED CASH FLOW STATEMENT
55 NOTES TO THE FINANCIAL STATEMENTS
94 FIVE YEAR SUMMARY
95 PROPERTIES HELD BY THE GROUP
96 CORPORATE INFORMATION

2 Varitronix International Limited
Chairman’s Statement
On behalf of Varitronix International Limited and its subsidiaries (“Varitronix” or the “Group”), I present the Group’s results for the year ended 31 December 2016.
During the year under review, revenue of HK$2,247 million was recorded, a decrease of 9.7% when compared with the HK$2,488 million recorded in 2015. EBITDA1 of the Group was HK$149 million, 61.1% lower than the HK$383 million recorded for the same period in the previous year. The profit attributable to shareholders of HK$51 million was recorded, a decrease of 83.2%, when compared with the HK$301 million recorded in 2015.
As at 31 December 2016, the cash and fixed deposits balance of the Group was HK$1,725 million, in which HK$1,400 million was attributable to the proceeds of shares subscription by the major shareholder BOE Technology Group Co., Ltd (“BOE”), compared to HK$767 million at the end of 2015. The gearing ratio, being total bank loans over net assets, was 0.3% as at 31 December 2016, lower than the 7.6% recorded in the previous year.
DiviDenDsThe Board of Directors has recommended a final dividend of 2.5 HK cents per share (2015: 30.5 HK cents). Upon completion of the new shares subscription transaction between the Company and BOE at the end of April 2016, the Company has declared a special dividend of HK$1.35 per share to the ordinary shareholders of the Company. The annual dividend payout ratio was 30% (2015: 50%), excluding the special dividend.
BUsiness ReviewThe Group’s sales revenue recorded for the year ended 31 December 2016 experienced a notable drop compared to the performance of same period of 2015. The primary reason was that, despite a slight decrease in sales quantity of monochrome displays, the average selling price decreased under the pressure of the expanding thin film transistor (“TFT”) market and changes in the product mix, resulting in a further decline of revenue from the sale of monochrome displays. In the meantime, monochrome display products of a higher average selling price were transformed to TFT module products. However, lack of own production lines for TFT panels affected the competitiveness of the Group’s TFT business in the past, while the relatively long development process of new automotive display products hindered the output growth within a short period of time. In consequence, the Group cannot achieve a significant growth in the sales of TFT module products in 2016. Moreover, in the first three quarters of this year, appreciation of Japanese yen not only led to a rise in purchasing costs of key materials from Japan, but also caused realised and unrealised foreign exchange loss that combined with the impact of depreciation of Renminbi. In addition, as the Group no longer had any one-off gain in 2016 as it did in 2015 from the disposal of its interest in Data Modul AG, and also suffered realised and unrealised loss resulting from the net change in fair value of listed securities held by the Group, the Group’s profit attributable to shareholders reduced significantly compared to the same period in 2015.
HK$ million 2016 2015
Revenue 2,247 2,488
EBITDA1 149 383
Profit Attributable to Shareholders 51 301
Cash and Fixed Deposits Balance 1,725 767
Basic Earnings per Share 8.4 HK cents 91.2 HK cents
Total Dividend per Share2 2.5 HK cents 45.5 HK cents
Highlights
1 EBITDA means profit for the year plus the following to the extent deducted in calculating such profit for the year: finance costs, income tax, depreciation and gain on disposal of an associate.
2 Total dividend per share excluding the special dividend of HK$1.35 per share.

3Annual Report 2016
Automotive Display BusinessFor the year under review, the automotive display business generated revenue of HK$1,487 million, a decrease of 10.9% from the revenue of HK$1,668 million recorded in 2015. This business represented approximately 66.2% of the Group’s overall revenue.
Regarding the European automotive display business of the Group, the mid-to-low end automobile brands that used to extensively adopt monochrome displays have turned to TFT module products rapidly because of a reduction of the TFT selling price. The demand of monochrome displays dropped accordingly, which also narrowed down the gross profit margin due to price pressure. The sales of the automobile TFT module products of the Group continued to increase during the period under review. As the selling price of those TFT modules is usually higher, the revenue generated by TFT modules was thus able to cover part of the losses incurred by the monochrome display business in Europe.
The performance of the automotive display business in the People’s Republic of China (“PRC”) and South Korea remained sluggish as most car manufactures switched to TFT displays, which also adversely affected the monochrome display business. Fortunately, the Group won a considerable amount of new TFT projects by leveraging the customer networks of the major shareholder BOE in these regions. Since the mass production of these new TFT projects has gradually commenced in the fourth quarter, it can partially offset the drop of monochrome displays business in the PRC and South Korea.
The automotive display business in Japan showed stable performance in the year under review. The Japanese market was dominated by medium and small automobile brands which essentially adopt monochrome displays. As such, the revenue from the automobile display business in Japan recorded a slight increase despite a fall in the average selling price of the monochrome displays.
Industrial Display BusinessIn 2016, revenue from the industrial display business was HK$760 million, representing a decrease of 7.3% from the HK$820 million in 2015. This business contributed approximately 33.8% of the total revenue.
Mr. Yao Xiangjun Chairman
The industrial display business in Europe secured a steady development in the year under review given the stable orders from electricity meter and white goods customers. Although industrial customers are still primarily using monochrome displays with lower selling price for the time being, the demand for the displays is stable and quantity demand is larger in the industrial sector; thus provide a sustainable revenue source for the Group.
The industrial display business in the United States of America (“US”) has always been an important contributor to the Group’s revenue. However, its development has slowed down since the first half in 2016 as some customers adjusted their production and reduced or postponed their orders, resulting in an adverse business performance in the year of review for the US market.
The industrial display business in Japan remained stable. During the year, active expansion of the industrial market has attracted industrial customers from the fields of musical instruments and office supplies etc. in Japan. These types of customers are slightly different from those of the general industrial customers of the Group and are becoming more diversified.

4 Varitronix International Limited
Chairman’s statement
PRosPeCTsAutomotive Display Business
Looking forward, the monochrome display business of the Group will remain suppressed by the TFT market and the selling price and profit margin will be still under pressure. The Group will strive to develop markets initially dominated by low-end customers, such as India, Brazil and Russia, so as to stabilise the revenue from the monochrome display business. Order inquiries regarding automotive TFT module products showed an increasing trend in the second half in 2016, and the Group had a higher probability of gaining orders for TFT products than before. The main reason for this was that BOE, being a stable supplier of TFT panels to the Group, is able to customise panels according to the design requirements of the customers, significantly enhancing the Group’s capability to win TFT orders. It is expected that mass production for these new won orders, including those from European customers, will commence gradually before the end of 2017, providing a boost to the Group’s revenue in 2017. On the other hand, given the extensive market networks and human resources of BOE in the PRC and South Korea, it is expected that the orders for TFT displays and revenue from these regions will continue to increase.
TFT displays tend to develop along the trend of large size and high resolution. The demand for full screen liquid crystal displays (“LCD”) automotive dashboards integrated with large TFT panel size, high resolution center integrated displays is growing in number. All of these will boost the quantity of TFT orders. Besides, the demand of capacitive touch panels is growing at fast pace, and we expect this will also facilitate the growth of automotive display revenue. The Group will definitely leverage on BOE, the key shareholder of the Group, which possesses strong TFT technology and production resources, to further improve its own technical and manufacturing performance, with an aim to fully capture the market opportunities.
Industrial Display BusinessThe European and US markets will continue to serve as important bases for the Group’s industrial displays, of which the applications will be mainly adopted in the white goods, electricity meter, point of sales (“POS”) device and medical product sectors. Customers in these sectors have relative stable requirements and form a
fundamental customer base for monochrome displays. In spite of a lack of significant growth in the past year, this market was still a sustainable revenue source for the Group.
Monochrome displays are still widely adopted by industrial customers. Nevertheless, driven by the increasing consumer demand for information to be obtained through the display interface, as well as the emergence of internet of thing (“IOT”) technology, manufacturers of white goods and household equipment are turning to larger colour displays that are capable of delivering more complex information. In view of this, it is expected that the industrial and white goods customers will have increasing demand for TFT modules. The Group will, subject to the enhanced TFT designs and production capability, focus on promoting applications of TFT modules to industrial customers in the coming years in order to increase the order amount and broaden the sources of revenue.
Development Strategy
Since becoming the major shareholder of the Group, BOE has been providing tremendous support to the Group in the supply of TFT panels. The market networks of BOE in the PRC and South Korea also allow the Group to further expand the presence of its automotive display business in these regions. In addition, the Group will, by leveraging the diversified production facilities of BOE that are capable of producing different areas of TFT panels, improve the efficiency and quality of TFT production so as to enhance the competitiveness of the Group’s module products in the market.
The Group has established a wholly-owned subsidiary in Chengdu, China to serve as the TFT business division of the Group, and that the Group has leased the production premise of BOE in Chengdu and acquired a set of TFT production equipment in Chengdu plant in early 2017. The Group also planned to set up an additional production line for TFT modules at the Chengdu plant in the second quarter, depending on the pace of business development.
The Group’s TFT module products have been increasing and getting diversified, the Group will strengthen its customer-oriented approach by establishing a strategic sales team that centres on customers, with a view to concentrate its resources on gaining larger order quantities for TFT module products. Although these
5Annual Report 2016
products contribute a lower profit margin due to fierce competition, their orders are usually large in quantities. The Group will actively procure large orders for the TFT module products while enhancing the bargaining power in respect of material purchase price, so that the profitability of these products, reaping the benefits of economies of scale, will gradually increase.
Technology DevelopmentsGiven the support of advanced production facilities and research & development (“R&D”) technology from BOE, the Group has been actively developing large-sized TFT modules as well as TFT modules incorporating touch screen technology specifically designed for automobiles during the year in order to stay abreast of the latest market trends. The Group expects to launch new products in the medium to long term.
The R&D team is making efforts in improving the performance of the automotive displays in order to meet the original equipment manufacturer (“OEM”) specifications in Germany and the PRC. Germany places stringent requirements on such specifications as contrast ratio, viewing angles, starting time and response time. As such, the R&D personnel are continuously refining the existing automotive displays based on these specifications to meet the standards in Europe, which in turn helps the Group further open up the European high-end automobile market. Moreover, the business networks of BOE have brought to the Group more business opportunities from automobile customers in China. As there are more and more PRC automobile customers looking for large-sized full high definition (“HD”) displays with TFT touch screen functions, the Group is working towards the goal of meeting the specifications for these modules, in the hope of gaining more business opportunities from the PRC market of automotive displays.
The future display trend falls on large displays with irregular shapes and curved edges, which the features provide greater flexibility for the displays to fit in with the designs of hardware to fulfil the aesthetic requirements of the high-end automobile customers. The newly designed modules are expected to launch in the fourth quarter in 2017. Oversized cockpit displays will be another key R&D project of the Group. Being a favourable choice for playing videos and audios in the cockpit, the oversized displays address the needs
of people nowadays who seek to keep abreast of the latest information and entertainment at all times. It is expected that production of the sample products will be completed in 2017. In addition, the market demand towards Head up Display and TFT Electronic Rear Mirror is increasing. It is expected to become another potential market segment for the Group. Products that are catered to this special demand are under R&D, with prototypes to be also completed within 2017.
The R&D projects of the Group also cover a series of display technologies, including high brightness suitable for the red green blue white (“RGBW”) design for outdoor use, high dynamic range (“HDR”) technology that improves the overall display performance, fine and narrow TFT modules, in-cell touch screens with the touch components being incorporated inside the display panels, and displays with haptic feedback which gives a more realistic sense of touch. It is expected that production of the newly designed components above will be completed progressively in the coming two years.
ACKnowleDgeMenTs The Group has rapidly realised its strategic development in 2016. After bringing BOE in as the major shareholder, the Group is promptly revamping its designs for automotive TFT modules and its business deployment for production, and has demonstrated partial achievement. The Group shall build on the partnership with BOE and move ahead to expand the business scale and market share of its automotive displays, with its commitment to be a leading designer and manufacturer of automotive display products in the global market in terms of both quantity and quality.
Under the strong back up of BOE, Varitronix is transforming itself into an enterprise with high growth potential and innovation capability. The positive results brought along by transformation will be visible from 2017 onwards, thereby creating sustainable value for investors. I would like to extend my gratitude to the Board, management, staff, shareholders and business partners, and thank all parties for their support and contribution along the way. Varitronix shall dedicate itself to secure better performance in the coming year beyond wildest expectations.
Yao Xiangjun Chairman Hong Kong, 27 March 2017

6 Varitronix International Limited
Management Discussion and Analysis
RevenUe The Group’s revenue for the year ended 31 December 2016 decreased by 9.7% to HK$2,247 million as compared to the previous financial year.
PRoFiT FRoM oPeRATions The profit from operations for the year ended 31 December 2016 was HK$60 million, a decrease of HK$265 million or 82% as compared to the previous financial year.
During the financial year 2016, the Group spent HK$133 million on research and development (“R&D”) activities, which represented approximately 6% of the Group’s revenue.
neT PRoFiT AnD DiviDenDs The profit attributable to shareholders for the year ended 31 December 2016 was HK$51 million, as compared to a profit of HK$301 million in 2015.
Basic earnings per share for the year ended 31 December 2016 were 8.4 HK cents as compared to basic earnings per share of 91.2 HK cents in the previous financial year. During the year, the Group did not declare an interim dividend. Upon completion of the new shares subscription transaction between the Company and BOE Technology Group Co., Ltd (“BOE”) at the end of April 2016, the Company declared a special dividend of HK$1.35 per share, which aggregated to HK$451 million. No special dividend was paid to BOE as it has agreed to waive its entitlement. Further details are set out in the Company’s announcement dated 28 April 2016.
The Board have recommended a final dividend of HK$0.025 per share for the year ended 31 December 2016, which will aggregate to HK$18 million. The total dividend for the year amounted to HK$1.375 per share.
sTRUCTURe oF AsseTs As at 31 December 2016, the total assets of the Group amounted to HK$3,174 million (2015: HK$2,439 million). At the year end, inventories decreased by 5% to HK$451 million (2015: HK$473 million) while available-for-sale securities amounted to HK$11 million (2015: HK$28 million).
liqUiDiTY AnD FinAnCiAl ResoURCes As at 31 December 2016, the total equity of the Group was HK$2,732 million (2015: HK$1,905 million). The Group’s current ratio, being the proportion of total current assets against total current liabilities, was 6.36 as at 31 December 2016 (2015: 3.74).
At the year end, the Group held a liquid portfolio of HK$1,790 million (2015: HK$986 million) of which HK$1,725 million (2015: HK$767 million) was in cash and fixed deposits balance, HK$65 million (2015: HK$58 million) in other financial assets and HK$nil (2015: HK$161 million) in trading securities. The unsecured interest-bearing bank loans amounted to HK$9 million (2015: HK$145 million). The gearing ratio (bank loans over net assets) was 0.3% (2015: 7.6%).
The Group’s inventory turnover ratio (annualized cost of inventories over average inventories balance) for the year was 3.9 times (2015: 4.4 times). Debtor turnover days (trade receivables over revenue times 366) for the year was 75 days (2015: 70 days).
CAsH Flows In the year under review, the Group’s cash generated from operations amounted to HK$235 million (2015: HK$289 million). The decrease in inventories and trade and other receivables raised cash flow by HK$15 million and HK$12 million respectively.
Net cash used in investing activities amounted to HK$576 million (2015: net cash generated from investing activities amounted to HK$199 million). There were payments for the purchase of fixed assets of HK$68 million (2015: HK$36 million).
CAPiTAl sTRUCTURe The Group’s long-term capital comprises shareholders’ equity and debt, which includes the bank borrowings. Upon the completion of the new shares subscription transaction between the Company and BOE on 28 April 2016, 400,000,000 ordinary shares of the Company were allotted and issued as fully paid to BOE at as an issue price of HK$3.50 per share totalling HK$1,400 million, of which HK$100 million was credited to share capital and the balance of HK$1,300 million was credited to the share

7Annual Report 2016
Management Discussion and Analysis
premium account. Issuing expenses in relation to the issuance of new shares of the Company of HK$6 million was also capitalised into the share premium account. The Group had also repaid the bank borrowings amounted to HK$184 million during the year and the bank borrowings decreased to HK$9 million as at 31 December 2016.
FoReign CURRenCY eXPosURe The Group is exposed to foreign currency risk primarily through sales, purchases, loan receivables and bank loans that are denominated in a currency other than the functional currency of the operations to which they relate. The currencies giving rise to this risk are primarily United State dollars, Euros, Japanese Yen and Renminbi.
The Group is not engaged in the use of any financial instruments for hedging purposes. However, the management monitors foreign exchange exposure from time to time and will consider hedging significant foreign currency exposure when the need arises.
ConTingenT liABiliTies As at 31 December 2016, the Company had contingent liabilities for guarantees given to banks in respect of banking facilities granted to certain subsidiaries, which were utilised to the extent of HK$9 million (2015: HK$145 million).
CoMMiTMenTs As at 31 December 2016, the Group had capital commitments of HK$84 million (2015: HK$35 million), representing the purchase of property, plant and equipment not provided for in the financial statements. The total future minimum lease payments under non-cancellable operating leases for properties payable within one year amounted to HK$6 million (2015: HK$7 million).
sTAFFAs at 31 December 2016, the Group employed 4,985 staff around the world, of whom 149 were in Hong Kong, 4,796 in the People’s Republic of China (“PRC”) and 40 were in overseas. The Group remunerates its employees based on their performance, experience and prevailing industry practice. The Group operates an employee share option scheme and provides rent-free quarters to certain of its employees in Hong Kong and the PRC.
The Group adopts a performance-based remuneration policy. Salary adjustments and performance bonuses are based on the evaluation of job performance. The aim is to create an atmosphere that encourages top performers and provides incentives for general employees to improve and excel.
sTAFF ReTiReMenT sCHeMesThe Group principally participates in defined contribution retirement plans. In Hong Kong, the Group participates in the Mandatory Provident Fund Scheme operated by independent trustees. Contribution at a fixed rate of 5% of the employee’s relevant income (the “Relevant Income”), subject to a cap of monthly Relevant Income of HK$30,000 per employee, are made to the scheme and are vested immediately.
In addition, the Group also operates a Top-Up ORSO scheme, approved by the Inland Revenue Department under Section 87A of the Inland Revenue Ordinance, and both the employer and the employee are required to contribute 5% of the excess of the Relevant Income to the scheme. It is only eligible for employees who joined the Group on or before 30 June 2009.
The employees of the Group’s subsidiaries which operate in the PRC are required to participate in central pension schemes operated by the local municipal government. The subsidiaries are required to contribute certain percentage of the payroll costs to the central pension schemes. The contributions are charged to the profit or loss as they become payable in accordance with the rules of the central pension schemes.
During the year, the total retirement scheme cost charged to the Consolidated Statement of Profit or Loss for the year ended 31 December 2016 was HK$32 million (2015: HK$31 million). Charges to administer the scheme are deducted from the employer’s contributions. Forfeited contributions are used by the employer to offset against future contributions. The amount so utilised during the year ended 31 December 2016 was HK$3,000 (2015: HK$38,000) and at 31 December 2016, the balance available to reduce the level of contributions in future amounted to HK$4,000 (2015: HK$5,000).
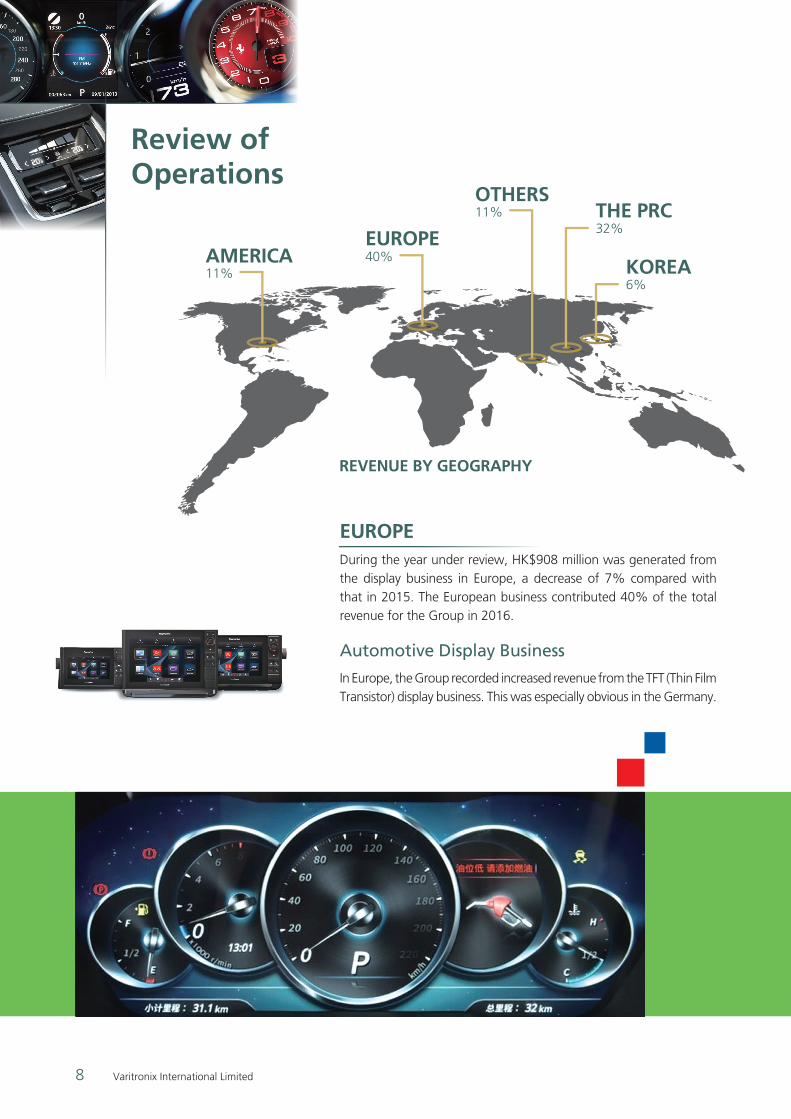
40%
32%
6%11%
11%
AMeRiCA
oTHeRs
eURoPeTHe PRC
KoReA
8 Varitronix International Limited
eURoPeDuring the year under review, HK$908 million was generated from the display business in Europe, a decrease of 7% compared with that in 2015. The European business contributed 40% of the total revenue for the Group in 2016.
Automotive Display Business
In Europe, the Group recorded increased revenue from the TFT (Thin Film Transistor) display business. This was especially obvious in the Germany.
Review of operations
RevenUe BY geogRAPHY

9Annual Report 2016
However, the passive display business continued to shrink in scale, in line with the trend recorded in the first half period in 2016.
Due to the continuous fierce competition in the TFT market in 2016, the average selling price of the TFT modules dropped. The selling price of the monochrome displays business also experienced a huge pressure and further adjusted down. Therefore, the revenue and profit margin of the automotive monochrome display business of the Group decreased accordingly. In fact, most of the mid-to-high end European automotive customers have switched from monochrome displays to TFT modules products at an accelerated rate due to drop in TFT selling price. It reduced the demand for the Group’s monochrome automotive displays in Europe market accordingly. Moreover, the adverse impact induced by the Volkswagen emissions scandal still affected the consumer demand for European cars. We expect that the monochrome display business will be still suppressed by the expanding TFT market, selling price and profit margin will be still under pressure.
Fortunately, since BOE became the stable TFT panels supplier of the Group, the Group was able to customise panels according to customers’ design requirements which largely enhanced the Group’s capability to win the TFT orders. It is expected that the Group will get more orders (including Europe) and mass production of these orders will take place before the end of 2017. It will provide a boost to the revenue of the European automotive business in 2017.
TFT displays tend to develop along the trend of high resolution, large size with irregular shapes and curved edges. Installing such display enhanced the uniqueness of car interior design which was widely acclaimed by the market. In the meantime, the market demand towards Head up Display, TFT Electronic Rear Mirror and captive touch panels are growing rapidly. All these developments will facilitate the growth of the Group’s automotive display revenue. The Group will definitely leverage on BOE’s advanced production facilitics and research and development technology to fully capture these market opportunities.
Industrial Display Business
The industrial display business in Europe developed steadily during the reporting period, with revenue similar to that in 2015. Most European countries experienced a steady development in the year under review given the stable orders from electricity meter and white goods customers.
The European market will continue to serve as an important base for the Group’s industrial displays, of which the applications will be mainly adopted in the white goods and electricity meter. Customers in these sectors have relative stable requirements and form a fundamental customer group base for monochrome displays. In spite of a lack of significant growth in the past year, this market was still a sustainable revenue source for the Group.

10 Varitronix International Limited
Looking ahead to the prospects in 2017, the current industrial customers still mainly use the monochrome display. Driven by the increasing consumer demand for information to be obtained through the display interface, as well as the emergence of Internet of Thing (“IOT”), white goods and home appliances manufacturers will use larger colour displays. Based on this, industrial and white goods market customers are expected to increase their demand for TFT modules which are capable of delivering more complex information, the Group will enhance the design and production capability of TFT accordingly. The Group will also focus on promoting applications of TFT modules to industrial customers in coming years in order to increase the orders amount and broaden the sources of revenue.
AMeRiCAAmerica generated revenue of HK$240 million in 2016, contributing 11% to the total revenue of the Group. America’s revenue in 2016 decreased by 17% as compared with that in 2015.
Industrial display has always been an important business segment in the America’s market. However, since the first half of 2016, some customers adjusted their production and reduced or postponed their orders, resulting in an adverse business performance for the America’s market.
On the industrial display business side, medical product and point of sales (“POS”) product sectors are still the major application areas. The sales team has secured certain quantity of sales orders from our key medical product and POS customer, which will provide a stable revenue source for the Group.
In terms of automotive display business, partial result has been achieved in 2016. We have established initial business connections with quite a number of second-tier automotive components suppliers, and won certain quantity of new sales orders. In future, we will strengthen our customer-oriented approach in order to gain more orders from the strategic customers.
THe PRCRevenue contributed by the PRC was HK$710 million during the year under review, representing a drop of 15% compared with that in 2015. This region accounted for 32% of the Group’s total revenue.
The performance of the automotive display business in the PRC remained sluggish as most car manufacturers switched to TFT displays, which also adversely affected the monochrome display business. Fortunately, the Group won a considerable amount of new projects by leveraging the customer networks of the substantial shareholder BOE in the PRC. Since the mass production of these new projects has gradually commenced in the fourth quarter, it can partially offset the drop of monochrome displays business in the PRC.
Moreover, the business networks of BOE have brought to the Group more business opportunities from automobile customers in the PRC. As there are more and more PRC automobile customers looking for large-sized full high definition (“HD”) displays with TFT touch
Review of operations

11Annual Report 2016
screen functions, the Group is working towards the goal of meeting the specifications for these modules, in the hope of gaining more business opportunities from the PRC market of automotive displays. In the meantime, the R&D team is making efforts in upgrading the performance of automotive displays in order to meet the original equipment manufacturer (“OEM”) specifications in the PRC through the improvement of contrast ratio, viewing angles, starting time and response time of the displays. The application of electricity meter still forms a fundamental customer base for the industrial displays market in the PRC. Our sales team has been further strengthened and expected to explore more diversified opportunities in the industrial market of the PRC by leveraging on the customer networks of BOE.
KoReARevenue generated in South Korea was HK$131 million, down 19% from 2015. South Korea accounted for 6% of the total of the total revenue of the Group.
Similar to the PRC market, most of automotive manufacturer customers adopted TFT technology in Korean market which caused the continual decline in the business performance of monochrome display. Despite of this, the Group won a considerable amount of new TFT and Touch Panel (“TP”) Projects and commenced mass production in the year under review, it can partly offset the adverse impact of drop in monochrome display business.
Looking forward, the Group had a higher probability of gaining large quantity orders for TFT products in Korea. The main reason for this was that BOE, being a stable supplier of TFT panels to the Group, is able to customize panels which significantly enhancing the Group’s capability to win TFT orders. Moreover, the diversified production facilities of BOE can strengthen the efficiency and quality of TFT production so as to enhance the competitiveness of the Group’s TFT modules products in the Korean market. It is expected that substantial growth in revenue will be realized from automotive TFT modules market on 2017.
The Group has also invested to further strengthen the technical know-how in TP for specific applications in automobiles since last year, and projects related to this technology have started to come to fruition. The Korean customer segment is one of the pioneers in the automotive industry to try new technology in automotive displays. It is expected that continual growth in revenue will be achieved from automotive touch display technology in 2017.
12 Varitronix International Limited
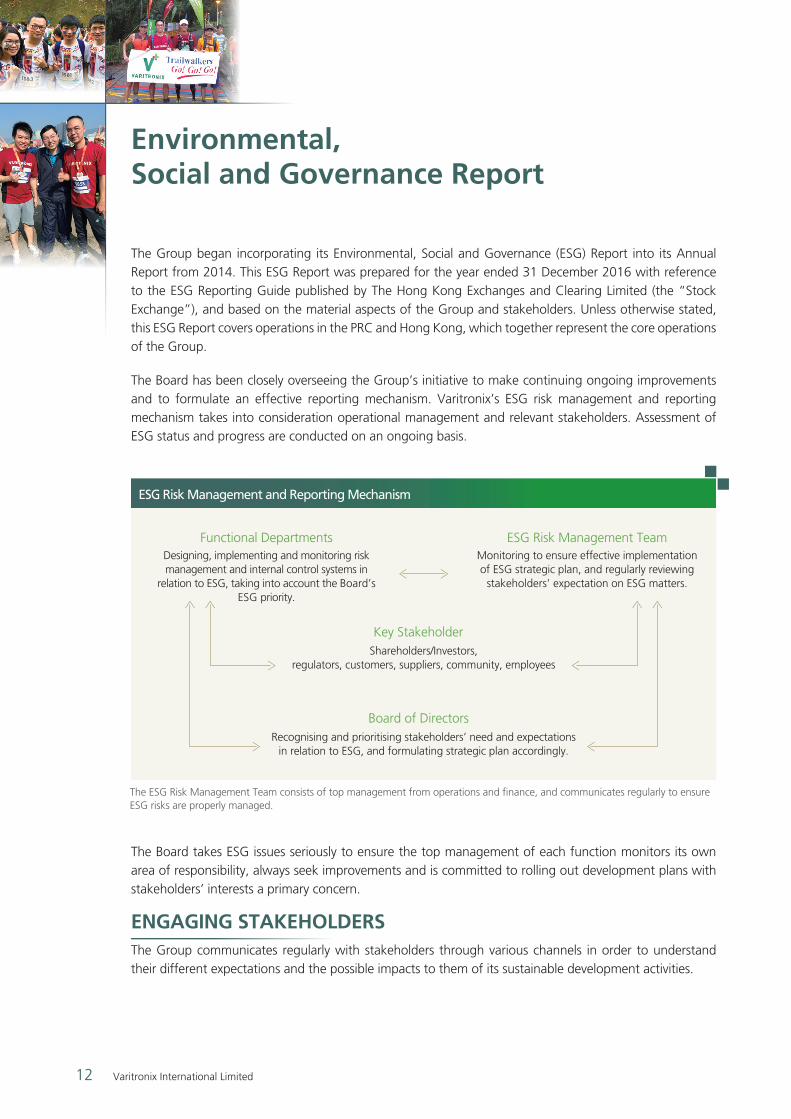
The Group began incorporating its Environmental, Social and Governance (ESG) Report into its Annual Report from 2014. This ESG Report was prepared for the year ended 31 December 2016 with reference to the ESG Reporting Guide published by The Hong Kong Exchanges and Clearing Limited (the “Stock Exchange”), and based on the material aspects of the Group and stakeholders. Unless otherwise stated, this ESG Report covers operations in the PRC and Hong Kong, which together represent the core operations of the Group.
The Board has been closely overseeing the Group’s initiative to make continuing ongoing improvements and to formulate an effective reporting mechanism. Varitronix’s ESG risk management and reporting mechanism takes into consideration operational management and relevant stakeholders. Assessment of ESG status and progress are conducted on an ongoing basis.
environmental,social and governance Report
ESG Risk Management and Reporting Mechanism
Functional DepartmentsDesigning, implementing and monitoring risk management and internal control systems in
relation to ESG, taking into account the Board’s ESG priority.
Monitoring to ensure effective implementation of ESG strategic plan, and regularly reviewing
stakeholders’ expectation on ESG matters.
ESG Risk Management Team
Recognising and prioritising stakeholders’ need and expectations in relation to ESG, and formulating strategic plan accordingly.
Board of Directors
Shareholders/Investors,regulators, customers, suppliers, community, employees
Key Stakeholder
The ESG Risk Management Team consists of top management from operations and finance, and communicates regularly to ensure ESG risks are properly managed.
The Board takes ESG issues seriously to ensure the top management of each function monitors its own area of responsibility, always seek improvements and is committed to rolling out development plans with stakeholders’ interests a primary concern.
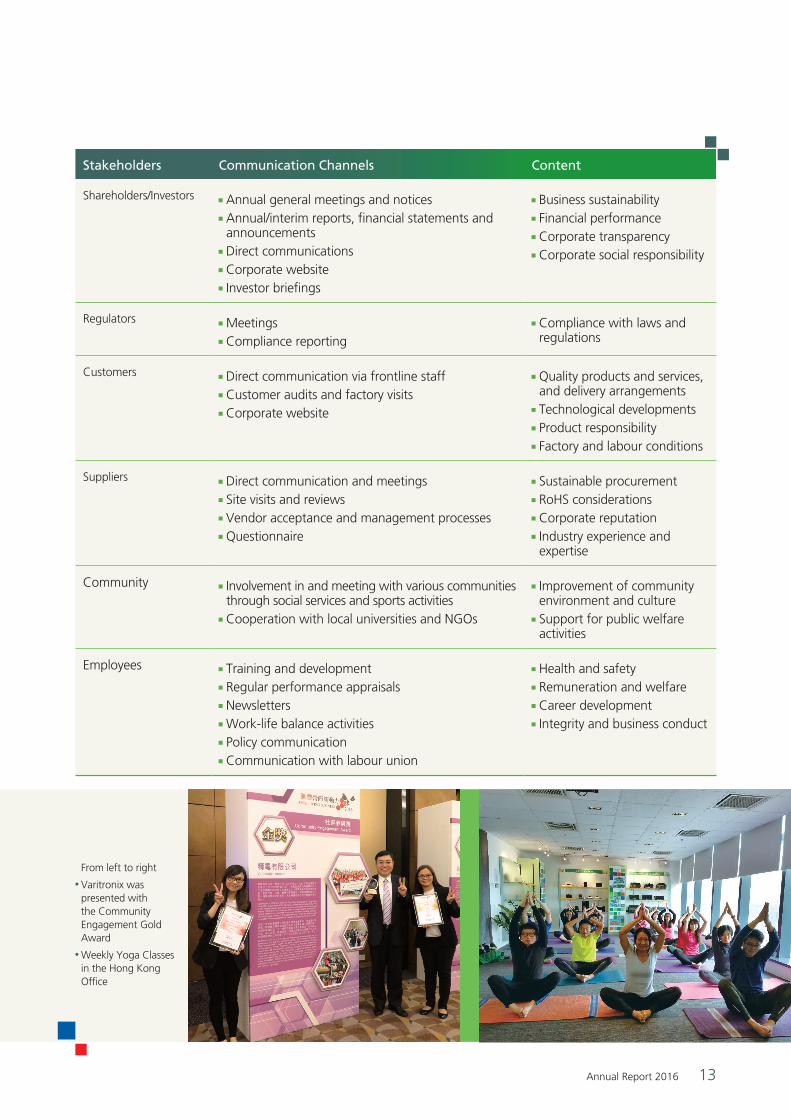
engAging sTAKeHolDeRsThe Group communicates regularly with stakeholders through various channels in order to understand their different expectations and the possible impacts to them of its sustainable development activities.
13Annual Report 2016
Shareholders/Investors Annual general meetings and notices Annual/interim reports, financial statements and announcements Direct communications Corporate website Investor briefings
Business sustainability Financial performance Corporate transparency Corporate social responsibility
Regulators Meetings Compliance reporting
Compliance with laws and regulations
Customers Direct communication via frontline staff Customer audits and factory visits Corporate website
Quality products and services, and delivery arrangements Technological developments Product responsibility Factory and labour conditions
Suppliers Direct communication and meetings Site visits and reviews Vendor acceptance and management processes Questionnaire
Sustainable procurement RoHS considerations Corporate reputation Industry experience and expertise
Community Involvement in and meeting with various communities through social services and sports activities Cooperation with local universities and NGOs
Improvement of community environment and culture Support for public welfare activities
Employees Training and development Regular performance appraisals Newsletters Work-life balance activities Policy communication Communication with labour union
Health and safety Remuneration and welfare Career development Integrity and business conduct
From left to right
Varitronix was presented with the Community Engagement Gold Award
Weekly Yoga Classes in the Hong Kong Office
Stakeholders Communication Channels Content

14 Varitronix International Limited
environmental, social and governance Report
MATERIALITY ASSESSMENTThe issues that matter most to the Group’s business and its stakeholders are identified and presented in the materiality matrix above. The Group places comparatively higher emphasis on ESG matters relating to the environment, employee safety and supply chain management as these are external stakeholders’ top concerns, weighted against the risks and opportunities they present to the Group. Whilst higher priority is given to these areas, other ESG aspects are also monitored on an ongoing basis and are included in this ESG report to enhance corporate transparency.
ENVIRONMENTOver years, the Group has developed streamlined operating processes and energy-efficient hardware to lessen energy and water utilisation, improved the use of resources and investigated new means for environmental preservation.
As a manufactur ing company, the Group’s management is always aware of the importance of sustainable development and environmental protection. The Group’s policy on emissions and waste is fully complied with the requirements of the emission standard in 《水污染物排放限值》 (DB44/26-2001), 《大氣污染物排放限值》(DB44/27-2001) and other relevant requirements and standards.
The Group has been accredited with ISO 14001 since 2005. Under this accreditation, the Group resolves to comply with environmental laws, regulations and other applicable requirements, and to reduce or eliminate pollution while minimising any impact on the environment.
The manufacturing facilities in Heyuan city are required to undergo stringent environmental audit and continuous monitoring, in order to protect the natural resources in the region and also to comply with all relevant local environmental laws and regulations.
Emission and Waste Performance
WasteTotal tonnes
in 2016
Tonnes/Revenue
(HKD1,000 million) in
2016Total tonnes
in 2015
Tonnes/Revenue
(HKD1,000 million) in
2015Total tonnes
in 2014
Tonnes/Revenue
(HKD1,000 million) in
2014
Air
HCL 3.13 1.39 2.9 1.17 3.8 1.45
Particulates <0.065 <0.0289 <0.050 <0.0201 0.098 0.0375
SO2 <0.1630 <0.0725 <0.1544 <0.0621 <0.0737 <0.0282
NOx 0.182 0.0809 0.175 0.0703 0.172 0.0658
Oil Fumes 0.01 0.01 0.02 0.01 <0.01 <0.01
water
Wastewater 662,863 294,999 837,897 336,775 859,906 329,088
solid
Solid Waste Hazardous
82.87 37 70 28 78 30
Solid Waste Non-hazardous
915* 407* 574 231 685 262
Note*: Include sludge in 2016. The Total tonnes and Tonnes/Revenue (HKD1,000 million) in 2016 are 650.07 and 289 respectively if excluding sludge.

15Annual Report 2016
Emissions
Major emissions in the production plant are primarily collected at the exhaust vents of the production buildings and canteen kitchen. Hydrochloric acid is the main emission created by the production process. It is used at the etching stage when producing LCD panels. The volatilised hydrochloric acid is drawn to the ventilation system in the production buildings, then transmitted to the neutralising machines on the rooftop and neutralised with alkali before being released to the air.
Emissions such as particulates, sulphur dioxide, nitrogen oxide and oil fumes are collected from the exhaust vent at the canteen kitchen. These substances are mainly produced during the process of fuel combustion.
During the reporting period, the Company’s product structure is in the adjustment and transformation period, thus the emission and waste performance has changed as compared to the previous years. The quantity of emissions of hydrochloric acid, particulates, sulphur dioxide, nitrogen oxide and oil fumes were all within the standards as stipulated by the Environmental Protection Bureau in Heyuan. Environmentally clean fuel has been used consistently since the second half of 2009, to reduce the emission of nitrogen oxide from kitchen ventilation.
Note: Due to the product mix structure change, TFT portion is increasing. The electricity consumption from production line utility, air-conditioning system is increased because the new TFT production area is built in 2016. During the internal testing period, the production line does not have output, then the average consumption rate is increased.
Note: Due to the product mix structure change, TFT portion is increasing. The electricity consumption from production line utility, air-conditioning system is increased because the new TFT production area is built in 2016. During the internal testing period, the production line does not have output, then the average electricity cost is increased, the corresponding indirect CO2 emission is also increased.
Wastewater
Waste is unavoidable during the manufacturing and operation process, but the Group keeps a stringent control on the emission and ensures it is properly treated to minimise any negative impact to the environment.
Wastewater generated during the manufacturing process is treated in a large underground wastewater treatment facility with a daily maximum treatment capacity of 4,000 cubic meters. The current actual daily treatment is about 3,000 cubic meters. A computer software program recognised by the Heyuan Environmental Protection Bureau has been installed to provide the data on elements such as Chemical Oxygen Demand (COD) and the PH level at the discharge vent directly to the Bureau’s system. That means the wastewater discharge in the production plant is under continuous and timely monitoring by the Bureau. During the reporting period, there was no event or reported case of non-compliance which significantly influenced the water source.
The quantity of wastewater usage decreased as compared to the last year because the Company’s product mix structure is changing in 2016.
gReenHoUse gAs eMissions
1,500
1,400
1,300
1,200
1,100
FY2014 FY2015 FY2016
electricity Consumption per Production output
Electricity (kWh / per 1,000 unit)
25
20
15
10
5
FY2014 FY2015 FY2016
water Consumption per Production output
Water (tonne / per 1,000 unit)
0.07
0.06
0.05
0.04
0.03
FY2014 FY2015 FY2016
emissions per Production output
CO2 (tonne / per 1,000 unit)

16 Varitronix International Limited
environmental, social and governance Report
Solid Waste
Non-hazardous solid waste is usually produced during manufacturing and daily living. Used carton boxes, wooden packing cases and scrap glass are collected by qualified recycling contractors. Production plant staff are also encouraged to put rubbish into designated garbage containers. Such collected garbage is also collected by qualified recycling contractors.
Hazardous waste from the production area consists primarily of materials used in the manufacturing process. Chemicals used during production are collected and treated in full compliance with local environmental regulations.
Measures to Reduce Emissions and Waste
In 2016, the Group mitigated 2.8 tonnes (per annum) of hazardous waste by recycling the used non-dust cloths, classified as hazardous waste after use with alcohol, with special treatment. Wastewater was also reduced to 40mg/L of Chemical Oxygen Demand (COD) through Mixed Wastewater Treatment of domestic sewage and industrial wastewater, which is lower than the emission standard value of 90mg/L.
Use of Resources
As a manufacturing company, electricity and water are the resources most used during the course of operations. Management recognises the significance of energy conservation, and ongoing measures are in place to reduce the use of natural resources. The Group regularly reviews ways for the efficient use of resources and develops improvement plans, with the aim of further reducing consumption of these resources while maintaining effective operation of the production plant. Nevertheless, with the change in market demand, the Group installed new production machines in 2016 to adjust the product structure, resulting in an increase in consumption of electricity when compared to 2015.
At the same time, the Group strives to minimise any impact on the environment and save material costs by continuously reviewing the design for product packaging, with the aim of reducing packaging size. Despite this, as
the Group’s products are glass LCD panels or modules, they must be protected with polyfoam trays during delivery and so the use of polyfoam trays is unavoidable.
In 2016, the quantities of carton boxes and polyfoam trays used for product storage and transportation were 928 tonnes and 907 tonnes respectively. This indicates a decrease of 17% and 9% respectively, as compared with the year 2015.
Below is a table outlining the energy consumption, water utilisation and packaging material used by the Group during the reporting period, as compared with the data recorded in 2014, 2015 and 2016.
Total tonnes in
2016
Tonnes/Revenue
(HKD1,000 million) in
2016
Total tonnes in
2015
Tonnes/Revenue
(HKD1,000 million) in
2015
Total tonnes in
2014
Tonnes/Revenue
(HKD1,000 million) in
2014
Electricity (kWh)
91,205,623 40,589,952 90,905,585 36,537,615 89,012,950 34,065,423
Water (Tonne)
1,145,386 509,740 1,414,773 568,639 1,251,385 478,907
Carton boxes (Tonne)
928 413 1,118 449 973 372
Polyfoam trays (Tonne)
907 404 999 402 825 316
Hong Kong Office
Electricity (kWh)
117,330 52,216 153,859 61,840 154,891 59,277
Water (Tonne)
96 43 88 35 90 34
Energy Consumption, Water Utilisation and Packaging Material Used
Heyuan Production Plant

17Annual Report 2016
Recognition
The Group received recognition for its efforts in environmental protection in 2016. Varitronix was awarded with the “Green Office Label” by the World Green Organisation. The Hong Kong office was also presented with a “Green Achievement Award – Certificate of Merit” by the HSBC Living Business Awards Programme1.
soCiAlEmployment
The Group strictly observes the labour law in Hong Kong and the PRC. It is the policy of the Company to maintain a working environment that complies with the Race Discrimination Ordinance, Sex Discrimination Ordinance, Disability Discrimination Ordinance and the Family Status Discrimination Ordinance of the Ordinance and Code of Practice.
Measures to Reduce Energy Consumption and Water Utilisation
As at 31 December 2016, 500 T8 and T5 light bulbs had been phased-out and replaced with LED lights. The water used in the production process was collected and reused in the toilet flushing system, thus the amount of tap water is reduced.
Environmental Education
In 2016, the “Green Office” concept continued to be the main theme for the headquarters office in Hong Kong, and the production plant in Heyuan. In the same year, the headquarters went through a second audit to drive carbon reduction by adopting a series of green office best practice, and the “Green Office Label” was awarded by the World Green Organisation.
Besides the “Green Office Label”, the Hong Kong office was also accredited with the “Green Achievement Award” by the HSBC Living Business Awards 2016 for its carbon reduction efforts. In the Hong Kong office, the consumption level of electricity is announced on a monthly basis, in order to enhance the awareness of energy saving among colleagues.
The Heyuan plant also adopted the green office practice in the daily operation, and a “Best Green Office Competition” was conducted. The competition was warmly received and staff expressed their wishes to create a greener working environment in the coming years.
In addition to green office and green cycling activities, the Heyuan plant also held an “Environmental Campaign Design Competition” to arouse staff awareness on the hazards of air pollution and the importance of protecting the environment.
1.“The HSBC Living Business Awards Programme” is supported by the Business Environment Council, The Hong Kong Council of Social Service and the Hong Kong Institute of Human Resources Management. The programme is open to all SMEs’ in Hong Kong.
18 Varitronix International Limited
environmental, social and governance Report
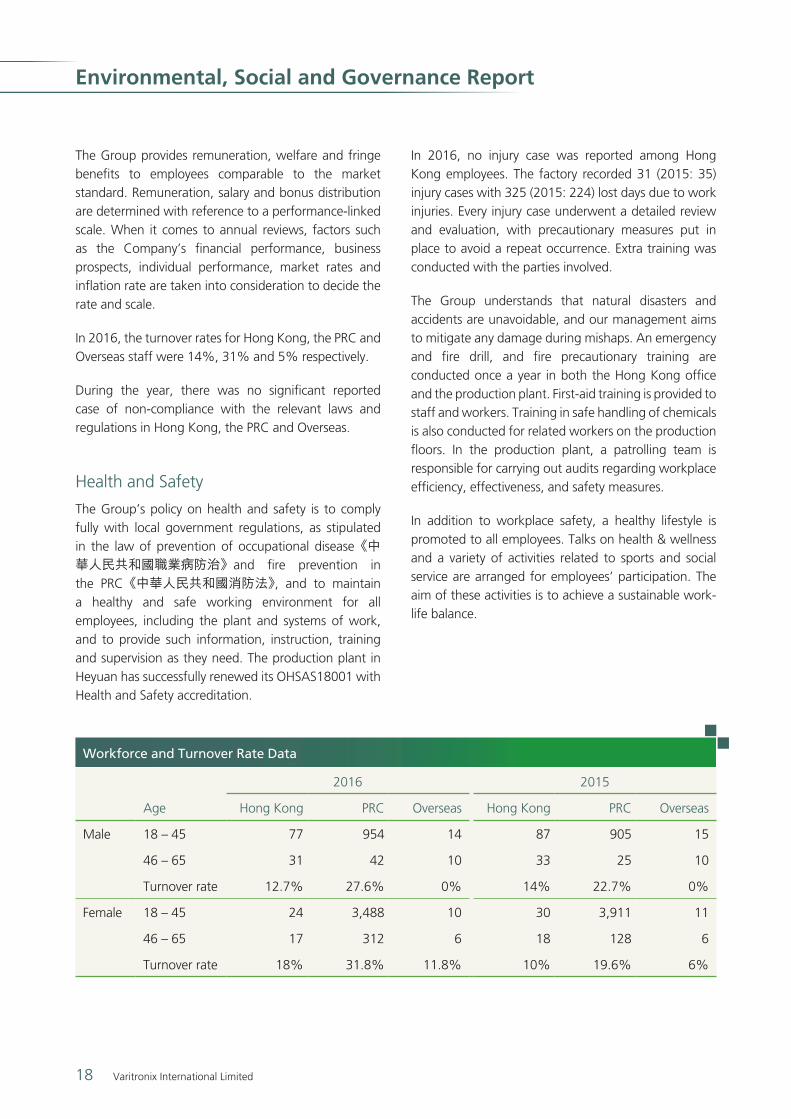
The Group provides remuneration, welfare and fringe benefits to employees comparable to the market standard. Remuneration, salary and bonus distribution are determined with reference to a performance-linked scale. When it comes to annual reviews, factors such as the Company’s financial performance, business prospects, individual performance, market rates and inflation rate are taken into consideration to decide the rate and scale.
In 2016, the turnover rates for Hong Kong, the PRC and Overseas staff were 14%, 31% and 5% respectively.
During the year, there was no significant reported case of non-compliance with the relevant laws and regulations in Hong Kong, the PRC and Overseas.
Health and Safety
The Group’s policy on health and safety is to comply fully with local government regulations, as stipulated in the law of prevention of occupational disease《中 華人民共和國職業病防治》and fire prevention in the PRC《中華人民共和國消防法》, and to maintain a healthy and safe working environment for all employees, including the plant and systems of work, and to provide such information, instruction, training and supervision as they need. The production plant in Heyuan has successfully renewed its OHSAS18001 with Health and Safety accreditation.
In 2016, no injury case was reported among Hong Kong employees. The factory recorded 31 (2015: 35) injury cases with 325 (2015: 224) lost days due to work injuries. Every injury case underwent a detailed review and evaluation, with precautionary measures put in place to avoid a repeat occurrence. Extra training was conducted with the parties involved.
The Group understands that natural disasters and accidents are unavoidable, and our management aims to mitigate any damage during mishaps. An emergency and fire drill, and fire precautionary training are conducted once a year in both the Hong Kong office and the production plant. First-aid training is provided to staff and workers. Training in safe handling of chemicals is also conducted for related workers on the production floors. In the production plant, a patrolling team is responsible for carrying out audits regarding workplace efficiency, effectiveness, and safety measures.
In addition to workplace safety, a healthy lifestyle is promoted to all employees. Talks on health & wellness and a variety of activities related to sports and social service are arranged for employees’ participation. The aim of these activities is to achieve a sustainable work-life balance.
2016 2015
Age Hong Kong PRC Overseas Hong Kong PRC Overseas
Male 18 – 45 77 954 14 87 905 15
46 – 65 31 42 10 33 25 10
Turnover rate 12.7% 27.6% 0% 14% 22.7% 0%
Female 18 – 45 24 3,488 10 30 3,911 11
46 – 65 17 312 6 18 128 6
Turnover rate 18% 31.8% 11.8% 10% 19.6% 6%
Workforce and Turnover Rate Data

19Annual Report 2016
2016 2015
Total Training
HoursTotal
ParticipantsTotal
Headcounts
Average Training Hours
per Staff Member
Total Training
HoursTotal
ParticipantsTotal
Headcounts
Average Training Hours
per Staff Member
HK Staff 332 207 149 2.2 795 300 168 4.7
PRC Staff
5,274 2,993 770 6.8 3,173 689 699 4.5
PRC Workers
19,312 6,886 4,026 4.8 20,364 4,262 4,270 4.8
Development and Training
The Group’s values its employees and is committed to providing an ideal workplace in which its staff members may grow and develop. In 2016, the Group conducted a series of training sessions for staff and workers.
The Group’s policy is to ensure that all employees achieve personal growth in their careers, and training is therefore encouraged. This is usually held during working hours, so that employees need not sacrifice personal time for training. A flexible work pattern may be scheduled for Hong Kong staff members working in the production plant if they need to pursue further studies.
Training covers a wide range of topics including operational skills, craftsmanship, display technology, quality standards, environmental matters, health and safety and soft management skills. Senior managerial staff members are usually invited to be technical instructors. External coaches are employed for specific trainings on soft management skills. In 2016, external coaches were employed to conduct an Outward Bound training for the engineering staff. The training aims at fostering personal development, teamwork, problem solving, and interpersonal skills.
Labour Standards
The Group complies with and observes the respective Labour Laws and Regulations in its operating countries. As a responsible employer, the following principles are strictly enforced:
No child labour
Ensure that wages comply with or exceed the minimum legal requirements of the country where employees are based
Overtime practice is based on a voluntary pattern, no forced labour is allowed
Respect for the opinions of general employees and the labour union
Formal complaint channels are established and are regularly promoted to employees
Equal employment opportunities – employment of disadvantaged employees and diversity and inclusion are encouraged in the workplace
Harassment and abuse – these are actively discouraged in any form, to or among all employees
Protection of privacy and personal data at work
All potential applicants are required to complete the Company’s Employment Application Form, where personal data such as, names, contact details, ID numbers, etc. will be provided by the applicants. Human Resources Department will then reference check the ID cards to ensure that they meet the minimum age standard, i.e. 18 years or above.

20 Varitronix International Limited
environmental, social and governance Report
Supply Chain Management
The Group takes a collaborative approach to supply chain sustainability management, as it views its suppliers as part of an interdependent ecosystem.
In 2016, the Group took the initiative to evaluate its suppliers’ social responsibility performance. Both material suppliers and logistics service vendors were included in an evaluation distribution list. Completed questionnaires helped the Group to understand and evaluate the performance of its suppliers and vendors in the aspects of:
Work hours
Child labour
Forced labour
Health and safety
Environmental concerns
Corporate social responsibility
Distribution of Suppliers
Suppliers are divided into material suppliers and logistics service vendors. Certain material suppliers are requested to sign a declaration declaring that their packing material and Bill of Material (BOM) contains no hazardous substance. There was no reported case of violation of the declaration by any of our suppliers in the reporting period.
Selection and Evaluation of Suppliers
The Group selects suppliers and purchases materials and/or services from suppliers and vendors using three methods, namely, price comparison, bidding and sentinel procurement. Audits of suppliers and vendors are performed on a regular basis. Results are compiled for review by the Supplier Quality Team and are approved by the department head of Quality.
Criteria for audit include:
General operation and workforce condition
Quality qualification
Quality system training
Inspection procedures for quality systems
Handling procedures for customer complaints
Calibration
Material suppliers control and handling procedures
Production process control and inspection
Past performance record
Number Percentage (%)
Total No. of suppliers for manufacturing operations
78 –
Total No. of suppliers questionnaires received
78 100
Total No. of completed questionnaires returned
60 77
Table of Distribution and Response Status
Rating Number Percentage (%)
Outstanding 40 66
Above Average 16 27
Average 4 7
Need Improvement 0 –
Below Standard 0 –
Total 60 100
Table of Results
PRC Asia EuropeUnited States
Material Suppliers
249 65 29 22
Logistics Service Vendors
2 2 5 1
Suppliers by Geographical Region
21Annual Report 2016
The Group’s prime objective is to provide high quality products that fully conform to their requirements and specifications. This commitment is fundamental to all work undertaken and is closely observed by all members of the Group in their daily activities. All products must strictly comply with the Group’s policy of operating a Quality Management System that fully meets the requirements of ISO 9001 and ISO/TS 16949 for automotive products and any related Quality Assessment Schedules/Supplements. This standard stipulates the process from product development to production within the automotive industry. The procedure must be followed by all design, manufacturing and quality engineers throughout the whole product development process. In addition, Hazardous Substance Process Management is in place where procedures and related processes have been assessed and confirmed to be compliant with QC 080000. The production plant in Heyuan is accredited with ISO 9001, ISO/TS 16949 and QC 080000 certifications.
To ensure stringent quality management, the Group’s Incoming Quality Control Team screens the incoming materials by sampling. Only unexpired and good quality materials are accepted for the production process. Similarly, finished goods go through a stringent quality check before being passed to the finished goods warehouse. The Quality Department and sales people also provide comprehensive service ranging from failure analysis and 8D reporting to production and process improvement when handling customer enquiries.
Service Vendors
The Logistics Department screens and selects service vendors by tender comparison. Factors for consideration include:
Company background – financial stability, reputation and global network
Pricing and competitiveness
Services – performance track record, efficiency and customer service
Environmental performance – for instance, all vendors must use trucks compliant with Euro IV and V standards
Product Responsibility
Varitronix has no recall on products sold or shipped due to safety and health reasons in 2016. There are average 132 cases and 117 cases per month of automotive quality enquiries in 2015 and 2016.
Safety is always the core of the Group quality policy. To pursue such policy, the group is qualified by International Standard: ISO 14000 and OC 080000. With these standards, the Group has developed an intensive system, to ensure no harmful substances (dangerous material lists from RoHS/REACH) going into Varitronix finished goods. As a result, there is no concerned recall in 2016 record.
As one of major automotive component suppliers, the group takes responsibility for those rejected parts. Such responsibility covers 8-discipline reporting (8D), customer complaint review meeting (CCR) and continuous improvement plan (CIP). With 8D approach, the negative impact from defects is quickly limited by containment action (which is mostly defined in 48 hours). With weekly CCR, “cause and action” will be fully consolidated across departments like Production, Process and Design. Furthermore, to achieve reject rate in PPM (parts per million) level, CIP is carried out quarterly with the involvement of the senior management.

22 Varitronix International Limited
environmental, social and governance Report
Protection of Intellectual Property Rights
Varitronix is devoted to respect the concept of intellectual property which include but not limited to patents, product information, technology, product design, outlook, trademarks, software, trade secrets, images, sound records, pictures and etc. The Group possesses the patent, copyright and trademark and related rights, or obtain the authorization in legitimate ways. They are protected by international treaties about intellectual property. Without the permission of the Group, other parties cannot possess, use, reproduce, record or display any related intellectual property which belongs to the Group. Otherwise the Group will consider to take legal actions.
Data Protection and Privacy Policies
In order to gain trust from our stakeholders, the security of their personal information is important to us. The Group acknowledges the importance in handling the personal information carefully.
The Group understands stakeholders use their personal information for different purpose. Therefore, it is important for us to handle this information with care. To protect this information from any unauthorised access, accidental loss and destruction, the Group adopts appropriate security measures in the transfer and storage of the personal data.
Anti-Corruption
The Group places emphasis on ensuring all business is conducted in accordance with relevant local laws and regulations, with policies in place to safeguard against corruption activities. Such measures are preventive, detective and punitive in nature.
Policies include:
Code of conduct, which covers conflict of interests and acceptance of advantages / benefits
Whistle-blowing policy
Entertainment policy
Travel policy
In addition, the Staff Handbook has stipulated rules and regulations for employees. The clear layout of policies can prevent arguments and disputes from employees. To date, no established case of corrupt practices has been uncovered.
Community Involvement
The Group is resolved to cultivate good relationships and focusing on needy areas within the community. The Varitronix Social Service Team has enjoyed a successful partnership with ELCHK Sheung Tak Integrated Youth Service Centre (“Sheung Tak”) since 2013, serving youngsters from ethnic groups such as Indians and Pakistanis.
In 2016, the Varitronix Social Service Team engaged in a new mentorship programme themed “Career Planning”. The volunteers took on the mission of counselling a group of ethnic DSE graduates to develop their career plans.
The project was not easy to execute, and demanded a great deal of participation and effort from the volunteers who guided the youngsters throughout the process. A series of career visitations were provided by partner enterprises for the youngsters to enhance their understanding of different careers, while the role of the social workers of Sheung Tak and Varitronix’s volunteering mentors were to monitor the progress of the project and to match up suitable youngsters with partner enterprises for a two-week internship opportunity.
The Varitronix Social Service Team cares deeply about the development and prospects of this group of ethnic young people. Looking into the future, it is committed in serving this particular group of young people long-term. Programmes such as Community Care with aims to provide assistance to the ethnic Mothers or kids will be embarked upon in the coming years.
Community Engagement Award
Varitronix was presented with the Gold Award in the Community Engagement category in the HSBC Living Business Awards in 2016. The Award recognizes the Group’s outstanding performance in serving the underprivileged and niche group in Hong Kong.

23Annual Report 2016
The Group provided sustainability in the community services, and performed exceptionally well in co-organising a four-year community integration programme named ‘Understanding Ethnic Neighbor Project’ with the Sheung Tak Integrated Youth Service Centre of the Evangelical Lutheran Church of Hong Kong. The programme organized activities periodically to help South Asian minorities to build up their confidence and settle down in Hong Kong.
The Award is a meaningful encouragement to the Group. It will continue to encourage employees and their families to take part in the Group’s social service activities, which will broaden the horizon of the staff and to contribute to the community.
Participation in Charity and Work-Life Balance Activities
The Group is involved in a variety of events that combine charity and sports. In 2016, the Group sponsored colleagues to participate in:
Hong Kong Streetathon @ Kowloon East
Standard Chartered Marathon
Totem Run
Oxfam Trailwalker
Weekly yoga classes were organised in the Hong Kong office to encourage healthy living, and attracted not only female colleagues but also, male colleagues to join. The Group encourages work-life balance, and a singing team was formed for colleagues who have an interest in singing. The team’s effort was applauded at the HK Annual Dinner in January 2017.
24 Varitronix International Limited
Board of Directors and Senior Management
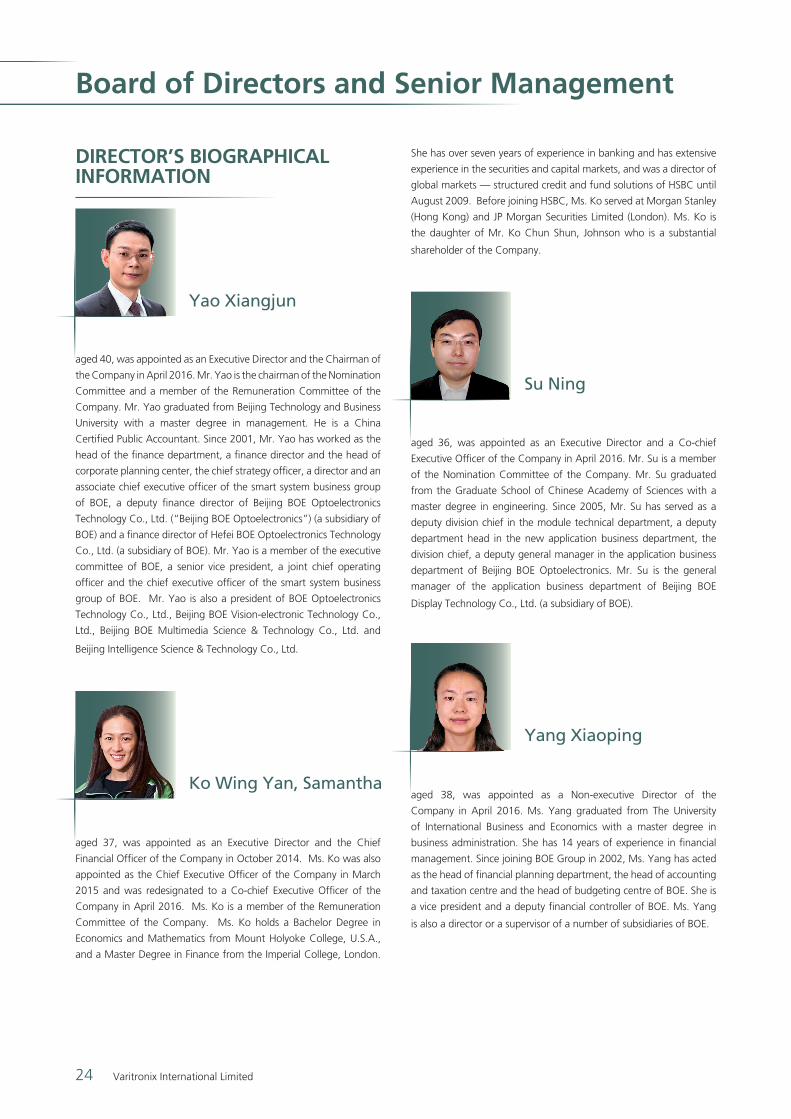
DiReCToR’s BiogRAPHiCAl inFoRMATion
She has over seven years of experience in banking and has extensive
experience in the securities and capital markets, and was a director of
global markets — structured credit and fund solutions of HSBC until
August 2009. Before joining HSBC, Ms. Ko served at Morgan Stanley
(Hong Kong) and JP Morgan Securities Limited (London). Ms. Ko is
the daughter of Mr. Ko Chun Shun, Johnson who is a substantial
shareholder of the Company.
aged 40, was appointed as an Executive Director and the Chairman of
the Company in April 2016. Mr. Yao is the chairman of the Nomination
Committee and a member of the Remuneration Committee of the
Company. Mr. Yao graduated from Beijing Technology and Business
University with a master degree in management. He is a China
Certified Public Accountant. Since 2001, Mr. Yao has worked as the
head of the finance department, a finance director and the head of
corporate planning center, the chief strategy officer, a director and an
associate chief executive officer of the smart system business group
of BOE, a deputy finance director of Beijing BOE Optoelectronics
Technology Co., Ltd. (“Beijing BOE Optoelectronics”) (a subsidiary of
BOE) and a finance director of Hefei BOE Optoelectronics Technology
Co., Ltd. (a subsidiary of BOE). Mr. Yao is a member of the executive
committee of BOE, a senior vice president, a joint chief operating
officer and the chief executive officer of the smart system business
group of BOE. Mr. Yao is also a president of BOE Optoelectronics
Technology Co., Ltd., Beijing BOE Vision-electronic Technology Co.,
Ltd., Beijing BOE Multimedia Science & Technology Co., Ltd. and
Beijing Intelligence Science & Technology Co., Ltd.
Yao Xiangjun
Su Ning
Yang Xiaoping
Ko Wing Yan, Samantha
aged 37, was appointed as an Executive Director and the Chief
Financial Officer of the Company in October 2014. Ms. Ko was also
appointed as the Chief Executive Officer of the Company in March
2015 and was redesignated to a Co-chief Executive Officer of the
Company in April 2016. Ms. Ko is a member of the Remuneration
Committee of the Company. Ms. Ko holds a Bachelor Degree in
Economics and Mathematics from Mount Holyoke College, U.S.A.,
and a Master Degree in Finance from the Imperial College, London.
aged 36, was appointed as an Executive Director and a Co-chief
Executive Officer of the Company in April 2016. Mr. Su is a member
of the Nomination Committee of the Company. Mr. Su graduated
from the Graduate School of Chinese Academy of Sciences with a
master degree in engineering. Since 2005, Mr. Su has served as a
deputy division chief in the module technical department, a deputy
department head in the new application business department, the
division chief, a deputy general manager in the application business
department of Beijing BOE Optoelectronics. Mr. Su is the general
manager of the application business department of Beijing BOE
Display Technology Co., Ltd. (a subsidiary of BOE).
aged 38, was appointed as a Non-executive Director of the
Company in April 2016. Ms. Yang graduated from The University
of International Business and Economics with a master degree in
business administration. She has 14 years of experience in financial
management. Since joining BOE Group in 2002, Ms. Yang has acted
as the head of financial planning department, the head of accounting
and taxation centre and the head of budgeting centre of BOE. She is
a vice president and a deputy financial controller of BOE. Ms. Yang
is also a director or a supervisor of a number of subsidiaries of BOE.
25Annual Report 2016
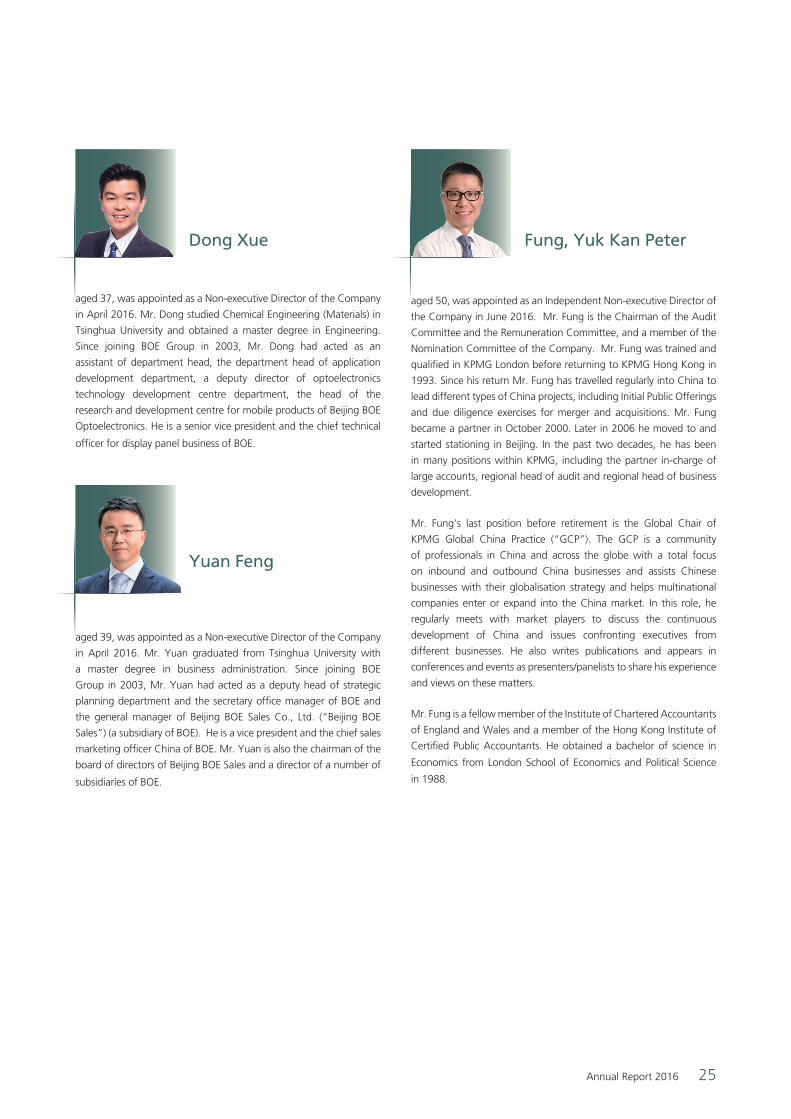
aged 37, was appointed as a Non-executive Director of the Company
in April 2016. Mr. Dong studied Chemical Engineering (Materials) in
Tsinghua University and obtained a master degree in Engineering.
Since joining BOE Group in 2003, Mr. Dong had acted as an
assistant of department head, the department head of application
development department, a deputy director of optoelectronics
technology development centre department, the head of the
research and development centre for mobile products of Beijing BOE
Optoelectronics. He is a senior vice president and the chief technical
officer for display panel business of BOE.
Dong Xue Fung, Yuk Kan Peter
Yuan Feng
aged 39, was appointed as a Non-executive Director of the Company
in April 2016. Mr. Yuan graduated from Tsinghua University with
a master degree in business administration. Since joining BOE
Group in 2003, Mr. Yuan had acted as a deputy head of strategic
planning department and the secretary office manager of BOE and
the general manager of Beijing BOE Sales Co., Ltd. (“Beijing BOE
Sales”) (a subsidiary of BOE). He is a vice president and the chief sales
marketing officer China of BOE. Mr. Yuan is also the chairman of the
board of directors of Beijing BOE Sales and a director of a number of
subsidiaries of BOE.
aged 50, was appointed as an Independent Non-executive Director of
the Company in June 2016. Mr. Fung is the Chairman of the Audit
Committee and the Remuneration Committee, and a member of the
Nomination Committee of the Company. Mr. Fung was trained and
qualified in KPMG London before returning to KPMG Hong Kong in
1993. Since his return Mr. Fung has travelled regularly into China to
lead different types of China projects, including Initial Public Offerings
and due diligence exercises for merger and acquisitions. Mr. Fung
became a partner in October 2000. Later in 2006 he moved to and
started stationing in Beijing. In the past two decades, he has been
in many positions within KPMG, including the partner in-charge of
large accounts, regional head of audit and regional head of business
development.
Mr. Fung’s last position before retirement is the Global Chair of
KPMG Global China Practice (“GCP”). The GCP is a community
of professionals in China and across the globe with a total focus
on inbound and outbound China businesses and assists Chinese
businesses with their globalisation strategy and helps multinational
companies enter or expand into the China market. In this role, he
regularly meets with market players to discuss the continuous
development of China and issues confronting executives from
different businesses. He also writes publications and appears in
conferences and events as presenters/panelists to share his experience
and views on these matters.
Mr. Fung is a fellow member of the Institute of Chartered Accountants
of England and Wales and a member of the Hong Kong Institute of
Certified Public Accountants. He obtained a bachelor of science in
Economics from London School of Economics and Political Science
in 1988.

26 Varitronix International Limited
Board of Directors and senior Management
aged 52, was appointed as an Independent Non-executive Directors
of the Company in June 2016. Mr. Chu is a member of the Audit
committee, the Remuneration Committee and the Nomination
Committee of the Company. Mr. Chu has over 15 years of business
experience and over 9 years of experience in corporate governance.
Mr. Chu is the chief executive officer of mReferral Corporation (HK)
Limited which is a leading mortgage referral company and is a joint
venture of Midland Holdings Limited and Cheung Kong (Holdings)
Limited. From March 2012 to June 2012, he was the chief financial
officer of China Smart Electric Co. Ltd. From July 2009 to October
2011, he was the chief financial officer of Trony Solar Holdings
Company Limited which is a publicly listed company on the Main
Board of the Stock Exchange. From September 2010 to May 2012,
he was an independent non-executive Director of China Kingstone
Mining Holdings Limited which is a publicly listed company on the
Main Board of the Stock Exchange. He has previously worked for
Shanghai Century Acquisition Corporation, a company listed on
the American Stock Exchange, and United Energy Group Limited, a
company listed on the Stock Exchange. He was a director at ABN
AMRO Asia Corporate Finance Ltd. and was also a director at the
Hong Kong and Shanghai Banking Corporation Ltd. From June 2012
to June 2015, he was an independent non-executive Director of
Weichai Power Co. Ltd. which is a publicly listed company on the
Main Board of Stock Exchange. He resigned as an independent
non-executive director of Directel Holdings Limited which is listed
on the Growth Enterprise Market of the Stock Exchange in June
2016. He obtained a master degree of business administration from
the Columbia University and a bachelor degree of science from the
University of Rochester in 1990 and 1986 respectively.
aged 79, was appointed as an Independent Non-executive Director of
the Company in March 2005. He is a member of the Audit Committee,
the Remuneration Committee and the Nomination Committee of the
Company. Mr. Hou graduated from Peking University in 1958 with
a Bachelor’s degree in Physics. From 1993 to 1997, Mr. Hou was
a Director of the Institute of Acoustics of the Chinese Academy of
Sciences. From 1988 to 1993, Mr. Hou was a Secretary General of
the Chinese Academy of Sciences.
Chu, Howard Ho Hwa Hou Ziqiang

27Annual Report 2016
senioR MAnAgeMenT’s BiogRAPHiCAl inFoRMATion
Lam Cheuk Yin, Kennethaged 42, is the Financial Controller and Company Secretary of the
Group. He holds a Bachelor of Business Administration (Accountancy)
from City University of Hong Kong, and is an Associate Member of
the HKICPA. He joined the Group in July 2005.
Fung Yeuk Keungaged 62, is the General Manager, responsible for Passive
Manufacturing of the Group. He conducted his PhD research study
in the Liquid Crystal Institute of Kent State University and obtained a
Master and a Doctorate degree in Physics from the same university.
Dr. Fung joined the Group in 1995 and resigned in 2006. He rejoined
the Group in November 2009.
Park Soo Bin, Jamesaged 46, is the Chief Technology Officer, head of Technical Group.
He holds a Bachelor of Physics degree from Sogang University in
South Korea. He joined the Group in October 2006.
Hidehiro Hashimoto aged 64, is the Assistant General Manager, responsible for Quality
of the Group. He holds a Master’s degree in Engineering from Osaka
University in Japan. He joined the Group in December 2015.
Lo Pak Chi, Patrickaged 43, is the Senior Manager, responsible for TFT & Touch Panel
Manufacturing of the Group. He holds a Bachelor’s degree in Applied
Physics from The Hong Kong Baptist University. He joined the Group
in May 1998.
Ng Siu Keung, Ricardoaged 54, is the Senior Manager – Information Service, Facilities,
Shipping & External Affairs (PRC) of the Group. He is the 8th Committee
Member of Yuancheng District, Heyuan City of the Chinese People's
Political Consultative Conference. Mr. Ng holds a Master’s degree in
Business Administration from International University of America. He
joined the Group in September 2006.
Ma Chung Man, Alexaged 41, is the Senior Manager – Sales & Marketing, responsible for
the Automotive business of the Group. He holds a degree in Industrial
and Manufacturing Systems Engineering from the University of Hong
Kong and a Master's degree in System Engineering and Engineering
Management from the Chinese University of Hong Kong. He joined
the Group in October 1998.
Tan King Ho, Tommyaged 42, is the Senior Manager – Sales & Marketing, responsible for
the Industrial business of the Group. He holds a Master's degree in
Professional Japanese from The Hong Kong Polytechnic University. He
joined the Group in April 2006.
Wong Wing, Alexaged 55, is the Senior Manager, responsible for Purchasing of the
Group. He holds a Diploma in Electronics & Electricity. He joined the
Group in July 1994.
28 Varitronix International Limited
Corporate Governance Report
The Company is committed to achieving and maintaining a high standard of corporate governance. The Board (the “Board”) of Directors (the “Directors”) recognises that such commitment is essential in upholding the accountability and transparency and to achieve a balance of interests between the shareholders, customers, creditors, employees as well as other stakeholders.
CoRPoRATe goveRnAnCe PRACTiCesThe corporate governance standards of the Company are built on the principles of independence, accountability, transparency and fairness. The Company has adopted and complied with the code provision set out in the Corporate Governance Code (the “CG Code”) contained in Appendix 14 of the Rules Governing the Listing of Securities (the “Listing Rules”) on The Stock Exchange of Hong Kong Limited (the “Stock Exchange”). The Board has taken actions and measures to ensure that the Company is in all aspects in strict compliance.
In the opinion of the Directors, the Company has complied with the code provisions of the CG Code throughout the year ended 31 December 2016.
MoDel CoDe FoR seCURiTies TRAnsACTions BY DiReCToRsThe Company has adopted the Model Code for Securities Transactions by Directors of Listed Issuers (the “Model Code”) set out in Appendix 10 of the Listing Rules. Following specific enquiry by the Company, all Directors confirmed that they have complied with the required standards as set out in the Model Code throughout the year under review.
BoARD oF DiReCToRsThe Company benefits from the professional management expertise of its Directors. Brief biographies of the Directors are set out in the “Board of Directors and Senior Management” section in this Annual Report. The professional management expertise of the Directors ensures that the Board has the capabilities of sustaining the Company’s continued success.
As at 31 December 2016, the Board comprises three Executive Directors, three Non-executive Directors and three Independent Non-executive Directors.
Executive Directors: Mr. Yao Xiangjun (Chairman)
Ms. Ko Wing Yan, Samantha (Co-Chief Executive Officer and Chief Financial Officer)
Mr. Su Ning (Co-Chief Executive Officer)
Non-executive Directors:
Ms. Yang Xiaoping
Mr. Dong Xue
Mr. Yuan Feng
Independent Non-executive Directors:
Mr. Fung, Yuk Kan Peter
Mr. Chu, Howard Ho Hwa
Mr. Hou Ziqiang
All the Independent Non-executive Directors meet the guidelines for assessment of independence as set out in Rule 3.13 of the Listing Rules.

29Annual Report 2016
The Board meets at least 4 times a year with additional meetings arranged when necessary to review the financial performance, material investments and other matters of the Group that require the resolution of the Board.
During the financial year ended 31 December 2016, a total of 16 Board meetings and 3 general meetings (“2016 GM”) of which 1 is an annual general meeting were held and the attendance of each Director is set out as follows:
number of meetings attended in 2016
name Board 2016 gMRemuneration
Committeenomination Committee
Audit Committee
executive Directors:
Mr. Ko Chun Shun, Johnson1 11/11 1/1 1/1 1/1 N/A
Mr. Yao Xiangjun2 5/5 2/2 1/1 2/2 N/A
Ms. Ko Wing Yan, Samantha3 16/16 3/3 1/1 N/A N/A
Mr. Ho Te Hwai, Cecil4 11/11 1/1 N/A N/A N/A
Mr. Su Ning5 5/5 2/2 N/A 2/2 N/A
non-executive Directors:
Ms. Yang Xiaoping6 5/5 2/2 N/A N/A N/A
Mr. Dong Xue6 5/5 2/2 N/A N/A N/A
Mr. Yuan Feng6 5/5 2/2 N/A N/A N/A
independent non-executive Directors:
Dr. Lo Wing Yan, William7 12/12 1/1 1/1 2/2 2/2
Mr. Chau Shing Yim, David8 12/12 1/1 0/0 1/1 2/2
Mr. Fung, Yuk Kan Peter9 4/4 2/2 1/1 1/1 2/2
Mr. Chu, Howard Ho Hwa10 4/4 2/2 1/1 1/1 2/2
Mr. Hou Ziqiang 16/16 3/3 2/2 3/3 4/4
Notes:
1. With effect from 28 April 2016, Mr. Ko Chun Shun, Johnson resigned as an Executive Director and the Chairman of the Board and ceased as a member of the remuneration committee (the “RC”) and the nomination committee (the “NC”) of the Company.
2. With effect from 28 April 2016, Mr. Yao Xiangjun was appointed as an Executive Director and the Chairman of the Board, a member of the RC and the chairman of the NC.
3. With effect from 28 April 2016, Ms. Ko Wing Yan, Samantha was redesignated from the Chief Executive Officer to a Co-chief Executive Officer of the Company and was appointed as a member of the RC.
4. With effect from 28 April 2016, Mr. Ho Te Hwai, Cecil resigned as an Executive Director and the Company Secretary of the Company.
5. With effect from 28 April 2016, Mr. Su Ning was appointed as an Executive Director and a Co-chief Executive Officer of the Company, and a member of the NC.
6. With effect from 28 April 2016, Ms. Yang Xiaoping, Mr. Dong Xue and Mr. Yuan Feng were appointed as Non-executive Directors of the Company.
7. With effect from 28 April 2016, Dr. Lo Wing Yan, William ceased as the Chairman of the NC but remained as a member thereof. With effect from 3 June 2016, Dr. Lo retired as an Independent Non-executive Director and ceased as the Chairman of Audit Committee of the Company (the “AC”) and the RC, and a member of the NC.
8. With effect from 28 April 2016, Mr. Chau Shing Yim, David was appointed as a member of the RC and the NC. With effect from 3 June 2016, Mr. Chau retired as an Independent Non-executive Director of the Company and ceased a member of the AC, the RC and the NC.
9. With effect from 3 June 2016, Mr. Fung, Yuk Kan Peter was appointed as an Independent Non-executive Director of the Company, the Chairman of the AC and the RC, and a member of the NC.
10. With effect from 3 June 2016, Mr. Chu, Howard Ho Hwa was appointed as an Independent Non-executive Director of the Company, a member of the AC, the RC and the NC.

30 Varitronix International Limited
Corporate governance Report
The Directors have no financial, business, family or other material/relevant relationships among the members of the Board except that:
(i) Mr. Ko Chun Shun, Johnson is the father of Ms. Ko Wing Yan, Samantha; and
(ii) Mr. Yao Xiangjun is a member of the executive committee of BOE Technology Group Co., Ltd (“BOE”), a senior vice president, a joint chief operating officer and the chief executive officer of the smart system business group of BOE. Mr. Yao is also a president of BOE Optoelectronics Technology Co., Ltd., Beijing BOE Vision-electronic Technology Co., Ltd., Beijing BOE Multimedia Science & Technology Co., Ltd. and Beijing Intelligence Science & Technology Co., Ltd. Mr. Su Ning is the general manager of the application business department of Beijing BOE Display Technology Co., Ltd. (a subsidiary of BOE). Ms. Yang Xiaoping is a vice president and a deputy financial controller of BOE. Ms. Yang is also acting as a director or a supervisor of a number of subsidiaries of BOE. Mr. Dong Xue is a senior vice president and the chief technical officer for display panel business of BOE. Mr. Yuan Feng is a vice president and the chief sales marketing officer China of BOE. Mr. Yuan is also the chairman of the board of directors of Beijing BOE Sales Co., Ltd. (a subsidiary of BOE) and a director of a number of subsidiaries of BOE. BOE Technology (HK) Limited, a wholly-owned subsidiary of BOE, is the controlling shareholder of the Company.
In the Board’s opinion, these relationships do not affect the Directors’ independent judgment and integrity in executing their roles and responsibilities.
Professional DevelopmentPursuant to A.6.5 of the CG Code, all Directors should participate in continuous professional development to develop and refresh their knowledge and skills. This is to ensure that their contribution to the Board remains informed and relevant. Up to the date of this report, all Directors have participated in continuous professional development by attending training course and/or referring materials on the topics related to corporate governance and regulations.
Responsibilities of the BoardThe Board has the collective responsibility for leadership and control of, and for promoting the success of, the Company by directing and supervising the Company’s affairs. The Board sets the Group’s overall objectives and strategies, monitors and evaluates its operating and financial performance and reviews the corporate governance standard of the Company. It also decides on matters such as interim and annual results, major transactions, director appointments or reappointments, and dividend and accounting policies. The Board has delegated the authority and responsibility for implementing its business strategies and managing the daily operations of the Group’s businesses to the management.
Corporate Governance FunctionsNo corporate governance committee has been established and the Board is responsible for performing the corporate governance functions such as developing and reviewing the Company’s policies, practices on corporate governance, training and continuous professional development of the Directors and senior management of the Group, the Company’s policies and practices on compliance with legal and regulatory requirements, etc.
The Board held meetings from time to time whenever necessary. At least 14 days notice of regular Board meetings is given to all Directors and they can include matters for discussion in the agenda as they think fit. The agenda accompanying board papers are sent to all Directors at least 3 days before the date of every Board meeting in order to allow sufficient time for the Directors to review the documents.
Minutes of every Board meeting are circulated to all Directors for their perusal and comments prior to confirmation of the minutes. The Board also ensures that it is supplied in a timely manner with all necessary information in a form and of a quality appropriate to enable it to discharge its duties.
Every Board member has full access to the advice and services of the company secretary of the Company with a view to ensuring that board procedures, and all applicable rules and regulations are followed and they are also entitled to have full access to board papers and related materials so that they are able to make an informed decision and to discharge their duties and responsibilities.

31Annual Report 2016
CHAiRMAn AnD Co-CHieF eXeCUTive oFFiCeRThe roles of the Chairman of the Board, Mr. Yao Xiangjun and Co-chief Executive Officers, Ms. Ko Wing Yan, Samantha and Mr. Su Ning are separated, with a clear division of responsibilities. The Chairman of the Board is responsible for formulating corporate strategies and overall business development planning. Co-chief Executive Officers’ duty is to oversee the execution of daily business activities. The division of responsibilities is to ensure a balance of power and authority.
TeRM oF APPoinTMenT oF non-eXeCUTive DiReCToRsAll Non-executive Directors have been appointed for a term of three years and all Independent Non-executive Directors have been appointed for a fixed term expiring on 31 December 2017 or such other date as agreed by the Independent Non-executive Directors. All Directors are subject to retirement by rotation at least once every three years under the Company’s Bye-laws.
BoARD CoMMiTTees
Remuneration CommitteeThe RC is responsible for setting and monitoring the remuneration policy for all Directors and senior management of the Group. The RC comprises Mr. Fung, Yuk Kan Peter (Chairman of the RC), Mr. Yao Xiangjun, Ms. Ko Wing Yan, Samantha, Mr. Chu, Howard Ho Hwa and Mr. Hou Ziqiang. Among the 5 members of the RC, 3 members are Independent Non-Executive Directors. The terms of reference of the RC are available at the websites of the Company and the Stock Exchange.
The roles and functions of the RC include consulting the Chairman of the Board about their remuneration proposals for other Executive Directors, making recommendation to the Board on the Company’s remuneration policy and structure for all Directors’ and senior management of the Group and the RC has adopted the approach under B.1.2(c)(ii) of the CG Code to make recommendations to the Board on the remuneration packages of individual Executive Director and senior management of the Group.
The Company’s remuneration policy is to link remuneration packages for Executive Directors with the achievement of annual and long-term performance goals. By providing competitive and performance-linked compensation, the Company seeks to attract, motivate and retain key executives, which is essential to its long-term success.
2 meetings were held in 2016. During meetings, the RC reviewed the Company’s remuneration policy and fixed the remuneration packages for the Executive Directors and senior management of the Group. No change has been proposed to the remuneration policy and the Directors’ remuneration. The number of RC meeting held during the year and record of individual attendance of members, on a named basis, at meetings held is set out in section headed “BOARD OF DIRECTORS” above in this report.
Remuneration of Directors and Senior ManagementThe Directors’ remuneration is set out in note 7 to the consolidated financial statements of this Annual Report.
The remuneration paid to the members of the senior management by bands in 2016 is set out below:
Remuneration Bands number of individuals
HK$500,001 to HK$1,000,000 6
HK$1,000,001 to HK$1,500,000 2
HK$1,500,001 to HK$2,000,000 1
Nomination CommitteeThe NC comprises Mr. Yao Xiangjun (Chairman of the NC), Mr. Su Ning, Mr. Fung, Yuk Kan Peter, Mr. Chu, Howard Ho Hwa and Mr. Hou Ziqiang. Among the 5 members of the NC, 3 members are Independent Non-executive Directors. The terms of reference of the NC are available at the websites of the Company and the Stock Exchange.
The roles and functions of the NC include reviewing the structure, size and composition of the Board at least annually, making recommendations on any proposed changes to the Board to complement the Company’s corporate strategy, identifying individuals suitably qualified to become members of the Board and selecting individuals nominated for directorship (if necessary), assessing the independence of the Independent Non-executive Directors and making recommendations to the Board on the appointment or re-appointment of directors and succession planning for the Directors, in particular the Chairman of the Board and the Chief Executive Officer. New Directors are sought mainly through referrals. In evaluating whether an appointee is suitable to act as a Director of the Company, the Board will review the independence, experience and expertise of the appointee as well as personal ethics, integrity and time commitment of the appointee.

32 Varitronix International Limited
Corporate governance Report
The Board adopted the board diversity policy (the “Board Diversity Policy”) which to comply with the CG Code on board diversity. The Board Diversity Policy was adopted to ensure that diversity in its broadest sense continues to remain a feature of the Board. The NC’s assessment of the candidates includes, but is not limited to, consideration of the relevant knowledge and diversity of backgrounds, skills, experience and perspectives that would complement the existing Board.
3 meeting was held in 2016. Issues concerning the structure, size and composition of the Board were discussed and reviewed. The number of NC meeting held during the year and record of individual attendance of members, on a named basis, at meetings held during is set out in section headed “BOARD OF DIRECTORS” above in this report.
Audit CommitteeThe AC comprises 3 Independent Non-executive Directors: Mr. Fung, Yuk Kan Peter (Chairman of the AC), Mr. Chu, Howard Ho Hwa and Mr. Hou Ziqiang. The AC is responsible for appointment of external auditors, review of the Group’s financial information and oversight of the Group’s financial reporting system, risk management and internal control systems. It is also responsible for reviewing the interim and annual results of the Group prior to recommending them to the Board for approval. It meets regularly to review financial reporting and internal control matters and to this end has unrestricted access to both the Company’s internal and external auditors. The terms of reference of the AC are available at the websites of the Company and the Stock Exchange.
The AC held 4 meetings in 2016, in which the Committee reviewed with management the accounting principles and practices adopted by the Group and discussed risk management, internal controls and financial reporting matters so as to ensure that an effective control environment is maintained. The number of AC meeting held during the year and record of individual attendance of members, on a named basis, at meetings held during is set out in section headed “BOARD OF DIRECTORS” above in this report.
The AC also made its recommendation to the Board that the external auditors should be reappointed and approved the remuneration and the terms of engagements of the external auditors.
The internal and external auditors have unrestricted access to the AC, which ensures that their independence remains unimpaired.
There are no disagreement between the Board and the AC on the selection, appointment, resignation or dismissal of the external auditors.
The AC meets and holds discussions with the Executive Directors and other senior management of the Group on the interim results, preliminary results announcement and annual reports. The AC reviews and discusses the management’s report and representations with a review to ensure that the Group’s consolidated financial statements and prepared in accordance with accounting principles generally accepted in Hong Kong. It also considers reports from the Company’s external auditors, KPMG, on the scope and the outcome of their annual audit of the consolidated financial statements.
Accountability and Audit
Financial ReportingThe management provides such explanation and information to the Board and reports regularly to the Board on financial position and prospects of the business of the Company so as to enable the Board to make an informed assessment of the financial and other information put before the Board for approval.
The Directors acknowledge their responsibilities (as set out in the Report of the Independent Auditor) for preparing the financial statements for each financial period with a view to ensuring such financial statements give a true and fair view of the state of affairs of the Group and of the results and cash flows for that period. The Company’s financial statements are prepared in accordance with all relevant statutory requirements and applicable accounting standards. The Directors are responsible for ensuring that appropriate accounting policies are selected and applied consistently; and that judgments and estimates made are prudent and reasonable. The Board was not aware of any material uncertainties relating to events or conditions that might cast significant doubt upon the Group’s ability to continue as a going concern and the Board has prepared the financial statements on a going concern basis. The responsibility of the external auditor is to form an independent opinion, based on their audit, on those consolidated financial statements prepared by the Board and to report their opinion to the shareholders of the Company. The reporting responsibilities of KPMG are set out in the Report of the Independent Auditor on pages 45 to 49 of this Annual Report.

33Annual Report 2016
Internal Control and Risk ManagementThe Board has overall responsibility for evaluating and determining the nature and extent of the risks they are willing to take in achieving the Group’s strategic objectives, overseeing the risk management and internal control systems including reviewing their effectiveness through the AC to ensure appropriate and effective risk management and internal control systems are in place. The Company has established an Internal Audit Department and the Risk Management Committee (the “RMC”). The RMC consists of representatives from operations departments, the Finance Department and the Internal Audit Department of the Company.
The AC assists the Board in meeting its responsibility for maintaining effective systems of risk management and internal control. The AC reviews all significant aspects of risk management and internal control, including financial, operational and compliance controls; the adequacy of resources, qualifications and experience, training programmes and budgets of the staff of the Group’s accounting, internal audit, and financial reporting functions. It reviews the process by which the Group evaluates its control environment and its risk assessment process, and the way in which business and control risks are managed. The AC reviews the effectiveness of the internal audit department and its annual work plans, and considers the reports of the RMC on the effectiveness of the systems of risk management and internal control. These reviews and reports are considered by the AC before it makes its recommendation to the Board for approval of the annual consolidated financial statements.
At the meeting held in December 2016, the AC has reviewed the effectiveness of the risk management and internal control systems of the Group and considered the systems are effective and adequate.
Effect ive r isk management is fundamental to the achievement of the Group’s strategic objectives, and an enterprise risk management framework is in place to provide top-down and bottom-up approaches to identify, assess, mitigate and monitor key risks in a pro-active and structured manner.
The Company’s management encourages a risk aware and control conscious environment, setting objectives, performance targets or policies for the management of key risks including strategic planning, business operations, acquisitions, investments, legal and regulatory compliance, expenditure control, treasury, environment, health and safety, and customer service. The Company has a well-established organisational structure with defined levels of responsibility and authority and reporting procedures. There are inherent limitations in any systems of risk management and internal control and accordingly the Group’s risk management and internal control systems are designed to manage rather than eliminate the risk of failure to achieve business of objectives, and can only provide reasonable and not absolute assurance against material misstatement or loss.
The Executive Directors review operational and financial reports and key operating statistics and hold regular meetings with the management to review their reports.
Budgets are prepared annually by the management and are subject to review and approval by the Co-chief Executive Officers and then by the Executive Directors. Re-forecasts of operating results for the current year are prepared regularly, reviewed for differences to the budget and for approval by the Executive Directors.
The Group has established guidelines and procedures for the approval and control of expenditure. Operating expenditure is subject to overall budget control. Capital expenditure is subject to overall control within the approved budget of individual projects with more specific controls and approvals being required for overspending, unbudgeted expenditure and material expenditure within the approved budget. Regular reports of actual versus budgeted and approved expenditure are also reviewed.
The treasury function, overseeing the Group’s investment and funding activities, regularly reports to the Executive Directors on the Group’s cash and liquid investments, borrowings, outstanding contingent liabilities and financial derivatives commitments. The Board has reviewed and adopted a treasury policy governing the management of the financial risks of the Group (including interest rate risk, foreign exchange risk and liquidity risk) and the operational risks associated with such risk management activities.
The legal and company secretarial function reports to the Co-chief Executive Officers, and oversees, among other things, the Group’s compliance of the Listing Rules and other legal and regulatory requirements.
The internal audit department reports to the AC of the existence and effectiveness of the risk management activities and controls in the operations of the Group. Using risk assessment methodology and taking into account the scope and nature of the Group’s activities and changes in operating environment, Internal Audit prepares its yearly audit plan which is reviewed and approved by the AC. Internal Audit’s reports on the Group’s operations are also reviewed and considered by the AC. The scope of work on the Group performed by Internal Audit includes financial and operations review, recurring and unscheduled audits, fraud investigation, productivity and efficiency review and laws and regulations compliance review. Internal Audit follows up audit recommendations on implementation and the progress is reported to the AC.
With the assistance of Internal Audit, the Co-chief Executive Officers and the Executive Directors review, among other things, the profile of the significant risks and how these risks have been identified, evaluated and managed, the changes since the last semi-annual assessment in the nature and extent of significant risks, and the Group’s ability to respond to changes in its business and the external environment, the

34 Varitronix International Limited
Corporate governance Report
scope and quality of management’s ongoing monitoring of the risk management and internal control systems. In addition, they review the work of internal audit department and other assurance providers, the extent and frequency of communication of monitoring results to the AC which enables it to assess control of the Group and the effectiveness of risk management, any significant failing or weaknesses in internal control that have been reported, the necessary actions that are being taken promptly to remedy any significant failings or weaknesses, and the effectiveness of the Group’s processes for financial reporting and Listing Rules compliance.
Reports from the external auditor on material non-compliance with procedures and significant internal control weakness, if any, are presented to the AC. These reports are considered and reviewed and the appropriate action is to be taken if required.
There are also procedures including pre-clearance on dealing in the Group’s securities by designated Directors, notification of regular blackout period and securities dealing restrictions to Directors, and dissemination of information for specified purpose and on a need-to-know basis have been implemented to guard against possible mishandling of inside information within the Group.
Auditors’ RemunerationTotal auditors’ remuneration in relation to audit and non-audit services provided to the Group amounted to HK$4 million (2015: HK$3 million), of which a sum of HK$3 million (2015: HK$2 million) was paid to KPMG. Details of the external auditor’s fees are set out in note 5(c) to the consolidated financial statements of this Annual Report.
Company SecretaryMr. Ho Te Hwai, Cecil was appointed as the Company Secretary of the Company in March 2005 and resigned in April 2016.
Mr. Pang Tien Kin was appointed as the Company Secretary of the Company in April 2016 and resigned in March 2017. Mr. Pang is a member of the Hong Kong Institute of Certified Public Accountants and a fellow member of the Association of Chartered Certified Accountants and he holds a BBA degree in Accountancy from City University of Hong Kong.
Mr. Lam Cheuk Yin, Kenneth was appointed as the Company Secretary of the Company in March 2017. Mr. Lam joined the Group in July 2005 and is the Financial Controller of the Group. He is an associate member of the Hong Kong Institute of Certified Public Accountants and holds a Bachelor of Business Administration (Accountancy) from City University of Hong Kong.
According to the Rule 3.29 of the Listing Rules, Mr. Pang has taken no less than 15 hours of relevant professional training during the financial year ended 31 December 2016.
Shareholders’ RightsThe general meetings of the Company provide an opportunity for communication between the shareholders of the Company and the Board. The Company holds an annual general meeting (“AGM”) every year, and may hold a general meeting known as an extraordinary general meeting (“EGM”) whenever necessary.
– Right to convene EGMMembers of the Company holding at the date of deposit of the requisition not less than one-tenth of the paid-up capital of the Company carrying the right of voting at general meetings of the Company shall at all times have the right, by written requisition sent to the Company’s registered office at Clarendon House, 2 Church Street, Hamilton HM11, Bermuda (the “Registered Office”) and its principal office at Units A – F, 35th Floor, Legend Tower, No. 7 Shing Yip Street, Kwun Tong, Kowloon, Hong Kong (the “Principal Office”), for the attention of the company secretary of the Company, to require an EGM to be called by the Board for the transaction of any business specified in such requisition; and such meeting shall be held within two months after the deposit of such requisition.
The written requisition must state the purposes of the general meeting, signed by the member(s) concerned and may consist of several documents in like form, each signed by one or more of those members.
If the requisition is in order, the company secretary of the Company will ask the Board to convene an EGM by serving sufficient notice in accordance with the statutory requirements to all the registered members. On the contrary, if the requisition is invalid, the members concerned will be advised of this outcome and accordingly, an EGM will not be convened as requested.
The notice period to be given to all the registered members for consideration of the proposal raised by the member(s) concerned at an EGM varies according to the nature of the proposal, as follows:
– At least 21 clear days’ and not less than 10 clear business days’ notice in writing if the proposal constitutes a special resolution of the Company, which cannot be amended other than to a mere clerical amendment to correct a patent error; and
– At least 14 clear days’ and not less than 10 clear business days’ notice in writing if the proposal constitutes an ordinary resolution of the Company.

35Annual Report 2016
– Right to put enquiries to the BoardMembers of the Company do not generally have any right to put forward enquiries to the Board. There is no procedure set out in the Bermuda Companies Act 1981 or in the Bye-Laws of the Company available for any member to put forward an enquiry to the Board. A member of the Company may, of course, at any time write to the Board and it is up to the Board to decide whether or not to entertain any request made by a member of the Company.
Members of the Company who have enquires about the above procedures or have enquires to put to the Board may write to the company secretary of the Company at Units A – F, 35/F., Legend Tower, No. 7 Shing Yip Street, Kwun Tong, Kowloon, Hong Kong.
– Right to put forward proposals at shareholders’ meetingsMember(s) of the Company holding (i) not less than one-twentieth of the total voting rights of all members having the right to vote at the shareholders’ meeting; or (ii) not less than 100 members, can submit a written request stating the resolution intended to be moved at an AGM; or a statement of not more than 1,000 words with respect to the matter referred to in any proposed resolution or the business to be dealt with at a particular shareholders’ meeting.
The written request/statements must be signed by the member(s) concern and deposited at the Registered Office and the Principal Office, for the attention of the company secretary of the Company, not less than six weeks before the AGM in the case of a requisition requiring notice of a resolution and not less than one week before the shareholders’ meeting in the case of any other requisition.
If the written request is in order, the company secretary of the Company will ask the Board (i) to include the resolution in the agenda for an AGM; or (ii) to circulate the statement for the shareholders’ meeting, provided that the member(s) concerned have deposited a sum of money reasonably determined by the Board sufficient to meet the Company’s expenses in serving the notice of the resolution and/or circulating the statement submitted by the member(s) concerned in accordance with the statutory requirements to all the registered members. On the contrary, if the requisition is invalid or the member(s) concerned have failed to deposit sufficient money to meet the Company’s expenses for the said purposes, the member(s) concerned will be advised of this outcome and accordingly, the proposed resolution will not be included in the agenda for the AGM; or the statement will not be circulated for the shareholders’ meeting.
The procedures for shareholders of the Company to propose a person for election as a director is posted on the Company’s website.
invesToR RelATionsThe Company attaches great importance to communicate with shareholders of the Company and a number of means, including regular group meetings and plant tours, are used to promote greater understanding and dialogue with investment community. This also includes the annual general meeting, the annual and interim reports, notices, announcements and circulars. Key executives maintain regular dialogue with institutional investors and analysts to keep them abreast of the Company’s development.
The Group’s website www.varitronix.com contains an “Investor & Media Relations” section which offers timely access to the Company’s press releases, financial reports and announcements.
The AGM is an important opportunity for communicating with shareholders. The Company’s Chairman and Directors are available at the AGM to answer questions from shareholders of the Company.
During the year ended 31 December 2016, there had been no significant change in the Company’s constitutional documents.
36 Varitronix International Limited
Report of the Directors
The Directors have pleasure in submitting herewith their report together with the audited financial statements of the Group for the year ended 31 December 2016.
PRinCiPAl ACTiviTies AnD BUsiness ReviewThe principal activity of the Company is investment holding. The Group is principally engaged in automobile and industrial display products and has monochrome display manufacturing capacity. Since its incorporation, the Company has been combining scientific and technological research, innovative product design, flexible product specifications and efficient manufacturing for many applications, including automotive components and industrial products, also providing complete display solutions for its customers. In addition to supplying standard products, the Group also provides tailor-made LCDs and modules for the specific needs of its customers. Particulars of the Company’s principal subsidiaries set out in Note 13 to the financial statements of this Annual Report. Further discussion and analysis of the Group’s activities as required by Schedule 5 to the Companies Ordinance (Cap. 622 of The Laws of Hong Kong), including a discussion of the principal risks and uncertainties facing the Group, an indication of likely future developments in the Group’s business and an analysis using financial key performance indicators, can be found in Chairman’s Statement on pages 2 to 5, Management Discussion and Analysis on pages 6 to 7, Review of Operations on pages 8 to 11, Environmental, Social and Governance Report on pages 12 to 23, and Notes 25(e) and 26 to the financial statements of this Annual Report.
A discussion on the Group’s key relationships with its stakeholders, environmental policies and performance, and its compliance with the relevant laws and regulations that have a significant impact on the Group is contained in Environmental, Social and Governance Report on pages 12 to 23 of this Annual Report. These discussions form part of this Directors’ Report.
The analysis of the principal activities and geographical locations of the operations of the Group during the financial year are set out in Notes 3, 4 and 11 to the financial statements of this Annual Report.
sUBsiDiARiesParticulars of the Company’s subsidiaries as at 31 December 2016 are set out in Note 13 to the financial statements.
FinAnCiAl sTATeMenTsThe results of the Group for the year ended 31 December 2016 and the state of affairs of the Company and the Group at that date are set out in the financial statements on pages 50 to 93 of this Annual Report.
DiviDenDThe Board has recommended declaring a final dividend of 2.5 HK cents (2015: 30.5 HK cents) per share as compared to interim dividend of Nil (2015: 15.0 HK cents) per share and special dividend of HK$1.35 per share (2015: Nil) representing a total of HK$1.375 (2015: 45.5 HK cents) per share for the year ended 2016.
ClosURe oF RegisTeR oF MeMBeRsThe register of members of the Company will be closed from Wednesday, 31 May 2017 to Monday, 5 June 2017 (both days inclusive), during which period no transfer of shares will be registered. In order to be eligible to attend and vote at the forthcoming AGM (the “2017 AGM”), all transfers of shares accompanied by the relevant share certificates must be lodged with the Company’s Hong Kong branch share registrar and transfer office, Computershare Hong Kong Investor Services Limited (“Computershare”), of Shops 1712-16, 17th Floor, Hopewell Centre, 183 Queen’s Road East, Hong Kong not later than 4:30 p.m. on Monday, 29 May 2017.
Subject to the shareholders approving the recommended final dividend at the 2017 AGM of the Company, such dividend will be payable on or around Friday, 7 July 2017 to shareholders whose names appear on the register of members of the Company on Friday, 16 June 2017. To determine eligibility for the final dividend, the register of members of the Company will be closed from Tuesday, 13 June 2017 to Friday, 16 June 2017 (both days inclusive), during which period no shares can be registered. In order to qualify for the aforementioned final dividend, all transfers of shares accompanied by the relevant share certificates must be lodged with Computershare, of Shops 1712-16, 17th Floor, Hopewell Centre, 183 Queen’s Road East, Hong Kong not later than 4:30 p.m. on Monday, 12 June 2017.
sHARe CAPiTAlDetails of the movements in the share capital of the Company during the year are set out in Note 25(c) to the financial statements.
CHARiTABle DonATionsCharitable donations made by the Group during the year amounted to HK$250,000 (2015: HK$542,000).

37Annual Report 2016
FiXeD AsseTsMovements in fixed assets during the year are set out in Note 12 to the financial statements.
ReseRvesDetails of movements in reserves of the Company during the year are set out in Note 25(a) to the financial statements. Details of movements in reserves of the Group during the year are set out in the Consolidated Statement of Changes in Equity.
DiReCToRsThe Directors during the financial year and up to the date of this Annual Report were:
Executive Directors:Mr. Ko Chun Shun, Johnson (Chairman) (resigned on 28 April 2016)
Mr. Yao Xiangjun (Chairman) (appointed on 28 April 2016)
Ms. Ko Wing Yan, Samantha
Mr. Ho Te Hwai, Cecil (resigned on 28 April 2016)
Mr. Su Ning (appointed on 28 April 2016)
Non-executive Directors:Ms. Yang Xiaoping (appointed on 28 April 2016)
Mr. Dong Xue (appointed on 28 April 2016)
Mr. Yuan Feng (appointed on 28 April 2016)
Independent Non-executive Directors:Dr. Lo Wing Yan, William (retired on 3 June 2016)
Mr. Chau Shing Yim, David (retired on 3 June 2016)
Mr. Fung, Yuk Kan Peter (appointed on 3 June 2016)
Mr. Chu, Howard Ho Hwa (appointed on 3 June 2016)
Mr. Hou Ziqiang
In accordance with Bye-laws of the Company, Mr. Yao Xiangjun, Ms. Ko Wing Yan, Samantha, Mr. Fung, Yuk Kan Peter, Mr. Chu, Howard Ho Hwa and Mr. Hou Ziqiang shall retire and being eligible, offer themselves for re-election at the forthcoming annual general meeting.
DiReCToRs’ AnD CHieF eXeCUTives’ inTeResTs AnD sHoRT PosiTions in sHARes, UnDeRlYing sHARes AnD DeBenTUResAs at 31 December 2016, the interests of the Directors and chief executive of the Company and their associates in the shares, underlying shares and debentures of the Company and its associated corporations (within the meaning of Part XV of the Securities and Futures Ordinance (the “SFO”)), as required to be notified to the Company and the Stock Exchange pursuant to Divisions 7 and 8 of Part XV of the SFO (including interests and short positions which they are taken or deemed to have under such provisions of the SFO), as recorded in the register required to be maintained by the Company under Section 352 of the SFO or as required, pursuant to the Model Code to be notified to the Company and the Stock Exchange were as follows:
(a)(i) Interests in shares of the Company
name of Director Capacity
number of shares in the
Company held
Approximate percentage of the total
issued share capital of the
Company
Ko Wing Yan, Samantha Personal Interest 247,000 0.03%
(a)(ii) Interests in shares of BOE Technology Group Co., Ltd. (“BOE”) (an associated corporation) (Note 1)
name of Director Capacity
number of A shares in
Boe held
Approximate percentage of the total
issued share capital of Boe
Yao Xiangjun Personal Interest 100,000 0.00%
Dong Xue Personal Interest 100,000 0.00%
Notes:
1. BOE subscribed 400,000,000 shares, representing 54.42% of the issued share capital of the Company.
2. All the interests disclosed above represent long positions.

38 Varitronix International Limited
Report of the Directors
Other than the aforesaid and as disclosed under the section headed “Share Option Schemes and Directors’ and Chief Executives’ Rights to Acquire Shares or Debentures” below, as at 31 December 2016, none of the Directors, chief executives or any of their associates had any interests or short positions in the shares, underlying shares and debentures of the Company or any of its associated corporations as recorded in the register required to be kept under Section 352 of Part XV of the SFO or as otherwise notified to the Company and the Stock Exchange pursuant to the Model Code.
sHARe oPTion sCHeMes AnD DiReCToRs’ AnD CHieF eXeCUTives’ RigHTs To ACqUiRe sHARes oR DeBenTUResOn 6 June 1991, the Company adopted a share option scheme. This is to provide the Group with a flexible means of giving incentive to rewarding, remunerating, compensating and/or providing benefits to the Group’s employees and business associates (the “Participants”). It was subsequently amended on 8 June 1999 and expired on 5 June 2001. A second share option scheme of the Company was adopted on 22 June 2001 and terminated on 12 May 2003.
A third share option scheme of the Company was adopted on 12 May 2003 as an incentive to the Participants. The third share option scheme limit was subsequently refreshed by a resolution passed at the annual general meeting held on 2 June 2010. The maximum number of share options that can be granted by the Company was refreshed to 32,342,220 share options. This scheme expired on 11 May 2013.
A fourth share option scheme of the Company was adopted on 3 June 2013. It shall be valid and effective for a period of 10 years and as at 31 December 2016, the fourth share option has a remaining life of up to 2 June 2023. On 9 July 2015, 8,600,000 share options were granted under the fourth share option scheme and a consideration of HK$19.00 was received. During the year, no share option was granted under the fourth share option scheme.
The Company can grant share options to the Participants for a consideration of HK$1.00 for each grant payable by the Participants. The maximum number of shares in respect of which share options may be granted under the fourth share option scheme and any other schemes of the Company may not exceed 10% of the issued share capital of the Company at the date of approval of the fourth share option scheme. The maximum entitlement of each Participant in the total number of shares issued and to be issued upon exercise of share options granted under the fourth share option scheme and any other share option schemes of the Company in any 12-month period shall not exceed 1% of the total number of shares in issue.
Subscription price of the shares in relation to a share option shall not be less than the higher of (i) the closing price of the shares as stated in the Stock Exchange’s daily quotation sheets on the date on which the share option is offered to the Participants, which must be a business day; (ii) the average of the closing prices of the shares as stated in the Stock Exchange’s daily quotation sheets for the 5 trading days immediately preceding the date of offer; and (iii) the nominal value of the shares. There shall be no minimum period for which the share options must be held before they are exercised but the Board may determine.
As at the date of this Annual Report, the total number of share options that can be granted was 24,411,520, representing 3.32% of the issued share capital of the Company. The total number of shares available for issue under the share option schemes as at 31 December 2016 represents 1.08% (2015: 3.67%) of the issued share capital of the Company at that date. Further details of the share option schemes are set out in Note 24 to the financial statements.

39Annual Report 2016
(b) Interests in share options of the CompanyMovements in the Company’s share options during the year are as follows:
Category Date of grant
number of share options
at 1 January 2016
number of share options
granted during the
year
number of share options
cancelled/lapsed during
the year
number of share options
exercised during the
year
number of share
options at 31 December
2016exercisable
period
Price per share to
be paid on exercise of
share options
Market value per share at
date of grant of share options
weighted average
closing price of share options immediately
before the dates on which
the share options were exercised
Directors
Ko Wing Yan, Samantha
9 July 2015 2,000,000 – – – 2,000,000 (Note 5) HK$5.72 HK$5.65 N/A
Hou Ziqiang 24 June 2010 400,000 – – (400,000) 0 (Note 6) HK$2.50 HK$2.50 HK$5.13
9 July 2015 300,000 – – – 300,000 (Note 5) HK$5.72 HK$5.65 N/A
others
Ko Chun Shun, Johnson (Note 1)
24 June 2010 1,900,000 – – (1,900,000) 0 (Note 6) HK$2.50 HK$2.50 HK$5.13
9 July 2015 2,000,000 – – – 2,000,000 (Note 5) HK$5.72 HK$5.65 N/A
Ho Te Hwai, Cecil (Note 2)
24 June 2010 950,000 – – (950,000) 0 (Note 6) HK$2.50 HK$2.50 HK$4.51
9 July 2015 1,000,000 – – – 1,000,000 (Note 5) HK$5.72 HK$5.65 N/A
Lo Wing Yan, William (Note 3)
24 June 2010 80,000 – – (80,000) 0 (Note 6) HK$2.50 HK$2.50 HK$4.84
9 July 2015 300,000 – – – 300,000 (Note 5) HK$5.72 HK$5.65 N/A
Chau Shing Yim, David (Note 4)
24 June 2010 160,000 – – (160,000) 0 (Note 6) HK$2.50 HK$2.50 HK$4.28
9 July 2015 300,000 – – – 300,000 (Note 5) HK$5.72 HK$5.65 N/A
employees 24 June 2010 260,000 – – (260,000) 0 (Note 6) HK$2.50 HK$2.50 HK$4.92
9 July 2015 2,500,000 – (250,000) (Note 7)
(180,000) 2,070,000 (Note 5) HK$5.72 HK$5.65 HK$6.27
12,150,000 – (250,000) (3,930,000) 7,970,000
Notes:
(1) Mr. Ko Chun Shun, Johnson resigned as an Executive Director on 28 April 2016. The 2,000,000 share options held by Mr. Ko were retained until the end of the expiry of the exercisable period of the share options, and reclassified from the category ‘Directors’ to ‘Others’.
(2) Mr. Ho Te Hwai, Cecil resigned as an Executive Director on 28 April 2016. The 1,000,000 share options held by Mr. Ho were retained until the end of the expiry of the exercisable period of the share options, and reclassified from the category ‘Directors’ to ‘Others’.
(3) Dr. Lo Wing Yan, William retired as an Independent Non-executive Director on 3 June 2016. The 300,000 share options held by Dr. Lo were retained until the end of the expiry of the exercisable period of the share options, and reclassified from the category ‘Directors’ to ‘Others’.
(4) Mr. Chau Shing Yim, David retired as an Independent Executive Director on 3 June 2016. The 300,000 share options held by Mr. Chau were retained until the end of the expiry of the exercisable period of the share options, and reclassified from the category ‘Directors’ to ‘Others’.
(5) Exercisable period:
(i) the first 40% of the options shall be exercisable from 1 September 2015 to 31 August 2018;
(ii) the second 30% of the options shall be exercisable from 1 September 2016 to 31 August 2018; and
(iii) the remaining 30% of the options shall be exercisable from 1 September 2017 to 31 August 2018.
(6) Exercisable period:
(i) the first 20% of the share options shall be exercisable from 1 July 2011 to 30 June 2016;
(ii) the second 20% of the share options shall be exercisable from 1 July 2012 to 30 June 2016;
(iii) the third 20% of the share options shall be exercisable from 1 July 2013 to 30 June 2016;
(iv) the fourth 20% of the share options shall be exercisable from 1 July 2014 to 30 June 2016; and
(v) the remaining 20% of the share options shall be exercisable from 1 July 2015 to 30 June 2016.
(7) The share options are lapsed.
(8) All the interests disclosed above represent long positions.

40 Varitronix International Limited
Report of the Directors
Apart from the foregoing, at no time during the year was the Company or any of its subsidiaries a party to any arrangement to enable the Directors or chief executive or any of their spouses or children under eighteen years of age to acquire benefits by means of the acquisition of shares in or debentures of the Company or any other body corporate.
sUBsTAnTiAl sHAReHolDeRs’ AnD oTHeR PeRsons’ inTeResTs AnD sHoRT PosiTions in sHARes AnD UnDeRlYing sHAResAs at 31 December 2016, other than the interests disclosed under the section headed “Directors’ and Chief Executives’ Interests and Short Positions in Shares, Underlying Shares and Debentures”, so far as is known to the Directors and chief executives of the Company, the following companies and person had interests and short positions in the shares and underlying shares of the Company as recorded in the register required to be kept under Section 336 of the SFO:
name Capacity
number of shares in the
Company held
number of underlying
shares in the Company held Total
Approximate percentage of
the total issued share capital
of the Company
BOE Technology Group Co., Ltd. Interest of controlled corporation
400,000,000 (Note 1)
– 400,000,000 54.42%
Ko Chun Shun, Johnson Beneficial owner 56,551,000 (Note 2)
2,000,000 (Note 3)
58,551,000 7.97%
Rockstead Technology Limited Interest of controlled corporation
43,951,000 (Note 2)
– 43,951,000 5.98%
Notes:
1. The subscription (the “Subscription”) of the 400,000,000 shares of the Company by BOE Technology Group Co., Ltd., a joint stock company established in the PRC and the issued shares of which are listed on the Shenzhen Stock Exchange with stock code 000725 for its A shares and stock code 200725 for its B shares.
2. Rockstead Technology Limited and Omnicorp Limited, both wholly-owned by Mr. Ko Chun Shun, Johnson (a former Executive Director of the Company and the former Chairman of the Board), held 43,951,000 shares and 10,700,000 shares of the Company respectively.
3. This represents the interests in 2,000,000 share options held by Mr. Ko Chun Shun, Johnson.
4. All the interests disclosed above represent long positions.
Saved as disclosed above, as at 31 December 2016, there were no other companies nor persons who had an interest or short position in the shares or underlying shares of the Company which would fall to be disclosed to the Company under Section 336 of the SFO, or which were recorded in the register to be kept by the Company under Section 336 of the SFO.
DeBenTURe issUeThe Group has not issued any debenture during the year ended 31 December 2016.
DiReCToRs’ seRviCe ConTRACTsMr. Yao Xiangjun, Ms. Ko Wing Yan, Samantha and Mr. Su Ning have entered into a management agreement with the Company which may be terminated by either party to the agreement at one month’s notice.
Non-executive Directors are appointed for a term of three years. Independent Non-executive Directors are appointed for a period up to 31 December 2017 or such other date as agreed by the Independent Non-executive Directors and the Company.
No Director proposed for re-election at the forthcoming annual general meeting has an unexpired service contract which is not determinable by the Company or any of its subsidiaries within one year without payment of compensation, other than normal statutory compensation.

41Annual Report 2016
DiReCToRs’ inTeResTs in TRAnsACTion, ARRAngeMenT oR ConTRACTReferring the section headed “Continuing Connected Transactions, Connected Transactions and Other Related Party Transactions” as disclosed, each of Mr. Yao Xiangjun and Mr. Dong Xue held 100,000 A shares of BOE. In addition, Mr. Yao is a member of executive committee of BOE, a senior vice president, a joint chief operating officer and the chief executive officer of the smart system business group of BOE. Mr. Yao is also a president of BOE Optoelectronics Technology Co., Ltd., Beijing BOE Vision-electronic Technology Co., Ltd., Beijing BOE Multimedia Science & Technology Co., Ltd. and Beijing Intelligence Science & Technology Co., Ltd. Mr. Dong is a vice president and the chief technical officer for display panel business of BOE. Moreover, Mr. Su Ning is the general manager of the application business department of Beijing BOE Display Technology Co., Ltd. (a subsidiary of BOE). Ms. Yang Xiaoping is a vice president and a deputy financial controller of BOE. Ms. Yang is also a director or supervisor of a number of subsidiaries of BOE. Mr. Yuan Feng is a vice president and the chief sales marketing officer China of BOE. Mr. Yuan is also the chairman of the board of directors of Beijing BOE Sales Co., Ltd (a subsidiary of BOE) and a director of a number of subsidiaries of BOE.
Mr. Yao, Mr. Su, Ms. Yang, Mr. Dong and Mr. Yuan may be considered having interests in the above-mentioned transactions.
Except as disclosed above, there has been no transaction, arrangement or contract of significance to which the Company, or any of its subsidiaries was a party, in which a Director of the Company and the Director’s connected entity had a material interest, whether directly or indirectly, subsisted at the end of the year or at any time during the year. There is no material interest of directors in contracts involving the Company.
ConTinUing ConneCTeD TRAnsACTions, ConneCTeD TRAnsACTions AnD oTHeR RelATeD PARTY TRAnsACTions
(a) Continuing Connected TransactionsDuring the year and subsequent to the year end, a number of connected transaction and continuing connected transactions have been entered into and between the Group and members of BOE. BOE Technology (HK) Limited (“BOE(HK)”), a wholly-owned subsidiary of BOE, is the controlling shareholder of the Company holding approximately 54.42% of the issued share capital of the Company.
(1) During the year Master Purchase Agreement and Master Subcontracting Agreement
On 22 April 2016, the Company and BOE entered into the master purchase agreement (the “Master Purchase Agreement”), pursuant to which the Group agreed to purchase TFT panels and other products including, but not limited to, raw materials for manufacturing TFT modules form BOE and its subsidiaries (the “BOE Group”) up to 31 December 2016.
On 27 October 2016, the Company and BOE entered into (i) the master subcontracting agreement (the “Master Subcontracting Agreement”), pursuant to which the Company has agreed the Group to engage the BOE Group to provide subcontracting services of manufacturing TFT/TP modules and other products on a non-exclusive basis; and (ii) the renewed master purchase agreement (the “Renewed Master Purchase Agreement”), pursuant to which the Company and BOE have agreed to extend the terms of the Master Purchase Agreement from up to 31 December 2016 to 31 December 2018.
Pursuant to the approval obtained at the special general meeting of the Company held on 29 December 2016, the annual caps under the Master Subcontracting Agreement and the Renewed Master Purchase Agreement for the three years are as follows:
For the year ended/ending 31 December
2016 2017 2018
HK$ million HK$ million HK$ million
Subcontracting Transactions 10 73 138
Purchase Transactions 133 702 1,229
More high-end vehicle models and other new automobile models like electric cars are using and expected to use coloured displays (including TFT displays) instead of monochrome LCD displays. The Company is of the view that monochrome display business provides a stable prospect but it has limited growth opportunity. The Company considers that the increasing usage of coloured display products is the global development trend of the display market. Given this shifting trend, the Company considers that with a view to achieving continued growth, it is a strategy for the Group to quickly further develop and expand the Group’s TFT product line segment by capitalising on the Group’s product and market position in monochrome displays.

42 Varitronix International Limited
Report of the Directors
Following completion of the Subscription, the Group has been discussing with the BOE Group to quickly further develop and expand its automotive TFT business segment. After considering the existing automotive TFT module manufacturing capacity and capabilities of the Group, the Directors consider it beneficial for the Group to leverage on the manufacturing resources of the BOE Group by entering into the Master Subcontracting Agreement to quickly expand its automotive TFT business segment.
The Group has been purchasing TFT panels from the BOE Group from time to time. With the continued business growth, the Company expects that the original purchase annual cap of HK$90 million will not be sufficient for the Group’s business growth, and thus proposes that the Original Purchase Annual Cap be revised. The Company also seeks to extend the arrangements under the Master Purchase Agreement for further two years to 31 December 2018. As such, the Directors consider it beneficial for the Group to revise the original purchase annual cap and to extend the term of the Master Purchase Agreement by entering into the Renewed Master Purchase Agreement.
(2) Subsequent to the year endTenancy Agreement, Management Agreement, Utilities Agreement and Computer Integrated Manufacturing (the “CIM”) System Management Agreement
On 13 January 2017, the Group entered into the tenancy agreement (the “Tenancy Agreement”), the management agreement, the utilities agreement and the CIM system management agreement (the “Related Agreements”) for a term from 15 January 2017 to 31 December 2019 whereby (i) Chengdu BOE Optoelectronics Technology Co., Ltd. (“Chengdu BOE”), a wholly-owned subsidiary of BOE, has agreed to lease the premises to the Group; and (ii) Chengdu BOE has agreed to provide (a) management service, (b) utilities and (c) optional CIM system management service for the Group in connection with the lease of the premises.
Pursuant to the Tenancy Agreement and the Related Agreements on an aggregate basis, the annual caps for the total estimated annual payment (comprising the rental, management fee, utilities fee and optional CIM system management fee) for the relevant periods in 2017, 2018 and 2019 are as follows:
For the periods from
15 January 2017 to
31 December 2017
For the year ending
31 December 2018
For the year ending
31 December 2019
(RMB) (RMB) (RMB)
Total payment under the Tenancy Agreement 971,494.09 1,009,485.48 1,009,485.48
Total payment under the Management Agreement 1,333,671.95 2,041,383.48 2,041,383.48
Total payment under the CIM System Management Agreement 461,217.50 997,516.92 997,516.92
Sub-total 2,766,383.54 4,048,385.88 4,048,385.88
Estimated total payment under the Utilities Agreement 4,970,000.00 8,320,000.00 8,320,000.00
Total (Annual Caps) 7,736,383.54 12,368,385.88 12,368,385.88
BOE Group has established production facil ities of TFT modules, the Group intends to leverage on the manufacturing resources of BOE and may consider to acquire such facilities to quickly expand its automobile TFT modules manufacturing business segment in view of the market trends and opportunities. Following completion of the Subscription, Varitronix (Chengdu) Display Technology Co. Ltd. (“Varitronix (Chengdu)”) was set up for the business expansion of the Group’s TFT business segment. The Board has considered the business needs of the Group and is of the view that additional production and office space are required for the operation and growth of the Group and the premises, which is located in the premises of Chengdu BOE’s TFT panel production facilities, fits the needs of the expansion. Therefore, the Group has entered into the Tenancy Agreement and the Related Agreements with Chengdu BOE on 13 January 2017. To strengthen the business operation in the TFT business segment of the Group, the Group entered into the acquisition agreement on 20 February 2017, pursuant to which the Group acquired certain TFT module production facilities (the “Assets”) from Chengdu BOE.
43Annual Report 2016
The Independent Non-executive Directors of the Company have reviewed the above continuing connected transactions and confirmed that these continuing connected transactions were entered into:
(i) in the ordinary and usual course of business of the Group;
(ii) on normal commercial terms or better; and
(iii) according to the agreement governing them on terms that are fair and reasonable and in the interests of the shareholders of the Company as a whole.
The company’s auditor was engaged to report on the continuing connected transaction in relation to Master Purchase Agreement and Master Subcontracting Agreement in accordance with Hong Kong Standard on Assurance Engagements 3000 (Revised) “Assurance Engagements Other Than Audits or Reviews of Historical Financial Information” and with reference to Practice Note 740 “Auditor’s Letter on Continuing Connected Transactions under the Hong Kong Listing Rules” issued by the Hong Kong Institute of Certified Public Accountants. The auditor has issued a letter containing the findings and conclusions in respect of this continuing connected transaction disclosed by the Group above in accordance with Rule 14A.56 of the Listing Rules. A copy of the auditor’s letter has been provided to the Company for submission to the Stock Exchange.
(b) Connected TransactionAcquisition Agreement
On 20 February 2017, the Group and Chengdu BOE entered into the acquisition agreement, pursuant to which the Group has agreed to acquire and Chengdu BOE has agreed to sell the Assets at the consideration of RMB60,143,596.00 (equivalent to approximately HK$67,962,263.48).
(c) Other Related Party TransactionsExcept as disclosed above, related party transactions entered into by the Group during the year which do not constitute connected transactions or continuing connected transactions under the Listing Rules are disclosed in Note 29 to the financial statements.
The Company has complied with the disclosure requirements prescribed in Chapter 14A of the Listing Rules with respect to the connected transactions entered into by the Group during the year ended 31 December 2016.
eqUiTY-linKeD AgReeMenTsOther than the aforesaid and as disclosed under the section headed “Share Option Schemes and Directors’ and Chief Executives’ Rights to Acquire Shares or Debentures” above, no equity-linked agreements that will or may result in the Company issuing shares or that require the Company to enter into any agreements that will or may result in the Company issuing shares were entered into by the Company during the year or subsisted at the end of the year.
MAnAgeMenT ConTRACTsNo contracts concerning the management and administration of the whole or any substantial part of the business of the Company were entered into or existed during the year.
PeRMiTTeD inDeMniTY PRovisionThe Company’s Bye-law provides that the Directors shall be indemnified out of the assets of the Company against any actions, costs, charges, losses, damages and expenses as a result of any act or failure to act in carrying out their functions.
The Company has arranged directors’ and officers’ liability insurance cover in respect of legal action against the Directors during the year.
PRe-eMPTive RigHTsThere is no provision for pre-emptive rights under the Company’s Bye-laws and the law of Bermuda.
BAnK loAnsParticulars of bank loans of the Group at 31 December 2016 are set out in Note 22 to the financial statements.
CAPiTAlisATion oF inTeResTNo interest was capitalised by the Group during the year.
PRoPeRTiesParticulars of the properties held by the Group are shown on page 95 of this Annual Report.
Five YeAR sUMMARYA summary of the results and the assets and liabilities of the Group for the last five financial years is set out on page 94 of this Annual Report.

44 Varitronix International Limited
Report of the Directors
sUFFiCienCY oF PUBliC FloATBased on the information that is publicly available and within the knowledge of the Directors, for the year under review, the Company has maintained the prescribed public float under the Listing Rules.
MAJoR CUsToMeRs AnD sUPPlieRsFor the year ended 31 December 2016, the five largest customers of the Group accounted for 31% of the Group’s total revenue while the largest customer of the Group accounted for 10% of the Group’s total revenue. In addition, for the year ended 31 December 2016, the five largest suppliers of the Group accounted for 30% of the Group’s total purchases while the largest supplier of the Group accounted for 12% of the Group’s total purchases.
At no time during the year have the Directors or any shareholder of the Company (which to the knowledge of the Directors own more than 5% of the Company’s total issued share capital) had any interest in these major customers and suppliers.
UPDATe on DiReCToR’s inFoRMATion UnDeR RUle 13.51B(1) oF THe lisTing RUlesMr. Ko Chun Shun, Johnson resigned as an Executive Director of the Company and the Chairman of the Board, and Mr. Ho Te Hwai, Cecil resigned as an Executive Director and the Company Secretary of the Company, both with effect from 28 April 2016.
Mr. Yao Xiangjun was appointed as an Executive Director of the Company and the Chairman of the Board with effect from 28 April 2016. Mr. Yao was appointed as a director and a member of the executive committee of BOE, a senior vice president, a joint chief operating officer and the chief executive officer of the smart system business group of BOE, all with effect from 20 May 2016. He resigned as a director of BOE in April 2017. BOE subscribed 400,000,000 shares of the Company and is a joint stock company established in the PRC and the issued shares of which are listed on the Shenzhen Stock Exchange with stock code 000725 for its A shares and stock code 200725 for its B shares.
Mr. Su Ning was appointed as an Executive Director and a Co-chief Executive Officer of the Company, and Ms. Yang Xiaoping, Mr. Dong Xue and Mr. Yuan Feng were appointed Non-executive Directors of the Company, all with effect from 28 April 2016.
Ms. Ko Wing Yan, Samantha was redesignated from the Chief Executive Officer to a Co-chief Executive Officer of the Company with effect from 28 April 2016.
Dr. Lo Wing Yan, William and Mr. Chau Shing Yim, David retired as Independent Non-Executive Directors of the Company on 3 June 2016.
Mr. Fung, Yuk Kan Peter was appointed as an Independent Non-Executive Director of the Company with effect from 3 June 2016.
Mr. Chu, Howard Ho Hwa was appointed as an Independent Non-Executive Director of the Company with effect from 3 June 2016. He resigned as an independent non-executive director of Directel Holdings Limited, which is listed on the Growth Enterprise Market of the Stock Exchange, with effect from 7 June 2016.
PURCHAse, sAle oR ReDeMPTion oF THe CoMPAnY’s lisTeD seCURiTiesNeither the Company nor any of its subsidiaries purchased, sold or redeemed any of the Company’s listed securities during the year ended 31 December 2016.
ConFiRMATion oF inDePenDenCeThe Company has received from each of the Independent Non-executive Directors an annual confirmation of independence pursuant to Rule 3.13 of the Listing Rules and considers all the Independent Non-executive Directors to be independent.
AUDiToRsKPMG retire and, being eligible, offer themselves for reappointment. A resolution for the reappointment of KPMG as auditors of the Company is to be proposed at the forthcoming annual general meeting.
By order of the Board
Yao Xiangjun
Chairman
Hong Kong, 27 March 2017
45Annual Report 2016
Report of the Independent Auditor
independent auditor’s report to the shareholders ofvaritronix international limited(Incorporated in Bermuda with limited liability)
oPinionWe have audited the consolidated financial statements of Varitronix International Limited (“the Company”) and its subsidiaries (“the Group”) set out on pages 50 to 93, which comprise the consolidated statement of financial position as at 31 December 2016, the consolidated statement of profit or loss and other comprehensive income, the consolidated statement of changes in equity and the consolidated statement of cash flows for the year then ended and notes to the consolidated financial statements, including a summary of significant accounting policies.
In our opinion, the consolidated financial statements give a true and fair view of the consolidated financial position of the Group as at 31 December 2016 and of its consolidated financial performance and its consolidated cash flows for the year then ended in accordance with Hong Kong Financial Reporting Standards (“HKFRSs”) issued by the Hong Kong Institute of Certified Public Accountants (“HKICPA”) and have been properly prepared in compliance with the disclosure requirements of the Hong Kong Companies Ordinance.
BAsis FoR oPinionWe conducted our audit in accordance with Hong Kong Standards on Auditing (“HKSAs”) issued by the HKICPA. Our responsibilities under those standards are further described in the Auditor’s responsibilities for the audit of the consolidated financial statements section of our report. We are independent of the Group in accordance with the HKICPA’s Code of Ethics for Professional Accountants (“the Code”) together with any ethical requirements that are relevant to our audit of the consolidated financial statements in Bermuda, and we have fulfilled our other ethical responsibilities in accordance with these requirements and the Code. We believe that the audit evidence we have obtained is sufficient and appropriate to provide a basis for our opinion.
KeY AUDiT MATTeRsKey audit matters are those matters that, in our professional judgement, were of most significance in our audit of the consolidated financial statements of the current period. These matters were addressed in the context of our audit of the consolidated financial statements as a whole, and in forming our opinion thereon, and we do not provide a separate opinion on these matters.
TiMing oF RevenUe ReCogniTionRefer to note 3 to the consolidated financial statements and the accounting policy note 1(s).
The key audit matter How the matter was addressed in our audit
Revenue from sales of the Group’s liquid crystal display (“LCD”) products is recognised when the products are delivered to the customer’s designated location which is considered to be the point in time when the Group transfers the significant risks and rewards of ownership of the goods to the customer.
The Group’s sales contracts with customers, which principally comprise automotive manufacturers, have a variety of trade terms relating to goods acceptance. Such terms may affect the timing of the recognition of sales to those customers. The Group evaluates the shipping terms of each sales contract in order to determine the appropriate timing for revenue recognition.
There is a risk that revenue transactions may not be recognised in the appropriate financial period due to lead times for sales made around the year end and the variety of trade terms offered to the customers.
We identified the timing of revenue recognition as a key audit matter because revenue is one of the key performance indicators of the Group and could be subject to manipulation to meet targets or expectations and because of the variety of trade terms offered to customers which increases the risk of error in the recognition of revenue.
Our audit procedures to assess the timing of revenue recognition included the following:
• obtaining an understanding of and assessing the design, implementation and operating effectiveness of the Group’s key internal controls over revenue recognition;
• inspecting key customer contracts to identify terms and conditions relating to goods acceptance and assessing the Group’s timing of recognition of revenue with reference to the requirements of the prevailing accounting standards;
• comparing, on a sample basis, specific revenue transactions recorded before and after the financial year end date with underlying sales invoices and delivery documents with the customers ’ acknowledgement of goods acceptance to determine whether the related revenue had been recognised in the appropriate financial period; and
• inspecting underlying documentation for manual journal entries relating to revenue which were considered to be material or met other specific risk-based criteria.

46 Varitronix International Limited
Report of the independent Auditor
vAlUATion oF invenToRiesRefer to note 18 to the consolidated financial statements and the accounting policy note 1(j).
The key audit matter How the matter was addressed in our audit
The Group held significant inventories as at 31 December 2016, which comprised raw materials, work-in-progress and finished goods in respect of LCD and related products.
Inventories are stated at the lower of cost and net realisable value.
The Group maintains its inventory levels based on customer orders and forecast demand. There is a risk that the net realisable value of inventories may fall below their cost due to changes in customer demand and the consequent overstocking of inventories at the end of the reporting period. In addition, a significant proportion of the Group’s products are manufactured to meet specific customer requirements. There is a risk that if a customer experiences financial difficulty or there is a demand issue with a customer’s product that includes a part manufactured by the Group that the related inventories held by the Group may not be sold or may be sold at a price below their cost.
Management assesses the level of write-downs and provisions for inventories required at each reporting date after considering inventory ageing and other relevant factors. Such assessment involves significant management judgement and estimation in determining the value of inventories which will not be recoverable at each reporting date.
We identified the valuation of inventories as a key audit matter because inventories are significant to the consolidated financial statements and because of the significant degree of management judgement involved in determining the write-down of or provisions for inventories.
Our audit procedures to assess the valuation of inventories included the following:
• obtaining an understanding of and assessing the design, implementation and operating effectiveness of the Group’s key internal controls over the inventory write-down and provisioning assessment process, including the Group’s monitoring controls over slow-moving inventories;
• comparing the cost of raw materials with third party supplier invoices, on a sample basis;
• obta in ing an understanding of the key assumptions in management’s overhead absorption policy for work-in-progress and finished goods and assessing whether the actual costs included in the calculations were determined in accordance with management’s overhead absorption policy by performing re-calculations of the absorbed overhead costs, on a sample basis;
• updating our understanding of the Group’s inventory write-down and provision policy and assessing whether this policy remained appropriate with reference to the Group’s current circumstances and the requirements of the prevailing accounting standards;
• assessing the classification of inventory items in the inventory ageing report by comparison with purchase invoices and other relevant underlying documentation, on a sample basis;
• selecting inventory items, on a sample basis, at the reporting date and comparing their carrying value with their subsequent selling prices as indicated in sales invoices subsequent to the reporting date; and
• assessing the historical accuracy of management’s calculation of write-downs and provisions for inventories by examining the utilisation or release of write-downs and provisions recorded at the end of the previous financial year during the current financial year.
47Annual Report 2016
ReCoveRABiliTY oF TRADe ReCeivABlesRefer to notes 19 and 26(a) to the consolidated financial statements and the accounting policies notes 1(k) and 1(i).
The key audit matter How the matter was addressed in our audit
As at 31 December 2016 the Group had significant trade receivables, which comprised a large number of individual balances.
The Group has a wide range of customers with different individual characteristics which are exposed to their own specific risks. Therefore, there is a risk that certain of the Group’s trade receivables may not be recoverable.
Management has implemented internal controls to monitor credit control, collection of trade receivables and follow up of overdue balances.
Management assesses the level of allowances for doubtful debts required at each reporting date after taking into account the ageing analysis of trade receivables and any other factors specific to individual debtors concerned and a collective element based on historical experience adjusted for certain current factors. Such assessment involves significant management judgement and estimation.
We identified the recoverability of trade receivables as a key audit matter because of the significance of trade receivables to the consolidated financial statements and because of the significant degree of management judgement involved in determining the allowances for doubtful debts.
Our audit procedures to assess the recoverability of trade receivables included the following:
• obtaining an understanding of and assessing the design, implementation and operating effectiveness of the Group’s key internal controls over the processes of credit control, collection of trade receivables and follow up of overdue balances;
• evaluating the Group’s policy for making allowances for doubtful debts with reference to the requirements of the prevailing accounting standards;
• assessing the classification of trade receivable items in the trade receivable ageing report by comparison with sales invoices and other underlying documentation on a sample basis;
• assessing the recoverability of trade receivables at the reporting date by inspecting bank receipts and other relevant underlying documentation subsequent to the reporting date, on a sample basis;
• obtaining an understanding of the basis of management’s judgements about the recoverability of individual trade receivable balances and evaluating the allowances for doubtful debts made by management for these individual balances with reference to the debtors’ financial condition, the industry in which the debtors are operating, the ageing of overdue balances and historical and post year end payment records; and
• assessing the assumptions and estimates made by management in the calculation of the allowances for doubtful debts based on a col lective assessment by performing a retrospective review of the historical accuracy of these estimates and recalculating the Group’s allowance with reference to the Group’s policy for collective assessment.

48 Varitronix International Limited
Report of the independent Auditor
inFoRMATion oTHeR THAn THe ConsoliDATeD FinAnCiAl sTATeMenTs AnD AUDiToR’s RePoRT THeReonThe Directors are responsible for the other information. The other information comprises all the information included in the annual report, other than the consolidated financial statements and our auditor’s report thereon.
Our opinion on the consolidated financial statements does not cover the other information and we do not express any form of assurance conclusion thereon.
In connection with our audit of the consolidated financial statements, our responsibility is to read the other information and, in doing so, consider whether the other information is materially inconsistent with the consolidated financial statements or our knowledge obtained in the audit or otherwise appears to be materially misstated.
If, based on the work we have performed, we conclude that there is a material misstatement of this other information, we are required to report that fact. We have nothing to report in this regard.
ResPonsiBiliTies oF THe DiReCToRs FoR THe ConsoliDATeD FinAnCiAl sTATeMenTsThe Directors are responsible for the preparation of the consolidated financial statements that give a true and fair view in accordance with HKFRSs issued by the HKICPA and the disclosure requirements of the Hong Kong Companies Ordinance, and for such internal control as the Directors determine is necessary to enable the preparation of consolidated financial statements that are free from material misstatement, whether due to fraud or error.
In preparing the consolidated financial statements, the Directors are responsible for assessing the Group’s ability to continue as a going concern, disclosing, as applicable, matters related to going concern and using the going concern basis of accounting unless the Directors either intend to liquidate the Group or to cease operations, or have no realistic alternative but to do so.
The Directors are assisted by the Audit Committee in discharging their responsibilities for overseeing the Group’s financial reporting process.
AUDiToR’s ResPonsiBiliTies FoR THe AUDiT oF THe ConsoliDATeD FinAnCiAl sTATeMenTsOur objectives are to obtain reasonable assurance about whether the consolidated financial statements as a whole are free from material misstatement, whether due to fraud or error, and to issue an auditor’s report that includes our
opinion. This report is made solely to you, as a body, in accordance with Section 90 of the Bermuda Companies Act 1981, and for no other purpose. We do not assume responsibility towards or accept liability to any other person for the contents of this report.
Reasonable assurance is a high level of assurance but is not a guarantee that an audit conducted in accordance with HKSAs will always detect a material misstatement when it exists. Misstatements can arise from fraud or error and are considered material if, individually or in the aggregate, they could reasonably be expected to influence the economic decisions of users taken on the basis of these consolidated financial statements.
As part of an audit in accordance with HKSAs, we exercise professional judgement and maintain professional scepticism throughout the audit. We also:
– Identify and assess the risks of material misstatement of the consolidated financial statements, whether due to fraud or error, design and perform audit procedures responsive to those risks, and obtain audit evidence that is sufficient and appropriate to provide a basis for our opinion. The risk of not detecting a material misstatement resulting from fraud is higher than for one resulting from error, as fraud may involve collusion, forgery, intentional omissions, misrepresentations or the override of internal control.
– Obtain an understanding of internal control relevant to the audit in order to design audit procedures that are appropriate in the circumstances but not for the purpose of expressing an opinion on the effectiveness of the Group’s internal control.
– Evaluate the appropriateness of accounting policies used and the reasonableness of accounting estimates and related disclosures made by the directors.
– Conclude on the appropriateness of the directors’ use of the going concern basis of accounting and, based on the audit evidence obtained, whether a material uncertainty exists related to events or conditions that may cast significant doubt on the Group’s ability to continue as a going concern. If we conclude that a material uncertainty exists, we are required to draw attention in our auditor’s report to the related disclosures in the consolidated financial statements or, if such disclosures are inadequate, to modify our opinion. Our conclusions are based on the audit evidence obtained up to the date of our auditor’s report. However, future events or conditions may cause the Group to cease to continue as a going concern.

49Annual Report 2016
AUDiToR’s ResPonsiBiliTies FoR THe AUDiT oF THe ConsoliDATeD FinAnCiAl sTATeMenTs (ConTinUeD)
– Evaluate the overall presentation, structure and content of the consolidated financial statements, inc luding the disc losures, and whether the consolidated financial statements represent the underlying transactions and events in a manner that achieves fair presentation.
– Obtain sufficient appropriate audit evidence regarding the financial information of the entities or business activities within the Group to express an opinion on the consolidated financial statements. We are responsible for the direction, supervision and performance of the Group audit. We remain solely responsible for our audit opinion.
We communicate with the Audit Committee regarding, among other matters, the planned scope and timing of the audit and significant audit findings, including any significant deficiencies in internal control that we identify during our audit.
We also provide the Audit Committee with a statement that we have complied with relevant ethical requirements regarding independence and communicate with them all relationships and other matters that may reasonably be thought to bear on our independence and, where applicable, related safeguards.
From the matters communicated with the Audit Committee, we determine those matters that were of most significance in the audit of the consolidated financial statements of the current period and are therefore the key audit matters. We describe these matters in our auditor’s report unless law or regulation precludes public disclosure about the matter or when, in extremely rare circumstances, we determine that a matter should not be communicated in our report because the adverse consequences of doing so would reasonably be expected to outweigh the public interest benefits of such communication.
The engagement partner on the audit resulting in this independent auditor’s report is Yip Ka Ming, Alice.
KPMG
Certified Public Accountants8th Floor, Prince’s Building10 Chater RoadCentral, Hong Kong
27 March 2017

50 Varitronix International Limited
Consolidated Statement of Profit or LossFor the year ended 31 December 2016(Expressed in Hong Kong dollars)
2016 2015Note $’000 $’000
Revenue 3 2,247,470 2,487,820
Other operating (loss)/income 4 (24,462) 97,204
Change in inventories of finished goods and work in progress (68,959) 79,310
Raw materials and consumables used (1,332,032) (1,506,120)
Staff costs (423,530) (462,221)
Depreciation 12 (90,029) (103,009)
Other operating expenses (248,759) (268,174)
Profit from operations 59,699 324,810
Finance costs 5(a) (1,197) (3,472)
Share of (losses)/profits of associates (453) 4,020
Profit before taxation 5 58,049 325,358
Income tax 6(a) (7,526) (24,997)
Profit for the year 50,523 300,361
Attributable to:
Equity shareholders of the Company 50,523 300,605
Non-controlling interests – (244)
Profit for the year 50,523 300,361
earnings per share (in HK cents) 10
Basic 8.4 cents 91.2 cents
Diluted 8.4 cents 90.4 cents
The notes on pages 55 to 93 form part of these financial statements. Details of dividends payable to equity shareholders of the Company attributable to the profit for the year are set out in note 25(b).

51Annual Report 2016
Consolidated Statement of Profit or Loss andOther Comprehensive IncomeFor the year ended 31 December 2016(Expressed in Hong Kong dollars)
2016 2015Note $’000 $’000
Profit for the year 50,523 300,361
other comprehensive income for the year (after tax and reclassification adjustments): 9
Items that may be reclassified subsequently to profit or loss:
Transfer to profit or loss upon disposal of an associate – (12,099)
Foreign currency translation adjustments: net movement in the exchange reserve (65,900) (35,652)
Available-for-sale securities: net movement in the fair value reserve (11,696) (3,601)
other comprehensive income for the year (77,596) (51,352)
Total comprehensive income for the year (27,073) 249,009
Attributable to:
Equity shareholders of the Company (27,073) 249,253
Non-controlling interests – (244)
Total comprehensive income for the year (27,073) 249,009
The notes on pages 55 to 93 form part of these financial statements.
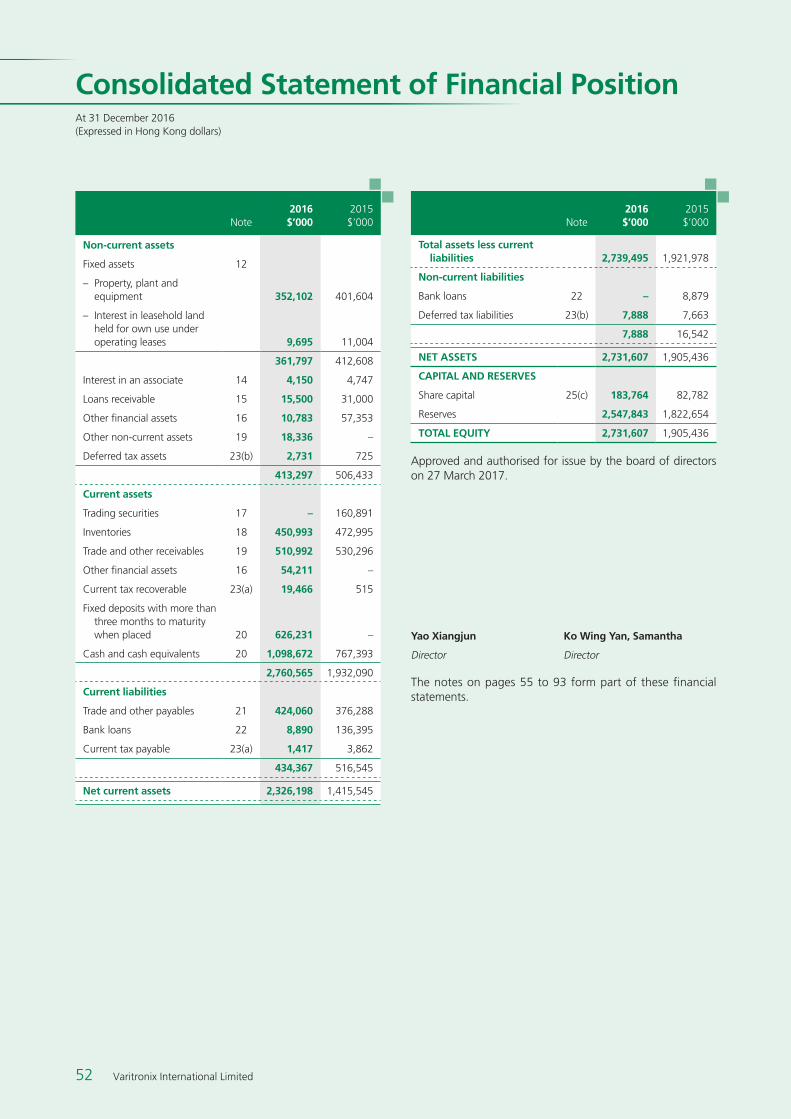
52 Varitronix International Limited
Consolidated Statement of Financial PositionAt 31 December 2016(Expressed in Hong Kong dollars)
2016 2015Note $’000 $’000
non-current assets
Fixed assets 12
– Property, plant and equipment 352,102 401,604
– Interest in leasehold land held for own use under operating leases 9,695 11,004
361,797 412,608
Interest in an associate 14 4,150 4,747
Loans receivable 15 15,500 31,000
Other financial assets 16 10,783 57,353
Other non-current assets 19 18,336 –
Deferred tax assets 23(b) 2,731 725
413,297 506,433
Current assets
Trading securities 17 – 160,891
Inventories 18 450,993 472,995
Trade and other receivables 19 510,992 530,296
Other financial assets 16 54,211 –
Current tax recoverable 23(a) 19,466 515
Fixed deposits with more than three months to maturity when placed 20 626,231 –
Cash and cash equivalents 20 1,098,672 767,393
2,760,565 1,932,090
Current liabilities
Trade and other payables 21 424,060 376,288
Bank loans 22 8,890 136,395
Current tax payable 23(a) 1,417 3,862
434,367 516,545
net current assets 2,326,198 1,415,545
2016 2015Note $’000 $’000
Total assets less current liabilities 2,739,495 1,921,978
non-current liabilities
Bank loans 22 – 8,879
Deferred tax liabilities 23(b) 7,888 7,663
7,888 16,542
neT AsseTs 2,731,607 1,905,436
CAPiTAl AnD ReseRves
Share capital 25(c) 183,764 82,782
Reserves 2,547,843 1,822,654
ToTAl eqUiTY 2,731,607 1,905,436
Approved and authorised for issue by the board of directors on 27 March 2017.
Yao Xiangjun Ko wing Yan, samantha
Director Director
The notes on pages 55 to 93 form part of these financial statements.
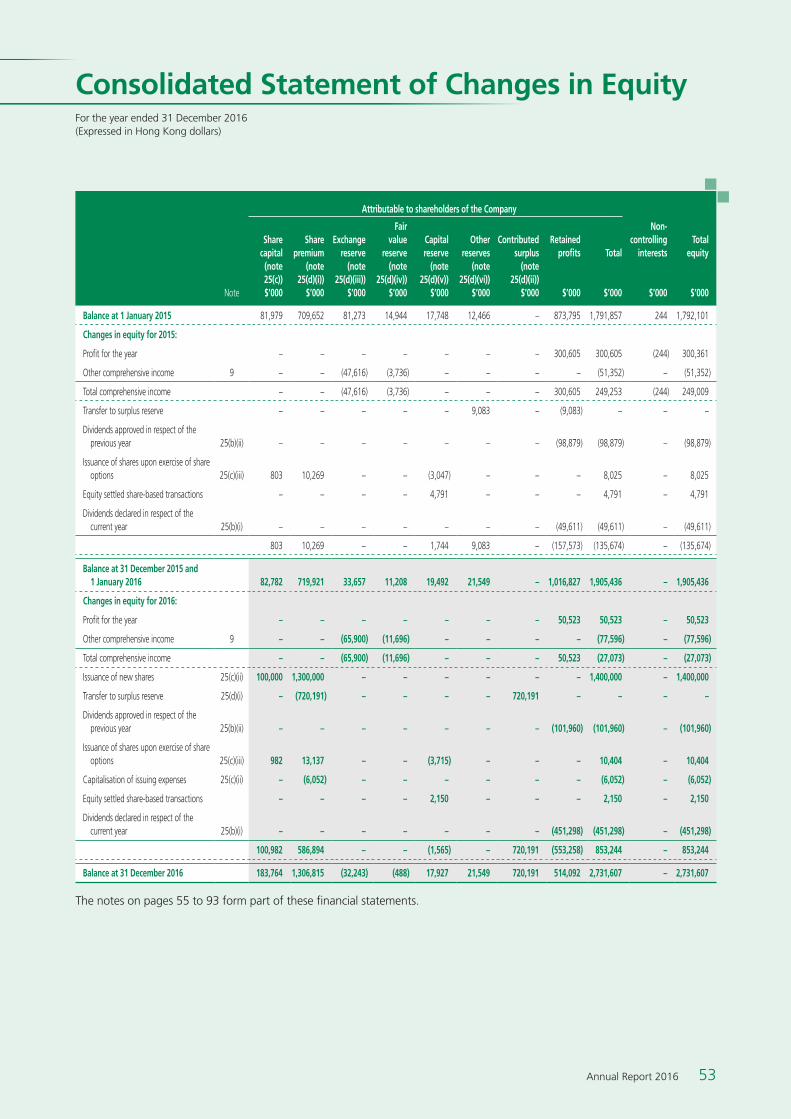
53Annual Report 2016
Consolidated Statement of Changes in EquityFor the year ended 31 December 2016(Expressed in Hong Kong dollars)
Attributable to shareholders of the Company
share capital
share premium
exchange reserve
Fair value
reserveCapital reserve
other reserves
Contributed surplus
Retained profits Total
non-controlling
interestsTotal
equity(note 25(c))
(note 25(d)(i))
(note 25(d)(iii))
(note 25(d)(iv))
(note 25(d)(v))
(note 25(d)(vi))
(note 25(d)(ii))
Note $’000 $’000 $’000 $’000 $’000 $’000 $’000 $’000 $’000 $’000 $’000
Balance at 1 January 2015 81,979 709,652 81,273 14,944 17,748 12,466 – 873,795 1,791,857 244 1,792,101
Changes in equity for 2015:
Profit for the year – – – – – – – 300,605 300,605 (244) 300,361
Other comprehensive income 9 – – (47,616) (3,736) – – – – (51,352) – (51,352)
Total comprehensive income – – (47,616) (3,736) – – – 300,605 249,253 (244) 249,009
Transfer to surplus reserve – – – – – 9,083 – (9,083) – – –
Dividends approved in respect of the previous year 25(b)(ii) – – – – – – – (98,879) (98,879) – (98,879)
Issuance of shares upon exercise of share options 25(c)(iii) 803 10,269 – – (3,047) – – – 8,025 – 8,025
Equity settled share-based transactions – – – – 4,791 – – – 4,791 – 4,791
Dividends declared in respect of the current year 25(b)(i) – – – – – – – (49,611) (49,611) – (49,611)
803 10,269 – – 1,744 9,083 – (157,573) (135,674) – (135,674)
Balance at 31 December 2015 and 1 January 2016 82,782 719,921 33,657 11,208 19,492 21,549 – 1,016,827 1,905,436 – 1,905,436
Changes in equity for 2016:
Profit for the year – – – – – – – 50,523 50,523 – 50,523
Other comprehensive income 9 – – (65,900) (11,696) – – – – (77,596) – (77,596)
Total comprehensive income – – (65,900) (11,696) – – – 50,523 (27,073) – (27,073)
Issuance of new shares 25(c)(ii) 100,000 1,300,000 – – – – – – 1,400,000 – 1,400,000
Transfer to surplus reserve 25(d)(i) – (720,191) – – – – 720,191 – – – –
Dividends approved in respect of the previous year 25(b)(ii) – – – – – – – (101,960) (101,960) – (101,960)
Issuance of shares upon exercise of share options 25(c)(iii) 982 13,137 – – (3,715) – – – 10,404 – 10,404
Capitalisation of issuing expenses 25(c)(ii) – (6,052) – – – – – – (6,052) – (6,052)
Equity settled share-based transactions – – – – 2,150 – – – 2,150 – 2,150
Dividends declared in respect of the current year 25(b)(i) – – – – – – – (451,298) (451,298) – (451,298)
100,982 586,894 – – (1,565) – 720,191 (553,258) 853,244 – 853,244
Balance at 31 December 2016 183,764 1,306,815 (32,243) (488) 17,927 21,549 720,191 514,092 2,731,607 – 2,731,607
The notes on pages 55 to 93 form part of these financial statements.

54 Varitronix International Limited
Consolidated Cash Flow StatementFor the year ended 31 December 2016(Expressed in Hong Kong dollars)
2016 2015Note $’000 $’000
operating activities
Cash generated from operations 20(b) 235,044 288,780
Tax paid
– Hong Kong Profits Tax paid (19,528) (5,189)
– People’s Republic of China (“PRC”) income taxes paid (5,071) (11,442)
– Tax paid in respect of jurisdictions outside Hong Kong and the PRC (6,104) (6,120)
net cash generated from operating activities 204,341 266,029
investing activities
Proceeds from disposal of fixed assets 1,883 120
Payment for the purchase of fixed assets (68,052) (35,826)
Proceeds from disposal of an associate – 160,258
Payment for the purchase of held-to-maturity debt securities (16,304) (31,384)
Payment for the purchase of certificates of deposits (784,092) (9,875)
Placement of fixed deposits with more than three months to maturity when placed (827,991) (82,625)
Proceeds from redemption of fixed deposits with more than three months to maturity when placed 201,760 120,995
Proceeds from redemption of certificates of deposits 760,504 25,125
Proceeds from redemption of held-to-maturity debt securities – 4,340
Proceeds from consideration received from disposal of non-listed available-for-sale equity securities and associated loans receivable 15,500 15,500
Proceeds from the sale of trading securities 109,712 18,441
Proceeds from disposal of available-for-sale mutual funds 7,990 –
Proceeds from disposal of available-for-sale equity securities 11,365 –
2016 2015Note $’000 $’000
Dividends received from investments in trading and available-for-sale securities – 7,507
Interest received 12,074 6,559
net cash (used in)/generated from investing activities (575,651) 199,135
Financing activities
Issuance of shares upon exercise of share options 25(c)(iii) 10,404 8,025
Issuance of new shares 25(c)(ii) 1,393,948 –
Proceeds from new bank loans 41,406 241,750
Repayment of bank loans (183,782) (324,863)
Interest paid (1,196) (3,472)
Dividends paid (553,258) (148,490)
net cash generated from/(used in) financing activities 707,522 (227,050)
net increase in cash and cash equivalents 336,212 238,114
Cash and cash equivalents at 1 January 767,393 536,501
effect of foreign exchange rates changes (4,933) (7,222)
Cash and cash equivalents at 31 December 20(a) 1,098,672 767,393
The notes on pages 55 to 93 form part of these financial statements.

55Annual Report 2016
Notes to the Financial Statements(Expressed in Hong Kong dollars unless otherwise indicated)
(c) Changes in accounting policiesThe HKICPA has issued a number of amendments to HKFRSs that are first effective for the current accounting period of the Group. None of these developments have had a material effect on how the Group’s results and financial position for the current or prior periods have been prepared or presented.
The Group has not appl ied any new standard or interpretation that is not yet effective for the current accounting period.
(d) Subsidiaries and non-controlling interests
Subsidiaries are entities controlled by the Group. The Group controls an entity when it is exposed, or has rights, to variable returns from its involvement with the entity and has the ability to affect those returns through its power over the entity. When assessing whether the Group has power, only substantive rights (held by the Group and other parties) are considered.
An investment in a subsidiary is consolidated into the consolidated financial statements from the date that control commences until the date that control ceases. Intra-group balances and transactions and any unrealised profits arising from intra-group transactions are eliminated in full in preparing the consolidated financial statements. Unrealised losses resulting from intra-group transactions are eliminated in the same way as unrealised gains but only to the extent that there is no evidence of impairment.
Non-controlling interests represent the equity in a subsidiary not attributable directly or indirectly to the Company, and in respect of which the Group has not agreed any additional terms with the holders of those interests which would result in the Group as a whole having a contractual obligation in respect of those interests that meets the definition of a financial liability. For each business combination, the Group can elect to measure, any non-controlling interests either at fair value or at the non-controlling interests’ proportionate share of the subsidiary is not identifiable assets.
Non-controlling interests are presented in the consolidated statement of financial position within equity, separately from equity attributable to the equity shareholders of the Company. Non-controlling interests in the results of the Group are presented on the face of the consolidated statement of profit or loss and the consolidated statement of profit or loss and other comprehensive income as an allocation of the total profit or loss and total comprehensive income for the year between non-controlling interests and the equity shareholders of the Company.
In the Company’s statement of financial position, an investment in a subsidiary is stated at cost less impairment losses (see note 1(i)).
1. signiFiCAnT ACCoUnTing PoliCies
(a) Statement of complianceThese financial statements have been prepared in accordance with all applicable Hong Kong Financial Reporting Standards (“HKFRSs”), which collective term includes all applicable individual Hong Kong Financial Reporting Standards, Hong Kong Accounting Standards (“HKASs”) and Interpretations issued by the Hong Kong Institute of Certified Public Accountants (“HKICPA”), accounting principles generally accepted in Hong Kong and the disclosure requirements of the Hong Kong Companies Ordinance. These financial statements also comply with the applicable disclosure provisions of the Rules Governing the Listing of Securities on The Stock Exchange of Hong Kong Limited (the “Listing Rules”). Significant accounting policies adopted by the Group are disclosed below.
The HKICPA has issued certain new and revised HKFRSs that are first effective or available for early adoption for the current accounting period of the Group. Note 1(c) provides information on any changes in accounting policies resulting from initial application of these developments to the extent that they are relevant to the Group for the current and prior accounting periods reflected in these financial statements.
(b) Basis of preparation of the financial statements
The consolidated financial statements for the year ended 31 December 2016 comprise the Company and its subsidiaries and the Group’s interest in an associate.
The measurement basis used in the preparation of the financial statements is the historical cost basis except that financial instruments classified as available-for-sale or as trading securities are stated at their fair value (see note 1(f)).
The preparation of financial statements in conformity with HKFRSs requires management to make judgements, estimates and assumptions that affect the application of policies and reported amounts of assets, liabilities, income and expenses. The estimates and associated assumptions are based on historical experience and various other factors that are believed to be reasonable under the circumstances, the results of which form the basis of making the judgements about carrying values of assets and liabilities that are not readily apparent from other sources. Actual results may differ from these estimates.
The estimates and underlying assumptions are reviewed on an ongoing basis. Revisions to accounting estimates are recognised in the period in which the estimate is revised if the revision affects only that period, or in the period of the revision and future periods if the revision affects both current and future periods.
Judgements made by management in the application of HKFRSs that have a significant effect on the financial statements and major sources of estimation uncertainty are discussed in note 2.

56 Varitronix International Limited
(Expressed in Hong Kong dollars unless otherwise indicated)
notes to the Financial statements
Investments in securities held for trading are classified as current assets. Any attributable transaction costs are recognised in the profit or loss as incurred. At the end of each reporting period the fair value is remeasured, with any resultant gain or loss being recognised in profit or loss. The net gain or loss recognised in profit or loss does not include any dividends or interest earned on these investments as these are recognised in accordance with the accounting policies set out in notes 1(s)(ii) and 1(s)(iii) respectively.
Dated debt securities that the Group and/or the Company have the positive ability and intention to hold to maturity are classified as held-to-maturity securities. Held-to-maturity securities are stated at amortised cost less impairment losses (see note 1(i)).
Investments in equity securities that do not have a quoted market price in an active market and whose fair value cannot be reliably measured are recognised in the statement of financial position at cost less impairment losses (see note 1(i)).
Investments in securities which do not fall into the above category are classified as available-for-sale securities. At the end of each reporting period date the fair value is remeasured, with any resultant gain or loss being recognised in other comprehensive income and accumulated separately in equity in the fair value reserve except foreign exchange gains and losses resulting from changes in the amortised cost of monetary items such as debt securities which are recognised directly in profit or loss. Dividend income from these investments is recognised in profit or loss in accordance with the policy set out in note 1(s)(ii) and, where these investments are interest-bearing, interest calculated using the effective interest method is recognised in profit or loss in accordance with the policy set out in note 1(s)(iii). When these investments are derecognised or impaired (see note 1(i)), the cumulative gain or loss is reclassified from equity to profit or loss.
Investments are recognised/derecognised on the date the Group commits to purchase/sell the investments or they expire.
(g) Property, plant and equipmentProperty, plant and equipment are stated at cost less accumulated depreciation and impairment losses (see note 1(i)).
Gains or losses arising from the retirement or disposal of an item of property, plant and equipment are determined as the difference between the net disposal proceeds and the carrying amount of the item and are recognised in profit or loss on the date of retirement or disposal.
1. signiFiCAnT ACCoUnTing PoliCies (ConTinUeD)
(e) AssociateAn associate is an entity in which the Group or Company has significant influence, but not control or joint control, over its management, including participation in the financial and operating policy decisions.
An investment in an associate is accounted for in the consolidated financial statements under the equity method. Under the equity method, the investment is initially recorded at cost, adjusted for any excess of the Group’s share of the acquisition-date fair values of the associate’s identified net assets over the cost of the investment (if any). Thereafter, the investment is adjusted for the post-acquisition change in the Group’s share of the associate’s net assets and any impairment loss relating to the investment (see note 1(i)). Any acquisition-date excess over cost, the Group’s share of the post-acquisition, post-tax results of associates and any impairment losses for the year are recognised in the consolidated statement of profit or loss, whereas the Group’s share of the post-acquisition post-tax items of associates’ other comprehensive income is recognised in the consolidated statement of profit or loss and other comprehensive income.
When the Group’s share of losses exceeds its interest in the associate, the Group’s interest is reduced to nil and recognition of further losses is discontinued.
Unrealised profits and losses resulting from transactions between the Group and its associates are eliminated to the extent of the Group’s interest in the associates, except where unrealised losses provide evidence of an impairment of the asset transferred, in which case they are recognised immediately in profit or loss.
When the Group ceases to have significant influence over an associate, it is accounted for as a disposal of the entire interest in that associate, with a resulting gain or loss being recognised in profit or loss.
(f) Other investments in debt and equity securities
The Group’s and the Company’s policies for investments in debt and equity securities, other than investments in subsidiaries and associates, are as follows:
Investments in debt and equity securities are initially stated at fair value, which is their transaction price unless fair value can be more reliably estimated using valuation techniques whose variables include only data from observable markets. Cost includes attributable transaction costs, except where indicated otherwise below. These investments are subsequently accounted for as follows, depending on their classification:

57Annual Report 2016
(ii) Operating lease chargesWhere the Group has the use of assets held under operating leases, payments made under the leases are charged to profit or loss in equal instalments over the accounting periods covered by the lease term, except where an alternative basis is more representative of the pattern of benefits to be derived from the leased asset. Lease incentives received are recognised in profit or loss as an integral part of the aggregate net lease payments made.
The cost of acquiring land held under an operating lease is amortised on a straight-line basis over the lease term. Impairment losses are recognised in accordance with the accounting policy set out in note 1(i).
(i) Impairment of assets
(i) Impairment of investments in debt and equity securities and other receivables
Investments in debt and equity securities and other current and non-current receivables that are stated at cost or amortised cost or are classified as available-for-sale securities are reviewed at the end of each reporting period to determine whether there is objective evidence of impairment. Objective evidence of impairment includes observable data that comes to the attention of the Group about one or more of the following loss events:
– significant financial difficulty of the debtor;
– a breach of contract, such as a default or delinquency in interest or principal payments;
– it becoming probable that the debtor will enter bankruptcy or other financial reorganisation;
– significant changes in the technological, market, economic or legal environment that have an adverse effect on the debtor; and
– a significant or prolonged decline in the fair value of an investment in an equity instrument below its cost.
If any such evidence exists, any impairment loss is determined and recognised as follows:
– For investment in an associate accounted for under the equity method in the consolidated financial statements (see note 1(e)), the impairment loss is measured by comparing the recoverable amount of the investment with its carrying amount in accordance with note 1(i)(ii). The impairment loss is reversed if there has been a favourable change in the estimates used to determine the recoverable amount in accordance with note 1(i)(ii).
1. signiFiCAnT ACCoUnTing PoliCies (ConTinUeD)
(g) Property, plant and equipment (continued)
Depreciation is calculated to write off the cost of items of property, plant and equipment, less their estimated residual values, if any, using the straight line method over their estimated useful lives as follows:
– Land and buildings 40 years
– Plant and machinery 2 to 8 years
– Tools and equipment 2 to 5 years
– Others 2 to 5 years
Where parts of an item of property, plant and equipment have different useful lives, the cost or valuation of the item is allocated on a reasonable basis between the parts and each part is depreciated separately. Both the useful life of an asset and its residual value, if any, are reviewed annually.
(h) Leased assetsAn arrangement, comprising a transaction or a series of transactions, is or contains a lease if the Group determines that the arrangement conveys a right to use a specific asset or assets for an agreed period of time in return for a payment or a series of payments. Such a determination is made based on an evaluation of the substance of the arrangement and is regardless of whether the arrangement takes the legal form of a lease.
(i) Classification of assets leased to the GroupAssets that are held by the Group under leases which transfer to the Group substantially all the risks and rewards of ownership are classified as being held under finance leases. Leases which do not transfer substantially all the risks and rewards of ownership to the Group are classified as operating leases, with the following exception:
– land held for own use under an operating lease, the fair value of which cannot be measured separately from the fair value of a building situated thereon at the inception of the lease, is accounted for as being held under a finance lease, unless the building is also clearly held under an operating lease. For these purposes, the inception of the lease is the time that the lease was first entered into by the Group, or taken over from the previous lessee.
58 Varitronix International Limited
(Expressed in Hong Kong dollars unless otherwise indicated)
notes to the Financial statements
Impairment losses in respect of available-for-sale debt securities are reversed if the subsequent increase in fair value can be objectively related to an event occurring after the impairment loss was recognised. Reversal of impairment losses in such circumstances are recognised in profit or loss.
Impairment losses are written off against the corresponding assets directly, except for impairment losses recognised in respect of trade debtors and bills receivable included within trade and other receivables, whose recovery is considered doubtful but not remote. In this case, the impairment losses for bad and doubtful debts are recorded using an allowance account. When the Group is satisfied that recovery is remote, the amount considered irrecoverable is written off against trade debtors and bills receivable directly and any amounts held in the allowance account relating to that debt are reversed. Subsequent recoveries of amounts previously charged to the allowance account are reversed against the allowance account. Other changes in the allowance account and subsequent recoveries of amounts previously written off directly are recognised in profit or loss.
(ii) Impairment of other assetsInternal and external sources of information are reviewed at the end of each reporting period to identify indications that the following assets may be impaired or, except in the case of goodwill, an impairment loss previously recognised no longer exists or may have decreased:
– property, plant and equipment;
– prepaid interest in leasehold land classified as being held for own use under operating leases;
– goodwill; and
– investments in subsidiaries in the Company’s statement of financial position.
If any such indication exists, the asset’s recoverable amount is estimated. In addition, for goodwill, the recoverable amount is estimated annually whether or not there is any indication of impairment.
– Calculation of recoverable amount
The recoverable amount of an asset is the greater of its fair value less costs of disposal and value in use. In assessing value in use, the estimated future cash flows are discounted to their present value using a pre-tax discount rate that reflects current market assessments of the time value of money and the risks specific to the asset. Where an asset does not generate cash inflows largely independent of those from other assets, the recoverable amount is determined for the smallest group of assets that generates cash inflows independently (i.e. a cash-generating unit).
1. signiFiCAnT ACCoUnTing PoliCies (ConTinUeD)
(i) Impairment of assets (continued)
(i) Impairment of investments in debt and equity securities and other receivables (continued)
– For unquoted equity securities carried at cost, the impairment loss is measured as the difference between the carrying amount of the financial asset and the estimated future cash flows, discounted at the current market rate of return for a similar financial asset, where the effect of discounting is material. Impairment losses for equity securities at cost are not reversed.
– For trade and other receivables and other financial assets carried at amortised cost, the impairment loss is measured as the difference between the asset’s carrying amount and the present value of estimated future cash flows, discounted at the financial asset’s original effective interest rate (i.e. the effective interest rate computed at initial recognition of the asset), where the effect of discounting is material. This assessment is made collectively where financial assets share similar risk characteristics, such as similar past due status, and have not been individually assessed as impaired. Future cash flows for financial assets which are assessed for impairment collectively are based on historical loss experience for assets with credit risk characteristics similar to the collective group.
If in a subsequent period the amount of an impairment loss decreases and the decrease can be linked objectively to an event occurring after the impairment loss was recognised, the impairment loss is reversed through profit or loss. A reversal of an impairment loss shall not result in the asset’s carrying amount exceeding that which would have been determined had no impairment loss been recognised in prior years.
– For available-for-sale securities, the cumulative loss that had been recognised in the fair value reserve is reclassified to profit or loss. The amount of the cumulative loss that is recognised in profit or loss is the difference between the acquisition cost (net of any principal repayment and amortisation) and current fair value, less any impairment loss on that asset previously recognised in profit or loss.
Impairment losses recognised in profit or loss in respect of available-for-sale equity securities are not reversed through profit or loss. Any subsequent increase in the fair value of such assets is recognised directly in other comprehensive income.
59Annual Report 2016
(j) InventoriesInventories are carried at the lower of cost and net realisable value.
Cost is calculated using the first-in first-out method and comprises all costs of purchase, costs of conversion and other costs incurred in bringing the inventories to their present location and condition.
Net realisable value is the estimated selling price in the ordinary course of business less the estimated costs of completion and the estimated costs necessary to make the sale.
When inventories are sold, the carrying amount of those inventories is recognised as an expense in the period in which the related revenue is recognised. The amount of any write-down of inventories to net realisable value and all losses of inventories are recognised as an expense in the period in which the write-down or loss occurs. The amount of any reversal of any write-down of inventories is recognised as a reduction in the amount of inventories recognised as an expense in the period in which the reversal occurs.
(k) Trade and other receivablesTrade and other receivables are initially recognised at fair value and thereafter stated at amortised cost using the effective interest method, less allowance for impairment losses of doubtful debts (see note 1(i)), except where the effect of discounting would be immaterial. In such cases, the receivables are stated at cost less allowance for impairment of doubtful debts.
(l) Loans receivableLoans receivable are recognised initially at fair value and thereafter stated at amortised cost using the effective interest method, less any identified impairment losses. Appropriate allowances for estimated irrecoverable amounts are recognised in profit or loss when there is objective evidence that the asset is impaired (see note 1(i)(i)).
(m) Interest-bearing borrowingsInterest-bearing borrowings are recognised initially at fair value less attributable transaction costs. Subsequent to initial recognition, interest-bearing borrowings are stated at amortised cost with any difference between the amount initially recognised and redemption value being recognised in profit or loss over the period of the borrowings, together with any interest and fees payable, using the effective interest method.
1. signiFiCAnT ACCoUnTing PoliCies (ConTinUeD)
(i) Impairment of assets (continued)
(ii) Impairment of other assets (continued)
– Recognition of impairment losses
An impairment loss is recognised in profit or loss if the carrying amount of an asset, or the cash-generating unit to which it belongs, exceeds its recoverable amount. Impairment losses recognised in respect of cash-generating units are allocated first to reduce the carrying amount of any goodwill allocated to the cash-generating unit (or group of units) and then, to reduce the carrying amount of the other assets in the unit (or group of units) on a pro rata basis, except that the carrying value of an asset will not be reduced below its individual fair value less costs of disposal, or value in use, if determinable.
– Reversal of impairment losses
In respect of assets, an impairment loss is reversed if there has been a favourable change in the estimates used to determine the recoverable amount. An impairment loss in respect of goodwill is not reversed.
A reversal of impairment loss is limited to the asset’s carrying amount that would have been determined had no impairment loss been recognised in prior years. Reversals of impairment losses are credited to profit or loss in the year in which the reversals are recognised.
(iii) Interim financial reporting and impairmentUnder the Listing Rules, the Group is required to prepare an interim financial report in compliance with HKAS 34, Interim financial reporting, in respect of the first six months of the financial year. At the end of the interim period, the Group applies the same impairment testing, recognition, and reversal criteria as it would at the end of the financial year.
Impairment losses recognised in an interim period in respect of goodwill, available-for-sale equity securities and unquoted equity securities carried at cost are not reversed in a subsequent period. This is the case even if no loss, or a smaller loss, would have been recognised had the impairment been assessed only at the end of the financial year to which the interim period relates. Consequently, if the fair value of an available-for-sale equity security increases in the remainder of the annual period, or in any other period subsequently, the increase is recognised in other comprehensive income and not profit or loss.

60 Varitronix International Limited
(Expressed in Hong Kong dollars unless otherwise indicated)
notes to the Financial statements
shares. The equity amount is recognised in the capital reserve until either the option is exercised (when it is included in the amount recognised in share capital for the shares issued) or the option expires (when it is released directly to retained profits).
(iii) Termination benefitsTermination benefits are recognised when, and only when, the Group demonstrably commits itself to terminate employment or to provide benefits as a result of voluntary redundancy by having a detailed formal plan which is without realistic possibility of withdrawal.
(q) Income taxIncome tax for the year comprises current tax and movements in deferred tax assets and liabilities. Current tax and movements in deferred tax assets and liabilities are recognised in profit or loss except to the extent that they relate to items recognised in other comprehensive income or directly in equity, in which case the relevant amounts of tax are recognised in other comprehensive income or directly in equity, respectively.
Current tax is the expected tax payable on the taxable income for the year, using tax rates enacted or substantively enacted at the end of the reporting period, and any adjustment to tax payable in respect of previous years.
Deferred tax assets and liabilities arise from deductible and taxable temporary differences respectively, being the differences between the carrying amounts of assets and liabilities for financial reporting purposes and their tax bases. Deferred tax assets also arise from unused tax losses and unused tax credits.
Apart from certain limited exceptions, all deferred tax liabilities and all deferred tax assets, to the extent that it is probable that future taxable profits will be available against which the asset can be utilised, are recognised. Future taxable profits that may support the recognition of deferred tax assets arising from deductible temporary differences include those that will arise from the reversal of existing taxable temporary differences, provided those differences relate to the same taxation authority and the same taxable entity, and are expected to reverse either in the same period as the expected reversal of the deductible temporary difference or in periods into which a tax loss arising from the deferred tax asset can be carried back or forward. The same criteria are adopted when determining whether existing taxable temporary differences support the recognition of deferred tax assets arising from unused tax losses and credits, that is, those differences are taken into account if they relate to the same taxation authority and the same taxable entity, and are expected to reverse in a period, or periods, in which the tax loss or credit can be utilised.
1. signiFiCAnT ACCoUnTing PoliCies (ConTinUeD)
(n) Trade and other payablesTrade and other payables are initially recognised at fair value. Except for financial guarantee liabilities measured in accordance with note 1(r)(i), trade and other payables are subsequently stated at amortised cost unless the effect of discounting would be immaterial, in which case they are stated at cost.
(o) Cash and cash equivalentsCash and cash equivalents comprise cash at bank and on hand, demand deposits with banks and other financial institutions, and short-term, highly liquid investments that are readily convertible into known amounts of cash and which are subject to an insignificant risk of changes in value, having been within three months of maturity at acquisition.
(p) Employee benefits
(i) Short term employee benefits and contributions to defined contribution retirement plans
Salaries, annual bonuses, paid annual leave, contributions to defined contribution retirement plans and the cost of non-monetary benefits are accrued in the year in which the associated services are rendered by employees. Where payment or settlement is deferred and the effect would be material, these amounts are stated at their present values.
(ii) Share-based paymentsThe fair value of share options granted to employees is recognised as an employee cost with a corresponding increase in a capital reserve within equity. The fair value is measured at grant date using the Black-Scholes model, taking into account the terms and conditions upon which the options were granted. Where the employees have to meet vesting conditions before becoming unconditionally entitled to the share options, the total estimated fair value of the share options is spread over the vesting period, taking into account the probability that the options will vest.
During the vesting period, the number of share options that is expected to vest is reviewed. Any resulting adjustment to the cumulative fair value recognised in prior years is charged/credited to profit or loss for the year of the review, unless the original employee expenses qualify for recognition as an asset, with a corresponding adjustment to the capital reserve. On vesting date, the amount recognised as an expense is adjusted to reflect the actual number of share options that vest (with a corresponding adjustment to the capital reserve) except where forfeiture is only due to not achieving vesting conditions that relate to the market price of the Company’s

61Annual Report 2016
(r) Financial guarantees issued, provisions and contingent liabilities
(i) Financial guarantees issuedFinancial guarantees are contracts that require the issuer (i.e. the guarantor) to make specified payments to reimburse the beneficiary of the guarantee (the “holder”) for a loss the holder incurs because a specified debtor fails to make payment when due in accordance with the terms of a debt instrument.
Where the Group issues a financial guarantee, the fair value of the guarantee (being the transaction price, unless the fair value can otherwise be reliably estimated) is initially recognised as deferred income within trade and other payables. Where consideration is received or receivable for the issuance of the guarantee, the consideration is recognised in accordance with the Group’s policies applicable to that category of asset. Where no such consideration is received or receivable, an immediate expense is recognised in profit or loss on initial recognition of any deferred income.
The amount of the guarantee initially recognised as deferred income is amortised in profit or loss over the term of the guarantee as income from financial guarantees issued. In addition, provisions are recognised in accordance with note 1(r)(ii) if and when (i) it becomes probable that the holder of the guarantee will call upon the Group under the guarantee, and (ii) the amount of that claim on the Group is expected to exceed the amount currently carried in trade and other payables in respect of that guarantee i.e. the amount initially recognised, less accumulated amortisation.
(ii) Other provisions and contingent liabilitiesProvisions are recognised for other liabilities of uncertain timing or amount when the Group or the Company has a legal or constructive obligation arising as a result of a past event, it is probable that an outflow of economic benefits will be required to settle the obligation and a reliable estimate can be made. Where the time value of money is material, provisions are stated at the present value of the expenditure expected to settle the obligation.
Where it is not probable that an outflow of economic benefits will be required, or the amount cannot be estimated reliably, the obligation is disclosed as a contingent liability, unless the probability of outflow of economic benefits is remote. Possible obligations, whose existence will only be confirmed by the occurrence or non-occurrence of one or more future events are also disclosed as contingent liabilities unless the probability of outflow of economic benefits is remote.
1. signiFiCAnT ACCoUnTing PoliCies (ConTinUeD)
(q) Income tax (continued)
The limited exceptions to recognition of deferred tax assets and liabilities are those temporary differences arising from goodwill not deductible for tax purposes, the initial recognition of assets or liabilities that affect neither accounting nor taxable profit, and temporary differences relating to investments in subsidiaries to the extent that, in the case of taxable differences, the Group controls the timing of the reversal and it is probable that the differences will not reverse in the foreseeable future, or in the case of deductible differences, unless it is probable that they will reverse in the future.
The amount of deferred tax recognised is measured based on the expected manner of realisation or settlement of the carrying amount of the assets and liabilities, using tax rates enacted or substantively enacted at the end of the reporting period. Deferred tax assets and liabilities are not discounted.
The carrying amount of a deferred tax asset is reviewed at the end of each reporting period and is reduced to the extent that it is no longer probable that sufficient taxable profits will be available to allow the related tax benefit to be utilised. Any such reduction is reversed to the extent that it becomes probable that sufficient taxable profits will be available.
Additional income taxes that arise from the distribution of dividends are recognised when the liability to pay the related dividends is recognised.
Current tax balances and deferred tax balances, and movements therein, are presented separately from each other and are not offset. Current tax assets are offset against current tax liabilities, and deferred tax assets against deferred tax liabilities, if the Company or the Group has the legally enforceable right to set off current tax assets against current tax liabilities and the following additional conditions are met:
– in the case of current tax assets and liabilities, the Company or the Group intends either to settle on a net basis, or to realise the asset and settle the liability simultaneously; or
– in the case of deferred tax assets and liabilities, if they relate to income taxes levied by the same taxation authority on either:
– the same taxable entity; or
– different taxable entities, which, in each future period in which significant amounts of deferred tax liabilities or assets are expected to be settled or recovered, intend to realise the current tax assets and settle the current tax liabilities on a net basis or realise and settle simultaneously.

62 Varitronix International Limited
(Expressed in Hong Kong dollars unless otherwise indicated)
notes to the Financial statements
The results of operations with functional currency other than Hong Kong dollars are translated into Hong Kong dollars at the exchange rates approximating the foreign exchange rates ruling at the dates of the transactions. Statement of financial position items are translated into Hong Kong dollars at the closing foreign exchange rates at the end of the reporting period. The resulting exchange differences are recognised in other comprehensive income and accumulated separately in equity in the exchange reserve.
On disposal of an operation with functional currency other than Hong Kong dollars, the cumulative amount of the exchange differences relating to that operation is reclassified from equity to profit or loss when the gain or loss on disposal is recognised.
(v) Borrowing costsBorrowings costs are expensed in the period in which they are incurred.
(w) Related parties(1) A person, or a close member of that person’s family, is
related to the Group if that person:
(i) has control or joint control over the Group;
(ii) has significant influence over the Group; or
(iii) is a member of the key management personnel of the Group or the Group’s parent.
(2) An entity is related to the Group if any of the following conditions applies:
(i) The entity and the Group are members of the same group (which means that each parent, subsidiary and fellow subsidiary is related to the others).
(ii) One entity is an associate or joint venture of the other entity (or an associate or joint venture of a member of a group of which the other entity is a member).
(iii) Both entities are joint ventures of the same third party.
(iv) One entity is a joint venture of a third entity and the other entity is an associate of the third entity.
(v) The entity is a post-employment benefit plan for the benefit of employees of either the Group or an entity related to the Group.
(vi) The entity is controlled or jointly controlled by a person identified in (1).
1. signiFiCAnT ACCoUnTing PoliCies (ConTinUeD)
(s) Revenue recognitionRevenue is measured at the fair value of the consideration received or receivable. Provided it is probable that the economic benefits will flow to the Group and the revenue and costs, if applicable, can be measured reliably, revenue is recognised in profit or loss as follows:
(i) Sale of goodsRevenue is recognised at the point in time when the customer has accepted the goods and the related risks and rewards of ownership. Revenue excludes value added tax or other sales taxes and is after deduction of returns and any trade discounts.
(ii) DividendsDividend income from listed investments is recognised when the share price of the security goes ex-dividend. Dividend income from unlisted investments is recognised when the shareholder’s right to receive payment is established.
(iii) Interest incomeInterest income is recognised as it accrues using the effective interest method.
(iv) Government grantsGovernment grants are recognised in the statement of financial position initially when there is reasonable assurance that they will be received and that the Group will comply with the conditions attaching to them. Grants that compensate the Group for expenses incurred are recognised as income in profit or loss on a systematic basis in the same periods in which the expenses are incurred.
(t) Research and developmentResearch and development expenditure is recognised as an expense in the period in which it is incurred.
(u) Translation of foreign currenciesForeign currency transactions during the year are translated at the foreign exchange rates ruling at the transaction dates. Monetary assets and liabilities denominated in foreign currencies are translated at the foreign exchange rates ruling at the end of the reporting period. Exchange gains and losses are recognised in profit or loss.
Non-monetary assets and liabilities that are measured in terms of historical cost in a foreign currency are translated using the foreign exchange rates ruling at the transaction dates. Non-monetary assets and liabilities denominated in foreign currencies that are stated at fair value are translated using the foreign exchange rates ruling at the dates the fair value was determined.

63Annual Report 2016
(b) Write-down of inventoriesThe Group reviews the carrying amounts of the inventories at the end of each reporting period to determine whether the inventories are carried at lower of cost and net realisable value in accordance with the accounting policy set out in note 1(j). Management estimates net realisable value based on the current market situation and historical experience on similar inventories. Any change in the assumptions would increase or decrease the amount of inventories write-down or the related reversal of write-down made in prior years and affect the Group’s net asset value and profit or loss.
(c) DepreciationProperty, plant and equipment are depreciated on a straight line basis over the estimated useful lives of the assets. The Group reviews the estimated useful lives and residual values of the assets annually in order to determine the amount of depreciation expense to be recorded during any reporting period. The useful lives and residual values are based on the Group’s technological experience with similar assets and taking into account anticipated technological changes. The depreciation expense for future periods is adjusted if there are significant changes from previous estimations.
(d) Recognition of deferred tax assetsThe Group has recognised deferred tax assets which arose from deductible temporary differences as set out in note 23(b). The realisability of the deferred tax assets mainly depends on whether it is probable that future taxable profits or taxable temporary differences will be available against which the assets can be utilised. In case where the actual future taxable profits or taxable temporary differences generated are less than expected, a reversal of deferred tax assets may arise, which will be recognised in profit or loss for the period in which such a reversal takes place.
3. RevenUeThe principal activity of the Company is investment holding. The principal activities of the Group are the design, manufacture and sale of liquid crystal displays (“LCDs”) and related products.
Revenue represents the invoiced value of goods supplied to customers by the Group less returns and discounts.
The Group’s customer base is diversified and includes only one customer with whom transactions have exceeded 10% of the Group’s revenues in 2016 (2015: one). In 2016 revenues from sales to the one customer in terms of sales amount, including sales to entities which are known to the Group to be under common control with such customer, amounted to approximately $224,752,000 (2015: $252,213,000). Details of concentrations of credit risk are set out in note 26(a).
Further details regarding the Group’s segment reporting are disclosed in note 11 to these financial statements.
1. signiFiCAnT ACCoUnTing PoliCies (ConTinUeD)
(w) Related parties (continued)
(vii) A person identified in (1)(i) has significant influence over the entity or is a member of the key management personnel of the entity (or of a parent of the entity).
(viii) The entity, or any member of a group of which it is a part, provides key management personnel services to the Group or to the Group’s parent.
Close members of the family of a person are those family members who may be expected to influence, or be influenced by, that person in their dealings with the entity.
(x) Segment reportingOperating segments, and the amounts of each segment item reported in the financial statements, are identified from the financial information provided regularly to the Group’s most senior executive management for the purposes of allocating resources to, and assessing the performance of, the Group’s various lines of business and geographical locations.
Individually material operating segments are not aggregated for financial reporting purposes unless the segments have similar economic characteristics and are similar in respect of the nature of products and services, the nature of production processes, the type or class of customers, the methods used to distribute the products or provide the services and the nature of the regulatory environment. Operating segments which are not individually material may be aggregated if they share a majority of these criteria.
2. ACCoUnTing JUDgeMenT AnD esTiMATes
Notes 16, 24 and 26(g) contain information about assumptions and their risk factors relating to valuation of other non-current financial assets, fair value of share options granted and financial instruments. Other key sources of estimation uncertainty are as follows:
(a) Impairment of assetsInternal and external sources of information are reviewed by the Group at the end of each reporting period to assess whether there is any indication that an asset may be impaired. If any such indication exists, the recoverable amount of the asset is estimated to determine impairment losses on the asset. Changes in facts and circumstances may result in revisions to the conclusion of whether an indication of impairment exists and revised estimates of recoverable amounts, which would affect profit or loss in future years.
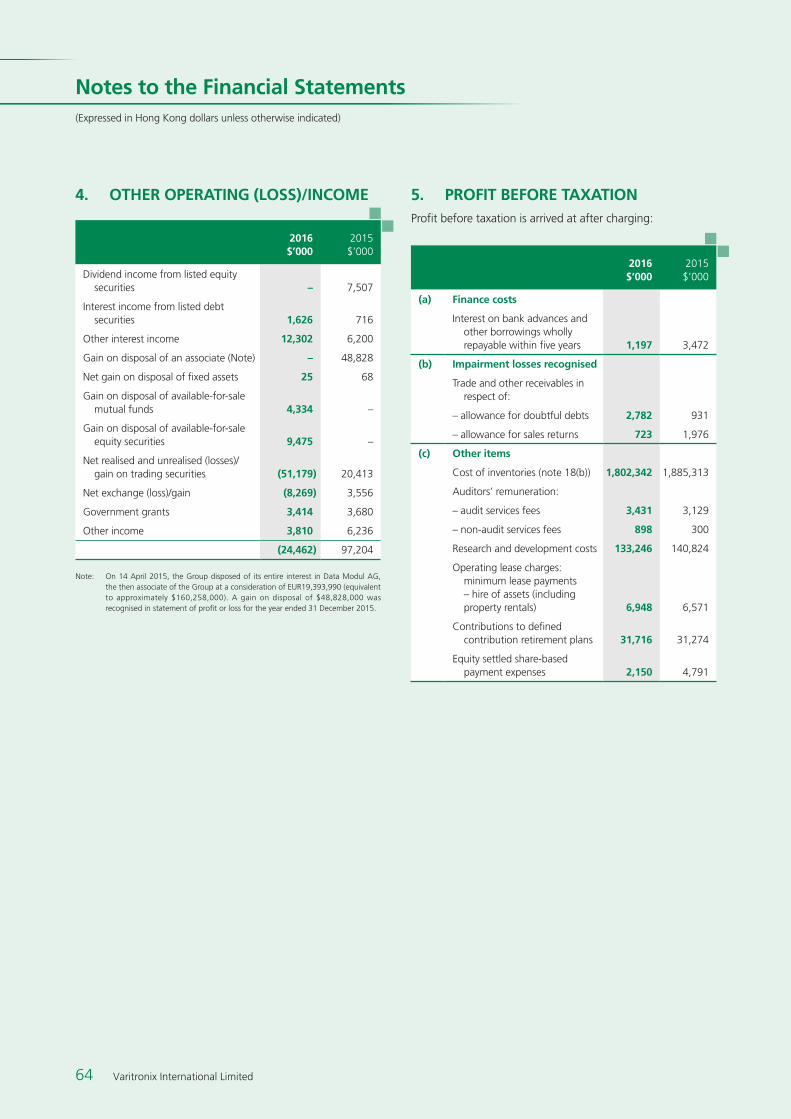
64 Varitronix International Limited
(Expressed in Hong Kong dollars unless otherwise indicated)
notes to the Financial statements
5. PRoFiT BeFoRe TAXATionProfit before taxation is arrived at after charging:
2016 2015$’000 $’000
(a) Finance costs
Interest on bank advances and other borrowings wholly repayable within five years 1,197 3,472
(b) impairment losses recognised
Trade and other receivables in respect of:
– allowance for doubtful debts 2,782 931
– allowance for sales returns 723 1,976
(c) other items
Cost of inventories (note 18(b)) 1,802,342 1,885,313
Auditors’ remuneration:
– audit services fees 3,431 3,129
– non-audit services fees 898 300
Research and development costs 133,246 140,824
Operating lease charges: minimum lease payments – hire of assets (including property rentals) 6,948 6,571
Contributions to defined contribution retirement plans 31,716 31,274
Equity settled share-based payment expenses 2,150 4,791
4. oTHeR oPeRATing (loss)/inCoMe
2016 2015$’000 $’000
Dividend income from listed equity securities – 7,507
Interest income from listed debt securities 1,626 716
Other interest income 12,302 6,200
Gain on disposal of an associate (Note) – 48,828
Net gain on disposal of fixed assets 25 68
Gain on disposal of available-for-sale mutual funds 4,334 –
Gain on disposal of available-for-sale equity securities 9,475 –
Net realised and unrealised (losses)/gain on trading securities (51,179) 20,413
Net exchange (loss)/gain (8,269) 3,556
Government grants 3,414 3,680
Other income 3,810 6,236
(24,462) 97,204
Note: On 14 April 2015, the Group disposed of its entire interest in Data Modul AG, the then associate of the Group at a consideration of EUR19,393,990 (equivalent to approximately $160,258,000). A gain on disposal of $48,828,000 was recognised in statement of profit or loss for the year ended 31 December 2015.

65Annual Report 2016
(iii) Jurisdictions outside Hong Kong and the PRC
Taxation for subsidiaries with operations outside Hong Kong and the PRC is charged at the appropriate current rates of taxation ruling in the relevant tax jurisdictions.
(b) Reconciliation between tax expense and accounting profit at applicable tax rates:
2016 2015$’000 $’000
Profit before taxation 58,049 325,358
Notional tax expense on profit before taxation, calculated at the rates applicable to profits in the tax jurisdictions concerned 4,625 64,056
Tax effect of non-deductible expenses 19,841 2,055
Tax effect of non-taxable income (13,483) (21,366)
Tax effect of tax rates differentials in respect of tax expenses for jurisdictions outside local operations – (9,401)
Tax effect of unused tax losses not recognised 903 4,052
Over-provisions in respect of prior years (4,932) (13,846)
Others 572 (553)
Actual tax expense 7,526 24,997
6. inCoMe TAX in THe ConsoliDATeD sTATeMenT oF PRoFiT oR loss
(a) Taxation in the consolidated statement of profit or loss represents:
2016 2015$’000 $’000
Current tax – Hong Kong Profits Tax
Provision for the year – 16,196
Under/(over)-provision in respect of prior years 666 (8,617)
666 7,579
Current tax – the PRC income taxes
Provision for the year 7,918 12,764
Over-provision in respect of prior years (5,816) (4,640)
2,102 8,124
Current tax – Jurisdictions outside Hong Kong and the PRC
Provision for the year 6,321 7,681
Under/(over)-provision in respect of prior years 218 (589)
6,539 7,092
Deferred tax
Origination and reversal of temporary differences (note 23(b)) (1,781) 2,202
7,526 24,997
(i) Hong Kong Profits TaxThe provision for Hong Kong Profits Tax for 2016 is calculated at 16.5% (2015: 16.5%) of the estimated assessable profits for the year.
(ii) PRC income taxesAccording to the Corporate Income Tax Law of the PRC with effect from 1 January 2008, the standard corporate income tax rate for enterprises in the PRC is 25%.
Varitronix (Heyuan) Display Technology Limited (“Varitronix Heyuan”), a subsidiary of the Group, was designated as high and new technology enterprise, which qualified for a reduced Corporate Income Tax rate of 15%. Accordingly, Varitronix Heyuan’s applicable tax rate is 15% for the years ended 31 December 2015 and 2016.
Withholding tax is levied on dividend distributions arising from profit of Varitronix Heyuan earned after 1 January 2008 based on an applicable tax rate at 5%.

66 Varitronix International Limited
(Expressed in Hong Kong dollars unless otherwise indicated)
notes to the Financial statements
7. DiReCToRs’ eMolUMenTsDirectors’ emoluments disclosed pursuant to section 383(1) of the Hong Kong Companies Ordinance and Part 2 of the Companies (Disclosure of Information about Benefits of Directors) Regulation are as follows:
Year ended 31 December 2016
Directors’ fees
salaries, allowances
and benefits in kind
Discretionary bonuses
Retirement scheme
contributions sub-totalshare-based
payments Total$’000 $’000 $’000 $’000 $’000 $’000 $’000
executive Directors
Ko Chun Shun, Johnson – 800 – 12 812 561 1,373
Ho Te Hwai, Cecil – 80 – 4 84 280 364
Ko Wing Yan, Samantha – 2,190 160 18 2,368 561 2,929
Yao Xiangjun – 1,600 – – 1,600 – 1,600
Su Ning – 800 160 – 960 – 960
non-executive Directors
Yang Xiaoping 135 – – – 135 – 135
Dong Xue 135 – – – 135 – 135
Yuan Feng 135 – – – 135 – 135
independent non-executive Directors
Dr. Lo Wing Yan, William 84 – – – 84 84 168
Hou Ziqiang 200 – – – 200 84 284
Chau Shing Yim, David 84 – – – 84 84 168
Fung, Yuk Kan Peter 116 – – – 116 – 116
Chu, Howard Ho Hwa 116 – – – 116 – 116
Total 1,005 5,470 320 34 6,829 1,654 8,483
Year ended 31 December 2015
Directors’ fees
Salaries, allowances
and benefits in kind
Discretionary bonuses
Retirement scheme
contributions Sub-totalShare-based
payments Total$’000 $’000 $’000 $’000 $’000 $’000 $’000
executive Directors
Ko Chun Shun, Johnson – 2,400 400 36 2,836 1,125 3,961
Tsoi Tong Hoo, Tony – 2,148 – 75 2,223 36 2,259
Ho Te Hwai, Cecil – 240 300 12 552 568 1,120
Ko Wing Yan, Samantha – 1,560 2,000 18 3,578 1,089 4,667
independent non-executive Directors
Dr. Lo Wing Yan, William 200 – – – 200 171 371
Hou Ziqiang 200 – – – 200 171 371
Chau Shing Yim, David 200 – – – 200 171 371
Total 600 6,348 2,700 141 9,789 3,331 13,120

67Annual Report 2016
10. eARnings PeR sHARe
(a) Basic earnings per shareThe calculation of basic earnings per share is based on the consolidated profit attributable to equity shareholders of the Company of $50,523,000 (2015: $300,605,000) and the weighted average number of shares of 604,378,565 shares (2015: 329,633,424 shares) in issue during the year, calculated as follows:
Weighted average number of ordinary shares
2016 2015
Issued ordinary shares at 1 January 331,125,204 327,915,204
Effect of issuance of new shares 271,038,251 –
Effect of share options exercised 2,215,110 1,718,220
Weighted average number of ordinary shares at 31 December 604,378,565 329,633,424
(b) Diluted earnings per shareThe calculation of diluted earnings per share is based on the consolidated profit attributable to equity shareholders of the Company of $50,523,000 (2015: $300,605,000) and the weighted average number of shares of 605,091,117 shares (2015: 332,525,052 shares), calculated as follows:
Weighted average number of ordinary shares (diluted)
2016 2015
Weighted average number of ordinary shares at 31 December 604,378,565 329,633,424
Effect of deemed issue of shares under the Company’s share option scheme for nil consideration 712,552 2,891,628
Weighted average number of ordinary shares (diluted) at 31 December 605,091,117 332,525,052
8. inDiviDUAls wiTH HigHesT eMolUMenTs
Of the five individuals with the highest emoluments, three (2015: three) are Directors, whose emoluments are disclosed in note 7. The aggregate of the emoluments in respect of the other two (2015: two) individuals are as follows:
2016 2015$’000 $’000
Salaries and allowances 4,206 4,499
Retirement scheme contributions 205 256
4,411 4,755
The emoluments of the two (2015: two) individuals with the highest emoluments are within the following band:
2016 2015number of individual
Number of individual
$1,500,001 – $2,500,000 1 1
$2,500,001 – $3,000,000 1 1
9. oTHeR CoMPReHensive inCoMeThere are no tax effects in respect of the components of other comprehensive income.
Components of other comprehensive income are as follows:
2016 2015$’000 $’000
Transfer to profit or loss upon disposal of an associate – (12,099)
Foreign currency translation adjustments:
Exchange differences on translation of financial statements of operations outside Hong Kong (65,900) (35,652)
Available-for-sale securities:
Changes in fair value recognised during the year 834 (3,601)
Reclassification to profit or loss upon disposal (12,530) –
(11,696) (3,601)

68 Varitronix International Limited
(Expressed in Hong Kong dollars unless otherwise indicated)
notes to the Financial statements
(i) Group’s revenues from external customers
2016 2015$’000 $’000
The PRC (place of domicile) 709,946 834,310
Europe 907,790 973,131
America 239,942 287,774
Korea 130,627 161,542
Others 259,165 231,063
1,537,524 1,653,510
Consolidated revenue 2,247,470 2,487,820
Revenue from external customers located in Europe is analysed as follows:
2016 2015$’000 $’000
Germany 139,832 126,459
United Kingdom 132,219 145,246
France 124,116 138,968
Italy 61,885 63,592
Other European countries 449,738 498,866
907,790 973,131
(ii) Group’s specified non-current assets
2016 2015$’000 $’000
The PRC (place of domicile) 358,644 409,013
Korea 4,150 4,747
Others 3,153 3,595
365,947 417,355
11. segMenT RePoRTing
(a) Operating segment resultsThe Group manages its business as a single unit and, accordingly, the design, manufacture and sale of liquid crystal displays and related products is the only reporting segment and virtually all of the revenue and operating profits is derived from this business segment. The consolidated financial statements are already presented in a manner consistent with the way in which information is reported internally to the Group’s most senior executive management for the purposes of resource allocation and performance assessment. Accordingly, no separate business segment information is disclosed.
The chief operating decision-maker has been identified as the Board. The Board reviews the Group’s internal reporting in order to assess performance and allocate resources. Management has determined that a single operating segment exists based on this internal reporting.
The Board assesses the performance of the operating segments based on revenue which is consistent with that in the consolidated financial statements. Other information, being the total assets excluding deferred tax assets, loans receivable, other financial assets, trading securities, current tax recoverable and the interest in associates, all of which are managed on a central basis, are provided to the Board to assess the performance of the operating segment.
(b) Geographic informationThe following table sets out information about the geographical location of (i) the Group’s revenues from external customers and (ii) the Group’s fixed assets and interest in associates (“specified non-current assets”). The geographical location of customers is based on the location at which the services were provided or the goods delivered. The geographical location of the specified non-current assets is based on the physical location of the asset, in the case of property, plant and equipment and the location of operations, in the case of interest in associates.

69Annual Report 2016
12. FiXeD AsseTs
land andbuildings
held for own use
Plant,machinery,
tools andequipment others sub-total
interest inleasehold land held
for ownuse underoperating
leases Total$’000 $’000 $’000 $’000 $’000 $’000
Cost:
At 1 January 2015 200,413 1,215,635 157,138 1,573,186 20,862 1,594,048
Exchange adjustments (13,222) (26,077) (4,406) (43,705) (690) (44,395)
Additions – 25,053 7,826 32,879 – 32,879
Disposals – (10) (511) (521) – (521)
At 31 December 2015 187,191 1,214,601 160,047 1,561,839 20,172 1,582,011
At 1 January 2016 187,191 1,214,601 160,047 1,561,839 20,172 1,582,011
Exchange adjustments (10,476) (45,428) (6,233) (62,137) (966) (63,103)
Additions – 39,721 20,406 60,127 – 60,127
Disposals – (55,389) (15,803) (71,192) (3,750) (74,942)
At 31 December 2016 176,715 1,153,505 158,417 1,488,637 15,456 1,504,093
Accumulated amortisation and depreciation:
At 1 January 2015 38,978 914,421 133,332 1,086,731 8,662 1,095,393
Exchange adjustments (1,598) (23,081) (3,626) (28,305) (225) (28,530)
Charge for the year 8,225 87,365 6,688 102,278 731 103,009
Written back on disposals – (10) (459) (469) – (469)
At 31 December 2015 45,605 978,695 135,935 1,160,235 9,168 1,169,403
At 1 January 2016 45,605 978,695 135,935 1,160,235 9,168 1,169,403
Exchange adjustments (2,762) (35,700) (5,241) (43,703) (349) (44,052)
Charge for the year 7,891 74,435 7,011 89,337 692 90,029
Written back on disposals – (55,389) (13,945) (69,334) (3,750) (73,084)
At 31 December 2016 50,734 962,041 123,760 1,136,535 5,761 1,142,296
net book value:
At 31 December 2016 125,981 191,464 34,657 352,102 9,695 361,797
At 31 December 2015 141,586 235,906 24,112 401,604 11,004 412,608
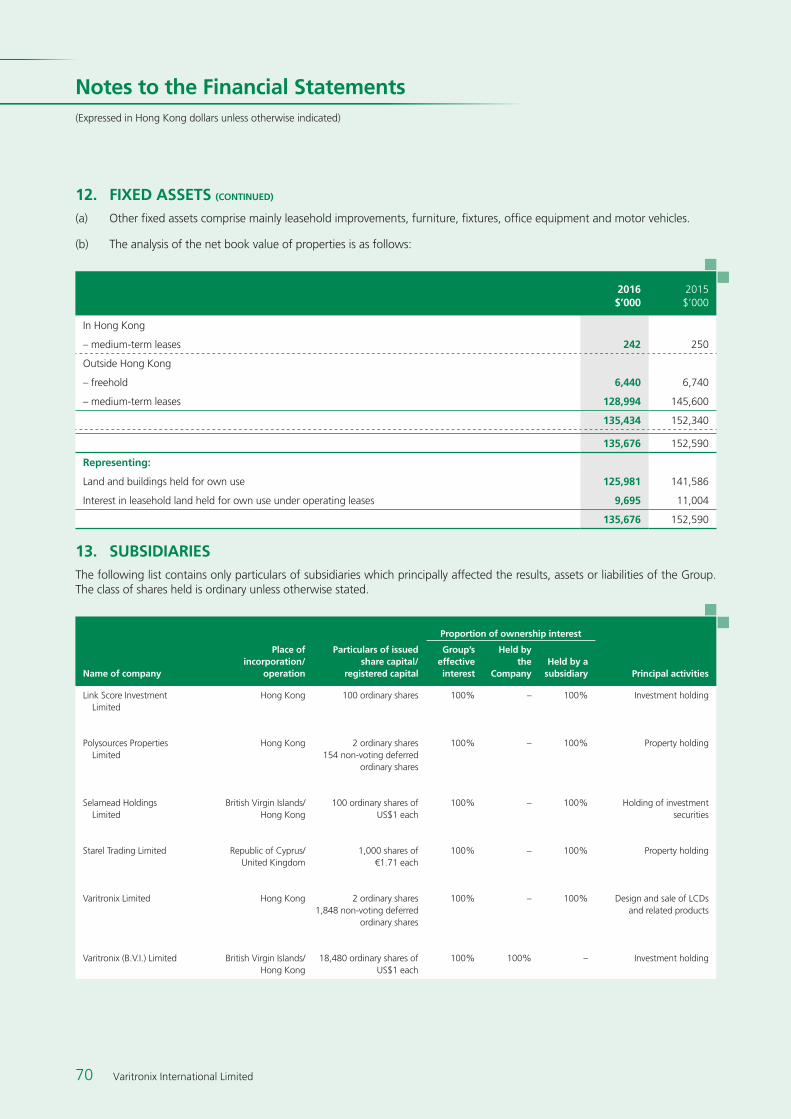
70 Varitronix International Limited
(Expressed in Hong Kong dollars unless otherwise indicated)
notes to the Financial statements
12. FiXeD AsseTs (ConTinUeD)
(a) Other fixed assets comprise mainly leasehold improvements, furniture, fixtures, office equipment and motor vehicles.
(b) The analysis of the net book value of properties is as follows:
2016 2015$’000 $’000
In Hong Kong
– medium-term leases 242 250
Outside Hong Kong
– freehold 6,440 6,740
– medium-term leases 128,994 145,600
135,434 152,340
135,676 152,590
Representing:
Land and buildings held for own use 125,981 141,586
Interest in leasehold land held for own use under operating leases 9,695 11,004
135,676 152,590
13. sUBsiDiARiesThe following list contains only particulars of subsidiaries which principally affected the results, assets or liabilities of the Group. The class of shares held is ordinary unless otherwise stated.
Proportion of ownership interest
name of company
Place of incorporation/
operation
Particulars of issued share capital/
registered capital
group’s effective interest
Held by the
CompanyHeld by a
subsidiary Principal activities
Link Score Investment Limited
Hong Kong 100 ordinary shares 100% – 100% Investment holding
Polysources Properties Limited
Hong Kong 2 ordinary shares 154 non-voting deferred
ordinary shares
100% – 100% Property holding
Selamead Holdings Limited
British Virgin Islands/Hong Kong
100 ordinary shares of US$1 each
100% – 100% Holding of investment securities
Starel Trading Limited Republic of Cyprus/United Kingdom
1,000 shares of €1.71 each
100% – 100% Property holding
Varitronix Limited Hong Kong 2 ordinary shares 1,848 non-voting deferred
ordinary shares
100% – 100% Design and sale of LCDs and related products
Varitronix (B.V.I.) Limited British Virgin Islands/Hong Kong
18,480 ordinary shares of US$1 each
100% 100% – Investment holding

71Annual Report 2016
Proportion of ownership interest
name of company
Place of incorporation/
operation
Particulars of issued share capital/
registered capital
group’s effective interest
Held by the
CompanyHeld by a
subsidiary Principal activities
Varitronix Finance Limited British Virgin Islands/Hong Kong
100 ordinary shares of US$1 each
100% – 100% Provision of financial co-ordination services for
group companies and holding of
investment securities
Varitronix France SAS France 2,500 ordinary shares of €15.25 each
100% – 100% Marketing and sales consultants
Varitronix GmbH Germany 100,000 shares of €0.51 each
100% – 100% Marketing and sales consultants
Varitronix (Heyuan) Display Technology Limited #
The People’s Republic of China
Paid-up registered capital RMB713,729,475
100% – 100% Manufacture and sale of LCDs and related products
Varitronix Investment Limited
British Virgin Islands/Hong Kong
5,000 ordinary shares of US$1 each
100% – 100% Holding of investment securities
Varitronix Italy s.r.l. Italy 12,000 ordinary shares of €1 each
100% – 100% Marketing and sales consultants
Varitronix (Switzerland) GmbH
Switzerland Registered capital CHF30,000
100% – 100% Marketing and sales consultants
Varitronix (U.K.) Limited United Kingdom 100 ordinary shares of GBP10 each
100% – 100% Marketing and sales consultants
VL Electronics, Inc. United States 5,000 common stock of US$10 each
100% – 100% Marketing and sales consultants
Varitronix (Japan) Limited Japan 1,000 ordinary stock of JPY10,000 each
100% – 100% Marketing and sales consultants
# Name of company Type of legal entity
Varitronix (Heyuan) Display Technology Limited Wholly owned foreign enterprise
13. sUBsiDiARies (ConTinUeD)

72 Varitronix International Limited
(Expressed in Hong Kong dollars unless otherwise indicated)
notes to the Financial statements
15. loAns ReCeivABle
Loans receivable are unsecured, interest free but guaranteed by the ultimate holding company of the debtor.
The loans receivable are repayable as follows:
2016$’000
2015$’000
Within 1 year* 15,500 15,500
After 1 year but within 5 years 15,500 31,000
31,000 46,500
* The current portion of loans receivable has been included in trade and other receivables (note 19).
14. inTeResT in An AssoCiATe
2016$’000
2015$’000
Share of net assets 3,017 3,579
Amount due from an associate 1,133 1,168
4,150 4,747
The amount due from an associate is unsecured, interest free and has no fixed repayment terms but the Group will not demand repayment within 12 months from the end of the reporting period.
Particulars of the associateSet out below are the particulars of the associate of the Group:
name of associatePlace of incorporation
and operation
Particulars of issued share capital/
registered capitalAttributable indirect
equity interest % held Principal activity
New On Technology Company Limited
Korea 40,000 ordinary shares of KRW5,000 each
50% Trading of electronic components
16. oTHeR FinAnCiAl AsseTs
2016$’000
2015$’000
non-current portion
Available-for-sale debt securities
Listed outside Hong Kong, carried at fair value 10,782 9,948
Available-for-sale mutual funds
Non-listed, carried at fair value – 7,195
Held-to-maturity debt securities
Listed outside Hong Kong, carried at amortised cost – 29,328
Available-for-sale equity securities
Listed in Hong Kong 1 10,882
Total other non-current financial assets 10,783 57,353
Current portion
Held-to-maturity debt securities
Listed outside Hong Kong, carried at amortised cost 44,127 –
Certificate of deposits
Issued by financial institutions in Hong Kong 10,084 –
Total current financial assets 54,211 –
The held-to-maturity debt securities are not past due or impaired.

73Annual Report 2016
19. TRADe AnD oTHeR ReCeivABles
2016$’000
2015$’000
Trade debtors and bills receivable 475,679 487,564
Less: Allowance for doubtful debts (6,125) (3,343)
Allowance for sales returns (6,073) (5,350)
463,481 478,871
Other receivables 43,429 70,876
Deposits and prepayments 37,918 11,549
544,828 561,296
Less: Non-current loan receivable (note 15) (15,500) (31,000)
Other non-current assets (18,336) –
510,992 530,296
Other non-current assets represent deposits paid for the purchase of property, plant and equipment amounted to approximately $18,336,000 (2015: $nil). Except for the rental deposit of $1,115,000 (2015: $1,210,000), all of the current portion of trade and other receivables are expected to be recovered or recognised as expense within 12 months from the end of the reporting period.
(a) Ageing analysisAs at the end of the reporting period, the ageing analysis of trade debtors and bills receivable which are included in trade and other receivables, based on the invoice date and net of allowance for doubtful debts and sales return, is as follows:
2016$’000
2015$’000
Within 60 days of the invoice issue date 313,165 363,767
61 to 90 days after the invoice issue date 89,484 72,944
91 to 120 days after the invoice issue date 30,627 25,510
More than 120 days but less than 12 months after the invoice issue date 30,205 16,650
463,481 478,871
Trade debtors and bills receivable are generally due within 60 to 90 days from the date of billing. Further details on the Group’s credit policy are set out in note 26(a).
17. TRADing seCURiTies
2016$’000
2015$’000
listed equity securities at fair value In Hong Kong – 160,891
Total – 160,891
During the year ended 31 December 2016, the Group has disposed of all the trading securities, at an aggregate proceed of $109,712,000. A net loss on disposal of $51,179,000 was recognised in the consolidated statement of profit or loss for the year ended 31 December 2016.
18. invenToRies
(a) Inventories in the consolidated statement of financial position comprise:
2016$’000
2015$’000
Raw materials 199,553 152,596
Work in progress 93,947 97,758
Finished goods 157,493 222,641
450,993 472,995
(b) The analysis of the amount of inventories recognised as an expense is as follows:
2016$’000
2015$’000
Carrying amount of inventories sold 1,797,107 1,892,706
Write-down of inventories 9,591 –
Reversal of write-down of inventories (4,356) (7,393)
1,802,342 1,885,313
The reversal of write-down of inventories made in prior years arose due to an increase in the estimated net realisable value of certain inventories as a result of a change in consumer preferences.

74 Varitronix International Limited
(Expressed in Hong Kong dollars unless otherwise indicated)
notes to the Financial statements
(c) Trade debtors and bills receivable that are not impaired
The ageing analysis of trade debtors and bills receivable that are neither individually nor collectively considered to be impaired are as follows:
2016$’000
2015$’000
Neither past due nor impaired 315,408 366,985
Less than 1 month 89,799 73,681
1 to 2 months 30,665 25,734
More than 2 months but less than 12 months 33,682 17,163
More than 12 months – 658
154,146 117,236
469,554 484,221
Receivables that were neither past due nor impaired related to a wide range of customers for whom there was no recent history of default.
Receivables that were past due but not impaired related to a number of independent customers that have a good track record with the Group. Based on past experience, management believes that no impairment allowance is necessary in respect of these balances as there has not been a significant change in credit quality and the balances are still considered fully recoverable.
20. CAsH AnD CAsH eqUivAlenTs AnD FiXeD DePosiTs wiTH BAnKs
(a) Cash and cash equivalents and fixed deposits with banks comprise:
2016$’000
2015$’000
Fixed deposits with banks and other financial institutions with more than three months to maturity when placed 626,231 –
Fixed deposits with banks and other financial institutions with three months or less to maturity when placed 394,290 258,631
Cash at banks and in hand 704,382 508,762
Cash and cash equivalents 1,098,672 767,393
19. TRADe AnD oTHeR ReCeivABles (ConTinUeD)
(b) Impairment of trade debtors and bills receivable
Impairment losses in respect of trade debtors and bills receivable are recorded using an allowance account unless the Group is satisfied that recovery of the amount is remote, in which case the impairment loss is written off against trade debtors and bills receivable directly (see note 1(k)).
The movement in the allowance for doubtful debts during the year, including both specific and collective loss components, is as follows:
2016$’000
2015$’000
At 1 January 3,343 2,412
Impairment loss recognised 2,782 931
At 31 December 6,125 3,343
The movement in the allowance for sales returns during the year, including both specific and collective estimation of sales returns, is as follows:
2016$’000
2015$’000
At 1 January 5,350 3,374
Allowance for sales returns recognised 723 1,976
At 31 December 6,073 5,350
At 31 December 2016, the Group’s trade debtors and bills receivable of $6,125,000 (2015: $3,343,000) were individually determined to be impaired. The individually impaired receivables related to customers those were in financial difficulties and management assessed that none of the receivables is expected to be recovered. Consequently, specific allowances for doubtful debts of $6,125,000 (2015: $3,343,000) were recognised.

75Annual Report 2016
21. TRADe AnD oTHeR PAYABles
2016$’000
2015$’000
Trade creditors 348,720 313,343
Accrued charges and other payables 75,340 62,945
424,060 376,288
All creditors and accrued charges are expected to be settled or recognised as income within one year or are repayable on demand.
As at the end of the reporting period, the ageing analysis of trade creditors and bills payable (which are included in trade and other payables), based on the invoice date, is as follows:
2016$’000
2015$’000
Within 60 days of supplier invoice date 262,538 232,976
61 to 120 days after supplier invoice date 77,029 73,023
More than 120 days but within 12 months after supplier invoice date 8,635 6,917
More than 12 months after supplier invoice date 518 427
348,720 313,343
20. CAsH AnD CAsH eqUivAlenTs AnD FiXeD DePosiTs wiTH BAnKs (ConTinUeD)
(b) Reconciliation of profit before taxation to cash generated from operations:
Note2016$’000
2015$’000
Profit before taxation 58,049 325,358
Adjustments for:
Depreciation 12 90,029 103,009
Finance costs 5(a) 1,197 3,472
Dividend income from listed equity securities 4 – (7,507)
Interest income (13,928) (6,916)
Gain on disposal of an associate 4 – (48,828)
Net realised and unrealised losses/(gain) on trading securities 4 51,179 (20,413)
Share of losses/(profits) of associates 453 (4,020)
Net gain on disposal of fixed assets 4 (25) (68)
Gain on disposal of available- for-sale mutual funds 4 (4,334) –
Gain on disposal of available- for-sale equity securities 4 (9,475) –
Equity settled share-based payment expenses 5(c) 2,150 4,791
Foreign exchange gain (1,891) (2,685)
173,404 346,193
Changes in working capital:
Decrease/(increase) in inventories 14,838 (90,566)
Decrease in trade and other receivables 12,286 71,588
Increase/(decrease) in trade and other payables 34,516 (38,435)
Cash generated from operations 235,044 288,780
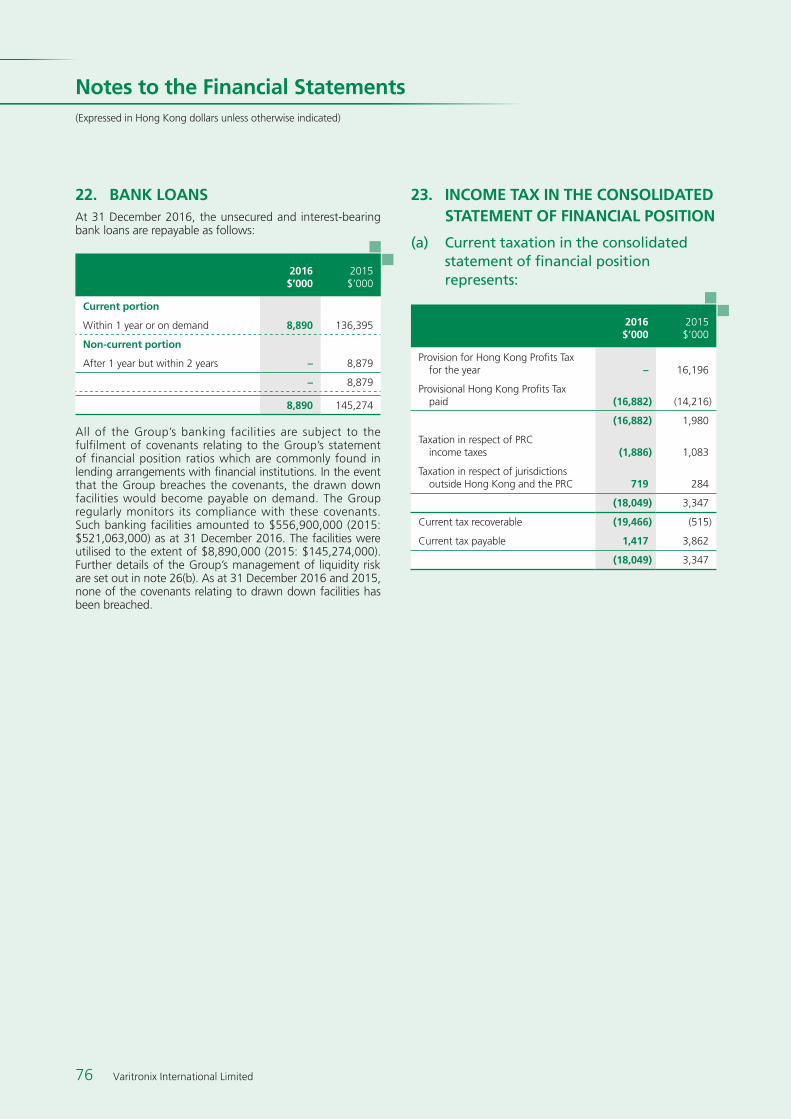
76 Varitronix International Limited
(Expressed in Hong Kong dollars unless otherwise indicated)
notes to the Financial statements
23. inCoMe TAX in THe ConsoliDATeD sTATeMenT oF FinAnCiAl PosiTion
(a) Current taxation in the consolidated statement of financial position represents:
2016$’000
2015$’000
Provision for Hong Kong Profits Tax for the year – 16,196
Provisional Hong Kong Profits Tax paid (16,882) (14,216)
(16,882) 1,980
Taxation in respect of PRC income taxes (1,886) 1,083
Taxation in respect of jurisdictions outside Hong Kong and the PRC 719 284
(18,049) 3,347
Current tax recoverable (19,466) (515)
Current tax payable 1,417 3,862
(18,049) 3,347
22. BAnK loAnsAt 31 December 2016, the unsecured and interest-bearing bank loans are repayable as follows:
2016$’000
2015$’000
Current portion
Within 1 year or on demand 8,890 136,395
non-current portion
After 1 year but within 2 years – 8,879
– 8,879
8,890 145,274
All of the Group’s banking facilities are subject to the fulfilment of covenants relating to the Group’s statement of financial position ratios which are commonly found in lending arrangements with financial institutions. In the event that the Group breaches the covenants, the drawn down facilities would become payable on demand. The Group regularly monitors its compliance with these covenants. Such banking facilities amounted to $556,900,000 (2015: $521,063,000) as at 31 December 2016. The facilities were utilised to the extent of $8,890,000 (2015: $145,274,000). Further details of the Group’s management of liquidity risk are set out in note 26(b). As at 31 December 2016 and 2015, none of the covenants relating to drawn down facilities has been breached.
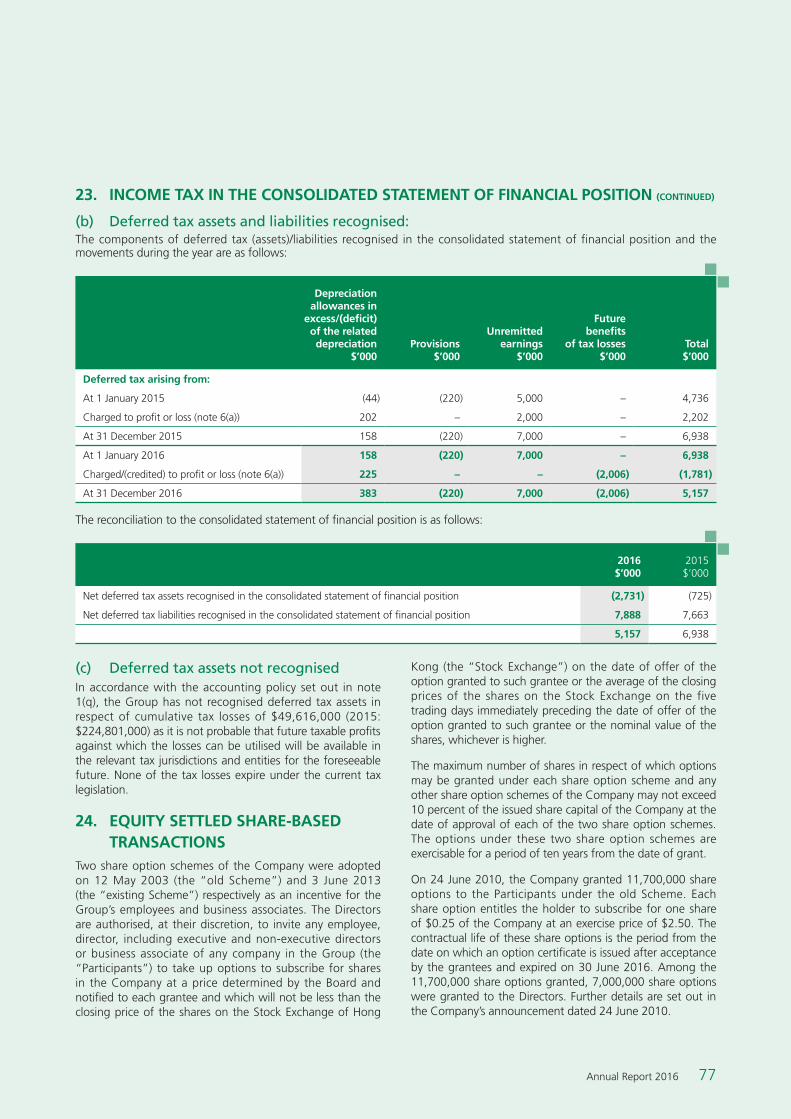
77Annual Report 2016
23. inCoMe TAX in THe ConsoliDATeD sTATeMenT oF FinAnCiAl PosiTion (ConTinUeD)
(b) Deferred tax assets and liabilities recognised:The components of deferred tax (assets)/liabilities recognised in the consolidated statement of financial position and the movements during the year are as follows:
Depreciation allowances in
excess/(deficit) of the related depreciation
$’000Provisions
$’000
Unremitted earnings
$’000
Future benefits
of tax losses$’000
Total$’000
Deferred tax arising from:
At 1 January 2015 (44) (220) 5,000 – 4,736
Charged to profit or loss (note 6(a)) 202 – 2,000 – 2,202
At 31 December 2015 158 (220) 7,000 – 6,938
At 1 January 2016 158 (220) 7,000 – 6,938
Charged/(credited) to profit or loss (note 6(a)) 225 – – (2,006) (1,781)
At 31 December 2016 383 (220) 7,000 (2,006) 5,157
The reconciliation to the consolidated statement of financial position is as follows:
2016$’000
2015$’000
Net deferred tax assets recognised in the consolidated statement of financial position (2,731) (725)
Net deferred tax liabilities recognised in the consolidated statement of financial position 7,888 7,663
5,157 6,938
(c) Deferred tax assets not recognisedIn accordance with the accounting policy set out in note 1(q), the Group has not recognised deferred tax assets in respect of cumulative tax losses of $49,616,000 (2015: $224,801,000) as it is not probable that future taxable profits against which the losses can be utilised will be available in the relevant tax jurisdictions and entities for the foreseeable future. None of the tax losses expire under the current tax legislation.
24. eqUiTY seTTleD sHARe-BAseD TRAnsACTions
Two share option schemes of the Company were adopted on 12 May 2003 (the “old Scheme”) and 3 June 2013 (the “existing Scheme”) respectively as an incentive for the Group’s employees and business associates. The Directors are authorised, at their discretion, to invite any employee, director, including executive and non-executive directors or business associate of any company in the Group (the “Participants”) to take up options to subscribe for shares in the Company at a price determined by the Board and notified to each grantee and which will not be less than the closing price of the shares on the Stock Exchange of Hong
Kong (the “Stock Exchange”) on the date of offer of the option granted to such grantee or the average of the closing prices of the shares on the Stock Exchange on the five trading days immediately preceding the date of offer of the option granted to such grantee or the nominal value of the shares, whichever is higher.
The maximum number of shares in respect of which options may be granted under each share option scheme and any other share option schemes of the Company may not exceed 10 percent of the issued share capital of the Company at the date of approval of each of the two share option schemes. The options under these two share option schemes are exercisable for a period of ten years from the date of grant.
On 24 June 2010, the Company granted 11,700,000 share options to the Participants under the old Scheme. Each share option entitles the holder to subscribe for one share of $0.25 of the Company at an exercise price of $2.50. The contractual life of these share options is the period from the date on which an option certificate is issued after acceptance by the grantees and expired on 30 June 2016. Among the 11,700,000 share options granted, 7,000,000 share options were granted to the Directors. Further details are set out in the Company’s announcement dated 24 June 2010.

78 Varitronix International Limited
(Expressed in Hong Kong dollars unless otherwise indicated)
notes to the Financial statements
(a) The terms and conditions of the grants that existed during the years are as follows, whereby all options are settled by physical delivery of shares:
number of options vesting conditions Contractual life of options
options granted to directors:
– 24 June 2010 7,000,000 Exercisable in five equal tranches immediately from 1 July of each year from 2011 to 2015
Expire at the close of business on 30 June 2016
– 9 July 2015 5,900,000 Exercisable in three tranches immediately from 1 September of each year from 2015 to 2017
Expire at the close of business on 31 August 2018
options granted to employees:
– 24 June 2010 4,700,000 Exercisable in five equal tranches immediately from 1 July of each year from 2011 to 2015
Expire at the close of business on 30 June 2016
– 9 July 2015 2,700,000 Exercisable in three tranches immediately from 1 September of each year from 2015 to 2017
Expire at the close of business on 31 August 2018
(b) The number and weighted average exercise prices of share options are as follows:
2016 2015
weighted average
exercise pricenumber of
options
Weighted average
exercise priceNumber of
options
Outstanding at the beginning of the year $4.73 12,150,000 $4.68 18,960,000
Granted during the year n/A – $5.72 8,600,000
Exercised during the year $2.647 (3,930,000) $2.50 (3,210,000)
Forfeited during the year n/A – $5.72 (200,000)
Lapsed during the year $5.72 (250,000) $2.55 (12,000,000)
Outstanding at the end of the year $5.72 7,970,000 $4.73 12,150,000
Exercisable at the end of the year 5,579,000 7,110,000
The weighted average share price at the date of exercise for share options exercised during the year was $2.65 (2015: $5.87).
The options outstanding at 31 December 2016 had an exercise price of $5.72 (2015: ranged from $2.50 to $5.72) and a weighted average remaining contractual life of 1.67 years (2015: 2.00 years).
24. eqUiTY seTTleD sHARe-BAseD TRAnsACTions (ConTinUeD)
On 9 July 2015, the Company granted 8,600,000 share options to the Participants under the existing Scheme. Each share option entitles the holder to subscribe for one share of $0.25 of the Company at an exercise price of $5.72. The contractual life of these share options is the period from the date on which an option certificate is issued after acceptance by the grantees and expiring on 31 August 2018. Among the 8,600,000 share options granted, 5,900,000 share options were granted to the Directors. Further details are set out in the Company’s announcement dated 9 July 2015.
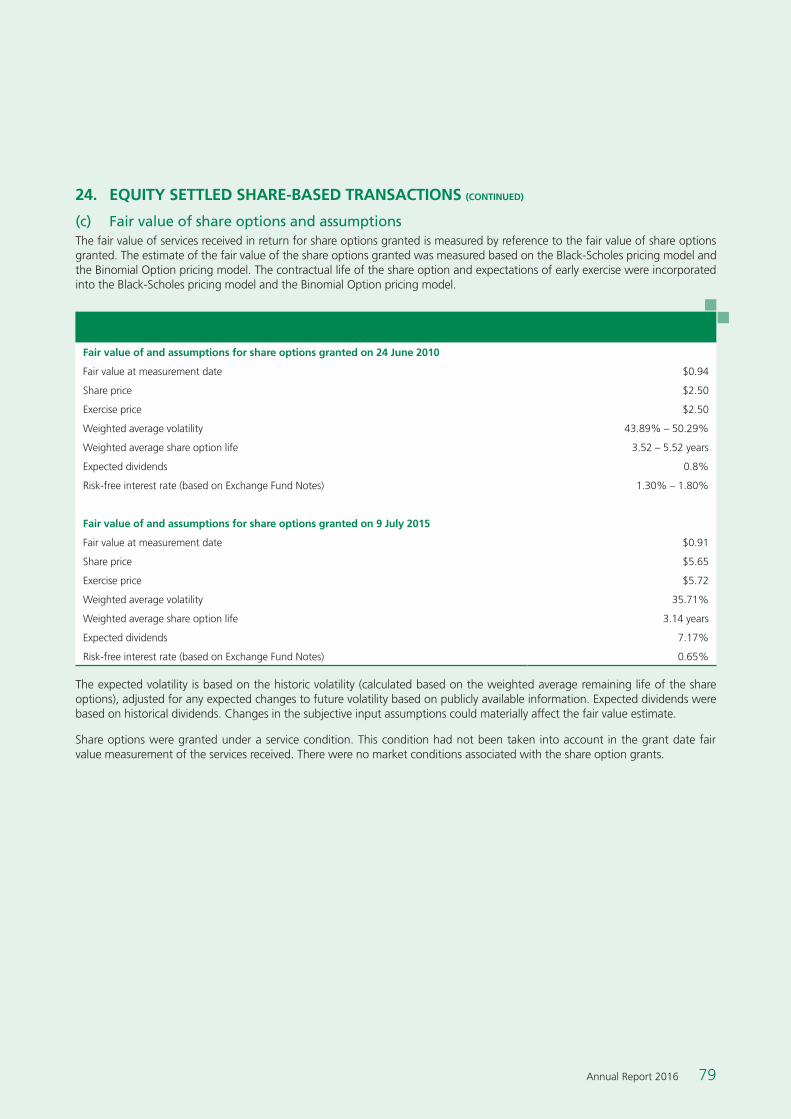
79Annual Report 2016
24. eqUiTY seTTleD sHARe-BAseD TRAnsACTions (ConTinUeD)
(c) Fair value of share options and assumptionsThe fair value of services received in return for share options granted is measured by reference to the fair value of share options granted. The estimate of the fair value of the share options granted was measured based on the Black-Scholes pricing model and the Binomial Option pricing model. The contractual life of the share option and expectations of early exercise were incorporated into the Black-Scholes pricing model and the Binomial Option pricing model.
Fair value of and assumptions for share options granted on 24 June 2010
Fair value at measurement date $0.94
Share price $2.50
Exercise price $2.50
Weighted average volatility 43.89% – 50.29%
Weighted average share option life 3.52 – 5.52 years
Expected dividends 0.8%
Risk-free interest rate (based on Exchange Fund Notes) 1.30% – 1.80%
Fair value of and assumptions for share options granted on 9 July 2015
Fair value at measurement date $0.91
Share price $5.65
Exercise price $5.72
Weighted average volatility 35.71%
Weighted average share option life 3.14 years
Expected dividends 7.17%
Risk-free interest rate (based on Exchange Fund Notes) 0.65%
The expected volatility is based on the historic volatility (calculated based on the weighted average remaining life of the share options), adjusted for any expected changes to future volatility based on publicly available information. Expected dividends were based on historical dividends. Changes in the subjective input assumptions could materially affect the fair value estimate.
Share options were granted under a service condition. This condition had not been taken into account in the grant date fair value measurement of the services received. There were no market conditions associated with the share option grants.

80 Varitronix International Limited
(Expressed in Hong Kong dollars unless otherwise indicated)
notes to the Financial statements
25. CAPiTAl, ReseRves AnD DiviDenDs
(a) Movements in components of equity of the CompanyThe reconciliation between the opening and closing balances of each component of the Group’s consolidated equity is set out in the consolidated statement of changes in equity. Details of the changes in the Company’s individual components of equity between the beginning and the end of the year are set out below:
Note
share capital
$’000
share premium
(note 25(d)(i))
$’000
Contributed surplus
(note 25(d)(ii))
$’000
Capital reserve
(note 25(d)(v))$’000
Retained profits
$’000
Total
$’000
Balance at 1 January 2015 81,979 709,652 51,636 17,748 168,893 1,029,908
Changes in equity for 2015:
Final dividends approved in respect of the previous year 25(b)(ii) – – – – (98,879) (98,879)
Profit and total comprehensive income for the year – – – – 794,452 794,452
Issuance of shares under share option scheme 25(c)(iii) 803 10,269 – (3,047) – 8,025
Equity settled share-based transactions – – – 4,791 – 4,791
Interim dividend declared in respect of the current year 25(b)(i) – – – – (49,611) (49,611)
Balance at 31 December 2015 82,782 719,921 51,636 19,492 814,855 1,688,686
Balance at 1 January 2016 82,782 719,921 51,636 19,492 814,855 1,688,686
Changes in equity for 2016:
Transfer to contributed surplus 25(d)(i) – (720,191) 720,191 – – –
Final dividends approved in respect of the previous year 25(b)(ii) – – – – (101,960) (101,960)
Loss and total comprehensive income for the year – – – – (4,747) (4,747)
Issuance of shares under share option scheme 25(c)(iii) 982 13,137 – (3,715) – 10,404
Issuance of new shares 25(c)(ii) 100,000 1,300,000 – – – 1,400,000
Equity settled share-based transactions – – – 2,150 – 2,150
Capitalization of issuing expenses 25(c)(ii) – (6,052) – – – (6,052)
Special dividend declared in respect of the current year 25(b)(i) – – – – (451,298) (451,298)
Balance at 31 December 2016 183,764 1,306,815 771,827 17,927 256,850 2,537,183
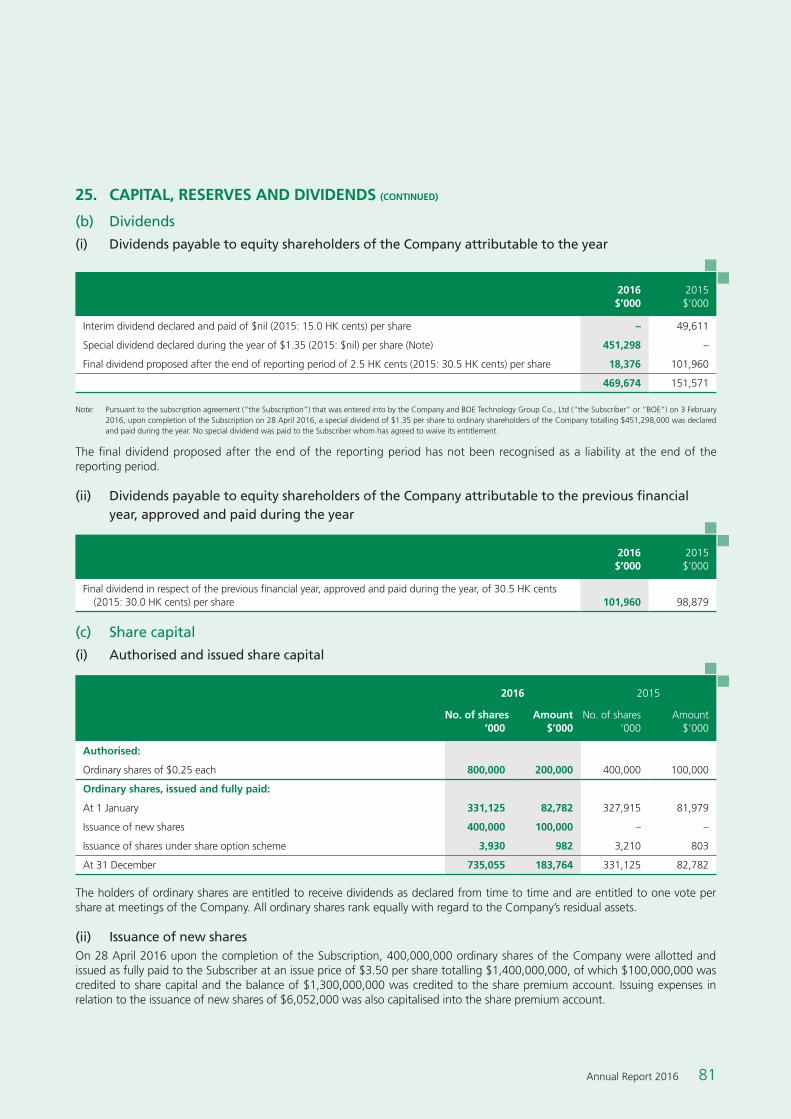
81Annual Report 2016
25. CAPiTAl, ReseRves AnD DiviDenDs (ConTinUeD)
(b) Dividends
(i) Dividends payable to equity shareholders of the Company attributable to the year
2016$’000
2015$’000
Interim dividend declared and paid of $nil (2015: 15.0 HK cents) per share – 49,611
Special dividend declared during the year of $1.35 (2015: $nil) per share (Note) 451,298 –
Final dividend proposed after the end of reporting period of 2.5 HK cents (2015: 30.5 HK cents) per share 18,376 101,960
469,674 151,571
Note: Pursuant to the subscription agreement (“the Subscription”) that was entered into by the Company and BOE Technology Group Co., Ltd (“the Subscriber” or “BOE”) on 3 February 2016, upon completion of the Subscription on 28 April 2016, a special dividend of $1.35 per share to ordinary shareholders of the Company totalling $451,298,000 was declared and paid during the year. No special dividend was paid to the Subscriber whom has agreed to waive its entitlement.
The final dividend proposed after the end of the reporting period has not been recognised as a liability at the end of the reporting period.
(ii) Dividends payable to equity shareholders of the Company attributable to the previous financial year, approved and paid during the year
2016$’000
2015$’000
Final dividend in respect of the previous financial year, approved and paid during the year, of 30.5 HK cents (2015: 30.0 HK cents) per share 101,960 98,879
(c) Share capital
(i) Authorised and issued share capital
2016 2015
no. of shares’000
Amount$’000
No. of shares’000
Amount$’000
Authorised:
Ordinary shares of $0.25 each 800,000 200,000 400,000 100,000
ordinary shares, issued and fully paid:
At 1 January 331,125 82,782 327,915 81,979
Issuance of new shares 400,000 100,000 – –
Issuance of shares under share option scheme 3,930 982 3,210 803
At 31 December 735,055 183,764 331,125 82,782
The holders of ordinary shares are entitled to receive dividends as declared from time to time and are entitled to one vote per share at meetings of the Company. All ordinary shares rank equally with regard to the Company’s residual assets.
(ii) Issuance of new sharesOn 28 April 2016 upon the completion of the Subscription, 400,000,000 ordinary shares of the Company were allotted and issued as fully paid to the Subscriber at an issue price of $3.50 per share totalling $1,400,000,000, of which $100,000,000 was credited to share capital and the balance of $1,300,000,000 was credited to the share premium account. Issuing expenses in relation to the issuance of new shares of $6,052,000 was also capitalised into the share premium account.
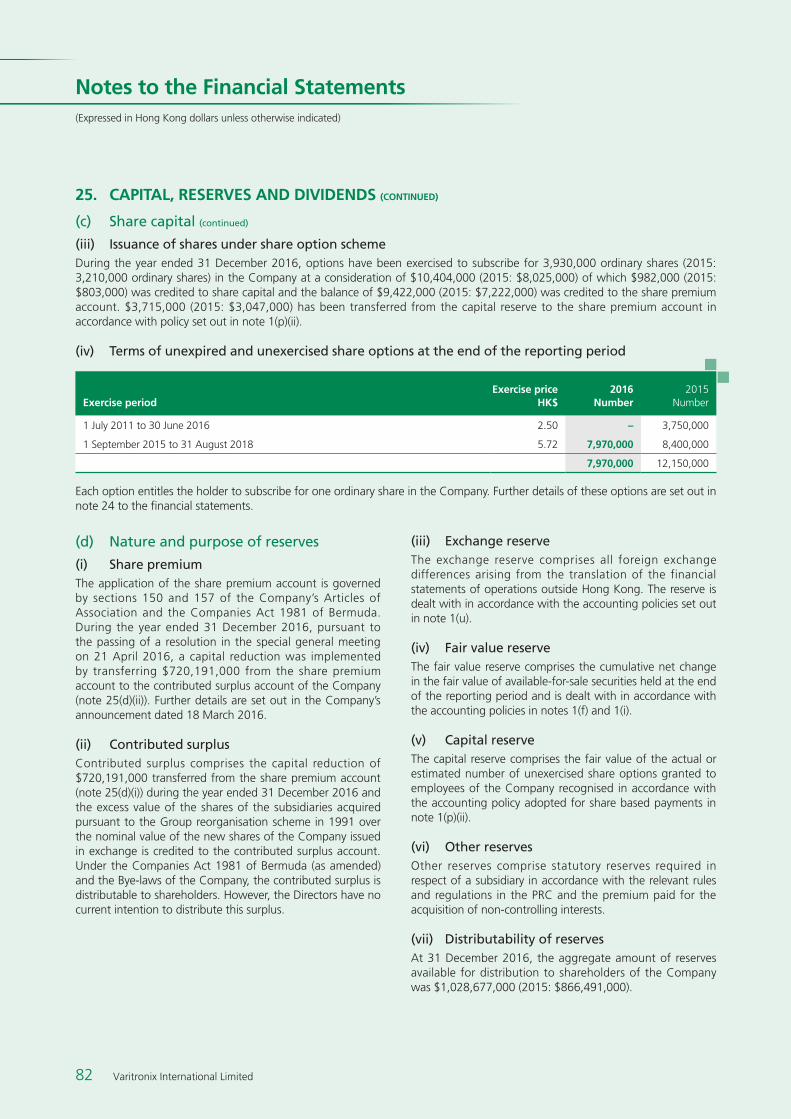
82 Varitronix International Limited
(Expressed in Hong Kong dollars unless otherwise indicated)
notes to the Financial statements
25. CAPiTAl, ReseRves AnD DiviDenDs (ConTinUeD)
(c) Share capital (continued)
(iii) Issuance of shares under share option schemeDuring the year ended 31 December 2016, options have been exercised to subscribe for 3,930,000 ordinary shares (2015: 3,210,000 ordinary shares) in the Company at a consideration of $10,404,000 (2015: $8,025,000) of which $982,000 (2015: $803,000) was credited to share capital and the balance of $9,422,000 (2015: $7,222,000) was credited to the share premium account. $3,715,000 (2015: $3,047,000) has been transferred from the capital reserve to the share premium account in accordance with policy set out in note 1(p)(ii).
(iv) Terms of unexpired and unexercised share options at the end of the reporting period
exercise periodexercise price
HK$2016
number2015
Number
1 July 2011 to 30 June 2016 2.50 – 3,750,000
1 September 2015 to 31 August 2018 5.72 7,970,000 8,400,000
7,970,000 12,150,000
Each option entitles the holder to subscribe for one ordinary share in the Company. Further details of these options are set out in note 24 to the financial statements.
(d) Nature and purpose of reserves
(i) Share premiumThe application of the share premium account is governed by sections 150 and 157 of the Company’s Articles of Association and the Companies Act 1981 of Bermuda. During the year ended 31 December 2016, pursuant to the passing of a resolution in the special general meeting on 21 April 2016, a capital reduction was implemented by transferring $720,191,000 from the share premium account to the contributed surplus account of the Company (note 25(d)(ii)). Further details are set out in the Company’s announcement dated 18 March 2016.
(ii) Contributed surplusContributed surplus comprises the capital reduction of $720,191,000 transferred from the share premium account (note 25(d)(i)) during the year ended 31 December 2016 and the excess value of the shares of the subsidiaries acquired pursuant to the Group reorganisation scheme in 1991 over the nominal value of the new shares of the Company issued in exchange is credited to the contributed surplus account. Under the Companies Act 1981 of Bermuda (as amended) and the Bye-laws of the Company, the contributed surplus is distributable to shareholders. However, the Directors have no current intention to distribute this surplus.
(iii) Exchange reserveThe exchange reserve comprises all foreign exchange differences arising from the translation of the financial statements of operations outside Hong Kong. The reserve is dealt with in accordance with the accounting policies set out in note 1(u).
(iv) Fair value reserveThe fair value reserve comprises the cumulative net change in the fair value of available-for-sale securities held at the end of the reporting period and is dealt with in accordance with the accounting policies in notes 1(f) and 1(i).
(v) Capital reserveThe capital reserve comprises the fair value of the actual or estimated number of unexercised share options granted to employees of the Company recognised in accordance with the accounting policy adopted for share based payments in note 1(p)(ii).
(vi) Other reservesOther reserves comprise statutory reserves required in respect of a subsidiary in accordance with the relevant rules and regulations in the PRC and the premium paid for the acquisition of non-controlling interests.
(vii) Distributability of reservesAt 31 December 2016, the aggregate amount of reserves available for distribution to shareholders of the Company was $1,028,677,000 (2015: $866,491,000).

83Annual Report 2016
The adjusted net debt-to-capital ratio at 31 December 2016 and 2015 was as follows:
Note2016$’000
2015$’000
Current liabilities
Trade and other payables 21 424,060 376,288
Bank loans 22 8,890 136,395
432,950 512,683
non-current liabilities
Bank loans 22 – 8,879
Total debt 432,950 521,562
Add: Proposed dividends 18,376 101,030
Less: Trading securities 17 – (160,891)
Fixed deposits with banks and other financial institutions with more than three months to maturity when placed 20 (626,231) –
Cash and cash equivalents 20 (1,098,672) (767,393)
net cash (1,273,577) (305,692)
Total equity 2,731,607 1,905,436
Less: Proposed dividends (18,376) (101,030)
Adjusted capital 2,713,231 1,804,406
Adjusted net debt-to- capital ratio n/A N/A
The Company was not subject to any externally imposed capital requirements in either current or prior year. The Group is subject to certain externally imposed capital requirements to maintain the value of net assets at a level specified in its bank loan covenants (note 22).
25. CAPiTAl, ReseRves AnD DiviDenDs (ConTinUeD)
(e) Capital managementThe Group’s primary objectives when managing capital are to safeguard the Group’s ability to continue as a going concern, so that it can continue to provide returns for shareholders and benefits for other stakeholders, by pricing products and services commensurately with the level of risk and by securing access to finance at a reasonable cost.
The Group actively and regularly reviews and manages its capital structure to maintain a balance between the higher shareholder returns that might be possible with higher levels of borrowings and the advantages and security afforded by a sound capital position, and makes adjustments to the capital structure in light of changes in economic conditions.
The Group monitors its capital structure on the basis of a net debt-to-adjusted capital ratio. For this purpose the Group defines net debt as total debt (which includes interest-bearing loans and borrowings and trade and other payables) plus unaccrued proposed dividends, less trading securities, fixed deposits with banks and cash and cash equivalents. Adjusted capital comprises all components of equity less unaccrued proposed dividends.
During 2016, the Group’s strategy, which was unchanged from 2015, was to maintain a stable net debt-to-adjusted capital ratio. In order to maintain or adjust the ratio, the Group may adjust the amount of dividends paid to shareholders, issue new shares, return capital to shareholders, raise new debt financing or sell assets to reduce debt.

84 Varitronix International Limited
(Expressed in Hong Kong dollars unless otherwise indicated)
notes to the Financial statements
The Group’s exposure to credit risk is influenced mainly by the individual characteristics of each debtor rather than the industry or country in which the customers operate and therefore significant concentrations of credit risk primarily arise when the Group has significant exposure to individual customers. At the end of the reporting period, 4% (2015: 5%) and 11% (2015: 13%) of the total trade and other receivables were due from the Group’s largest customer and the five largest customers respectively.
The maximum exposure to credit risk without taking account of any collateral held is represented by the carrying amount of each financial asset, in the statement of financial position after deducting any impairment allowance. Except for the financial guarantees given by the Group as set out in note 28, the Group does not provide any other guarantees which would expose the Group or the Company to credit risk. The maximum exposure to credit risk in respect of these financial guarantees at the end of reporting period is disclosed in note 28.
Further quantitative disclosures in respect of the Group’s exposure to credit risk arising from trade and other receivables are set out in note 19.
(b) Liquidity riskIndividual operating entities within the Group are responsible for their own cash management, including the short term investment of cash surpluses and the raising of loans to cover expected cash demands, subject to approval by the parent company’s board when the borrowings exceed certain predetermined levels of authority. The Group’s policy is to regularly monitor its liquidity requirements and its compliance with lending covenants, to ensure that it maintains sufficient reserves of cash and cash equivalents and adequate committed lines of funding from major financial institutions to meet its liquidity requirements in the short and longer term.
26. FinAnCiAl RisK MAnAgeMenT AnD FAiR vAlUes
Exposure to credit, liquidity, interest rate and currency risks arises in the normal course of the Group’s business. The Group is also exposed to equity price risk arising from its equity investments in other entities.
The Group’s exposure to these risks and the financial risk management policies and practices used by the Group to manage these risks are described below.
(a) Credit riskThe Group’s credit risk is primarily attributable to cash at bank, deposits with banks and other financial institutions, trade and other receivables, loans receivable and investments in debt and equity securities. Management has a credit policy in place and exposures to these credit risks are monitored on an ongoing basis.
Investments are normally only in liquid securities quoted on a recognised stock exchange, except where entered into for long term strategic purposes. Given their high credit standing, management does not expect any investment counterparty to fail to meet its obligations. Cash at bank and deposits with banks and other financial institutions are placed with licensed financial institutions with high credit ratings. The Group monitors the exposure to each financial institution.
In respect of trade and other receivables, credit evaluations are performed on all customers requiring credit over a certain amount. The status of the receivable is closely monitored to minimise any credit risk associated with these receivables. Trade receivables are generally due within 60 to 90 days from the date of billing. Normally, the Group does not obtain collateral from customers.
In respect of loans receivable, the Group reviews the borrowers’ financial information periodically. Management considers the credit quality of such loans to be good since the borrowers have a good repayment history.

85Annual Report 2016
26. FinAnCiAl RisK MAnAgeMenT AnD FAiR vAlUes (ConTinUeD)
(b) Liquidity risk (continued)
The following tables show the remaining contractual maturities at the end of reporting period of the Group’s and the Company’s financial liabilities, which are based on contractual undiscounted cash flows (including interest payments computed using contractual rates or, if floating, based on rates currently applicable at the end of reporting period) and the earliest date that the Group and the Company can be required to pay:
2016 Contractual undiscounted cash outflow
2015 Contractual undiscounted cash outflow
within 1 year or on
demand$’000
More than 1 year but
less than 2 years
$’000Total$’000
Carrying amount at
31 December$’000
Within 1 year or on
demand$’000
More than 1 year but
less than 2 years$’000
Total$’000
Carrying amount at
31 December$’000
Non-derivative liabilities:
– Bank loans 8,938 – 8,938 8,890 137,182 8,926 146,108 145,274
– Trade and other payables 424,060 – 424,060 424,060 376,288 – 376,288 376,288
432,998 – 432,998 432,950 513,470 8,926 522,396 521,562
(c) Interest rate riskThe Group’s interest rate risk arises primarily from bank borrowings issued at variable rates which expose the Group to cash flow interest rate risk. Loans receivable of $15,500,000 (2015: $31,000,000) are interest free and are carried at amortised cost. Held-to-maturity debt securities of $44,127,000 (2015: $29,328,000) and certificate of deposits of $10,084,000 (2015: $nil) bear interest at fixed rates and are carried at amortised cost. Accordingly, they do not expose the Group to cash flow interest rate risk on their interest income or fair value interest rate risk on their carrying amounts. In respect of available-for-sale debt securities of $10,782,000 (2015: $9,948,000) carried at fair value, they bear fixed interest rates and do not expose the Group to cash flow interest rate risk but expose the Group to fair value interest rate risk. The Group regularly reviews its strategy on interest rate risk management in light of prevailing market conditions.

86 Varitronix International Limited
(Expressed in Hong Kong dollars unless otherwise indicated)
notes to the Financial statements
26. FinAnCiAl RisK MAnAgeMenT AnD FAiR vAlUes (ConTinUeD)
(c) Interest rate risk (continued)
(i) Interest rate profileThe following table details the interest rate profile of the Group’s borrowings at the end of the reporting period:
2016 2015effective
interest rate % $’000
Effective interest rate
% $’000
Fixed rate borrowings:
Bank loans 2.33 8,890 2.33 44,394
variable rate borrowings:
Bank loans – – 1.12 100,880
Total net borrowings 8,890 145,274
Net fixed rate borrowings as a percentage of total net borrowings 100% 30.6%
(ii) Sensitivity analysisAt 31 December 2016, it is estimated that a general increase/decrease of 100 basis points in interest rates, with all other variables held constant, would have no impact on the Group’s profit after taxation and its retained profits (2015: decreased/increased by approximately $842,000). Other components of equity would not be materially affected by the changes in interest rates.
The sensitivity analysis above has been determined assuming that the change in interest rates had occurred at the end of the reporting period and had been applied to the exposure to interest rate risk for financial instruments held by the Group. The impact on the Group’s profit after taxation (and retained profits) and other components of consolidated equity is estimated as an annualised impact on interest expense of such a change in interest rates. The analysis has been performed on the same basis for 2015.
(d) Currency riskThe Group is exposed to currency risk primarily through sales and purchases which give rise to receivables, payables and cash balances that are denominated in a foreign currency, i.e. a currency other than the functional currency of the operations to which the transactions relate. The Group is also exposed to currency risk through bank loans drawn and other financial assets acquired which are denominated in a foreign currency. The currencies giving rise to these risks are primarily United States dollars, Euros, Japanese Yen and Renminbi.
There is currently no hedging policy adopted by the Group with respect to its foreign exchange exposure. Most of the sales and purchases are made in the respective functional currency of each group entity, except for group entities whose functional currency is Hong Kong dollars, certain transactions are denominated in United States dollars and Japanese Yen. Given the Hong Kong dollar is pegged to the United States dollar, the Group does not expect that there will be any significant currency risk associated with such United States dollars denominated transactions. In respect of balances denominated in other currencies, the Group ensures that the net exposure is kept to an acceptable level by buying or selling foreign currencies at spot rates where necessary to address short-term imbalances.

87Annual Report 2016
26. FinAnCiAl RisK MAnAgeMenT AnD FAiR vAlUes (ConTinUeD)
(d) Currency risk (continued)
(i) Exposure to currency riskThe following table details the Group’s exposure at the end of the reporting period to currency risk arising from recognised assets or liabilities denominated in a currency other than the functional currency of the entity to which they relate. For presentation purposes, the amounts of the exposure are shown in Hong Kong dollars, translated using the spot rate at the year end date. Differences resulting from the translation of the financial statements of operations outside Hong Kong into the Group’s presentation currency are excluded.
2016 exposure to foreign currencies
(expressed in Hong Kong dollars)
2015 Exposure to foreign currencies
(expressed in Hong Kong dollars) United states
Dollars$’000
euros$’000
Japanese Yen
$’000Renminbi
$’000
United States
Dollars$’000
Euros$’000
Japanese Yen
$’000Renminbi
$’000
Trade and other receivables 334,332 88 – 651 351,477 – – 502
Other financial assets 15,437 – – 38,003 – – – –
Loans receivable 31,000 – – – 31,000 – – –
Cash and cash equivalents 538,234 1,747 12,532 347 405,411 8,945 14 136,967
Fixed deposits with more than three months to maturity when placed 616,809 – – – – – – –
Trade and other payables (93,916) (1,220) (33,320) – (113,702) (235) (53,980) –
Bank loans (8,890) – – – (80,310) – (64,964) –
1,433,006 615 (20,788) 39,001 593,876 8,710 (118,930) 137,469
In addition, the Group exposed to currency risk arising from inter-company receivables and payables denominated in currency other than the functional currency of either the lender or the borrower. The net inter-company receivables amounted to United States dollars 6,699,000 and Renminbi 253,619,000 (2015: United States dollars 9,305,000 and Renminbi 79,552,000).

88 Varitronix International Limited
(Expressed in Hong Kong dollars unless otherwise indicated)
notes to the Financial statements
26. FinAnCiAl RisK MAnAgeMenT AnD FAiR vAlUes (ConTinUeD)
(d) Currency risk (continued)
(ii) Sensitivity analysisThe following table indicates the instantaneous change in the Group’s profit after taxation (and retained profits) and other components of consolidated equity that would arise if foreign exchange rates to which the Group has significant exposure at the end of the reporting period had changed at that date, assuming all other risk variables remained constant. In this respect, it is assumed that the pegged rate between the Hong Kong dollar and the United States dollar would be materially unaffected by any changes in movement in value of the United States dollar against other currencies for group entities whose functional currency is Hong Kong dollars.
2016 2015
increase/(decrease) in foreign exchange
rates
increase/(decrease) in
profit after taxation and
retained profits
$’000
increase/(decrease)
in other components
of equity$’000
Increase/(decrease) in foreign exchange
rates
Increase/(decrease) in
profit after taxation and
retained profits$’000
Increase/(decrease)
in other components
of equity$’000
United States dollars 10% 41,147 – 10% 20,354 –
(10)% (41,147) – (10)% (20,354) –
Euros 10% 80 – 10% 875 –
(10)% (80) – (10)% (875) –
Japanese Yen 10% (1,529) – 10% (11,002) –
(10)% 1,529 – (10)% 11,002 –
Renminbi 10% 3,889 – 10% 13,739 –
(10)% (3,889) – (10)% (13,739) –
Results of the analysis as presented in the above table represent an aggregation of the instantaneous effects on each of the Group entities’ profit after taxation and equity measured in the respective functional currencies, translated into Hong Kong dollars at the exchange rate ruling at the end of the reporting period for presentation purposes.
The sensitivity analysis assumes that the change in foreign exchange rates had been applied to remeasure those financial instruments held by the Group which expose the Group to currency risk at the end of the reporting period. The analysis excludes differences that would result from the translation of the financial statements of operations outside Hong Kong into the Group’s presentation currency. The analysis has been performed on the same basis for 2015.

89Annual Report 2016
The sensitivity analysis indicates the instantaneous change in the Group’s profit after taxation (and retained profits) and other components of consolidated equity that would arise assuming that the changes in the stock market index or other relevant risk variables had occurred at the end of the reporting period and had been applied to re-measure those financial instruments held by the Group which expose the Group to equity price risk at the end of the reporting period. It is also assumed that the fair values of the Group’s equity investments would change in accordance with the historical correlation with the relevant stock market index or the relevant risk variables, that none of the Group’s available-for-sale investments would be considered impaired as a result of the decrease in the relevant stock market index or other relevant risk variables, and that all other variables remain constant.
The analysis has been performed on the same basis for 2015.
(f) Fair values
Financial instruments carried at fair valueThe following table represents the carrying value of the financial instruments measured at fair value at the end of the reporting period across the three levels of the fair value hierarchy defined in HKFRS 7, Financial instruments: Disclosures, with the fair value of each financial instruments categorised in its entirety based on the lowest level of input that is significant to that fair value measurement. The levels are defined as follows:
– Level 1 (highest level): fair values measured using quoted prices (unadjusted) in active markets for identical financial instruments
– Level 2: fair values measured using quoted prices in active markets for similar financial instruments, or using valuation techniques in which all significant inputs are directly or indirectly based on observable market data
– Level 3 (lowest level): fair values measured using valuation techniques in which any significant input is not based on observable market data
26. FinAnCiAl RisK MAnAgeMenT AnD FAiR vAlUes (ConTinUeD)
(e) Equity price riskThe Group is exposed to equity price changes arising from equity investments classified as trading securities (see note 17) and available-for-sale securities (see note 16). Other than unquoted securities held for strategic purposes, all of these investments are listed or with quoted market price provided by financial institutions.
Decisions to buy or sell trading securities are based on daily monitoring of the performance of individual securities compared to that of the relevant stock indexes and other industry indicators, as well as the Group’s liquidity needs. Listed investments held in the available-for-sale portfolio have been chosen based on their longer term growth potential and are monitored regularly for performance against expectations.
The Group’s unquoted investments were held for long term strategic purposes. Their performance was assessed at least bi-annually against performance of similar listed entities, based on the limited information available to the Group, together with an assessment of their relevance to the Group’s long term strategic plans.
With regards to securities held as trading securities and available-for-sale securities, as at 31 December 2016 it is estimated that an increase/decrease of 3% in the relevant stock market index (for listed investments) with all other variables held constant would have increased/decreased the Group’s profit after taxation and retained profits by approximately $nil (2015: $2,449,000). Other components of equity would not be materially affected.

90 Varitronix International Limited
(Expressed in Hong Kong dollars unless otherwise indicated)
notes to the Financial statements
26. FinAnCiAl RisK MAnAgeMenT AnD FAiR vAlUes (ConTinUeD)
(f) Fair values (continued)
Financial instruments carried at fair value (continued)
2016
level 1$’000
Total$’000
Assets
Listed available-for-sale debt securities 10,782 10,782
Listed available-for-sale equity securities 1 1
10,783 10,783
2015
Level 1$’000
Level 2$’000
Total$’000
Assets
Non-listed available-for-sale mutual funds – 7,195 7,195
Listed available-for-sale debt securities 9,948 – 9,948
Listed available-for-sale equity securities 10,882 – 10,882
Listed held-to-maturity debt securities 29,328 – 29,328
Trading securities 160,891 – 160,891
211,049 7,195 218,244
During the year there were no significant transfers between instruments in Level 1 and Level 2.
Fair values of financial instruments carried at other than fair valueThe carrying amounts of the Group’s and the Company’s financial instruments carried at cost or amortised cost are not materially different from their fair values as at 31 December 2016 and 2015.
(g) Estimation of fair valuesThe following summarises the major methods and assumptions used in estimating the fair values of financial instruments.
(i) SecuritiesFair value is based on quoted market prices at the end of the reporting period without any deduction for transaction costs.
(ii) Interest-bearing loans and borrowingsThe fair value is estimated as the present value of future cash flows, discounted at current market interest rates for similar financial instruments.
(iii) Financial guaranteesThe fair value of financial guarantees issued is determined by reference to fees charged in an arm’s length transaction for similar services, when such information is obtainable, or is otherwise estimated by reference to interest rate differentials, by comparing the actual rates charged by lenders when the guarantee is made available with the estimated rates that lenders would have charged, had the guarantees not been available, where reliable estimates of such information can be made.

91Annual Report 2016
29. MATeRiAl RelATeD PARTY TRAnsACTions
(a) Key management personnel remuneration
Remuneration for key management personnel, including amounts paid to the Directors is disclosed in note 7 and certain of the highest paid employees is disclosed in note 8.
(b) Recurring transactionsThe following transactions were carried out with related parties, including BOE and its subsidiaries other than the Group (“BOE Group”), except for disclosed elsewhere in the annual financial report.
2016 2015$’000 $’000
BOE Group:
Purchase of goods (Note 1) 106,347 –
Data Modul AG:
Sale of goods (Note 2) – 13,150
Notes:
(1) The transactions with BOE Group were conducted based on the terms as governed by the master purchase agreements entered into between the Group and BOE on 22 April 2016 and 27 October 2016. Further details are set out in the Company’s announcements dated 22 April 2016 and 27 October 2016. The related party transactions constitute connected transaction or continuing connected transaction as defined in Chapter 14A of the Listing Rules.
(2) Data Modul AG was an associate of the Group until the completion of disposal on 14 April 2015.
(c) Balance with related partiesAt 31 December 2016, included in trade and other payables were amounts due to BOE Group for the purchase cost payable of $15,590,000 (2015: $nil).
30. non-ADJUsTing evenT AFTeR THe RePoRTing PeRioD
On 13 January 2017, Link Score Investment Limited (“Link Score”), a wholly owned subsidiary of the Company, and Chengdu BOE Optoelectronics Technology Co., Ltd. (“Chengdu BOE”), a wholly-owned subsidiary of BOE, entered into a tenancy agreement (“Tenancy Agreement”) for a term commencing from 15 January 2017 to 31 December 2019. In connection with the Tenancy Agreement, the two contractual parties also formed the management agreement, the utilities agreement and the computer integrated manufacturing system management agreement (“Related Agreements”) for the term during the subsistence of the Tenancy Agreement. Each of the transactions as contemplated under the Tenancy Agreement and the Related Agreements constitutes continuing connected transactions under Chapter 14A of the Listing Rules. Further details are set out in the Company’s announcement dated 13 January 2017.
27. CoMMiTMenTs
(a) Capital commitments outstanding at the end of the reporting period not provided for in the financial statements were as follows:
2016 2015$’000 $’000
Contracted for 33,003 10,974
Authorised but not contracted for 51,317 24,351
84,320 35,325
(b) At 31 December 2016, the total future minimum lease payments under non-cancellable operating leases are payable as follows:
2016 2015$’000 $’000
Within 1 year 6,356 6,886
After 1 year but within 5 years 4,405 10,407
10,761 17,293
All operating leases are for properties. The leases typically run for an initial period of 1 to 3 years, with an option to renew the leases when all terms are renegotiated. Lease payments are usually increased every year to reflect market rentals. None of the leases includes contingent rentals.
28. ConTingenT liABiliTies
Financial guarantees issuedAs at the end of the reporting period, the Company has issued guarantees to banks in respect of banking facilities granted to certain subsidiaries.
As at the end of the reporting period, the Directors do not consider it probable that a claim will be made against the Company under any of the guarantees. The maximum liability of the Company at the end of the reporting period under the guarantees issued and the facilities drawn down by the subsidiaries is $8,890,000 (2015: $145,274,000).
The Company has not recognised any deferred income in respect of the guarantees as their fair value cannot be reliably measured using observable market data.

92 Varitronix International Limited
(Expressed in Hong Kong dollars unless otherwise indicated)
notes to the Financial statements
31. CoMPAnY-level sTATeMenT oF FinAnCiAl PosiTion
(Expressed in Hong Kong dollars)
2016 2015Note $’000 $’000
non-current assets
Investments in subsidiaries 13 2,185,192 1,626,285
Loans receivable 15,500 31,000
2,200,692 1,657,285
Current assets
Other receivables 16,082 15,836
Fixed deposits with more than three months to maturity when placed 272,265 –
Cash and cash equivalents 53,303 20,246
341,650 36,082
Current liabilities
Other payables 5,156 4,676
Current tax payable 3 5
5,159 4,681
net current assets 336,491 31,401
neT AsseTs 2,537,183 1,688,686
CAPiTAl AnD ReseRves
Share capital 25(c) 183,764 82,782
Reserves 25(a) 2,353,419 1,605,904
ToTAl eqUiTY 2,537,183 1,688,686
Approved and authorised for issue by the board of directors on 27 March 2017.
Yao Xiangjun Ko wing Yan, samantha
Director Director
30. non-ADJUsTing evenT AFTeR THe RePoRTing PeRioD (ConTinUeD)
On 20 February 2017, Varitronix (Chengdu) Display Technology Co. Ltd. (“Varitronix (Chengdu)”), a wholly-owned subsidiary of the Company, and Chengdu BOE, entered into an acquisition agreement (“Acquisition Agreement”), pursuant to which Varitronix (Chengdu) has agreed to acquire and Chengdu BOE has agreed to sell certain production equipment, office equipment, information technology equipment and other auxiliary tools and equipment at the consideration of RMB60,143,596 (equiva lent to approx imate ly $67,962,000) . The consideration was settled on 20 March 2017. The transaction contemplated under the Acquisition Agreement constitutes connected transaction as defined in Chapter 14A of the Listing Rules. Further details are set out in the Company’s announcement dated 20 February 2017.
On 23 March 2017, Link Score and Chengdu High-Tech Industrial Development Zone Management Committee entered into an investment cooperation agreement in relation to the investment of automobile thin film transistor display module production lines and related business operations (the”Project”). The total investment amount of the Project is RMB1,000,000,000 and the Project will be constructed in two phases, coming into operation at the fourth quarter of 2017 and the third quarter of 2020 respectively. Further details are set out in the Company’s announcement dated 23 March 2017.

93Annual Report 2016
HKFRS 15, Revenue from contracts with customersHKFRS 15 establishes a comprehensive framework for recognising revenue from contracts with customers. HKFRS 15 will replace the existing revenue standards, HKAS 18, Revenue, which covers revenue arising from sale of goods and rendering of services, and HKAS 11, Construction contracts, which specifies the accounting for revenue from construction contracts. The Group is currently assessing the impacts of adopting HKFRS 15 on its financial statements. Based on the preliminary assessment, the Group has identified the following areas which may be affected:
(a) Timing of revenue recognitionThe Group’s revenue recognition policies are disclosed in note 1(s). Currently, revenue from sales of goods is generally recognised when the risks and rewards of ownership have passed to the customers.
Under HKFRS 15, revenue is recognised when the customer obtains control of the promised good or service in the contract. At contract inception, an entity evaluates whether it transfers the control to the customer over time and therefore revenue should be recognised over time – if not, then it transfers control at a point in time and revenue will be recognised at that single point in time.
Based on a preliminary assessment, the Group expects that revenue from sales of goods will continue to be recognised at a point in time. However, as a result of the change from the risk-and-reward approach to the transfer-of-control approach, the point in time at which revenue will be recognised may change upon the adoption of HKFRS 15. Further analysis is required to determine whether this change in accounting policy may have a material impact on the amounts reported in any given financial reporting period.
(b) Sales with a right of returnCurrently when the customers are allowed to return the products, the Group estimates the level of returns and makes an adjustment against revenue and cost of sales.
The Group expects that the adoption of HKFRS 15 will not materially affect how the company recognises revenue and cost of sales when the customers have a right of return. However, the new requirement to recognise separately a return asset for the products expected to be returned will impact the presentation in the statement of financial position as the Group currently adjusts the carrying amounts of inventory for the expected returns, instead of recognising a separate asset.
32. iMMeDiATe PARenT AnD UlTiMATe ConTRolling PARTY
At 31 December 2016, the directors consider the immediate parent and the ultimate controlling party of the Group to be BOE Technology (HK) Limited, which is incorporated in Hong Kong, and BOE Technology Group Co., Ltd, which is incorporated in PRC, respectively. BOE Technology Group Co., Ltd produces financial statements available for public use.
33. PossiBle iMPACT oF AMenDMenTs, new sTAnDARDs AnD inTeRPReTATions issUeD BUT noT YeT eFFeCTive FoR THe YeAR enDeD 31 DeCeMBeR 2016
Up to the date of issue of these financial statements, the HKICPA has issued a number of amendments and new standards which are not yet effective for the year ended 31 December 2016 and which have not been adopted in these financial statements. These include the following which may be relevant to the Group.
effective foraccounting
periodsbeginning on
or after
Amendments to HKAS 7, Statement of cash flows: Disclosure initiative 1 January 2017
Amendments to HKAS 12, Income taxes: Recognition of deferred tax assets for unrealised losses 1 January 2017
HKFRS 9, Financial instruments 1 January 2018
HKFRS 15, Revenue from contracts with customers 1 January 2018
Amendments to HKFRS 2, Share-based payment: Classification and measurement of share-based payment transactions 1 January 2018
HKFRS 16, Leases 1 January 2019
The Group is in the process of making an assessment of what the impact of these amendments and new standards is expected to be in the period of initial application. So far it has concluded that the above developments are relevant to the Group’s financial statements but the adoption of them is unlikely to have a significant impact on the Group’s results of operations and financial position except for HKFRS 15.
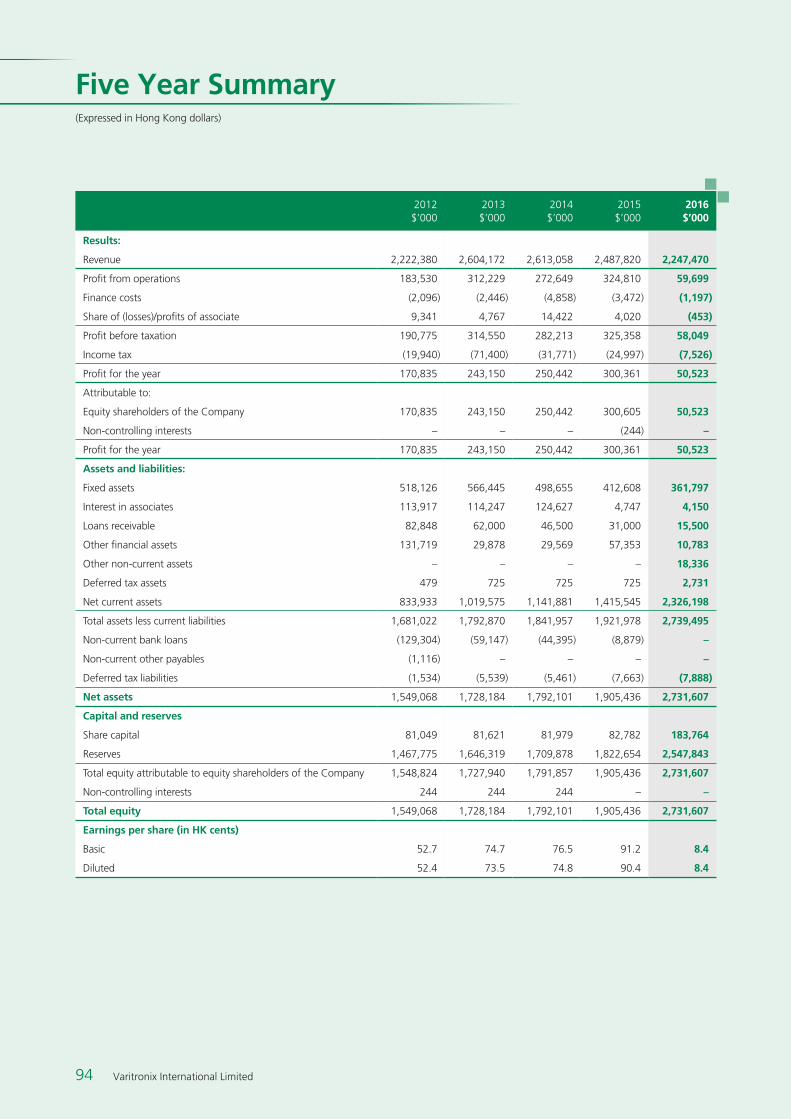
94 Varitronix International Limited
Five Year Summary(Expressed in Hong Kong dollars)
2012$’000
2013$’000
2014$’000
2015$’000
2016$’000
Results:
Revenue 2,222,380 2,604,172 2,613,058 2,487,820 2,247,470
Profit from operations 183,530 312,229 272,649 324,810 59,699
Finance costs (2,096) (2,446) (4,858) (3,472) (1,197)
Share of (losses)/profits of associate 9,341 4,767 14,422 4,020 (453)
Profit before taxation 190,775 314,550 282,213 325,358 58,049
Income tax (19,940) (71,400) (31,771) (24,997) (7,526)
Profit for the year 170,835 243,150 250,442 300,361 50,523
Attributable to:
Equity shareholders of the Company 170,835 243,150 250,442 300,605 50,523
Non-controlling interests – – – (244) –
Profit for the year 170,835 243,150 250,442 300,361 50,523
Assets and liabilities:
Fixed assets 518,126 566,445 498,655 412,608 361,797
Interest in associates 113,917 114,247 124,627 4,747 4,150
Loans receivable 82,848 62,000 46,500 31,000 15,500
Other financial assets 131,719 29,878 29,569 57,353 10,783
Other non-current assets – – – – 18,336
Deferred tax assets 479 725 725 725 2,731
Net current assets 833,933 1,019,575 1,141,881 1,415,545 2,326,198
Total assets less current liabilities 1,681,022 1,792,870 1,841,957 1,921,978 2,739,495
Non-current bank loans (129,304) (59,147) (44,395) (8,879) –
Non-current other payables (1,116) – – – –
Deferred tax liabilities (1,534) (5,539) (5,461) (7,663) (7,888)
net assets 1,549,068 1,728,184 1,792,101 1,905,436 2,731,607
Capital and reserves
Share capital 81,049 81,621 81,979 82,782 183,764
Reserves 1,467,775 1,646,319 1,709,878 1,822,654 2,547,843
Total equity attributable to equity shareholders of the Company 1,548,824 1,727,940 1,791,857 1,905,436 2,731,607
Non-controlling interests 244 244 244 – –
Total equity 1,549,068 1,728,184 1,792,101 1,905,436 2,731,607
earnings per share (in HK cents)
Basic 52.7 74.7 76.5 91.2 8.4
Diluted 52.4 73.5 74.8 90.4 8.4

95Annual Report 2016
Properties Held by the Group
location existing use Percentage holding
1. Flat G, 22nd Floor, Tower 1,Yue Man Centre,Nos. 300 and 302 Ngau Tau Kok Road,Kwun Tong,Kowloon
Staff quarters 100%
2. 128 Heyuan Road, Yuancheng DistrictHeyuan City, Guangdong,The People’s Republic of China
Industrial 100%
3. Unit 3 Milbanke Court,Milbanke Way, Bracknell,Berkshire,United Kingdom
Office 100%
Note: The above properties are either freehold, held on long or medium-term leases or have no specified lease term.

96 Varitronix International Limited
Corporate Information
BoARD oF DiReCToRs
Executive Directors:Mr. Ko Chun Shun, Johnson (Chairman) (resigned on 28 April 2016)Mr. Yao Xiangjun (Chairman) (appointed on 28 April 2016)Ms. Ko Wing Yan, SamanthaMr. Ho Te Hwai, Cecil (resigned on 28 April 2016)Mr. Su Ning (appointed on 28 April 2016)
Non-executive Directors:Ms. Yang Xiaoping (appointed on 28 April 2016)Mr. Dong Xue (appointed on 28 April 2016)Mr. Yuan Feng (appointed on 28 April 2016)
Independent Non-executive Directors:Dr. Lo Wing Yan, William (retired on 3 June 2016)Mr. Chau Shing Yim, David (retired on 3 June 2016)Mr. Fung, Yuk Kan Peter (appointed on 3 June 2016)Mr. Chu, Howard Ho Hwa (appointed on 3 June 2016)Mr. Hou Ziqiang
CoMPAnY seCReTARYMr. Ho Te Hwai, Cecil (resigned on 28 April 2016)Mr. Pang Tien Kin (appointed on 28 April 2016 and resigned on 17 March 2017)Mr. Lam Cheuk Yin, Kenneth (appointed on 17 March 2017)
AUDiT CoMMiTTeeMr. Fung, Yuk Kan Peter (Chairman)Mr. Chu, Howard Ho HwaMr. Hou Ziqiang
ReMUneRATion CoMMiTTeeMr. Fung, Yuk Kan Peter (Chairman)Mr. Yao XiangjunMs. Ko Wing Yan, SamanthaMr. Chu, Howard Ho HwaMr. Hou Ziqiang
noMinATion CoMMiTTeeMr. Yao Xiangjun (Chairman)Mr. Su NingMr. Fung, Yuk Kan PeterMr. Chu, Howard Ho HwaMr. Hou Ziqiang
inDePenDenT AUDiToRsKPMGCertified Public Accountants
PRinCiPAl BAnKeRsThe Bank of Tokyo-Mitsubishi UFJ LtdHang Seng Bank LimitedThe Hongkong and Shanghai Banking Corporation Limited
RegisTeReD oFFiCeClarendon House2 Church StreetHamilton HM11Bermuda
HeAD oFFiCe AnD PRinCiPAl PlACe oF BUsinessUnits A-F, 35/F., Legend TowerNo.7 Shing Yip StreetKwun Tong, KowloonHong Kong
PRinCiPAl sHARe RegisTRARs AnD TRAnsFeR oFFiCeMUFG Fund Services (Bermuda) LimitedThe Belvedere Building69 Pitts Bay RoadPembroke HM08Bermuda
Hong Kong BRAnCH sHARe RegisTRAR AnD TRAnsFeR oFFiCeComputershare Hong Kong Investor Services LimitedShops 1712-16, 17/F., Hopewell Centre183 Queen’s Road EastHong Kong
ADR DePosiTARYThe Bank of New YorkAmerican Depositary Receipts101 Barclay Street, 22WNew York, NY 10286U.S.A.
sToCK CoDe710
weBsiTehttp://www.varitronix.com

Varitronix International LimitedUnit A-F, 35/F, Legend Tower, 7 Shing Yip Street, Kwun Tong, Kowloon, Hong Kong
www.varitronix.com