UNFCCC/CCNUCC CDM Œ Executive Board PROJECT … · for afforestation and reforestation project...
102
UNFCCC/CCNUCC CDM Executive Board PROJECT DESIGN DOCUMENT FORM FOR AFFORESTATION AND REFORESTATION PROJECT ACTIVITIES (CDM-AR-PDD) - Version 04 1/102 CLEAN DEVELOPMENT MECHANISM PROJECT DESIGN DOCUMENT FORM FOR AFFORESTATION AND REFORESTATION PROJECT ACTIVITIES (CDM-AR-PDD) Version 04 CONTENTS A. General description of the proposed A/R CDM project activity B. Duration of the project activity / crediting period C. Application of an approved baseline and monitoring methodology D. Estimation of ex ante net anthropogenic GHG removals by sinks and estimated amount of net anthropogenic GHG removals by sinks over the chosen crediting period E. Monitoring plan F. Environmental impacts of the proposed A/R CDM project activity G. Socio-economic impacts of the proposed A/R CDM project activity H. Stakeholders comments Annexes Annex 1: Contact information on participants in the proposed A/R CDM project activity Annex 2: Information regarding public funding Annex 3: Baseline information Annex 4: Monitoring plan Annex 5: Legal and Institutional Analysis Annex 6: Participatory Rural Appraisal Annex 7: Social Mitigation Action Plan Annex 8: Project Coordinates Annex 9: Results of Consultations with Communities Annex 10: Fire Management Plan Annex 11: Additional Information on Leakage
Transcript of UNFCCC/CCNUCC CDM Œ Executive Board PROJECT … · for afforestation and reforestation project...
UNFCCC/CCNUCC
CDM � Executive Board PROJECT DESIGN DOCUMENT FORM
FOR AFFORESTATION AND REFORESTATION PROJECT ACTIVITIES (CDM-AR-PDD) - Version 04
1/102
CLEAN DEVELOPMENT MECHANISM PROJECT DESIGN DOCUMENT FORM FOR AFFORESTATION AND REFORESTATION
PROJECT ACTIVITIES (CDM-AR-PDD) Version 04
CONTENTS A. General description of the proposed A/R CDM project activity B. Duration of the project activity / crediting period C. Application of an approved baseline and monitoring methodology D. Estimation of ex ante net anthropogenic GHG removals by sinks and estimated amount of net anthropogenic GHG removals by sinks over the chosen crediting period E. Monitoring plan
F. Environmental impacts of the proposed A/R CDM project activity
G. Socio-economic impacts of the proposed A/R CDM project activity H. Stakeholders� comments
Annexes Annex 1: Contact information on participants in the proposed A/R CDM project activity Annex 2: Information regarding public funding Annex 3: Baseline information
Annex 4: Monitoring plan Annex 5: Legal and Institutional Analysis Annex 6: Participatory Rural Appraisal Annex 7: Social Mitigation Action Plan Annex 8: Project Coordinates Annex 9: Results of Consultations with Communities Annex 10: Fire Management Plan Annex 11: Additional Information on Leakage

UNFCCC/CCNUCC
CDM � Executive Board PROJECT DESIGN DOCUMENT FORM
FOR AFFORESTATION AND REFORESTATION PROJECT ACTIVITIES (CDM-AR-PDD) - Version 04
2/102
Annex 12: Additional Information on Additionality Annex 13: Additional information on Forest and Plantation Growth Annex 14: Environmental Analysis
UNFCCC/CCNUCC
CDM � Executive Board PROJECT DESIGN DOCUMENT FORM
FOR AFFORESTATION AND REFORESTATION PROJECT ACTIVITIES (CDM-AR-PDD) - Version 04
3/102
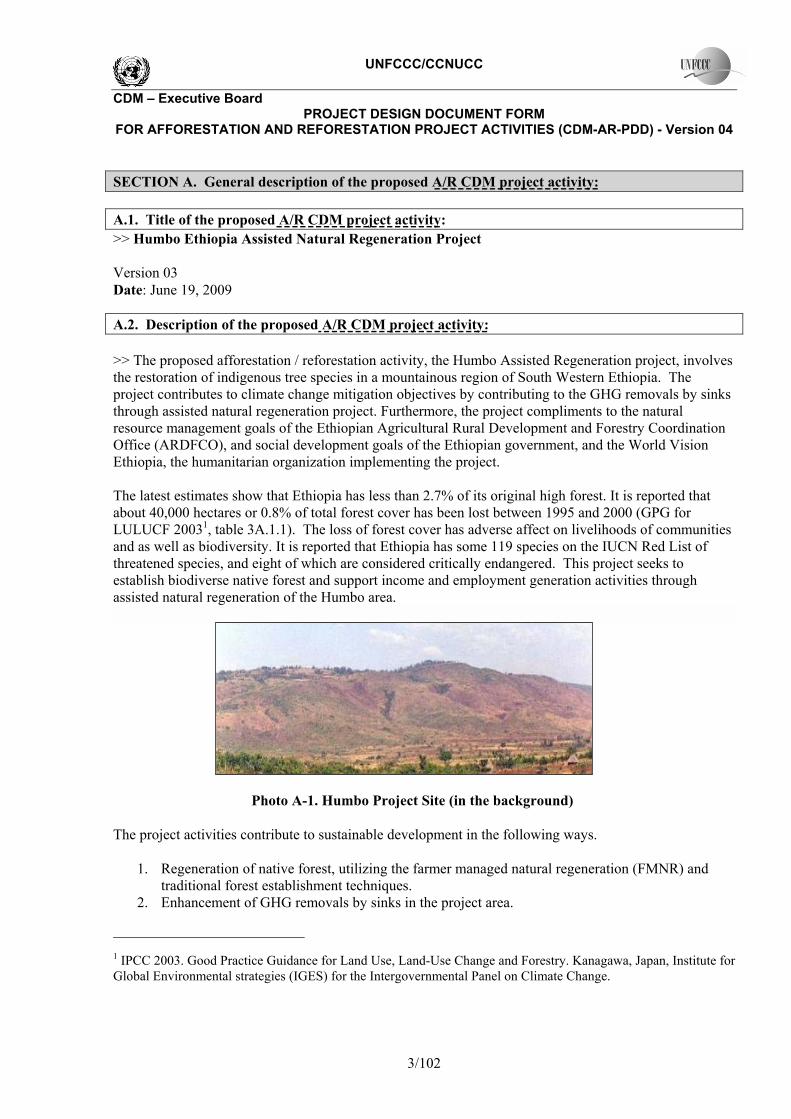
SECTION A. General description of the proposed A/R CDM project activity: A.1. Title of the proposed A/R CDM project activity: >> Humbo Ethiopia Assisted Natural Regeneration Project Version 03 Date: June 19, 2009 A.2. Description of the proposed A/R CDM project activity: >> The proposed afforestation / reforestation activity, the Humbo Assisted Regeneration project, involves the restoration of indigenous tree species in a mountainous region of South Western Ethiopia. The project contributes to climate change mitigation objectives by contributing to the GHG removals by sinks through assisted natural regeneration project. Furthermore, the project compliments to the natural resource management goals of the Ethiopian Agricultural Rural Development and Forestry Coordination Office (ARDFCO), and social development goals of the Ethiopian government, and the World Vision Ethiopia, the humanitarian organization implementing the project. The latest estimates show that Ethiopia has less than 2.7% of its original high forest. It is reported that about 40,000 hectares or 0.8% of total forest cover has been lost between 1995 and 2000 (GPG for LULUCF 20031, table 3A.1.1). The loss of forest cover has adverse affect on livelihoods of communities and as well as biodiversity. It is reported that Ethiopia has some 119 species on the IUCN Red List of threatened species, and eight of which are considered critically endangered. This project seeks to establish biodiverse native forest and support income and employment generation activities through assisted natural regeneration of the Humbo area.
Photo A-1. Humbo Project Site (in the background)
The project activities contribute to sustainable development in the following ways.
1. Regeneration of native forest, utilizing the farmer managed natural regeneration (FMNR) and traditional forest establishment techniques.
2. Enhancement of GHG removals by sinks in the project area.
1 IPCC 2003. Good Practice Guidance for Land Use, Land-Use Change and Forestry. Kanagawa, Japan, Institute for Global Environmental strategies (IGES) for the Intergovernmental Panel on Climate Change.

UNFCCC/CCNUCC
CDM � Executive Board PROJECT DESIGN DOCUMENT FORM
FOR AFFORESTATION AND REFORESTATION PROJECT ACTIVITIES (CDM-AR-PDD) - Version 04
4/102
3. Promotion of native vegetation and biodiversity in the project area, which can be utilized as a refuge for local and migratory species and to improve the connectivity of fragmented forest resources.
4. Reduction in soil erosion and flooding and help maintain supply of the subterranean streams to support the region�s water supply.
5. Provision of income stream for communities through sustainable harvesting of forest resources. To achieve these goals, this project seeks to undertake the following activities:
• Restoration of approximately 2728 hectares of biodiverse natural forest in the Humbo Woreda, using indigenous and naturalized species.
• Community management of public land with multiple objectives of promoting natural resource management, poverty alleviation and biodiversity enhancement
• Development of a model of community land use that would enhance GHG removals by sinks from regenerating native vegetation, which can be replicable in other regions of Ethiopia.
• Formation of seven community cooperative societies and securing legal title to manage the proposed regeneration area, and adopting a constitution and by-laws to manage the project.
• Establishment of institutional structure with right to the Certified Emissions Reductions (CERs) generated from the site.
• Establishment of a system to monitor the carbon stocks and recording and reporting on the changes in carbon stocks.
• Establishment of a system to monitor the environmental and social issues relevant to the project.
The implementation of farmer managed natural regeneration (FMNR) will be done over a period of three to five years. Species endemic to the area are used to restore the forest. These will include Acacia spp., Aningeria adolfifericii, Podocarpus facutus, Olea africana, Cordia africana, Croton macrostachytus, Erthrina spp., Ficus spp, Hagenia abyssinica, among others. The naturalized species such as Grevillea robusta and Eucalyptus globulus are also considered for planting in blocks and on the perimeter of the sites. No genetically modified organisms or invasive alien species are used in this project The project developer, World Vision, has experience in community capacity building, and in protecting and restoring forest ecosystems in Ethiopia and other countries of Sub-Saharan Africa. This project fits within the goals of World Vision, the local government and the local community goals of transforming communities through sustainable development activities and offers the following benefits.
• Development of more robust land use and land access rights • Protection of fragile water catchment areas • Protection against land erosion • Facilitation of income generation and community asset creation and awareness generation.
The Humbo Assisted regeneration project seeks to establish seven community cooperative societies, which have legal ownership to 2,728 hectares of community land. These groups intend to manage the areas for the purposes of carbon removal using the Farmer Managed Natural Regeneration techniques, environmental benefits (biodiversity, water quality, and habitat) and income producing activities for the local population. Bylaws agreed upon at project inception will form the rules for community cooperative societies to manage the project. The cooperative societies will comprise representatives from World Vision, the ARDFCO, local community and gender categories.
UNFCCC/CCNUCC
CDM � Executive Board PROJECT DESIGN DOCUMENT FORM
FOR AFFORESTATION AND REFORESTATION PROJECT ACTIVITIES (CDM-AR-PDD) - Version 04
5/102
A.3. Project participants: >> Please list project participants and Party(ies) involved and provide contact information in Annex 1. Information shall be indicated using the following tabular format.
Name of Party involved (*) ((host) indicates a host Party)
Private and/or public entity(ies) project participants (*)
(as applicable)
Indicate if the Party involved wishes to be
considered as a project participant (Yes/No)
Federal Democratic Republic of Ethiopia (host)
World Vision Ethiopia
No
Government of Canada International Bank for Reconstruction and Development as a trustee of BioCarbon Fund
Yes
(*) In accordance with the CDM A/R modalities and procedures, at the time of making the CDM-AR-PDD public at the stage of validation, a Party involved may or may not have provided its approval. At the time of requesting registration, the approval by the Party(ies) involved is required. Note: When the CDM-AR-PDD is prepared to support a proposed new baseline and monitoring methodology (form CDM-AR-NM), at least the host Party(ies) and any known project participant (e.g. those proposing a new methodology) shall be identified.
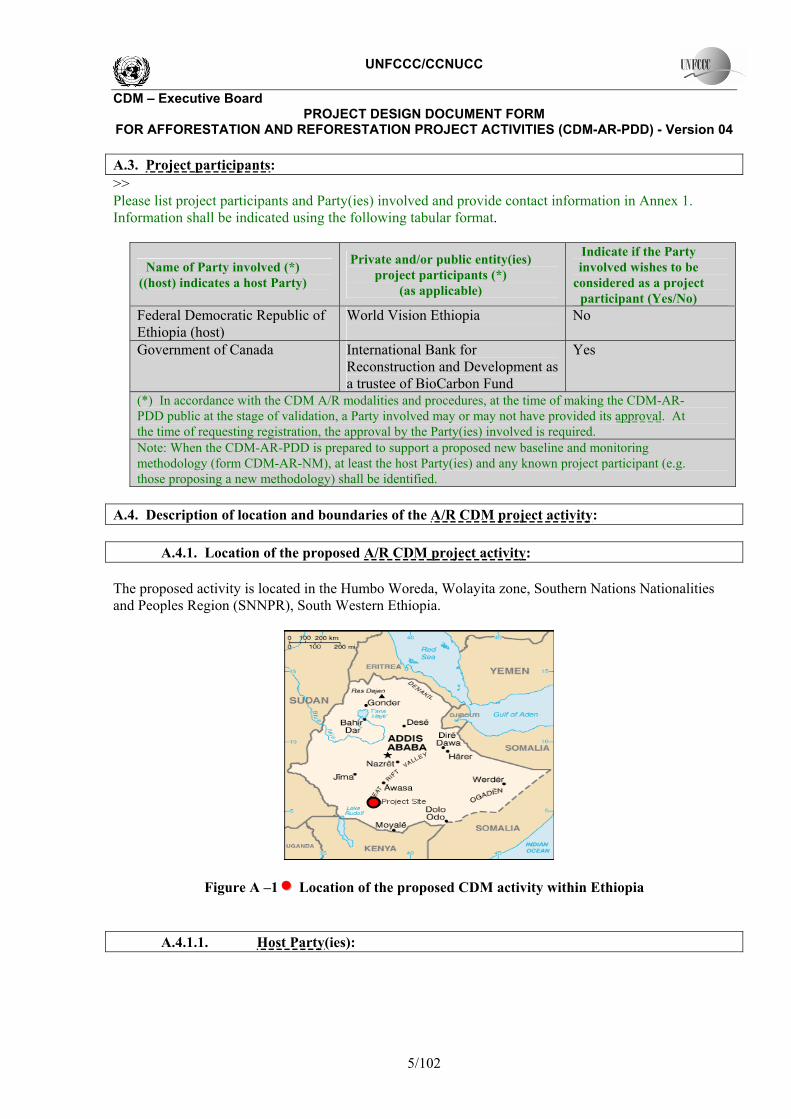
A.4. Description of location and boundaries of the A/R CDM project activity: A.4.1. Location of the proposed A/R CDM project activity: The proposed activity is located in the Humbo Woreda, Wolayita zone, Southern Nations Nationalities and Peoples Region (SNNPR), South Western Ethiopia.
Figure A �1 •• Location of the proposed CDM activity within Ethiopia
A.4.1.1. Host Party(ies):
UNFCCC/CCNUCC
CDM � Executive Board PROJECT DESIGN DOCUMENT FORM
FOR AFFORESTATION AND REFORESTATION PROJECT ACTIVITIES (CDM-AR-PDD) - Version 04
6/102
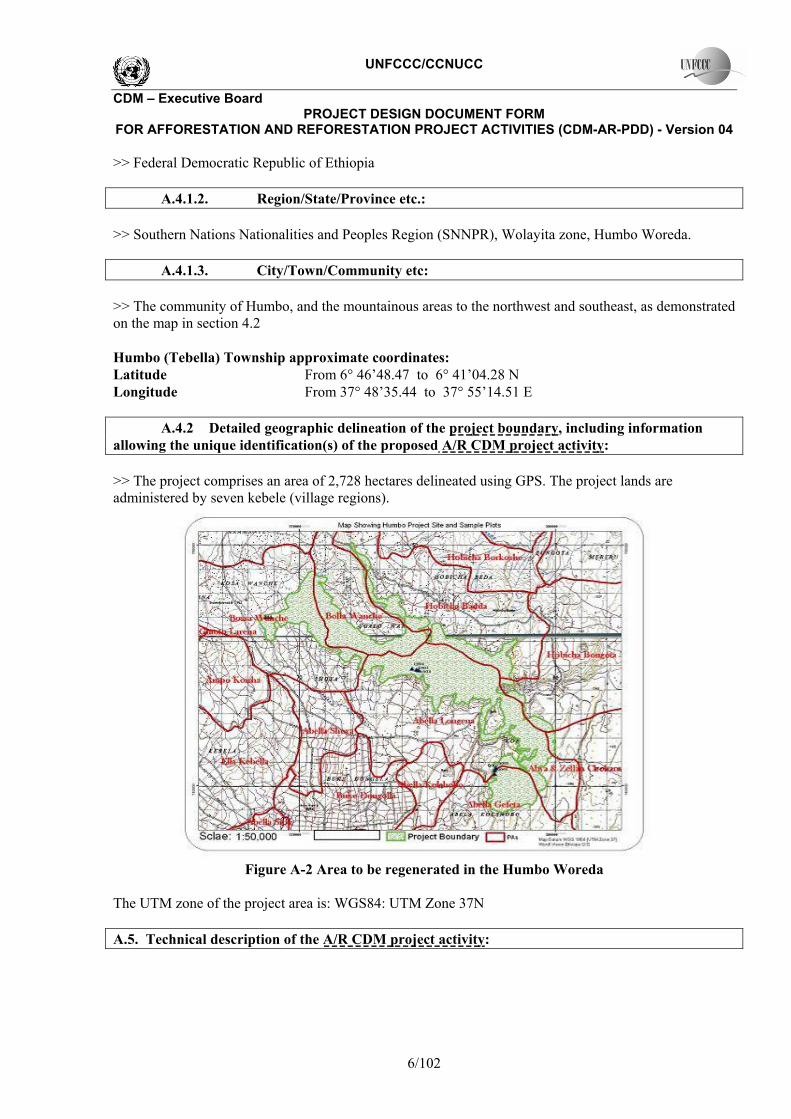
>> Federal Democratic Republic of Ethiopia A.4.1.2. Region/State/Province etc.: >> Southern Nations Nationalities and Peoples Region (SNNPR), Wolayita zone, Humbo Woreda. A.4.1.3. City/Town/Community etc: >> The community of Humbo, and the mountainous areas to the northwest and southeast, as demonstrated on the map in section 4.2 Humbo (Tebella) Township approximate coordinates: Latitude From 6° 46�48.47 to 6° 41�04.28 N Longitude From 37° 48�35.44 to 37° 55�14.51 E A.4.2 Detailed geographic delineation of the project boundary, including information allowing the unique identification(s) of the proposed A/R CDM project activity: >> The project comprises an area of 2,728 hectares delineated using GPS. The project lands are administered by seven kebele (village regions).
Figure A-2 Area to be regenerated in the Humbo Woreda The UTM zone of the project area is: WGS84: UTM Zone 37N A.5. Technical description of the A/R CDM project activity:

UNFCCC/CCNUCC
CDM � Executive Board PROJECT DESIGN DOCUMENT FORM
FOR AFFORESTATION AND REFORESTATION PROJECT ACTIVITIES (CDM-AR-PDD) - Version 04
7/102
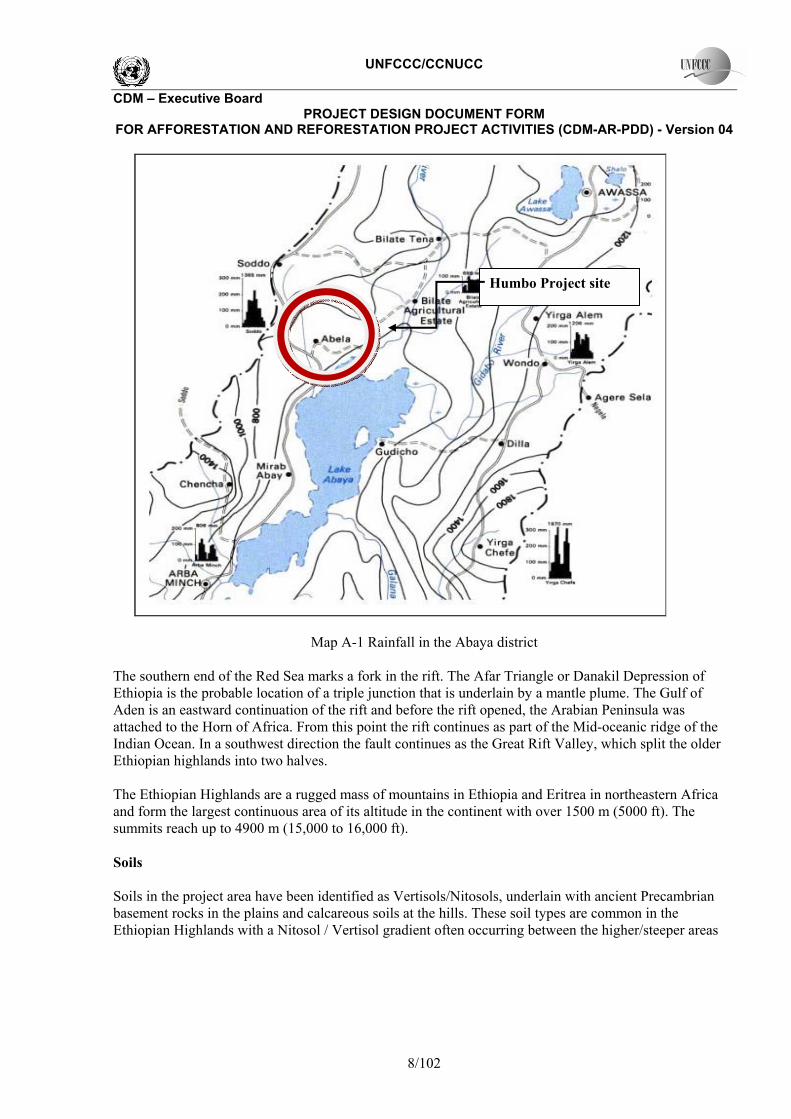
A.5.1. Description of the present environmental conditions of the area planned for the proposed A/R CDM project activity, including a concise description of climate, hydrology, soils, ecosystems (including land use): >> Climate The Inter Tropical Convergence Zone (ITCZ) has influence on the climate in the Humbo region. With the northward movement of the ITCZ between May and October, warm moist air is drawn from the Indian Ocean, which causes rainfall on the southern slopes of the Ethiopian Highlands. During the remainder of the year, the ITCZ lies south of the highlands, and the winds move from the Red Sea to the north and east. These winds typically contain less moisture and cause rainfall on the northern side of the highland massif. From May to October, winds blow from the southwest and bring rainfall. During the rest of the year, onshore winds from the Red Sea bring moisture to the Northern regions of the country while the areas around Humbo remain drier. Overall, the highest annual rainfall (up to 2,500 mm) is on the south-western scarp faces of the highlands, which support montane or transitional forests. Humidity is sometimes high due to cloud precipitation and local interactions between topography and weather. Unlike the moist equatorial mountains, the effects of cold descend further down on these dry highlands. Temperatures vary according to the season and elevation, but mean maxima range from 18 to 24oC and mean minima from 12 to 15oC Surface Hydrology Rainfall in the project region varies from 700-1000 mm (see Map A.1). Due to the steep terrain and denuded soil, erosion can be severe, and heavy rains cause flooding of low-lying areas. In times of extreme rainfall, mudslides damage roads, bridges and other infrastructure and cause localized flooding. The catchment of the Abaya - Chamo Basin covers an area of approximately 18,000 km², so the Humbo and Soddo areas form a small part of this large hydrological system. Lake Chamo and Lake Abaya have a combined surface area of 1,440 km². The headwater areas also extend into the Western and Eastern Ethiopian Highlands and the lakes are located at the bottom of the Rift Valley. Decades of erosion has turned the waters of Lake Abaya to a murky brown colour due to high ferrous hydroxide and sediment load which are threats to the lake ecosystem. Subsurface Hydrology The site is located immediately above the Likemse springs, a hydrological system which deliver potable water to a population of over 65,000 people in and around Humbo. Reduction in vegetation cover, clearing for agriculture and grazing, has resulted in a loss of groundwater. The project could play a significant role in reducing the runoff and helping to conserve the water supplies required for meeting the potable water needs in the region. Geology The project site runs along the edge of the Ethiopian portion of the Great Rift Valley. This geological feature runs north to south for some 5,000 km, from northern Syria in Southwest Asia to central Mozambique in East Africa. The valley formed in the rifts of African and Arabian tectonic plates varies in width from 30-100 km and a few hundred to several thousand meters in depth.
UNFCCC/CCNUCC
CDM � Executive Board PROJECT DESIGN DOCUMENT FORM
FOR AFFORESTATION AND REFORESTATION PROJECT ACTIVITIES (CDM-AR-PDD) - Version 04
8/102
Map A-1 Rainfall in the Abaya district The southern end of the Red Sea marks a fork in the rift. The Afar Triangle or Danakil Depression of Ethiopia is the probable location of a triple junction that is underlain by a mantle plume. The Gulf of Aden is an eastward continuation of the rift and before the rift opened, the Arabian Peninsula was attached to the Horn of Africa. From this point the rift continues as part of the Mid-oceanic ridge of the Indian Ocean. In a southwest direction the fault continues as the Great Rift Valley, which split the older Ethiopian highlands into two halves. The Ethiopian Highlands are a rugged mass of mountains in Ethiopia and Eritrea in northeastern Africa and form the largest continuous area of its altitude in the continent with over 1500 m (5000 ft). The summits reach up to 4900 m (15,000 to 16,000 ft). Soils Soils in the project area have been identified as Vertisols/Nitosols, underlain with ancient Precambrian basement rocks in the plains and calcareous soils at the hills. These soil types are common in the Ethiopian Highlands with a Nitosol / Vertisol gradient often occurring between the higher/steeper areas
Humbo Project site
UNFCCC/CCNUCC
CDM � Executive Board PROJECT DESIGN DOCUMENT FORM
FOR AFFORESTATION AND REFORESTATION PROJECT ACTIVITIES (CDM-AR-PDD) - Version 04
9/102
and the lower flatter areas. Nitosols are highly erodible and often acidic. Over-clearing has led to significant soil erosion problems, with mudslides occurring on the site2. Biodiversity The project offers a significant opportunity to realize biodiversity outcomes alongside those of climate protection through the reestablishment of natural habitat. Indigenous species will be naturally regenerated or planted resulting in biodiversity. Natural regeneration will improve ecological succession, creating the conditions for establishing climax species for ecological community, and for maintenance of forest cover. Fast-growing naturalized species will also be planted on the perimeter and within the project boundary to enhance fuel wood and charcoal supply. The naturalized species have been used by the communities over a long period. The re-establishment of native forests will provide wildlife habitat and improve floral and faunal diversity and will enhance natural regeneration through improved seed dispersal. Vegetation of the project area The vegetation categories of the project area includes Ethiopian montane grassland and woodland and Ethiopian montane forest.3 Ethiopian montane grasslands and woodlands4
Conservation status: critical/endangered The montane vegetation includes Hagenia abyssinica, Podocarpus falcatus and Juniperus procera. A variety of Ethiopian endemic species including the critically endangered Walia ibex (Capra walie) and endangered mountain Nyala (Tragelaphus buxtoni) are found in the region. The endemism peaks in the forest/ woodland/ grassland complex. As the region is densely populated, there is significant anthropogenic pressure on the vegetation areas. The area of the proposed Humbo Community Forest was cleared in the mid 1970�s (see Annex 6). Biodiversity features The ecoregion has a number of endemics in all taxonomic groups, and covers the two endemic bird areas5. The south Ethiopian Highlands endemic bird area is centered on the forests, grasslands and thickets to the southwest of the Bale Mountains and around the town of Yabello. Ruppell's chat (Myrmecocichla melaena) and Ankober serin (Serinus ankoberensis) are two notable near-endemic areas. Among the birds, only the lineated pytilia (Pytilia lineata) is endemic to this ecoregion. A number of Ethiopian endemics occur only in this ecoregion and the Ethiopian Montane Moorland ecoregion. These high altitude ecoregions are especially known for their diversity of small mammals with over 10 near-endemic species, but also harbour notable near-endemic large mammals, such as the Walia ibex (Capra walie), the
2 See fao.org/Wairdocs/ILRI/x5493E/x5493e19.htm 3 These two biological communities and the threats they face have been detailed by the World Wildlife Fund, and
can be found at www.worldwildlife.org. 4 Ecological descriptions were sourced from wwf.org. 5 Stattersfield, A.J., Crosby, M.J., Long, A.J. & Wege, D.C. 1998. Endemic Bird Areas of the World. Priorities for
Biodiversity Conservation. BirdLife Conservation Series No. 7. BirdLife International, Cambridge, UK. 846 pp.
UNFCCC/CCNUCC
CDM � Executive Board PROJECT DESIGN DOCUMENT FORM
FOR AFFORESTATION AND REFORESTATION PROJECT ACTIVITIES (CDM-AR-PDD) - Version 04
10/102
mountain Nyala (Tragelaphus buxtoni), and the Gelada Baboon (Theropithecus gelada). Most of these species are shared with the Ethiopian Montane Moorland ecoregion. At least 10 amphibians are endemic or near-endemic to the ecoregion, together with five species of near-endemic reptiles. Most of the species are shared either with the lower altitude Ethiopian Montane Woodland ecoregion, or with the higher altitude Ethiopian Montane Moorland ecoregion. The mountain Nyala is not a montane specialist, but has been restricted to Afromontane areas through habitat loss. Found only in the southern part of the highlands, the lower reaches of its altitudinal range are more suitable to the mountain Nyala than the higher, less vegetated ones, but the lower habitat has mostly been converted to cultivation and pastoralism6. The mountain Nyala population in Bale Mountains National Park was thriving until 1991 when it was severely reduced by local people, in protests and upheaval associated with the change in government. Another antelope commonly found at lower elevations is Menelik�s bushbuck (Tragelaphus scriptus meneliki), a subspecies of bushbuck endemic to Ethiopia. A number of the endemic species are endangered. Threatened bird species include two near-endemics, the Ankober serin (Serinus ankoberensis, EN) and the white-winged flufftail (Sarothrura ayresi, EN). Several distinctive mammalian endemics face global extinction. The walia ibex numbers fewer than 400 individuals (Nievergelt et al. 1998), and it is threatened through habitat loss and hybridization with free-ranging domestic goats. Other mammals found in this ecoregion include olive baboon (Papio anubis), black and white colobus monkey (Colobus guereza), golden jackal (Canis aureus), leopard (Panthera pardus), lion (Panthera leo), spotted hyaena (Crocuta crocuta), caracal (Caracal caracal), serval (Felis serval), bush duiker (Sylvicapra grimmia) and bush pig (Potamochoerus porcus). Two different subspecies of the Cercopithecus superspecies are found in this ecoregion: the Djam-djam or Bale monkey (Cercopithecus aethiops djamdjamensis, DD), which is restricted to the southern highlands and the black-faced vervet (Cercopithecus aethiops aethiops). All these species, including the black and white colobus monkey, are suffering from a decrease in suitable habitat. Colobus populations are increasingly fragmented, with groups living in small remnant forest patches, often a single church graveyard. Ethiopian montane forests
Conservation Status: critical/endangered
The Ethiopian montane woodland ecoregion is biodiverse, poorly known and highly threatened. The rugged topography of this ecoregion rings the highlands of Ethiopia and Eritrea, extending to outlying massifs in Sudan. Remnant patches of natural vegetation consist mostly of podocarp and juniper forests, with some acacias found at lower elevations. While soils are rather infertile, this area is densely populated and most land has been converted to agriculture where the topography permits, however there is no agriculture practiced within the boundary of the project. Notable endemics found here include the yellow-throated serin and Prince Ruspoli's turaco. Many of the endemic species are threatened due to the loss of their habitat Biodiversity features
6 Kingdon, J. 1989. Island Africa: The evolution of Africa�s rare animals and plants. Princeton University Press. Princeton, NJ,
USA. 287 pp
UNFCCC/CCNUCC
CDM � Executive Board PROJECT DESIGN DOCUMENT FORM
FOR AFFORESTATION AND REFORESTATION PROJECT ACTIVITIES (CDM-AR-PDD) - Version 04
11/102
Forest types present in this ecoregion range from wet to dry, giving the area high biodiversity values. The patterns of endemism and their association with the forests of the area are complex and have been presented previously7,8. There is an area of bird endemism on the southeast corner of the southern Ethiopian highlands and another one in the higher plateau of the northern Ethiopian highlands and Eritrea9. Other plant and animal endemics are found along the drier northeastern margins of the Ethiopian highlands, which link to the mountains of northern Eritrea and Somalia as well as the Day Forest in the Goda Massif in Djibouti. Threatened species include four strict endemics, including Djibouti francolin (Francolinus ochropectus, CR), Harwood's francolin (Francolinus harwoodi, VU), Prince Ruspoli's turaco (Tauraco ruspoli, VU) and yellow-throated seedeater (Serinus flavigula, VU), all of which are primarily threatened by habitat loss10 (Magin 2001). Prince Ruspoli�s turaco is further restricted where its range overlaps with the near-endemic white-cheeked turaco (Tauraco leucotis). Where both species are present, Prince Ruspoli�s turaco is only found in juniper forest, but where it occurs alone, it inhabits both broad-leaved and juniper forest. Both birds are part of a recent radiation of small, red-winged turacos. However, the white-cheeked turaco is extremely adaptable and the regional representative of a type that is found across all of Africa. Prince Ruspoli�s turaco has not become significantly distinct and is declining as the white-cheeked turaco advances19. The ecoregion also contains part of the South Ethiopian highlands endemic bird area22, centered on the forests, grasslands and thickets to the southwest of the Bale Mountains and including the Yabello Sanctuary at around 1,700 m where the endemic Sidamo lark (Heteromirafra sidamoensis, EN), white-tailed swallow (Hirundo megaensis, VU) and Ethiopian bush-crow (Zavattariornis stresemanni, VU) occur. Other birds considered as near-endemic to this ecoregion include dark-headed oriole (Oriolus monacha), Abyssinian catbird (Parophasma galinieri), Abyssinian slaty flycatcher (Dioptrornis chocolatinus), and yellow-fronted parrot (Poicephalus flavifrons). Mammals with ranges restricted to Ethiopia that occur in this ecoregion include the shrew, (Crocidura harenna) CR, the narrow-footed woodland mouse (Grammomys minnae), and Menelik�s bushbuck (Tragelaphus scriptus meneliki), a subspecies of bushbuck with long, dark fur. Males are black while females are chestnut colored with white spots. Some other mammals found in this ecoregion are: olive baboons (Papio anubis), black and white colobus monkeys (Colobus guereza), black-faced vervet monkey (Cercopithecus aethiops aethiops), bush duikers (Sylvicapra grimmia), warthogs (Phacochoerus aethiopicus), bush pigs (Potamochoerus porcus) and hippopotamus (Hippopotamus amphibius). Predators include caracals (Caracal caracal), golden jackals (Canis aureus), black backed jackals (Canis mesomelas), leopards (Panthera pardus, EN), lions (Panthera leo, VU), spotted hyaenas (Crocuta 7 Friis, I. 1992. Forests and Forest Trees of Northeast Tropical Africa. HMSO, Kew Bulletin Additional Series
XV 8 Lovett, J. C. and I. Friis. 1996. Patterns of endemism in the woody flora of north-east and east Africa. Pages
582-601 in L. J. G. van der Maesen, X. M. van der Burgt, J. M. van Medenbach de Rooy, editors. The Biodiversity of African Plants. The Netherlands: Kluwer Academic Publishers
9 Stattersfield, A.J., Crosby, M.J., Long, A.J. & Wege, D.C. 1998. Endemic Bird Areas of the World. Priorities for Biodiversity Conservation. BirdLife Conservation Series No. 7. BirdLife International, Cambridge, UK. 846 pp
10 Magin, G. 2001. Djibouti chapter in: Fishpool, L.D.C. and Evans, M.I. (eds). Important Bird Areas in Africa and associated islands: priority sites for conservation. Newbury and Cambridge, U.K: Pisces Publications and BirdLife International (BirdLife Conservation Series No. 11)

UNFCCC/CCNUCC
CDM � Executive Board PROJECT DESIGN DOCUMENT FORM
FOR AFFORESTATION AND REFORESTATION PROJECT ACTIVITIES (CDM-AR-PDD) - Version 04
12/102
crocuta) and servels (Felis serval). Antelope species found here include Swayne�s hartebeest (Alcelaphus buselaphus swaynei, EN), Guenther�s dikdik (Madoqua guentheri) and greater kudu (Tragelaphus strepsiceros). Many of these larger mammals are only found in protected areas, most notably Nechisar National Park and Sikele reserve. In the early 1900s, elephant (Loxodonta africana), black rhinocerus (Diceros bicornis), buffalo (Syncerus caffer) and oryx (Oryx gazella) were found in the Nechisar area but all have been eliminated11. Although accurately ascribing species of amphibian and reptile to this complex ecoregion has proven problematic, there are believed to be a number of near-endemic species of both taxonomic groups in these forests. Of the five endemic amphibians two are tree frogs (Afrixalus clarkei and Afrixalus enseticola), two are ranid frogs (Phrynobatrachus bottegi and Phrynobatrachus sciangallarum), and one is a caecilian (Sylvacaecilia grandisonae). Two endemic chameleons are found, including two species of chameleons, Chamaeleo balebicornutus and Chamaeleo harennae. A.5.2. Description of the presence, if any, of rare or endangered species and their habitats: >> This region contains several threatened species, identified in the World Conservation Union (IUCN) red list, associated with the temperate and tropical mountain forest habitats which are anticipated to benefit directly from the proposed project. These are identified in Table A-1. Table A-1. IUCN Red List Species endemic to the project area
Afrixalus enseticola Ethiopian Banana Frog (E) Caprimulgus solala Nechisar Nightjar (E) Grammomys minnae Ethiopian Thicket Rat (E) Heteromirafra sidamoensis Sidamo Bushlark Hipposideros megalotis Ethiopian Large-Eared Roundleaf Bat (E) Kerivoula eriophora Ethiopian Woolly Bat (E) Lycaon pictus African Wild Dog Panthera leo African Lion Vulpes pallida African Sand Fox Phoenicopterus minor Lesser Flamingo
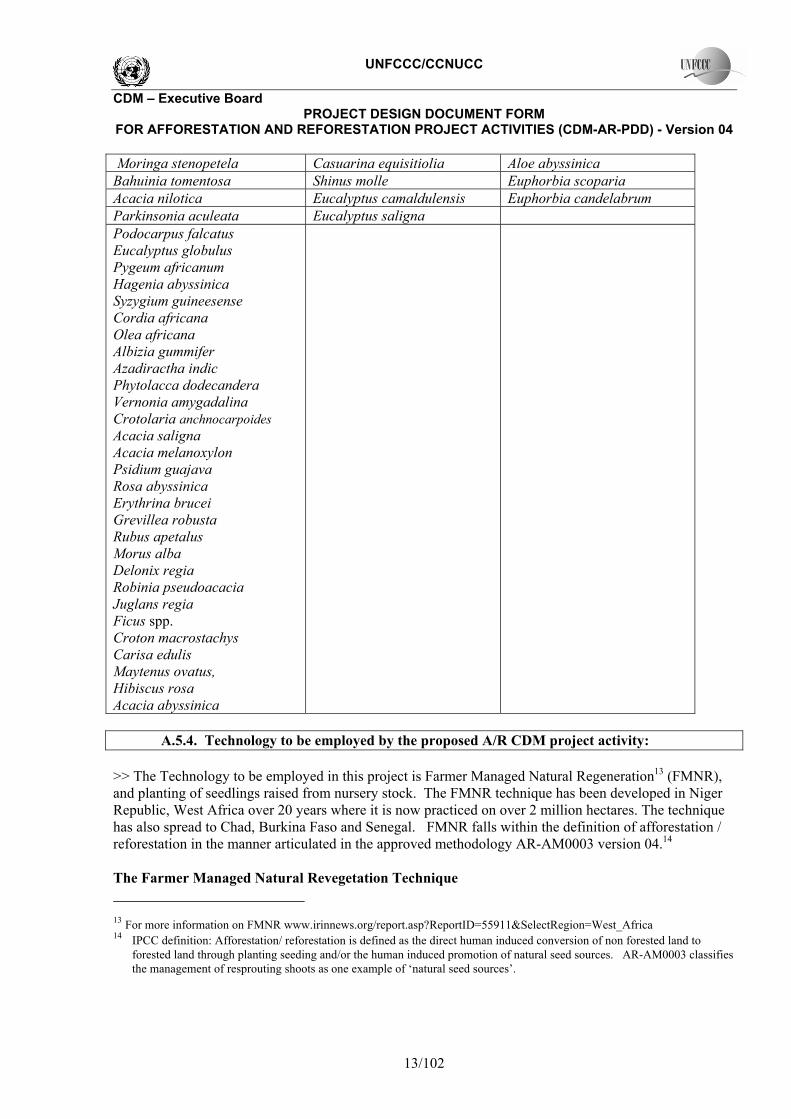
A.5.3. Species and varieties selected for the proposed A/R CDM project activity: >> Tree species to be included in reforestation schedules include those indigenous to the project area, and other naturalized species that are widely used12. It is envisaged there will be many grass, ground layer, and shrub species, which will establish on the site with the progress in project implementation. The species proposed for planting include: Table A-2 Species proposed for planting in the project. Supplemental planting Buffer zone plantation Live fence & erosion controlShinus molle Euphorbia abyssinica Eucalyptus camaldulensis Azadiractha indica Euphorbia tirucalli Acacia saligna Casuarina cunninghamia Agave americana 11 Yalden, D.W., Largen, M.J., Kock, D., Hillman, J.C. 1996. Catalogue of the mammals of Ethiopia and Eritrea. 7.
Revised checklist, zoogeography and conservation. Tropical Zoology 9: 3-164 12 A Forestry analysis has been prepared and is available as annex 6.
UNFCCC/CCNUCC
CDM � Executive Board PROJECT DESIGN DOCUMENT FORM
FOR AFFORESTATION AND REFORESTATION PROJECT ACTIVITIES (CDM-AR-PDD) - Version 04
13/102
Moringa stenopetela Casuarina equisitiolia Aloe abyssinica Bahuinia tomentosa Shinus molle Euphorbia scoparia Acacia nilotica Eucalyptus camaldulensis Euphorbia candelabrum Parkinsonia aculeata Eucalyptus saligna Podocarpus falcatus Eucalyptus globulus Pygeum africanum Hagenia abyssinica Syzygium guineesense Cordia africana Olea africana Albizia gummifer Azadiractha indic Phytolacca dodecandera Vernonia amygadalina Crotolaria anchnocarpoides Acacia saligna Acacia melanoxylon Psidium guajava Rosa abyssinica Erythrina brucei Grevillea robusta Rubus apetalus Morus alba Delonix regia Robinia pseudoacacia Juglans regia Ficus spp. Croton macrostachys Carisa edulis Maytenus ovatus, Hibiscus rosa Acacia abyssinica
A.5.4. Technology to be employed by the proposed A/R CDM project activity: >> The Technology to be employed in this project is Farmer Managed Natural Regeneration13 (FMNR), and planting of seedlings raised from nursery stock. The FMNR technique has been developed in Niger Republic, West Africa over 20 years where it is now practiced on over 2 million hectares. The technique has also spread to Chad, Burkina Faso and Senegal. FMNR falls within the definition of afforestation / reforestation in the manner articulated in the approved methodology AR-AM0003 version 04.14 The Farmer Managed Natural Revegetation Technique 13 For more information on FMNR www.irinnews.org/report.asp?ReportID=55911&SelectRegion=West_Africa 14 IPCC definition: Afforestation/ reforestation is defined as the direct human induced conversion of non forested land to
forested land through planting seeding and/or the human induced promotion of natural seed sources. AR-AM0003 classifies the management of resprouting shoots as one example of �natural seed sources�.
UNFCCC/CCNUCC
CDM � Executive Board PROJECT DESIGN DOCUMENT FORM
FOR AFFORESTATION AND REFORESTATION PROJECT ACTIVITIES (CDM-AR-PDD) - Version 04
14/102
Farmer managed Natural Revegetation (FMNR) is a system of farm and forest vegetation established by poor rural communities to achieve the objective of forest restoration over a short period. They have rights to forests and their products. Professor Chris Reij, of Vrije University in Amsterdam15 and Dr. Peter Cunningham, SIM International, has documented the technique, and this work is publicly available16. Implementation of FMNR FMNR is implemented in areas that have root stock that could resprout under protection and management. It works best where annual rainfall is in excess of 650mm and is not suitable for areas with an annual rainfall of less than 200mm. Root stock from trees cleared as long as 60 years ago can remain in the soil, resprouting periodically. This root stock will develop new shoots each year, and these can be mistaken for small shrubs or broadleaf groundcover species. On farmland, standard practice for farmers has been to slash this regrowth each year in preparation for planting crops. In non-arable areas, such growth is controlled through regular burning, grazing and fuel wood collection. However with training, the local communities could identify young shoots tend and manage them to regenerate the root stock. The proposed Humbo community forest area has been found suitable for application of the FMNR technique. In the most basic form of FMNR, all stalks except one are cut from the root stock. Side branches are then pruned half way up the stem. Selecting and pruning the best five to seven stems can offer more benefits, and this has been the practice in West Africa. Unwanted stems are removed, and the managed stems increase in size each year, protecting the immediate soil environment and providing other useful materials and services such as fodder, humus, habitat, and protection from the wind and shade. On occasions that a stem is harvested, a younger stem is selected to replace it. Different tree species require different pruning techniques, and these are determined through on site observation. A small handsaw or machete is the only tool used for pruning side branches of young shoots. Land managers revisit the project area every 2-4 months to re-prune as necessary. Heavy equipment is not required as a result there will be minimal soil disturbance when this technique is used. Integrated fire management approaches are implemented in cooperation with the local communities. Grazing is prevented during the vulnerable period after pruning. The decision to allow grazing would be depend upon the growth of trees beyond the height that would not be vulnerable to grazing. Supplemental planting Supplemental planting will be used to augment the FMNR established forests. The nursery will have the capacity to deliver up to 1,000,000 seedlings per year for the first two years, sufficient to reforest 500 hectares at 1000 stems per hectare. The nursery will be set up in a conventional manner. Seedlings will be planted in small pits (0.3m x 0.3m x 0.2m), which are pre-dug through community labor schemes. Seedlings will be planted at the start of the rainy season and follow up weed control will be undertaken. Harvest
15 Farmer Managed Natural Regeneration. Impressions of a short field trip. June 9-11, 2004. Reij. C. Vrije Universiteit, Amsterdam.
16 Reforesting the Sahel: Farmer Managed Natural Regeneration. Cunningham P.J and Abas. T.
UNFCCC/CCNUCC
CDM � Executive Board PROJECT DESIGN DOCUMENT FORM
FOR AFFORESTATION AND REFORESTATION PROJECT ACTIVITIES (CDM-AR-PDD) - Version 04
15/102
The project area is expected to be harvested at years 12, 22 and 31 years. The management plan will maintain 50% of the standing biomass for the benefits of biodiversity, environmental protection and other ongoing services. Forest products are transported by donkey. Therefore, no leakage emission from the transport of harvested produce is expected. The forest products will be processed at the city of Soddo, approximately 40km from the project site. A.5.5. Transfer of technology/know-how, if applicable: >> The project will provide training in reforestation and regeneration techniques to the local communities through community society cooperatives. Additionally, the cooperatives will offer training in a range of activities including sustainable forest management; agro-forestry, improved agricultural practices, eco tourism; fire management; community conflict resolution and cooperatives management; project and leakage monitoring; poultry management, alternative energy sources, apiculture and fodder development. A.5.6. Proposed measures to be implemented to minimize potential leakage: >> To minimize the potential leakage in the form of fuel wood collection this project will establish some fuel wood plantations to offset potential project leakage, however these are a small proportion of the project area, and will be used for the communities� fuel wood supply rather than commercial purposes. During project implementation, grazing activity will be discontinued and it will need to be minimized in areas where pruning and tending of existing root material is practiced. Landholders will still have access to the forest to �cut and carry� the fodder which grows under the trees. The existing beneficiaries of grazing access in these areas have been included in discussion regarding the proposed changes in the management of the land resources, and their agreement to the process of area closure/restricted access will be required. At the project design stage, a reasonable sub-sample was contacted and they expressed strong support for the reforestation to proceed. The users understand the environmental impacts caused by the deforestation and see the importance of re-establishing the forest vegetation. Additionally, leakage is also prevented by implementing following measures. • The project will seek to identify alternate community grazing areas for the individuals impacted for
the period of exclusion. The large contiguous nature of sites will make monitoring of grazing restrictions easier to manage.
• User rights will be granted to individuals, groups of families, or communities. This is expected to help reduce over-exploitation and encourage management of forest and fodder resources.
• There will be an opportunities for long-term employment to some of the existing beneficiaries in the planting, tending and protection roles required for forest management.
• There will be an opportunity to protect the forest from excessive grazing and over exploitation once a certificate of ownership is delivered to a definite number of peasant associations.
• Training will be imparted to community members on livestock management as well as general forest management through the network of the seven community cooperatives.
A.6. Description of legal title to the land, current land tenure and rights to tCERs / lCERs issued for the proposed A/R CDM project activity: >> The area where the proposed project is to be implemented (as with all land in Ethiopia) is the property of the Federal Government of Ethiopia. The land is �communal land� and management of the land is not
UNFCCC/CCNUCC
CDM � Executive Board PROJECT DESIGN DOCUMENT FORM
FOR AFFORESTATION AND REFORESTATION PROJECT ACTIVITIES (CDM-AR-PDD) - Version 04
16/102
allocated to any individual, group or organization. The land is degraded and is utilized ad hoc by community members for fuel wood collection, charcoal making, and grazing by the surrounding community. The Federal Rural Land Administration and Land Use Proclamation No. 456/2005, and the SNNPRS (Regional) Rural Land Administration and Utilization Proclamation No. 53/2003, are the legal instruments that specify the content of rights a rural landholder or cooperative may have over an area of land. Within SNNPRS proclamation no 53/2003 a possessory right is defined as �the right any peasant or pastoral shall have to use rural land for agriculture or natural resource development activities.� Natural resource is defined as �living things and non-living things which are gift of nature found on the land�. Legal counsel and confirmation from the EPA, state, and woreda level natural resource management specialists confirm that this includes rights to carbon sequestered in the forest.
The two proclamations also specify the types of holdings pertaining to rural land; provisions on land measurement, registration and holding certificate; duration of rural land use rights and transfer of rights; obligations of rural land users etc. The Federal Proclamation requires enactment of land administration and land use law consisting provisions to implement the federal law.
�Holding Right� or �Possessory Right� (the term used in the SNNPRS Proclamation) is defined as the right of any peasant or pastoralist (semi-pastoralist) to use rural land for the purpose of agricultural and natural resources development and the right includes the right to lease and bequeath it to family members. Similar to what is provided in the respective Federal and Regional Constitutions, the Rural Land Administration and Use Proclamations also provide for the right to acquire property produced on the land by the labour or capital of the holder of the right and to sell, exchange and bequeath same. Thus, the bundle of rights included within the term �land holding right� includes the right to use, lease and bequeath the land to heirs and acquire private property over both immovable and movable property that is produced by the labour or capital of the landholder concerned.
There are three different types of land holdings provided in the Proclamations, namely, private holding, state holding and communal holding. The definition given to the latter types of land holdings in both the Federal and Regional Proclamations is more or less similar in nature. �Private holdings� is defined as rural land under the holding of peasants or pastoralists or other bodies legally entitled to use rural land (e.g. private investors). �State holdings� is defined as rural land demarcated or to be demarcated as Federal or Regional state holding and includes forest lands, wildlife protected areas, state farms etc. �Communal holdings� are defined as rural land which is allocated by the government to local communities for common grazing, forestry and other social services.
The SNNPRS Proclamation defines �community holdings� in a slightly different manner, being �land which is not designated as state or private holding and is being used by the local community as common holding for the purpose of grazing, forestry or other social services�. Thus, the Regional Proclamation takes into account the existing use of land. Land that community uses for grazing and fuel wood falls under the term �community holding�.
For the purpose of this reforestation project, the most important definition is that given to �community holdings�. Accordingly, the definition given under both the Federal and Regional laws allows the designation of the potential project sites as community holdings. The law also provides that holding certificates (title deeds) will also be issued as proof of rural land use right. Indeed, after the Humbo project site was designated as communal holdings, a holding certificate or title deed were given to the holders of the right (see Article 8 of the SNNPRS Proclamation No. 53/2003) that is, the seven cooperative societies. In discussions with the authorities at both the Regional and Woreda (local) levels, officials have shown their full support to the project and their readiness to transfer the land rights to the
UNFCCC/CCNUCC
CDM � Executive Board PROJECT DESIGN DOCUMENT FORM
FOR AFFORESTATION AND REFORESTATION PROJECT ACTIVITIES (CDM-AR-PDD) - Version 04
17/102
communities participating in the project. They have also confirmed that they will issue holding certificates to the communities in accordance with the law. Although the regional land proclamation does not specifically identify carbon sequestration, an independent consultant in Ethiopian law confirmed that those who possess community holdings (user rights certificates issued from proclamations SNNPR 53/2003 and Federal 456/2005) have the right to all the products produced from the land, and that the products produced from the land would therefore necessarily include sequestered carbon. This interpretation of the legal framework has also been confirmed through legal counsel by the Environmental Protection Agency (Designated National Authority for the Clean Development Mechanism), the Ministry of Agriculture and Rural Development, and the Humbo Woreda Bureau for Agriculture and Rural Development. Annex 5 presents detailed information on the legal status of the lands included in the project. A.7. Assessment of the eligibility of the land: >> The Ethiopian DNA has determined that within Ethiopia, a forest is defined as land with trees that has:
• A minimum area of 0.05 hectares; • A minimum tree crown cover of 20 per cent; • A minimum average tree height above 2 m.
The minimum tree crown cover value falls between 10 and 30 per cent and the minimum land area value falls between 0.05 and 1 hectare defined by paragraph 8 in decision 19/CP.9. Therefore, the forest definition of the Ethiopian government complies with the UNFCCC definition of a forest and can be used for the purposes of the Kyoto Protocol. Field survey assessments have confirmed that no area in the project boundary could be considered a forest. Although the sites have vegetation below the threshold of a forest, these sites are not expected to become forest in the future without the project due to anthropogenic pressure from grazing and fuelwood collection. Forest destruction on communal land has been a major problem for the past 30 years. This problem is well documented:
• The Good Practice Guidance for Land Use, Land-Use Change and Forestry (IPCC 2003) identifies that Ethiopia is losing as much as 40,000 hectares of vegetation annually. As the project region is densely populated, it has lost almost all of its native forest.
• According to the UN report �Forest fires in Ethiopia� compiled for the UN Emergencies Unit for Ethiopia (UN-EUE), land tenure is the single most important factor in natural resources management, environmental degradation and fire use. The report notes "without changing ownership either literally or symbolically to give local communities a greater sense of investment in the land, environmental disasters will continue and the 2.7% of the country that is forested will rapidly diminish".
• The IUCN Red list confirms the state of forest destruction �Forest destruction has been dramatic in Ethiopia's highlands. Measures to stop further deforestation and reforestation with indigenous trees are urgently needed.
• The Nechisar National Park, some 50 kilometers from the project site holds a documented example of forest destruction. Tilahun et al. (1996) in �Bird Areas of Ethiopia� identify the threats of intensive natural resource use, fueled by the fast growth in the nearby town of Arba Minch. Previously one of the best protected areas in the country, the park is now exploited for livestock grazing and wood for construction and fuel.
UNFCCC/CCNUCC
CDM � Executive Board PROJECT DESIGN DOCUMENT FORM
FOR AFFORESTATION AND REFORESTATION PROJECT ACTIVITIES (CDM-AR-PDD) - Version 04
18/102
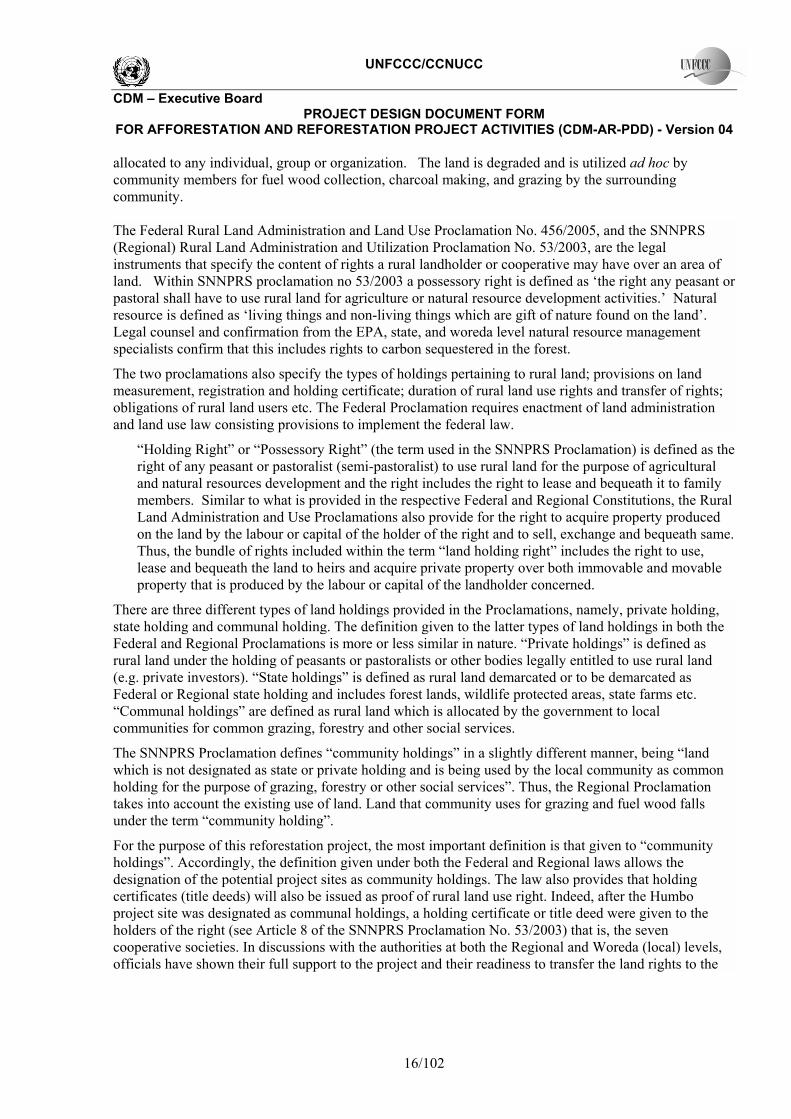
Photo A-2 Grazing in the project area
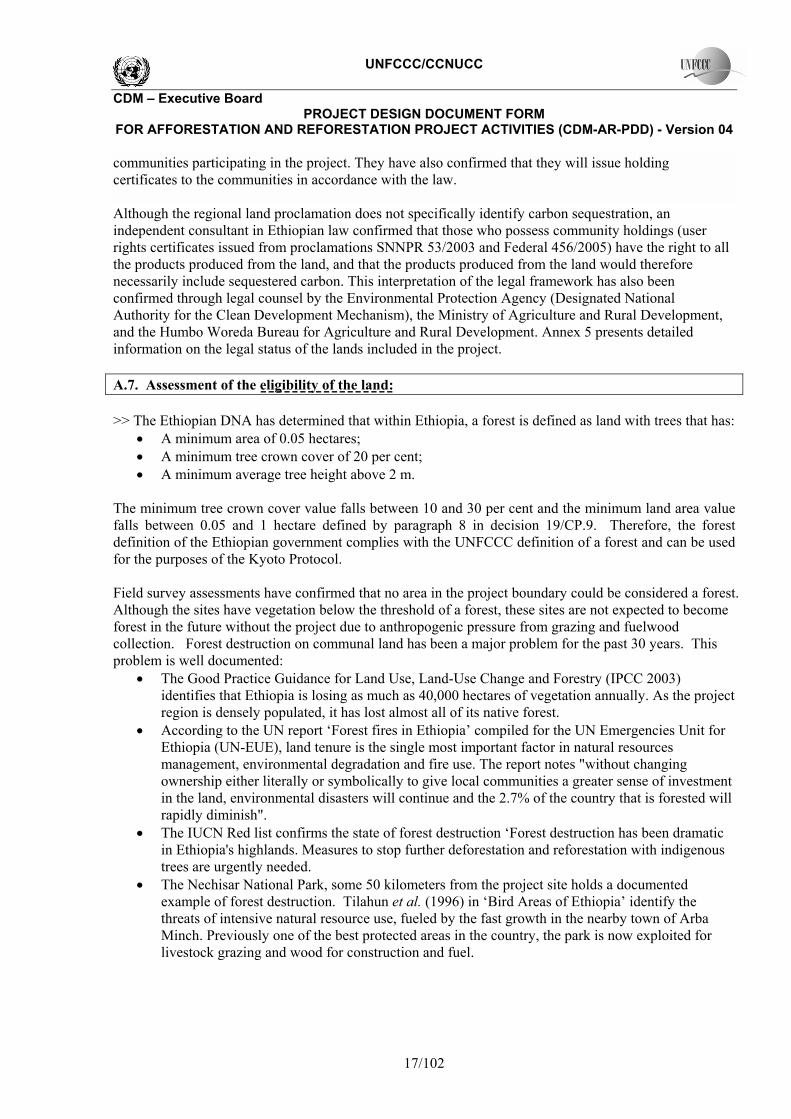
Photo A-3 Charcoal production near the project area
The aerial photographic information for the project sites is provided in section C5.1. Additionally, evidence in the form of affidavits and written testimony provided by village leaders through participatory rural appraisal confirms that the project sites did not have vegetation since December 31, 1989 (Annex 6). A.8. Approach for addressing non-permanence: >> The project team chooses to utilize the tCER mechanism for the net anthropogenic GHG removals by sinks achieved by the proposed A/R CDM project activity. The project is designed to facilitate the long-term establishment of mature trees, as well as the sustainable harvesting of forest products. Issues relating to permanence will be addressed in the project area in the following ways. Measures to strengthen the protection of forest
UNFCCC/CCNUCC
CDM � Executive Board PROJECT DESIGN DOCUMENT FORM
FOR AFFORESTATION AND REFORESTATION PROJECT ACTIVITIES (CDM-AR-PDD) - Version 04
19/102
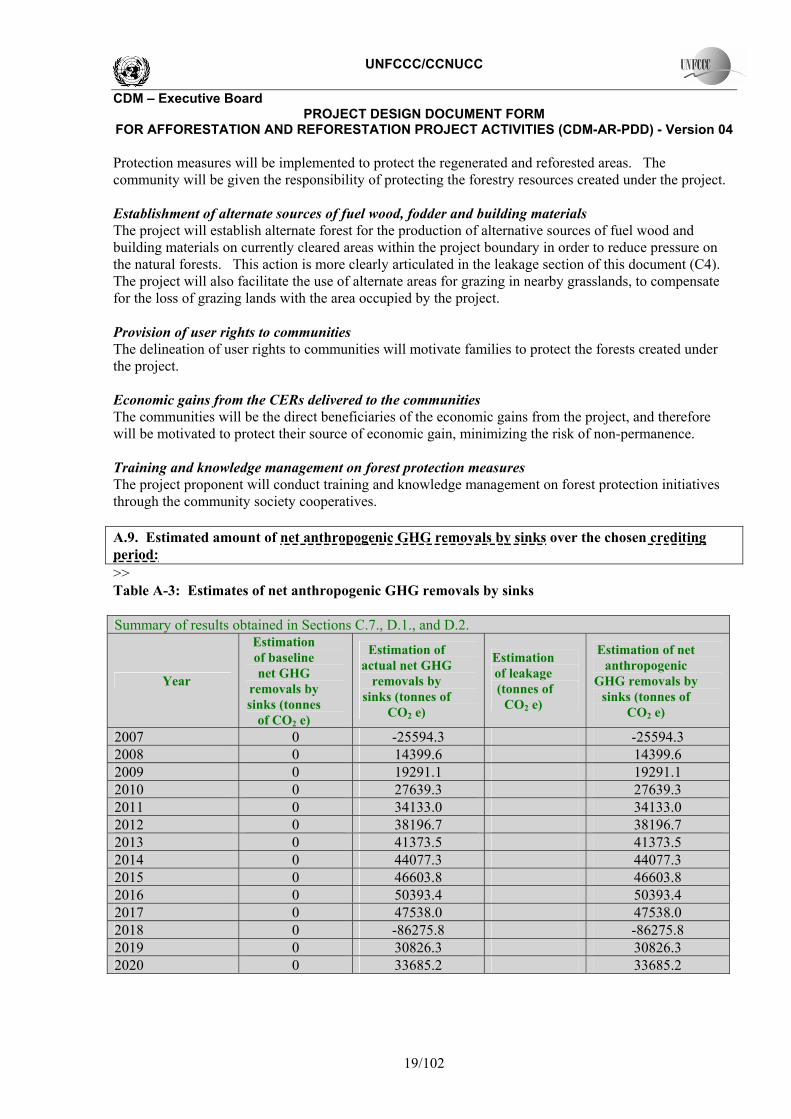
Protection measures will be implemented to protect the regenerated and reforested areas. The community will be given the responsibility of protecting the forestry resources created under the project. Establishment of alternate sources of fuel wood, fodder and building materials The project will establish alternate forest for the production of alternative sources of fuel wood and building materials on currently cleared areas within the project boundary in order to reduce pressure on the natural forests. This action is more clearly articulated in the leakage section of this document (C4). The project will also facilitate the use of alternate areas for grazing in nearby grasslands, to compensate for the loss of grazing lands with the area occupied by the project. Provision of user rights to communities The delineation of user rights to communities will motivate families to protect the forests created under the project. Economic gains from the CERs delivered to the communities The communities will be the direct beneficiaries of the economic gains from the project, and therefore will be motivated to protect their source of economic gain, minimizing the risk of non-permanence. Training and knowledge management on forest protection measures The project proponent will conduct training and knowledge management on forest protection initiatives through the community society cooperatives. A.9. Estimated amount of net anthropogenic GHG removals by sinks over the chosen crediting period: >> Table A-3: Estimates of net anthropogenic GHG removals by sinks Summary of results obtained in Sections C.7., D.1., and D.2.
Year
Estimation of baseline net GHG
removals by sinks (tonnes
of CO2 e)
Estimation of actual net GHG
removals by sinks (tonnes of
CO2 e)
Estimation of leakage (tonnes of
CO2 e)
Estimation of net anthropogenic
GHG removals by sinks (tonnes of
CO2 e)
2007 0 -25594.3 -25594.3 2008 0 14399.6 14399.6 2009 0 19291.1 19291.1 2010 0 27639.3 27639.3 2011 0 34133.0 34133.0 2012 0 38196.7 38196.7 2013 0 41373.5 41373.5 2014 0 44077.3 44077.3 2015 0 46603.8 46603.8 2016 0 50393.4 50393.4 2017 0 47538.0 47538.0 2018 0 -86275.8 -86275.8 2019 0 30826.3 30826.3 2020 0 33685.2 33685.2
UNFCCC/CCNUCC
CDM � Executive Board PROJECT DESIGN DOCUMENT FORM
FOR AFFORESTATION AND REFORESTATION PROJECT ACTIVITIES (CDM-AR-PDD) - Version 04
20/102
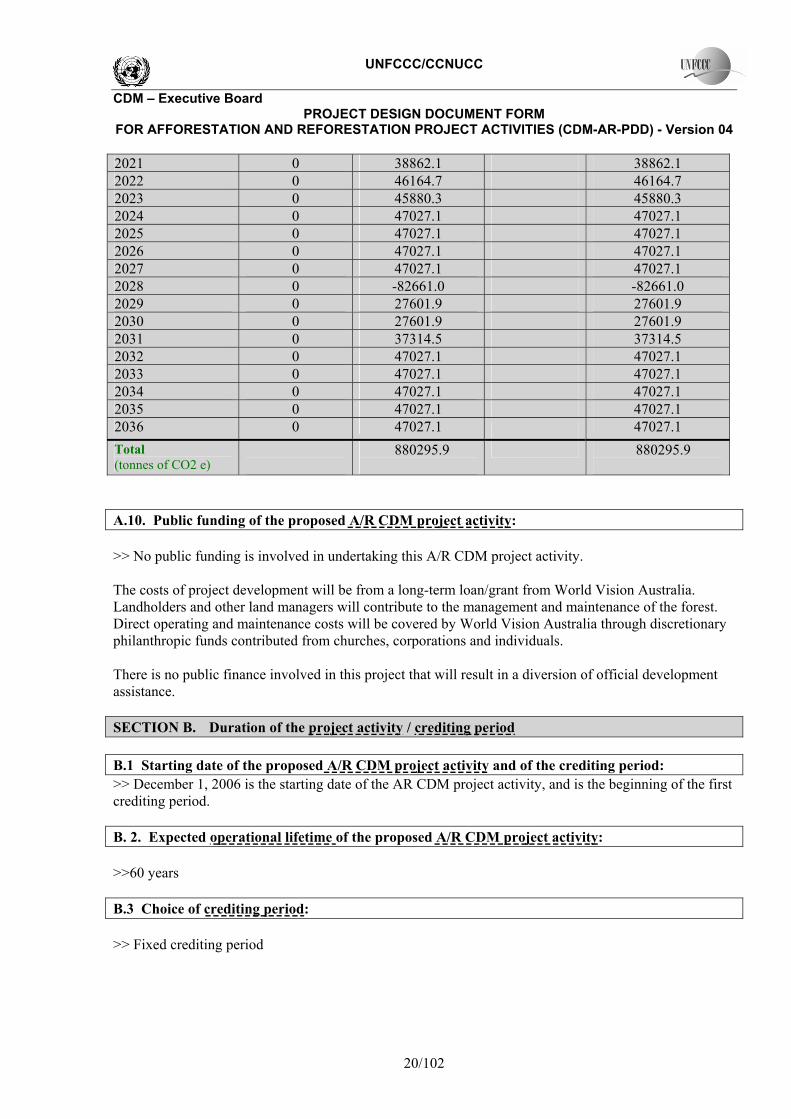
2021 0 38862.1 38862.1 2022 0 46164.7 46164.7 2023 0 45880.3 45880.3 2024 0 47027.1 47027.1 2025 0 47027.1 47027.1 2026 0 47027.1 47027.1 2027 0 47027.1 47027.1 2028 0 -82661.0 -82661.0 2029 0 27601.9 27601.9 2030 0 27601.9 27601.9 2031 0 37314.5 37314.5 2032 0 47027.1 47027.1 2033 0 47027.1 47027.1 2034 0 47027.1 47027.1 2035 0 47027.1 47027.1 2036 0 47027.1 47027.1 Total (tonnes of CO2 e)
880295.9
880295.9
A.10. Public funding of the proposed A/R CDM project activity: >> No public funding is involved in undertaking this A/R CDM project activity. The costs of project development will be from a long-term loan/grant from World Vision Australia. Landholders and other land managers will contribute to the management and maintenance of the forest. Direct operating and maintenance costs will be covered by World Vision Australia through discretionary philanthropic funds contributed from churches, corporations and individuals. There is no public finance involved in this project that will result in a diversion of official development assistance. SECTION B. Duration of the project activity / crediting period B.1 Starting date of the proposed A/R CDM project activity and of the crediting period: >> December 1, 2006 is the starting date of the AR CDM project activity, and is the beginning of the first crediting period. B. 2. Expected operational lifetime of the proposed A/R CDM project activity: >>60 years B.3 Choice of crediting period: >> Fixed crediting period
UNFCCC/CCNUCC
CDM � Executive Board PROJECT DESIGN DOCUMENT FORM
FOR AFFORESTATION AND REFORESTATION PROJECT ACTIVITIES (CDM-AR-PDD) - Version 04
21/102
B.3.1. Length of the renewable crediting period (in years and months), if selected: >>N.A B.3.2. Length of the fixed crediting period (in years and months), if selected: >>30 years SECTION C. Application of an approved baseline and monitoring methodology C.1. Title and reference of the approved baseline and monitoring methodology applied to the proposed A/R CDM project activity: >> This project activity uses the approved baseline methodology AR-AM0003, Version 4, Afforestation and reforestation of degraded land through tree planting, assisted natural regeneration and control of animal grazing. This methodology utilizes Version 2 of the Tool for the Demonstration and Assessment of Additionality in A/R CDM Project Activities17. C.2. Assessment of the applicability of the selected approved methodology to the proposed A/R CDM project activity and justification of the choice of the methodology: >> The proposed A/R CDM activity complies with the following applicability conditions of AR-AM0003. • The project activity can lead to a shift of pre-project activities outside the project boundary, e.g. a
displacement of grazing and fuelwood collection activities, including charcoal production; o There will be temporary displacement of both grazing and fuel-wood collection (including
charcoal production) activities from the project sites, these are articulated section D.2 of this document.
• Lands to be afforested or reforested are severely degraded and the lands are still degrading or remain
in a low carbon steady state; o The proposed project areas have been denuded and anthropogenic pressures prohibit natural
regeneration. These areas have low carbon stocks, which are being reduced and are therefore degrading or in a low carbon steady state, and therefore fulfill this applicability condition of the methodology. This is attested to in the PRA workshops, which have been held in the region (see annex 6), and in the foresters report (available upon request). . To reverse the degraded status of lands, the lands that are in degraded condition under state ownership are transferred to the cooperatives for management, with accompanying user rights as per proclamations SNNPR 53/2003 and Federal 456/2005. Further to this, without substantive change in forest management, from ad-hoc utilization of all forest resources by any person to forest management using the FMNR techniques as proposed in this project the forest vegetation is not expected to be re-established on the site. The details of which are presented in section C.5.1.
17 http://cdm.unfccc.int/Reference/tools/ar/methAR_tool01_v02.pdf
UNFCCC/CCNUCC
CDM � Executive Board PROJECT DESIGN DOCUMENT FORM
FOR AFFORESTATION AND REFORESTATION PROJECT ACTIVITIES (CDM-AR-PDD) - Version 04
22/102
• Environmental conditions or anthropogenic pressures do not permit the encroachment of natural tree vegetation that leads to the establishment of forests according to the threshold values of the national definition of forest for CDM purposes; o Anthropogenic pressures do not permit the encroachment of natural forest vegetation, and is
discussed in section C.6. • Lands will be afforested or reforested through promotion of natural regeneration and or direct planting
or seeding; o Lands will be afforested or reforested through promotion of natural regeneration and/or direct
planting and seeding. The FMRN technique is a form of assisted natural regeneration technique pioneered in West Africa and considered appropriate to this region. FMNR will be practiced on the project sites, as described in section A.5.4
• Site preparation does not cause significant longer term net decreases of soil carbon stocks or increases
of non-CO2 emissions from soil; o Using the FMRN techniques very limited levels of soil disturbance will occur on a small
number of hectares, the potential decrease in soil carbon is extremely low, see section A.5.4. • Carbon stocks in soil organic carbon, litter and dead wood can be expected to decrease more due to
soil erosion and human intervention or increase less in the absence of the project activity, relative to the project scenario; o Soil erosion and land degradation data produced by the World Bank18 indicated that the
project area is losing an average of between 4 and 10 tonnes of topsoil erosion per hectare per year due to erosion, and is allocated the highest possible environmental degradation index. Due to their steep terrain, the sites are subject to higher levels of erosion and as a consequence, the soil carbon levels in the baseline scenario are expected to show a gradual decline. Due to anthropogenic pressures, the dead wood and litter levels are also expected to decrease in the baseline scenario (see PRA workshop report, Annex 6). While in the project scenario, the deadwood, litter and soil carbon pools are expected to increase. Therefore, not accounting their changes in the project scenario is conservative.
• Flooding irrigation is not permitted;
o The project is not expected to practice irrigation as discussed in section A.5.4. • Soil drainage and disturbance are insignificant, so that non CO2-greenhouse gas emissions from this
type of activities can be neglected; o Site preparation is not expected to cause significant longer-term net decreases of soil carbon
stocks or increases of non-CO2 emissions from soil. As very limited levels of soil disturbance will occur, the potential change in soil carbon as result of project site preparation activities is insignificant (see section A.5.4). As no irrigation or fertilizers will be utilized, there is no anticipated increase in the levels of non-CO2 GHG from the soil.
• The amount of nitrogen-fixing species (NFS) used in the AR CDM project activity is not significant, so
that greenhouse gas emissions from denitrification can be neglected in the estimation of actual net greenhouse gas removals by sinks; o The number of nitrogen fixing shrub species included in the project activity are anticipated to
be insignificant (less than 5%). These species are also indigenous to the region (see A.5.3) 18 World Bank Background report, assessing Ethiopia growth potential and potential obstacles, April 2004:31
UNFCCC/CCNUCC
CDM � Executive Board PROJECT DESIGN DOCUMENT FORM
FOR AFFORESTATION AND REFORESTATION PROJECT ACTIVITIES (CDM-AR-PDD) - Version 04
23/102
• The AR CDM project activity is implemented on land where there are no other on-going or planned AR
activities. o There are no on-going or alternate AR activities in the project area, and this has been
confirmed by the official agencies in the region. C.3. Assessment of the selected carbon pools and emission sources of the approved methodology to the proposed CDM project activity: >> The methodology includes above-ground biomass and below-ground biomass. Both carbon pools are considered appropriate given that the objective and technology of the project is natural regeneration of degraded areas with supplementary planting. C.4. Description of strata identified using the ex ante stratification:
>> Stratification is undertaken as prescribed in section II.3 of the approved methodology AR-AM0003 version 04.
Step 1: Stratification according to pre-existing conditions and baseline projections.
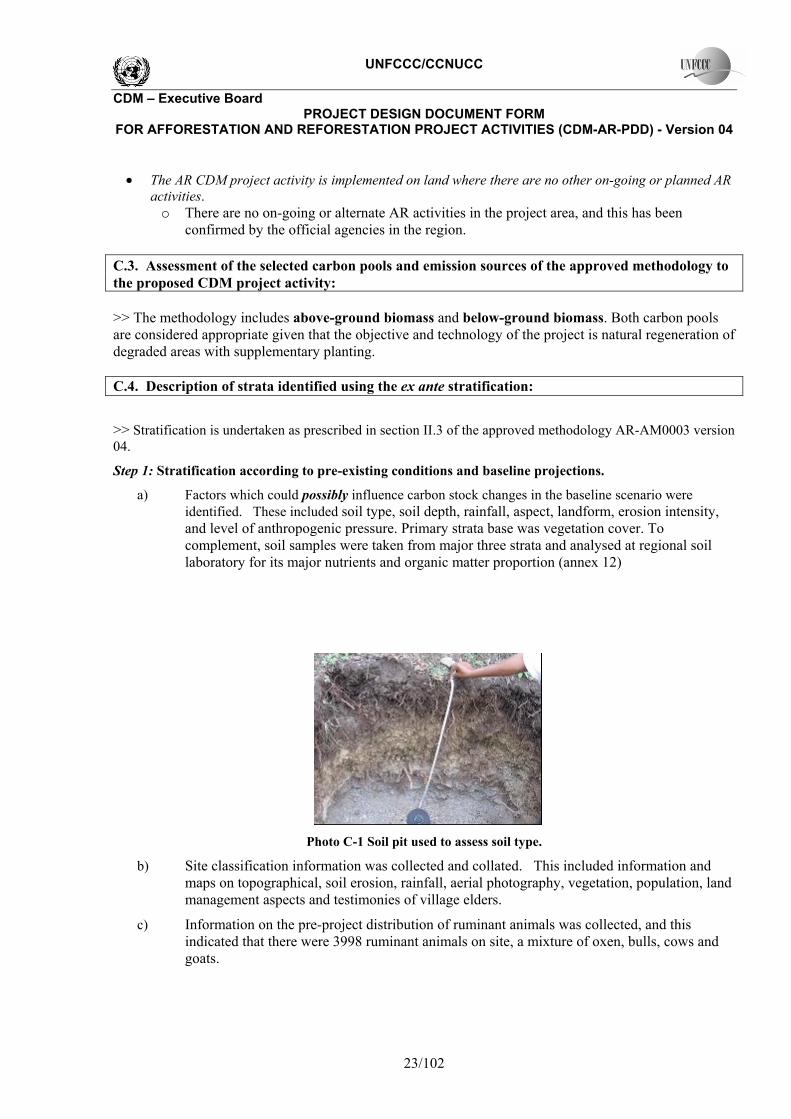
a) Factors which could possibly influence carbon stock changes in the baseline scenario were identified. These included soil type, soil depth, rainfall, aspect, landform, erosion intensity, and level of anthropogenic pressure. Primary strata base was vegetation cover. To complement, soil samples were taken from major three strata and analysed at regional soil laboratory for its major nutrients and organic matter proportion (annex 12)
Photo C-1 Soil pit used to assess soil type.
b) Site classification information was collected and collated. This included information and maps on topographical, soil erosion, rainfall, aerial photography, vegetation, population, land management aspects and testimonies of village elders.
c) Information on the pre-project distribution of ruminant animals was collected, and this indicated that there were 3998 ruminant animals on site, a mixture of oxen, bulls, cows and goats.
UNFCCC/CCNUCC
CDM � Executive Board PROJECT DESIGN DOCUMENT FORM
FOR AFFORESTATION AND REFORESTATION PROJECT ACTIVITIES (CDM-AR-PDD) - Version 04
24/102
d) A preliminary stratification showed that the anthropogenic pressure was a major factor influencing the baseline scenario, the details of which presented in section Annex 6, page 16.The information confirming anthropogenic pressure as a major factor influencing the baseline scenario in the preliminary stratification included:
a. Preliminary measurements of pre-existing biomass on the project site. These demonstrated that the project area was in a low carbon state, and activities such as charcoal burning indicated that this carbon state was slowly decreasing.
b. Discussions with elderly residents of the area to determine previous land use, and the extent to which anthropogenic pressures have fluctuated. The PRA confirmed unsustainable use as the single factor determining the baseline scenario (Annex 6).
c. Historical records to determine changes in land tenure and legal aspects of land use. The area has been �communal land� since 1972 reflecting the large anthropogenic pressure and absence of rational land use.
d. Events that had in the past led to deforestation. The overthrow of the emperor Haile Selassie and transition to a communist government saw a shift in land management in 1972 which has continued to the inception of this project.
e) For final baseline stratification, information collected from the above sources was analyzed. The project team considered the legal and political changes that occurred between 1972 and 1975 and the deforestation caused in the project area, and the land tenure system contributed to the significant anthropogenic pressure. Based on the information collated in the baseline stratification analysis
Anthropogenic pressure has been identified as the only major factor that has significant impact on the baseline scenario. Other factors such as terrain and slope also influence the areas. The anthropogenic pressure affects all land within the project sites and as a result, the baseline scenario is uniform across project sites, and the baseline scenario of degrading lands and the consequent loss of carbon is applicable to all project sites.
Based on the terrain, elevation, slope and location of the sites, we categorize the baseline into four strata.
Stratum 1: Southern most part of the project with few scattered trees. This area is the closest to Lake Abaya, and is at lower in elevation than the rest of the project strata.
Stratum 2: It is in two sites, a small site to the north of the project with the major part of the stratum lies between stratum 1 and stratum 3. It has scattered trees and grass cover and is the least undulating of the project strata.
Stratum 3: It has the largest area and accounts for about 40% of the project area. It has shrub growth and encompasses the southern sloping aspects.
Stratum 4: It is the northern most part of the project and has shrub vegetation on rocky hillsides, with a northerly aspect.
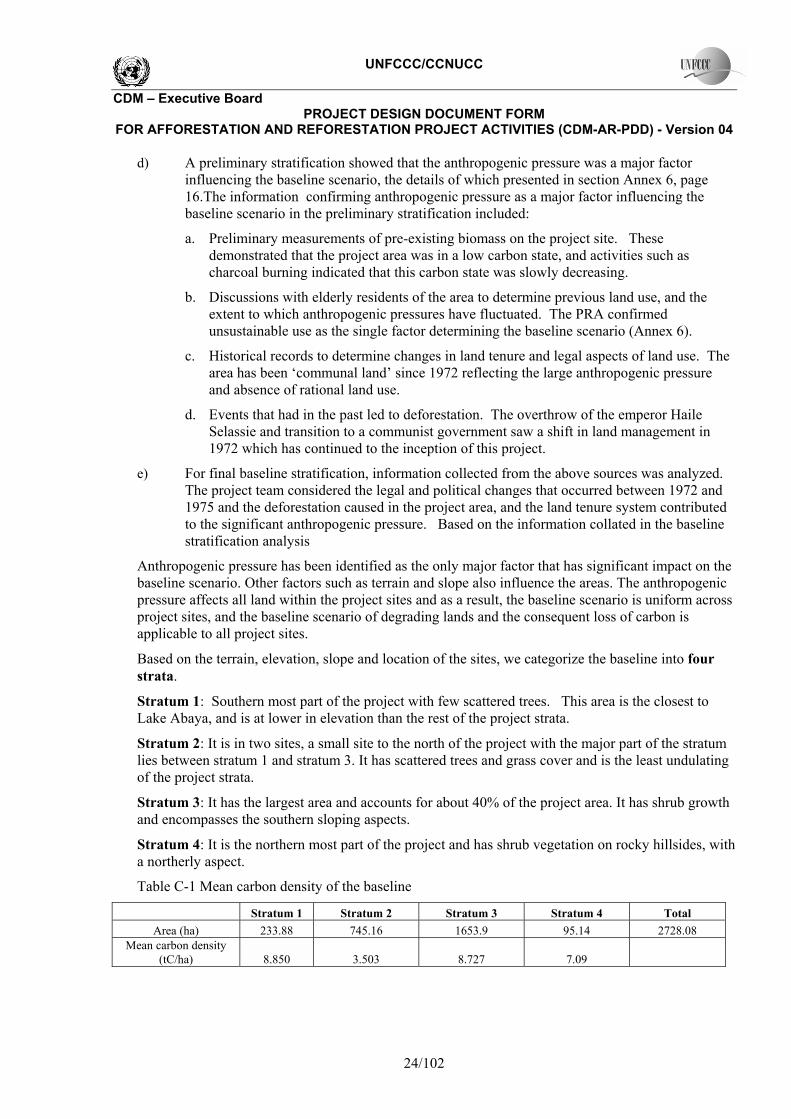
Table C-1 Mean carbon density of the baseline
Stratum 1 Stratum 2 Stratum 3 Stratum 4 Total Area (ha) 233.88 745.16 1653.9 95.14 2728.08
Mean carbon density (tC/ha)
8.850 3.503 8.727 7.09
UNFCCC/CCNUCC
CDM � Executive Board PROJECT DESIGN DOCUMENT FORM
FOR AFFORESTATION AND REFORESTATION PROJECT ACTIVITIES (CDM-AR-PDD) - Version 04
25/102
From the table C-1 it is clear that mean carbon density is very low or insignificant. Therefore in the absence of the project, the project sites will see a continuing net decrease in carbon stored in the above and below ground biomass. Therefore, baseline of declining carbon stock will be relevant to all strata. Analysis of the project sites determined that there is no possibility for establishment of natural regeneration in the baseline scenario due to anthropogenic pressure. As a consequence, baseline carbon stock change for all the sites in the baseline is assumed to be zero. Step 2: Stratification according to the planned AR CDM project activity:
For the purpose of the project, the four strata that are used to outline the baseline are used as a basis for stratifying into five (5) strata. The protection and management to promote natural regeneration of indigenous species is supported in stratum 1 to stratum 4 and planting of naturalized species such as Grevillea and Eucalyptus implemented in areas that do not natural vegetation is identified as stratum 5.
Stratum 1: Southern most part of the project with few scattered trees. This area is the closest to Lake Abaya, and is at lower in elevation than the rest of the project strata.
Stratum 2: It is in two sites, a small site to the north of the project with the major part of the stratum lies between stratum 1 and stratum 3. It has scattered trees and grass cover and is the least undulating of the project strata.
Stratum 3: It has the largest area and accounts for about 40% of the project area. It has shrub growth and encompasses the southern sloping aspects.
Stratum 4: It is the northern most part of the project and has shrub vegetation on rocky hillsides, with a northerly aspect.
Stratum 5: This stratum represents planting of mixed naturalized species � Eucalyptus and Grevillea on 500 ha of land that is identified as part of the baseline stratum 3 which has no pre-existing sprouts for natural regeneration.
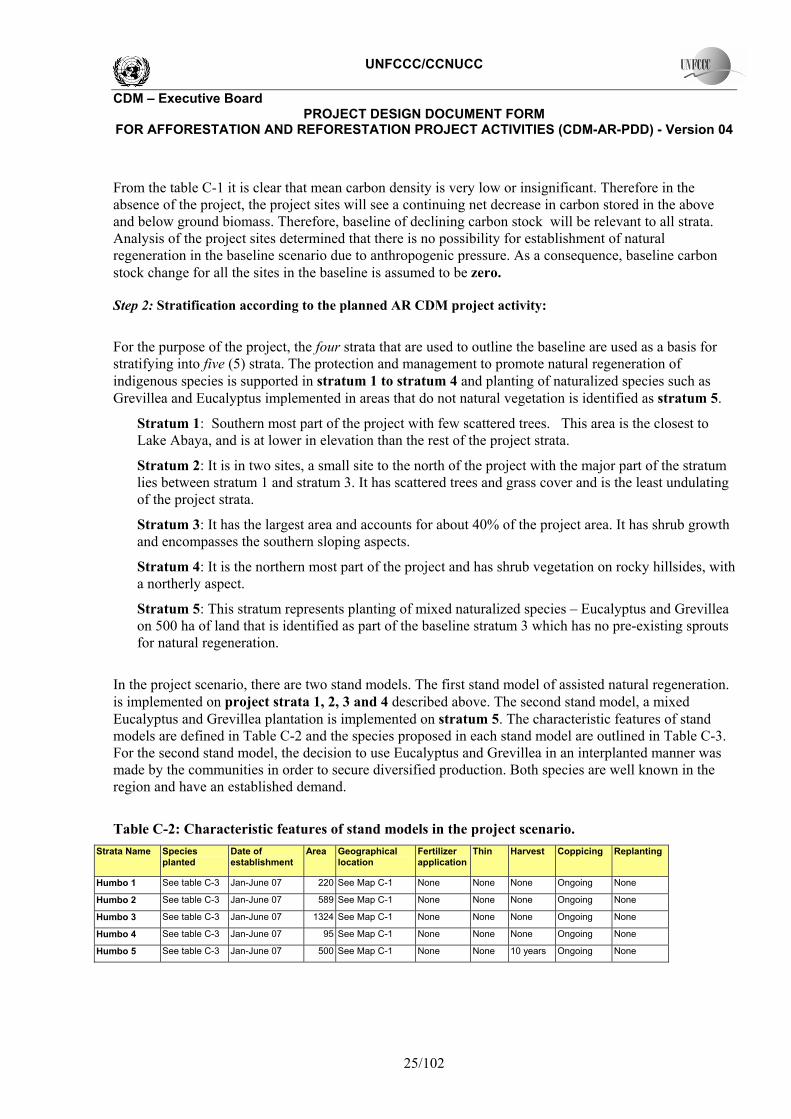
In the project scenario, there are two stand models. The first stand model of assisted natural regeneration. is implemented on project strata 1, 2, 3 and 4 described above. The second stand model, a mixed Eucalyptus and Grevillea plantation is implemented on stratum 5. The characteristic features of stand models are defined in Table C-2 and the species proposed in each stand model are outlined in Table C-3. For the second stand model, the decision to use Eucalyptus and Grevillea in an interplanted manner was made by the communities in order to secure diversified production. Both species are well known in the region and have an established demand.
Table C-2: Characteristic features of stand models in the project scenario. Strata Name Species
planted Date of establishment
Area Geographical location
Fertilizer application
Thin Harvest Coppicing Replanting
Humbo 1 See table C-3 Jan-June 07 220 See Map C-1 None None None Ongoing None
Humbo 2 See table C-3 Jan-June 07 589 See Map C-1 None None None Ongoing None
Humbo 3 See table C-3 Jan-June 07 1324 See Map C-1 None None None Ongoing None
Humbo 4 See table C-3 Jan-June 07 95 See Map C-1 None None None Ongoing None
Humbo 5 See table C-3 Jan-June 07 500 See Map C-1 None None 10 years Ongoing None
UNFCCC/CCNUCC
CDM � Executive Board PROJECT DESIGN DOCUMENT FORM
FOR AFFORESTATION AND REFORESTATION PROJECT ACTIVITIES (CDM-AR-PDD) - Version 04
26/102
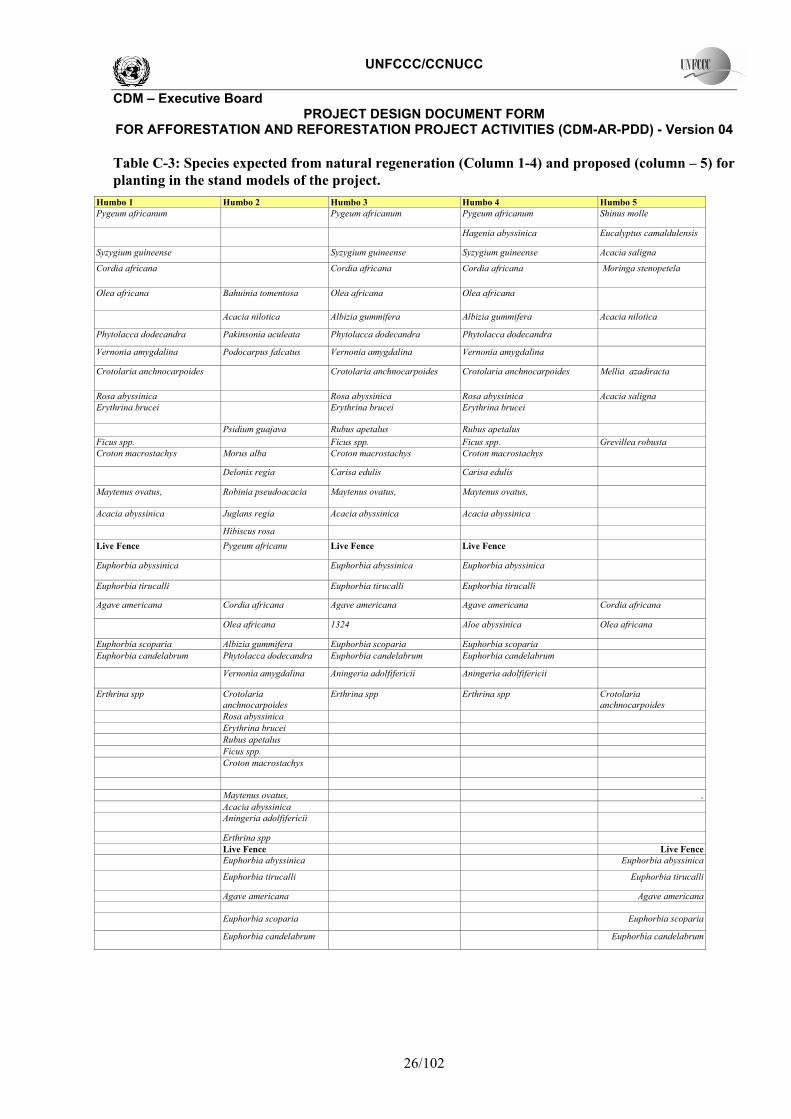
Table C-3: Species expected from natural regeneration (Column 1-4) and proposed (column � 5) for planting in the stand models of the project.
Humbo 1 Humbo 2 Humbo 3 Humbo 4 Humbo 5 Pygeum africanum Pygeum africanum Pygeum africanum Shinus molle
Hagenia abyssinica Eucalyptus camaldulensis
Syzygium guineense Syzygium guineense Syzygium guineense Acacia saligna
Cordia africana Cordia africana Cordia africana Moringa stenopetela
Olea africana Bahuinia tomentosa Olea africana Olea africana
Acacia nilotica Albizia gummifera Albizia gummifera Acacia nilotica
Phytolacca dodecandra Pakinsonia aculeata Phytolacca dodecandra Phytolacca dodecandra
Vernonia amygdalina Podocarpus falcatus Vernonia amygdalina Vernonia amygdalina
Crotolaria anchnocarpoides Crotolaria anchnocarpoides Crotolaria anchnocarpoides Mellia azadiracta
Rosa abyssinica Rosa abyssinica Rosa abyssinica Acacia saligna Erythrina brucei Erythrina brucei Erythrina brucei
Psidium guajava Rubus apetalus Rubus apetalus Ficus spp. Ficus spp. Ficus spp. Grevillea robusta Croton macrostachys Morus alba Croton macrostachys Croton macrostachys
Delonix regia Carisa edulis Carisa edulis
Maytenus ovatus, Robinia pseudoacacia Maytenus ovatus, Maytenus ovatus,
Acacia abyssinica Juglans regia Acacia abyssinica Acacia abyssinica
Hibiscus rosa Live Fence Pygeum africanu Live Fence Live Fence
Euphorbia abyssinica Euphorbia abyssinica Euphorbia abyssinica
Euphorbia tirucalli Euphorbia tirucalli Euphorbia tirucalli
Agave americana Cordia africana Agave americana Agave americana Cordia africana
Olea africana 1324 Aloe abyssinica Olea africana
Euphorbia scoparia Albizia gummifera Euphorbia scoparia Euphorbia scoparia Euphorbia candelabrum Phytolacca dodecandra Euphorbia candelabrum Euphorbia candelabrum
Vernonia amygdalina Aningeria adolfifericii Aningeria adolfifericii
Erthrina spp Crotolaria anchnocarpoides
Erthrina spp Erthrina spp Crotolaria anchnocarpoides
Rosa abyssinica Erythrina brucei Rubus apetalus Ficus spp. Croton macrostachys
Maytenus ovatus, , Acacia abyssinica Aningeria adolfifericii
Erthrina spp Live Fence Live Fence Euphorbia abyssinica Euphorbia abyssinica
Euphorbia tirucalli Euphorbia tirucalli
Agave americana Agave americana Euphorbia scoparia Euphorbia scoparia
Euphorbia candelabrum Euphorbia candelabrum
UNFCCC/CCNUCC
CDM � Executive Board PROJECT DESIGN DOCUMENT FORM
FOR AFFORESTATION AND REFORESTATION PROJECT ACTIVITIES (CDM-AR-PDD) - Version 04
27/102
Note: Species described under Humbo 5 are plantations over gap areas of strata 1, 2 & 3. While the other columns are species expected to regenerate naturally and already done so.
Step 3: Final ex-ante stratification:
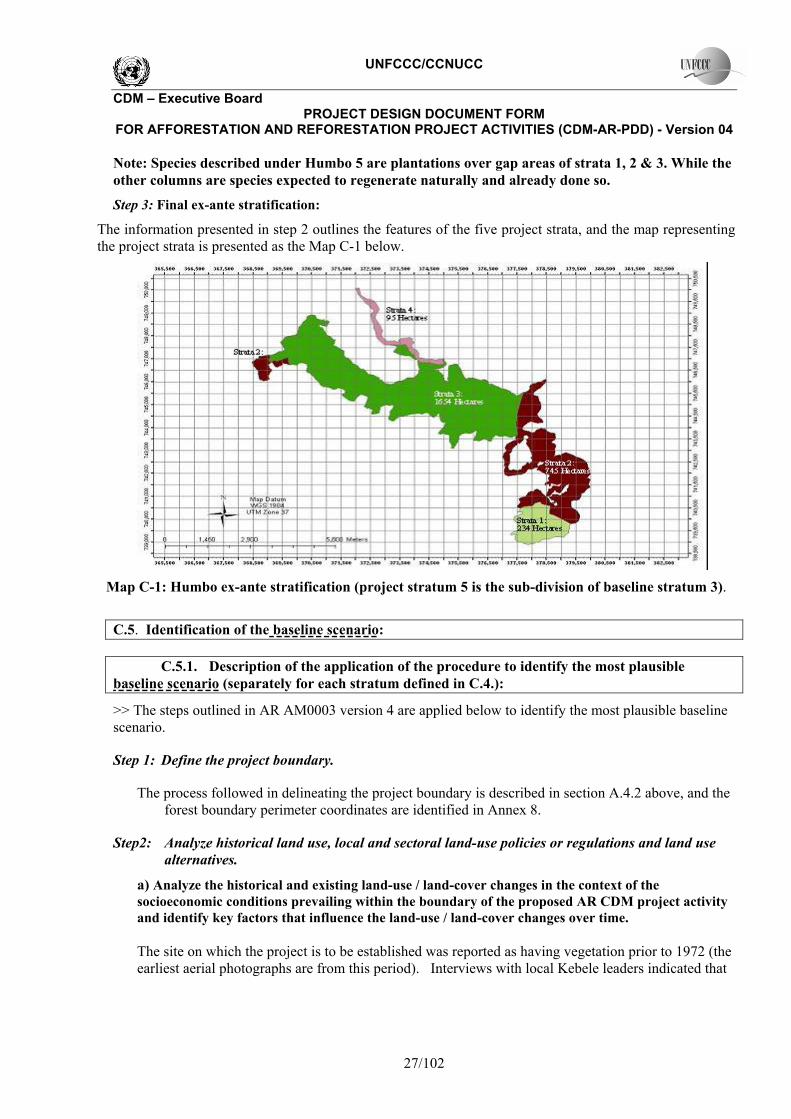
The information presented in step 2 outlines the features of the five project strata, and the map representing the project strata is presented as the Map C-1 below.
Map C-1: Humbo ex-ante stratification (project stratum 5 is the sub-division of baseline stratum 3).
C.5. Identification of the baseline scenario:
C.5.1. Description of the application of the procedure to identify the most plausible baseline scenario (separately for each stratum defined in C.4.):
>> The steps outlined in AR AM0003 version 4 are applied below to identify the most plausible baseline scenario.
Step 1: Define the project boundary.
The process followed in delineating the project boundary is described in section A.4.2 above, and the forest boundary perimeter coordinates are identified in Annex 8.
Step2: Analyze historical land use, local and sectoral land-use policies or regulations and land use alternatives.
a) Analyze the historical and existing land-use / land-cover changes in the context of the socioeconomic conditions prevailing within the boundary of the proposed AR CDM project activity and identify key factors that influence the land-use / land-cover changes over time.
The site on which the project is to be established was reported as having vegetation prior to 1972 (the earliest aerial photographs are from this period). Interviews with local Kebele leaders indicated that

UNFCCC/CCNUCC
CDM � Executive Board PROJECT DESIGN DOCUMENT FORM
FOR AFFORESTATION AND REFORESTATION PROJECT ACTIVITIES (CDM-AR-PDD) - Version 04
28/102
the area was cleared between 1975 and 1985 and was subjected to severe soil erosion. The following aerial photographs taken in 1973 seem to demonstrate that at this point in time, the area had been substantially cleared and could not be considered a forest. The evidence from aerial photographs of the project area in 1973 and 1979 does not clearly indicate that the area was subjected to deforestation, although the project site in 1973 does appear to demonstrate that the project area has minimal vegetation.
Photo C-3 Humbo Site 1973.
Photo C-4 Humbo Site 1973 enlargement.
See photo C-4
UNFCCC/CCNUCC
CDM � Executive Board PROJECT DESIGN DOCUMENT FORM
FOR AFFORESTATION AND REFORESTATION PROJECT ACTIVITIES (CDM-AR-PDD) - Version 04
29/102
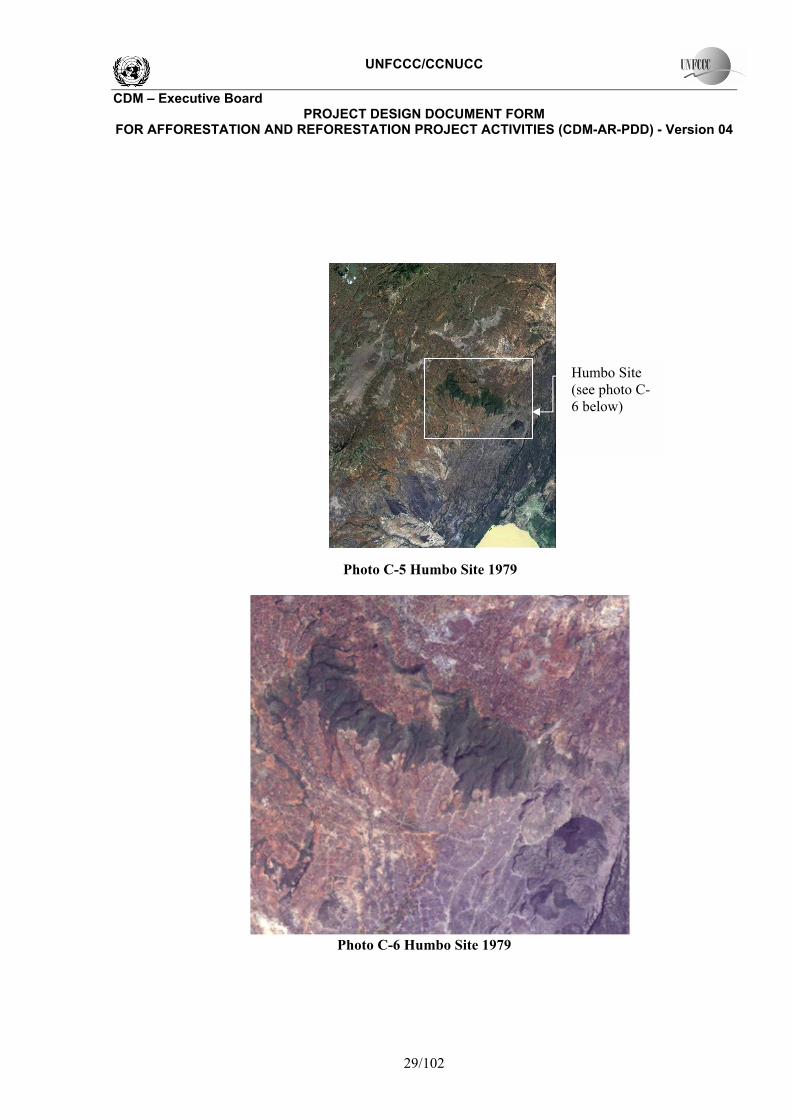
Photo C-5 Humbo Site 1979
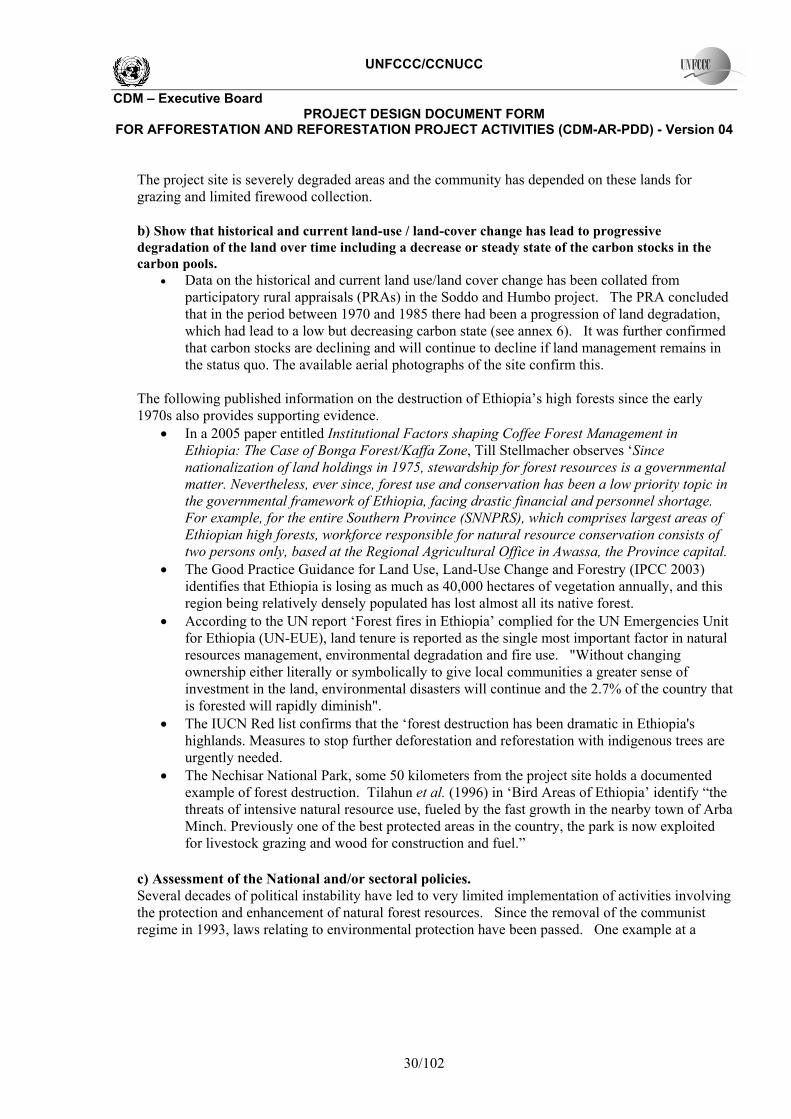
Photo C-6 Humbo Site 1979
Humbo Site (see photo C-6 below)
UNFCCC/CCNUCC
CDM � Executive Board PROJECT DESIGN DOCUMENT FORM
FOR AFFORESTATION AND REFORESTATION PROJECT ACTIVITIES (CDM-AR-PDD) - Version 04
30/102
The project site is severely degraded areas and the community has depended on these lands for grazing and limited firewood collection.
b) Show that historical and current land-use / land-cover change has lead to progressive degradation of the land over time including a decrease or steady state of the carbon stocks in the carbon pools.
• Data on the historical and current land use/land cover change has been collated from participatory rural appraisals (PRAs) in the Soddo and Humbo project. The PRA concluded that in the period between 1970 and 1985 there had been a progression of land degradation, which had lead to a low but decreasing carbon state (see annex 6). It was further confirmed that carbon stocks are declining and will continue to decline if land management remains in the status quo. The available aerial photographs of the site confirm this.
The following published information on the destruction of Ethiopia�s high forests since the early 1970s also provides supporting evidence.
• In a 2005 paper entitled Institutional Factors shaping Coffee Forest Management in Ethiopia: The Case of Bonga Forest/Kaffa Zone, Till Stellmacher observes �Since nationalization of land holdings in 1975, stewardship for forest resources is a governmental matter. Nevertheless, ever since, forest use and conservation has been a low priority topic in the governmental framework of Ethiopia, facing drastic financial and personnel shortage. For example, for the entire Southern Province (SNNPRS), which comprises largest areas of Ethiopian high forests, workforce responsible for natural resource conservation consists of two persons only, based at the Regional Agricultural Office in Awassa, the Province capital.
• The Good Practice Guidance for Land Use, Land-Use Change and Forestry (IPCC 2003) identifies that Ethiopia is losing as much as 40,000 hectares of vegetation annually, and this region being relatively densely populated has lost almost all its native forest.
• According to the UN report �Forest fires in Ethiopia� complied for the UN Emergencies Unit for Ethiopia (UN-EUE), land tenure is reported as the single most important factor in natural resources management, environmental degradation and fire use. "Without changing ownership either literally or symbolically to give local communities a greater sense of investment in the land, environmental disasters will continue and the 2.7% of the country that is forested will rapidly diminish".
• The IUCN Red list confirms that the �forest destruction has been dramatic in Ethiopia's highlands. Measures to stop further deforestation and reforestation with indigenous trees are urgently needed.
• The Nechisar National Park, some 50 kilometers from the project site holds a documented example of forest destruction. Tilahun et al. (1996) in �Bird Areas of Ethiopia� identify �the threats of intensive natural resource use, fueled by the fast growth in the nearby town of Arba Minch. Previously one of the best protected areas in the country, the park is now exploited for livestock grazing and wood for construction and fuel.�
c) Assessment of the National and/or sectoral policies. Several decades of political instability have led to very limited implementation of activities involving the protection and enhancement of natural forest resources. Since the removal of the communist regime in 1993, laws relating to environmental protection have been passed. One example at a
UNFCCC/CCNUCC
CDM � Executive Board PROJECT DESIGN DOCUMENT FORM
FOR AFFORESTATION AND REFORESTATION PROJECT ACTIVITIES (CDM-AR-PDD) - Version 04
31/102
federal level is the establishment of an Environmental Protection Organs Proclamation19 governing environmental regulations, and overseeing the targeted increase in Ethiopia�s forest cover. While biodiversity preservation and enhancement are broad governmental objectives, these objectives are neither binding nor enforced (Stellmacher 2005 (page 5) documents this in the proceedings of the International Trade and the Protection of Natural Resources in Ethiopia Conference, 2005, hosted by the German Ethiopian Association). Government resources are prioritized on the more pressing domestic issues of food security and national economic development, prohibiting widespread investment in biodiversity enhancement and protection in areas such as Humbo. It has been identified that despite laws prohibiting clearing, this practice continues in Ethiopia to this day. Ethiopia�s total forest cover is being reduced by between 40,000 and 140,000 hectares annually20,21. It is clear that in the absence of the proposed A/R project this area will not be reforested, and the current degrading land management regime will continue. d) Identify alternative land uses including alternative future public or private activities on the degraded lands including any similar AR activity or any other feasible land development activities, that are not in contradiction with the identified local, national or sectoral land-use policies and regulations and that could be implemented within the boundary of the proposed AR CDM project activity. In doing so, use land records, field surveys, data and feedback from stakeholders, and other appropriate sources. Given the topography and the obvious soil degradation problems on the site, the only alternative land use to the proposed A/R project is a continuation of the current management regime, leading to further land and biodiversity degradation. e) Demonstrate that the land use change/cover would either not change, or would lead to further degradation and carbon stock decrease in the absence of the proposed project activity. Given that there are no suitable alternate land uses aside from the proposed project activity, the land would continue to be managed in the current manner, and carbon stocks would continue to decline. Significant technical, land title, and financial barriers prohibit the transformation of lands from the current land use to the proposed alternate land management regime. The most significant of these barriers includes the divulging of user rights to the appropriate community groups, the education in the FMNR techniques, and the costs associated with these activities.
Step 3: Stratification of the A/R CDM project area The AR CDM Project area has been stratified, and ex-ante stratification is described in section C.4.
C.5.2. Description of the identified baseline scenario (separately for each stratum defined in Section C.4.): >> Step 4. Determination of baseline scenario for each stratum As the baseline scenario is not likely to change from their current status of degraded and subject to further degradation. The baseline is identified as the continuation of the pre-project land use.
19 Proclamation No 295/2002 Federal Democratic Republic of Ethiopia 20 GPG for LULUCF projects, IPCC 21 National Meterological Services Agency Initial National Communication of Ethiopia to the United Nations Framework Convention on Climate Change (UNFCCC )June 2001
UNFCCC/CCNUCC
CDM � Executive Board PROJECT DESIGN DOCUMENT FORM
FOR AFFORESTATION AND REFORESTATION PROJECT ACTIVITIES (CDM-AR-PDD) - Version 04
32/102
The carbon stocks in all the baseline strata are in a state of continued decline. This conclusion is justified in sections A.4.2, A.6, A.7, and C.2, as well as in field survey assessments. There is no possibility for the establishment of natural regeneration in the baseline scenario due to anthropogenic pressures. In the absence of the project, each stratum will see a net decrease in carbon stored above and below ground biomass. However to be conservative, baseline assessment considered the changes in carbon stocks of few isolated standing trees in each baseline strata (this scenario is very conservative as it much more likely the existing vegetation would be cleared in the baseline scenario), and accounted in the calculation of the baseline GHG removals by sinks. C.6. Assessment and demonstration of additionality: >> The version 02 of the Tool for the Demonstration and Assessment of Additionality in A/R CDM Project Activities is used to demonstrate the additionality of the project below. STEP 0: Preliminary screening based on the starting date of the project activity The starting date of the project is 1 December 2006. The following table demonstrates the progression of the project. Event Date Tony Rinaudo and Paul Dettmann, World Vision communicate on the opportunities in Carbon Sequestration for World Vision
July 2004
Paul Dettmann recommends a CDM project be undertaken in a World Vision partner country
August 2004
Ethiopia is selected as candidate country August 2004 Tony Rinaudo and Paul Dettmann visit Humbo ADP in Ethiopia to identify suitable project
October 2004
Project site identified October 2004 PIN completed for Humbo site (available upon request) April 2005 PIN Submitted to BioCarbon Fund May 2005 BioCarbon Fund requests Carbon Finance Document June 2005 Carbon Finance Document completed (available upon request) July 2005 World Bank pre-feasibility assessment January 2006 Inclusion of project in to BioCarbon Fund February 2006 PDD initiated March 2006 Project inception December 2006 PDD Completion and submission to validation August 2008 STEP 1: Identification of alternatives to the project activity consistent with current laws and regulations Sub-step 1a: Define alternatives to the project activity
The alternative activities relevant to this project include:
• Continuation of the current land use activity, grazing and fuelwood collection.
UNFCCC/CCNUCC
CDM � Executive Board PROJECT DESIGN DOCUMENT FORM
FOR AFFORESTATION AND REFORESTATION PROJECT ACTIVITIES (CDM-AR-PDD) - Version 04
33/102
• Assisted regeneration and reforestation of the land in the project boundary performed without being registered as the A/R CDM project activity
• Commercial timber production
Sub-step 1b. Enforcement of applicable laws and regulations The Ethiopian government has identified its desire to see afforestation/reforestation works extended, however, specific regulation supporting the implementation of such projects is not available. Funds for this activity are severely limited and very little forestry related resources are available in the Humbo Woreda. The baseline scenario is compliant with all Ethiopian legal and regulatory requirements, and this situation is not likely to change. STEP 2: Investment analysis Not undertaken for this project.
STEP 3: Barrier analysis Sub-step 3a: Identify barriers proposed project activity: This project faces following barriers, which prohibit it from getting implemented in the absence of income derived from the sale of carbon credits. These barriers are: a) Investment barriers This project faces investment barriers, which prohibit its implementation without income derived from the sale of carbon credits. Firstly, the costs of nursery establishment and of implementing a training program among the forest users regarding the implementation of FMNR are significant. In order to precipitate this carbon project, World Vision Australia has committed US$103,700 over three years for nursery establishment and management, as well as US$ 39,550 over three years for forest management training, and $138,600 over three years for project related staff costs. In addition, the costs of establishing the legal and socio-economic framework for the efficient running of the seven community cooperatives have been significant (over US$11,000) and it would not be possible without the possibility of revenue provided by carbon finance to establish these institutions. The communities of Humbo are particularly poor, with the average per capita income in this Woreda was less that $100 per year in 200322. It is therefore not possible that these costs could be borne by the communities financed by a system of royalties from increased forest production. Sources of commercial finance have been considered, but banks have formally rejected the request23. The Ethiopian government has expressed its desire to see revegetation works extended, however this is unlikely to as funds for forestry activities are severely limited, and very little forestry related resources are available in Ethiopia and specifically in the Humbo Woreda. The project team discussed the possibility of project finance with various financial institutions, and the project could not secure commercial project finance. To illustrate this, a statement from United Bank S.C., Ethiopia, is provided in Annex 12, stating that such project cannot receive bank loan financing. The revenue from sale of CERs would partially support the costs of implementing the project. Considering the lack of alternative sources to fund the project, the project costs can not be met without the revenue from the sale of CERs, which would only be possible as a registered CDM project. Therefore,
22 SNNPR statistics department, Regional basic Socio-economic and Demographic Information, 2003 23 See Annex 12.

UNFCCC/CCNUCC
CDM � Executive Board PROJECT DESIGN DOCUMENT FORM
FOR AFFORESTATION AND REFORESTATION PROJECT ACTIVITIES (CDM-AR-PDD) - Version 04
34/102
registration of this project as a CDM activity would facilitate in partially overcoming the investment barriers. b) Lack of organisation of local communities Despite the environmental needs of the Humbo Woreda (district), there has been no institution with requisite capacity to implement a program of forest restoration on the proposed project sites. The Woreda level government forestry department indicated that its financial resources and local technical extension resources are extremely limited, and it therefore could not develop the project without assistance. In the absence of financial resources and capacity of local institutions, the restoration of these areas could not occur. c) Barriers related to prevailing practice The unsustainable use of communal lands is a major cause of forest loss in the region. This project is a first of its kind in the country (using a forest cooperative to restore native forest), which seeks to demonstrate that protecting highly degraded land against over-grazing would lead to regrowth of forest biomass without the need to make costly investment in planting. Through implementation of this CDM project, the above barrier was overcome. d) Barriers relating to land tenure, ownership, inheritance and property rights Prior to the implementation of the project area, the area had been categorised as �communal� land. Within Ethiopia, communal lands have no specific land management rights associated to any individuals or communities. Due to the fact that this project was specifically identified as for carbon sequestration, the government was willing to allocate user rights (a form of land tenure delivering management and forest product rights) to the community (through the forest cooperative). As a CDM project, the above barrier was overcome. e) First of a kind project There have not been projects similar to this project implemented in Ethiopia. At the inception of the project, staff sought to gain insight from other projects with similar attributes. The Dodolla participatory forest management project, located at Adaba-Dodolla north-east of Shashamane is a project developed to protect an existing Juniper forest is not a forest restoration project. As no other project has been implemented with the objective of establishing a forest through assisted natural regeneration, this project can be considered as the first of a kind project. As a consequence, this project needs to significant barriers in the establishment, implementation and monitoring phase. Sub-step 3b: Show that the identified barriers would not prevent the implementation of at least one of the alternatives (except the proposed project activity). The only identified alternative to the project is continuation of the pre-project land use (continuing degradation as communal land). This activity does not face the above-mentioned barriers. Given that the status quo of continuing degradation as communal land for the past three decades, the above-mentioned barriers do not prohibit the land use that results in continued degradation. STEP 4. Common practice analysis
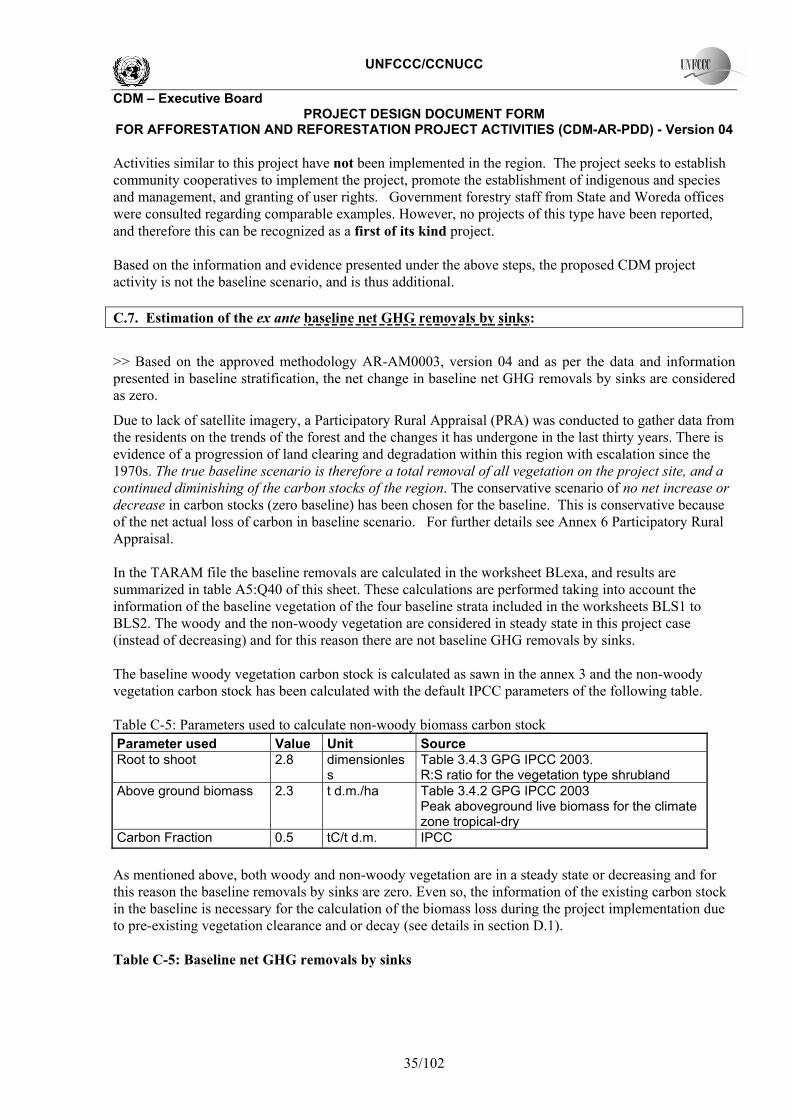
UNFCCC/CCNUCC
CDM � Executive Board PROJECT DESIGN DOCUMENT FORM
FOR AFFORESTATION AND REFORESTATION PROJECT ACTIVITIES (CDM-AR-PDD) - Version 04
35/102
Activities similar to this project have not been implemented in the region. The project seeks to establish community cooperatives to implement the project, promote the establishment of indigenous and species and management, and granting of user rights. Government forestry staff from State and Woreda offices were consulted regarding comparable examples. However, no projects of this type have been reported, and therefore this can be recognized as a first of its kind project. Based on the information and evidence presented under the above steps, the proposed CDM project activity is not the baseline scenario, and is thus additional. C.7. Estimation of the ex ante baseline net GHG removals by sinks:
>> Based on the approved methodology AR-AM0003, version 04 and as per the data and information presented in baseline stratification, the net change in baseline net GHG removals by sinks are considered as zero.
Due to lack of satellite imagery, a Participatory Rural Appraisal (PRA) was conducted to gather data from the residents on the trends of the forest and the changes it has undergone in the last thirty years. There is evidence of a progression of land clearing and degradation within this region with escalation since the 1970s. The true baseline scenario is therefore a total removal of all vegetation on the project site, and a continued diminishing of the carbon stocks of the region. The conservative scenario of no net increase or decrease in carbon stocks (zero baseline) has been chosen for the baseline. This is conservative because of the net actual loss of carbon in baseline scenario. For further details see Annex 6 Participatory Rural Appraisal. In the TARAM file the baseline removals are calculated in the worksheet BLexa, and results are summarized in table A5:Q40 of this sheet. These calculations are performed taking into account the information of the baseline vegetation of the four baseline strata included in the worksheets BLS1 to BLS2. The woody and the non-woody vegetation are considered in steady state in this project case (instead of decreasing) and for this reason there are not baseline GHG removals by sinks. The baseline woody vegetation carbon stock is calculated as sawn in the annex 3 and the non-woody vegetation carbon stock has been calculated with the default IPCC parameters of the following table. Table C-5: Parameters used to calculate non-woody biomass carbon stock Parameter used Value Unit Source Root to shoot 2.8 dimensionles
s Table 3.4.3 GPG IPCC 2003. R:S ratio for the vegetation type shrubland
Above ground biomass 2.3 t d.m./ha Table 3.4.2 GPG IPCC 2003 Peak aboveground live biomass for the climate zone tropical-dry
Carbon Fraction 0.5 tC/t d.m. IPCC As mentioned above, both woody and non-woody vegetation are in a steady state or decreasing and for this reason the baseline removals by sinks are zero. Even so, the information of the existing carbon stock in the baseline is necessary for the calculation of the biomass loss during the project implementation due to pre-existing vegetation clearance and or decay (see details in section D.1). Table C-5: Baseline net GHG removals by sinks
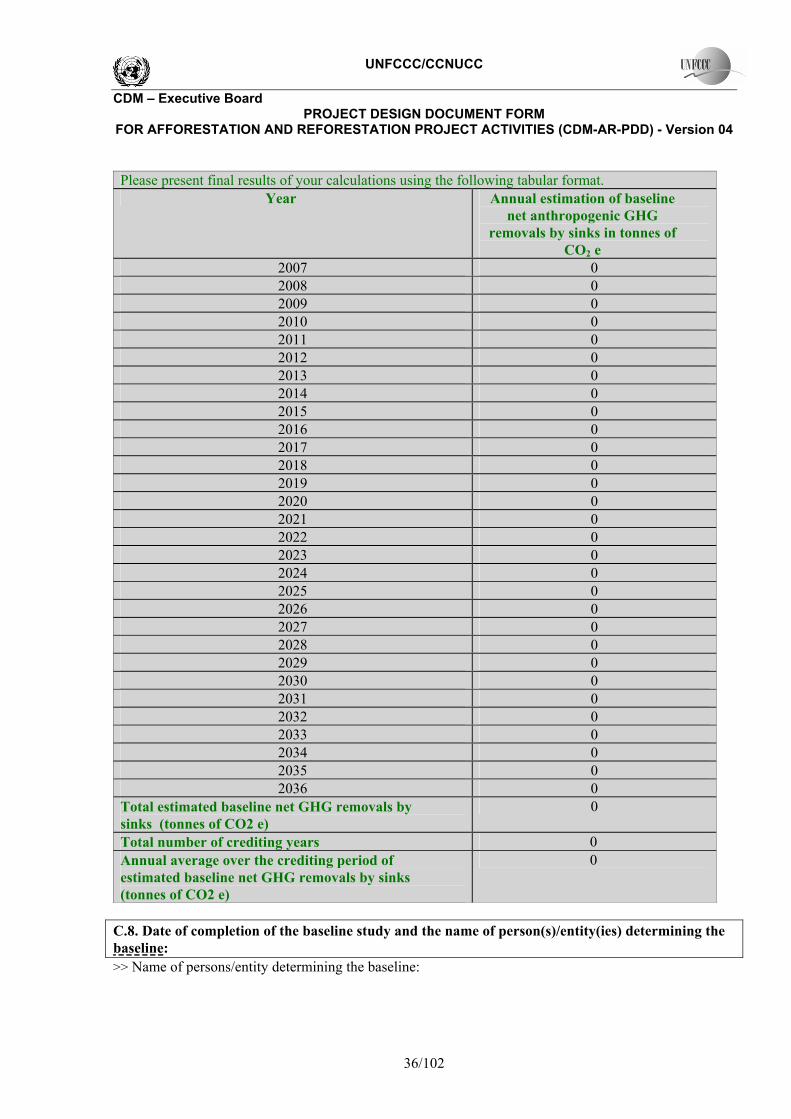
UNFCCC/CCNUCC
CDM � Executive Board PROJECT DESIGN DOCUMENT FORM
FOR AFFORESTATION AND REFORESTATION PROJECT ACTIVITIES (CDM-AR-PDD) - Version 04
36/102
Please present final results of your calculations using the following tabular format.
Year Annual estimation of baseline net anthropogenic GHG
removals by sinks in tonnes of CO2 e
2007 0 2008 0 2009 0 2010 0 2011 0 2012 0 2013 0 2014 0 2015 0 2016 0 2017 0 2018 0 2019 0 2020 0 2021 0 2022 0 2023 0 2024 0 2025 0 2026 0 2027 0 2028 0 2029 0 2030 0 2031 0 2032 0 2033 0 2034 0 2035 0 2036 0
Total estimated baseline net GHG removals by sinks (tonnes of CO2 e)
0
Total number of crediting years 0 Annual average over the crediting period of estimated baseline net GHG removals by sinks (tonnes of CO2 e)
0
C.8. Date of completion of the baseline study and the name of person(s)/entity(ies) determining the baseline: >> Name of persons/entity determining the baseline:
UNFCCC/CCNUCC
CDM � Executive Board PROJECT DESIGN DOCUMENT FORM
FOR AFFORESTATION AND REFORESTATION PROJECT ACTIVITIES (CDM-AR-PDD) - Version 04
37/102
• World Vision Forestry Ethiopia o Asfaw Mariane ([email protected])
• World Vision Ethiopia, Land Resource Management o Hailu Tefera Ayele ([email protected])
• World Vision Ethiopia o Assefa Tofu Chofore ([email protected])
With assistance from consultants: • Ethiopian Forestry Department
o Dr. Deribe Gurmu ( [email protected] )
• Joanneum Research, Austria
o Dr. Bernhard Schlamadinger • Greenhouse Balanced
o Paul Dettmann ([email protected] ) SECTION D. Estimation of ex ante actual net GHG removals by sinks, leakage and estimated amount of net anthropogenic GHG removals by sinks over the chosen crediting period D.1. Estimate of the ex ante actual net GHG removals by sinks: >> Estimation of actual changes in living biomass carbon stocks in the project scenario (section 7.1 of AR-AM0003 version 04) A. Treatment of pre-existing non-tree and tree vegetation The pre-existing tree vegetation will be left standing and thus there is not biomass stock change due to the clearance of this type of vegetation. In TARAM the results of the biomass stock change due to the clearance of tree vegetation are in the worksheet Aexa table F29:I62 and are based on the information of the pre-existing woody vegetation per baseline stratum in the BLS sheets and in the type of treatment of this vegetation per stand model in SM1 and SM2 cells C10, C11 and C12. As in this project case the trees are left standing (Cell C10=100%) the biomass stock change is zero. In accordance with the methodology AR-AM0003 version 4, Section 7.1, it can be estimated that carbon stocks are not significant, which may be reflected in two situations. One of which is, carbon stocks of pre-existing vegetation are not included in the carbon stock changes (project or actual removals) regardless of pre-existing vegetation is standing or harvested. In the context of this project, the above statement indicates that pre-existing vegetation is part of the baseline, therefore, it is not included in the actual (project) removals. As presented in the baseline information in Annex 3, the carbon stock of preexisting vegetation is 3.5 tons to 8.85 tons, which is insignificant, and not relevant for the calculation of actual removals. In the case of the non-tree vegetation, as mentioned in the 15th page of the methodology (4th paragraph), All existing non-tree vegetation is assumed to disappear in the year of site preparation because of biomass clearance, disturbance or future competition from planted trees. This is a conservative assumption because there will be some non-tree vegetation in the project scenario. TARAM calculates this biomass loss using equation 14 of the methodology in the worksheet Aexa table N29:Q62. These calculations are based on the biomass stock and parameters provided in the baseline strata�s worksheets (BLS 1 to BLS4; cells C15 to C17). TARAM calculates Ebiomassloss in Aexa with this stock information, with the project planting plan (Table D-2 and TARAM; sheet AR-Plan) and with the type of treatment (burned or not
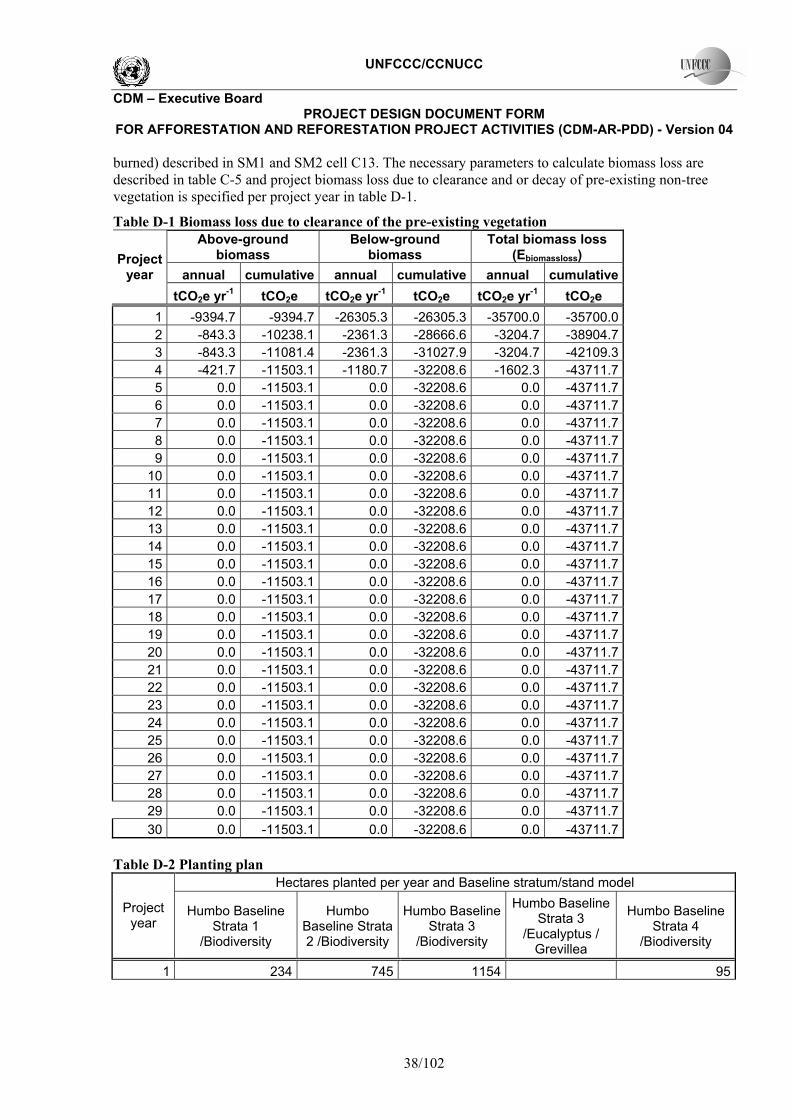
UNFCCC/CCNUCC
CDM � Executive Board PROJECT DESIGN DOCUMENT FORM
FOR AFFORESTATION AND REFORESTATION PROJECT ACTIVITIES (CDM-AR-PDD) - Version 04
38/102
burned) described in SM1 and SM2 cell C13. The necessary parameters to calculate biomass loss are described in table C-5 and project biomass loss due to clearance and or decay of pre-existing non-tree vegetation is specified per project year in table D-1.
Table D-1 Biomass loss due to clearance of the pre-existing vegetation Above-ground
biomass Below-ground
biomass Total biomass loss
(Ebiomassloss) annual cumulative annual cumulative annual cumulative
Project year
tCO2e yr-1 tCO2e tCO2e yr-1 tCO2e tCO2e yr-1 tCO2e 1 -9394.7 -9394.7 -26305.3 -26305.3 -35700.0 -35700.0 2 -843.3 -10238.1 -2361.3 -28666.6 -3204.7 -38904.7 3 -843.3 -11081.4 -2361.3 -31027.9 -3204.7 -42109.3 4 -421.7 -11503.1 -1180.7 -32208.6 -1602.3 -43711.7 5 0.0 -11503.1 0.0 -32208.6 0.0 -43711.7 6 0.0 -11503.1 0.0 -32208.6 0.0 -43711.7 7 0.0 -11503.1 0.0 -32208.6 0.0 -43711.7 8 0.0 -11503.1 0.0 -32208.6 0.0 -43711.7 9 0.0 -11503.1 0.0 -32208.6 0.0 -43711.7
10 0.0 -11503.1 0.0 -32208.6 0.0 -43711.7 11 0.0 -11503.1 0.0 -32208.6 0.0 -43711.7 12 0.0 -11503.1 0.0 -32208.6 0.0 -43711.7 13 0.0 -11503.1 0.0 -32208.6 0.0 -43711.7 14 0.0 -11503.1 0.0 -32208.6 0.0 -43711.7 15 0.0 -11503.1 0.0 -32208.6 0.0 -43711.7 16 0.0 -11503.1 0.0 -32208.6 0.0 -43711.7 17 0.0 -11503.1 0.0 -32208.6 0.0 -43711.7 18 0.0 -11503.1 0.0 -32208.6 0.0 -43711.7 19 0.0 -11503.1 0.0 -32208.6 0.0 -43711.7 20 0.0 -11503.1 0.0 -32208.6 0.0 -43711.7 21 0.0 -11503.1 0.0 -32208.6 0.0 -43711.7 22 0.0 -11503.1 0.0 -32208.6 0.0 -43711.7 23 0.0 -11503.1 0.0 -32208.6 0.0 -43711.7 24 0.0 -11503.1 0.0 -32208.6 0.0 -43711.7 25 0.0 -11503.1 0.0 -32208.6 0.0 -43711.7 26 0.0 -11503.1 0.0 -32208.6 0.0 -43711.7 27 0.0 -11503.1 0.0 -32208.6 0.0 -43711.7 28 0.0 -11503.1 0.0 -32208.6 0.0 -43711.7 29 0.0 -11503.1 0.0 -32208.6 0.0 -43711.7 30 0.0 -11503.1 0.0 -32208.6 0.0 -43711.7
Table D-2 Planting plan
Hectares planted per year and Baseline stratum/stand model
Project year
Humbo Baseline Strata 1
/Biodiversity
Humbo Baseline Strata 2 /Biodiversity
Humbo Baseline Strata 3
/Biodiversity
Humbo Baseline Strata 3
/Eucalyptus / Grevillea
Humbo Baseline Strata 4
/Biodiversity
1 234 745 1154 95

UNFCCC/CCNUCC
CDM � Executive Board PROJECT DESIGN DOCUMENT FORM
FOR AFFORESTATION AND REFORESTATION PROJECT ACTIVITIES (CDM-AR-PDD) - Version 04
39/102
2 200 3 200 4 100 5 6
B. Treatment of trees To calculate the carbon stock change in living biomass in the project scenario this project uses method 2 (stock change) applying equations 8, 9, 10, 11 and 20 of the methodology. TARAM calculates this stock change in Aexa sheet, tables A67:M100 (total) and A29:E62 (per stand model). Basically the information necessary to calculate this stock changes is the growth models per stand model, the species parameters, the specific management (thinning and harvesting) and the planting plan. In TARAM the species parameters are included in sheet Species and the specific sources of this parameters are described below in tables D-4 and D-7, the planting plan in AR-Plan sheet described above in table D-2 and the growth information and management in sheets SM1 and SM2 (growth models in table A52:K87 and management in table A90:BS123). The necessary information to fill out SM1 and SM2 sheets is described in the following paragraphs and the summary of the results is included in tables D-3, D-5, D-6 and D-8. Data used for ex ante estimation of actual net GHG removals by sinks The GPG-LULUFC manual recommends the use of following data sources to estimate biomass increase.
a) Existing local sources and specific species; b) National and species specific (e.g. from national GHG inventory); c) Species specific from neighboring countries with similar conditions (sometimes c) might be preferable to b)); d) Species specific relevant at the global level (e.g. GPG-LULUCF).
In Ethiopia there is a lack of local growth data available to estimate the biomass stock change achieved by the proposed A/R CDM project activity.
(a) Stand model 1
There is no published data available to predict growth of natural multi-species forests in the SNNPR State, Ethiopia, and data on natural multi-species forests is generally difficult to find. Therefore, the approach used to estimate yields in the Stand Model 1 of the project is application of existing information for similar climatic zone and vegetation type as reported in the Good Practice Guidance for Land Use, Land-Use Change and Forestry (IPCC 2003), and adjusted for the local circumstances drawing on the expert opinion.
1. Based on its altitude (as determined by GPS measurements) and annual rainfall, the project site belongs mostly to tropical montane dry forests (Table 5-1, IPCC Guidelines 1996). Some parts of the project area are reported to have higher annual rainfall and can be categorized as tropical montane moist forests.
2. In Africa, the mean aboveground biomass stock in naturally regenerated tropical montane dry forests is estimated to be 40 t dry matter/ha, and in naturally regenerated tropical montane moist forests 191 t dry matter/ha (Table 3A.1.2, GPG for LULUCF).
3. The average annual increment in aboveground biomass in natural regeneration in such dry forests is 2.0 t dry matter/ha/yr for forests younger than 20 years old and 1.5 t dry matter/ha/yr for forests
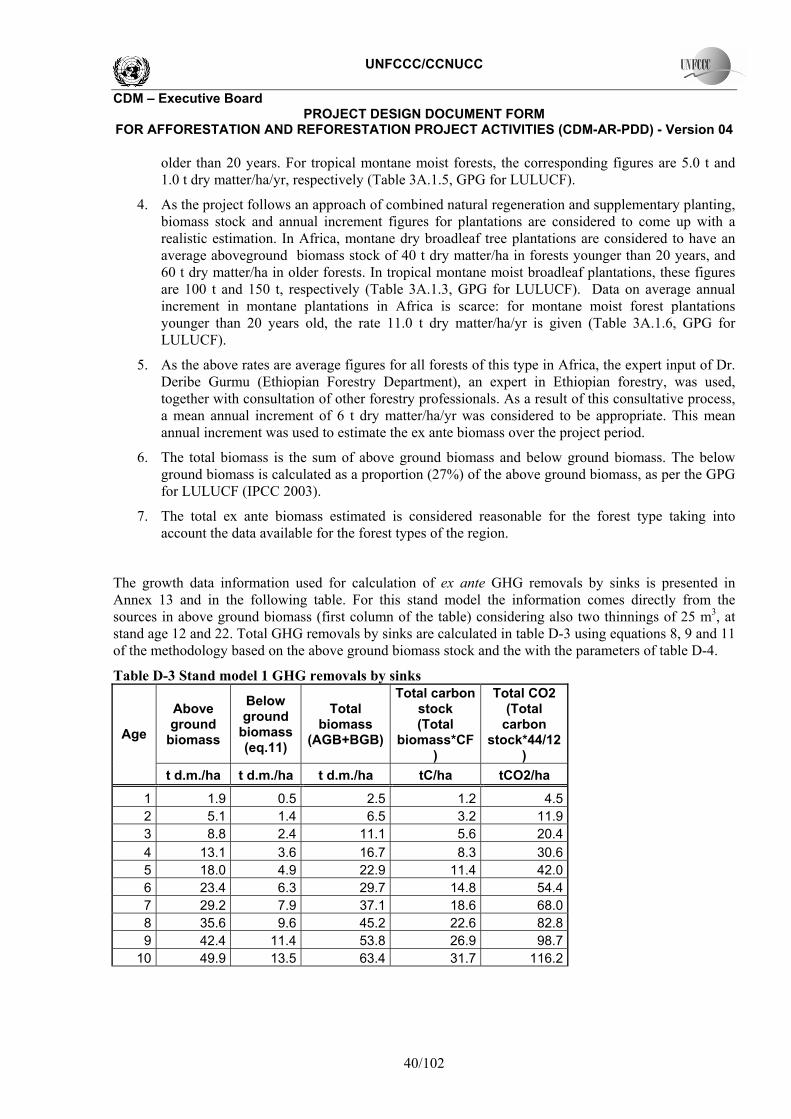
UNFCCC/CCNUCC
CDM � Executive Board PROJECT DESIGN DOCUMENT FORM
FOR AFFORESTATION AND REFORESTATION PROJECT ACTIVITIES (CDM-AR-PDD) - Version 04
40/102
older than 20 years. For tropical montane moist forests, the corresponding figures are 5.0 t and 1.0 t dry matter/ha/yr, respectively (Table 3A.1.5, GPG for LULUCF).
4. As the project follows an approach of combined natural regeneration and supplementary planting, biomass stock and annual increment figures for plantations are considered to come up with a realistic estimation. In Africa, montane dry broadleaf tree plantations are considered to have an average aboveground biomass stock of 40 t dry matter/ha in forests younger than 20 years, and 60 t dry matter/ha in older forests. In tropical montane moist broadleaf plantations, these figures are 100 t and 150 t, respectively (Table 3A.1.3, GPG for LULUCF). Data on average annual increment in montane plantations in Africa is scarce: for montane moist forest plantations younger than 20 years old, the rate 11.0 t dry matter/ha/yr is given (Table 3A.1.6, GPG for LULUCF).
5. As the above rates are average figures for all forests of this type in Africa, the expert input of Dr. Deribe Gurmu (Ethiopian Forestry Department), an expert in Ethiopian forestry, was used, together with consultation of other forestry professionals. As a result of this consultative process, a mean annual increment of 6 t dry matter/ha/yr was considered to be appropriate. This mean annual increment was used to estimate the ex ante biomass over the project period.
6. The total biomass is the sum of above ground biomass and below ground biomass. The below ground biomass is calculated as a proportion (27%) of the above ground biomass, as per the GPG for LULUCF (IPCC 2003).
7. The total ex ante biomass estimated is considered reasonable for the forest type taking into account the data available for the forest types of the region.
The growth data information used for calculation of ex ante GHG removals by sinks is presented in Annex 13 and in the following table. For this stand model the information comes directly from the sources in above ground biomass (first column of the table) considering also two thinnings of 25 m3, at stand age 12 and 22. Total GHG removals by sinks are calculated in table D-3 using equations 8, 9 and 11 of the methodology based on the above ground biomass stock and the with the parameters of table D-4.
Table D-3 Stand model 1 GHG removals by sinks
Above ground
biomass
Below ground
biomass (eq.11)
Total biomass
(AGB+BGB)
Total carbon stock (Total
biomass*CF)
Total CO2 (Total
carbon stock*44/12
) Age
t d.m./ha t d.m./ha t d.m./ha tC/ha tCO2/ha
1 1.9 0.5 2.5 1.2 4.5 2 5.1 1.4 6.5 3.2 11.9 3 8.8 2.4 11.1 5.6 20.4 4 13.1 3.6 16.7 8.3 30.6 5 18.0 4.9 22.9 11.4 42.0 6 23.4 6.3 29.7 14.8 54.4 7 29.2 7.9 37.1 18.6 68.0 8 35.6 9.6 45.2 22.6 82.8 9 42.4 11.4 53.8 26.9 98.7
10 49.9 13.5 63.4 31.7 116.2
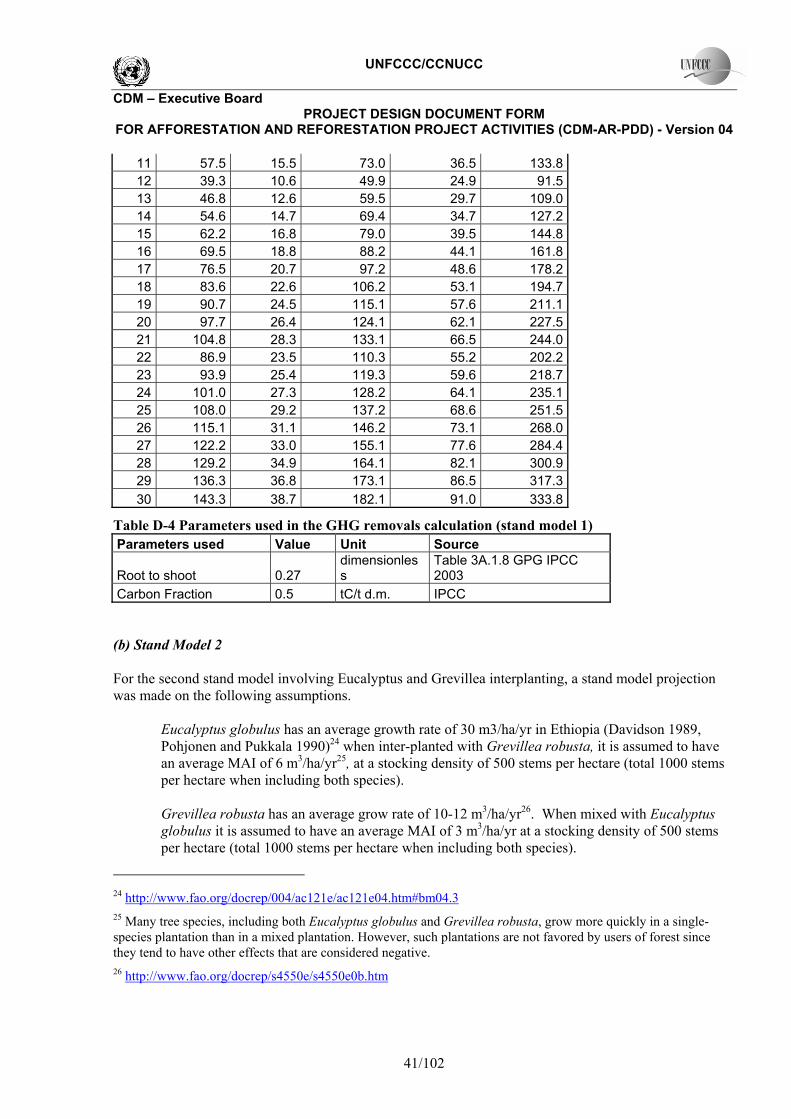
UNFCCC/CCNUCC
CDM � Executive Board PROJECT DESIGN DOCUMENT FORM
FOR AFFORESTATION AND REFORESTATION PROJECT ACTIVITIES (CDM-AR-PDD) - Version 04
41/102
11 57.5 15.5 73.0 36.5 133.8 12 39.3 10.6 49.9 24.9 91.5 13 46.8 12.6 59.5 29.7 109.0 14 54.6 14.7 69.4 34.7 127.2 15 62.2 16.8 79.0 39.5 144.8 16 69.5 18.8 88.2 44.1 161.8 17 76.5 20.7 97.2 48.6 178.2 18 83.6 22.6 106.2 53.1 194.7 19 90.7 24.5 115.1 57.6 211.1 20 97.7 26.4 124.1 62.1 227.5 21 104.8 28.3 133.1 66.5 244.0 22 86.9 23.5 110.3 55.2 202.2 23 93.9 25.4 119.3 59.6 218.7 24 101.0 27.3 128.2 64.1 235.1 25 108.0 29.2 137.2 68.6 251.5 26 115.1 31.1 146.2 73.1 268.0 27 122.2 33.0 155.1 77.6 284.4 28 129.2 34.9 164.1 82.1 300.9 29 136.3 36.8 173.1 86.5 317.3 30 143.3 38.7 182.1 91.0 333.8
Table D-4 Parameters used in the GHG removals calculation (stand model 1) Parameters used Value Unit Source
Root to shoot 0.27 dimensionless
Table 3A.1.8 GPG IPCC 2003
Carbon Fraction 0.5 tC/t d.m. IPCC
(b) Stand Model 2 For the second stand model involving Eucalyptus and Grevillea interplanting, a stand model projection was made on the following assumptions.
Eucalyptus globulus has an average growth rate of 30 m3/ha/yr in Ethiopia (Davidson 1989, Pohjonen and Pukkala 1990)24 when inter-planted with Grevillea robusta, it is assumed to have an average MAI of 6 m3/ha/yr25, at a stocking density of 500 stems per hectare (total 1000 stems per hectare when including both species).
Grevillea robusta has an average grow rate of 10-12 m3/ha/yr26. When mixed with Eucalyptus globulus it is assumed to have an average MAI of 3 m3/ha/yr at a stocking density of 500 stems per hectare (total 1000 stems per hectare when including both species).
24 http://www.fao.org/docrep/004/ac121e/ac121e04.htm#bm04.3 25 Many tree species, including both Eucalyptus globulus and Grevillea robusta, grow more quickly in a single-species plantation than in a mixed plantation. However, such plantations are not favored by users of forest since they tend to have other effects that are considered negative. 26 http://www.fao.org/docrep/s4550e/s4550e0b.htm
UNFCCC/CCNUCC
CDM � Executive Board PROJECT DESIGN DOCUMENT FORM
FOR AFFORESTATION AND REFORESTATION PROJECT ACTIVITIES (CDM-AR-PDD) - Version 04
42/102
Based on the above growth rates in an inter-planted situation, Eucalyptus and Grevillea mixed plantation has an average MAI of 8.9 m3/ha/yr at a stocking density of 1000 stems per hectare (500 of each species) over the initial 20 year period, plus woody biomass, prunings and thinnings.
In TARAM in SM2 table A52:K87 has been filled out with above ground biomass calculated in table D-5 based on the stand volume information and using equation 20 and 10 of the methodology. TARAM calculates the GHG removals per hectare using equations 8, 9, 11 and 20 as described in tables D-5 and D-6 using the parameters of table D-7. Both species of the stand model have two thinnings and a final harvesting described in the fourth column of tables D-5 and D-6.
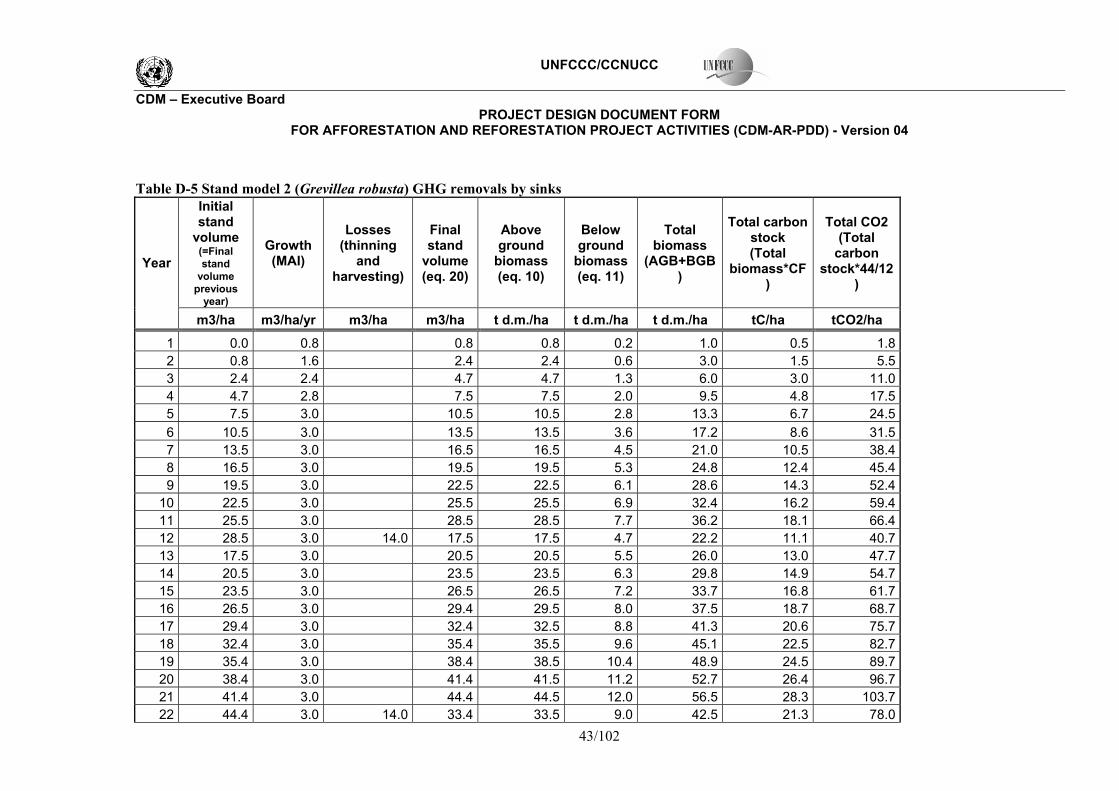
UNFCCC/CCNUCC
CDM � Executive Board PROJECT DESIGN DOCUMENT FORM
FOR AFFORESTATION AND REFORESTATION PROJECT ACTIVITIES (CDM-AR-PDD) - Version 04
43/102
Table D-5 Stand model 2 (Grevillea robusta) GHG removals by sinks Initial stand
volume (=Final stand
volume previous
year)
Growth (MAI)
Losses (thinning
and harvesting)
Final stand
volume (eq. 20)
Above ground
biomass (eq. 10)
Below ground
biomass (eq. 11)
Total biomass
(AGB+BGB)
Total carbon stock (Total
biomass*CF)
Total CO2 (Total
carbon stock*44/12
) Year
m3/ha m3/ha/yr m3/ha m3/ha t d.m./ha t d.m./ha t d.m./ha tC/ha tCO2/ha
1 0.0 0.8 0.8 0.8 0.2 1.0 0.5 1.82 0.8 1.6 2.4 2.4 0.6 3.0 1.5 5.53 2.4 2.4 4.7 4.7 1.3 6.0 3.0 11.04 4.7 2.8 7.5 7.5 2.0 9.5 4.8 17.55 7.5 3.0 10.5 10.5 2.8 13.3 6.7 24.56 10.5 3.0 13.5 13.5 3.6 17.2 8.6 31.57 13.5 3.0 16.5 16.5 4.5 21.0 10.5 38.48 16.5 3.0 19.5 19.5 5.3 24.8 12.4 45.49 19.5 3.0 22.5 22.5 6.1 28.6 14.3 52.4
10 22.5 3.0 25.5 25.5 6.9 32.4 16.2 59.411 25.5 3.0 28.5 28.5 7.7 36.2 18.1 66.412 28.5 3.0 14.0 17.5 17.5 4.7 22.2 11.1 40.713 17.5 3.0 20.5 20.5 5.5 26.0 13.0 47.714 20.5 3.0 23.5 23.5 6.3 29.8 14.9 54.715 23.5 3.0 26.5 26.5 7.2 33.7 16.8 61.716 26.5 3.0 29.4 29.5 8.0 37.5 18.7 68.717 29.4 3.0 32.4 32.5 8.8 41.3 20.6 75.718 32.4 3.0 35.4 35.5 9.6 45.1 22.5 82.719 35.4 3.0 38.4 38.5 10.4 48.9 24.5 89.720 38.4 3.0 41.4 41.5 11.2 52.7 26.4 96.721 41.4 3.0 44.4 44.5 12.0 56.5 28.3 103.722 44.4 3.0 14.0 33.4 33.5 9.0 42.5 21.3 78.0
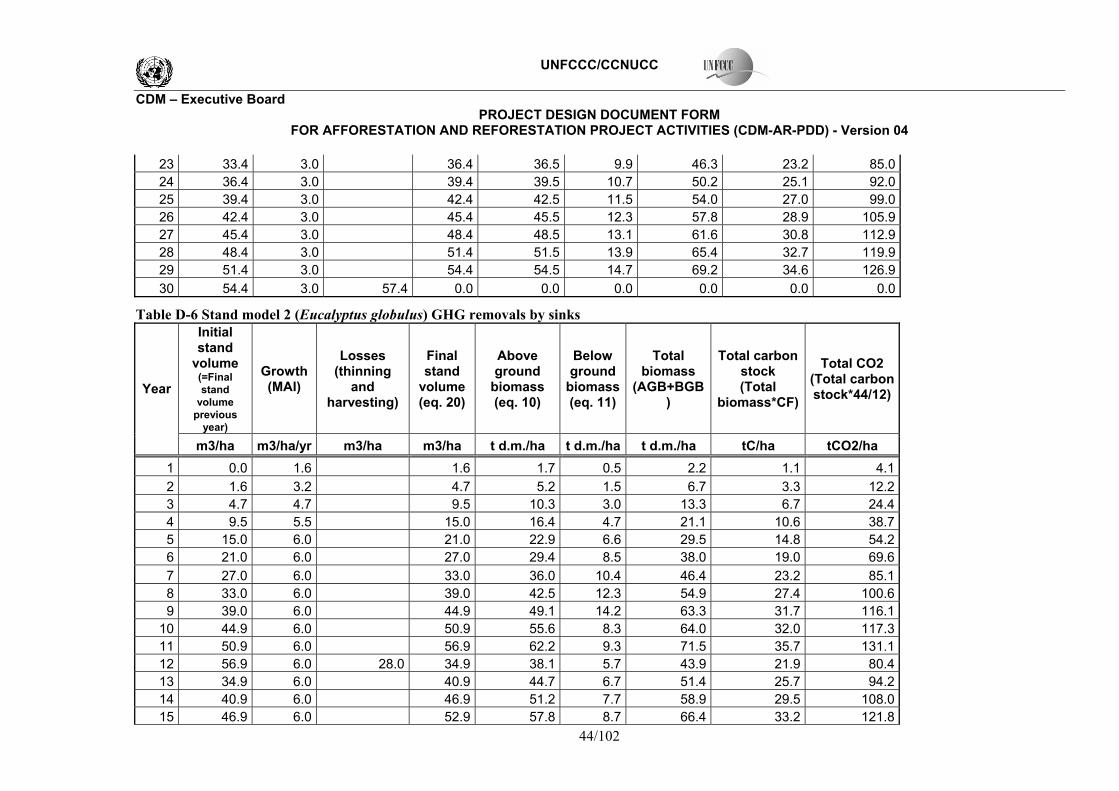
UNFCCC/CCNUCC
CDM � Executive Board PROJECT DESIGN DOCUMENT FORM
FOR AFFORESTATION AND REFORESTATION PROJECT ACTIVITIES (CDM-AR-PDD) - Version 04
44/102
23 33.4 3.0 36.4 36.5 9.9 46.3 23.2 85.024 36.4 3.0 39.4 39.5 10.7 50.2 25.1 92.025 39.4 3.0 42.4 42.5 11.5 54.0 27.0 99.026 42.4 3.0 45.4 45.5 12.3 57.8 28.9 105.927 45.4 3.0 48.4 48.5 13.1 61.6 30.8 112.928 48.4 3.0 51.4 51.5 13.9 65.4 32.7 119.929 51.4 3.0 54.4 54.5 14.7 69.2 34.6 126.930 54.4 3.0 57.4 0.0 0.0 0.0 0.0 0.0 0.0
Table D-6 Stand model 2 (Eucalyptus globulus) GHG removals by sinks Initial stand
volume (=Final stand
volume previous
year)
Growth (MAI)
Losses (thinning
and harvesting)
Final stand
volume (eq. 20)
Above ground
biomass (eq. 10)
Below ground
biomass (eq. 11)
Total biomass
(AGB+BGB)
Total carbon stock (Total
biomass*CF)
Total CO2 (Total carbon stock*44/12)Year
m3/ha m3/ha/yr m3/ha m3/ha t d.m./ha t d.m./ha t d.m./ha tC/ha tCO2/ha 1 0.0 1.6 1.6 1.7 0.5 2.2 1.1 4.12 1.6 3.2 4.7 5.2 1.5 6.7 3.3 12.23 4.7 4.7 9.5 10.3 3.0 13.3 6.7 24.44 9.5 5.5 15.0 16.4 4.7 21.1 10.6 38.75 15.0 6.0 21.0 22.9 6.6 29.5 14.8 54.26 21.0 6.0 27.0 29.4 8.5 38.0 19.0 69.67 27.0 6.0 33.0 36.0 10.4 46.4 23.2 85.18 33.0 6.0 39.0 42.5 12.3 54.9 27.4 100.69 39.0 6.0 44.9 49.1 14.2 63.3 31.7 116.1
10 44.9 6.0 50.9 55.6 8.3 64.0 32.0 117.311 50.9 6.0 56.9 62.2 9.3 71.5 35.7 131.112 56.9 6.0 28.0 34.9 38.1 5.7 43.9 21.9 80.413 34.9 6.0 40.9 44.7 6.7 51.4 25.7 94.214 40.9 6.0 46.9 51.2 7.7 58.9 29.5 108.015 46.9 6.0 52.9 57.8 8.7 66.4 33.2 121.8

UNFCCC/CCNUCC
CDM � Executive Board PROJECT DESIGN DOCUMENT FORM
FOR AFFORESTATION AND REFORESTATION PROJECT ACTIVITIES (CDM-AR-PDD) - Version 04
45/102
16 52.9 6.0 58.9 64.3 9.6 74.0 37.0 135.617 58.9 6.0 64.9 70.9 10.6 81.5 40.7 149.418 64.9 6.0 70.9 77.4 11.6 89.0 44.5 163.219 70.9 6.0 76.9 83.9 12.6 96.5 48.3 177.020 76.9 6.0 82.9 90.5 13.6 104.1 52.0 190.821 82.9 6.0 88.9 97.0 14.6 111.6 55.8 204.622 88.9 6.0 28.0 66.9 73.0 11.0 84.0 42.0 153.923 66.9 6.0 72.8 79.5 11.9 91.5 45.7 167.724 72.8 6.0 78.8 86.1 12.9 99.0 49.5 181.525 78.8 6.0 84.8 92.6 13.9 106.5 53.3 195.326 84.8 6.0 90.8 99.2 14.9 114.1 57.0 209.127 90.8 6.0 96.8 105.7 15.9 121.6 60.8 222.928 96.8 6.0 102.8 112.3 16.8 129.1 64.6 236.729 102.8 6.0 108.8 118.8 17.8 136.6 68.3 250.530 108.8 6.0 114.8 0.0 0.0 0.0 0.0 0.0 0.0
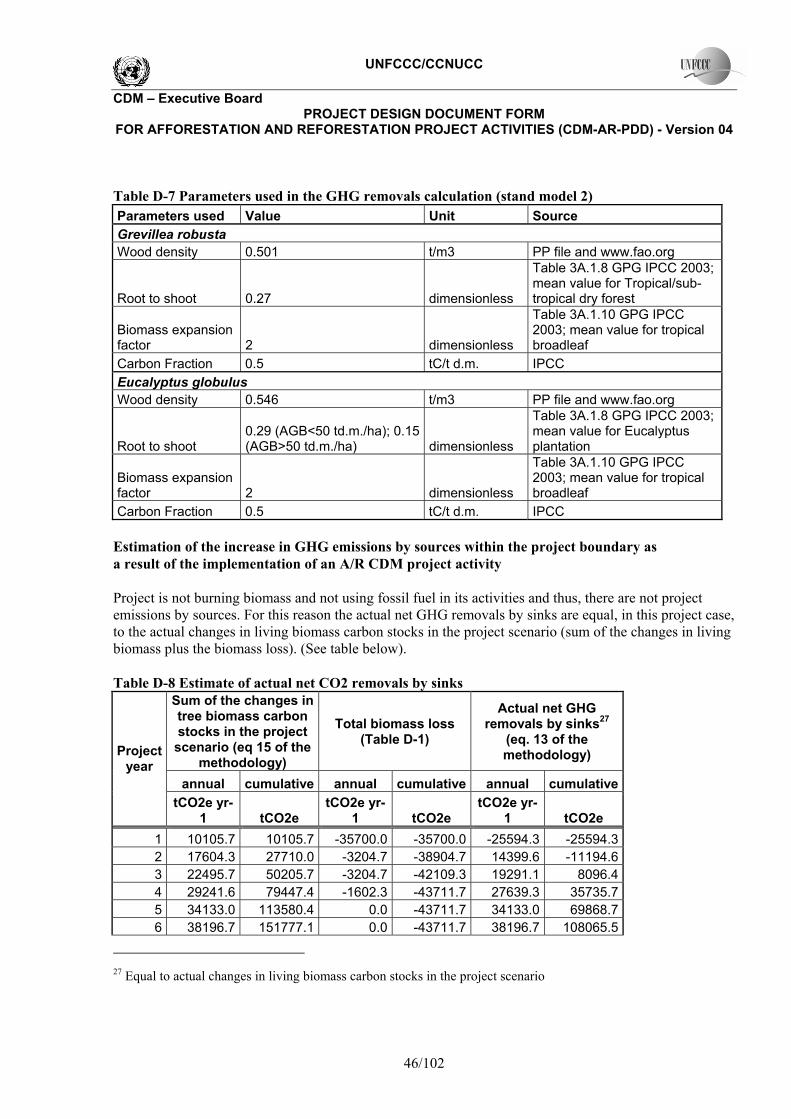
UNFCCC/CCNUCC
CDM � Executive Board PROJECT DESIGN DOCUMENT FORM
FOR AFFORESTATION AND REFORESTATION PROJECT ACTIVITIES (CDM-AR-PDD) - Version 04
46/102
Table D-7 Parameters used in the GHG removals calculation (stand model 2) Parameters used Value Unit Source Grevillea robusta Wood density 0.501 t/m3 PP file and www.fao.org
Root to shoot 0.27 dimensionless
Table 3A.1.8 GPG IPCC 2003; mean value for Tropical/sub-tropical dry forest
Biomass expansion factor 2 dimensionless
Table 3A.1.10 GPG IPCC 2003; mean value for tropical broadleaf
Carbon Fraction 0.5 tC/t d.m. IPCC Eucalyptus globulus Wood density 0.546 t/m3 PP file and www.fao.org
Root to shoot 0.29 (AGB<50 td.m./ha); 0.15 (AGB>50 td.m./ha) dimensionless
Table 3A.1.8 GPG IPCC 2003; mean value for Eucalyptus plantation
Biomass expansion factor 2 dimensionless
Table 3A.1.10 GPG IPCC 2003; mean value for tropical broadleaf
Carbon Fraction 0.5 tC/t d.m. IPCC Estimation of the increase in GHG emissions by sources within the project boundary as a result of the implementation of an A/R CDM project activity Project is not burning biomass and not using fossil fuel in its activities and thus, there are not project emissions by sources. For this reason the actual net GHG removals by sinks are equal, in this project case, to the actual changes in living biomass carbon stocks in the project scenario (sum of the changes in living biomass plus the biomass loss). (See table below). Table D-8 Estimate of actual net CO2 removals by sinks
Sum of the changes in tree biomass carbon stocks in the project
scenario (eq 15 of the methodology)
Total biomass loss (Table D-1)
Actual net GHG removals by sinks27
(eq. 13 of the methodology)
annual cumulative annual cumulative annual cumulative
Project year
tCO2e yr-1 tCO2e
tCO2e yr-1 tCO2e
tCO2e yr-1 tCO2e
1 10105.7 10105.7 -35700.0 -35700.0 -25594.3 -25594.3 2 17604.3 27710.0 -3204.7 -38904.7 14399.6 -11194.6 3 22495.7 50205.7 -3204.7 -42109.3 19291.1 8096.4 4 29241.6 79447.4 -1602.3 -43711.7 27639.3 35735.7 5 34133.0 113580.4 0.0 -43711.7 34133.0 69868.7 6 38196.7 151777.1 0.0 -43711.7 38196.7 108065.5
27 Equal to actual changes in living biomass carbon stocks in the project scenario
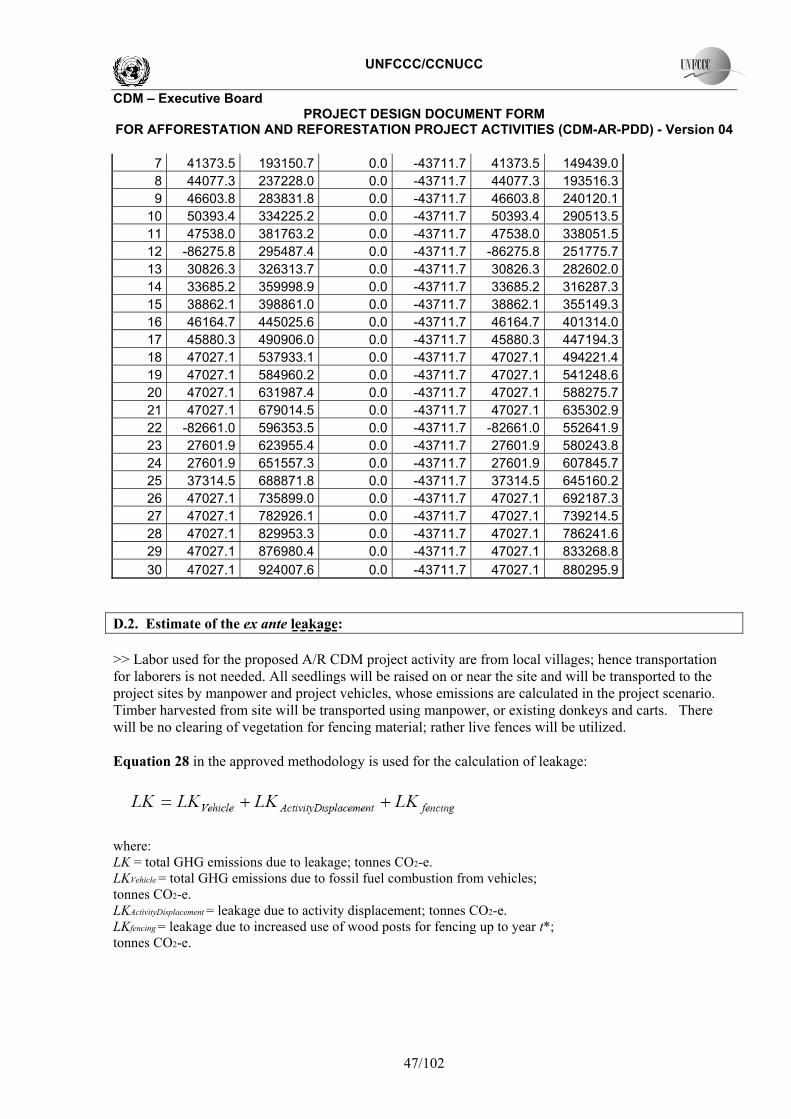
UNFCCC/CCNUCC
CDM � Executive Board PROJECT DESIGN DOCUMENT FORM
FOR AFFORESTATION AND REFORESTATION PROJECT ACTIVITIES (CDM-AR-PDD) - Version 04
47/102
7 41373.5 193150.7 0.0 -43711.7 41373.5 149439.0 8 44077.3 237228.0 0.0 -43711.7 44077.3 193516.3 9 46603.8 283831.8 0.0 -43711.7 46603.8 240120.1
10 50393.4 334225.2 0.0 -43711.7 50393.4 290513.5 11 47538.0 381763.2 0.0 -43711.7 47538.0 338051.5 12 -86275.8 295487.4 0.0 -43711.7 -86275.8 251775.7 13 30826.3 326313.7 0.0 -43711.7 30826.3 282602.0 14 33685.2 359998.9 0.0 -43711.7 33685.2 316287.3 15 38862.1 398861.0 0.0 -43711.7 38862.1 355149.3 16 46164.7 445025.6 0.0 -43711.7 46164.7 401314.0 17 45880.3 490906.0 0.0 -43711.7 45880.3 447194.3 18 47027.1 537933.1 0.0 -43711.7 47027.1 494221.4 19 47027.1 584960.2 0.0 -43711.7 47027.1 541248.6 20 47027.1 631987.4 0.0 -43711.7 47027.1 588275.7 21 47027.1 679014.5 0.0 -43711.7 47027.1 635302.9 22 -82661.0 596353.5 0.0 -43711.7 -82661.0 552641.9 23 27601.9 623955.4 0.0 -43711.7 27601.9 580243.8 24 27601.9 651557.3 0.0 -43711.7 27601.9 607845.7 25 37314.5 688871.8 0.0 -43711.7 37314.5 645160.2 26 47027.1 735899.0 0.0 -43711.7 47027.1 692187.3 27 47027.1 782926.1 0.0 -43711.7 47027.1 739214.5 28 47027.1 829953.3 0.0 -43711.7 47027.1 786241.6 29 47027.1 876980.4 0.0 -43711.7 47027.1 833268.8 30 47027.1 924007.6 0.0 -43711.7 47027.1 880295.9
D.2. Estimate of the ex ante leakage: >> Labor used for the proposed A/R CDM project activity are from local villages; hence transportation for laborers is not needed. All seedlings will be raised on or near the site and will be transported to the project sites by manpower and project vehicles, whose emissions are calculated in the project scenario. Timber harvested from site will be transported using manpower, or existing donkeys and carts. There will be no clearing of vegetation for fencing material; rather live fences will be utilized. Equation 28 in the approved methodology is used for the calculation of leakage:
where: LK = total GHG emissions due to leakage; tonnes CO2-e. LKVehicle = total GHG emissions due to fossil fuel combustion from vehicles; tonnes CO2-e. LKActivityDisplacement = leakage due to activity displacement; tonnes CO2-e. LKfencing = leakage due to increased use of wood posts for fencing up to year t*; tonnes CO2-e.
UNFCCC/CCNUCC
CDM � Executive Board PROJECT DESIGN DOCUMENT FORM
FOR AFFORESTATION AND REFORESTATION PROJECT ACTIVITIES (CDM-AR-PDD) - Version 04
48/102
However given that live fences will be utilized LKfencing = 0 Given that fossil fuel emissions can be ignored (decision of EB 42) LKvehicle = 0 Leakage is therefore assessed for activity displacement only Activity displacement Assessment of leakage from fuelwood collection There is no leakage expected from fuel wood collection28. The project will generate enough fuel wood within the project area, initially through pruning of existing vegetation to assist natural regeneration and later from planted areas within the project boundary, as well as areas planted outside the project boundary from seedlings supplied through the project. During project preparation, pre-project fuel wood collection was estimated at 4.3 t/ha, while post project just after one and half year fuel wood estimation gave 5.13t/ha (see Annex 11 on Leakage). The pre project estimate was based on interviews and focus groups with a representative sample of the community, while the post-project assessment was based on sampling over strata and validation interviews. The fuel wood removed as a result of pruning was collected from four sample areas of 100m2 from four cooperatives (randomly selected) and was then weighed. Based on the data delivered from this procedure the fuel wood collection following project implementation is 5.1 t per hectare. Based on field experience from Niger29 (Tony Rinaudo) as well as published literature30 the project team assessed that the fuelwood yield from the project more than compensates for the change from fuelwood collection to cooperative community management that would generate higher levels of fuelwood as thinning and pruning activities would increase the amount of biomass available. Through interviews with community members, it was clarified that the communities are collecting a large amount of these pruned branches. As per the methodology on leakage assessment, the project meets the condition, FGBL<FGAR,t Therefore, leakage from fuelwood can be ignored. Assessment of leakage from grazing There is anticipated to be no net leakage due to the relocation of animals from the project31. The number of animals using the project area NaBL was calculated by counting the total number of animals.
28 See TARAM V1.3_HAR_ETHIOPIA 090511.xls 29 Rinaudo, T, various publications including http://www.frameweb.org/CommunityBrowser.aspx?id=2871&lang=en-US 30 Callesen, I. and Østergaard, 2008 � www. orgprints.org/12222/01/Callesen_12222_ed.doc 31 See TARAM V1.3_HAR_ETHIOPIA (APRIL 5 2009).xls
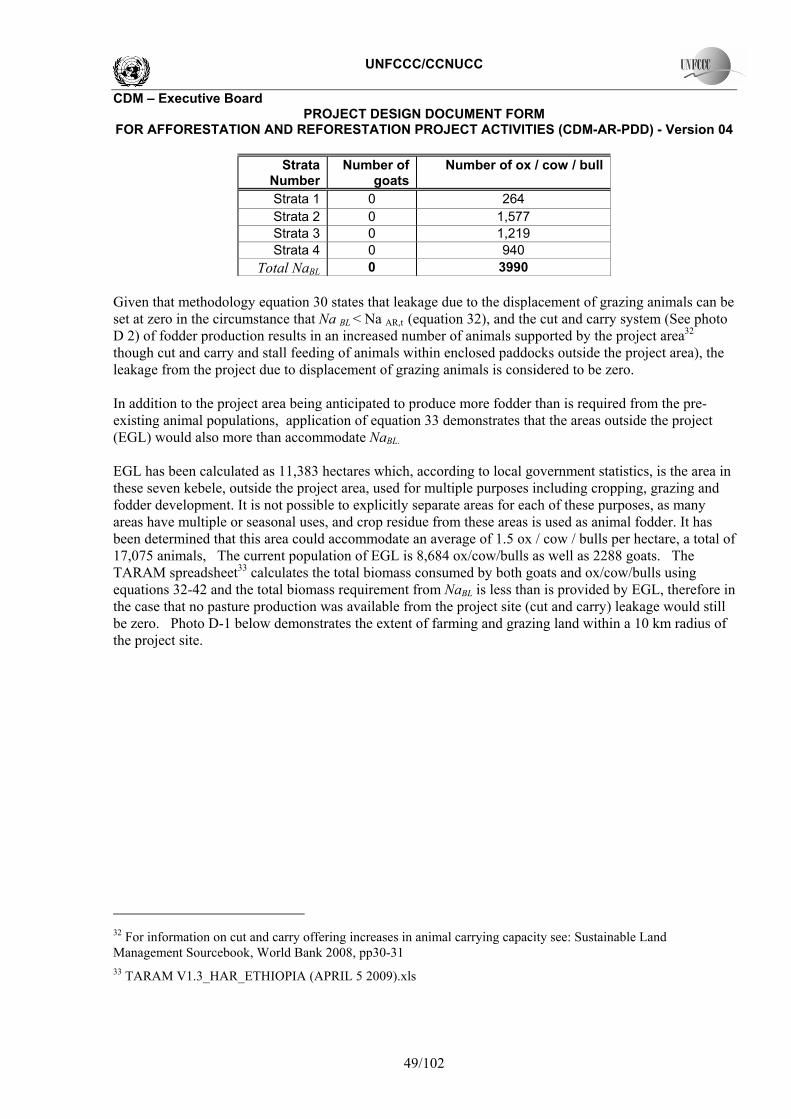
UNFCCC/CCNUCC
CDM � Executive Board PROJECT DESIGN DOCUMENT FORM
FOR AFFORESTATION AND REFORESTATION PROJECT ACTIVITIES (CDM-AR-PDD) - Version 04
49/102
Strata Number
Number of goats
Number of ox / cow / bull
Strata 1 0 264 Strata 2 0 1,577 Strata 3 0 1,219 Strata 4 0 940
Total NaBL 0 3990 Given that methodology equation 30 states that leakage due to the displacement of grazing animals can be set at zero in the circumstance that Na BL < Na AR,t (equation 32), and the cut and carry system (See photo D 2) of fodder production results in an increased number of animals supported by the project area32 though cut and carry and stall feeding of animals within enclosed paddocks outside the project area), the leakage from the project due to displacement of grazing animals is considered to be zero. In addition to the project area being anticipated to produce more fodder than is required from the pre-existing animal populations, application of equation 33 demonstrates that the areas outside the project (EGL) would also more than accommodate NaBL. EGL has been calculated as 11,383 hectares which, according to local government statistics, is the area in these seven kebele, outside the project area, used for multiple purposes including cropping, grazing and fodder development. It is not possible to explicitly separate areas for each of these purposes, as many areas have multiple or seasonal uses, and crop residue from these areas is used as animal fodder. It has been determined that this area could accommodate an average of 1.5 ox / cow / bulls per hectare, a total of 17,075 animals, The current population of EGL is 8,684 ox/cow/bulls as well as 2288 goats. The TARAM spreadsheet33 calculates the total biomass consumed by both goats and ox/cow/bulls using equations 32-42 and the total biomass requirement from NaBL is less than is provided by EGL, therefore in the case that no pasture production was available from the project site (cut and carry) leakage would still be zero. Photo D-1 below demonstrates the extent of farming and grazing land within a 10 km radius of the project site.
32 For information on cut and carry offering increases in animal carrying capacity see: Sustainable Land Management Sourcebook, World Bank 2008, pp30-31 33 TARAM V1.3_HAR_ETHIOPIA (APRIL 5 2009).xls

UNFCCC/CCNUCC
CDM � Executive Board PROJECT DESIGN DOCUMENT FORM
FOR AFFORESTATION AND REFORESTATION PROJECT ACTIVITIES (CDM-AR-PDD) - Version 04
50/102
Photo D - 1 Humbo Site radius of 10km demonstrating no areas of remaining forest cover.
Photo D-2 Farmers carrying grass after cutting � the �cut and carry� method. Leakage from the clearing of vegetation for fencing material There will be no leakage due to the clearing of vegetation for fencing material, as live fences will be utilised. Table D-2: Annual and cumulative leakage emissions associated with the project Year Annual leakage emissions
(t CO2-e.yr-1)
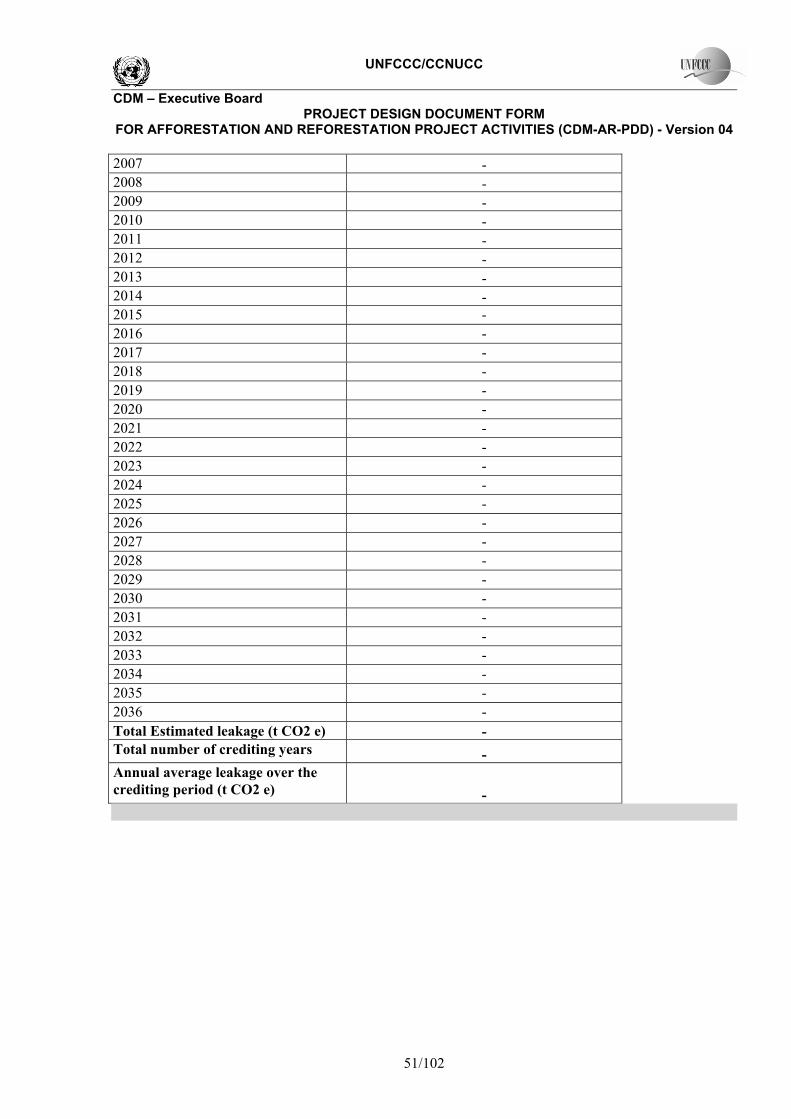
UNFCCC/CCNUCC
CDM � Executive Board PROJECT DESIGN DOCUMENT FORM
FOR AFFORESTATION AND REFORESTATION PROJECT ACTIVITIES (CDM-AR-PDD) - Version 04
51/102
2007 - 2008 - 2009 - 2010 - 2011 - 2012 - 2013 - 2014 - 2015 - 2016 - 2017 - 2018 - 2019 - 2020 - 2021 - 2022 - 2023 - 2024 - 2025 - 2026 - 2027 - 2028 - 2029 - 2030 - 2031 - 2032 - 2033 - 2034 - 2035 - 2036 - Total Estimated leakage (t CO2 e) - Total number of crediting years - Annual average leakage over the crediting period (t CO2 e) -
UNFCCC/CCNUCC
CDM � Executive Board PROJECT DESIGN DOCUMENT FORM
FOR AFFORESTATION AND REFORESTATION PROJECT ACTIVITIES (CDM-AR-PDD) - Version 04
52/102
SECTION E. Monitoring plan E.1. Monitoring of the project implementation: >> The approved methodology proposes methods for monitoring the following elements: � The project boundary, forest establishment, and forest management activities; � Actual net GHG removals by sinks including changes in carbon stock in above-ground biomass and below-ground biomass, increase in GHG emissions within the
project boundary due to site preparation, transportation, thinning, logging and fertilization; � Leakage due to displacement of grazing and fuelwood collection activities, A Quality Assurance/Quality Control plan, including field measurements, data collection verification, data entry and archiving will be implemented as part
of the monitoring plan of the proposed AR CDM project activity to ensure the integrity of data collected.
E.1.1. Monitoring of forest establishment and management: >>
a) Monitoring of the project boundary
The project boundary is used to delineate the project area. The location of each node of the project boundary will be measured during fieldwork and archived in the database. The project boundary would need to be monitored at periodic intervals such as site preparation, planting, silvicultural operations, fire risk assessment etc. Results of the monitoring will be inserted in the database and stored electronically and in paper formats. Table E-1 Data for monitoring of the project boundary ID number34
Data variable
Data unit
Measured (m), calculated (c) estimated (e) or default (d)35
Recording frequency
Number of data points / Other measure of number of collected data
Comment
34 Please provide ID number for cross-referencing in the PDD.
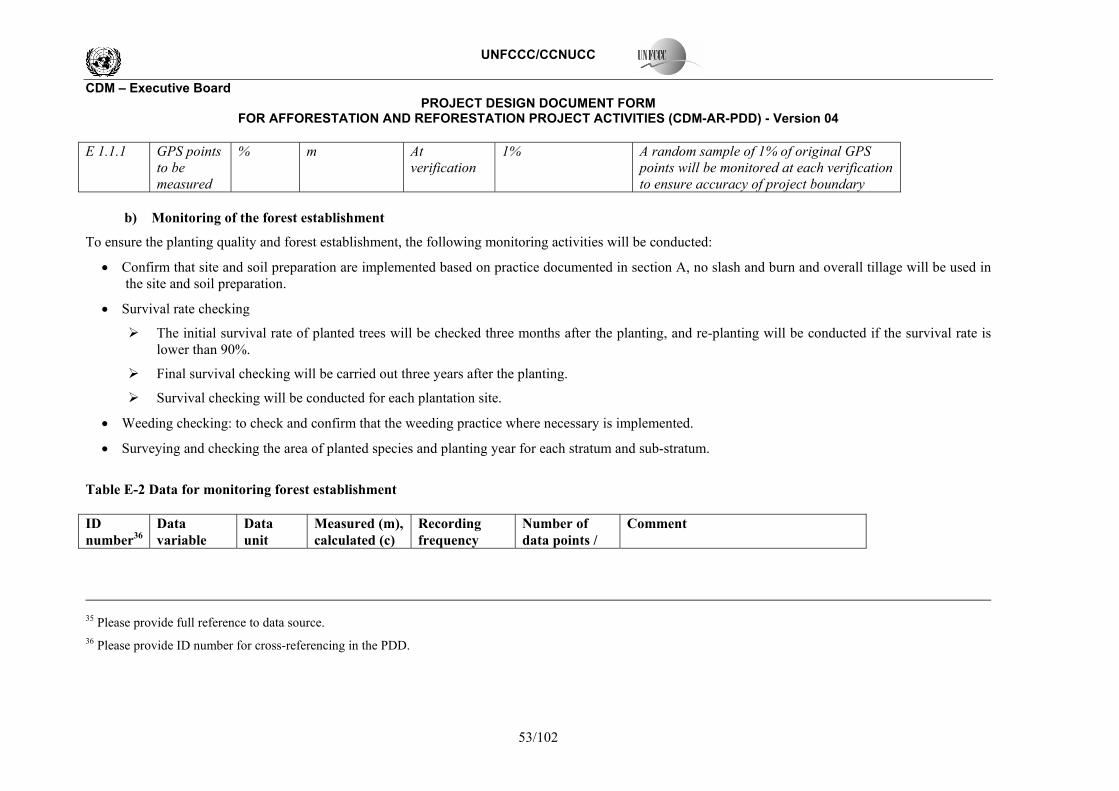
UNFCCC/CCNUCC
CDM � Executive Board PROJECT DESIGN DOCUMENT FORM
FOR AFFORESTATION AND REFORESTATION PROJECT ACTIVITIES (CDM-AR-PDD) - Version 04
53/102
E 1.1.1 GPS points to be measured
% m At verification
1% A random sample of 1% of original GPS points will be monitored at each verification to ensure accuracy of project boundary
b) Monitoring of the forest establishment
To ensure the planting quality and forest establishment, the following monitoring activities will be conducted:
• Confirm that site and soil preparation are implemented based on practice documented in section A, no slash and burn and overall tillage will be used in the site and soil preparation.
• Survival rate checking
! The initial survival rate of planted trees will be checked three months after the planting, and re-planting will be conducted if the survival rate is lower than 90%.
! Final survival checking will be carried out three years after the planting.
! Survival checking will be conducted for each plantation site.
• Weeding checking: to check and confirm that the weeding practice where necessary is implemented.
• Surveying and checking the area of planted species and planting year for each stratum and sub-stratum.
Table E-2 Data for monitoring forest establishment ID number36
Data variable
Data unit
Measured (m), calculated (c)
Recording frequency
Number of data points /
Comment
35 Please provide full reference to data source. 36 Please provide ID number for cross-referencing in the PDD.
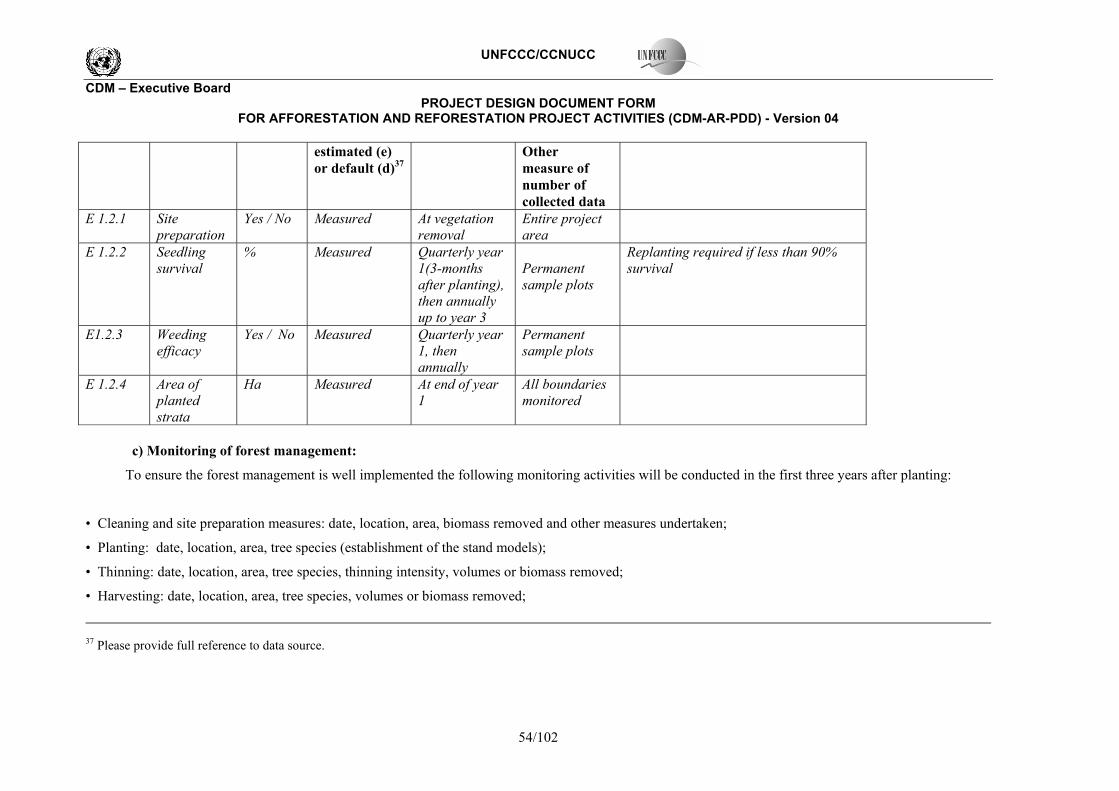
UNFCCC/CCNUCC
CDM � Executive Board PROJECT DESIGN DOCUMENT FORM
FOR AFFORESTATION AND REFORESTATION PROJECT ACTIVITIES (CDM-AR-PDD) - Version 04
54/102
estimated (e) or default (d)37
Other measure of number of collected data
E 1.2.1 Site preparation
Yes / No Measured At vegetation removal
Entire project area
E 1.2.2 Seedling survival
% Measured Quarterly year 1(3-months after planting), then annually up to year 3
Permanent sample plots
Replanting required if less than 90% survival
E1.2.3 Weeding efficacy
Yes / No Measured Quarterly year 1, then annually
Permanent sample plots
E 1.2.4 Area of planted strata
Ha Measured At end of year 1
All boundaries monitored
c) Monitoring of forest management:
To ensure the forest management is well implemented the following monitoring activities will be conducted in the first three years after planting:
� Cleaning and site preparation measures: date, location, area, biomass removed and other measures undertaken;
� Planting: date, location, area, tree species (establishment of the stand models);
� Thinning: date, location, area, tree species, thinning intensity, volumes or biomass removed;
� Harvesting: date, location, area, tree species, volumes or biomass removed;
37 Please provide full reference to data source.
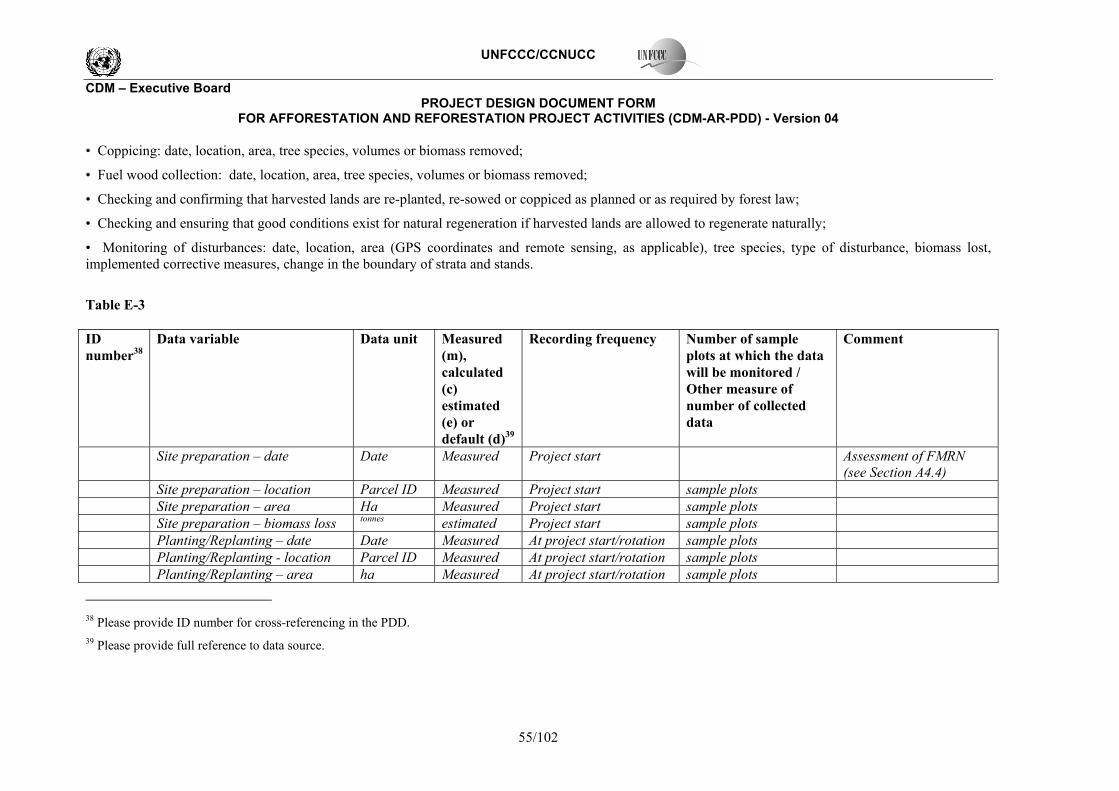
UNFCCC/CCNUCC
CDM � Executive Board PROJECT DESIGN DOCUMENT FORM
FOR AFFORESTATION AND REFORESTATION PROJECT ACTIVITIES (CDM-AR-PDD) - Version 04
55/102
� Coppicing: date, location, area, tree species, volumes or biomass removed;
� Fuel wood collection: date, location, area, tree species, volumes or biomass removed;
� Checking and confirming that harvested lands are re-planted, re-sowed or coppiced as planned or as required by forest law;
� Checking and ensuring that good conditions exist for natural regeneration if harvested lands are allowed to regenerate naturally;
� Monitoring of disturbances: date, location, area (GPS coordinates and remote sensing, as applicable), tree species, type of disturbance, biomass lost, implemented corrective measures, change in the boundary of strata and stands.
Table E-3 ID number38
Data variable Data unit Measured (m), calculated (c) estimated (e) or default (d)39
Recording frequency Number of sample plots at which the data will be monitored / Other measure of number of collected data
Comment
Site preparation � date Date Measured Project start Assessment of FMRN (see Section A4.4)
Site preparation � location Parcel ID Measured Project start sample plots Site preparation � area Ha Measured Project start sample plots Site preparation � biomass loss tonnes estimated Project start sample plots Planting/Replanting � date Date Measured At project start/rotation sample plots Planting/Replanting - location Parcel ID Measured At project start/rotation sample plots Planting/Replanting � area ha Measured At project start/rotation sample plots
38 Please provide ID number for cross-referencing in the PDD. 39 Please provide full reference to data source.
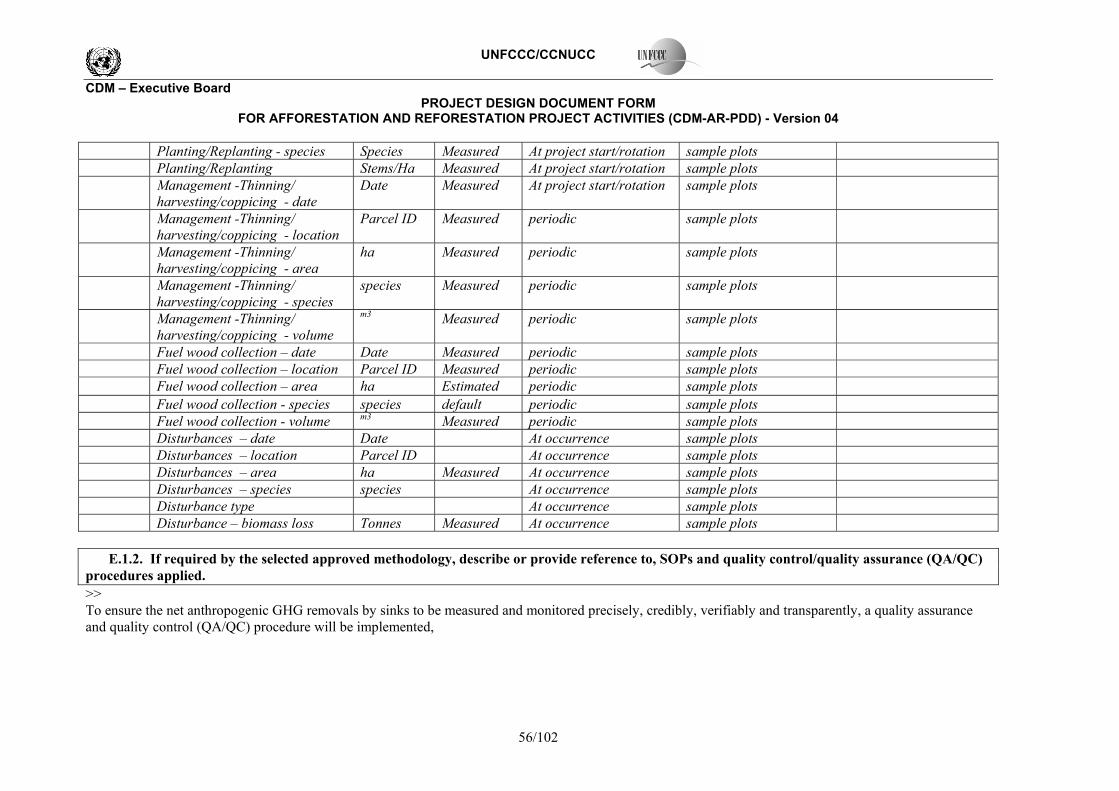
UNFCCC/CCNUCC
CDM � Executive Board PROJECT DESIGN DOCUMENT FORM
FOR AFFORESTATION AND REFORESTATION PROJECT ACTIVITIES (CDM-AR-PDD) - Version 04
56/102
Planting/Replanting - species Species Measured At project start/rotation sample plots Planting/Replanting Stems/Ha Measured At project start/rotation sample plots Management -Thinning/
harvesting/coppicing - date Date Measured At project start/rotation sample plots
Management -Thinning/ harvesting/coppicing - location
Parcel ID Measured periodic sample plots
Management -Thinning/ harvesting/coppicing - area
ha Measured periodic sample plots
Management -Thinning/ harvesting/coppicing - species
species Measured periodic sample plots
Management -Thinning/ harvesting/coppicing - volume
m3 Measured periodic sample plots
Fuel wood collection � date Date Measured periodic sample plots Fuel wood collection � location Parcel ID Measured periodic sample plots Fuel wood collection � area ha Estimated periodic sample plots Fuel wood collection - species species default periodic sample plots Fuel wood collection - volume m3 Measured periodic sample plots Disturbances � date Date At occurrence sample plots Disturbances � location Parcel ID At occurrence sample plots Disturbances � area ha Measured At occurrence sample plots Disturbances � species species At occurrence sample plots Disturbance type At occurrence sample plots Disturbance � biomass loss Tonnes Measured At occurrence sample plots
E.1.2. If required by the selected approved methodology, describe or provide reference to, SOPs and quality control/quality assurance (QA/QC) procedures applied. >> To ensure the net anthropogenic GHG removals by sinks to be measured and monitored precisely, credibly, verifiably and transparently, a quality assurance and quality control (QA/QC) procedure will be implemented,
UNFCCC/CCNUCC
CDM � Executive Board PROJECT DESIGN DOCUMENT FORM
FOR AFFORESTATION AND REFORESTATION PROJECT ACTIVITIES (CDM-AR-PDD) - Version 04
57/102
a) Reliable field measurements To ensure the reliable field measurements: Standard Operating Procedures (SOPs) for each step of the field measurements, including the field measurements are followed. Training programs on the field data collection and data analyses will be held for persons involving in the field measurement works. The training programs will ensure that each field-team members is fully aware of all procedures and the importance of collecting data as accurately as possible. To achieve this, both classroom examination and field examination will be conducted. b) Verification of field data collection To verify that plots have been installed and the measurements taken correctly: - Randomly selected plots will be re-measured by teams other than those involved in the prior plot measurements - Key re-measurement elements include the location of plots, DBH, and tree height. - The re-measurement data will be compared with the original measurement data. Errors assessed in the prior measurements will be corrected and recorded and would be used to calculate the measurement error. c) Verification of data entry and analysis To minimize the possible errors in the process of data entry, the entry of field data and laboratory data will be reviewed by an independent team. Direct communication between all personnel involved in measuring and analyzing data will be used to resolve any apparent anomalies before the final analysis of the monitoring data is completed. d) Data maintenance and archiving Data archiving will take both electronic and paper forms, and copies of all data will be provided to each project participant for two years post the final verification. All electronic data and reports will also be copied on durable media such as CDs and copies of the CDs are stored in multiple locations. The archives include: - Copies of all original field measurement data, laboratory data, and data analysis spreadsheet; - Estimates of the carbon stock changes in all pools and non-CO2 GHG and corresponding calculation spreadsheets; - Copies of the measurement and monitoring reports. E.2. Sampling design and stratification
UNFCCC/CCNUCC
CDM � Executive Board PROJECT DESIGN DOCUMENT FORM
FOR AFFORESTATION AND REFORESTATION PROJECT ACTIVITIES (CDM-AR-PDD) - Version 04
58/102
>> The sampling procedures used in this project are described in AR-AM0003, section III 2.1 & 2.2. a) Sampling Design The project will establish nested plots in accordance with the guidelines of AR-AM0003
i)Type of plots In order to monitor the project through time, permanent-sampling plots will be established and maintained. These will be managed in an identical way to the rest of the project, and will permit the most cost and labor effective form of forest monitoring.
ii) Shape and Size Circular nested plots have been determined to be the most appropriate shape and type of plot for this type of project. Circular nested plots of 1m, 4m, 14m, and 20m in diameter will be established using distance measuring equipment and a fixed central point. Clinometer and relevant correction factor will be used for measurements of sloping lands .
iii) Number of Plots The sample size (number of plots) will depend on the species variation within the stratified areas, however given that this is a biodiverse forest of mixed ages variation will be high. Precision has been predetermined at ±5%. Preliminary data will be collected to evaluate variance, and following this the number of plots required per strata will be determined using equations 53 - 57 of AR-AM0003 version 04.
iv) Location of sampling plots In order to avoid bias with regard to plot locations, permanent sample plots will be been located systematically with a random start. The geographical position (GPS coordinate), location, stratum and sub-stratum series number of each plot is recorded and archived. It is to be ensured that the sampling plots are distributed randomly, and as evenly spread as possible.
v) Monitoring frequency
Forest establishment will be conducted from 2006 to 2009. Permanent plots will be monitored every five years to assess actual above and below ground biomass accumulation.
vi) Measuring and estimating carbon stock changes over time
UNFCCC/CCNUCC
CDM � Executive Board PROJECT DESIGN DOCUMENT FORM
FOR AFFORESTATION AND REFORESTATION PROJECT ACTIVITIES (CDM-AR-PDD) - Version 04
59/102
Carbon stock changes in above- and below-ground biomass on each plot are estimated using Biomass Expansion Factors (BEF) method The below�ground biomass is estimated using root/shoot ratio read from Table 3A1.8 of the GPG LULUCF.
b) Stratification of the project area
Stratification has been described in section C.4. Stratification will be reviewed as per AR-AM0003 should there be need to develop additional strata or sub strata. Strata boundaries may be modified at time points in the future in order to address changes in project implementation, including areas actually established using the implementation techniques, actual forest management applied to each area, variation in carbon stock change between strata. Strata and substrata will be combined where possible. The project team will use permanent sample plots in the project monitoring. These are regarded as statistically more efficient in estimating changes in forest carbon stocks than temporary plots because there is high covariance between observations at successive sampling events. Moreover, permanent plots will permit efficient verification, and a verifying organization can find and measure permanent plots at random to verify, in quantitative terms, the design and implementation of the carbon-monitoring plan. c) Sample size
Considering that the regeneration improvements expected in the project are dependent upon the state of pre-project vegetation, the project stratification takes into account the stratification used in the baseline scenario.
A total of five project strata are identified for the project scenario. The four strata identified in the baseline scenario were also adopted in the project scenario and the regeneration measures implemented in each of the four strata as part of the project scenario are considered as the project interventions. An additional stratum (stratum 5) is adopted for planting naturalized species in the bare areas under the project.
The steps and equations of AR AM0003 are used to calculate the sample size. The number of sample plots for each stratum is estimated as per the required accuracy. The costs of establishing sample plots across the strata were assumed to remain constant; therefore, these were not taken into account the sample size calculations.
For the purpose of stratification, the equations 54 to 57 are applied to calculating the sample size. The sample size calculation also corresponds to the method of samples drawn without replacement under method I of the tool for calculation of number of sample plots for measurements within A/R CDM project activities, version 02.(EB 46, Annex 19).
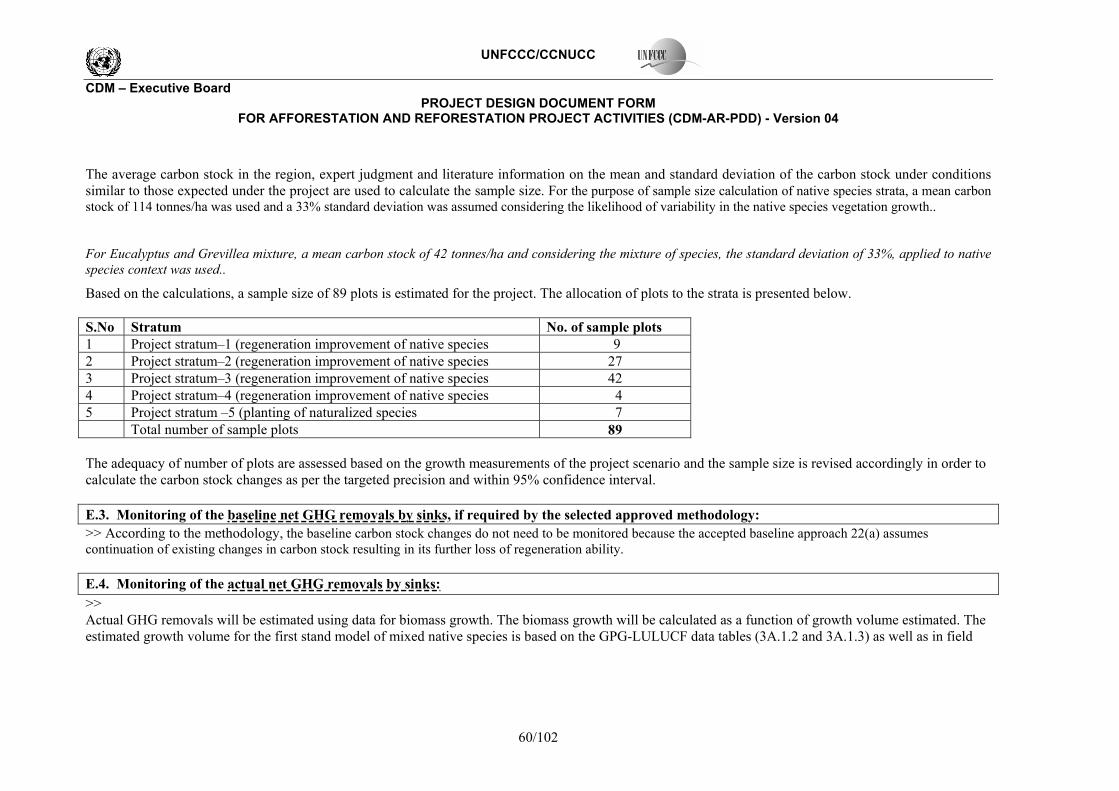
UNFCCC/CCNUCC
CDM � Executive Board PROJECT DESIGN DOCUMENT FORM
FOR AFFORESTATION AND REFORESTATION PROJECT ACTIVITIES (CDM-AR-PDD) - Version 04
60/102
The average carbon stock in the region, expert judgment and literature information on the mean and standard deviation of the carbon stock under conditions similar to those expected under the project are used to calculate the sample size. For the purpose of sample size calculation of native species strata, a mean carbon stock of 114 tonnes/ha was used and a 33% standard deviation was assumed considering the likelihood of variability in the native species vegetation growth..
For Eucalyptus and Grevillea mixture, a mean carbon stock of 42 tonnes/ha and considering the mixture of species, the standard deviation of 33%, applied to native species context was used..
Based on the calculations, a sample size of 89 plots is estimated for the project. The allocation of plots to the strata is presented below. S.No Stratum No. of sample plots 1 Project stratum�1 (regeneration improvement of native species 9 2 Project stratum�2 (regeneration improvement of native species 27 3 Project stratum�3 (regeneration improvement of native species 42 4 Project stratum�4 (regeneration improvement of native species 4 5 Project stratum �5 (planting of naturalized species 7 Total number of sample plots 89 The adequacy of number of plots are assessed based on the growth measurements of the project scenario and the sample size is revised accordingly in order to calculate the carbon stock changes as per the targeted precision and within 95% confidence interval. E.3. Monitoring of the baseline net GHG removals by sinks, if required by the selected approved methodology: >> According to the methodology, the baseline carbon stock changes do not need to be monitored because the accepted baseline approach 22(a) assumes continuation of existing changes in carbon stock resulting in its further loss of regeneration ability. E.4. Monitoring of the actual net GHG removals by sinks: >> Actual GHG removals will be estimated using data for biomass growth. The biomass growth will be calculated as a function of growth volume estimated. The estimated growth volume for the first stand model of mixed native species is based on the GPG-LULUCF data tables (3A.1.2 and 3A.1.3) as well as in field
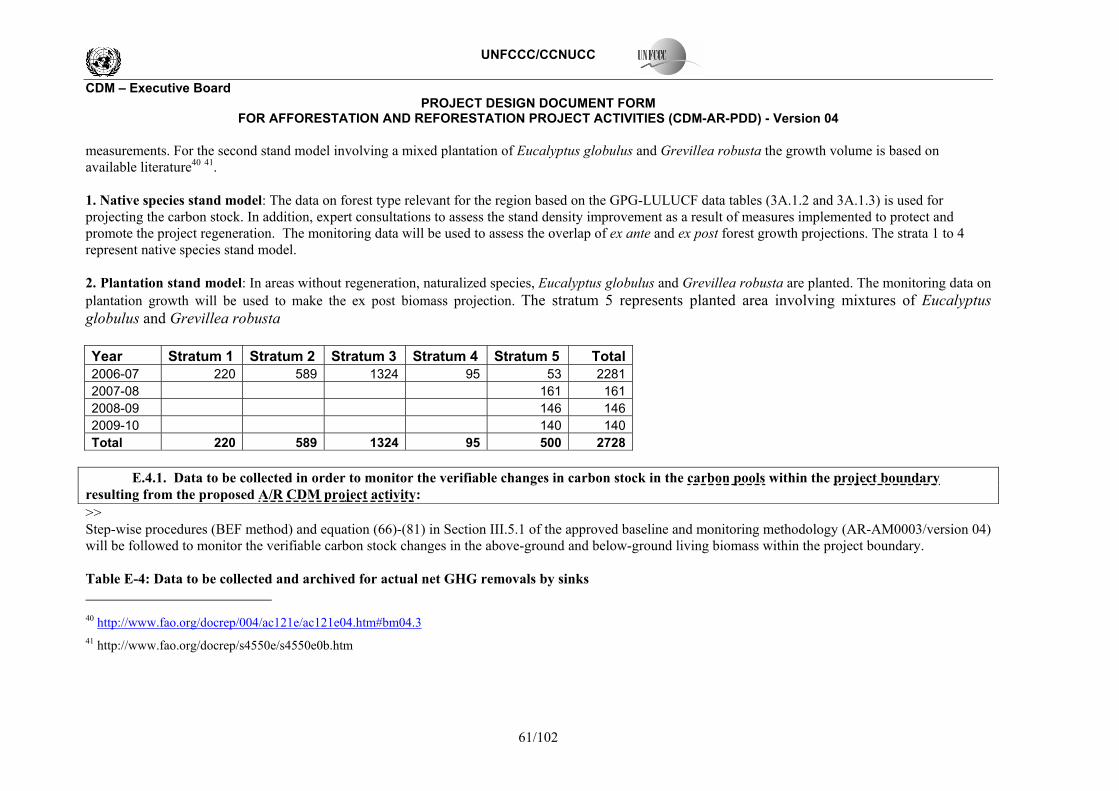
UNFCCC/CCNUCC
CDM � Executive Board PROJECT DESIGN DOCUMENT FORM
FOR AFFORESTATION AND REFORESTATION PROJECT ACTIVITIES (CDM-AR-PDD) - Version 04
61/102
measurements. For the second stand model involving a mixed plantation of Eucalyptus globulus and Grevillea robusta the growth volume is based on available literature40 41. 1. Native species stand model: The data on forest type relevant for the region based on the GPG-LULUCF data tables (3A.1.2 and 3A.1.3) is used for projecting the carbon stock. In addition, expert consultations to assess the stand density improvement as a result of measures implemented to protect and promote the project regeneration. The monitoring data will be used to assess the overlap of ex ante and ex post forest growth projections. The strata 1 to 4 represent native species stand model. 2. Plantation stand model: In areas without regeneration, naturalized species, Eucalyptus globulus and Grevillea robusta are planted. The monitoring data on plantation growth will be used to make the ex post biomass projection. The stratum 5 represents planted area involving mixtures of Eucalyptus globulus and Grevillea robusta Year Stratum 1 Stratum 2 Stratum 3 Stratum 4 Stratum 5 Total 2006-07 220 589 1324 95 53 2281 2007-08 161 161 2008-09 146 146 2009-10 140 140 Total 220 589 1324 95 500 2728
E.4.1. Data to be collected in order to monitor the verifiable changes in carbon stock in the carbon pools within the project boundary resulting from the proposed A/R CDM project activity: >> Step-wise procedures (BEF method) and equation (66)-(81) in Section III.5.1 of the approved baseline and monitoring methodology (AR-AM0003/version 04) will be followed to monitor the verifiable carbon stock changes in the above-ground and below-ground living biomass within the project boundary. Table E-4: Data to be collected and archived for actual net GHG removals by sinks 40 http://www.fao.org/docrep/004/ac121e/ac121e04.htm#bm04.3 41 http://www.fao.org/docrep/s4550e/s4550e0b.htm
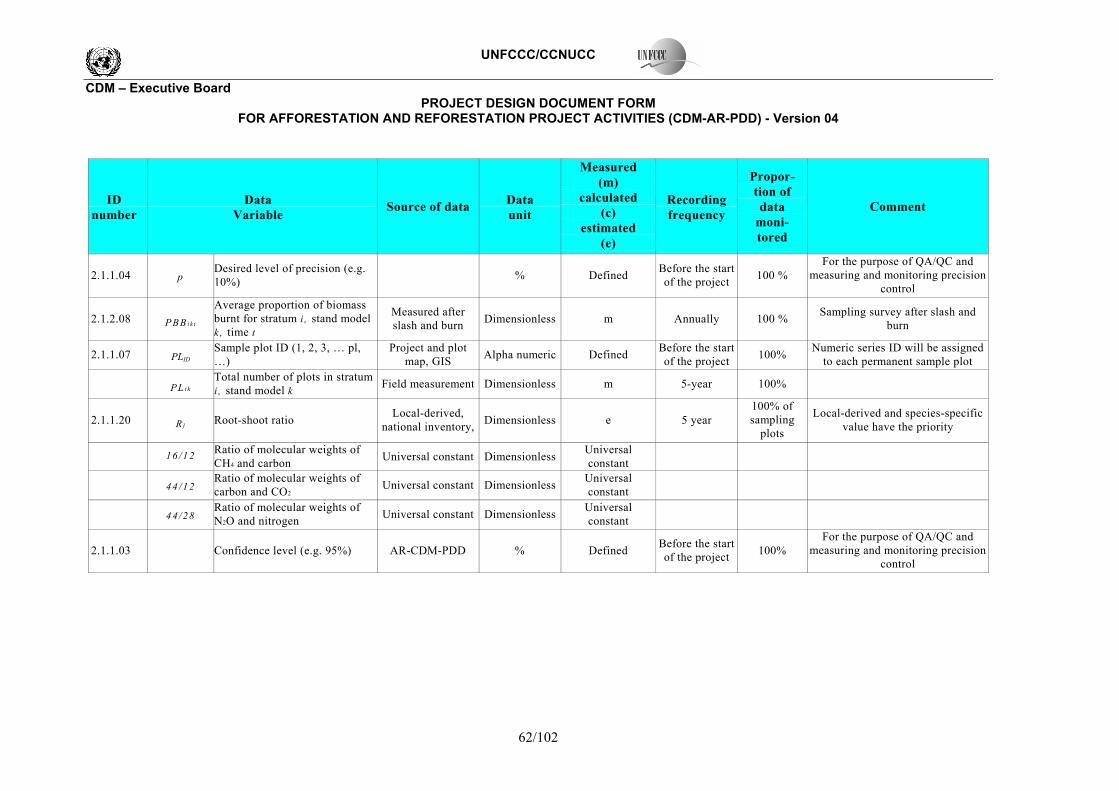
UNFCCC/CCNUCC
CDM � Executive Board PROJECT DESIGN DOCUMENT FORM
FOR AFFORESTATION AND REFORESTATION PROJECT ACTIVITIES (CDM-AR-PDD) - Version 04
62/102
ID number
Data Variable Source of data Data
unit
Measured (m)
calculated (c)
estimated (e)
Recordingfrequency
Propor- tion of data
moni- tored
Comment
2.1.1.04 p Desired level of precision (e.g.10%)
% Defined Before the start
of the project 100 % For the purpose of QA/QC and
measuring and monitoring precision control
2.1.2.08 PBB i kt
Average proportion of biomassburnt for stratum i , stand modelk , time t
Measured after slash and burn Dimensionless m Annually 100 % Sampling survey after slash and
burn
2.1.1.07 PLID Sample plot ID (1, 2, 3, � pl, �)
Project and plot map, GIS Alpha numeric Defined Before the start
of the project 100% Numeric series ID will be assigned to each permanent sample plot
PL i k
Total number of plots in stratum i , stand model k Field measurement Dimensionless m 5-year 100%
2.1.1.20 R j Root-shoot ratio Local-derived, national inventory, Dimensionless e 5 year
100% of sampling
plots
Local-derived and species-specific value have the priority
16 /12 Ratio of molecular weights of CH4 and carbon Universal constant Dimensionless Universal
constant
44 /12
Ratio of molecular weights of carbon and CO2 Universal constant Dimensionless Universal
constant
44 /28
Ratio of molecular weights of N2O and nitrogen Universal constant Dimensionless Universal
constant
2.1.1.03
Confidence level (e.g. 95%) AR-CDM-PDD % Defined Before the startof the project 100%
For the purpose of QA/QC and measuring and monitoring precision
control
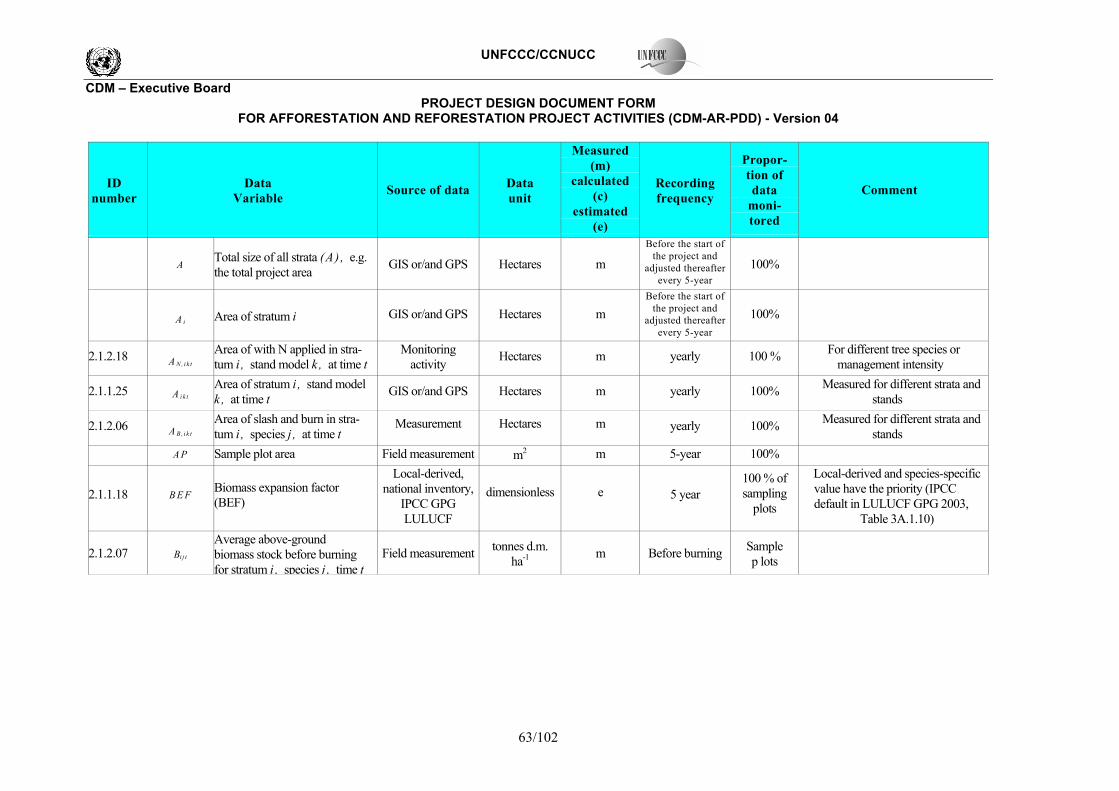
UNFCCC/CCNUCC
CDM � Executive Board PROJECT DESIGN DOCUMENT FORM
FOR AFFORESTATION AND REFORESTATION PROJECT ACTIVITIES (CDM-AR-PDD) - Version 04
63/102
ID number
Data Variable Source of data Data
unit
Measured (m)
calculated (c)
estimated (e)
Recording frequency
Propor-tion of data
moni- tored
Comment
A
Total size of all strata (A) , e.g.the total project area GIS or/and GPS Hectares m
Before the start ofthe project and
adjusted thereafterevery 5-year
100%
A i Area of stratum i GIS or/and GPS Hectares m
Before the start ofthe project and
adjusted thereafterevery 5-year
100%
2.1.2.18 A N ,i k t Area of with N applied in stra- tum i , stand model k , at time t
Monitoring activity Hectares m yearly 100 % For different tree species or
management intensity
2.1.1.25 A i k t Area of stratum i , stand model k , at time t GIS or/and GPS Hectares m yearly 100% Measured for different strata and
stands
2.1.2.06 A B, i k t Area of slash and burn in stra- tum i , species j , at time t
Measurement Hectares m yearly 100% Measured for different strata andstands
A P Sample plot area Field measurement m2 m 5-year 100%
2.1.1.18 B E F Biomass expansion factor (BEF)
Local-derived, national inventory,
IPCC GPG LULUCF
dimensionless e 5 year 100 % of sampling
plots
Local-derived and species-specificvalue have the priority (IPCC default in LULUCF GPG 2003,
Table 3A.1.10)
2.1.2.07 Bi j t
Average above-ground biomass stock before burning for stratum i , species j , time t
Field measurement tonnes d.m. ha-1 m Before burning Sample
p lots
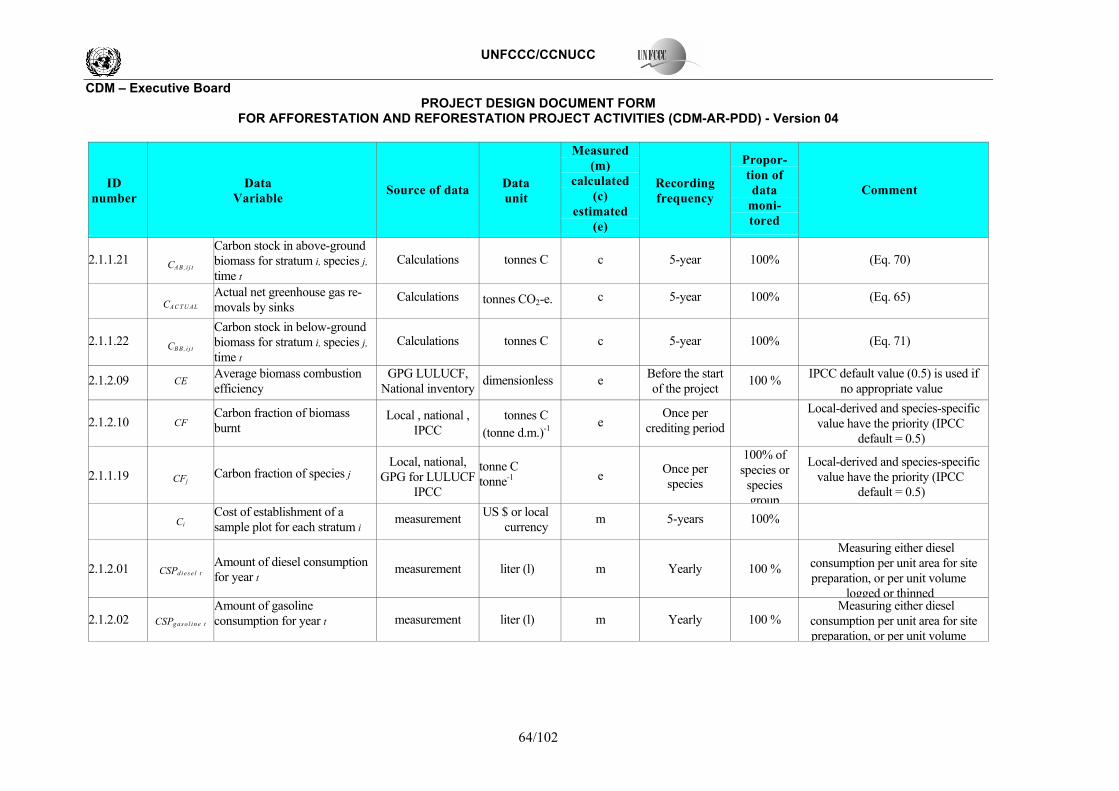
UNFCCC/CCNUCC
CDM � Executive Board PROJECT DESIGN DOCUMENT FORM
FOR AFFORESTATION AND REFORESTATION PROJECT ACTIVITIES (CDM-AR-PDD) - Version 04
64/102
ID number
Data Variable Source of data Data
unit
Measured (m)
calculated (c)
estimated (e)
Recording frequency
Propor-tion of data
moni- tored
Comment
2.1.1.21 CAB, i j t
Carbon stock in above-groundbiomass for stratum i, species j,time t
Calculations tonnes C c 5-year 100% (Eq. 70)
CAC T UAL
Actual net greenhouse gas re- movals by sinks
Calculations tonnes CO2-e. c 5-year 100% (Eq. 65)
2.1.1.22 CBB, i j t
Carbon stock in below-groundbiomass for stratum i, species j,time t
Calculations tonnes C c 5-year 100% (Eq. 71)
2.1.2.09 CE Average biomass combustion efficiency
GPG LULUCF,National inventory dimensionless e Before the start
of the project 100 % IPCC default value (0.5) is used ifno appropriate value
2.1.2.10 CF Carbon fraction of biomass burnt
Local , national ,IPCC
tonnes C (tonne d.m.)-1 e
Once per crediting period
Local-derived and species-specificvalue have the priority (IPCC
default = 0.5)
2.1.1.19 CFj Carbon fraction of species j Local, national,
GPG for LULUCFIPCC
tonne C tonne-1
e Once per
species
100% of species or
species group
Local-derived and species-specificvalue have the priority (IPCC
default = 0.5)
Ci Cost of establishment of a sample plot for each stratum i measurement US $ or local
currency m 5-years 100%
2.1.2.01 CSPd i es e l tAmount of diesel consumptionfor year t measurement liter (l) m Yearly 100 %
Measuring either diesel consumption per unit area for sitepreparation, or per unit volume
logged or thinned
2.1.2.02 CSPga s o l i n e t
Amount of gasoline consumption for year t measurement liter (l) m Yearly 100 %
Measuring either diesel consumption per unit area for sitepreparation, or per unit volume
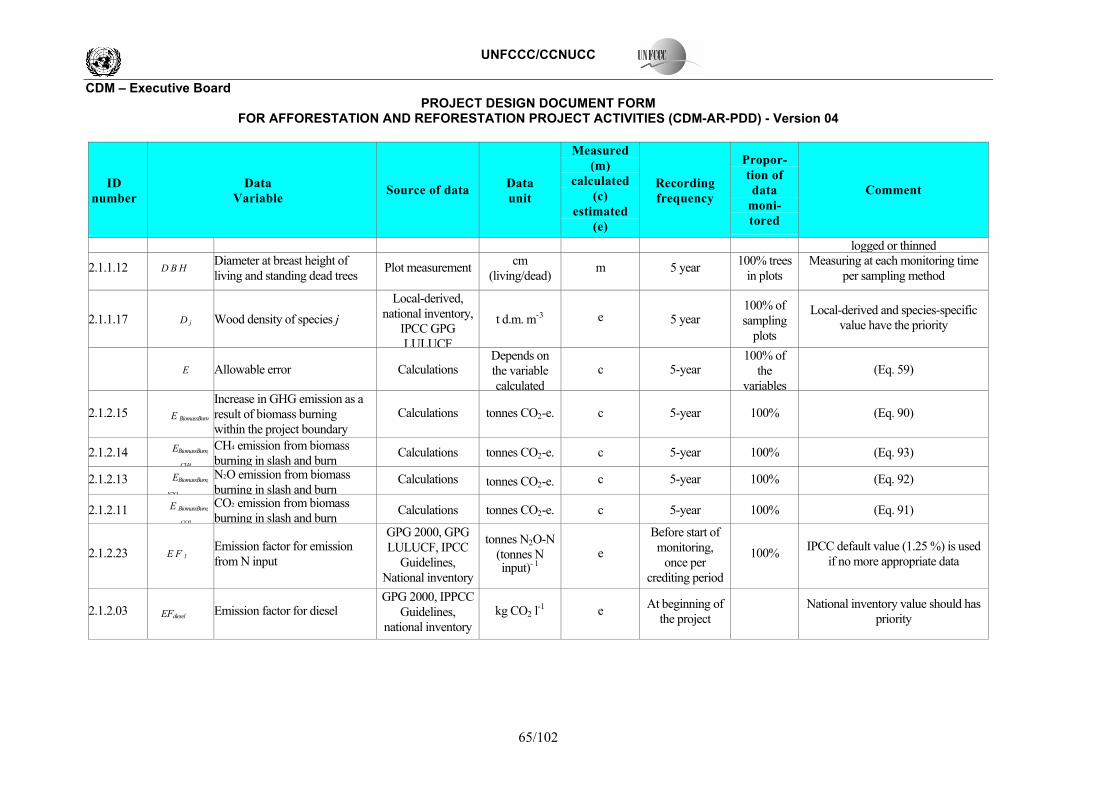
UNFCCC/CCNUCC
CDM � Executive Board PROJECT DESIGN DOCUMENT FORM
FOR AFFORESTATION AND REFORESTATION PROJECT ACTIVITIES (CDM-AR-PDD) - Version 04
65/102
ID number
Data Variable Source of data Data
unit
Measured (m)
calculated (c)
estimated (e)
Recording frequency
Propor-tion of data
moni- tored
Comment
logged or thinned
2.1.1.12 D B H Diameter at breast height of living and standing dead trees Plot measurement cm
(living/dead) m 5 year 100% treesin plots
Measuring at each monitoring timeper sampling method
2.1.1.17 D j Wood density of species j Local-derived,
national inventory,IPCC GPG LULUCF
t d.m. m-3 e 5 year 100% of sampling
plots
Local-derived and species-specificvalue have the priority
E Allowable error Calculations
Depends on the variable calculated
c 5-year 100% of
the variables
(Eq. 59)
2.1.2.15 E BiomassBurn
Increase in GHG emission as a result of biomass burning within the project boundary
Calculations tonnes CO2-e. c 5-year 100% (Eq. 90)
2.1.2.14 EBiomassBurn,
CH4
CH4 emission from biomass burning in slash and burn Calculations tonnes CO2-e. c 5-year 100% (Eq. 93)
2.1.2.13 EBiomassBurn,
N2O
N2O emission from biomass burning in slash and burn
Calculations tonnes CO2-e. c 5-year 100% (Eq. 92)
2.1.2.11 E BiomassBurn,
CO2
CO2 emission from biomass burning in slash and burn Calculations tonnes CO2-e. c 5-year 100% (Eq. 91)
2.1.2.23 E F 1 Emission factor for emission from N input
GPG 2000, GPGLULUCF, IPCC
Guidelines, National inventory
tonnes N2O-N(tonnes N input)- 1
e Before start ofmonitoring,
once per crediting period
100% IPCC default value (1.25 %) is usedif no more appropriate data
2.1.2.03 EFdiesel Emission factor for diesel GPG 2000, IPPCC
Guidelines, national inventory
kg CO2 l-1 e At beginning ofthe project
National inventory value should haspriority
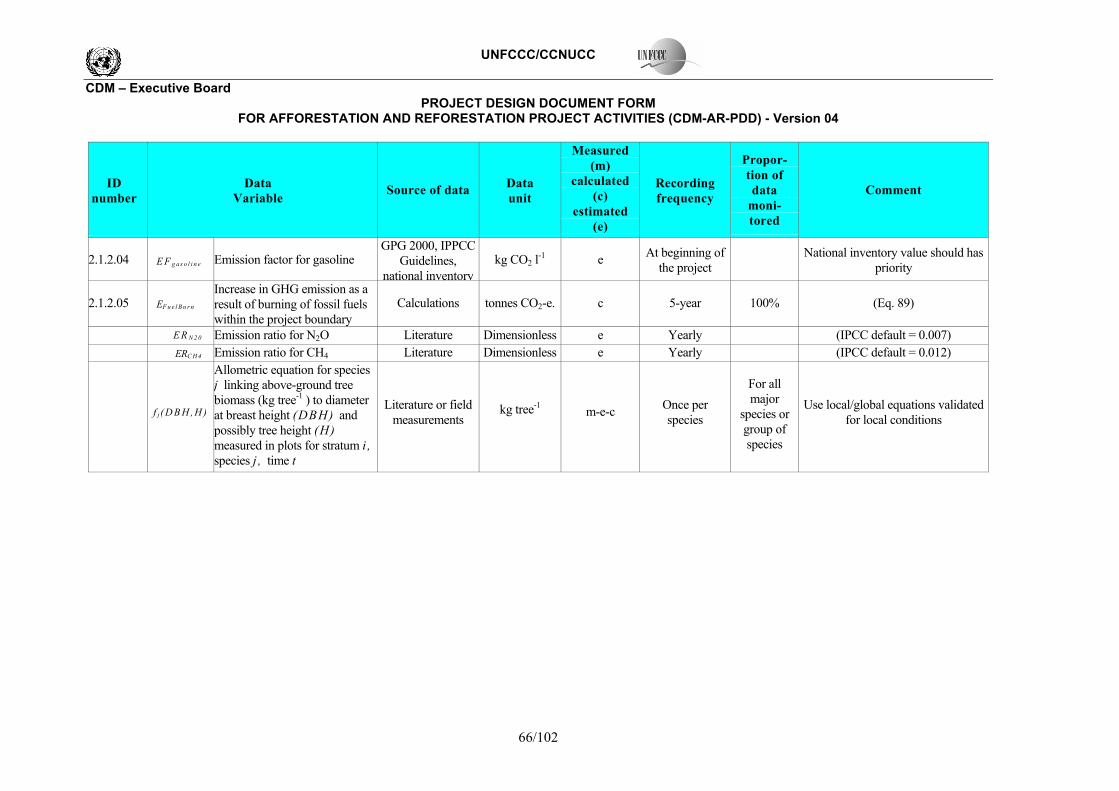
UNFCCC/CCNUCC
CDM � Executive Board PROJECT DESIGN DOCUMENT FORM
FOR AFFORESTATION AND REFORESTATION PROJECT ACTIVITIES (CDM-AR-PDD) - Version 04
66/102
ID number
Data Variable Source of data Data
unit
Measured (m)
calculated (c)
estimated (e)
Recording frequency
Propor-tion of data
moni- tored
Comment
2.1.2.04 E F g a s o l i n e Emission factor for gasoline GPG 2000, IPPCC
Guidelines, national inventory
kg CO2 l-1 e At beginning ofthe project
National inventory value should has priority
2.1.2.05 EF u e l B u r n Increase in GHG emission as aresult of burning of fossil fuelswithin the project boundary
Calculations tonnes CO2-e. c 5-year 100% (Eq. 89)
E R N 2 0 Emission ratio for N2O Literature Dimensionless e Yearly (IPCC default = 0.007) ERC H 4 Emission ratio for CH4 Literature Dimensionless e Yearly (IPCC default = 0.012)
f j ( D B H , H )
Allometric equation for speciesj linking above-ground tree biomass (kg tree-1 ) to diameterat breast height (DBH) and possibly tree height (H) measured in plots for stratum i ,species j , time t
Literature or fieldmeasurements
kg tree-1 m-e-c Once per species
For all major
species orgroup of species
Use local/global equations validated for local conditions
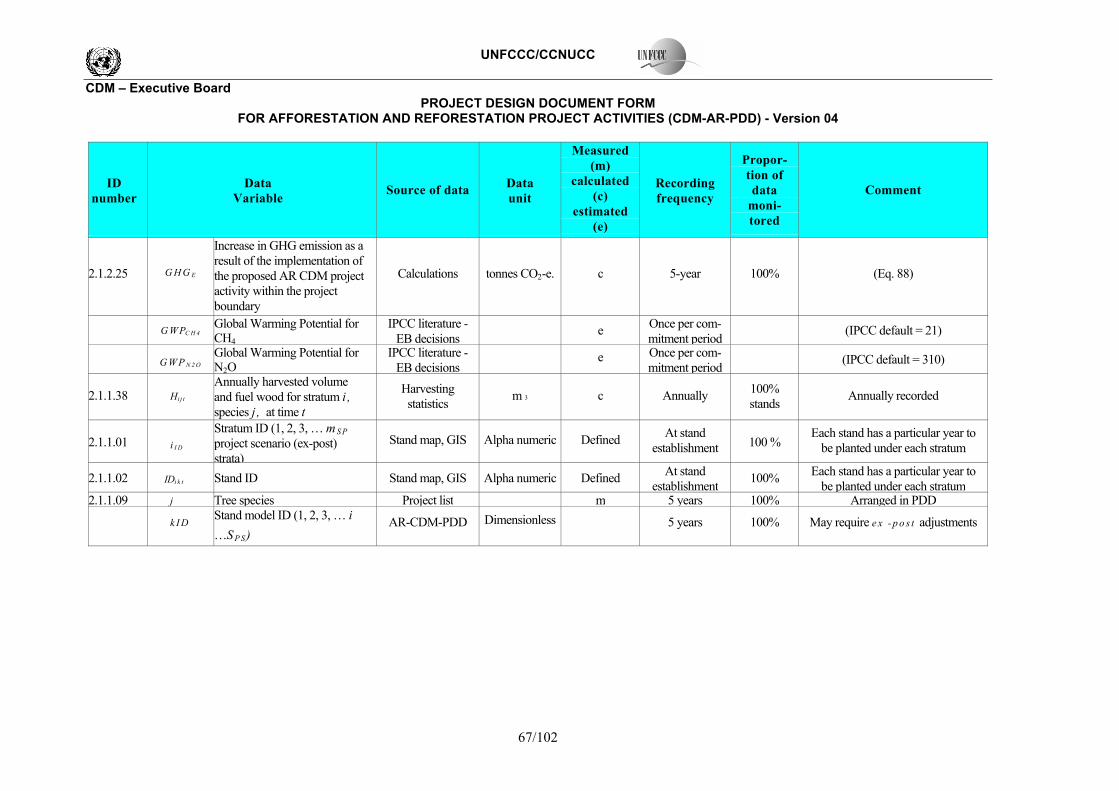
UNFCCC/CCNUCC
CDM � Executive Board PROJECT DESIGN DOCUMENT FORM
FOR AFFORESTATION AND REFORESTATION PROJECT ACTIVITIES (CDM-AR-PDD) - Version 04
67/102
ID number
Data Variable Source of data Data
unit
Measured (m)
calculated (c)
estimated (e)
Recording frequency
Propor-tion of data
moni- tored
Comment
2.1.2.25 G H G E
Increase in GHG emission as a result of the implementation of the proposed AR CDM project activity within the project boundary
Calculations tonnes CO2-e. c 5-year 100% (Eq. 88)
G WPC H 4 Global Warming Potential for CH4
IPCC literature -EB decisions
e Once per com-mitment period
(IPCC default = 21)
G W P N 2 O
Global Warming Potential for N2O
IPCC literature -EB decisions
e Once per com-mitment period
(IPCC default = 310)
2.1.1.38 Hi j t Annually harvested volume and fuel wood for stratum i , species j , at time t
Harvesting statistics m 3 c Annually 100%
stands Annually recorded
2.1.1.01 i I D Stratum ID (1, 2, 3, � m S P project scenario (ex-post) strata)
Stand map, GIS Alpha numeric Defined At stand establishment 100 %
Each stand has a particular year to be planted under each stratum
2.1.1.02 IDi k t Stand ID Stand map, GIS Alpha numeric Defined At stand establishment 100% Each stand has a particular year to
be planted under each stratum2.1.1.09 j Tree species Project list m 5 years 100% Arranged in PDD
k I D Stand model ID (1, 2, 3, � i �S P S)
AR-CDM-PDD Dimensionless 5 years 100% May require e x - p o s t adjustments
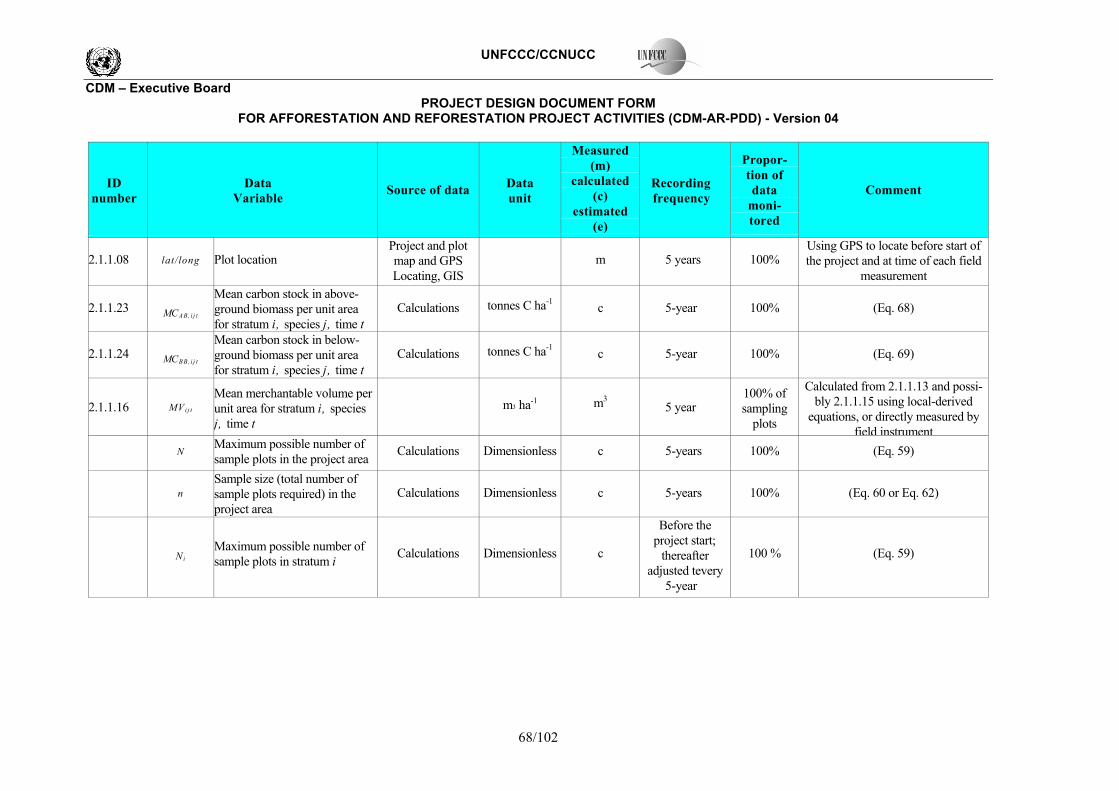
UNFCCC/CCNUCC
CDM � Executive Board PROJECT DESIGN DOCUMENT FORM
FOR AFFORESTATION AND REFORESTATION PROJECT ACTIVITIES (CDM-AR-PDD) - Version 04
68/102
ID number
Data Variable Source of data Data
unit
Measured (m)
calculated (c)
estimated (e)
Recording frequency
Propor-tion of data
moni- tored
Comment
2.1.1.08 lat/long Plot location Project and plotmap and GPS Locating, GIS
m 5 years 100%
Using GPS to locate before start ofthe project and at time of each field
measurement
2.1.1.23 MCAB, i j t
Mean carbon stock in above- ground biomass per unit area for stratum i, species j, time t
Calculations tonnes C ha-1 c 5-year 100% (Eq. 68)
2.1.1.24 MCBB, i j t
Mean carbon stock in below- ground biomass per unit area for stratum i, species j, time t
Calculations tonnes C ha-1 c 5-year 100% (Eq. 69)
2.1.1.16 MVi j t Mean merchantable volume perunit area for stratum i, speciesj, time t
m3 ha-1 m3 5 year
100% of sampling
plots
Calculated from 2.1.1.13 and possi- bly 2.1.1.15 using local-derived
equations, or directly measured byfield instrument
N
Maximum possible number of sample plots in the project area Calculations Dimensionless c 5-years 100% (Eq. 59)
n
Sample size (total number of sample plots required) in the project area
Calculations Dimensionless c 5-years 100% (Eq. 60 or Eq. 62)
Ni Maximum possible number of sample plots in stratum i Calculations Dimensionless c
Before the project start;
thereafter adjusted tevery
5-year
100 % (Eq. 59)
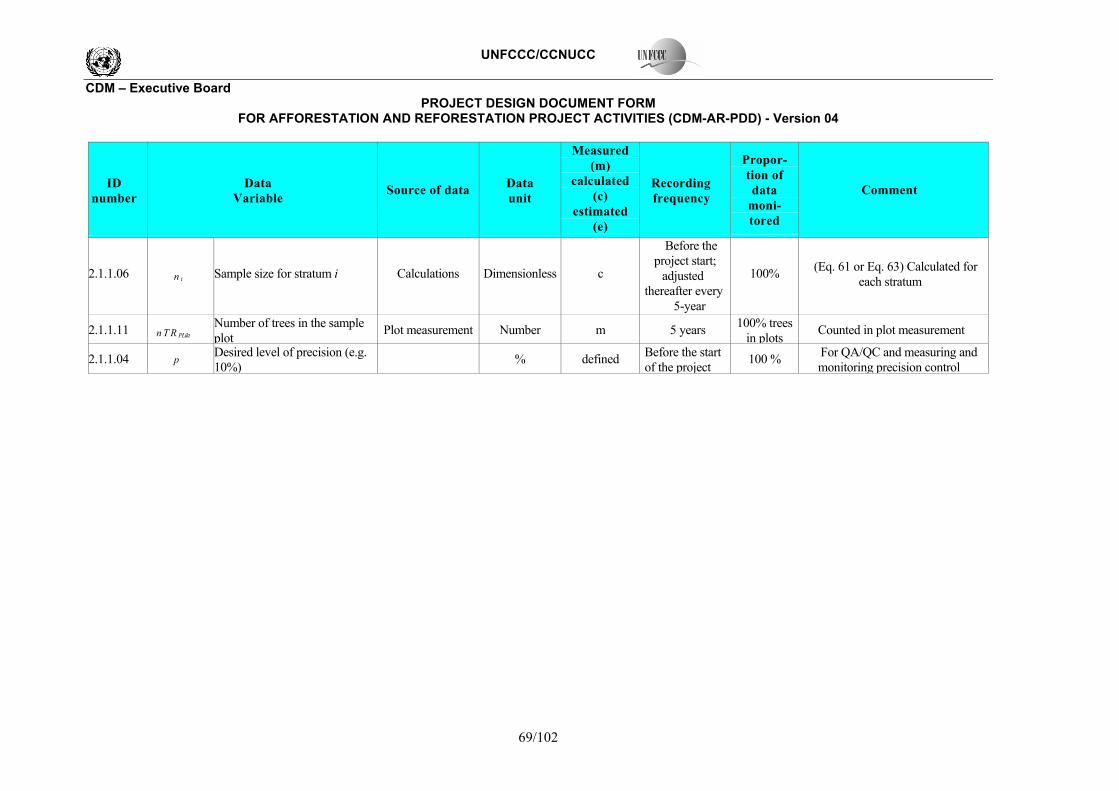
UNFCCC/CCNUCC
CDM � Executive Board PROJECT DESIGN DOCUMENT FORM
FOR AFFORESTATION AND REFORESTATION PROJECT ACTIVITIES (CDM-AR-PDD) - Version 04
69/102
ID number
Data Variable Source of data Data
unit
Measured (m)
calculated (c)
estimated (e)
Recording frequency
Propor-tion of data
moni- tored
Comment
2.1.1.06 n i Sample size for stratum i Calculations Dimensionless c
Before the project start;
adjusted thereafter every
5-year
100% (Eq. 61 or Eq. 63) Calculated foreach stratum
2.1.1.11 n T R PLikt Number of trees in the sample plot Plot measurement Number m 5 years 100% trees
in plots Counted in plot measurement
2.1.1.04 p Desired level of precision (e.g.10%)
% defined Before the startof the project 100 % For QA/QC and measuring and
monitoring precision control

UNFCCC/CCNUCC
CDM � Executive Board PROJECT DESIGN DOCUMENT FORM
FOR AFFORESTATION AND REFORESTATION PROJECT ACTIVITIES (CDM-AR-PDD) - Version 04
70/102
ID number
Data Variable Source of data Data
unit
Measured (m)
calculated (c)
estimated (e)
Recording frequency
Propor-tion of data
moni- tored
Comment
2.1.2.08 PBBi k t Proportion of biomass burnt Measured after
slash and burn Dimensionless m Annually 100% Sampling survey after slash and burn
PBBi k t
Average proportion of biomass burnt for stratum i , stand modelk, time t
Field estimates orliterature Dimensionless e Before burning sample
plots
Used for estimating numbers of sample plots of each stratum and
stand, as necessary
2.1.1.07 PL I D Sample plot ID (1, 2, 3, � pl) Project and plot map, GIS Alpha numeric defined Before the start
of the project 100% Numeric series ID will be assignedto each permanent sample plot
PLi k
Total number of plots in stratum i , stand model k Field measurement Dimensionless m 5-year 100%
2.1.1.20 R j Root-shoot ratio Local-derived,
national inventory, Dimensionless e 5 year 100% of sampling
plots
Local-derived and species-specificvalue have the priority
2.1.1.05 s t i Standard deviation for each stratum i
e At each moni-
toring event 100% Used for estimating numbers of sample plots of each stratum and
stand, as necessary TB A B j
Above-ground biomass of a tree of species j
Calculations kg dry mattertree-1 c 5-year 100% (Eq. 74)
TC A B j
Carbon stock in above-ground biomass per tree of species j Calculations k g C tree-1 c 5- y ear 100% (Eq. 75 )
TC B B j
Carbon stock in below-ground biomass per tree of species j Calculations k g C tree-1 c 5- y ear 100% (Eq. 75 )
2.1.1.10 t ID Age of plantation (1, 2� years) GIS Year m At stand establishment 100% Counted since the planted year
t rI D
Tree ID (1, 2, 3, � tr � TR = total number of trees in plot) Field measurement Dimensionless m 5-year 100%
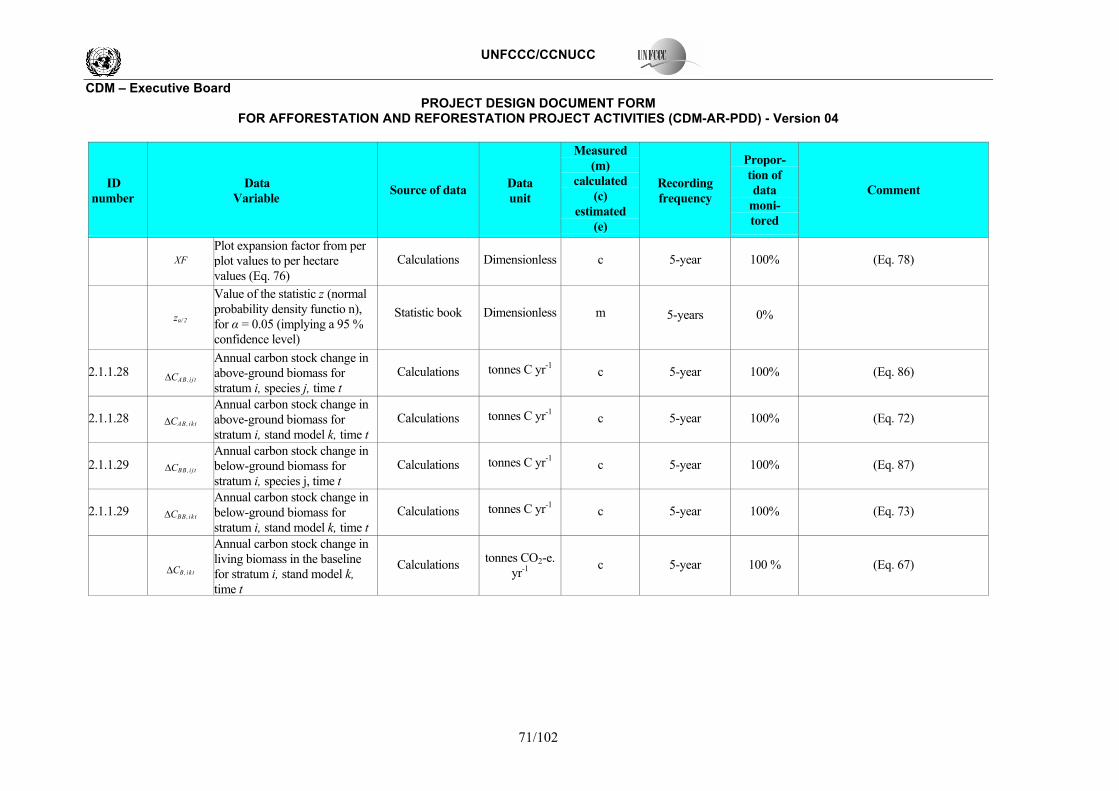
UNFCCC/CCNUCC
CDM � Executive Board PROJECT DESIGN DOCUMENT FORM
FOR AFFORESTATION AND REFORESTATION PROJECT ACTIVITIES (CDM-AR-PDD) - Version 04
71/102
ID number
Data Variable Source of data Data
unit
Measured (m)
calculated (c)
estimated (e)
Recording frequency
Propor- tion of data
moni- tored
Comment
XF
Plot expansion factor from perplot values to per hectare values (Eq. 76)
Calculations Dimensionless c 5-year 100% (Eq. 78)
zα/ 2
Value of the statistic z (normalprobability density functio n), for α = 0.05 (implying a 95 % confidence level)
Statistic book Dimensionless m 5-years 0%
2.1.1.28 ∆CAB,i j t
Annual carbon stock change inabove-ground biomass for stratum i, species j, time t
Calculations tonnes C yr-1 c 5-year 100% (Eq. 86)
2.1.1.28 ∆CAB,ikt Annual carbon stock change inabove-ground biomass for stratum i, stand model k, time t
Calculations tonnes C yr-1 c 5-year 100% (Eq. 72)
2.1.1.29 ∆CBB,i j t Annual carbon stock change inbelow-ground biomass for stratum i, species j, time t
Calculations tonnes C yr-1 c 5-year 100% (Eq. 87)
2.1.1.29 ∆CBB,ikt Annual carbon stock change inbelow-ground biomass for stratum i, stand model k, time t
Calculations tonnes C yr-1 c 5-year 100% (Eq. 73)
∆CB,ikt
Annual carbon stock change inliving biomass in the baseline for stratum i, stand model k, time t
Calculations tonnes CO2-e.yr-1 c 5-year 100 % (Eq. 67)
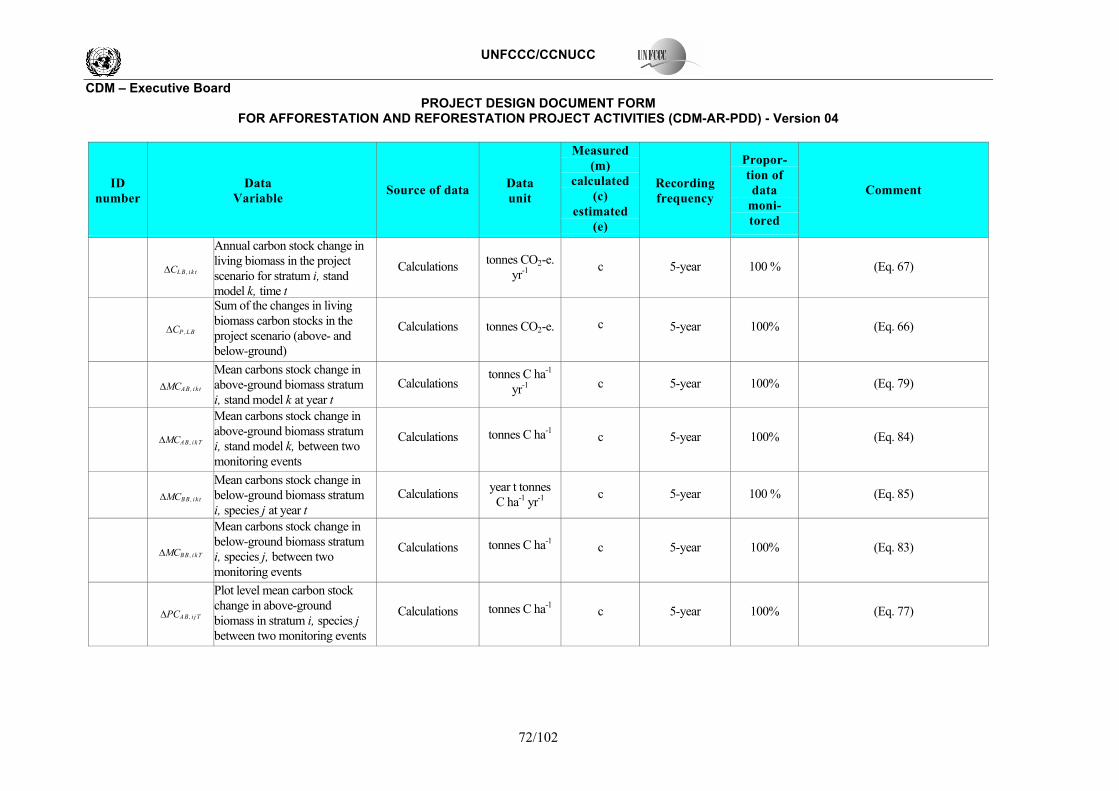
UNFCCC/CCNUCC
CDM � Executive Board PROJECT DESIGN DOCUMENT FORM
FOR AFFORESTATION AND REFORESTATION PROJECT ACTIVITIES (CDM-AR-PDD) - Version 04
72/102
ID number
Data Variable Source of data Data
unit
Measured (m)
calculated (c)
estimated (e)
Recording frequency
Propor-tion of data
moni- tored
Comment
∆CLB, i k t
Annual carbon stock change in living biomass in the project scenario for stratum i, stand model k, time t
Calculations tonnes CO2-e.yr-1 c 5-year 100 % (Eq. 67)
∆CP,LB
Sum of the changes in living biomass carbon stocks in the project scenario (above- and below-ground)
Calculations tonnes CO2-e. c 5-year 100% (Eq. 66)
∆MCAB, i k t
Mean carbons stock change in above-ground biomass stratum i, stand model k at year t
Calculations tonnes C ha-1
yr-1 c 5-year 100% (Eq. 79)
∆MCAB, i k T
Mean carbons stock change in above-ground biomass stratum i, stand model k, between two monitoring events
Calculations tonnes C ha-1 c 5-year 100% (Eq. 84)
∆MCBB, i k t
Mean carbons stock change in below-ground biomass stratum i, species j at year t
Calculations year t tonnesC ha-1 yr-1 c 5-year 100 % (Eq. 85)
∆MCBB, i k T
Mean carbons stock change in below-ground biomass stratum i, species j, between two monitoring events
Calculations tonnes C ha-1 c 5-year 100% (Eq. 83)
∆PCAB, i j T
Plot level mean carbon stock change in above-ground biomass in stratum i, species j between two monitoring events
Calculations tonnes C ha-1 c 5-year 100% (Eq. 77)
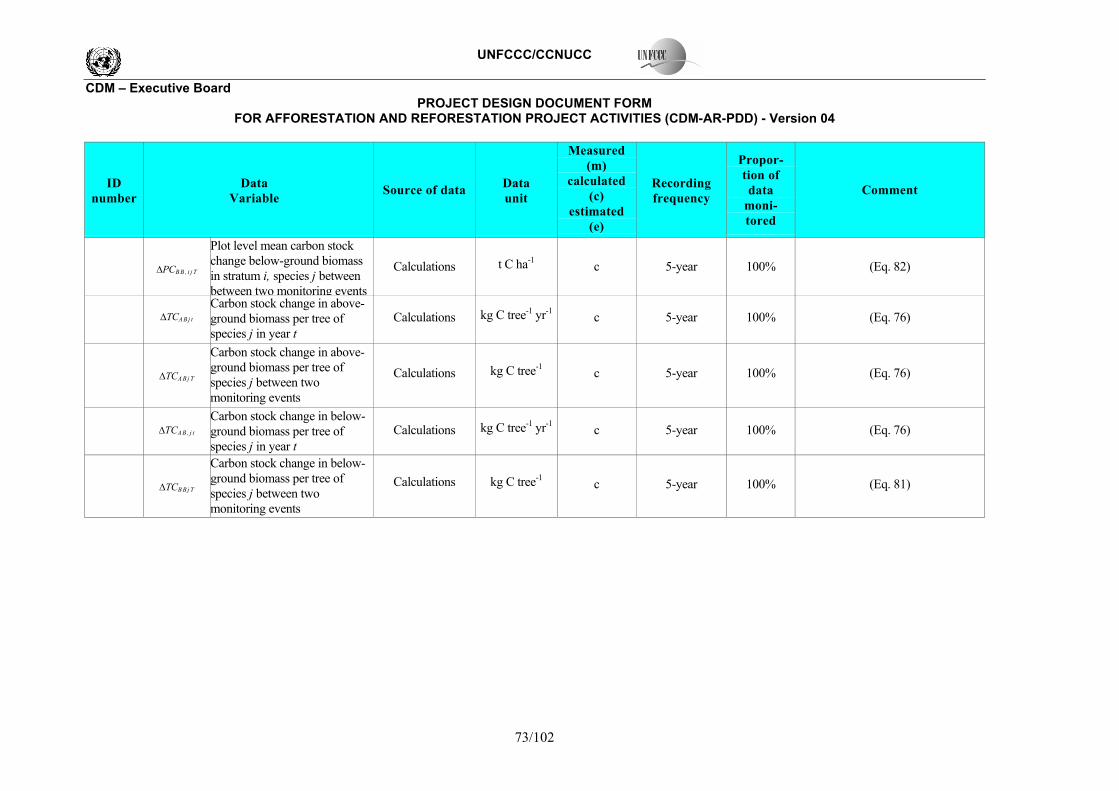
UNFCCC/CCNUCC
CDM � Executive Board PROJECT DESIGN DOCUMENT FORM
FOR AFFORESTATION AND REFORESTATION PROJECT ACTIVITIES (CDM-AR-PDD) - Version 04
73/102
ID number
Data Variable Source of data Data
unit
Measured (m)
calculated (c)
estimated (e)
Recording frequency
Propor-tion of data
moni- tored
Comment
∆PCB B , i j T
Plot level mean carbon stock change below-ground biomassin stratum i, species j between between two monitoring events
Calculations t C ha-1 c 5-year 100% (Eq. 82)
∆TCA B j t
Carbon stock change in above-ground biomass per tree of species j in year t
Calculations kg C tree-1 yr-1 c 5-year 100% (Eq. 76)
∆TCA B j T
Carbon stock change in above-ground biomass per tree of species j between two monitoring events
Calculations kg C tree-1 c 5-year 100% (Eq. 76)
∆TCA B , j t
Carbon stock change in below-ground biomass per tree of species j in year t
Calculations kg C tree-1 yr-1 c 5-year 100% (Eq. 76)
∆TCB B j T
Carbon stock change in below-ground biomass per tree of species j between two monitoring events
Calculations kg C tree-1 c 5-year 100% (Eq. 81)
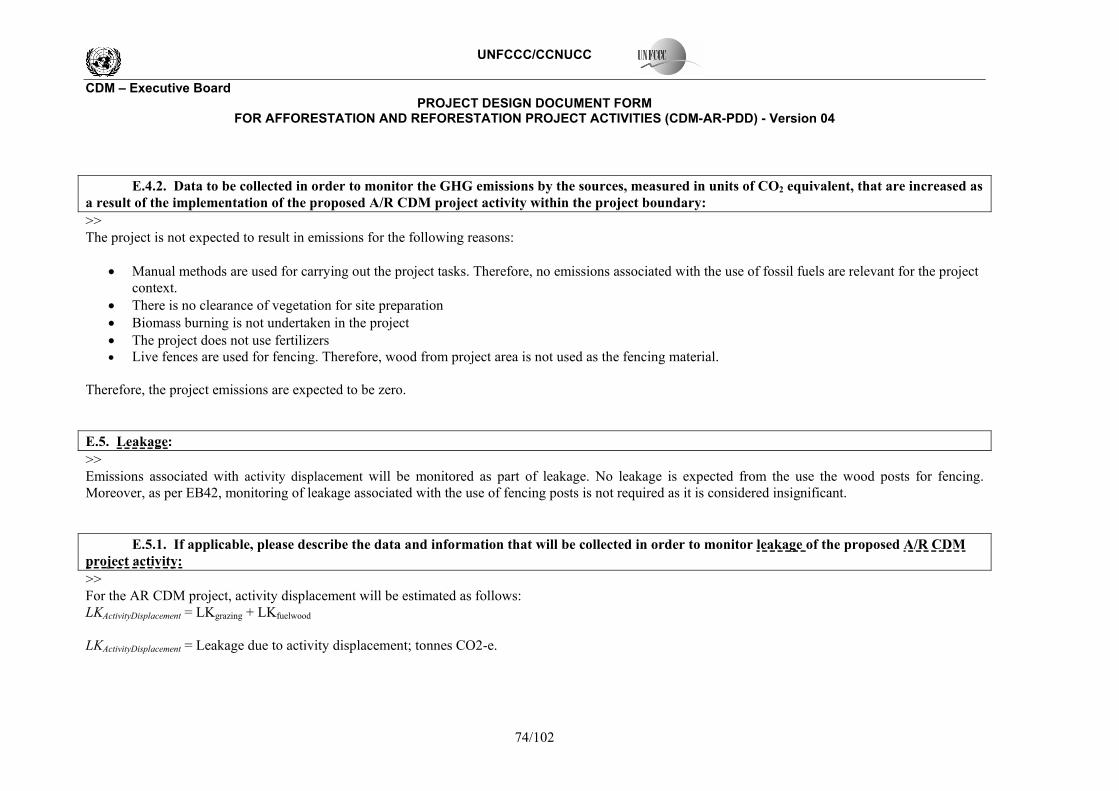
UNFCCC/CCNUCC
CDM � Executive Board PROJECT DESIGN DOCUMENT FORM
FOR AFFORESTATION AND REFORESTATION PROJECT ACTIVITIES (CDM-AR-PDD) - Version 04
74/102
E.4.2. Data to be collected in order to monitor the GHG emissions by the sources, measured in units of CO2 equivalent, that are increased as a result of the implementation of the proposed A/R CDM project activity within the project boundary: >> The project is not expected to result in emissions for the following reasons:
• Manual methods are used for carrying out the project tasks. Therefore, no emissions associated with the use of fossil fuels are relevant for the project context.
• There is no clearance of vegetation for site preparation • Biomass burning is not undertaken in the project • The project does not use fertilizers • Live fences are used for fencing. Therefore, wood from project area is not used as the fencing material.
Therefore, the project emissions are expected to be zero. E.5. Leakage: >> Emissions associated with activity displacement will be monitored as part of leakage. No leakage is expected from the use the wood posts for fencing. Moreover, as per EB42, monitoring of leakage associated with the use of fencing posts is not required as it is considered insignificant. E.5.1. If applicable, please describe the data and information that will be collected in order to monitor leakage of the proposed A/R CDM project activity: >> For the AR CDM project, activity displacement will be estimated as follows: LKActivityDisplacement = LKgrazing + LKfuelwood LKActivityDisplacement = Leakage due to activity displacement; tonnes CO2-e.
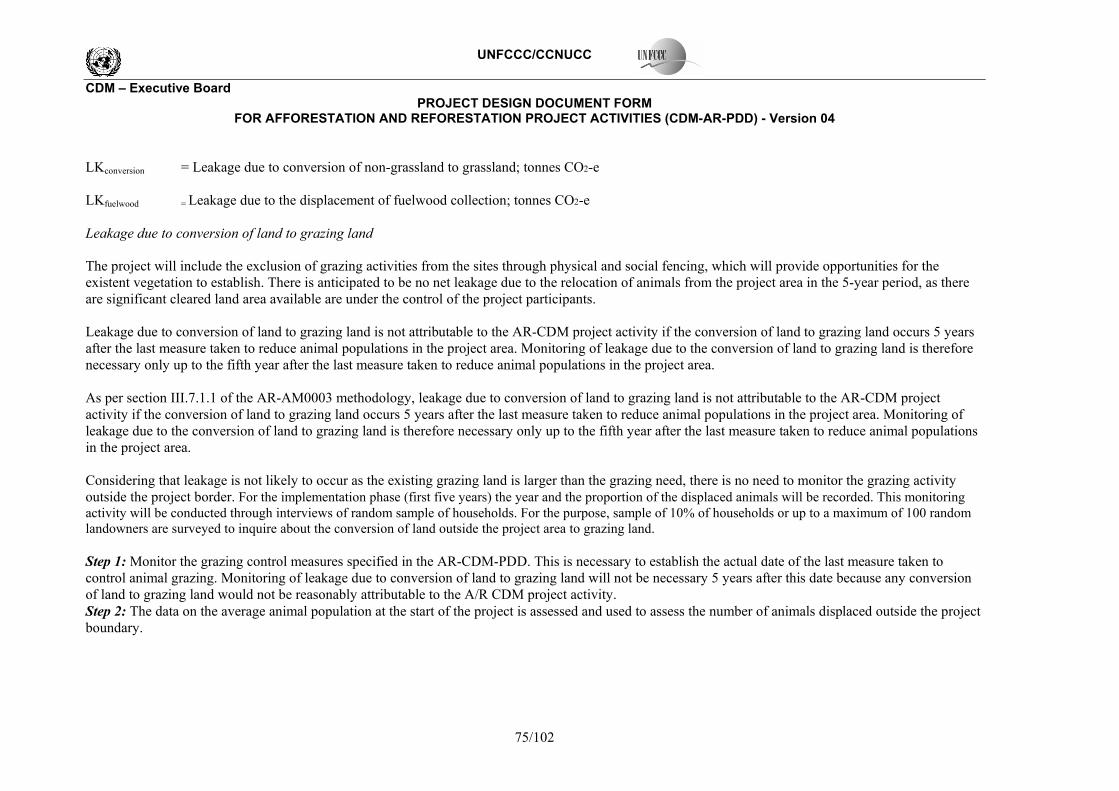
UNFCCC/CCNUCC
CDM � Executive Board PROJECT DESIGN DOCUMENT FORM
FOR AFFORESTATION AND REFORESTATION PROJECT ACTIVITIES (CDM-AR-PDD) - Version 04
75/102
LKconversion = Leakage due to conversion of non-grassland to grassland; tonnes CO2-e LKfuelwood = Leakage due to the displacement of fuelwood collection; tonnes CO2-e Leakage due to conversion of land to grazing land The project will include the exclusion of grazing activities from the sites through physical and social fencing, which will provide opportunities for the existent vegetation to establish. There is anticipated to be no net leakage due to the relocation of animals from the project area in the 5-year period, as there are significant cleared land area available are under the control of the project participants. Leakage due to conversion of land to grazing land is not attributable to the AR-CDM project activity if the conversion of land to grazing land occurs 5 years after the last measure taken to reduce animal populations in the project area. Monitoring of leakage due to the conversion of land to grazing land is therefore necessary only up to the fifth year after the last measure taken to reduce animal populations in the project area. As per section III.7.1.1 of the AR-AM0003 methodology, leakage due to conversion of land to grazing land is not attributable to the AR-CDM project activity if the conversion of land to grazing land occurs 5 years after the last measure taken to reduce animal populations in the project area. Monitoring of leakage due to the conversion of land to grazing land is therefore necessary only up to the fifth year after the last measure taken to reduce animal populations in the project area. Considering that leakage is not likely to occur as the existing grazing land is larger than the grazing need, there is no need to monitor the grazing activity outside the project border. For the implementation phase (first five years) the year and the proportion of the displaced animals will be recorded. This monitoring activity will be conducted through interviews of random sample of households. For the purpose, sample of 10% of households or up to a maximum of 100 random landowners are surveyed to inquire about the conversion of land outside the project area to grazing land. Step 1: Monitor the grazing control measures specified in the AR-CDM-PDD. This is necessary to establish the actual date of the last measure taken to control animal grazing. Monitoring of leakage due to conversion of land to grazing land will not be necessary 5 years after this date because any conversion of land to grazing land would not be reasonably attributable to the A/R CDM project activity. Step 2: The data on the average animal population at the start of the project is assessed and used to assess the number of animals displaced outside the project boundary.
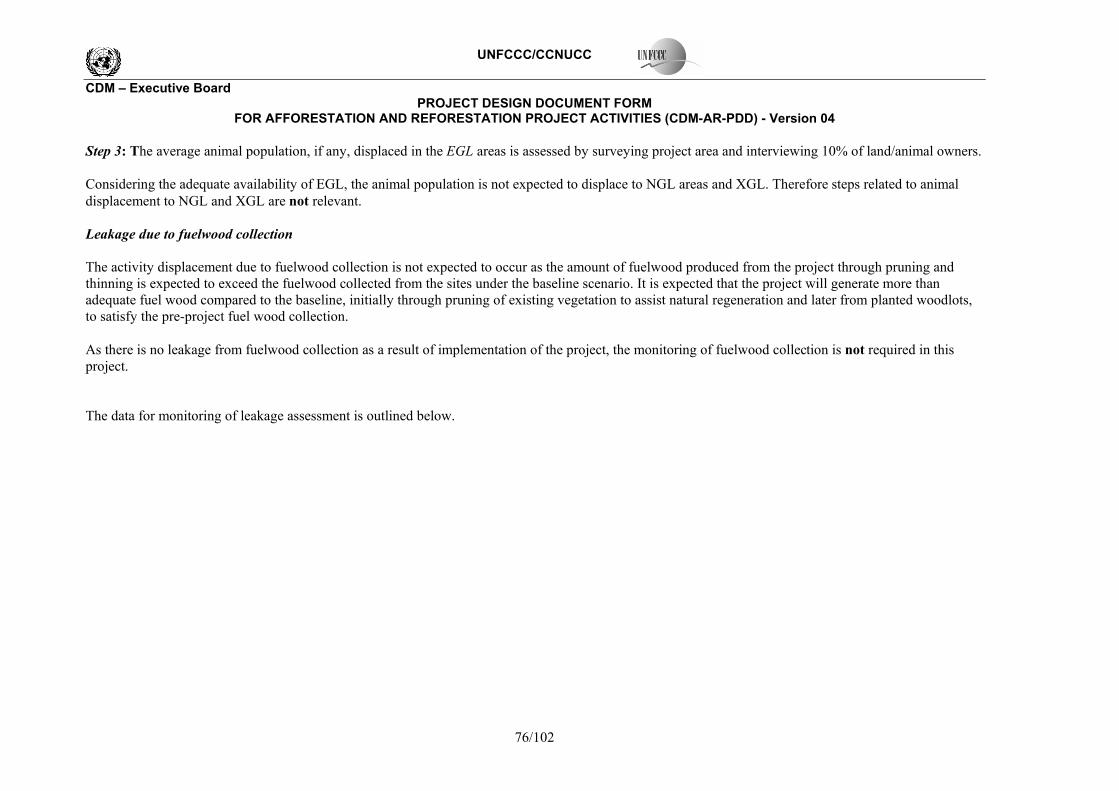
UNFCCC/CCNUCC
CDM � Executive Board PROJECT DESIGN DOCUMENT FORM
FOR AFFORESTATION AND REFORESTATION PROJECT ACTIVITIES (CDM-AR-PDD) - Version 04
76/102
Step 3: The average animal population, if any, displaced in the EGL areas is assessed by surveying project area and interviewing 10% of land/animal owners. Considering the adequate availability of EGL, the animal population is not expected to displace to NGL areas and XGL. Therefore steps related to animal displacement to NGL and XGL are not relevant. Leakage due to fuelwood collection The activity displacement due to fuelwood collection is not expected to occur as the amount of fuelwood produced from the project through pruning and thinning is expected to exceed the fuelwood collected from the sites under the baseline scenario. It is expected that the project will generate more than adequate fuel wood compared to the baseline, initially through pruning of existing vegetation to assist natural regeneration and later from planted woodlots, to satisfy the pre-project fuel wood collection. As there is no leakage from fuelwood collection as a result of implementation of the project, the monitoring of fuelwood collection is not required in this project. The data for monitoring of leakage assessment is outlined below.
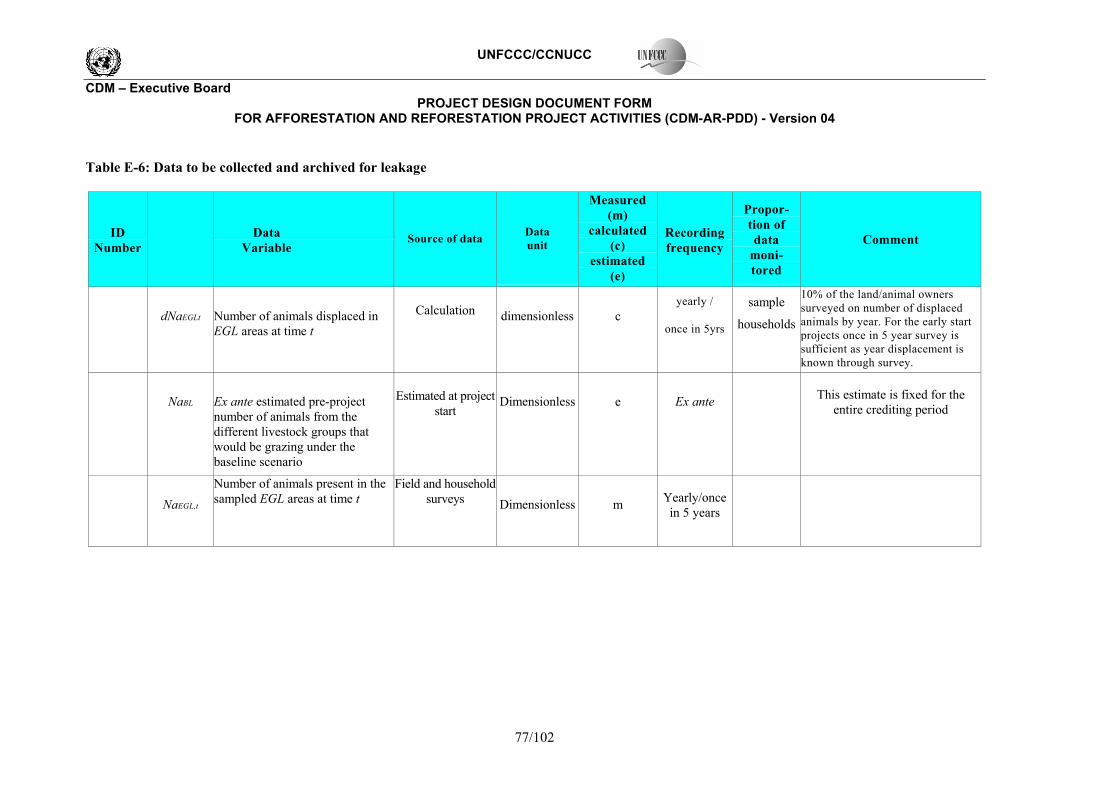
UNFCCC/CCNUCC
CDM � Executive Board PROJECT DESIGN DOCUMENT FORM
FOR AFFORESTATION AND REFORESTATION PROJECT ACTIVITIES (CDM-AR-PDD) - Version 04
77/102
Table E-6: Data to be collected and archived for leakage
ID Number
Data Variable
Source of data Data unit
Measured (m)
calculated (c)
estimated (e)
Recordingfrequency
Propor-tion of data
moni- tored
Comment
dNaEGLt Number of animals displaced in EGL areas at time t
Calculation dimensionless c
yearly /
once in 5yrs
sample
households
10% of the land/animal owners surveyed on number of displaced animals by year. For the early start projects once in 5 year survey is sufficient as year displacement is known through survey.
NaBL Ex ante estimated pre-project number of animals from the different livestock groups that would be grazing under the baseline scenario
Estimated at project
start Dimensionless e Ex ante
This estimate is fixed for the entire crediting period
NaEGL,t
Number of animals present in the sampled EGL areas at time t
Field and household surveys Dimensionless m Yearly/once
in 5 years
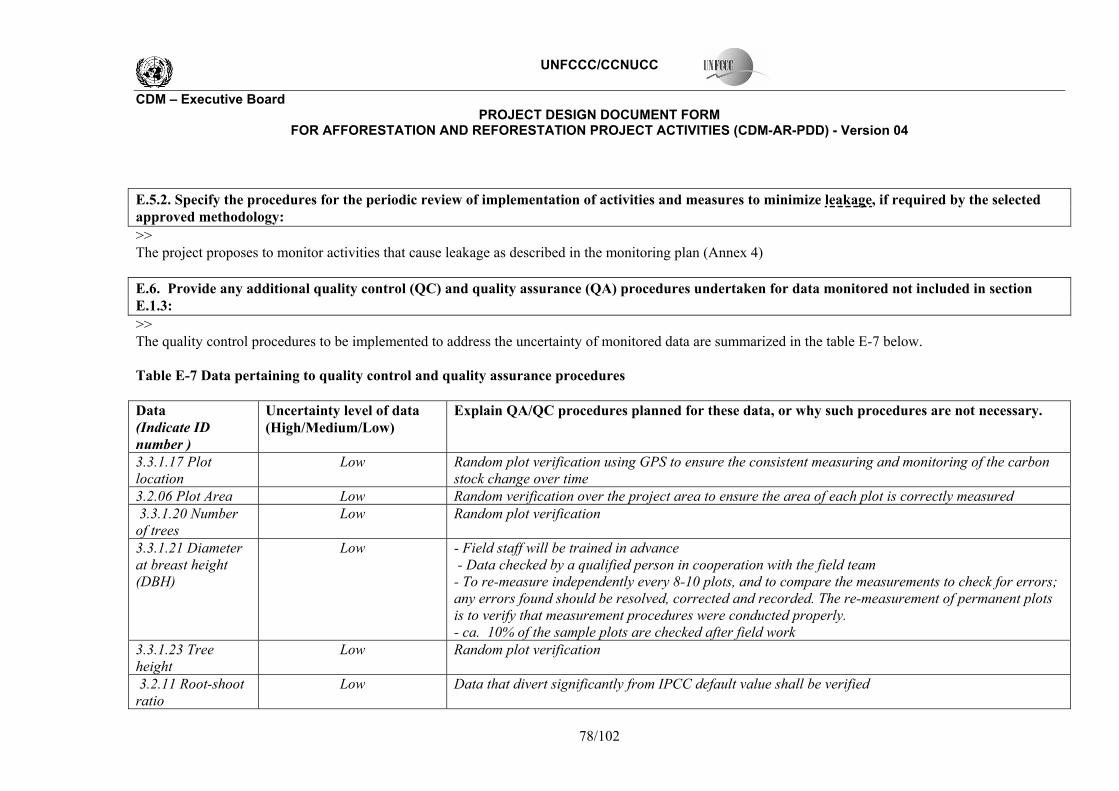
UNFCCC/CCNUCC
CDM � Executive Board PROJECT DESIGN DOCUMENT FORM
FOR AFFORESTATION AND REFORESTATION PROJECT ACTIVITIES (CDM-AR-PDD) - Version 04
78/102
E.5.2. Specify the procedures for the periodic review of implementation of activities and measures to minimize leakage, if required by the selected approved methodology: >> The project proposes to monitor activities that cause leakage as described in the monitoring plan (Annex 4) E.6. Provide any additional quality control (QC) and quality assurance (QA) procedures undertaken for data monitored not included in section E.1.3: >> The quality control procedures to be implemented to address the uncertainty of monitored data are summarized in the table E-7 below. Table E-7 Data pertaining to quality control and quality assurance procedures Data (Indicate ID number )
Uncertainty level of data (High/Medium/Low)
Explain QA/QC procedures planned for these data, or why such procedures are not necessary.
3.3.1.17 Plot location
Low Random plot verification using GPS to ensure the consistent measuring and monitoring of the carbon stock change over time
3.2.06 Plot Area Low Random verification over the project area to ensure the area of each plot is correctly measured 3.3.1.20 Number of trees
Low Random plot verification
3.3.1.21 Diameter at breast height (DBH)
Low - Field staff will be trained in advance - Data checked by a qualified person in cooperation with the field team - To re-measure independently every 8-10 plots, and to compare the measurements to check for errors; any errors found should be resolved, corrected and recorded. The re-measurement of permanent plots is to verify that measurement procedures were conducted properly. - ca. 10% of the sample plots are checked after field work
3.3.1.23 Tree height
Low Random plot verification
3.2.11 Root-shoot ratio
Low Data that divert significantly from IPCC default value shall be verified
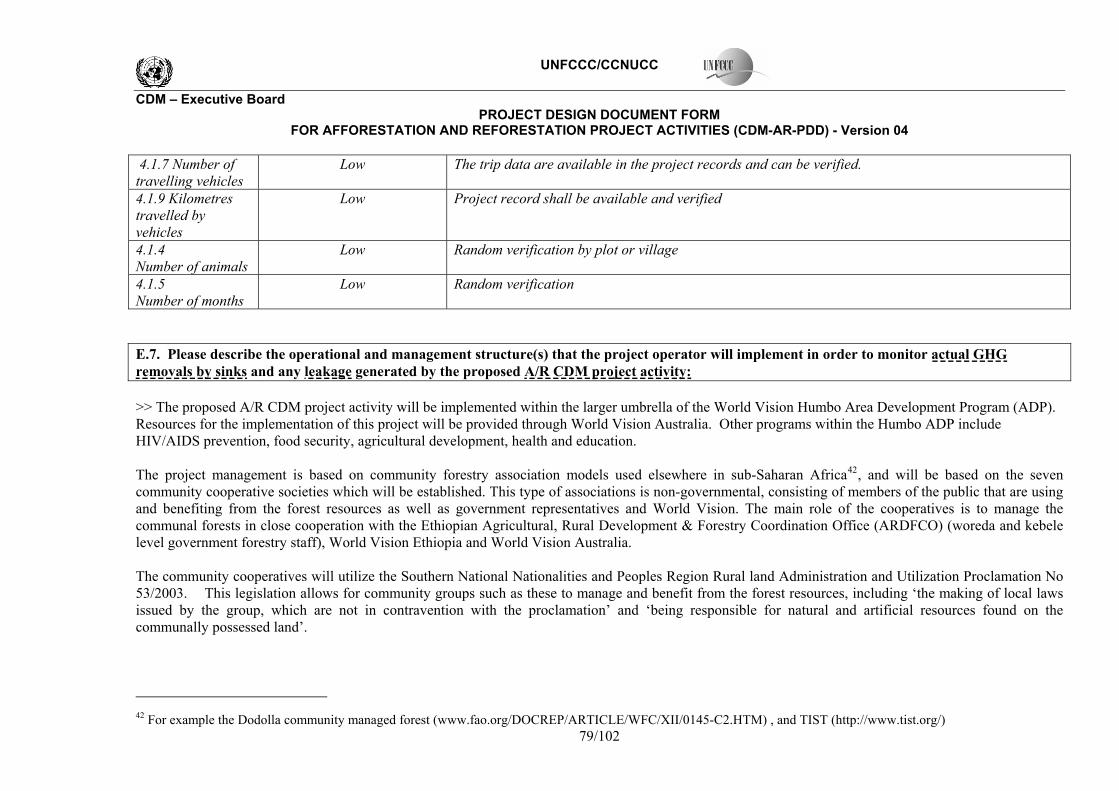
UNFCCC/CCNUCC
CDM � Executive Board PROJECT DESIGN DOCUMENT FORM
FOR AFFORESTATION AND REFORESTATION PROJECT ACTIVITIES (CDM-AR-PDD) - Version 04
79/102
4.1.7 Number of travelling vehicles
Low The trip data are available in the project records and can be verified.
4.1.9 Kilometres travelled by vehicles
Low Project record shall be available and verified
4.1.4 Number of animals
Low Random verification by plot or village
4.1.5 Number of months
Low Random verification
E.7. Please describe the operational and management structure(s) that the project operator will implement in order to monitor actual GHG removals by sinks and any leakage generated by the proposed A/R CDM project activity: >> The proposed A/R CDM project activity will be implemented within the larger umbrella of the World Vision Humbo Area Development Program (ADP). Resources for the implementation of this project will be provided through World Vision Australia. Other programs within the Humbo ADP include HIV/AIDS prevention, food security, agricultural development, health and education. The project management is based on community forestry association models used elsewhere in sub-Saharan Africa42, and will be based on the seven community cooperative societies which will be established. This type of associations is non-governmental, consisting of members of the public that are using and benefiting from the forest resources as well as government representatives and World Vision. The main role of the cooperatives is to manage the communal forests in close cooperation with the Ethiopian Agricultural, Rural Development & Forestry Coordination Office (ARDFCO) (woreda and kebele level government forestry staff), World Vision Ethiopia and World Vision Australia. The community cooperatives will utilize the Southern National Nationalities and Peoples Region Rural land Administration and Utilization Proclamation No 53/2003. This legislation allows for community groups such as these to manage and benefit from the forest resources, including �the making of local laws issued by the group, which are not in contravention with the proclamation� and �being responsible for natural and artificial resources found on the communally possessed land�.
42 For example the Dodolla community managed forest (www.fao.org/DOCREP/ARTICLE/WFC/XII/0145-C2.HTM) , and TIST (http://www.tist.org/)
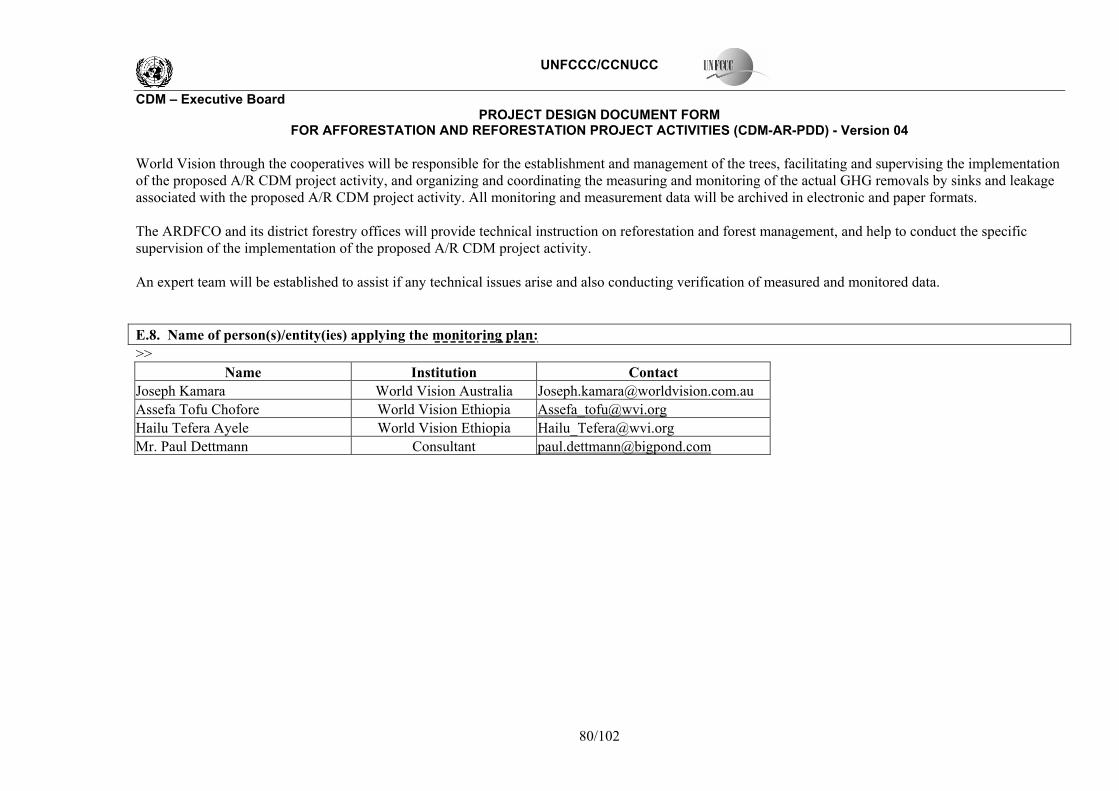
UNFCCC/CCNUCC
CDM � Executive Board PROJECT DESIGN DOCUMENT FORM
FOR AFFORESTATION AND REFORESTATION PROJECT ACTIVITIES (CDM-AR-PDD) - Version 04
80/102
World Vision through the cooperatives will be responsible for the establishment and management of the trees, facilitating and supervising the implementation of the proposed A/R CDM project activity, and organizing and coordinating the measuring and monitoring of the actual GHG removals by sinks and leakage associated with the proposed A/R CDM project activity. All monitoring and measurement data will be archived in electronic and paper formats. The ARDFCO and its district forestry offices will provide technical instruction on reforestation and forest management, and help to conduct the specific supervision of the implementation of the proposed A/R CDM project activity. An expert team will be established to assist if any technical issues arise and also conducting verification of measured and monitored data. E.8. Name of person(s)/entity(ies) applying the monitoring plan: >>
Name Institution Contact Joseph Kamara World Vision Australia [email protected] Assefa Tofu Chofore World Vision Ethiopia [email protected] Hailu Tefera Ayele World Vision Ethiopia [email protected] Mr. Paul Dettmann Consultant [email protected]
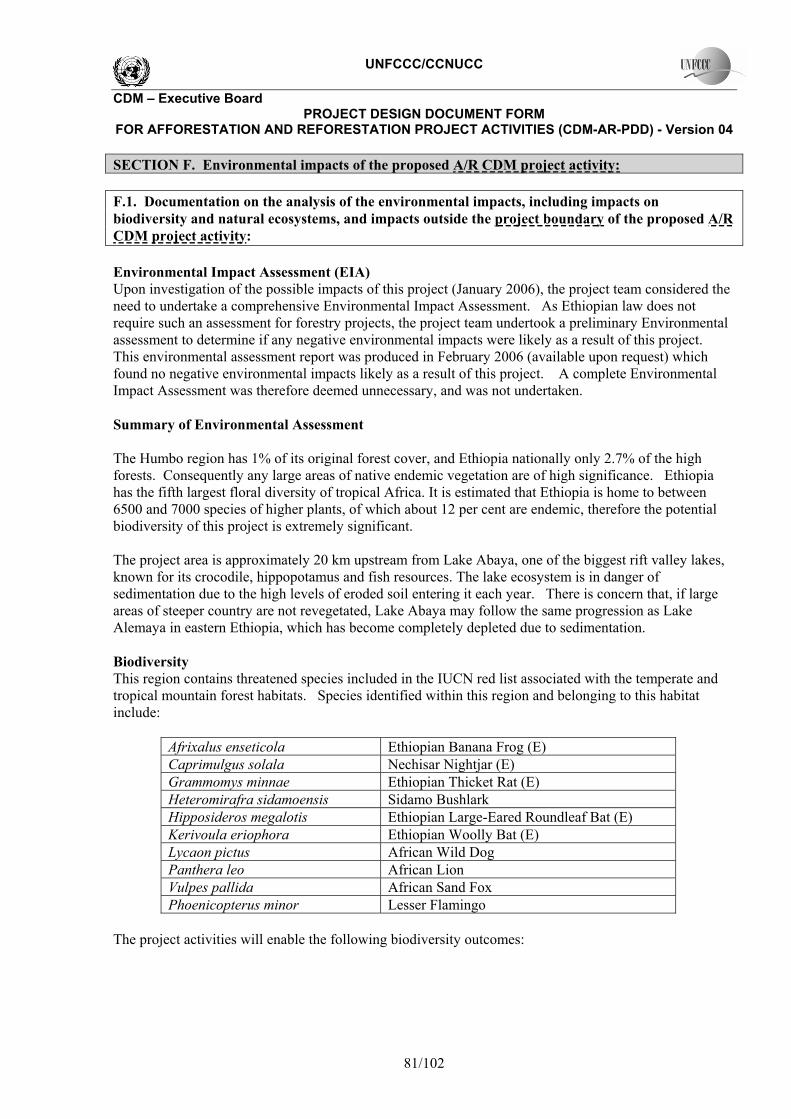
UNFCCC/CCNUCC
CDM � Executive Board PROJECT DESIGN DOCUMENT FORM
FOR AFFORESTATION AND REFORESTATION PROJECT ACTIVITIES (CDM-AR-PDD) - Version 04
81/102
SECTION F. Environmental impacts of the proposed A/R CDM project activity: F.1. Documentation on the analysis of the environmental impacts, including impacts on biodiversity and natural ecosystems, and impacts outside the project boundary of the proposed A/R CDM project activity: Environmental Impact Assessment (EIA) Upon investigation of the possible impacts of this project (January 2006), the project team considered the need to undertake a comprehensive Environmental Impact Assessment. As Ethiopian law does not require such an assessment for forestry projects, the project team undertook a preliminary Environmental assessment to determine if any negative environmental impacts were likely as a result of this project. This environmental assessment report was produced in February 2006 (available upon request) which found no negative environmental impacts likely as a result of this project. A complete Environmental Impact Assessment was therefore deemed unnecessary, and was not undertaken. Summary of Environmental Assessment The Humbo region has 1% of its original forest cover, and Ethiopia nationally only 2.7% of the high forests. Consequently any large areas of native endemic vegetation are of high significance. Ethiopia has the fifth largest floral diversity of tropical Africa. It is estimated that Ethiopia is home to between 6500 and 7000 species of higher plants, of which about 12 per cent are endemic, therefore the potential biodiversity of this project is extremely significant. The project area is approximately 20 km upstream from Lake Abaya, one of the biggest rift valley lakes, known for its crocodile, hippopotamus and fish resources. The lake ecosystem is in danger of sedimentation due to the high levels of eroded soil entering it each year. There is concern that, if large areas of steeper country are not revegetated, Lake Abaya may follow the same progression as Lake Alemaya in eastern Ethiopia, which has become completely depleted due to sedimentation. Biodiversity This region contains threatened species included in the IUCN red list associated with the temperate and tropical mountain forest habitats. Species identified within this region and belonging to this habitat include:
Afrixalus enseticola Ethiopian Banana Frog (E) Caprimulgus solala Nechisar Nightjar (E) Grammomys minnae Ethiopian Thicket Rat (E) Heteromirafra sidamoensis Sidamo Bushlark Hipposideros megalotis Ethiopian Large-Eared Roundleaf Bat (E) Kerivoula eriophora Ethiopian Woolly Bat (E) Lycaon pictus African Wild Dog Panthera leo African Lion Vulpes pallida African Sand Fox Phoenicopterus minor Lesser Flamingo
The project activities will enable the following biodiversity outcomes:
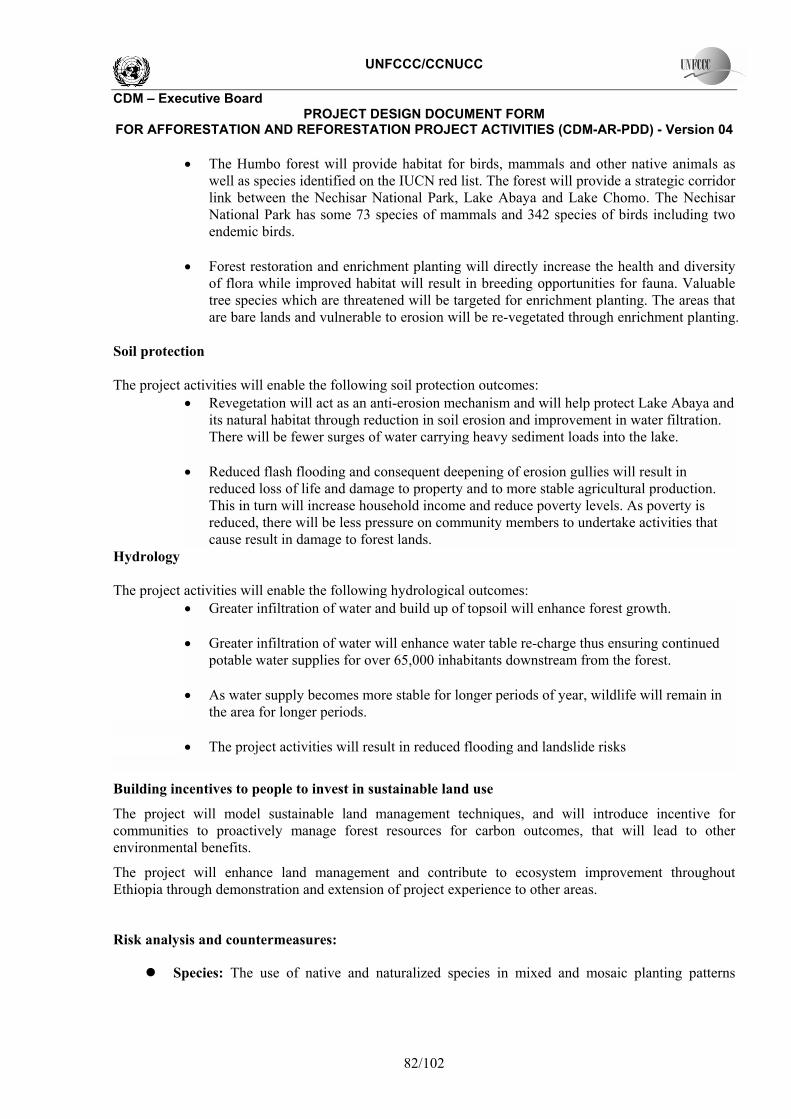
UNFCCC/CCNUCC
CDM � Executive Board PROJECT DESIGN DOCUMENT FORM
FOR AFFORESTATION AND REFORESTATION PROJECT ACTIVITIES (CDM-AR-PDD) - Version 04
82/102
• The Humbo forest will provide habitat for birds, mammals and other native animals as well as species identified on the IUCN red list. The forest will provide a strategic corridor link between the Nechisar National Park, Lake Abaya and Lake Chomo. The Nechisar National Park has some 73 species of mammals and 342 species of birds including two endemic birds.
• Forest restoration and enrichment planting will directly increase the health and diversity
of flora while improved habitat will result in breeding opportunities for fauna. Valuable tree species which are threatened will be targeted for enrichment planting. The areas that are bare lands and vulnerable to erosion will be re-vegetated through enrichment planting.
Soil protection The project activities will enable the following soil protection outcomes:
• Revegetation will act as an anti-erosion mechanism and will help protect Lake Abaya and its natural habitat through reduction in soil erosion and improvement in water filtration. There will be fewer surges of water carrying heavy sediment loads into the lake.
• Reduced flash flooding and consequent deepening of erosion gullies will result in
reduced loss of life and damage to property and to more stable agricultural production. This in turn will increase household income and reduce poverty levels. As poverty is reduced, there will be less pressure on community members to undertake activities that cause result in damage to forest lands.
Hydrology The project activities will enable the following hydrological outcomes:
• Greater infiltration of water and build up of topsoil will enhance forest growth. • Greater infiltration of water will enhance water table re-charge thus ensuring continued
potable water supplies for over 65,000 inhabitants downstream from the forest. • As water supply becomes more stable for longer periods of year, wildlife will remain in
the area for longer periods.
• The project activities will result in reduced flooding and landslide risks
Building incentives to people to invest in sustainable land use
The project will model sustainable land management techniques, and will introduce incentive for communities to proactively manage forest resources for carbon outcomes, that will lead to other environmental benefits.
The project will enhance land management and contribute to ecosystem improvement throughout Ethiopia through demonstration and extension of project experience to other areas.
Risk analysis and countermeasures:
" Species: The use of native and naturalized species in mixed and mosaic planting patterns
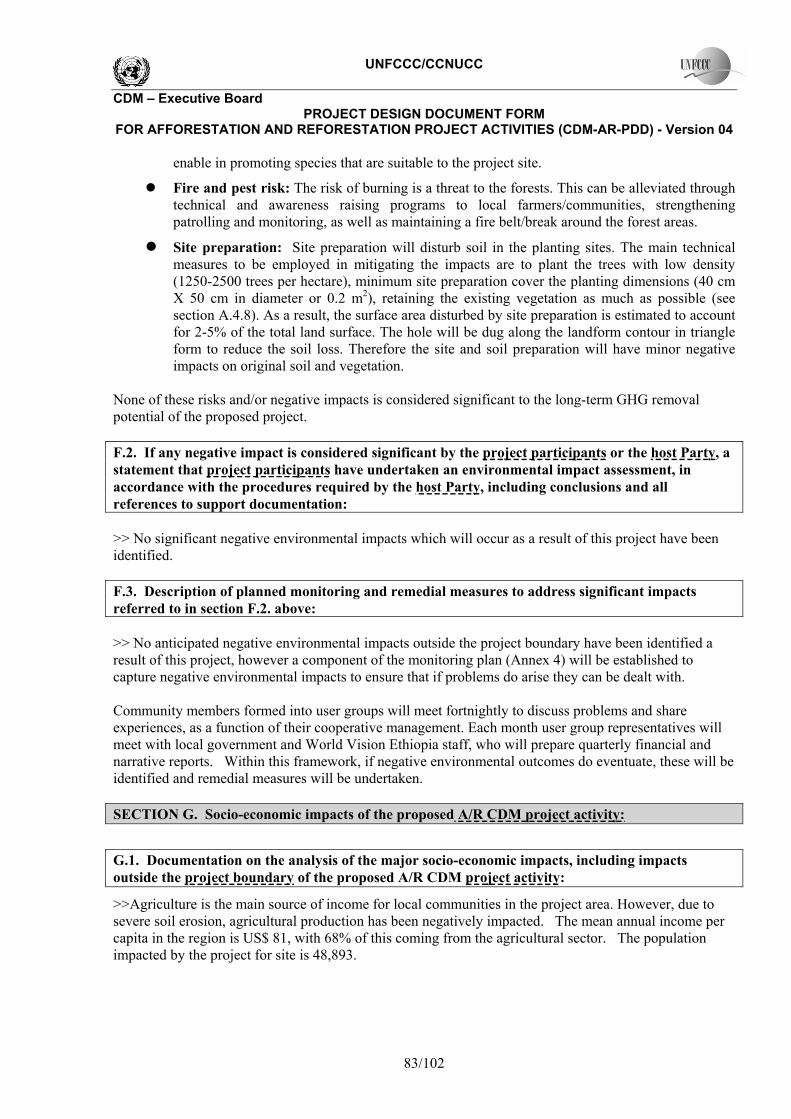
UNFCCC/CCNUCC
CDM � Executive Board PROJECT DESIGN DOCUMENT FORM
FOR AFFORESTATION AND REFORESTATION PROJECT ACTIVITIES (CDM-AR-PDD) - Version 04
83/102
enable in promoting species that are suitable to the project site.
" Fire and pest risk: The risk of burning is a threat to the forests. This can be alleviated through technical and awareness raising programs to local farmers/communities, strengthening patrolling and monitoring, as well as maintaining a fire belt/break around the forest areas.
" Site preparation: Site preparation will disturb soil in the planting sites. The main technical measures to be employed in mitigating the impacts are to plant the trees with low density (1250-2500 trees per hectare), minimum site preparation cover the planting dimensions (40 cm X 50 cm in diameter or 0.2 m2), retaining the existing vegetation as much as possible (see section A.4.8). As a result, the surface area disturbed by site preparation is estimated to account for 2-5% of the total land surface. The hole will be dug along the landform contour in triangle form to reduce the soil loss. Therefore the site and soil preparation will have minor negative impacts on original soil and vegetation.
None of these risks and/or negative impacts is considered significant to the long-term GHG removal potential of the proposed project. F.2. If any negative impact is considered significant by the project participants or the host Party, a statement that project participants have undertaken an environmental impact assessment, in accordance with the procedures required by the host Party, including conclusions and all references to support documentation: >> No significant negative environmental impacts which will occur as a result of this project have been identified. F.3. Description of planned monitoring and remedial measures to address significant impacts referred to in section F.2. above: >> No anticipated negative environmental impacts outside the project boundary have been identified a result of this project, however a component of the monitoring plan (Annex 4) will be established to capture negative environmental impacts to ensure that if problems do arise they can be dealt with. Community members formed into user groups will meet fortnightly to discuss problems and share experiences, as a function of their cooperative management. Each month user group representatives will meet with local government and World Vision Ethiopia staff, who will prepare quarterly financial and narrative reports. Within this framework, if negative environmental outcomes do eventuate, these will be identified and remedial measures will be undertaken. SECTION G. Socio-economic impacts of the proposed A/R CDM project activity:
G.1. Documentation on the analysis of the major socio-economic impacts, including impacts outside the project boundary of the proposed A/R CDM project activity:
>>Agriculture is the main source of income for local communities in the project area. However, due to severe soil erosion, agricultural production has been negatively impacted. The mean annual income per capita in the region is US$ 81, with 68% of this coming from the agricultural sector. The population impacted by the project for site is 48,893.
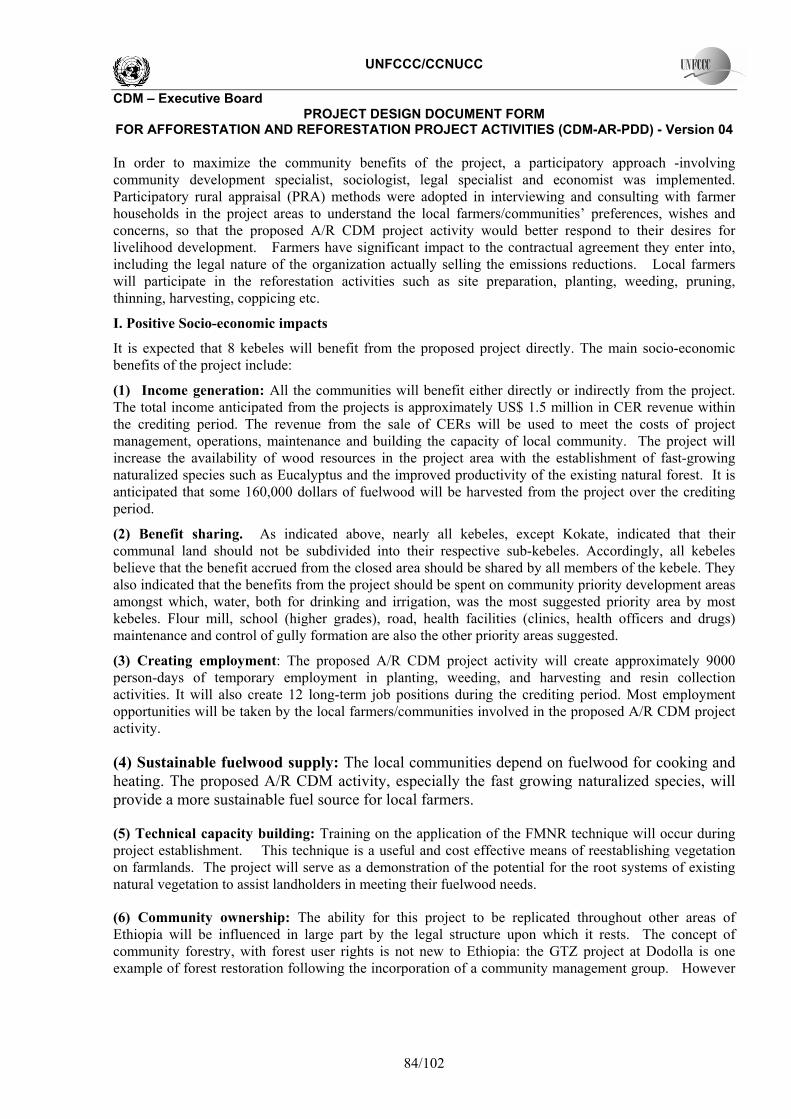
UNFCCC/CCNUCC
CDM � Executive Board PROJECT DESIGN DOCUMENT FORM
FOR AFFORESTATION AND REFORESTATION PROJECT ACTIVITIES (CDM-AR-PDD) - Version 04
84/102
In order to maximize the community benefits of the project, a participatory approach -involving community development specialist, sociologist, legal specialist and economist was implemented. Participatory rural appraisal (PRA) methods were adopted in interviewing and consulting with farmer households in the project areas to understand the local farmers/communities� preferences, wishes and concerns, so that the proposed A/R CDM project activity would better respond to their desires for livelihood development. Farmers have significant impact to the contractual agreement they enter into, including the legal nature of the organization actually selling the emissions reductions. Local farmers will participate in the reforestation activities such as site preparation, planting, weeding, pruning, thinning, harvesting, coppicing etc.
I. Positive Socio-economic impacts
It is expected that 8 kebeles will benefit from the proposed project directly. The main socio-economic benefits of the project include:
(1) Income generation: All the communities will benefit either directly or indirectly from the project. The total income anticipated from the projects is approximately US$ 1.5 million in CER revenue within the crediting period. The revenue from the sale of CERs will be used to meet the costs of project management, operations, maintenance and building the capacity of local community. The project will increase the availability of wood resources in the project area with the establishment of fast-growing naturalized species such as Eucalyptus and the improved productivity of the existing natural forest. It is anticipated that some 160,000 dollars of fuelwood will be harvested from the project over the crediting period.
(2) Benefit sharing. As indicated above, nearly all kebeles, except Kokate, indicated that their communal land should not be subdivided into their respective sub-kebeles. Accordingly, all kebeles believe that the benefit accrued from the closed area should be shared by all members of the kebele. They also indicated that the benefits from the project should be spent on community priority development areas amongst which, water, both for drinking and irrigation, was the most suggested priority area by most kebeles. Flour mill, school (higher grades), road, health facilities (clinics, health officers and drugs) maintenance and control of gully formation are also the other priority areas suggested.
(3) Creating employment: The proposed A/R CDM project activity will create approximately 9000 person-days of temporary employment in planting, weeding, and harvesting and resin collection activities. It will also create 12 long-term job positions during the crediting period. Most employment opportunities will be taken by the local farmers/communities involved in the proposed A/R CDM project activity.
(4) Sustainable fuelwood supply: The local communities depend on fuelwood for cooking and heating. The proposed A/R CDM activity, especially the fast growing naturalized species, will provide a more sustainable fuel source for local farmers.
(5) Technical capacity building: Training on the application of the FMNR technique will occur during project establishment. This technique is a useful and cost effective means of reestablishing vegetation on farmlands. The project will serve as a demonstration of the potential for the root systems of existing natural vegetation to assist landholders in meeting their fuelwood needs.
(6) Community ownership: The ability for this project to be replicated throughout other areas of Ethiopia will be influenced in large part by the legal structure upon which it rests. The concept of community forestry, with forest user rights is not new to Ethiopia: the GTZ project at Dodolla is one example of forest restoration following the incorporation of a community management group. However
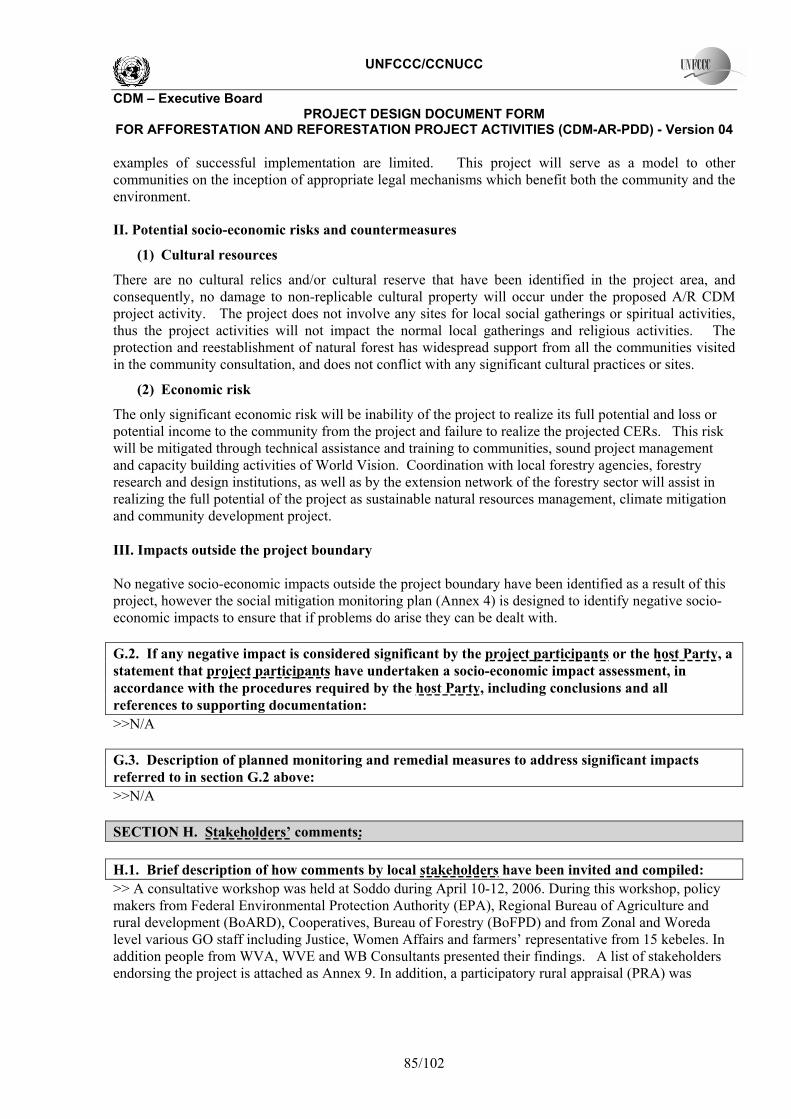
UNFCCC/CCNUCC
CDM � Executive Board PROJECT DESIGN DOCUMENT FORM
FOR AFFORESTATION AND REFORESTATION PROJECT ACTIVITIES (CDM-AR-PDD) - Version 04
85/102
examples of successful implementation are limited. This project will serve as a model to other communities on the inception of appropriate legal mechanisms which benefit both the community and the environment.
II. Potential socio-economic risks and countermeasures
(1) Cultural resources
There are no cultural relics and/or cultural reserve that have been identified in the project area, and consequently, no damage to non-replicable cultural property will occur under the proposed A/R CDM project activity. The project does not involve any sites for local social gatherings or spiritual activities, thus the project activities will not impact the normal local gatherings and religious activities. The protection and reestablishment of natural forest has widespread support from all the communities visited in the community consultation, and does not conflict with any significant cultural practices or sites.
(2) Economic risk
The only significant economic risk will be inability of the project to realize its full potential and loss or potential income to the community from the project and failure to realize the projected CERs. This risk will be mitigated through technical assistance and training to communities, sound project management and capacity building activities of World Vision. Coordination with local forestry agencies, forestry research and design institutions, as well as by the extension network of the forestry sector will assist in realizing the full potential of the project as sustainable natural resources management, climate mitigation and community development project. III. Impacts outside the project boundary No negative socio-economic impacts outside the project boundary have been identified as a result of this project, however the social mitigation monitoring plan (Annex 4) is designed to identify negative socio-economic impacts to ensure that if problems do arise they can be dealt with. G.2. If any negative impact is considered significant by the project participants or the host Party, a statement that project participants have undertaken a socio-economic impact assessment, in accordance with the procedures required by the host Party, including conclusions and all references to supporting documentation: >>N/A G.3. Description of planned monitoring and remedial measures to address significant impacts referred to in section G.2 above: >>N/A SECTION H. Stakeholders� comments: H.1. Brief description of how comments by local stakeholders have been invited and compiled: >> A consultative workshop was held at Soddo during April 10-12, 2006. During this workshop, policy makers from Federal Environmental Protection Authority (EPA), Regional Bureau of Agriculture and rural development (BoARD), Cooperatives, Bureau of Forestry (BoFPD) and from Zonal and Woreda level various GO staff including Justice, Women Affairs and farmers� representative from 15 kebeles. In addition people from WVA, WVE and WB Consultants presented their findings. A list of stakeholders endorsing the project is attached as Annex 9. In addition, a participatory rural appraisal (PRA) was
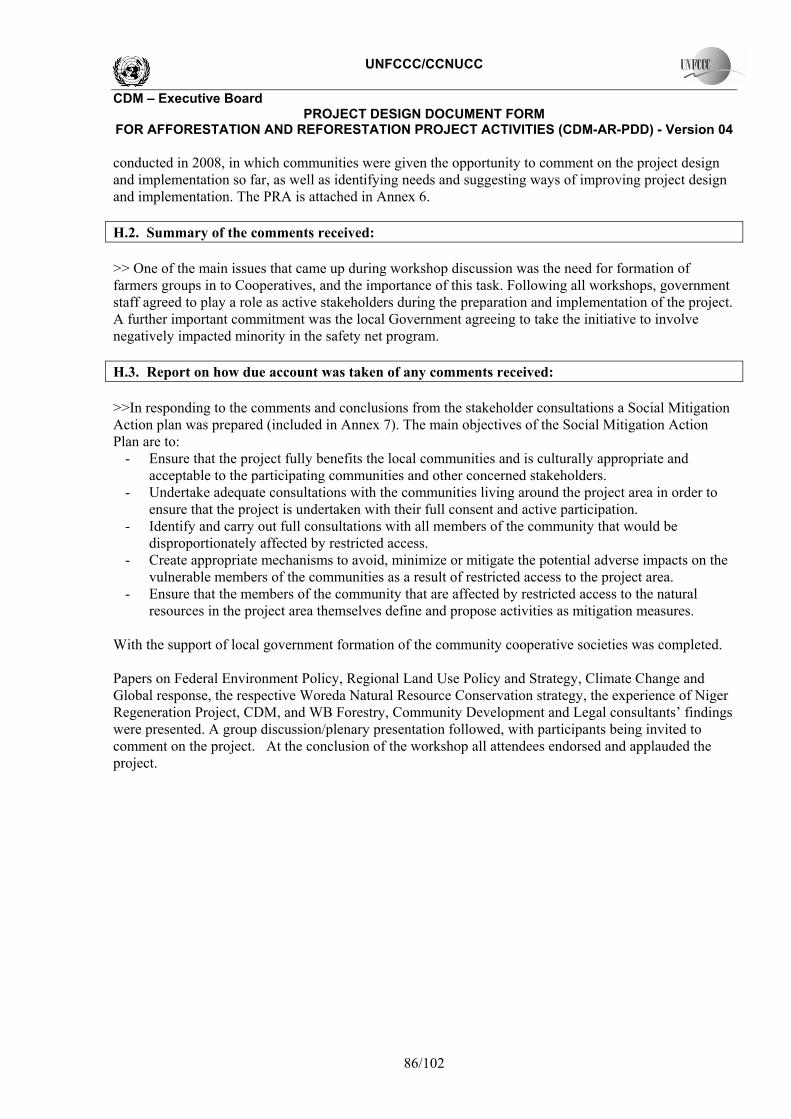
UNFCCC/CCNUCC
CDM � Executive Board PROJECT DESIGN DOCUMENT FORM
FOR AFFORESTATION AND REFORESTATION PROJECT ACTIVITIES (CDM-AR-PDD) - Version 04
86/102
conducted in 2008, in which communities were given the opportunity to comment on the project design and implementation so far, as well as identifying needs and suggesting ways of improving project design and implementation. The PRA is attached in Annex 6. H.2. Summary of the comments received: >> One of the main issues that came up during workshop discussion was the need for formation of farmers groups in to Cooperatives, and the importance of this task. Following all workshops, government staff agreed to play a role as active stakeholders during the preparation and implementation of the project. A further important commitment was the local Government agreeing to take the initiative to involve negatively impacted minority in the safety net program. H.3. Report on how due account was taken of any comments received: >>In responding to the comments and conclusions from the stakeholder consultations a Social Mitigation Action plan was prepared (included in Annex 7). The main objectives of the Social Mitigation Action Plan are to:
- Ensure that the project fully benefits the local communities and is culturally appropriate and acceptable to the participating communities and other concerned stakeholders.
- Undertake adequate consultations with the communities living around the project area in order to ensure that the project is undertaken with their full consent and active participation.
- Identify and carry out full consultations with all members of the community that would be disproportionately affected by restricted access.
- Create appropriate mechanisms to avoid, minimize or mitigate the potential adverse impacts on the vulnerable members of the communities as a result of restricted access to the project area.
- Ensure that the members of the community that are affected by restricted access to the natural resources in the project area themselves define and propose activities as mitigation measures.
With the support of local government formation of the community cooperative societies was completed. Papers on Federal Environment Policy, Regional Land Use Policy and Strategy, Climate Change and Global response, the respective Woreda Natural Resource Conservation strategy, the experience of Niger Regeneration Project, CDM, and WB Forestry, Community Development and Legal consultants� findings were presented. A group discussion/plenary presentation followed, with participants being invited to comment on the project. At the conclusion of the workshop all attendees endorsed and applauded the project.
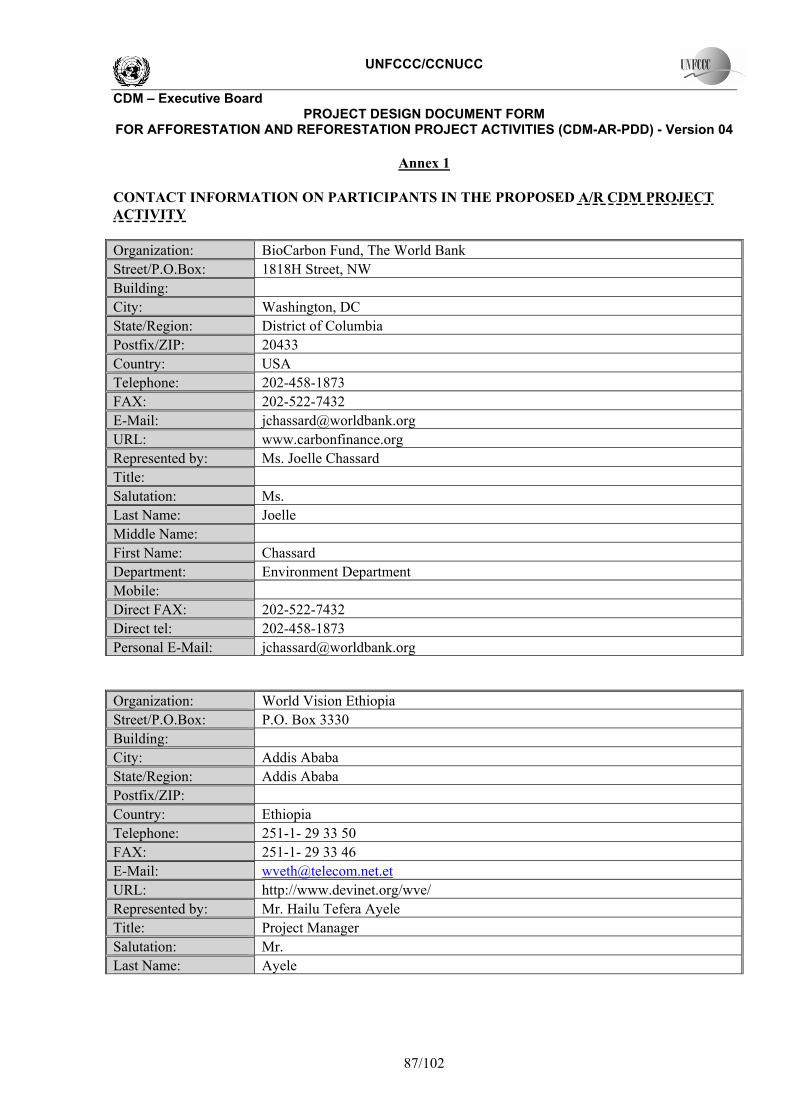
UNFCCC/CCNUCC
CDM � Executive Board PROJECT DESIGN DOCUMENT FORM
FOR AFFORESTATION AND REFORESTATION PROJECT ACTIVITIES (CDM-AR-PDD) - Version 04
87/102
Annex 1
CONTACT INFORMATION ON PARTICIPANTS IN THE PROPOSED A/R CDM PROJECT ACTIVITY Organization: BioCarbon Fund, The World Bank Street/P.O.Box: 1818H Street, NW Building: City: Washington, DC State/Region: District of Columbia Postfix/ZIP: 20433 Country: USA Telephone: 202-458-1873 FAX: 202-522-7432 E-Mail: [email protected] URL: www.carbonfinance.org Represented by: Ms. Joelle Chassard Title: Salutation: Ms. Last Name: Joelle Middle Name: First Name: Chassard Department: Environment Department Mobile: Direct FAX: 202-522-7432 Direct tel: 202-458-1873 Personal E-Mail: [email protected]
Organization: World Vision Ethiopia Street/P.O.Box: P.O. Box 3330 Building: City: Addis Ababa State/Region: Addis Ababa Postfix/ZIP: Country: Ethiopia Telephone: 251-1- 29 33 50 FAX: 251-1- 29 33 46 E-Mail: [email protected] URL: http://www.devinet.org/wve/ Represented by: Mr. Hailu Tefera Ayele Title: Project Manager Salutation: Mr. Last Name: Ayele
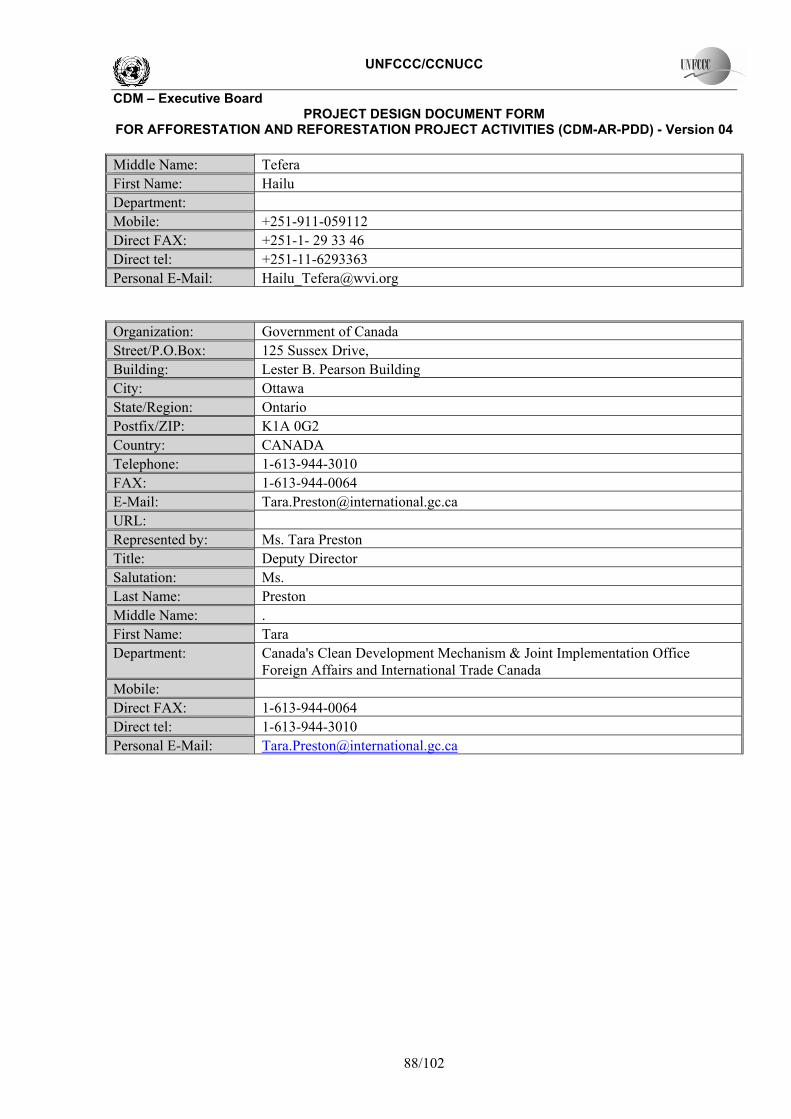
UNFCCC/CCNUCC
CDM � Executive Board PROJECT DESIGN DOCUMENT FORM
FOR AFFORESTATION AND REFORESTATION PROJECT ACTIVITIES (CDM-AR-PDD) - Version 04
88/102
Middle Name: Tefera First Name: Hailu Department: Mobile: +251-911-059112 Direct FAX: +251-1- 29 33 46 Direct tel: +251-11-6293363 Personal E-Mail: [email protected]
Organization: Government of Canada Street/P.O.Box: 125 Sussex Drive, Building: Lester B. Pearson Building City: Ottawa State/Region: Ontario Postfix/ZIP: K1A 0G2 Country: CANADA Telephone: 1-613-944-3010 FAX: 1-613-944-0064 E-Mail: [email protected] URL: Represented by: Ms. Tara Preston Title: Deputy Director Salutation: Ms. Last Name: Preston Middle Name: . First Name: Tara Department: Canada's Clean Development Mechanism & Joint Implementation Office
Foreign Affairs and International Trade Canada Mobile: Direct FAX: 1-613-944-0064 Direct tel: 1-613-944-3010 Personal E-Mail: [email protected]
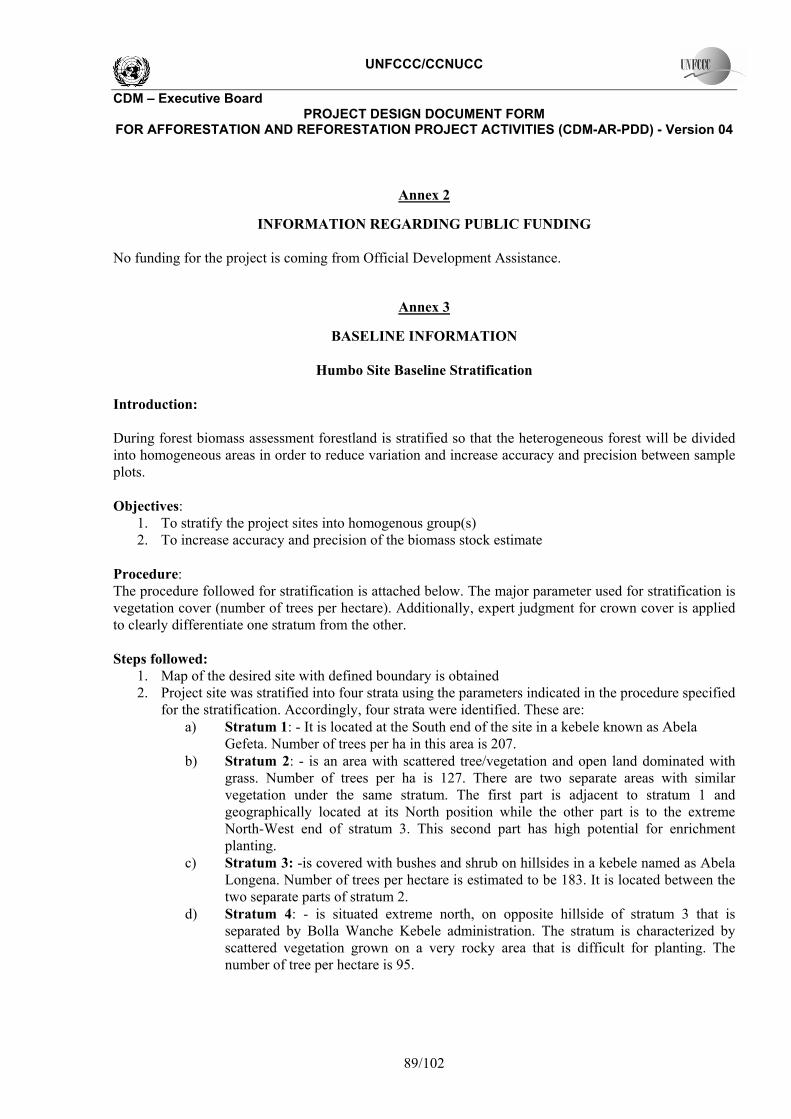
UNFCCC/CCNUCC
CDM � Executive Board PROJECT DESIGN DOCUMENT FORM
FOR AFFORESTATION AND REFORESTATION PROJECT ACTIVITIES (CDM-AR-PDD) - Version 04
89/102
Annex 2
INFORMATION REGARDING PUBLIC FUNDING No funding for the project is coming from Official Development Assistance.
Annex 3
BASELINE INFORMATION
Humbo Site Baseline Stratification Introduction: During forest biomass assessment forestland is stratified so that the heterogeneous forest will be divided into homogeneous areas in order to reduce variation and increase accuracy and precision between sample plots. Objectives:
1. To stratify the project sites into homogenous group(s) 2. To increase accuracy and precision of the biomass stock estimate
Procedure: The procedure followed for stratification is attached below. The major parameter used for stratification is vegetation cover (number of trees per hectare). Additionally, expert judgment for crown cover is applied to clearly differentiate one stratum from the other. Steps followed:
1. Map of the desired site with defined boundary is obtained 2. Project site was stratified into four strata using the parameters indicated in the procedure specified
for the stratification. Accordingly, four strata were identified. These are: a) Stratum 1: - It is located at the South end of the site in a kebele known as Abela
Gefeta. Number of trees per ha in this area is 207. b) Stratum 2: - is an area with scattered tree/vegetation and open land dominated with
grass. Number of trees per ha is 127. There are two separate areas with similar vegetation under the same stratum. The first part is adjacent to stratum 1 and geographically located at its North position while the other part is to the extreme North-West end of stratum 3. This second part has high potential for enrichment planting.
c) Stratum 3: -is covered with bushes and shrub on hillsides in a kebele named as Abela Longena. Number of trees per hectare is estimated to be 183. It is located between the two separate parts of stratum 2.
d) Stratum 4: - is situated extreme north, on opposite hillside of stratum 3 that is separated by Bolla Wanche Kebele administration. The stratum is characterized by scattered vegetation grown on a very rocky area that is difficult for planting. The number of tree per hectare is 95.
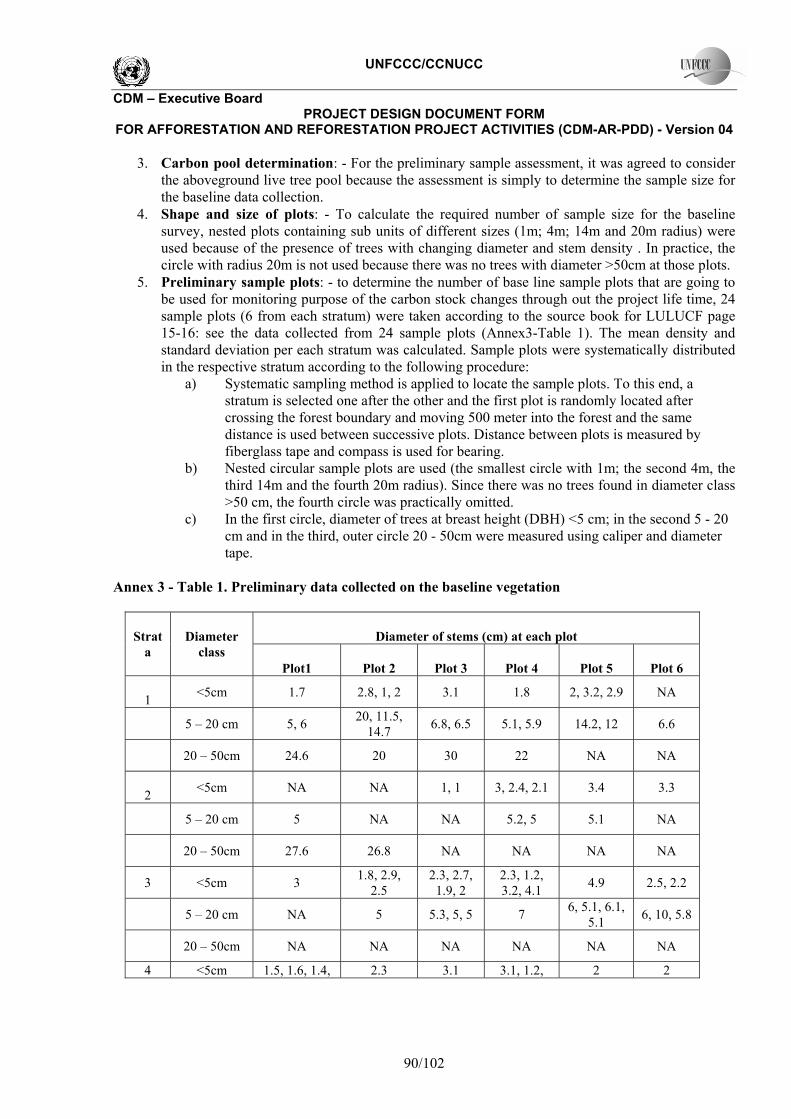
UNFCCC/CCNUCC
CDM � Executive Board PROJECT DESIGN DOCUMENT FORM
FOR AFFORESTATION AND REFORESTATION PROJECT ACTIVITIES (CDM-AR-PDD) - Version 04
90/102
3. Carbon pool determination: - For the preliminary sample assessment, it was agreed to consider the aboveground live tree pool because the assessment is simply to determine the sample size for the baseline data collection.
4. Shape and size of plots: - To calculate the required number of sample size for the baseline survey, nested plots containing sub units of different sizes (1m; 4m; 14m and 20m radius) were used because of the presence of trees with changing diameter and stem density . In practice, the circle with radius 20m is not used because there was no trees with diameter >50cm at those plots.
5. Preliminary sample plots: - to determine the number of base line sample plots that are going to be used for monitoring purpose of the carbon stock changes through out the project life time, 24 sample plots (6 from each stratum) were taken according to the source book for LULUCF page 15-16: see the data collected from 24 sample plots (Annex3-Table 1). The mean density and standard deviation per each stratum was calculated. Sample plots were systematically distributed in the respective stratum according to the following procedure:
a) Systematic sampling method is applied to locate the sample plots. To this end, a stratum is selected one after the other and the first plot is randomly located after crossing the forest boundary and moving 500 meter into the forest and the same distance is used between successive plots. Distance between plots is measured by fiberglass tape and compass is used for bearing.
b) Nested circular sample plots are used (the smallest circle with 1m; the second 4m, the third 14m and the fourth 20m radius). Since there was no trees found in diameter class >50 cm, the fourth circle was practically omitted.
c) In the first circle, diameter of trees at breast height (DBH) <5 cm; in the second 5 - 20 cm and in the third, outer circle 20 - 50cm were measured using caliper and diameter tape.
Annex 3 - Table 1. Preliminary data collected on the baseline vegetation
Diameter of stems (cm) at each plot Strat
a Diameter
class Plot1
Plot 2
Plot 3
Plot 4
Plot 5
Plot 6
1 <5cm 1.7 2.8, 1, 2 3.1 1.8 2, 3.2, 2.9 NA
5 � 20 cm 5, 6 20, 11.5, 14.7 6.8, 6.5 5.1, 5.9 14.2, 12 6.6
20 � 50cm 24.6 20 30 22 NA NA
2 <5cm NA NA 1, 1 3, 2.4, 2.1 3.4 3.3
5 � 20 cm 5 NA NA 5.2, 5 5.1 NA
20 � 50cm 27.6 26.8 NA NA NA NA
3 <5cm 3 1.8, 2.9, 2.5
2.3, 2.7, 1.9, 2
2.3, 1.2, 3.2, 4.1 4.9 2.5, 2.2
5 � 20 cm NA 5 5.3, 5, 5 7 6, 5.1, 6.1, 5.1 6, 10, 5.8
20 � 50cm NA NA NA NA NA NA
4 <5cm 1.5, 1.6, 1.4, 2.3 3.1 3.1, 1.2, 2 2
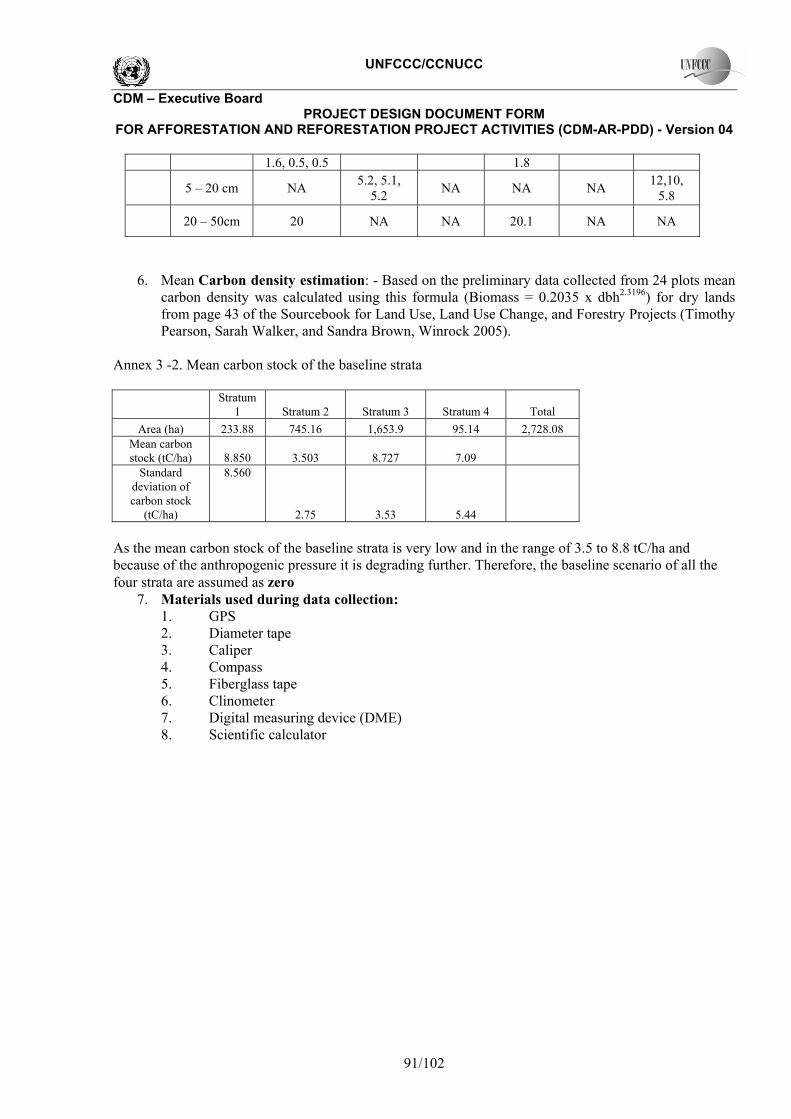
UNFCCC/CCNUCC
CDM � Executive Board PROJECT DESIGN DOCUMENT FORM
FOR AFFORESTATION AND REFORESTATION PROJECT ACTIVITIES (CDM-AR-PDD) - Version 04
91/102
1.6, 0.5, 0.5 1.8
5 � 20 cm NA 5.2, 5.1, 5.2 NA NA NA 12,10,
5.8 20 � 50cm 20 NA NA 20.1 NA NA
6. Mean Carbon density estimation: - Based on the preliminary data collected from 24 plots mean carbon density was calculated using this formula (Biomass = 0.2035 x dbh2.3196) for dry lands from page 43 of the Sourcebook for Land Use, Land Use Change, and Forestry Projects (Timothy Pearson, Sarah Walker, and Sandra Brown, Winrock 2005).
Annex 3 -2. Mean carbon stock of the baseline strata
Stratum
1 Stratum 2 Stratum 3 Stratum 4 Total Area (ha) 233.88 745.16 1,653.9 95.14 2,728.08
Mean carbon stock (tC/ha)
8.850 3.503 8.727 7.09
Standard deviation of carbon stock
(tC/ha)
8.560
2.75 3.53 5.44 As the mean carbon stock of the baseline strata is very low and in the range of 3.5 to 8.8 tC/ha and because of the anthropogenic pressure it is degrading further. Therefore, the baseline scenario of all the four strata are assumed as zero
7. Materials used during data collection: 1. GPS 2. Diameter tape 3. Caliper 4. Compass 5. Fiberglass tape 6. Clinometer 7. Digital measuring device (DME) 8. Scientific calculator
UNFCCC/CCNUCC
CDM � Executive Board PROJECT DESIGN DOCUMENT FORM
FOR AFFORESTATION AND REFORESTATION PROJECT ACTIVITIES (CDM-AR-PDD) - Version 04
92/102
Annex 4
MONITORING PLAN
1. Monitoring of the baseline net GHG removals According to the methodology, the baseline carbon stock changes do not need to be monitored because the accepted baseline approach 22(a) assumes continuation of existing changes in carbon stock resulting in its further loss of regeneration ability. The proposed project activity proposes a fixed 30-year crediting period. 2. Monitoring of the proposed A/R CDM project activity a) Monitoring of the actual project boundary The procedures for monitoring of the project boundary are reflected in section E.1.1 b) Monitoring of forest establishment
• Information on planting and area closure schedule, location, area and species planted will be recorded in plot journals and archived in the project database
• Information on area planted and closed for assisted natural regeneration each year in each stratum is confirmed through field surveys.
• Information on species composition and characteristics of planted species as well as pre-existing vegetation are recorded;
• The characteristics of stand models are recorded in the project database; • The area and location of supplemental plantings undertaken to fill the gaps is recorded in the
project database and identified on the strata maps; Monitoring of post-planting activities to demonstrate the forest establishment
• Information on drainage, drought, and other climatic extremes that can impact stand establishment and stand growth will be recorded; Surveys are conducted annually for first 3-years to evaluate the survivals rates and to fill the gaps and survival rates of planted stock should be established by undertaking surveys during the initial establishment period.
Final survival check is conducted in the permanent sample plots at the end of third year of plantation and survival percent estimated from surveys conducted at the end of 3 rd year is recorded in the project database. The survival percent at the end of the 3rd year will be reported for verification purposes.
• The number and periodicity of weeding, pruning, coppicing, and tending practices and frequency of the herbicide use will be monitored and recorded.
• Information pertaining to droughts and floods and other emergencies will be monitored and recorded and the area affected by them will be taken into account the ex post calculations of the carbon stock changes.
• In case of fires, the causes, area affected, season, and duration of fire occurrence shall be also recorded and the emissions associated with the burning of biomass shall be calculated and accounted as part of project emissions. As per the fire management plan (see Annex 10) a fuel
UNFCCC/CCNUCC
CDM � Executive Board PROJECT DESIGN DOCUMENT FORM
FOR AFFORESTATION AND REFORESTATION PROJECT ACTIVITIES (CDM-AR-PDD) - Version 04
93/102
inventory shall be maintained, and regular monitoring of fire risk indicators, fire risk mapping, fire-weather prediction carried out.
c) Monitoring of forest management
• Information on silvicultural management activities such as thinning, tending, pruning, harvesting, and other operations that influence the GHG removals by sinks will be monitored and the information recorded in the project database.
• Quantity of fossil fuels used in silvicultural operations, transport of equipment and personnel and other management activities carried out in the project boundary will be monitored and recorded and the quantity of fossil fuels used in the operations will be calculated and archived;
• As the project does not use fertilizer, GHG emissions fertilizer application will not be monitored and the emissions from this source are treated as zero in the project database.
• Information on the occurrence of natural fires or other natural or human induced disturbances and the area and the biomass affected shall be recorded and reported;
• Deviations, if any, in the forest management activities from those outlined in the project design document and the nursery and plantation establishment guidelines will be monitored and the reasons for such deviations will be recorded.
3. Monitoring the actual net GHG removals by sinks data
a) Stratification Post stratification will be conducted to address the possible changes in project boundary and planting scheme in comparison to the project design. The post-stratification will address the changes in carbon stocks in comparison to the details outlined in the project design. Strata or substrata could be aggregated if they represent similar carbon stock changes. Otherwise, new strata could be defined. b) Sampling frame and sample size Considering that the regeneration improvements expected in the project are dependent upon the state of pre-project vegetation, the project stratification takes into account the stratification used in the baseline scenario.
A total of five project strata are identified for the project scenario. The four strata identified in the baseline scenario were also adopted in the project scenario and the regeneration measures implemented in each of the four strata as part of the project scenario are considered as the project interventions. An additional stratum (stratum 5) is adopted for planting naturalized species in the bare areas under the project.
The average carbon stock in the region, expert judgment and literature information on the mean and standard deviation of the carbon stock under conditions similar to those expected under the project are used to calculate the sample size.
The steps and equations of AR AM0003 are used to calculate the sample size. The number of sample plots for each stratum is estimated as per the required accuracy. The costs of establishing sample plots across the strata were assumed to remain constant; therefore, these were not taken into account the sample size calculations.
A sample size of 88 plots is estimated for the project. The allocation of plots to the strata is presented below.
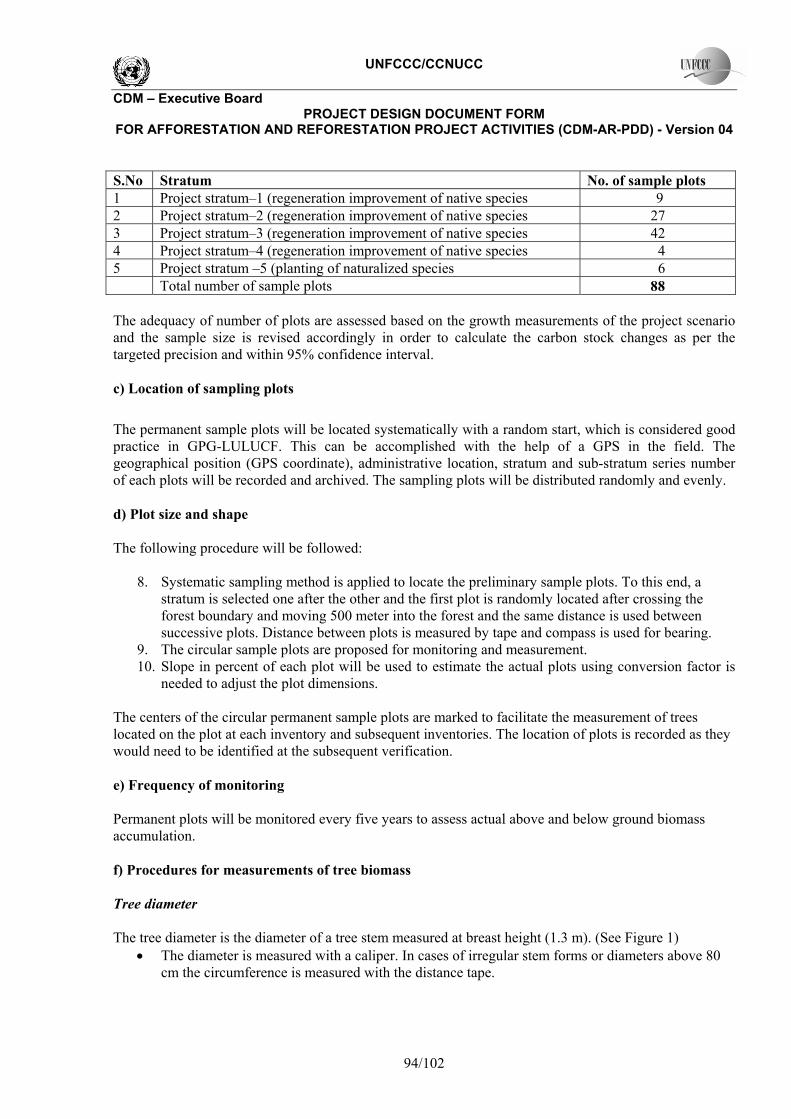
UNFCCC/CCNUCC
CDM � Executive Board PROJECT DESIGN DOCUMENT FORM
FOR AFFORESTATION AND REFORESTATION PROJECT ACTIVITIES (CDM-AR-PDD) - Version 04
94/102
S.No Stratum No. of sample plots 1 Project stratum�1 (regeneration improvement of native species 9 2 Project stratum�2 (regeneration improvement of native species 27 3 Project stratum�3 (regeneration improvement of native species 42 4 Project stratum�4 (regeneration improvement of native species 4 5 Project stratum �5 (planting of naturalized species 6 Total number of sample plots 88 The adequacy of number of plots are assessed based on the growth measurements of the project scenario and the sample size is revised accordingly in order to calculate the carbon stock changes as per the targeted precision and within 95% confidence interval. c) Location of sampling plots
The permanent sample plots will be located systematically with a random start, which is considered good practice in GPG-LULUCF. This can be accomplished with the help of a GPS in the field. The geographical position (GPS coordinate), administrative location, stratum and sub-stratum series number of each plots will be recorded and archived. The sampling plots will be distributed randomly and evenly. d) Plot size and shape The following procedure will be followed:
8. Systematic sampling method is applied to locate the preliminary sample plots. To this end, a stratum is selected one after the other and the first plot is randomly located after crossing the forest boundary and moving 500 meter into the forest and the same distance is used between successive plots. Distance between plots is measured by tape and compass is used for bearing.
9. The circular sample plots are proposed for monitoring and measurement. 10. Slope in percent of each plot will be used to estimate the actual plots using conversion factor is
needed to adjust the plot dimensions. The centers of the circular permanent sample plots are marked to facilitate the measurement of trees located on the plot at each inventory and subsequent inventories. The location of plots is recorded as they would need to be identified at the subsequent verification. e) Frequency of monitoring Permanent plots will be monitored every five years to assess actual above and below ground biomass accumulation. f) Procedures for measurements of tree biomass Tree diameter The tree diameter is the diameter of a tree stem measured at breast height (1.3 m). (See Figure 1)
• The diameter is measured with a caliper. In cases of irregular stem forms or diameters above 80 cm the circumference is measured with the distance tape.

UNFCCC/CCNUCC
CDM � Executive Board PROJECT DESIGN DOCUMENT FORM
FOR AFFORESTATION AND REFORESTATION PROJECT ACTIVITIES (CDM-AR-PDD) - Version 04
95/102
• The caliper is held perpendicular to the stem axis with the axis of the caliper pointing towards the plot center.
• The measurement is rounded down to full centimeters. • The minimum diameter to be measured is 4 cm.
Trees with inclined stem axis are skipped if the measurement point at 1.3 m is outside the plot. Trees with inclined stem are measured if the bottom of the stem is outside but the measurement point of dbh is inside the plot. Special cases of tree diameter measurement 1. Branch or knot at 1.3 m: One diameter measurement is done above and one below the disturbance,
calculating the diameter as average of the two measurements. 2. Forked tree/twin stem above 1.3 m: It is considered as one single tree. 3. Forked tree/twin stem below 1.3 m: It is considered as two trees. Each stem is measured separately
(and gets its own tree number). 4. Bifurcation at 1.3 m: In this case the measurement is taken below the bifurcation. 5. Measurement impossible: The diameter at breast height gets the value �0� and the reason is given as
remark in Figure below.
Figure 1: Examples of diameter measurements.
Tree height For each site, the yield class will be determined by measuring minimum three tree heights. If the tree heights of several trees are the same, one measurement can be used for several trees. g) Procedures for the maintenance of equipment used in vegetation measurement The procedures for maintenance of equipment used in vegetation measurement are outlined below. In case no ready guidance on the procedures is available, the recommendations of local forest management agency will be followed.
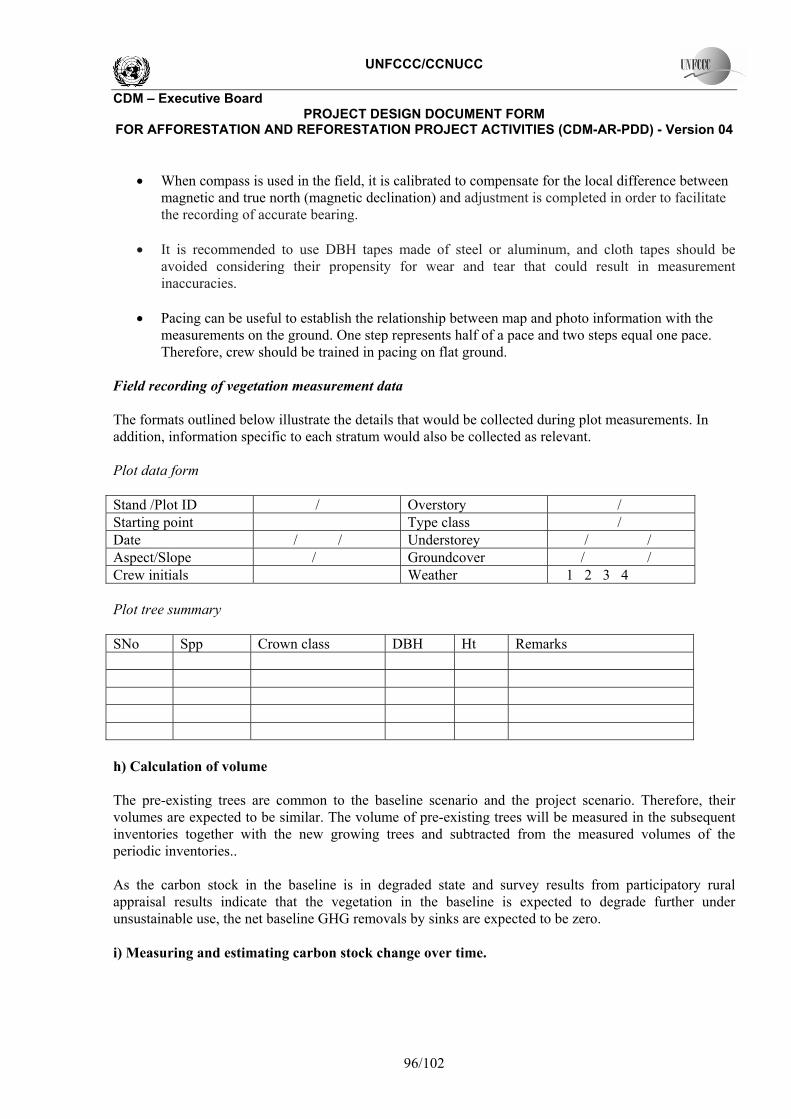
UNFCCC/CCNUCC
CDM � Executive Board PROJECT DESIGN DOCUMENT FORM
FOR AFFORESTATION AND REFORESTATION PROJECT ACTIVITIES (CDM-AR-PDD) - Version 04
96/102
• When compass is used in the field, it is calibrated to compensate for the local difference between
magnetic and true north (magnetic declination) and adjustment is completed in order to facilitate the recording of accurate bearing.
• It is recommended to use DBH tapes made of steel or aluminum, and cloth tapes should be
avoided considering their propensity for wear and tear that could result in measurement inaccuracies.
• Pacing can be useful to establish the relationship between map and photo information with the
measurements on the ground. One step represents half of a pace and two steps equal one pace. Therefore, crew should be trained in pacing on flat ground.
Field recording of vegetation measurement data The formats outlined below illustrate the details that would be collected during plot measurements. In addition, information specific to each stratum would also be collected as relevant. Plot data form Stand /Plot ID / Overstory / Starting point Type class / Date / / Understorey / / Aspect/Slope / Groundcover / / Crew initials Weather 1 2 3 4 Plot tree summary SNo Spp Crown class DBH Ht Remarks h) Calculation of volume The pre-existing trees are common to the baseline scenario and the project scenario. Therefore, their volumes are expected to be similar. The volume of pre-existing trees will be measured in the subsequent inventories together with the new growing trees and subtracted from the measured volumes of the periodic inventories.. As the carbon stock in the baseline is in degraded state and survey results from participatory rural appraisal results indicate that the vegetation in the baseline is expected to degrade further under unsustainable use, the net baseline GHG removals by sinks are expected to be zero. i) Measuring and estimating carbon stock change over time.
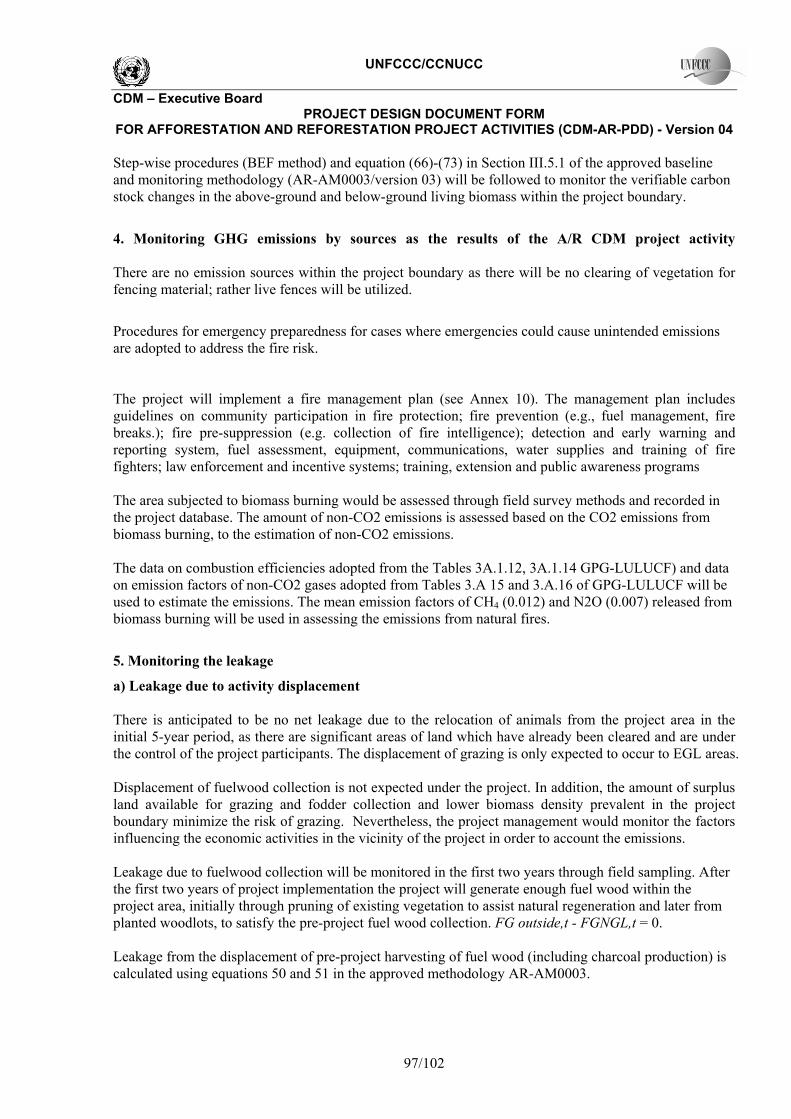
UNFCCC/CCNUCC
CDM � Executive Board PROJECT DESIGN DOCUMENT FORM
FOR AFFORESTATION AND REFORESTATION PROJECT ACTIVITIES (CDM-AR-PDD) - Version 04
97/102
Step-wise procedures (BEF method) and equation (66)-(73) in Section III.5.1 of the approved baseline and monitoring methodology (AR-AM0003/version 03) will be followed to monitor the verifiable carbon stock changes in the above-ground and below-ground living biomass within the project boundary.
4. Monitoring GHG emissions by sources as the results of the A/R CDM project activity There are no emission sources within the project boundary as there will be no clearing of vegetation for fencing material; rather live fences will be utilized.
Procedures for emergency preparedness for cases where emergencies could cause unintended emissions are adopted to address the fire risk. The project will implement a fire management plan (see Annex 10). The management plan includes guidelines on community participation in fire protection; fire prevention (e.g., fuel management, fire breaks.); fire pre-suppression (e.g. collection of fire intelligence); detection and early warning and reporting system, fuel assessment, equipment, communications, water supplies and training of fire fighters; law enforcement and incentive systems; training, extension and public awareness programs
The area subjected to biomass burning would be assessed through field survey methods and recorded in the project database. The amount of non-CO2 emissions is assessed based on the CO2 emissions from biomass burning, to the estimation of non-CO2 emissions.
The data on combustion efficiencies adopted from the Tables 3A.1.12, 3A.1.14 GPG-LULUCF) and data on emission factors of non-CO2 gases adopted from Tables 3.A 15 and 3.A.16 of GPG-LULUCF will be used to estimate the emissions. The mean emission factors of CH4 (0.012) and N2O (0.007) released from biomass burning will be used in assessing the emissions from natural fires.
5. Monitoring the leakage
a) Leakage due to activity displacement There is anticipated to be no net leakage due to the relocation of animals from the project area in the initial 5-year period, as there are significant areas of land which have already been cleared and are under the control of the project participants. The displacement of grazing is only expected to occur to EGL areas. Displacement of fuelwood collection is not expected under the project. In addition, the amount of surplus land available for grazing and fodder collection and lower biomass density prevalent in the project boundary minimize the risk of grazing. Nevertheless, the project management would monitor the factors influencing the economic activities in the vicinity of the project in order to account the emissions. Leakage due to fuelwood collection will be monitored in the first two years through field sampling. After the first two years of project implementation the project will generate enough fuel wood within the project area, initially through pruning of existing vegetation to assist natural regeneration and later from planted woodlots, to satisfy the pre-project fuel wood collection. FG outside,t - FGNGL,t = 0. Leakage from the displacement of pre-project harvesting of fuel wood (including charcoal production) is calculated using equations 50 and 51 in the approved methodology AR-AM0003.

UNFCCC/CCNUCC
CDM � Executive Board PROJECT DESIGN DOCUMENT FORM
FOR AFFORESTATION AND REFORESTATION PROJECT ACTIVITIES (CDM-AR-PDD) - Version 04
98/102
where:
LK fuelwood = leakage due to displacement of fuelwood collection up to year t*; tonnes CO2-e. FGt = volume of fuelwood gathering displaced in unidentified areas; m3 yr-1 FGoutside,t = volume of fuelwood gathering displaced outside the project area at year t; m3 yr-1 FGNGL,t = volume of fuelwood gathering in NGL areas and supplied to pre-project fuelwood collectors or charcoal producers; m3 yr-1 D = basic wood density; tonnes d.m. m-3 (see IPCC GPG-LULUCF, Table 3A.1.9) BEF2 = biomass expansion factor for converting volumes of extracted round wood to total above-ground biomass (including bark); dimensionless Table 3A.1.10 CF = carbon fraction of dry matter (default = 0.5); tonnes C (tonnes d.m.)-1 (pre-project fuel wood collection in the project areas has been estimated based on community consultations during project preparation and the baseline survey)
Variable Data
Type Unit Source
Biomass Expansion Factor Absolute number
ratio From GPG tables
Basic Wood density Absolute number
ratio From GPG tables
Volume of fuelwood collection displaced to alternative location
Absolute number
Cubic meters
Measurement
6. Quality Assurance and Quality Control (QA/QC)
To ensure the net anthropogenic GHG removals by sinks to be measured and monitored precisely, credibly, verifiably and transparently, a quality assurance and quality control (QA/QC) procedure will be implemented,
a) Reliable field measurements
To ensure the reliable field measurements,
! Standard Operating Procedures (SOPs) for each step of the field measurements, including all detail phases of the field measurements and provisions for documentation for verification purposes are proposed in this document and they will be adjusted periodically.
! Training courses on the field data collection and data analyses will be held for persons involving in the field measurement works. The training courses will ensure that each field-team members is fully aware of all procedures and the importance of collecting data as accurately as possible.
b) Verification of field data
To verify that plots have been installed and the measurements taken correctly,

UNFCCC/CCNUCC
CDM � Executive Board PROJECT DESIGN DOCUMENT FORM
FOR AFFORESTATION AND REFORESTATION PROJECT ACTIVITIES (CDM-AR-PDD) - Version 04
99/102
- Randomly selected plots will be re-measured by teams other than those involved in the prior plot measurements - Key re-measurement elements include the location of plots, DBH and tree height. - The re-measurement data will be compared with the original measurement data. Errors assessed in the prior measurements will be corrected and recorded and would be used to calculate the measurement error.
c) Verification of data entry and analysis
To minimize the possible errors in the process of data entry, the entry of both field data and laboratory data will be reviewed by an independent expert team and compared with independent data to ensure that the data are realistic. Communication between all personnel involved in measuring and analyzing data will be used to resolve any apparent anomalies before the final analysis of the monitoring data is completed.
d) Data maintenance and archiving
Data archiving will take both electronic and paper forms, and copies of all data will be provided to each project participant. All electronic data and reports will also be copied on durable media such as CDs and copies of the CDs are stored in multiple locations. The archives include:
! Copies of all original field measurement data, laboratory data, data analysis spreadsheet;
! Estimates of the carbon stock changes in all pools and non-CO2 GHG and corresponding calculation spreadsheets;
! GIS products;
! Copies of the measuring and monitoring reports.
7. Monitoring of environmental impacts outside the project boundary
Given the significant environmental benefits anticipated from this project, it is difficult to conceive negative environmental impacts outside the project boundary. In order to monitor these, the project manager will communicate the importance of recognising previously unforeseen negative environmental impacts outside the boundary. The project manager will establish a reporting process for community and cooperative members who manage the day-to-day aspects of the project. There will be an annual discussion with each cooperative to consider environmental impacts outside the project boundary.
8. Monitoring of socioeconomic issues
A Social Mitigation Action Plan has been developed (see Annex 7) and monitoring and evaluation of the actual implementation of the mitigation action plan will be done in a participatory manner with the active involvement of the beneficiary communities. Such participatory monitoring and evaluation will be incorporated in each project implementation phase throughout the implementation period. This will help to generate feedback on the on-going activities and to take timely corrective actions where necessary. Relevant and measurable monitoring indicators will be put in place to effectively monitor actual results and identify possible gaps of social mitigation action plan. Training schedule for field staff The Project will employ an estimated 5 additional staff on site who will implement the project monitoring for net carbon sequestration from the project areas. Table below identifies the specific staff training activities that will take place.
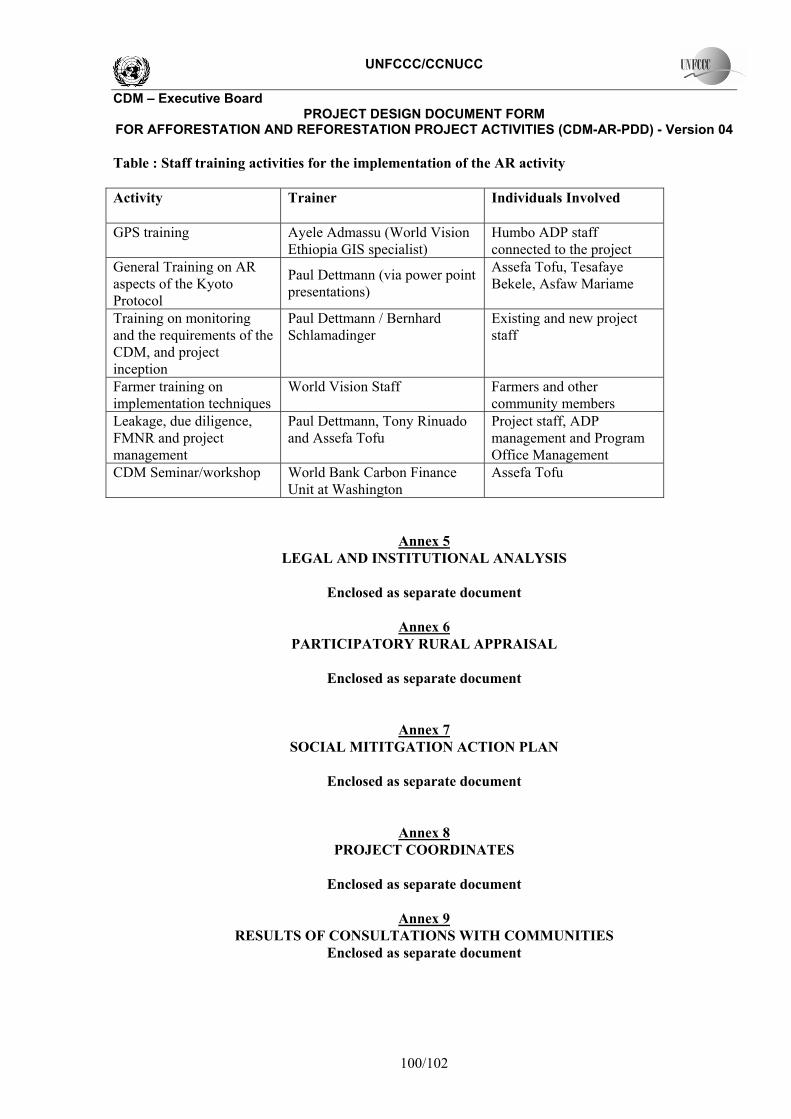
UNFCCC/CCNUCC
CDM � Executive Board PROJECT DESIGN DOCUMENT FORM
FOR AFFORESTATION AND REFORESTATION PROJECT ACTIVITIES (CDM-AR-PDD) - Version 04
100/102
Table : Staff training activities for the implementation of the AR activity Activity
Trainer Individuals Involved
GPS training Ayele Admassu (World Vision Ethiopia GIS specialist)
Humbo ADP staff connected to the project
General Training on AR aspects of the Kyoto Protocol
Paul Dettmann (via power point presentations)
Assefa Tofu, Tesafaye Bekele, Asfaw Mariame
Training on monitoring and the requirements of the CDM, and project inception
Paul Dettmann / Bernhard Schlamadinger
Existing and new project staff
Farmer training on implementation techniques
World Vision Staff
Farmers and other community members
Leakage, due diligence, FMNR and project management
Paul Dettmann, Tony Rinuado and Assefa Tofu
Project staff, ADP management and Program Office Management
CDM Seminar/workshop World Bank Carbon Finance Unit at Washington
Assefa Tofu
Annex 5 LEGAL AND INSTITUTIONAL ANALYSIS
Enclosed as separate document
Annex 6
PARTICIPATORY RURAL APPRAISAL
Enclosed as separate document
Annex 7 SOCIAL MITITGATION ACTION PLAN
Enclosed as separate document
Annex 8 PROJECT COORDINATES
Enclosed as separate document
Annex 9
RESULTS OF CONSULTATIONS WITH COMMUNITIES Enclosed as separate document
UNFCCC/CCNUCC
CDM � Executive Board PROJECT DESIGN DOCUMENT FORM
FOR AFFORESTATION AND REFORESTATION PROJECT ACTIVITIES (CDM-AR-PDD) - Version 04
101/102
Annex 10 FIRE MANAGEMENT PLAN Enclosed as separate document
Annex 11.
ADDITIONAL INFORMATION ON LEAKAGE Enclosed as separate document
Annex 12.
ADDITIONAL INFORMATION ON ADDITIONALITY Enclosed as separate document
Annex 13.
ADDITIONAL INFORMATION ON FOREST AND PLANTATION GROWTH Enclosed as separate document
Annex 14.
ENVIRONMENTAL ANALYSIS Enclosed as separate document
- - - - -
•
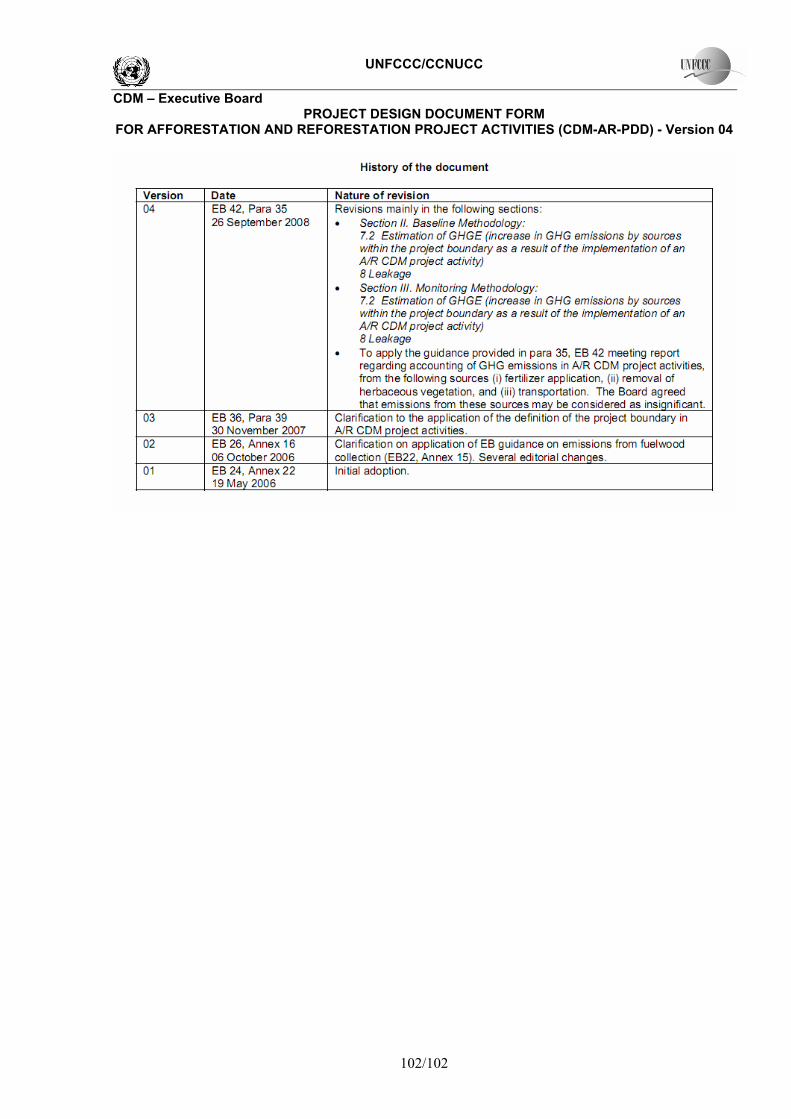
UNFCCC/CCNUCC
CDM � Executive Board PROJECT DESIGN DOCUMENT FORM
FOR AFFORESTATION AND REFORESTATION PROJECT ACTIVITIES (CDM-AR-PDD) - Version 04
102/102