
Underground design Laxemar Layout D2 - Rock mechanics and ...
52
Svensk Kärnbränslehantering AB Swedish Nuclear Fuel and Waste Management Co Box 250, SE-101 24 Stockholm Phone +46 8 459 84 00 R-09-10 Underground design Laxemar Layout D2 Rock mechanics and rock support Magnus Eriksson, Jesper Petersson, Magnus Leander Vattenfall Power Consultant December 2009
Transcript of Underground design Laxemar Layout D2 - Rock mechanics and ...
Svensk Kärnbränslehantering ABSwedish Nuclear Fueland Waste Management Co
Box 250, SE-101 24 Stockholm Phone +46 8 459 84 00
R-09-10
CM
Gru
ppen
AB
, Bro
mm
a, 2
010
Underground design Laxemar Layout D2
Rock mechanics and rock support
Magnus Eriksson, Jesper Petersson, Magnus Leander
Vattenfall Power Consultant
December 2009
Tänd ett lager:
P, R eller TR.
Underground design Laxemar Layout D2
Rock mechanics and rock support
Magnus Eriksson, Jesper Petersson, Magnus Leander
Vattenfall Power Consultant
December 2009
ISSN 1402-3091
SKB Rapport R-09-10
This report concerns a study which was conducted for SKB. The conclusions and viewpoints presented in the report are those of the authors. SKB may draw modified conclusions, based on additional literature sources and/or expert opinions.
A pdf version of this document can be downloaded from www.skb.se.
R-09-10 3
Abstract
This report presents the work on rock reinforcement systems in the design step D2 of an underground repository facility at the Laxemar site, Oskarshamn Municipality. The general objective is to assign rock reinforcement for each functional area of the repository and show that it is feasible from a rock mechanical and operational point of view.
The main finding is that support of the underground openings does not appear to be problematic due to the exceptionally good rock conditions at the chosen site for the deep repository. The major issues to consider are the presence of highly transmissive features at depth, potential spalling-induced failures and the lifetime for the openings.
The report presents numerical calculations of the stress concentrations that occur around the openings in different directions in relation to the in situ stress field. Based on these it is concluded that under the most likely stress situation spalling is not likely to occur in any part of the repository. At elevated stress levels it was found that tangential stresses could exceed the spalling strength in the depositions holes if an unfavourable orientation of the deposition tunnels is chosen. Therefore, considering the uncertainty in in situ stress level as well as in rock mass strength, the recommendation is to orient the tunnels close to the direction of the major horizontal stress. However, spalling is not considered a critical issue for the constructability.
The geological conditions of the rock mass encountered in the repository layout are described as four different ground types. Influencing factors, such as geological discontinuities and hydrological and stress conditions have been evaluated by three categories of ground behaviours, without considering the effect of reinforcement or the benefit of modifications. The interaction between ground types, ground behaviour and assigned support types have been assessed by using the construction experiences from Oskarshamn, the empirical Q-system and analytical calculations. The analysis has been carried out both for the most probable and the most unfavourable system behaviour.
As rock support a general minimum support of shotcrete is proposed for all tunnels and caverns exclud-ing the deposition tunnels. The reason is that this will limit and simplify periodic inspections. Additional to this are five different rock support classes presented for different ground types and functional areas.
Possible mechanical instability due to high transmissivities in combination with high water pressures may occur very locally. Such inflows are considered to be reduced to a level where the impact can be minimised by adequate drainage. Lining might be a necessary measure in shafts where the inflow is of an extent that drainage is impractical.
The calculated amount of bolts in the repository is approximately half of the estimate quantity during design step D1. The required quantities of shotcrete and wire mesh are, however, more or less the same. The lower bolt quantity is generally considered an effect of the established good rock conditions and the use of the observational method as design concept.

4 R-09-10
Sammanfattning
Föreliggande rapport behandlar arbetet med bergförstärkningslösningar inom projekteringsskede D2 för en underjordisk slutförvarsanläggning i Laxemar, Oskarshamns kommun. Det övergripande syftet är att anvisa bergförstärkning för respektive funktionalitetsområde i förvaret och visa att det är lämpligt ur ett bergmekaniskt och driftsmässigt perspektiv.
Det primära resultatet är att förstärkning av undermarksutrymmena inte antas vara problematisk efter-som bergförhållandena vid den valda platsen för djupförvaret är exceptionellt goda. De huvudsakliga frågeställningarna är att beakta förekomsten av djupt förekommande, högtransmissiva strukturer, poten tialen för spjälkbrott och utrymmenas livslängd.
Rapporten presenterar numeriska beräkningar på spänningskoncentrationer som förväntas upp komma runt utrymmen vid olika riktningar i förhållande till in situ spänningsfältet. Baserat på dessa är slutsatsen att det vid den mest sannolika spänningssituationen, sannolikt inte kommer att ske någon spjälkning i förvarsanläggningen. Vid förhöjda spänningsnivåer visade det sig dock att den tangentiella spänningen kunde överstiga spjälkningshållfastigheten vid en ofördelaktig orientering av deponeringstunnlarna. Rekommendationen är därför, med hänsyn till osäkerheten i spännings fälten och i bergmassans hållfast-het, att orientera tunnlarna i enlighet med den dominerande horisontella spänningen. Spjälkning bedöms dock inte vara något avgörande problem för byggbarheten.
De geologiska förhållanden som förväntas i förvarslayouten kan beskrivas i termer av fyra olika berg klasser. Faktorer så som geologiska diskontinuiteter, hydrologiska förhållanden och spännings-förhållanden har utvärderats i tre kategorier av brottmoder, utan hänsyn till förstärkningens effekt eller modifieringsfördelar. Samspelet mellan bergklasser, brottmoder och fastslagen förstärkning har utvärderats baserat på konstruktionserfarenheter från Oskarshamnsområdet, det empiriska Q-systemet och analytiska beräkningar. Analysen har genomförts både för de mest sannolika och de mest ofördelaktiga systemegenskaperna.
Som bergförstärkning föreslås en generell minimiförstärkning av sprutbetong för alla tunnlar och hallar bortsett från deponeringstunnlarna. Syftet är att begränsa och förenkla periodiska besiktningar. Dessutom föreslås fem olika bergförstärkningsklasser för olika bergklasser och funktionalitetsområden.
Möjlig instabilitet på grund av hög transmissivitet i kombination med höga vattentryck kan förekomma mycket lokalt. Sådana inflöden förutsätts vara möjliga att reducera till en nivå där problemen kan minimeras med adekvat dränering. Lining skulle kunna vara en nödvändig åtgärd i schakt där inflödet är av en storlek att dränering är opraktiskt.
De beräknade mängderna bult i slutförvaret uppgår till ungefär hälften av de uppskattade kvantiteterna under designsteg D1. De erforderliga mängderna sprutbetong och nät är dock mer eller mindre de samma. Den lägre kvantiteten bult antas generellt vara en effekt av de goda bergförhållandena och tillämpandet av observationsmetoden som ett designkoncept.

R-09-10 5
Contents
1 Introduction 71.1 Background 71.2 Objective and scope 71.3 Methodology 71.4 Requirements for the reinforcement system 81.5 Controlling documents and guideline instructions 81.6 Reference design and guideline instructions regarding rock reinforcement 91.7 Layout 92 Design permises and site conditions 112.1 Geological outlines 112.2 Definitions of ground types 132.3 Distribution of ground types in the repository 14
2.3.1 Ramp and central area 142.3.2 Deposition area 16
3 Ground behaviour 193.1 Definition of ground behaviour 193.2 Assumptions regarding the ground behaviour 193.3 Combinations of ground type and ground behaviour 203.4 Distribution of ground behaviour in the repository 214 Stress analysis 234.1 Introduction 234.2 Strength and stress parameters 234.3 Analysis methods 244.4 Central area 254.5 Profile of the main tunnels 264.6 Tunnel crossings 274.7 Deposition holes 294.8 Conclusions and discussion 325 Support types 335.1 Introduction 335.2 The impact of various ground types 345.3 Spalling 355.4 Shafts, caverns and deposition tunnels 366 System behaviour 376.1 Analysis methods 37
6.1.1 Experience from underground works at Oskarshamn 376.1.2 The Q-system 386.1.3 Analytical calculations on load bearing capacity on reinforcement 38
6.2 Most probable system behaviour 416.2.1 Experience from underground works at Oskarshamn 416.2.2 Analytical calculations 42
6.3 Most unfavourable system behaviour 427 Reinforcement quantities 457.1 General 457.2 Compilation of amounts 458 Constructability and uncertainties 498.1 Uncertainties 498.2 Effect on constructability 498.3 Observation parameters and acceptable limits 509 Comments and conclusions 5110 References 53Appendix A Tangential stress in depositions holes 55

R-09-10 7
1 Introduction
1.1 BackgroundSKB has been commissioned to manage the radioactive waste from Swedish nuclear power plants. Spent nuclear fuel is currently transferred successively from Swedish nuclear power plants to a central intermediate repository for spent nuclear fuel (CLAB). SKB is planning to store the spent nuclear fuel in a final repository designed in accordance with the KBS-3 method, in which the spent nuclear fuel is encapsulated in watertight and load-bearing copper canisters. The canisters are deposited in crystalline rock at about 500 m depth, and enclosed in a buffer, which prevents water ingress and protects the canister. When deposition is complete, the tunnels and cavern are sealed.
The current activity involves carrying out design phase D2 for the two selected sites, Forsmark (Östhammar Municipality) and Laxemar (Oskarshamn Municipality). A number of different studies of both sites have been carried out in parallel in order to determine which of the two sites is the more suitable for a final repository.
Rock reinforcement studies are a central part of this design. This involves evaluating and defining the amount and composition of material needed for rock reinforcement in the various parts of the reposi-tory in order to ensure that the requirements for functionality and safety are attained (described in more detail in Section 1.3).
1.2 Objective and scopeThis document reports the work on rock reinforcement systems in the current design (Step D2) of an underground repository facility at the Laxemar site, Oskarshamn Municipality. The general objective is to show that the underground fascility is feasible from a rock mechanical and operational point of view and to assign rock reinforcement. For each functional area of the repository the task is according to /SKB, 2007a/:
• Assessthedistributionofgroundtypesandgroundbehaviourswithoutconsideringtheeffectfrom support measures or sequential excavation.
• Determinetheappropriatesupportmeasuresbasedontheassessmentofgroundbehaviourandconsidering the requirements and the function of the facility part.
• Assessthesystembehaviourbasedoninteractionbetweengroundtypes,supportmeasuresandconstruction measures.
1.3 MethodologyTo address the uncertainty and variability of the geological conditions and ground structure interac-tion that may occur during the underground excavations of the final repository facility, SKB directs an approach known as the ‘Observational Method’. It is a risk-based approach that employs adaptive management by various monitoring and measurement techniques to substantially reduce costs while protecting investment, human health and the environment. In the work on rock reinforcement systems it is appropriate to apply the method in situations where uncertainties in prediction of the geotechni-cal behaviour may occur. The focus in design step D2 shall be on the following issues:
• Assessmentofacceptablelimitsofthebehaviour.
• Assessmentoftherangeofpossiblebehaviour.
• Outlinethecontentandtheparametersforamonitoringplaninlinewiththeproposeddesignsolutions.
8 R-09-10
For brittle failures, including wedge instability and spalling, the critical parameters are stress and block size /Stille and Holmberg 2007/. This means that an observation programme should include checks on the stresses and block sizes on which the design is based and that this must be verified in connection with tunnelling. If the conditions deviate, a more suitable reinforcement solution should be chosen. The guidelines for the work on the rock reinforcement systems for the final repository are detailed /SKB 2007a/. According to this the work in design step D2 follows a concept where the geological conditions of the rock mass encountered during construction are described in engineering terms as four different ground types (GT). Moreover, it involves evaluations of the potential ground behaviour (GB) considering each ground type, without considering the effect of reinforcement or the benefit of modifications. Three general categories of ground behaviours, as modified from /Palmstrom and Stille 2007/, have been provided for the evaluation of influencing factors, such as geological discontinuities, hydrological and stress conditions. After the ground types and ground behaviour have been determined, appropriate reinforcement types are suggested. The final step in the concept is an assessment of the system behaviour, defined as the interaction between the ground types, ground behaviour and support types.
The system behaviour has been assessed using the construction experiences from underground works at Oskarshamn, the empirical Q-system and analytical calculations on load bearing capacity. The analysis has been carried out both for the most probable and the most unfavourable system behaviour.
An essential task in this work is to assess the rock mass stability during construction quantitatively. The main findings of design step D1, as concluded in /Martin 2005/, is that gravity-driven, fall-out or wedge stability failures can be adequately handled by standard rock support and hence is not an issue for layout adaptation or for safety case. Therefore, the main attention is given to stress induced failures. The stress analysis aims at describing the stresses around the openings in the central area, main and deposition tunnels, including crossings, in the deposition area and in deposition holes.
1.4 Requirements for the reinforcement systemRock reinforcement shall be designed with respect to stability and required maintenance for the neces-sary activities to be carried out in a safe manner. It shall thus comprise development and description of methods and materials needed for the construction of the underground openings to reach sufficient tightness, load-bearing capacity, stability and durability.
The underground openings of importance for the long term safety shall be adapted to ensure isolation and containment for as long time as required considering the radio toxicity of the spent nuclear fuel. In this context, the repository shall be optimised with respect to the rock mass behaviour and the in situ stresses of the area. The critical factors are occurrence and orientation of fractures and deformation zones, as well as any risks of stress-induced spalling. This should be considered in:
• Choiceofrepositorydepth.• Orientationofdepositiontunnels.• Discardingofdepositionholepositionsduetotheriskofspalling.
Material used for rock reinforcement should not create unfavourable chemical conditions, which may affect the barrier function of the repository.
1.5 Controlling documents and guideline instructionsThe task was implemented on the basis of the controlling documents, various documents with input data, and guideline instructions. Controlling documents for the work are:
• UndergroundDesignPremises(UDP/D2)/SKB2007a/.• Client’senvironmentalprogrammeforfinalrepository/SKB2007b/.• Preliminarysafetyanalysis(PSAR)–Requirementsandconstructionpremises/SKB2006/.• Statementoflayoutandtechnicalsolution/SKB2007c/.
R-09-10 9
Design parameters and engineering guidelines for the rock mass are provided in the Site Engineering Report, Laxemar /SKB 2008/. This document incorporates details regarding rock and fracture domains, as well as hydraulic and in situ stress conditions, with parameters required to provide a description in terms of ground types (GT). /SKB 2008/ also outlines the use of previous construction experiences /Carlsson and Christiansson 2007/ as empirical reference. Guidelines regarding the geometrical design of the underground repository are given in Appendix 1 of /SKB 2007a/.
1.6 Reference design and guideline instructions regarding rock reinforcement
In order to meet the requirements of Section 1.4, guidelines are given in /SKB 2007a/, and in certain supplementary reports. A brief summary of the key guidelines used in design work is given below.
In /SKB 2008/, repository depth is given as 500 m. This means that the roofs of the deposition tunnels shall be set at 500 m depth or below.
The orientation of the deposition tunnels has been studied by /Martin 2005/. The conclusion of this work was that the risk of spalling is ‘significantly reduced’ if the tunnel is oriented within 30° of the direction of the maximum horizontal stress.
The distance between deposition holes shall be determined with respect to the highest permissible temperature in the buffer, which depends on the thermal properties of the rock mass. Depending on rock domain the spacing ranges between 8.1 and 10.5 m /SKB 2008/.
Rock reinforcement should provide sufficient stability and load-bearing capability to the final reposi-tory facility in order to secure operations and the working environment during the design working life. Methods and material used for reinforcement work must not adversely affect the load-bearing functions of the final repository. Apart from the fact that all cement used in underground installations which have to remain after back-filling and sealing should have a pH-value less than 11, SKB’s aim is that conventional methods and materials should be used for all rock reinforcement.
The designed working life should for the all facility parts excluding deposition tunnels be at least 100 years. The deposition tunnels should be designed for a working life of at least 5 years.
There should be no reinforcement of the deposition holes. If there is any indication that reinforcement would be needed in a deposition hole, the hole should be discarded.
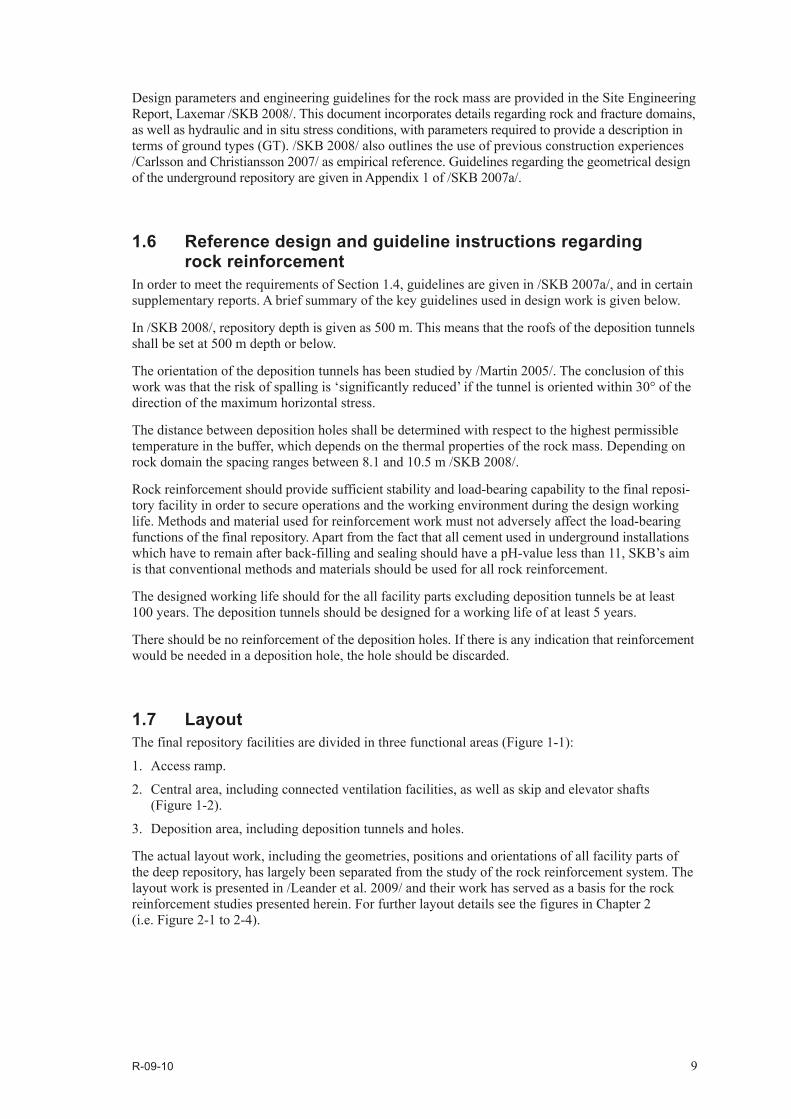
1.7 LayoutThe final repository facilities are divided in three functional areas (Figure 1-1):
1. Access ramp.
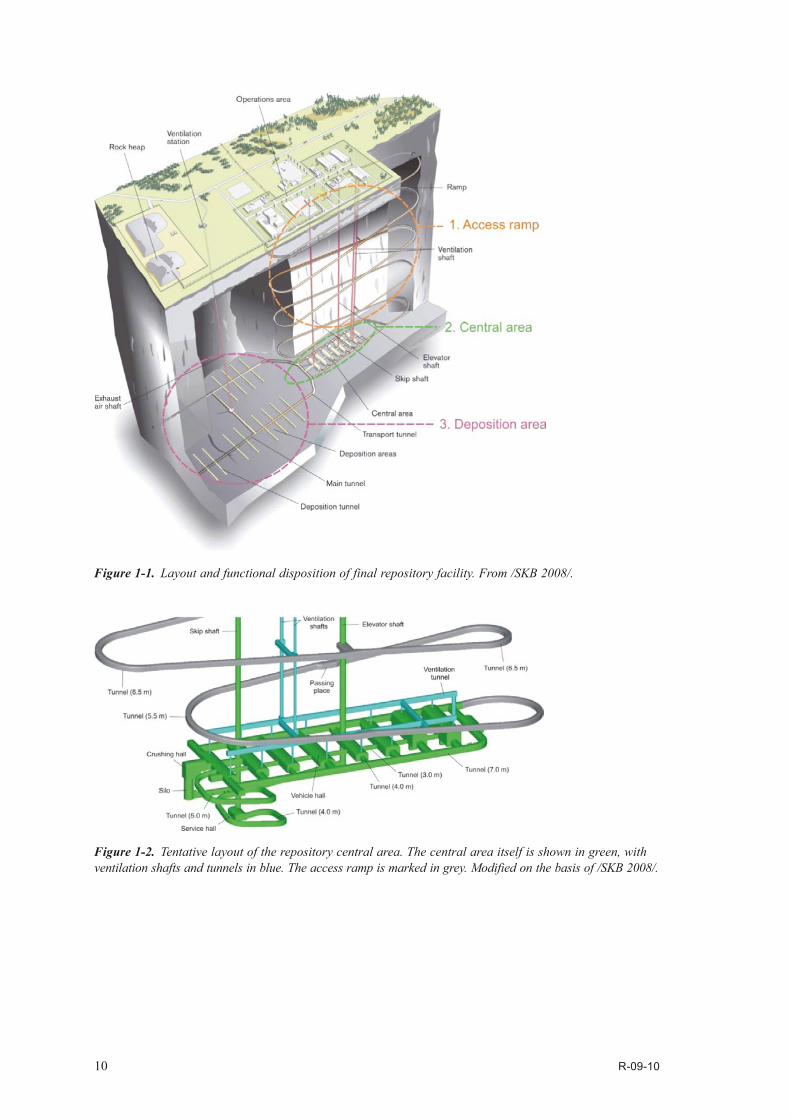
2. Central area, including connected ventilation facilities, as well as skip and elevator shafts (Figure 1-2).
3. Deposition area, including deposition tunnels and holes.
The actual layout work, including the geometries, positions and orientations of all facility parts of the deep repository, has largely been separated from the study of the rock reinforcement system. The layout work is presented in /Leander et al. 2009/ and their work has served as a basis for the rock reinforcement studies presented herein. For further layout details see the figures in Chapter 2 (i.e. Figure 2-1 to 2-4).
10 R-09-10
Figure 1‑1. Layout and functional disposition of final repository facility. From /SKB 2008/.
Figure 1‑2. Tentative layout of the repository central area. The central area itself is shown in green, with ventilation shafts and tunnels in blue. The access ramp is marked in grey. Modified on the basis of /SKB 2008/.

R-09-10 11
2 Design permises and site conditions
2.1 Geological outlinesThe following description of the geological conditions in the repository area is based on information given in /SKB 2008/.
All rocks in the area are igneous rocks that belong to the Transscandinavian Igneous Belt (TIB). The general bedrock distribution in the target volume can be described in terms of three rock domains, RSMA01, RSMM01 and RSMD01. The northeastern part is occupied by rock domain RSMA01, which principally consists of Ävrö granite, whereas rock domain RSMD01, which is dominated by quartz monzodiotite, occupies the southern and southwestern part. The two domains are separated by a central, arc-shaped domain characterized by frequent diorite to gabbro bodies in quartz monzo-diorite and particularly Ävrö granite. Mixtures of fine-grained dioritoid and Ävrö granite are locally embedded in RSMM01. All contacts towards RSMM01 dip north or north-eastwards.
Figure 2‑1. Plane view at 500 m depth of the Laxemar rock domain model and the relationship to the tentative layout of the repository. The positions of the two external ventilation shafts SA01 and SA02 are marked by red dots.
12 R-09-10
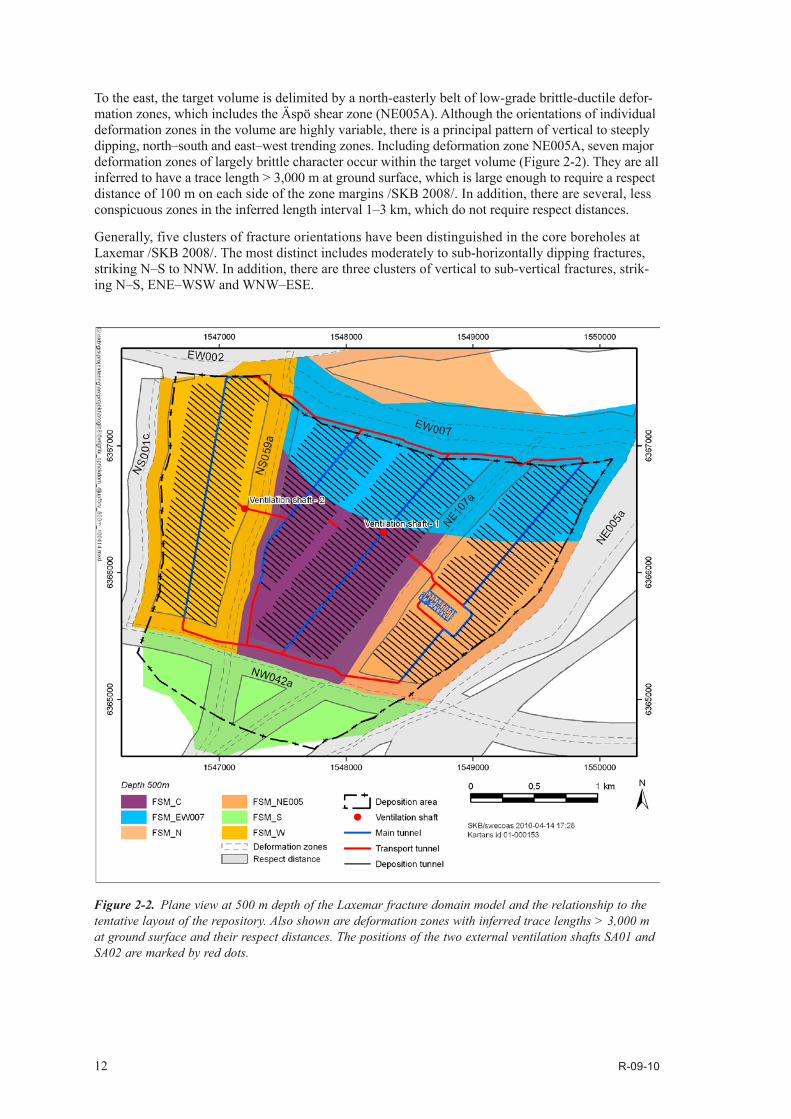
To the east, the target volume is delimited by a north-easterly belt of low-grade brittle-ductile defor-mation zones, which includes the Äspö shear zone (NE005A). Although the orientations of individual deformation zones in the volume are highly variable, there is a principal pattern of vertical to steeply dipping,north–southandeast–westtrendingzones.IncludingdeformationzoneNE005A,sevenmajordeformation zones of largely brittle character occur within the target volume (Figure 2-2). They are all inferred to have a trace length > 3,000 m at ground surface, which is large enough to require a respect distance of 100 m on each side of the zone margins /SKB 2008/. In addition, there are several, less conspicuouszonesintheinferredlengthinterval1–3km,whichdonotrequirerespectdistances.
Generally, five clusters of fracture orientations have been distinguished in the core boreholes at Laxemar /SKB 2008/. The most distinct includes moderately to sub-horizontally dipping fractures, strikingN–StoNNW.Inaddition,therearethreeclustersofverticaltosub-verticalfractures,strik-ingN–S,ENE–WSWandWNW–ESE.
Figure 2‑2. Plane view at 500 m depth of the Laxemar fracture domain model and the relationship to the tentative layout of the repository. Also shown are deformation zones with inferred trace lengths > 3,000 m at ground surface and their respect distances. The positions of the two external ventilation shafts SA01 and SA02 are marked by red dots.

R-09-10 13
Based on the fracture conditions, four separate domains can be recognised in the target volume. Fracture domain FSM_C is located in the central part of the volume. It is separated from fracture domain FSM_W in the western part by deformation zone NS059A, and from fracture domain FSM_NE005 in the eastern part, adjacent the Äspö shear zone by deformation zone NE107A (Figure 2-2). The fourth fracture domain, FSM_EW007 is situated north of FSM_C and FSM_NE005, around deformation zone EW007.
The bedrock in FSM_W, FSM_C and FSM_NE005 can be described as medium fractured rock. How ever, the intensity of different fracture sets varies among the three domains. The fracture intensity is slightly higher in FSM_EW007, with an increased frequency of fractures oriented sub-parallel to deformation zone EW007. No available data suggest that the fracture intensity in any of the domains changes towards depth /SKB 2008/.
The conductive features form an anisotropic system; near surface subhorizontal and steeply dipping featureswithWNWstrikedominateandbelow100–200mdepththerelativeintensityofthesub-horizontal features decreases and steeply dipping conductive features with WNW strike dominate. Taking also the decrease by depth of the intensity of the flowing features into account, it is realised that a large portion of the groundwater recharge is only flowing through the upper 200 m of rock before discharging /SKB 2008/. The overall rock mass hydraulic conductivity is likely to decrease withdepth.Atrepositorydepth(i.e.450–650mdepth),thehydraulicpropertiesareessentiallythesame for FSM_W and FSM_C with few high transmissive features. Fracture domain FSM_EW007, on the other hand, is much more conductive, due to a high frequency of connected transmissive fractures.
2.2 Definitions of ground typesIn order to describe the geological conditions of the area concerned in engineering terms, four differ-ent ground types (GT) have been defined in /SKB 2008/. A summary of these ground types and the Q-values given in /SKB 2008/ for each type is listed in Table 2-1.
The application of ground types to various phenomena in the geological model of the Laxemar area are provided in /SKB 2008/ and a summary is presented in Table 2-2. Most deformation zones that affect the layout is moderately to steeply dipping. There are, however, three gently dipping zones with dips less than 30° within the deposition area: EW946A, KLX07_DZ10 and KLX11_DZ11 (cf. Figure 2-4).
The only facility parts located within deformation zones with trace lengths < 3,000 m at ground sur-face and the respect distances to such zones are parts of the access ramp and the transport tunnels in thedepositionarea.Sincethereisageneralpatternofnorth–southandeast–westtrendingzonesinthearea, there are several crossings between two or more deformation zones, and hence respect distances. In order to avoid these lengths being calculated twice, overlapping parts have been excluded. The part excluded is always the one with the most favourable ground type distribution. Consequently, they are excluded according to the following hierarchy: deformation zone NE107A > gently dipping (< 30°) zones less than 3 km > deformation NS059A and respect distances > moderately to steeply dipping (< 30°) zones less than 3 km.
Table 2‑1. Summary of ground types (GT) /SKB 2008/.
Ground types
Q‑value Description
GT1 > 100 Sparsely fractured rock with isotropic properties.GT2 40–100 Blocky rock mass. Individual blocks are intimately interlocked.
Water-bearing fractures occur, especially in gently dipping zones.GT3 10–40 Sealed fracture network, which may result in blocky rock if
fractures are reactivated.GT4 4–20 Major deformation zones that require a respect distance. Water
transmission may be significant if fractures are not sealed.
14 R-09-10
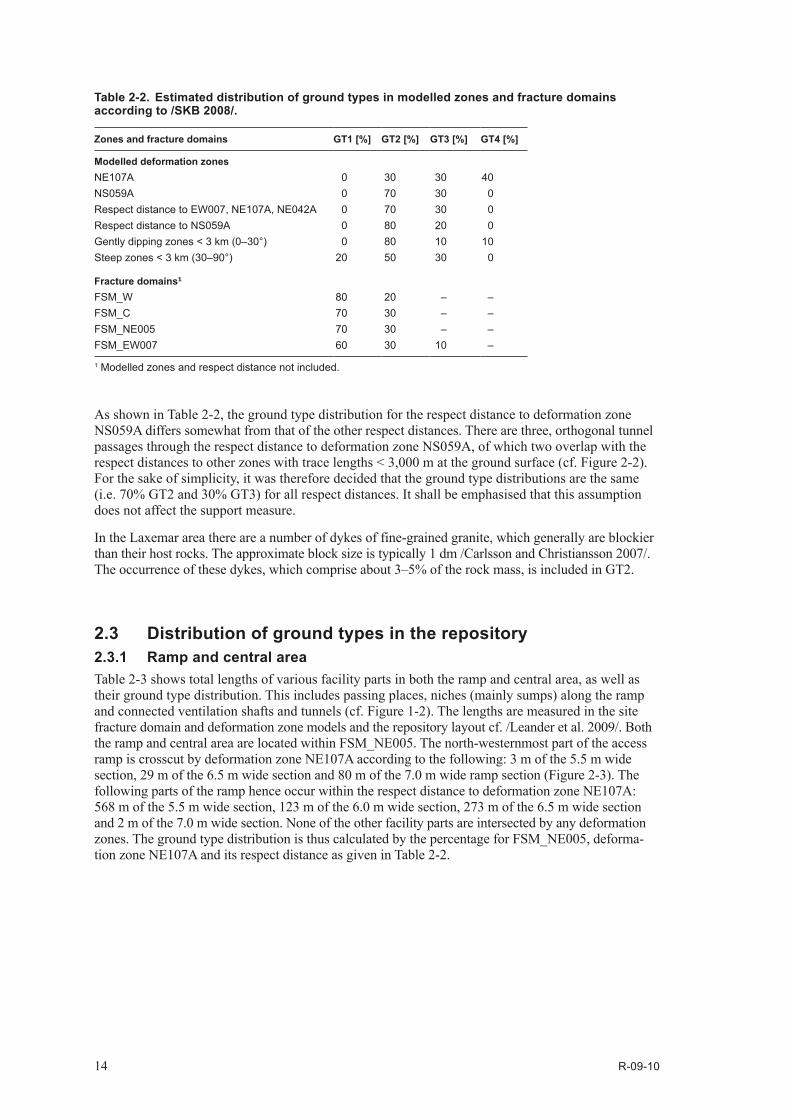
As shown in Table 2-2, the ground type distribution for the respect distance to deformation zone NS059A differs somewhat from that of the other respect distances. There are three, orthogonal tunnel passages through the respect distance to deformation zone NS059A, of which two overlap with the respect distances to other zones with trace lengths < 3,000 m at the ground surface (cf. Figure 2-2). For the sake of simplicity, it was therefore decided that the ground type distributions are the same (i.e. 70% GT2 and 30% GT3) for all respect distances. It shall be emphasised that this assumption does not affect the support measure.
In the Laxemar area there are a number of dykes of fine-grained granite, which generally are blockier than their host rocks. The approximate block size is typically 1 dm /Carlsson and Christiansson 2007/. Theoccurrenceofthesedykes,whichcompriseabout3–5%oftherockmass,isincludedinGT2.
2.3 Distribution of ground types in the repository2.3.1 Ramp and central areaTable 2-3 shows total lengths of various facility parts in both the ramp and central area, as well as their ground type distribution. This includes passing places, niches (mainly sumps) along the ramp and connected ventilation shafts and tunnels (cf. Figure 1-2). The lengths are measured in the site fracture domain and deformation zone models and the repository layout cf. /Leander et al. 2009/. Both the ramp and central area are located within FSM_NE005. The north-westernmost part of the access ramp is crosscut by deformation zone NE107A according to the following: 3 m of the 5.5 m wide section, 29 m of the 6.5 m wide section and 80 m of the 7.0 m wide ramp section (Figure 2-3). The following parts of the ramp hence occur within the respect distance to deformation zone NE107A: 568 m of the 5.5 m wide section, 123 m of the 6.0 m wide section, 273 m of the 6.5 m wide section and 2 m of the 7.0 m wide section. None of the other facility parts are intersected by any deformation zones. The ground type distribution is thus calculated by the percentage for FSM_NE005, deforma-tion zone NE107A and its respect distance as given in Table 2-2.
Table 2‑2. Estimated distribution of ground types in modelled zones and fracture domains according to /SKB 2008/.
Zones and fracture domains GT1 [%] GT2 [%] GT3 [%] GT4 [%]
Modelled deformation zonesNE107A 0 30 30 40NS059A 0 70 30 0Respect distance to EW007, NE107A, NE042A 0 70 30 0Respect distance to NS059A 0 80 20 0Gently dipping zones < 3 km (0–30°) 0 80 10 10Steep zones < 3 km (30–90°) 20 50 30 0
Fracture domains1
FSM_W 80 20 – –FSM_C 70 30 – –FSM_NE005 70 30 – –FSM_EW007 60 30 10 –
1 Modelled zones and respect distance not included.

R-09-10 15
Figure 2‑3. Tentative layout of the access ramp and central area showing the parts of the ramp within deformation zone NE107A (red) and its respect distance (purple).
Table 2‑3. The total length of various facility parts in the ramp and central area, as well as the ground type distribution.
Facility part Total length [m] GT1 [m] GT2 [m] GT3 [m] GT4 [m]
RampTunnel (5.5 m wide)1 4,549 2,785 1,592 171 1Tunnel (6.0 m wide) 123 – 86 37 –Tunnel (6.5 m wide) 707 284 321 91 11Tunnel (7.0 m wide) 230 104 69 25 32Passing places and niche (8.0 m wide) 211 148 63 – –Niche (10.0 m wide) 24 17 7 – –
VentilationShaft (ø 1.5 m) 252 176 76 – –Shaft (ø 2.5 m) 490 343 147 – –Shaft (ø 3.5 m) 490 343 147 – –Shaft (ø 4.5 m) 25 17 8 – –Tunnel (4.0 m wide) 807 565 242 – –Tunnel (8.0 m wide) 32 22 10 – –
Central areaSkip shaft (ø 5.0 m) 558 391 167 – –Elevator shaft (ø 6.0 m) 534 374 160 – –Silo (ø 9.5 m) 22 15 7 – –Tunnel (3.0 m wide) 134 94 40 – –Tunnel (4.0 m wide) 533 373 160 – –Tunnel (5.0 m wide) 47 33 14 – –Tunnel (7.0 m wide) 933 653 280 – –Halls (13.0 m wide) n = 5 290 203 87 – –Halls (15.0 m wide) n = 3 186 130 56 – –Crushing hall (10.0 m wide) 22 15 7 – –Vehicle hall (16.0 m wide) 65 45 20 – –Service hall (12 m wide) 20 14 6 – –
1 Includes also transitions to wider tunnel sections and one nisch.

16 R-09-10
2.3.2 Deposition areaTunnel lengths in the deposition area and their distribution in deformation zones and fracture domains are presented in Figure 2-4. The lengths are measured in a horizontal projection of the site fracture domain and deformation zone models and the repository layout cf. /Leander et al. 2009/. The deposi-tion area consists in total of 104,149 m of tunnels, of which slightly more than 8% occur in modelled deformation zones. Of the transportation tunnels slightly more than 80% are located within deformation zones or respect distances to major zones. The total distance of transport tunnels within the major zones NE107A and NS059A amounts to 256 m and within respect distances to such zones 5,089 m. Other facility parts of the deposition area are not touched by the major deformation zones or their respect distances.Atotalofninemodelleddeformationzonesinthelengthinterval1–3km(Figure2-4),and eleven zones defined in single boreholes and modelled as discs with a standard radius of 564 m are involved in the deposition area. Three of these deformation zones (EW946A, KLX07_DZ10 and KLX11_DZ11) are gently dipping with dips less than 30°. About 2% of the deposition tunnels and 2% of the main tunnels are located within gently dipping zones.
Ventilation shafts SA01 and SA02 have a total length of 1,029 m in fracture domain FSM_NE005 and FSM_W, respectively. The only modelled deformation zone that affects the ventilation shafts is KLX11_DZ11, which occurs in 20 m of SA02.
Figure 2‑4. Schematic three-dimensional view of the repository area at 300–600 m depth, showing modelled deformation zones relative to the layout. Discrete deformation zones without associated surface lineaments (modelled as circular slabs and denoted KLXxx_DZxx) have been excluded for the readability.

R-09-10 17
A classification in terms of ground types for the various tunnel types occurring in the deposition area and ventilation shafts SA01 and SA02 is given in Table 2-5. Classification is based on the distributions established in Table 2-2 and Table 2-4.
Since most of the transport tunnels in the deposition area to a great extent are located within the respectdistancetoeast–weststriking,majordeformationzones(EW007AandNW042A),theproportion of GT2 and GT3 is significantly higher than in other tunnel types. The proportion of GT2, GT3 and GT4 is lowest in the deposition tunnels where they together constitute about 34%.
Table 2‑4. Tunnel and shaft lengths in the deposition area and their distribution in zones and fracture domains.
Zones and fracture domains Ventilation shafts SA01 and SA02 [m]
Main tunnel [m]
Transport tunnel [m]
Deposition tunnel [m]
Total length 1,029 7,881 6,852 89,408
Modelled deformation zonesNE107A – – 106 –NS059A – – 150 –Respect distances to zones > 3 km1 – 43 5,089 –Gently dipping zones (< 30°) < 3 km 20 148 21 2,079Steep zones (> 30°) < 3 km2 – 504 27 5,298
Fracture domains3
FSM_W 501 1,899 353 22,359FSM_C – 1,993 376 23,052FSM_NE005 508 1,488 647 14,800FSM_EW007 – 1,807 84 21,820
1 Outside deformation zones NE107A and NS059A.2 Outside gently dipping zones3 Modelled zones and respect distance not included.
Table 2‑5. Distribution of ground types in various tunnels and shafts in the deposition area.
Facility part GT1 [m] GT2 [m] GT3 [m] GT4 [m]
Ventilation shafts SA01 and SA02 (ø 3.0 m) 757 268 2 2Main tunnel (10.0 m wide) 5,141 2,367 360 15Transport tunnel (7.0 m wide) 1,054 4,132 1,622 45Deposition tunnel (4.2 m wide) 58,535 26,686 3,979 208
R-09-10 19
3 Ground behaviour
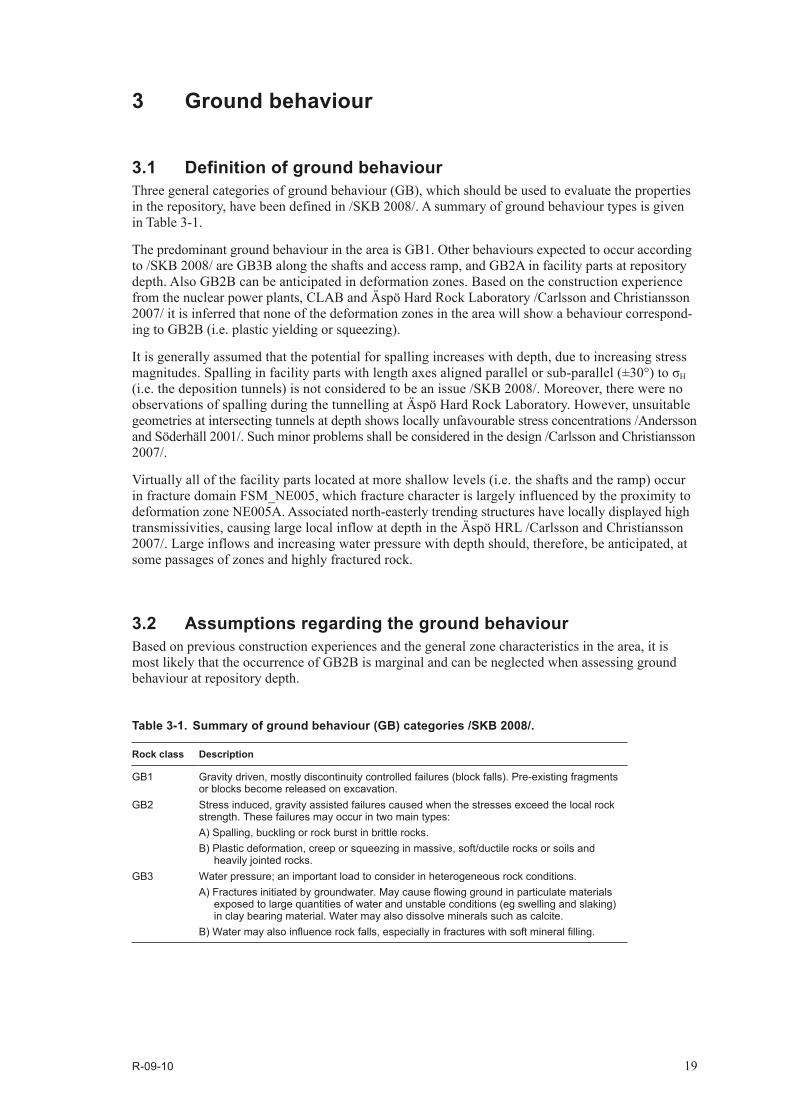
3.1 Definition of ground behaviourThree general categories of ground behaviour (GB), which should be used to evaluate the properties in the repository, have been defined in /SKB 2008/. A summary of ground behaviour types is given in Table 3-1.
The predominant ground behaviour in the area is GB1. Other behaviours expected to occur according to /SKB 2008/ are GB3B along the shafts and access ramp, and GB2A in facility parts at repository depth. Also GB2B can be anticipated in deformation zones. Based on the construction experience from the nuclear power plants, CLAB and Äspö Hard Rock Laboratory /Carlsson and Christiansson 2007/ it is inferred that none of the deformation zones in the area will show a behaviour correspond-ing to GB2B (i.e. plastic yielding or squeezing).
It is generally assumed that the potential for spalling increases with depth, due to increasing stress magnitudes.Spallinginfacilitypartswithlengthaxesalignedparallelorsub-parallel(±30°)toσH (i.e. the deposition tunnels) is not considered to be an issue /SKB 2008/. Moreover, there were no observations of spalling during the tunnelling at Äspö Hard Rock Laboratory. However, unsuitable geometries at intersecting tunnels at depth shows locally unfavourable stress concentrations /Andersson and Söderhäll 2001/. Such minor problems shall be considered in the design /Carlsson and Christiansson 2007/.
Virtually all of the facility parts located at more shallow levels (i.e. the shafts and the ramp) occur in fracture domain FSM_NE005, which fracture character is largely influenced by the proximity to deformation zone NE005A. Associated north-easterly trending structures have locally displayed high transmissivities, causing large local inflow at depth in the Äspö HRL /Carlsson and Christiansson 2007/. Large inflows and increasing water pressure with depth should, therefore, be anticipated, at some passages of zones and highly fractured rock.
3.2 Assumptions regarding the ground behaviourBased on previous construction experiences and the general zone characteristics in the area, it is most likely that the occurrence of GB2B is marginal and can be neglected when assessing ground behaviour at repository depth.
Table 3‑1. Summary of ground behaviour (GB) categories /SKB 2008/.
Rock class Description
GB1 Gravity driven, mostly discontinuity controlled failures (block falls). Pre-existing fragments or blocks become released on excavation.
GB2 Stress induced, gravity assisted failures caused when the stresses exceed the local rock strength. These failures may occur in two main types:A) Spalling, buckling or rock burst in brittle rocks.B) Plastic deformation, creep or squeezing in massive, soft/ductile rocks or soils and
heavily jointed rocks.GB3 Water pressure; an important load to consider in heterogeneous rock conditions.
A) Fractures initiated by groundwater. May cause flowing ground in particulate materials exposed to large quantities of water and unstable conditions (eg swelling and slaking) in clay bearing material. Water may also dissolve minerals such as calcite.
B) Water may also influence rock falls, especially in fractures with soft mineral filling.
20 R-09-10
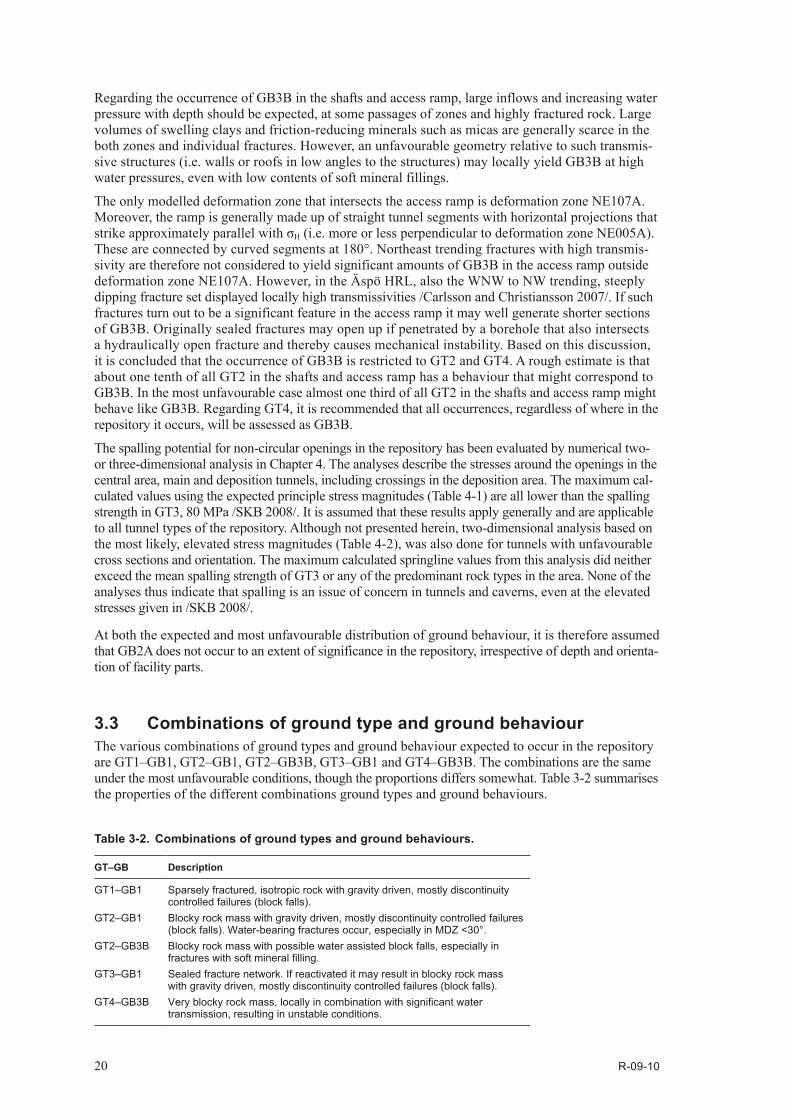
Regarding the occurrence of GB3B in the shafts and access ramp, large inflows and increasing water pressure with depth should be expected, at some passages of zones and highly fractured rock. Large volumes of swelling clays and friction-reducing minerals such as micas are generally scarce in the both zones and individual fractures. However, an unfavourable geometry relative to such transmis-sive structures (i.e. walls or roofs in low angles to the structures) may locally yield GB3B at high water pressures, even with low contents of soft mineral fillings.
The only modelled deformation zone that intersects the access ramp is deformation zone NE107A. Moreover, the ramp is generally made up of straight tunnel segments with horizontal projections that strikeapproximatelyparallelwithσH (i.e. more or less perpendicular to deformation zone NE005A). These are connected by curved segments at 180°. Northeast trending fractures with high transmis-sivity are therefore not considered to yield significant amounts of GB3B in the access ramp outside deformation zone NE107A. However, in the Äspö HRL, also the WNW to NW trending, steeply dipping fracture set displayed locally high transmissivities /Carlsson and Christiansson 2007/. If such fractures turn out to be a significant feature in the access ramp it may well generate shorter sections of GB3B. Originally sealed fractures may open up if penetrated by a borehole that also intersects a hydraulically open fracture and thereby causes mechanical instability. Based on this discussion, it is concluded that the occurrence of GB3B is restricted to GT2 and GT4. A rough estimate is that about one tenth of all GT2 in the shafts and access ramp has a behaviour that might correspond to GB3B. In the most unfavourable case almost one third of all GT2 in the shafts and access ramp might behave like GB3B. Regarding GT4, it is recommended that all occurrences, regardless of where in the repository it occurs, will be assessed as GB3B.
The spalling potential for non-circular openings in the repository has been evaluated by numerical two- or three-dimensional analysis in Chapter 4. The analyses describe the stresses around the openings in the central area, main and deposition tunnels, including crossings in the deposition area. The maximum cal-culated values using the expected principle stress magnitudes (Table 4-1) are all lower than the spalling strength in GT3, 80 MPa /SKB 2008/. It is assumed that these results apply generally and are applicable to all tunnel types of the repository. Although not presented herein, two-dimensional analysis based on the most likely, elevated stress magnitudes (Table 4-2), was also done for tunnels with unfavourable cross sections and orientation. The maximum calculated springline values from this analysis did neither exceed the mean spalling strength of GT3 or any of the predominant rock types in the area. None of the analyses thus indicate that spalling is an issue of concern in tunnels and caverns, even at the elevated stresses given in /SKB 2008/.
At both the expected and most unfavourable distribution of ground behaviour, it is therefore assumed that GB2A does not occur to an extent of significance in the repository, irrespective of depth and orienta-tion of facility parts.
3.3 Combinations of ground type and ground behaviourThe various combinations of ground types and ground behaviour expected to occur in the repository areGT1–GB1,GT2–GB1,GT2–GB3B,GT3–GB1andGT4–GB3B.Thecombinationsarethesameunder the most unfavourable conditions, though the proportions differs somewhat. Table 3-2 summarises the properties of the different combinations ground types and ground behaviours.
Table 3‑2. Combinations of ground types and ground behaviours.
GT–GB Description
GT1–GB1 Sparsely fractured, isotropic rock with gravity driven, mostly discontinuity controlled failures (block falls).
GT2–GB1 Blocky rock mass with gravity driven, mostly discontinuity controlled failures (block falls). Water-bearing fractures occur, especially in MDZ <30°.
GT2–GB3B Blocky rock mass with possible water assisted block falls, especially in fractures with soft mineral filling.
GT3–GB1 Sealed fracture network. If reactivated it may result in blocky rock mass with gravity driven, mostly discontinuity controlled failures (block falls).
GT4–GB3B Very blocky rock mass, locally in combination with significant water transmission, resulting in unstable conditions.
R-09-10 21
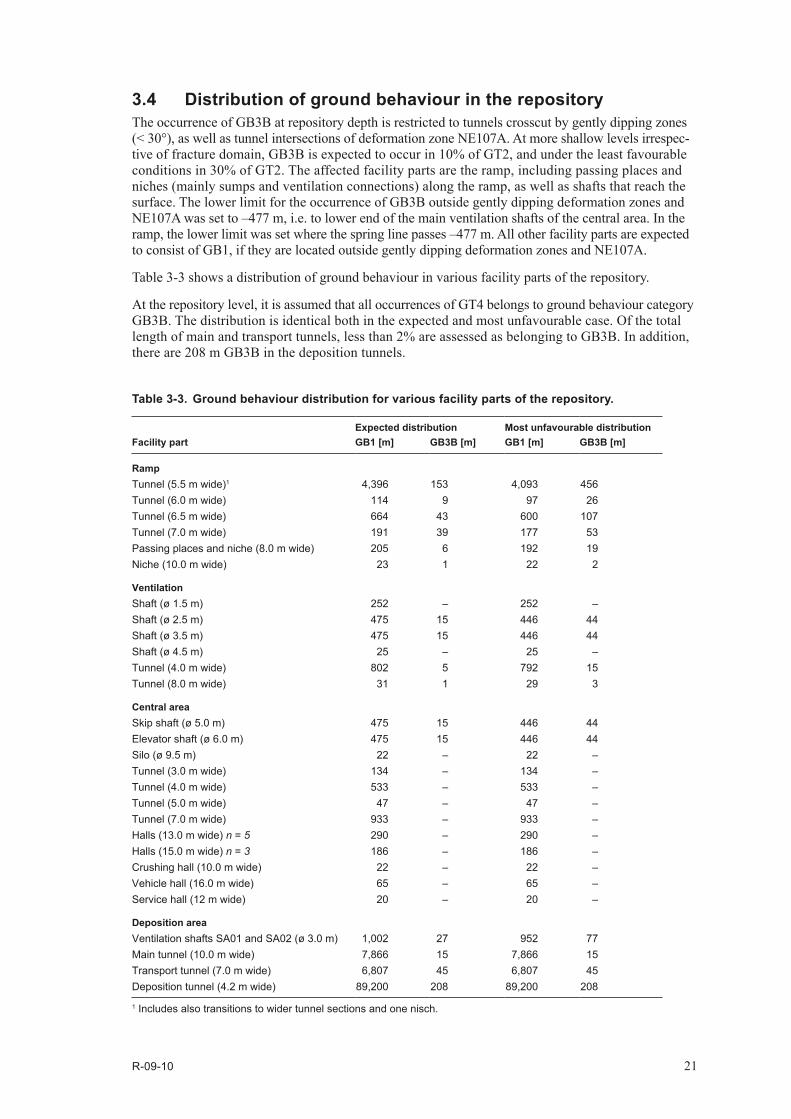
3.4 Distribution of ground behaviour in the repositoryThe occurrence of GB3B at repository depth is restricted to tunnels crosscut by gently dipping zones (< 30°), as well as tunnel intersections of deformation zone NE107A. At more shallow levels irrespec-tive of fracture domain, GB3B is expected to occur in 10% of GT2, and under the least favourable conditions in 30% of GT2. The affected facility parts are the ramp, including passing places and niches (mainly sumps and ventilation connections) along the ramp, as well as shafts that reach the surface. The lower limit for the occurrence of GB3B outside gently dipping deformation zones and NE107Awassetto–477m,i.e.tolowerendofthemainventilationshaftsofthecentralarea.Intheramp,thelowerlimitwassetwherethespringlinepasses–477m.Allotherfacilitypartsareexpectedto consist of GB1, if they are located outside gently dipping deformation zones and NE107A.
Table 3-3 shows a distribution of ground behaviour in various facility parts of the repository.
At the repository level, it is assumed that all occurrences of GT4 belongs to ground behaviour category GB3B. The distribution is identical both in the expected and most unfavourable case. Of the total length of main and transport tunnels, less than 2% are assessed as belonging to GB3B. In addition, there are 208 m GB3B in the deposition tunnels.
Table 3‑3. Ground behaviour distribution for various facility parts of the repository.
Expected distribution Most unfavourable distributionFacility part GB1 [m] GB3B [m] GB1 [m] GB3B [m]
RampTunnel (5.5 m wide)1 4,396 153 4,093 456Tunnel (6.0 m wide) 114 9 97 26Tunnel (6.5 m wide) 664 43 600 107Tunnel (7.0 m wide) 191 39 177 53Passing places and niche (8.0 m wide) 205 6 192 19Niche (10.0 m wide) 23 1 22 2
VentilationShaft (ø 1.5 m) 252 – 252 –Shaft (ø 2.5 m) 475 15 446 44Shaft (ø 3.5 m) 475 15 446 44Shaft (ø 4.5 m) 25 – 25 –Tunnel (4.0 m wide) 802 5 792 15Tunnel (8.0 m wide) 31 1 29 3
Central areaSkip shaft (ø 5.0 m) 475 15 446 44Elevator shaft (ø 6.0 m) 475 15 446 44Silo (ø 9.5 m) 22 – 22 –Tunnel (3.0 m wide) 134 – 134 –Tunnel (4.0 m wide) 533 – 533 –Tunnel (5.0 m wide) 47 – 47 –Tunnel (7.0 m wide) 933 – 933 –Halls (13.0 m wide) n = 5 290 – 290 –Halls (15.0 m wide) n = 3 186 – 186 –Crushing hall (10.0 m wide) 22 – 22 –Vehicle hall (16.0 m wide) 65 – 65 –Service hall (12 m wide) 20 – 20 –
Deposition areaVentilation shafts SA01 and SA02 (ø 3.0 m) 1,002 27 952 77Main tunnel (10.0 m wide) 7,866 15 7,866 15Transport tunnel (7.0 m wide) 6,807 45 6,807 45Deposition tunnel (4.2 m wide) 89,200 208 89,200 208
1 Includes also transitions to wider tunnel sections and one nisch.
R-09-10 23
4 Stress analysis
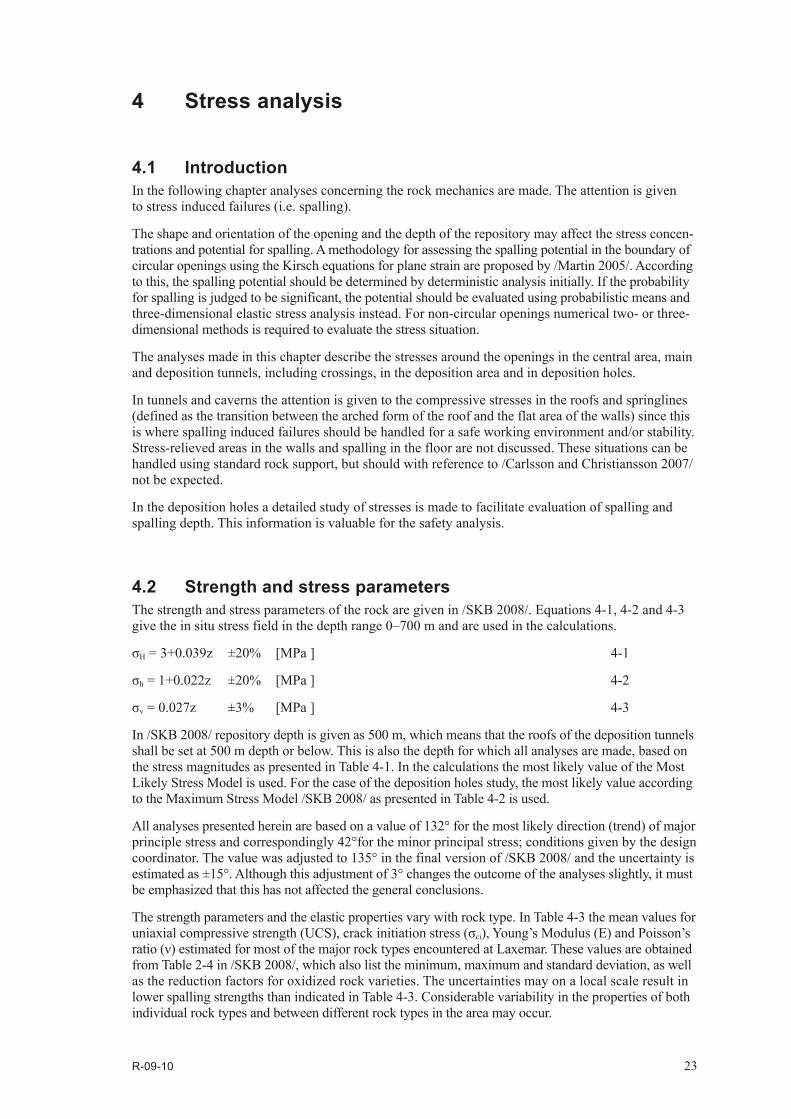
4.1 IntroductionIn the following chapter analyses concerning the rock mechanics are made. The attention is given to stress induced failures (i.e. spalling).
The shape and orientation of the opening and the depth of the repository may affect the stress concen-trations and potential for spalling. A methodology for assessing the spalling potential in the boundary of circular openings using the Kirsch equations for plane strain are proposed by /Martin 2005/. Accor ding to this, the spalling potential should be determined by deterministic analysis initially. If the probability for spalling is judged to be significant, the potential should be evaluated using probabilistic means and three-dimensional elastic stress analysis instead. For non-circular openings numerical two- or three-dimensional methods is required to evaluate the stress situation.
The analyses made in this chapter describe the stresses around the openings in the central area, main and deposition tunnels, including crossings, in the deposition area and in deposition holes.
In tunnels and caverns the attention is given to the compressive stresses in the roofs and springlines (defined as the transition between the arched form of the roof and the flat area of the walls) since this is where spalling induced failures should be handled for a safe working environment and/or stability. Stress-relieved areas in the walls and spalling in the floor are not discussed. These situations can be handled using standard rock support, but should with reference to /Carlsson and Christiansson 2007/ not be expected.
In the deposition holes a detailed study of stresses is made to facilitate evaluation of spalling and spalling depth. This information is valuable for the safety analysis.
4.2 Strength and stress parametersThe strength and stress parameters of the rock are given in /SKB 2008/. Equations 4-1, 4-2 and 4-3 givetheinsitustressfieldinthedepthrange0–700mandareusedinthecalculations.
σH = 3+0.039z ±20% [MPa ] 4-1
σh = 1+0.022z ±20% [MPa ] 4-2
σv = 0.027z ±3% [MPa ] 4-3
In /SKB 2008/ repository depth is given as 500 m, which means that the roofs of the deposition tunnels shall be set at 500 m depth or below. This is also the depth for which all analyses are made, based on the stress magnitudes as presented in Table 4-1. In the calculations the most likely value of the Most Likely Stress Model is used. For the case of the deposition holes study, the most likely value according to the Maximum Stress Model /SKB 2008/ as presented in Table 4-2 is used.
All analyses presented herein are based on a value of 132° for the most likely direction (trend) of major principle stress and correspondingly 42°for the minor principal stress; conditions given by the design coordinator. The value was adjusted to 135° in the final version of /SKB 2008/ and the uncertainty is estimated as ±15°. Although this adjustment of 3° changes the outcome of the analyses slightly, it must be emphasized that this has not affected the general conclusions.
The strength parameters and the elastic properties vary with rock type. In Table 4-3 the mean values for uniaxialcompressivestrength(UCS),crackinitiationstress(σci), Young’s Modulus (E) and Poisson’s ratio(ν)estimatedformostofthemajorrocktypesencounteredatLaxemar.Thesevaluesareobtainedfrom Table 2-4 in /SKB 2008/, which also list the minimum, maximum and standard deviation, as well as the reduction factors for oxidized rock varieties. The uncertainties may on a local scale result in lower spalling strengths than indicated in Table 4-3. Considerable variability in the properties of both individual rock types and between different rock types in the area may occur.

24 R-09-10
4.3 Analysis methodsTwo-dimensional stress analyses have been carried out both analytically and numerically using Examine2D /RocScience 2007/, which is a boundary-element program for elastic stress analysis of underground excavations. The analytical portion was carried out on the deposition hole and concerns average stress in accordance with the Kirsch equations. Initially, the spalling potential should be determined by determinis-tic analysis using the Kirsch equations for plane strain, as proposed by /Martin 2005/. If the deterministic factor of safety (FOS), calculated by Equation 4-4, is 1.45 or less, the probability for spalling is judged to be significant and the potential should be evaluated further.
FOS = CIR · UCSmean / (3σH – σh) 4-4
whereCIR=crackinitiationratioUCSmean = mean uniaxial compressive strength.
The spalling potential has been evaluated deterministically for the three most frequent rock types in the Laxemar area: quartz monzodiorite, Ävrö granodiorite and Ävrö quartz monzodiorite. All together they make up 91, 89 and 74% of rock domain RSMA01, RSMD01 and RSMM01, respectively, in Laxemar. Values used in the analysis for principal stresses are given in Table 4-1 and for UCSmean in Table 4-3. /SKB 2008/ gives a value of 0.54 for CIR.
The calculated safety factor for the Ävrö quartz monzodiorite, which has the lowest UCSmean, is 1.64. This is well above the limiting value, indicating that the uncertainty if spalling occurs needs no further evaluation by probabilistic means.
Table 4‑2. Stress magnitudes according to the Maximum Stress Model at the depth of 500m /SKB 2008/.
Principal stress components Most likely value [MPa]
Minimum value [MPa]
Maximum value [MPa]
Major principal stress (σΗ) 30 24 36Minor principal stress (σh) 13 13 16Vertical stress (σv) 13 13 13
Table 4‑3. Strength and elastic properties on tunnel scale for most of the major rock types encountered at Laxemar. From /SKB 2008/.
Rock type UCS [MPa] σci [MPa] E [GPa] ν [-]
Diorite/gabbro (501033) 225 130 80 0.33Quartz monzodiorite (501036) 186 104 76 0.29Ävrö quartz monzodiorite (501046) 167 88 71 0.28Ävrö granodiorite (501056) 198 104 72 0.25
Table 4‑1. Stress magnitudes according to the Most Likely Stress Model at the depth of 500m /SKB 2008/.
Principal stress components Most likely value [MPa]
Minimum value [MPa]
Maximum value MPa]
Major principal stress (σΗ) 22 18 27Minor principal stress (σh) 12 10 14Vertical stress (σv) 13 13 13
R-09-10 25
Numerical two-dimensional stress analyses were carried out on a section of the main tunnel using the Examine2D software to study the effect of a varied cross-section of the tunnel. The analyses aimed to visualize how the stress concentration is influenced by the cross-section and that adjustment of the cross-section can limit the stress concentrations.
In order to obtain a correct picture of the stress situation a three-dimensional analysis is needed for some cross-sections and conditions in the repository. The calculations were carried out using Examine3D, a three-dimensional analysis program for underground structures in rock. This is a boundary-element program designed to perform three-dimensional elastic stress analyses /RocScience 1998/. The following were studied using three-dimensional analysis:
• Crossingsbetweenmainanddepositiontunnels.
• Depositiontunnelswithdepositionholepositions.
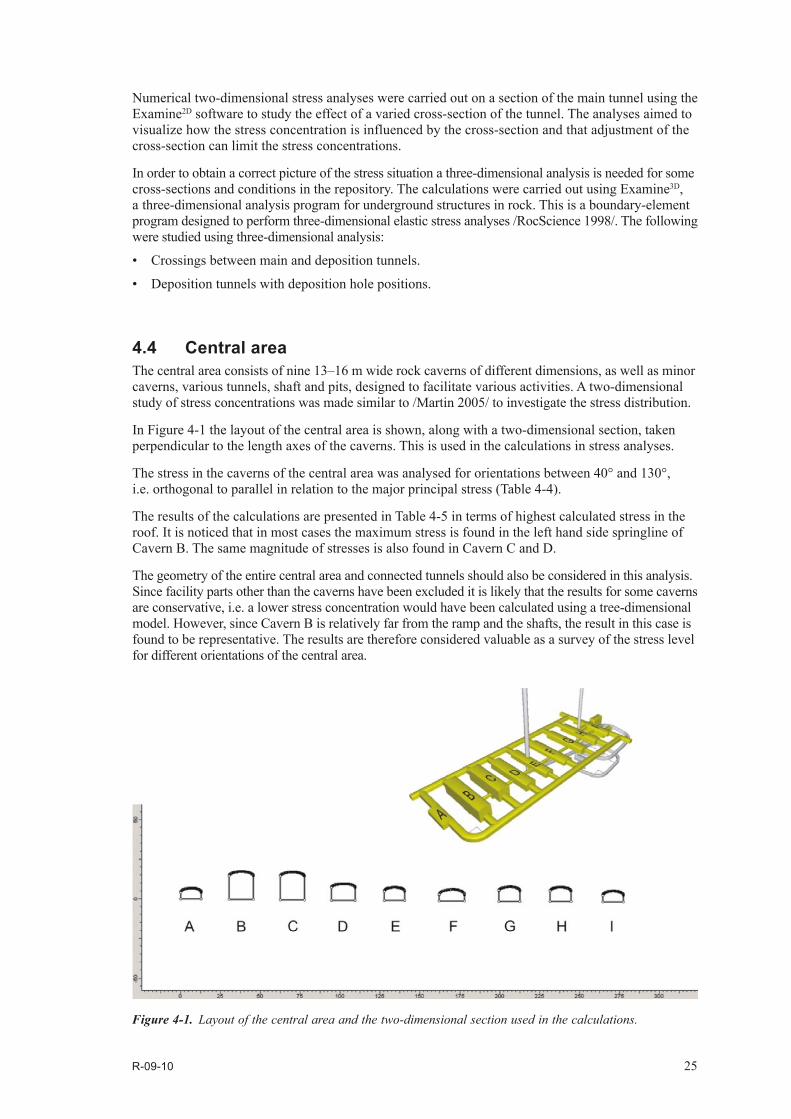
4.4 Central areaThecentralareaconsistsofnine13–16mwiderockcavernsofdifferentdimensions,aswellasminorcaverns, various tunnels, shaft and pits, designed to facilitate various activities. A two-dimensional study of stress concentrations was made similar to /Martin 2005/ to investigate the stress distribution.
In Figure 4-1 the layout of the central area is shown, along with a two-dimensional section, taken perpendicular to the length axes of the caverns. This is used in the calculations in stress analyses.
The stress in the caverns of the central area was analysed for orientations between 40° and 130°, i.e. orthogonal to parallel in relation to the major principal stress (Table 4-4).
The results of the calculations are presented in Table 4-5 in terms of highest calculated stress in the roof. It is noticed that in most cases the maximum stress is found in the left hand side springline of Cavern B. The same magnitude of stresses is also found in Cavern C and D.
The geometry of the entire central area and connected tunnels should also be considered in this analysis. Since facility parts other than the caverns have been excluded it is likely that the results for some caverns are conservative, i.e. a lower stress concentration would have been calculated using a tree-dimensional model. However, since Cavern B is relatively far from the ramp and the shafts, the result in this case is found to be representative. The results are therefore considered valuable as a survey of the stress level for different orientations of the central area.
Figure 4‑1. Layout of the central area and the two-dimensional section used in the calculations.
26 R-09-10
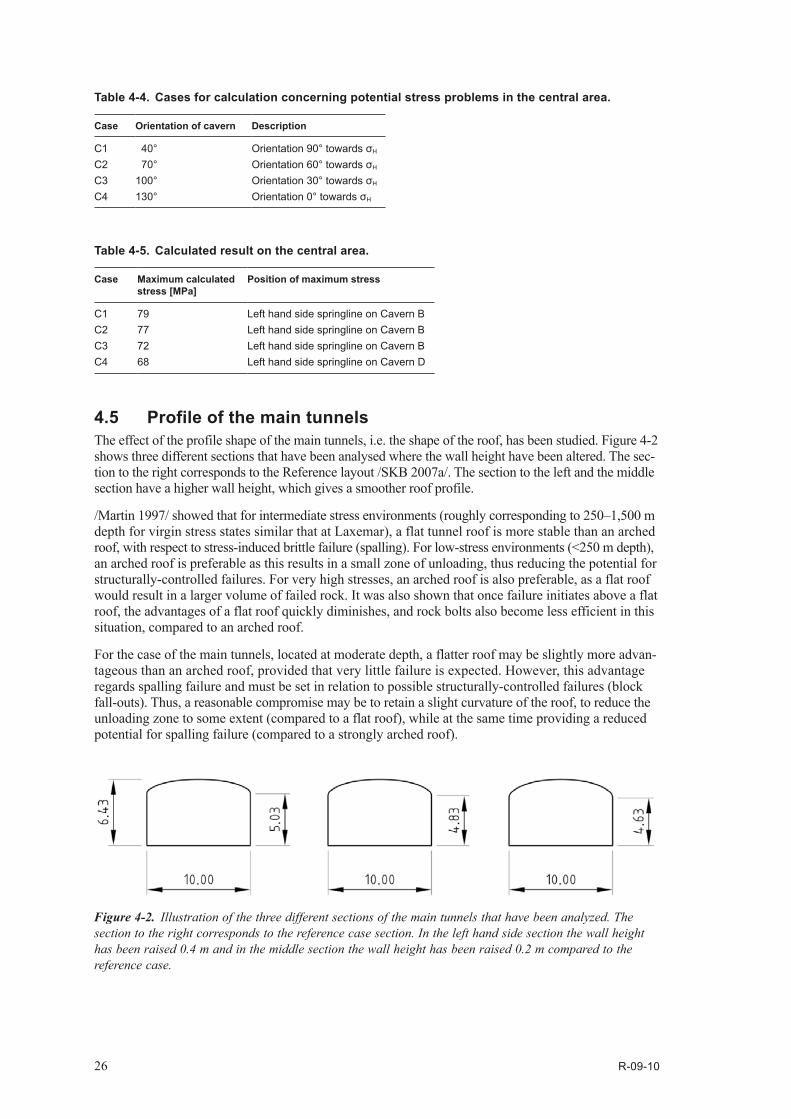
4.5 Profile of the main tunnelsThe effect of the profile shape of the main tunnels, i.e. the shape of the roof, has been studied. Figure 4-2 shows three different sections that have been analysed where the wall height have been altered. The sec-tion to the right corresponds to the Reference layout /SKB 2007a/. The section to the left and the middle section have a higher wall height, which gives a smoother roof profile.
/Martin1997/showedthatforintermediatestressenvironments(roughlycorrespondingto250–1,500mdepth for virgin stress states similar that at Laxemar), a flat tunnel roof is more stable than an arched roof, with respect to stress-induced brittle failure (spalling). For low-stress environments (<250 m depth), an arched roof is preferable as this results in a small zone of unloading, thus reducing the potential for structurally-controlled failures. For very high stresses, an arched roof is also preferable, as a flat roof would result in a larger volume of failed rock. It was also shown that once failure initiates above a flat roof, the advantages of a flat roof quickly diminishes, and rock bolts also become less efficient in this situation, compared to an arched roof.
For the case of the main tunnels, located at moderate depth, a flatter roof may be slightly more advan-tageous than an arched roof, provided that very little failure is expected. However, this advantage regards spalling failure and must be set in relation to possible structurally-controlled failures (block fall-outs). Thus, a reasonable compromise may be to retain a slight curvature of the roof, to reduce the unloading zone to some extent (compared to a flat roof), while at the same time providing a reduced potential for spalling failure (compared to a strongly arched roof).
Table 4‑4. Cases for calculation concerning potential stress problems in the central area.
Case Orientation of cavern Description
C1 40° Orientation 90° towards σH
C2 70° Orientation 60° towards σH
C3 100° Orientation 30° towards σH
C4 130° Orientation 0° towards σH
Table 4‑5. Calculated result on the central area.
Case Maximum calculated stress [MPa]
Position of maximum stress
C1 79 Left hand side springline on Cavern BC2 77 Left hand side springline on Cavern BC3 72 Left hand side springline on Cavern BC4 68 Left hand side springline on Cavern D
Figure 4‑2. Illustration of the three different sections of the main tunnels that have been analyzed. The section to the right corresponds to the reference case section. In the left hand side section the wall height has been raised 0.4 m and in the middle section the wall height has been raised 0.2 m compared to the reference case.
R-09-10 27
Calculations were made to evaluate the relative difference in roof stress. The three profiles were analyzed between 40° and 130°, i.e. orthogonal to parallel in relation to the major principal stress.
The result of the calculations shows that the profile of the roof has an impact on the calculated stresses. The highest stresses in the roof and springline are presented in Table 4-6. It is noticed that the reference case profile gives the lowest stress peaks, hence the stresses are distributed smoothly resulting in lower peak values. All calculations indicate that spalling should not occur in the main tunnels and that the profile according to /SKB 2008/ gives low stress peaks.
4.6 Tunnel crossingsThe stress concentrations in crossings between the main and the deposition tunnels have been analyzed in a three-dimensional model and using the Examine3D software. The geometry is an orthogonal cross-ing, illustrated in Figure 4-3. The model consist of 40×40 m main and deposition tunnels with a layout according to /SKB 2008/. Both orthogonal and skewed crossings have been analyzed and it was found that the results were only marginally affected if the crossing was orthogonal or skewed. Consequently, it was decided to restrict the present analyses to orthogonal crossings.
In the calculations the stress fields have been set to expected values at the depth levels of 500 m.
The crossing has been analysed for four different orientations in relation to the stress field according to Table 4-7 and Figure 4-4. Direction 40° is when the deposition tunnel is orthogonal to the major principalstress(σH). The system is rotated in steps of 30° until the deposition tunnel is aligned with the major principal stress that is in the direction 130°.
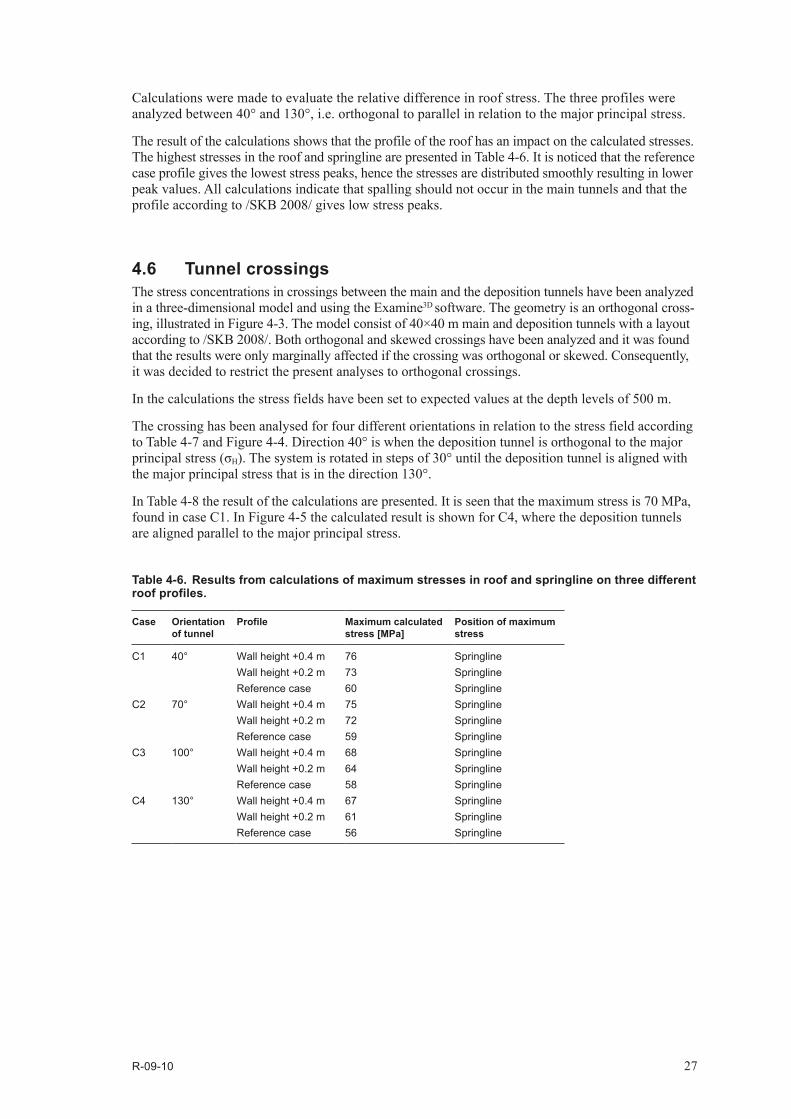
In Table 4-8 the result of the calculations are presented. It is seen that the maximum stress is 70 MPa, found in case C1. In Figure 4-5 the calculated result is shown for C4, where the deposition tunnels are aligned parallel to the major principal stress.
Table 4‑6. Results from calculations of maximum stresses in roof and springline on three different roof profiles.
Case Orientation of tunnel
Profile Maximum calculated stress [MPa]
Position of maximum stress
C1 40° Wall height +0.4 m 76 SpringlineWall height +0.2 m 73 SpringlineReference case 60 Springline
C2 70° Wall height +0.4 m 75 SpringlineWall height +0.2 m 72 SpringlineReference case 59 Springline
C3 100° Wall height +0.4 m 68 SpringlineWall height +0.2 m 64 SpringlineReference case 58 Springline
C4 130° Wall height +0.4 m 67 SpringlineWall height +0.2 m 61 SpringlineReference case 56 Springline

28 R-09-10
Figure 4‑4. Illustration of different cases with orthogonal crossing.
Figure 4‑3. Layout for studying of spalling in tunnels and crossings.
Table 4‑7. Cases for calculation with orthogonal crossing.
Case Direction of deposition tunnel
Description
C1 40° Deposition tunnel 90° towards σH
C2 70° Deposition tunnel 60° towards σH
C3 100° Deposition tunnel 30° towards σH
C4 130° Deposition tunnel 0° towards σH
Table 4‑8. Result for the different cases.
Case Maximum calculated stress [MPa]
Position of maximum stress
C1 70 In the springline in the crossingC2 70 In the springline in the crossingC3 68 In the springline in the crossingC4 66 In the springline in the crossing
R-09-10 29
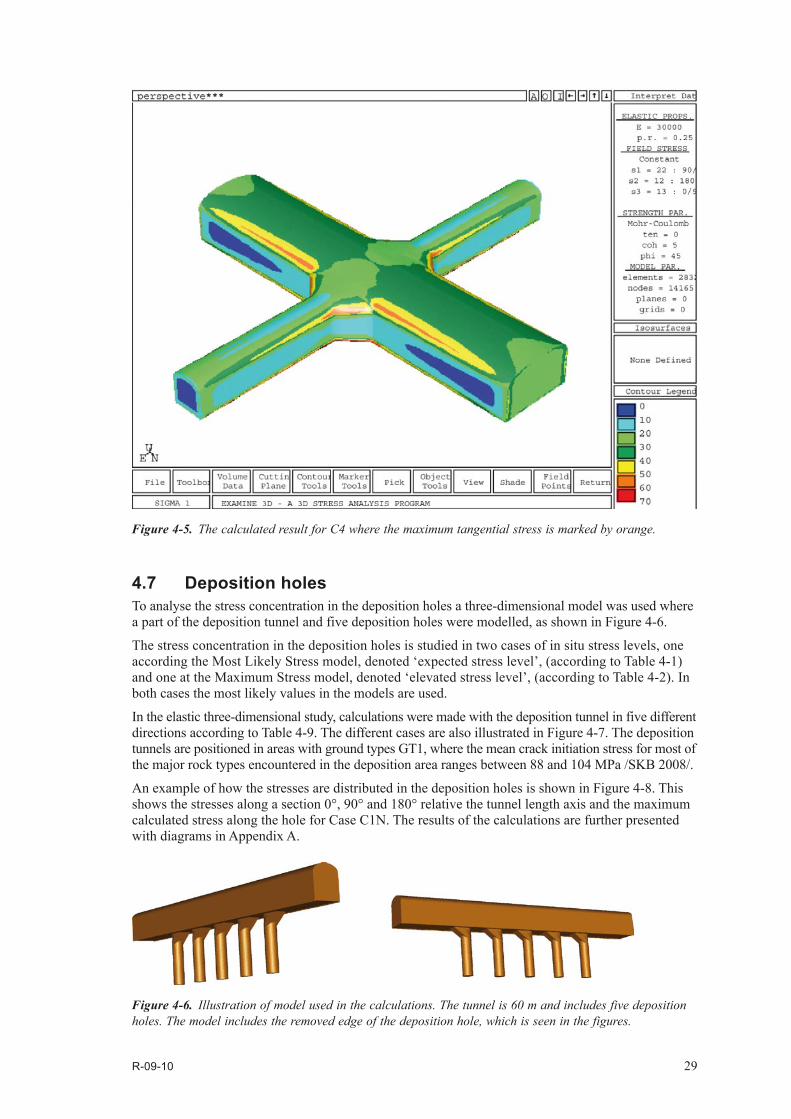
4.7 Deposition holesTo analyse the stress concentration in the deposition holes a three-dimensional model was used where a part of the deposition tunnel and five deposition holes were modelled, as shown in Figure 4-6.
The stress concentration in the deposition holes is studied in two cases of in situ stress levels, one according the Most Likely Stress model, denoted ‘expected stress level’, (according to Table 4-1) and one at the Maximum Stress model, denoted ‘elevated stress level’, (according to Table 4-2). In both cases the most likely values in the models are used.
In the elastic three-dimensional study, calculations were made with the deposition tunnel in five different directions according to Table 4-9. The different cases are also illustrated in Figure 4-7. The deposition tunnels are positioned in areas with ground types GT1, where the mean crack initiation stress for most of the major rock types encountered in the deposition area ranges between 88 and 104 MPa /SKB 2008/.
An example of how the stresses are distributed in the deposition holes is shown in Figure 4-8. This shows the stresses along a section 0°, 90° and 180° relative the tunnel length axis and the maximum calculated stress along the hole for Case C1N. The results of the calculations are further presented with diagrams in Appendix A.
Figure 4‑5. The calculated result for C4 where the maximum tangential stress is marked by orange.
Figure 4‑6. Illustration of model used in the calculations. The tunnel is 60 m and includes five deposition holes. The model includes the removed edge of the deposition hole, which is seen in the figures.

30 R-09-10
Figure 4‑7. Illustration of the different cases for calculation of spalling in deposition holes.
Figure 4‑8. Example of calculated result for Case C1N, i.e. where the deposition tunnel is orthogonal to the maximum principal stress. The figure shows the stress distribution along the deposition hole for a section 0°, 90° and 180° relative the tunnel length axis and also the calculated maximum value. Estimated spalling strength range (88–104 MPa) expected for the major rock types in the Laxemar rock domains is shown in yellow.
Table 4‑9. Cases for calculation for spalling in deposition holes. C1N‑C4N are made at the expected stress level and C1E‑C4E are made at the elevated stress level.
Case Orientation of deposition tunnel Description
C1N / C1E 40° Deposition tunnel 90° towards σH
C2N / C2E 70° Deposition tunnel 60° towards σH
C2bN / C2bE 85° Deposition tunnel 45° towards σH
C3N / C3E 100° Deposition tunnel 30° towards σH
C4N / C4E 130° Deposition tunnel 0° towards σH
R-09-10 31
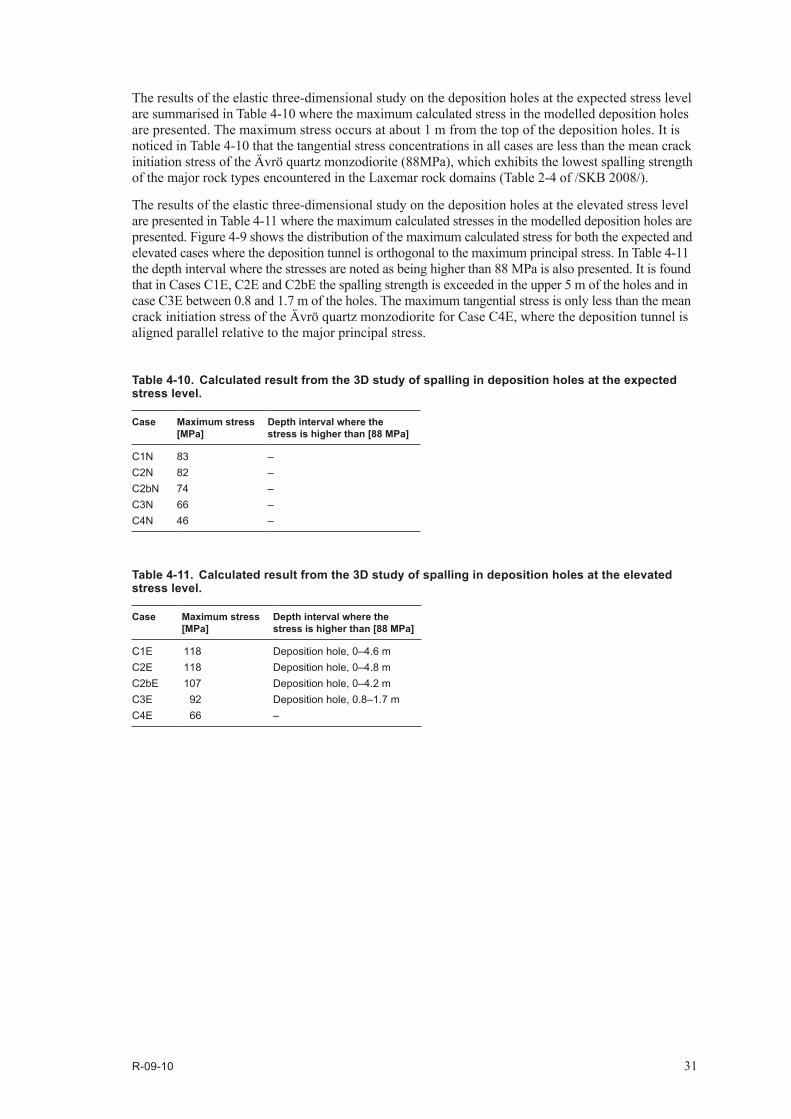
The results of the elastic three-dimensional study on the deposition holes at the expected stress level are summarised in Table 4-10 where the maximum calculated stress in the modelled deposition holes are presented. The maximum stress occurs at about 1 m from the top of the deposition holes. It is noticed in Table 4-10 that the tangential stress concentrations in all cases are less than the mean crack initiation stress of the Ävrö quartz monzodiorite (88MPa), which exhibits the lowest spalling strength of the major rock types encountered in the Laxemar rock domains (Table 2-4 of /SKB 2008/).
The results of the elastic three-dimensional study on the deposition holes at the elevated stress level are presented in Table 4-11 where the maximum calculated stresses in the modelled deposition holes are presented. Figure 4-9 shows the distribution of the maximum calculated stress for both the expected and elevated cases where the deposition tunnel is orthogonal to the maximum principal stress. In Table 4-11 the depth interval where the stresses are noted as being higher than 88 MPa is also presented. It is found that in Cases C1E, C2E and C2bE the spalling strength is exceeded in the upper 5 m of the holes and in case C3E between 0.8 and 1.7 m of the holes. The maximum tangential stress is only less than the mean crack initiation stress of the Ävrö quartz monzodiorite for Case C4E, where the deposition tunnel is aligned parallel relative to the major principal stress.
Table 4‑10. Calculated result from the 3D study of spalling in deposition holes at the expected stress level.
Case Maximum stress [MPa]
Depth interval where the stress is higher than [88 MPa]
C1N 83 –C2N 82 –C2bN 74 –C3N 66 –C4N 46 –
Table 4‑11. Calculated result from the 3D study of spalling in deposition holes at the elevated stress level.
Case Maximum stress [MPa]
Depth interval where the stress is higher than [88 MPa]
C1E 118 Deposition hole, 0–4.6 mC2E 118 Deposition hole, 0–4.8 mC2bE 107 Deposition hole, 0–4.2 mC3E 92 Deposition hole, 0.8–1.7 mC4E 66 –

32 R-09-10
4.8 Conclusions and discussionThe analyses of the spalling potential using both analytical estimates and two- and three-dimensional numerical calculations show a non-critical state and the conclusion is that spalling induced failures will not occur. However, there are uncertainties in the stress magnitude and the spalling strength that may have a considerable impact on this general conclusion.
Considering the deposition area, /SKB 2008/ states that this should be positioned in areas with ground types GT1, where the mean crack initiation stress for most of the major rock types encountered in the deposition area ranges between 88 and 104 MPa. If the orientations of the tunnels align with the orientation of the maximum horizontal stress, the calculations show that spalling will not occur.
The uncertainty in stress magnitude has been considered in the analyses of the spalling potential in the deposition holes using an elevated stress level given in /SKB 2008/. At elevated levels of stress it was found that the spalling strength is exceeded if an unfavourable orientation of the deposition tunnels is chosen, especially within the Ävrö quartz monzodiorite, having a mean crack initiation stress of 88MPa.Inthesecases,spallingisfoundtooccurintheupper4–5mifthedepositiontunnelsdeviate45°ormorefromtheorientationofthemaximumhorizontalstress,and0.8–1.7mifthedepositiontunnels deviate 30° from the orientation of the maximum horizontal stress.
It should be emphasized that there is a considerable variability in the spalling strength of both individual rock types and between different rock types in the area. The Ävrö monzodiorite and quartz monzodi-orite, which are found in considerable amounts in both RSMA01 (26%) and RSMM01 (50%), has the lowest spalling strength with a crack initiation stress that ranges between 50 and 130 MPa according to Table 2-4 of /SKB 2008/. The spalling strength may be further reduced by the presence of oxidation.
Considering this aspect, the recommendation is to orient the tunnels close to the direction of the major horizontal stress in order to also incorporate uncertainties in stress magnitude and orientation as well as the spalling strength of the predominant rock types in the area.
For the Central area and the tunnel crossing the analyses were made using an expected stress state given by /SKB 2008/. The calculated maximum tangential stress was found to be lower than the mean spalling strength (crack initiation stress) of the Ävrö quartz monzodiorite. In case of a higher stress magnitude than the expected, spalling in limited areas might occur. This should be handled using rock support.
Figure 4‑9. Result for Case C1N Max and C1E Max, i.e. the calculated maximum tangential stress at the expected and elevated level where the deposition tunnel is orthogonal to the maximum principal stress. Estimated spalling strength range (88–104 MPa) expected for the major rock types in the Laxemar rock domains is shown in yellow.

R-09-10 33
5 Support types
5.1 IntroductionFor the current design, SKB proposes five different support types for tunnels and one for caverns in /SKB 2008/. A summary is given in Table 5-1. The task is to determine the appropriate support measures on the basis of this, considering details such as bolt type, sealing, and length, as well as shotcrete thickness.
Since all parts of the repository except for the deposition tunnels are recommended to have a minimum reinforcement of shotcrete, and that assigned combinations of ground types and ground behaviour only to a limited extent occur as examples in Table 5-1, the support types given by SKB need to be modi fied. It has also been our ambition to maintain continuity of support types in order to facilitate upgrading based on the observational method in the event that the reinforcement is inadequate. Support types ST1 and ST2 have, therefore, been supplemented with 30 and 50 mm of fibre-reinforced shotcrete, respec tively, in the roof and the uppermost metre of the walls, while the deposition tunnels and caverns in the central area were each assigned a separate support type (see Table 5-2).
The main purpose with the shotcrete is to protect such installations and facilitate maintenance. Since the shotcrete will facilitate the detection of brittle failure, it is also an important part in the applica-tion of the observational method. Therefore, it is assessed that a thickness of 30 mm would be fully adequate. This is a minimum thickness, since thinner shotcrete may increase the risk of dehydration and hence loosening.
Since none of the walls according to appendix 1 of /SKB 2007a/ have fixed installations (except for drainage), there are no arguments for shotcrete on the walls. The motive for the uppermost metre of shotcrete on the walls is entirely due to practical problems to yield the sharp transition between roof and walls, as given in appendix 1 of /SKB 2007a/. However, walls should be thoroughly reinforced with selective bolting.
The most crucial aspects for the quantitative details of the proposed support types have been to facilitate maintenance and protect installations, as well as the application of the observational method. The Q-system has then been used to verify the sufficiency of the suggested reinforcement. Since the Q-system does not consider the abovementioned aspects, the proposed support efforts are generally an over-reinforcement in respect to direct block falls. The good safety margins in the proposed reinforcement, strongly suggest that it is amply sufficient also when alternative analyse methods to the Q-system are used for evaluation.
Table 5‑1. Summary of support types (ST) proposed by the /SKB 2008/.
Support type Description Example of ground types
Example of ground behaviour
ST1 Spot bolting GT1 GB1ST2 Systematic bolting GT1, GT2 GB1, GB2AST3 Systematic bolting + wire mesh GT1, GT2 GB1ST4 Systematic bolting + fibre-reinforced shotcrete GT1, GT2, GT3 GB1, GB2BST5 Concrete lining GT4 GB3BSTC Systematic bolting + fibre-reinforced shotcrete All GB1, GB2
34 R-09-10
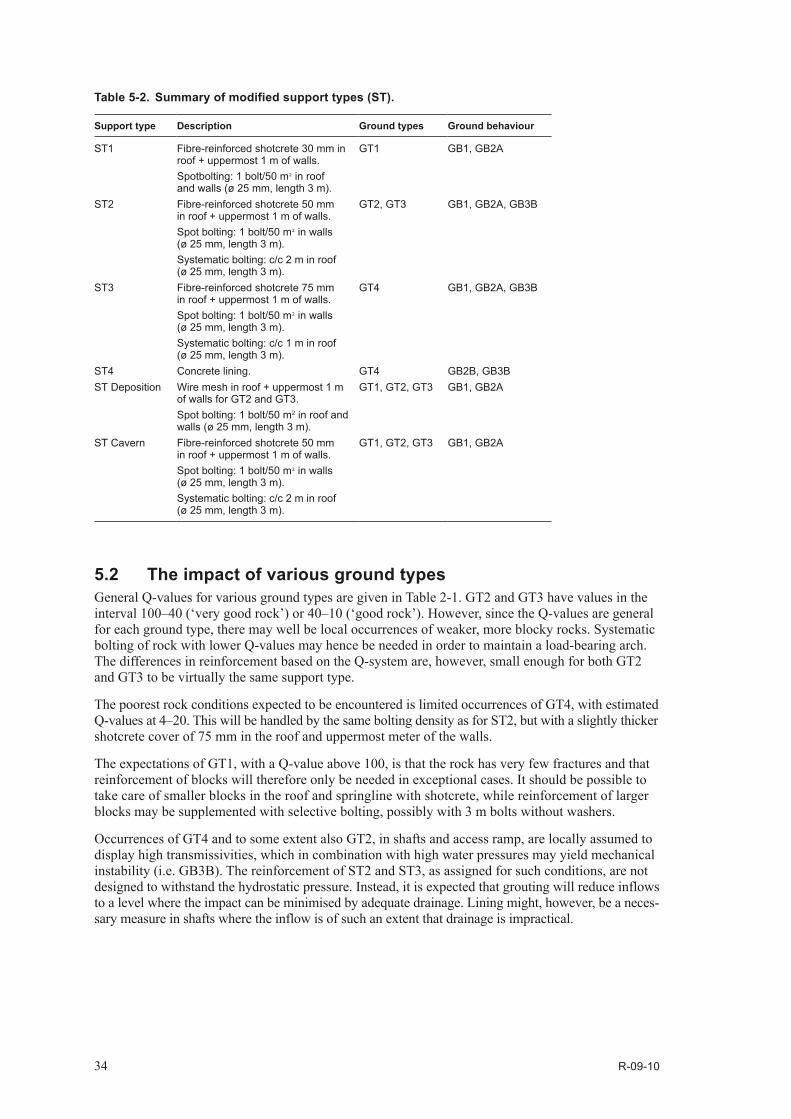
5.2 The impact of various ground typesGeneral Q-values for various ground types are given in Table 2-1. GT2 and GT3 have values in the interval100–40(‘verygoodrock’)or40–10(‘goodrock’).However,sincetheQ-valuesaregeneralfor each ground type, there may well be local occurrences of weaker, more blocky rocks. Systematic bolting of rock with lower Q-values may hence be needed in order to maintain a load-bearing arch. The differences in reinforcement based on the Q-system are, however, small enough for both GT2 and GT3 to be virtually the same support type.
The poorest rock conditions expected to be encountered is limited occurrences of GT4, with estimated Q-valuesat4–20.ThiswillbehandledbythesameboltingdensityasforST2,butwithaslightlythickershotcrete cover of 75 mm in the roof and uppermost meter of the walls.
The expectations of GT1, with a Q-value above 100, is that the rock has very few fractures and that reinforcement of blocks will therefore only be needed in exceptional cases. It should be possible to take care of smaller blocks in the roof and springline with shotcrete, while reinforcement of larger blocks may be supplemented with selective bolting, possibly with 3 m bolts without washers.
Occurrences of GT4 and to some extent also GT2, in shafts and access ramp, are locally assumed to display high transmissivities, which in combination with high water pressures may yield mechanical instability (i.e. GB3B). The reinforcement of ST2 and ST3, as assigned for such conditions, are not designed to withstand the hydrostatic pressure. Instead, it is expected that grouting will reduce inflows to a level where the impact can be minimised by adequate drainage. Lining might, however, be a neces-sary measure in shafts where the inflow is of such an extent that drainage is impractical.
Table 5‑2. Summary of modified support types (ST).
Support type Description Ground types Ground behaviour
ST1 Fibre-reinforced shotcrete 30 mm in roof + uppermost 1 m of walls.Spotbolting: 1 bolt/50 m2 in roof and walls (ø 25 mm, length 3 m).
GT1 GB1, GB2A
ST2 Fibre-reinforced shotcrete 50 mm in roof + uppermost 1 m of walls.Spot bolting: 1 bolt/50 m2 in walls (ø 25 mm, length 3 m).Systematic bolting: c/c 2 m in roof (ø 25 mm, length 3 m).
GT2, GT3 GB1, GB2A, GB3B
ST3 Fibre-reinforced shotcrete 75 mm in roof + uppermost 1 m of walls.Spot bolting: 1 bolt/50 m2 in walls (ø 25 mm, length 3 m).Systematic bolting: c/c 1 m in roof (ø 25 mm, length 3 m).
GT4 GB1, GB2A, GB3B
ST4 Concrete lining. GT4 GB2B, GB3BST Deposition Wire mesh in roof + uppermost 1 m
of walls for GT2 and GT3.Spot bolting: 1 bolt/50 m2 in roof and walls (ø 25 mm, length 3 m).
GT1, GT2, GT3 GB1, GB2A
ST Cavern Fibre-reinforced shotcrete 50 mm in roof + uppermost 1 m of walls.Spot bolting: 1 bolt/50 m2 in walls (ø 25 mm, length 3 m).Systematic bolting: c/c 2 m in roof (ø 25 mm, length 3 m).
GT1, GT2, GT3 GB1, GB2A

R-09-10 35
In summary, this means that the parts of the installation classified as GT1, even under the most unfavour-able stress conditions, may be treated with ST1. For other combinations of rock classes and ground behaviour(i.e.GT2–GB1,GT2–GB3B,GT3–GB1),itissuggestedthatST2willbeasuitablesupporttype.AnexceptionisthelimitedoccurrencesofGT4–GB3BorunfavourablerockconditionsinGT2combined with large spans, where instead ST3 should be used. In the case that very poor rock condi-tions are encountered, for example flowing ground (GB3A), there is also a ST4, which is made up of concrete lining. Table 5-3 gives a summary of the assigned support types for the sub-surface facilities of the repository.
Table 5‑3. Support type assigned for various facility parts of the repository.
Facility part ST1 [m] ST2 [m] ST3 [m] STC [m] STD [m]
RampTunnel (5.5 m wide)1 2,785 1,763 1 – –Tunnel (6.0 m wide) – 123 – – –Tunnel (6.5 m wide) 284 412 11 – –Tunnel (7.0 m wide) 104 94 32 – –Passing places and niche (8.0 m wide) 148 63 – – –Niche (10.0 m wide) 17 7 – – –
VentilationShaft (ø 1.5 m) 176 76 – – –Shaft (ø 2.5 m) 343 147 – – –Shaft (ø 3.5 m) 343 147 – – –Shaft (ø 4.5 m) 17 8 – – –Tunnel (4.0 m wide) 565 242 – – –Tunnel (8.0 m wide) 22 10 – – –
Central areaSkip shaft (ø 5.0 m) 391 167 – – –Elevator shaft (ø 6.0 m) 374 160 – – –Silo (ø 9.5 m) 15 7 – – –Tunnel (3.0 m wide) 94 40 – – –Tunnel (4.0 m wide) 373 160 – – –Tunnel (5.0 m wide) 33 14 – – –Tunnel (7.0 m wide) 653 280 – – –Halls (13.0 m wide) n = 5 – – – 290 –Halls (15.0 m wide) n = 3 – – – 186 –Crushing hall (10.0 m wide) – – – 22 –Vehicle hall (16.0 m wide) – – – 65 –Service hall (12 m wide) – – – 20 –
Deposition areaVentilation shafts SA01 and SA02 (ø 3.0 m) 757 270 2 – –Main tunnel (10.0 m wide) 5,141 2,727 15 – –Transport tunnel (7.0 m wide) 1,054 5,754 45 – –Deposition tunnel (4.2 m wide) – – – – 89,408
1 Includes also transitions to wider tunnel sections and one nisch.

36 R-09-10
5.3 SpallingSpalling-induced failure is treated with reinforced shotcrete, wire mesh or bolt reinforcement, using large washers /Stille et al. 2005, Kaiser et al. 1996, Hoek and Brown 1980/. References are mainly practically based. Theoretical descriptions do exist e.g. /Edelbro 2008/, but they are sparse. Practical experience from mines on great depths shows that a small confinement is sufficient to prevent pro-gressive spalling. In /Andersson 2007/, it is concluded from the Apse tunnel that small confinement from a rubber bladder was enough to stop spalling. /Edelbro and Sandström 2009/ suggest that the stability of an excavation also is improved by scaling the damaged rock to a more stable shape.
Based on the stress analyses it is assessed that if spalling will occur, it is local and hence no reason to reinforce for a progressive fracture process. Tough and well-applied shotcrete reinforcement is thought to be suitable from a rock mechanical viewpoint. This is, however, included in all proposed support types in Table 5-2, with the exception of deposition tunnels where shotcrete is not permitted.
5.4 Shafts, caverns and deposition tunnelsDeposition tunnels have been given one type of reinforcement, ST Deposition. One reason is that the use of shotcrete is not permitted. The significantly shorter lifetime compared with other parts of the installation is another reason. The orientation of the tunnels also suggests that any need for reinforce-ment to prevent spalling may be disregarded. It is, therefore, considered that selective bolting is fully adequate reinforcement for the combinations of ground types and ground behaviour assigned to the deposition tunnels. Occurrences of poorer rock quality as in GT2 and GT3 will be treated with wire mesh. Also the occurrences of GT4 in the deposition tunnels will be handled by wire mesh and selec-tive bolting, but it is recommended that the reinforcement quantities are doubled (i.e. more dense spot bolting and overlapping wire mesh).
Although the orientation not directly promotes gravitational block falls, it is recommended to treat all shafts with shotcrete, due to both the height of possible rock falls and maintenance difficulties, especially in the skip and elevator shaft. Also, because space is restricted, a shorter bolt length than in other parts of the repository may be required.
R-09-10 37
6 System behaviour
System behaviour refers to the interaction between reinforcement and the rock mass. The intention is to show that the system is stable, i.e. that the proposed reinforcement will work in relation to ground behaviour.
The analysis is carried out for (a) the most probable system behaviour, and (b) the most unfavourable system behaviour.
6.1 Analysis methodsIn accordance with /SKB 2007a/, analyses should be applied in rock reinforcement design work to verify the system behaviour, i.e. the interaction between the ground behaviour of the construction measures.
Three methods are applied for analyses:
• Experiencefromcomparableexcavations.
• TheQ-system.
• Analyticalcalculationsofload-bearingcapacityforrockreinforcement.
6.1.1 Experience from underground works at OskarshamnThe system behaviour is analysed using experiences from different projects in the Oskarhamn area, as summarised in cf. /Carlsson and Christiansson 2007/. In the upper parts of the repository (i.e. the upper-mostpartsoftheshaftsandaccessramp)downtoabout40–50mdepth,thecomparisonisgenerallybased on reinforcement experience from three major construction projects in the area: the Oskarshamn Nuclear Power Station, including an underground storage for medium and low grade radioactive waste, the Central Interim Storage Facility for Spent Nuclear Fuel (CLAB) and the Äspö HRL. In the deeper parts, the construction experiences in the area are limited to the Äspö HRL, where the tunnel continues down to 450 m depth. Reinforcement solutions at repository depth are further verified by individual analytical calculations.
Based on the collective experience from these projects /Carlsson and Christiansson 2007/ gives a general description of the rock mass in terms of four rock classes together with the reinforcement used. A summary of these rock classes is given in Table 6-1.
Table 6‑1. Summary of rock classes and installed reinforcement in the Oskarshamn area /Carlsson and Christiansson 2007/.
Rock class Description Reinforcement
1 Sparsely fractured rock, may contain all dominant fracture sets, but seldom as significant clusters.
Bolting: none, spot bolting or systematic bolting (1 bolt/4 m2). Shotcrete: 0–50 mm un-reinforced.
2 Clusters of steeply dipping fractures, locally forming smaller deformation zones; the majority strike WNW–NW or NE–SW. The width is typically very limited (1–2 m). Significant high inflows have been experienced at depth.
Bolting: 1/4 m2 – 1/2 m2. Shotcrete: 50 mm un-reinforced to 80 mm fibre-reinforced.
3 Northeast trending, steeply dipping ductile deformation zones, with brittle reactivation. Hydrothermal alteration is locally significant. Sub-parallel splays can be expected. Excluding splays, the width is typically < 5 m. Fractures are generally open and local variation in conductivity can be expected.
Bolting: 1/4 m2 – 1/2 m2. Shotcrete: 50 mm un-reinforced to 100 mm fibre-reinforced.
4 Major deformation zones (e.g. zone NE-1 in Äspö HRL). Heterogeneous, with considerable variations in clay content and transmissivity.
Bolting: 1/4 m2 – pre-bolting. Shotcrete: 50–200 mm fibre-reinforced.

38 R-09-10
6.1.2 The Q‑systemThe Q-system /Barton et al. 1974/ and its recommendations for rock reinforcement have be used for the analyses. The starting points are the Q-value given in /SKB 2008/ and the geometries given in Appendix 1 of /SKB 2007a/. It should, however, be emphasized that the Q-system has been used primarily to verify the suggested reinforcement, which rather aims at facilitating the maintenance and being part of the observational method than to prevent direct block falls.
The Q-system is well known and accepted as the classification system for Scandinavian conditions. The objections and criticisms of the Q-system chiefly concern the application of support types or other deviations in the applicability. The criticism of the support types is that they give an over-reinforced and expensive system.
The Q-system is empirical and based on a number of tunnel projects where reinforcement was set in relation to various rock parameters. The result was a diagram with Q-value on the x-axis and tunnel dimension on the y-axis, which enabled the proposed reinforcement to be read off. A major updating of the Q-system was presented by /Grimstad and Barton 1993/ and several supplements have since been published. The 1993 version is the one used in the present work (Figure 6-1).
6.1.3 Analytical calculations on load bearing capacity on reinforcementSimple analytical calculation is used here to estimate the reinforcement effect that can be required or attained from various approaches. Analyses are performed in accordance with Banverket’s Design Instructions /Lundman 2006/ and the reinforcement of individual blocks. The analyses do not account for the stress situation found at this depth. More advanced analyses using numerical models could be made to include where blocks are locked by high stresses or pushed out by the stresses. The analyses are considered relevant to give an indicative picture of the block sizes supported by the proposed reinforcement.
The analyses are carried out inversely, in other words the total load bearing properties of a bolt or shotcrete are converted to a block size. This approach provides an estimate of the block sizes handled by the bolt reinforcement.
Figure 6‑1. Support types of the Q-system /Grimstad and Barton 1993/.

R-09-10 39
ShotcreteThe following expression /Fredriksson 1994/ is used to evaluate the capability of the shotcrete to carry the block with respect to adhesion failure:
6-1
whereW = weight of the block [N]σadk = characteristic adhesion strength [Pa]δ=shotcretecarryingthicknesslayer[m]Om = circumference of load-bearing surface between shotcrete and rock [m]γn, η, γm = partial coefficients.
The following values are used for the estimate:
• Theweightoftheblockiscalculatedontheassumptionofablockwithashapeofapyramid.Thesideshaveaparticularangle(α),seeFigure6-2.
• Thecharacteristicadhesionstrengthisrecommendedtobe0.5MPacorrespondingtocommonpractice, considered to be a conservative value.
• Theshotcretecarryingthicknessisassumedtobehalfofthethicknessoftheshotcretelayerbasedon the values given in /Holmgren 1979/.
• Partialcoefficientsproductissetto1.5(SafetyClass3),whichisconsideredreasonableduetothetype of facility and a life of 100 years.
Figure 6-3 shows the results of the calculation graphically for three different thicknesses of shotcrete: 30, 50 and 70 mm. Assuming a side angle of the block between 45° and 60°, 30 mm of well-applied shotcretecansupportablockvolumeofaround1.2–1.5m3.
mn
madk OWγηγ
δσ⋅⋅⋅⋅≤
Figure 6‑2. Illustration of a block in shape of a pyramid. Modified from /Lundman 2006/.

40 R-09-10
Rock boltsThe load bearing capacity of the bolt (Bmax) is calculated using Equation 6-2 where it is assumed that the bolt is fully grouted but not tensioned.
6-2
whereσ=yieldlimit[Pa]Α=area[m2]Fs = factor of safety.
Based on a diameter of 25 mm, a yield limit of 500 MPa and a safety factor of 1.5, the load bearing capacity is estimated to be 160 kN.
The volume of the block that can be carried by the bolt is calculated using Equation 6-3.
6-3
where
γ=unitweightoftheblock[N/m3]
Using the unit weight 27 kN/m3 it is found that a block with the volume of 5.9 m3 is carried by the bolt.
It must also be verified that the bolt length is long enough to penetrate and provide enough reinforce-ment for the block. If it is assumed that the block is shaped like a pyramid according to Figure 6-4, the block volume is described by Equation 6-4.
6-4
In Figure 6-4 the results of calculations are presented for 2, 3 and 4 m long bolts and assuming at least 1 m support length in the rock. It is noted that the bolt length is the limiting factor for blocks with a steep side. For 3 m long bolts in particular, blocks with a side inclination of around 45° are fully supported but with steeper sides the block volume becomes the limitation.
Figure 6‑3. Calculated values of block size carried by the shotcrete.
0
2
4
6
8
10
12
14
0 20 40 60 80
Block side inclination [º]
Thickness 30 mm
Thickness 50 mm
Thickness 70 mm
Max
imum
vol
ume
of b
lock
[m3 ]
sFAB /max ⋅= σ
γmaxBV =
3tan3 α⋅= SV
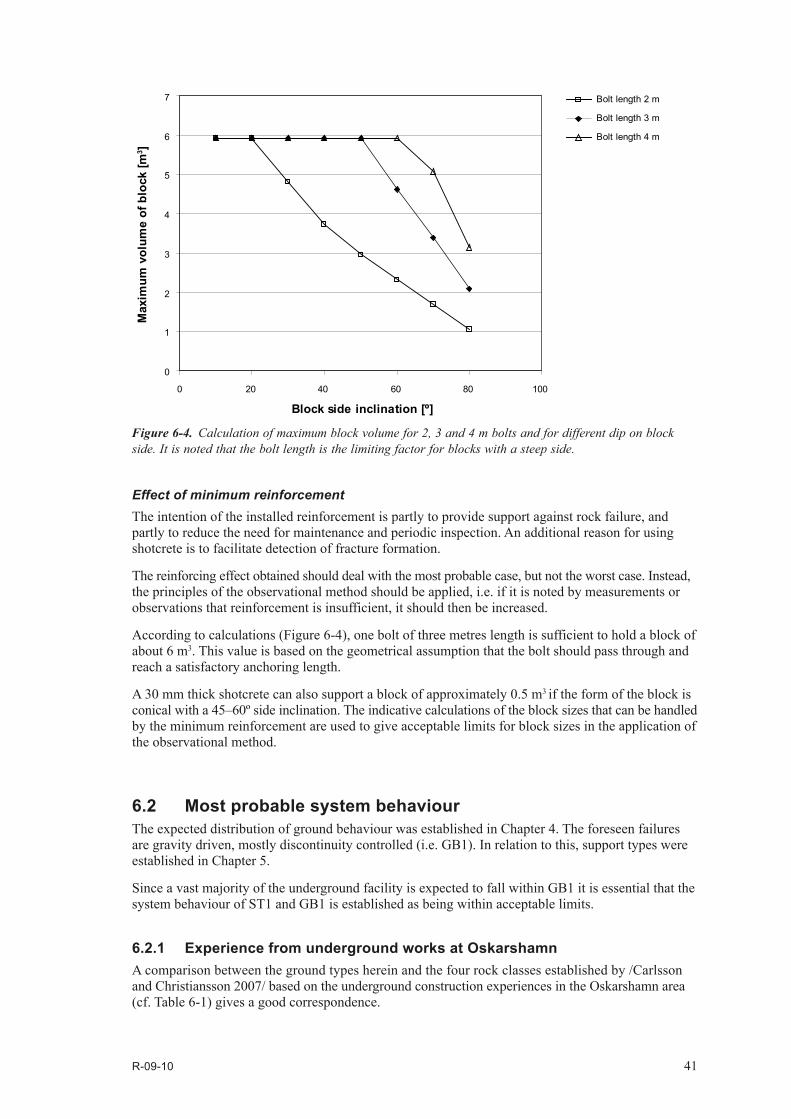
R-09-10 41
Effect of minimum reinforcementThe intention of the installed reinforcement is partly to provide support against rock failure, and partly to reduce the need for maintenance and periodic inspection. An additional reason for using shotcrete is to facilitate detection of fracture formation.
The reinforcing effect obtained should deal with the most probable case, but not the worst case. Instead, the principles of the observational method should be applied, i.e. if it is noted by measurements or observations that reinforcement is insufficient, it should then be increased.
According to calculations (Figure 6-4), one bolt of three metres length is sufficient to hold a block of about 6 m3. This value is based on the geometrical assumption that the bolt should pass through and reach a satisfactory anchoring length.
A 30 mm thick shotcrete can also support a block of approximately 0.5 m3 if the form of the block is conicalwitha45–60ºsideinclination.Theindicativecalculationsoftheblocksizesthatcanbehandledby the minimum reinforcement are used to give acceptable limits for block sizes in the application of the observational method.
6.2 Most probable system behaviourThe expected distribution of ground behaviour was established in Chapter 4. The foreseen failures are gravity driven, mostly discontinuity controlled (i.e. GB1). In relation to this, support types were established in Chapter 5.
Since a vast majority of the underground facility is expected to fall within GB1 it is essential that the system behaviour of ST1 and GB1 is established as being within acceptable limits.
6.2.1 Experience from underground works at OskarshamnA comparison between the ground types herein and the four rock classes established by /Carlsson and Christiansson 2007/ based on the underground construction experiences in the Oskarshamn area (cf. Table 6-1) gives a good correspondence.
Figure 6‑4. Calculation of maximum block volume for 2, 3 and 4 m bolts and for different dip on block side. It is noted that the bolt length is the limiting factor for blocks with a steep side.
0
1
2
3
4
5
6
7
0 20 40 60 80 100
Block side inclination [º]
Bolt length 2 m
Bolt length 3 m
Bolt length 4 mM
axim
um v
olum
e of
blo
ck [m
3 ]
42 R-09-10
Rock class 1 is described as a competent, sparsely fractured rock with high Q-values. It occurs frequently in the deeper parts of Äspö HRL. The applied support measures vary from no support to reinforcement that includes systematic bolting and 50 mm of shotcrete. This indicates that in Rock class 1, engineering on-site expertise have applied support measures that exceeds the proposed rock support for GT1 (i.e. ST1). However, it is reported that the lower level of support, i.e. no support measures are frequent at the lower levels of Äspö HRL indicating that the most relevant area for comparison is well handled by ST1.
InRockclass2,arelativelyhomogeneoussupportofsystematicboltingand50–100mmshotcretehas been applied. This support is comparable to ST2, which covers both GT2 and GT3, even though thicker shotcrete sometimes have been used. The bolt density in ST2 (i.e. c/c 2 m) is almost identical withthatofRockclass2with1bolt/2–4m2. Mechanical instability can occur if the drift penetrates hydraulically open fractures.
Rock class 3 corresponds to the properties of the NE trending deformation zones that occur in the area. The support measures in this class are identical to that of Rock class 2, and consist of system-aticboltingand50–100mmshotcrete.Suchzonesgenerallydisplayagroundtypedistributionthatrequires ST2. Since the strength of Rock class 3 is similar to that of ST2, it is considered to be a relevant level of support.
Rock Class 4 relates to major deformation zones, such as NE1 at Äspö. The associated problem is however not to structurally control these but limiting the inflow of water. The used support measures accordingto/CarlssonandChristiansson2007/weresystematicboltingand50–200mmofshotcrete.ST3 correspond well to this support strength and is therefore considered adequate. However, a ST4, consisting of concrete lining, can be applied if the extent of such a deformation is large or if the core of the deformation zone consists of extremely poor rock conditions.
6.2.2 Analytical calculationsThe construction experiences from Äspö HRL suggest that wedge stability should not be a significant issue at the repository depth in Laxemar. This practical experience is, according to /Martin 2005/, consid-ered more relevant at this design stage than the results from wedge analysis based on the discrete fracture network (DFN) model for Laxemar. A comparison between the results in Section 6.1.3 and the maximum weight of potential wedges calculated by /Martin 2005/, using the Forsmark DFN model, support the conclusion that the majority of all blocks are carried by the general support ST1.
6.3 Most unfavourable system behaviourAn assessment of the most unfavourable system behaviour, compared to the probable behaviour as described above, shows that the condition that may change is the occurrence of spalling, i.e. that the proportion of ground behaviour GB3B may increase in the access ramp and shafts. A change in the pro-portion of different ground types is not included in the analysis of the more unfavourable conditions.
No spalling has been noticed during the construction of the Äspö HRL /Carlsson and Christiansson 2007/. Note that the main rock type at the Äspö HRL has a higher crack initiation stress (125 MPa) than the majority of the rocks encountered at Laxemar. However, unsuitable geometries at intersecting tunnels at depth show locally unfavourable stress concentrations /Andersson and Söderhäll 2001/. Analyses herein shows that limited spalling may occur in for example tunnel crossings in some of the weaker rock types (low CI values) at higher stress magnitudes than expected. Based on the findings that a small confinement is sufficient to prevent progressive spalling cf. /Andersson 2007/, an increased amount of spalling is handled by the shotcrete reinforcement that is already included in the minimum reinforcement. This may suggest that the shotcrete area may need to be increased from covering only the roof to including parts of the walls.

R-09-10 43
The minimum reinforcement (ST 1) that should be applied in the whole sub-surface repository, irre-spective of system behaviour, apart from in the deposition tunnels, is shotcrete and selective bolting in the roof. This reinforcement is sufficient in comparison to Q-system to handle the conditions that may occur in the most unfavourable system behaviour. In the proposed support types, bolt lengths greater than 3 m have also been assumed, which is longer than given by the reinforcement recommendations of the Q-system, except in the largest caverns. This indicates that the proposed support types already cover the most unfavourable system behaviour.
With the resistance offered by shotcrete, spalling should be limited, according to results in /Andersson 2007, Kaiser et al. 1996/. The tunnel behind the face will not suffer full stress since some stresses are transferred in the rock in front of the face. Assuming that an undisturbed stress field is reached approximately maximum 2 blast lengths behind the front (interpreted from /Chang 1994/), no sup-porting shotcrete should be necessary close to the face to prevent spalling. Since the shotcrete is part of the minimum reinforcement, it is inferred that there will be no changes in support type, whether spalling occurs or not.
Possible problems related to the spalling is, therefore, expected to be restricted to facility parts with-out the minimum reinforcement. The analyses showed low stresses in the deposition tunnels when these are oriented sub-parallel to the major horizontal stress and spalling is therefore not foreseen at all. If spalling occurs in weaker rock volumes, wire mesh is used as reinforcement. This will not prevent spalling as shotcrete is expected to do, but will allow a safe working environment.
Regarding the possibly increased proportion of GB3B in the ramp and ventilation shafts in the prox-imity to deformation zone NE005A under the most unfavourable conditions, it is difficult to evaluate quantitatively. The occurrence of GB3B is assumed to be restricted to GT2. A comparison with the Q-system reinforcement proposals for GT2 shows that no reinforcement apart from selective bolting in larger caverns is needed. The recommended use of ST2, which includes both systematic bolting and fibre-reinforced shotcrete, is thus on the high side. However, it is not designed to withstand the high transmissivities in combination with high water pressures that may be expected locally in GB3B. This is generally handled by grouting and, where necessary, by drainage of the shotcrete. If additional reinforcement is still required, ST4 may be used, consisting of concrete lining.

R-09-10 45
7 Reinforcement quantities
7.1 GeneralThis section covers calculated amounts of reinforcement and the conditions on which they are based. For a description of support types and the activities included in them, reference is made to the previ-ous chapter.
7.2 Compilation of amountsThe various parts of the repository include several different objects such as tunnels, shafts, caverns, etc.ThesearesummarisedandreportedinthetablespreviouslygiveninChapters3–5.
When calculating the amount of reinforcement, a number of assumptions have been made regarding the parts of the object that need to be reinforced. Several of these are given and discussed in Chapter 5. In accordance with the Reference Design, a number of parts of the installation have an access road or a floor of concrete 0.43 m above the theoretical bottom contour. It is therefore recommended that the bottom 0.5 m of the walls is not reinforced in tunnels and caverns. This also applies to deposition tunnels, even though in accordance with /SKB 2007a/ they do not have a raised access road.
The use of wire mesh is recommended in the roof and uppermost 1 m of the walls of deposition tun-nels that occur in GT2 and GT3. For GT4 both the quantities of rock bolts and wire mesh are doubled. Similar to Layout D1 /Brantberger et al. 2006/, it is assumed that 0.5 rock bolt/m2 and a bolt length of 0.5 m are suitable for fixing the mesh.
In Table 7-1 the amount of reinforcement per facility part are presented. The compilations given in Table 7-2 report the total amount of reinforcement per functional area.
In Tables 7-3, 7-4 and 7-5 the amount of subsidiary material in shotcrete, bolt cement, bolts and wire mesh are presented. This material meets the requirements supplied by SKB for low pH and other functional requirements.
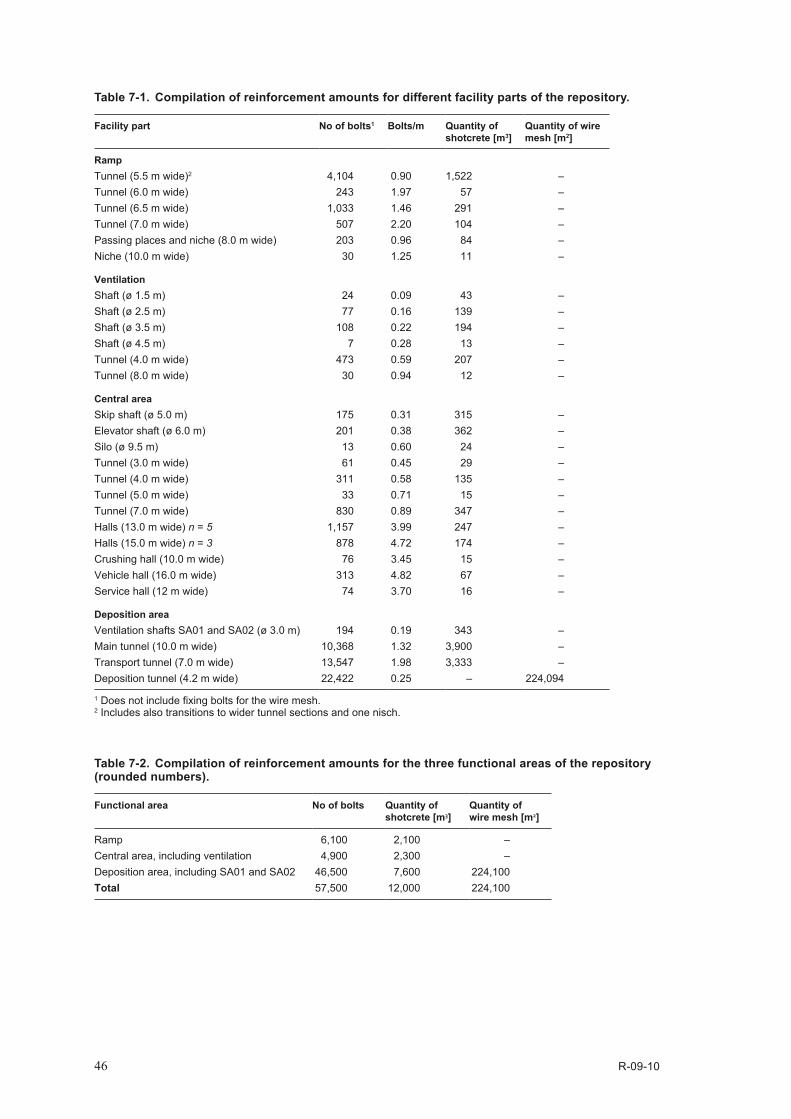
46 R-09-10
Table 7‑1. Compilation of reinforcement amounts for different facility parts of the repository.
Facility part No of bolts1 Bolts/m Quantity of shotcrete [m3]
Quantity of wire mesh [m2]
RampTunnel (5.5 m wide)2 4,104 0.90 1,522 –Tunnel (6.0 m wide) 243 1.97 57 –Tunnel (6.5 m wide) 1,033 1.46 291 –Tunnel (7.0 m wide) 507 2.20 104 –Passing places and niche (8.0 m wide) 203 0.96 84 –Niche (10.0 m wide) 30 1.25 11 –
VentilationShaft (ø 1.5 m) 24 0.09 43 –Shaft (ø 2.5 m) 77 0.16 139 –Shaft (ø 3.5 m) 108 0.22 194 –Shaft (ø 4.5 m) 7 0.28 13 –Tunnel (4.0 m wide) 473 0.59 207 –Tunnel (8.0 m wide) 30 0.94 12 –
Central areaSkip shaft (ø 5.0 m) 175 0.31 315 –Elevator shaft (ø 6.0 m) 201 0.38 362 –Silo (ø 9.5 m) 13 0.60 24 –Tunnel (3.0 m wide) 61 0.45 29 –Tunnel (4.0 m wide) 311 0.58 135 –Tunnel (5.0 m wide) 33 0.71 15 –Tunnel (7.0 m wide) 830 0.89 347 –Halls (13.0 m wide) n = 5 1,157 3.99 247 –Halls (15.0 m wide) n = 3 878 4.72 174 –Crushing hall (10.0 m wide) 76 3.45 15 –Vehicle hall (16.0 m wide) 313 4.82 67 –Service hall (12 m wide) 74 3.70 16 –
Deposition areaVentilation shafts SA01 and SA02 (ø 3.0 m) 194 0.19 343 –Main tunnel (10.0 m wide) 10,368 1.32 3,900 –Transport tunnel (7.0 m wide) 13,547 1.98 3,333 –Deposition tunnel (4.2 m wide) 22,422 0.25 – 224,094
1 Does not include fixing bolts for the wire mesh. 2 Includes also transitions to wider tunnel sections and one nisch.
Table 7‑2. Compilation of reinforcement amounts for the three functional areas of the repository (rounded numbers).
Functional area No of bolts Quantity of shotcrete [m3]
Quantity of wire mesh [m2]
Ramp 6,100 2,100 –Central area, including ventilation 4,900 2,300 –Deposition area, including SA01 and SA02 46,500 7,600 224,100Total 57,500 12,000 224,100
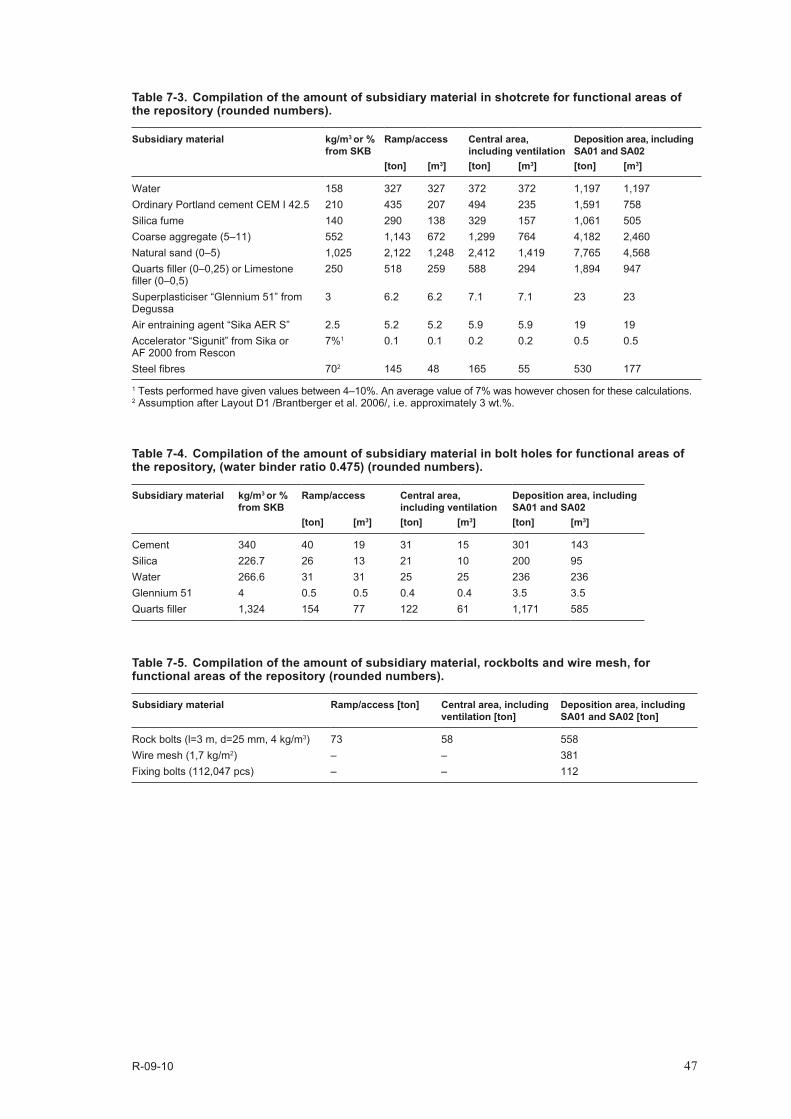
R-09-10 47
Table 7‑3. Compilation of the amount of subsidiary material in shotcrete for functional areas of the repository (rounded numbers).
Subsidiary material kg/m3 or % from SKB
Ramp/access Central area, including ventilation
Deposition area, including SA01 and SA02
[ton] [m3] [ton] [m3] [ton] [m3]
Water 158 327 327 372 372 1,197 1,197Ordinary Portland cement CEM I 42.5 210 435 207 494 235 1,591 758Silica fume 140 290 138 329 157 1,061 505Coarse aggregate (5–11) 552 1,143 672 1,299 764 4,182 2,460Natural sand (0–5) 1,025 2,122 1,248 2,412 1,419 7,765 4,568Quarts filler (0–0,25) or Limestone filler (0–0,5)
250 518 259 588 294 1,894 947
Superplasticiser “Glennium 51” from Degussa
3 6.2 6.2 7.1 7.1 23 23
Air entraining agent “Sika AER S” 2.5 5.2 5.2 5.9 5.9 19 19Accelerator “Sigunit” from Sika or AF 2000 from Rescon
7%1 0.1 0.1 0.2 0.2 0.5 0.5
Steel fibres 702 145 48 165 55 530 177
1 Tests performed have given values between 4–10%. An average value of 7% was however chosen for these calculations. 2 Assumption after Layout D1 /Brantberger et al. 2006/, i.e. approximately 3 wt.%.
Table 7‑4. Compilation of the amount of subsidiary material in bolt holes for functional areas of the repository, (water binder ratio 0.475) (rounded numbers).
Subsidiary material kg/m3 or % from SKB
Ramp/access Central area, including ventilation
Deposition area, including SA01 and SA02
[ton] [m3] [ton] [m3] [ton] [m3]
Cement 340 40 19 31 15 301 143Silica 226.7 26 13 21 10 200 95Water 266.6 31 31 25 25 236 236Glennium 51 4 0.5 0.5 0.4 0.4 3.5 3.5Quarts filler 1,324 154 77 122 61 1,171 585
Table 7‑5. Compilation of the amount of subsidiary material, rockbolts and wire mesh, for functional areas of the repository (rounded numbers).
Subsidiary material Ramp/access [ton] Central area, including ventilation [ton]
Deposition area, including SA01 and SA02 [ton]
Rock bolts (l=3 m, d=25 mm, 4 kg/m3) 73 58 558Wire mesh (1,7 kg/m2) – – 381Fixing bolts (112,047 pcs) – – 112

R-09-10 49
8 Constructability and uncertainties
In this report, ‘constructability’ means the possibility of producing the structure of the repository while meeting requirements. The term ‘uncertainty’ refers to the factors that might affect the produc-tion structurally or contractually.
8.1 UncertaintiesThere are several uncertainties connected with the analysis of reinforcement requirements. The following can be listed from an overall perspective:
• TheGroundTypespresentedin/SKB2008/indicategoodtoexcellentrockfromaconstructionpoint of view. The uncertainties are found in potential frequent jointing aligned with the maximum horizontal stress, and hence the elongation of certain facility parts, such as the deposition tunnels. This is not considered in particular in the design of the reinforcement.
• Thestressanalysesarebasedontheexpectedstressesandaworstcasescenariogivenin/SKB2008/. Based on these analyses it has been found that spalling should not be a critical issue in any of the repository functional areas. The uncertainty span in both magnitude and orientation of the stress field however gives a wide range of possible ground behaviour in relation to the layout and it could be found that spalling is more frequent than anticipated in the analyses. In addition, there is a considerable variability in the spalling strength of both individual rock types and between dif-ferent rock types in the area. The Ävrö quartz monzodiorite, which has the lowest spalling strength and is found in considerable amounts in the area, has a crack initiation stress that ranges between 50 and 110 MPa according to /SKB 2008/. Also the rock type distribution in the area exhibits a certain degree of uncertainty.
• Theanalysesonthesystembehaviourhavenotincludedthestressesintheblockanalyses.Thereis also a limited understanding on how the reinforcement may change with time.
In summary, an assessment of constructability and observation parameters based on the following uncertainties has been carried out:
• Morewedginginstabilityorblockyrockthanexpected.
• Morespallingencounteredthanexpected.
• Functionofthereinforcementovertime.
8.2 Effect on constructabilityAs identified at the beginning of this chapter, constructability is a measure of whether or not it is pos-sible to construct the repository. The assessments of constructability given below are made on the basis of the overall uncertainties identified.
Wedge instability and blocky rock are potentially increasing the necessary amount of reinforcement. In the present design of the reinforcement there is a load bearing capacity for wedges and blocks. In case of frequent jointing parallel or sub-parallel with the orientation of deposition tunnels, as might be expected in FSM_EW007 and through experiences from Äspö HRL /SKB 2008/, the assigned reinforcement needs to be increased. The effect on constructability is however judged small to insig-nificant since thicker shotcrete and more bolting may be used. However, the effect on production time, costs and material should be recognised.
The calculated maximum tangential stress for the Central area and tunnel crossings was found to be lower than the spalling strength of the weakest of the more frequently occurring rock types at Laxemar (i.e. the Ävrö quartz monzodiorite). However, limited spalling might occur in case of a higher stress magnitude than the expected or in rocks with locally lowered spalling strength. This is handled by shotcrete reinforcement, which is part of all proposed support types in Table 5-2.
50 R-09-10
During the lifetime of the facility the load bearing capacity of the installed reinforcement may decrease. There is limited experience of the function of shotcrete and bolts, especially after using low-pH grouts, which needs special attention. Common practise is however periodical inspections to verify the func-tion, which will reveal any kind of degradation.
From the rock reinforcement perspective, it is assessed that there is no risk that a structurally unstable repository could be produced. The collective experience from rock-working is sufficient to state this definitively.
8.3 Observation parameters and acceptable limitsFor brittle failures, including wedge instability and spalling, the critical parameters are stress and block size /Stille and Holmberg 2007/. This means that an observation programme should include checks on the stresses and block sizes on which the design is based and that this must be verified in connection with tunnelling. If the conditions deviate, a more suitable reinforcement solution should be chosen.
Geological mapping is proposed when determining the critical parameters for block size to control whether conditions encountered lie within acceptable limits. Here, acceptable limits mean that rein forcement will work for the worst case rock classes encountered (i.e., in the worst case of failure behaviour).
Rock stresses are adequately monitored by in situ measurements or convergency measurement. Checks on stress conditions are also thought to be possible with two indirect methods of checking whether or not spalling occurs. One method is acoustic measurement of the number of microseismic events in connection with tunnelling in order to see whether they diminish in a way similar to that given by /Andersson 2007/. This is not to our knowledge tested in tunnelling activities but could be a possibility. The other method is to drive a pilot tunnel with an ‘unfavourable’ cross-section, i.e. with a cross-section that favours spalling failures. If spalling failures do not appear, or the reinforcement solutions work, acceptable limits have been verified. If the reinforcement solutions do not work, a stronger reinforcement should be tested and verified. Another important part in the application of the observational method is the proposed minimum reinforcement that consists of 30 mm shotcrete, which will facilitate the detection of brittle failure.

R-09-10 51
9 Comments and conclusions
This report has presented a survey of expected rock conditions and suitable reinforcement methods for these in terms of requirements for the final repository. The work has been carried out in accordance with the instructions in /SKB 2007a/ with the support of other literature and input data documents.
In all, the conclusion from the study is that the current site adaptation is suitable from a rock reinforce-ment perspective. There cannot be foreseen any difficulties concerning rock reinforcement; potential block falls or minor spalling are considered well within the experience of underground construction work. Rocks stresses are concluded to be a non-critical issue based on both modelling and comparable experience from Äspö HRL. However, there are uncertainties in the stress magnitude and orientation as well as the spalling strength of the predominant rock types in the area, which may result in spalling locally.
At elevated levels of stress it was found that the spalling strength is exceeded if an unfavourable orientation of the deposition tunnels is chosen, especially within the Ävrö quartz monzodiorite, which has the lowest spalling strength of the main rock types encountered at Laxemar. In these cases, spalling isfoundtooccurintheupper4–5mofthedepositionholes.Aligningthedepositiontunnelsparalleltothe major horizontal stress would hence minimise the risk of spalling in the deposition tunnels and the deposition holes.
The rock engineering in general is found to be within the experience of common rock engineering work. There are no reports from nearby facilities that structural problems have been a major issue. There are no indications based on the prevailing description in /SKB 2008/ that any other situation should occur in the planned repository. Aligning the openings in the northeast trend however gives potential situations of instability in water conductive fractures at all depth.
The calculated amount of bolts in the repository is approximately half of the estimate quantity during design step D1 /Janson et al. 2006/. The required quantities of shotcrete and wire mesh are, however, more or less the same. The lower bolt quantity is generally considered an effect of the established good rock conditions and the use of the observational method as design concept. The latter permits insecure conditions to be retrospectively reinforced on the basis of observations. This means that the amount of reinforcement at this design stage may be based on expected amounts without an actual safety margin.
A general over-reinforcement relative to the estimated stability has however been proposed for the whole roof and the shafts, with the intention of protecting installations, ensuring safe working conditions and minimising the need for periodic maintenance. This minimum reinforcement has been proposed to be 30 mm of shotcrete, which is not intended to have any direct reinforcing effect for block falls. Minimum reinforcement also has the advantage during inspections in that fracture formation can be noted.

R-09-10 53
10 References
Andersson C J, 2007. Rock Mass Response to Coupled Mechanical Thermal Loading Äspö Pillar Stability Experiment, Sweden. Doctoral Thesis. Div of Soil and Rock Mechanics, Royal Institute of Technology, Stockholm, Sweden. ISSN 1650-9501.
Andersson C, Söderhäll J, 2001. Rock mechanical conditions at the Äspö HRL. A study of the correlation between geology, tunnel maintenance and tunnel shape. SKB R-01-53, Svensk Kärnbränslehantering AB.
Barton N, Lien R, Lunde J, 1974. Engineering Classification of Rock Masses for the Design of TunnelSupport.RockMechanics6,186–236.
Brantberger M, Zetterqvist A, Arnbjerg-Nielsen T, Olsson T, Outters N, Syrjänen P, 2006. Final repository for spent nuclear fuel. Underground design Forsmark Layout D1. SKB R-06-34, Svensk Kärnbränslehantering AB.
Carlsson A, Christiansson R, 2007. Construction experiences from underground works at Oskarshamn. SKB R-07-66, Svensk Kärnbränslehantering AB.
Chang Y, 1994. TunnelSupportwithshotcreteinweakrock–arockmechanicsstudy.Doctoralthesis, Div of Soil and Rock Mechanics, Royal Institute of Technology, Stockholm.
Edelbro C, 2008. Strength, fallouts and numerical modelling of hard rock masses. Doctoral thesis, Division of Mining and Geotechnical Engineering, Luleå University of Technology, Luleå.
Edelbro C, Sandström D, 2009. Interpretation of failure and fallouts based on numerical modelling of an underground mine slope. Sinorock 2009, ISRM International Symposium on Rock Mechanics, Hongkong.
Fredriksson A, 1994. Bergmekanik. Dimensionering av sprutbetong. Södra Länken, PM 1994-02-15.
Grimstad E, Barton N, 1993. Updating the Q-system for NMT. Proc to the Int Symp on Sprayed Concrete, Oslo.
Hoek E, Brown E T, 1980. Underground excavations in rock. Chapman & Hall, ISBN 0419160302.
Holmgren J, 1979. Punch loaded shotcrete linings on hard rock. Doctoral thesis, Rapp nr 121:6n, FortF/F dnr 2492F, Stockholm.
Janson T, Magnusson J, Bergvall M, Olsson R, Cuisiat F, Skurtveit E, Grimstad E, 2006. Final repository for spent nuclear fuel. Underground design Laxemar Layout D1. SKB R-06-36, Svensk Kärnbränslehantering AB.
Kaiser P K, McCreath D R, Tannant D D, 1996. Rockburst research handbook. Volume 2. Rockburst reinforcement.PreparedforsponsorsoftheCanadianRockburstResearchprogram1990–1995,GRC,Laurentian University, Sudbury, Canada.
Leander M, Lundqvist A, Eriksson M, Nyborg M, Petersson J, 2009. Underground design Laxemar, Layout D2. Layout and construction plan. SKB R-09-08, Svensk Kärnbränslehantering AB.
Lundman P, 2006. Projekteringsanvisningar–Dimensioneringavdetbärandehuvudsystemetförbergtunnlar. Report BB 06-04, Banverket.
Martin CD, 1997. Seventeenth Canadian Geotechnical Colloquium: The effect of cohesion loss and stresspathonbrittlerockstrength.CanadianGeotechnicalJournal34,698–725.
Martin D, 2005. Preliminary assessment of potential underground stability (wedge and spalling) at Forsmark, Simpevarp and Laxemar sites. SKB R-05-71, Svensk Kärnbränslehantering AB.
Palmstrom A, Stille H, 2007. Ground behaviour and rock engineering tools for underground excavations.TunnellingandUndergroundSpaceTechnology22,363–376.
RocScience, 1998. Examine3D version 4.0. Manual. RocScience Inc.
RocScience, 2007. Examine2D version 7.0. Manual. RocScience Inc.

54 R-09-10
SKB, 2006. PSAR Allmän del Kapitel 3 Krav och Konstruktionsförutsättningar. Svensk Kärnbränslehantering AB.
SKB, 2007a. Final Repository Facility. Underground Design Permises /D2. SKB R-07-33, Svensk Kärnbränslehantering AB.
SKB, 2007b. Miljöprogram för kärnbränsleprojektet. Svensk Kärnbränslehantering AB.
SKB, 2007c. Mall för motivering av layout och teknisk lösning. Svensk Kärnbränslehantering AB.
SKB, 2008. Laxemar Site Engineering Report. Guidelines for Underground Design Step D2. SKB R-08-88, Svensk Kärnbränslehantering AB.
Stille H, Eriksson M, Nord G, 2005. Kompendium i Bergmekanik. Dept of Soil and Rock Mechanics, KTH, Stockholm.
Stille H, Holmberg M, 2007. Observationsmetodens grunder och dess tillämpning på design av konstruktioner i berg. SveBeFo 80, Stockholm 2007. ISSN 1104-1773.
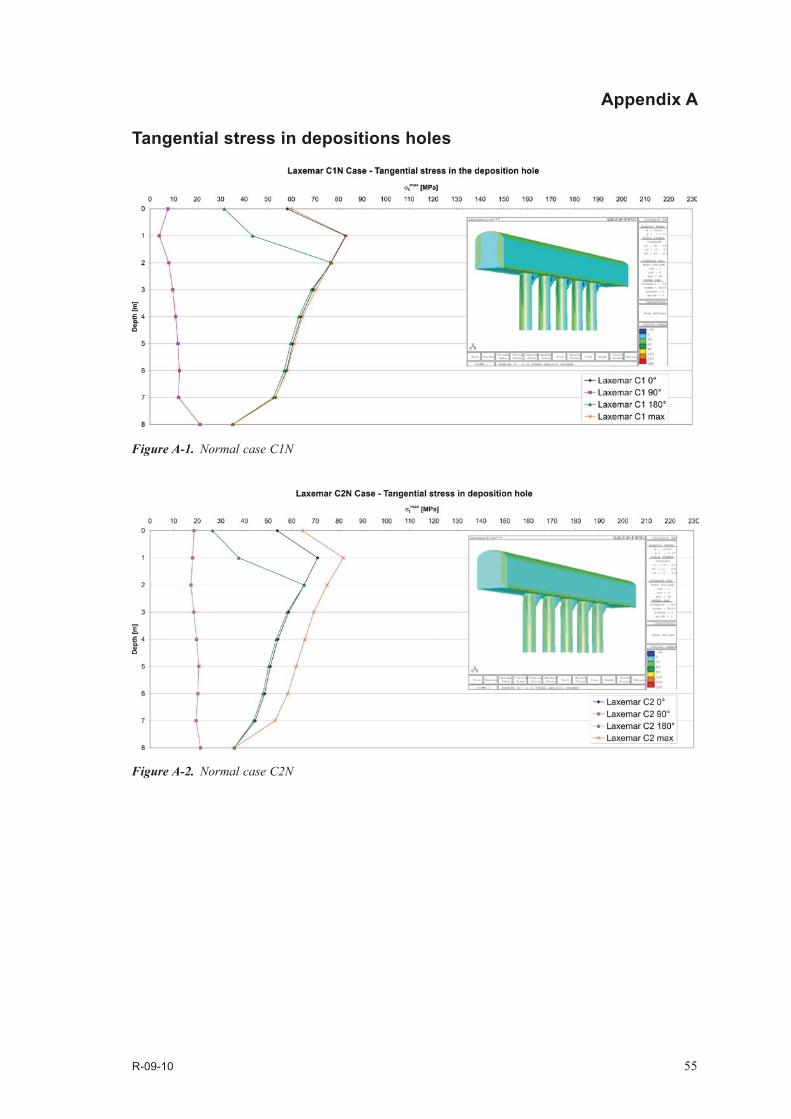
R-09-10 55
Appendix A
Tangential stress in depositions holes
Figure A‑1. Normal case C1N
Figure A‑2. Normal case C2N
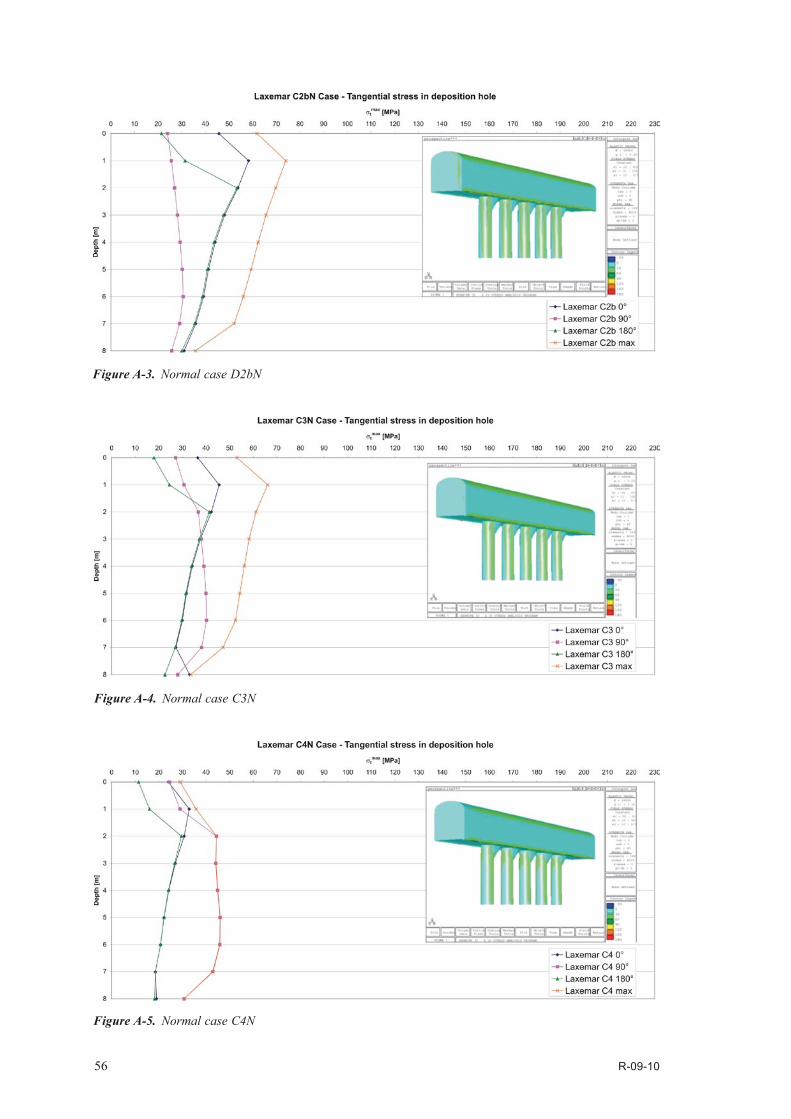
56 R-09-10
Figure A‑4. Normal case C3N
Figure A‑5. Normal case C4N
Figure A‑3. Normal case D2bN

R-09-10 57
Figure A‑6. Elevated stress C1E
Figure A‑7. Elevated stress C2E
Figure A‑8. Elevated stress C2bE

58 R-09-10
Figure A‑9. Elevated stress C3E
Figure A‑10. Elevated stress C4E