
UAB Barcelona · 2016-09-01 · 1 AMERICAN EXPRESS COMPANY | ANNUAL REPORT 2015 TO OUR SHAREHOLDERS...
196
ANNUAL REPORT AMERICAN EXPRESS COMPANY 2015
Transcript of UAB Barcelona · 2016-09-01 · 1 AMERICAN EXPRESS COMPANY | ANNUAL REPORT 2015 TO OUR SHAREHOLDERS...

A N N U A L R E P O R T
AMERICAN EXPRESS COMPANY
2015

1 AMERICAN EXPRESS COMPANY | ANNUAL REPORT 2015
TO OURSHAREHOLDERS
Our company has a long track record of success. That’s not to say the path has always been easy. We’ve often faced challenges, yet each time we’ve adapted and emerged stronger. Today, as our industry undergoes fundamental change, we’re taking steps to accelerate revenue growth and adjust our cost structure. We’re doing so with both a realistic view of our challenges and confidence in our many strengths. I think we have a strong foundation and abundant opportunities to create a very successful future.
However, I’d also be among the first to tell you that we need to raise our performance coming out of 2015. All in all, it was a tough year. Our earnings were not what we, or you, are used to seeing from American Express. Our stock trailed the broader market. And, on a personal note, we suffered the tragic loss of our dear friend and president, Ed Gilligan, who passed away in May.
We made progress on many fronts in 2015, including strong loan growth, industry- leading credit quality, higher transaction volumes, and encouraging results from investments to expand our Card Member and merchant bases. However, we also had several factors working against us, such as worsening cobrand economics and the stronger U.S. dollar, which suppressed earnings and revenue.
For the year, we earned $5.2 billion in net income, down 12 percent from 2014. Revenues decreased by 4 percent to $32.8 billion. Expenses were down 1 percent overall as a result of strong operating expense controls. At the same time, we continued to invest heavily in initiatives designed to fuel our future growth.
A number of factors made year-over-year comparisons somewhat complex. But a look at our underlying business shows continued growth. Adjusted revenues rose 4 percent, excluding foreign exchange, a 2014 gain on the sale of our investment in Concur Technologies and revenues from business travel, which now operates as a joint venture.1
Spending on American Express cards rose 6 percent, adjusted for foreign exchange translations.2 This came despite lower volumes in Canada, where our relationship with Costco ended, as well as a slowdown in Costco volumes in the U.S. in anticipa-tion of the end of our contract in mid-2016.

AMERICAN EXPRESS COMPANY | ANNUAL REPORT 2015 2
Ultimately, though, revenues did not pick up as we had expected during 2015. Our changing view of both the environment and our own performance caused us to issue a more cautious outlook for 2016 and 2017.
As I did in my recent conversation with investors during our fourth-quarter earnings conference call, I’d like to spend the bulk of this letter addressing three key questions:
• Why has our view of 2016 and 2017 evolved?
• What are we doing about it?
• Why are we confident in our ability to grow over the moderate to long term?
To answer the first question, we need to look at the operating environment.
While the macroeconomic headwinds that we’ve been discussing for some time now are not new trends, they’ve lasted longer than we previously expected. The stronger U.S. dollar has had a large impact on our business, reducing earnings per share by about 3 to 4 percentage points in 2015. The price of oil, and its down-stream impact on airfares and gasoline prices, created a drag on charge volume. And the slow-growing U.S. economy has made businesses of all sizes more cautious in their spending. These are cyclical challenges that will eventually turn.
We also face longer-term changes that are reshaping the payments industry. They include:
• A reset in cobrand economics — Over time, these relationships have become more expensive as contracts have come up for renewal and competition for them has increased.
• Pressure on merchant fees — This is coming from several fronts: regulation in key international markets, intensifying competition, and a lowering of our average discount rate as we expand card acceptance among smaller merchants.
• Heightened competition for customers — As banks have been shifting invest-ments to their card businesses, competition for our customers has increased in every segment: consumer, small business, middle market and large corporations.
The Operating Environment

3 AMERICAN EXPRESS COMPANY | ANNUAL REPORT 2015
Beyond these factors, we also continue to await the outcome of our appeal in the Department of Justice lawsuit. The DOJ wants to ban provisions in our merchant contracts that protect American Express from discrimination against our card products. There was an encouraging development in December when an appeals court ordered a temporary stay of an earlier lower court judgment against American Express. We continue to believe that the lower court’s ruling would provide no benefit to consumers and, instead, would harm competition.
This is a long list of challenges, longer than we’ve seen in many years. We recognize them. We’ve been addressing them with a strong sense of urgency. And we’re making progress on many fronts.
Over the past 12 to 18 months:
• We took decisive action in the cobrand space, accelerating contract talks with partners. We focused on those relationships where we can earn attractive returns and provide strong customer value, which led us to deals with Delta, Starwood, Cathay Pacific, British Air and Charles Schwab. We did not, however, renew our agreement with Costco because we were unable to reach terms that would have made economic sense for our company and our shareholders. This certainly has a significant short-term impact, but we continue to believe it was in our best long-term interests.
• We contained operating expenses and reorganized many areas of our business. Now we’re set to take cost reduction to the next level through the billion-dollar improvement program we announced in January 2016.
• We ramped up spending on Card Member acquisition and brought in 7.7 million new cards in the U.S. last year. Our investments here are paying off, and we’re now working to turn those new accounts into additional volumes.
• We stepped up investments in our international business with strong results. Adjusted billed business rose by 12 percent last year.2
• We expanded our merchant network, adding more than 1.2 million new merchants globally in 2015. With our OptBlue program, we’re continuing our efforts to move toward parity coverage with the other card networks in the U.S.
Our Response

AMERICAN EXPRESS COMPANY | ANNUAL REPORT 2015 4
• We grew our lending business faster than the market, while maintaining our industry-best credit performance. Adjusted loans rose by 7 percent worldwide and 10 percent in the U.S. in 2015.3 We’ll continue to target new lending prospects and deepen relationships with current customers.
• We expanded our digital capabilities and partnerships to better serve our customers. Actions here included the launch of Amex Express Checkout and integrations with Airbnb, Android Pay, ApplePay, Samsung Pay and Uber.
• We streamlined our management structure, creating integrated consumer, commercial and merchant teams to help accelerate our growth.
• And, taking advantage of our financial strength, we returned more than $5 billion to our shareholders last year through dividends and share repurchases.
We accomplished a great deal, but, as I said earlier, we have more work to do. We’re heightening our efforts with a focus on three priorities:
• Reduce our expense base and optimize our investments;
• Accelerate revenue growth; and
• Continue to use our capital strength to create value for shareholders.
Let me start with expenses and give you a little more context.
In 2013, we set a goal to limit opex growth to 3 percent or less. We have beaten that goal every year since then. To accomplish this, we took a number of restructuring actions that provided benefits in 2015 and will continue to aid us in 2016.
The plan we announced in January is a major step up from there. We aim to reduce our overall cost base, which includes total operating expenses plus marketing and promotion costs, by $1 billion by the end of 2017.
This will involve structural changes to streamline the organization and reengineer key processes that now exist in multiple parts of the company to increase efficiency. I’ve assigned our Vice Chairman Steve Squeri to lead the effort. He’ll work with me and other senior leaders in every area of our business to ensure we move quickly and meet our goals.
Reduce Costs

5 AMERICAN EXPRESS COMPANY | ANNUAL REPORT 2015
Steve is one of our most accomplished leaders. He’s been at the forefront of con-taining our operating expenses over the past several years and has an outstanding track record of making the organizations he’s led more efficient and more effective.
As this new effort advances, we’ll act to reduce costs in a thoughtful way — without compromising our ability to serve our customers, meet our compliance obligations and grow the business.
Our focus on costs also involves spending our investment dollars more efficiently. We’ll continue to use big data analytics to improve the way we evaluate, prioritize and execute our investment opportunities. We’ll pursue growth opportunities in a more coordinated way through the new management structure we put in place last October. And we’ll stop certain initiatives where we’re not seeing results — or a clear path to results — just as we did by refocusing Enterprise Growth late last year.
Some of the alternative products and platforms that Enterprise Growth developed in recent years showed promise while, frankly, others didn’t. As a result, we decided to focus more narrowly on our strongest prepaid products, Serve and Bluebird, and we recorded a charge in the fourth quarter. Taking this step will enable us to redirect investments to other parts of our business that can generate better returns more quickly.
While managing costs is important, revenue growth is key to our long-term success. I’m confident we can improve upon our recent performance. Here are some of the reasons why: a wide range of attractive opportunities across our diverse customer base; the progress we’ve made in attracting new Card Members and merchants; our ability to broaden relationships with existing customers; the leverage we can gain from operating and investing more efficiently; and the power and potential of our closed-loop model to create additional value for customers and partners.
Optimize Investments
Grow Revenues
AMERICAN EXPRESS COMPANY | ANNUAL REPORT 2015 6
Going forward, we’ll direct our investments toward efforts that can help us build revenues and earnings over the moderate to long term, including:
• Expanding our card member base with a focus on differentiated products and premium services;
• Growing our merchant network through OptBlue and other programs;
•Deepening customer relationships through lending and rewards;
• Continuing to increase our international presence;
• Expanding our offerings in merchant financing, working capital and FX international payments; and
• Developing newer opportunities related to our loyalty coalition business as well as our closed-loop data analytics.
In addition to organic growth, we’ll continue to explore acquisitions that can help enhance the value we provide to our customers.
Taking a broader view, we see a compelling range of growth opportunities as consumers continue to move away from cash and checks, as online and mobile opportunities expand, and as commerce and payments continue to converge. While we certainly face greater competition from both traditional rivals and newer entrants looking to disrupt the industry, we believe that macro trends in payments and technology can play to our strengths in the years ahead.
We have a tremendous set of assets to draw upon — our trusted brand, financial strength, the advantages of our closed loop and the data it provides, world-class customer service, and our proven ability to innovate in digital commerce.
Our integrated payments model runs about $1 trillion in spending through our closed loop each year. That rich data enables us to create value for Card Members and build business for our merchant partners. This is a major advantage, and it’s one reason why other card issuers are trying to cobble together a closed loop of their own, despite having only a portion of the essential data.
We’re not simply looking to do a better job of processing payments. We’re focused on using our relationships, technology and data to better serve our customers and open up commerce opportunities for our partners. As the boundaries between online and offline blur, I believe our business model puts us in a great position to benefit from the convergence of commerce and payments.

7 AMERICAN EXPRESS COMPANY | ANNUAL REPORT 2015
We recognize that we’re operating in a new reality. That’s why we’re focused on the plan I outlined to increase revenues, reduce costs and optimize our investments. As always, we worked closely with the Board of Directors as they reviewed our plans and progress. Our Board is an outstanding group of business leaders whose insights, guidance and support play a critical role in our efforts to build shareholder value. While we’re intensely focused on raising the company’s performance in the short-term, we are managing American Express with a long-term view as we adapt and invest for the future.
As I said at the start of this letter, we face difficult challenges, but we’ve faced tough challenges before. Each time this company has been tested, we’ve become stronger.
We’re confident that we can deal with our challenges, return to sustainable growth and position the company for long-term success.
Thank you.
Sincerely,
Kenneth I. Chenault Chairman & CEO American Express Company
February 29, 2016
Footnotes:
1 Total revenues net of interest expense, adjusted for FX and excluding Business Travel revenues from the first half of 2014 and the gain on the sale of our investment in Concur Technologies in the fourth quarter 2014, and related growth rate are non-GAAP measures. See footnote 2 for an explanation of FX-adjusted information and Appendix I for a reconciliation to total revenues net of interest expense on a GAAP basis.
2 FX-adjusted information assumes a constant exchange rate between the periods being compared for purposes of currency translation into U.S. dollars (e.g., assumes the foreign exchange rates used to determine results for 2015 apply to the period(s) against which such results are being compared). Certain amounts included in the calculations of FX-adjusted revenues are subject to management allocations.
3 Adjusted worldwide loan growth is a non-GAAP measure and excludes from 2014 the Q4’14 Card Member loan balances related to cobrand partnerships with Costco in the U.S. and JetBlue, now classified as held for sale. See Appendix II for a reconciliation to Card Member loans held for investment, on a GAAP basis.

UNITED STATES SECURITIES AND EXCHANGE COMMISSIONWashington, D.C. 20549
Form 10-KÍ ANNUAL REPORT PURSUANT TO SECTION 13 OR 15(d)
OF THE SECURITIES EXCHANGE ACT OF 1934For the fiscal year ended December 31, 2015
OR‘ TRANSITION REPORT PURSUANT TO SECTION 13 OR 15(d)
OF THE SECURITIES EXCHANGE ACT OF 1934For the transition period from to
Commission File No. 1-7657
American Express Company(Exact name of registrant as specified in its charter)
New York 13-4922250(State or other jurisdiction of
incorporation or organization)(I.R.S. Employer
Identification No.)
200 Vesey StreetNew York, New York 10285
(Address of principal executive offices) (Zip Code)
Registrant’s telephone number, including area code: (212) 640-2000Securities registered pursuant to Section 12(b) of the Act:
Title of each class Name of each exchange on which registered
Common Shares (par value $0.20 per Share) New York Stock ExchangeSecurities registered pursuant to Section 12(g) of the Act: None
Indicate by check mark if the registrant is a well-known seasoned issuer, as defined in Rule 405 of the SecuritiesAct. Yes Í No ‘
Indicate by check mark if the registrant is not required to file reports pursuant to Section 13 or Section 15(d) of theAct. Yes ‘ No Í
Indicate by check mark whether the registrant (1) has filed all reports required to be filed by Section 13 or 15(d) of theSecurities Exchange Act of 1934 during the preceding 12 months (or for such shorter period that the registrant wasrequired to file such reports) and (2) has been subject to such filing requirements for the past 90 days. Yes Í No ‘
Indicate by check mark whether the registrant has submitted electronically and posted on its corporate website, ifany, every Interactive Data File required to be submitted and posted pursuant to Rule 405 of Regulation S-T (§ 232.405 ofthis chapter) during the preceding 12 months (or for a shorter period that the registrant was required to submit and postsuch files). Yes Í No ‘
Indicate by check mark if disclosure of delinquent filers pursuant to Item 405 of Regulation S-K is not containedherein, and will not be contained, to the best of registrant’s knowledge, in definitive proxy or information statementsincorporated by reference in Part III of this Form 10-K or any amendment to this Form 10-K. Í
Indicate by check mark whether the registrant is a large accelerated filer, an accelerated filer, a non-accelerated filer,or a smaller reporting company. See definitions of “large accelerated filer,” “accelerated filer” and “smaller reportingcompany” in Rule 12b-2 of the Exchange Act.Large accelerated filer Í Accelerated filer ‘ Non-accelerated filer ‘ Smaller reporting company ‘
(Do not check if a smaller reporting company)Indicate by check mark whether the registrant is a shell company (as defined in Rule 12b-2 of the
Act). Yes ‘ No Í
As of June 30, 2015, the aggregate market value of the registrant’s voting shares held by non-affiliates of theregistrant was approximately $77.7 billion based on the closing sale price as reported on the New York Stock Exchange.
As of February 10, 2016, there were 964,045,452 common shares of the registrant outstanding.
DOCUMENTS INCORPORATED BY REFERENCE
Part III: Portions of Registrant’s Proxy Statement to be filed with the Securities and Exchange Commission inconnection with the Annual Meeting of Shareholders to be held on May 2, 2016.

TABLE OF CONTENTS
Form 10-KItem Number Page
PART I
1. Business
Introduction . . . . . . . . . . . . . . . . . . . . . . . . . . . . . . . . . . . . . . . . . . . . . . . . . . . . . . . . . . . . . . . . . . . . . . . . . 1
U.S. Card Services . . . . . . . . . . . . . . . . . . . . . . . . . . . . . . . . . . . . . . . . . . . . . . . . . . . . . . . . . . . . . . . . . . . 3
International Card Services . . . . . . . . . . . . . . . . . . . . . . . . . . . . . . . . . . . . . . . . . . . . . . . . . . . . . . . . . . . . 10
Global Commercial Services . . . . . . . . . . . . . . . . . . . . . . . . . . . . . . . . . . . . . . . . . . . . . . . . . . . . . . . . . . . 11
Global Network & Merchant Services . . . . . . . . . . . . . . . . . . . . . . . . . . . . . . . . . . . . . . . . . . . . . . . . . . . . 12
Corporate & Other . . . . . . . . . . . . . . . . . . . . . . . . . . . . . . . . . . . . . . . . . . . . . . . . . . . . . . . . . . . . . . . . . . . . 20
Supervision and Regulation . . . . . . . . . . . . . . . . . . . . . . . . . . . . . . . . . . . . . . . . . . . . . . . . . . . . . . . . . . . . 21
Foreign Operations . . . . . . . . . . . . . . . . . . . . . . . . . . . . . . . . . . . . . . . . . . . . . . . . . . . . . . . . . . . . . . . . . . . 31
Segment Information and Classes of Similar Services . . . . . . . . . . . . . . . . . . . . . . . . . . . . . . . . . . . . . 31
Executive Officers of the Company . . . . . . . . . . . . . . . . . . . . . . . . . . . . . . . . . . . . . . . . . . . . . . . . . . . . . . 31
Employees . . . . . . . . . . . . . . . . . . . . . . . . . . . . . . . . . . . . . . . . . . . . . . . . . . . . . . . . . . . . . . . . . . . . . . . . . . 32
Guide 3 — Statistical Disclosure by Bank Holding Companies . . . . . . . . . . . . . . . . . . . . . . . . . . . . . . . 33
1A. Risk Factors . . . . . . . . . . . . . . . . . . . . . . . . . . . . . . . . . . . . . . . . . . . . . . . . . . . . . . . . . . . . . . . . . . . . . . . . . . 33
1B. Unresolved Staff Comments . . . . . . . . . . . . . . . . . . . . . . . . . . . . . . . . . . . . . . . . . . . . . . . . . . . . . . . . . . . 46
2. Properties . . . . . . . . . . . . . . . . . . . . . . . . . . . . . . . . . . . . . . . . . . . . . . . . . . . . . . . . . . . . . . . . . . . . . . . . . . . . 46
3. Legal Proceedings . . . . . . . . . . . . . . . . . . . . . . . . . . . . . . . . . . . . . . . . . . . . . . . . . . . . . . . . . . . . . . . . . . . . 46
4. Mine Safety Disclosures . . . . . . . . . . . . . . . . . . . . . . . . . . . . . . . . . . . . . . . . . . . . . . . . . . . . . . . . . . . . . . . 48
PART II
5. Market for Registrant’s Common Equity, Related Stockholder Matters and IssuerPurchases of Equity Securities . . . . . . . . . . . . . . . . . . . . . . . . . . . . . . . . . . . . . . . . . . . . . . . . . . . . . . . . . 48
6. Selected Financial Data . . . . . . . . . . . . . . . . . . . . . . . . . . . . . . . . . . . . . . . . . . . . . . . . . . . . . . . . . . . . . . . . 50
7. Management’s Discussion and Analysis of Financial Condition and Results of Operations(“MD&A”) . . . . . . . . . . . . . . . . . . . . . . . . . . . . . . . . . . . . . . . . . . . . . . . . . . . . . . . . . . . . . . . . . . . . . . . . . . . . 51
Executive Overview . . . . . . . . . . . . . . . . . . . . . . . . . . . . . . . . . . . . . . . . . . . . . . . . . . . . . . . . . . . . . . . . . . . 51
Consolidated Results of Operations . . . . . . . . . . . . . . . . . . . . . . . . . . . . . . . . . . . . . . . . . . . . . . . . . . . . . 54
Business Segment Results . . . . . . . . . . . . . . . . . . . . . . . . . . . . . . . . . . . . . . . . . . . . . . . . . . . . . . . . . . . . 62
Consolidated Capital Resources and Liquidity . . . . . . . . . . . . . . . . . . . . . . . . . . . . . . . . . . . . . . . . . . . . 73
Off-Balance Sheet Arrangements and Contractual Obligations . . . . . . . . . . . . . . . . . . . . . . . . . . . . . . 83
Risk Management . . . . . . . . . . . . . . . . . . . . . . . . . . . . . . . . . . . . . . . . . . . . . . . . . . . . . . . . . . . . . . . . . . . . 84
Critical Accounting Estimates . . . . . . . . . . . . . . . . . . . . . . . . . . . . . . . . . . . . . . . . . . . . . . . . . . . . . . . . . . 90
Other Matters . . . . . . . . . . . . . . . . . . . . . . . . . . . . . . . . . . . . . . . . . . . . . . . . . . . . . . . . . . . . . . . . . . . . . . . 93
7A. Quantitative and Qualitative Disclosures about Market Risk . . . . . . . . . . . . . . . . . . . . . . . . . . . . . . 98
8. Financial Statements and Supplementary Data . . . . . . . . . . . . . . . . . . . . . . . . . . . . . . . . . . . . . . . . . . 98
Management’s Report on Internal Control Over Financial Reporting . . . . . . . . . . . . . . . . . . . . . . . . . 98
Report of Independent Registered Public Accounting Firm . . . . . . . . . . . . . . . . . . . . . . . . . . . . . . . . . 99
Index to Consolidated Financial Statements . . . . . . . . . . . . . . . . . . . . . . . . . . . . . . . . . . . . . . . . . . . . . . 100
Consolidated Financial Statements . . . . . . . . . . . . . . . . . . . . . . . . . . . . . . . . . . . . . . . . . . . . . . . . . . . . . 101
Notes to Consolidated Financial Statements . . . . . . . . . . . . . . . . . . . . . . . . . . . . . . . . . . . . . . . . . . . . . 106
9. Changes in and Disagreements with Accountants on Accounting and FinancialDisclosure . . . . . . . . . . . . . . . . . . . . . . . . . . . . . . . . . . . . . . . . . . . . . . . . . . . . . . . . . . . . . . . . . . . . . . . . . . . . 160
9A. Controls and Procedures . . . . . . . . . . . . . . . . . . . . . . . . . . . . . . . . . . . . . . . . . . . . . . . . . . . . . . . . . . . . . . 160
9B. Other Information . . . . . . . . . . . . . . . . . . . . . . . . . . . . . . . . . . . . . . . . . . . . . . . . . . . . . . . . . . . . . . . . . . . . . 160
i

Form 10-KItem Number Page
PART III
10. Directors, Executive Officers and Corporate Governance . . . . . . . . . . . . . . . . . . . . . . . . . . . . . . . . . 160
11. Executive Compensation . . . . . . . . . . . . . . . . . . . . . . . . . . . . . . . . . . . . . . . . . . . . . . . . . . . . . . . . . . . . . . 160
12. Security Ownership of Certain Beneficial Owners and Management and RelatedStockholder Matters . . . . . . . . . . . . . . . . . . . . . . . . . . . . . . . . . . . . . . . . . . . . . . . . . . . . . . . . . . . . . . . . . . 160
13. Certain Relationships and Related Transactions, and Director Independence . . . . . . . . . . . . . . 160
14. Principal Accounting Fees and Services . . . . . . . . . . . . . . . . . . . . . . . . . . . . . . . . . . . . . . . . . . . . . . . . . 161
PART IV
15. Exhibits, Financial Statement Schedules . . . . . . . . . . . . . . . . . . . . . . . . . . . . . . . . . . . . . . . . . . . . . . . . 161
Signatures . . . . . . . . . . . . . . . . . . . . . . . . . . . . . . . . . . . . . . . . . . . . . . . . . . . . . . . . . . . . . . . . . . . . . . . . . . . 162
Guide 3 — Statistical Disclosure by Bank Holding Companies . . . . . . . . . . . . . . . . . . . . . . . . . . . . A-1
Exhibit Index . . . . . . . . . . . . . . . . . . . . . . . . . . . . . . . . . . . . . . . . . . . . . . . . . . . . . . . . . . . . . . . . . . . . . . . . . E-1
This Annual Report on Form 10-K, including the “Management’s Discussion and Analysis of Financial Conditionand Results of Operations,” contains forward-looking statements within the meaning of the Private SecuritiesLitigation Reform Act of 1995 that are subject to risks and uncertainties. You can identify forward-looking statementsby words such as “believe,” “expect,” “anticipate,” “intend,” “plan,” “aim,” “will,” “may,” “should,” “could,” “would,”“likely,” “estimate,” “predict,” “potential,” “continue” or other similar expressions. We discuss certain factors thataffect our business and operations and that may cause our actual results to differ materially from these forward-looking statements under “Risk Factors” and “Cautionary Note Regarding Forward-Looking Statements.” You arecautioned not to place undue reliance on these forward-looking statements, which speak only as of the date on whichthey are made. We undertake no obligation to update publicly or revise any forward-looking statements.
ii
PART I
ITEM 1. BUSINESS
INTRODUCTIONOverview
American Express Company, together with its consolidated subsidiaries (“American Express,” the “Company,”“we,” “us” or “our”), is a global services company that provides customers with access to products, insights andexperiences that enrich lives and build business success. Our principal products and services are charge and creditpayment card products and travel-related services offered to consumers and businesses around the world.
We were founded in 1850 as a joint stock association. We were incorporated in 1965 as a New York corporation.American Express Company and its principal operating subsidiary, American Express Travel Related ServicesCompany, Inc. (“TRS”), are bank holding companies under the Bank Holding Company Act of 1956, as amended (the“BHC Act”), subject to supervision and examination by the Board of Governors of the Federal Reserve System (the“Federal Reserve”).
Our headquarters are located in New York, New York in lower Manhattan. We also have offices in other locationsthroughout the world.
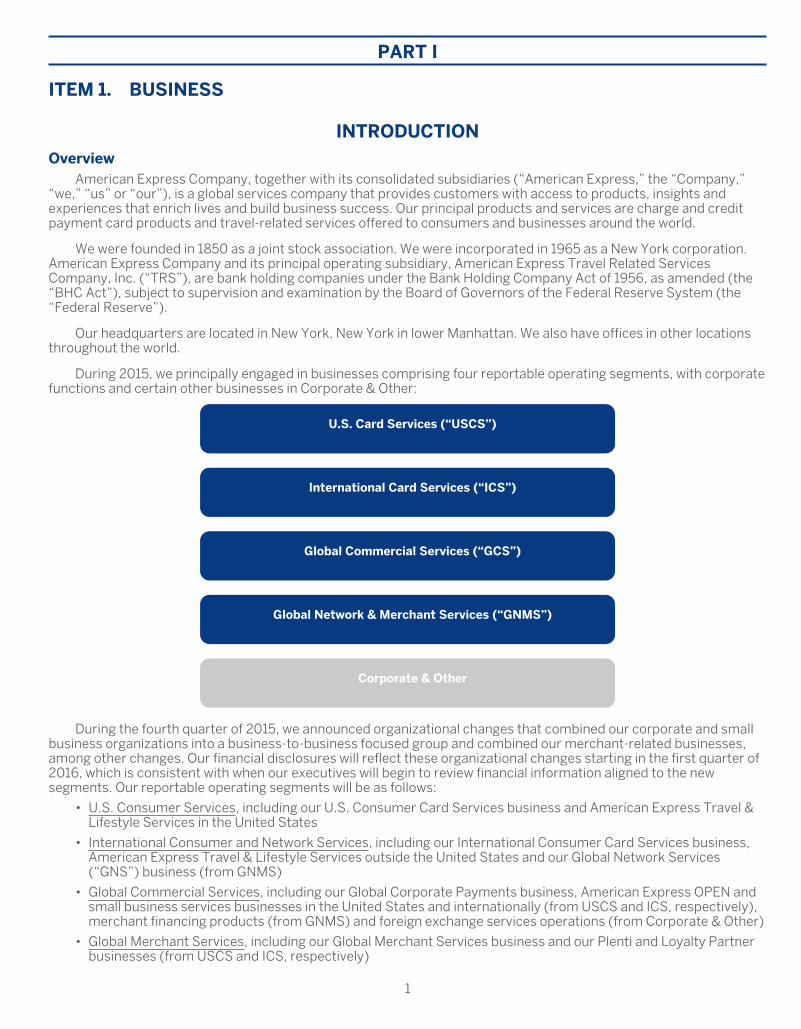
During 2015, we principally engaged in businesses comprising four reportable operating segments, with corporatefunctions and certain other businesses in Corporate & Other:
U.S. Card Services (“USCS”)
International Card Services (“ICS”)
Global Commercial Services (“GCS”)
Global Network & Merchant Services (“GNMS”)
Corporate & Other
During the fourth quarter of 2015, we announced organizational changes that combined our corporate and smallbusiness organizations into a business-to-business focused group and combined our merchant-related businesses,among other changes. Our financial disclosures will reflect these organizational changes starting in the first quarter of2016, which is consistent with when our executives will begin to review financial information aligned to the newsegments. Our reportable operating segments will be as follows:
• U.S. Consumer Services, including our U.S. Consumer Card Services business and American Express Travel &Lifestyle Services in the United States
• International Consumer and Network Services, including our International Consumer Card Services business,American Express Travel & Lifestyle Services outside the United States and our Global Network Services(“GNS”) business (from GNMS)
• Global Commercial Services, including our Global Corporate Payments business, American Express OPEN andsmall business services businesses in the United States and internationally (from USCS and ICS, respectively),merchant financing products (from GNMS) and foreign exchange services operations (from Corporate & Other)
• Global Merchant Services, including our Global Merchant Services business and our Plenti and Loyalty Partnerbusinesses (from USCS and ICS, respectively)
1

This report discusses the reportable operating segments consistent with financial information as presented in theConsolidated Financial Statements.
Securities Exchange Act Reports and Additional Information
We maintain an Investor Relations website on the internet at http://ir.americanexpress.com. We make availablefree of charge, on or through this website, our annual, quarterly and current reports and any amendments to thosereports as soon as reasonably practicable following the time they are electronically filed with or furnished to theSecurities and Exchange Commission (“SEC”). To access these materials, click on the “SEC Filings” link under thecaption “Financial Information” on our Investor Relations homepage.
You can also access our Investor Relations website through our main website at www.americanexpress.com byclicking on the “Investor Relations” link, which is located at the bottom of our homepage. Information contained on ourInvestor Relations website, our main website and other websites referred to in this report is not incorporated byreference into this report or any other report filed with or furnished to the SEC. We have included such websiteaddresses only as inactive textual references and do not intend them to be active links.
This report includes trademarks, such as American Express®, which are protected under applicable intellectualproperty laws and are the property of American Express Company or its subsidiaries. This report also containstrademarks, service marks, copyrights and trade names of other companies, which are the property of their respectiveowners. Solely for convenience, our trademarks and trade names referred to in this report may appear without the ® orTM symbols, but such references are not intended to indicate, in any way, that we will not assert, to the fullest extentunder applicable law, our rights or the right of the applicable licensor to these trademarks and trade names.
Products and Services
Our range of products and services includes:
• Charge and credit card products
• Network services
• Merchant acquisition and processing, servicing and settlement, merchant financing, and point-of-sale,marketing and information products and services for merchants
• Fee services, including fraud prevention services and the design and operation of customer loyalty and rewardsprograms
• Expense management products and services
• Travel-related services
• Stored value/prepaid products
Our various products and services are sold globally to diverse customer groups, including consumers, smallbusinesses, mid-sized companies and large corporations. These products and services are sold through variouschannels, including direct mail, online applications, in-house and third-party sales forces and direct responseadvertising. Business travel-related services are offered through our non-consolidated joint venture, AmericanExpress Global Business Travel (the “GBT JV”).
Our general-purpose card network, card-issuing and merchant-acquiring and processing businesses are global inscope. We are a world leader in providing charge and credit cards to consumers, small businesses and corporations.These cards include cards issued by American Express as well as cards issued by third-party banks and otherinstitutions that are accepted by merchants on the American Express network. American Express® cards permit CardMembers to charge purchases of goods and services in most countries around the world at the millions of merchantsthat accept cards bearing our logo. At December 31, 2015, we had total worldwide cards-in-force of 117.8 million(including cards issued by third parties). In 2015, our worldwide billed business (spending on American Express cards,including cards issued by third parties) was $1.04 trillion.
Our business as a whole has not experienced significant seasonal fluctuations, although card billed business tendsto be moderately higher in the fourth quarter than in other quarters. As a result, the amount of Card Member loans andreceivables outstanding tend to be moderately higher during that quarter. The average discount rate also tends to beslightly lower during the fourth quarter due to a higher level of retail-related billed business volumes.
2

Competitive Advantages of Our Closed-Loop Network and Spend-Centric Model
We believe our “closed-loop” network and “spend-centric” business model continue to be competitive advantagesby giving us the ability to provide differentiated value to Card Members, merchants and our card-issuing partners.*
Wherever we manage both the acquiring relationship with merchants and the card-issuing side of the business,there is a “closed loop,” which distinguishes our network from the bankcard networks, in that we have access toinformation at both ends of the card transaction. We maintain direct relationships with both our Card Members (as acard issuer) and merchants (as an acquirer), and we handle all key aspects of those relationships. Through contractualrelationships, we also obtain data from third-party card issuers, merchant acquirers and processors with whom we dobusiness. This “closed loop” allows us to analyze information on Card Member spending and build algorithms andother analytical tools that we use to underwrite risk, reduce fraud and provide targeted marketing and otherinformation services for merchants and special offers and services to Card Members through a variety of channels,while at the same time respecting Card Member preferences and protecting Card Member and merchant data incompliance with applicable policies and legal requirements.
Our “spend-centric” business model focuses on generating revenues primarily by driving spending on our cardsand secondarily by finance charges and fees. Spending on our cards, which is higher on average on a per-card basisversus our competitors, offers greater value to merchants in the form of loyal customers and higher sales. Thisenables us to earn discount revenue that allows us to invest in value-added services for merchants and Card Members.Because of the revenues generated from having higher-spending Card Members, we have the flexibility to invest inattractive rewards and other benefits to Card Members, as well as targeted marketing and other programs andinvestments for merchants, all of which create incentives for Card Members to spend more on their cards andpositively differentiate American Express cards. The significant investments we make in rewards and other compellingvalue propositions for Card Members incent card usage at merchants and Card Member loyalty.
The American Express Brand
Our brand and its attributes — trust, security and service — are key assets of the Company. We continue to focuson our brand, and our products and services are evidence of our commitment to its attributes. Our brand hasconsistently been rated one of the most valuable brands in the world in published studies, and we believe it provides uswith a significant competitive advantage.
We believe our brand and its attributes are critical to our success, and we invest heavily in managing, marketing,promoting and protecting it. We place significant importance on trademarks, service marks and patents, and seek tosecure our intellectual property rights around the world.
U.S. CARD SERVICES
We offer a wide range of card products and services to consumers and small businesses in the United States. Ourconsumer travel business, which provides travel services to Card Members and other consumers, complements ourcore card business. We also operate a coalition loyalty business in the U.S. called Plenti and offer deposit productsdirectly to consumers through American Express Personal Savings.
The proprietary card business offers a broad set of card products, rewards and services to acquire and retainhigh-spending, creditworthy Card Members. Core elements of our strategy are:
• Designing card products with features that appeal to our target customer base in traditional and newercustomer segments
• Using incentives to drive spending on our various card products and generate loyal customers, including ourMembership Rewards® program, cash-back reward features and participation in loyalty programs sponsored byour cobrand and other partners, such as Delta SkyMiles®
• Providing an array of other benefits and services across card products to address travel and other needs
• Driving spending in online and offline channels and accommodating spending wherever and however CardMembers desire
• Developing and nurturing wide-ranging relationships with cobrand and other partners
* The use of the term “partner” or “partnering” does not mean or imply a formal legal partnership, and is not meant inany way to alter the terms of American Express’ relationship with third-party issuers and merchant acquirers.
3

• Promoting and using incentives for Card Members to use their cards in new and expanded merchant categories,including everyday spend and traditional cash and check categories
• Providing solutions to support the everyday business operations of our small business customers
• Providing exceptional customer service
Consumer and Small Business Services
We offer individual consumer charge cards such as the American Express® Green Card, the American Express®
Gold Card, the Platinum Card® and the Centurion® Card, as well as small business charge cards, including the PlumCard®. We also offer revolving credit cards such as the Amex EveryDay® Credit Card, Blue Cash Everyday® Card fromAmerican Express, Blue Sky from American Express® and, for small businesses, Blue for Business® Credit Card andSimplyCash® Business Card. In addition, we offer a variety of cards sponsored by and cobranded with othercorporations and institutions for consumers and small businesses, such as the Delta SkyMiles® Credit Card fromAmerican Express, Starwood Preferred Guest Credit Card from American Express, Hilton HHonorsTM Card fromAmerican Express and Lowe’s Business Rewards Card. For the year ended December 31, 2015, billed business fromcharge cards comprised 56 percent of total U.S. Card Services billed business.
Centurion Bank and American Express Bank as Issuers of Certain Cards and Deposit Products
We have two U.S. bank subsidiaries, American Express Centurion Bank (“Centurion Bank”) and American ExpressBank, FSB (“American Express Bank”), which are both FDIC-insured depository institutions. Certain informationregarding each bank is set forth in the table below:
Centurion Bank American Express Bank
Type of Bank Utah-chartered industrial bank Federal savings bank
Regulatory Supervision Regulated, supervised and regularlyexamined by the Utah Department ofFinancial Institutions and the FederalDeposit Insurance Corporation(“FDIC”)
Subject to supervision, examinationand enforcement by the ConsumerFinancial Protection Bureau(“CFPB”) with respect to marketingand sale of consumer financialproducts and compliance withfederal consumer financial laws
Regulated, supervised and regularlyexamined by the Office of theComptroller of the Currency(“OCC”), an independent bureau ofthe U.S. Department of the Treasury
Subject to supervision, examinationand enforcement by the CFPB withrespect to marketing and sale ofconsumer financial products andcompliance with federal consumerfinancial laws
Types of Cards Issued Consumer charge and credit cards • Consumer charge and credit cards• All OPEN small business credit and
charge cards
Card Marketing Methods Primarily direct mail, online andother remote marketing channels
• Direct mail, online and otherremote marketing channels
• In-person marketing, including bythird-party cobrand partners
Deposit Programs Deposits obtained only throughthird-party brokerage channels
Deposits obtained through third-party brokerage channels andaccepted directly from consumers
Capital Adequacy Requirementsat December 31, 2015*
Well capitalized Well capitalized
* As of December 31, 2015, a bank generally was deemed to be well capitalized if it maintained a common equity Tier 1 capital ratio of at least 6.5percent, a Tier 1 capital ratio of at least 8 percent, a total capital ratio of at least 10 percent and a Tier 1 leverage ratio of at least 5 percent. Forfurther discussion regarding capital adequacy, see “Capital Adequacy” under “Supervision and Regulation.”
Charge Cards
Our charge cards, which generally carry no preset spending limits, are designed as a method of payment. Chargesare approved based on a variety of factors including a Card Member’s current spending patterns, payment history,credit record and financial resources. Card Members generally must pay the full amount billed each month. Charge
4

cards do offer several ways for eligible Card Members to pay off purchases over time. For example, Select & PayLater® allows enrolled Card Members to select individual charges to pay over time and the Extended Payment Optionprovides eligible Card Members with the ability to extend payment for eligible charges above a certain dollar amount.Charge card accounts that are past due are subject, in most cases, to a delinquency assessment and, if not brought tocurrent status, may be suspended or cancelled. The no-preset spending limit and pay-in-full nature of these productsattract high-spending Card Members, while allowing us to manage risk accordingly.
Revolving Credit Cards
We offer a variety of revolving credit cards that have a range of different payment terms, interest rate and feestructures. Revolving credit card products provide Card Members with the flexibility to pay their bill in full each monthor carry a monthly balance on their cards to finance the purchase of goods or services. Along with charge cards andcobrand cards, these revolving credit cards promote increased relevance for our expanding merchant network.
Cobrand Cards
We issue cards under cobrand agreements with selected commercial firms in the United States. Attainingattractive cobrand card partnerships is intensely competitive among card issuers and networks as these partnershipscan generate high-spending loyal customers. Cobrand arrangements are entered into for a fixed period, generallyranging from five to eight years, and will terminate in accordance with their terms, including at the end of the fixedperiod unless extended or renewed at the option of the parties, or upon early termination as a result of an event ofdefault or otherwise. Card Members typically earn rewards provided by the partners’ respective loyalty programsbased upon their spending on the cobrand cards, such as frequent flyer miles, hotel loyalty points and cash back.
We make payments to our cobrand partners, which can be significant, based primarily on the amount of CardMember spending and corresponding rewards earned on such spending and, under certain arrangements, on thenumber of accounts acquired and retained. The amount we pay to our cobrand partners has increased and willcontinue to increase as arrangements are renegotiated due to increasingly intense competition for cobrand partnersamong card issuers and networks. In some cases, the partner is solely liable for providing rewards to the Card Memberunder the cobrand partner’s own loyalty program. As the issuer of the cobrand card, we retain all the credit risk withthe Card Member and bear the receivables funding and operating expenses for such cards. The cobrand partnerretains the risk associated with the miles, points or other currency earned by the Card Member under the partner’sloyalty program. For further discussion of the competition for cobrand partners, see “Card-Issuing Business —Competition” and “We face substantial and increasingly intense competition for partner relationships, which couldresult in a loss or renegotiation of these arrangements that could have a material adverse impact on our business andresults of operations” in “Risk Factors.”
Card Pricing and Account Management
On certain cards we charge an annual fee that varies based on the type of card and the number of cards for eachaccount. We also offer many revolving credit cards on which we assess finance charges for revolving balances.Depending on the product, we may also charge Card Members an annual program fee to participate in theMembership Rewards programs and fees for account performance (e.g., late fees) or for certain optional services. Weapply standards and criteria for creditworthiness to each Card Member through a variety of means both at the time ofinitial solicitation or application and on an ongoing basis during the card relationship. We use sophisticated creditmodels and techniques in our risk management operations. For a further description of our risk management policies,see “Risk Management” under “MD&A.”
Membership Rewards® Program
Our Membership Rewards program allows Card Members to earn one point for virtually every dollar charged oneligible, enrolled American Express cards, and then use points for a wide array of rewards, including travel, retailmerchandise, dining and entertainment, financial services and donations to benefit charities. Memberships Rewards isour largest card-based rewards program and a significant portion of our cards by their terms allow Card Members toearn bonus points for purchases at merchants in particular industry categories. Points generally have no expirationdate and there is no limit on the number of points one can earn. Membership Rewards program tiers are aligned withspecific card products to better meet Card Member lifestyle and rewards program usage needs. American ExpressCard Members participate in various Membership Rewards program tiers based on their credit or charge card.
We believe our Membership Rewards “point bank” is a substantial asset and a competitive advantage. Wecontinue to evolve Membership Rewards to provide innovative ways to use points. For example, in 2015 we announceda partnership with Airbnb to allow eligible U.S. Card Members to use points to book accommodations directly on theAirbnb website. We also partnered with Best Buy to allow eligible U.S. Card Members to use their points for onlinepurchases on BestBuy.com.
5

Membership Rewards® program Emergency Card Replacement Global Assist® Hotline Online Account ManagementCar Rental Loss and Damage Insurance Online Year-End Summary Extended WarrantyAdvance Ticket Sales PurchaseProtection Exclusive Access to Card Member Events Return Protection
When a Card Member enrolled in the Membership Rewards program uses their card, we establish reserves tocover the cost of estimated future reward redemptions for points earned to date. When a Membership Rewardsprogram enrollee redeems a reward using Membership Rewards points, we make a payment to the MembershipRewards program partner providing the reward pursuant to contractual arrangements. Membership Rewards expenseis driven by Card Member charge volume, customer participation in the program and contractual arrangements withredemption partners. For more information on our Membership Rewards program, see “Critical AccountingEstimates — Liability for Membership Rewards Expense” under “MD&A.”
Membership Rewards continues to be an important competitive differentiator and driver of Card Memberspending and loyalty. We believe, based on historical experience, Card Members enrolled in rewards programs yieldhigher spend, stronger credit performance and greater profit for us. By offering a broader range of redemptionchoices, we have given our Card Members more flexibility in the use of their rewards points on a cost-effective basis.Our program is also valuable to merchants that become redemption partners as we bring them high-spending CardMembers and new marketing channels to reach these Card Members.
Card Member Benefits and Services
Our Card Members have access to a variety of special benefits and services, some of which are fee-based,depending on the type of cards they have. Examples of these special benefits and services include:
Membership Rewards®
programEmergency Card
ReplacementGlobal Assist®
HotlineOnline Account
Management
Car Rental Loss andDamage Insurance
Online Year-EndSummary
Purchase ProtectionExclusive Access to
Card Member EventsReturn Protection
Extended Warranty Advance Ticket Sales
OPEN
In addition to our U.S. consumer card business, through American Express Bank we are also a leading paymentcard issuer for small businesses (generally, firms with fewer than 100 employees and/or annual sales up to $10million). American Express OPEN offers small business owners a wide range of products, services, tools and savingsdesigned to meet their evolving payment and business needs, including:
• Charge and credit cards
• Rewards on eligible spend and business-relevant rewards redemption options
• Travel and concierge services
• Retail and travel protections such as purchase protection and baggage insurance
• A five percent discount or two Membership Rewards points for each eligible dollar spent at select suppliers oftravel, business services and products through OPEN Savings®
• Expense management tools and reporting
• Online account management capabilities
• Resources to help grow and manage a business through our community-driven website, OPEN Forum®
6
• Client managers for our top-spending and higher-revenue clients to support business growth
OPEN engages in advocacy efforts on behalf of small businesses. These advocacy efforts include our OPEN forGovernment Contracting program to help small businesses learn how to obtain government contracts, programsdesigned to help women entrepreneurs learn how to grow and sustain businesses, and our efforts to increaseawareness of the importance of small businesses in our communities generally. For example, in 2015 we led the sixthSmall Business Saturday®, a day to increase consumer awareness and patronage of local businesses and their role inthe economy and local neighborhoods. Small Business Saturday now takes place in the United States, the UnitedKingdom and Australia, with similar initiatives in Israel and South Africa.
Card-Issuing Business — Competition
Our payment products face substantial and intense competition and generally compete with a wide variety offinancial payment products including cash, foreign currency, checks, debit, prepaid and ATM cards, bank accounts,virtual currencies, alternative financial services such as check cashing and money orders, store-branded gift cards, othernetwork-branded credit and charge cards and other payment accounts and services. As a card issuer, we compete in theUnited States with financial institutions that issue general-purpose charge and revolving credit cards (such as Bank ofAmerica, Capital One Financial, Citibank, Discover Financial Services and JPMorgan Chase). We also encountercompetition from businesses that issue their own private label cards or otherwise extend credit to their customers, suchas retailers and airline associations, although these cards are generally accepted only at limited locations. We faceincreasing competition for cobrand relationships, as both card issuer and network competitors have targeted keybusiness partners with attractive value propositions for access to high-spending loyal customers. For example, althoughwe competed aggressively to renew our cobrand and merchant acceptance agreements with Costco WholesaleCorporation in the United States, we were unable in the end to reach terms that would have made economic sense for ourCompany and our shareholders and in February 2015, we announced that such agreements are set to end in 2016.
The largest competing issuers have continued to grow, in several cases by acquiring card portfolios, and also bycross-selling through their retail branch networks. Competing card issuers offer a variety of products and services toattract cardholders, including premium cards with enhanced services or lines of credit, airline frequent flyer programmileage credits, cash rebates and other reward or rebate programs, services for small business owners, “teaser”promotional interest rates and rewards points for both credit card acquisition and balance transfers, and cobrandedarrangements with partners that offer benefits to cardholders.
Most financial institutions that offer demand deposit accounts also issue debit cards to permit depositors toaccess their funds. Use of debit cards for point-of-sale purchases has grown as most financial institutions havereplaced ATM cards with general-purpose debit cards bearing either the Visa or MasterCard logo. Debit cards werehistorically marketed as replacements for cash and checks, and transactions made with debit cards have typicallybeen for smaller dollar amounts. However, debit cards are increasingly perceived as an alternative to credit or chargecards and used in that manner. Additionally, overdraft accounts can be used by our competitors to extend credit tocustomers when transaction values exceed monies available in a linked demand deposit account.
As the payments industry continues to evolve, we are also facing increasing competition from non-traditionalplayers, such as online networks, telecommunication providers and software-as-a-service providers, which leveragenew technologies and customers’ existing charge and credit card accounts and bank relationships to create paymentor other fee-based solutions. In addition, the evolution of payment products in emerging markets may be differentthan it has been in developed markets. Instead of migrating from cash to checks to plastic, technology and consumerbehaviors in these markets may result in the skipping of one or more steps to alternative payment mechanisms suchas mobile payments. For a further discussion of the evolving competitive landscape in the payments industry, see“Global Network & Merchant Services — Competition” under “Global Network & Merchant Services.”
The principal competitive factors that affect the card-issuing business include:
• The features, value and quality of the products and services, including customer care, rewards programs,partnerships, benefits and digital resources, and the costs associated with providing such features and services
• The number, spending characteristics and credit performance of customers
• The quantity, diversity and quality of the establishments where the cards can be used
• The pricing, payment and other card account terms and conditions
• The number and quality of other payment cards and other forms of payment, such as debit cards and electronicwallets, available to customers
• Reputation and brand recognition
• The success of marketing and promotional campaigns
• The nature and quality of expense management data capture and reporting capability, particularly for smallbusinesses
7
• The ability to manage credit and interest rate risk throughout the economic cycle and implement operationaland cost efficiencies
In addition to the discussion in this section, see “Our operating results may suffer because of substantial andincreasingly intense competition worldwide in the payments industry” in “Risk Factors” for further discussion of thepotential impact of competition on our business.
Financing Activities
We meet our funding needs through a variety of sources, including direct and third-party sourced deposits anddebt instruments, such as senior unsecured notes, asset securitizations and secured borrowing facilities. The cost offunding Card Member receivables and loans is a major expense of our card operations.
Centurion Bank and American Express Bank finance their charge card receivables and credit card loans, in part,through the issuance of medium-term notes and by accepting consumer deposits in the United States. TRS, CenturionBank and American Express Bank also fund receivables and loans through asset securitization programs. AmericanExpress Credit Corporation, a wholly owned subsidiary of TRS, along with its subsidiaries (collectively, “Credco”)acquires or finances charge card receivables arising from the use of corporate cards issued in the United States andconsumer and corporate charge cards issued in certain countries outside the United States. Credco also acquires orfinances revolving credit card loans arising from the use of consumer cards issued in certain countries outside theUnited States. Credco funds the acquisition or financing of receivables and loans principally through the issuance ofmedium-term notes.
There is a discussion of our financing activities in “Consolidated Capital Resources and Liquidity” under “MD&A”and Notes 6 and 9 to our Consolidated Financial Statements. In addition, see “Adverse financial market conditions maysignificantly affect our ability to meet liquidity needs, access to capital and cost of capital” in “Risk Factors.”
Deposit Programs
Centurion Bank and American Express Bank accept deposits from individuals through third-party brokeragenetworks. American Express Bank also accepts deposits directly from consumers through American Express®
Personal Savings, a set of deposit products, including High-Yield Savings and Certificate of Deposit accounts. As ofDecember 31, 2015, we had approximately $54.1 billion in total U.S. retail deposits. Our deposit-taking activitiescompete with those of other deposit-taking organizations that source deposits through telephone, internet and otherelectronic delivery channels, brokerage networks and/or branch locations. We compete primarily in the deposit sectoron the basis of rates and our brand and its attributes.
Card-Issuing Business and Deposit Programs — Regulation
We are subject to a variety of laws and regulations applicable to financial institutions that have becomeincreasingly complex and robust, and supervisory efforts to apply relevant laws, regulations and policies have becomemore intense. Further changes in such laws and regulations or in the regulatory application or judicial interpretationthereof could continue to impact the manner in which we conduct our business and the costs of compliance. Weregularly review and, as appropriate, refine our business practices in light of existing and anticipated developments inlaws, regulations and industry trends so we can continue to manage our business prudently and consistent withregulatory requirements and expectations.
Our charge card, consumer lending and deposit operations are subject to extensive regulation in the UnitedStates, including pursuant to:
• The Equal Credit Opportunity Act (which generally prohibits discrimination in the granting and handling ofcredit)
• The Fair Credit Reporting Act (“FCRA”), as amended by the Fair and Accurate Credit Transactions Act (“FACTAct”) (which, among other things, regulates use by creditors of consumer credit reports and creditprescreening practices and requires certain disclosures when an application for credit is rejected)
• The Credit Card Accountability Responsibility and Disclosure Act of 2009 (the “CARD Act”) (which prohibitscertain acts and practices in connection with consumer credit card accounts)
• The Truth in Lending Act (“TILA”) (which, among other things, requires extensive disclosure of the terms uponwhich credit is granted), including the amendments to TILA that were adopted through the enactment of theFair Credit and Charge Card Disclosure Act (which mandates certain disclosures on credit and charge cardapplications)
• Regulation Z (which implements TILA and was amended by the Federal Reserve to extensively revise the openend consumer credit disclosure requirements and implement the requirements of the CARD Act)
8

• The Consumer Financial Protection Act (Title X of the Dodd-Frank Wall Street Reform and Consumer ProtectionAct (“Dodd-Frank”)) (“CFPA”)
• The Fair Credit Billing Act (which, among other things, regulates the manner in which billing inquiries arehandled and specifies certain billing requirements)
• The Truth in Savings Act (which requires certain disclosures about rates paid and other terms of depositaccounts)
• The Electronic Funds Transfer Act (which, among other things, governs disclosures and settlement oftransactions for electronic funds transfers and customer rights and liability arising from the use of ATMs andother electronic banking services and, after the enactment of Dodd-Frank, imposes a cap on debit cardinterchange fees and prohibits exclusivity arrangements for payment card networks)
• The Telephone Consumer Protection Act (which prohibits contacting customers on their cellular telephoneswithout their express consent, and provides for significant statutory damages)
• The Controlling the Assault of Non-Solicited Pornography and Marketing Act of 2003 (which establishednational requirements for sending of commercial email messages and which provides for significant statutorydamages for violations)
• Federal and state laws and regulations that generally prohibit engaging in unfair, deceptive and abusive acts andpractices in offering consumer financial products and services
In the United States, our marketing and sale of consumer financial products and our compliance with certainfederal consumer financial laws, including the CFPA and TILA, are supervised and examined by the CFPB. The CFPBhas broad rulemaking and enforcement authority over providers of credit, savings and payment services and productsand authority to prevent “unfair, deceptive or abusive” acts or practices. The CFPB has the authority to writeregulations under federal consumer financial protection laws and to enforce those laws against and examine forcompliance large financial institutions like the Company, TRS, Centurion Bank and American Express Bank. It is alsoauthorized to collect fines and require consumer restitution in the event of violations, engage in consumer financialeducation, track consumer complaints, request data and promote the availability of financial services to underservedconsumers and communities. In addition, a number of U.S. states have significant consumer credit protection anddisclosure laws (in certain cases more stringent than U.S. federal laws). U.S. federal law also regulates abusive debtcollection practices. Bankruptcy and debtor relief laws can affect our ability to collect amounts owed to us.
In October 2012, the Company, TRS, Centurion Bank and American Express Bank reached settlements withseveral bank regulators relating to certain aspects of our U.S. consumer card practices. In December 2013, TRS,Centurion Bank and American Express Bank reached settlements with the FDIC, OCC and CFPB to resolve regulatoryreviews of marketing and billing practices related to several credit card add-on products. Internal and regulatoryreviews are likely to continue to result in changes to practices, products and procedures. Such reviews are also likelyto continue to result in increased costs related to regulatory oversight, supervision and examination and additionalrestitution to Card Members, and may result in additional regulatory actions, including civil money penalties.
We are subject to certain applicable federal and state privacy, data protection and information security laws, rulesand regulations, including certain requirements related to breach notification. Such laws also govern the collection,use, sharing and safeguarding of personal information. Since American Express Company and TRS are bank holdingcompanies, our business is also subject to certain activity restrictions under the BHC Act and to certain provisions ofthe Currency and Foreign Transactions Reporting Act and the accompanying regulations issued by the U.S.Department of the Treasury (collectively referred to as the “Bank Secrecy Act”), as amended by the USA PATRIOT Actof 2001 (the “Patriot Act”), with regard to maintaining effective anti-money laundering (“AML”) programs. For adiscussion of these and other regulations and legislation that impact our business, see “Supervision and Regulation.”
In 2003, the Federal Financial Institutions Examination Council issued guidance on credit card accountmanagement and loss allowance practices. Centurion Bank and American Express Bank regularly evaluate and discussthe guidance with their respective regulators and, as a result, may refine their practices from time to time based onregulatory input. The guidance has not had, nor do we expect it to have, any material impact on our businesses orpractices.
American Express Travel & Lifestyle ServicesAmerican Express Travel & Lifestyle Services (“TLS”) is focused on delivering premium leisure travel and lifestyle-
related services to Card Members and other customers in the United States and internationally. Services are providedthrough a proprietary network of travel and lifestyle consultants, consumer travel websites available in 14 countriesand the U.S. American Express Travel Representative Network (which consists of independently owned travelagencies that license the American Express Travel brand). Additional services are offered to Gold, Platinum andCenturion Card Members when booking through TLS.
9

TLS competes with a variety of competitors including traditional “brick and mortar” travel agents, travel networks,travel agencies that provide travel benefits through competitors of our proprietary card business and online travel agencies.
PlentiDuring 2015, we launched Plenti®, a U.S.-based loyalty coalition, with AT&T, ExxonMobil, Macy’s, Nationwide, Rite
Aid, Direct Energy, Enterprise Rent-A-Car and Hulu. Coalition loyalty programs such as Plenti and our Payback®
program (which is operated by our Loyalty Partner subsidiary and is described in “International Card Services”) enableconsumers to earn rewards points and use them to save on purchases from a variety of participating merchantsthrough a multi-category rewards platform that is payment agnostic. Merchants generally fund the consumer offersand are responsible to us for the cost of loyalty points; we earn revenue from operating the loyalty platform and byproviding marketing support.
Our ability to generate revenue will depend on our ability to differentiate ourselves through the products andservices we provide and the attractiveness of our loyalty programs to consumers. The continued attractiveness of ourloyalty programs will also depend on our ability to remain affiliated with partners that are desirable to consumers andto offer rewards that are both attainable and attractive to consumers.
INTERNATIONAL CARD SERVICES
We offer our charge and credit cards to consumers and small businesses in numerous countries around the globe.Our geographic scope is widespread and we focus primarily on those countries we believe offer us the greatestfinancial opportunity. For a discussion of cards issued internationally through our GNS partner relationships, see“Global Network Services.”
We continued to bolster our international proprietary card business through the launch of a number of new orenhanced card products during 2015, including the American Express Essential™ Credit Card in Australia and the BlueCash® Credit Card from American Express in Hong Kong. We offer many of the same programs and services in ourinternational proprietary card-issuing business as we do in our U.S. proprietary issuing business. Also, as in the UnitedStates, we issue cards internationally under distribution agreements with financial services institutions. Anotherexample of our distribution partnerships is affinity cards with fraternal, professional, educational and otherorganizations. For instance, we have been successful in penetrating the affinity card segment in Australia, where weissue cards with some of the largest professional associations in that country. In Australia, affinity cards are asignificant part of our consumer lending portfolio.
As in the United States, the Membership Rewards program is a strong driver of Card Member spending in theinternational consumer business. Our redemption options include travel, retail merchandise, entertainment, shoppingand recreation gift certificates, experiences, financial services and donations to benefit charities. In 2015, wecontinued to enhance our rewards programs. We provided more flexibility in the way Card Members can use theirrewards points by upgrading our capabilities in certain countries to allow Card Members to use rewards to pay foreligible transactions on the Card Member’s statement as well as at the point of sale in select retail locations in storeand online. We also offer the opportunity to pay for travel services by allowing International Consumer Card Membersto use their Membership Rewards points to pay for their travel purchases and other charges in 19 countries outside theUnited States.
We continue to build on our strengths and look for further opportunities to increase our presence internationally.Through Loyalty Partner, our marketing services company, we build coalition loyalty programs, such as the Payback®
program, and offer loyalty cards good for discounts and rewards at participating coalition partners. Loyalty Partneroperates the Payback program in Germany, India, Italy, Mexico and Poland. Loyalty Partner also provides marketanalysis, operating platforms and consulting services that help merchants grow their businesses. Using these services,participating merchants are able to run targeted and tailored campaigns across various channels. Loyalty Partner hasdeepened our merchant relationships in certain countries, added consumers to our international customer base andexpanded our range of rewards and loyalty marketing services. It also provides us opportunities to offer AmericanExpress products and services to new customer segments and develop new cobrand card products, such as thePayback cobrand card products in Germany, India, Italy and Mexico.
International Card Services — CompetitionCompared with the United States, consumers outside the United States use general-purpose charge and credit cards
for a smaller percentage of their total payments, with some large emerging-market countries only just beginning totransition to card usage in any meaningful way. Although our geographic scope is widespread, we generally do not havesignificant share of spend on general-purpose charge, credit and debit cards in the countries in which we operateinternationally. Our proprietary card-issuing business is subject to competition from multinational banks, such as BancoSantander, Citibank and HSBC, as well as many local banks and financial institutions.
10

International Card Services — RegulationAs discussed elsewhere in this report, regulators continued to propose and enact a variety of new regulatory
changes to the payments industry during the course of 2015.
In Europe, the EU continued in its efforts to work towards greater harmonization on a number of fronts, inparticular in relation to payments, AML, consumer rights, data protection and information security. These pan-European initiatives have been supplemented by a broad range of consumer protection and transparency initiatives atan individual Member State level.
In countries outside Europe, we have seen regulators initiate new regulations in relation to a number of keythemes, particularly responsible lending (such as Australia, Mexico, New Zealand and Singapore), privacy and dataprotection (such as Australia, Canada, Mexico and Singapore), fairness and financial crime.
Regulators in a number of countries are shifting their focus from just ensuring compliance with local rules andregulations towards paying greater attention to the product design and operation with a focus on customers andoutcomes. Regulators’ expectations of firms in relation to their compliance, risk and control frameworks continue toincrease and regulators are placing significant emphasis on a firm’s systems and controls relating to the identificationand resolution of issues. We have also seen a further increase in regulatory focus on consumer protection, with anumber of regulators (such as those in the United Kingdom and Canada) being given a stronger mandate in this area.
We expect this activity to continue in 2016. We continue to evaluate our business planning in light of changingmarket circumstances and the evolving political, economic and regulatory environments.
GLOBAL COMMERCIAL SERVICES
In our GCS segment, we offer a wide range of payments and expense management solutions to large and mid-sized companies and organizations worldwide. GCS also offers a variety of business travel-related services to itscorporate clients through the GBT JV, including: full-service online and offline travel booking and reservation servicesand support; travel program management services; consulting services; and meetings and events managementservices. Until June 30, 2014, the business travel operations were wholly owned. For more information on the GBT JVtransaction, see Note 2 to our Consolidated Financial Statements.
Corporate Card ProgramsThe American Express® Corporate Card is a charge card that individual employees may obtain through a
corporate account established by their employer for business purposes. Through our corporate card program,companies can manage their travel, entertainment and everyday business expenses. We use our closed-loop anddirect relationships with merchants to offer corporate card clients enhanced data about company spending as well asthe ability to efficiently manage and resolve disputes. We issue local currency corporate cards in more than 65countries and territories, and have global U.S. dollar and euro corporate cards available in more than 100 countriesand territories.
We are focused on continuing to expand our business with mid-sized companies (defined in the United States asfirms with annual revenues of $10 million to $1 billion worldwide), which we believe represents a significant growthopportunity. Businesses of this size often do not have a corporate card program; however, once enrolled, mid-sizedcompanies typically put a significant portion of their business spending on the corporate card because they areseeking greater control over their business expenses and the potential savings and employee benefits that can result.
Corporate Card Members can also take advantage of our Membership Rewards program to earn points that canbe redeemed for air travel and hotel stays, as well as retail, home and recreation items. In select regions we also offerCorporate Membership Rewards that allows a company to earn points to redeem for enterprise-level rewards.Membership Rewards is an effective tool for encouraging corporate card usage.
Business-to-Business Payment SolutionsWe offer a suite of business-to-business payment solutions to help companies manage their spend and recognize
other potential benefits, including cost savings, process control and efficiency, improved cash flow and increasedvisibility on spend. This type of spending by companies also helps diversify our spend mix. Our corporate purchasingcard helps large corporations and mid-sized companies manage their everyday spending. It is used to pay for everydayand large-ticket business expenses, such as office supplies, industrial supplies and business equipment. We issue localcurrency corporate purchasing cards in 25 countries.
vPayment, which offers companies single-use virtual account numbers, allows corporate clients to makepayments with enhanced controls, data capture and reconciliation capabilities. Charges are authorized for a specifiedamount during a designated time window. The solution automates reconciliation, eliminates manual check requests
11
and interfaces with a client’s enterprise resource planning, procurement and accounts payable systems. vPaymentcan be used as the form of payment throughout the stages of a typical procure-to-pay process.
Buyer Initiated Payments (“BIP”) allows companies to pay merchants electronically, which gives them morecontrol over their payments, extends their own days payable outstanding (or “float”) and increases their cash on hand.Examples of BIP purchases by our clients include hospital equipment, industrial supplies, and construction andbuilding materials. This solution is best suited for mid- to large-sized companies that want to convert from paper toelectronic payments and optimize cash flow. BIP is currently available to companies in Australia, Canada, France,Germany, Mexico, the Netherlands, Spain, the United Kingdom and the United States.
Global Commercial Services — CompetitionThe corporate payments sector is dynamic and highly competitive, with much overlap between corporate and
consumer payment cards and services and competition increasingly intense at both the payment provider andnetwork levels. We are seeing increased product and price competition from payment providers, including largerregional and national banks. Customers are increasingly seeking payment products that integrate with their expensemanagement tools and support electronic payment methods. With respect to competition at the network level, bothVisa and MasterCard continue to support card issuers such as Citibank, JPMorgan Chase and U.S. Bank, including byimproving data collection and reporting to meet customers’ requirements. In addition to product and pricecompetition, other key competitive factors in the corporate payments business include global servicing capability,merchant coverage, quality of data, and access to additional services, such as reporting and program managementtools, and customer experience.
Global Commercial Services — RegulationThe GCS business, which engages in the extension of commercial credit, is subject to more limited regulation than
our consumer lending business. In the United States, we are subject to certain of the federal and state laws applicableto our consumer lending business, including the Equal Credit Opportunity Act, the FCRA (as amended by the FACTAct), as well as laws that generally prohibit engaging in unfair or deceptive acts or business practices. We are alsosubject to certain state laws that regulate fees and charges on our products. In the United States, we are subject tocertain applicable privacy, data protection and information security laws, including certain requirements related tobreach notification. Such laws also govern the collection, use, sharing and safeguarding of personal information. Othercountries in which we operate also have certain applicable privacy, data protection and information security laws, insome cases more stringent than the requirements in the United States. We are also subject to bankruptcy and debtorrelief laws that can affect our ability to collect amounts owed to us. As discussed above, along with the rest of ourbusiness, we are subject to certain provisions of the Bank Secrecy Act as amended by the Patriot Act, with regard tomaintaining effective AML programs. For a discussion of this legislation and its effect on our business, see“Supervision and Regulation.” In some countries, regulation of card practices and consumer protection legislation mayapply to some corporate payments relationships.
GLOBAL NETWORK & MERCHANT SERVICESThe GNMS segment operates a global payments network that processes and settles proprietary and non-
proprietary card transactions. GNMS acquires merchants, provides financing products for qualified merchants andleverages our closed-loop network to offer multi-channel marketing programs and capabilities, services, and reportingand analytical data to our merchants around the world. It also enters into partnership agreements with third-party cardissuers and acquirers to license the American Express brand and broaden the Card Member and merchant base forour network worldwide.
Our GNS business establishes and maintains relationships with banks and other institutions around the world thatissue cards and, in certain countries, acquire local merchants on the American Express network. Cards bearing ourlogo are accepted at all merchant locations worldwide that accept American Express-branded cards and, dependingon the product, are generally accepted at ATM locations worldwide that accept our cards.
Our Global Merchant Services (“GMS”) business provides us with access to transaction and merchant datathrough our closed-loop network, which encompasses relationships with Card Members, merchants and merchantacquirers and processors. This capability helps us acquire new merchants, deepen relationships with existingmerchants, process transactions, underwrite risk, reduce fraud and provide targeted marketing, analytics and othervalue-added services to merchants on our network. In addition, it allows us to analyze trends and spending patternsamong various segments of our customer base.
Global Network ServicesGNS focuses on partnering with select third-party banks and other institutions to issue cards and, in some
countries, act as merchant acquirers on the American Express network. By leveraging our global infrastructure andthe appeal of the American Express brand, we broaden our Card Member and merchant bases for our networkworldwide. This strategy also enables us to enhance our presence in countries where we already do business and
12
expand our presence into new geographic areas generally without assuming additional Card Member credit risk orhaving to invest a large amount of resources, as our GNS partners already have established attractive customer basesand are responsible for managing the credit risk associated with the cards they issue.
In assessing whether we should pursue a proprietary or GNS strategy in a given country, or some combinationthereof, we consider a wide range of country-specific factors, including the stability and attractiveness of financialreturns, the size of the potential Card Member base, the strength of available marketing and credit data, the size ofcobrand opportunities and how we can best create strong merchant value.
Although we customize our network arrangements to the particular country and each partner’s requirements, aswell as to our strategic plans in that marketplace, all GNS arrangements are designed to help issuers develop productsthat are relevant and attractive to their customers and to support the value of American Express card acceptance tomerchants. We choose to partner with institutions that share a core set of attributes compatible with the AmericanExpress brand, such as commitment to high quality standards and strong marketing expertise, and we requireadherence to our product, brand and service standards.
The GNS business has established 158 card-issuing and/or merchant-acquiring arrangements with banks andother institutions in 141 countries. Since 1999, cards-in-force issued by GNS partners have grown at a compoundannual growth rate of approximately 20 percent, totaling over 47 million cards at the end of 2015. Outside the UnitedStates, approximately 80 percent of new cards issued in 2015 were cards issued by GNS partners. Spending on GNScards has grown at a compound annual rate of 21 percent since 1999, with spending on these cards totaling $166billion in 2015, up 3 percent from a year ago. With the total number of American Express-branded GNS partnerproducts standing at over 1,350, GNS strengthens our brand visibility around the world, drives more transactionvolume onto our merchant network and increases the number of merchants choosing to accept the American Expresscard.
GNS Arrangements
Although the structures and details of each of the GNS arrangements vary, all of them generate revenues for usfrom the card transaction volumes they drive on the American Express network. Gross revenues we receive per dollarspent on a card issued by a GNS partner are generally lower than those from our proprietary card-issuing business.However, because the GNS partner is responsible for most of the operating costs and risk of its card-issuing business,our operating expenses and credit losses are generally lower than those in our proprietary card-issuing business. TheGNS business model generates an attractive earnings stream and risk profile that requires a lower level of capitalsupport. The return on equity in our GNS business can thus be significantly higher than that of our proprietary card-issuing business. In addition, since the majority of GNS costs are fixed, the business is scalable. GNS partners benefitfrom their association with the American Express brand and their ability to gain attractive revenue streams andexpand and differentiate their product offerings with innovative marketing programs.
Our GNS arrangements fall into the following three main categories: Independent Operator Arrangements,Network Card License Arrangements and Joint Venture Arrangements.
Independent Operator Arrangements. The first type of GNS arrangement is known as an independent operator(“IO”) arrangement. As of the end of 2015, we had 71 of these arrangements around the world. We pursue thesearrangements to expand the presence of the American Express network in countries in which we do not offer aproprietary local currency card. The partner’s local presence and relationships help us enhance the impact of ourbrand in the country, reach merchant coverage goals more quickly, and operate at economic scale and cost levels thatwould be difficult for us to achieve on our own. Subject to meeting our standards, IO partners are licensed to issuelocal currency cards in their countries, including the American Express® classic Green, Gold, Platinum and Centurioncards. In addition, most of these partners serve as the merchant acquirer and processor for local merchants.American Express retains the relationship with multinational merchants. Our IO partners make the decisions aboutwhich customers will be issued cards, own the customer relationships and bear the credit and fraud risk for theAmerican Express cards they issue. GNS generates revenues in IO arrangements from card licensing fees,commissions on Card Member billings, foreign exchange conversion revenue, commissions on charge volume atmerchants, share of discount revenue and, in some partnerships, commissions on net interest income or commissionson cards-in-force. Our IO partners are responsible for transaction authorization, billing and pricing, Card Member andmerchant servicing, and funding card receivables for their cards and payables for their merchants.
We bear the credit risk arising from the IO partner’s potential failure to meet its settlement obligations to us. Thisexposure arises when their Card Members make purchases at merchants on the American Express network or use thecard for cash advances at ATMs and we submit such transactions to the IO partner for settlement. We mitigate thisrisk by partnering with institutions we believe are financially sound and will meet their obligations, and by monitoringtheir financial health, their compliance with the terms of their relationship with us and the political, economic andregulatory environment in which they operate. In addition, depending on an IO partner’s credit rating and otherindicators of financial health, we may require an IO partner to post a letter of credit, bank guarantee or other collateralto reduce this risk.
13

Examples of countries where we have entered into IO arrangements include Brazil, Colombia, Indonesia, Malaysia,Peru, Russia, South Africa, South Korea, Turkey and Vietnam. Through our IO partnerships, we believe we canaccelerate growth in Card Member spending, cards-in-force and merchant acceptance in these countries.
Network Card License Arrangements. The second type of GNS arrangement is known as a network card license(“NCL”). At the end of 2015, we had 83 of these arrangements in place worldwide. We pursue these arrangements toincrease our brand presence and gain share in countries in which we have a proprietary card-issuing and/or merchantacquiring business and, in a few cases, those in which we have IO partners. In an NCL arrangement, we grant the third-party institution a license to issue American Express-branded cards. The NCL issuer owns the customer relationshipsfor all cards it issues, provides customer service to its Card Members, authorizes transactions, manages billing andcredit and designs card product features (including rewards and other incentives for Card Members), subject tomeeting certain standards. The NCL issuer bears the credit and fraud risk for the issued cards, marketing andacquisition costs, and costs of rewards and other loyalty initiatives. We (or an IO partner) operate the merchantnetwork, route and process card transactions from the merchant’s point of sale through submission to the issuer, andsettle with issuers.
Our revenues in NCL arrangements are driven by a variety of factors, including the level of Card Memberspending, commissions, currency conversions and licensing fees paid by the NCL issuer and fees charged to the NCLissuer based on charge volume, plus the value-added services such as card features and benefits we provide for theNCL issuer’s Card Members. As with IO arrangements, we bear the risk arising from the NCL issuer’s potential failureto meet its settlement obligations to us, and, as a result, engage in similar monitoring and risk mitigation activities asdescribed above.
Examples of NCL arrangements include our relationships with Wells Fargo and U.S. Bank in the United States,Santander in Mexico, Minsheng Bank in China and NOVO BANCO in Portugal.
Joint Venture Arrangements. The third type of GNS arrangement is a joint venture (“JV”) arrangement. We haveutilized this type of arrangement in Switzerland, as well as in other countries. In these countries, we join with a thirdparty to establish a separate business in which we have a significant ownership stake. The JV typically signs newmerchants to accept cards on the American Express network and issues local and U.S. dollar-denominated currencycards that carry our logo. In a JV arrangement, the JV bears the credit and fraud risk for the American Express cards itissues and is responsible for the operating and marketing costs. Unlike the other two types of GNS arrangements, weshare management, risk, and profit and loss responsibility with our JV partners. Income is generated by discountrevenues, card fees and net interest income. The economics of the JV are similar to those of our proprietary card-issuing business, which we discuss under “U.S. Card Services,” and we receive a portion of the JV’s income dependingon, among other things, the level of our ownership interest. Our subsidiary, American Express Overseas CreditCorporation Limited, purchases card receivables from certain of the GNS JVs from time to time.
Global Merchant ServicesOur GMS business builds and maintains relationships with merchants and merchant acquirers and processors,
processes card transactions and settles with merchants that choose to accept cards for purchases. We signmerchants to accept cards and provide marketing information and other programs and services to merchants,leveraging the capabilities provided by our closed-loop network. We also offer support for card acceptance, fraudprevention and other value-added services.
Our objective is for Card Members to be able to use the card wherever and however they desire, and to increasemerchant acceptance in key geographic areas, industries and businesses that have not traditionally accepted the card.We add new merchants to our network through a number of sales channels: an in-house sales force; third-party salesand service agents; third-party acquirers; aggregators; strategic alliances with banks and processors; the internet;telemarketing; and inbound “Want to Honor” calls (i.e., where merchants desiring to accept our card contact usdirectly). As discussed in the “Global Network Services” section, our IO partners and JVs also add new local merchantsto the American Express network.
With our direct and inbound channels, we acquire the merchant, own the contract, agree with the merchant on thediscount rate and handle servicing. Since 1995, we have worked with third-party acquirers to acquire small- and medium-sized merchants using several different models. External sales agents, for example, acquire the merchant on our behalf,while we retain the card acceptance agreement with participating merchants, agree on the discount rate and handleservicing. In 2014, we established a new merchant-acquiring program, OptBlue, to expand card acceptance by U.S. smallmerchants that have a projected American Express charge volume of less than $1 million per year. In the OptBlue®
program, third-party acquirers or processors contract directly with merchants for card acceptance and determinemerchant pricing. The OptBlue program provides an alternative for eligible small merchants who may prefer to deal withone acquirer for all their card acceptance needs. OptBlue acquirers provide relevant merchant data back to us so we canmaintain our closed loop of transaction data. In 2015, we announced the launch of OptBlue in Canada.
GMS continues to expand the number of merchants that accept our cards as well as the kinds of businesses thataccept the card in order to address Card Member needs. For example, 40 percent of our U.S. billings came from the
14

travel and entertainment sectors in 2001 and 60 percent came from retail and other sectors. In 2015, only 26 percentof U.S. billings came from the travel and entertainment sectors. This shift resulted, in part, from the growth, over time,in the types of merchants that began to accept payment cards in response to consumers’ increased desire to usethese cards for more of their purchases, our focus on expanding card acceptance to meet Card Members’ needs, andincreased competition for travel and entertainment sector spending.
Globally, acceptance of general-purpose cards continues to increase and we continue to grow merchant acceptanceof American Express cards around the world, as well as refine our approach to calculating merchant coverage. Weestimate that, as of the end of 2015, our merchant network in the United States could accommodate more than 90percent of general-purpose card spending. Our international spend coverage is more limited, although we continue toexpand our merchant network in locations outside the United States. We estimate that our international merchantnetwork as a whole could accommodate approximately 80 percent of general-purpose card spending. Thesepercentages are based on comparing spending on all networks’ general-purpose credit and charge cards at merchantsthat accept American Express cards with total general-purpose credit and charge spending at all merchants.
Discount Revenue
We earn “discount” revenue from fees charged to merchants for accepting our cards as payment for goods orservices sold. The merchant discount, or discount rate, is a fee charged to the merchant for accepting our cards and isgenerally expressed as a percentage of the charge amount. In some instances, an additional flat transaction fee isassessed as part of the merchant discount. The merchant discount is generally deducted from the amount of thepayment that the merchant acquirer (in most cases, one of our subsidiaries) pays to a merchant for chargessubmitted. A merchant acquirer is the entity that contracts for American Express card acceptance with the merchant,accepts transactions from the merchant, pays the merchant for these transactions and submits the transactions tothe American Express network, which in turn submits the transactions to the appropriate card issuer. When a CardMember presents our card for payment, the merchant creates a record of charge for the transaction and submits it tothe merchant acquirer for payment. To the extent that we are the merchant acquirer, we record the merchant discountas discount revenue at the time we receive the transaction. We may also charge additional fees to merchants, such asa variable fee for “non-swiped” card transactions or for transactions using cards issued outside the United States andused at merchants located in the United States.
Where we act as the merchant acquirer and the card presented at a merchant is issued by a third-party bank orfinancial institution, such as in the case of our GNS partners, we will make financial settlement to the merchant andreceive the discount revenue. In our role as the operator of the card network, we will also receive financial settlementfrom the GNS card issuer, which in turn receives an issuer rate that is individually negotiated between the issuer andus (i.e., the amount the GNS card issuer receives for a transaction on our network with a card they issue — usuallyexpressed as a percentage of the charge amount). The difference between the merchant discount received by us fromthe merchant (which is directly agreed between a merchant and us and is not based on the issuer rate) and the issuerrate received by the GNS card issuer generates a return to us. In cases where American Express is the card issuer andthe merchant acquirer is a third party (which can be the case in a country in which an IO partner is the local merchantacquirer or in the United States under our OptBlue program with certain third-party merchant acquirers), we receive anetwork rate in our settlement with the merchant acquirer, which is individually negotiated between us and themerchant acquirer and is recorded by us as discount revenue. In contrast with networks such as those operated byVisa and MasterCard, there are no collectively set interchange rates on the American Express network, issuer rates donot serve as a basis for merchant discount rates and no fees are agreed or due between third-party bank or financialinstitution participants on the network.
We work hard to persuade merchants to choose to accept our payment products in addition to those of ourcompetitors. As such, we compete on our ability to innovate and deliver meaningful value to merchants to justify thecost of acceptance. The merchant discount we charge reflects the value we deliver to the merchant and theinvestments we make in providing that value. We deliver greater value to merchants as compared to our competitorsin a variety of ways, including through higher spending by our Card Members relative to users of cards issued oncompeting card networks, our product and network features and functionality, our marketing expertise and programs,information services, fraud prevention services, our dedicated client management group, and other investments thatenhance the merchant value propositions associated with American Express card acceptance.
The merchant discount varies with, among other factors, the industry in which the merchant does business, themerchant’s charge volume, the timing and method of payment to the merchant, the method of submission of charges and,in certain instances, the geographic scope of the card acceptance agreement signed with us (e.g., local or global) and thecharge amount. In the United States and Canada, we charge a different discount rate for our prepaid cards. We may alsocharge a different discount rate for our corporate purchasing cards if the merchant meets certain requirements.
While we believe merchants that accept our cards understand our merchant discount pricing in relation to thevalue provided, we do encounter merchants that accept our cards, but tell their customers that they prefer to acceptanother type of payment or otherwise seek to suppress use of the card. Our Card Members value the ability to usetheir cards where and when they want to, and we, therefore, take steps to meet our Card Members’ expectations andto protect the American Express brand, subject to local legal requirements, such as Dodd-Frank in the United States.
15

We make efforts to limit card suppression by focusing on acquiring merchants where Card Members want to use ourcard; continuing to enhance the value we provide to merchants through marketing programs such as our SmallBusiness Saturday® and Shop Small® campaigns to encourage Card Members and other consumers to shop at smallmerchants; addressing factors that influence merchant satisfaction; and providing earlier and more frequentcommunication of our value proposition. We have a client management organization dedicated to growing ourmerchants’ businesses and finding ways to enhance the effectiveness of our relationships with these key businesspartners. Most importantly, we recognize that it is the merchant’s choice whether or not to accept American Expresscards and that all merchants have numerous options given the intense competition from other card networks withlarger cardholder bases and from new as well as traditional forms of payment. Therefore, we dedicate substantialresources to delivering superior and differentiated value to attract and retain merchants on our network.
The laws of a number of states in the United States prohibit the surcharging of credit card purchases, although thelaws in four of these states (California, Florida, New York and Texas) are being challenged in litigation brought bymerchant groups. Conversely, there are certain countries in which surcharging is specifically permitted, such asAustralia. Where permitted by local law, our card acceptance agreements generally include a provision under whichthe merchant agrees not to discriminate against our cards, such as by surcharging higher amounts on purchases withour cards than on purchases with any other cards the merchant accepts or by imposing a surcharge only on AmericanExpress card purchases, but not on purchases made with other cards. We do not prohibit merchants from offeringdiscounts to customers who pay with cash, check or inter-bank transfers (i.e., Automated Clearing House or “ACH”).In addition, we do not prohibit U.S. merchants from offering discounts or in-kind incentives to customers who pay withparticular forms of payment in accordance with the provisions of Dodd-Frank.
Enhancing Merchant Satisfaction
GMS is focused on understanding and addressing factors that influence merchant satisfaction, includingdeveloping and executing programs that increase the usage of American Express cards at merchants, usingtechnology resources and innovative marketing tools such as social media, and applying our closed-loop capabilitiesand deep marketing expertise. Our closed-loop network and other relationships allow us to analyze merchant data andinformation on Card Member spending. This enables us to offer a range of targeted marketing services, networkcapabilities and special offers for the benefit of merchants and Card Members through a variety of channels. At thesame time, we protect the confidentiality of Card Member and merchant information in compliance with applicableprivacy, data protection and information security laws, other applicable legal requirements and our internal policies.We also work closely with our card-issuing and merchant-acquiring partners to maintain the information that supportskey elements of this closed loop, providing value to Card Members and merchants.
For example, we connect merchants and Card Members through Amex Offers, a centralized portal that providesCard Members with merchant offers. Card Members can access these offers on their online account and mobile appand redeem them for couponless savings, reflected as statement credits. Amex Offers can help merchants attract newcustomers and generate repeat business by targeting relevant offers to Card Members. In 2015, we launched AmexOffers in the UK and Australia.
We offer fraud prevention services to merchants for transactions on the American Express network, and oursubsidiary, Accertify, Inc., is a leading provider of solutions that help merchants combat fraudulent online and othercard-not-present transactions. Accertify provides a hosted software application that offers an extra level of securityfor transactions on any of the major payment networks, including American Express, Visa, MasterCard, Discover andPayPal, or using any other alternative payment method. Accertify also offers merchants the option to outsource theirend-to-end fraud management process to Accertify and provides other value-added services.
We also offer Merchant Financing, a set of products providing qualified American Express accepting merchants withaccess to convenient, attractively priced fixed-fee financing to support their business needs. The financing offered is acommercial loan, repaid automatically through the merchant’s daily charge submissions or business bank account.
We continue to focus our efforts in areas that make use and acceptance of our cards more secure and convenientfor merchants and Card Members. We participate in standard-setting bodies, such as EMVCo and PCI SecurityStandards Council, LLC, designed to help drive secure and interoperable payments globally. Our goal is to make iteasier for merchants to accept our cards, for Card Members to have safe and seamless experiences at the point ofsale, and for issuers and acquirers that have more than one network relationship to have uniform technologystandards across their card products and platforms. These efforts are particularly important as emerging technologiesenabled on contactless cards, mobile phones and new payment devices offer consumers new, convenient ways to payfor their purchases.
Billing Disputes
As the merchant acquirer, we have certain exposures that arise if a billing dispute between a Card Member and amerchant is settled in favor of the Card Member. Drivers of this liability are returns in the normal course of business,disputes over fraudulent charges, the quality or non-delivery of goods and services, and billing errors. Typically, weoffset the amount due to the Card Member against payments for the merchant’s current or future charge
16

submissions. We can realize losses when a merchant’s offsetting charge submissions cease, such as when themerchant decides to no longer accept our card or goes out of business. We monitor our merchant base to assess therisk of this exposure. When appropriate, we will take action to reduce the net exposure to a given merchant byestablishing reserves of charge payable holdbacks from a merchant, lengthening the time between when the merchantsubmits a charge for payment and when we pay the merchant, requiring the merchant to secure a letter of credit or aparent company guarantee, or implementing other appropriate risk management tools. We also establish reserves onour balance sheet for these contingencies in accordance with relevant accounting rules.
Global Network & Merchant Services — CompetitionOur global card network competes in the global payments industry with other card networks, including, among
others, Visa, MasterCard, Discover (primarily in the United States), Diners Club International (which is owned by DiscoverFinancial Services) and JCB and China UnionPay (primarily in Asia). We are the fourth largest general-purpose cardnetwork on a global basis based on purchase volume, behind China UnionPay, Visa and MasterCard. In addition to suchnetworks, a range of companies globally, including merchant acquirers and processors and companies such as PayPal,carry out some activities similar to those performed by our GMS and GNS businesses. No other single entity engages on aglobal basis in the full range and scale of activities that are encompassed by our closed-loop business model.
The principal competitive factors that affect the network and merchant service businesses include:
• The number of cards-in-force and amount of spending on those cards
• The quantity, diversity and quality of the establishments where the cards can be used
• The economic attractiveness of the network to card issuers, cardholders and merchants
• The success of marketing and promotional campaigns
• Reputation and brand recognition
• Innovation and investment in systems, technologies and product and service offerings
• The quality of customer service
• The payments industry expertise and capabilities that can be provided to partners in areas such as customerservicing, loyalty, fraud prevention and data analytics
• The security of cardholder and merchant information
• The impact of court orders and litigation settlements, ongoing litigation, legislation and government regulation
Another aspect of network competition is the dynamic and rapid growth of alternative payment mechanisms andsystems, which include aggregators (such as PayPal, Square and Amazon), wireless payment technologies (includingusing mobile telephone networks to carry out transactions), electronic wallet providers (including handsetmanufacturers, retailers, banks and technology companies), prepaid systems and systems linked to payment cards,and bank transfer models such as ACH and wire transfers. Partnerships are also being formed to create variouscompetitors, such as merchant coalitions like the Merchant Customer Exchange. New payments competitors continueto emerge in response to evolving consumer habits and merchant needs.
New technologies and evolving consumer behavior are rapidly changing the way people interact with each otherand transact business all around the world. Traditional and non-traditional competitors such as technologycompanies, telecommunication providers and aggregators are working to deliver digital and mobile payment servicesfor both consumers and merchants. Competition remains fierce for obtaining and retaining online and mobile spend inthe ever-increasing digital world. Alternative business models represent potentially disintermediating factors in thecard payment industry and new entrants to the digital payments space may have large cash reserves and otherresources available to develop new platforms and technologies, large existing customer bases and the ability to usepayments as a tool to support other sources of revenue. To the extent alternative payment mechanisms and systems,such as aggregators, continue to expand successfully, discount revenues and potentially other revenues, as well as ourability to access transaction data and conduct merchant marketing through our closed-loop network, could benegatively impacted. In the United States, alternative payment vehicles that seek to redirect customers to paymentsystems based on ACH continue to emerge and grow, merchants with recurring billing models actively seek to switchcustomers to payment through direct debits from bank accounts, and existing debit networks also continue to expandboth on- and off-line and are making efforts to develop online PIN functionality, which could further reduce the relativeuse of charge and credit cards online.
Some of our competitors have attempted to replicate our closed-loop functionality. For example, JPMorgan Chaselaunched ChaseNet, a merchant-processing platform developed with Visa. Efforts by some card networks, paymentproviders and non-traditional competitors to replicate the closed loop reflect both its continued value and the intenselycompetitive environment in which we operate.
Some third-party processors and acquirers offer merchants the capability of converting payment cardtransactions from the local currency to the currency of the cardholder’s residence (i.e., the cardholder’s billing
17

currency) at the point of sale, and submitting the transaction in the cardholder’s billing currency, thus bypassing thetraditional foreign currency conversion process of the card network. Some merchants also offer this option tocustomers. This practice is known as “dynamic currency conversion.” Our policy generally requires merchants tosubmit charges and be paid in the currency of the country in which the transaction occurs, and we convert thetransaction to the Card Member’s billing currency.
In addition to the discussion in this section, see “Our operating results may suffer because of substantial andincreasingly intense competition worldwide in the payments industry” in “Risk Factors” for further discussion of thepotential impact of competition on our business, and “Ongoing legal proceedings regarding provisions in our merchantcontracts could have a material adverse effect on our business, result in additional litigation and/or arbitrations, subjectus to substantial monetary damages and damage to our reputation and brand” in “Risk Factors” for a discussion of thepotential impact on our ability to compete effectively if ongoing legal proceedings limit our ability to preventmerchants from engaging in various actions to discriminate against our card products.
Global Network & Merchant Services — RegulationLegislators and regulators in various countries in which we operate have focused on the operation of card
networks, including through antitrust actions, legislation and rules that would or do impose changes on pricing orpractices of card issuers, merchant acquirers and payment networks, and the establishment of broad and ongoingregulatory oversight regimes for payment systems. Regulators and legislators have focused on the fees merchantspay to accept cards, including the way bankcard network members collectively set the “interchange” (that is, the feepaid by the bankcard merchant acquirer to the card issuer in payment networks like Visa and MasterCard), as well asthe rules, contract terms and practices governing merchant card acceptance. Although, unlike the Visa andMasterCard networks, the American Express network does not have interchange fees or collectively set fees or rules,antitrust actions and government regulation relating to merchant pricing or terms of merchant rules and contractscould affect all networks directly or indirectly, as well as adversely impact consumers and merchants. Among otherthings, lower interchange and/or merchant discount revenue may lead card issuers to look for other sources ofrevenue from consumers such as higher annual card fees or interest charges, as well as to reduce costs by scalingback or eliminating rewards, services or benefits to cardholders and merchants.
In certain countries where regulations have required our competitors to lower their fees, we have madeadjustments to our pricing to merchants to reflect local competitive trends. For example, reductions in bankcardinterchange mandated by the Reserve Bank of Australia in 2003 resulted in lower merchant discount rates for Visaand MasterCard acceptance. As a result of these regulation-driven changes in the marketplace, we reduced our ownmerchant discount rates in Australia over time, although we have been able to increase billed business and the numberof merchants accepting our cards. We have also experienced selective, but increasing, merchant surcharging on ourcards in certain industries and, in some cases, on a basis that is greater than that applied to cards issued on thebankcard networks, which is known as differential surcharging. The Australian surcharging standards allow us andother networks to limit merchant surcharges to “the reasonable cost of card acceptance.” This could lead todifferential surcharging of American Express cards if a surcharging merchant takes the position that the cost ofAmerican Express acceptance is higher than that of other payment cards.
Following a formal review of the regulatory framework for card payments in Australia, the Reserve Bank ofAustralia published a consultation paper on December 3, 2015, proposing new regulations, including the following:
• The inclusion of our GNS business in Australia under interchange regulation, which would subject GNSpayments to bank partners to the same interchange caps that apply to Visa and MasterCard in Australia
• Broadening interchange fee caps to include all amounts payable to card issuers in regulated payment systemsas well as other payments to card issuers across both three- and four-party card payment networks
• Introducing a maximum interchange fee cap, increasing the frequency of periodic weighted-average benchmarkcalculations and including all transactions at Australian merchants in benchmark calculations (therebycapturing foreign-issued cards, which had previously been excluded)
• Changing the rules on merchant surcharging to limit surcharging to the actual costs of card acceptance paid tothe merchant acquirer, as recorded on the merchant statement issued by the merchant acquirer
Responses to the consultation paper were due by February 3, 2016. We do not expect any changes to take effectbefore mid-2016.
In the European Union, the Payment Services Directive (“PSD”), adopted in 2007 and subsequently implementedby EU Member States, prescribes common rules across the EU for licensing and supervision of payment servicesproviders, including card issuers and merchant acquirers, and for their conduct of business with customers. Theobjective of the PSD is to facilitate the operation of a single internal payments market in the EU through harmonizationof EU Member State laws governing payment services. One provision of the PSD permits merchants to surcharge,subject to disclosure requirements, but also allows individual Member States to override this rule by prohibiting orlimiting surcharging. To date, the Member States are split on whether they prohibit or permit surcharging, withcountries such as the United Kingdom (which for a number of years has permitted it for credit card purchases), the
18

Netherlands and Spain permitting it and other countries such as France, Italy and Sweden prohibiting it. All MemberStates permit merchants to offer discounts for particular forms of payment.
The PSD has complemented another European initiative, the Single Euro Payments Area (“SEPA”), which is anindustry-led initiative with support from EU institutions. Among other changes, SEPA has involved the adoption of new,pan-European technical standards for card transactions and the introduction of new direct debit and credit transfersystems, which we can use for collecting and initiating payments with Card Members, merchants and othercounterparties. Compliance with the PSD, SEPA and related requirements has involved significant costs to implementand maintain. In addition, the Consumer Rights Directive (“CRD”) prohibits merchants from surcharging cardpurchases more than the merchants’ cost of acceptance in those Member States that permit surcharging pursuant tothe PSD. The CRD provides no guidance to merchants on how to assess the cost of acceptance or take into accountthe relative value of different payment methods. A cost-based limit on surcharging could result in merchants imposinghigher surcharges on American Express transactions if, in the absence of clear guidance, a surcharging merchant tookthe position that the cost of American Express acceptance is higher than other payment cards. These elements of theCRD may be superseded by proposals now under consideration as part of the EU Payments Package discussed above.
In July 2013, the European Commission (the “Commission”) proposed legislation in two parts, covering a widerange of topics across the payments industry. The first part was a proposed EU-wide regulation on interchange fees(the “Interchange Fee Regulation”); the second consisted of revisions to the PSD (the “PSD2”).
The Interchange Fee Regulation was formally adopted in April 2015. The substantive terms as adopted include thefollowing:
• Price caps — Interchange fees on consumer card transactions in the EU are capped as of December 2015,generally at 20 basis points for debit and prepaid cards and 30 basis points for credit and charge cards, with thepossibility of lower caps in some instances. Although we do not have interchange fees and “three-party”networks such as American Express are exempt from the application of the caps, the regulation provides that“three-party” networks should be treated as “four-party” networks (such as Visa and MasterCard, which haveinterchange fees) when they license third-party providers to issue cards and/or acquire merchants or whenthey issue cards with a cobrand partner or through an agent. This means, for example, the caps will apply toelements of the financial arrangements agreed to between us and each of our GNS partners in the EU, whichmay undermine our ability to attract and retain GNS partners. While the discount rates we agree to withmerchants are not capped, the interchange caps have exerted, and will likely continue to exert, downwardpressures on merchant fees across the industry, including our discount rates. The Interchange Fee Regulationexcludes commercial card transactions from the scope of the caps.
• Card acceptance terms —“Anti-steering” and honor-all-cards rules across all card networks, including non-discrimination and honor-all-cards provisions in our card acceptance agreements, are prohibited with someexceptions. Removal of these provisions creates significant risk of customer confusion and Card Memberdissatisfaction, which would result in harm to the American Express brand. The prohibition on “anti-steeringrules” took effect immediately upon effectiveness of the regulation; the prohibition on honor-all-cards rulestakes effect in June 2016.
• Network licensing — In December 2015, the geographic scope of network licenses within the EU, including thosewe agree to with our GNS partners, was amended to cover the entire EU. This allows GNS partners to activelypursue their American Express business throughout the EU, including countries where we or other GNSpartners are present, and may undermine the value of licenses granted to some GNS partners to date, whichhave been subject to varying levels of exclusivity to incentivize development of the American Express businessin relation to a particular country.
• Separation of network processing — From June 2016, card networks will be required to separate their networkprocessing functions (in which transactions between different issuers and acquirers are processed forauthorization, clearing and settlement). This provision does not generally apply to “three-party” paymentnetworks, such as American Express, but may be deemed applicable, for example, where a different GNS issuerand acquirer is involved in a transaction, which represent a very small percentage of transactions on ournetwork.
• Co-badging of cards — From June 2016, a single card may bear the brand of multiple networks and be used toprocess transactions on any of those networks. Merchants may install automatic mechanisms in point-of-saleequipment to prioritize selection of a particular network, subject to override by the cardholder. These provisionsmay harm the American Express brand insofar as GNS issuing partners will be able to offer multiple networks ona single card and merchants may program their point-of-sale equipment to prioritize selection of anothernetwork on such cards.
The PSD2 was adopted on November 25, 2015, and was published in the Official Journal of the EU onDecember 23, 2015. Each Member State has until January 2018 to transpose the PSD2 into national law.
Among other terms, the published text of PSD2 includes provisions that will (i) further regulate surcharging so thattransactions falling in scope of the interchange caps could not be surcharged, but transactions falling outside the scope of
19

the caps could be surcharged up to cost, subject potentially to the ability of an individual Member State to prohibitsurcharging altogether; and (ii) require all networks, including three-party payment networks that operate with licensingarrangements, such as our GNS business, to establish objective, proportionate and non-discriminatory criteria underwhich a financial institution may access the network, for example, as a licensed issuer or acquirer. The potentialsurcharging regulation may increase instances of differential surcharging of our cards, prompt customer and merchantconfusion as to which transactions may be surcharged and lead to Card Member dissatisfaction. The access requirementswill undermine the flexibility and discretion we have had to date in deciding with whom to partner in our GNS business.
We see a trend toward regulation of the payments industry in other countries, too. For example, in Mexico, the centralbank issued rules in March 2014 for the regulation of payment instruments and the authorization of paymentclearinghouses, including requirements on non-discrimination and access; however, “closed-loop” networks such asAmerican Express are exempt as are also our licensing arrangements, provided that volumes under these arrangementsfall below a certain sector share (as do currently our GNS volumes in Mexico). In Canada, regulators have prompted themajor international card networks to make voluntary commitments on pricing, specifically interchange fee levels; in thecase of American Express, our commitment extends to maintaining current pricing practices whereby issuer ratesreceived by GNS partners are agreed to bilaterally with each partner, rather than multilaterally, and merchant pricing issimple, transparent and value-based with the same rate for the acquiring of credit and charge card transactions for aparticular merchant regardless of the type of card that is presented. In Malaysia, the central bank introduced rules thatimpose caps on interchange fees, permit steering by merchants and co-badging of debit cards with other card networks,and require issuers to offer cardholders the option of taking up a basic card product with minimal or no cardholderincentives or rewards and at zero or nominal cost to the cardholder.
In some countries governments have established regulatory regimes that require international card networks to belocally licensed and/or to localize aspects of their operations. For example, card network operators in India must obtainauthorization from the Reserve Bank of India, which has broad power under the Payment and Settlement Systems Act 2007to regulate the membership and operations of card networks. In Indonesia, bank regulations require participants in a cardpayment and settlement business to obtain a license and establish a local legal entity, and the central bank is nowconsidering the establishment of a domestic processing infrastructure for local transactions. In Russia, card networkoperators must be authorized by the central bank, and newly enacted regulation requires networks to place security depositswith the central bank, process all local transactions using government-owned infrastructure and insure that local transactiondata remains within the country. Governments in some countries also provide resources or protection to select domesticpayment card networks. For example, China recently proposed new regulation that will permit foreign card networks tooperate domestically in the country for the first time, subject to licensing, capital and other requirements. The developmentand enforcement of these and other similar laws, regulations and policies in international markets may adversely affect ourability to compete effectively in such countries and maintain and extend our global network.
As the operator of a general-purpose card network, we are also subject to certain provisions of the Bank SecrecyAct, as amended by the Patriot Act. We conduct due diligence on our GNS partners to ensure that they haveimplemented and maintain sufficient AML controls to prevent our network from being used for money laundering orterrorist financing purposes. As aggregators and other third parties add merchants to the American Express network, wehave expanded our due diligence to review the AML and “know your customer” policies and controls of those thirdparties, and retain the right to require termination of merchants’ card acceptance under appropriate circumstances.Since American Express Company and TRS are bank holding companies, our business is also subject to furtherregulation and regulatory oversight by the Federal Reserve. As a service provider to regulated U.S. banks, our GNSbusiness is subject to review by certain federal banking regulators, including the Federal Reserve, the FDIC and the OCC.For additional information about our regulatory status, see “Supervision and Regulation.”
CORPORATE & OTHER
Corporate & Other consists of corporate functions and certain other businesses, including our prepaid servicesbusiness (which offers stored value/prepaid products, such as American Express Serve®, Bluebird®, the AmericanExpress® Gift Card and Travelers Cheques), LoyaltyEdge® and our foreign exchange services. Our support functions,including servicing, credit and technology, are organized by process rather than business unit, which we believe serves tostreamline costs, reduce duplication of work, better integrate skills and expertise and improve customer service.
As an issuer of stored value/prepaid products, we are regulated in the United States under the “money transmitter” or“sale of check” laws in effect in most states. We hold the funds received for stored value/prepaid products in accordancewith applicable law, predominantly in highly rated debt securities consisting primarily of intermediate- and long-termfederal, state and municipal obligations and bank deposit accounts. Sales of Travelers Cheques and net interest incomefrom the Travelers Cheque investment portfolio continued to decline in 2015. We are also required by the laws of manystates to comply with unclaimed and abandoned property laws, under which we must pay to states the face amount of anyTravelers Cheque or prepaid card that is uncashed or unredeemed after a period of time depending on the type of product.
In November 2014, the CFPB proposed regulatory standards for prepaid cards, including uniform disclosures,certain protections for consumers and other requirements. Because the proposed rule is not final, the ultimate impactof these measures on us is not certain.
20

SUPERVISION AND REGULATION
OverviewFederal and state banking laws, regulations and policies extensively regulate the Company, TRS, Centurion Bank
and American Express Bank. They prescribe standards relating to, among other things, capital, earnings, liquidity,stress tests, resolution planning, dividends, the repurchase or redemption of shares, loans or extension of credit toaffiliates and insiders, corporate governance, internal controls, information systems, risk management, internal auditsystems, compensation, loan documentation, credit underwriting, asset growth and impaired assets. Such laws,regulations and policies are intended primarily for the protection of our depositors and other customers and thefederal deposit insurance funds, as well as to minimize systemic risk, and not for the protection of our shareholders orother creditors. The costs of compliance with this extensive regulatory regime are substantial. In recent years, thefinancial services industry has been subject to rigorous examination scrutiny, high regulatory expectations, and astringent and unpredictable regulatory enforcement environment. American Express Company and TRS are bankholding companies and financial holding companies under the BHC Act. As bank holding companies under the BHCAct, American Express Company and TRS are subject to supervision and examination by the Federal Reserve. Underthe system of “functional regulation” established under the BHC Act, the Federal Reserve supervises the Company,including all its non-bank subsidiaries, as an “umbrella regulator” of the consolidated organization and generally defersto the primary U.S. regulators of the Company’s U.S. bank subsidiaries with respect to the supervision and regulationof those institutions. Banking regulators have broad examination and enforcement power over bank holdingcompanies and their subsidiaries, including the power to impose substantial fines, limit dividends and other capitaldistributions, restrict operations and acquisitions and require divestitures. Bank holding companies and banks, as wellas subsidiaries of both, are prohibited by law from engaging in practices that the relevant regulatory authority deemsunsafe or unsound (which such authorities generally interpret broadly). We are also subject to supervision,examination and enforcement by the CFPB with respect to marketing and sale of consumer financial products andcompliance with certain federal consumer financial laws, including, among other laws, the CFPA and the TILA.
Many aspects of our business also are subject to rigorous regulation by other U.S. federal and state regulatoryagencies and securities exchanges and by non-U.S. government agencies or regulatory bodies. To the extent thatdifferent regulatory systems impose overlapping or inconsistent requirements on the conduct of our business, we facecomplexity and additional costs in our compliance efforts. New laws or regulations or changes to existing laws andregulations (including changes in interpretation or enforcement), as well as the enforcement of both existing and newlaws and regulations, could materially adversely affect our financial condition or results of operations. In addition to thediscussion in this section, see “Risk Factors — Legal and Regulatory Risks” for a further discussion of the potentialimpact legislative and regulatory changes may have on our results of operations and financial condition.
See also “Card-Issuing Business and Deposit Programs — Regulation” under “U.S. Card Services,” “InternationalCard Services — Regulation,” “Global Commercial Services — Regulation” and “Global Network & MerchantServices — Regulation” for a discussion of certain regulatory considerations specifically applicable to our businesssegments.
Financial Holding Company and Bank Holding Company Status and ActivitiesThe BHC Act limits the non-banking activities of bank holding companies. The activities of bank holding
companies that are not “financial holding companies” are restricted to those activities that the Federal Reserve hasdetermined are “so closely related to banking as to be a proper incident thereto.” An eligible bank holding companymay elect to become a financial holding company, which is authorized to engage in a broader range of financial andrelated activities. As a financial holding company, American Express engages in various activities permissible only for afinancial holding company including, in particular, providing travel agency services, acting as a finder and engaging incertain insurance underwriting and agency services.
For a bank holding company to be and remain eligible for financial holding company status, the bank holdingcompany and each of its subsidiary U.S. depository institutions must be “well capitalized” and “well managed,” andeach of its subsidiary U.S. depository institutions must have received at least a “satisfactory” rating on its most recentassessment under the Community Reinvestment Act of 1977 (the “CRA”). If the bank holding company fails to meetapplicable standards for financial holding company status, it is likely to be barred from engaging in new types offinancial activities or making certain types of acquisitions or investments in reliance on its status as a financial holdingcompany, and ultimately could be required to either discontinue the broader range of activities permitted to financialholding companies or divest its subsidiary U.S. depository institutions.
Acquisitions and Investments
Applicable federal and state laws place limitations on the ability of persons to invest in or acquire control of uswithout providing notice to or obtaining the approval of one or more of our regulators. In addition, we are subject tobanking laws and regulations that limit our investments and acquisitions and, in some cases, subject them to the priorreview and approval of our regulators, including the Federal Reserve, the OCC and the FDIC. The banking agencies havebroad discretion in evaluating proposed acquisitions and investments that are subject to their prior review or approval.
21
Source of Strength
A bank holding company is required by statute to act as a source of strength to all of its insured depositoryinstitution subsidiaries. Therefore, the Company is required to act as a source of strength to Centurion Bank andAmerican Express Bank and may be required to commit capital and financial resources to support both institutions.Such support may be required at times when, absent this requirement, the Company otherwise might determine notto provide it.
Capital loans by a bank holding company to any of its subsidiary banks are subordinate in right of payment todeposits and to certain other indebtedness of such subsidiary banks. In the event of a bank holding company’sbankruptcy, any commitment by the bank holding company to a federal banking regulator to maintain the capital of asubsidiary bank will be assumed by the bankruptcy trustee and entitled to a priority of payment.
Heightened Prudential Requirements for Large Bank Holding CompaniesDodd-Frank imposes heightened prudential requirements on bank holding companies with at least $50 billion in
total consolidated assets, including the Company, and requires the Federal Reserve to establish prudential standardsfor such large bank holding companies that are more stringent than those applicable to other bank holding companies.The Federal Reserve’s final rule implementing certain enhanced prudential requirements, including enhanced liquidityand overall risk management, became effective on January 1, 2015. The Federal Reserve has not yet finalized rules fortwo heightened prudential requirements mandated by Dodd-Frank — namely, bank holding company-consolidatedlimits on exposures to single counterparties and early remediation requirements for large bank holding companiesexperiencing financial distress. Apart from Dodd-Frank’s requirements, the Federal Reserve has discretionaryauthority to establish additional prudential standards on its own, or at the recommendation of the Financial StabilityOversight Council.
Stress Testing
As part of its implementation of the enhanced prudential requirements of Dodd-Frank, the Federal Reserve issuedrules relating to annual supervisory and semiannual company-run analyses of certain large bank holding companies, suchas the Company, to evaluate whether the companies have sufficient capital on a total consolidated basis to absorb lossesand support operations under adverse economic conditions (so-called “stress tests”). The Federal Reserve applies itsstress test rules and its capital planning requirements, discussed in “Capital Planning,” on a consolidated basis.
The FDIC and the OCC have also issued rules consistent with the Federal Reserve’s regulations governingcompany-conducted stress testing to implement annual company stress testing requirements applicable to certainbanking organizations, including Centurion Bank and American Express Bank.
Centurion Bank and American Express Bank began reporting the results of their stress tests in 2015 and we publishthe stress test results for the Company, Centurion Bank and American Express Bank on our Investor Relations website.
Capital Planning
Bank holding companies with $50 billion or more in total consolidated assets, including the Company, arerequired to develop and maintain a capital plan, and to submit the capital plan to the Federal Reserve for review underits Comprehensive Capital Analysis and Review (“CCAR”) process. CCAR is designed to evaluate the capital adequacy,capital adequacy process and planned capital distributions, such as dividend payments and common stockrepurchases, of a bank holding company subject to CCAR. As part of CCAR, the Federal Reserve evaluates whether abank holding company has sufficient capital to continue operations under various scenarios of economic and financialmarket stress (developed by both the bank holding company and the Federal Reserve, including “adverse” and“severely adverse” stress scenarios developed by the Federal Reserve). The scenarios are designed to stress our risksand vulnerabilities and assess our pro-forma capital position and ratios under hypothetical stressed environments.The Federal Reserve will also evaluate whether the bank holding company has robust, forward-looking capital planningprocesses that account for its unique risks.
The capital plan must cover a “planning horizon” of at least nine quarters (beginning with the quarter precedingthe submission of the plan). The Federal Reserve has broad authority to object to capital plans, and to require bankholding companies to revise and resubmit their capital plans. Bank holding companies are also subject to an ongoingrequirement to revise and resubmit their capital plans upon the occurrence of certain events specified by rule, or whenrequired by the Federal Reserve. In addition to other limitations, our ability to make any capital distributions (includingdividends and share repurchases) is contingent on the Federal Reserve’s non-objection to our capital plan under bothquantitative and qualitative tests. Should the Federal Reserve object to a capital plan, a bank holding company may notmake any capital distribution other than those capital distributions to which the Federal Reserve has indicated its non-objection in writing. Beginning in 2016, participating bank holding companies are required to submit their capital plansand stress testing results to the Federal Reserve on or before April 5 of each year, instead of on or before January 5 ofeach year as previously required.
22

The Federal Reserve is expected to publish the decisions for all the bank holding companies participating in CCAR2016, including the reasons for any objection to capital plans, by June 30, 2016. In addition, the Federal Reserve willseparately publish the results of its supervisory stress test under both the supervisory severely adverse and adversescenarios. The information to be released will include, among other things, the Federal Reserve’s projection ofcompany-specific information, including post-stress capital ratios and the minimum value of these ratios over theplanning horizon.
DividendsThe Company and TRS, as well as Centurion Bank and American Express Bank, are limited in their ability to pay
dividends by banking statutes, regulations and supervisory policy. In general, federal and applicable state banking lawsprohibit, without first obtaining regulatory approval, insured depository institutions, such as Centurion Bank andAmerican Express Bank, from making dividend distributions if such distributions are not paid out of available recentearnings or would cause the institution to fail to meet capital adequacy standards. As described in “Prompt CorrectiveAction,” the Federal Deposit Insurance Act (“FDIA”) also generally prohibits an FDIC-insured depository institutionfrom making any capital distribution (including payment of dividends) or paying any management fee to its holdingcompany if the depository institution would thereafter be undercapitalized. In addition to specific limitations on thedividends that subsidiary banks can pay to their holding companies, federal banking regulators have authority toprohibit or limit the payment of a dividend if, in the banking regulator’s opinion, payment of a dividend would constitutean unsafe or unsound practice in light of the financial condition of the banking organization.
Dividend payments by the Company and TRS to shareholders are subject to the oversight of the Federal Reserve.It is Federal Reserve policy that bank holding companies generally should pay dividends on common stock only out ofnet income available to common shareholders generated over the past year and only if prospective earnings retentionis consistent with the organization’s current and expected future capital needs, asset quality and overall financialcondition. See also “Heightened Prudential Requirements for Large Bank Holding Companies — Capital Planning.”Moreover, bank holding companies should not maintain dividend levels that place undue pressure on the capital ofdepository institution subsidiaries or that may undermine the bank holding company’s ability to be a source ofstrength to its banking subsidiaries. The Federal Reserve could prohibit a dividend by the Company or TRS that theFederal Reserve believes would constitute an unsafe or unsound practice in light of the financial condition of thebanking organization.
In addition, the Company generally is required to obtain prior approval from the Federal Reserve before it canmake capital distributions, including dividend payments, under any of the following circumstances (regardless ofwhether the distribution is part of a capital plan to which the Federal Reserve has not objected):
• The Company will not meet a minimum regulatory capital ratio after giving effect to the capital distribution;
• The Federal Reserve has notified the Company that it has determined that either (i) the capital distribution willresult in a material adverse change to the Company’s capital or liquidity structure, or (ii) the Company’searnings are materially underperforming projections;
• The dollar amount of the capital distribution will exceed the projected distribution described in the Company’sapproved capital plan; or
• The capital distribution will occur after the occurrence of an event requiring the resubmission (other thanpursuant to an objection) of the Company’s capital plan and before the Federal Reserve has acted on theresubmitted plan.
Resolution PlanningIn December 2015, we filed an updated plan for the rapid and orderly resolution of the Company under the
Bankruptcy Code in the event of material distress or failure. Under rules adopted by the Federal Reserve and the FDICpursuant to Dodd-Frank, we are required to update this resolution plan annually and may be required to update it uponthe occurrence of material changes in our business, structure or operations. This resolution planning requirementmay, as a practical matter, present additional constraints on our structure, operations and business strategy, and ontransactions and business arrangements between our bank and non-bank subsidiaries, because we must consider theimpact of these matters on our ability to prepare and submit a resolution plan that demonstrates that we may beresolved under the Bankruptcy Code in a rapid and orderly manner. If the Federal Reserve and the FDIC determine thatour plan is not credible and we fail to cure the deficiencies, we may be subject to more stringent capital, leverage orliquidity requirements, or restrictions on our growth, activities or operations, or may ultimately be required to divestcertain assets or operations to facilitate an orderly resolution.
Capital AdequacyThe Company, Centurion Bank and American Express Bank are required to comply with the applicable capital
adequacy rules established by federal banking regulators. These rules are intended to ensure that bank holdingcompanies and banks (collectively, “banking organizations”) have adequate capital given the level of assets and off-balance sheet obligations, and to minimize disincentives for holding liquid assets.
23

Since January 1, 2014, subject to certain transitional provisions, the Company, Centurion Bank and AmericanExpress Bank have been subject to the federal banking regulators’ revised capital rules (the “New Capital Rules”). TheNew Capital Rules substantially revised the general risk-based capital rules previously applicable to bankingorganizations to make them more risk sensitive and largely implement the Basel Committee on Banking Supervision’s(“Basel Committee”) final framework for strengthening international capital regulation, known as Basel III. Foradditional information regarding our capital ratios, see “Consolidated Capital Resources and Liquidity” under “MD&A.”
New Capital Rules
Under the New Capital Rules, new minimum capital and buffer requirements were established and will be fullyphased-in by 2019. Specifically, banking organizations are required to maintain minimum ratios for Common EquityTier 1 (“CET1”), Tier 1 and Total capital to risk-weighted assets. In addition, all banking organizations remain subject toa minimum leverage ratio of Tier 1 capital to total adjusted average assets (as defined for regulatory purposes).Advanced approaches institutions, such as the Company, will also become subject to a supplementary leverage ratio.In addition, advanced approaches institutions calculate risk-based capital ratios under both the generally applicablestandardized approach and the advanced approaches capital rule, and then use the lower of each capital ratio todetermine whether it meets its minimum risk-based capital requirements. The portions of the New Capital Rulesimplementing the standardized approach became effective January 1, 2015.
During 2014, we began reporting our capital adequacy ratios on a parallel basis to federal banking regulators usingboth risk-weighted assets calculated under the Basel III standardized approach, as adjusted for certain items, and therequirements for an advanced approaches institution. During this parallel period, federal banking regulators assessour compliance with the advanced approaches requirements. We continue to make progress in complying with therequirements, including refining our calculations to align the requirements with our asset types. The parallel period willcontinue until we receive regulatory approval to exit parallel reporting, at which point we will begin publicly reportingcapital ratios using risk-weighted assets calculated under both the advanced approaches and the standardizedapproach in the New Capital Rules, and will be required to use the lower of these ratios in order to determine whetherwe are in compliance with minimum capital requirements. Depending on how the advanced approaches are ultimatelyimplemented for our asset types, our capital ratios calculated under the advanced approaches may be lower thanunder the standardized approach. The Federal Reserve has indefinitely delayed use of the advanced approaches inCCAR and, therefore, the standardized approach will remain the applicable measurement for such purposes.
Commencing January 1, 2015, the Company, Centurion Bank and American Express Bank must each maintainCET1, Tier 1 capital (that is, CET1 plus additional Tier 1 capital) and Total capital (that is, Tier 1 capital plus Tier 2capital) ratios of at least 4.5 percent, 6.0 percent and 8.0 percent, respectively, without giving effect to the capitalconservation buffer or countercyclical capital buffer discussed below.
The New Capital Rules also implement a 2.5 percent capital conservation buffer composed entirely of CET1, on topof these minimum risk-weighted asset ratios. As a result, the minimum ratios are effectively 7.0 percent, 8.5 percentand 10.5 percent for the CET1, Tier 1 capital and Total capital ratios, respectively, on a fully phased-in basis.Implementation of the capital conservation buffer began on January 1, 2016 at the 0.625 percent level and will increasein equal increments at the beginning of each year until it is fully implemented on January 1, 2019. Additionally, as notedabove, the required minimum capital ratios for advanced approaches institutions such as the Company may be furtherincreased by a countercyclical capital buffer composed entirely of CET1 up to 2.5 percent, which may be assessedwhen federal banking regulators determine that such a buffer is necessary to protect the banking system fromdisorderly downturns associated with excessively expansionary periods. As a result, when fully phased-in, thecountercyclical capital buffer and capital conservation buffer could potentially result in effective minimum CET1, Tier 1capital and Total capital ratios of 9.5 percent, 11.0 percent and 13.0 percent, respectively.
Banking institutions whose ratio of CET1, Tier 1 Capital or Total capital to risk-weighted assets is above theminimum but below the capital conservation buffer (or below the combined capital conservation buffer andcountercyclical capital buffer, when the latter is applied) will face constraints on discretionary distributions such asdividends, repurchases and redemptions of capital securities, and executive compensation based on the amount ofthe shortfall.
As a supervisory matter, federal banking regulators expect most bank holding companies, and in particular largerbank holding companies such as the Company, to maintain regulatory capital ratios that, at a minimum, qualify a bankholding company and its depository institution subsidiaries as “well capitalized.” The rules also provide that bankholding companies experiencing internal growth or making acquisitions will be expected to maintain strong capitalpositions substantially above the minimum supervisory levels without significant reliance on intangible assets. Forexample, the Federal Reserve has indicated that it will consider a “tangible Tier 1 capital leverage ratio” (deducting allintangibles) and other indicators of capital strength in evaluating proposals for expansion or new activities.Furthermore, since the 2008-2009 financial crisis, federal banking regulators have encouraged larger bank holdingcompanies to maintain capital ratios appreciably above the “well capitalized” standard. The Federal Reserve has alsofocused on the regulatory requirement that common equity be the “predominant” element of Tier 1 capital.
24

In December 2015, the Basel Committee proposed a series of revisions to the standardized approach tocalculating regulatory capital requirements, including new rules that would require holding additional capital for certain“unconditionally cancellable commitments” such as unused credit card lines of credit. If adopted in the United Statesas proposed by the Basel Committee, the changes would require credit card issuers like us to hold significantly morecapital. Federal banking regulators have previously acknowledged the proposal and indicated that the revisions wouldapply primarily to large, internationally active banking organizations. This could include all advanced approachesinstitutions, such as the Company. In addition, the Basel Committee has proposed adjustments to the standardizedcalculation of operational risk capital requirements. If adopted in the United States as proposed by the BaselCommittee, the changes would require banking organizations that are highly specialized in fee-based businesses andconduct significant fee-based activities like us to hold significantly more capital.
Leverage Requirements
Banking organizations are also required to comply with minimum leverage ratio requirements. The leverage ratiois the ratio of a banking organization’s Tier 1 capital to its total adjusted average assets (as defined for regulatorypurposes). All banking organizations are required to maintain a leverage ratio of at least 4.0 percent.
The New Capital Rules also establish a supplementary leverage ratio requirement for advanced approachesbanking organizations such as the Company, consistent with the Basel III framework. The supplementary leverageratio is the ratio of Tier 1 capital to an expanded concept of leverage exposure that includes both on-balance sheet andcertain off-balance sheet exposures. The New Capital Rules require a minimum supplemental leverage ratio of 3.0percent for advanced approaches banking organizations as reported to the federal banking regulators, with fullimplementation and compliance by January 1, 2018.
Liquidity RegulationLiquidity risk management and supervision have become increasingly important since the financial crisis. The
Federal Reserve’s heightened prudential requirements rule, which applies to the Company and is discussed in“Heightened Prudential Requirements for Large Bank Holding Companies,” includes enhanced liquidity and overall riskmanagement requirements. The Federal Reserve’s rule focuses on a bank holding company’s process to manageliquidity risk and details certain requirements and responsibilities for boards of directors and senior managementrelating to liquidity planning and overall risk management. The rule also requires the maintenance of a liquidity buffer,consisting of highly liquid assets, that is sufficient to meet projected funding needs for 30 days over a range of liquiditystress scenarios.
In addition, the Company has been subject to the liquidity coverage ratio (“LCR”) requirement since January 2015,which is designed to ensure that the banking entity maintains an adequate level of unencumbered high-quality liquidassets that can be converted into cash to meet its liquidity needs for a 30-day time horizon under an acute liquiditystress scenario specified by supervisors. The ratio of a firm’s high-quality liquid assets to its projected net outflows isits LCR. The most comprehensive form of the LCR requirement applies only to advanced approaches bankingorganizations, such as the Company, and their depository institution subsidiaries with $10 billion or more in totalconsolidated assets, such as Centurion Bank and American Express Bank. Under the federal banking regulators’ LCRrule, covered banking organizations are required to comply with the LCR on an accelerated schedule, maintaining aminimum ratio of 80 percent beginning January 1, 2015, 90 percent by January 1, 2016 and 100 percent by January 1,2017. The Company is required to calculate the LCR on a monthly basis, and on a daily basis starting July 1, 2016. As ofDecember 31, 2015, the Company, Centurion Bank and American Express Bank were in compliance with therequirements of the LCR rule. The LCR is one of the two new standards provided for in the Basel III liquidity framework.
The Basel III framework also includes a second standard, referred to as the net stable funding ratio (“NSFR”),which is designed to promote more medium- and long-term funding of the assets and activities of banking entities overa one-year time horizon. These requirements will incent banking entities to increase their holdings of cash, U.S.Treasury securities and other sovereign debt as a component of assets and increase the use of long-term debt as afunding source. On October 31, 2014, the Basel Committee published the final NSFR, which contemplates that theNSFR will be implemented as a minimum standard by January 1, 2018. The Basel Committee’s final NSFR documentstates that the NSFR applies to internationally active banks. Federal banking regulators have not yet proposed rulesimplementing the NSFR liquidity framework for U.S. banking institutions, so the ultimate requirements to which wemay be subject are not yet known.
Prompt Corrective ActionThe FDIA requires, among other things, that federal banking regulators take prompt corrective action in respect of
FDIC-insured depository institutions (such as Centurion Bank and American Express Bank) that do not meet minimumcapital requirements. The FDIA specifies five capital tiers: “well capitalized,” “adequately capitalized,”“undercapitalized,” “significantly undercapitalized” and “critically undercapitalized.” Once an institution becomes“undercapitalized,” the FDIA imposes progressively more restrictive constraints on operations, management andcapital distributions, depending on the capital category in which an institution is classified.
25
The FDIA generally prohibits a bank, including Centurion Bank and American Express Bank, from acceptingbrokered deposits or offering interest rates on any deposits significantly higher than the prevailing rate in its normalmarket area or nationally (depending upon where the deposits are solicited), unless (1) it is well capitalized or (2) it isadequately capitalized and receives a waiver from the FDIC. A significant amount of our outstanding U.S. retaildeposits has been raised through third-party brokerage networks, and such deposits are considered brokereddeposits for bank regulatory purposes. A bank that is less than well capitalized generally may not pay an interest rateon any deposit, including direct-to-consumer deposits, in excess of 75 basis points over the national rate published bythe FDIC unless the FDIC determines that the bank is operating in a high-rate area. An adequately capitalized insureddepository institution may not accept, renew or roll over any brokered deposit unless it has applied for and beengranted a waiver of this prohibition by the FDIC. Undercapitalized depository institutions may not solicit deposits byoffering interest rates that are significantly higher than the prevailing rates of interest on insured deposits in suchinstitution’s normal market areas or in the market area in which such deposits would otherwise be accepted. There areno such restrictions on a bank that is well capitalized (provided such bank is not subject to a capital maintenanceprovision within a written agreement, consent order, order to cease and desist, capital directive, or prompt correctiveaction directive issued by its federal regulator). If a depository institution’s federal regulator determines that theinstitution is in an unsafe or unsound condition or is engaging in unsafe or unsound banking practices, the regulatormay reclassify a well capitalized institution as adequately capitalized, require an adequately capitalized institution tocomply with certain restrictions as if it were undercapitalized, or require an undercapitalized institution to take certainactions applicable to significantly undercapitalized institutions, all of which would adversely impact the institution’sability to accept brokered deposits. For a description of our deposit programs, see “Deposit Programs” under “U.S.Card Services — Consumer and Small Business Services.”
The FDIA generally prohibits an FDIC-insured depository institution from making any capital distribution(including payment of dividends) or paying any management fee to its holding company if the depository institutionwould thereafter be undercapitalized. Undercapitalized depository institutions are subject to restrictions on borrowingfrom the Federal Reserve and to growth limitations, and are required to submit a capital restoration plan. Significantlyundercapitalized depository institutions may be subject to a number of requirements and restrictions, including ordersto sell sufficient voting stock to become adequately capitalized, requirements to reduce total assets and cessation ofreceipt of deposits from correspondent banks. Critically undercapitalized depository institutions are subject toappointment of a receiver or conservator.
Transactions Between Centurion Bank or American Express Bank and Their Respective AffiliatesCertain transactions (including loans and credit extensions from Centurion Bank and American Express Bank)
between Centurion Bank and American Express Bank, on the one hand, and their affiliates (including the Company,TRS and their non-bank subsidiaries), on the other hand, are subject to quantitative and qualitative limitations,collateral requirements, and other restrictions imposed by statute and regulation. Transactions subject to theserestrictions are generally required to be made on an arms-length basis. These restrictions generally do not apply totransactions between a depository institution and its subsidiaries.
FDIC Deposit Insurance and Insurance AssessmentsCenturion Bank and American Express Bank accept deposits and those deposits are insured by the FDIC up to the
applicable limits. Under the FDIA, the FDIC may terminate the insurance of an institution’s deposits upon a finding thatthe institution has engaged in unsafe or unsound practices, is in an unsafe or unsound condition to continueoperations, or has violated any applicable law, regulation, rule, order or condition imposed by the FDIC. We do notknow of any practice, condition or violation that might lead to termination of deposit insurance at either of our insureddepository institution subsidiaries.
The FDIC’s deposit insurance fund is funded by assessments on insured depository institutions, which are subjectto adjustment by the FDIC. For example, on October 22, 2015, the FDIC proposed rules imposing a temporaryassessment surcharge for banks with at least $10 billion in assets. This surcharge would result in increased costs forCenturion Bank and American Express Bank.
FDIC Powers upon Insolvency of Insured Depository InstitutionsIf the FDIC is appointed the conservator or receiver of an insured depository institution, such as Centurion Bank or
American Express Bank, upon its insolvency or in certain other events, the FDIC has the power: (1) to transfer any ofthe depository institution’s assets and liabilities to a new obligor without the approval of the depository institution’screditors; (2) to enforce the terms of the depository institution’s contracts pursuant to their terms; or (3) to repudiateor disaffirm any contract or lease to which the depository institution is a party, the performance of which is determinedby the FDIC to be burdensome and the disaffirmation or repudiation of which is determined by the FDIC to promotethe orderly administration of the depository institution.
In addition, under federal law, the claims of holders of U.S. deposit liabilities and certain claims for administrativeexpenses of the FDIC against an insured depository institution would be afforded priority over other general unsecuredclaims against the institution, including claims of debt holders of the institution and depositors in non-U.S. offices, in
26

the liquidation or other resolution of the institution by a receiver. As a result, whether or not the FDIC ever sought torepudiate any debt obligations of Centurion Bank or American Express Bank, the debt holders and depositors in non-U.S. offices would be treated differently from, and could receive substantially less, if anything, than the depositors inU.S. offices of the depository institution.
Orderly Liquidation Authority under Dodd-FrankDodd-Frank created the Orderly Liquidation Authority (“OLA”), a resolution regime for systemically important
non-bank financial companies, including bank holding companies, under which the Treasury Secretary may appointthe FDIC as receiver to liquidate such a company if the company is in danger of default and presents a systemic risk toU.S. financial stability. OLA is similar to the FDIC resolution model for depository institutions, including granting verybroad powers to the FDIC as receiver. Though creditors’ rights under OLA were modified from the FDIC regime toreduce disparities in treatment between OLA and the U.S. Bankruptcy Code, substantial differences exist between thetwo regimes, including the right of the FDIC to disregard the strict priority of creditor claims in limited circumstances,the use of an administrative claims procedure to determine creditor claims (as opposed to the judicial procedure usedin bankruptcy proceedings), and the right of the FDIC to transfer claims to a “bridge” entity. The OLA is separate fromthe Company’s resolution plan discussed in “Resolution Planning.”
The FDIC has developed a strategy under OLA, referred to as the “single point of entry” or “SPOE” strategy, underwhich the FDIC would resolve a failed financial holding company by transferring its assets (including shares of itsoperating subsidiaries) and, potentially, very limited liabilities to a “bridge” holding company; utilize the resources ofthe failed financial holding company to recapitalize the operating subsidiaries; and satisfy the claims of unsecuredcreditors of the failed financial holding company and other claimants in the receivership by delivering securities of oneor more new financial companies that would emerge from the bridge holding company. Under this strategy,management of the failed financial holding company would be replaced and shareholders and creditors of the failedfinancial holding company would bear the losses resulting from the failure.
Cross-Guarantee ProvisionsUnder the “cross-guarantee” provision of the Financial Institutions Reform, Recovery and Enforcement Act of
1989 (“FIRREA”), insured depository institutions, such as Centurion Bank and American Express Bank, may be liableto the FDIC with respect to any loss incurred or reasonably anticipated to be incurred by the FDIC in connection withthe default of, or FDIC assistance to, any commonly controlled insured depository institution. Centurion Bank andAmerican Express Bank are commonly controlled within the meaning of the FIRREA cross-guarantee provision. Across-guarantee claim of the FDIC against a depository institution is generally superior in right of payment to claims ofthe holding company and its affiliates against such depository institution.
Community Reinvestment ActCenturion Bank and American Express Bank are subject to the CRA, which imposes affirmative, ongoing
obligations on depository institutions to meet the credit needs of their local communities, including low- andmoderate-income neighborhoods, consistent with the safe and sound operation of the institution. The CRA requires aninstitution’s primary federal regulator, as part of the examination process, to assess the institution’s record in meetingits obligations under the CRA, and also to take such assessment into account in evaluating merger and acquisitionproposals and applications to open or relocate a branch office. American Express Bank was examined by the OCCduring the fourth quarter of 2012 and received a “satisfactory” CRA rating. Centurion Bank was examined by the FDICfor CRA compliance during the third quarter of 2015. We are awaiting the results of this examination. In its lastexamination, Centurion Bank received a “satisfactory” CRA rating.
Privacy and Data ProtectionRegulatory and legislative activity in the areas of privacy, data protection and information security continues to
increase worldwide. We have established and continue to maintain policies that provide a framework for compliancewith applicable privacy, data protection and information security laws, meet evolving customer privacy expectationsand support and enable business innovation and growth.
Our regulators, including regulatory examiners, are increasingly focused on ensuring that our privacy, dataprotection and information security-related policies and practices are adequate to inform customers of our datacollection, use, sharing and/or security practices, to provide them with choices, if required, about how we use andshare their information, and to safeguard their personal information in accordance with applicable privacy, dataprotection and information security laws.
In the United States, certain of our businesses may be subject to the privacy, disclosure and information securityprovisions of the Gramm-Leach-Bliley Act (“GLBA”) and its implementing regulations and guidance. Among otherthings, the GLBA imposes certain limitations on the ability of a financial institution to share consumers’ nonpublicpersonal information with nonaffiliated third parties; requires that a financial institution provide certain disclosures to
27

consumers about its data collection, sharing and security practices and affords customers the right to “opt out” of theinstitution’s disclosure of their personal financial information to nonaffiliated third parties (with limited exceptions),and requires the financial institution to develop, implement and maintain a written comprehensive information securityprogram containing safeguards that are appropriate to the financial institution’s size and complexity, the nature andscope of the financial institution’s activities and the sensitivity of customer information processed by the financialinstitution. The GLBA does not preempt state laws that afford greater privacy protections to consumers. Variousstates also have adopted laws, rules and/or regulations pertaining to privacy and/or information security, includingcertain potentially applicable financial privacy laws (such as a law in effect in California); data security and/or datadisposal requirements (including potentially applicable requirements adopted in states such as Massachusetts andNevada); online privacy laws (such as a law in effect in California); and laws relating to the confidentiality of certaintypes of data (such as laws governing certain health-related information and/or Social Security numbers, for whichthere are also potentially applicable federal laws, rules, regulations and/or guidance as well). Certain of theserequirements may apply to the personal information of our employees and/or contractors as well as our customers.
Various U.S. federal banking regulators and 47 U.S. states, the District of Columbia, Guam, Puerto Rico and theVirgin Islands have enacted data security breach notification requirements with varying levels of individual, consumer,regulator and/or law enforcement notification in certain circumstances in the event of a data security breach. Databreach notification laws are also becoming more prevalent in other parts of the world where we operate, includingGermany, Japan, Mexico, South Korea and Taiwan. In many countries that have yet to impose data breach notificationrequirements, regulators have increasingly used the threat of significant sanctions and penalties by data protectionauthorities to encourage voluntary breach notification.
We are also subject to certain privacy, data protection and information security laws in other countries in which weoperate (including countries in the EU, Australia, Canada, Japan, Hong Kong, Mexico and Singapore), some of whichare more stringent than those in the United States. We have also seen some countries institute laws requiring in-country data processing and/or in-country storage of the personal data of its citizens. Compliance with such lawscould result in higher technology, administrative and other costs for us and could limit our ability to optimize the use ofour closed-loop data.
In Europe, European Directive 95/46/EC (commonly referred to as the “Data Protection Directive”), which hasbeen in place since 1995, provides for the protection of individuals with regard to the processing of personal data andon the free movement of such data. The Data Protection Directive requires the controller and/or processor of anindividual’s personal data to, among other things, take the necessary technical and organizational steps to protectpersonal data. We generally rely on our binding corporate rules as the primary method for lawfully transferring datafrom our European entities to our entities in the United States and elsewhere globally. European Directive2002/58/EC (commonly referred to as the “e-Privacy Directive”) sets out requirements for the processing of personaldata and the protection of privacy in the electronic communications sector. The ePrivacy Directive places restrictionson, among other things, the sending of unsolicited marketing communications, as well as on the collection and use ofdata about internet users.
In January 2012, the Commission proposed data protection framework regulation to replace the Data ProtectionDirective. The EU legislative process is in the final stages and the new regulation will affect parties, such as theCompany, that collect and/or process the personal data of residents of Member States and may result in additionalcompliance requirements and costs. The new regulation includes, among other things, a requirement for promptnotice of data breaches, in certain circumstances, to data subjects and supervisory authorities, applying uniformlyacross sectors and across the EU and significant fines for non-compliance.
In 2015, the European Central Bank and the European Banking Authority enacted secondary legislation focused onsecurity breaches, strong customer authentication and information security-related policies. Likewise, theCommission released in December 2015 the text of its draft proposed network information security directive, to beimplemented into national laws by Member States. PSD2 also contains regulatory requirements on strong customerauthentication and measures to prevent security incidents.
Fair Credit ReportingThe FCRA regulates the disclosure of consumer credit reports by consumer reporting agencies and the use of
consumer credit report information by banks and other companies. Among other things, FCRA places restrictions(with limited exceptions) on the sharing and use of certain personal financial and creditworthiness information of ourcustomers with and by our affiliates.
The FCRA was significantly amended by the enactment in 2003 of the FACT Act. The FACT Act requires anycompany that receives information concerning a consumer from an affiliate, subject to certain exceptions, to permitthe consumer to opt out from having that information used to market the company’s products to the consumer. Wehave implemented various mechanisms to allow our customers to opt out of affiliate sharing and of marketing by theCompany and our affiliates, and we continue to review and enhance these mechanisms to ensure compliance withapplicable laws, rules and regulations and a favorable customer experience.
28
The FACT Act also amended the FCRA by adding several provisions designed to prevent or decrease identity theftand to improve the accuracy of consumer credit information. Our internal policies and standards, as well as ourenterprise-wide data protection, information security and fraud prevention programs, are designed to comply with theidentity theft requirements. The FACT Act also imposes duties on both consumer reporting agencies and onbusinesses that furnish or use information contained in consumer credit reports. For example, a furnisher ofinformation is required to implement procedures to prevent the reporting of any information that it learns is the resultof identity theft. Also, if a consumer disputes the accuracy of information provided to a consumer reporting agency,the furnisher of that information must conduct an investigation and respond to the consumer in a timely fashion. TheFACT Act also requires grantors of credit that use consumer credit report information in making a determination tooffer a borrower credit on terms that are “materially less favorable” than the terms offered to most of the lender’sother customers to notify the borrower that the terms are based on a consumer credit report. In such a case theborrower is entitled to receive a free copy of the report from the consumer reporting agency Since 2011, Dodd-Frankhas required the addition of certain information about credit scores to “risk-based pricing” notices and to adverseaction notices otherwise required by the FCRA. Grantors of credit using prescreened consumer credit reportinformation in credit solicitations are also required to include an enhanced notice to consumers that they have theright to opt out from receiving further prescreened offers of credit.
The CARD ActThe CARD Act regulates credit card billing, pricing, disclosure and other practices, as well as certain aspects of gift
certificates, store gift cards and general-use prepaid cards primarily for personal use. Under the CARD Act, issuersmust not open a credit card account or increase a credit line without considering the consumer’s ability to make therequired minimum payments under the terms of the account.
With respect to billing and payment, the CARD Act prohibits a card issuer from treating any payment as late forany purpose, including imposing a penalty interest rate or late fee, unless the issuer has adopted reasonableprocedures designed to ensure that a periodic statement showing the required minimum payment is mailed to theconsumer at least 21 days before the payment due date.
With respect to pricing, the CARD Act prohibits an issuer from increasing any annual percentage rate (“APR”) onan outstanding balance, except in specific enumerated circumstances. If an issuer increases an APR, the CARD Actrequires that the issuer periodically reevaluate the APR increase to determine if a decrease is “appropriate.” Penaltyfees for a violation with respect to an account be “reasonable and proportional” to such violation.
With respect to disclosure, the CARD Act generally requires issuers to provide certain repayment disclosures onperiodic statements, such as a disclosure of the total cost to the consumer, including interest charges, of paying off abalance by making only the required minimum payment each billing cycle. An issuer is also obligated to provideadvance notice prior to making “significant” changes to the terms of an account (such as increasing an APR or a latefee) and, in some cases, give the consumer the right to reject the proposed change.
Anti-Money Laundering ComplianceAmerican Express is subject to a significant number of AML laws and regulations as a result of being a financial
company headquartered in the United States, as well as having a global presence. In the United States, the majority ofAML requirements are derived from the Bank Secrecy Act, as it has been amended by the Patriot Act. In Europe, AMLrequirements are largely the result of countries transposing the 3rd EU Anti-Money Laundering Directive (and precedingEU Anti-Money Laundering Directives) into local laws and regulations. The 4th EU Anti-Money Laundering Directive waspublished in June 2015, which added new AML requirements. Each Member State has two years to transpose the newDirective into national law. Numerous other countries, such as Argentina, Australia, Canada and Mexico, have alsoenacted or proposed new or enhanced AML legislation and regulations applicable to American Express.
The underpinnings of these laws and regulations are the efforts of each government to prevent the financialsystem from being used by criminals to hide their illicit proceeds and to impede terrorists’ ability to access and movefunds used in support of terrorist activities. Among other things, these laws and regulations require financialinstitutions to establish AML programs that meet certain standards, including, in some instances, expanded reporting,particularly in the area of suspicious transactions, and enhanced information gathering and recordkeepingrequirements. Any errors, failures or delays in complying with federal, state or foreign AML and counter-terroristfinancing laws could result in significant criminal and civil lawsuits, penalties and forfeiture of significant assets orother enforcement actions.
American Express has established and continues to maintain a Global Anti-Money Laundering Policy, designed toensure that, at a minimum, American Express and all of its businesses are in compliance with all applicable laws, rulesand regulations related to AML and anti-terrorist financing initiatives. The American Express Global Anti-MoneyLaundering Policy requires that each American Express business maintains a compliance program that provides for asystem of internal controls to ensure that appropriate due diligence and, when necessary, enhanced due diligence,including obtaining and maintaining appropriate documentation, is conducted at account opening and updated, as
29

necessary, through the course of the customer relationship. The Global Anti-Money Laundering Policy is also designedto ensure there are appropriate methods of monitoring transactions and account relationships to identify potentiallysuspicious activity and reporting suspicious activity to governmental authorities in accordance with applicable laws,rules and regulations. In addition, the American Express Global Anti-Money Laundering Policy requires the training ofappropriate personnel with regard to AML and anti-terrorist financing issues and provides for independent testing toensure that the Global Anti-Money Laundering Policy is in compliance with all applicable laws and regulations.
Office of Foreign Assets Control RegulationThe United States has imposed economic sanctions that affect transactions with designated foreign countries,
nationals and others. The United States prohibits U.S. persons from engaging with individuals and entities identified as“Specially Designated Nationals,” such as terrorists and narcotics traffickers. These prohibitions are administered bythe U.S. Department of the Treasury’s Office of Foreign Assets Control (“OFAC”) and are typically known as the OFACrules. The OFAC rules prohibit U.S. persons from engaging in financial transactions with or relating to the prohibitedindividual, entity or country, require the blocking of assets in which the individual, entity or country has an interest, andprohibit transfers of property subject to U.S. jurisdiction (including property in the possession or control of U.S.persons) to such individual, entity or country. Blocked assets (e.g., property or bank deposits) cannot be paid out,withdrawn, set off or transferred in any manner without a license from OFAC. We maintain a global sanctions programdesigned to ensure compliance with OFAC requirements. Failure to comply with such requirements could subject us toserious legal and reputational consequences, including criminal penalties.
Pursuant to Section 219 of the Iran Threat Reduction and Syria Human Rights Act of 2012, which addedSection 13(r) to the Securities Exchange Act of 1934, as amended (the “Exchange Act”), an issuer is required todisclose in its annual or quarterly reports, as applicable, whether it or any of its affiliates knowingly engaged in certainactivities, transactions or dealings relating to Iran or with individuals or entities designated pursuant to certainExecutive Orders. Disclosure is generally required even where the activities, transactions or dealings were conductedoutside the United States by non-U.S. affiliates in compliance with applicable law, and whether or not the activities aresanctionable under U.S. law.
During the year ended December 31, 2015, American Express Global Business Travel booked three hotelreservations at Homa Hotel Tehran, one hotel reservation at Esteghlal Grand Hotel and two hotel reservations atEsteghlal East Wing Hotel. In addition, certain third-party service providers obtained approximately 40 visas fromIranian embassies and consulates around the world during the year ended December 31, 2015 in connection withcertain travel arrangements on behalf of American Express Global Business Travel and TLS clients. We and AmericanExpress Global Business Travel had negligible gross revenues and net profits attributable to these transactions.American Express Global Business Travel believes these transactions were permissible pursuant to certainexemptions from U.S. sanctions for travel-related transactions under the International Emergency Economic PowersAct, as amended. American Express Global Business Travel has informed us that it intends to continue to engage inthese activities on a limited basis so long as such activities are permitted under U.S. law.
In addition, a travel company that may be considered an affiliate of ours, American Express Nippon Travel Agency,Inc. (“Nippon Travel Agency”), has informed us that during the year ended December 31, 2015 it obtained 92 visasfrom the Iranian embassy in Japan in connection with certain travel arrangements on behalf of its clients. NipponTravel Agency had negligible gross revenues and net profits attributable to these transactions. Nippon Travel Agencyhas informed us that it intends to continue to engage in this activity so long as such activity is permitted under U.S.law.
Compensation PracticesOur compensation practices are subject to oversight by the Federal Reserve. In June 2010, federal banking
regulators issued final guidance on sound incentive compensation practices that applies to all banking organizationssupervised by the Federal Reserve, including bank holding companies, such as the Company, as well as all insureddepository institutions, including Centurion Bank and American Express Bank. The final guidance sets forth three keyprinciples for incentive compensation arrangements that are designed to help ensure that incentive compensationplans do not encourage imprudent risk-taking and are consistent with the safety and soundness of bankingorganizations. The three principles provide that a banking organization’s incentive compensation arrangementsshould (1) provide incentives that appropriately balance risk and financial results in a manner that does not encourageemployees to expose their organizations to imprudent risks, (2) be compatible with effective internal controls and riskmanagement, and (3) be supported by strong corporate governance, including active and effective oversight by theorganization’s board of directors. Any deficiencies in compensation practices of a banking institution that areidentified by the Federal Reserve or other banking regulators in connection with its review of such organization’scompensation practices may be incorporated into the organization’s supervisory ratings, which can affect its ability tomake acquisitions or perform other actions. The final guidance provides that enforcement actions may be takenagainst a banking organization if its incentive compensation arrangements or related risk-management control orgovernance processes pose a risk to the organization’s safety and soundness and the organization is not takingprompt and effective measures to correct the deficiencies.
30
Additionally, in 2011, federal banking regulators, the SEC, the Federal Housing Finance Agency and the National CreditUnion Administration issued proposed rulemaking pursuant to Dodd-Frank on incentive-based compensation practices.Under the proposed rule, all financial institutions with total consolidated assets of $1 billion or more (such as theCompany, Centurion Bank and American Express Bank) would be prohibited from offering incentive-based compensationarrangements that encourage inappropriate risk taking by offering “excessive” compensation or compensation that couldlead the company to material financial loss. All covered institutions would be required to provide federal regulators withadditional disclosures to determine compliance with the proposed rule and also to maintain policies and procedures toensure compliance. Additionally, for covered institutions with at least $50 billion in total consolidated assets, such as theCompany, the proposed rule requires that at least 50 percent of certain executive officers’ incentive-based compensationbe deferred for a minimum of three years and provides for the adjustment of deferred payments to reflect actual losses orother measures of performance that become known during the deferral period. Moreover, the board of directors of acovered institution with at least $50 billion in total consolidated assets must identify employees who have authority toexpose an institution to substantial risk, evaluate and document the incentive-based compensation methods used tobalance risk and financial rewards for the identified employees, and approve incentive-based compensation arrangementsfor those employees after appropriately considering other available methods for balancing risk and financial rewards. Thecomment period for this rule ended in May 2011. Although final rules have not yet been adopted, officials from the FederalReserve have indicated that federal banking regulators are in the process of preparing for public comment a new rule onincentive compensation. If these or other regulations are adopted in a form similar to what was initially proposed, they willimpose limitations on the manner in which we may structure compensation for our executives.
The scope and content of these policies and regulations on executive compensation are continuing to develop andare likely to continue evolving in the future. It cannot be determined at this time whether compliance with such policiesand regulations will adversely affect our ability to hire, retain and motivate key employees.
Anti-CorruptionWe are subject to complex international and U.S. anti-corruption laws and regulations, including the U.S. Foreign
Corrupt Practices Act (the “FCPA”), the UK Bribery Act and other laws that prohibit the making or offering of improperpayments. The FCPA makes it illegal to corruptly offer or provide anything of value to foreign government officials,political parties or political party officials for the purpose of obtaining or retaining business or an improper advantage.The anti-bribery provisions of the FCPA are enforced by the U.S. Department of Justice (“DOJ”). The FCPA also requiresus to strictly comply with certain accounting and internal controls standards, which are enforced by the SEC. In recentyears, DOJ and SEC enforcement of the FCPA has become more intense. The UK Bribery Act, which took effect in July2011, also prohibits commercial bribery, and the receipt of a bribe, and makes it a corporate offense to fail to preventbribery by an associated person, in addition to prohibiting improper payments to foreign government officials. Failure tocomply with the FCPA, the UK Bribery Act and other laws can expose us and/or individual employees to potentiallysevere criminal and civil penalties. The risk may be greater when we transact business, whether through subsidiaries orjoint ventures or other partnerships, in countries with higher perceived levels of corruption. We have risk-based policiesand procedures designed to detect and deter prohibited practices, provide specialized training, monitor our operationsand payments, and investigate allegations of improprieties relating to transactions and the manner in which transactionsare recorded. However, if our employees, contractors or agents fail to comply with applicable laws governing ourinternational operations, the Company, as well as individual employees, may face investigations or prosecutions, whichcould have a material adverse effect on our financial condition or results of operations.
FOREIGN OPERATIONSWe derive a significant portion of our revenues from the use of our card products and other financial services in
countries outside the United States and continue to broaden the use of these products and services outside the UnitedStates. (For a discussion of our revenue by geographic region, see Note 25 to our Consolidated Financial Statements.)Our revenues can be affected by political and economic conditions in these countries as well as by foreign exchangerate fluctuations. See “Adverse currency fluctuations and foreign exchange controls could decrease earnings we receivefrom our international operations and impact our capital” under “Risk Factors.”
SEGMENT INFORMATION AND CLASSES OF SIMILAR SERVICESYou can find information regarding our reportable operating segments, geographic operations and classes of
similar services in Note 25 to our Consolidated Financial Statements.
EXECUTIVE OFFICERS OF THE COMPANYSet forth below, in alphabetical order, is a list of all our executive officers as of February 19, 2016, including each
executive officer’s principal occupation and employment during the past five years. None of our executive officers has anyfamily relationship with any other executive officer, and none of our executive officers became an officer pursuant to anyarrangement or understanding with any other person. Each executive officer has been elected to serve until the next annualelection of officers or until his or her successor is elected and qualified. Each officer’s age is indicated by the number inparentheses next to his or her name.
31

DOUGLAS E. BUCKMINSTER — President, Global Consumer ServicesMr. Buckminster (55) has been President, Global Consumer Services since October 2015. Prior thereto, he had
been President, Global Network and International Card Services since February 2012 and President, InternationalConsumer and Small Business Services since November 2009.
JAMES BUSH — President, Global Network and International Consumer ServicesMr. Bush (57) has been President, Global Network and International Consumer Services since October 2015. Prior
thereto, he had been Executive Vice President, World Service since October 2009.
JEFFREY C. CAMPBELL — Executive Vice President and Chief Financial OfficerMr. Campbell (55) has been Executive Vice President, Finance since July 2013 and Chief Financial Officer since
August 2013. Mr. Campbell joined American Express from McKesson Corporation, a health care services company,where he served as Executive Vice President and Chief Financial Officer since 2004.
KENNETH I. CHENAULT — Chairman and Chief Executive OfficerMr. Chenault (64) has been Chairman since April 2001 and Chief Executive Officer since January 2001.
L. KEVIN COX — Chief Human Resources OfficerMr. Cox (52) has been Chief Human Resources Officer since April 2005.
PAUL FABARA — President, Global Risk & Compliance Group and Chief Risk OfficerMr. Fabara (50) has been President, Global Risk & Compliance Group and Chief Risk Officer since February 2016
and President, Global Banking Group since February 2013. He also served as President, Global Network Business fromSeptember 2014 to October 2015. Prior thereto, he had been Executive Vice President, Global Credit Administrationsince January 2011. Mr. Fabara joined American Express from Barclays PLC, where he served as Managing Directorand Global Head, Operations, Regulatory, Implementation and Planning from February 2009 to January 2011.
MARC D. GORDON — Executive Vice President and Chief Information OfficerMr. Gordon (55) has been Executive Vice President and Chief Information Officer since September 2012.
Mr. Gordon joined American Express from Bank of America, where he served as Enterprise Chief Information Officerfrom December 2011 until April 2012. Prior thereto, he had been Chief Technology Officer and head of Global DeliveryOperations at Bank of America from May 2008 until November 2011.
ASH GUPTA — President, Credit Risk and Global Information ManagementMr. Gupta (62) has been President, Credit Risk and Global Information Management since February 2016. Prior
thereto, he had been President, Risk and Information Management and Chief Risk Officer since July 2007.
MICHAEL J. O’NEILL — Executive Vice President, Corporate Affairs and CommunicationsMr. O’Neill (62) has been Executive Vice President, Corporate Affairs and Communications since September
2014. Prior thereto, he had been Senior Vice President, Corporate Affairs and Communications since March 1991.
LAUREEN E. SEEGER — Executive Vice President and General CounselMs. Seeger (54) has been Executive Vice President and General Counsel since July 2014. Ms. Seeger joined
American Express from McKesson Corporation, where she served as Executive Vice President, General Counsel andChief Compliance Officer since 2006.
SUSAN SOBBOTT — President, Global Commercial PaymentsMs. Sobbott (51) has been President, Global Commercial Payments since October 2015 and President, Global
Corporate Payments since January 2014. Prior thereto, she had been President, American Express OPEN since 2004.
STEPHEN J. SQUERI — Vice ChairmanMr. Squeri (56) has been Vice Chairman since July 2015. Prior thereto, he had been Group President, Global
Corporate Services since November 2011. Prior thereto, he had been Group President, Global Services since October2009.
ANRÉ WILLIAMS — President, Global Merchant Services and LoyaltyMr. Williams (50) has been President of Global Merchant Services and Loyalty since October 2015 and President,
Global Merchant Services since November 2011. Prior thereto, he had been President, Global Corporate Paymentssince June 2007.
EMPLOYEES
We had approximately 54,800 employees on December 31, 2015.
32

GUIDE 3 – STATISTICAL DISCLOSURE BY BANK HOLDING COMPANIES
You can find certain statistical disclosures required of bank holding companies starting on page A-1, which areincorporated herein by reference.
ITEM 1A. RISK FACTORSThis section highlights specific risks that could affect us and our businesses. You should carefully consider each of the
following risks and all of the other information set forth in this Annual Report on Form 10-K. Based on the informationcurrently known to us, we believe the following information identifies the most significant risk factors affecting us.However, the risks and uncertainties we face are not limited to those described below. Additional risks and uncertaintiesnot presently known to us or that we currently believe to be immaterial may also adversely affect our business.
If any of the following risks and uncertainties develop into actual events or if the circumstances described in therisks and uncertainties occur or continue to occur, these events or circumstances could have a material adverse effecton our business, financial condition or results of operations. These events could also have a negative effect on thetrading price of our securities.
Strategic, Business and Competitive Risks
Difficult economic conditions may materially adversely affect our business and results of operations.
Our results of operations are materially affected by economic conditions, both in the United States and elsewherearound the world. Uncertain expectations for global economic growth have had, and may continue to have, an adverseeffect on us, in part because we are very dependent upon the level of consumer and business activity and the demandfor credit and payment products. A prolonged period of slow economic growth or deterioration in economic conditionscould change customer behaviors, including spending on our cards and the ability and willingness of Card Members topay amounts owed to us. Travel expenditures are sensitive to business and personal discretionary spending levels andalso tend to decline during general economic downturns. Further, economic instability in certain regions or countriescould negatively affect consumer and business spending in other parts of the world. If economic conditions were toworsen, we could experience adverse effects on our results of operations and financial condition.
Factors such as consumer spending, business investment, government spending, interest rates, tax rates, fueland other energy costs, the volatility and strength of the capital markets, inflation and deflation all affect the economicenvironment and, ultimately, our profitability. While the recent drop in oil prices may be beneficial for the U.S.economy overall, it has negatively impacted, and may continue to negatively impact, the amount of gas spending onour cards. An economic downturn characterized by higher unemployment, lower family income, lower consumerspending, lower demand for credit, lower corporate earnings or lower business investment is likely to materially andadversely affect our business, results of operations and financial condition. Furthermore, such factors may cause ourearnings, credit metrics and margins to fluctuate and diverge from expectations of analysts and investors, who mayhave differing assumptions regarding their impact on our business, adversely affecting the trading price of ourcommon shares.
Our operating results may suffer because of substantial and increasingly intense competition worldwide in thepayments industry.
The payments industry is highly competitive, and we compete with a wide variety of financial payment products,including charge, credit and debit card networks and issuers, paper-based transactions (e.g., cash and checks), banktransfer models (e.g., wire transfers and ACH), as well as evolving alternative payment mechanisms, systems andproducts, such as aggregators and web-based payment platforms (e.g., PayPal, Square and Amazon), wirelesspayment technologies (including using mobile telephone networks to carry out transactions), virtual currencies,prepaid systems, gift cards, mobile payments, blockchain and similar distributed ledger technologies, and othersystems linked to payment cards or that provide payment solutions. We also compete with technology companies,telecommunication providers, handset manufacturers, large retailers and retailer coalitions that are seeking tointegrate more financial services into their product offerings.
We are the fourth largest general-purpose card network on a global basis based on purchase volume, behindChina UnionPay, Visa and MasterCard and. We believe Visa and MasterCard are larger than we are in most countries.As a result, competitive card issuers and acquirers on the Visa and MasterCard networks may be able to benefit fromthe dominant position, scale, resources, marketing and pricing of Visa and MasterCard.
Some of our competitors have developed, or may develop, substantially greater financial and other resources thanwe have, including larger cash reserves, may offer a wider range of programs and services than we offer or may usemore effective advertising, marketing or cross-selling strategies to achieve broader brand recognition, cobrand card
33

programs or merchant acceptance than we have. We may not be able to compete effectively against these threats orrespond or adapt to changes in consumer spending habits as effectively as our competitors.
Spending on our cards could continue to be impacted by increasing consumer usage of debit cards issued oncompetitive networks, as well as adoption of payment systems based on ACH or other payment mechanisms. To theextent alternative payment mechanisms, systems and products continue to successfully expand, our discountrevenues and our ability to access transaction data through our closed-loop network could be negatively impacted. Ifwe are not able to differentiate ourselves from our competitors, drive value for our customers and/or effectively growin areas such as mobile and online payments, fee-based services and emerging technologies, we may not be able tocompete effectively against these threats.
To the extent we expand into new business areas and new geographic regions, we may face competitors withmore experience and more established relationships with relevant customers, regulators and industry participants,which could adversely affect our ability to compete. We may face additional compliance and regulatory risk to theextent that we expand into new business areas and we may need to dedicate more expense, time and resources tocomply with regulatory requirements than our competitors, particularly those that are not regulated financialinstitutions. In addition, companies that control access to consumer and merchant payment method preferencesthrough digital wallets, mobile applications or at the point of sale could choose not to accept or could suppress use ofour products or could restrict our access to our customers and transaction data. Such companies could also requirepayments from us to participate in such digital wallets and applications, impacting our profitability on transactions.Laws and business practices that favor local competitors, require card transactions to be routed over domesticnetworks or prohibit or limit foreign ownership of certain businesses could slow our growth in international regions.Further, expanding our service offerings, adding customer acquisition channels and forming new partnerships couldhave higher cost structures than our current arrangements, adversely impact our average discount rate or dilute ourbrand.
Many of our competitors are subject to different, and in some cases, less stringent, legislative and regulatoryregimes. More restrictive laws and regulations that do not apply to all of our competitors can put us at a competitivedisadvantage, including prohibiting us from engaging in certain transactions, regulating our contract terms andpractices governing merchant card acceptance or adversely affecting our cost structure. See “Ongoing legalproceedings regarding provisions in our merchant contracts could have a material adverse effect on our business, resultin additional litigation and/or arbitrations, subject us to substantial monetary damages and damage our reputation andbrand” for a discussion of the potential impact on our ability to compete effectively if ongoing legal proceedings limitour ability to prevent merchants from engaging in various actions to discriminate against our card products.
We face continued intense competitive pressure that may impact the prices we charge merchants that acceptour cards for payment for goods and services.
Unlike our competitors in the payments industry that rely on high revolving credit balances to drive profits, ourbusiness model is focused on Card Member spending. Discount revenue, which represents fees generally charged tomerchants when Card Members use their cards to purchase goods and services on our network, is primarily driven bybilled business volumes and is our largest single revenue source. In recent years, we experienced some reduction inour global weighted average merchant discount rate and have been under increasing market pressure, includingpressure created by regulatory-mandated reductions to competitors’ pricing, to reduce merchant discount rates andundertake other repricing initiatives. We also face pressure from competitors that have other sources of income orlower expense bases that can make their pricing more attractive to key business partners and merchants. Merchantsare also able to negotiate incentives and pricing concessions from us as a condition to accepting our cards. Asmerchants consolidate and become even larger, we may have to increase the amount of incentives and/orconcessions we provide to certain merchants, which could materially and adversely affect our results of operations.Competitive and regulatory pressures on pricing could make it difficult to offset the costs of these incentives.
In addition, differentiated payment models and technologies from non-traditional players in the alternativepayments space and the regulatory and litigation environment could pose challenges to our traditional payment modeland adversely impact our average discount rate. Some merchants also continue to invest in their own paymentsolutions, such as proprietary-branded mobile wallets and the CurrentC app on the Merchant Customer Exchange,using both traditional and new technology platforms. If merchants are able to drive broad consumer adoption andusage, it could adversely impact our merchant discount rate and billed business volumes.
A continuing priority of ours is to drive greater and differentiated value to our merchants, which, if not successful,could negatively impact our discount revenue and financial results. If we continue to experience a decline in theaverage merchant discount rate, we will need to find ways to offset the financial impact by increasing billed businessvolumes, increasing other sources of revenue, such as fee-based revenue or interest income, or both. We may notsucceed in sustaining merchant discount rates or offsetting the impact of declining merchant discount rates,particularly in the current regulatory environment, which could materially and adversely affect our revenues andprofitability, and therefore our ability to invest in innovation and in value-added services to merchants and CardMembers.
34

An increasing prevalence of surcharging by merchants could materially adversely affect our business andresults of operations.
In certain countries, such as Australia and certain Member States in the EU, merchants are permitted by law tosurcharge card purchases. The number of countries in the EU that permit surcharging and the potential for selectivesurcharging of American Express cards only could increase following adoption of new EU-wide regulation, asdiscussed in “Global Network & Merchant Services — Regulation.” In Australia, we have seen increasing merchantsurcharging on American Express cards in certain merchant categories and, in some cases, on a basis that is greaterthan that applied to cards issued on the bankcard networks, which is known as differential surcharging.
If surcharging becomes widespread, American Express cards and credit and charge cards generally could becomeless desirable to consumers, which could result in a decrease in cards-in-force and transaction volumes. The impactcould vary depending on the manner in which a surcharge is levied and whether surcharges are levied upon allpayment cards, whether debit cards are excluded, or whether the amount of the surcharge varies depending on thecard, network, acquirer or issuer. Surcharging could have a material adverse effect on our business, financial conditionand results of operations, particularly to the extent surcharging disproportionately impacts our Card Membersthrough differential surcharging or otherwise.
If we are not able to invest successfully in, and compete at the leading edge of, technological developmentsacross all our businesses, our revenue and profitability could be negatively affected.
Our industry is subject to rapid and significant technological changes. In order to compete in our industry, we needto continue to invest in business process and technology advances across all areas of our business, including intransaction processing, data management and analysis, customer interactions and communications, alternativepayment mechanisms and risk management and compliance systems. Incorporating new technologies into ourproducts and services may require substantial expenditures and take considerable time, and ultimately may not besuccessful. We expect that new technologies in the payments industry will continue to emerge, and these newtechnologies may be superior to, or render obsolete, the technologies we currently use in our products and services.
Our success will depend in part on our ability to innovate by offering new payment services products, develop newtechnologies and adapt to technological changes and evolving industry standards. Consumer and merchant adoptionis a key competitive factor and our competitors may develop products, platforms or technologies that become morewidely adopted than ours. If we are unable to continue to keep pace with innovation, manage the shift to mobile,device-based and multi-channel commerce, drive adoption of new products and services or improve the quality of theCard Member experience, our business and results of operations could be adversely affected.
Our ability to develop, acquire or access competitive technologies or business processes on acceptable termsmay also be limited by intellectual property rights that third parties, including competitors and potential competitors,may assert. In addition, our ability to adopt new technologies may be inhibited by a need for industry-wide standards, achanging legislative and regulatory environment, the need for internal product and engineering expertise, resistance tochange from Card Members or merchants, or the complexity of our systems.
We may not be successful in our efforts to promote card usage through our marketing, promotion, merchantacceptance and rewards programs, or to effectively control the costs of such programs, both of which mayimpact our profitability.
Increasing consumer and business spending on our cards and growing card lending balances depend in part onour ability to develop and issue new or enhanced cards and increase revenues from such products. If customers do notperceive our new offerings as providing significant value, they may fail to accept our new products and services, whichwould negatively impact our results of operations. Increasing spending on our cards also depends on our continuedexpansion of merchant acceptance of our cards. If the rate of merchant acceptance growth slows or reverses itself,our business could suffer.
One of the ways in which we attract new Card Members, reduce Card Member attrition and seek to retain orcapture a greater share of customers’ total spending is through our Membership Rewards program, as well as otherCard Member benefits. Any significant change in, or failure by management to reasonably estimate, actualredemptions of Membership Rewards points and associated redemption costs could adversely affect our profitability.In addition, many credit card issuers have instituted rewards and cobrand programs that are similar to ours, andissuers may in the future institute programs and services that are more attractive than ours.
We have been spending at elevated levels on a number of growth initiatives over the past couple years and expectto continue spending at similar levels in 2016. There can be no assurance that any of our investments to acquire CardMembers and increase usage of our cards will be effective. We may not be able to cost-effectively manage and expandCard Member benefits, including containing the growth of marketing, promotion, rewards and Card Member servicesexpenses in the future. If such expenses continue to increase beyond our expectations, we will need to find ways tooffset the financial impact by increasing payments volume, increasing other areas of revenues such as fee-basedrevenues or both. We may not succeed in doing so, particularly in the current regulatory environment.
35

Our brand and reputation are key assets of our Company, and our business may be affected by how we areperceived in the marketplace.
Our brand and its attributes are key assets of ours, and we believe our continued success depends on our ability topreserve, grow and leverage the value of our brand. Our ability to attract and retain consumer and small business CardMembers and corporate clients is highly dependent upon the external perceptions of our level of service,trustworthiness, business practices, merchant acceptance, financial condition and other subjective qualities. Negativeperceptions or publicity regarding these matters — even if related to seemingly isolated incidents — could erode trustand confidence and damage our reputation among existing and potential Card Members and corporate clients, whichcould make it difficult for us to attract new Card Members and customers and maintain existing ones. Negative publicopinion could also result from actual or alleged conduct in any number of activities or circumstances, including cardpractices, regulatory compliance and the use and protection of customer information, and from actions taken byregulators or others in response to such conduct. Social media channels can also cause rapid, widespread reputationalharm to our brand.
Our brand and reputation may also be harmed by actions taken by third parties that are outside our control. Forexample, any shortcoming of a third-party vendor, merchant acquirer or GNS partner may be attributed by CardMembers and merchants to us, thus damaging our reputation and brand value. The lack of acceptance or suppressionof card usage by merchants can also negatively impact perceptions of our brand and our products, lower overalltransaction volume and increase the attractiveness of other payments systems. Adverse developments with respectto our industry may also, by association, negatively impact our reputation, or result in greater regulatory or legislativescrutiny or litigation against us. Furthermore, as a corporation with headquarters and operations located in the UnitedStates, a negative perception of the United States arising from its political or other positions could harm theperception of our company and our brand. Although we monitor developments for areas of potential risk to ourreputation and brand, negative perceptions or publicity could materially and adversely affect our revenues andprofitability.
If we cannot successfully execute on our strategy, our business and financial results may be adverselyimpacted.
We may not be able to implement important strategic initiatives in accordance with our expectations, which mayresult in an adverse impact on our business and financial results. These strategic initiatives are designed to improveour results of operations and drive long-term shareholder value, and include:
• Growing our Card Member base and merchant network
• Deepening customer relationships through lending and rewards
• Increasing our international presence
• Growing in commercial payments
• Developing newer, adjacent opportunities like our loyalty coalition business
The process of developing new products and services and enhancing existing products and services is complex,costly and uncertain, and any failure by us to anticipate customers’ changing needs and emerging technological trendsaccurately could significantly harm our ability to compete effectively. In addition, we may underestimate the time andexpense we must invest in new products and services before they generate material revenues, if at all.
Our growth strategy also includes the pursuit of new business opportunities and, potentially, acquisitions.However, we may not be able to take advantage of new business opportunities or to identify and secure futureacquisition candidates on terms and conditions that are acceptable to us, which could impair our growth.
We also continue to pursue a disciplined expense-management strategy, although there is no guarantee that wewill be able to control the growth of expenses. Expenses incurred in our foreign entities are subject to foreign exchangevolatility and may cause our expenses to increase in any particular period even if we otherwise achieve cost savings. Inaddition, compliance, legal and related costs are difficult to predict or control given the current environment and mayvary from period to period. As cybersecurity threats continue to evolve, we have invested and will continue to investsignificant additional resources to continue to modify and strengthen our protective security measures, investigateand remediate any vulnerabilities of our information systems and infrastructure and develop new technology tomitigate security risks. If we are unable to successfully manage our expenses, our financial results will be negativelyaffected.
A significant disruption or breach in the security of our information technology systems or an increase infraudulent activity using our cards could lead to reputational damage to our brand and significant legal,regulatory and financial exposure and could reduce the use and acceptance of our charge and credit cards.
We and other third parties process, transmit and store account information in connection with our charge andcredit cards and prepaid products, and in the normal course of our business, we collect, analyze and retain significantvolumes of certain types of personally identifiable and other information pertaining to our customers and employees.
36
Global financial institutions like us have experienced a significant increase in information security risk in recent years andwill likely continue to be the target of increasingly sophisticated cyber-attacks, including computer viruses, malicious ordestructive code, social engineering attacks (including phishing), denial of service attacks and security breaches. Forexample, we and other U.S. financial services providers have been the targets of distributed denial-of-service attacks fromsophisticated third parties.
Our networks and systems are subject to constant attempts to identify and exploit potential vulnerabilities in ouroperating environment with intent to disrupt our business operations and capture various types of information relating tocorporate trade secrets, customer information, including Card Member and loyalty program account information, employeeinformation and other sensitive business information. There are a number of motivations for cyber threat actors, includingcriminal activities such as fraud, identity theft and ransom, corporate or nation-state espionage, public embarrassment withthe intent to cause financial or reputational harm, intent to disrupt information technology systems, and to expose andexploit potential security and privacy vulnerabilities in corporate systems and websites. As outsourcing and specialization offunctions within the payments industry increase, there are more third parties involved in processing transactions using ourcards and there is a risk the confidentiality, privacy and/or security of data held by third parties, including merchants thataccept our cards and our business partners, may be compromised, which could lead to unauthorized transactions on ourcards and costs associated with responding to the compromise.
We develop and maintain systems and processes aimed at detecting and preventing data breaches and fraudulentactivity, which require significant investment, maintenance and ongoing monitoring and updating as technologies andregulatory requirements change and as efforts to overcome security measures become more sophisticated. Despite ourefforts, the possibility of data breaches, malicious social engineering and fraudulent or other malicious activities and humanerror or malfeasance cannot be eliminated entirely, and risks associated with each of these remain, including the unauthorizeddisclosure, release, gathering, monitoring, misuse, loss or destruction of confidential, proprietary and other information(including account data information), online accounts and systems. These risks will likely evolve as new technology isdeployed. For example, with the increased use of EMV technology, we may see a decrease in traditional fraud risk, butsophisticated fraudsters may develop new ways to commit fraud and we may see an increase in online fraud.
Our information technology systems, including our transaction authorization, clearing and settlement systems, and datacenters may experience service disruptions or degradation because of technology malfunction, sudden increases in customertransaction volume, natural disasters, accidents, power outages, telecommunications failures, fraud, denial-of-service andother cyber-attacks, terrorism, computer viruses, physical or electronic break-ins, or similar events. Service disruptions couldprevent access to our online services and account information, compromise company or customer data, and impedetransaction processing and financial reporting. Inadequate infrastructure in lesser developed countries could also result inservice disruptions, which could impact our ability to do business in those countries.
If our information technology systems experience a significant disruption or breach or if actual or perceived fraud levels orother illegal activities involving our cards or customer online accounts were to rise due to a data breach at a business partner,merchant or other market participant, employee error, malfeasance or otherwise, it could lead to the loss of data or dataintegrity, regulatory investigations and intervention (such as mandatory card reissuance), increased litigation (including classaction litigation), remediation and response costs, greater concerns of customers and/or business partners relating to theprivacy and security of their data, and reputational and financial damage to our brand, which could reduce the use andacceptance of our cards, and have a material adverse impact on our business. If such disruptions or breaches are not detectedimmediately, their effect could be compounded. Data breaches and other actual or perceived failures to maintainconfidentiality, integrity, privacy and/or data protection, including leaked business data, may also disrupt our operations,undermine our competitive advantage through the disclosure of sensitive company information, divert management attentionand resources and negatively impact the assessment of us and our subsidiaries by banking regulators and rating agencies.
Successful cyber-attacks or data breaches at other large financial institutions, large retailers or other market participants,whether or not we are impacted, could lead to a general loss of customer confidence that could negatively affect us, includingharming the market perception of the effectiveness of our security measures or the financial system in general, which couldresult in reduced use of our products and services. Although we have insurance for losses related to cyber-risks and attacksand information security and privacy liability, it may not be sufficient to offset the impact of a material loss event.
We face substantial and increasingly intense competition for partner relationships, which could result in a lossor renegotiation of these arrangements that could have a material adverse impact on our business and resultsof operations.
In the ordinary course of our business we enter into different types of contractual arrangements with business partners ina variety of industries. For example, we have partnered with Delta Air Lines, as well as many others globally, to offer cobrandedcards for consumers and small businesses, and through our Membership Rewards program we have partnered withbusinesses in many industries, including the airline industry, to offer benefits to Card Member participants. Competition forrelationships with key business partners is very intense and there can be no assurance we will be able to grow or maintainthese partner relationships. Establishing and retaining attractive cobrand card partnerships is particularly competitive amongcard issuers and networks as these partnerships typically have high-spending loyal customers. Our entire cobrand portfolio
37

accounted for approximately 22 percent of our worldwide billed business for the year ended December 31, 2015. Card Memberloans held for investment related to our cobrand portfolio accounted for approximately 33 percent of our worldwide CardMember loans held for investment as of December 31, 2015, which do not include Card Member loans related to our cobrandpartnerships with Costco Wholesale Corporation in the United States and JetBlue Airways Corporation that were transferredto held for sale on the Consolidated Balance Sheets effective December 1, 2015. See Note 2 to the “Consolidated FinancialStatements” for additional information on loans and receivables held for sale.
We face the risk that we could lose partner relationships, even after we have invested significant resources, timeand expense in acquiring and developing the relationships. The volume of billed business could decline and CardMember attrition could increase, in each case, significantly as a result of the termination of one or more partnershiprelationships. In addition, some of our cobrand arrangements provide that, upon expiration or termination, thecobrand partner may purchase or designate a third party to purchase the receivables generated with respect to itsprogram, which could result in a significant decline in our Card Member loans outstanding. For example, we previouslyannounced that our U.S. cobrand relationship with Costco is set to end in 2016 and we expect to sell the outstandingCard Member loans associated with the Costco portfolio. For a discussion on Costco and our expectations regardingthe portfolio sale, see “Business Environment” under “MD&A.” In November 2015, Starwood Hotels & ResortsWorldwide, with which we have a cobrand relationship, announced that it agreed to be acquired by MarriottInternational, which has a cobrand relationship with a competing card issuer.
We also face the risk that existing relationships will be renegotiated with less favorable terms for us as competitionfor such relationships increases. In 2015, both Card Member rewards expense and cost of Card Member servicesincreased when compared to the prior year, reflecting a portion of the increased costs related to several recentlyrenewed cobrand partnerships.
The loss of business partners (whether by non-renewal at the end of the contract period, such as the end of ourrelationship with Costco in the United States in 2016, or early termination as the result of a merger or otherwise, suchas the withdrawal of American Airlines in 2014 from our Airport Club Access program for Centurion and Platinum CardMembers) or the renegotiation of existing relationships with terms that are significantly worse for us could have amaterial adverse impact on our business and results of operations. In addition, any publicity associated with the loss ofany of our key business partners could harm our reputation, making it more difficult to attract and retain CardMembers and merchants, and could lessen our negotiating power with our remaining and prospective businesspartners.
We have agreements with business partners in a variety of industries, including the airline industry, thatrepresent a significant portion of our business. We are exposed to risks associated with these industries,including bankruptcies, liquidations, restructurings, consolidations and alliances of our partners, and thepossible obligation to make payments to our partners.
We may be obligated to make or accelerate payments to certain business partners such as cobrand partners andmerchants upon the occurrence of certain triggering events such as: (i) our filing for bankruptcy, (ii) our economiccondition deteriorating such that our senior unsecured debt rating is downgraded significantly below investment gradeby S&P and Moody’s, (iii) our ceasing to have a public debt rating, or (iv) a shortfall in certain performance levels. If weare not able to effectively manage these triggering events, we could unexpectedly have to make payments to thesepartners, which could have a negative effect on our financial condition and results of operations.
Similarly, we have credit risk to certain cobrand partners relating to our prepayments for loyalty program pointsthat may not be fully redeemed. We are also exposed to risk from bankruptcies, liquidations, insolvencies, financialdistress, restructurings, consolidations and other similar events that may occur in any industry representing asignificant portion of our billed business, which could negatively impact particular card products and services (andbilled business generally) and our financial condition and results of operations. For example, we could be materiallyimpacted if we were obligated to or elected to reimburse Card Members for products and services purchased frommerchants that have ceased operations or stopped accepting our cards.
The airline industry, which represents a significant portion of our billed business, has undergone bankruptcies,restructurings, consolidations and other similar events in the past. The airline industry accounted for approximatelyeight percent of our worldwide billed business for the year ended December 31, 2015. Our largest airline cobrandportfolio, American Express’ Delta SkyMiles, accounted for approximately six percent of our worldwide billed businessfor the year ended December 31, 2015 and approximately 20 percent of worldwide Card Member loans held forinvestment as of December 31, 2015. We have credit risk to the airline industry to the extent we protect Card Membersagainst non-delivery of goods and services, such as where we have remitted payment to an airline for a Card Memberpurchase of tickets that have not yet been used or “flown.” If we are unable to collect the amount from the airline, wewill bear the loss for the amount credited to the Card Member.
For additional information relating to the general risks related to the airline industry, see “Risk Management —Institutional Credit Risk — Exposure to the Airline Industry” under “MD&A.”
38

We may not be successful in realizing the benefits associated with our strategic alliances, joint ventures andinvestment activity, and our business and reputation could be negatively impacted.
Joint ventures and minority investments inherently involve a lesser degree of control over business operations,thereby potentially increasing the financial, legal, operational and/or compliance risks associated with the jointventure or minority investment. In addition, we may be dependent on joint venture partners, controlling shareholdersor management who may have business interests, strategies or goals that are inconsistent with ours. Businessdecisions or other actions or omissions of the joint venture partner, controlling shareholders or management mayadversely affect the value of our investment, result in litigation or regulatory action against us and otherwise damageour reputation and brand.
As discussed in “Global Commercial Services,” we created a joint venture for our Global Business Traveloperations in 2014. There can be no assurance that we will be able to realize the underlying assumptions related to thejoint venture transaction, including accelerating the transformation and growth of the corporate travel business,creating additional investment capacity and enhancing its suite of products and services. We and the GBT JV face therisk of potential loss of key customers, vendors and other key business partners as a result of the joint venturetransaction. Our failure to address these risks or other problems encountered in connection with the joint venturetransaction could cause us to fail to realize the anticipated benefits of the transaction, incur unanticipated liabilitiesand adversely affect our operations.
We rely on third-party providers of various computer systems, platforms and other services integral to theoperations of our businesses. These third parties may act in ways that could harm our business.
We rely on third-party service providers, merchants, processors, aggregators, GNS partners and other thirdparties for services that are integral to our operations, including the timely transmission of accurate informationacross our global network. If a service provider or other third party fails to provide the data quality, communicationscapacity or services we require, as a result of natural disaster, operational disruptions, terrorism, hacking or othercybersecurity incidents or any other reason, the failure could interrupt or compromise the quality of our services tocustomers.
We are subject to the risk that activities of our third-party service providers may adversely affect our business. Afailure to exercise adequate oversight over third-party service providers, including compliance with service levelagreements or regulatory or legal requirements, could result in regulatory actions, fines, sanctions or economic andreputational harm to us. There is also a risk the confidentiality, integrity, privacy and/or security of data held by thirdparties or communicated over third-party networks or platforms could become compromised, which couldsignificantly harm our business even if the attack or breach does not impact our systems. In addition, the managementof multiple third-party vendors increases our operational complexity and decreases our control. It is also possible thatthe cost efficiencies of certain outsourcings will decrease as the demand for these services increases around theworld.
Our business is subject to the effects of geopolitical events, weather, natural disasters and other conditions.Geopolitical events, terrorist attacks, natural disasters, severe weather conditions, floods, health pandemics,
intrusion into or degradation of our infrastructure by hackers and other catastrophic events can have a negative effecton our business. Because of our proximity to the World Trade Center, our headquarters were damaged as a result ofthe terrorist attacks of September 11, 2001. Similar events or other disasters or catastrophic events in the future andevents impacting other sectors of the economy, including the telecommunications and energy sectors, could have anegative effect on our businesses and infrastructure, including our information technology systems. Because wederive a portion of our revenues from travel-related spending, our business will be sensitive to safety concerns, andthus is likely to decline during periods in which travelers become concerned about safety issues or when travel mightinvolve health-related risks. In addition, disruptions in air travel and other forms of travel caused by such events canresult in the payment of claims under travel interruption insurance policies that we offer and, if such disruptions totravel are prolonged, they can materially adversely affect overall travel-related spending. If the conditions describedabove (or similar ones) result in widespread or lengthy disruptions to travel, they could have a material adverse effecton our results of operations. Card Member spending may also be negatively impacted in areas affected by naturaldisasters or other catastrophic events. The impact of such events on the overall economy may also adversely affectour financial condition or results of operations.
Our success is dependent, in part, upon our executive officers and other key personnel, and the loss of keypersonnel could materially adversely affect our business.
Our success depends, in part, on our executive officers and other key personnel. Our senior management teamhas significant industry experience and would be difficult to replace. The market for qualified individuals is highlycompetitive, and we may not be able to attract and retain qualified personnel or candidates to replace or succeedmembers of our senior management team or other key personnel. As further described in “Supervision andRegulation — Compensation Practices,” our compensation practices are subject to review and oversight by theFederal Reserve and the compensation practices of our U.S. bank subsidiaries are subject to review and oversight bythe FDIC and the OCC. Regulatory review and oversight could further affect our ability to attract and retain ourexecutive officers and other key personnel. The loss of key personnel could materially adversely affect our business.
39

Legal, Regulatory and Compliance RisksOngoing legal proceedings regarding provisions in our merchant contracts could have a material adverse effecton our business, result in additional litigation and/or arbitrations, subject us to substantial monetary damagesand damage our reputation and brand.
The DOJ and certain states’ attorneys general brought an action against us alleging that the provisions in our cardacceptance agreements with merchants that prohibit merchants from discriminating against our card products at thepoint of sale violate the U.S. antitrust laws. Visa and MasterCard, which were also defendants in the DOJ and stateaction, entered into a settlement agreement and have been dismissed as parties pursuant to that agreement, whichwas approved by the court. The settlement enjoins Visa and MasterCard from entering into contracts that prohibitmerchants from engaging in various actions to steer cardholders to other card products or payment forms at the pointof sale. On February 19, 2015, the trial court found that the challenged provisions in American Express cardacceptance agreements were anticompetitive and on April 30, 2015 issued a final judgment prohibiting us fromenforcing certain elements of such provisions. We appealed this judgment and on December 18, 2015, the Court ofAppeals for the Second Circuit stayed the trial court’s judgment pending the issuance of its appellate decision. We arealso a defendant in a number of actions and arbitration proceedings, including proposed class actions, filed bymerchants that challenge the non-discrimination and honor-all-cards provisions in our card acceptance agreementsand seek damages. A description of these legal proceedings is contained in “Legal Proceedings.”
An adverse outcome in these proceedings against us (including an adverse final judgment following appeal in theDOJ and state action) could have a material adverse effect on our business and results of operations, require us tochange our merchant agreements in a way that could expose our cards to increased merchant steering and otherforms of discrimination that could impair the Card Member experience, result in additional litigation and/orarbitrations, impose substantial monetary damages and damage our reputation and brand. Even if we were notrequired to change our merchant agreements, changes in Visa’s and MasterCard’s policies or practices as a result oflegal proceedings, lawsuit settlements or regulatory actions could result in changes to our business practices andmaterially and adversely impact our profitability.
Our business is subject to significant and extensive government regulation and supervision, which couldadversely affect our results of operations and financial condition.
We are subject to extensive government regulation and supervision in jurisdictions around the world. The currentenvironment of additional regulation, enhanced supervision efforts and increased and unpredictable regulatoryinvestigations and enforcement is likely to continue to result in changes to our business practices, products andprocedures, increased costs (including increased compliance costs), and potentially additional penalties and/orrestitution payments to Card Members. In addition, new laws or regulations or changes in the enforcement of existinglaws or regulations applicable to our businesses could impact the profitability of our business activities, limit our abilityto pursue business opportunities or adopt new technologies, require us to change certain of our business practices oralter our relationships with partners, merchants and Card Members, or affect retention of our key personnel. Suchchanges also may require us to invest significant management attention and resources to make any necessarychanges and could adversely affect our results of operations and financial condition.
If we fail to satisfy regulatory requirements to maintain our financial holding company status, our financialcondition and results of operations could be adversely affected, and we may be restricted in our ability to take certaincapital actions (such as declaring dividends or repurchasing outstanding shares) or engage in certain activities oracquisitions. Additionally, our banking regulators have wide discretion in the examination and the enforcement ofapplicable banking statutes and regulations and may restrict our ability to engage in certain activities or acquisitions orrequire us to maintain more capital.
In recent years, legislators and regulators have focused on the operation of card networks, including interchangefees paid to card issuers in payment networks such as Visa and MasterCard and the fees merchants are charged toaccept cards. Fee regulation can significantly negatively impact the discount revenue derived from our business,including as a result of downward pressure on our discount rate from decreases in competitor pricing in connectionwith caps on interchange fees. In some cases, such regulation extends to certain aspects of our business, for example,GNS or cobrand arrangements or terms of card acceptance for merchants, including terms relating to non-discrimination and honor-all-cards. We have brought a legal challenge and seek a ruling from the EU Court of Justice toinvalidate the application of price caps in circumstances where three-party networks issue cards with a cobrandpartner. There can be no assurance that our legal challenge will be successful. For a description of certain regulationsand their impact on us, see “Global Network & Merchant Services — Regulation.” Legislators and regulators aroundthe world are aware of each other’s approaches to the regulation of the payments industry. Consequently, adevelopment in one country, state or region may influence regulatory approaches in another.
We are subject to certain provisions of the Bank Secrecy Act, as amended by the Patriot Act, with regard tomaintaining effective AML programs. Increased regulatory focus in this area could result in additional obligations orrestrictions with respect to the types of products and services we may offer to consumers, the countries in which ourcards may be used, and the types of customers and merchants who can obtain or accept our cards. Activity such asmoney laundering or terrorist financing involving our cards could result in enforcement action, and our reputation may
40

suffer due to our customers’ association with certain countries, persons or entities or the existence of any suchtransactions. In addition, Member States of the European Economic Area have implemented the PSD for electronicpayment services that put in place a common legal framework for licensing and supervision of payment servicesproviders, including card issuers and merchant acquirers, and for their conduct of business. Complying with these andother regulations increases our costs and could reduce our revenue opportunities.
Various regulatory agencies and legislatures are also considering regulations and legislation covering identitytheft, account management guidelines, credit bureau reporting, disclosure rules, security and marketing that wouldimpact us directly, in part due to increased scrutiny of our underwriting and account management standards. Thesenew requirements may restrict our ability to issue charge and credit cards or partner with other financial institutions,which could adversely affect our revenue growth.
See “Supervision and Regulation” for more information about the material laws and regulations to which we are subject.
Litigation and regulatory actions could subject us to significant fines, penalties, judgments and/orrequirements resulting in significantly increased expenses, damage to our reputation and/or a materialadverse effect on our business.
Businesses in the financial services and payments industries have historically been subject to significant legalactions, including class action lawsuits. Many of these actions have included claims for substantial compensatory orpunitive damages. While we have historically relied on our arbitration clause in agreements with customers to limit ourexposure to class action litigation, there can be no assurance that we will continue to be successful in enforcing ourarbitration clause in the future. On October 7, 2015, the CFPB announced a proposal that would, among other changes,require that our consumer arbitration clause not apply to cases filed in court as class actions, unless and until classcertification is denied or the class claims are dismissed. This proposal is the beginning of a rulemaking process thatmay not result in a final rule, if any, becoming effective before 2018. The continued focus of merchants on issuesrelating to the acceptance of various forms of payment may lead to additional litigation and other legal actions. Giventhe inherent uncertainties involved in litigation, and the very large or indeterminate damages sought in some mattersasserted against us, there is significant uncertainty as to the ultimate liability we may incur from litigation matters.
We have been subject to regulatory actions by the CFPB and other regulators and may continue to be involved insuch actions, including governmental inquiries, investigations and enforcement proceedings, in the event ofnoncompliance or alleged noncompliance with laws or regulations. Regulatory action could subject us to significant fines,penalties or other requirements resulting in increased expenses, limitations or conditions on our business activities, anddamage to our reputation and our brand, which could adversely affect our results of operations and financial condition.The recent trend towards larger settlement amounts could lead to more adverse outcomes in any enforcement actionsagainst us in the future. We expect that regulators will continue taking formal enforcement actions against financialinstitutions in addition to addressing supervisory concerns through non-public supervisory actions or findings, whichcould involve restrictions on our activities, among other limitations that could adversely affect our business.
We are subject to capital adequacy and liquidity rules, and if we fail to meet these rules, our business would beadversely affected.
Failure to meet current or future capital or liquidity requirements, including those imposed by the New Capital Rules,the LCR or by regulators in implementing other portions of the Basel III framework, could compromise our competitiveposition and could result in restrictions imposed by the Federal Reserve, including limiting our ability to pay commonstock dividends, repurchase our common stock, invest in our business, expand our business or engage in acquisitions.
There continues to be substantial uncertainty regarding significant portions of the capital and liquidity regime that will applyto us and our U.S. bank subsidiaries. As a result, the ultimate impact on our long-term capital and liquidity planning and ourresults of operations is not certain, although an increase in our capital and liquid asset levels could lower our return on equity.
The capital requirements applicable to the Company as a bank holding company and our U.S. bank subsidiaries havebeen substantially revised to implement the international Basel III framework and are in the process of being phased-in.Once these revisions are fully phased-in, the Company and our U.S. bank subsidiaries will be required to satisfy morestringent capital adequacy standards than in the past. As part of our required stress testing, both internally and by theFederal Reserve, we must continue to comply with applicable capital standards in the adverse and severely adverseeconomic scenarios published by the Federal Reserve each year. To satisfy these requirements, it may be necessary for usto hold additional capital in excess of that required by the New Capital Rules as they are phased-in.
Compliance with capital adequacy and liquidity rules, including the New Capital Rules and the LCR, will require a materialinvestment of resources. An inability to meet regulatory expectations regarding our compliance with applicable capitaladequacy and liquidity rules may also negatively impact the assessment of the Company and our U.S. bank subsidiaries byfederal banking regulators.
We continue to progress through the parallel run phase of Basel III advanced approaches implementation.Depending on how the advanced approaches are ultimately implemented for our asset types, our capital ratios
41

calculated under the advanced approaches may be lower than under the standardized approach. In such a case, we mayneed to hold significantly more regulatory capital in order to maintain a given capital ratio.
There are several recent proposals or potential proposals that could significantly impact the regulatory capitalstandards and requirements applicable to financial institutions such as the Company and our U.S. bank subsidiaries,as well as our ability to meet these requirements. The Basel Committee has adopted a framework that would impose acapital buffer on certain banks that may have an important impact on their domestic economies (so-called “domesticsystemically important banks,” or “D-SIBs”). Additionally, the Basel Committee has proposed a series of revisions tothe standardized approach for credit and operational risk capital requirements. If these or other proposals are adoptedin the United States and applied to advanced approaches institutions, we could be required to hold significantly morecapital.
For more information on capital adequacy requirements, see “Capital Adequacy” and “Liquidity Regulation” under“Supervision and Regulation.”
We are subject to restrictions that limit our ability to pay dividends and repurchase our capital stock. Oursubsidiaries are also subject to restrictions that limit their ability to pay dividends to us, which may adverselyaffect our liquidity.
We are limited in our ability to pay dividends and repurchase capital stock by our regulators who have broadauthority to prohibit any action that would be considered an unsafe or unsound banking practice. For example, we aresubject to a requirement to submit capital plans that include, among other things, projected dividend payments andrepurchases of capital stock to the Federal Reserve for review. As part of the capital planning and stress testingprocess, our proposed capital actions are assessed against our ability to satisfy applicable capital requirements in theevent of a stressed market environment. If our capital plan is not approved for any reason or if we fail to satisfyapplicable capital requirements, our ability to undertake capital actions may be restricted. A failure to increasedividends along with our competitors, or any reduction of, or elimination of, our common stock dividend or sharerepurchase program would likely adversely affect the market price of our common stock and market perceptions ofAmerican Express.
Our ability to declare or pay dividends on, or purchase, redeem or otherwise acquire, shares of our common stockwill be prohibited, subject to certain exceptions, in the event that we do not declare and pay in full dividends for the lastpreceding dividend period of our Series B and Series C preferred stock.
American Express Company relies on dividends from its subsidiaries for liquidity, and federal and state law limitthe amount of dividends that our subsidiaries may pay to the parent company. In particular, our U.S. bank subsidiariesare subject to various statutory and regulatory limitations on their declaration and payment of dividends. Theselimitations may hinder our ability to access funds we may need to make payments on our obligations, make dividendpayments on outstanding American Express Company capital stock or otherwise achieve strategic objectives.
For more information on bank holding company and depository institution dividend restrictions, see “Dividends”under “Supervision and Regulation,” as well as “Consolidated Capital Resources and Liquidity — Share Repurchasesand Dividends” under “MD&A” and Note 23 to our Consolidated Financial Statements.
Regulation in the areas of privacy, data protection and information security could increase our costs and affector limit our business opportunities and how we collect and/or use personal information.
As privacy, data protection and information security laws are interpreted and applied, compliance costs mayincrease, particularly in the context of ensuring that adequate data protection and data transfer mechanisms are inplace. In recent years, there has been increasing regulatory enforcement and litigation activity in the areas of privacy,data protection and information security in the United States and in various countries in which we operate.
In addition, legislators and/or regulators in the United States and other countries in which we operate areincreasingly adopting or revising privacy, data protection and information security laws that potentially could havesignificant impact on our current and planned privacy, data protection and information security-related practices, ourcollection, use, sharing, retention and safeguarding of consumer and/or employee information, and some of ourcurrent or planned business activities. New legislation or regulation could increase our costs of compliance andbusiness operations and could reduce revenues from certain business initiatives. Moreover, the application of existingor new laws to existing technology and practices can be uncertain and may lead to additional compliance risk and cost.
Compliance with current or future privacy, data protection and information security laws relating to customerand/or employee data could result in higher compliance and technology costs and could restrict our ability to fullymaximize our closed-loop capability or provide certain products and services, which could materially and adverselyaffect our profitability. Our failure to comply with privacy, data protection and information security laws could result inpotentially significant regulatory and/or governmental investigations and/or actions, litigation, fines, sanctions,ongoing regulatory monitoring, customer attrition, decreases in the use or acceptance of our cards and damage to ourreputation and our brand.
42
We may not be able to effectively manage the operational and compliance risks to which we are exposed.
We consider operational risk to be the risk of not achieving business objectives due to inadequate or failedprocesses or information systems, poor data quality, human error or the external environment (i.e., natural disasters).Operational risk includes, among others, the risk that employee error or intentional misconduct could result in amaterial financial misstatement; a failure to monitor a third party’s compliance with a service level agreement orregulatory or legal requirements; or a failure to adequately monitor and control access to data in our systems we grantto third-party service providers. As processes are changed, or new products and services are introduced, we may notfully appreciate or identify new operational risks that may arise from such changes. Compliance risk arises from thefailure to adhere to applicable laws, rules, regulations and internal policies and procedures. Operational andcompliance risks can expose us to reputational risks as well as fines, civil money penalties or payment of damages andcan lead to diminished business opportunities and diminished ability to expand key operations.
If we are not able to protect our intellectual property, our revenue and profitability could be negativelyaffected.
We rely on a variety of measures to protect our intellectual property and proprietary information, includingcopyrights, trademarks, patents and controls on access and distribution. These measures may not preventmisappropriation of our proprietary information or infringement of our intellectual property rights and a resulting loss ofcompetitive advantage. In addition, competitors or other third parties may allege that our systems, processes ortechnologies infringe on their intellectual property rights. Given the complex, rapidly changing and competitivetechnological and business environment in which we operate, and the potential risks and uncertainties of intellectualproperty-related litigation, a future assertion of an infringement claim against us could cause us to lose significantrevenues, incur significant license, royalty or technology development expenses, or pay significant monetary damages.
Tax legislative initiatives or assessments by governmental authorities could adversely affect our results ofoperations and financial condition.
We are subject to income and other taxes in the United States and in various foreign jurisdictions. The laws andregulations related to tax matters are extremely complex and subject to varying interpretations. Althoughmanagement believes our positions are reasonable, we are subject to audit by the Internal Revenue Service and by taxauthorities in all the jurisdictions in which we conduct business operations. These tax authorities may challenge ourpositions or apply existing laws and regulations more broadly, which may potentially result in a significant increase inliabilities for taxes and interest in excess of accrued liabilities.
New tax legislative initiatives may be proposed from time to time, such as proposals for comprehensive tax reformin the United States, which may impact our effective tax rate and could adversely affect our tax positions or taxliabilities. In addition, unilateral or multi-jurisdictional actions by various tax authorities, including an increase in taxaudit activity, to address “base erosion and profit shifting” by multinational companies could also have an adverseimpact on our tax liabilities.
Credit, Liquidity and Market Risks
Our risk management policies and procedures may not be effective.
Our risk management framework seeks to identify and mitigate risk and appropriately balance risk and return. Wehave established policies and procedures intended to identify, monitor and manage the types of risk to which we aresubject, including credit risk, market risk, asset liability risk, liquidity risk, operational risk, compliance risk, model riskand reputational risk. See “Risk Management” under “MD&A” for a discussion of the policies and procedures we use toidentify, monitor and manage the risks we assume in conducting our businesses. Although we have devoted significantresources to develop our risk management policies and procedures and expect to continue to do so in the future, thesepolicies and procedures, as well as our risk management techniques such as our hedging strategies, may not be fullyeffective. There may also be risks that exist, or that develop in the future, that we have not appropriately anticipated,identified or mitigated. As regulations and markets in which we operate continue to evolve, our risk managementframework may not always keep sufficient pace with those changes. If our risk management framework does noteffectively identify or mitigate our risks, we could suffer unexpected losses and could be materially adversely affected.
Management of our risks in some cases depends upon the use of analytical and/or forecasting models. Although wehave a governance framework for model development and independent model validation, the modeling methodologycould be erroneous or the models could be misused. If our decisions are based on incorrect or misused model outputsand reports, we may face adverse consequences, such as financial loss, poor business and strategic decision-making, ordamage to our reputation. In addition, some decisions our regulators make, including those related to our capitaldistribution plans, may be adversely impacted if they perceive the quality of our models to be insufficient.
43

We may not be able to effectively manage credit risk related to consumer debt, business loans, settlementwith GNS partners, merchant and consumer bankruptcies, delinquencies and other credit trends that canaffect spending on card products, debt payments by individual and corporate customers and businesses thataccept our card products, which could have a material adverse effect on our results of operations and financialcondition.
We are exposed to both individual credit risk, principally from consumer and small business Card Memberreceivables and loans, and institutional credit risk from merchants, GNS partners, GCS clients, Plenti partners andtreasury and investment counterparties. Third parties may default on their obligations to us due to bankruptcy, lack ofliquidity, operational failure or other reasons. Country, regional and political risks can contribute to credit risk. Ourability to assess creditworthiness may be impaired if the criteria or models we use to manage our credit risk becomeless predictive of future losses, which could cause our losses to rise and have a negative impact on our results ofoperations. Rising delinquencies and rising rates of bankruptcy are often precursors of future write-offs and mayrequire us to increase our reserve for loan losses. After write-off and delinquency rates reached historical lows, theyhave recently leveled out and begun to increase in line with our expectations. Higher write-off rates and an increase inour reserve for loan losses adversely affect our profitability and the performance of our securitizations, and mayincrease our cost of funds. In addition, our ability to recover amounts that we have previously written off may belimited, which could have a negative impact on our revenues.
Although we make estimates to provide for credit losses in our outstanding portfolio of loans and receivables,these estimates may not be accurate. In addition, the information we use in managing our credit risk may beinaccurate or incomplete. Although we regularly review our credit exposure to specific clients and counterparties andto specific industries, countries and regions that we believe may present credit concerns, default risk may arise fromevents or circumstances that are difficult to foresee or detect, such as fraud. We may also fail to receive fullinformation with respect to the credit risks of our customers. In addition, our ability to manage credit risk may beadversely affected by legal or regulatory changes (such as bankruptcy laws and minimum payment regulations).Increased credit risk, whether resulting from underestimating the credit losses inherent in our portfolio of loans andreceivables, deteriorating economic conditions, changes in our mix of business or otherwise, could require us toincrease our provision for losses and could have a material adverse effect on our results of operations and financialcondition.
Adverse financial market conditions may significantly affect our ability to meet liquidity needs, access tocapital and cost of capital.
We need liquidity to pay merchants, operating and other expenses, interest on debt and dividends on capital stockand to repay maturing liabilities. If we are unsuccessful in managing our liquidity risk, we may maintain too muchliquidity, which can be costly and limit financial flexibility; or we may be too illiquid, which could limit our investments ingrowth opportunities, curtail operations or result in financial distress during a liquidity event.
The principal sources of our liquidity are payments from Card Members and merchants, cash flow from ourinvestment portfolio and assets, consisting mainly of cash or assets that are readily convertible into cash, direct andthird-party sourced deposits, debt instruments such as unsecured medium- and long-term notes and assetsecuritizations, securitized borrowings through our secured financing facilities, the Federal Reserve discount windowand long-term committed bank borrowing facilities.
Our ability to obtain financing in the debt capital markets for unsecured term debt and asset securitizations isdependent on investor demand. Disruptions, uncertainty or volatility across the financial markets could negativelyimpact market liquidity and limit our access to capital required to operate our business. Such market conditions maylimit our ability to replace, in a timely manner, maturing liabilities, satisfy regulatory capital requirements and accessthe capital necessary to grow our business. As such, we may be forced to delay raising capital or bear an unattractivecost to raise capital, which could decrease profitability and significantly reduce financial flexibility. Market disruptionand volatility could have an adverse effect, which may be material, on our ability to access capital and on our business,financial condition and results of operations.
For a further discussion of our liquidity and funding needs, see “Consolidated Capital Resources and Liquidity —Funding Programs and Activities” under “MD&A.”
Any reduction in our and our subsidiaries’ credit ratings could increase the cost of our funding from, andrestrict our access to, the capital markets and have a material adverse effect on our results of operations andfinancial condition.
Rating agencies regularly evaluate us and our subsidiaries, and their ratings of our and our subsidiaries’ long-termand short-term debt are based on a number of factors, including financial strength as well as factors not within ourcontrol, including conditions affecting the financial services industry generally, and the wider state of the economy.Our and our subsidiaries’ ratings could be downgraded at any time and without any notice by any of the ratingagencies, which could, among other things, adversely limit our access to the capital markets and adversely affect thecost and other terms upon which we and our subsidiaries are able to obtain funding.
44

Adverse currency fluctuations and foreign exchange controls could decrease earnings we receive from ourinternational operations and impact our capital.
During 2015, approximately 24 percent of our total revenues net of interest expense were generated fromactivities outside the United States. We are exposed to foreign exchange risk from our international operations, andaccordingly the revenue we generate outside the United States is subject to unpredictable fluctuations if the values ofother currencies change relative to the U.S. dollar, which could have a material adverse effect on our results ofoperations. For the year ended December 31, 2015, foreign currency movements relative to the U.S. dollar negativelyimpacted our net revenues of $32.8 billion by approximately $1.3 billion as the U.S. dollar strengthened against manycurrencies over the course of the year.
We may become subject to exchange control regulations that might restrict or prohibit the conversion of othercurrencies into U.S. dollars. Political and economic conditions in other countries could also impact the availability offoreign exchange for the payment by the local card issuer of obligations arising out of local Card Members’ spendingoutside such country and for the payment of card bills by Card Members who are billed in a currency other than theirlocal currency. Substantial and sudden devaluation of local Card Members’ currency can also affect their ability tomake payments to the local issuer of the card in connection with spending outside the local country. The occurrence ofany of these circumstances could further impact our result of operations.
Interest rate increases could materially adversely affect our earnings.
Interest rates have remained at historically low levels for a prolonged period of time and we expect interest ratesto rise in the future. If the rate of interest we pay on our borrowings increases more than the rate of interest we earn onour loans, our net interest yield, and consequently our net income, could fall. Our interest expense was approximately$1.6 billion for the year ended December 31, 2015. A hypothetical 1.0 percent increase in interest rates would haveresulted in a decrease to our annual net interest income of approximately $216 million as of December 31, 2015. Inaddition, interest rate changes may affect customer behavior, such as impacting the loan balance amounts CardMembers carry on their credit cards or their ability to make payments as higher interest rates lead to higher paymentrequirements, further impacting our results of operations.
For a further discussion of our interest rate risk, see “Risk Management — Market Risk Management Process”under “MD&A.”
The value of our assets or liabilities may be adversely impacted by economic, political or market conditions.
Market risk represents the loss in value of portfolios and financial instruments due to adverse changes in marketvariables, which could negatively impact our financial condition. We held approximately $3.8 billion of investmentsecurities as of December 31, 2015. In the event that actual default rates of these investment securities were tosignificantly change from historical patterns due to challenges in the economy or otherwise, it could have a materialadverse impact on the value of our investment portfolio. Defaults or economic disruptions, even in countries or territoriesin which we do not have material investment exposure, conduct business or have operations, could adversely affect us.
An inability to accept or maintain deposits due to market demand or regulatory constraints could materiallyadversely affect our liquidity position and our ability to fund our business.
As a source of funding, our U.S. bank subsidiaries accept deposits from individuals through third-party brokeragenetworks as well as directly from consumers through American Express Personal Savings. As of December 31, 2015,we had approximately $54.1 billion in total U.S. retail deposits. We face strong competition in the deposit markets,particularly as to brokerage networks. Aggressive pricing throughout the industry may adversely affect our retentionof existing balances and the cost-efficient acquisition of new deposit funds. If we are required to offer higher interestrates to attract or maintain deposits, our funding costs will be adversely impacted. Customers could also close theiraccounts or reduce balances in favor of products and services offered by competitors for reasons other than price,including general dissatisfaction with our products or services and concerns over online security or our reputation.
Our ability to obtain deposit funding and offer competitive interest rates on deposits is also dependent on capitallevels of our U.S. bank subsidiaries. The FDIA in certain circumstances prohibits banks, including Centurion Bank andAmerican Express Bank, from accepting brokered deposits and applies other restrictions, such as a cap on interestrates we may pay. See “Prompt Corrective Action” under “Regulation and Supervision” for additional information. Asignificant amount of our outstanding U.S. retail deposits has been raised through third-party brokerage networks, andsuch deposits are considered brokered deposits for bank regulatory purposes.
While Centurion Bank and American Express Bank were considered “well capitalized” as of December 31, 2015 andhad no restrictions regarding acceptance of brokered deposits or setting of interest rates, there can be no assurancethey will continue to meet this definition. The New Capital Rules, when fully phased in, will require bank holdingcompanies and their bank subsidiaries to maintain substantially more capital, with a greater emphasis on common
45
equity. Additionally, our regulators can adjust the requirements to be “well capitalized” at any time and have authorityto place limitations on our deposit businesses, including the interest rate we pay on deposits. An inability to attract ormaintain deposits in the future could materially adversely affect our liquidity position and our ability to fund ourbusiness.
ITEM 1B. UNRESOLVED STAFF COMMENTSNot applicable.
ITEM 2. PROPERTIESOur principal executive offices are in a 51-story, 2.2 million square foot building located in lower Manhattan on land
leased from the Battery Park City Authority for a term expiring in 2069. We have an approximately 49 percentownership interest in the building and an affiliate of Brookfield Financial Properties owns the remaining approximately51 percent interest in the building. We also lease space in the building from Brookfield’s affiliate.
Other owned or leased principal locations include American Express offices in Fort Lauderdale, Florida, Phoenix,Arizona, Salt Lake City, Utah, Mexico City, Mexico, Sydney, Australia, Singapore, Gurgaon, India, Manila, Philippines,and Brighton, England; the American Express data centers in Phoenix, Arizona and Greensboro, North Carolina; theheadquarters for American Express Services Europe Limited in London, England; and the Amex Bank of Canada andAmex Canada Inc. headquarters in Toronto, Ontario, Canada. We own 40 acres of developable land in Sunrise, Florida,on which we are constructing our new South Florida Campus.
Generally, we lease the premises we occupy in other locations. We believe the facilities we own or occupy suit ourneeds and are well maintained.
ITEM 3. LEGAL PROCEEDINGSIn the ordinary course of business, we and our subsidiaries are subject to various claims, investigations,
examinations, pending and potential legal actions, and other matters relating to compliance with laws and regulations(collectively, “legal proceedings”). We believe we have meritorious defenses to each of these legal proceedings andintend to defend them vigorously. Some of these proceedings are at preliminary stages and seek an indeterminateamount of damages.
We believe we are not a party to, nor are any of our properties the subject of, any legal proceeding that would havea material adverse effect on our consolidated financial condition or liquidity. However, in light of the uncertaintiesinvolved in such matters, it is possible that the outcome of legal proceedings, including the possible resolution ofmerchant claims described later in this section, could have a material impact on our results of operations. In addition,it is possible that significantly increased merchant steering or other actions impairing the Card Member experience asa result of the DOJ case described later in this section could have a material adverse effect on our business. Certainlegal proceedings involving us or our subsidiaries are described below.
For those legal proceedings described in this section where a loss is reasonably possible in future periods, whetherin excess of a related reserve for legal contingencies or where there is no such reserve, and for which we are able toestimate a range of possible loss, the current estimated range is zero to $350 million in excess of any reserves relatedto those matters. This range represents our estimate based on currently available information and does not representour maximum loss exposure; actual results may vary significantly. As such proceedings evolve, including the merchantclaims, we may need to increase our range of possible loss or reserves for legal contingencies. For additionalinformation, see Note 13 to our Consolidated Financial Statements.
Antitrust Matters
In 2010, the DOJ, along with Attorneys General from Arizona, Connecticut, Hawaii (Hawaii has since withdrawn itsclaim), Idaho, Illinois, Iowa, Maryland, Michigan, Missouri, Montana, Nebraska, New Hampshire, Ohio, Rhode Island,Tennessee, Texas, Utah and Vermont filed a complaint in the U.S. District Court for the Eastern District of New Yorkagainst us, MasterCard International Incorporated and Visa, Inc., alleging a violation of Section 1 of the ShermanAntitrust Act (the “DOJ case”). The complaint included allegations that provisions in our merchant agreementsprohibiting merchants from steering a customer to use another network’s card or another type of general-purposecard (“anti-steering” and “non-discrimination” contractual provisions) violate the antitrust laws. The complaint soughta judgment permanently enjoining us from enforcing our non-discrimination contractual provisions. The complaint didnot seek monetary damages.
46

Following a non-jury trial in the DOJ case, the trial court found that the challenged provisions were anticompetitiveand on April 30, 2015, the court issued a final judgment entering a permanent injunction. Following our appeal of thisjudgment, on December 18, 2015, the Court of Appeals for the Second Circuit stayed the trial court’s judgment as wellas related matters before the trial court pending the issuance of its appellate decision.
In addition to the DOJ case, individual merchant cases and a putative class action, collectively captioned In re:American Express Anti-Steering Rules Antitrust Litigation (II), are pending in the Eastern District of New York againstus alleging that our anti-steering provisions in merchant card acceptance agreements violate U.S. antitrust laws. Theindividual merchant cases seek damages in unspecified amounts and injunctive relief. These matters, including a trialpreviously scheduled in the individual merchant cases, have been stayed pending resolution of the appeal in the DOJcase.
Individual merchants have initiated arbitration proceedings raising similar claims concerning the anti-steeringprovisions in our card acceptance agreements and seeking damages. We are vigorously defending against those claims.
In July 2004, we were named as a defendant in another putative class action filed in the Southern District of NewYork and subsequently transferred to the Eastern District of New York, captioned The Marcus Corporation v. AmericanExpress Company, et al., in which the plaintiffs allege an unlawful antitrust tying arrangement between certain of ourcharge cards and credit cards in violation of various state and federal laws. The plaintiffs in this action seek injunctiverelief and an unspecified amount of damages. In December 2013, we announced a proposed settlement of the Marcuscase and the putative class action challenging our anti-steering provisions. The settlement, which provides for certaininjunctive relief for the proposed classes, received preliminary approval in the United States District Court for theEastern District of New York. On August 4, 2015, the court denied final approval of the settlement; further proceedingsare anticipated after resolution of the appeal in the DOJ case.
On March 20, 2015, a shareholder derivative action captioned Lankford v. Chenault, et al., and American ExpressCo. was filed in New York State Supreme Court, New York County. The defendants include current and formerCompany executives, current and former members of the Company’s Board of Directors and the Company itself, as anominal defendant. No demand preceded the filing of the complaint. The complaint alleges that the defendantspermitted and/or caused the Company to violate the antitrust laws through inclusion of its non-discriminationprovisions in merchant contracts, which led to the recent negative result in the DOJ case discussed above. Based onthose allegations, the complaint further alleges: breach of fiduciary duties by disseminating false and misleadinginformation in our SEC filings and other public statements; failure to maintain internal controls, and failure to properlyoversee and manage the Company; unjust enrichment; abuse of control; and gross mismanagement. The amount ofpurported damages is unspecified in the complaint. On October 29, 2015, the court dismissed the action withprejudice; the plaintiff has filed a notice of appeal.
On November 6, 2015, a putative representative action, captioned People of the State of California, ex. rel. DennisHerrera v. American Express Co. et al., was filed in California state court on behalf of the People of California by theSan Francisco City Attorney for the benefit of California merchants that accept American Express cards. Thecomplaint alleges that certain terms in our merchant agreements violate California law and seeks relief in the form of:(1) a declaratory judgment; (2) an injunction preventing us from enforcing those terms; (3) statutory civil penalties inan amount to be determined by the court; (4) restitution for alleged overcharges; and (5) attorney’s fees and cost ofsuit. This action has been stayed pending resolution of the appeal in the DOJ case.
Corporate MattersWe are a defendant in a class action captioned Kaufman v. American Express Travel Related Services, which was
filed on February 14, 2007, and is pending in the United States District Court for the Northern District of Illinois.Plaintiffs’ principal allegation is that our gift cards violated consumer protection statutes because consumers allegedlyhad difficulty spending small residual amounts on the gift cards prior to the imposition of monthly service fees. TheCourt preliminarily certified a settlement class consisting of (with some exceptions) “all purchasers, recipients andholders of all gift cards issued by American Express from January 1, 2002 through the date of preliminary approval ofthe settlement.” A final fairness hearing to consider approval of a class-wide settlement occurred on January 22, 2016.
On July 30, 2015, plaintiff Plumbers and Steamfitters Local 137 Pension Fund, on behalf of themselves and otherpurchasers of American Express stock, filed a suit, captioned Plumbers and Steamfitters Local 137 Pension Fund v.American Express Co., Kenneth I. Chenault and Jeffrey C. Campbell, for violation of federal securities law, alleging thatthe Company deliberately issued false and misleading statements to, and omitted important information from, thepublic relating to the financial importance of the Costco cobrand relationship to the Company, including, but notlimited to, the decision to accelerate negotiations to renew the cobrand agreement. The plaintiff seeks damages andinjunctive relief. We intend to vigorously defend against these claims.
On October 16, 2015, a putative class action, captioned Houssain v. American Express Company, et al., was filed inthe United States District Court for the Southern District of New York against the Company and certain officers of theCompany under the Employee Retirement Income Security Act of 1974 (“ERISA”) relating to disclosures of the Costcocobrand relationship. The complaint alleges that the defendants violated certain ERISA obligations by: allowing the
47

investment of American Express Retirement Savings Plan (“Plan”) assets in American Express common stock whenAmerican Express common stock was not a prudent investment; misrepresenting and failing to disclose material factsto Plan participants in connection with the administration of the Plan; and breaching certain fiduciary obligations. Thesuit seeks, among other remedies, an unspecified amount of damages. We intend to vigorously defend against theseclaims.
U.S. Card Services Matters
In October 2009, a putative class action, captioned Lopez, et al. v. American Express Bank, FSB and AmericanExpress Centurion Bank, was filed in the United States District Court for the Central District of California. Theamended complaint sought to certify a class of California American Express Card Members whose interest rates werechanged from fixed to variable in or around August 2009 or otherwise increased. On August 20, 2014, plaintiffs filed anamended nationwide complaint and an unopposed motion for preliminary approval of a settlement of the claimsalleged in that complaint. The settlement provides for certain relief to class members, attorneys’ fees and costs of upto $6 million. The court granted preliminary approval of the settlement on February 3, 2016. The final approval hearingis scheduled for October 17, 2016.
ITEM 4. MINE SAFETY DISCLOSURESNot applicable.
PART II
ITEM 5. MARKET FOR REGISTRANT’S COMMON EQUITY, RELATEDSTOCKHOLDER MATTERS AND ISSUER PURCHASESOF EQUITY SECURITIES
(a) Our common stock trades principally on The New York Stock Exchange under the trading symbol AXP. As ofDecember 31, 2015, we had 24,704 common shareholders of record. You can find price and dividend informationconcerning our common stock in Note 27 to our Consolidated Financial Statements. For information on dividendrestrictions, see “Dividends” under “Supervision and Regulation” and Note 23 to our Consolidated Financial Statements.You can find information on securities authorized for issuance under our equity compensation plans under the caption“Item 4 — Approval of American Express Company 2016 Incentive Compensation Plan — Equity Compensation Plans” tobe contained in the Company’s definitive 2016 proxy statement for our Annual Meeting of Shareholders, which isscheduled to be held on May 2, 2016. The information to be found under such caption is incorporated herein byreference. Our definitive 2016 proxy statement for our Annual Meeting of Shareholders is expected to be filed with theSEC in March 2016 (and, in any event, not later than 120 days after the close of our most recently completed fiscal year).
Stock Performance Graph
The information contained in this Stock Performance Graph section shall not be deemed to be “soliciting material”or “filed” or incorporated by reference in future filings with the SEC, or subject to the liabilities of Section 18 of theExchange Act, except to the extent that we specifically incorporate it by reference into a document filed under theSecurities Act or the Exchange Act.
The following graph compares the cumulative total shareholder return on our common shares with the total returnon the S&P 500 Index and the S&P Financial Index for the last five years. It shows the growth of a $100 investment onDecember 31, 2010, including the reinvestment of all dividends.
48

Cumulative Value of $100 Invested on December 31, 2010 $250 $200 $150 $100 $50 $0 Dec 2010 Dec 2011 Dec 2012Dec 2013 Dec 2014 Dec 2015 AXP S&P 500 Index S&P Financial Index
Cumulative Value of $100 Invested on December 31, 2010
$250
$200
$150
$100
$50
$0Dec 2010 Dec 2011 Dec 2012 Dec 2013 Dec 2014 Dec 2015
AXP
S&P 500 Index
S&P Financial Index
Year-end Data 2010 2011 2012 2013 2014 2015
American Express . . . . . . . . . . . . . . . . . . . . . . . . . . . . . . . . $100.00 $111.62 $137.94 $220.48 $228.57 $ 173.21S&P 500 Index . . . . . . . . . . . . . . . . . . . . . . . . . . . . . . . . . . . $100.00 $102.11 $ 118.44 $ 156.78 $ 178.22 $180.67S&P Financial Index . . . . . . . . . . . . . . . . . . . . . . . . . . . . . . . $100.00 $ 82.94 $106.78 $ 144.79 $166.76 $ 164.15
(b) Not applicable.
(c) Issuer Purchases of Securities
The table below sets forth the information with respect to purchases of our common stock made by us or on ourbehalf during the quarter ended December 31, 2015.
Total Numberof Shares
PurchasedAverage Price
Paid Per Share
Total Number ofShares
Purchased asPart of Publicly
Announced Plansor Programs (c)
MaximumNumber
of Shares thatMay Yet Be
Purchased Underthe Plans or
Programs
October 1-31, 2015Repurchase program (a) . . . . . . . . . . . . . . . . . . . . . . . . . 2,094,706 $ 74.01 2,904,706 119,805,248Employee transactions (b) . . . . . . . . . . . . . . . . . . . . . . . . 708 $74.43 N/A N/A
November 1-30, 2015Repurchase program (a) . . . . . . . . . . . . . . . . . . . . . . . . . 6,869,147 $ 72.61 6,869,147 112,936,101Employee transactions (b) . . . . . . . . . . . . . . . . . . . . . . . . 38,984 $73.26 N/A N/A
December 1-31, 2015Repurchase program (a) . . . . . . . . . . . . . . . . . . . . . . . . . 7,290,800 $69.93 7,290,800 105,645,301Employee transactions (b) . . . . . . . . . . . . . . . . . . . . . . . . 6,431 $68.64 N/A N/A
TotalRepurchase program (a) . . . . . . . . . . . . . . . . . . . . . . . . . 16,254,653 $ 71.59 16,254,653 105,645,301Employee transactions (b) . . . . . . . . . . . . . . . . . . . . . . . . 46,123 $72.63 N/A N/A
(a) On May 12, 2015, we announced the authorization to repurchase up to 150 million shares of our common stock from time to time, in accordancewith the our capital distribution plans approved by the Federal Reserve and subject to market conditions. This authorization replaced the priorrepurchase authorization and does not have an expiration date.
(b) Includes: (i) shares surrendered by holders of employee stock options who exercised options (granted under our incentive compensation plans)in satisfaction of the exercise price and/or tax withholding obligation of such holders and (ii) restricted shares withheld (under the terms ofgrants under our incentive compensation plans) to offset tax withholding obligations that occur upon vesting and release of restricted shares.Our incentive compensation plans provide that the value of the shares delivered or attested to, or withheld, be based on the price of ourcommon stock on the date the relevant transaction occurs.
(c) Share purchases under publicly announced programs are made pursuant to open market purchases or privately negotiated transactions(including employee benefit plans) as market conditions warrant and at prices we deem appropriate.
49
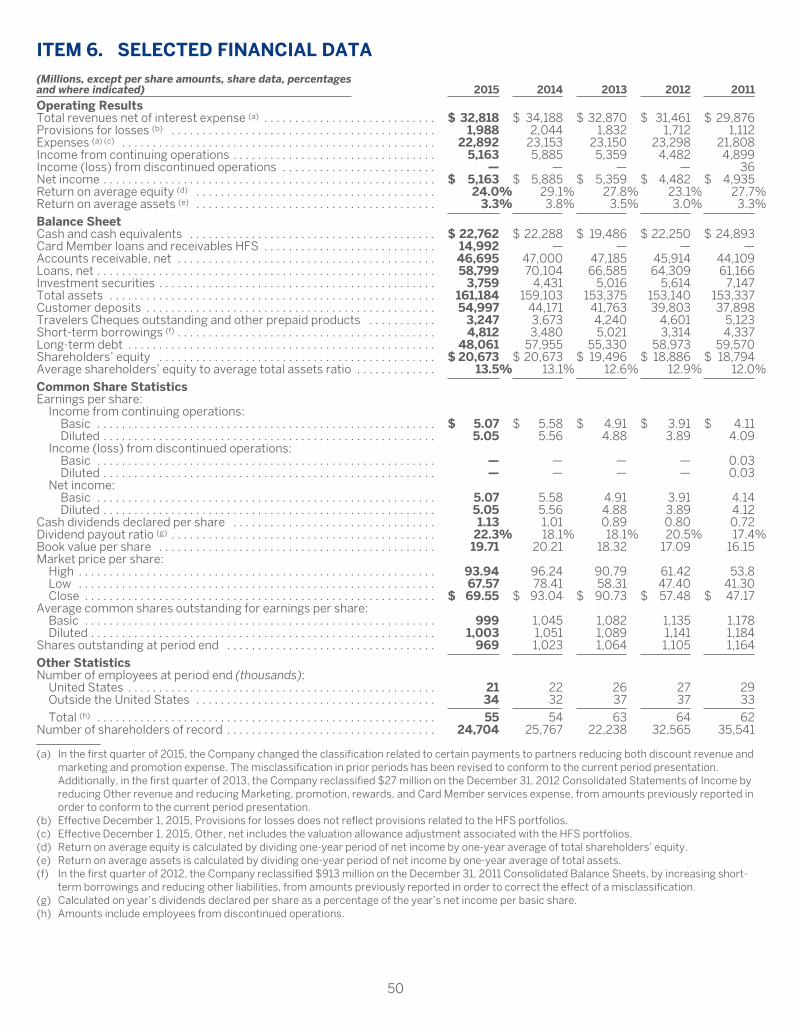
ITEM 6. SELECTED FINANCIAL DATA
(Millions, except per share amounts, share data, percentagesand where indicated) 2015 2014 2013 2012 2011
Operating ResultsTotal revenues net of interest expense (a) . . . . . . . . . . . . . . . . . . . . . . . . . . . . $ 32,818 $ 34,188 $ 32,870 $ 31,461 $ 29,876Provisions for losses (b) . . . . . . . . . . . . . . . . . . . . . . . . . . . . . . . . . . . . . . . . . . . 1,988 2,044 1,832 1,712 1,112Expenses (a) (c) . . . . . . . . . . . . . . . . . . . . . . . . . . . . . . . . . . . . . . . . . . . . . . . . . . . 22,892 23,153 23,150 23,298 21,808Income from continuing operations . . . . . . . . . . . . . . . . . . . . . . . . . . . . . . . . . 5,163 5,885 5,359 4,482 4,899Income (loss) from discontinued operations . . . . . . . . . . . . . . . . . . . . . . . . . — — — — 36Net income . . . . . . . . . . . . . . . . . . . . . . . . . . . . . . . . . . . . . . . . . . . . . . . . . . . . . . $ 5,163 $ 5,885 $ 5,359 $ 4,482 $ 4,935Return on average equity (d) . . . . . . . . . . . . . . . . . . . . . . . . . . . . . . . . . . . . . . . 24.0% 29.1% 27.8% 23.1% 27.7%Return on average assets (e) . . . . . . . . . . . . . . . . . . . . . . . . . . . . . . . . . . . . . . . 3.3% 3.8% 3.5% 3.0% 3.3%
Balance SheetCash and cash equivalents . . . . . . . . . . . . . . . . . . . . . . . . . . . . . . . . . . . . . . . . $ 22,762 $ 22,288 $ 19,486 $ 22,250 $ 24,893Card Member loans and receivables HFS . . . . . . . . . . . . . . . . . . . . . . . . . . . . 14,992 — — — —Accounts receivable, net . . . . . . . . . . . . . . . . . . . . . . . . . . . . . . . . . . . . . . . . . . 46,695 47,000 47,185 45,914 44,109Loans, net . . . . . . . . . . . . . . . . . . . . . . . . . . . . . . . . . . . . . . . . . . . . . . . . . . . . . . . 58,799 70,104 66,585 64,309 61,166Investment securities . . . . . . . . . . . . . . . . . . . . . . . . . . . . . . . . . . . . . . . . . . . . . 3,759 4,431 5,016 5,614 7,147Total assets . . . . . . . . . . . . . . . . . . . . . . . . . . . . . . . . . . . . . . . . . . . . . . . . . . . . . 161,184 159,103 153,375 153,140 153,337Customer deposits . . . . . . . . . . . . . . . . . . . . . . . . . . . . . . . . . . . . . . . . . . . . . . . 54,997 44,171 41,763 39,803 37,898Travelers Cheques outstanding and other prepaid products . . . . . . . . . . . 3,247 3,673 4,240 4,601 5,123Short-term borrowings (f) . . . . . . . . . . . . . . . . . . . . . . . . . . . . . . . . . . . . . . . . . . 4,812 3,480 5,021 3,314 4,337Long-term debt . . . . . . . . . . . . . . . . . . . . . . . . . . . . . . . . . . . . . . . . . . . . . . . . . . 48,061 57,955 55,330 58,973 59,570Shareholders’ equity . . . . . . . . . . . . . . . . . . . . . . . . . . . . . . . . . . . . . . . . . . . . . $ 20,673 $ 20,673 $ 19,496 $ 18,886 $ 18,794Average shareholders’ equity to average total assets ratio . . . . . . . . . . . . . 13.5% 13.1% 12.6% 12.9% 12.0%
Common Share StatisticsEarnings per share:
Income from continuing operations:Basic . . . . . . . . . . . . . . . . . . . . . . . . . . . . . . . . . . . . . . . . . . . . . . . . . . . . . . . $ 5.07 $ 5.58 $ 4.91 $ 3.91 $ 4.11Diluted . . . . . . . . . . . . . . . . . . . . . . . . . . . . . . . . . . . . . . . . . . . . . . . . . . . . . . 5.05 5.56 4.88 3.89 4.09
Income (loss) from discontinued operations:Basic . . . . . . . . . . . . . . . . . . . . . . . . . . . . . . . . . . . . . . . . . . . . . . . . . . . . . . . — — — — 0.03Diluted . . . . . . . . . . . . . . . . . . . . . . . . . . . . . . . . . . . . . . . . . . . . . . . . . . . . . . — — — — 0.03
Net income:Basic . . . . . . . . . . . . . . . . . . . . . . . . . . . . . . . . . . . . . . . . . . . . . . . . . . . . . . . 5.07 5.58 4.91 3.91 4.14Diluted . . . . . . . . . . . . . . . . . . . . . . . . . . . . . . . . . . . . . . . . . . . . . . . . . . . . . . 5.05 5.56 4.88 3.89 4.12
Cash dividends declared per share . . . . . . . . . . . . . . . . . . . . . . . . . . . . . . . . . 1.13 1.01 0.89 0.80 0.72Dividend payout ratio (g) . . . . . . . . . . . . . . . . . . . . . . . . . . . . . . . . . . . . . . . . . . . 22.3% 18.1% 18.1% 20.5% 17.4%Book value per share . . . . . . . . . . . . . . . . . . . . . . . . . . . . . . . . . . . . . . . . . . . . . 19.71 20.21 18.32 17.09 16.15Market price per share:
High . . . . . . . . . . . . . . . . . . . . . . . . . . . . . . . . . . . . . . . . . . . . . . . . . . . . . . . . . . 93.94 96.24 90.79 61.42 53.8Low . . . . . . . . . . . . . . . . . . . . . . . . . . . . . . . . . . . . . . . . . . . . . . . . . . . . . . . . . . 67.57 78.41 58.31 47.40 41.30Close . . . . . . . . . . . . . . . . . . . . . . . . . . . . . . . . . . . . . . . . . . . . . . . . . . . . . . . . . $ 69.55 $ 93.04 $ 90.73 $ 57.48 $ 47.17
Average common shares outstanding for earnings per share:Basic . . . . . . . . . . . . . . . . . . . . . . . . . . . . . . . . . . . . . . . . . . . . . . . . . . . . . . . . . 999 1,045 1,082 1,135 1,178Diluted . . . . . . . . . . . . . . . . . . . . . . . . . . . . . . . . . . . . . . . . . . . . . . . . . . . . . . . . 1,003 1,051 1,089 1,141 1,184
Shares outstanding at period end . . . . . . . . . . . . . . . . . . . . . . . . . . . . . . . . . . 969 1,023 1,064 1,105 1,164
Other StatisticsNumber of employees at period end (thousands):
United States . . . . . . . . . . . . . . . . . . . . . . . . . . . . . . . . . . . . . . . . . . . . . . . . . . 21 22 26 27 29Outside the United States . . . . . . . . . . . . . . . . . . . . . . . . . . . . . . . . . . . . . . . 34 32 37 37 33
Total (h) . . . . . . . . . . . . . . . . . . . . . . . . . . . . . . . . . . . . . . . . . . . . . . . . . . . . . . . 55 54 63 64 62Number of shareholders of record . . . . . . . . . . . . . . . . . . . . . . . . . . . . . . . . . . 24,704 25,767 22,238 32,565 35,541
(a) In the first quarter of 2015, the Company changed the classification related to certain payments to partners reducing both discount revenue andmarketing and promotion expense. The misclassification in prior periods has been revised to conform to the current period presentation.Additionally, in the first quarter of 2013, the Company reclassified $27 million on the December 31, 2012 Consolidated Statements of Income byreducing Other revenue and reducing Marketing, promotion, rewards, and Card Member services expense, from amounts previously reported inorder to conform to the current period presentation.
(b) Effective December 1, 2015, Provisions for losses does not reflect provisions related to the HFS portfolios.(c) Effective December 1, 2015, Other, net includes the valuation allowance adjustment associated with the HFS portfolios.(d) Return on average equity is calculated by dividing one-year period of net income by one-year average of total shareholders’ equity.(e) Return on average assets is calculated by dividing one-year period of net income by one-year average of total assets.(f) In the first quarter of 2012, the Company reclassified $913 million on the December 31, 2011 Consolidated Balance Sheets, by increasing short-
term borrowings and reducing other liabilities, from amounts previously reported in order to correct the effect of a misclassification.(g) Calculated on year’s dividends declared per share as a percentage of the year’s net income per basic share.(h) Amounts include employees from discontinued operations.
50

ITEM 7. MANAGEMENT’S DISCUSSION AND ANALYSIS OF FINANCIALCONDITION AND RESULTS OF OPERATIONS (“MD&A”)
EXECUTIVE OVERVIEW
BUSINESS INTRODUCTION
We are a global services company with four reportable operating segments: U.S. Card Services (USCS),International Card Services (ICS), Global Commercial Services (GCS) and Global Network & Merchant Services(GNMS). Refer to “Business” for a discussion of changes to our reportable operating segments, effective in the firstquarter of 2016.
We provide our customers with access to products, insights and experiences that enrich lives and build businesssuccess. Our principal products and services are charge and credit payment card products and travel-related servicesoffered to consumers and businesses around the world. Business travel-related services are offered through a non-consolidated joint venture, American Express Global Business Travel (GBT JV). Prior to July 1, 2014, these businesstravel operations were wholly owned.
We compete in the global payments industry with charge, credit and debit card networks, issuers and acquirers,as well as evolving and growing alternative payment providers. As the payments industry continues to evolve, we faceincreasing competition from non-traditional players that leverage new technologies and customers’ existing accountsand relationships to create payment or other fee-based solutions.
Our products and services are sold globally to diverse customer groups, including consumers, small businesses,mid-sized companies and large corporations. These products and services are sold through various channels,including direct mail, online applications, in-house and third-party sales forces and direct response advertising.
The following types of revenue are generated from our various products and services:
• Discount revenue, our largest revenue source, which represents fees generally charged to merchants whenCard Members use their cards to purchase goods and services at merchants on our network;
• Net card fees, which represent revenue earned from annual card membership fees;
• Travel commissions and fees, which are earned by charging a transaction or management fee to bothcustomers and suppliers for travel-related transactions (business travel commissions and fees includedthrough June 30, 2014);
• Other commissions and fees, which are earned on foreign exchange conversions, card-related fees, such as latefees and assessments, loyalty coalition-related fees and other service fees;
• Other revenue, which represents revenues arising from contracts with partners of our Global Network Services(GNS) business (including commissions and signing fees), insurance premiums earned from Card Membertravel and other insurance programs, prepaid card-related revenues, revenues related to the GBT JV transitionservices agreement, earnings from equity method investments (including the GBT JV after June 30, 2014) andother miscellaneous revenue and fees; and
• Interest on loans, which principally represents interest income earned on outstanding balances.
FINANCIAL HIGHLIGHTS
For 2015, we reported net income of $5.2 billion and diluted earnings per share of $5.05. This compared to $5.9billion of net income and $5.56 diluted earnings per share for 2014, and $5.4 billion of net income and $4.88 dilutedearnings per share for 2013.
2015 results included:
• A $419 million ($335 million after-tax) charge in the fourth quarter, related to Enterprise Growth (EG), that wasdriven primarily by the impairment of goodwill and technology, plus some restructuring costs.
51

2014 results included:
• A $719 million ($453 million after-tax) gain on the sale of our investment in Concur Technologies (Concur) in thefourth quarter;
• A $626 million ($409 million after-tax) gain as a result of the business travel joint venture transaction in thesecond quarter;
• $420 million ($277 million after-tax) of net charges for costs related to reengineering initiatives, including $313million ($206 million after-tax) and $133 million ($90 million after-tax) of restructuring charges in the fourthand second quarter, respectively; and
• A $109 million ($68 million after-tax) charge related to the renewal of our partnership with Delta Air Lines(Delta) in the fourth quarter.
2013 results included:
• A $66 million ($41 million after-tax) charge related to a proposed merchant litigation settlement in the fourthquarter.
In addition, effective December 1, 2015, we transferred the Card Member loans and receivables related to ourcobrand partnerships with Costco Wholesale Corporation (Costco) in the United States and JetBlue AirwaysCorporation (JetBlue) (the HFS portfolios) to Card Member loans and receivables held for sale (HFS) on theConsolidated Balance Sheets. Refer to Note 2 to the “Consolidated Financial Statements” for additional information.
NON-GAAP MEASURES
We prepare our Consolidated Financial Statements in accordance with accounting principles generally accepted inthe United States of America (GAAP). However, certain information included within this report constitutes non-GAAPfinancial measures. Our calculations of non-GAAP financial measures may differ from the calculations of similarly titledmeasures by other companies.
BUSINESS ENVIRONMENT
Our performance in 2015 reflected both the strength of our business and the headwinds we have been managingthroughout the year. Results for the year benefited from healthy loan growth, strong card acquisitions, excellent creditperformance, disciplined operating expense control and the benefits of our strong capital position. Our results were alsochallenged by several factors. First, the cumulative impact from the initial increased costs associated with early renewals ofcertain of our cobrand relationships and the end of our relationship with Costco in Canada negatively impacted our results.Second, the U.S. dollar continued to strengthen as the year progressed. Third, our decision to increase spending on growthinitiatives for the year, consistent with the elevated levels of 2014, further pressured our 2015 earnings. Fourth, theeconomic, regulatory, and competitive environments all became even more challenging as the year progressed.
The combination of these factors resulted in billings and revenue growth rates that were fairly steady throughoutthe year. Billings did grow in 2015, although growth rates decelerated modestly during the second half of the year.International billed business continued to be strong versus the prior year after excluding Canada (due to thetermination of our relationship with Costco Canada last year) and adjusting for foreign currency exchange rates. In theUnited States, we saw softening in billings on the Costco cobrand card, where volumes dropped versus the prior year.Lower gas prices also continued to be a drag on billings. GCS billed business growth continued to slow due, in part, tolower airline volumes and a generally cautious corporate spending environment. Our billings growth rates during thesecond half of 2016 will be impacted by the end of our relationship with Costco in the United States, which is expectedto occur around mid-year.
For the full year, discount revenue was down slightly versus the prior year driven in part by a decline in ourdiscount rate due primarily to the continued rollout of OptBlue, and we anticipate that the discount rate will furtherdecline by a greater amount during 2016, due to the continued expansion of OptBlue, a greater impact frominternational regulatory changes, and continued competitive pressures.
52

Growth in net interest income remained strong during the year, driven by loan growth. Card Member loans held forinvestment were down in 2015 on a reported basis due to the transfer of the Costco and JetBlue loan portfolios to CardMember loans and receivables HFS, effective December 1, 2015. Excluding the HFS portfolios from the prior year,worldwide loans increased. We expect to see strong growth in loans held for investment in 2016, and continue tobelieve there are opportunities to increase our share of lending without significantly changing our overall risk profile.Our credit provision was down versus the prior year, as lending write-off rates remained at lower levels. We expectcontinued growth in loans will contribute to an increase in provisions; we also expect to see some upward pressure onour write-off rates, due primarily to the seasoning of loans related to new Card Members.
Our capital position allowed us to return over $5 billion to our shareholders in the form of dividends and sharerepurchases, representing approximately 105 percent of total capital generated during the year, reflecting our ongoingcommitment to using our capital strength to create value for our shareholders.
As mentioned above, we are now reporting the Costco portfolio as HFS. We expect the sale to close around mid-year 2016 and that our merchant acceptance agreement will extend through the transaction close. The ultimate gainon sale will be determined based on the assets actually sold, but we currently estimate a gain of approximately $1billion. We have not yet signed a definitive agreement and given that we are still several months away from the close,and the Card Member borrowing and paydown trends are difficult to predict in this type of transition, the final gaincould differ from our estimate. We expect the portfolio sale gain will be partially used to fund spending on growthinitiatives throughout 2016, resulting in some unevenness in our quarterly performance. As of December 31, 2015,Costco cobrand accounts were responsible for approximately 19 percent of our worldwide Card Member loans held forinvestment and HFS (combined) and approximately 10 percent of our total cards-in-force. Costco cobrand accountsgenerated approximately 8 percent of our worldwide billed business for the year ended December 31, 2015.Approximately 70 percent of the spending on these accounts occurred outside Costco warehouses. In addition, 1percent of our worldwide billed business for the year ended December 31, 2015, came from spending on other (non-Costco cobrand) American Express cards at Costco warehouses.
In an effort to accelerate and expand our cost control efforts to right size our cost base with the evolving businessenvironment, we have launched, in the first quarter of 2016, cost initiatives that are designed to remove $1 billion fromour overall cost base, which includes total operating expenses plus marketing and promotion costs, by the end of2017. We plan to take action throughout 2016 to drive benefits in 2017 and beyond, which we expect will result inrestructuring charges in 2016.
See “Legal, Regulatory and Compliance Risk” in “Risk Factors” for information on the potential impacts of anadverse decision in the Department of Justice (DOJ) case and related merchant litigations on our business. Fordiscussion of certain legislative and regulatory changes that could have a material adverse effect on our results ofoperations and financial condition, see “Card-Issuing Business and Deposit Programs — Regulation” under “U.S. CardServices,” “International Card Services — Regulation,” “Global Commercial Services — Regulation,” “GlobalNetwork & Merchant Services — Regulation” and “Supervision and Regulation” in “Business.”
53

CONSOLIDATED RESULTS OF OPERATIONS
As a result of the GBT JV transaction, we deconsolidated the Global Business Travel net assets, effective June 30,2014, resulting in a lack of comparability between the periods presented.
As mentioned previously, effective December 1, 2015, we transferred the Card Member loans and receivablesrelated to the HFS portfolios (included in the USCS segment), to Card Member loans and receivables HFS on theConsolidated Balance Sheets. The primary impacts beyond the HFS classification on the Consolidated Balance Sheetsare to provisions for losses and credit metrics, which no longer reflect amounts related to these loans and receivables,as credit costs are reported in Other expenses through a valuation allowance adjustment. Other, non-credit relatedmetrics (i.e., billed business, cards-in-force, net interest yield), continue to reflect amounts related to the HFSportfolios. Refer to Note 2 to the “Consolidated Financial Statements” for additional information.
The relative strengthening of the U.S. dollar over the periods of comparison has had an impact on our results ofoperations. Where meaningful in describing our performance, foreign currency-adjusted amounts, which exclude theimpact of changes in the foreign exchange (FX) rates, have been provided.
TABLE 1: SUMMARY OF FINANCIAL PERFORMANCE
Years Ended December 31,(Millions, except percentages and per share amounts) 2015 2014 2013
Change2015 vs. 2014
Change2014 vs. 2013
Total revenues net of interest expense . . . . . . . . . . . $ 32,818 $34,188 $32,870 $(1,370) (4)% $1,318 4%Provisions for losses . . . . . . . . . . . . . . . . . . . . . . . . . . . 1,988 2,044 1,832 (56) (3) 212 12Expenses . . . . . . . . . . . . . . . . . . . . . . . . . . . . . . . . . . . . 22,892 23,153 23,150 (261) (1) 3 —Net income . . . . . . . . . . . . . . . . . . . . . . . . . . . . . . . . . . 5,163 5,885 5,359 (722) (12) 526 10Earnings per common share — diluted (a) . . . . . . . . . $ 5.05 $ 5.56 $ 4.88 $ (0.51) (9)% $ 0.68 14%Return on average equity (b) . . . . . . . . . . . . . . . . . . . . 24.0% 29.1% 27.8%Return on average tangible common equity (c) . . . . . 31.0% 35.9% 34.9%
(a) Earnings per common share — diluted was reduced by the impact of (i) earnings allocated to participating share awards and other items of $38million, $46 million and $47 million for the years ended December 31, 2015, 2014 and 2013, respectively, and (ii) dividends on preferred sharesof $62 million for the year ended December 31, 2015, and nil for both the years ended December 31, 2014 and 2013.
(b) Return on Average Equity (ROE) is computed by dividing (i) one-year period net income ($5.2 billion, $5.9 billion and $5.4 billion for 2015, 2014and 2013, respectively) by (ii) one-year average total shareholders’ equity ($21.5 billion, $20.3 billion and $19.3 billion for 2015, 2014 and 2013,respectively).
(c) Return on average tangible common equity (ROTCE), a non-GAAP measure, is computed in the same manner as ROE except the computationof average tangible common equity, a non-GAAP measure, excludes from one-year average total shareholders’ equity, one-year averagegoodwill and other intangibles of $3.8 billion, $3.9 billion and $4.1 billion as of December 31, 2015, 2014 and 2013, respectively, and one-yearaverage preferred shares of $1.6 billion, $0.7 billion and nil as of December 31, 2015, 2014, and 2013, respectively. We believe ROTCE is a usefulmeasure of the profitability of our business.
TABLE 2: TOTAL REVENUES NET OF INTEREST EXPENSE SUMMARY
Years Ended December 31,(Millions, except percentages) 2015 2014 2013
Change2015 vs. 2014
Change2014 vs. 2013
Discount revenue . . . . . . . . . . . . . . . . . . . . . . . . . . . . . . . $ 19,297 $19,389 $ 18,591 $ (92) —% $ 798 4%Net card fees . . . . . . . . . . . . . . . . . . . . . . . . . . . . . . . . . . . 2,700 2,712 2,631 (12) — 81 3Travel commissions and fees . . . . . . . . . . . . . . . . . . . . . 349 1,118 1,913 (769) (69) (795) (42)Other commissions and fees . . . . . . . . . . . . . . . . . . . . . . 2,517 2,508 2,414 9 — 94 4Other . . . . . . . . . . . . . . . . . . . . . . . . . . . . . . . . . . . . . . . . . . 2,033 2,989 2,274 (956) (32) 715 31
Total non-interest revenues . . . . . . . . . . . . . . . . . . . . . . . 26,896 28,716 27,823 (1,820) (6) 893 3
Total interest income . . . . . . . . . . . . . . . . . . . . . . . . . . . . 7,545 7,179 7,005 366 5 174 2Total interest expense . . . . . . . . . . . . . . . . . . . . . . . . . . . 1,623 1,707 1,958 (84) (5) (251) (13)
Net interest income . . . . . . . . . . . . . . . . . . . . . . . . . . . . . 5,922 5,472 5,047 450 8 425 8
Total revenues net of interest expense . . . . . . . . . . $ 32,818 $34,188 $32,870 $(1,370) (4)% $1,318 4%
54

TOTAL REVENUES NET OF INTEREST EXPENSE
Discount revenue remained relatively flat in 2015 compared to 2014, and increased $798 million or 4 percent in2014 compared to 2013, driven by 2 percent and 7 percent growth in billed business, respectively, offset by a decline inthe average discount rate, faster growth in GNS billings than in overall Company billings, increases in contra-discountrevenues, such as cash rebate rewards and higher payments during 2015 related to cobrand partnership agreements.U.S. billed business increased 5 percent, and non-U.S. billed business increased 8 percent on an FX-adjusted basis in2015 compared to 2014, due to increases in average spending per proprietary basic card and basic cards-in-force.1
The average discount rate was 2.46 percent, 2.48 percent and 2.51 percent for 2015, 2014 and 2013, respectively.The decrease in the average discount rate in 2015 compared to 2014 was driven, in part, by growth of the OptBlueprogram to expand card acceptance by U.S. small merchants, changes in industry mix and competition, partially offsetby the decline in Costco merchant volume in Canada (which was at a lower discount rate than the average) due to theexpiration of our merchant agreement. The average discount rate will likely decline by a greater amount during 2016due to the continued expansion of Optblue, a greater impact from international regulatory changes and continuedcompetitive pressures. Overall, changes in the mix of spending by location and industry, merchant incentives andconcessions, volume related pricing discounts, strategic investments, certain pricing initiatives, competition, pricingregulation (including regulation of competitors’ interchange rates) and other factors will likely result in continuederosion of our discount rate over time. See Tables 5 and 6 for more details on billed business performance and theaverage discount rate.
Net card fees remained relatively flat in 2015 compared to 2014 and increased $81 million or 3 percent in 2014compared to 2013, while FX-adjusted net card fees increased 5 percent in both periods.1 The increases in both yearson an FX-adjusted basis were primarily driven by higher average proprietary cards-in-force. The current year increasealso reflects a benefit from certain pricing initiatives.
Travel commissions and fees decreased $769 million or 69 percent in 2015 compared to 2014 and $795 million or42 percent in 2014 compared to 2013. The decreases in both years were primarily due to the business travel jointventure transaction, resulting in a lack of comparability between periods.
Other commissions and fees remained relatively flat in 2015 compared to 2014 and increased $94 million or 4percent in 2014 compared to 2013. FX-adjusted other commissions and fees increased 9 percent in 2015 compared to2014 and 6 percent in 2014 compared to 2013. 1 The increases, on an FX-adjusted basis, in both periods were primarilydriven by higher loyalty coalition revenues, as well as higher delinquency fees.
Other revenues decreased $956 million or 32 percent in 2015 compared to 2014 and increased $715 million or 31percent in 2014 compared to 2013. The decrease in the current year was primarily driven by prior-year gains related tothe sales of investment securities in Concur, and the sales of investment securities in Industrial and Commercial Bankof China. The increase in the prior year was primarily driven by the gains on the sales of our investment securities inConcur, revenues earned related to the GBT JV transition services agreement, and higher Loyalty Edge revenues,partially offset by the loss of revenue from the publishing business, which was sold in the fourth quarter of 2013.
Interest income increased $366 million or 5 percent in 2015 compared to 2014, and $174 million or 2 percent in2014 compared to 2013. The increase in both years primarily reflects higher average Card Member loans, partiallyoffset by decreases in interest and dividends on investment securities, driven by lower average investment securities.
Interest expense decreased $84 million or 5 percent in 2015 compared to 2014, and $251 million or 13 percent in2014 compared to 2013. The decrease in both years was primarily driven by a lower cost of funds on debt andcustomer deposits, partially offset by increases in average customer deposit balances.
1 The foreign currency adjusted information assumes a constant exchange rate between the periods being compared for purposes of currencytranslation into U.S. dollars (e.g., assumes the foreign exchange rates used to determine results for the current year apply to the correspondingyear period against which such results are being compared). Certain amounts included in the calculations of foreign currency-adjustedrevenues and expenses, which constitute non-GAAP measures, are subject to management allocations. We believe the presentation ofinformation on a foreign currency adjusted basis is helpful to investors by making it easier to compare our performance in one period to that ofanother period without the variability caused by fluctuations in currency exchange rates.
55

TABLE 3: PROVISIONS FOR LOSSES SUMMARY
Years Ended December 31,(Millions, except percentages) 2015 2014 2013
Change2015 vs. 2014
Change2014 vs. 2013
Charge card . . . . . . . . . . . . . . . . . . . . . . . . . . . . . . . . . . . . . . . . . . $ 737 $ 792 $ 648 $(55) (7)% $144 22%Card Member loans . . . . . . . . . . . . . . . . . . . . . . . . . . . . . . . . . . . . 1,190 1,138 1,115 52 5 23 2Other . . . . . . . . . . . . . . . . . . . . . . . . . . . . . . . . . . . . . . . . . . . . . . . . 61 114 69 (53) (46) 45 65
Total provisions for losses (a) . . . . . . . . . . . . . . . . . . . . . . . . . . $1,988 $2,044 $1,832 $(56) (3)% $212 12%
(a) Effective December 1, 2015, Provisions for losses does not reflect provisions related to the HFS portfolios.
PROVISIONS FOR LOSSES
Charge card provision for losses decreased $55 million or 7 percent in 2015 compared to 2014, and increased$144 million or 22 percent in 2014 compared to 2013. The decrease in the current year primarily reflects a reserverelease versus a reserve build in 2014, partially offset by higher write-offs. The increase in the prior year was primarilydue to a slower reserve rate improvement in 2014 versus 2013, higher corporate card write-offs and the effects ofchanges in other loss reserve assumptions resulting in a reserve build versus a reserve release in 2013.
Card Member loans provision for losses increased $52 million or 5 percent in 2015 compared to 2014, and $23million or 2 percent in 2014 compared to 2013. The increase in the current year primarily reflects a reserve buildversus a reserve release in 2014. The reserve build in the current year was due to a small increase in delinquency ratescombined with an increase in loan balances, partially offset by lower write-offs and the impact related to transferringthe HFS portfolios to Card Member loans and receivables HFS, as related credit costs are reported in Other expensesthrough a valuation allowance adjustment beginning in December 2015. The increase in the prior year was driven byhigher average Card Member loans, a slower improvement in the reserve rate and the effects of changes in other lossreserve assumptions resulting in a lower reserve release compared to 2013, partially offset by the benefit of lower netwrite-offs due to improved credit performance.
Other provision for losses decreased $53 million or 46 percent in 2015 compared to 2014 and increased $45million or 65 percent in 2014 compared to 2013. The decrease in the current year and increase in the prior year weredue, in part, to a merchant-related charge in the fourth quarter of 2014.
TABLE 4: EXPENSES SUMMARY
Years Ended December 31,(Millions, except percentages) 2015 2014 2013
Change2015 vs. 2014
Change2014 vs. 2013
Marketing and promotion . . . . . . . . . . . . . . . . . . . . . . . . . $ 3,109 $ 3,216 $ 2,939 $ (107) (3)% $ 277 9%Card Member rewards . . . . . . . . . . . . . . . . . . . . . . . . . . . 6,996 6,931 6,457 65 1 474 7Card Member services and other . . . . . . . . . . . . . . . . . . 1,018 822 767 196 24 55 7
Total marketing, promotion, rewards and CardMember services and other . . . . . . . . . . . . . . . . . . . . . 11,123 10,969 10,163 154 1 806 8
Salaries and employee benefits . . . . . . . . . . . . . . . . . . . . 4,976 6,095 6,191 (1,119) (18) (96) (2)Other, net (a) . . . . . . . . . . . . . . . . . . . . . . . . . . . . . . . . . . . . 6,793 6,089 6,796 704 12 (707) (10)
Total expenses . . . . . . . . . . . . . . . . . . . . . . . . . . . . . . . . . $22,892 $ 23,153 $23,150 $ (261) (1)% $ 3 —%
(a) Effective December 1, 2015, Other, net includes the valuation allowance adjustment associated with the HFS portfolios.
EXPENSES
Marketing and promotion expenses decreased $107 million or 3 percent (although they increased 1 percent on anFX-adjusted basis) in 2015 compared to 2014 and increased $277 million or 9 percent in 2014 compared to 2013.2
Both periods reflect elevated levels of spending on growth initiatives.
Card Member rewards expenses increased $65 million or 1 percent in 2015 compared to 2014, and $474 million or7 percent in 2014 compared to 2013. The current year increase was primarily driven by higher cobrand rewardsexpense of $199 million, driven by rate impacts as a result of cobrand partnership renewal costs, partially offset by adecrease in Membership Rewards expense of $134 million. The latter was primarily driven by slower growth in theUltimate Redemption Rate (URR) and a decline in the weighted average cost (WAC) per point assumption, including
2 Refer to footnote 1 on page 55 for details regarding foreign currency adjusted information.
56
the impact of the $109 million charge in the fourth quarter of 2014 related to the Delta partnership renewal, partiallyoffset by increased expenses related to new points earned, driven by higher spending volumes.
The prior year increase was primarily due to higher Membership Rewards expense of $263 million, driven by a$266 million increase related to new points earned, in line with higher spending volumes, and a higher WAC per pointassumption, including the impact of the previously mentioned charge related to the Delta partnership renewal; theseincreases were offset by slower average growth in the URR. Cobrand rewards expense increased $211 million in 2014compared to 2013, primarily driven by higher spending volumes.
The Membership Rewards URR for current program participants was 95 percent (rounded down) at December 31,2015, compared to 95 percent (rounded up) at December 31, 2014 and 94 percent (rounded down) at December 31,2013.
Card Member services and other expenses increased $196 million or 24 percent in 2015 compared to 2014 andincreased $55 million or 7 percent in 2014 compared to 2013. The increase in the current year was primarily due tohigher costs related to certain previously renewed cobrand partnership agreements. The increase in the prior year wasprimarily driven by increased engagement levels and use of certain Card Member benefits, as well as AmericanExpress-branded airport lounges opened in 2014.
Salaries and employee benefits expenses decreased $1.1 billion or 18 percent in 2015 compared to 2014, and $96million or 2 percent in 2014 compared to 2013. The decrease in both years was primarily due to the business traveljoint venture transaction (resulting in a lack of comparability between periods). The decrease in the current year wasalso driven by restructuring charges in the second and fourth quarters of 2014 and lower compensation costs in 2015as a result of those initiatives. In 2014, compared to 2013, those restructuring charges partially offset the impact of thebusiness travel joint venture transaction.
Other expenses increased $704 million or 12 percent in 2015 compared to 2014 and decreased $707 million or 10percent in 2014 compared to 2013. The increase in the current year reflects the net gain from the 2014 business traveljoint venture transaction, partially offset by the EG charge discussed previously. Refer to Note 2 to the “ConsolidatedFinancial Statements” for further details on the charge. The decrease in the prior year was primarily driven by the gainfrom the business travel joint venture transaction (resulting in a lack of comparability between periods), and a chargein 2013 related to the rejected merchant litigation settlement. See “Legal Proceedings” for further information on thismerchant litigation.
INCOME TAXES
The effective tax rate was 35.0 percent in 2015 compared to 34.5 percent in 2014 and 32.1 percent in 2013. Thetax rates for 2015, 2014, and 2013 include benefits of $33 million, expenses of $40 million and benefits of $150 million,respectively, related to the resolution of certain prior years’ items. The tax rate for 2015 also includes the impact of thenondeductible portion of the goodwill impairment charge in EG. The tax rates for all periods reflect the level of pretaxincome in relation to recurring permanent tax benefits and geographic mix of business.
57

TABLE 5: SELECTED STATISTICAL INFORMATION
Years Ended December 31, 2015 2014 2013Change
2015 vs. 2014Change
2014 vs. 2013
Card billed business: (billions)United States . . . . . . . . . . . . . . . . . . . . . . . . . . . . . . . . . . $ 721.0 $ 688.1 $ 637.0 5% 8%Outside the United States . . . . . . . . . . . . . . . . . . . . . . . . 318.7 334.7 315.4 (5) 6
Total . . . . . . . . . . . . . . . . . . . . . . . . . . . . . . . . . . . . . . . . . . $1,039.7 $1,022.8 $ 952.4 2 7
Total cards-in-force: (millions)United States . . . . . . . . . . . . . . . . . . . . . . . . . . . . . . . . . . 57.6 54.9 53.1 5 3Outside the United States . . . . . . . . . . . . . . . . . . . . . . . . 60.2 57.3 54.1 5 6
Total . . . . . . . . . . . . . . . . . . . . . . . . . . . . . . . . . . . . . . . . . . 117.8 112.2 107.2 5 5
Basic cards-in-force: (millions)United States . . . . . . . . . . . . . . . . . . . . . . . . . . . . . . . . . . 44.8 42.6 41.1 5 4Outside the United States . . . . . . . . . . . . . . . . . . . . . . . . 49.5 47.0 44.0 5 7
Total . . . . . . . . . . . . . . . . . . . . . . . . . . . . . . . . . . . . . . . . . . $ 94.3 $ 89.6 $ 85.1 5 5
Average discount rate (a) . . . . . . . . . . . . . . . . . . . . . . . . . 2.46% 2.48% 2.51%Average basic Card Member spending (dollars) (b) . . . $ 16,743 $ 16,884 $16,334 (1) 3Average fee per card (dollars) (b) . . . . . . . . . . . . . . . . . . 39 40 40 (3) —Average fee per card adjusted (dollars) (b) . . . . . . . . . . $ 44 $ 45 $ 44 (2)% 2%
(a) In the three months ended March 31, 2015, we changed the classification related to certain payments to partners, reducing both discountrevenue and marketing and promotion expense. The misclassification in prior periods has been revised to conform to the current periodpresentation. Accordingly, the average discount rate for prior periods was also revised, resulting in a reduction of between zero and one basispoint in any period from what was originally reported.
(b) Average basic Card Member spending and average fee per card are computed from proprietary card activities only. Average fee per card iscomputed based on net card fees, including the amortization of deferred direct acquisition costs divided by average worldwide proprietarycards-in-force. The average fee per card, adjusted, which is a non-GAAP measure, is computed in the same manner, but excludes amortizationof deferred direct acquisition costs. The amount of amortization excluded was $283 million, $306 million and $262 million for the years endedDecember 31, 2015, 2014 and 2013, respectively. We present the average fee per card, adjusted, because we believe this metric presents auseful indicator of card fee pricing across a range of our proprietary card products.
58

TABLE 6: SELECTED STATISTICAL INFORMATION
2015 2014
PercentageIncrease
(Decrease)
Percentage Increase(Decrease) Assuming
No Changes inFX Rates (a)
PercentageIncrease
(Decrease)
Percentage Increase(Decrease) Assuming
No Changes inFX Rates (a)
Worldwide (b)
Billed business . . . . . . . . . . . . . . . . . . . . . . . . . . . . . . . . . . . . . 2% 6% 7% 9%Proprietary billed business . . . . . . . . . . . . . . . . . . . . . . . . . . . 1 4 7 7GNS billed business (c) . . . . . . . . . . . . . . . . . . . . . . . . . . . . . . . 3 15 12 15Airline-related volume
(8% and 9% of worldwide billed business for 2015 and2014, respectively) . . . . . . . . . . . . . . . . . . . . . . . . . . . . . . (5) 1 5 6
United States (b)
Billed business . . . . . . . . . . . . . . . . . . . . . . . . . . . . . . . . . . . . . 5 8Proprietary consumer card billed business (d) . . . . . . . . . . . 5 7Proprietary small business billed business (d) . . . . . . . . . . . . 7 10Proprietary corporate services billed business (e) . . . . . . . . 2 8T&E-related volume
(26% of U.S. billed business for both 2015 and 2014) . . . 4 6Non-T&E-related volume
(74% of U.S. billed business for both 2015 and 2014) . . . 5 9Airline-related volume
(7% and 8% of U.S. billed business for 2015 and2014, respectively) . . . . . . . . . . . . . . . . . . . . . . . . . . . . . . (2) 3
Outside the United States (b)
Billed business . . . . . . . . . . . . . . . . . . . . . . . . . . . . . . . . . . . . . (5) 8 6 10Japan, Asia Pacific & Australia (JAPA) billed business . . 4 15 10 14Latin America & Canada (LACC) billed business . . . . . . . (18) (3) (1) 8Europe, the Middle East & Africa (EMEA) billed business . . . (5) 8 7 7
Proprietary consumer and small business billed business (f) . . (10) 3 2 6JAPA billed business . . . . . . . . . . . . . . . . . . . . . . . . . . . . . . (3) 10 — 6LACC billed business . . . . . . . . . . . . . . . . . . . . . . . . . . . . . . (29) (17) (5) 2EMEA billed business . . . . . . . . . . . . . . . . . . . . . . . . . . . . . . (3) 10 9 8
Proprietary corporate services billed business (e) . . . . . . . . (10)% 7% 3% 6%
(a) The foreign currency adjusted information assumes a constant exchange rate between the periods being compared for purposes of currencytranslation into U.S. dollars (i.e., assumes the foreign exchange rates used to determine results for the current year apply to the correspondingprior year period against which such results are being compared).
(b) Captions in the table above not designated as “proprietary” or “GNS” include both proprietary and GNS data.(c) Included in the GNMS segment.(d) Included in the USCS segment.(e) Included in the GCS segment.(f) Included in the ICS segment.
59

TABLE 7: SELECTED STATISTICAL INFORMATION
As of or for the Years Ended December 31,(Millions, except percentages and where indicated) 2015 2014 2013
Change2015 vs. 2014
Change2014 vs. 2013
Worldwide Card Member receivables (a)
Total receivables (billions) . . . . . . . . . . . . . . . . . . . . . . . . . . $ 44.1 $ 44.9 $ 44.2 (2)% 2%Loss reserves:Beginning balance . . . . . . . . . . . . . . . . . . . . . . . . . . . . . . . . . 465 386 428 20 (10)
Provisions (b) . . . . . . . . . . . . . . . . . . . . . . . . . . . . . . . . . . . . 737 792 648 (7) 22Net write-offs (c) . . . . . . . . . . . . . . . . . . . . . . . . . . . . . . . . . (713) (683) (669) 4 2Other (d) . . . . . . . . . . . . . . . . . . . . . . . . . . . . . . . . . . . . . . . . (27) (30) (21) (10) 43
Ending balance . . . . . . . . . . . . . . . . . . . . . . . . . . . . . . . . . . . $ 462 $ 465 $ 386 (1)% 20%
% of receivables . . . . . . . . . . . . . . . . . . . . . . . . . . . . . . . . . . 1.0% 1.0% 0.9%Net write-off rate — principal only — USCS/ICS (f) . . . . . 1.8% 1.7 (e)Net write-off rate — principal and fees — USCS/ICS (f) . . . . 2.0% 1.9 (e)30+ days past due as a % of total — USCS/ICS . . . . . . . . 1.5% 1.6 (e)Net loss ratio as a % of charge volume — GCS . . . . . . . . . 0.09% 0.09% 0.08%90+ days past billing as a % of total — GCS . . . . . . . . . . . 0.9% 0.8% 0.9%
Worldwide Card Member loans (a)
Total loans (billions) . . . . . . . . . . . . . . . . . . . . . . . . . . . . . . . $ 58.6 $ 70.4 $ 67.2 (17)% 5%Loss reserves:Beginning balance . . . . . . . . . . . . . . . . . . . . . . . . . . . . . . . . . 1,201 1,261 1,471 (5) (14)
Provisions (b) . . . . . . . . . . . . . . . . . . . . . . . . . . . . . . . . . . . . 1,190 1,138 1,115 5 2Net write-offs — principal only (c) . . . . . . . . . . . . . . . . . . (967) (1,023) (1,141) (5) (10)Net write-offs — interest and fees (c) . . . . . . . . . . . . . . . (162) (164) (150) (1) 9Transfer of reserves on HFS loan portfolios . . . . . . . . . (224) — — — —Other . . . . . . . . . . . . . . . . . . . . . . . . . . . . . . . . . . . . . . . . . . (10) (11) (34) (9) (68)
Ending balance . . . . . . . . . . . . . . . . . . . . . . . . . . . . . . . . . . . $1,028 $ 1,201 $ 1,261 (14) (5)
Ending reserves — principal . . . . . . . . . . . . . . . . . . . . . . . . $ 975 $ 1,149 $ 1,212 (15) (5)Ending reserves — interest and fees . . . . . . . . . . . . . . . . . $ 53 $ 52 $ 49 2 6% of loans . . . . . . . . . . . . . . . . . . . . . . . . . . . . . . . . . . . . . . . . 1.8% 1.7% 1.9%% of past due . . . . . . . . . . . . . . . . . . . . . . . . . . . . . . . . . . . . . 164% 167% 169%Average loans (billions) (a) . . . . . . . . . . . . . . . . . . . . . . . . . . $ 67.9 $ 66.0 $ 63.3 3% 4%Net write-off rate — principal only (f) . . . . . . . . . . . . . . . . . 1.4% 1.5% 1.8%Net write-off rate — principal, interest and fees (f) . . . . . . 1.7% 1.8% 2.0%30+ days past due as a % of total . . . . . . . . . . . . . . . . . . . . 1.1% 1.0% 1.1%
(a) Effective December 1, 2015, does not reflect the HFS portfolios.(b) Provisions on principal and fee reserve components on Card Member receivables and provisions for principal, interest and/or fees on Card
Member loans.(c) Write-offs, less recoveries.(d) 2015 includes the impact of the transfer of the HFS receivables portfolio, which was not significant.(e) Historically, net loss ratio as a % of charge volume and 90 days past billing as a % of receivables were presented for ICS. Beginning in the first
quarter 2014, as a result of system enhancements, 30 days past due as a % of total, net write-off rate (principal only) and net write-off rate(principal and fees) have been presented.
(f) We present a net write-off rate based on principal losses only (i.e., excluding interest and/or fees) to be consistent with industry convention. Inaddition, because we consider uncollectible interest and/or fees in our reserves for credit losses, a net write-off rate including principal, interestand/or fees is also presented. The twelve months ended December 31, 2015 reflect the impact of a change in the timing of charge-offs for CardMember receivables and loans in certain modification programs from 180 days past due to 120 days past due.
60

TABLE 8: NET INTEREST YIELD ON CARD MEMBER LOANS
Years Ended December 31,(Millions, except percentages and where indicated) 2015 2014 2013
Net interest income . . . . . . . . . . . . . . . . . . . . . . . . . . . . . . . . . . . . . . . . . . . . . . . . . . . . . . . . . . $ 5,922 $5,472 $5,047Exclude:
Interest expense not attributable to the Company’s Card Member loan portfolio . . . . 961 1,019 1,181Interest income not attributable to the Company’s Card Member loan portfolio . . . . . (387) (359) (361)
Adjusted net interest income (a) . . . . . . . . . . . . . . . . . . . . . . . . . . . . . . . . . . . . . . . . . . . . . . . . $6,496 $6,132 $5,867
Average loans including HFS loan portfolios (billions) (b) . . . . . . . . . . . . . . . . . . . . . . . . . . . $ 69.0 $ 66.0 $ 63.3Exclude certain non-traditional Card Member loans and other fees (billions) . . . . . . . . . (0.2) (0.2) (0.3)
Adjusted average loans (billions) (a) . . . . . . . . . . . . . . . . . . . . . . . . . . . . . . . . . . . . . . . . . . . . . $ 68.8 $ 65.8 $ 63.0
Net interest income divided by average loans . . . . . . . . . . . . . . . . . . . . . . . . . . . . . . . . . . . . 8.6% 8.3% 8.0%Net interest yield on Card Member loans (a) . . . . . . . . . . . . . . . . . . . . . . . . . . . . . . . . . . . . . . 9.4% 9.3% 9.3%
(a) Adjusted net interest income, adjusted average loans, and net interest yield on Card Member loans are non-GAAP measures. Refer to “Glossaryof Selected Terminology” for definitions of these terms. We believe adjusted net interest income and adjusted average loans are useful toinvestors because they are components of net interest yield on Card Member loans, which provides a measure of profitability of our CardMember loan portfolio.
(b) For purposes of the calculation of net interest yield on Card Member loans, average loans continues to include the HFS loan portfolios.
61

BUSINESS SEGMENT RESULTS
We consider a combination of factors when evaluating the composition of our reportable operating segments,including the results reviewed by the chief operating decision maker, economic characteristics, products and servicesoffered, classes of customers, product distribution channels, geographic considerations (primarily United Statesversus outside the United States) and regulatory considerations. Refer to Note 25 of the “Consolidated FinancialStatements” for additional discussion of the products and services by segment.
In light of the organizational changes discussed under “Business,” our financial disclosures will reflect segmentchanges starting in the first quarter of 2016. This overview discusses the operating segments used for financialreporting in 2015.
Results of the business segments generally treat each segment as a stand-alone business. The managementreporting process that derives these results allocates revenue and expense using various methodologies as describedbelow.
TOTAL REVENUES NET OF INTEREST EXPENSE
We allocate discount revenue and certain other revenues among segments using a transfer pricing methodology.Within the USCS, ICS and GCS segments, discount revenue generally reflects the issuer component of the overalldiscount revenue generated by each segment’s Card Members; within the GNMS segment, discount revenue generallyreflects the network and acquirer component of the overall discount revenue. Net card fees and travel commissionsand fees are directly attributable to the segment in which they are reported.
Interest and fees on loans and certain investment income is directly attributable to the segment in which it isreported. Interest expense represents an allocated funding cost based on a combination of segment fundingrequirements and internal funding rates.
PROVISIONS FOR LOSSES
The provisions for losses are directly attributable to the segment in which they are reported.
EXPENSES
Marketing and promotion expenses are included in each segment based on actual expenses incurred, with theexception of brand advertising, which is primarily reflected in the GNMS and USCS segments. Rewards and CardMember services expenses are included in each segment based on actual expenses incurred within each segment.
Salaries and employee benefits and other operating expenses reflect expenses such as professional services,occupancy and equipment and communications incurred directly within each segment. In addition, expenses relatedto support services, such as technology costs, are allocated to each segment primarily based on support serviceactivities directly attributable to the segment. Other overhead expenses, such as staff group support functions, areallocated from Corporate & Other to the other segments based on a mix of each segment’s direct consumption ofservices and relative level of pretax income.
CAPITAL
Each business segment is allocated capital based on established business model operating requirements, riskmeasures and regulatory capital requirements. The business model operating requirements reflect the capital neededto support operations and specific balance sheet items. The risk measures reflect considerations for credit, marketand operational risk.
INCOME TAXES
An income tax provision (benefit) is allocated to each business segment based on the effective tax ratesapplicable to the various businesses that comprise the segment.
62
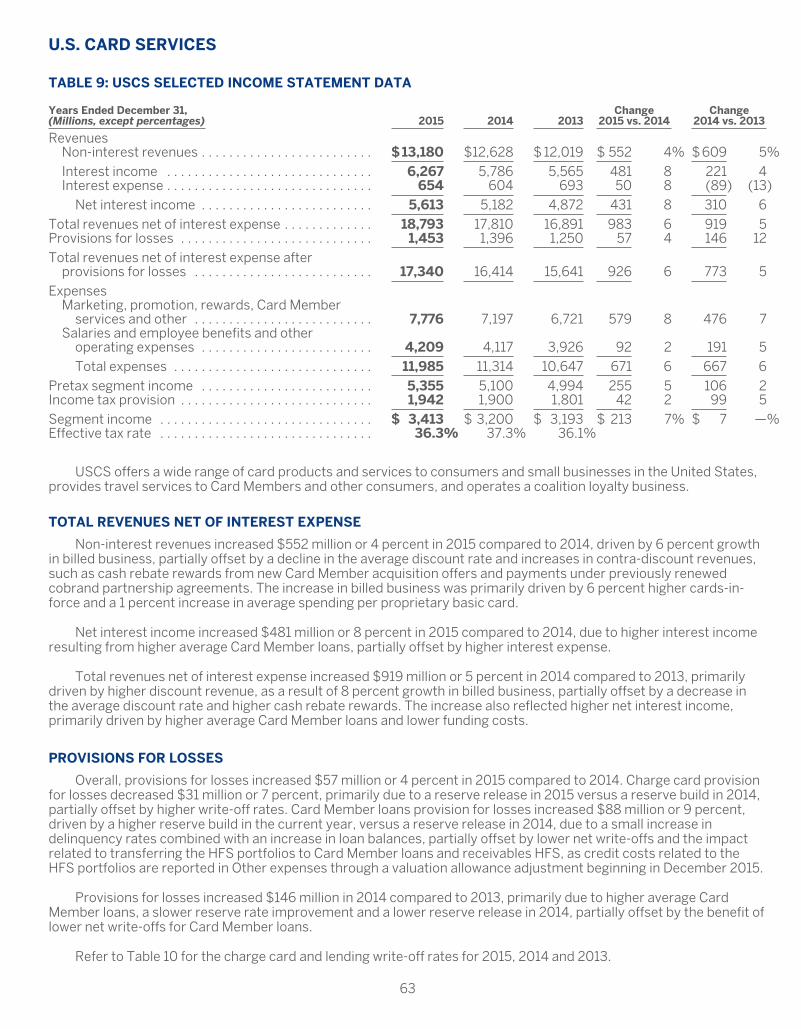
U.S. CARD SERVICES
TABLE 9: USCS SELECTED INCOME STATEMENT DATA
Years Ended December 31,(Millions, except percentages) 2015 2014 2013
Change2015 vs. 2014
Change2014 vs. 2013
RevenuesNon-interest revenues . . . . . . . . . . . . . . . . . . . . . . . . . $13,180 $12,628 $ 12,019 $ 552 4% $ 609 5%
Interest income . . . . . . . . . . . . . . . . . . . . . . . . . . . . . . 6,267 5,786 5,565 481 8 221 4Interest expense . . . . . . . . . . . . . . . . . . . . . . . . . . . . . . 654 604 693 50 8 (89) (13)
Net interest income . . . . . . . . . . . . . . . . . . . . . . . . . 5,613 5,182 4,872 431 8 310 6
Total revenues net of interest expense . . . . . . . . . . . . . 18,793 17,810 16,891 983 6 919 5Provisions for losses . . . . . . . . . . . . . . . . . . . . . . . . . . . . 1,453 1,396 1,250 57 4 146 12
Total revenues net of interest expense afterprovisions for losses . . . . . . . . . . . . . . . . . . . . . . . . . . 17,340 16,414 15,641 926 6 773 5
ExpensesMarketing, promotion, rewards, Card Member
services and other . . . . . . . . . . . . . . . . . . . . . . . . . . 7,776 7,197 6,721 579 8 476 7Salaries and employee benefits and other
operating expenses . . . . . . . . . . . . . . . . . . . . . . . . . 4,209 4,117 3,926 92 2 191 5
Total expenses . . . . . . . . . . . . . . . . . . . . . . . . . . . . . 11,985 11,314 10,647 671 6 667 6
Pretax segment income . . . . . . . . . . . . . . . . . . . . . . . . . 5,355 5,100 4,994 255 5 106 2Income tax provision . . . . . . . . . . . . . . . . . . . . . . . . . . . . 1,942 1,900 1,801 42 2 99 5
Segment income . . . . . . . . . . . . . . . . . . . . . . . . . . . . . . . $ 3,413 $ 3,200 $ 3,193 $ 213 7% $ 7 —%Effective tax rate . . . . . . . . . . . . . . . . . . . . . . . . . . . . . . . 36.3% 37.3% 36.1%
USCS offers a wide range of card products and services to consumers and small businesses in the United States,provides travel services to Card Members and other consumers, and operates a coalition loyalty business.
TOTAL REVENUES NET OF INTEREST EXPENSE
Non-interest revenues increased $552 million or 4 percent in 2015 compared to 2014, driven by 6 percent growthin billed business, partially offset by a decline in the average discount rate and increases in contra-discount revenues,such as cash rebate rewards from new Card Member acquisition offers and payments under previously renewedcobrand partnership agreements. The increase in billed business was primarily driven by 6 percent higher cards-in-force and a 1 percent increase in average spending per proprietary basic card.
Net interest income increased $481 million or 8 percent in 2015 compared to 2014, due to higher interest incomeresulting from higher average Card Member loans, partially offset by higher interest expense.
Total revenues net of interest expense increased $919 million or 5 percent in 2014 compared to 2013, primarilydriven by higher discount revenue, as a result of 8 percent growth in billed business, partially offset by a decrease inthe average discount rate and higher cash rebate rewards. The increase also reflected higher net interest income,primarily driven by higher average Card Member loans and lower funding costs.
PROVISIONS FOR LOSSES
Overall, provisions for losses increased $57 million or 4 percent in 2015 compared to 2014. Charge card provisionfor losses decreased $31 million or 7 percent, primarily due to a reserve release in 2015 versus a reserve build in 2014,partially offset by higher write-off rates. Card Member loans provision for losses increased $88 million or 9 percent,driven by a higher reserve build in the current year, versus a reserve release in 2014, due to a small increase indelinquency rates combined with an increase in loan balances, partially offset by lower net write-offs and the impactrelated to transferring the HFS portfolios to Card Member loans and receivables HFS, as credit costs related to theHFS portfolios are reported in Other expenses through a valuation allowance adjustment beginning in December 2015.
Provisions for losses increased $146 million in 2014 compared to 2013, primarily due to higher average CardMember loans, a slower reserve rate improvement and a lower reserve release in 2014, partially offset by the benefit oflower net write-offs for Card Member loans.
Refer to Table 10 for the charge card and lending write-off rates for 2015, 2014 and 2013.
63
EXPENSES
Marketing, promotion, rewards, Card Member services and other expenses increased $579 million or 8 percent in2015 compared to 2014, driven in part by a $233 million or 5 percent increase in Card Member rewards expense. Theincrease in rewards costs was driven by higher cobrand rewards expenses of $252 million, partially offset by adecrease in Membership Rewards expense of $19 million. The increase in cobrand rewards expense was driven byhigher spending volumes and rate increases, which were due in part to the previously renewed cobrand partnershipagreements. The decrease in Membership Rewards expense was primarily driven by slower growth in the URR and adecline in the WAC per point assumption, including the impact of a $96 million charge in the fourth quarter of 2014related to the Delta partnership renewal, partially offset by higher spending volumes. Card Member services and otherexpenses increased $207 million or 42 percent in 2015 compared to 2014, primarily driven by higher costs related torenewed cobrand partnership agreements. Marketing and promotion increased $139 million or 9 percent in 2015compared to 2014, reflecting elevated levels of spending on growth initiatives.
Salaries and employee benefits and other operating expenses increased $92 million or 2 percent in 2015,compared to 2014, primarily driven by higher spending on growth initiatives and the December 2015 valuationallowance adjustment related to the HFS portfolios mentioned previously, partially offset by lower fraud losses in thecurrent year and a change in the estimated value of certain investments in our Community Reinvestment Act (CRA)portfolio in the prior year.
Total expenses increased $667 million in 2014 compared to 2013, primarily driven by higher marketing andpromotion expenses, higher cobrand rewards expenses related to higher spending volumes and an increase inMembership Rewards expense, which was due to higher new points earned and a higher WAC per point assumption,including the impact of the previously mentioned charge related to the Delta partnership renewal. The increase alsoreflected higher salaries and employee benefits and other expenses, driven by an increase in card-related fraud losses,a change in the estimated value of certain investments in our CRA portfolio and higher restructuring charges in 2014.
64

TABLE 10: USCS SELECTED STATISTICAL INFORMATION
As of or for the Years Ended December 31,(Millions, except percentages and where indicated) 2015 2014 2013
Change2015 vs. 2014
Change2014 vs. 2013
Card billed business (billions) . . . . . . . . . . . . . . . . . . . . . . . . $ 572.3 $ 542.0 $ 501.0 6% 8%Total cards-in-force . . . . . . . . . . . . . . . . . . . . . . . . . . . . . . . . 48.3 45.6 43.7 6 4Basic cards-in-force . . . . . . . . . . . . . . . . . . . . . . . . . . . . . . . . 36.2 34.0 32.5 6 5Average basic Card Member spending (dollars)* . . . . . . . . $ 16,413 $16,294 $15,689 1 4U.S. Consumer Travel:
Travel sales . . . . . . . . . . . . . . . . . . . . . . . . . . . . . . . . . . . . . $ 3,761 $ 3,774 $ 3,967 — (5)Travel commissions and fees/sales . . . . . . . . . . . . . . . . . 7.0% 7.2% 7.1%
Total segment assets (billions) (a) . . . . . . . . . . . . . . . . . . . . . $ 117.3 $ 113.2 $ 103.5 4 9Segment capital . . . . . . . . . . . . . . . . . . . . . . . . . . . . . . . . . . . $10,320 $10,433 $ 9,269 (1) 13Return on average segment capital (b) . . . . . . . . . . . . . . . . . 32.4% 32.5% 35.6%Return on average tangible segment capital (b) . . . . . . . . . 33.7% 33.6% 37.0%
Card Member receivables: (c)
Total receivables (billions) . . . . . . . . . . . . . . . . . . . . . . . . . $ 23.3 $ 22.5 $ 21.8 4 3Net write-off rate — principal only (d) . . . . . . . . . . . . . . . . 1.7% 1.6% 1.7%Net write-off rate — principal and fees (d) . . . . . . . . . . . . 1.9% 1.8% 1.9%30+ days past due as a % of total . . . . . . . . . . . . . . . . . . . 1.5% 1.7% 1.6%
Card Member loans: (c)
Total loans (billions) . . . . . . . . . . . . . . . . . . . . . . . . . . . . . . $ 51.4 $ 62.6 $ 58.4 (18)% 7%Net write-off rate — principal only (d) . . . . . . . . . . . . . . . . 1.4% 1.5% 1.8%Net write-off rate — principal, interest and fees (d) . . . . . 1.6% 1.7% 2.0%30+ days past due loans as a % of total . . . . . . . . . . . . . 1.0% 1.0% 1.1%
Calculation of Net Interest Yield on Card Member Loans:Net interest income . . . . . . . . . . . . . . . . . . . . . . . . . . . . . . $ 5,613 $ 5,182 $ 4,872Exclude:
Interest expense not attributable to the Company’sCard Member loan portfolio . . . . . . . . . . . . . . . . . . . . 164 157 183
Interest income not attributable to the Company’sCard Member loan portfolio . . . . . . . . . . . . . . . . . . . . (16) (11) (9)
Adjusted net interest income (e) . . . . . . . . . . . . . . . . . . . . $ 5,761 $ 5,328 $ 5,046Average loans including HFS loan portfolios (billions) (f) . . $ 61.9 $ 57.8 $ 54.7Exclude certain non-traditional Card Member loans
and other fees (billions) . . . . . . . . . . . . . . . . . . . . . . . . . — — —
Adjusted average loans (billions) (e) . . . . . . . . . . . . . . . . . $ 61.9 $ 57.8 $ 54.7Net interest income divided by average loans . . . . . . . . 9.1% 9.0% 8.9%Net interest yield on Card Member loans (e) . . . . . . . . . . 9.3% 9.2% 9.2%
* Proprietary cards only.(a) As of September 30, 2015, and prospectively, certain intercompany balances have been reclassified between operating segments, as a result of
systems enhancements.(b) Return on average segment capital is calculated by dividing (i) one-year period segment income ($3.4 billion for 2015 and $3.2 billion for both
2014 and 2013), by (ii) one-year average segment capital ($10.5 billion, $9.8 billion and $9.0 billion for 2015, 2014 and 2013, respectively).Return on average tangible segment capital, a non-GAAP measure, is computed in the same manner as return on average segment capitalexcept the computation excludes from average segment capital average goodwill and other intangibles of $395 million, $319 million and $334million as of December 31, 2015, 2014 and 2013, respectively. We believe return on average tangible segment capital is a useful measure of theprofitability of our business.
(c) Refer to Table 7 footnote (a).(d) Refer to Table 7 footnote (f).(e) Adjusted net interest income, adjusted average loans and net interest yield on Card Member loans are non-GAAP measures. Refer to “Glossary
of Selected Terminology” for the definitions of these terms. We believe adjusted net interest income and adjusted average loans are useful toinvestors because they are components of net interest yield on Card Member loans, which provides a measure of profitability of our CardMember loan portfolio.
(f) Refer to Table 8 footnote (b).
65

INTERNATIONAL CARD SERVICES
TABLE 11: ICS SELECTED INCOME STATEMENT DATA
Years Ended December 31,(Millions, except percentages) 2015 2014 2013
Change2015 vs. 2014
Change2014 vs. 2013
RevenuesNon-interest revenues . . . . . . . . . . . . . . . . . . . . . . . . . . . . $ 4,321 $4,737 $4,644 $ (416) (9)% $ 93 2%Interest income . . . . . . . . . . . . . . . . . . . . . . . . . . . . . . . . . . 939 1,085 1,118 (146) (13) (33) (3)Interest expense . . . . . . . . . . . . . . . . . . . . . . . . . . . . . . . . . 242 330 361 (88) (27) (31) (9)
Net interest income . . . . . . . . . . . . . . . . . . . . . . . . . . . . 697 755 757 (58) (8) (2) —Total revenues net of interest expense . . . . . . . . . . . . . . . . 5,018 5,492 5,401 (474) (9) 91 2Provisions for losses . . . . . . . . . . . . . . . . . . . . . . . . . . . . . . . 329 370 388 (41) (11) (18) (5)Total revenues net of interest expense after provisions
for losses . . . . . . . . . . . . . . . . . . . . . . . . . . . . . . . . . . . . . . . 4,689 5,122 5,013 (433) (8) 109 2Expenses
Marketing, promotion, rewards, Card Memberservices and other . . . . . . . . . . . . . . . . . . . . . . . . . . . . . 1,943 2,160 2,013 (217) (10) 147 7
Salaries and employee benefits and other operatingexpenses . . . . . . . . . . . . . . . . . . . . . . . . . . . . . . . . . . . . . 2,238 2,513 2,357 (275) (11) 156 7Total expenses . . . . . . . . . . . . . . . . . . . . . . . . . . . . . . . . 4,181 4,673 4,370 (492) (11) 303 7
Pretax segment income . . . . . . . . . . . . . . . . . . . . . . . . . . . . 508 449 643 59 13 (194) (30)Income tax provision . . . . . . . . . . . . . . . . . . . . . . . . . . . . . . . 87 38 12 49 # 26 #Segment income . . . . . . . . . . . . . . . . . . . . . . . . . . . . . . . . . . $ 421 $ 411 $ 631 $ 10 2% $(220) (35)%Effective tax rate . . . . . . . . . . . . . . . . . . . . . . . . . . . . . . . . . . 17.1% 8.5% 1.9%
# Denotes a variance greater than 100 percent
ICS offers a wide range of card products and services to consumers and small businesses outside the UnitedStates, provides travel services to Card Members and other consumers, and operates a coalition loyalty business invarious countries.
TOTAL REVENUES NET OF INTEREST EXPENSE
Non-interest revenues decreased $416 million or 9 percent in 2015 compared to 2014, and FX-adjusted non-interestrevenues increased 5 percent, primarily driven by net foreign exchange fees and spread revenue on cross-border CardMember spending, higher net card fees and revenue from our Loyalty Partner business.3 Billed business decreased 10 percentin 2015 compared to 2014, while FX-adjusted billed business increased 3 percent, primarily due to higher average CardMember spending per card, partially offset by lower cards-in-force in Canada driven by the termination of our relationship withCostco in that country.3 Refer to Tables 5 and 6 for additional information on billed business by region.
Interest income decreased $146 million or 13 percent (and remained flat on an FX-adjusted basis), in 2015 compared to2014, primarily driven by lower average loans as a result of the termination of our relationship with Costco in Canada, offset bya higher net interest yield. 3
Interest expense decreased $88 million or 27 percent in 2015 compared to 2014, primarily driven by lower funding costs,as a result of lower average loans.
Total revenues net of interest expense increased $91 million or 2 percent in 2014 compared to 2013, primarily driven byhigher Loyalty Partner-related fees, higher discount revenue and an increase in net card fees.
PROVISIONS FOR LOSSES
Provisions for losses decreased $41 million or 11 percent (4 percent increase on an FX-adjusted basis) in 2015, comparedto 2014, and decreased $18 million or 5 percent (1 percent on an FX-adjusted basis) in 2014 compared to 2013.3 Refer to Table12 for Card Member receivables and loans write-off rates for 2015, 2014 and 2013.
EXPENSES
Marketing, promotion, rewards, Card Member services and other expenses decreased $217 million or 10 percent in 2015compared to 2014, but increased 3 percent on an FX-adjusted basis, reflecting elevated levels of spending on growthinitiatives, primarily in marketing.3
3 Refer to footnote 1 on page 55 for details regarding foreign currency adjusted information.
66

Salaries and employee benefits and other operating expenses decreased $275 million or 11 percent in 2015compared to 2014, primarily due to restructuring charges in 2014.
Total expenses increased $303 million or 7 percent in 2014 compared to 2013, primarily driven by highermarketing and promotion expenses, higher Loyalty Partner expenses and higher restructuring charges in 2014.
INCOME TAXES
The effective tax rate in all periods reflects the recurring permanent tax benefit related to the segment’s ongoingfunding activities outside the United States, in relation to the levels of pretax income. The benefit is allocated to ICSunder our internal tax allocation process. The effective tax rates for 2015 and 2013 also include the allocated share oftax benefits related to the resolution of certain prior-years’ items. In addition, the effective tax rate in each of theperiods reflects the impact of recurring permanent tax benefits on varying levels of pretax income.
67

TABLE 12: ICS SELECTED STATISTICAL INFORMATION
As of or for the Years Ended December 31,(Millions, except percentages and where indicated) 2015 2014 2013
Change2015 vs. 2014
Change2014 vs. 2013
Card billed business (billions) . . . . . . . . . . . . . . . . . . . . . . . . . . $ 120.2 $ 133.8 $ 131.7 (10)% 2%Total cards-in-force . . . . . . . . . . . . . . . . . . . . . . . . . . . . . . . . . . 15.2 15.7 15.7 (3) —Basic cards-in-force . . . . . . . . . . . . . . . . . . . . . . . . . . . . . . . . . . 10.5 11.0 10.7 (5) 3Average basic Card Member spending (dollars)* . . . . . . . . . $11,459 $12,297 $12,429 (7) (1)International Consumer Travel:
Travel sales . . . . . . . . . . . . . . . . . . . . . . . . . . . . . . . . . . . . . . . $ 1,304 $ 1,422 $ 1,420 (8) —Travel commissions and fees/sales . . . . . . . . . . . . . . . . . . 6.7% 6.8% 6.9%
Total segment assets (billions) (a) . . . . . . . . . . . . . . . . . . . . . . $ 35.4 $ 30.7 $ 31.1 15 (1)Segment capital . . . . . . . . . . . . . . . . . . . . . . . . . . . . . . . . . . . . . $ 2,906 $ 2,948 $ 3,132 (1) (6)Return on average segment capital (b) . . . . . . . . . . . . . . . . . . . 13.2% 13.6% 20.9%Return on average tangible segment capital (b) . . . . . . . . . . . 21.3% 24.6% 38.8%
Card Member receivables:Total receivables (billions) . . . . . . . . . . . . . . . . . . . . . . . . . . . $ 7.0 $ 7.7 $ 7.8 (9) (1)Net write-off rate — principal only (d) . . . . . . . . . . . . . . . . . . 2.0% 1.9% (c)Net write-off rate — principal and fees (d) . . . . . . . . . . . . . . 2.2% 2.1% (c)30+ days past due as a % of total . . . . . . . . . . . . . . . . . . . . 1.4% 1.3% (c)90+ days past billing as a % of total . . . . . . . . . . . . . . . . . . (c) (c) 1.1%Net loss ratio as a % of charge volume . . . . . . . . . . . . . . . . (c) (c) 0.20%
Card Member loans:Total loans (billions) . . . . . . . . . . . . . . . . . . . . . . . . . . . . . . . . $ 7.1 $ 7.7 $ 8.8 (8)% (13)%Net write-off rate — principal only (d) . . . . . . . . . . . . . . . . . . 1.9% 2.0% 1.9%Net write-off rate — principal, interest and fees (d) . . . . . . 2.4% 2.4% 2.3%30+ days past due loans as a % of total . . . . . . . . . . . . . . . 1.6% 1.6% 1.4%
Calculation of Net Interest Yield on Card Member Loans:Net interest income . . . . . . . . . . . . . . . . . . . . . . . . . . . . . . . . $ 697 $ 755 $ 757Exclude:
Interest expense not attributable to the Company’sCard Member loan portfolio . . . . . . . . . . . . . . . . . . . . . 68 89 93
Interest income not attributable to the Company’sCard Member loan portfolio . . . . . . . . . . . . . . . . . . . . . (32) (39) (29)
Adjusted net interest income (e) . . . . . . . . . . . . . . . . . . . . . . . . $ 733 $ 805 $ 821
Average loans (billions) . . . . . . . . . . . . . . . . . . . . . . . . . . . . . . . $ 7.0 $ 8.2 $ 8.5Exclude certain non-traditional Card Member loans and
other fees (billions) . . . . . . . . . . . . . . . . . . . . . . . . . . . . . . . . . (0.1) (0.2) (0.2)
Adjusted average loans (billions) (e) . . . . . . . . . . . . . . . . . . . . . $ 6.9 $ 8.0 $ 8.3
Net interest income divided by average loans . . . . . . . . . . . . 10.0% 9.2% 8.9%Net interest yield on Card Member loans (e) . . . . . . . . . . . . . . 10.6% 10.0% 9.9%
* Proprietary cards only.(a) As of September 30, 2015, and prospectively, certain intercompany balances have been reclassified between operating segments, as a result of
systems enhancements.(b) Return on average segment capital is calculated by dividing (i) one-year period segment income ($421 million, $411 million and $631 million for
2015, 2014 and 2013, respectively) by (ii) one-year average segment capital ($3.2 billion for 2015 and $3.0 billion for both 2014 and 2013).Return on average tangible segment capital, a non-GAAP measure, is computed in the same manner as return on average segment capitalexcept the computation excludes from average segment capital average goodwill and other intangibles of $1.2 billion at December 31, 2015 and$1.4 billion at December 31, 2014 and 2013. We believe return on average tangible segment capital is a useful measure of the profitability of ourbusiness.
(c) Historically, due to system constraints, net loss ratio as a % of charge volume and 90 days past billing as a % of receivables were presented.Beginning in the first quarter of 2014, as a result of system enhancements, net write-off rate — principal only, net write-off rate — principal andfees and 30 days past due as a % of total are presented.
(d) Refer to Table 7 footnote (f).(e) Adjusted net interest income, adjusted average loans and net interest yield on Card Member loans are non-GAAP measures. Refer to “Glossary
of Selected Terminology” for the definitions of these terms. We believe adjusted net interest income and adjusted average loans are useful toinvestors because they are components of net interest yield on Card Member loans, which provides a measure of profitability of our CardMember loan portfolio.
68

GLOBAL COMMERCIAL SERVICES
TABLE 13: GCS SELECTED INCOME STATEMENT DATA
Years Ended December 31,(Millions, except percentages) 2015 2014 2013
Change2015 vs. 2014
Change2014 vs. 2013
RevenuesNon-interest revenues . . . . . . . . . . . . . . . . . . . . . . . . $ 3,513 $ 5,173 $5,085 $(1,660) (32)% $ 88 2%Interest income . . . . . . . . . . . . . . . . . . . . . . . . . . . . . 14 15 13 (1) (7) 2 15Interest expense . . . . . . . . . . . . . . . . . . . . . . . . . . . . . 185 240 245 (55) (23) (5) (2)
Net interest expense . . . . . . . . . . . . . . . . . . . . . . . (171) (225) (232) (54) (24) (7) (3)Total revenues net of interest expense . . . . . . . . . . . . 3,342 4,948 4,853 (1,606) (32) 95 2Provisions for losses . . . . . . . . . . . . . . . . . . . . . . . . . . . 148 180 129 (32) (18) 51 40Total revenues net of interest expense after
provisions for losses . . . . . . . . . . . . . . . . . . . . . . . . . 3,194 4,768 4,724 (1,574) (33) 44 1Expenses
Marketing, promotion, rewards, Card Memberservices and other . . . . . . . . . . . . . . . . . . . . . . . . . 632 682 604 (50) (7) 78 13
Salaries and employee benefits and otheroperating expenses . . . . . . . . . . . . . . . . . . . . . . . . 1,489 1,678 2,876 (189) (11) (1,198) (42)Total expenses . . . . . . . . . . . . . . . . . . . . . . . . . . . . 2,121 2,360 3,480 (239) (10) (1,120) (32)
Pretax segment income . . . . . . . . . . . . . . . . . . . . . . . . 1,073 2,408 1,244 (1,335) (55) 1,164 94Income tax provision . . . . . . . . . . . . . . . . . . . . . . . . . . . 407 865 384 (458) (53) 481 #Segment income . . . . . . . . . . . . . . . . . . . . . . . . . . . . . . $ 666 $ 1,543 $ 860 $ (877) (57)% $ 683 79%Effective tax rate . . . . . . . . . . . . . . . . . . . . . . . . . . . . . . 37.9% 35.9% 30.9%
# Denotes a variance greater than 100 percent
GCS offers global corporate payment services to large and mid-sized companies. Our business travel operations,which had been included in GCS, were deconsolidated effective June 30, 2014 in connection with the formation of theGBT JV, discussed previously. Therefore, there is a lack of comparability against periods prior to the deconsolidation.Our proportional share of the GBT JV net income or loss is reported within Other revenues.
TOTAL REVENUES NET OF INTEREST EXPENSE
Non-interest revenues decreased $1.7 billion or 32 percent in 2015 compared to 2014. The decrease was primarilydue to the gain on the sale of our investment in Concur in 2014 and the impact of the business travel joint venturetransaction (resulting in a lack of comparability between periods). Billed business decreased 2 percent in 2015compared to 2014 and increased 2 percent on an FX-adjusted basis.4 Billed business volume increased 2 percentwithin the United States and decreased 10 percent outside the United States. FX-adjusted billed business outside theUnited States increased 3 percent.4
Net interest expense decreased $54 million or 24 percent in 2015 compared to 2014, primarily driven by lowerfunding costs due to lower Card Member receivables.
Total revenues net of interest expense increased $95 million or 2 percent in 2014 compared to 2013, primarily dueto the gain on the sale of our investment in Concur in 2014 and higher discount revenue from an increased level ofCard Member spending, partially offset by the impact of the business travel joint venture transaction (resulting in alack of comparability between periods).
PROVISIONS FOR LOSSES
Provisions for losses decreased $32 million or 18 percent in 2015 compared to 2014, primarily driven by a lowercharge card provision, resulting from a lower reserve build due to lower average Card Member receivables and lowernet write-offs.
Provisions for losses increased $51 million or 40 percent in 2014 compared to 2013, primarily driven by higheraverage Card Member receivables resulting in higher net write-offs. Refer to Table 14 for the charge card net loss ratioas a percentage of charge volume.
4 Refer to footnote 1 on page 55 for details regarding foreign currency adjusted information.
69
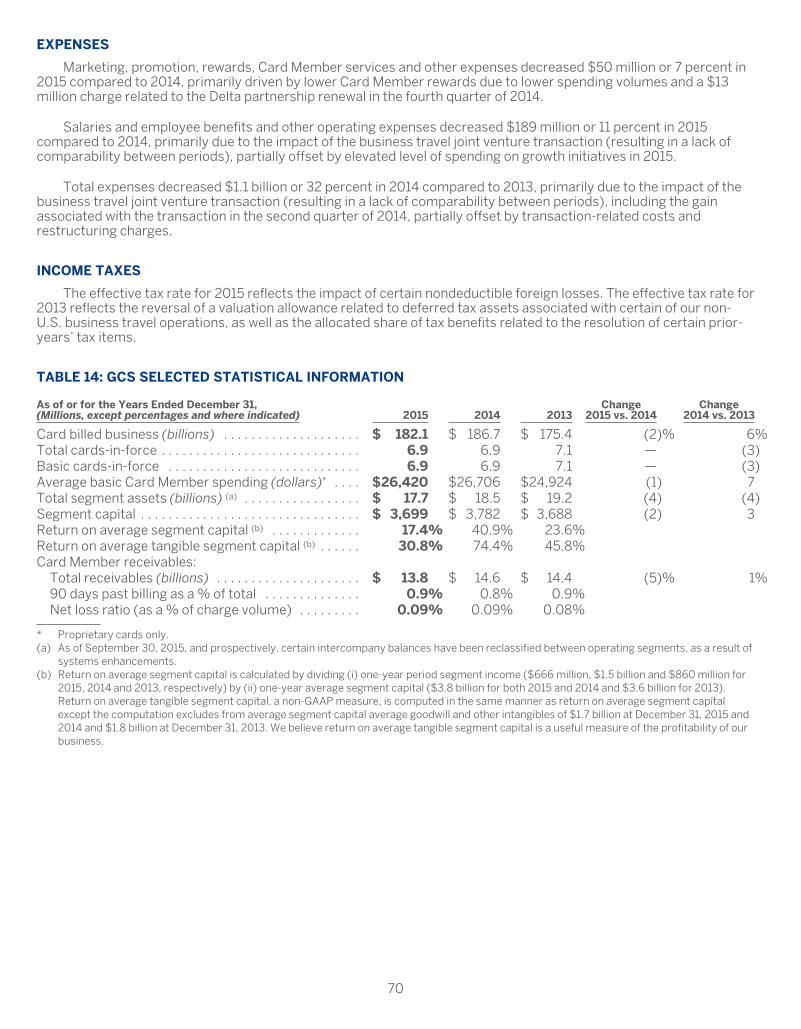
EXPENSES
Marketing, promotion, rewards, Card Member services and other expenses decreased $50 million or 7 percent in2015 compared to 2014, primarily driven by lower Card Member rewards due to lower spending volumes and a $13million charge related to the Delta partnership renewal in the fourth quarter of 2014.
Salaries and employee benefits and other operating expenses decreased $189 million or 11 percent in 2015compared to 2014, primarily due to the impact of the business travel joint venture transaction (resulting in a lack ofcomparability between periods), partially offset by elevated level of spending on growth initiatives in 2015.
Total expenses decreased $1.1 billion or 32 percent in 2014 compared to 2013, primarily due to the impact of thebusiness travel joint venture transaction (resulting in a lack of comparability between periods), including the gainassociated with the transaction in the second quarter of 2014, partially offset by transaction-related costs andrestructuring charges.
INCOME TAXES
The effective tax rate for 2015 reflects the impact of certain nondeductible foreign losses. The effective tax rate for2013 reflects the reversal of a valuation allowance related to deferred tax assets associated with certain of our non-U.S. business travel operations, as well as the allocated share of tax benefits related to the resolution of certain prior-years’ tax items.
TABLE 14: GCS SELECTED STATISTICAL INFORMATION
As of or for the Years Ended December 31,(Millions, except percentages and where indicated) 2015 2014 2013
Change2015 vs. 2014
Change2014 vs. 2013
Card billed business (billions) . . . . . . . . . . . . . . . . . . . . $ 182.1 $ 186.7 $ 175.4 (2)% 6%Total cards-in-force . . . . . . . . . . . . . . . . . . . . . . . . . . . . . 6.9 6.9 7.1 — (3)Basic cards-in-force . . . . . . . . . . . . . . . . . . . . . . . . . . . . 6.9 6.9 7.1 — (3)Average basic Card Member spending (dollars)* . . . . $26,420 $26,706 $24,924 (1) 7Total segment assets (billions) (a) . . . . . . . . . . . . . . . . . $ 17.7 $ 18.5 $ 19.2 (4) (4)Segment capital . . . . . . . . . . . . . . . . . . . . . . . . . . . . . . . . $ 3,699 $ 3,782 $ 3,688 (2) 3Return on average segment capital (b) . . . . . . . . . . . . . 17.4% 40.9% 23.6%Return on average tangible segment capital (b) . . . . . . 30.8% 74.4% 45.8%Card Member receivables:
Total receivables (billions) . . . . . . . . . . . . . . . . . . . . . $ 13.8 $ 14.6 $ 14.4 (5)% 1%90 days past billing as a % of total . . . . . . . . . . . . . . 0.9% 0.8% 0.9%Net loss ratio (as a % of charge volume) . . . . . . . . . 0.09% 0.09% 0.08%
* Proprietary cards only.(a) As of September 30, 2015, and prospectively, certain intercompany balances have been reclassified between operating segments, as a result of
systems enhancements.(b) Return on average segment capital is calculated by dividing (i) one-year period segment income ($666 million, $1.5 billion and $860 million for
2015, 2014 and 2013, respectively) by (ii) one-year average segment capital ($3.8 billion for both 2015 and 2014 and $3.6 billion for 2013).Return on average tangible segment capital, a non-GAAP measure, is computed in the same manner as return on average segment capitalexcept the computation excludes from average segment capital average goodwill and other intangibles of $1.7 billion at December 31, 2015 and2014 and $1.8 billion at December 31, 2013. We believe return on average tangible segment capital is a useful measure of the profitability of ourbusiness.
70
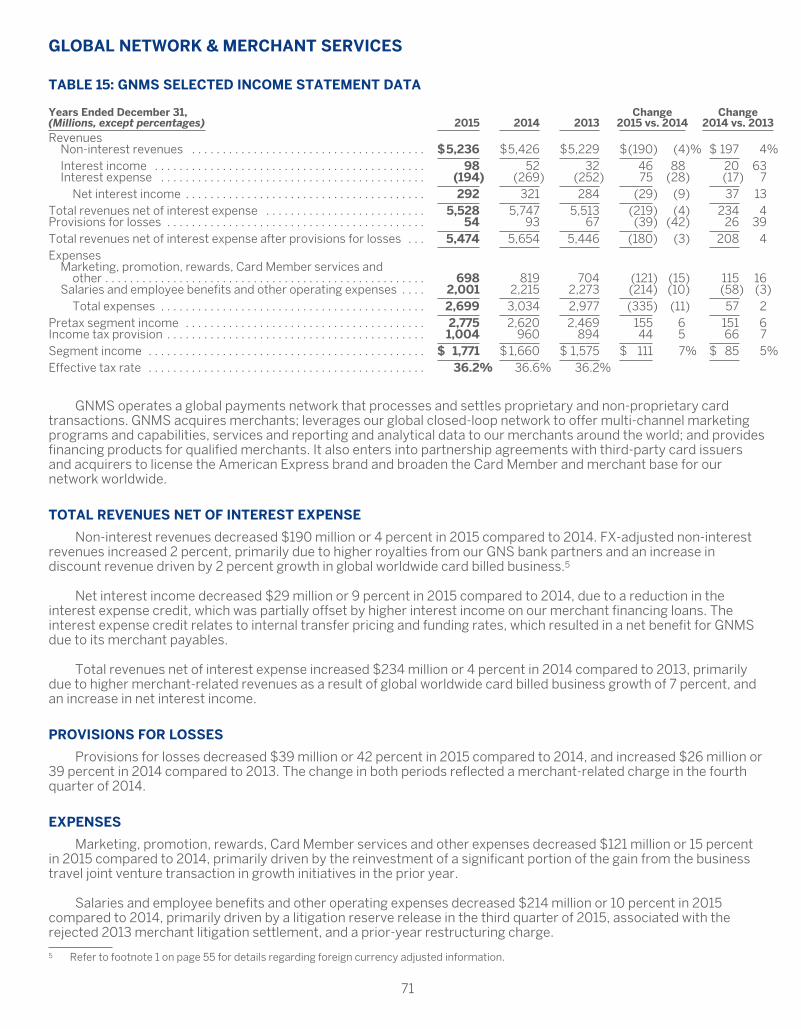
GLOBAL NETWORK & MERCHANT SERVICES
TABLE 15: GNMS SELECTED INCOME STATEMENT DATA
Years Ended December 31,(Millions, except percentages) 2015 2014 2013
Change2015 vs. 2014
Change2014 vs. 2013
RevenuesNon-interest revenues . . . . . . . . . . . . . . . . . . . . . . . . . . . . . . . . . . . . . . $5,236 $5,426 $5,229 $(190) (4)% $ 197 4%Interest income . . . . . . . . . . . . . . . . . . . . . . . . . . . . . . . . . . . . . . . . . . . . 98 52 32 46 88 20 63Interest expense . . . . . . . . . . . . . . . . . . . . . . . . . . . . . . . . . . . . . . . . . . . (194) (269) (252) 75 (28) (17) 7
Net interest income . . . . . . . . . . . . . . . . . . . . . . . . . . . . . . . . . . . . . . . 292 321 284 (29) (9) 37 13Total revenues net of interest expense . . . . . . . . . . . . . . . . . . . . . . . . . . 5,528 5,747 5,513 (219) (4) 234 4Provisions for losses . . . . . . . . . . . . . . . . . . . . . . . . . . . . . . . . . . . . . . . . . . 54 93 67 (39) (42) 26 39Total revenues net of interest expense after provisions for losses . . . 5,474 5,654 5,446 (180) (3) 208 4Expenses
Marketing, promotion, rewards, Card Member services andother . . . . . . . . . . . . . . . . . . . . . . . . . . . . . . . . . . . . . . . . . . . . . . . . . . . . 698 819 704 (121) (15) 115 16
Salaries and employee benefits and other operating expenses . . . . 2,001 2,215 2,273 (214) (10) (58) (3)Total expenses . . . . . . . . . . . . . . . . . . . . . . . . . . . . . . . . . . . . . . . . . . . 2,699 3,034 2,977 (335) (11) 57 2
Pretax segment income . . . . . . . . . . . . . . . . . . . . . . . . . . . . . . . . . . . . . . . 2,775 2,620 2,469 155 6 151 6Income tax provision . . . . . . . . . . . . . . . . . . . . . . . . . . . . . . . . . . . . . . . . . . 1,004 960 894 44 5 66 7Segment income . . . . . . . . . . . . . . . . . . . . . . . . . . . . . . . . . . . . . . . . . . . . . $ 1,771 $ 1,660 $ 1,575 $ 111 7% $ 85 5%Effective tax rate . . . . . . . . . . . . . . . . . . . . . . . . . . . . . . . . . . . . . . . . . . . . . 36.2% 36.6% 36.2%
GNMS operates a global payments network that processes and settles proprietary and non-proprietary cardtransactions. GNMS acquires merchants; leverages our global closed-loop network to offer multi-channel marketingprograms and capabilities, services and reporting and analytical data to our merchants around the world; and providesfinancing products for qualified merchants. It also enters into partnership agreements with third-party card issuersand acquirers to license the American Express brand and broaden the Card Member and merchant base for ournetwork worldwide.
TOTAL REVENUES NET OF INTEREST EXPENSE
Non-interest revenues decreased $190 million or 4 percent in 2015 compared to 2014. FX-adjusted non-interestrevenues increased 2 percent, primarily due to higher royalties from our GNS bank partners and an increase indiscount revenue driven by 2 percent growth in global worldwide card billed business.5
Net interest income decreased $29 million or 9 percent in 2015 compared to 2014, due to a reduction in theinterest expense credit, which was partially offset by higher interest income on our merchant financing loans. Theinterest expense credit relates to internal transfer pricing and funding rates, which resulted in a net benefit for GNMSdue to its merchant payables.
Total revenues net of interest expense increased $234 million or 4 percent in 2014 compared to 2013, primarilydue to higher merchant-related revenues as a result of global worldwide card billed business growth of 7 percent, andan increase in net interest income.
PROVISIONS FOR LOSSES
Provisions for losses decreased $39 million or 42 percent in 2015 compared to 2014, and increased $26 million or39 percent in 2014 compared to 2013. The change in both periods reflected a merchant-related charge in the fourthquarter of 2014.
EXPENSES
Marketing, promotion, rewards, Card Member services and other expenses decreased $121 million or 15 percentin 2015 compared to 2014, primarily driven by the reinvestment of a significant portion of the gain from the businesstravel joint venture transaction in growth initiatives in the prior year.
Salaries and employee benefits and other operating expenses decreased $214 million or 10 percent in 2015compared to 2014, primarily driven by a litigation reserve release in the third quarter of 2015, associated with therejected 2013 merchant litigation settlement, and a prior-year restructuring charge.
5 Refer to footnote 1 on page 55 for details regarding foreign currency adjusted information.
71

Total expenses increased $57 million or 2 percent in 2014 compared to 2013, primarily driven by the reinvestmentof a significant portion of the gain from the business travel joint venture transaction in growth initiatives, partiallyoffset by a charge in 2013 to reserve for the previously mentioned merchant litigation settlement.
TABLE 16: GNMS SELECTED STATISTICAL INFORMATION
As of or for the Years Ended December 31,(Millions, except percentages and where indicated) 2015 2014 2013
Change2015 vs. 2014
Change2014 vs. 2013
Global worldwide card billed business (billions) . . . . . . $1,039.7 $1,022.8 $952.4 2% 7%Total segment assets (billions) . . . . . . . . . . . . . . . . . . . . $ 23.6 $ 18.1 $ 17.1 30 6Segment capital (a) . . . . . . . . . . . . . . . . . . . . . . . . . . . . . . . $ 2,397 $ 1,970 $ 1,952 22 1Return on average segment capital (b) . . . . . . . . . . . . . . 78.4% 84.0% 76.8%Return on average tangible segment capital (b) . . . . . . . 86.2% 92.9% 84.9%Global Network Services:
Card billed business (billions) . . . . . . . . . . . . . . . . . . . $ 166.0 $ 160.7 $ 144.1 3 12Total cards-in-force . . . . . . . . . . . . . . . . . . . . . . . . . . . . 47.4 44.0 40.7 8% 8%
(a) As of September 30, 2015, and prospectively, certain intercompany balances have been reclassified between operating segments, as a result ofsystems enhancements.
(b) Return on average segment capital is calculated by dividing (i) one-year period segment income ($1.8 billion, $1.7 billion and $1.6 billion for2015, 2014 and 2013, respectively) by (ii) one-year average segment capital ($2.3 billion, $2.0 billion and $2.1 billion for 2015, 2014 and 2013,respectively). Return on average tangible segment capital, a non-GAAP measure, is computed in the same manner as return on averagesegment capital except the computation excludes from average segment capital average goodwill and other intangibles of $206 million, $189million and $195 million as of December 31, 2015, 2014 and 2013, respectively. We believe return on average tangible segment capital is a usefulmeasure of the profitability of our business.
CORPORATE & OTHERCorporate functions and certain other businesses, including EG and other operations, are included in Corporate &
Other.
Corporate & Other net expense increased to $1.1 billion in 2015, compared to $929 million and $900 million in2014 and 2013, respectively. The increase in net expense was driven by EG charges in the third and fourth quarter of2015 of $91 million and $419 million, respectively. The third quarter charge of $91 million related to previouslycapitalized software development costs, while the fourth quarter charge of $419 million reflected a write-down ingoodwill ($219 million) and technology and other ($165 million), plus restructuring charges ($35 million). These 2015charges were partially offset by higher restructuring costs in 2014. Refer to Note 2 to the “Consolidated FinancialStatements” for further details on the fourth quarter EG impairment charges.
Results for all periods disclosed also include net interest expense related to maintaining the liquidity pooldiscussed in “Consolidated Capital Resources and Liquidity — Liquidity Management,” as well as interest expenserelated to other corporate indebtedness.
72

CONSOLIDATED CAPITAL RESOURCES AND LIQUIDITY
Our balance sheet management objectives are to maintain:
• A solid and flexible equity capital profile;
• A broad, deep and diverse set of funding sources to finance our assets and meet operating requirements; and
• Liquidity programs that enable us to continuously meet expected future financing obligations and businessrequirements for at least a 12-month period, even in the event we are unable to continue to raise new fundsunder our traditional funding programs during a substantial weakening in economic conditions.
CAPITAL STRATEGY
Our objective is to retain sufficient levels of capital generated through earnings and other sources to maintain asolid equity capital base and to provide flexibility to support future business growth. We believe capital allocated togrowing businesses with a return on risk-adjusted equity in excess of our costs will generate shareholder value.
The level and composition of our consolidated capital position are determined through our internal capitaladequacy assessment process, which takes into account our business activities, as well as marketplace conditions andrequirements or expectations of credit rating agencies, regulators and shareholders, among others. Our consolidatedcapital position is also influenced by subsidiary capital requirements. As a bank holding company, we are also subjectto regulatory requirements administered by the U.S. federal banking agencies. The Federal Reserve has establishedspecific capital adequacy guidelines that involve quantitative measures of assets, liabilities and certain off-balancesheet items.
We report our capital ratios using the Basel III capital definitions, inclusive of transition provisions, and the Basel IIIStandardized Approach for calculating risk-weighted assets (see section on Transitional Basel III). The Basel IIIstandards will be fully phased-in by January 1, 2019 (see section on Fully Phased-in Basel III).
We also report capital adequacy standards on a parallel basis to regulators under Basel requirements forAdvanced Approaches institutions. The parallel period will continue until we receive regulatory approval to exit parallelreporting, at which point we will begin publicly disclosing regulatory risk-based capital ratios using both theStandardized and Advanced Approaches, and will be required to use the lower of the regulatory risk-based capitalratios based on the Standardized or Advanced Approaches to determine whether we are in compliance with minimumcapital requirements.
73

The following table presents our regulatory risk-based capital ratios and leverage ratios and those of oursignificant bank subsidiaries, as well as additional ratios widely utilized in the marketplace, as of December 31, 2015.
TABLE 17: REGULATORY RISK-BASED CAPITAL AND LEVERAGE RATIOS
Basel IIIStandards
2015 (a)
Ratios as ofDecember 31,
2015
Risk-Based CapitalCommon Equity Tier 1 . . . . . . . . . . . . . . . . . . . . . . . . . . . . . . . . . . . . . . . . . . . . . . . . . . . . . . . . . . . . 4.5%
American Express Company . . . . . . . . . . . . . . . . . . . . . . . . . . . . . . . . . . . . . . . . . . . . . . . . . . . . . 12.4%American Express Centurion Bank . . . . . . . . . . . . . . . . . . . . . . . . . . . . . . . . . . . . . . . . . . . . . . . . 16.9American Express Bank, FSB . . . . . . . . . . . . . . . . . . . . . . . . . . . . . . . . . . . . . . . . . . . . . . . . . . . . 13.7
Tier 1 . . . . . . . . . . . . . . . . . . . . . . . . . . . . . . . . . . . . . . . . . . . . . . . . . . . . . . . . . . . . . . . . . . . . . . . . . . . 6.0American Express Company . . . . . . . . . . . . . . . . . . . . . . . . . . . . . . . . . . . . . . . . . . . . . . . . . . . . . 13.5American Express Centurion Bank . . . . . . . . . . . . . . . . . . . . . . . . . . . . . . . . . . . . . . . . . . . . . . . . 16.9American Express Bank, FSB . . . . . . . . . . . . . . . . . . . . . . . . . . . . . . . . . . . . . . . . . . . . . . . . . . . . 13.7
Total . . . . . . . . . . . . . . . . . . . . . . . . . . . . . . . . . . . . . . . . . . . . . . . . . . . . . . . . . . . . . . . . . . . . . . . . . . . 8.0American Express Company . . . . . . . . . . . . . . . . . . . . . . . . . . . . . . . . . . . . . . . . . . . . . . . . . . . . . 15.2American Express Centurion Bank . . . . . . . . . . . . . . . . . . . . . . . . . . . . . . . . . . . . . . . . . . . . . . . . 18.2American Express Bank, FSB . . . . . . . . . . . . . . . . . . . . . . . . . . . . . . . . . . . . . . . . . . . . . . . . . . . . 15.1
Tier 1 Leverage . . . . . . . . . . . . . . . . . . . . . . . . . . . . . . . . . . . . . . . . . . . . . . . . . . . . . . . . . . . . . . . . . . . 4.0American Express Company . . . . . . . . . . . . . . . . . . . . . . . . . . . . . . . . . . . . . . . . . . . . . . . . . . . . . 11.7American Express Centurion Bank . . . . . . . . . . . . . . . . . . . . . . . . . . . . . . . . . . . . . . . . . . . . . . . . 17.7American Express Bank, FSB . . . . . . . . . . . . . . . . . . . . . . . . . . . . . . . . . . . . . . . . . . . . . . . . . . . . 13.2
Supplementary Leverage Ratio (b) . . . . . . . . . . . . . . . . . . . . . . . . . . . . . . . . . . . . . . . . . . . . . . . . . . 3.0%American Express Company . . . . . . . . . . . . . . . . . . . . . . . . . . . . . . . . . . . . . . . . . . . . . . . . . . . . . 9.8American Express Centurion Bank . . . . . . . . . . . . . . . . . . . . . . . . . . . . . . . . . . . . . . . . . . . . . . . . 14.1American Express Bank, FSB . . . . . . . . . . . . . . . . . . . . . . . . . . . . . . . . . . . . . . . . . . . . . . . . . . . . 10.0
Common Equity to Risk-Weighted AssetsAmerican Express Company . . . . . . . . . . . . . . . . . . . . . . . . . . . . . . . . . . . . . . . . . . . . . . . . . . . . . 14.1
Tangible Common Equity to Risk-Weighted Assets (c)
American Express Company . . . . . . . . . . . . . . . . . . . . . . . . . . . . . . . . . . . . . . . . . . . . . . . . . . . . . 11.5%
(a) Transitional Basel III minimum and conservation buffer as defined by the Federal Reserve for calendar year 2015 for Advanced Approachesinstitutions.
(b) The minimum supplementary leverage ratio (SLR) requirement of 3 percent is effective January 1, 2018.(c) Tangible Common Equity to Risk-Weighted Assets, a non-GAAP measure, is calculated by dividing shareholders’ equity of $20.7 billion as of
December 31, 2015, less preferred shares of $1.6 billion and goodwill and other intangibles of $3.5 billion, by risk-weighted assets of $135.2billion. We believe presenting the ratio of Tangible Common Equity to Risk-Weighted Assets is a useful measure of evaluating the strength of ourcapital position. Tangible Common Equity to Risk-Weighted Assets ratio is widely used in the marketplace, although it may be calculateddifferently by different companies.
TABLE 18: REGULATORY RISK-BASED CAPITAL COMPONENTS AND RISK WEIGHTED ASSETS
($ in Billions)December 31,
2015
Risk-Based CapitalCommon Equity Tier 1 . . . . . . . . . . . . . . . . . . . . . . . . . . . . . . . . . . . . . . . . . . . . . . . . . . . . . . . . . . . . . . . . . . . . . . $ 16.7Tier 1 Capital . . . . . . . . . . . . . . . . . . . . . . . . . . . . . . . . . . . . . . . . . . . . . . . . . . . . . . . . . . . . . . . . . . . . . . . . . . . . . . 18.3Tier 2 Capital (a) . . . . . . . . . . . . . . . . . . . . . . . . . . . . . . . . . . . . . . . . . . . . . . . . . . . . . . . . . . . . . . . . . . . . . . . . . . . . 2.3Total Capital . . . . . . . . . . . . . . . . . . . . . . . . . . . . . . . . . . . . . . . . . . . . . . . . . . . . . . . . . . . . . . . . . . . . . . . . . . . . . . 20.6
Risk Weighted Assets . . . . . . . . . . . . . . . . . . . . . . . . . . . . . . . . . . . . . . . . . . . . . . . . . . . . . . . . . . . . . . . . . . . . . . . 135.2Average Total Assets to calculate the Tier 1 Leverage Ratio . . . . . . . . . . . . . . . . . . . . . . . . . . . . . . . . . . . . . . 156.4
Total Leverage Exposure to calculate SLR . . . . . . . . . . . . . . . . . . . . . . . . . . . . . . . . . . . . . . . . . . . . . . . . . . . . $186.6
(a) Tier 2 capital is the sum of the allowance for receivable and loan losses (limited to 1.25 percent of risk-weighted assets), a portion of theunrealized gains on equity securities, $600 million of subordinated notes issued in the fourth quarter of 2014 and $750 million of subordinateddebentures. The $750 million of subordinated debentures do not meet the requirements of Tier 2 capital under Basel III, and are beingtransitioned out of capital (the total amount included in Tier 2 capital as of December 31, 2015, was $187 million). Hence, the total amount ofsubordinated debt included in Tier 2 capital as of December 31, 2015, was $787 million. The $750 million of subordinated debentures have beenfully transitioned out of capital as of January 1, 2016.
74

We seek to maintain capital levels and ratios in excess of the minimum regulatory requirements and finance suchcapital in a cost efficient manner; failure to maintain minimum capital levels could affect our status as a financialholding company and cause the respective regulatory agencies to take actions that could limit our businessoperations.
Our primary source of equity capital has been the generation of net income. Historically, capital generatedthrough net income and other sources, such as the exercise of stock options by employees, has exceeded the annualgrowth in our capital requirements. To the extent capital has exceeded business, regulatory and rating agencyrequirements, we have historically returned excess capital to shareholders through our regular common sharedividend and share repurchase program.
We maintain certain flexibility to shift capital across our businesses as appropriate. For example, we may infuseadditional capital into subsidiaries to maintain capital at targeted levels in consideration of debt ratings and regulatoryrequirements. These infused amounts can affect the capital profile and liquidity levels at the American Express parentcompany level. We do not currently intend or foresee a need to shift capital from non-U.S. subsidiaries withpermanently reinvested earnings to a U.S. parent company.
The following are definitions for our regulatory risk-based capital ratios and leverage ratio, which are calculated asper standard regulatory guidance:
Risk-Weighted Assets — Assets are weighted for risk according to a formula used by the Federal Reserve toconform to capital adequacy guidelines. On- and off-balance sheet items are weighted for risk, with off-balance sheetitems converted to balance sheet equivalents, using risk conversion factors, before being allocated a risk-adjustedweight. The off-balance sheet items comprise a minimal part of the overall calculation. Risk-weighted assets underBasel III as of December 31, 2015 were $135.2 billion.
Common Equity Tier 1 Risk-Based Capital Ratio — The Common Equity Tier 1 risk-based capital ratio is calculatedas Common Equity Tier 1 capital, divided by risk-weighted assets. Common Equity Tier 1 is the sum of commonshareholders’ equity, adjusted for ineligible goodwill and intangible assets, certain deferred tax assets, as well ascertain other comprehensive income items as follows: net unrealized gains/losses on securities and derivatives, andnet unrealized pension and other postretirement benefit losses, all net of tax and subject to transition provisions.Common Equity Tier 1 capital as of December 31, 2015 was $16.7 billion.
Tier 1 Risk-Based Capital Ratio — The Tier 1 capital ratio is calculated as Tier 1 capital divided by risk-weightedassets. Tier 1 capital is the sum of Common Equity Tier 1 capital, our perpetual preferred stock and third-party non-controlling interests in consolidated subsidiaries adjusted for capital to be held by insurance subsidiaries and deferredtax assets from net operating losses not deducted from Common Equity Tier 1 capital. Tier 1 capital as of December 31,2015 was $18.3 billion.
Total Risk-Based Capital Ratio — The total risk-based capital ratio is calculated as the sum of Tier 1 capital and Tier2 capital, divided by risk-weighted assets. Tier 2 capital is the sum of the allowance for receivable and loan losses(limited to 1.25 percent of risk-weighted assets) a portion of the unrealized gains on equity securities, $600 million ofsubordinated notes issued in the fourth quarter of 2014 and $750 million of subordinated debentures adjusted forcapital to be held by insurance subsidiaries. The $750 million of subordinated debentures do not meet therequirements of Tier 2 capital under Basel III, and are being transitioned out of capital (the total amount included inTier 2 capital as of December 31, 2015 was $187 million). Hence, the total amount of subordinated debt included in Tier2 capital as of December 31, 2015 was $787 million. Tier 2 capital as of December 31, 2015 was $2.3 billion. The $750million of subordinated debentures have been fully transitioned out of capital as of January 1, 2016. See “Fully Phased-in Basel III” section.
Tier 1 Leverage Ratio — The Tier 1 leverage ratio is calculated by dividing Tier 1 capital by our average totalconsolidated assets for the most recent quarter. Average total consolidated assets as of December 31, 2015 were$156.4 billion.
The following is a definition for Tangible Common Equity to Risk-Weighted Assets ratio, which is widely used in themarketplace, although it may be calculated differently by different companies:
Common Equity and Tangible Common Equity to Risk-Weighted Assets Ratios — Common equity equals ourshareholders’ equity of $20.7 billion as of December 31, 2015, less preferred shares of $1.6 billion. Tangible commonequity, a non-GAAP measure, equals common equity less goodwill and other intangibles of $3.5 billion as ofDecember 31, 2015. We believe presenting the ratio of tangible common equity to risk-weighted assets is a usefulmeasure of evaluating the strength of our capital position.
75

FULLY PHASED-IN BASEL III
Basel III, when fully phased-in, will require bank holding companies and their bank subsidiaries to maintain morecapital than prior requirements, with a greater emphasis on common equity. The following table presents ourestimates for our regulatory risk-based capital ratios and leverage ratios had Basel III been fully phased-in as ofDecember 31, 2015. These ratios are calculated using the Standardized Approach for determining risk-weightedassets. As noted previously, we are currently taking steps toward Basel III Advanced Approaches implementation inthe United States. We believe the presentation of these ratios is helpful to investors by showing the impact of futureregulatory capital standards on our capital and leverage ratios.
TABLE 19: ESTIMATED FULLY PHASED-IN BASEL III CAPITAL AND LEVERAGE RATIOS
($ in Billions)December 31,
2015
Estimated Common Equity Tier 1 Ratio under Fully Phased-In Basel III (a) . . . . . . . . . . . . . . . . . . . . . . . . . . . . 11.8%Estimated Tier 1 Capital Ratio under Fully Phased-In Basel III (a) . . . . . . . . . . . . . . . . . . . . . . . . . . . . . . . . . . . . 13.0
Estimated Tier 1 Leverage Ratio under Fully Phased-In Basel III (b) . . . . . . . . . . . . . . . . . . . . . . . . . . . . . . . . . . 11.2Estimated Supplementary Leverage Ratio under Fully Phased-In Basel III . . . . . . . . . . . . . . . . . . . . . . . . . . . . 9.4%
Estimated Risk-Weighted Assets under Fully Phased-In Basel III (c) . . . . . . . . . . . . . . . . . . . . . . . . . . . . . . . . . . $135.0Estimated Average Total Assets to calculate the Tier 1 Leverage Ratio (b) . . . . . . . . . . . . . . . . . . . . . . . . . . . . 156.0Estimated Total Leverage Exposure to calculate SLR under Fully Phased-In Basel III (d) . . . . . . . . . . . . . . . . $ 186.1
(a) The Fully Phased-in Basel III Common Equity Tier 1 and Tier 1 risk-based capital ratios, non-GAAP measures, are calculated as Common EquityTier 1 or Tier 1 capital under Fully Phased-in Basel III rules, as applicable, divided by risk-weighted assets under Fully Phased-in Basel III rules.Refer to Table 20 for a reconciliation of Common Equity Tier 1 and Tier 1 capital under Fully Phased-in Basel III rules to Common Equity Tier 1and Tier 1 capital under Transitional Basel III rules.
(b) The Fully Phased-in Basel III Tier 1 and supplementary leverage ratios, non-GAAP measures, are calculated by dividing Fully Phased-in Basel IIITier 1 capital by our average total assets and Fully Phased-in total leverage exposure for supplementary leverage ratio purposes under FullyPhased-in Basel III, respectively.
(c) Estimated Fully Phased-in Basel III risk-weighted assets, a non-GAAP measure, reflect our Basel III risk-weighted assets, with all transitionprovisions fully phased in. This includes incremental risk weighting applied to deferred tax assets and significant investments in unconsolidatedfinancial institutions, as well as exposures to past due accounts, equities and sovereigns.
(d) Estimated Fully Phased-in Basel III Leverage Exposure, a non-GAAP measure, reflects average total consolidated assets with adjustments forTier 1 capital deductions on a fully phased-in basis, off-balance sheet derivatives, undrawn conditionally and unconditionally cancellablecommitments and other off-balance sheet liabilities.
The Basel capital standards establish minimum requirements for the Tier 1 risk-based capital ratios that are 1.5percent higher than the minimum requirements for Common Equity Tier 1 risk-based capital ratios. This differencebetween Tier 1 capital, which includes common equity and qualifying preferred securities and Common Equity Tier 1 isalso present in the minimum capital requirements within Comprehensive Capital Analysis and Review (CCAR). Weissued $750 million of preferred shares in the fourth quarter of 2014 and $850 million in the first quarter of 2015. Thepreferred shares issuances help to finance a portion of the Tier 1 capital requirements in excess of common equityrequirements.
Our $750 million of subordinated debentures, which prior to 2014, were fully included in Tier 2 capital (but not inTier 1 capital), do not meet the requirements of Tier 2 capital under Basel III. The phase-out of the subordinateddebentures from Tier 2 capital began in the first quarter of 2014 and will be fully phased out on January 1, 2016, whichaffects our total risk-based capital ratio. At our option, the subordinated debentures are redeemable for cash on orafter September 1, 2016 at 100 percent of the principal amount plus any accrued but unpaid interest. We currentlyintend to exercise this redemption option, subject to business and market conditions. As previously mentioned, weissued $600 million of subordinated notes in the fourth quarter of 2014, which qualifies as Tier 2 capital under Baselrules. Our total risk-based capital ratio is expected to remain well in excess of the required minimum.
76

The following table presents a comparison of our Common Equity Tier 1 and Tier 1 risk-based capital underTransitional Basel III rules to our estimated Common Equity Tier 1 and Tier 1 risk-based capital under Fully Phased-inBasel III rules as of December 31, 2015.
TABLE 20: TRANSITIONAL BASEL III VERSUS FULLY PHASED-IN BASEL III
(Billions) CET1 Tier 1
Risk-Based Capital under Transitional Basel III . . . . . . . . . . . . . . . . . . . . . . . . . . . . . . . . . . . . . . . . . . . . . . . . . $16.7 $18.3Adjustments related to:
AOCI . . . . . . . . . . . . . . . . . . . . . . . . . . . . . . . . . . . . . . . . . . . . . . . . . . . . . . . . . . . . . . . . . . . . . . . . . . . . . . . . . (0.3) (0.3)Transition provisions for intangible assets . . . . . . . . . . . . . . . . . . . . . . . . . . . . . . . . . . . . . . . . . . . . . . . . . (0.5) (0.5)Deferred tax assets . . . . . . . . . . . . . . . . . . . . . . . . . . . . . . . . . . . . . . . . . . . . . . . . . . . . . . . . . . . . . . . . . . . . . (0.1) (0.1)
Other . . . . . . . . . . . . . . . . . . . . . . . . . . . . . . . . . . . . . . . . . . . . . . . . . . . . . . . . . . . . . . . . . . . . . . . . . . . . . . . . . . . 0.1 0.1
Estimated Common Equity Tier 1 (CET1) and Tier 1 Risk-Based Capital under Fully Phased-inBasel III . . . . . . . . . . . . . . . . . . . . . . . . . . . . . . . . . . . . . . . . . . . . . . . . . . . . . . . . . . . . . . . . . . . . . . . . . . . . . . . . . $15.9 $17.5
Fully Phased-in Basel III Risk-Weighted Assets — The Fully Phased-in Basel III risk-weighted assets reflect ourBasel III risk-weighted assets, with all transition provisions fully phased in. This includes incremental risk weightingapplied to deferred tax assets and significant investments in unconsolidated financial institutions, as well as exposuresto past due accounts, equities and sovereigns. The Fully Phased-in Basel III risk-weighted assets as of December 31,2015 were estimated to be $135.0 billion.
Fully Phased-in Basel III Tier 1 Leverage Ratio — The Fully Phased-in Basel III Tier 1 leverage ratio is calculated bydividing Fully Phased-in Basel III Tier 1 capital by our average total consolidated assets.
Basel III Supplementary Leverage Ratio — The supplementary leverage ratio under Fully Phased-in Basel III rules iscalculated by dividing Fully Phased-in Basel III Tier 1 capital by our total assets for supplementary leverage capitalpurposes under Basel III. Total assets for supplementary leverage capital purposes reflect total consolidated assetswith adjustments for Tier 1 capital deductions, off-balance sheet derivatives, undrawn unconditionally cancellablecommitments and other off-balance sheet liabilities. Total assets for supplementary leverage capital purposes as ofDecember 31, 2015 were estimated to be $186.1 billion.
SHARE REPURCHASES AND DIVIDENDS
We return capital to common shareholders through dividends and share repurchases. The share repurchasesreduce common shares outstanding and more than offset the issuance of new shares as part of employeecompensation plans.
During the year ended December 31, 2015, we returned $5.6 billion to our shareholders in the form of commonstock dividends ($1.1 billion) and share repurchases ($4.5 billion). We repurchased 58.8 million common shares at anaverage price of $76.70 in 2015. These dividend and share repurchase amounts represent approximately 105 percentof total capital generated during the year. The amount of capital we generated in 2015 significantly exceeded thecapital required to finance organic business growth and acquisitions. The proposed sales of the HFS loan portfolios areexpected to, all else remaining constant, increase our capital ratios due to the reduction in risk-weighted assets. Thisadditional capital flexibility may be used to support growth in loans, potential acquisitions, distributions toshareholders, or a combination thereof. Beginning in 2016, participating CCAR firms are now required to submit theircapital plans and stress testing results to the Federal Reserve on or before April 5 of each year instead of on or beforeJanuary 5 of each year as previously required. The Federal Reserve is expected to publish the decisions for all the bankholding companies participating in CCAR 2016, including the reasons for any objection to capital plans, by June 30,2016.
In addition, during the year ended December 31, 2015, we had $750 million of non-cumulative perpetual preferredshares (the “Series B Preferred Shares”) and $850 million of non-cumulative perpetual preferred shares (the “SeriesC Preferred Shares”) outstanding. Dividends declared and paid on Series B and Series C Preferred Shares during 2015were $40 million and $22 million, respectively. For additional information on our preferred shares refer to Note 17“Common and Preferred Shares” and Note 22 “Earnings per Common Share (EPS); Preferred Shares” of the“Consolidated Financial Statements.”
77
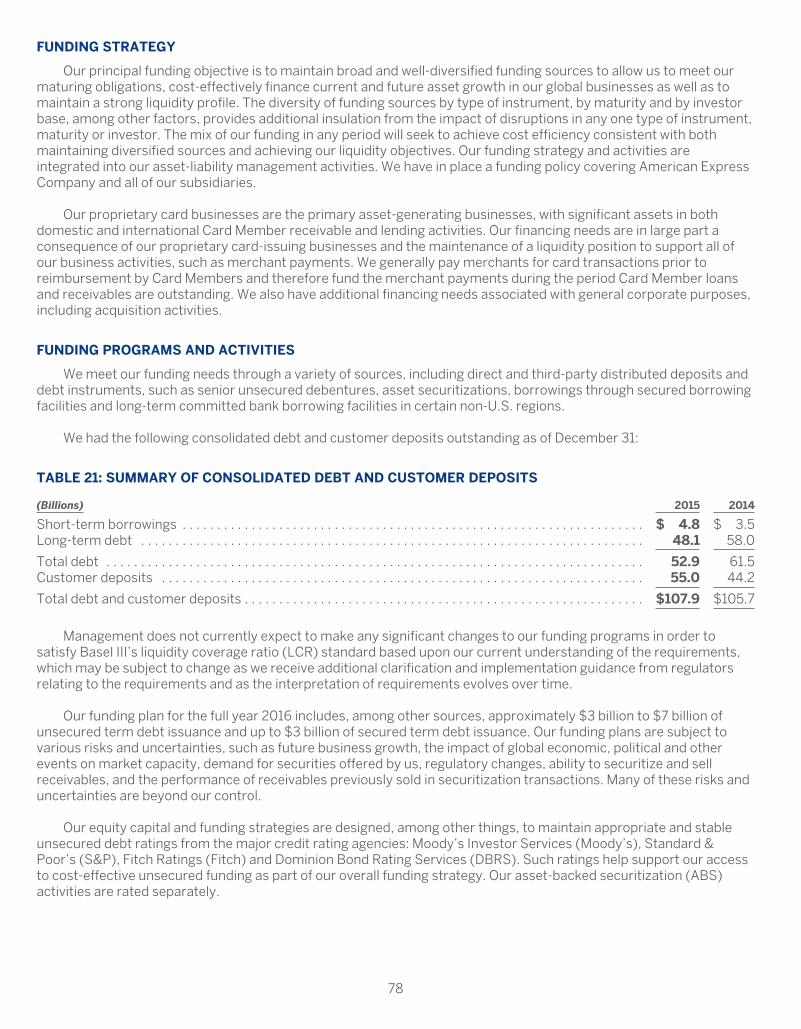
FUNDING STRATEGY
Our principal funding objective is to maintain broad and well-diversified funding sources to allow us to meet ourmaturing obligations, cost-effectively finance current and future asset growth in our global businesses as well as tomaintain a strong liquidity profile. The diversity of funding sources by type of instrument, by maturity and by investorbase, among other factors, provides additional insulation from the impact of disruptions in any one type of instrument,maturity or investor. The mix of our funding in any period will seek to achieve cost efficiency consistent with bothmaintaining diversified sources and achieving our liquidity objectives. Our funding strategy and activities areintegrated into our asset-liability management activities. We have in place a funding policy covering American ExpressCompany and all of our subsidiaries.
Our proprietary card businesses are the primary asset-generating businesses, with significant assets in bothdomestic and international Card Member receivable and lending activities. Our financing needs are in large part aconsequence of our proprietary card-issuing businesses and the maintenance of a liquidity position to support all ofour business activities, such as merchant payments. We generally pay merchants for card transactions prior toreimbursement by Card Members and therefore fund the merchant payments during the period Card Member loansand receivables are outstanding. We also have additional financing needs associated with general corporate purposes,including acquisition activities.
FUNDING PROGRAMS AND ACTIVITIES
We meet our funding needs through a variety of sources, including direct and third-party distributed deposits anddebt instruments, such as senior unsecured debentures, asset securitizations, borrowings through secured borrowingfacilities and long-term committed bank borrowing facilities in certain non-U.S. regions.
We had the following consolidated debt and customer deposits outstanding as of December 31:
TABLE 21: SUMMARY OF CONSOLIDATED DEBT AND CUSTOMER DEPOSITS
(Billions) 2015 2014
Short-term borrowings . . . . . . . . . . . . . . . . . . . . . . . . . . . . . . . . . . . . . . . . . . . . . . . . . . . . . . . . . . . . . . . . . . . $ 4.8 $ 3.5Long-term debt . . . . . . . . . . . . . . . . . . . . . . . . . . . . . . . . . . . . . . . . . . . . . . . . . . . . . . . . . . . . . . . . . . . . . . . . . 48.1 58.0
Total debt . . . . . . . . . . . . . . . . . . . . . . . . . . . . . . . . . . . . . . . . . . . . . . . . . . . . . . . . . . . . . . . . . . . . . . . . . . . . . . 52.9 61.5Customer deposits . . . . . . . . . . . . . . . . . . . . . . . . . . . . . . . . . . . . . . . . . . . . . . . . . . . . . . . . . . . . . . . . . . . . . . 55.0 44.2
Total debt and customer deposits . . . . . . . . . . . . . . . . . . . . . . . . . . . . . . . . . . . . . . . . . . . . . . . . . . . . . . . . . . $107.9 $105.7
Management does not currently expect to make any significant changes to our funding programs in order tosatisfy Basel III’s liquidity coverage ratio (LCR) standard based upon our current understanding of the requirements,which may be subject to change as we receive additional clarification and implementation guidance from regulatorsrelating to the requirements and as the interpretation of requirements evolves over time.
Our funding plan for the full year 2016 includes, among other sources, approximately $3 billion to $7 billion ofunsecured term debt issuance and up to $3 billion of secured term debt issuance. Our funding plans are subject tovarious risks and uncertainties, such as future business growth, the impact of global economic, political and otherevents on market capacity, demand for securities offered by us, regulatory changes, ability to securitize and sellreceivables, and the performance of receivables previously sold in securitization transactions. Many of these risks anduncertainties are beyond our control.
Our equity capital and funding strategies are designed, among other things, to maintain appropriate and stableunsecured debt ratings from the major credit rating agencies: Moody’s Investor Services (Moody’s), Standard &Poor’s (S&P), Fitch Ratings (Fitch) and Dominion Bond Rating Services (DBRS). Such ratings help support our accessto cost-effective unsecured funding as part of our overall funding strategy. Our asset-backed securitization (ABS)activities are rated separately.
78

TABLE 22: UNSECURED DEBT RATINGS
Credit Agency Entity RatedShort-Term
RatingsLong-Term
Ratings Outlook
DBRS . . . . . . . . . . . . . . . . . . . . . . . . . All rated entities R-1 (middle) A (high) StableFitch . . . . . . . . . . . . . . . . . . . . . . . . . . All rated entities F1 A+ StableMoody’s . . . . . . . . . . . . . . . . . . . . . . . TRS and rated operating subsidiaries (a) Prime-1 A2 StableMoody’s . . . . . . . . . . . . . . . . . . . . . . . American Express Company Prime-2 A3 StableS&P . . . . . . . . . . . . . . . . . . . . . . . . . . TRS and rated operating subsidiaries (a)(b) A-2 A- StableS&P . . . . . . . . . . . . . . . . . . . . . . . . . . American Express Company A-2 BBB+ Stable
(a) American Express Travel Related Services Company, Inc.(b) S&P does not provide a rating for TRS short-term debt.
Downgrades in the ratings of our unsecured debt or asset securitization program securities could result in higherfunding costs, as well as higher fees related to borrowings under our unused lines of credit. Declines in credit ratingscould also reduce our borrowing capacity in the unsecured debt and asset securitization capital markets. We believeour funding mix, including the proportion of U.S. retail deposits insured by the Federal Deposit Insurance Corporation(FDIC), should reduce the impact that credit rating downgrades would have on our funding capacity and costs.
SHORT-TERM FUNDING PROGRAMS
Short-term borrowings, such as commercial paper, are defined as any debt with an original maturity of 12 monthsor less, as well as interest-bearing overdrafts with banks. Our short-term funding programs are used primarily to meetworking capital needs, such as managing seasonal variations in receivables balances. The amount of short-termborrowings issued in the future will depend on our funding strategy, our needs and market conditions.
We had the following short-term borrowings outstanding as of December 31:
TABLE 23: SHORT-TERM BORROWINGS OUTSTANDING
(Billions) 2015 2014
Commercial paper (a) . . . . . . . . . . . . . . . . . . . . . . . . . . . . . . . . . . . . . . . . . . . . . . . . . . . . . . . . . . . . . . . . . . . . . . . . $ 2.1 $0.8Other short-term borrowings . . . . . . . . . . . . . . . . . . . . . . . . . . . . . . . . . . . . . . . . . . . . . . . . . . . . . . . . . . . . . . . . . 2.7 2.7
Total . . . . . . . . . . . . . . . . . . . . . . . . . . . . . . . . . . . . . . . . . . . . . . . . . . . . . . . . . . . . . . . . . . . . . . . . . . . . . . . . . . . . . . $4.8 $3.5
(a) Average commercial paper outstanding was $0.9 billion and $0.2 billion in 2015 and 2014, respectively.
Refer to Note 9 to the “Consolidated Financial Statements” for further description of these borrowings.
DEPOSIT PROGRAMS
We offer deposits within our American Express Centurion Bank (Centurion Bank) and American Express Bank,FSB (American Express Bank) subsidiaries (together, the Banks). These funds are currently insured up to $250,000per account holder through the FDIC. Our ability to obtain deposit funding and offer competitive interest rates isdependent on the Banks’ capital levels. We, through the American Express Bank, have a direct retail deposit program,Personal Savings from American Express, to supplement our distribution of deposit products sourced through third-party distribution channels. The direct retail program makes FDIC-insured certificates of deposit (CDs) and high-yieldsavings account products available directly to consumers.
79

We held the following deposits as of December 31:
TABLE 24: CUSTOMER DEPOSITS
(Billions) 2015 2014
U.S. retail deposits:Savings accounts — Direct . . . . . . . . . . . . . . . . . . . . . . . . . . . . . . . . . . . . . . . . . . . . . . . . . . . . . . . . . . . . . . . $29.0 $26.2Certificates of deposit: (a)
Direct . . . . . . . . . . . . . . . . . . . . . . . . . . . . . . . . . . . . . . . . . . . . . . . . . . . . . . . . . . . . . . . . . . . . . . . . . . . . . . . 0.3 0.3Third-party (brokered) . . . . . . . . . . . . . . . . . . . . . . . . . . . . . . . . . . . . . . . . . . . . . . . . . . . . . . . . . . . . . . . . . 13.9 7.8
Sweep accounts — Third-party (brokered) . . . . . . . . . . . . . . . . . . . . . . . . . . . . . . . . . . . . . . . . . . . . . . . . . . 10.9 9.0Other retail deposits:
Non-U.S. deposits and U.S. non-interest bearing . . . . . . . . . . . . . . . . . . . . . . . . . . . . . . . . . . . . . . . . . . . . . 0.2 0.2Card Member credit balances — U.S. and non-U.S. . . . . . . . . . . . . . . . . . . . . . . . . . . . . . . . . . . . . . . . . . . . . 0.7 0.7
Total customer deposits . . . . . . . . . . . . . . . . . . . . . . . . . . . . . . . . . . . . . . . . . . . . . . . . . . . . . . . . . . . . . . . . . . . $55.0 $44.2
(a) The weighted average remaining maturity and weighted average rate at issuance on the total portfolio of U.S. retail CDs, issued through directand third-party programs, were 30.7 months and 1.69 percent, respectively, as of December 31, 2015.
LONG-TERM DEBT PROGRAMS
During 2015, we and our subsidiaries issued unsecured debt and asset-backed securities with maturities rangingfrom 2 to 5 years. These amounts included approximately $6.6 billion of unsecured debt and $1.0 billion of AAA-ratedsecuritization certificates and notes. During the year, we retained approximately $0.1 billion of subordinatedsecurities, as the pricing for these securities were not attractive compared to our other sources of financing available.
Our 2015 debt issuances were as follows:
TABLE 25: DEBT ISSUANCES
(Billions)
American Express Credit Corporation:Fixed Rate Senior Notes (weighted-average coupon of 2.26%) . . . . . . . . . . . . . . . . . . . . . . . . . . . . . . . . . . . . . . . . . $4.9Floating Rate Senior Notes (3-month LIBOR plus 80 basis points on average) . . . . . . . . . . . . . . . . . . . . . . . . . . . . 1.7
American Express Credit Account Master Trust: (a)
Floating Rate Senior Certificates (1-month LIBOR plus 29 basis points on average) . . . . . . . . . . . . . . . . . . . . . . . 1.0
Total . . . . . . . . . . . . . . . . . . . . . . . . . . . . . . . . . . . . . . . . . . . . . . . . . . . . . . . . . . . . . . . . . . . . . . . . . . . . . . . . . . . . . . . . . . . . . $ 7.6
(a) Issuances from the American Express Credit Account Master Trust (the Lending Trust) do not include $0.1 billion of subordinated securitiesretained by us during the year.
ASSET SECURITIZATION PROGRAMS
We periodically securitize Card Member receivables and loans arising from our card business, as the securitizationmarket provides us with cost-effective funding. Securitization of Card Member receivables and loans is accomplishedthrough the transfer of those assets to a trust, which in turn issues securities collateralized by the transferred assetsto third-party investors. The proceeds from issuance are distributed to us, through our wholly owned subsidiaries, asconsideration for the transferred assets.
The receivables and loans being securitized are reported as Card Member receivables and loans on ourConsolidated Balance Sheets, with a portion also included in Card Member loans and receivables HFS, and the relatedsecurities issued to third-party investors are reported as long-term debt.
Under the respective terms of the securitization trust agreements, the occurrence of certain triggering eventsassociated with the performance of the assets of each trust could result in payment of trust expenses, establishmentof reserve funds, or in a worst-case scenario, early amortization of investor securities. During the twelve months endedDecember 31, 2015, no such triggering events occurred.
80

LIQUIDITY MANAGEMENT
We incur liquidity risk that arises in the course of offering our products and services. Our liquidity objective is tomaintain access to a diverse set of on- and off-balance sheet liquidity sources. We seek to maintain liquidity sources,even in the event we are unable to raise new funds under our regular funding programs during a substantial weakeningin economic conditions, in amounts sufficient to meet our expected future financial obligations and our businesses’requirements for liquidity for a period of at least twelve months. Our liquidity risk policy sets out our objectives andapproach to managing liquidity risk.
The liquidity risks that we are exposed to could arise from a wide variety of scenarios. Our liquidity managementstrategy thus includes a number of elements, including, but not limited to:
• Maintaining diversified funding sources (refer to the “Funding Strategy” section for more details);
• Maintaining unencumbered liquid assets and off-balance sheet liquidity sources;
• Projecting cash inflows and outflows under a variety of economic and market scenarios;
• Establishing clear objectives for liquidity risk management, including compliance with regulatory requirements;
• Incorporating liquidity risk management as appropriate into our capital adequacy framework.
We seek to maintain access to a diverse set of on-balance sheet and off-balance sheet liquidity sources, includingcash and other liquid assets, committed bank credit facilities and ABS conduit facilities. Through our U.S. banksubsidiaries, we also hold collateral eligible for use at the Federal Reserve’s discount window.
The amount and type of liquidity resources we maintain can vary over time, based upon the results of stressscenarios required under the Dodd-Frank Wall Street Reform and Consumer Protection Act (Dodd-Frank) and otherregulatory measures of liquidity, such as the Liquidity Coverage Ratio (LCR), as well as additional stress scenariosrequired under our liquidity risk policy. These stress scenarios possess distinct characteristics, varying by cash flowassumptions, time horizon and qualifying liquidity sources, among other factors. Scenarios under our liquidity riskpolicy include market-wide, firm-specific and combined liquidity stresses. The LCR rule prescribes cash flowassumptions over a 30-day period and establishes qualifying criteria for high-quality liquid assets. We consider otherfactors in determining the amount and type of liquidity we maintain, such as economic and financial market conditions,seasonality in business operations, growth in our businesses, potential acquisitions or dispositions, the cost andavailability of alternative liquidity sources and credit rating agency guidelines and requirements.
The investment income we receive on liquidity resources, such as cash, is less than the interest expense on thesources of funding for these balances. The net interest costs on these amounts have been substantial. The level offuture net interest costs depends on the amount of liquidity resources we maintain and the difference between ourcost of funding these amounts and their investment yields.
Securitized Borrowing Capacity
As of December 31, 2015, we maintained our committed, revolving, secured borrowing facility, with a maturitydate of July 15, 2018, that gives us the right to sell up to $3.0 billion face amount of eligible AAA notes from theAmerican Express Issuance Trust II (the Charge Trust together with the Lending Trust, the Trusts). We alsomaintained our committed, revolving, secured borrowing facility, with a maturity date of September 15, 2017, thatgives us the right to sell up to $2.0 billion face amount of eligible AAA certificates from the Lending Trust. Bothfacilities are used in the ordinary course of business to fund seasonal working capital needs, as well as to furtherenhance our contingent funding resources. As of December 31, 2015, $1.0 billion was drawn on the Charge Trustfacility and $0.1 billion was drawn on the Lending Trust facility, both of which were subsequently repaid on January 15,2016.
Federal Reserve Discount Window
As insured depository institutions, the Banks may borrow from the Federal Reserve Bank of San Francisco,subject to the amount of qualifying collateral that they may pledge. The Federal Reserve has indicated that both creditand charge card receivables are a form of qualifying collateral for secured borrowings made through the discountwindow. Whether specific assets will be considered qualifying collateral and the amount that may be borrowed againstthe collateral remain at the discretion of the Federal Reserve.
We had approximately $50.9 billion as of December 31, 2015 in U.S. credit card loans and charge card receivablesthat could be sold over time through our securitization trusts or pledged in return for secured borrowings, to providefurther liquidity, subject in each case to applicable market conditions and eligibility criteria.
81

Committed Bank Credit Facilities
In addition to the secured borrowing facilities described earlier in this section, we maintained a committedsyndicated bank credit facility as of December 31, 2015 of $3.0 billion, which expires on December 9, 2018. Theavailability of this credit line is subject to our compliance with certain financial covenants, principally the maintenanceby American Express Credit Corporation (Credco) of a certain ratio of combined earnings and fixed charges to fixedcharges. As of December 31, 2015, we were in compliance with each of our covenants. As of December 31, 2015, noamounts were drawn on the committed credit facility. The capacity of the facility mainly served to further enhance ourcontingent funding resources.
Our committed bank credit facility does not contain a material adverse change clause, which might otherwisepreclude borrowing under the credit facility, nor is it dependent on our credit rating.
CASH FLOWS
The following table summarizes our cash flow activity, followed by a discussion of the major drivers impactingoperating, investing and financing cash flows.
TABLE 26: CASH FLOWS
(Billions) 2015 2014 2013
Total cash provided by (used in):Operating activities . . . . . . . . . . . . . . . . . . . . . . . . . . . . . . . . . . . . . . . . . . . . . . . . . . . . . . . . . . . . . . . . . $11.0 $ 11.0 $ 8.5Investing activities . . . . . . . . . . . . . . . . . . . . . . . . . . . . . . . . . . . . . . . . . . . . . . . . . . . . . . . . . . . . . . . . . . (8.2) (8.0) (7.2)Financing activities . . . . . . . . . . . . . . . . . . . . . . . . . . . . . . . . . . . . . . . . . . . . . . . . . . . . . . . . . . . . . . . . . . (2.0) — (3.9)Effect of foreign currency exchange rates on cash and cash equivalents . . . . . . . . . . . . . . . . . . . . (0.3) (0.2) (0.2)
Net increase (decrease) in cash and cash equivalents . . . . . . . . . . . . . . . . . . . . . . . . . . . . . . . . . . . . $ 0.5 $ 2.8 $(2.8)
Cash Flows from Operating Activities
Our cash flows from operating activities primarily include net income adjusted for (i) non-cash items included innet income and (ii) changes in the balances of operating assets and liabilities, which can vary significantly in the normalcourse of business due to the amount and timing of payments.
For December 31, 2015 and 2014, net cash provided by operating activities remained consistent at $11.0 billion inboth periods, driven by net income of $5.2 billion and $5.9 billion, respectively, adjusted for non-cash items includingcertain changes in provisions for losses, depreciation and amortization, deferred taxes, and stock-basedcompensation.
Cash Flows from Investing Activities
Our cash flows from investing activities primarily include changes in Card Member receivables and loans,including Card Member loans and receivables HFS, as well as changes in our available for sale investment securitiesportfolio.
For the year ended December 31, 2015 and 2014, net cash used in investing activities was $8.2 billion and $8.0billion, respectively. Both periods primarily reflect an increase in Card Member receivables and loans, including theHFS portfolios. In 2014, that increase was partially offset by the cash proceeds from the sale of our investment inConcur.
Cash Flows from Financing Activities
Our cash flows from financing activities primarily include issuing and repaying debt, changes in customerdeposits, issuing and repurchasing our common shares, and paying dividends.
For the year ended December 31, 2015, net cash used in financing activities was $2.0 billion. For the year endedDecember 31, 2014, net cash provided by financing activities was $11 million. The variance was primarily driven by anincrease in debt repayments in the current year versus the prior year, partially offset by a greater increase in customerdeposits in the current year versus the prior year.
82

OFF-BALANCE SHEET ARRANGEMENTS AND CONTRACTUAL OBLIGATIONS
We have identified both on- and off-balance sheet transactions, arrangements, obligations and other relationshipsthat may have a material current or future effect on our financial condition, changes in financial condition, results ofoperations, or liquidity and capital resources.
CONTRACTUAL OBLIGATIONS
The table below identifies transactions that represent our contractually committed future obligations. Purchaseobligations include our agreements to purchase goods and services that are enforceable and legally binding and thatspecify significant terms, including: fixed or minimum quantities to be purchased; fixed, minimum or variable priceprovisions; and the approximate timing of the transaction.
TABLE 27: COMMITTED FUTURE OBLIGATIONS BY YEAR
Payments due by year (a)
(Millions) 2016 2017-2018 2019-20202021 and
thereafter Total
Long-term debt . . . . . . . . . . . . . . . . . . . . . . . . . . . . . . . . . . . . . . . . . . . . . . . . . . $ 6,814 $28,608 $10,262 $ 3,176 $48,860Interest payments on long-term debt (b) . . . . . . . . . . . . . . . . . . . . . . . . . . . . . 864 1,016 331 1,360 3,571Certificates of deposit . . . . . . . . . . . . . . . . . . . . . . . . . . . . . . . . . . . . . . . . . . . . 2,493 6,810 4,841 — 14,144Other long-term liabilities (c) . . . . . . . . . . . . . . . . . . . . . . . . . . . . . . . . . . . . . . . 184 70 17 22 293Operating lease obligations . . . . . . . . . . . . . . . . . . . . . . . . . . . . . . . . . . . . . . . . 165 278 187 863 1,493Purchase obligations (d) . . . . . . . . . . . . . . . . . . . . . . . . . . . . . . . . . . . . . . . . . . . 397 165 61 30 653Cobrand obligations (e) . . . . . . . . . . . . . . . . . . . . . . . . . . . . . . . . . . . . . . . . . . . . 212 138 63 204 617
Total . . . . . . . . . . . . . . . . . . . . . . . . . . . . . . . . . . . . . . . . . . . . . . . . . . . . . . . . . . . $11,129 $37,085 $15,762 $5,655 $ 69,631
(a) The table above excludes approximately $0.9 billion of tax liabilities related to the uncertainty in income taxes as inherent complexities and thenumber of tax years currently open for examination in multiple jurisdictions do not permit reasonable estimates of payments, if any, to be madeover a range of years.
(b) Estimated interest payments were calculated using the effective interest rate in place as of December 31, 2015, and includes the effect ofexisting interest rate swaps. Actual cash flows may differ from estimated payments.
(c) As of December 31, 2015, there were no minimum required contributions, and no contributions are currently planned, for the U.S. AmericanExpress Retirement Plan. For the U.S. American Express Retirement Restoration Plan and non-U.S. defined benefit pension and postretirementbenefit plans, contributions in 2016 are anticipated to be approximately $44 million, and this amount has been included within other long-termliabilities. Remaining obligations under defined benefit pension and postretirement benefit plans aggregating $726 million have not beenincluded in the table above as the timing of such obligations is not determinable. Additionally, other long-term liabilities do not include $6.7billion of Membership Rewards liabilities, which are not considered long-term liabilities as Card Members in good standing can redeem pointsimmediately, without restrictions, and because the timing of point redemption is not determinable.
(d) The purchase obligation amounts represent either the early termination fees or non-cancelable minimum contractual obligations, as applicable,by period under contracts that were in effect as of December 31, 2015.
(e) Represents obligations to make payments under contractual agreements with certain cobrand partners. We expect to fully satisfy theseobligations over the remaining term of these agreements as part of the ongoing operations of our business.
In addition to the contractual obligations noted in Table 27, we have off-balance sheet arrangements that includeguarantees, indemnifications and certain other off-balance sheet arrangements.
GUARANTEES
Our principal guarantees are associated with Card Member services to enhance the value of owning an AmericanExpress card. As of December 31, 2015, we had guarantees totaling approximately $48 billion related to Card Memberprotection plans, as well as other guarantees and indemnifications provided in the ordinary course of business. Referto Note 16 to the “Consolidated Financial Statements” for further discussion regarding our guarantees.
CERTAIN OTHER OFF-BALANCE SHEET ARRANGEMENTS
As of December 31, 2015, we had approximately $297 billion of unused credit available to Card Members as part ofestablished lending product agreements. Total unused credit available to Card Members does not represent potentialfuture cash requirements, as a significant portion of this unused credit will likely not be drawn. Our charge card productsgenerally have no pre-set limit, and therefore are not reflected in unused credit available to Card Members.
To mitigate counterparty credit risk related to derivatives, we accepted non-cash collateral in the form of securityinterests in U.S. Treasury securities from its derivatives counterparties with a fair value of nil and $91 million as ofDecember 31, 2015 and 2014, respectively, none of which was sold or repledged.
Refer to Notes 7 and 13 to the “Consolidated Financial Statements” for discussion regarding our other off-balancesheet arrangements.
83

RISK MANAGEMENTGOVERNANCE
We use our comprehensive Enterprise-wide Risk Management (ERM) program to identify, aggregate, monitor, andmanage risks. The program also defines our risk appetite, governance, culture and capabilities. The implementationand execution of the ERM program is headed by our Chief Risk Officer.
Risk management is overseen by our Board of Directors through three Board committees: the Risk Committee,the Audit and Compliance Committee, and the Compensation and Benefits Committee. Each committee consistsentirely of independent directors and provides regular reports to the full Board regarding matters reviewed at theircommittee. The committees meet regularly in private sessions with our Chief Risk Officer, the Chief Compliance &Ethics Officer, the General Auditor and other senior management with regard to our risk management processes,controls, talent and capabilities. The Board monitors the “tone at the top,” our risk culture, and oversees emerging andstrategic risks.
The Risk Committee of our Board of Directors provides oversight on risk policies, risk appetite and ourperformance against goals. The Risk Committee approves our ERM policy along with its sub-policies governingindividual credit risk, institutional credit risk, market risk, liquidity risk, operational risk, reputational risk and asset/liability risk, as well as policies governing the launch of new products and services, third-party management, andresolution planning. The ERM policy defines our risk appetite as well as governance over risk taking and oversightprocesses. Risk appetite defines the authorized risk limits to control exposures well within our risk capacity even understressed forward-looking scenarios. In addition, it establishes principles for risk taking in the aggregate and for eachrisk type, and is supported by a comprehensive system for monitoring limits, escalation triggers and assessing controlprograms.
The Risk Committee reviews and concurs in the appointment, replacement, performance and compensation of ourChief Risk Officer and receives regular updates from the Chief Risk Officer on key risks, transactions and exposures.
The Risk Committee reviews our credit risk profile as well as credit risk performance, trends and risk managementcapabilities.
The Risk Committee also reviews enterprise-wide operational risk trends, events and capabilities, with anemphasis on compliance, fraud, legal, process or control failures, information security, and privacy, as well as trends inmarket, funding, liquidity and reputational risks. The Risk Committee also provides oversight of our compliance withBasel capital and liquidity standards and its Internal Capital Adequacy Assessment Process, including its CCARsubmissions; and resolution planning.
The Audit and Compliance Committee of our Board of Directors approves our compliance policies and risktolerance, and reinforces the importance of our compliance risk management. In addition, the Audit and ComplianceCommittee reviews the effectiveness of our Corporate-wide Compliance Risk Management Program. More broadly,this committee is responsible for assisting the Board in its oversight responsibilities relating to the integrity of ourfinancial statements and financial reporting process, internal and external auditing, including the qualifications andindependence of the independent registered public accounting firm and the performance of our internal audit servicesfunction, and the integrity of our systems of internal accounting and financial controls.
The Audit and Compliance Committee provides oversight of our Internal Audit Group. The Audit and ComplianceCommittee reviews and concurs in the appointment, replacement, performance and compensation of our GeneralAuditor and approves Internal Audit’s annual Audit Plan, charter, policies and budget. The Audit and ComplianceCommittee also receives regular updates on the Audit Plan’s status and results including significant reports issued byInternal Audit and the status of our corrective actions.
The Compensation and Benefits Committee of our Board of Directors works with the Chief Risk Officer to ensureour overall compensation programs, as well as those covering our business units and risk-taking employees,appropriately balance risk with business incentives and how business performance is achieved without takingimprudent or excessive risk. Our Chief Risk Officer is actively involved in setting goals, including for our business units.Our Chief Risk Officer also reviews the current and forward-looking risk profiles of each business unit, and providesinput into performance evaluation. The Chief Risk Officer meets with the Compensation and Benefits Committee andattests whether performance goals and results have been achieved without taking imprudent risks. The Compensationand Benefits Committee uses a risk-balanced incentive compensation framework to decide on our bonus pools andthe compensation of senior executives.
84

There are several internal management committees, including the Enterprise-wide Risk Management Committee(ERMC), chaired by our Chief Risk Officer. The ERMC is the highest-level management committee to oversee all firm-widerisks. It maintains the enterprise-wide risk appetite framework and monitors compliance with limits and escalations defined init. The ERMC oversees implementation of risk policies companywide with approval by the appropriate board committee. TheERMC reviews key risk exposures, trends and concentrations, significant compliance matters, economic capital and Baselcapital trends, and provides guidance on the steps to monitor, control and report major risks. The ERMC is responsible for riskgovernance, risk oversight and risk appetite for all risks, which include individual credit risk, institutional credit risk, operationalrisk, compliance risk, reputational risk, market risk, asset liability management (ALM) risk, liquidity risk, model risk, andstrategic and business risk.
As defined in the ERM policy, we follow the “three lines of defense” approach to risk management. The first line of defensecomprises functions and management committees directly initiating risk taking. Business unit presidents, our Chief CreditOfficer, Chief Operational Risk Officer, Chief Market Risk Officer and Functional Risk Officer are part of the first line of defense.
The second line comprises independent functions overseeing risk taking activities of the first line. The Global RiskOversight Officer and Market Risk Oversight Officer, the Chief Compliance & Ethics Officer, the Corporate Comptroller andcertain control groups, both at the enterprise level and within regulated entities, are part of the second line of defense. Theglobal risk oversight team oversees the policies, strategies, frameworks, models, processes and capabilities deployed by thefirst line teams and provides challenges and independent assessments on how the first line of defense is managing risks.
Our Internal Audit Group constitutes the third line of defense, and provides independent assessments and effectivechallenge of the first and second lines of defense.
In addition, the Asset Liability Committee, chaired by our Chief Financial Officer, is responsible for managing market,liquidity, asset/liability risk and capital.
CREDIT RISK MANAGEMENT PROCESS
Credit risk is defined as loss due to obligor or counterparty default or changes in the credit quality of a security. Our creditrisks are divided into two broad categories: individual and institutional. Each has distinct risk management capabilities,strategies, and tools. Business units that create individual or institutional credit risk exposures of significant importance aresupported by dedicated risk management teams, each led by a Chief Credit Officer. To preserve independence, Chief CreditOfficers for all business units report to our Chief Credit Officer.
INDIVIDUAL CREDIT RISK
Individual credit risk arises principally from consumer and small business charge cards, credit cards, lines of credit, andloans. These portfolios consist of millions of customers across multiple geographies, industries and levels of net worth. Webenefit from the high-quality profile of our customers, which is driven by our brand, premium customer servicing, productfeatures and risk management capabilities, which span underwriting, customer management and collections. Externally, therisk in these portfolios is correlated to broad economic trends, such as unemployment rates and gross domestic product(GDP) growth, which can affect customer liquidity.
The business unit leaders and their Chief Credit Officers take the lead in managing the individual credit risk process. TheseChief Credit Officers are guided by the Individual Credit Risk Committee, which is responsible for implementation andenforcement of the Individual Credit Risk Management Policy. This policy is further supported by subordinate policies andoperating manuals covering decision logic and processes of credit extension, including prospecting, new account approvals,point-of-sale authorizations, credit line management and collections. The subordinate risk policies and operating manuals aredesigned to ensure consistent application of risk management principles and standardized reporting of asset quality and lossrecognition.
Individual credit risk management is supported by sophisticated proprietary scoring and decision-making models thatuse the most up-to-date information on prospects and customers, such as spending and payment history and data feeds fromcredit bureaus. Additional data, such as commercial variables, are integrated to further mitigate small business risk. We havedeveloped data-driven economic decision logic for customer interactions to better serve our customers.
INSTITUTIONAL CREDIT RISK
Institutional credit risk arises principally within our Global Corporate Payments, Global Merchant Services, GNS, PrepaidServices, and Foreign Exchange Services businesses, as well as investment and liquidity management activities. Unlikeindividual credit risk, institutional credit risk is characterized by a lower loss frequency but higher severity. It is affected both bygeneral economic conditions and by client-specific events. The absence of large losses in any given year or over several yearsis not necessarily representative of the level of risk of institutional portfolios, given the infrequency of loss events in suchportfolios.
85

Similar to Individual Credit Risk, business units taking institutional credit risks are supported by Chief CreditOfficers. These officers are guided by the Institutional Risk Management Committee (IRMC), which is responsible forimplementation and enforcement of the Institutional Credit Risk Management Policy and for providing guidance to thecredit officers of each business unit with substantial institutional credit risk exposures. The committee, along with thebusiness unit Chief Credit Officers, makes investment decisions in core risk capabilities, ensures properimplementation of the underwriting standards and contractual rights of risk mitigation, monitors risk exposures, anddetermines risk mitigation actions. The IRMC formally reviews large institutional risk exposures to ensure compliancewith ERMC guidelines and procedures and escalates them to the ERMC as appropriate. At the same time, the IRMCprovides guidance to the business unit risk management teams to optimize risk-adjusted returns on capital. Acentralized risk rating unit and a specialized airline risk group provide risk assessment of our institutional obligors.
Exposure to the Airline Industry
We have multiple important cobrand, rewards, merchant acceptance and corporate payments arrangements withairlines. The ERM program evaluates the risks posed by our airline partners and the overall airline strategycompanywide through comprehensive business analysis of global airlines. Our largest airline partner is Delta, and thisrelationship includes exclusive cobrand credit card partnerships and other arrangements including MembershipRewards redemption, merchant acceptance, travel and corporate payments. See “Risk Factors.”
Sovereign Debt Exposure
As part of our ongoing risk management process, we monitor our financial exposure to both sovereign and non-sovereign customers and counterparties, and measure and manage concentrations of risk by geographic regions, aswell as by economic sectors and industries. A primary focus area for monitoring is credit deterioration due toweaknesses in economic and fiscal profiles. We evaluate countries based on the market assessment of the riskiness oftheir sovereign debt and our assessment of our economic and financial outlook and closely monitor those deemedhigh risk. As of December 31, 2015, we considered our gross credit exposures to government entities, financialinstitutions and corporations in those countries deemed high risk to be individually and collectively not material.
OPERATIONAL RISK MANAGEMENT PROCESS
We define operational risk as the risk of not achieving business objectives due to inadequate or failed processes,people, or information systems, or the external environment, including failures to comply with laws and regulations.Operational risk is inherent in all business activities and can impact an organization through direct or indirect financialloss, brand damage, customer dissatisfaction, or legal and regulatory penalties.
To appropriately measure and manage operational risk, we have implemented a comprehensive operational riskframework that is defined in the Operational Risk Management Policy approved by the Risk Committee. TheOperational Risk Management Committee (ORMC) coordinates with all control groups on effective risk assessmentsand controls and oversees the preventive, responsive and mitigation efforts by Lead Operational Risk Officers in thebusiness units and staff groups. To preserve independence, the Lead Operational Risk Officers for all business unitsreport to our Chief Operational Risk Officer, who in turn reports directly to our Chief Risk Officer.
We use the operational risk framework to identify, measure, monitor and report inherent and emergingoperational risks. This framework, supervised by the ORMC, consists of (a) operational risk event capture, (b) a projectoffice to coordinate issue management and control enhancements, (c) key risk indicators such as customercomplaints or pre-implementation test metrics, and (d) process and entity-level risk assessments.
The framework requires the assessment of operational risk events to determine root causes, impact to customersand/or us, and resolution plan accountability to correct any defect, remediate customers, and enhance controls andtesting to mitigate future issues. Our impact is assessed from an operational, financial, brand, regulatory complianceand legal perspective.
INFORMATION SECURITY, PRIVACY, AND DATA GOVERNANCE
We have implemented an Information Security Framework and Operating Model that is designed to protectinformation and information systems from unauthorized access, use, disclosure, disruption, modification ordestruction.
Chaired by the Chief Information Security Officer, our Information Security Risk Management Committee, a sub-committee of the ORMC, provides oversight and governance for our information security risk management program.In addition, the committee is responsible for establishing cyber risk tolerances and in managing cyber crisispreparedness. The Information Security Oversight team provides challenges and independent assessment of theinformation security program.
86
We assess our cyber risk across four categories of “threat actors” that we currently believe pose the greatest risk,namely cyber criminals, nation state sponsored groups, determined insiders and “hacktivists” or social objectors. OurInformation Security Framework and Operating Model uses an approach that looks at different phases of security toprepare, prevent, detect, respond and recover from cyber-security attacks.
Our Privacy Framework and Operating Model follow a similar structure. Co-chaired by the U.S. Chief PrivacyOfficer and the International Chief Privacy Officer, our Privacy Risk Management Committee, a sub-committee of theORMC, provides oversight and governance for our privacy program. The committee is responsible for the governanceover the collection, notice, use, sharing, transfer, confidentiality and retention of personal data.
Our Enterprise Data Governance Framework and Policy defines governance and data standards for data used inregulatory reporting, risk management as well as other critical systems including big data capabilities.
COMPLIANCE RISK MANAGEMENT PROCESS
We define compliance risk as the risk of legal or reputational harm, fines, monetary penalties and payment ofdamages or other forms of sanction as a result of non-compliance with applicable laws, regulations, rules or standardsof conduct.
We view our ability to effectively mitigate compliance risk as an important aspect of our business model. OurGlobal Compliance and Ethics organization is responsible for establishing and maintaining our corporate-wideCompliance Risk Management Program. Pursuant to this program, we seek to manage and mitigate compliance riskby assessing, controlling, monitoring, measuring and reporting the regulatory risks to which we are exposed.
We have a comprehensive Anti-Money Laundering program that monitors and reports suspicious activity to theappropriate government authorities. As part of that program, the Global Risk Oversight team provides independentrisk assessment of the models and rules used by the Anti-Money Laundering team. In addition, the Internal AuditGroup reviews the processes for practices consistent with regulatory guidance.
REPUTATIONAL RISK MANAGEMENT PROCESS
We define reputational risk as the risk that negative publicity regarding our products, services, business practices,management, clients and partners, whether perceived or real, could cause a decline in the customer base, costlylitigation, or revenue reductions.
We view protecting our reputation as core to our vision of becoming the world’s most respected service brand andfundamental to our long-term success.
Our business leaders are responsible for ensuring that reputational risk implications of transactions, businessactivities and management practices are appropriately considered and relevant subject matter experts are engaged asneeded. The ERMC and its sub-committees are responsible for reviewing decisions where reputational risk may existand ensuring that reputational risk considerations are properly reflected.
MARKET RISK MANAGEMENT PROCESS
Market risk is the risk to earnings or asset and liability values resulting from movements in market prices. Ourmarket risk exposures include:
• Interest rate risk due to changes in the relationship between interest rates on our assets (such as loans,receivables and investment securities) and our interest rates on our liabilities (such as debt and deposits); and
• Foreign exchange risk related to earnings, funding, transactions and investments in currencies other than theU.S. dollar.
Our Asset-Liability Management (ALM) and Market Risk policies establish the framework that guides and governsmarket risk management, including quantitative limits and escalation triggers. These policies are approved by the RiskCommittee of the Board of Directors.
Market risk is managed by the Market Risk Committee. The Market Risk Oversight Officer provides an independentrisk assessment and oversight over the policies and exposures for market risk and ALM activities, as well as ensuringcompliance with the Volcker Rule and other regulatory requirements. Market risk management is also guided andgoverned by policies covering the use of derivative financial instruments, funding, liquidity and investments.
87

Our interest rate exposure can vary over time as a result of, among other things, the proportion of our totalfunding provided by variable-and fixed-rate debt and deposits compared to our Card Member loans and receivables.Interest rate swaps are used from time to time to effectively convert debt issuances to (or from) variable-rate, from (orto) fixed-rate. We do not engage in derivative financial instruments for trading purposes. Refer to Note 14 to theConsolidated Financial Statements for further discussion of our derivative financial instruments.
We analyze a variety of interest rate scenarios to inform us of the potential impacts from interest rate changes onearnings and the value of assets, liabilities and the economic value of equity. As of December 31, 2015, the detrimentaleffect on our annual net interest income of a hypothetical, immediate 100 basis point increase in interest rates wouldbe approximately $216 million. To calculate this effect, the projected net interest income over a 12-month time horizonis measured, considering forecasted business growth and future interest rates. The change in projected net interestincome from a 100 basis point increase in rates is measured by increasing our forecast of future interest rates by 100basis points. The timing and loan balances associated with the sales of the HFS loan portfolios are key assumptions inprojecting business growth this year. The HFS loan portfolio sales, if and when completed, are expected to reduce ourexposure to rising interest rates, all else remaining constant.
We are also subject to market risk from changes in the relationship between the benchmark Prime rate thatdetermines the yield on our variable-rate lending receivables and the benchmark LIBOR rate that determines theeffective interest cost on a significant portion of our outstanding debt. Differences in the rate of change of these twoindices, commonly referred to as basis risk, would impact our variable-rate U.S. lending net interest margins becausewe borrow at rates based on LIBOR but lend to our customers based on the Prime rate. The detrimental effect on ournet interest income of a hypothetical 10 basis point decrease in the spread between Prime and one-month LIBOR overthe next 12 months is estimated to be $35 million. We currently have approximately $40 billion of Prime-based,variable-rate U.S. lending receivables and $35 billion of LIBOR-indexed debt, including asset securitizations. The HFSloan portfolios sales are expected to reduce our basis risk exposure, all else remaining constant.
Foreign exchange exposures arise in four principal ways: 1) Card Member spending in currencies that are not thebilling currency, 2) cross-currency transactions and balances from our funding activities, 3) cross-currency investingactivities, such as in the equity of foreign subsidiaries, and 4) revenues generated and expenses incurred in foreigncurrencies, which impact earnings.
These foreign exchange risks are managed primarily by entering into foreign exchange spot transactions orhedged with foreign exchange forward contracts when the hedge costs are economically justified and in notionalamounts designed to offset pre-tax impacts from currency movements in the period in which they occur. As ofDecember 31, 2015 and 2014, foreign currency derivative instruments with total notional amounts of approximately$26 billion and $30 billion were outstanding, respectively.
With respect to Card Member spending and cross-currency transactions, including related foreign exchangeforward contracts outstanding, a hypothetical 10 percent strengthening of the U.S. dollar would result in an immaterialimpact to projected earnings as of December 31, 2015. With respect to translation exposure of foreign subsidiaryequity balances, including related foreign exchange forward contracts outstanding, a hypothetical 10 percentstrengthening of the U.S. dollar would result in an immaterial reduction in other comprehensive income and equity asof December 31, 2015. With respect to earnings denominated in foreign currencies, the adverse impact on pretaxincome of a hypothetical 10 percent strengthening of the U.S. dollar related to anticipated overseas operating resultsfor the next 12 months would be approximately $179 million as of December 31, 2015.
The actual impact of interest rate and foreign exchange rate changes will depend on, among other factors, the timing ofrate changes, the extent to which different rates do not move in the same direction or in the same direction to the samedegree, changes in the cost, volume and mix of our hedging activities and changes in the volume and mix of our businesses.
FUNDING & LIQUIDITY RISK MANAGEMENT PROCESS
Liquidity risk is defined as our inability to meet our ongoing financial and business obligations as they become dueat a reasonable cost.
Our Board-approved Liquidity Risk Policy establishes the framework that guides and governs liquidity riskmanagement.
Liquidity risk is managed by the Funding and Liquidity Committee. In addition, the Market Risk Oversight Officerprovides independent oversight of liquidity risk management. We manage liquidity risk by maintaining access to adiverse set of cash, readily-marketable securities and contingent sources of liquidity, such that we can continuouslymeet our business requirements and expected future financing obligations for at least a 12-month period, even in theevent we are unable to raise new funds under our regular funding programs during a substantial weakening ineconomic conditions. We consider the trade-offs between maintaining too much liquidity, which can be costly and limitfinancial flexibility, and having inadequate liquidity, which may result in financial distress during a liquidity event.
88

Liquidity risk is managed at an aggregate consolidated level as well as at certain subsidiaries in order to ensurethat sufficient and accessible liquidity resources are maintained. The Funding and Liquidity Committee reviewsforecasts of our aggregate and subsidiary cash positions and financing requirements, approves funding plansdesigned to satisfy those requirements under normal and stressed conditions, establishes guidelines to identify theamount of liquidity resources required and monitors positions and determines any actions to be taken.
MODEL RISK MANAGEMENT PROCESS
We define model risk as the risk of adverse consequences, such as financial loss, poor business and strategicdecision making, or damage to our reputation, from decisions based on incorrect or misused model outputs andreports.
We manage model risk through a comprehensive model governance framework, including policies and proceduresfor model development, independent model validation and change management capabilities that seek to minimizeerroneous model methodology, outputs and misuse. We also assess model performance on an ongoing basis.
STRATEGIC AND BUSINESS RISK MANAGEMENT PROCESS
Strategic and business risk is the risk related to our inability to achieve our business objectives due to poorstrategic decisions, including decisions related to mergers, acquisitions, and divestitures, poor implementation ofstrategic decisions or declining demand for our products and services.
Strategic decisions are reviewed and approved by business leaders and various committees and must be alignedwith company policies. We seek to manage strategic and business risks through risk controls embedded in theseprocesses as well as overall risk management oversight over business goals. Existing product performance is reviewedperiodically by committees and business leaders. Mergers, acquisitions and divestitures can only be approvedfollowing Deal Committee due diligence, a comprehensive risk assessment by operational, market, credit andoversight leaders and approval by either the Chief Risk Officer or appropriate risk committees. All new products andmaterial changes in business processes are reviewed and approved by the New Products Committee and appropriatecredit or risk committees.
89
CRITICAL ACCOUNTING ESTIMATESRefer to Note 1 to the “Consolidated Financial Statements” for a summary of our significant accounting policies.
Certain of our accounting policies requiring significant management assumptions and judgments are as follows:
RESERVES FOR CARD MEMBER LOSSES
Reserves for Card Member losses represent our best estimate of the probable losses inherent in our outstandingportfolio of Card Member receivables and loans, as of the balance sheet date. As of December 31, 2015, this estimate doesnot reflect Card Member loans and receivables HFS. Refer to Note 2 to the “Consolidated Financial Statements” foradditional information.
In estimating these losses, we use statistical and analytical models that analyze portfolio performance and reflect ourjudgment regarding the quantitative components of the reserve. The models take into account several factors, includingdelinquency-based loss migration rates, loss emergence periods and average losses over an appropriate historical period,as well as expected future recoveries. We also consider whether to adjust the quantitative reserve for certain external andinternal qualitative factors that may increase or decrease the reserves for losses on Card Member receivables and loans.
The process of estimating these reserves requires a high degree of judgment. To the extent historical creditexperience, updated for any external and internal qualitative factors such as environmental trends, is not indicative offuture performance, actual losses could differ significantly from our judgments and expectations, resulting in either higheror lower future provisions for Card Member losses in any quarter.
As of December 31, 2015, a 10 percent increase in our estimate of losses inherent in the outstanding portfolio of CardMember receivables and loans evaluated collectively for impairment, would increase reserves for losses with acorresponding change to provisions for losses by approximately $149 million. This sensitivity analysis is provided as ahypothetical scenario to assess the sensitivity of the provisions for losses. It does not represent our expectations forlosses in the future, nor does it include how other portfolio factors such as delinquency-based loss migration rates orrecoveries, or the amount of outstanding balances, may impact the level of reserves for losses and the correspondingimpact on the provisions for losses.
LIABILITY FOR MEMBERSHIP REWARDS EXPENSE
The Membership Rewards program is our largest card-based rewards program. Card Members can earn points forpurchases charged on their enrolled card products. Certain types of purchases allow Card Members to also earn bonuspoints. Membership Rewards points are redeemable for a broad variety of rewards including travel, entertainment, retailcertificates and merchandise. Points typically do not expire, and there is no limit on the number of points a Card Membermay earn.
We record a Membership Rewards liability that represents the estimated cost of points earned that are expected to beredeemed by Card Members in the future. The Membership Rewards liability is impacted over time by enrollment levels,attrition, the volume of points earned and redeemed, and the associated redemption costs. We estimate the MembershipRewards liability by determining the URR and the WAC per point, which are applied to the points of current enrollees.
The URR assumption is used to estimate the number of points earned by current enrollees that will ultimately beredeemed in future periods. We use statistical and actuarial models to estimate the URR of points earned to date bycurrent Card Members based on redemption trends, card product type, enrollment tenure, card spend levels and creditattributes. The WAC per point assumption is used to estimate future redemption costs and is primarily based onredemption choices made by Card Members, reward offerings by partners, and Membership Rewards program changes.The WAC per point is derived from the previous 12 months of redemptions and is adjusted as appropriate for certainchanges in redemption costs that are not representative of future cost expectations.
We periodically evaluate our liability estimation process and assumptions based on developments in redemptionpatterns, cost per point redeemed, partner contract changes and other factors. The process of estimating theMembership Rewards liability includes a high degree of judgment. Actual redemptions and associated redemption costscould differ significantly from our judgment, resulting in either higher or lower Membership Rewards expense.
Changes in the Membership Rewards URR and WAC per point have the effect of either increasing or decreasing theliability through the current period marketing, promotion, rewards and Card Member services expense by an amountestimated to cover the cost of all points previously earned but not yet redeemed by current enrollees as of the end of thereporting period. As of December 31, 2015, an increase in the estimated URR of current enrollees of 100 basis pointswould increase the Membership Rewards liability and corresponding rewards expense by approximately $341 million.Similarly, an increase in the WAC per point of 1 basis point would increase the Membership Rewards liability andcorresponding rewards expense by approximately $85 million.
90

FAIR VALUE MEASUREMENT
We hold investment securities and derivative instruments that are carried at fair value on the Consolidated BalanceSheets. Management makes assumptions and judgments when estimating the fair values of these financial instruments.
In accordance with fair value measurement and disclosure guidance, the objective of a fair value measurement is todetermine the price that would be received to sell an asset or paid to transfer a liability in an orderly transaction betweenmarket participants at the measurement date based on the principal or, in the absence of a principal, most advantageousmarket for the specific asset or liability. The disclosure guidance establishes a three-level hierarchy of inputs to valuationtechniques used to measure fair value. The fair value hierarchy gives the highest priority to the measurement of fair valuebased on unadjusted quoted prices in active markets for identical assets or liabilities (Level 1), followed by the measurement offair value based on pricing models with significant observable inputs (Level 2), with the lowest priority given to themeasurement of fair value based on pricing models with significant unobservable inputs (Level 3). We did not have any Level 3financial instruments measured on a recurring basis during the year ended December 31, 2015.
Investment Securities
Our investment securities are mostly composed of fixed-income securities issued by states and municipalities, as well asthe U.S. Government and Agencies.
The fair market values for our investment securities, including investments comprising defined benefit pension planassets, are obtained primarily from pricing services we engage and for each security, we receive one price from that pricingservice. The fair values provided by the pricing services are estimated using pricing models, where the inputs to those modelsare based on observable market inputs or recent trades of similar securities. The pricing services did not apply anyadjustments to the pricing models used as of December 31, 2015 and 2014. In addition, we did not apply any adjustments toprices received from the pricing services. We reaffirm our understanding of the valuation techniques used by our pricingservices at least annually. In addition, we corroborate the prices provided by our pricing services for reasonableness bycomparing the prices from the respective pricing services to valuations obtained from different pricing sources as well ascomparing prices to the sale prices received from sold securities at least quarterly.
In the measurement of fair value for our investment securities, even though the underlying inputs used in the pricingmodels are directly observable from active markets or recent trades of similar securities in inactive markets, the pricingmodels do entail a certain amount of subjectivity, and therefore differing judgments in the underlying inputs, or how they aremodeled, could result in a different estimate of fair value.
Other-Than-Temporary Impairment of Investment Securities
Realized losses are recognized when management determines that a decline in the fair value of investment securities isother-than-temporary. Such determination requires judgment regarding the amount and timing of recovery. We review andevaluate our investment securities at least quarterly, and more often as market conditions may require, to identify investmentsecurities that have indications of other-than-temporary impairments. We consider several factors when evaluating debtsecurities for other-than-temporary impairment, including the determination of the extent to which a decline in the fair value ofa security is due to increased default risk for the specific issuer, or market interest rate risk. With respect to market interestrate risk, we assess whether we have the intent to sell the investment securities and whether we are more likely than not to berequired to sell the investment securities before recovery of any unrealized losses.
In determining whether any of our investment securities are other-than-temporarily impaired, a change in facts andcircumstances could lead to a change in management judgment about our view on collectability and credit quality of theissuer, or the impact of market interest rates on the investment securities. Any such changes could result in us recognizing another-than-temporary impairment loss through earnings.
Derivative Instruments
Our primary derivative instruments are interest rate swaps and foreign currency forward agreements.
The fair value of our derivative instruments is estimated by using either a third-party valuation service that uses proprietarypricing models, or by internal pricing models, where the inputs to those models are readily observable from actively quotedmarkets. We reaffirm our understanding of the valuation techniques used by a third-party valuation service at least annually.
To mitigate credit risk arising from our derivative instruments, counterparties are required to be pre-approved and ratedas investment grade. In addition, we manage certain counterparty credit risks by exchanging cash and non-cash collateralunder executed credit support agreements. The non-cash collateral does not reduce the derivative balance included in Otherassets on the Consolidated Balance Sheets, but effectively reduces risk exposure as it is available in the event of counterpartydefault. Based on the assessment of credit risk of our derivative counterparties, we do not have derivative positions thatwarrant credit valuation adjustments.
In the measurement of fair value for our derivative instruments, although the underlying inputs used in the pricing modelsare readily observable from actively quoted markets, the pricing models do entail a certain amount of subjectivity, and thereforediffering judgments in the underlying inputs, or how they are modeled, could result in a different estimate of fair value.
91

GOODWILL RECOVERABILITY
Goodwill represents the excess of acquisition cost of an acquired business over the fair value of assets acquiredand liabilities assumed. Goodwill is not amortized but is tested for impairment at the reporting unit level annually orwhen events or circumstances arise, such as adverse changes in the business climate, that would more likely than notreduce the fair value of the reporting unit below its carrying value. Our approach and methodology for conducting ourgoodwill impairment testing is fundamentally based on the measurement of fair value for our reporting units, whichinherently entails the use of significant judgment.
For valuation, we use a combination of the income approach (discounted cash flows) and market approach(market multiples) in estimating the fair value of our reporting units.
When preparing discounted cash flow models under the income approach, we estimate future cash flows usingthe reporting unit’s internal multi-year forecast, and a terminal value calculated using a growth rate that we believe isappropriate in light of current and expected future economic conditions. To discount these cash flows we use ourexpected cost of equity, determined using a capital asset pricing model. When using the market method under themarket approach, we apply comparable publicly traded companies’ multiples (e.g., earnings, revenues) to ourreporting units’ actual results. The judgment in estimating forecasted cash flows, discount rates and marketcomparables is significant, and imprecision could materially affect the fair value of our reporting units.
Refer to Note 2 of the “Consolidated Financial Statements” for additional information regarding the EG goodwillimpairment in 2015.
We could be exposed to an increased risk of further goodwill impairment if future operating results ormacroeconomic conditions differ significantly from management’s current assumptions.
INCOME TAXES
We are subject to the income tax laws of the United States, its states and municipalities and those of the foreignjurisdictions in which we operate. These tax laws are complex, and the manner in which they apply to the taxpayer’sfacts is sometimes open to interpretation. In establishing a provision for income tax expense, we must makejudgments about the application of inherently complex tax laws.
Unrecognized Tax Benefits
We establish a liability for unrecognized tax benefits, which are the differences between a tax position taken orexpected to be taken in a tax return and the benefit recognized in the financial statements.
In establishing a liability for an unrecognized tax benefit, assumptions may be made in determining whether, andthe extent to which, a tax position should be sustained. A tax position is recognized only when it is more likely than notto be sustained upon examination by the relevant taxing authority, based on its technical merits. The amount of taxbenefit recognized is the largest benefit that we believe is more likely than not to be realized on ultimate settlement. Asnew information becomes available, we evaluate our tax positions and adjust our unrecognized tax benefits, asappropriate.
Tax benefits ultimately realized can differ from amounts previously recognized due to uncertainties, with any suchdifferences generally impacting the provision for income tax.
Deferred Tax Asset Realization
Deferred tax assets and liabilities are determined based on the differences between the financial statement andtax bases of assets and liabilities using the enacted tax rates expected to be in effect for the years in which thedifferences are expected to reverse.
Since deferred taxes measure the future tax effects of items recognized in the Consolidated Financial Statements,certain estimates and assumptions are required to determine whether it is more likely than not that all or some portionof the benefit of a deferred tax asset will not be realized. In making this assessment, we analyze and estimate theimpact of future taxable income, reversing temporary differences and available tax planning strategies. Theseassessments are performed quarterly, taking into account any new information.
Changes in facts or circumstances can lead to changes in the ultimate realization of deferred tax assets due touncertainties.
92

OTHER MATTERS
RECENTLY ISSUED ACCOUNTING STANDARDS
Refer to the Recently Issued Accounting Standards section of Note 1 to the “Consolidated Financial Statements.”
GLOSSARY OF SELECTED TERMINOLOGY
Adjusted average loans — Represents average Card Member loans on a gross basis, including gross loans classified asheld for sale (i.e., not adjusted for any valuation allowance), and excluding the impact of certain non-traditional Card Memberloans and other fees.
Adjusted net interest income — Represents net interest income attributable to our Card Member loans and loans HFS,including interest that is deemed uncollectible; excludes the impact of interest expense and interest income not attributable toour Card Member loans.
Asset securitizations — Asset securitization involves the transfer and sale of receivables or loans to a special-purposeentity created for the securitization activity, typically a trust. The trust, in turn, issues securities, commonly referred to asasset-backed securities that are secured by the transferred receivables or loans. The trust uses the proceeds from the sale ofsuch securities to pay the purchase price for the underlying receivables or loans. The receivables and loans of our ChargeTrust and Lending Trust being securitized are reported as assets, and the securities issued by the Trusts are reported asliabilities on our Consolidated Balance Sheets.
Average discount rate — This calculation is generally designed to reflect pricing at merchants accepting general-purposeAmerican Express cards. It represents the percentage of billed business (generated from both proprietary and GNS CardMember spending) retained by us from merchants we acquire, or for merchants acquired by a third party on our behalf, net ofamounts retained by such third party.
Basic cards-in-force — Proprietary basic consumer cards-in-force includes basic cards issued to the primary accountowner, (i.e., not including additional supplemental cards issued on accounts). Proprietary basic small business and corporatecards-in-force includes both basic and supplemental cards issued. Non-proprietary basic cards-in-force includes cards thatare issued and outstanding under network partnership agreements, except for supplemental cards and retail cobrand CardMember accounts which have had no out-of-store spending activity during the prior 12-month period.
Billed business — Includes activities (including cash advances) related to proprietary cards, cards issued under networkpartnership agreements (non-proprietary billed business), corporate payment services and certain insurance fees charged onproprietary cards. In-store spending activity within retail cobrand portfolios in GNS, from which we earn no revenue, is notincluded in non-proprietary billed business. Card billed business is included in the United States or outside the United Statesbased on where the issuer is located.
Capital ratios — Represents the minimum standards established by the regulatory agencies as a measure to determinewhether the regulated entity has sufficient capital to absorb on- and off-balance sheet losses beyond current loss accrualestimates. Refer to the Capital Strategy section under “Consolidated Capital Resources and Liquidity” for further relateddefinitions under Transitional Basel III and Fully Phased-in Basel III.
Card Member — The individual holder of an issued American Express-branded charge, credit and certain prepaid cards.
Card Member loans — Represents the outstanding amount due from Card Members for charges made on their AmericanExpress credit cards, as well as any interest charges and card-related fees. Card Member loans also include revolving balanceson certain American Express charge card products.
Card Member loans and receivables HFS — Beginning as of December 1, 2015, represents Card Member loans andreceivables related to our cobrand partnerships with Costco in the United States and Jetblue.
Card Member receivables — Represents the outstanding amount due from Card Members for charges made on theirAmerican Express charge cards, as well as any card-related fees.
Charge cards — Represents cards that generally carry no pre-set spending limits and are primarily designed as a methodof payment and not as a means of financing purchases. Charge Card Members generally must pay the full amount billed eachmonth. No finance charges are assessed on charge cards. Each charge card transaction is authorized based on its likelyeconomics reflecting a Card Member’s most recent credit information and spend patterns. Some charge card accounts havean additional lending-on-charge feature that allows revolving certain balances.
Credit cards — Represents cards that have a range of revolving payment terms, grace periods, and rate and fee structures.
Discount revenue — Represents revenue earned from fees generally charged to merchants who have entered into a cardacceptance agreement. The discount fee generally is deducted from our payment for Card Member purchases. Discountrevenue is reduced by incentive payments made to merchants, payments to third-party card issuing partners, cash-backreward costs and statement credits, corporate incentive payments and other similar items.
93

Interest expense — Includes interest incurred primarily to fund Card Member receivables and loans, general corporate purposesand liquidity needs, and is recognized as incurred. Interest expense is divided principally into two categories: (i) deposits, whichprimarily relates to interest expense on deposits taken from customers and institutions, and (ii) debt, which primarily relates to interestexpense on our long-term financing and short-term borrowings, (e.g., commercial paper, federal funds purchased, bank overdrafts andother short-term borrowings), as well as the realized impact of derivatives hedging interest rate risk on our long-term debt.
Interest income — Includes (i) interest on loans, (ii) interest and dividends on investment securities and (iii) interest income ondeposits with banks and other.
Interest on loans — Assessed using the average daily balance method for Card Member loans and loans HFS. Unless the loan isclassified as non-accrual, interest is recognized based upon the principal amount outstanding in accordance with the terms of theapplicable account agreement until the outstanding balance is paid or written off.
Interest and dividends on investment securities — Primarily relates to our performing fixed-income securities. Interest income isrecognized as earned using the effective interest method, which adjusts the yield for security premiums and discounts, fees and otherpayments, so a constant rate of return is recognized on the outstanding balance of the related investment security throughout its term.Amounts are recognized until securities are in default or when it is likely that future interest payments will not be made as scheduled.
Interest income on deposits with banks and other — Recognized as earned, and primarily relates to the placement of cash in excessof near-term funding requirements in interest-bearing time deposits, overnight sweep accounts, and other interest-bearing demandand call accounts.
Liquidity Coverage Ratio — Represents the proposed minimum standards being established by the regulatory agencies as ameasure to determine whether the regulated entity has sufficient liquidity to meet liquidity needs in periods of financial and economicstress.
Merchant acquisition — Represents our process of entering into agreements with merchants to accept American Express-branded cards.
Net card fees — Represents the card membership fees earned during the period. These fees are recognized as revenue over thecovered card membership period (typically one year), net of the provision for projected refunds for Card Membership cancellation anddeferred acquisition costs.
Net interest yield on Card Member loans — Net interest yield on Card Member loans is computed by dividing adjusted net interestincome by adjusted average loans, computed on an annualized basis. The calculation of net interest yield on Card Member loansincludes interest that is deemed uncollectible. Reserves and net write-offs related to uncollectible interest are recorded throughprovisions for losses, which are not included in the net interest yield calculation.
Net loss ratio — Represents the ratio of GCS charge card write-offs, consisting of principal (resulting from authorized transactions)and fee components, less recoveries, on Card Member receivables expressed as a percentage of gross amounts billed to corporateCard Members.
Net write-off rate — principal only — Represents the amount of Card Member loans or USCS and ICS Card Member receivableswritten off, consisting of principal (resulting from authorized transactions), less recoveries, as a percentage of the average loan balanceor USCS and ICS average receivables balance during the period.
Net write-off rate — principal, interest and fees — Includes, in the calculation of the net write-off rate, amounts for interest and feesin addition to principal for Card Member loans, and fees in addition to principal for USCS and ICS Card Member receivables.
Operating expenses — Represents salaries and employee benefits, professional services, occupancy and equipment,communications and other expenses.
Return on average equity — Calculated by dividing one-year period net income by one-year average total shareholders’ equity.
Return on average segment capital — Calculated by dividing one-year period segment income by one-year average segmentcapital.
Return on average tangible segment capital — Computed in the same manner as the return on average segment capital, except thecomputation of average tangible segment capital excludes from average segment capital, average goodwill and other intangibles.
Segment capital — Represents the capital allocated to a segment based upon specific business operational needs, risk measures,and regulatory capital requirements.
Total cards-in-force — Represents the number of cards that are issued and outstanding. Non-proprietary cards-in-force includesall cards that are issued and outstanding under network partnership agreements, except for retail cobrand Card Member accountswhich have no out-of-store spending activity during the prior 12-month period.
Travel sales — Represents the total dollar amount of travel transaction volume for airline, hotel, car rental, and other travelarrangements made for consumers and small businesses. We earn revenue on these transactions by charging a transaction ormanagement fee.
94
CAUTIONARY NOTE REGARDING FORWARD-LOOKING STATEMENTS
This report includes forward-looking statements within the meaning of the Private Securities Litigation Reform Actof 1995, which are subject to risks and uncertainties. The forward-looking statements, which address our expectedbusiness and financial performance, among other matters, contain words such as “believe,” “expect,” “estimate,”“anticipate,” “intend,” “plan,” “aim,” “will,” “may,” “should,” “could,” “would,” “likely,” and similar expressions.Readers are cautioned not to place undue reliance on these forward-looking statements, which speak only as of thedate on which they are made. We undertake no obligation to update or revise any forward-looking statements. Factorsthat could cause actual results to differ materially from these forward-looking statements, include, but are not limitedto, the following:
• our ability to grow in the future, which will depend in part on the following: an acceleration of billed business andrevenue growth, which could be impacted by, among other things, weakening economic conditions in the U.S. orinternationally, a decline in consumer confidence impacting the willingness and ability of Card Members tosustain spending, a further decline in gas prices, a further strengthening of the U.S. dollar, a greater erosion ofthe average discount rate than expected and lower spending on new cards acquired than estimated; oursuccess in addressing competitive pressures and implementing strategies and business initiatives, includinggrowing profitable spending through proprietary, cobrand and network products, increasing penetration amongcorporate, middle market and small business clients, expanding our international footprint, growing loyaltycoalitions and increasing merchant acceptance; the timing and impact of any potential sale of the Costco U.S.Card Member loan portfolio; realizing incremental economics associated with the Costco U.S. contractextension, which could be impacted by, among other things, Card Member behavior, including the desire ofCostco U.S. Card Members to continue to use their Costco U.S. cobrand cards and the availability to those CardMembers of other payment forms; the impact of any potential restructuring charges or other contingencies,including, but not limited to, litigation-related expenses, impairments, the imposition of fines or civil moneypenalties, an increase in Card Member reimbursements and changes in reserves; credit performance remainingin line with current expectations; continued growth of Card Member loans held for investment; the ability tocontinue to realize benefits from restructuring actions and operating leverage at levels consistent with currentexpectations; the amount we spend on growth initiatives; changes in interest rates beyond currentexpectations; the impact of regulation and litigation, which could affect the profitability of our businessactivities, limit our ability to pursue business opportunities, require changes to business practices or alter ourrelationships with partners, merchants and Card Members; our tax rate remaining in line with currentexpectations, which could be impacted by, among other things, our geographic mix of income being weightedmore to higher tax jurisdictions than expected and unfavorable tax audits and other unanticipated tax items; theimpact of accounting changes and reclassifications; and our ability to continue executing the share repurchaseprogram;
• our ability to reduce our overall cost base by $1 billion by the end of 2017, which will depend in part on the timingand financial impact of future reengineering plans (including whether we will recognize restructuring charges infuture periods), which could be impacted by factors such as our inability to mitigate the operational and otherrisks posed by potential staff reductions, our inability to develop and implement technology resources to realizecost savings, underestimating hiring needs related to some of the job positions being eliminated and otheremployee needs not currently anticipated, lower than expected attrition rates and higher than expectedredeployment rates; our ability to reduce annual operating expenses, which could be impacted by, among otherthings, the factors identified below; and our ability to optimize and lower marketing and promotion expenses,which could be impacted by higher advertising and mailing costs, competitive pressures that may requireadditional expenditures or limit our ability to reduce costs, contractual obligations with business partners, theavailability of opportunities to invest at a higher level due to favorable business results and changes inmacroeconomic conditions;
• the ability to reduce annual operating expenses, which could be impacted by increases in significant categoriesof operating expenses, such as consulting or professional fees, including as a result of increased litigation,compliance or regulatory-related costs, technology costs or fraud costs; our ability to develop, implement andachieve substantial benefits from reengineering plans; higher than expected employee levels; the impact ofchanges in foreign currency exchange rates on costs; the payment of civil money penalties, disgorgement,restitution, non-income tax assessments and litigation-related settlements; impairments of goodwill or otherassets; management’s decision to increase or decrease spending in such areas as technology, business andproduct development and sales forces depending on overall business performance; greater than expectedinflation or merit increases; our ability to balance expense control and investments in the business; the impactof accounting changes and reclassifications; and the level of acquisition activity and related expenses;
• our lending write-off rates increasing more quickly than current expectations and provision expense beinghigher than current expectations, which will depend in part on changes in the level of loan balances, delinquencyrates of Card Members, unemployment rates, the volume of bankruptcies and recoveries of previously written-off loans;
95

• our ability to execute against our lending strategy and grow Card Member loans held for investment, includingby targeting new lending prospects and deepening relationships with current customers, which may be affectedby increasing competition, brand perceptions and reputation, our ability to manage risk in a growing CardMember loan portfolio, and the behavior of Card Members and their actual spending and borrowing patterns,which in turn may be driven by our ability to issue new and enhanced card products, offer attractive servicesand rewards programs, attract new Card Members, reduce Card Member attrition and capture a greater shareof existing Card Members’ spending and borrowing;
• uncertainties associated with the timing and impact of any potential sale of the Costco U.S. Card Member loanportfolio and the extension of the merchant acceptance agreement, such as the negotiation and execution ofdefinitive documentation, operational issues related to the transfer of Card Member loans and accounts, theparties’ ability to satisfy the closing conditions and the amount of any gain we recognize as a result of a sale,which could be impacted by the credit quality and performance of the portfolio, the amount of any volumedecline experienced by the cobrand portfolio and the timing of the potential sale as the gain will be determinedby the amount of the aggregate outstanding loans transferred at closing;
• the erosion of the average discount rate by a greater amount than anticipated during 2016 and beyond,including as a result of changes in the mix of spending by location and industry, merchant incentives andconcessions, volume-related pricing discounts, strategic investments, certain pricing initiatives, competition,pricing regulation (including regulation of competitors’ interchange rates) and other factors;
• the possibility that we will not fully execute on our plans for OptBlue to significantly increase merchantcoverage, which will depend in part on the success of OptBlue merchant acquirers in signing merchants toaccept American Express, which could be impacted by the pricing set by the merchant acquirers, the valueproposition offered to small merchants and the efforts of OptBlue merchant acquirers to sign merchants forAmerican Express acceptance, as well as the willingness of Card Members to use American Express cards atsmall merchants and of those merchants to accept American Express cards;
• uncertainty relating to the ultimate outcome of the antitrust lawsuit filed against us by the U.S. Department ofJustice and certain state attorneys general, including the success or failure of our appeal and the impact onexisting private merchant cases and potentially additional litigation and/or arbitrations;
• changes affecting our ability or desire to return capital to shareholders through dividends and sharerepurchases, including the opportunity for incremental capital returns related to the Costco U.S. portfolio sale,which will depend on factors such as approval of our capital plans by our primary regulators, the amount wespend on acquisitions and results of operations and capital needs in any given period;
• our funding plan for the full year 2016 being implemented in a manner inconsistent with current expectations,which will depend on various factors such as future business growth, the impact of global economic, politicaland other events on market capacity, demand for securities we offer, regulatory changes, ability to securitizeand sell receivables and the performance of receivables previously sold in securitization transactions;
• our ability to drive growth by developing and marketing value propositions that appeal to Card Members andnew customers and by offering attractive services and rewards programs, which will depend in part on ongoinginvestment in product innovation, marketing and promotion and acquisition efforts, including through digitalchannels; our ability to update our systems and platforms to support new products, services and benefits;competition; and brand perceptions and reputation;
• changes in global economic and business conditions, including consumer and business spending, theavailability and cost of credit, unemployment and political conditions, all of which may significantly affectspending on American Express cards, delinquency rates, loan balances and other aspects of our business andresults of operations;
• changes in capital and credit market conditions, including sovereign creditworthiness, which may significantlyaffect our ability to meet our liquidity needs, expectations regarding capital and liquidity ratios, access to capitaland cost of capital, including changes in interest rates; changes in market conditions affecting the valuation ofour assets; or any reduction in our credit ratings or those of our subsidiaries, which could materially increase thecost and other terms of our funding, restrict our access to the capital markets or result in contingent paymentsunder contracts;
96

• legal and regulatory developments wherever we do business, including legislative and regulatory changes in theUnited States, such as the actions of the CFPB and Dodd-Frank’s stricter regulation of large, interconnectedfinancial institutions, which could make fundamental changes to many of our business practices or materiallyaffect our capital or liquidity requirements, results of operations, or ability to pay dividends or repurchase ourstock; actions and potential future actions by the FDIC and credit rating agencies applicable to securitizationtrusts, which could impact our ABS program; or potential changes to the taxation of our businesses, theallowance of deductions for significant expenses, or the incidence of consumption taxes on our transactions,products and services;
• changes in the substantial and increasing worldwide competition in the payments industry, includingcompetitive pressure that may impact the prices we charge merchants that accept our cards, competition forcobrand partnerships and the success of marketing, promotion or rewards programs;
• changes in the financial condition and creditworthiness of our business partners, such as bankruptcies,restructurings or consolidations, involving merchants that represent a significant portion of our business, suchas the airline industry, or our partners in GNS or financial institutions that we rely on for routine funding andliquidity, which could materially affect our financial condition or results of operations;
• our ability to maintain and expand our presence in the digital payments space, including online and mobilechannels, which will depend on our success in evolving our business models and processes for the digitalenvironment, building partnerships and executing programs with companies, and utilizing digital capabilitiesthat can be leveraged for future growth; and
• factors beyond our control such as foreign currency rates, fire, power loss, disruptions in telecommunications,severe weather conditions, natural disasters, health pandemics, terrorism, cyber attacks or fraud, which couldsignificantly affect spending on American Express cards, delinquency rates, loan balances and travel-relatedspending or disrupt our global network systems and ability to process transactions.
A further description of these uncertainties and other risks can be found in “Risk Factors” above and our otherreports filed with the Securities and Exchange Commission.
97

ITEM 7A. QUANTITATIVE AND QUALITATIVE DISCLOSURES ABOUT MARKET RISK
Refer to “Risk Management” under MD&A.
ITEM 8. FINANCIAL STATEMENTS AND SUPPLEMENTARY DATA
MANAGEMENT’S REPORT ON INTERNAL CONTROL OVER FINANCIAL REPORTING
Our management is responsible for establishing and maintaining adequate internal control over financialreporting.
Our internal control over financial reporting is a process designed to provide reasonable assurance regarding thereliability of financial reporting and the preparation of financial statements for external purposes in accordance withaccounting principles generally accepted in the United States of America (GAAP), and includes those policies andprocedures that:
• Pertain to the maintenance of records that, in reasonable detail, accurately and fairly reflect our transactionsand dispositions of assets;
• Provide reasonable assurance that transactions are recorded as necessary to permit preparation of financialstatements in accordance with GAAP, and that our receipts and expenditures are being made only inaccordance with authorizations of our management and directors; and
• Provide reasonable assurance regarding prevention or timely detection of unauthorized acquisition, use ordisposition of our assets that could have a material effect on the financial statements.
Because of its inherent limitations, internal control over financial reporting may not prevent or detectmisstatements. Also, projections of any evaluation of effectiveness to future periods are subject to the risk thatcontrols may become inadequate because of changes in conditions, or that the degree of compliance with the policiesor procedures may deteriorate.
Our management assessed the effectiveness of our internal control over financial reporting as of December 31,2015. In making this assessment, our management used the criteria set forth by the Committee of SponsoringOrganizations of the Treadway Commission (COSO) in Internal Control — Integrated Framework (2013).
Based on management’s assessment and those criteria, we conclude that, as of December 31, 2015, our internalcontrol over financial reporting is effective.
PricewaterhouseCoopers LLP, our independent registered public accounting firm, has issued an attestation reportappearing on the following page on the effectiveness of our internal control over financial reporting as of December 31,2015.
98

PricewaterhouseCoopers LLPREPORT OF INDEPENDENT REGISTERED PUBLIC ACCOUNTING FIRM
TO THE BOARD OF DIRECTORS AND SHAREHOLDERS OF AMERICAN EXPRESS COMPANY:
In our opinion, the accompanying consolidated balance sheets and the related consolidated statements ofincome, comprehensive income, cash flows and shareholders’ equity present fairly, in all material respects, thefinancial position of American Express Company and its subsidiaries at December 31, 2015 and 2014, and the resultsof their operations and their cash flows for each of the three years in the period ended December 31, 2015, inconformity with accounting principles generally accepted in the United States of America. Also in our opinion, theCompany maintained, in all material respects, effective internal control over financial reporting as of December 31,2015, based on criteria established in Internal Control — Integrated Framework (2013) issued by the Committee ofSponsoring Organizations of the Treadway Commission (COSO). The Company’s management is responsible forthese financial statements, for maintaining effective internal control over financial reporting and for its assessment ofthe effectiveness of internal control over financial reporting, included in the accompanying Management’s Report onInternal Control over Financial Reporting. Our responsibility is to express opinions on these financial statements andon the Company’s internal control over financial reporting based on our integrated audits. We conducted our audits inaccordance with the standards of the Public Company Accounting Oversight Board (United States). Those standardsrequire that we plan and perform the audits to obtain reasonable assurance about whether the financial statementsare free of material misstatement and whether effective internal control over financial reporting was maintained in allmaterial respects. Our audits of the financial statements included examining, on a test basis, evidence supporting theamounts and disclosures in the financial statements, assessing the accounting principles used and significantestimates made by management, and evaluating the overall financial statement presentation. Our audit of internalcontrol over financial reporting included obtaining an understanding of internal control over financial reporting,assessing the risk that a material weakness exists, and testing and evaluating the design and operating effectivenessof internal control based on the assessed risk. Our audits also included performing such other procedures as weconsidered necessary in the circumstances. We believe that our audits provide a reasonable basis for our opinions.
A company’s internal control over financial reporting is a process designed to provide reasonable assuranceregarding the reliability of financial reporting and the preparation of financial statements for external purposes inaccordance with generally accepted accounting principles. A company’s internal control over financial reportingincludes those policies and procedures that (i) pertain to the maintenance of records that, in reasonable detail,accurately and fairly reflect the transactions and dispositions of the assets of the company; (ii) provide reasonableassurance that transactions are recorded as necessary to permit preparation of financial statements in accordancewith generally accepted accounting principles, and that receipts and expenditures of the company are being made onlyin accordance with authorizations of management and directors of the company; and (iii) provide reasonableassurance regarding prevention or timely detection of unauthorized acquisition, use, or disposition of the company’sassets that could have a material effect on the financial statements.
Because of its inherent limitations, internal control over financial reporting may not prevent or detectmisstatements. Also, projections of any evaluation of effectiveness to future periods are subject to the risk thatcontrols may become inadequate because of changes in conditions, or that the degree of compliance with the policiesor procedures may deteriorate.
New York, New York
February 19, 2016
99

INDEX TO CONSOLIDATED FINANCIAL STATEMENTS
PAGE
CONSOLIDATED FINANCIAL STATEMENTSConsolidated Statements of Income — For the Years Ended December 31, 2015, 2014 and 2013 . . . . . . . . . . . . . . 101Consolidated Statements of Comprehensive Income — For the Years Ended December 31, 2015,
2014 and 2013 . . . . . . . . . . . . . . . . . . . . . . . . . . . . . . . . . . . . . . . . . . . . . . . . . . . . . . . . . . . . . . . . . . . . . . . . . . . . . . . . . . 102Consolidated Balance Sheets — December 31, 2015 and 2014 . . . . . . . . . . . . . . . . . . . . . . . . . . . . . . . . . . . . . . . . . . . 103Consolidated Statements of Cash Flows — For the Years Ended December 31, 2015, 2014 and 2013 . . . . . . . . . . . 104Consolidated Statements of Shareholders’ Equity — For the Years Ended December 31, 2015, 2014 and 2013 . . 105
NOTES TO CONSOLIDATED FINANCIAL STATEMENTSNote 1 — Summary of Significant Accounting Policies . . . . . . . . . . . . . . . . . . . . . . . . . . . . . . . . . . . . . . . . . . . . . . . . . 106Note 2 — Business Events . . . . . . . . . . . . . . . . . . . . . . . . . . . . . . . . . . . . . . . . . . . . . . . . . . . . . . . . . . . . . . . . . . . . . . . . . 110Note 3 — Accounts Receivable and Loans . . . . . . . . . . . . . . . . . . . . . . . . . . . . . . . . . . . . . . . . . . . . . . . . . . . . . . . . . . . . 111Note 4 — Reserves for Losses . . . . . . . . . . . . . . . . . . . . . . . . . . . . . . . . . . . . . . . . . . . . . . . . . . . . . . . . . . . . . . . . . . . . . . 118Note 5 — Investment Securities . . . . . . . . . . . . . . . . . . . . . . . . . . . . . . . . . . . . . . . . . . . . . . . . . . . . . . . . . . . . . . . . . . . . 120Note 6 — Asset Securitizations . . . . . . . . . . . . . . . . . . . . . . . . . . . . . . . . . . . . . . . . . . . . . . . . . . . . . . . . . . . . . . . . . . . . . 122Note 7 — Other Assets . . . . . . . . . . . . . . . . . . . . . . . . . . . . . . . . . . . . . . . . . . . . . . . . . . . . . . . . . . . . . . . . . . . . . . . . . . . . 123Note 8 — Customer Deposits . . . . . . . . . . . . . . . . . . . . . . . . . . . . . . . . . . . . . . . . . . . . . . . . . . . . . . . . . . . . . . . . . . . . . . 125Note 9 — Debt . . . . . . . . . . . . . . . . . . . . . . . . . . . . . . . . . . . . . . . . . . . . . . . . . . . . . . . . . . . . . . . . . . . . . . . . . . . . . . . . . . . 126Note 10 — Other Liabilities . . . . . . . . . . . . . . . . . . . . . . . . . . . . . . . . . . . . . . . . . . . . . . . . . . . . . . . . . . . . . . . . . . . . . . . . . . 129Note 11 — Stock Plans . . . . . . . . . . . . . . . . . . . . . . . . . . . . . . . . . . . . . . . . . . . . . . . . . . . . . . . . . . . . . . . . . . . . . . . . . . . . . 130Note 12 — Retirement Plans . . . . . . . . . . . . . . . . . . . . . . . . . . . . . . . . . . . . . . . . . . . . . . . . . . . . . . . . . . . . . . . . . . . . . . . . 132Note 13 — Commitments and Contingencies . . . . . . . . . . . . . . . . . . . . . . . . . . . . . . . . . . . . . . . . . . . . . . . . . . . . . . . . . . 132Note 14 — Derivatives and Hedging Activities . . . . . . . . . . . . . . . . . . . . . . . . . . . . . . . . . . . . . . . . . . . . . . . . . . . . . . . . . 134Note 15 — Fair Values . . . . . . . . . . . . . . . . . . . . . . . . . . . . . . . . . . . . . . . . . . . . . . . . . . . . . . . . . . . . . . . . . . . . . . . . . . . . . . 138Note 16 — Guarantees . . . . . . . . . . . . . . . . . . . . . . . . . . . . . . . . . . . . . . . . . . . . . . . . . . . . . . . . . . . . . . . . . . . . . . . . . . . . . 142Note 17 — Common and Preferred Shares . . . . . . . . . . . . . . . . . . . . . . . . . . . . . . . . . . . . . . . . . . . . . . . . . . . . . . . . . . . . 143Note 18 — Changes in Accumulated Other Comprehensive (Loss) Income . . . . . . . . . . . . . . . . . . . . . . . . . . . . . . . . . 144Note 19 — Non-Interest Revenue and Expense Detail . . . . . . . . . . . . . . . . . . . . . . . . . . . . . . . . . . . . . . . . . . . . . . . . . . . 145
Includes further details of:• Other Commissions and Fees• Other Revenues• Other Expenses
Note 20 — Restructuring . . . . . . . . . . . . . . . . . . . . . . . . . . . . . . . . . . . . . . . . . . . . . . . . . . . . . . . . . . . . . . . . . . . . . . . . . . . 146Note 21 — Income Taxes . . . . . . . . . . . . . . . . . . . . . . . . . . . . . . . . . . . . . . . . . . . . . . . . . . . . . . . . . . . . . . . . . . . . . . . . . . . 148Note 22 — Earnings Per Common Share . . . . . . . . . . . . . . . . . . . . . . . . . . . . . . . . . . . . . . . . . . . . . . . . . . . . . . . . . . . . . . 151Note 23 — Regulatory Matters and Capital Adequacy . . . . . . . . . . . . . . . . . . . . . . . . . . . . . . . . . . . . . . . . . . . . . . . . . . . 151Note 24 — Significant Credit Concentrations . . . . . . . . . . . . . . . . . . . . . . . . . . . . . . . . . . . . . . . . . . . . . . . . . . . . . . . . . . 153Note 25 — Reportable Operating Segments and Geographic Operations . . . . . . . . . . . . . . . . . . . . . . . . . . . . . . . . . . 154Note 26 — Parent Company . . . . . . . . . . . . . . . . . . . . . . . . . . . . . . . . . . . . . . . . . . . . . . . . . . . . . . . . . . . . . . . . . . . . . . . . 157Note 27 — Quarterly Financial Data (Unaudited) . . . . . . . . . . . . . . . . . . . . . . . . . . . . . . . . . . . . . . . . . . . . . . . . . . . . . . . 159
100

CONSOLIDATED STATEMENTS OF INCOME
Years Ended December 31 (Millions, except per share amounts) 2015 2014 2013
RevenuesNon-interest revenues
Discount revenue . . . . . . . . . . . . . . . . . . . . . . . . . . . . . . . . . . . . . . . . . . . . . . . . . . . . . . . . . $ 19,297 $19,389 $ 18,591Net card fees . . . . . . . . . . . . . . . . . . . . . . . . . . . . . . . . . . . . . . . . . . . . . . . . . . . . . . . . . . . . . 2,700 2,712 2,631Travel commissions and fees . . . . . . . . . . . . . . . . . . . . . . . . . . . . . . . . . . . . . . . . . . . . . . . 349 1,118 1,913Other commissions and fees . . . . . . . . . . . . . . . . . . . . . . . . . . . . . . . . . . . . . . . . . . . . . . . . 2,517 2,508 2,414Other . . . . . . . . . . . . . . . . . . . . . . . . . . . . . . . . . . . . . . . . . . . . . . . . . . . . . . . . . . . . . . . . . . . . 2,033 2,989 2,274
Total non-interest revenues . . . . . . . . . . . . . . . . . . . . . . . . . . . . . . . . . . . . . . . . . . . . . . . 26,896 28,716 27,823
Interest incomeInterest on loans . . . . . . . . . . . . . . . . . . . . . . . . . . . . . . . . . . . . . . . . . . . . . . . . . . . . . . . . . . 7,309 6,929 6,718Interest and dividends on investment securities . . . . . . . . . . . . . . . . . . . . . . . . . . . . . . . 157 179 201Deposits with banks and other . . . . . . . . . . . . . . . . . . . . . . . . . . . . . . . . . . . . . . . . . . . . . . 79 71 86
Total interest income . . . . . . . . . . . . . . . . . . . . . . . . . . . . . . . . . . . . . . . . . . . . . . . . . . . . 7,545 7,179 7,005
Interest expenseDeposits . . . . . . . . . . . . . . . . . . . . . . . . . . . . . . . . . . . . . . . . . . . . . . . . . . . . . . . . . . . . . . . . . 475 373 442Long-term debt and other . . . . . . . . . . . . . . . . . . . . . . . . . . . . . . . . . . . . . . . . . . . . . . . . . . 1,148 1,334 1,516
Total interest expense . . . . . . . . . . . . . . . . . . . . . . . . . . . . . . . . . . . . . . . . . . . . . . . . . . . 1,623 1,707 1,958
Net interest income . . . . . . . . . . . . . . . . . . . . . . . . . . . . . . . . . . . . . . . . . . . . . . . . . . . . . 5,922 5,472 5,047
Total revenues net of interest expense . . . . . . . . . . . . . . . . . . . . . . . . . . . . . . . . . . . . . . . . . 32,818 34,188 32,870
Provisions for lossesCharge card . . . . . . . . . . . . . . . . . . . . . . . . . . . . . . . . . . . . . . . . . . . . . . . . . . . . . . . . . . . . . . 737 792 648Card Member loans . . . . . . . . . . . . . . . . . . . . . . . . . . . . . . . . . . . . . . . . . . . . . . . . . . . . . . . 1,190 1,138 1,115Other . . . . . . . . . . . . . . . . . . . . . . . . . . . . . . . . . . . . . . . . . . . . . . . . . . . . . . . . . . . . . . . . . . . . 61 114 69
Total provisions for losses . . . . . . . . . . . . . . . . . . . . . . . . . . . . . . . . . . . . . . . . . . . . . . . . 1,988 2,044 1,832
Total revenues net of interest expense after provisions for losses . . . . . . . . . . . . . . . . . . 30,830 32,144 31,038
ExpensesMarketing and promotion . . . . . . . . . . . . . . . . . . . . . . . . . . . . . . . . . . . . . . . . . . . . . . . . . . 3,109 3,216 2,939Card Member rewards . . . . . . . . . . . . . . . . . . . . . . . . . . . . . . . . . . . . . . . . . . . . . . . . . . . . . 6,996 6,931 6,457Card Member services and other . . . . . . . . . . . . . . . . . . . . . . . . . . . . . . . . . . . . . . . . . . . . 1,018 822 767Salaries and employee benefits . . . . . . . . . . . . . . . . . . . . . . . . . . . . . . . . . . . . . . . . . . . . . 4,976 6,095 6,191Other, net . . . . . . . . . . . . . . . . . . . . . . . . . . . . . . . . . . . . . . . . . . . . . . . . . . . . . . . . . . . . . . . . 6,793 6,089 6,796
Total expenses . . . . . . . . . . . . . . . . . . . . . . . . . . . . . . . . . . . . . . . . . . . . . . . . . . . . . . . . . . 22,892 23,153 23,150
Pretax income . . . . . . . . . . . . . . . . . . . . . . . . . . . . . . . . . . . . . . . . . . . . . . . . . . . . . . . . . . . . . . 7,938 8,991 7,888Income tax provision . . . . . . . . . . . . . . . . . . . . . . . . . . . . . . . . . . . . . . . . . . . . . . . . . . . . . . . . 2,775 3,106 2,529
Net income . . . . . . . . . . . . . . . . . . . . . . . . . . . . . . . . . . . . . . . . . . . . . . . . . . . . . . . . . . . . . . . . . $ 5,163 $ 5,885 $ 5,359
Earnings per Common Share — (Note 22) (a)
Basic . . . . . . . . . . . . . . . . . . . . . . . . . . . . . . . . . . . . . . . . . . . . . . . . . . . . . . . . . . . . . . . . . . . . $ 5.07 $ 5.58 $ 4.91Diluted . . . . . . . . . . . . . . . . . . . . . . . . . . . . . . . . . . . . . . . . . . . . . . . . . . . . . . . . . . . . . . . . . . 5.05 5.56 4.88
Average common shares outstanding for earnings per common share:Basic . . . . . . . . . . . . . . . . . . . . . . . . . . . . . . . . . . . . . . . . . . . . . . . . . . . . . . . . . . . . . . . . . . . . 999 1,045 1,082Diluted . . . . . . . . . . . . . . . . . . . . . . . . . . . . . . . . . . . . . . . . . . . . . . . . . . . . . . . . . . . . . . . . . . 1,003 1,051 1,089
(a) Represents net income less (i) earnings allocated to participating share awards of $38 million, $46 million and $47 million for the years endedDecember 31, 2015, 2014 and 2013, respectively, and (ii) dividends on preferred shares of $62 million for the year ended December 31, 2015,and nil for the years ended December 31, 2014 and 2013.
See Notes to Consolidated Financial Statements.
101

CONSOLIDATED STATEMENTS OF COMPREHENSIVE INCOME
Years Ended December 31 (Millions) 2015 2014 2013
Net income . . . . . . . . . . . . . . . . . . . . . . . . . . . . . . . . . . . . . . . . . . . . . . . . . . . . . . . . . . . . . . . . . . . . $ 5,163 $5,885 $5,359Other comprehensive loss:
Net unrealized securities (losses) gains, net of tax . . . . . . . . . . . . . . . . . . . . . . . . . . . . . . . . (38) 33 (252)Foreign currency translation adjustments, net of tax . . . . . . . . . . . . . . . . . . . . . . . . . . . . . . (545) (409) (336)Net unrealized pension and other postretirement benefit (losses) gains, net of tax . . . . . (32) (117) 89
Other comprehensive loss . . . . . . . . . . . . . . . . . . . . . . . . . . . . . . . . . . . . . . . . . . . . . . . . . . . . . . . (615) (493) (499)
Comprehensive income . . . . . . . . . . . . . . . . . . . . . . . . . . . . . . . . . . . . . . . . . . . . . . . . . . . . . . . . . $4,548 $5,392 $4,860
See Notes to Consolidated Financial Statements.
102

CONSOLIDATED BALANCE SHEETS
December 31 (Millions, except share data) 2015 2014
AssetsCash and cash equivalents
Cash and due from banks . . . . . . . . . . . . . . . . . . . . . . . . . . . . . . . . . . . . . . . . . . . . . . . . . . . . . . . . . . . . . . . . . . . . . . $ 2,935 $ 2,628Interest-bearing deposits in other banks (includes securities purchased under resale agreements: 2015,
$41; 2014, $204) . . . . . . . . . . . . . . . . . . . . . . . . . . . . . . . . . . . . . . . . . . . . . . . . . . . . . . . . . . . . . . . . . . . . . . . . . . . . 19,569 19,190Short-term investment securities . . . . . . . . . . . . . . . . . . . . . . . . . . . . . . . . . . . . . . . . . . . . . . . . . . . . . . . . . . . . . . . . 258 470
Total cash and cash equivalents . . . . . . . . . . . . . . . . . . . . . . . . . . . . . . . . . . . . . . . . . . . . . . . . . . . . . . . . . . . . . . . 22,762 22,288Card Member loans and receivables held for sale (includes gross loans and receivables available to settle
obligations of consolidated variable interest entities: 2015, $4,966) . . . . . . . . . . . . . . . . . . . . . . . . . . . . . . . . . . 14,992 —Accounts receivable
Card Member receivables (includes gross receivables available to settle obligations of a consolidatedvariable interest entity: 2015, $6,649; 2014, $7,025), less reserves: 2015, $462; 2014, $465 . . . . . . . . . . 43,671 44,386
Other receivables, less reserves: 2015, $43; 2014, $61 . . . . . . . . . . . . . . . . . . . . . . . . . . . . . . . . . . . . . . . . . . . . . 3,024 2,614Loans
Card Member loans (includes gross loans available to settle obligations of a consolidated variable interestentity: 2015, $23,559; 2014, $30,115), less reserves: 2015, $1,028; 2014, $1,201 . . . . . . . . . . . . . . . . . . . . . 57,545 69,184
Other loans, less reserves: 2015, $20; 2014, $12 . . . . . . . . . . . . . . . . . . . . . . . . . . . . . . . . . . . . . . . . . . . . . . . . . . . 1,254 920Investment securities . . . . . . . . . . . . . . . . . . . . . . . . . . . . . . . . . . . . . . . . . . . . . . . . . . . . . . . . . . . . . . . . . . . . . . . . . . . . 3,759 4,431Premises and equipment, less accumulated depreciation and amortization: 2015, $6,801; 2014, $6,270 . . . . 4,108 3,938Other assets (includes restricted cash of consolidated variable interest entities: 2015, $155; 2014, $64) . . . . 10,069 11,342
Total assets . . . . . . . . . . . . . . . . . . . . . . . . . . . . . . . . . . . . . . . . . . . . . . . . . . . . . . . . . . . . . . . . . . . . . . . . . . . . . . . . . . . . . . $161,184 $ 159,103
Liabilities and Shareholders’ EquityLiabilities
Customer deposits . . . . . . . . . . . . . . . . . . . . . . . . . . . . . . . . . . . . . . . . . . . . . . . . . . . . . . . . . . . . . . . . . . . . . . . . . . . . . . $ 54,997 $ 44,171Travelers Cheques and other prepaid products . . . . . . . . . . . . . . . . . . . . . . . . . . . . . . . . . . . . . . . . . . . . . . . . . . . . . . 3,247 3,673Accounts payable . . . . . . . . . . . . . . . . . . . . . . . . . . . . . . . . . . . . . . . . . . . . . . . . . . . . . . . . . . . . . . . . . . . . . . . . . . . . . . . 11,822 11,300Short-term borrowings (includes debt issued by a consolidated variable interest entity: 2015, $100; 2014,
nil) . . . . . . . . . . . . . . . . . . . . . . . . . . . . . . . . . . . . . . . . . . . . . . . . . . . . . . . . . . . . . . . . . . . . . . . . . . . . . . . . . . . . . . . . . . . 4,812 3,480Long-term debt (includes debt issued by consolidated variable interest entities: 2015, $13,602; 2014, $19,516) . . . 48,061 57,955Other liabilities . . . . . . . . . . . . . . . . . . . . . . . . . . . . . . . . . . . . . . . . . . . . . . . . . . . . . . . . . . . . . . . . . . . . . . . . . . . . . . . . . . 17,572 17,851
Total liabilities . . . . . . . . . . . . . . . . . . . . . . . . . . . . . . . . . . . . . . . . . . . . . . . . . . . . . . . . . . . . . . . . . . . . . . . . . . . . . . . . $140,511 $138,430
Commitments and Contingencies (Note 13)Shareholders’ Equity
Preferred shares, $1.662/3 par value, authorized 20 million shares; issued and outstanding 1,600 shares asof December 31, 2015 and 750 shares as of December 31, 2014 (Note 17) . . . . . . . . . . . . . . . . . . . . . . . . . . . . . — —
Common shares, $0.20 par value, authorized 3.6 billion shares; issued and outstanding 969 million sharesas of December 31, 2015 and 1,023 million shares as of December 31, 2014 . . . . . . . . . . . . . . . . . . . . . . . . . . . 194 205
Additional paid-in capital . . . . . . . . . . . . . . . . . . . . . . . . . . . . . . . . . . . . . . . . . . . . . . . . . . . . . . . . . . . . . . . . . . . . . . . . . 13,348 12,874Retained earnings . . . . . . . . . . . . . . . . . . . . . . . . . . . . . . . . . . . . . . . . . . . . . . . . . . . . . . . . . . . . . . . . . . . . . . . . . . . . . . . 9,665 9,513Accumulated other comprehensive loss
Net unrealized securities gains, net of tax of: 2015, $32; 2014, $52 . . . . . . . . . . . . . . . . . . . . . . . . . . . . . . . . . . . 58 96Foreign currency translation adjustments, net of tax of: 2015, $(100); 2014, $(317) . . . . . . . . . . . . . . . . . . . . (2,044) (1,499)Net unrealized pension and other postretirement benefit losses, net of tax of: 2015, $(223); 2014, $(223) . . . (548) (516)
Total accumulated other comprehensive loss . . . . . . . . . . . . . . . . . . . . . . . . . . . . . . . . . . . . . . . . . . . . . . . . . . . . . . . (2,534) (1,919)
Total shareholders’ equity . . . . . . . . . . . . . . . . . . . . . . . . . . . . . . . . . . . . . . . . . . . . . . . . . . . . . . . . . . . . . . . . . . . . . . 20,673 20,673
Total liabilities and shareholders’ equity . . . . . . . . . . . . . . . . . . . . . . . . . . . . . . . . . . . . . . . . . . . . . . . . . . . . . . . . . . . . . . $161,184 $ 159,103
See Notes to Consolidated Financial Statements.
103
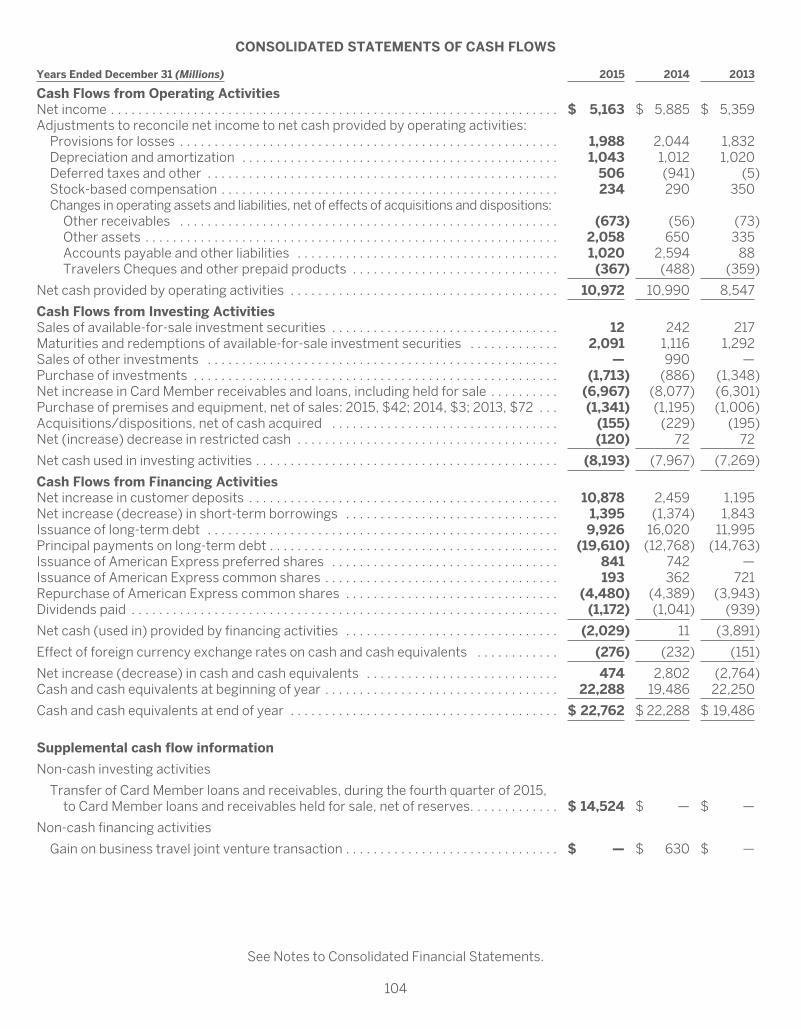
CONSOLIDATED STATEMENTS OF CASH FLOWS
Years Ended December 31 (Millions) 2015 2014 2013
Cash Flows from Operating ActivitiesNet income . . . . . . . . . . . . . . . . . . . . . . . . . . . . . . . . . . . . . . . . . . . . . . . . . . . . . . . . . . . . . . . . . $ 5,163 $ 5,885 $ 5,359Adjustments to reconcile net income to net cash provided by operating activities:
Provisions for losses . . . . . . . . . . . . . . . . . . . . . . . . . . . . . . . . . . . . . . . . . . . . . . . . . . . . . . . 1,988 2,044 1,832Depreciation and amortization . . . . . . . . . . . . . . . . . . . . . . . . . . . . . . . . . . . . . . . . . . . . . . 1,043 1,012 1,020Deferred taxes and other . . . . . . . . . . . . . . . . . . . . . . . . . . . . . . . . . . . . . . . . . . . . . . . . . . . 506 (941) (5)Stock-based compensation . . . . . . . . . . . . . . . . . . . . . . . . . . . . . . . . . . . . . . . . . . . . . . . . . 234 290 350Changes in operating assets and liabilities, net of effects of acquisitions and dispositions:
Other receivables . . . . . . . . . . . . . . . . . . . . . . . . . . . . . . . . . . . . . . . . . . . . . . . . . . . . . . . (673) (56) (73)Other assets . . . . . . . . . . . . . . . . . . . . . . . . . . . . . . . . . . . . . . . . . . . . . . . . . . . . . . . . . . . . 2,058 650 335Accounts payable and other liabilities . . . . . . . . . . . . . . . . . . . . . . . . . . . . . . . . . . . . . . 1,020 2,594 88Travelers Cheques and other prepaid products . . . . . . . . . . . . . . . . . . . . . . . . . . . . . . (367) (488) (359)
Net cash provided by operating activities . . . . . . . . . . . . . . . . . . . . . . . . . . . . . . . . . . . . . . . 10,972 10,990 8,547
Cash Flows from Investing ActivitiesSales of available-for-sale investment securities . . . . . . . . . . . . . . . . . . . . . . . . . . . . . . . . . 12 242 217Maturities and redemptions of available-for-sale investment securities . . . . . . . . . . . . . 2,091 1,116 1,292Sales of other investments . . . . . . . . . . . . . . . . . . . . . . . . . . . . . . . . . . . . . . . . . . . . . . . . . . . — 990 —Purchase of investments . . . . . . . . . . . . . . . . . . . . . . . . . . . . . . . . . . . . . . . . . . . . . . . . . . . . . (1,713) (886) (1,348)Net increase in Card Member receivables and loans, including held for sale . . . . . . . . . . (6,967) (8,077) (6,301)Purchase of premises and equipment, net of sales: 2015, $42; 2014, $3; 2013, $72 . . . (1,341) (1,195) (1,006)Acquisitions/dispositions, net of cash acquired . . . . . . . . . . . . . . . . . . . . . . . . . . . . . . . . . (155) (229) (195)Net (increase) decrease in restricted cash . . . . . . . . . . . . . . . . . . . . . . . . . . . . . . . . . . . . . . (120) 72 72
Net cash used in investing activities . . . . . . . . . . . . . . . . . . . . . . . . . . . . . . . . . . . . . . . . . . . . (8,193) (7,967) (7,269)
Cash Flows from Financing ActivitiesNet increase in customer deposits . . . . . . . . . . . . . . . . . . . . . . . . . . . . . . . . . . . . . . . . . . . . . 10,878 2,459 1,195Net increase (decrease) in short-term borrowings . . . . . . . . . . . . . . . . . . . . . . . . . . . . . . . 1,395 (1,374) 1,843Issuance of long-term debt . . . . . . . . . . . . . . . . . . . . . . . . . . . . . . . . . . . . . . . . . . . . . . . . . . . 9,926 16,020 11,995Principal payments on long-term debt . . . . . . . . . . . . . . . . . . . . . . . . . . . . . . . . . . . . . . . . . . (19,610) (12,768) (14,763)Issuance of American Express preferred shares . . . . . . . . . . . . . . . . . . . . . . . . . . . . . . . . . 841 742 —Issuance of American Express common shares . . . . . . . . . . . . . . . . . . . . . . . . . . . . . . . . . . 193 362 721Repurchase of American Express common shares . . . . . . . . . . . . . . . . . . . . . . . . . . . . . . . (4,480) (4,389) (3,943)Dividends paid . . . . . . . . . . . . . . . . . . . . . . . . . . . . . . . . . . . . . . . . . . . . . . . . . . . . . . . . . . . . . . (1,172) (1,041) (939)
Net cash (used in) provided by financing activities . . . . . . . . . . . . . . . . . . . . . . . . . . . . . . . (2,029) 11 (3,891)
Effect of foreign currency exchange rates on cash and cash equivalents . . . . . . . . . . . . (276) (232) (151)
Net increase (decrease) in cash and cash equivalents . . . . . . . . . . . . . . . . . . . . . . . . . . . . 474 2,802 (2,764)Cash and cash equivalents at beginning of year . . . . . . . . . . . . . . . . . . . . . . . . . . . . . . . . . . 22,288 19,486 22,250
Cash and cash equivalents at end of year . . . . . . . . . . . . . . . . . . . . . . . . . . . . . . . . . . . . . . . $ 22,762 $ 22,288 $ 19,486
Supplemental cash flow information
Non-cash investing activities
Transfer of Card Member loans and receivables, during the fourth quarter of 2015,to Card Member loans and receivables held for sale, net of reserves. . . . . . . . . . . . . $ 14,524 $ — $ —
Non-cash financing activities
Gain on business travel joint venture transaction . . . . . . . . . . . . . . . . . . . . . . . . . . . . . . . $ — $ 630 $ —
See Notes to Consolidated Financial Statements.
104
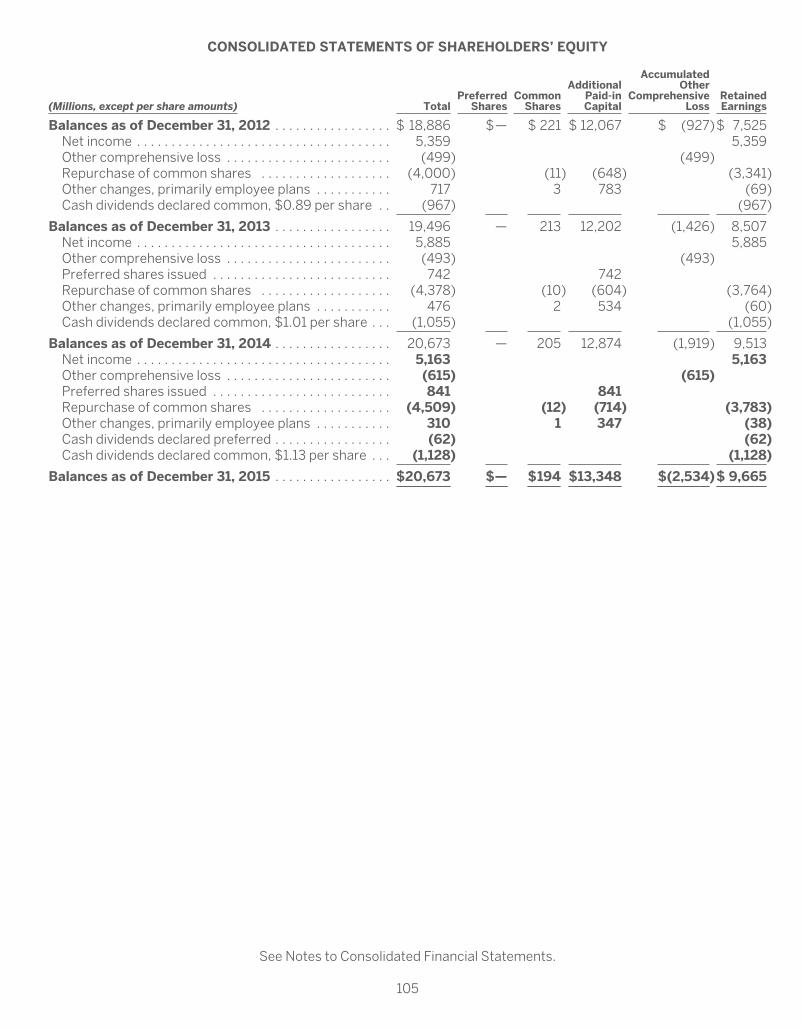
CONSOLIDATED STATEMENTS OF SHAREHOLDERS’ EQUITY
(Millions, except per share amounts) TotalPreferred
SharesCommon
Shares
AdditionalPaid-inCapital
AccumulatedOther
ComprehensiveLoss
RetainedEarnings
Balances as of December 31, 2012 . . . . . . . . . . . . . . . . . $ 18,886 $— $ 221 $ 12,067 $ (927)$ 7,525Net income . . . . . . . . . . . . . . . . . . . . . . . . . . . . . . . . . . . . . 5,359 5,359Other comprehensive loss . . . . . . . . . . . . . . . . . . . . . . . . (499) (499)Repurchase of common shares . . . . . . . . . . . . . . . . . . . (4,000) (11) (648) (3,341)Other changes, primarily employee plans . . . . . . . . . . . 717 3 783 (69)Cash dividends declared common, $0.89 per share . . (967) (967)
Balances as of December 31, 2013 . . . . . . . . . . . . . . . . . 19,496 — 213 12,202 (1,426) 8,507Net income . . . . . . . . . . . . . . . . . . . . . . . . . . . . . . . . . . . . . 5,885 5,885Other comprehensive loss . . . . . . . . . . . . . . . . . . . . . . . . (493) (493)Preferred shares issued . . . . . . . . . . . . . . . . . . . . . . . . . . 742 742Repurchase of common shares . . . . . . . . . . . . . . . . . . . (4,378) (10) (604) (3,764)Other changes, primarily employee plans . . . . . . . . . . . 476 2 534 (60)Cash dividends declared common, $1.01 per share . . . (1,055) (1,055)
Balances as of December 31, 2014 . . . . . . . . . . . . . . . . . 20,673 — 205 12,874 (1,919) 9,513Net income . . . . . . . . . . . . . . . . . . . . . . . . . . . . . . . . . . . . . 5,163 5,163Other comprehensive loss . . . . . . . . . . . . . . . . . . . . . . . . (615) (615)Preferred shares issued . . . . . . . . . . . . . . . . . . . . . . . . . . 841 841Repurchase of common shares . . . . . . . . . . . . . . . . . . . (4,509) (12) (714) (3,783)Other changes, primarily employee plans . . . . . . . . . . . 310 1 347 (38)Cash dividends declared preferred . . . . . . . . . . . . . . . . . (62) (62)Cash dividends declared common, $1.13 per share . . . (1,128) (1,128)
Balances as of December 31, 2015 . . . . . . . . . . . . . . . . . $20,673 $— $194 $13,348 $(2,534)$ 9,665
See Notes to Consolidated Financial Statements.
105

NOTES TO CONSOLIDATED FINANCIAL STATEMENTS
NOTE 1
SUMMARY OF SIGNIFICANT ACCOUNTING POLICIES
THE COMPANY
American Express Company (the Company) is a global services company that provides customers with access toproducts, insights and experiences that enrich lives and build business success. The Company’s principal productsand services are charge and credit payment card products and travel-related services offered to consumers andbusinesses around the world. Business travel-related services are offered through the non-consolidated joint venture,American Express Global Business Travel (GBT JV). Prior to July 1, 2014, these business travel operations were whollyowned. The Company’s various products and services are sold globally to diverse customer groups, includingconsumers, small businesses, mid-sized companies and large corporations. These products and services are soldthrough various channels, including direct mail, online applications, in-house and third-party sales forces and directresponse advertising.
PRINCIPLES OF CONSOLIDATION
The Consolidated Financial Statements of the Company are prepared in conformity with accounting principlesgenerally accepted in the United States of America (GAAP). Significant intercompany transactions are eliminated.
The Company consolidates entities in which it holds a “controlling financial interest.” For voting interest entities,the Company is considered to hold a controlling financial interest when it is able to exercise control over the investees’operating and financial decisions. For variable interest entities (VIEs), the Company is considered to hold a controllingfinancial interest when it is determined to be the primary beneficiary. A primary beneficiary is the party that has both:(1) the power to direct the activities that most significantly impact that entity’s economic performance, and (2) theobligation to absorb losses of, or the right to receive benefits from, the VIE that could potentially be significant to theVIE. The determination of whether an entity is a VIE is based on the amount and characteristics of the entity’s equity.
Entities in which the Company’s voting interest in common equity does not provide it with control, but allows theCompany to exert significant influence over the operating and financial decisions, are accounted for under the equitymethod. All other investments in equity securities, to the extent they are not considered marketable securities, areaccounted for under the cost method.
FOREIGN CURRENCY
Assets and liabilities denominated in foreign currencies are translated into U.S. dollars based upon exchange ratesprevailing at the end of the reporting period. The resulting translation adjustments, along with any related qualifyinghedge and tax effects, are included in accumulated other comprehensive income (loss) (AOCI), a component ofshareholders’ equity. Translation adjustments, including qualifying hedge and tax effects, are reclassified to earningsupon the sale or substantial liquidation of investments in foreign operations. Revenues and expenses are translated atthe average month-end exchange rates during the year. Gains and losses related to transactions in a currency otherthan the functional currency are reported net in the Company’s Consolidated Statements of Income, in other non-interest revenue, interest income, interest expense, or other expenses, depending on the nature of the activity. Netforeign currency transaction gains amounted to approximately $68 million, $44 million and $108 million in 2015, 2014and 2013, respectively.
AMOUNTS BASED ON ESTIMATES AND ASSUMPTIONS
Accounting estimates are an integral part of the Consolidated Financial Statements. These estimates are based, inpart, on management’s assumptions concerning future events. Among the more significant assumptions are thosethat relate to reserves for Card Member losses on loans and receivables, the proprietary point liability for MembershipRewards costs, fair value measurement, goodwill and income taxes. These accounting estimates reflect the bestjudgment of management, but actual results could differ.
106
INCOME STATEMENT
Discount Revenue
Discount revenue represents the amount earned by the Company on transactions occurring at merchants withwhich the Company, or a Global Network Services (GNS) partner, has entered into a card acceptance agreement forfacilitating transactions between the merchants and the Company’s Card Members. The discount fee generally isdeducted from the payment to the merchant and recorded as discount revenue at the time the charge is captured.
Net Card Fees
Card fees, net of deferred acquisition costs and a reserve for projected refunds for Card Member cancellation, aredeferred and recognized on a straight-line basis over the 12-month card membership period as Net Card Fees in theConsolidated Statements of Income. The unamortized net card fee balance is reported in Other Liabilities on theConsolidated Balance Sheets (refer to Note 10).
Travel Commissions and Fees
The Company earns travel commissions and fees by charging clients transaction or management fees for selling andarranging travel. Client transaction fee revenue is recognized at the time the client books the travel arrangements. TheCompany’s travel suppliers (e.g., airlines, hotels and car rental companies) pay commissions and fees on tickets issued,sales and other services based on contractual agreements. Commissions and fees from travel suppliers are generallyrecognized at the time a ticket is purchased or over the term of the contract, if not transaction specific. Commissionsand fees that are based on services rendered (e.g., hotel stays and car rentals) are recognized based on usage.
Other Commissions and Fees
Other commissions and fees include foreign currency conversion fees, Card Member delinquency fees, service feesand other card-related assessments, which are recognized primarily in the period in which they are charged to the CardMember (refer to Note 19). In addition, service fees are also earned from other customers (e.g., merchants) for a varietyof services and are recognized when the service is performed, which is generally in the period the fee is charged. Alsoincluded are fees related to the Company’s Membership Rewards program, which are deferred and recognized over theperiod covered by the fee, generally one year. The unamortized Membership Rewards fee balance is included in OtherLiabilities on the Consolidated Balance Sheets (Refer to Note 10).
Contra-revenue
The Company regularly makes payments through contractual arrangements with merchants, corporate paymentsclients, Card Members and certain other customers. These payments, including cash rebates and statement creditsprovided to Card Members, are generally classified as contra-revenue unless a specifically identifiable benefit (e.g.,goods or services) is received by the Company or its Card Members in consideration for that payment, and the fair valueof such benefit is determinable and measurable. If no such benefit is identified, then the entire payment is classified ascontra-revenue and included in the Consolidated Statements of Income in the revenue line item where the relatedtransactions are recorded (e.g., Discount revenue, Travel commissions and fees, and Other commissions and fees). Ifsuch a benefit is identified, then the payment is classified as expense up to the estimated fair value of the benefit.
Interest Income
Interest on Card Member loans is assessed using the average daily balance method. Unless the loan is classified asnon-accrual, interest is recognized based upon the principal amount outstanding, in accordance with the terms of theapplicable account agreement, until the outstanding balance is paid or written off.
Interest and dividends on investment securities primarily relate to the Company’s performing fixed-incomesecurities. Interest income is recognized as earned using the effective interest method, which adjusts the yield forsecurity premiums and discounts, fees and other payments, so that a constant rate of return is recognized on theinvestment security’s outstanding balance. Amounts are recognized until securities are in default or when it is likely thatfuture interest payments will not be made as scheduled.
Interest on deposits with banks and other is recognized as earned, and primarily relates to the placement of cash, inexcess of near-term funding requirements, in interest-bearing time deposits, overnight sweep accounts, and otherinterest-bearing demand and call accounts.
107

Interest Expense
Interest expense includes interest incurred primarily to fund Card Member receivables and loans, general corporatepurposes and liquidity needs, and is recognized as incurred. Interest expense is divided principally into two categories:(i) deposits, which primarily relates to interest expense on deposits taken from customers and institutions, and (ii) debt,which primarily relates to interest expense on the Company’s long-term financing and short-term borrowings, as well asthe realized impact of derivatives hedging interest rate risk on the Company’s long-term debt.
Expenses
Marketing and promotion expense includes advertising costs, which are expensed in the year in which theadvertising first takes place.
BALANCE SHEET
Cash and Cash Equivalents
Cash and cash equivalents include cash and amounts due from banks, interest-bearing bank balances, includingsecurities purchased under resale agreements, and other highly liquid investments with original maturities of 90 daysor less.
Goodwill
Goodwill represents the excess of acquisition cost of an acquired business over the fair value of assets acquired andliabilities assumed. The Company allocates goodwill to its reporting units for the purpose of impairment testing. Areporting unit is defined as an operating segment, or a business that is one level below an operating segment for whichdiscrete financial information is regularly reviewed by the operating segment manager.
The Company evaluates goodwill for impairment annually as of June 30, or more frequently if events occur orcircumstances change that would more likely than not reduce the fair value of one or more of the Company’s reportingunits below its carrying value. The Company performs an impairment evaluation of goodwill using a two-step process.The first step identifies whether there is a potential impairment by comparing the fair value of a reporting unit to thecarrying amount, including goodwill. If the carrying amount of a reporting unit exceeds the fair value, the second step ofthe impairment test is performed to determine the implied fair value of goodwill. An impairment loss is recognized basedon the amount that the carrying amount of goodwill exceeds the implied fair value. Prior to completing the interimassessment of goodwill for impairment under the second step, the Company performs a recoverability test of certainlong-lived assets by assessing the recoverability of the asset values based on the cash flows generated by the relevantassets or asset groups. If the assets are not recoverable, an impairment loss is recognized based on the amount that thecarrying value of the asset or asset group exceeds its fair value. See further details in Other Intangible Assets herein.
Goodwill impairment testing involves management judgment, requiring an assessment of whether the carrying valueof the reporting unit can be supported by its fair value using widely accepted valuation techniques. The Company uses acombination of the income approach (discounted cash flows) and market approach (market multiples).
When preparing discounted cash flow models under the income approach, the Company uses internal forecasts toestimate future cash flows expected to be generated by the reporting units. To discount these cash flows, the Companyuses the expected cost of equity, determined by using a capital asset pricing model. The Company believes the discountrates used appropriately reflect the risks and uncertainties in the financial markets generally and specifically in theCompany’s internally developed forecasts. When using market multiples under the market approach, the Companyapplies comparable publicly traded companies’ multiples (e.g., earnings, revenues) to its reporting units’ actual results.
Other Intangible Assets
Intangible assets, primarily customer relationships, are amortized over their estimated useful lives of 1 to 22 yearson a straight-line basis. The Company reviews long-lived assets and asset groups, including intangible assets, forimpairment whenever events and circumstances indicate their carrying amounts may not be recoverable. An impairmentis recognized if the carrying amount is not recoverable and exceeds the asset or asset group’s fair value.
Certain long-lived assets, such as capitalized software development costs, are included in Premises and equipment.The Company reviews these assets for impairment using the same impairment methodology used for intangible assets.
108

Premises and Equipment
Premises and equipment, including leasehold improvements, are carried at cost less accumulated depreciation.Costs incurred during construction are capitalized and are depreciated once an asset is placed in service. Depreciationis generally computed using the straight-line method over the estimated useful lives of the assets, which range from 3to 10 years for equipment, furniture and building improvements. Premises are depreciated based upon their estimateduseful life at the acquisition date, which generally ranges from 40 to 50 years.
Leasehold improvements are depreciated using the straight-line method over the lesser of the remaining term ofthe leased facility or the economic life of the improvement, which ranges from 5 to 10 years. The Company maintainsoperating leases worldwide for facilities and equipment. Rent expense for facility leases is recognized ratably over thelease term, and includes adjustments for rent concessions, rent escalations and leasehold improvement allowances.The Company recognizes lease restoration obligations at the fair value of the restoration liabilities when incurred, andamortizes the restoration assets over the lease term.
Certain costs associated with the acquisition or development of internal-use software are also recorded inPremises and equipment. Once the software is ready for its intended use, these costs are amortized on a straight-linebasis over the software’s estimated useful life, generally 5 years.
OTHER SIGNIFICANT ACCOUNTING POLICIES
The following table identifies the Company’s other significant accounting policies, the Note and page where theNote can be found.
Significant Accounting PolicyNote
Number Note Title Page
Accounts Receivable . . . . . . . . . . . . . . . . . . . . . . . . . . . . . . . . . Note 3 Accounts Receivable and Loans . . . . . . . . . . . . . . . . . . . . . . Page 111Loans . . . . . . . . . . . . . . . . . . . . . . . . . . . . . . . . . . . . . . . . . . . . . . Note 3 Accounts Receivable and Loans . . . . . . . . . . . . . . . . . . . . . . Page 111Reserves for Losses . . . . . . . . . . . . . . . . . . . . . . . . . . . . . . . . . . Note 4 Reserves for Losses . . . . . . . . . . . . . . . . . . . . . . . . . . . . . . . . Page 118Investment Securities . . . . . . . . . . . . . . . . . . . . . . . . . . . . . . . . Note 5 Investment Securities . . . . . . . . . . . . . . . . . . . . . . . . . . . . . . . Page 120Asset Securitizations . . . . . . . . . . . . . . . . . . . . . . . . . . . . . . . . . Note 6 Asset Securitizations . . . . . . . . . . . . . . . . . . . . . . . . . . . . . . . Page 122Membership Rewards . . . . . . . . . . . . . . . . . . . . . . . . . . . . . . . . Note 10 Other Liabilities . . . . . . . . . . . . . . . . . . . . . . . . . . . . . . . . . . . . Page 129Stock-based Compensation . . . . . . . . . . . . . . . . . . . . . . . . . . . Note 11 Stock Plans . . . . . . . . . . . . . . . . . . . . . . . . . . . . . . . . . . . . . . . . Page 130Retirement Plans . . . . . . . . . . . . . . . . . . . . . . . . . . . . . . . . . . . . Note 12 Retirement Plans . . . . . . . . . . . . . . . . . . . . . . . . . . . . . . . . . . . Page 132Legal Contingencies . . . . . . . . . . . . . . . . . . . . . . . . . . . . . . . . . . Note 13 Commitments and Contingencies . . . . . . . . . . . . . . . . . . . . Page 132Derivative Financial Instruments and Hedging Activities . . . Note 14 Derivatives and Hedging Activities . . . . . . . . . . . . . . . . . . . . Page 134Fair Value Measurements . . . . . . . . . . . . . . . . . . . . . . . . . . . . . Note 15 Fair Values . . . . . . . . . . . . . . . . . . . . . . . . . . . . . . . . . . . . . . . . Page 138Income Taxes . . . . . . . . . . . . . . . . . . . . . . . . . . . . . . . . . . . . . . . Note 21 Income Taxes . . . . . . . . . . . . . . . . . . . . . . . . . . . . . . . . . . . . . . Page 148Regulatory Matters and Capital Adequacy . . . . . . . . . . . . . . . Note 23 Regulatory Matters and Capital Adequacy . . . . . . . . . . . . . Page 151Reportable Operating Segments . . . . . . . . . . . . . . . . . . . . . . . Note 25 Reportable Operating Segments and Geographic
Operations . . . . . . . . . . . . . . . . . . . . . . . . . . . . . . . . . . . . . . Page 154
RECENTLY ISSUED ACCOUNTING STANDARDS
In May 2014, the Financial Accounting Standards Board (FASB) issued new accounting guidance on revenuerecognition. The guidance establishes the principles to apply to determine the amount and timing of revenuerecognition, specifying the accounting for certain costs related to revenue, and requiring additional disclosures aboutthe nature, amount, timing and uncertainty of revenues and related cash flows. The guidance, as amended,supersedes most of the current revenue recognition requirements, and is effective January 1, 2018, with early adoptionas of January 1, 2017, permitted. The Company does not intend to adopt the new standard early and continues toevaluate the impact this guidance, including the method of implementation, will have on its financial position, results ofoperations and cash flows, among other items.
In January 2016, the FASB issued new accounting guidance on the recognition and measurement of financialassets and financial liabilities. The standard, which is effective January 1, 2018, makes targeted changes to currentGAAP, specifically to the classification and measurement of equity securities, and to certain disclosure requirementsassociated with the fair value of financial instruments. The Company is currently evaluating the impact this guidancewill have on its financial position, results of operations and cash flows, among other items.
109

CLASSIFICATION OF VARIOUS ITEMS
In the first quarter of 2015, the Company changed the classification related to certain payments to partners,reducing both discount revenue and marketing and promotion expense. Prior period amounts have been reclassifiedto conform to the current period presentation. None of the prior period financial statements were materially misstatedfrom these misclassifications. Certain other insignificant reclassifications of prior period amounts have been made toconform to the current period presentation.
NOTE 2
BUSINESS EVENTS
GLOBAL BUSINESS TRAVEL TRANSACTION
On June 30, 2014, the Company completed a transaction to establish a non-consolidated joint venture comprisingthe former Global Business Travel (GBT) operations of the Company and an external cash investment. As a result ofthis transaction, the Company deconsolidated the GBT net assets, effective June 30, 2014, and began accounting forthe GBT JV as an equity method investment reported in Other assets within the Consolidated Balance Sheets. Prior tothe deconsolidation, the carrying amount of GBT’s assets and liabilities were not material to the Company’s financialposition and its operations were reported within the Global Commercial Services (GCS) segment.
LOANS AND RECEIVABLES HELD FOR SALE
During the fourth quarter of 2015, it was determined the Company would sell the Card Member loans andreceivables related to its cobrand partnerships with Costco Wholesale Corporation (Costco) in the United States andJetBlue Airways Corporation (JetBlue) (the HFS portfolios). The sale of the JetBlue portfolio is subject to customaryclosing conditions, and is expected to be consummated in the first quarter of 2016. The sale of the Costco portfolio issubject to the outcome of ongoing discussions, and is expected to be consummated around mid-year 2016. The gainson the sales of the two portfolios will be recognized upon consummation of the sales.
As a result of the determination, the HFS portfolios are presented as held for sale (HFS) on the ConsolidatedBalance Sheets within Card Member loans and receivables HFS. The HFS portfolios were transferred at the netcarrying amount, inclusive of the related reserves for losses of $0.2 billion, which approximates the lower of cost or fairvalue in the aggregate, and which will also be the measurement basis applied until consummation of the sales. CardMember loans and receivables HFS at December 31, 2015, totaled $15.0 billion, of which $13.9 billion relates to theCostco portfolio and $1.1 billion relates to the JetBlue portfolio. Changes in the valuation of the HFS portfolios arerecognized in Other expenses beginning on December 1, 2015. The Company will continue to recognize discountrevenue, interest income, and other revenues and expenses related to the portfolios in the respective incomestatement line items while the portfolios are HFS.
GOODWILL AND TECHNOLOGY IMPAIRMENT
As discussed in Note 1, the Company evaluates goodwill for impairment annually, or more frequently if eventsoccur or circumstances change that would more likely than not reduce the fair value of one or more of the Company’sreporting units below its carrying value. Based on its annual assessment, the Company determined that goodwill wasnot impaired. During the fourth quarter of 2015, the Company announced changes to its management organizationalstructure under which reconsideration of the Company’s Prepaid Services business (a reporting unit within EnterpriseGrowth (EG), which is included in Corporate and Other), occurred. As a result, the Company determined that sufficientindicators of potential impairment of goodwill existed and performed an impairment evaluation. In performing the two-step impairment evaluation, it was determined the carrying value of the Prepaid Services business’ goodwill exceededits implied fair value and the Company recognized an impairment loss. The fair value of the Prepaid Services businessasset group was measured based on an income approach (discounted cash flow valuation methodology), with theassistance of a third-party valuation firm. Prior to completing the assessment of goodwill for impairment, theCompany performed a recoverability test of certain long-lived assets in the Prepaid Services business and determinedthat certain long-lived assets, primarily technology assets, were not recoverable. As a result, during the fourth quarterof 2015, the Company recorded a $384 million impairment charge, comprising a $219 million write-down of the entirebalance of goodwill in the Prepaid Services business and a $165 million write-down of technology and other assets tofair value. These charges are reported in Other expenses.
110
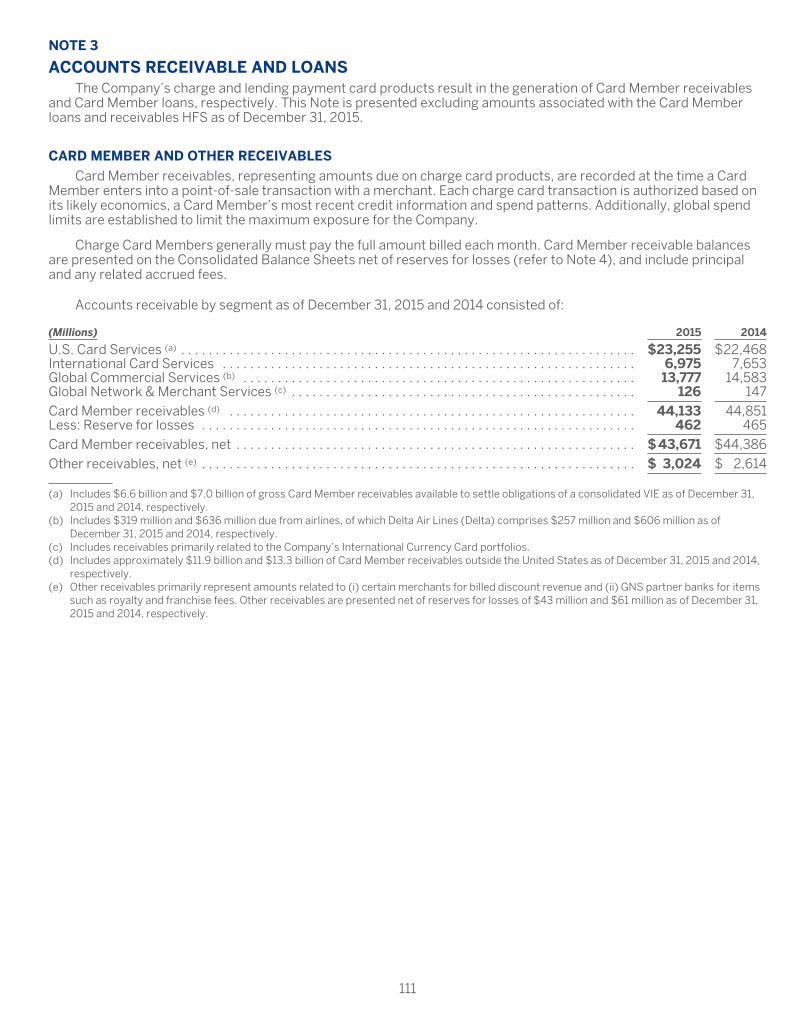
NOTE 3
ACCOUNTS RECEIVABLE AND LOANSThe Company’s charge and lending payment card products result in the generation of Card Member receivables
and Card Member loans, respectively. This Note is presented excluding amounts associated with the Card Memberloans and receivables HFS as of December 31, 2015.
CARD MEMBER AND OTHER RECEIVABLES
Card Member receivables, representing amounts due on charge card products, are recorded at the time a CardMember enters into a point-of-sale transaction with a merchant. Each charge card transaction is authorized based onits likely economics, a Card Member’s most recent credit information and spend patterns. Additionally, global spendlimits are established to limit the maximum exposure for the Company.
Charge Card Members generally must pay the full amount billed each month. Card Member receivable balancesare presented on the Consolidated Balance Sheets net of reserves for losses (refer to Note 4), and include principaland any related accrued fees.
Accounts receivable by segment as of December 31, 2015 and 2014 consisted of:
(Millions) 2015 2014
U.S. Card Services (a) . . . . . . . . . . . . . . . . . . . . . . . . . . . . . . . . . . . . . . . . . . . . . . . . . . . . . . . . . . . . . . . . . . $23,255 $22,468International Card Services . . . . . . . . . . . . . . . . . . . . . . . . . . . . . . . . . . . . . . . . . . . . . . . . . . . . . . . . . . . . 6,975 7,653Global Commercial Services (b) . . . . . . . . . . . . . . . . . . . . . . . . . . . . . . . . . . . . . . . . . . . . . . . . . . . . . . . . . 13,777 14,583Global Network & Merchant Services (c) . . . . . . . . . . . . . . . . . . . . . . . . . . . . . . . . . . . . . . . . . . . . . . . . . . 126 147
Card Member receivables (d) . . . . . . . . . . . . . . . . . . . . . . . . . . . . . . . . . . . . . . . . . . . . . . . . . . . . . . . . . . . 44,133 44,851Less: Reserve for losses . . . . . . . . . . . . . . . . . . . . . . . . . . . . . . . . . . . . . . . . . . . . . . . . . . . . . . . . . . . . . . . 462 465
Card Member receivables, net . . . . . . . . . . . . . . . . . . . . . . . . . . . . . . . . . . . . . . . . . . . . . . . . . . . . . . . . . . $43,671 $44,386
Other receivables, net (e) . . . . . . . . . . . . . . . . . . . . . . . . . . . . . . . . . . . . . . . . . . . . . . . . . . . . . . . . . . . . . . . $ 3,024 $ 2,614
(a) Includes $6.6 billion and $7.0 billion of gross Card Member receivables available to settle obligations of a consolidated VIE as of December 31,2015 and 2014, respectively.
(b) Includes $319 million and $636 million due from airlines, of which Delta Air Lines (Delta) comprises $257 million and $606 million as ofDecember 31, 2015 and 2014, respectively.
(c) Includes receivables primarily related to the Company’s International Currency Card portfolios.(d) Includes approximately $11.9 billion and $13.3 billion of Card Member receivables outside the United States as of December 31, 2015 and 2014,
respectively.(e) Other receivables primarily represent amounts related to (i) certain merchants for billed discount revenue and (ii) GNS partner banks for items
such as royalty and franchise fees. Other receivables are presented net of reserves for losses of $43 million and $61 million as of December 31,2015 and 2014, respectively.
111

CARD MEMBER AND OTHER LOANS
Card Member loans, representing revolving amounts due on lending card products, are recorded at the time aCard Member enters into a point-of-sale transaction with a merchant, as well as amounts due from charge CardMembers who utilize the lending-on-charge feature on their account and elect to revolve a portion of the outstandingbalance by entering into a revolving payment arrangement with the Company. These loans have a range of terms suchas credit limits, interest rates, fees and payment structures, which can be revised over time based on new informationabout Card Members and in accordance with applicable regulations and the respective product’s terms andconditions. Card Members holding revolving loans are typically required to make monthly payments based on pre-established amounts. The amounts that Card Members choose to revolve are subject to finance charges.
Card Member loans are presented on the Consolidated Balance Sheets net of reserves for losses (refer to Note 4),and include principal, accrued interest and fees receivable. The Company’s policy generally is to cease accruinginterest on a Card Member loan at the time the account is written off, and establish reserves for interest that theCompany believes will not be collected.
Loans by segment as of December 31, 2015 and 2014 consisted of:
(Millions) 2015 2014
U.S. Card Services (a) . . . . . . . . . . . . . . . . . . . . . . . . . . . . . . . . . . . . . . . . . . . . . . . . . . . . . . . . . . . . . . . . . . $51,446 $62,592International Card Services . . . . . . . . . . . . . . . . . . . . . . . . . . . . . . . . . . . . . . . . . . . . . . . . . . . . . . . . . . . . 7,072 7,744Global Commercial Services . . . . . . . . . . . . . . . . . . . . . . . . . . . . . . . . . . . . . . . . . . . . . . . . . . . . . . . . . . . 55 49
Card Member loans . . . . . . . . . . . . . . . . . . . . . . . . . . . . . . . . . . . . . . . . . . . . . . . . . . . . . . . . . . . . . . . . . . . 58,573 70,385Less: Reserve for losses . . . . . . . . . . . . . . . . . . . . . . . . . . . . . . . . . . . . . . . . . . . . . . . . . . . . . . . . . . . . . . . 1,028 1,201
Card Member loans, net . . . . . . . . . . . . . . . . . . . . . . . . . . . . . . . . . . . . . . . . . . . . . . . . . . . . . . . . . . . . . . . $57,545 $ 69,184
Other loans, net (b) . . . . . . . . . . . . . . . . . . . . . . . . . . . . . . . . . . . . . . . . . . . . . . . . . . . . . . . . . . . . . . . . . . . . $ 1,254 $ 920
(a) Includes approximately $23.6 billion and $30.1 billion of gross Card Member loans available to settle obligations of a consolidated VIE as ofDecember 31, 2015 and 2014, respectively.
(b) Other loans primarily represent loans to merchants. Other loans are presented net of reserves for losses of $20 million and $12 million as ofDecember 31, 2015 and 2014, respectively.
112

CARD MEMBER LOANS AND CARD MEMBER RECEIVABLES AGING
Generally, a Card Member account is considered past due if payment is not received within 30 days after thebilling statement date. The following table presents the aging of Card Member loans and receivables as ofDecember 31, 2015 and 2014:
2015 (Millions) Current30-59 Days
Past Due60-89 Days
Past Due90+ DaysPast Due Total
Card Member Loans:U.S. Card Services . . . . . . . . . . . . . . . . . . . . . . . . . . . . . . . . . . . . . $50,929 $154 $112 $ 251 $51,446International Card Services . . . . . . . . . . . . . . . . . . . . . . . . . . . . . 6,961 34 25 52 7,072Card Member Receivables:U.S. Card Services . . . . . . . . . . . . . . . . . . . . . . . . . . . . . . . . . . . . . $22,896 $ 118 $ 73 $168 $23,255International Card Services . . . . . . . . . . . . . . . . . . . . . . . . . . . . . 6,875 28 21 51 6,975Global Commercial Services (a) . . . . . . . . . . . . . . . . . . . . . . . . . . (b) (b) (b) 124 13,777
2014 (Millions) Current30-59 Days
Past Due60-89 Days
Past Due90+ DaysPast Due Total
Card Member Loans:U.S. Card Services . . . . . . . . . . . . . . . . . . . . . . . . . . . . . . . . . . . . . $ 61,995 $ 179 $128 $290 $ 62,592International Card Services . . . . . . . . . . . . . . . . . . . . . . . . . . . . . 7,621 39 27 57 7,744Card Member Receivables:U.S. Card Services . . . . . . . . . . . . . . . . . . . . . . . . . . . . . . . . . . . . . $ 22,096 $ 129 $ 72 $ 171 $ 22,468International Card Services . . . . . . . . . . . . . . . . . . . . . . . . . . . . . 7,557 29 20 47 7,653Global Commercial Services (a) . . . . . . . . . . . . . . . . . . . . . . . . . . (b) (b) (b) 120 14,583
(a) For Card Member receivables in GCS, delinquency data is tracked based on days past billing status rather than days past due. A Card Memberaccount is considered 90 days past billing if payment has not been received within 90 days of the Card Member’s billing statement date. Inaddition, if the Company initiates collection procedures on an account prior to the account becoming 90 days past billing, the associated CardMember receivable balance is classified as 90 days past billing. These amounts are shown above as 90+ Days Past Due for presentationpurposes.
(b) Delinquency data for periods other than 90 days past billing is not available due to system constraints. Therefore, such data has not beenutilized for risk management purposes. The balances that are current to 89 days past due can be derived as the difference between the Totaland the 90+ Days Past Due balances.
113

CREDIT QUALITY INDICATORS FOR CARD MEMBER LOANS AND RECEIVABLES
The following tables present the key credit quality indicators as of or for the years ended December 31:
2015 2014Net Write-Off Rate Net Write-Off Rate
PrincipalOnly (a)
Principal,Interest, &
Fees (a)
30+Days Past Due
as a % ofTotal
PrincipalOnly (a)
Principal,Interest, &
Fees (a)
30+Days Past Due
as a % ofTotal
Card Member Loans:U.S. Card Services . . . . . . . . . . . . . . . . . . . . . . . . . . . . 1.4% 1.6% 1.0% 1.5% 1.7% 1.0%International Card Services . . . . . . . . . . . . . . . . . . . . 1.9% 2.4% 1.6% 2.0% 2.4% 1.6%Card Member Receivables:U.S. Card Services . . . . . . . . . . . . . . . . . . . . . . . . . . . . 1.7% 1.9% 1.5% 1.6% 1.8% 1.7%International Card Services . . . . . . . . . . . . . . . . . . . . 2.0% 2.2% 1.4% 1.9% 2.1% 1.3%
2015 2014Net LossRatio as
a % ofChargeVolume
90+Days Past Billing
as a % ofReceivables
Net LossRatio as
a % ofChargeVolume
90+Days Past Billing
as a % ofReceivables
Card Member Receivables:Global Commercial Services . . . . . . . . . . . . . . . . . . . . 0.09% 0.9% 0.09% 0.8%
(a) The Company presents a net write-off rate based on principal losses only (i.e., excluding interest and/or fees) to be consistent with industryconvention. In addition, because the Company considers uncollectible interest and/or fees in estimating its reserves for credit losses, a netwrite-off rate including principal, interest and/or fees is also presented. The year ended December 31, 2015, reflects the impact of a change inthe timing of charge-offs for Card Member loans and receivables in certain modification programs from 180 days past due to 120 days past due,which was fully recognized during the three months ended March 31, 2015.
Refer to Note 4 for additional indicators, including external environmental qualitative factors, managementconsiders in its monthly evaluation process for reserves for losses.
IMPAIRED CARD MEMBER LOANS AND RECEIVABLES
Impaired loans and receivables are individual larger balance or homogeneous pools of smaller balance loans andreceivables for which it is probable that the Company will be unable to collect all amounts due according to the originalcontractual terms of the Card Member agreement. The Company considers impaired loans and receivables to include:(i) loans over 90 days past due still accruing interest, (ii) nonaccrual loans and (iii) loans and receivables modified astroubled debt restructurings (TDRs).
The Company may modify, through various programs, Card Member loans and receivables in instances where theCard Member is experiencing financial difficulty in order to minimize losses and improve collectability, while providingCard Members with temporary or permanent financial relief. The Company has classified Card Member loans andreceivables in these modification programs as TDRs. Beginning January 1, 2015, on a prospective basis the Companycontinues to classify Card Member accounts that have exited a modification program as a TDR, with such accountsidentified as “Out of Program TDRs.”
Such modifications to the loans and receivables primarily include (i) temporary interest rate reductions (possiblyas low as zero percent, in which case the loan is characterized as non-accrual in the Company’s TDR disclosures),(ii) placing the Card Member on a fixed payment plan not to exceed 60 months and (iii) suspending delinquency feesuntil the Card Member exits the modification program. Upon entering the modification program, the Card Member’sability to make future purchases is either cancelled, or in certain cases suspended until the Card Member successfullyexits the modification program. In accordance with the modification agreement with the Card Member, loans mayrevert back to the original contractual terms (including the contractual interest rate) when the Card Member exits themodification program, which is (i) when all payments have been made in accordance with the modification agreementor, (ii) when the Card Member defaults out of the modification program. The Company establishes a reserve for CardMember interest charges and fees considered to be uncollectible.
114
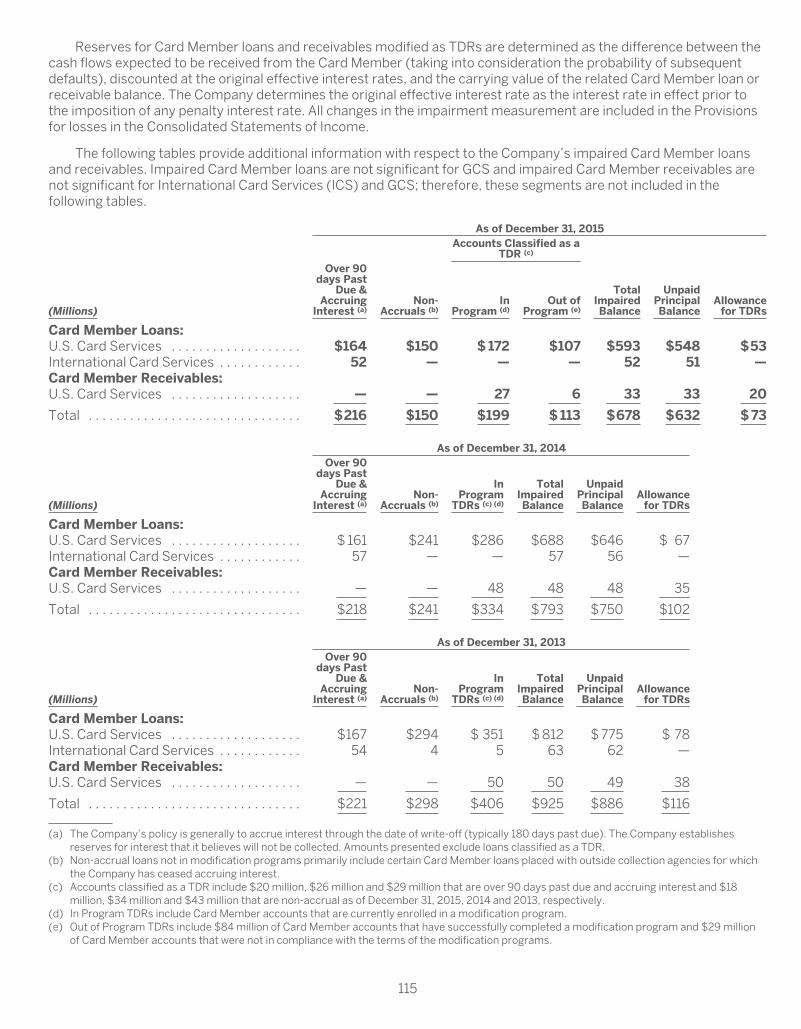
Reserves for Card Member loans and receivables modified as TDRs are determined as the difference between thecash flows expected to be received from the Card Member (taking into consideration the probability of subsequentdefaults), discounted at the original effective interest rates, and the carrying value of the related Card Member loan orreceivable balance. The Company determines the original effective interest rate as the interest rate in effect prior tothe imposition of any penalty interest rate. All changes in the impairment measurement are included in the Provisionsfor losses in the Consolidated Statements of Income.
The following tables provide additional information with respect to the Company’s impaired Card Member loansand receivables. Impaired Card Member loans are not significant for GCS and impaired Card Member receivables arenot significant for International Card Services (ICS) and GCS; therefore, these segments are not included in thefollowing tables.
As of December 31, 2015Accounts Classified as a
TDR (c)
(Millions)
Over 90days Past
Due &Accruing
Interest (a)Non-
Accruals (b)In
Program (d)Out of
Program (e)
TotalImpairedBalance
UnpaidPrincipalBalance
Allowancefor TDRs
Card Member Loans:U.S. Card Services . . . . . . . . . . . . . . . . . . . $164 $150 $ 172 $107 $593 $548 $53International Card Services . . . . . . . . . . . . 52 — — — 52 51 —Card Member Receivables:U.S. Card Services . . . . . . . . . . . . . . . . . . . — — 27 6 33 33 20
Total . . . . . . . . . . . . . . . . . . . . . . . . . . . . . . . $216 $150 $199 $ 113 $678 $632 $ 73
As of December 31, 2014
(Millions)
Over 90days Past
Due &Accruing
Interest (a)Non-
Accruals (b)
InProgram
TDRs (c) (d)
TotalImpairedBalance
UnpaidPrincipalBalance
Allowancefor TDRs
Card Member Loans:U.S. Card Services . . . . . . . . . . . . . . . . . . . $ 161 $241 $286 $688 $646 $ 67International Card Services . . . . . . . . . . . . 57 — — 57 56 —Card Member Receivables:U.S. Card Services . . . . . . . . . . . . . . . . . . . — — 48 48 48 35
Total . . . . . . . . . . . . . . . . . . . . . . . . . . . . . . . $218 $241 $334 $793 $750 $102
As of December 31, 2013
(Millions)
Over 90days Past
Due &Accruing
Interest (a)Non-
Accruals (b)
InProgram
TDRs (c) (d)
TotalImpairedBalance
UnpaidPrincipalBalance
Allowancefor TDRs
Card Member Loans:U.S. Card Services . . . . . . . . . . . . . . . . . . . $167 $294 $ 351 $ 812 $ 775 $ 78International Card Services . . . . . . . . . . . . 54 4 5 63 62 —Card Member Receivables:U.S. Card Services . . . . . . . . . . . . . . . . . . . — — 50 50 49 38
Total . . . . . . . . . . . . . . . . . . . . . . . . . . . . . . . $221 $298 $406 $925 $886 $116
(a) The Company’s policy is generally to accrue interest through the date of write-off (typically 180 days past due). The Company establishesreserves for interest that it believes will not be collected. Amounts presented exclude loans classified as a TDR.
(b) Non-accrual loans not in modification programs primarily include certain Card Member loans placed with outside collection agencies for whichthe Company has ceased accruing interest.
(c) Accounts classified as a TDR include $20 million, $26 million and $29 million that are over 90 days past due and accruing interest and $18million, $34 million and $43 million that are non-accrual as of December 31, 2015, 2014 and 2013, respectively.
(d) In Program TDRs include Card Member accounts that are currently enrolled in a modification program.(e) Out of Program TDRs include $84 million of Card Member accounts that have successfully completed a modification program and $29 million
of Card Member accounts that were not in compliance with the terms of the modification programs.
115

The following table provides information with respect to the Company’s average balances of, and interest incomerecognized from, impaired Card Member loans and the average balances of impaired Card Member receivables for theyears ended December 31:
2015 (Millions)AverageBalance
InterestIncome
Recognized
Card Member Loans:U.S. Card Services . . . . . . . . . . . . . . . . . . . . . . . . . . . . . . . . . . . . . . . . . . . . . . . . . . . . . . . . . . . . . . . . . . $673 $59International Card Services . . . . . . . . . . . . . . . . . . . . . . . . . . . . . . . . . . . . . . . . . . . . . . . . . . . . . . . . . . . 54 14
Card Member Receivables:U.S. Card Services . . . . . . . . . . . . . . . . . . . . . . . . . . . . . . . . . . . . . . . . . . . . . . . . . . . . . . . . . . . . . . . . . . 33 —
Total . . . . . . . . . . . . . . . . . . . . . . . . . . . . . . . . . . . . . . . . . . . . . . . . . . . . . . . . . . . . . . . . . . . . . . . . . . . . . . . . $760 $73
2014 (Millions)AverageBalance
InterestIncome
Recognized
Card Member Loans:U.S. Card Services . . . . . . . . . . . . . . . . . . . . . . . . . . . . . . . . . . . . . . . . . . . . . . . . . . . . . . . . . . . . . . . . . . $750 $49International Card Services . . . . . . . . . . . . . . . . . . . . . . . . . . . . . . . . . . . . . . . . . . . . . . . . . . . . . . . . . . . 62 16
Card Member Receivables:U.S. Card Services . . . . . . . . . . . . . . . . . . . . . . . . . . . . . . . . . . . . . . . . . . . . . . . . . . . . . . . . . . . . . . . . . . 47 —
Total . . . . . . . . . . . . . . . . . . . . . . . . . . . . . . . . . . . . . . . . . . . . . . . . . . . . . . . . . . . . . . . . . . . . . . . . . . . . . . . . $859 $65
2013 (Millions)AverageBalance
InterestIncome
Recognized
Card Member Loans:U.S. Card Services . . . . . . . . . . . . . . . . . . . . . . . . . . . . . . . . . . . . . . . . . . . . . . . . . . . . . . . . . . . . . . . . . . $ 948 $46International Card Services . . . . . . . . . . . . . . . . . . . . . . . . . . . . . . . . . . . . . . . . . . . . . . . . . . . . . . . . . . . 67 16
Card Member Receivables:U.S. Card Services . . . . . . . . . . . . . . . . . . . . . . . . . . . . . . . . . . . . . . . . . . . . . . . . . . . . . . . . . . . . . . . . . . 81 —
Total . . . . . . . . . . . . . . . . . . . . . . . . . . . . . . . . . . . . . . . . . . . . . . . . . . . . . . . . . . . . . . . . . . . . . . . . . . . . . . . . $1,096 $62
116

CARD MEMBER LOANS AND RECEIVABLES MODIFIED AS TDRS
The following table provides additional information with respect to the U.S. Card Services (USCS) Card Memberloans and receivables modified as TDRs for the years ended December 31, 2015, 2014 and 2013. The ICS Card Memberloans and receivables modifications were not significant and the Company does not offer modification programs for itsGCS Card Member receivables; therefore, these segments are not included in the following TDR disclosures.
2015
Number ofAccounts
(in thousands)
OutstandingBalances (a)
($ in millions)
AverageInterest
RateReduction(% points)
AveragePayment
TermExtensions
(# of months)
Troubled Debt Restructurings:Card Member Loans . . . . . . . . . . . . . . . . . . . . . . . . . . . . . . . . . . . . 40 $285 9 (b)Card Member Receivables . . . . . . . . . . . . . . . . . . . . . . . . . . . . . . 12 147 (c) 12
Total . . . . . . . . . . . . . . . . . . . . . . . . . . . . . . . . . . . . . . . . . . . . . . . . . . . 52 $432
2014
Number ofAccounts
(in thousands)
OutstandingBalances (a)
($ in millions)
AverageInterest
RateReduction(% points)
AveragePayment
TermExtensions
(# of months)
Troubled Debt Restructurings:Card Member Loans . . . . . . . . . . . . . . . . . . . . . . . . . . . . . . . . . . . . 46 $342 10 (b)Card Member Receivables . . . . . . . . . . . . . . . . . . . . . . . . . . . . . . 15 176 (c) 12
Total . . . . . . . . . . . . . . . . . . . . . . . . . . . . . . . . . . . . . . . . . . . . . . . . . . . 61 $ 518
2013
Number ofAccounts
(in thousands)
OutstandingBalances (a)
($ in millions)
AverageInterest
RateReduction(% points)
AveragePayment
TermExtensions
(# of months)
Troubled Debt Restructurings:Card Member Loans . . . . . . . . . . . . . . . . . . . . . . . . . . . . . . . . . . . . 60 $448 10 (b)Card Member Receivables . . . . . . . . . . . . . . . . . . . . . . . . . . . . . . 20 247 (c) 12
Total . . . . . . . . . . . . . . . . . . . . . . . . . . . . . . . . . . . . . . . . . . . . . . . . . . . 80 $695
(a) Represents the outstanding balance immediately prior to modification. The outstanding balance includes principal, fees and accrued interest onCard Member loans, and principal and fees on Card Member receivables. For the year ended December 31, 2013, in certain modifications, theprincipal balance was reduced in the aggregate by $4 million. For the years ended December 31, 2015 and 2014, modifications did not reducethe principal balance.
(b) For Card Member loans, there have been no payment term extensions.(c) The Company does not offer interest rate reduction programs for Card Member receivables as the receivables are non-interest bearing.
117
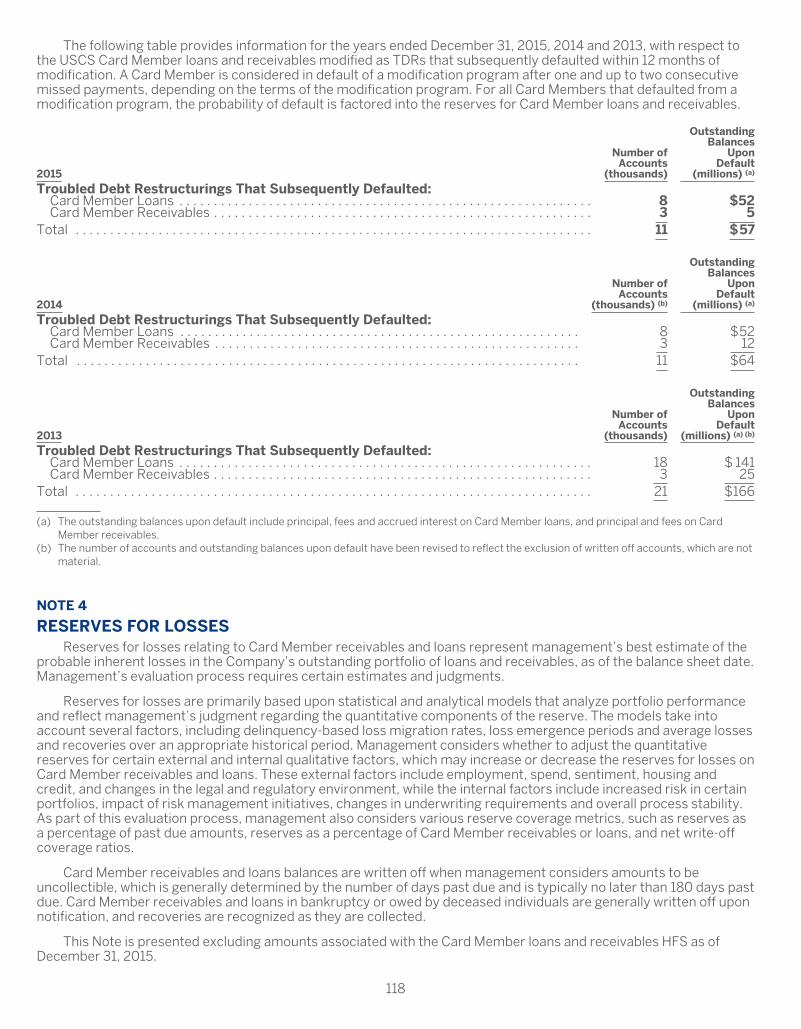
The following table provides information for the years ended December 31, 2015, 2014 and 2013, with respect tothe USCS Card Member loans and receivables modified as TDRs that subsequently defaulted within 12 months ofmodification. A Card Member is considered in default of a modification program after one and up to two consecutivemissed payments, depending on the terms of the modification program. For all Card Members that defaulted from amodification program, the probability of default is factored into the reserves for Card Member loans and receivables.
2015
Number ofAccounts
(thousands)
OutstandingBalances
UponDefault
(millions) (a)
Troubled Debt Restructurings That Subsequently Defaulted:Card Member Loans . . . . . . . . . . . . . . . . . . . . . . . . . . . . . . . . . . . . . . . . . . . . . . . . . . . . . . . . . . . . 8 $52Card Member Receivables . . . . . . . . . . . . . . . . . . . . . . . . . . . . . . . . . . . . . . . . . . . . . . . . . . . . . . . 3 5
Total . . . . . . . . . . . . . . . . . . . . . . . . . . . . . . . . . . . . . . . . . . . . . . . . . . . . . . . . . . . . . . . . . . . . . . . . . . . 11 $57
2014
Number ofAccounts
(thousands) (b)
OutstandingBalances
UponDefault
(millions) (a)
Troubled Debt Restructurings That Subsequently Defaulted:Card Member Loans . . . . . . . . . . . . . . . . . . . . . . . . . . . . . . . . . . . . . . . . . . . . . . . . . . . . . . . . . . 8 $52Card Member Receivables . . . . . . . . . . . . . . . . . . . . . . . . . . . . . . . . . . . . . . . . . . . . . . . . . . . . . 3 12
Total . . . . . . . . . . . . . . . . . . . . . . . . . . . . . . . . . . . . . . . . . . . . . . . . . . . . . . . . . . . . . . . . . . . . . . . . . 11 $64
2013
Number ofAccounts
(thousands)
OutstandingBalances
UponDefault
(millions) (a) (b)
Troubled Debt Restructurings That Subsequently Defaulted:Card Member Loans . . . . . . . . . . . . . . . . . . . . . . . . . . . . . . . . . . . . . . . . . . . . . . . . . . . . . . . . . . . . 18 $ 141Card Member Receivables . . . . . . . . . . . . . . . . . . . . . . . . . . . . . . . . . . . . . . . . . . . . . . . . . . . . . . . 3 25
Total . . . . . . . . . . . . . . . . . . . . . . . . . . . . . . . . . . . . . . . . . . . . . . . . . . . . . . . . . . . . . . . . . . . . . . . . . . . 21 $166
(a) The outstanding balances upon default include principal, fees and accrued interest on Card Member loans, and principal and fees on CardMember receivables.
(b) The number of accounts and outstanding balances upon default have been revised to reflect the exclusion of written off accounts, which are notmaterial.
NOTE 4
RESERVES FOR LOSSESReserves for losses relating to Card Member receivables and loans represent management’s best estimate of the
probable inherent losses in the Company’s outstanding portfolio of loans and receivables, as of the balance sheet date.Management’s evaluation process requires certain estimates and judgments.
Reserves for losses are primarily based upon statistical and analytical models that analyze portfolio performanceand reflect management’s judgment regarding the quantitative components of the reserve. The models take intoaccount several factors, including delinquency-based loss migration rates, loss emergence periods and average lossesand recoveries over an appropriate historical period. Management considers whether to adjust the quantitativereserves for certain external and internal qualitative factors, which may increase or decrease the reserves for losses onCard Member receivables and loans. These external factors include employment, spend, sentiment, housing andcredit, and changes in the legal and regulatory environment, while the internal factors include increased risk in certainportfolios, impact of risk management initiatives, changes in underwriting requirements and overall process stability.As part of this evaluation process, management also considers various reserve coverage metrics, such as reserves asa percentage of past due amounts, reserves as a percentage of Card Member receivables or loans, and net write-offcoverage ratios.
Card Member receivables and loans balances are written off when management considers amounts to beuncollectible, which is generally determined by the number of days past due and is typically no later than 180 days pastdue. Card Member receivables and loans in bankruptcy or owed by deceased individuals are generally written off uponnotification, and recoveries are recognized as they are collected.
This Note is presented excluding amounts associated with the Card Member loans and receivables HFS as ofDecember 31, 2015.
118

CHANGES IN CARD MEMBER RECEIVABLES RESERVE FOR LOSSES
The following table presents changes in the Card Member receivables reserve for losses for the years endedDecember 31:
(Millions) 2015 2014 2013
Balance, January 1 . . . . . . . . . . . . . . . . . . . . . . . . . . . . . . . . . . . . . . . . . . . . . . . . . . . . . . . . . . . . . . . . . $465 $ 386 $ 428Provisions (a) . . . . . . . . . . . . . . . . . . . . . . . . . . . . . . . . . . . . . . . . . . . . . . . . . . . . . . . . . . . . . . . . . . . . 737 792 648Net write-offs (b) . . . . . . . . . . . . . . . . . . . . . . . . . . . . . . . . . . . . . . . . . . . . . . . . . . . . . . . . . . . . . . . . . (713) (683) (669)Other (c) . . . . . . . . . . . . . . . . . . . . . . . . . . . . . . . . . . . . . . . . . . . . . . . . . . . . . . . . . . . . . . . . . . . . . . . . (27) (30) (21)
Balance, December 31 . . . . . . . . . . . . . . . . . . . . . . . . . . . . . . . . . . . . . . . . . . . . . . . . . . . . . . . . . . . . . . $462 $ 465 $ 386
(a) Provisions for principal and fee reserve components.(b) Consists of principal and fee components, less recoveries of $401 million, $358 million and $402 million, including net write-offs from TDRs of
$60 million, $15 million and $12 million, for the years ended December 31, 2015, 2014 and 2013, respectively.(c) Includes foreign currency translation adjustments of $(16) million, $(15) million and $(4) million for the years ended December 31, 2015, 2014
and 2013, respectively; and other adjustments of $(11) million, $(8) million and $(17) million for the years ended December 31, 2015, 2014 and2013, respectively. Additionally, 2015 includes the impact of the transfer of the HFS receivables portfolio, which was not significant, and 2014includes an adjustment related to reserves for card-related fraud losses of $(7) million, which was reclassified to Other liabilities.
CARD MEMBER RECEIVABLES EVALUATED INDIVIDUALLY AND COLLECTIVELY FOR IMPAIRMENT
The following table presents Card Member receivables evaluated individually and collectively for impairment, andrelated reserves, as of December 31:
(Millions) 2015 2014 2013
Card Member receivables evaluated individually for impairment (a) . . . . . . . . . . . . . . . . . . . $ 33 $ 48 $ 50Related reserves (a) . . . . . . . . . . . . . . . . . . . . . . . . . . . . . . . . . . . . . . . . . . . . . . . . . . . . . . . . . . . . $ 20 $ 35 $ 38
Card Member receivables evaluated collectively for impairment . . . . . . . . . . . . . . . . . . . . . . $44,100 $44,803 $44,113Related reserves (b) . . . . . . . . . . . . . . . . . . . . . . . . . . . . . . . . . . . . . . . . . . . . . . . . . . . . . . . . . . . . $ 442 $ 430 $ 348
(a) Represents receivables modified as a TDR and related reserves.(b) The reserves include the quantitative results of analytical models that are specific to individual pools of receivables, and reserves for internal
and external qualitative risk factors that apply to receivables that are collectively evaluated for impairment.
CHANGES IN CARD MEMBER LOANS RESERVE FOR LOSSES
The following table presents changes in the Card Member loans reserve for losses for the years endedDecember 31:
(Millions) 2015 2014 2013
Balance, January 1 . . . . . . . . . . . . . . . . . . . . . . . . . . . . . . . . . . . . . . . . . . . . . . . . . . . . . . . . . . . . . . $ 1,201 $ 1,261 $ 1,471Provisions (a) . . . . . . . . . . . . . . . . . . . . . . . . . . . . . . . . . . . . . . . . . . . . . . . . . . . . . . . . . . . . . . . . . 1,190 1,138 1,115Net write-offs
Principal (b) . . . . . . . . . . . . . . . . . . . . . . . . . . . . . . . . . . . . . . . . . . . . . . . . . . . . . . . . . . . . . . . . (967) (1,023) (1,141)Interest and fees (b) . . . . . . . . . . . . . . . . . . . . . . . . . . . . . . . . . . . . . . . . . . . . . . . . . . . . . . . . . (162) (164) (150)
Transfer of reserves on HFS loan portfolios . . . . . . . . . . . . . . . . . . . . . . . . . . . . . . . . . . . . . . . (224) — —Other (c) . . . . . . . . . . . . . . . . . . . . . . . . . . . . . . . . . . . . . . . . . . . . . . . . . . . . . . . . . . . . . . . . . . . . . (10) (11) (34)
Balance, December 31 . . . . . . . . . . . . . . . . . . . . . . . . . . . . . . . . . . . . . . . . . . . . . . . . . . . . . . . . . . $1,028 $ 1,201 $ 1,261
(a) Provisions for principal interest and fee reserve components.(b) Consists of principal write-offs, less recoveries of $418 million, $428 million and $452 million, including net write-offs/(recoveries) from TDRs of
$41 million, $(10) million and $(1) million, for the years ended December 31, 2015, 2014 and 2013, respectively. Recoveries of interest and feeswere de minimis.
(c) Includes foreign currency translation adjustments of $(20) million, $(17) million and $(12) million for the years ended December 31, 2015, 2014and 2013, respectively, and other adjustments of $10 million, $12 million and $(22) million for the years ended December 31, 2015, 2014 and2013, respectively. Additionally, 2014 includes an adjustment related to reserves for card-related fraud losses of $(6) million, which werereclassified to Other liabilities.
119
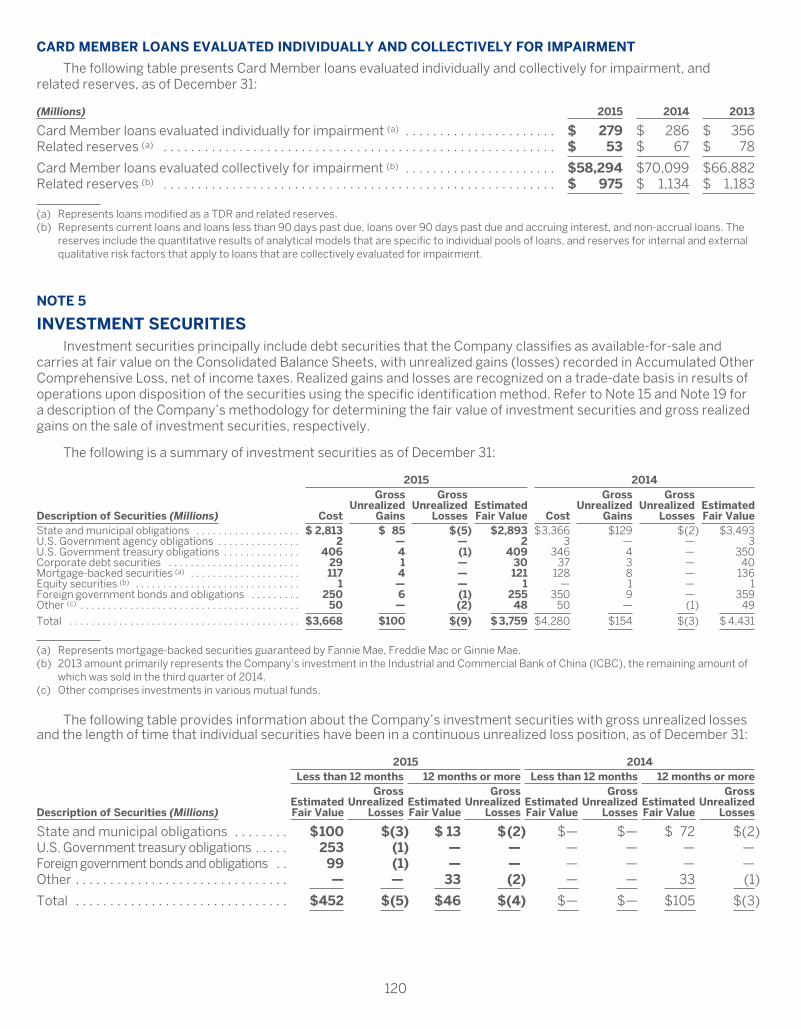
CARD MEMBER LOANS EVALUATED INDIVIDUALLY AND COLLECTIVELY FOR IMPAIRMENT
The following table presents Card Member loans evaluated individually and collectively for impairment, andrelated reserves, as of December 31:
(Millions) 2015 2014 2013
Card Member loans evaluated individually for impairment (a) . . . . . . . . . . . . . . . . . . . . . . $ 279 $ 286 $ 356Related reserves (a) . . . . . . . . . . . . . . . . . . . . . . . . . . . . . . . . . . . . . . . . . . . . . . . . . . . . . . . . . $ 53 $ 67 $ 78
Card Member loans evaluated collectively for impairment (b) . . . . . . . . . . . . . . . . . . . . . . $58,294 $70,099 $66,882Related reserves (b) . . . . . . . . . . . . . . . . . . . . . . . . . . . . . . . . . . . . . . . . . . . . . . . . . . . . . . . . . $ 975 $ 1,134 $ 1,183
(a) Represents loans modified as a TDR and related reserves.(b) Represents current loans and loans less than 90 days past due, loans over 90 days past due and accruing interest, and non-accrual loans. The
reserves include the quantitative results of analytical models that are specific to individual pools of loans, and reserves for internal and externalqualitative risk factors that apply to loans that are collectively evaluated for impairment.
NOTE 5
INVESTMENT SECURITIESInvestment securities principally include debt securities that the Company classifies as available-for-sale and
carries at fair value on the Consolidated Balance Sheets, with unrealized gains (losses) recorded in Accumulated OtherComprehensive Loss, net of income taxes. Realized gains and losses are recognized on a trade-date basis in results ofoperations upon disposition of the securities using the specific identification method. Refer to Note 15 and Note 19 fora description of the Company’s methodology for determining the fair value of investment securities and gross realizedgains on the sale of investment securities, respectively.
The following is a summary of investment securities as of December 31:
2015 2014
Description of Securities (Millions) Cost
GrossUnrealized
Gains
GrossUnrealized
LossesEstimatedFair Value Cost
GrossUnrealized
Gains
GrossUnrealized
LossesEstimatedFair Value
State and municipal obligations . . . . . . . . . . . . . . . . . . . $ 2,813 $ 85 $(5) $2,893 $3,366 $129 $(2) $3,493U.S. Government agency obligations . . . . . . . . . . . . . . . 2 — — 2 3 — — 3U.S. Government treasury obligations . . . . . . . . . . . . . . 406 4 (1) 409 346 4 — 350Corporate debt securities . . . . . . . . . . . . . . . . . . . . . . . . 29 1 — 30 37 3 — 40Mortgage-backed securities (a) . . . . . . . . . . . . . . . . . . . . 117 4 — 121 128 8 — 136Equity securities (b) . . . . . . . . . . . . . . . . . . . . . . . . . . . . . . 1 — — 1 — 1 — 1Foreign government bonds and obligations . . . . . . . . . 250 6 (1) 255 350 9 — 359Other (c) . . . . . . . . . . . . . . . . . . . . . . . . . . . . . . . . . . . . . . . . 50 — (2) 48 50 — (1) 49
Total . . . . . . . . . . . . . . . . . . . . . . . . . . . . . . . . . . . . . . . . . . $3,668 $100 $(9) $3,759 $4,280 $154 $(3) $ 4,431
(a) Represents mortgage-backed securities guaranteed by Fannie Mae, Freddie Mac or Ginnie Mae.(b) 2013 amount primarily represents the Company’s investment in the Industrial and Commercial Bank of China (ICBC), the remaining amount of
which was sold in the third quarter of 2014.(c) Other comprises investments in various mutual funds.
The following table provides information about the Company’s investment securities with gross unrealized lossesand the length of time that individual securities have been in a continuous unrealized loss position, as of December 31:
2015 2014Less than 12 months 12 months or more Less than 12 months 12 months or more
Description of Securities (Millions)EstimatedFair Value
GrossUnrealized
LossesEstimatedFair Value
GrossUnrealized
LossesEstimatedFair Value
GrossUnrealized
LossesEstimatedFair Value
GrossUnrealized
Losses
State and municipal obligations . . . . . . . . $100 $(3) $ 13 $(2) $— $— $ 72 $(2)U.S. Government treasury obligations . . . . . 253 (1) — — — — — —Foreign government bonds and obligations . . 99 (1) — — — — — —Other . . . . . . . . . . . . . . . . . . . . . . . . . . . . . . . — — 33 (2) — — 33 (1)
Total . . . . . . . . . . . . . . . . . . . . . . . . . . . . . . . $452 $(5) $46 $(4) $— $— $105 $(3)
120
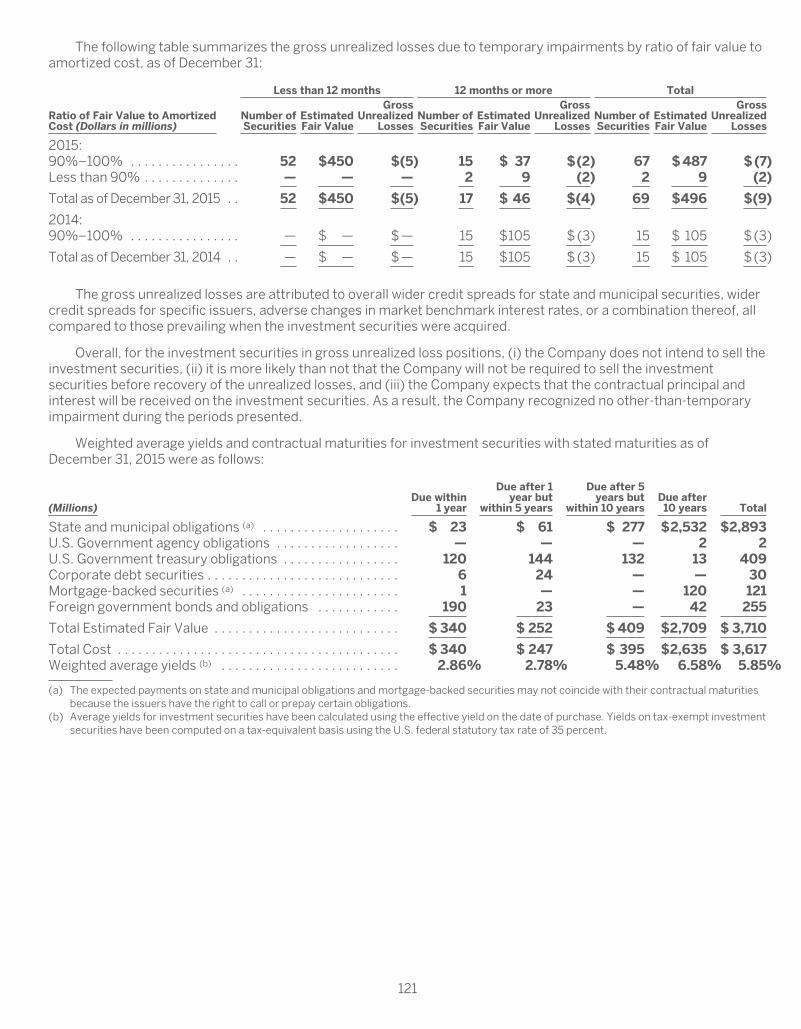
The following table summarizes the gross unrealized losses due to temporary impairments by ratio of fair value toamortized cost, as of December 31:
Less than 12 months 12 months or more Total
Ratio of Fair Value to AmortizedCost (Dollars in millions)
Number ofSecurities
EstimatedFair Value
GrossUnrealized
LossesNumber ofSecurities
EstimatedFair Value
GrossUnrealized
LossesNumber ofSecurities
EstimatedFair Value
GrossUnrealized
Losses
2015:90%–100% . . . . . . . . . . . . . . . . 52 $450 $(5) 15 $ 37 $(2) 67 $487 $(7)Less than 90% . . . . . . . . . . . . . . — — — 2 9 (2) 2 9 (2)
Total as of December 31, 2015 . . 52 $450 $(5) 17 $ 46 $(4) 69 $496 $(9)
2014:90%–100% . . . . . . . . . . . . . . . . — $ — $ — 15 $105 $ (3) 15 $ 105 $(3)
Total as of December 31, 2014 . . — $ — $ — 15 $105 $ (3) 15 $ 105 $(3)
The gross unrealized losses are attributed to overall wider credit spreads for state and municipal securities, widercredit spreads for specific issuers, adverse changes in market benchmark interest rates, or a combination thereof, allcompared to those prevailing when the investment securities were acquired.
Overall, for the investment securities in gross unrealized loss positions, (i) the Company does not intend to sell theinvestment securities, (ii) it is more likely than not that the Company will not be required to sell the investmentsecurities before recovery of the unrealized losses, and (iii) the Company expects that the contractual principal andinterest will be received on the investment securities. As a result, the Company recognized no other-than-temporaryimpairment during the periods presented.
Weighted average yields and contractual maturities for investment securities with stated maturities as ofDecember 31, 2015 were as follows:
(Millions)Due within
1 year
Due after 1year but
within 5 years
Due after 5years but
within 10 yearsDue after10 years Total
State and municipal obligations (a) . . . . . . . . . . . . . . . . . . . . $ 23 $ 61 $ 277 $2,532 $2,893U.S. Government agency obligations . . . . . . . . . . . . . . . . . . — — — 2 2U.S. Government treasury obligations . . . . . . . . . . . . . . . . . 120 144 132 13 409Corporate debt securities . . . . . . . . . . . . . . . . . . . . . . . . . . . . 6 24 — — 30Mortgage-backed securities (a) . . . . . . . . . . . . . . . . . . . . . . . 1 — — 120 121Foreign government bonds and obligations . . . . . . . . . . . . 190 23 — 42 255
Total Estimated Fair Value . . . . . . . . . . . . . . . . . . . . . . . . . . . $ 340 $ 252 $ 409 $2,709 $ 3,710
Total Cost . . . . . . . . . . . . . . . . . . . . . . . . . . . . . . . . . . . . . . . . . $ 340 $ 247 $ 395 $2,635 $ 3,617Weighted average yields (b) . . . . . . . . . . . . . . . . . . . . . . . . . . 2.86% 2.78% 5.48% 6.58% 5.85%
(a) The expected payments on state and municipal obligations and mortgage-backed securities may not coincide with their contractual maturitiesbecause the issuers have the right to call or prepay certain obligations.
(b) Average yields for investment securities have been calculated using the effective yield on the date of purchase. Yields on tax-exempt investmentsecurities have been computed on a tax-equivalent basis using the U.S. federal statutory tax rate of 35 percent.
121

NOTE 6
ASSET SECURITIZATIONSThe Company periodically securitizes Card Member receivables and loans arising from its card business, including
Card Member loans and receivables HFS, through the transfer of those assets to securitization trusts. The trusts thenissue debt securities to third-party investors, collateralized by the transferred assets.
Card Member receivables are transferred to the American Express Issuance Trust II (the Charge Trust). CardMember loans are transferred to the American Express Credit Account Master Trust (the Lending Trust, collectivelythe Trusts). The Trusts are consolidated by American Express Travel Related Services Company, Inc. (TRS), which is aconsolidated subsidiary of the Company. The Trusts are considered VIEs as they have insufficient equity at risk tofinance their activities, which are to issue debt securities that are collateralized by the underlying Card Memberreceivables and loans. Details on the principles of consolidation can be found in the summary of significant accountingpolicies (refer to Note 1).
TRS, in its role as servicer of the Trusts, has the power to direct the most significant activity of the Trusts, which isthe collection of the underlying Card Member receivables and loans. In addition, TRS, excluding its consolidatedsubsidiaries, owned approximately $1.0 billion of subordinated securities issued by the Lending Trust as ofDecember 31, 2015. These subordinated securities have the obligation to absorb losses of the Lending Trust andprovide the right to receive benefits from the Lending Trust, both of which are significant to the VIE. TRS’ role asservicer for the Charge Trust does not provide it with a significant obligation to absorb losses or a significant right toreceive benefits. However, TRS’ position as the parent company of the entities that transferred the receivables to theCharge Trust makes it the party most closely related to the Charge Trust. Based on these considerations, TRS is theprimary beneficiary of both Trusts.
The debt securities issued by the Trusts are non-recourse to the Company. The securitized Card Memberreceivables and loans held by the Charge Trust and the Lending Trust, respectively, are available only for payment ofthe debt securities or other obligations issued or arising in the securitization transactions (refer to Note 3). The long-term debt of each Trust is payable only out of collections on their respective underlying securitized assets (refer toNote 9).
The following table presents the restricted cash held by the Charge Trust and the Lending Trust as ofDecember 31, 2015 and 2014, included in Other Assets on the Company’s Consolidated Balance Sheets:
(Millions) 2015 2014
Charge Trust . . . . . . . . . . . . . . . . . . . . . . . . . . . . . . . . . . . . . . . . . . . . . . . . . . . . . . . . . . . . . . . . . . . . . . . . . . . . . . . . $ 2 $ 2Lending Trust . . . . . . . . . . . . . . . . . . . . . . . . . . . . . . . . . . . . . . . . . . . . . . . . . . . . . . . . . . . . . . . . . . . . . . . . . . . . . . . 153 62
Total . . . . . . . . . . . . . . . . . . . . . . . . . . . . . . . . . . . . . . . . . . . . . . . . . . . . . . . . . . . . . . . . . . . . . . . . . . . . . . . . . . . . . . . $155 $64
These amounts relate to collections of Card Member receivables and loans to be used by the Trusts to fund futureexpenses and obligations, including credit losses, interest paid on the debt securities and upcoming debt maturities.
Under the respective terms of the Charge Trust and the Lending Trust agreements, the occurrence of certaintriggering events associated with the performance of the assets of each Trust could result in payment of trustexpenses, establishment of reserve funds, or, in a worst-case scenario, early amortization of investor debt securities.During the year ended December 31, 2015, no such triggering events occurred.
122
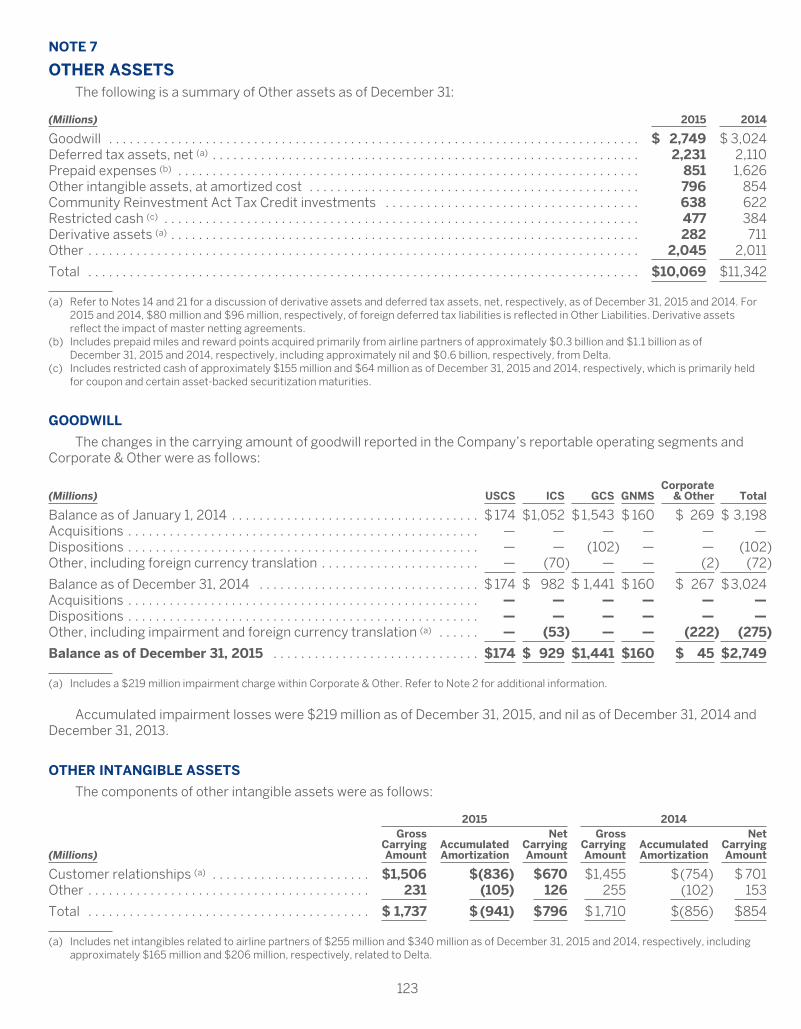
NOTE 7
OTHER ASSETSThe following is a summary of Other assets as of December 31:
(Millions) 2015 2014
Goodwill . . . . . . . . . . . . . . . . . . . . . . . . . . . . . . . . . . . . . . . . . . . . . . . . . . . . . . . . . . . . . . . . . . . . . . . . . . . . . $ 2,749 $ 3,024Deferred tax assets, net (a) . . . . . . . . . . . . . . . . . . . . . . . . . . . . . . . . . . . . . . . . . . . . . . . . . . . . . . . . . . . . . . 2,231 2,110Prepaid expenses (b) . . . . . . . . . . . . . . . . . . . . . . . . . . . . . . . . . . . . . . . . . . . . . . . . . . . . . . . . . . . . . . . . . . . 851 1,626Other intangible assets, at amortized cost . . . . . . . . . . . . . . . . . . . . . . . . . . . . . . . . . . . . . . . . . . . . . . . . 796 854Community Reinvestment Act Tax Credit investments . . . . . . . . . . . . . . . . . . . . . . . . . . . . . . . . . . . . . 638 622Restricted cash (c) . . . . . . . . . . . . . . . . . . . . . . . . . . . . . . . . . . . . . . . . . . . . . . . . . . . . . . . . . . . . . . . . . . . . . 477 384Derivative assets (a) . . . . . . . . . . . . . . . . . . . . . . . . . . . . . . . . . . . . . . . . . . . . . . . . . . . . . . . . . . . . . . . . . . . . 282 711Other . . . . . . . . . . . . . . . . . . . . . . . . . . . . . . . . . . . . . . . . . . . . . . . . . . . . . . . . . . . . . . . . . . . . . . . . . . . . . . . . 2,045 2,011
Total . . . . . . . . . . . . . . . . . . . . . . . . . . . . . . . . . . . . . . . . . . . . . . . . . . . . . . . . . . . . . . . . . . . . . . . . . . . . . . . . $10,069 $11,342
(a) Refer to Notes 14 and 21 for a discussion of derivative assets and deferred tax assets, net, respectively, as of December 31, 2015 and 2014. For2015 and 2014, $80 million and $96 million, respectively, of foreign deferred tax liabilities is reflected in Other Liabilities. Derivative assetsreflect the impact of master netting agreements.
(b) Includes prepaid miles and reward points acquired primarily from airline partners of approximately $0.3 billion and $1.1 billion as ofDecember 31, 2015 and 2014, respectively, including approximately nil and $0.6 billion, respectively, from Delta.
(c) Includes restricted cash of approximately $155 million and $64 million as of December 31, 2015 and 2014, respectively, which is primarily heldfor coupon and certain asset-backed securitization maturities.
GOODWILL
The changes in the carrying amount of goodwill reported in the Company’s reportable operating segments andCorporate & Other were as follows:
(Millions) USCS ICS GCS GNMSCorporate
& Other Total
Balance as of January 1, 2014 . . . . . . . . . . . . . . . . . . . . . . . . . . . . . . . . . . . . $ 174 $1,052 $1,543 $ 160 $ 269 $ 3,198Acquisitions . . . . . . . . . . . . . . . . . . . . . . . . . . . . . . . . . . . . . . . . . . . . . . . . . . . — — — — — —Dispositions . . . . . . . . . . . . . . . . . . . . . . . . . . . . . . . . . . . . . . . . . . . . . . . . . . . — — (102) — — (102)Other, including foreign currency translation . . . . . . . . . . . . . . . . . . . . . . . — (70) — — (2) (72)
Balance as of December 31, 2014 . . . . . . . . . . . . . . . . . . . . . . . . . . . . . . . . $ 174 $ 982 $ 1,441 $ 160 $ 267 $3,024Acquisitions . . . . . . . . . . . . . . . . . . . . . . . . . . . . . . . . . . . . . . . . . . . . . . . . . . . — — — — — —Dispositions . . . . . . . . . . . . . . . . . . . . . . . . . . . . . . . . . . . . . . . . . . . . . . . . . . . — — — — — —Other, including impairment and foreign currency translation (a) . . . . . . — (53) — — (222) (275)
Balance as of December 31, 2015 . . . . . . . . . . . . . . . . . . . . . . . . . . . . . . $174 $ 929 $1,441 $160 $ 45 $2,749
(a) Includes a $219 million impairment charge within Corporate & Other. Refer to Note 2 for additional information.
Accumulated impairment losses were $219 million as of December 31, 2015, and nil as of December 31, 2014 andDecember 31, 2013.
OTHER INTANGIBLE ASSETS
The components of other intangible assets were as follows:
2015 2014
(Millions)
GrossCarryingAmount
AccumulatedAmortization
NetCarryingAmount
GrossCarryingAmount
AccumulatedAmortization
NetCarryingAmount
Customer relationships (a) . . . . . . . . . . . . . . . . . . . . . . . $1,506 $(836) $670 $1,455 $(754) $ 701Other . . . . . . . . . . . . . . . . . . . . . . . . . . . . . . . . . . . . . . . . . 231 (105) 126 255 (102) 153
Total . . . . . . . . . . . . . . . . . . . . . . . . . . . . . . . . . . . . . . . . . $ 1,737 $(941) $796 $ 1,710 $(856) $854
(a) Includes net intangibles related to airline partners of $255 million and $340 million as of December 31, 2015 and 2014, respectively, includingapproximately $165 million and $206 million, respectively, related to Delta.
123
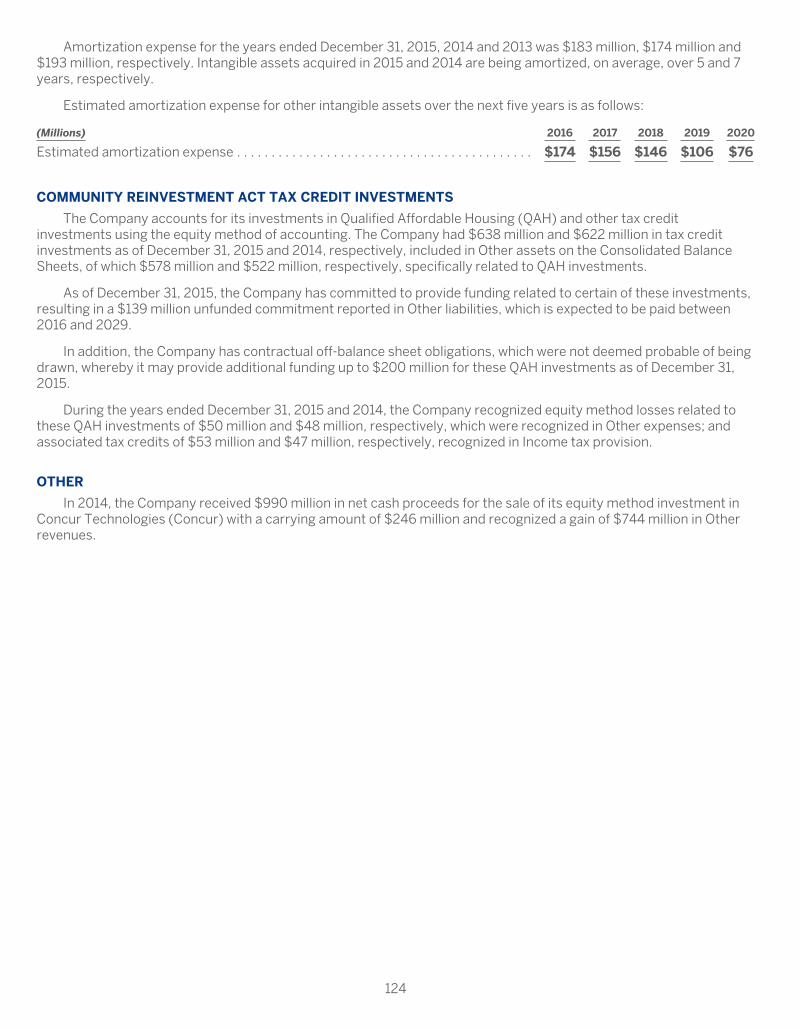
Amortization expense for the years ended December 31, 2015, 2014 and 2013 was $183 million, $174 million and$193 million, respectively. Intangible assets acquired in 2015 and 2014 are being amortized, on average, over 5 and 7years, respectively.
Estimated amortization expense for other intangible assets over the next five years is as follows:
(Millions) 2016 2017 2018 2019 2020
Estimated amortization expense . . . . . . . . . . . . . . . . . . . . . . . . . . . . . . . . . . . . . . . . . . . $174 $156 $146 $106 $76
COMMUNITY REINVESTMENT ACT TAX CREDIT INVESTMENTS
The Company accounts for its investments in Qualified Affordable Housing (QAH) and other tax creditinvestments using the equity method of accounting. The Company had $638 million and $622 million in tax creditinvestments as of December 31, 2015 and 2014, respectively, included in Other assets on the Consolidated BalanceSheets, of which $578 million and $522 million, respectively, specifically related to QAH investments.
As of December 31, 2015, the Company has committed to provide funding related to certain of these investments,resulting in a $139 million unfunded commitment reported in Other liabilities, which is expected to be paid between2016 and 2029.
In addition, the Company has contractual off-balance sheet obligations, which were not deemed probable of beingdrawn, whereby it may provide additional funding up to $200 million for these QAH investments as of December 31,2015.
During the years ended December 31, 2015 and 2014, the Company recognized equity method losses related tothese QAH investments of $50 million and $48 million, respectively, which were recognized in Other expenses; andassociated tax credits of $53 million and $47 million, respectively, recognized in Income tax provision.
OTHER
In 2014, the Company received $990 million in net cash proceeds for the sale of its equity method investment inConcur Technologies (Concur) with a carrying amount of $246 million and recognized a gain of $744 million in Otherrevenues.
124

NOTE 8
CUSTOMER DEPOSITSAs of December 31, customer deposits were categorized as interest-bearing or non-interest-bearing as follows:
(Millions) 2015 2014
U.S.:Interest-bearing . . . . . . . . . . . . . . . . . . . . . . . . . . . . . . . . . . . . . . . . . . . . . . . . . . . . . . . . . . . . . . . . . . . . . . $54,102 $43,279Non-interest-bearing (includes Card Member credit balances of: 2015, $389 million; 2014, $372 million) . . . 478 418
Non-U.S.:Interest-bearing . . . . . . . . . . . . . . . . . . . . . . . . . . . . . . . . . . . . . . . . . . . . . . . . . . . . . . . . . . . . . . . . . . . . . . 82 115Non-interest-bearing (includes Card Member credit balances of: 2015, $323 million; 2014, $347 million) . . . 335 359
Total customer deposits . . . . . . . . . . . . . . . . . . . . . . . . . . . . . . . . . . . . . . . . . . . . . . . . . . . . . . . . . . . . . . . . . $54,997 $ 44,171
Customer deposits by deposit type as of December 31 were as follows:
(Millions) 2015 2014
U.S. retail deposits:Savings accounts — Direct . . . . . . . . . . . . . . . . . . . . . . . . . . . . . . . . . . . . . . . . . . . . . . . . . . . . . . . . . . . . . $29,023 $26,159Certificates of deposit:
Direct . . . . . . . . . . . . . . . . . . . . . . . . . . . . . . . . . . . . . . . . . . . . . . . . . . . . . . . . . . . . . . . . . . . . . . . . . . . . . 281 333Third-party (brokered) . . . . . . . . . . . . . . . . . . . . . . . . . . . . . . . . . . . . . . . . . . . . . . . . . . . . . . . . . . . . . . 13,856 7,838
Sweep accounts —Third-party (brokered) . . . . . . . . . . . . . . . . . . . . . . . . . . . . . . . . . . . . . . . . . . . . . . . . 10,942 8,949Other retail deposits:
Non-U.S. deposits and U.S. non-interest bearing deposits . . . . . . . . . . . . . . . . . . . . . . . . . . . . . . . . . . 183 173Card Member credit balances — U.S. and non-U.S. . . . . . . . . . . . . . . . . . . . . . . . . . . . . . . . . . . . . . . . . . . 712 719
Total customer deposits . . . . . . . . . . . . . . . . . . . . . . . . . . . . . . . . . . . . . . . . . . . . . . . . . . . . . . . . . . . . . . . . . $54,997 $ 44,171
The scheduled maturities of certificates of deposit as of December 31, 2015 were as follows:
(Millions) U.S. Non-U.S. Total
2016 . . . . . . . . . . . . . . . . . . . . . . . . . . . . . . . . . . . . . . . . . . . . . . . . . . . . . . . . . . . . . . . . . . . . . . . . $ 2,486 $ 7 $ 2,4932017 . . . . . . . . . . . . . . . . . . . . . . . . . . . . . . . . . . . . . . . . . . . . . . . . . . . . . . . . . . . . . . . . . . . . . . . . 3,630 — 3,6302018 . . . . . . . . . . . . . . . . . . . . . . . . . . . . . . . . . . . . . . . . . . . . . . . . . . . . . . . . . . . . . . . . . . . . . . . . 3,180 — 3,1802019 . . . . . . . . . . . . . . . . . . . . . . . . . . . . . . . . . . . . . . . . . . . . . . . . . . . . . . . . . . . . . . . . . . . . . . . . 2,326 — 2,3262020 . . . . . . . . . . . . . . . . . . . . . . . . . . . . . . . . . . . . . . . . . . . . . . . . . . . . . . . . . . . . . . . . . . . . . . . 2,515 — 2,515
Total . . . . . . . . . . . . . . . . . . . . . . . . . . . . . . . . . . . . . . . . . . . . . . . . . . . . . . . . . . . . . . . . . . . . . . . . $14,137 $ 7 $14,144
As of December 31, certificates of deposit in denominations of $250,000 or more, in the aggregate, were asfollows:
(Millions) 2015 2014
U.S. . . . . . . . . . . . . . . . . . . . . . . . . . . . . . . . . . . . . . . . . . . . . . . . . . . . . . . . . . . . . . . . . . . . . . . . . . . . . . . . . . . . . . . . $105 $ 111Non-U.S. . . . . . . . . . . . . . . . . . . . . . . . . . . . . . . . . . . . . . . . . . . . . . . . . . . . . . . . . . . . . . . . . . . . . . . . . . . . . . . . . . . 1 17
Total . . . . . . . . . . . . . . . . . . . . . . . . . . . . . . . . . . . . . . . . . . . . . . . . . . . . . . . . . . . . . . . . . . . . . . . . . . . . . . . . . . . . . . $106 $128
125

NOTE 9
DEBT
SHORT-TERM BORROWINGS
The Company’s short-term borrowings outstanding, defined as borrowings with original contractual maturitydates of less than one year, as of December 31 were as follows:
2015 2014
(Millions, except percentages)Outstanding
BalanceYear-End StatedRate on Debt (a)
OutstandingBalance
Year-End StatedRate on Debt (a)
Commercial paper . . . . . . . . . . . . . . . . . . . . . . . . . . . . . . . . . . . $ 2,120 0.38% $ 769 0.29%Other short-term borrowings (b)(c) . . . . . . . . . . . . . . . . . . . . . . 2,692 1.11 2,711 0.81
Total . . . . . . . . . . . . . . . . . . . . . . . . . . . . . . . . . . . . . . . . . . . . . . . $ 4,812 0.79% $3,480 0.69%
(a) For floating-rate issuances, the stated interest rates are weighted based on the outstanding balances and floating rates in effect as ofDecember 31, 2015 and 2014.
(b) Includes interest-bearing overdrafts with banks of $410 million and $470 million as of December 31, 2015 and 2014, respectively. In addition,balances include a partially drawn secured borrowing facility (maturing on September 15, 2017), certain book overdrafts (i.e., primarily timingdifferences arising in the ordinary course of business), short-term borrowings from banks, as well as interest-bearing amounts due tomerchants in accordance with merchant service agreements. The secured borrowing facility gives the Company the right to sell up to $2.0billion face amount of eligible certificates issued from the Lending Trust.
(c) The Company paid $6.7 million and $7.0 million in fees to maintain the secured borrowing facility in 2015 and 2014, respectively.
126

LONG-TERM DEBT
The Company’s long-term debt outstanding, defined as debt with original contractual maturity dates of one yearor greater, as of December 31 was as follows:
2015 2014
(Millions, except percentages)
OriginalContractual
MaturityDates
OutstandingBalance (a)
Year-EndStated Rate
on Debt (b)
Year-EndEffectiveInterest
Rate withSwaps (b)(c)
OutstandingBalance (a)
Year-EndStated Rate
on Debt (b)
Year-EndEffectiveInterest
Rate withSwaps (b)(c)
American Express Company(Parent Company only)Fixed Rate Senior Notes . . . . . . . . . . . . . . . 2016-2042 $ 7,546 5.15% 4.25% $ 7,535 5.15% 4.20%Floating Rate Senior Notes . . . . . . . . . . . . . 2018 850 0.97 — 850 0.85 —Subordinated Notes (d) . . . . . . . . . . . . . . . . . 2024-2036 1,347 5.39 4.47 1,350 5.39 4.42American Express Credit CorporationFixed Rate Senior Notes . . . . . . . . . . . . . . . 2016-2020 16,469 2.16 1.28 16,260 2.26 1.22Floating Rate Senior Notes . . . . . . . . . . . . . 2016-2020 5,300 0.98 — 4,400 0.82 —Borrowings under Bank Credit Facilities . . . . . . — — — — 3,672 4.25 —American Express Centurion BankFixed Rate Senior Notes . . . . . . . . . . . . . . . 2017 1,319 5.99 4.75 2,089 4.12 3.32Floating Rate Senior Notes . . . . . . . . . . . . . 2018 125 0.81 — 675 0.68 —American Express Bank, FSBFixed Rate Senior Notes . . . . . . . . . . . . . . . 2017 1,000 6.00 — 999 6.00 —Floating Rate Senior Notes . . . . . . . . . . . . . 2017 300 0.62 — 300 0.46 —American Express Charge Trust IIFloating Rate Senior Notes . . . . . . . . . . . . . 2018 2,200 0.67 — 3,700 0.41 —Floating Rate Subordinated Notes . . . . . . . 2018 87 0.97 — 87 0.80 —American Express Lending TrustFixed Rate Senior Notes . . . . . . . . . . . . . . . 2016-2017 4,000 1.35 — 6,100 1.11 —Floating Rate Senior Notes . . . . . . . . . . . . . 2017-2019 7,025 0.82 — 8,876 0.72 —Fixed Rate Subordinated Notes . . . . . . . . . — — — — 300 1.08 —Floating Rate Subordinated Notes . . . . . . . 2017-2019 316 0.97 — 488 0.73 —OtherFixed Rate Instruments (e) . . . . . . . . . . . . . . 2021-2033 29 5.62 — 143 3.09 —Floating Rate Borrowings . . . . . . . . . . . . . . 2016-2019 244 0.66 —% 247 0.59 —%Unamortized Underwriting Fees . . . . . . . . . (96) (116)
Total Long-Term Debt . . . . . . . . . . . . . . . . . $48,061 2.44% $57,955 2.34%
(a) The outstanding balances include (i) unamortized discount and premium, (ii) the impact of movements in exchange rates on foreign currencydenominated debt and (iii) the impact of fair value hedge accounting on certain fixed-rate notes that have been swapped to floating rate throughthe use of interest rate swaps. Under fair value hedge accounting, the outstanding balances on these fixed-rate notes are adjusted to reflect theimpact of changes in fair value due to changes in interest rates. Refer to Note 14 for more details on the Company’s treatment of fair valuehedges.
(b) For floating-rate issuances, the stated and effective interest rates are weighted based on the outstanding balances and floating rates in effect asof December 31, 2015 and 2014.
(c) Effective interest rates are only presented when swaps are in place to hedge the underlying debt.(d) For the $750 million of subordinated debentures issued in 2006 and outstanding as of December 31, 2015, the maturity date will automatically
be extended to September 1, 2066, except in the case of either (i) a prior redemption or (ii) a default. At the Company’s option, thesubordinated debentures are redeemable for cash on or after September 1, 2016, at 100 percent of the principal amounts plus any accrued butunpaid interest.
(e) Includes $29 million and $31 million as of December 31, 2015 and 2014, respectively, related to capitalized lease transactions.
127

As of December 31, 2015 and 2014, the Company had $750 million principal outstanding of SubordinatedDebentures that accrue interest at an annual rate of 6.8 percent until September 1, 2016, and at an annual rate ofthree-month LIBOR plus 2.23 percent thereafter. As noted above, at the Company’s option, these SubordinatedDebentures are redeemable for cash after September 1, 2016 at 100 percent of the principal amount plus any accruedbut unpaid interest. The Company currently intends to exercise this redemption option subject to business and marketconditions. If the Company fails to achieve specified performance measures, it will be required to issue commonshares and apply the net proceeds to make interest payments on these Subordinated Debentures. No dividends on theCompany’s common or preferred shares could be paid until such interest payments are made. The Company wouldfail to meet these specific performance measures if (i) the Company’s tangible common equity is less than 4 percentof total adjusted assets for the most recent quarter or (ii) if the trailing two quarters’ consolidated net income is equalto or less than zero and tangible common equity as of the trigger determination date, and as of the end of the quarterend six months prior, has in each case declined by 10 percent or more from tangible common equity as of the end ofthe quarter 18 months prior to the trigger determination date. The Company met the specified performance measuresin 2015. The Company issued $600 million of 3.6 percent subordinated notes on December 5, 2014 that are senior inright of payment to the outstanding $750 million of Subordinated Debentures.
Aggregate annual maturities on long-term debt obligations (based on contractual maturity or anticipatedredemption dates) as of December 31, 2015 were as follows:
(Millions) 2016 2017 2018 2019 2020 Thereafter Total
American Express Company (Parent Company only) (a) . . $1,350 $ 1,500 $ 3,851 $ 641 $ — $3,147 $ 10,489American Express Credit Corporation . . . . . . . . . . . . . . . . . 4,931 4,900 3,614 4,150 4,150 — 21,745American Express Centurion Bank . . . . . . . . . . . . . . . . . . . — 1,300 125 — — — 1,425American Express Bank, FSB . . . . . . . . . . . . . . . . . . . . . . . . — 1,300 — — — — 1,300American Express Charge Trust II . . . . . . . . . . . . . . . . . . . . — — 2,287 — — — 2,287American Express Lending Trust . . . . . . . . . . . . . . . . . . . . . 500 6,639 2,885 1,317 — — 11,341Other . . . . . . . . . . . . . . . . . . . . . . . . . . . . . . . . . . . . . . . . . . . 33 83 124 4 — 29 273
$6,814 $15,722 $12,886 $ 6,112 $4,150 $3,176 $48,860
Unamortized Underwriting Fees . . . . . . . . . . . . . . . . . . . (96)Unamortized Discount and Premium . . . . . . . . . . . . . . . (890)Impacts due to Fair Value Hedge Accounting . . . . . . . . 187
Total Long-Term Debt . . . . . . . . . . . . . . . . . . . . . . . . . . . . $ 48,061
(a) The Company currently intends to exercise its redemption option related to the $750 million of Subordinated Debentures, subject to businessand market conditions.
As of December 31, 2015, the Company maintained a bank line of credit of $3.0 billion compared to bank lines ofcredit of $6.7 billion as of December 31, 2014. Of the total credit lines, $3.0 billion was undrawn as of bothDecember 31, 2015 and 2014. These undrawn amounts support commercial paper borrowings and contingent fundingneeds. The availability of the credit line is subject to the Company’s compliance with certain financial covenants,principally the maintenance by American Express Credit Corporation (Credco) of a 1.25 ratio of combined earningsand fixed charges, to fixed charges. As of December 31, 2015 and 2014, the Company was not in violation of any of itsdebt covenants.
Additionally, the Company maintained a 3-year committed, revolving, secured borrowing facility that gives theCompany the right to sell up to $3.0 billion face amount of eligible notes issued from the Charge Trust at any timethrough July 15, 2018. As of December 31, 2015 and 2014, $1.0 billion and $2.5 billion, respectively, were drawn on thisfacility.
The Company paid $35.1 million and $49.9 million in fees to maintain these lines in 2015 and 2014, respectively.These committed facilities do not contain material adverse change clauses, which might otherwise preclude borrowingunder the credit facilities, nor are they dependent on the Company’s credit rating.
The Company paid total interest, primarily related to short- and long-term debt, corresponding interest rateswaps and customer deposits, of $1.6 billion, $1.7 billion and $2.0 billion in 2015, 2014 and 2013, respectively.
128

NOTE 10
OTHER LIABILITIESThe following is a summary of Other liabilities as of December 31:
(Millions) 2015 2014
Membership Rewards liability . . . . . . . . . . . . . . . . . . . . . . . . . . . . . . . . . . . . . . . . . . . . . . . . . . . . . . . . . . . $ 6,721 $ 6,521Employee-related liabilities (a) . . . . . . . . . . . . . . . . . . . . . . . . . . . . . . . . . . . . . . . . . . . . . . . . . . . . . . . . . . . . 2,097 2,258Card Member rebate and reward accruals (b) . . . . . . . . . . . . . . . . . . . . . . . . . . . . . . . . . . . . . . . . . . . . . . . 2,238 2,073Deferred card and other fees, net . . . . . . . . . . . . . . . . . . . . . . . . . . . . . . . . . . . . . . . . . . . . . . . . . . . . . . . . 1,343 1,308Book overdraft balances . . . . . . . . . . . . . . . . . . . . . . . . . . . . . . . . . . . . . . . . . . . . . . . . . . . . . . . . . . . . . . . . 409 647Other (c) . . . . . . . . . . . . . . . . . . . . . . . . . . . . . . . . . . . . . . . . . . . . . . . . . . . . . . . . . . . . . . . . . . . . . . . . . . . . . . 4,764 5,044
Total . . . . . . . . . . . . . . . . . . . . . . . . . . . . . . . . . . . . . . . . . . . . . . . . . . . . . . . . . . . . . . . . . . . . . . . . . . . . . . . . . $17,572 $17,851
(a) Employee-related liabilities include employee benefit plan obligations and incentive compensation.(b) Card Member rebate and reward accruals include payments to third-party reward partners and cash-back reward costs.(c) Other includes accruals for general operating expenses, client incentives, merchant rebates, payments to third-party card-issuing partners,
advertising and promotion, restructuring and reengineering reserves, QAH unfunded commitments and derivatives.
MEMBERSHIP REWARDS
The Membership Rewards program allows enrolled Card Members to earn points that can be redeemed for abroad range of rewards including travel, entertainment, retail certificates and merchandise. The Company records abalance sheet liability that represents management’s best estimate of the cost of points earned that are expected tobe redeemed in the future. The weighted average cost (WAC) per point and the Ultimate Redemption Rate (URR) arekey assumptions used to estimate the Membership Rewards liability.
The expense for Membership Rewards points is included in marketing, promotion, rewards and Card Memberservices expenses. The Company periodically evaluates its liability estimation process and assumptions based ondevelopments in redemption patterns, cost per point redeemed, partner contract changes and other factors.
DEFERRED CARD AND OTHER FEES, NET
The carrying amount of deferred card and other fees, net of deferred direct acquisition costs and reserves formembership cancellations as of December 31, was as follows:
(Millions) 2015 2014
Deferred card and other fees (a) . . . . . . . . . . . . . . . . . . . . . . . . . . . . . . . . . . . . . . . . . . . . . . . . . . . . . . . . . . . . $1,652 $ 1,615Deferred direct acquisition costs . . . . . . . . . . . . . . . . . . . . . . . . . . . . . . . . . . . . . . . . . . . . . . . . . . . . . . . . . . (173) (176)Reserves for membership cancellations . . . . . . . . . . . . . . . . . . . . . . . . . . . . . . . . . . . . . . . . . . . . . . . . . . . . (136) (131)
Deferred card and other fees, net . . . . . . . . . . . . . . . . . . . . . . . . . . . . . . . . . . . . . . . . . . . . . . . . . . . . . . . . $1,343 $1,308
(a) Includes deferred fees for Membership Rewards program participants.
129

NOTE 11
STOCK PLANS
STOCK OPTION AND AWARD PROGRAMS
Under the 2007 Incentive Compensation Plan and previously under the 1998 Incentive Compensation Plan,awards may be granted to employees and other key individuals who perform services for the Company and itsparticipating subsidiaries. These awards may be in the form of stock options, restricted stock awards or units (RSAs),portfolio grants (PGs) or other incentives, and similar awards designed to meet the requirements of non-U.S.jurisdictions.
For the Company’s Incentive Compensation Plans, there were a total of 33 million common shares unissued andavailable for grant as of December 31, 2015, and 35 million common shares unissued and available for grant as ofDecember 31, 2014 and 2013, as authorized by the Company’s Board of Directors and shareholders.
A summary of stock option and RSA activity as of December 31, 2015, and changes during the year is presentedbelow:
Stock Options RSAs
(Shares in thousands) Shares
Weighted-Average Exercise
Price Shares
Weighted-Average Grant
Price
Outstanding as of December 31, 2014 (a) . . . . . . . . . . . . . . . . . . . . . . . . 13,416 $ 44.88 7,874 $64.48Granted . . . . . . . . . . . . . . . . . . . . . . . . . . . . . . . . . . . . . . . . . . . . . . . . . . . . 301 83.30 3,069 81.99Exercised/vested . . . . . . . . . . . . . . . . . . . . . . . . . . . . . . . . . . . . . . . . . . . (2,921) 49.96 (3,003) 55.17Forfeited . . . . . . . . . . . . . . . . . . . . . . . . . . . . . . . . . . . . . . . . . . . . . . . . . . . (10) 49.22 (507) 75.99Expired . . . . . . . . . . . . . . . . . . . . . . . . . . . . . . . . . . . . . . . . . . . . . . . . . . . . 34 50.04 — —
Outstanding as of December 31, 2015 . . . . . . . . . . . . . . . . . . . . . . . . . . 10,820 44.60 7,433 $74.67
Options vested and expected to vest as of December 31, 2015 . . . . . 10,820 44.60 — —
Options exercisable as of December 31, 2015 . . . . . . . . . . . . . . . . . . . . 9,809 $ 41.78 — —
(a) Outstanding as of December 31, 2014, includes CEO market-based stock options of 687,000 that were previously disclosed separately.
The Company recognizes the cost of employee stock awards granted in exchange for employee services based onthe grant-date fair value of the award, net of expected forfeitures. Those costs are recognized ratably over the vestingperiod.
STOCK OPTIONS
Each stock option has an exercise price equal to the market price of the Company’s common stock on the date ofgrant and a contractual term of 10 years from the date of grant. Stock options generally vest 100 percent on the thirdanniversary of the grant date.
The weighted-average remaining contractual life and the aggregate intrinsic value (the amount by which the fairvalue of the Company’s stock exceeds the exercise price of the option) of the stock options outstanding, exercisable,vested, and expected to vest as of December 31, 2015, are as follows:
Outstanding ExercisableVested and
Expected to Vest
Weighted-average remaining contractual life (in years) . . . . . . . . . . . . . . . . . . . 3.4 2.9 3.4Aggregate intrinsic value (millions) . . . . . . . . . . . . . . . . . . . . . . . . . . . . . . . . . . . . $279 $273 $279
The intrinsic value of options exercised during 2015, 2014 and 2013 was $87 million, $245 million and $374million, respectively, (based upon the fair value of the Company’s stock price at the date of exercise). Cash receivedfrom the exercise of stock options in 2015, 2014 and 2013 was $146 million, $283 million and $580 million,respectively. The tax benefit realized from income tax deductions from stock option exercises, which was recorded inadditional paid-in capital, in 2015, 2014 and 2013 was $18 million, $54 million and $84 million, respectively.
130

The fair value of each option is estimated on the date of grant using a Black-Scholes-Merton option-pricing model.The following weighted-average assumptions were used for options granted in 2015, 2014 and 2013, the majority ofwhich were options granted in the beginning of each year:
2015 2014 2013
Dividend yield . . . . . . . . . . . . . . . . . . . . . . . . . . . . . . . . . . . . . . . . . . . . . . . . . . . . . . . . . . . . . . 1.1% 1.1% 1.4%Expected volatility (a) . . . . . . . . . . . . . . . . . . . . . . . . . . . . . . . . . . . . . . . . . . . . . . . . . . . . . . . . 37% 38% 39%Risk-free interest rate . . . . . . . . . . . . . . . . . . . . . . . . . . . . . . . . . . . . . . . . . . . . . . . . . . . . . . . 1.7% 2.2% 1.3%Expected life of stock option (in years) (b) . . . . . . . . . . . . . . . . . . . . . . . . . . . . . . . . . . . . . . . 6.7 6.7 6.3Weighted-average fair value per option . . . . . . . . . . . . . . . . . . . . . . . . . . . . . . . . . . . . . . . . $29.20 $32.36 $21.11
(a) The expected volatility is based on both weighted historical and implied volatilities of the Company’s common stock price.(b) In 2015, 2014 and 2013, the expected life of stock options was determined using both historical data and expectations of option exercise
behavior.
RESTRICTED STOCK AWARDS
RSAs are valued based on the stock price on the date of grant, contain either a) service conditions or b) bothservice and performance conditions, and generally vest 25 percent per year beginning with the first anniversary of thegrant date. RSAs containing both service and performance conditions generally vest on the third anniversary of thegrant date, and the number of shares earned depends on the achievement of predetermined Company metrics. AllRSA holders receive non-forfeitable dividends or dividend equivalents. The total fair value of shares vested during2015, 2014 and 2013 was $247 million, $298 million and $336 million, respectively (based upon the Company’s stockprice at the vesting date).
The weighted-average grant date fair value of RSAs granted in 2015, 2014 and 2013, is $81.99, $86.65 and $60.13,respectively.
LIABILITY-BASED AWARDS
Certain employees are awarded PGs and other incentive awards that can be settled with cash or equity shares atthe Company’s discretion and final Compensation and Benefits Committee payout approval. These awards earn valuebased on performance, market and service conditions, and vest over periods of one to three years.
PGs and other incentive awards are generally settled with cash and thus are classified as liabilities; therefore, thefair value is determined at the date of grant and remeasured quarterly as part of compensation expense over thevesting period. Cash paid upon vesting of these awards in 2015, 2014 and 2013 was $74 million, $62 million and $43million, respectively.
Summary of Stock Plan Expense
The components of the Company’s total stock-based compensation expense (net of forfeitures) for the yearsended December 31, are as follows:
(Millions) 2015 2014 2013
Restricted stock awards (a) . . . . . . . . . . . . . . . . . . . . . . . . . . . . . . . . . . . . . . . . . . . . . . . . . . . . . . . . . . . . $190 $ 193 $208Stock options (a) . . . . . . . . . . . . . . . . . . . . . . . . . . . . . . . . . . . . . . . . . . . . . . . . . . . . . . . . . . . . . . . . . . . . . 12 13 23Liability-based awards . . . . . . . . . . . . . . . . . . . . . . . . . . . . . . . . . . . . . . . . . . . . . . . . . . . . . . . . . . . . . . . 32 84 119
Total stock-based compensation expense (b) . . . . . . . . . . . . . . . . . . . . . . . . . . . . . . . . . . . . . . . . . . . . $234 $290 $350
(a) As of December 31, 2015, the total unrecognized compensation cost related to unvested RSAs and options of $214 million and $3 million,respectively, will be recognized ratably over the weighted-average remaining vesting period of 2.1 years and 1.2 years, respectively.
(b) The total income tax benefit recognized in the Consolidated Statements of Income for stock-based compensation arrangements for the yearsended December 31, 2015, 2014 and 2013 was $83 million, $104 million and $127 million, respectively.
131

NOTE 12
RETIREMENT PLANS
DEFINED CONTRIBUTION RETIREMENT PLANS
The Company sponsors defined contribution retirement plans, the principal plan being the Retirement SavingsPlan (RSP), a 401(k) savings plan with a profit-sharing component. The RSP is a tax-qualified retirement plan subjectto the Employee Retirement Income Security Act of 1974 and covers most employees in the United States. The totalexpense for all defined contribution retirement plans globally was $224 million, $272 million and $281 million in 2015,2014 and 2013, respectively.
DEFINED BENEFIT PENSION AND OTHER POSTRETIREMENT BENEFIT PLANS
The Company’s primary defined benefit pension plans that cover certain employees in the United States and UnitedKingdom are closed to new entrants and existing participants do not accrue any additional benefits. Most employeesoutside the United States and United Kingdom are covered by local retirement plans, some of which are funded, whileother employees receive payments at the time of retirement or termination under applicable labor laws or agreements.The Company complies with minimum funding requirements in all countries. The Company sponsors unfunded otherpostretirement benefit plans that provide health care and life insurance to certain retired U.S. employees. The totalexpense for these plans was $23 million, $24 million and $59 million in 2015, 2014 and 2013, respectively.
The Company recognizes the funded status of its defined benefit pension plans and other postretirement benefitplans, measured as the difference between the fair value of the plan assets and the projected benefit obligation, in theConsolidated Balance Sheets. As of December 31, 2015 and 2014, the funded status related to the defined benefitpension plans and other postretirement benefit plans was underfunded by $770 million and $767 million, respectively,and is recorded in Other liabilities.
NOTE 13
COMMITMENTS AND CONTINGENCIES
LEGAL CONTINGENCIES
In the ordinary course of business, the Company and its subsidiaries are subject to various claims, investigations,examinations, pending and potential legal actions, and other matters relating to compliance with laws and regulations(collectively, legal proceedings). The Company discloses its material legal proceedings under “Legal Proceedings”.
The Company has recorded reserves for certain of its outstanding legal proceedings. A reserve is recorded when itis both (a) probable that a loss has occurred and (b) the amount of loss can be reasonably estimated. There may beinstances in which an exposure to loss exceeds the recorded reserve. The Company evaluates, on a quarterly basis,developments in legal proceedings that could cause an increase or decrease in the amount of the reserve that hasbeen previously recorded, or a revision to the disclosed estimated range of possible losses, as applicable.
The Company’s legal proceedings range from cases brought by a single plaintiff to class actions with millions ofputative class members. These legal proceedings involve various lines of business of the Company and a variety ofclaims (including, but not limited to, common law tort, contract, antitrust and consumer protection claims), some ofwhich present novel factual allegations and/or unique legal theories. While some matters pending against theCompany specify the damages claimed by the plaintiff or class, many seek an unspecified amount of damages or areat very early stages of the legal process. Even when the amount of damages claimed against the Company are stated,the claimed amount may be exaggerated and/or unsupported. As a result, some matters have not yet progressedsufficiently through discovery and/or development of important factual information and legal issues to enable theCompany to estimate an amount of loss or a range of possible loss, while other matters have progressed sufficientlysuch that the Company is able to estimate an amount of loss or a range of possible loss.
For those disclosed material legal proceedings where a loss is reasonably possible in future periods, whether inexcess of a related reserve for legal contingencies or where there is no such reserve, and for which the Company isable to estimate a range of possible loss, the current estimated range is zero to $350 million in excess of any reservesrelated to these matters. This range represents management’s estimate based on currently available information anddoes not represent the Company’s maximum loss exposure; actual results may vary significantly. As such proceedingsevolve, including the merchant claims described under “Legal Proceedings,” the Company may need to increase itsrange of possible loss or reserves for legal contingencies.
132

Based on its current knowledge, and taking into consideration its litigation-related liabilities, the Companybelieves it is not a party to, nor are any of its properties the subject of, any legal proceeding that would have a materialadverse effect on the Company’s consolidated financial condition or liquidity. However, in light of the uncertaintiesinvolved in such matters, it is possible that the outcome of legal proceedings, including the possible resolution ofmerchant claims, could have a material impact on the Company’s results of operations.
OTHER COMMITMENTS
The Company also has obligations to make payments under contractual agreements with certain cobrandpartners. The Company expects to fully satisfy these obligations over the remaining term of these agreements as partof the ongoing operations of its business.
As of December 31, 2015, the obligations under such arrangements were as follows:
(Millions)
2016 . . . . . . . . . . . . . . . . . . . . . . . . . . . . . . . . . . . . . . . . . . . . . . . . . . . . . . . . . . . . . . . . . . . . . . . . . . . . . . . . . . . . . . . . . . . . $ 2122017 . . . . . . . . . . . . . . . . . . . . . . . . . . . . . . . . . . . . . . . . . . . . . . . . . . . . . . . . . . . . . . . . . . . . . . . . . . . . . . . . . . . . . . . . . . . . 762018 . . . . . . . . . . . . . . . . . . . . . . . . . . . . . . . . . . . . . . . . . . . . . . . . . . . . . . . . . . . . . . . . . . . . . . . . . . . . . . . . . . . . . . . . . . . . 622019 . . . . . . . . . . . . . . . . . . . . . . . . . . . . . . . . . . . . . . . . . . . . . . . . . . . . . . . . . . . . . . . . . . . . . . . . . . . . . . . . . . . . . . . . . . . . 432020 . . . . . . . . . . . . . . . . . . . . . . . . . . . . . . . . . . . . . . . . . . . . . . . . . . . . . . . . . . . . . . . . . . . . . . . . . . . . . . . . . . . . . . . . . . . . 20Thereafter . . . . . . . . . . . . . . . . . . . . . . . . . . . . . . . . . . . . . . . . . . . . . . . . . . . . . . . . . . . . . . . . . . . . . . . . . . . . . . . . . . . . . . . 204
Total . . . . . . . . . . . . . . . . . . . . . . . . . . . . . . . . . . . . . . . . . . . . . . . . . . . . . . . . . . . . . . . . . . . . . . . . . . . . . . . . . . . . . . . . . . . . $ 617
The Company leases certain facilities and equipment under non-cancelable and cancelable agreements, for whichtotal rental expense was $187 million, $237 million and $281 million in 2015, 2014 and 2013, respectively.
As of December 31, 2015, the minimum aggregate rental commitment under all non-cancelable operating leases(net of subleases of $37 million) was as follows:
(Millions)
2016 . . . . . . . . . . . . . . . . . . . . . . . . . . . . . . . . . . . . . . . . . . . . . . . . . . . . . . . . . . . . . . . . . . . . . . . . . . . . . . . . . . . . . . . . . . . $ 1652017 . . . . . . . . . . . . . . . . . . . . . . . . . . . . . . . . . . . . . . . . . . . . . . . . . . . . . . . . . . . . . . . . . . . . . . . . . . . . . . . . . . . . . . . . . . . 1492018 . . . . . . . . . . . . . . . . . . . . . . . . . . . . . . . . . . . . . . . . . . . . . . . . . . . . . . . . . . . . . . . . . . . . . . . . . . . . . . . . . . . . . . . . . . . 1292019 . . . . . . . . . . . . . . . . . . . . . . . . . . . . . . . . . . . . . . . . . . . . . . . . . . . . . . . . . . . . . . . . . . . . . . . . . . . . . . . . . . . . . . . . . . . 1052020 . . . . . . . . . . . . . . . . . . . . . . . . . . . . . . . . . . . . . . . . . . . . . . . . . . . . . . . . . . . . . . . . . . . . . . . . . . . . . . . . . . . . . . . . . . 82Thereafter . . . . . . . . . . . . . . . . . . . . . . . . . . . . . . . . . . . . . . . . . . . . . . . . . . . . . . . . . . . . . . . . . . . . . . . . . . . . . . . . . . . . . . 863
Total . . . . . . . . . . . . . . . . . . . . . . . . . . . . . . . . . . . . . . . . . . . . . . . . . . . . . . . . . . . . . . . . . . . . . . . . . . . . . . . . . . . . . . . . . . $1,493
As of December 31, 2015, the Company’s future minimum lease payments under capital leases or other similararrangements is approximately $4 million in 2016 through 2020, and $14 million thereafter.
133

NOTE 14
DERIVATIVES AND HEDGING ACTIVITIESThe Company uses derivative financial instruments (derivatives) to manage exposures to various market risks. These
instruments derive their value from an underlying variable or multiple variables, including interest rates, foreign exchangerates, and equity index or price, and are carried at fair value on the Consolidated Balance Sheets. These instruments enableend users to increase, reduce or alter exposure to various market risks and, for that reason, are an integral component of theCompany’s market risk management. The Company does not transact in derivatives for trading purposes.
Market risk is the risk to earnings or asset and liability values resulting from movements in market prices. The Company’smarket risk exposures include:
• Interest rate risk due to changes in the relationship between interest rates on the Company’s assets (such as loans,receivables and investment securities) and interest rates on the Company’s liabilities (such as debt and deposits); and
• Foreign exchange risk related to earnings, funding, transactions and investments in currencies other than the U.S.dollar.
The Company centrally monitors market risks using market risk limits and escalation triggers as defined in its Asset/Liability Management Policy. The Company’s market exposures are in large part byproducts of the delivery of its productsand services.
Interest rate risk primarily arises through the funding of Card Member receivables and fixed-rate loans with variable-rate borrowings, as well as through the risk to net interest margin from changes in the relationship between benchmarkrates such as Prime and LIBOR. Interest rate exposure within the Company’s charge card and fixed-rate lending products ismanaged by varying the proportion of total funding provided by short-term and variable-rate debt and deposits comparedto fixed-rate debt and deposits. In addition, interest rate swaps are used from time to time to economically convert fixed-rate debt obligations to variable-rate obligations, or to convert variable-rate debt obligations to fixed-rate obligations. TheCompany may change the mix between variable-rate and fixed-rate funding based on changes in business volumes and mix,among other factors. As of December 31, 2015 and 2014, the Company did not have any designated cash flow hedges.
Foreign exchange risk is generated by Card Member cross-currency charges, foreign currency balance sheetexposures, foreign subsidiary equity and foreign currency earnings in entities outside the United States. The Company’sforeign exchange risk is managed primarily by entering into agreements to buy and sell currencies on a spot basis or byhedging this market exposure, to the extent it is economically justified, through various means, including the use ofderivatives such as foreign exchange forwards and cross-currency swap contracts.
In addition to the exposures mentioned previously, effective August 1, 2011, the Company entered into a total returncontract (TRC) to hedge its exposure to changes in the fair value of its equity investment in ICBC in local currency. Underthe terms of the TRC, the Company received from the TRC counterparty an amount equivalent to any reduction in the fairvalue of its investment in ICBC in local currency, and the Company paid to the TRC counterparty an amount equivalent toany increase in the fair value of its investment in local currency, along with all dividends paid by ICBC, as well as ongoinghedge costs. The TRC was fully unwound on July 18, 2014 upon the sale of the remaining underlying ICBC shares.
Derivatives may give rise to counterparty credit risk, which is the risk that a derivative counterparty will default on, orotherwise be unable to perform pursuant to, an uncollateralized derivative exposure. The Company manages this risk byconsidering the current exposure, which is the replacement cost of contracts on the measurement date, as well asestimating the maximum potential value of the contracts over the next 12 months, considering such factors as the volatilityof the underlying or reference index. To mitigate derivative credit risk, counterparties are required to be pre-approved bythe Company and rated as investment grade, and counterparty risk exposures are centrally monitored.
Additionally, in order to mitigate the bilateral counterparty credit risk associated with derivatives, the Company has incertain instances entered into master netting agreements with its derivative counterparties, which provide a right of offsetfor certain exposures between the parties. A majority of the Company’s derivative assets and liabilities as of December 31,2015 and 2014 are subject to such master netting agreements with its derivative counterparties, and there are no instancesin which management makes an accounting policy election to not net assets and liabilities subject to an enforceable masternetting agreement on the Company’s Consolidated Balance Sheets. To further mitigate bilateral counterparty credit risk,the Company exercises its rights under executed credit support agreements with certain of its derivative counterparties.These agreements require that, in the event the fair value change in the net derivatives position between the two partiesexceeds certain dollar thresholds, the party in the net liability position posts collateral to its counterparty. All derivativecontracts cleared through a central clearinghouse are collateralized to the full amount of the fair value of the contracts.
134
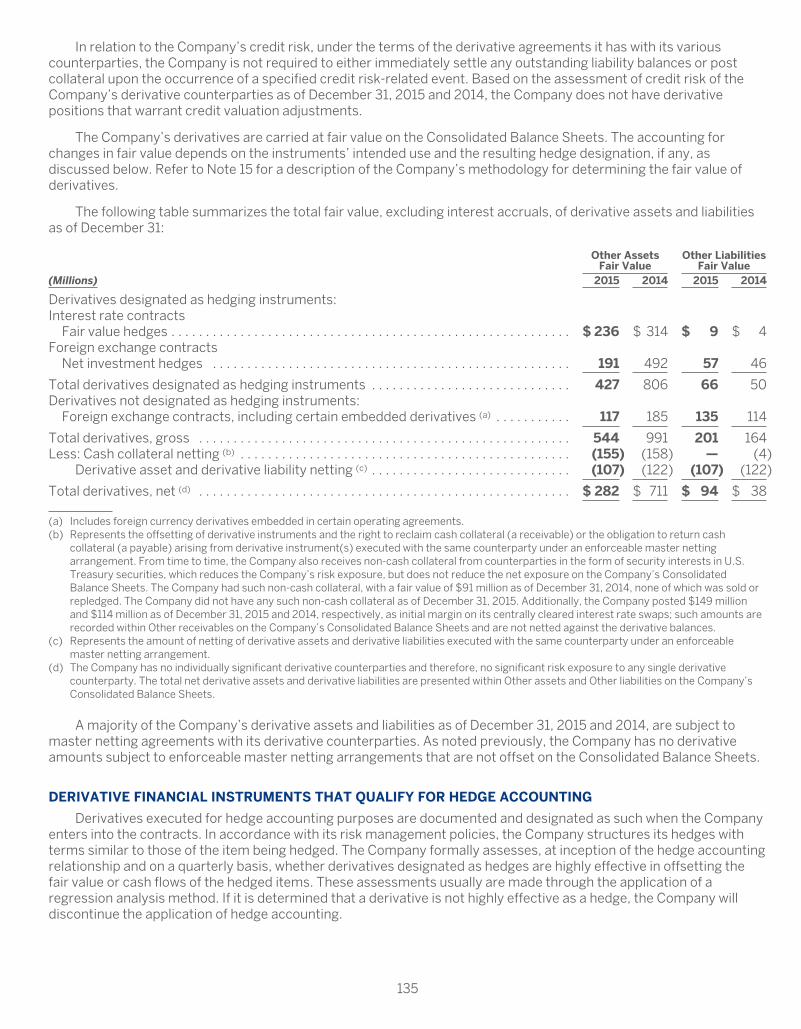
In relation to the Company’s credit risk, under the terms of the derivative agreements it has with its variouscounterparties, the Company is not required to either immediately settle any outstanding liability balances or postcollateral upon the occurrence of a specified credit risk-related event. Based on the assessment of credit risk of theCompany’s derivative counterparties as of December 31, 2015 and 2014, the Company does not have derivativepositions that warrant credit valuation adjustments.
The Company’s derivatives are carried at fair value on the Consolidated Balance Sheets. The accounting forchanges in fair value depends on the instruments’ intended use and the resulting hedge designation, if any, asdiscussed below. Refer to Note 15 for a description of the Company’s methodology for determining the fair value ofderivatives.
The following table summarizes the total fair value, excluding interest accruals, of derivative assets and liabilitiesas of December 31:
Other AssetsFair Value
Other LiabilitiesFair Value
(Millions) 2015 2014 2015 2014
Derivatives designated as hedging instruments:Interest rate contracts
Fair value hedges . . . . . . . . . . . . . . . . . . . . . . . . . . . . . . . . . . . . . . . . . . . . . . . . . . . . . . . . . . $ 236 $ 314 $ 9 $ 4Foreign exchange contracts
Net investment hedges . . . . . . . . . . . . . . . . . . . . . . . . . . . . . . . . . . . . . . . . . . . . . . . . . . . . 191 492 57 46
Total derivatives designated as hedging instruments . . . . . . . . . . . . . . . . . . . . . . . . . . . . . 427 806 66 50Derivatives not designated as hedging instruments:
Foreign exchange contracts, including certain embedded derivatives (a) . . . . . . . . . . . 117 185 135 114
Total derivatives, gross . . . . . . . . . . . . . . . . . . . . . . . . . . . . . . . . . . . . . . . . . . . . . . . . . . . . . . 544 991 201 164Less: Cash collateral netting (b) . . . . . . . . . . . . . . . . . . . . . . . . . . . . . . . . . . . . . . . . . . . . . . . . (155) (158) — (4)
Derivative asset and derivative liability netting (c) . . . . . . . . . . . . . . . . . . . . . . . . . . . . . (107) (122) (107) (122)
Total derivatives, net (d) . . . . . . . . . . . . . . . . . . . . . . . . . . . . . . . . . . . . . . . . . . . . . . . . . . . . . . $ 282 $ 711 $ 94 $ 38
(a) Includes foreign currency derivatives embedded in certain operating agreements.(b) Represents the offsetting of derivative instruments and the right to reclaim cash collateral (a receivable) or the obligation to return cash
collateral (a payable) arising from derivative instrument(s) executed with the same counterparty under an enforceable master nettingarrangement. From time to time, the Company also receives non-cash collateral from counterparties in the form of security interests in U.S.Treasury securities, which reduces the Company’s risk exposure, but does not reduce the net exposure on the Company’s ConsolidatedBalance Sheets. The Company had such non-cash collateral, with a fair value of $91 million as of December 31, 2014, none of which was sold orrepledged. The Company did not have any such non-cash collateral as of December 31, 2015. Additionally, the Company posted $149 millionand $114 million as of December 31, 2015 and 2014, respectively, as initial margin on its centrally cleared interest rate swaps; such amounts arerecorded within Other receivables on the Company’s Consolidated Balance Sheets and are not netted against the derivative balances.
(c) Represents the amount of netting of derivative assets and derivative liabilities executed with the same counterparty under an enforceablemaster netting arrangement.
(d) The Company has no individually significant derivative counterparties and therefore, no significant risk exposure to any single derivativecounterparty. The total net derivative assets and derivative liabilities are presented within Other assets and Other liabilities on the Company’sConsolidated Balance Sheets.
A majority of the Company’s derivative assets and liabilities as of December 31, 2015 and 2014, are subject tomaster netting agreements with its derivative counterparties. As noted previously, the Company has no derivativeamounts subject to enforceable master netting arrangements that are not offset on the Consolidated Balance Sheets.
DERIVATIVE FINANCIAL INSTRUMENTS THAT QUALIFY FOR HEDGE ACCOUNTING
Derivatives executed for hedge accounting purposes are documented and designated as such when the Companyenters into the contracts. In accordance with its risk management policies, the Company structures its hedges withterms similar to those of the item being hedged. The Company formally assesses, at inception of the hedge accountingrelationship and on a quarterly basis, whether derivatives designated as hedges are highly effective in offsetting thefair value or cash flows of the hedged items. These assessments usually are made through the application of aregression analysis method. If it is determined that a derivative is not highly effective as a hedge, the Company willdiscontinue the application of hedge accounting.
135

FAIR VALUE HEDGES
A fair value hedge involves a derivative designated to hedge the Company’s exposure to future changes in the fairvalue of an asset or a liability, or an identified portion thereof, that is attributable to a particular risk.
Interest Rate Contracts
The Company is exposed to interest rate risk associated with its fixed-rate long-term debt. The Company usesinterest rate swaps to economically convert certain fixed-rate debt obligations to floating-rate obligations at the timeof issuance. As of December 31, 2015 and 2014, the Company hedged $18.8 billion and $17.6 billion, respectively, of itsfixed-rate debt to floating-rate debt using interest rate swaps.
To the extent the fair value hedge is effective, the gain or loss on the hedging instrument offsets the loss or gain onthe hedged item attributable to the hedged risk. Any difference between the changes in the fair value of the derivativeand the hedged item is referred to as hedge ineffectiveness and is reflected in earnings as a component of Otherexpenses. Hedge ineffectiveness may be caused by differences between a debt instrument’s interest coupon and thebenchmark rate, primarily due to credit spreads at inception of the hedging relationship that are not reflected in thevaluation of the interest rate swap. Furthermore, hedge ineffectiveness may be caused by changes in the relationshipbetween 3-month LIBOR and 1-month LIBOR, as well as between the overnight indexed swap rate (OIS) and 1-monthLIBOR, as spreads between these rates may impact the valuation of the interest rate swap without causing anoffsetting impact in the value of the hedged debt.
If a fair value hedge is de-designated or no longer considered to be effective, changes in fair value of the derivativecontinue to be recorded through earnings but the hedged asset or liability is no longer adjusted for changes in fairvalue resulting from changes in interest rates. The existing basis adjustment of the hedged asset or liability isamortized or accreted as an adjustment to yield over the remaining life of that asset or liability.
Total Return Contract
The Company hedged its exposure to changes in the fair value of its equity investment in ICBC in local currency.The Company used a TRC to transfer its exposure to its derivative counterparty. On July 18, 2014, the Company soldits remaining shares in ICBC and terminated the TRC.
The following table summarizes the impact on the Consolidated Statements of Income associated with theCompany’s fair value hedges of its fixed-rate long-term debt and its investment in ICBC for the years endedDecember 31:
Gains (losses) recognized in income(Millions) Derivative contract Hedged item Net hedge
ineffectivenessIncome StatementLine Item
Amount Income StatementLine Item
AmountDerivative relationship 2015 2014 2013 2015 2014 2013 2015 2014 2013
Interest rate contracts . . Other expenses $(83) $(143) $(370) Other expenses $93 $148 $351 $10 $ 5 $(19)Total return contract . . . Other non-interest
revenues $ — $ 11 $ 15Other non-interestrevenues $ — $ (11) $ (15) $ — $— $ —
The Company also recognized a net reduction in interest expense on long-term debt of $284 million, $283 millionand $346 million for the years ended December 31, 2015, 2014 and 2013, respectively, primarily related to the netsettlements (interest accruals) on the Company’s interest rate derivatives designated as fair value hedges.
136

NET INVESTMENT HEDGES
A net investment hedge is used to hedge future changes in currency exposure of a net investment in a foreignoperation. The Company primarily designates foreign currency derivatives, typically foreign exchange forwards, andon occasion foreign currency denominated debt, as hedges of net investments in certain foreign operations. Theseinstruments reduce exposure to changes in currency exchange rates on the Company’s investments in non-U.S.subsidiaries. The effective portion of the gain on net investment hedges, net of taxes, recorded in Accumulated OtherComprehensive Income (Loss) as part of the cumulative translation adjustment, was $577 million, $455 million and$253 million for the years ended 2015, 2014 and 2013, respectively, with any ineffective portion recognized in Otherexpenses during the period of change.
Gains (losses) recognized in incomeAmount reclassified from AOCI into income Net hedge ineffectiveness
Description (Millions) Income Statement Line Item 2015 2014 2013 Income Statement Line Item 2015 2014 2013
Net investment hedges:Foreign exchange contracts . . . Other expenses $— $10 $— Other expenses $1 $— $—
DERIVATIVES NOT DESIGNATED AS HEDGES
The Company has derivatives that act as economic hedges, but are not designated as such for hedge accountingpurposes. Foreign currency transactions and non-U.S. dollar cash flow exposures from time to time may be partially orfully economically hedged through foreign currency contracts, primarily foreign exchange forwards, options andcross-currency swaps. These hedges generally mature within one year. Foreign currency contracts involve thepurchase and sale of designated currencies at an agreed upon rate for settlement on a specified date. The changes inthe fair value of the derivatives effectively offset the related foreign exchange gains or losses on the underlying balancesheet exposures. From time to time, the Company also may enter into interest rate swaps to specifically managefunding costs related to its proprietary card business.
The Company also has certain operating agreements containing payments that may be linked to a market rate orprice, primarily foreign currency rates. The payment components of these agreements may meet the definition of anembedded derivative, in which case the embedded derivative is accounted for separately and is classified as a foreignexchange contract based on its primary risk exposure.
For derivatives that are not designated as hedges, changes in fair value are reported in current period earnings.
The following table summarizes the impact on the Consolidated Statements of Income associated with theCompany’s derivatives not designated as hedges for the years ended December 31:
Pretax gains (losses)Amount
Description (Millions) Income Statement Line Item 2015 2014 2013
Interest rate contracts . . . . . . . . . . . . . . . . . . . . . . Other expenses $ — $ — $ 1Foreign exchange contracts (a) . . . . . . . . . . . . . . . . Other expenses (39) 194 72
Cost of Card Member services 5 4 —
Total . . . . . . . . . . . . . . . . . . . . . . . . . . . . . . . . . . . . . $(34) $198 $73
(a) Foreign exchange contracts include forwards and embedded foreign currency derivatives.
137
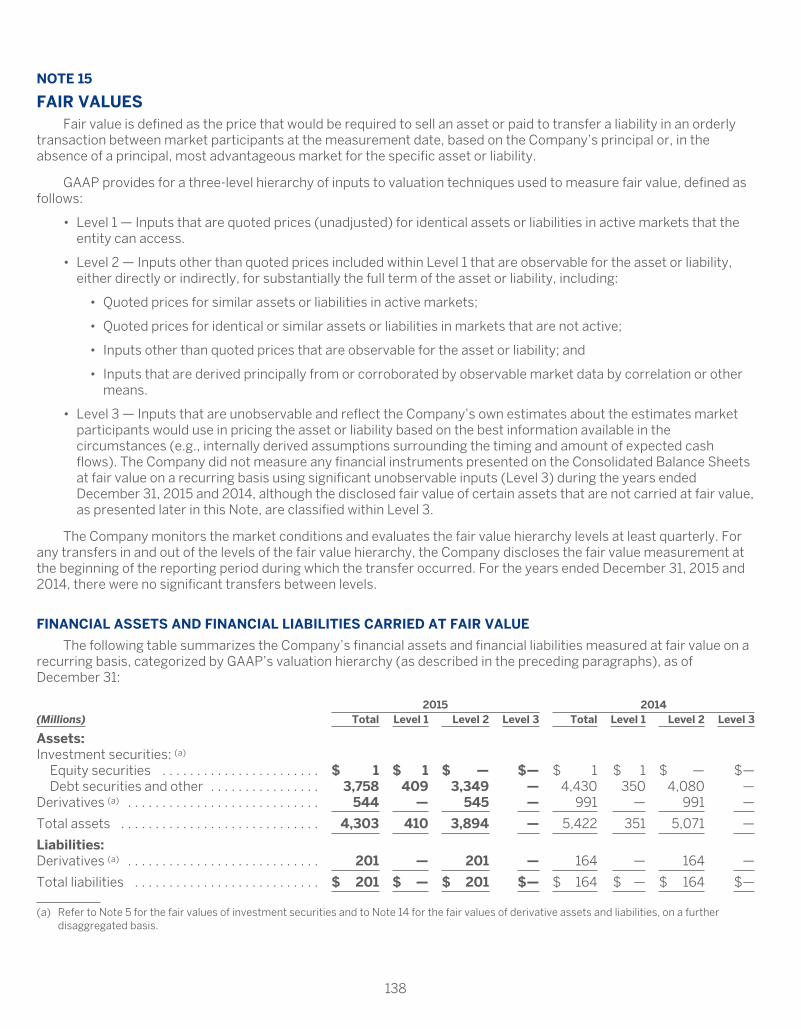
NOTE 15
FAIR VALUESFair value is defined as the price that would be required to sell an asset or paid to transfer a liability in an orderly
transaction between market participants at the measurement date, based on the Company’s principal or, in theabsence of a principal, most advantageous market for the specific asset or liability.
GAAP provides for a three-level hierarchy of inputs to valuation techniques used to measure fair value, defined asfollows:
• Level 1 — Inputs that are quoted prices (unadjusted) for identical assets or liabilities in active markets that theentity can access.
• Level 2 — Inputs other than quoted prices included within Level 1 that are observable for the asset or liability,either directly or indirectly, for substantially the full term of the asset or liability, including:
• Quoted prices for similar assets or liabilities in active markets;
• Quoted prices for identical or similar assets or liabilities in markets that are not active;
• Inputs other than quoted prices that are observable for the asset or liability; and
• Inputs that are derived principally from or corroborated by observable market data by correlation or othermeans.
• Level 3 — Inputs that are unobservable and reflect the Company’s own estimates about the estimates marketparticipants would use in pricing the asset or liability based on the best information available in thecircumstances (e.g., internally derived assumptions surrounding the timing and amount of expected cashflows). The Company did not measure any financial instruments presented on the Consolidated Balance Sheetsat fair value on a recurring basis using significant unobservable inputs (Level 3) during the years endedDecember 31, 2015 and 2014, although the disclosed fair value of certain assets that are not carried at fair value,as presented later in this Note, are classified within Level 3.
The Company monitors the market conditions and evaluates the fair value hierarchy levels at least quarterly. Forany transfers in and out of the levels of the fair value hierarchy, the Company discloses the fair value measurement atthe beginning of the reporting period during which the transfer occurred. For the years ended December 31, 2015 and2014, there were no significant transfers between levels.
FINANCIAL ASSETS AND FINANCIAL LIABILITIES CARRIED AT FAIR VALUE
The following table summarizes the Company’s financial assets and financial liabilities measured at fair value on arecurring basis, categorized by GAAP’s valuation hierarchy (as described in the preceding paragraphs), as ofDecember 31:
2015 2014(Millions) Total Level 1 Level 2 Level 3 Total Level 1 Level 2 Level 3
Assets:Investment securities: (a)
Equity securities . . . . . . . . . . . . . . . . . . . . . . . $ 1 $ 1 $ — $— $ 1 $ 1 $ — $—Debt securities and other . . . . . . . . . . . . . . . . 3,758 409 3,349 — 4,430 350 4,080 —
Derivatives (a) . . . . . . . . . . . . . . . . . . . . . . . . . . . . 544 — 545 — 991 — 991 —
Total assets . . . . . . . . . . . . . . . . . . . . . . . . . . . . . 4,303 410 3,894 — 5,422 351 5,071 —
Liabilities:Derivatives (a) . . . . . . . . . . . . . . . . . . . . . . . . . . . . 201 — 201 — 164 — 164 —
Total liabilities . . . . . . . . . . . . . . . . . . . . . . . . . . . $ 201 $ — $ 201 $— $ 164 $ — $ 164 $—
(a) Refer to Note 5 for the fair values of investment securities and to Note 14 for the fair values of derivative assets and liabilities, on a furtherdisaggregated basis.
138

VALUATION TECHNIQUES USED IN THE FAIR VALUE MEASUREMENT OF FINANCIAL ASSETS ANDFINANCIAL LIABILITIES CARRIED AT FAIR VALUE
For the financial assets and liabilities measured at fair value on a recurring basis (categorized in the valuationhierarchy table above) the Company applies the following valuation techniques:
Investment Securities
When available, quoted prices of identical investment securities in active markets are used to estimate fair value.Such investment securities are classified within Level 1 of the fair value hierarchy.
When quoted prices of identical investment securities in active markets are not available, the fair values for theCompany’s investment securities are obtained primarily from pricing services engaged by the Company, and theCompany receives one price for each security. The fair values provided by the pricing services are estimated usingpricing models, where the inputs to those models are based on observable market inputs or recent trades of similarsecurities. Such investment securities are classified within Level 2 of the fair value hierarchy. The inputs to thevaluation techniques applied by the pricing services vary depending on the type of security being priced but aretypically benchmark yields, benchmark security prices, credit spreads, prepayment speeds, reported trades andbroker-dealer quotes, all with reasonable levels of transparency. The pricing services did not apply any adjustments tothe pricing models used. In addition, the Company did not apply any adjustments to prices received from the pricingservices.
The Company reaffirms its understanding of the valuation techniques used by its pricing services at least annually.In addition, the Company corroborates the prices provided by its pricing services for reasonableness by comparing theprices from the respective pricing services to valuations obtained from different pricing sources. In instances whereprice discrepancies are identified between different pricing sources, the Company evaluates such discrepancies toensure that the prices used for its valuation represent the fair value of the underlying investment securities. Refer toNote 5 for additional fair value information.
Derivative Financial Instruments
The fair value of the Company’s derivative financial instruments is estimated by third-party valuation services thatuse proprietary pricing models or by internal pricing models, where the inputs to those models are readily observablefrom actively quoted markets. The pricing models used are consistently applied and reflect the contractual terms ofthe derivatives as described below. The Company reaffirms its understanding of the valuation techniques used by thethird-party valuation services at least annually. The Company’s derivative instruments are classified within Level 2 ofthe fair value hierarchy.
The fair value of the Company’s interest rate swaps is determined based on a discounted cash flow method usingthe following significant inputs: the contractual terms of the swap such as the notional amount, fixed coupon rate,floating coupon rate (based on interbank rates consistent with the frequency and currency of the interest cash flows)and tenor, as well as discount rates consistent with the underlying economic factors of the currency in which the cashflows are denominated.
The fair value of foreign exchange forward contracts is determined based on a discounted cash flow method usingthe following significant inputs: the contractual terms of the forward contracts such as the notional amount, maturitydates and contract rate, as well as relevant foreign currency forward curves, and discount rates consistent with theunderlying economic factors of the currency in which the cash flows are denominated.
Credit valuation adjustments are necessary when the market parameters, such as a benchmark curve, used tovalue derivatives are not indicative of the credit quality of the Company or its counterparties. The Company considersthe counterparty credit risk by applying an observable forecasted default rate to the current exposure. Refer to Note14 for additional fair value information.
139

FINANCIAL ASSETS AND FINANCIAL LIABILITIES CARRIED AT OTHER THAN FAIR VALUE
The following table summarizes the estimated fair values of the Company’s financial assets and financial liabilitiesthat are not required to be carried at fair value on a recurring basis, as of December 31, 2015 and 2014. The fair valuesof these financial instruments are estimates based upon the market conditions and perceived risks as of December 31,2015 and 2014, and require management judgment. These figures may not be indicative of future fair values, nor canthe fair value of the Company be estimated by aggregating the amounts presented.
CarryingValue
Corresponding Fair Value Amount2015 (Billions) Total Level 1 Level 2 Level 3
Financial Assets:Financial assets for which carrying values equal or approximate fair
valueCash and cash equivalents . . . . . . . . . . . . . . . . . . . . . . . . . . . . . . . . . . . . . $23 $23 $22 $ 1(a) $ —Other financial assets (b) . . . . . . . . . . . . . . . . . . . . . . . . . . . . . . . . . . . . . . . 47 47 — 47 —
Financial assets carried at other than fair valueCard Member loans and receivables HFS (d) . . . . . . . . . . . . . . . . . . . . . . 15 15 — — 15Loans, net . . . . . . . . . . . . . . . . . . . . . . . . . . . . . . . . . . . . . . . . . . . . . . . . . . . 59 60(c) — — 60
Financial Liabilities:Financial liabilities for which carrying values equal or approximate fair
value . . . . . . . . . . . . . . . . . . . . . . . . . . . . . . . . . . . . . . . . . . . . . . . . . . . . . . . 67 67 — 67 —Financial liabilities carried at other than fair value
Certificates of deposit (e) . . . . . . . . . . . . . . . . . . . . . . . . . . . . . . . . . . . . . . 14 14 — 14 —Long-term debt . . . . . . . . . . . . . . . . . . . . . . . . . . . . . . . . . . . . . . . . . . . . . . $48 $49(c) $ — $49 $ —
CarryingValue
Corresponding Fair Value Amount2014 (Billions) Total Level 1 Level 2 Level 3
Financial Assets:Financial assets for which carrying values equal or approximate fair
valueCash and cash equivalents . . . . . . . . . . . . . . . . . . . . . . . . . . . . . . . . . . . . . $22 $22 $21 $ 1(a) $—Other financial assets (b) . . . . . . . . . . . . . . . . . . . . . . . . . . . . . . . . . . . . . . . 48 48 — 48 —
Financial assets carried at other than fair valueLoans, net . . . . . . . . . . . . . . . . . . . . . . . . . . . . . . . . . . . . . . . . . . . . . . . . . . . 70 71(c) — — 71
Financial Liabilities:Financial liabilities for which carrying values equal or approximate fair
value . . . . . . . . . . . . . . . . . . . . . . . . . . . . . . . . . . . . . . . . . . . . . . . . . . . . . . . 61 61 — 61 —Financial liabilities carried at other than fair value
Certificates of deposit (e) . . . . . . . . . . . . . . . . . . . . . . . . . . . . . . . . . . . . . . 8 8 — 8 —Long-term debt . . . . . . . . . . . . . . . . . . . . . . . . . . . . . . . . . . . . . . . . . . . . . . $58 $60(c) $— $60 $—
(a) Reflects time deposits.(b) Includes accounts receivable (including fair values of Card Member receivables of $6.7 billion and $7.0 billion held by a consolidated VIE as of
December 31, 2015 and 2014, respectively), restricted cash and other miscellaneous assets.(c) Includes fair values of Card Member loans of $23.5 billion and $29.9 billion, and long-term debt of $13.6 billion and $19.5 billion held by
consolidated VIEs as of December 31, 2015 and 2014, respectively.(d) Does not include any fair value associated with the Card Member account relationships. Refer to Note 2 for additional information.(e) Presented as a component of customer deposits on the Consolidated Balance Sheets.
The fair values of these financial instruments are estimates based upon the market conditions and perceived risksas of December 31, 2015, and require management judgment. These figures may not be indicative of future fair values.The fair value of the Company cannot be reliably estimated by aggregating the amounts presented.
140

VALUATION TECHNIQUES USED IN THE FAIR VALUE MEASUREMENT OF FINANCIAL ASSETS ANDFINANCIAL LIABILITIES CARRIED AT OTHER THAN FAIR VALUE
For the financial assets and liabilities that are not required to be carried at fair value on a recurring basis(categorized in the valuation hierarchy table) the Company applies the following valuation techniques to measure fairvalue:
Financial Assets For Which Carrying Values Equal Or Approximate Fair Value
Financial assets for which carrying values equal or approximate fair value include cash and cash equivalents, CardMember receivables, accrued interest and certain other assets. For these assets, the carrying values approximate fairvalue because they are short term in duration, have no defined maturity or have a market-based interest rate.
Financial Assets Carried At Other Than Fair Value
Card Member loans and receivables HFS
As described in Note 2, Card Member loans and receivables HFS are recorded at the lower of cost or fair value onthe Consolidated Balance Sheets. As a result, the estimation of fair value included in the previous table does not reflectany fair value associated with the Card Member account relationships and follows the technique described underLoans, net below.
Loans, net
Loans are recorded at historical cost, less reserves, on the Consolidated Balance Sheets. In estimating the fairvalue for the Company’s loans the Company uses a discounted cash flow model. Due to the lack of a comparable wholeloan sales market for similar credit card loans and the lack of observable pricing inputs thereof, the Company usesvarious inputs derived from an equivalent securitization market to estimate fair value. Such inputs include projectedincome (inclusive of future interest payments and late fee revenue), estimated pay-down rates, discount rates andrelevant credit costs. The valuation does not include economic value attributable to future receivables generated bythe accounts associated with the loans.
Financial Liabilities For Which Carrying Values Equal Or Approximate Fair Value
Financial liabilities for which carrying values equal or approximate fair value include accrued interest, customerdeposits (excluding certificates of deposit, which are described further below), Travelers Cheques and other prepaidproducts outstanding, accounts payable, short-term borrowings and certain other liabilities for which the carryingvalues approximate fair value because they are short term in duration, have no defined maturity or have a market-based interest rate.
Financial Liabilities Carried At Other Than Fair Value
Certificates of Deposit
Certificates of deposit (CDs) are recorded at their historical issuance cost on the Consolidated Balance Sheets.Fair value is estimated using a discounted cash flow methodology based on the future cash flows and the discount ratethat reflects the Company’s current rates for similar types of CDs within similar markets.
Long-term Debt
Long-term debt is recorded at historical issuance cost on the Consolidated Balance Sheets adjusted for theimpact of fair value hedge accounting on certain fixed-rate notes and current translation rates for foreign-denominated debt. The fair value of the Company’s long-term debt is measured using quoted offer prices when quotedmarket prices are available. If quoted market prices are not available, the fair value is determined by discounting thefuture cash flows of each instrument at rates currently observed in publicly-traded debt markets for debt of similarterms and credit risk. For long-term debt, where there are no rates currently observable in publicly traded debtmarkets of similar terms and comparable credit risk, the Company uses market interest rates and adjusts those ratesfor necessary risks, including its own credit risk. In determining an appropriate spread to reflect its credit standing, theCompany considers credit default swap spreads, bond yields of other long-term debt offered by the Company, andinterest rates currently offered to the Company for similar debt instruments of comparable maturities.
141
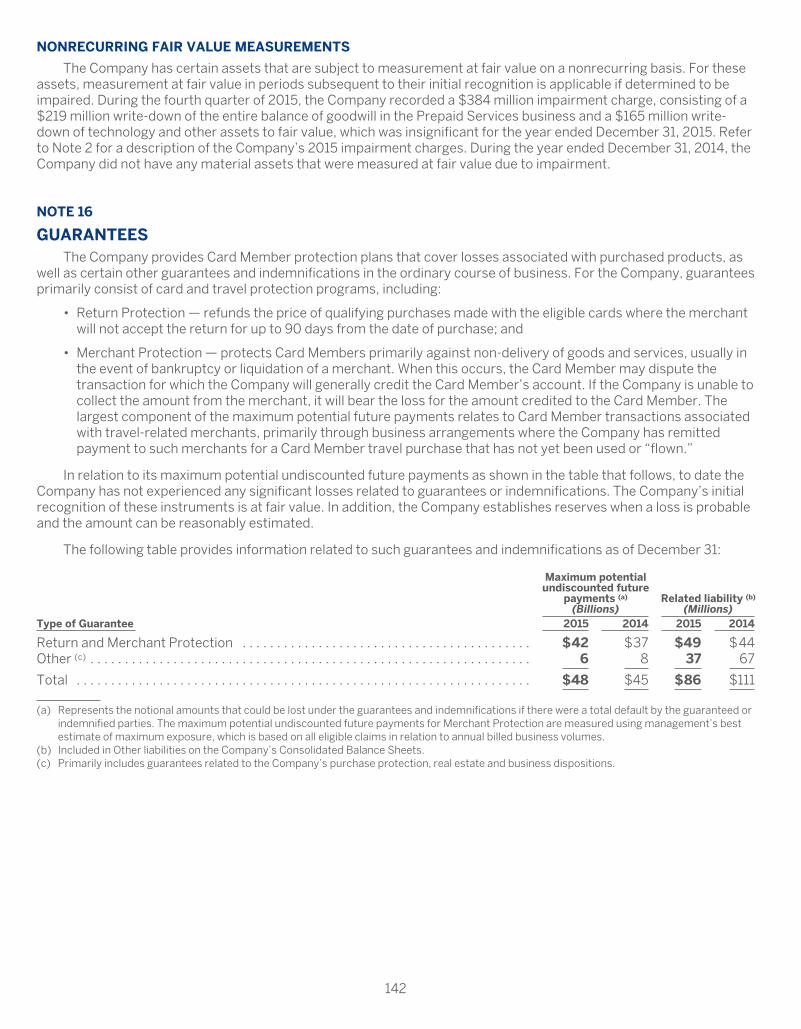
NONRECURRING FAIR VALUE MEASUREMENTS
The Company has certain assets that are subject to measurement at fair value on a nonrecurring basis. For theseassets, measurement at fair value in periods subsequent to their initial recognition is applicable if determined to beimpaired. During the fourth quarter of 2015, the Company recorded a $384 million impairment charge, consisting of a$219 million write-down of the entire balance of goodwill in the Prepaid Services business and a $165 million write-down of technology and other assets to fair value, which was insignificant for the year ended December 31, 2015. Referto Note 2 for a description of the Company’s 2015 impairment charges. During the year ended December 31, 2014, theCompany did not have any material assets that were measured at fair value due to impairment.
NOTE 16
GUARANTEESThe Company provides Card Member protection plans that cover losses associated with purchased products, as
well as certain other guarantees and indemnifications in the ordinary course of business. For the Company, guaranteesprimarily consist of card and travel protection programs, including:
• Return Protection — refunds the price of qualifying purchases made with the eligible cards where the merchantwill not accept the return for up to 90 days from the date of purchase; and
• Merchant Protection — protects Card Members primarily against non-delivery of goods and services, usually inthe event of bankruptcy or liquidation of a merchant. When this occurs, the Card Member may dispute thetransaction for which the Company will generally credit the Card Member’s account. If the Company is unable tocollect the amount from the merchant, it will bear the loss for the amount credited to the Card Member. Thelargest component of the maximum potential future payments relates to Card Member transactions associatedwith travel-related merchants, primarily through business arrangements where the Company has remittedpayment to such merchants for a Card Member travel purchase that has not yet been used or “flown.”
In relation to its maximum potential undiscounted future payments as shown in the table that follows, to date theCompany has not experienced any significant losses related to guarantees or indemnifications. The Company’s initialrecognition of these instruments is at fair value. In addition, the Company establishes reserves when a loss is probableand the amount can be reasonably estimated.
The following table provides information related to such guarantees and indemnifications as of December 31:
Maximum potentialundiscounted future
payments (a)
(Billions)Related liability (b)
(Millions)Type of Guarantee 2015 2014 2015 2014
Return and Merchant Protection . . . . . . . . . . . . . . . . . . . . . . . . . . . . . . . . . . . . . . . . . . $42 $37 $49 $44Other (c) . . . . . . . . . . . . . . . . . . . . . . . . . . . . . . . . . . . . . . . . . . . . . . . . . . . . . . . . . . . . . . . . 6 8 37 67
Total . . . . . . . . . . . . . . . . . . . . . . . . . . . . . . . . . . . . . . . . . . . . . . . . . . . . . . . . . . . . . . . . . . $48 $45 $86 $111
(a) Represents the notional amounts that could be lost under the guarantees and indemnifications if there were a total default by the guaranteed orindemnified parties. The maximum potential undiscounted future payments for Merchant Protection are measured using management’s bestestimate of maximum exposure, which is based on all eligible claims in relation to annual billed business volumes.
(b) Included in Other liabilities on the Company’s Consolidated Balance Sheets.(c) Primarily includes guarantees related to the Company’s purchase protection, real estate and business dispositions.
142
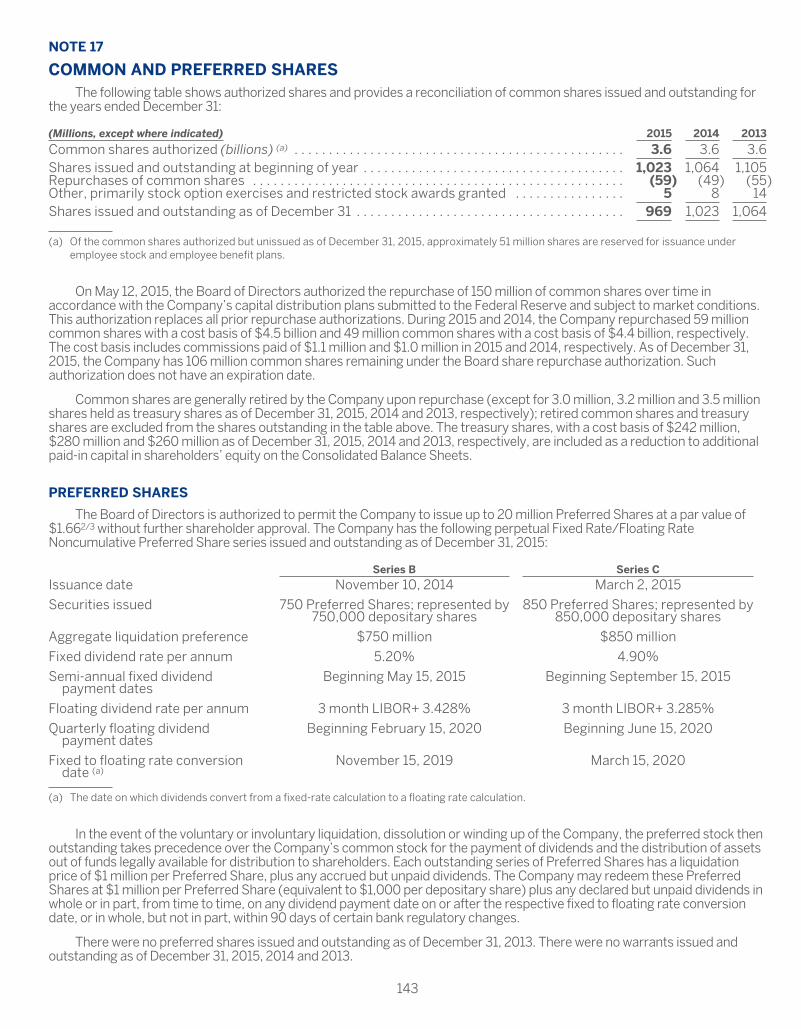
NOTE 17
COMMON AND PREFERRED SHARESThe following table shows authorized shares and provides a reconciliation of common shares issued and outstanding for
the years ended December 31:
(Millions, except where indicated) 2015 2014 2013
Common shares authorized (billions) (a) . . . . . . . . . . . . . . . . . . . . . . . . . . . . . . . . . . . . . . . . . . . . . . . . 3.6 3.6 3.6Shares issued and outstanding at beginning of year . . . . . . . . . . . . . . . . . . . . . . . . . . . . . . . . . . . . . . 1,023 1,064 1,105Repurchases of common shares . . . . . . . . . . . . . . . . . . . . . . . . . . . . . . . . . . . . . . . . . . . . . . . . . . . . . . (59) (49) (55)Other, primarily stock option exercises and restricted stock awards granted . . . . . . . . . . . . . . . . 5 8 14Shares issued and outstanding as of December 31 . . . . . . . . . . . . . . . . . . . . . . . . . . . . . . . . . . . . . . . 969 1,023 1,064
(a) Of the common shares authorized but unissued as of December 31, 2015, approximately 51 million shares are reserved for issuance underemployee stock and employee benefit plans.
On May 12, 2015, the Board of Directors authorized the repurchase of 150 million of common shares over time inaccordance with the Company’s capital distribution plans submitted to the Federal Reserve and subject to market conditions.This authorization replaces all prior repurchase authorizations. During 2015 and 2014, the Company repurchased 59 millioncommon shares with a cost basis of $4.5 billion and 49 million common shares with a cost basis of $4.4 billion, respectively.The cost basis includes commissions paid of $1.1 million and $1.0 million in 2015 and 2014, respectively. As of December 31,2015, the Company has 106 million common shares remaining under the Board share repurchase authorization. Suchauthorization does not have an expiration date.
Common shares are generally retired by the Company upon repurchase (except for 3.0 million, 3.2 million and 3.5 millionshares held as treasury shares as of December 31, 2015, 2014 and 2013, respectively); retired common shares and treasuryshares are excluded from the shares outstanding in the table above. The treasury shares, with a cost basis of $242 million,$280 million and $260 million as of December 31, 2015, 2014 and 2013, respectively, are included as a reduction to additionalpaid-in capital in shareholders’ equity on the Consolidated Balance Sheets.
PREFERRED SHARES
The Board of Directors is authorized to permit the Company to issue up to 20 million Preferred Shares at a par value of$1.662/3 without further shareholder approval. The Company has the following perpetual Fixed Rate/Floating RateNoncumulative Preferred Share series issued and outstanding as of December 31, 2015:
Series B Series C
Issuance date November 10, 2014 March 2, 2015
Securities issued 750 Preferred Shares; represented by750,000 depositary shares
850 Preferred Shares; represented by850,000 depositary shares
Aggregate liquidation preference $750 million $850 million
Fixed dividend rate per annum 5.20% 4.90%
Semi-annual fixed dividendpayment dates
Beginning May 15, 2015 Beginning September 15, 2015
Floating dividend rate per annum 3 month LIBOR+ 3.428% 3 month LIBOR+ 3.285%
Quarterly floating dividendpayment dates
Beginning February 15, 2020 Beginning June 15, 2020
Fixed to floating rate conversiondate (a)
November 15, 2019 March 15, 2020
(a) The date on which dividends convert from a fixed-rate calculation to a floating rate calculation.
In the event of the voluntary or involuntary liquidation, dissolution or winding up of the Company, the preferred stock thenoutstanding takes precedence over the Company’s common stock for the payment of dividends and the distribution of assetsout of funds legally available for distribution to shareholders. Each outstanding series of Preferred Shares has a liquidationprice of $1 million per Preferred Share, plus any accrued but unpaid dividends. The Company may redeem these PreferredShares at $1 million per Preferred Share (equivalent to $1,000 per depositary share) plus any declared but unpaid dividends inwhole or in part, from time to time, on any dividend payment date on or after the respective fixed to floating rate conversiondate, or in whole, but not in part, within 90 days of certain bank regulatory changes.
There were no preferred shares issued and outstanding as of December 31, 2013. There were no warrants issued andoutstanding as of December 31, 2015, 2014 and 2013.
143
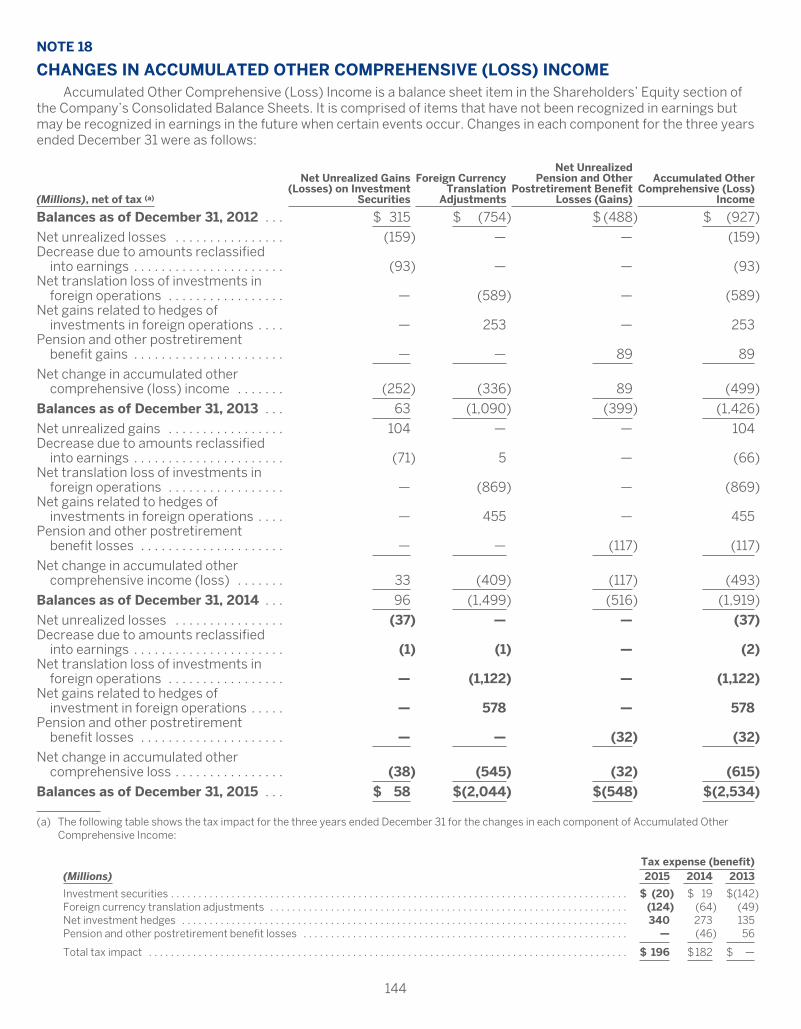
NOTE 18
CHANGES IN ACCUMULATED OTHER COMPREHENSIVE (LOSS) INCOMEAccumulated Other Comprehensive (Loss) Income is a balance sheet item in the Shareholders’ Equity section of
the Company’s Consolidated Balance Sheets. It is comprised of items that have not been recognized in earnings butmay be recognized in earnings in the future when certain events occur. Changes in each component for the three yearsended December 31 were as follows:
(Millions), net of tax (a)
Net Unrealized Gains(Losses) on Investment
Securities
Foreign CurrencyTranslation
Adjustments
Net UnrealizedPension and Other
Postretirement BenefitLosses (Gains)
Accumulated OtherComprehensive (Loss)
Income
Balances as of December 31, 2012 . . . $ 315 $ (754) $ (488) $ (927)
Net unrealized losses . . . . . . . . . . . . . . . . (159) — — (159)Decrease due to amounts reclassified
into earnings . . . . . . . . . . . . . . . . . . . . . . (93) — — (93)Net translation loss of investments in
foreign operations . . . . . . . . . . . . . . . . . — (589) — (589)Net gains related to hedges of
investments in foreign operations . . . . — 253 — 253Pension and other postretirement
benefit gains . . . . . . . . . . . . . . . . . . . . . . — — 89 89
Net change in accumulated othercomprehensive (loss) income . . . . . . . (252) (336) 89 (499)
Balances as of December 31, 2013 . . . 63 (1,090) (399) (1,426)
Net unrealized gains . . . . . . . . . . . . . . . . . 104 — — 104Decrease due to amounts reclassified
into earnings . . . . . . . . . . . . . . . . . . . . . . (71) 5 — (66)Net translation loss of investments in
foreign operations . . . . . . . . . . . . . . . . . — (869) — (869)Net gains related to hedges of
investments in foreign operations . . . . — 455 — 455Pension and other postretirement
benefit losses . . . . . . . . . . . . . . . . . . . . . — — (117) (117)
Net change in accumulated othercomprehensive income (loss) . . . . . . . 33 (409) (117) (493)
Balances as of December 31, 2014 . . . 96 (1,499) (516) (1,919)
Net unrealized losses . . . . . . . . . . . . . . . . (37) — — (37)Decrease due to amounts reclassified
into earnings . . . . . . . . . . . . . . . . . . . . . . (1) (1) — (2)Net translation loss of investments in
foreign operations . . . . . . . . . . . . . . . . . — (1,122) — (1,122)Net gains related to hedges of
investment in foreign operations . . . . . — 578 — 578Pension and other postretirement
benefit losses . . . . . . . . . . . . . . . . . . . . . — — (32) (32)
Net change in accumulated othercomprehensive loss . . . . . . . . . . . . . . . . (38) (545) (32) (615)
Balances as of December 31, 2015 . . . $ 58 $(2,044) $(548) $(2,534)
(a) The following table shows the tax impact for the three years ended December 31 for the changes in each component of Accumulated OtherComprehensive Income:
Tax expense (benefit)(Millions) 2015 2014 2013
Investment securities . . . . . . . . . . . . . . . . . . . . . . . . . . . . . . . . . . . . . . . . . . . . . . . . . . . . . . . . . . . . . . . . . . . . . . . . . . . . . . . . . . . $ (20) $ 19 $(142)Foreign currency translation adjustments . . . . . . . . . . . . . . . . . . . . . . . . . . . . . . . . . . . . . . . . . . . . . . . . . . . . . . . . . . . . . . . . . (124) (64) (49)Net investment hedges . . . . . . . . . . . . . . . . . . . . . . . . . . . . . . . . . . . . . . . . . . . . . . . . . . . . . . . . . . . . . . . . . . . . . . . . . . . . . . . . . 340 273 135Pension and other postretirement benefit losses . . . . . . . . . . . . . . . . . . . . . . . . . . . . . . . . . . . . . . . . . . . . . . . . . . . . . . . . . . . — (46) 56
Total tax impact . . . . . . . . . . . . . . . . . . . . . . . . . . . . . . . . . . . . . . . . . . . . . . . . . . . . . . . . . . . . . . . . . . . . . . . . . . . . . . . . . . . . . . . $ 196 $182 $ —
144

The following table presents the effects of reclassifications out of Accumulated Other Comprehensive (Loss)Income and into the Consolidated Statements of Income for the years ended December 31:
Gains (losses) recognized in earningsDescription (Millions) Income Statement Line Item 2015 2014
Available-for-sale securitiesReclassifications for previously unrealized net
gains on investment securities . . . . . . . . . . . . . . . . Other non-interest revenues $ 1 $ 111Related income tax expense . . . . . . . . . . . . . . . . . . . . Income tax provision — (40)
Reclassification to net income related to available-for-sale securities . . . . . . . . . . . . . . . . . . . . . . . . . . . 1 71
Foreign currency translation adjustmentsReclassification of realized losses on translation
adjustments and related hedges . . . . . . . . . . . . . . Other expenses 1 (9)Related income tax expense . . . . . . . . . . . . . . . . . . . . Income tax provision — 4
Reclassification of foreign currency translationadjustments . . . . . . . . . . . . . . . . . . . . . . . . . . . . . . . . 1 (5)
Total . . . . . . . . . . . . . . . . . . . . . . . . . . . . . . . . . . . . . . . . . . $ 2 $ 66
NOTE 19
NON-INTEREST REVENUE AND EXPENSE DETAILThe following is a detail of Other commissions and fees for the years ended December 31:
(Millions) 2015 2014 2013
Foreign currency conversion fee revenue . . . . . . . . . . . . . . . . . . . . . . . . . . . . . . . . . . . . . . . . . . . $ 852 $ 877 $ 877Delinquency fees . . . . . . . . . . . . . . . . . . . . . . . . . . . . . . . . . . . . . . . . . . . . . . . . . . . . . . . . . . . . . . . . 788 722 667Loyalty coalition-related fees . . . . . . . . . . . . . . . . . . . . . . . . . . . . . . . . . . . . . . . . . . . . . . . . . . . . . . 379 383 310Service fees . . . . . . . . . . . . . . . . . . . . . . . . . . . . . . . . . . . . . . . . . . . . . . . . . . . . . . . . . . . . . . . . . . . . 361 366 375Other (a) . . . . . . . . . . . . . . . . . . . . . . . . . . . . . . . . . . . . . . . . . . . . . . . . . . . . . . . . . . . . . . . . . . . . . . . . 137 160 185
Total Other commissions and fees . . . . . . . . . . . . . . . . . . . . . . . . . . . . . . . . . . . . . . . . . . . . . . . $2,517 $2,508 $2,414
(a) Other primarily includes revenues from fees related to Membership Rewards programs.
The following is a detail of Other revenues for the years ended December 31:
(Millions) 2015 2014 2013
Gain on sale of investment in Concur Technologies . . . . . . . . . . . . . . . . . . . . . . . . . . . . . . . . . . $ — $ 744 $ —Global Network Services partner revenues . . . . . . . . . . . . . . . . . . . . . . . . . . . . . . . . . . . . . . . . . 640 694 650Gross realized gains on sale of investment securities . . . . . . . . . . . . . . . . . . . . . . . . . . . . . . . . 1 100 136Other (a) . . . . . . . . . . . . . . . . . . . . . . . . . . . . . . . . . . . . . . . . . . . . . . . . . . . . . . . . . . . . . . . . . . . . . . . 1,392 1,451 1,488
Total Other revenues . . . . . . . . . . . . . . . . . . . . . . . . . . . . . . . . . . . . . . . . . . . . . . . . . . . . . . . . . . $2,033 $2,989 $2,274
(a) Other includes revenues arising from net revenue earned on cross-border Card Member spending, merchant-related fees, insurance premiumsearned from Card Member travel and other insurance programs, Travelers Cheques-related revenues, revenues related to the GBT JV transitionservices agreement, earnings from equity method investments (including the GBT JV) and other miscellaneous revenue and fees.
145

The following is a detail of Other expenses for the years ended December 31:
(Millions) 2015 2014 2013
Professional services . . . . . . . . . . . . . . . . . . . . . . . . . . . . . . . . . . . . . . . . . . . . . . . . . . . . . . . . . . . $2,750 $3,008 $ 3,102Occupancy and equipment . . . . . . . . . . . . . . . . . . . . . . . . . . . . . . . . . . . . . . . . . . . . . . . . . . . . . . 1,854 1,807 1,904Goodwill and long-lived asset impairment (a) . . . . . . . . . . . . . . . . . . . . . . . . . . . . . . . . . . . . . . . . 384 — —Card and merchant-related fraud losses (b) . . . . . . . . . . . . . . . . . . . . . . . . . . . . . . . . . . . . . . . . . 308 369 278Communications . . . . . . . . . . . . . . . . . . . . . . . . . . . . . . . . . . . . . . . . . . . . . . . . . . . . . . . . . . . . . . . 345 383 379Gain on business travel joint venture transaction . . . . . . . . . . . . . . . . . . . . . . . . . . . . . . . . . . . . — (630) —Other (c) . . . . . . . . . . . . . . . . . . . . . . . . . . . . . . . . . . . . . . . . . . . . . . . . . . . . . . . . . . . . . . . . . . . . . . . 1,152 1,152 1,133
Total Other expenses . . . . . . . . . . . . . . . . . . . . . . . . . . . . . . . . . . . . . . . . . . . . . . . . . . . . . . . . . $6,793 $6,089 $6,796
(a) Refer to Note 2 for additional information.(b) Beginning January 1, 2015, merchant-related fraud losses are reported within Other expenses.(c) Other expense includes general operating expenses, gains (losses) on sale of assets or businesses not classified as discontinued operations,
litigation, certain internal and regulatory review-related reimbursements and insurance costs or settlements, certain loyalty coalition-relatedexpenses and foreign currency-related gains and losses (including the favorable impact from the reassessment of the functional currency ofcertain UK legal entities in the year ended December 31, 2015). Effective December 1, 2015, Other expenses includes the valuation allowanceadjustment associated with the HFS portfolios.
NOTE 20
RESTRUCTURINGFrom time to time, the Company initiates restructuring programs to become more efficient and effective, and to
support new business strategies. In connection with these programs, the Company typically will incur severance andother exit costs.
During 2015, the Company recorded a net reduction of $26 million in restructuring charges, consisting of areduction of $61 million in revisions to prior estimates, partially offset by $35 million in net restructuring charges forEG recorded in the fourth quarter.
During 2014, the Company recorded $411 million of restructuring charges, net of revisions to prior estimates. The2014 activity primarily relates to $313 million and $133 million of restructuring charges recorded in the fourth quarterand second quarter, respectively.
Restructuring charges related to severance obligations are included in salaries and employee benefits in theCompany’s Consolidated Statements of Income, while charges pertaining to other exit costs are included inoccupancy and equipment and other expenses.
146

The following table summarizes the Company’s restructuring reserves activity for the years ended December 31,2015, 2014 and 2013:
(Millions) Severance Other (a) Total
Liability balance as of December 31, 2012 . . . . . . . . . . . . . . . . . . . . . . . . . . . . . . . . . . . . . . . . . . $ 412 $ 58 $ 470Restructuring charges, net of $4 in revisions (b) . . . . . . . . . . . . . . . . . . . . . . . . . . . . . . . . . . . (7) 3 (4)Payments . . . . . . . . . . . . . . . . . . . . . . . . . . . . . . . . . . . . . . . . . . . . . . . . . . . . . . . . . . . . . . . . . . . (206) (23) (229)Other non-cash (c) . . . . . . . . . . . . . . . . . . . . . . . . . . . . . . . . . . . . . . . . . . . . . . . . . . . . . . . . . . . . (3) (1) (4)
Liability balance as of December 31, 2013 . . . . . . . . . . . . . . . . . . . . . . . . . . . . . . . . . . . . . . . . . . 196 37 233Restructuring charges, net of $35 in revisions (b) . . . . . . . . . . . . . . . . . . . . . . . . . . . . . . . . . . 383 28 411Payments . . . . . . . . . . . . . . . . . . . . . . . . . . . . . . . . . . . . . . . . . . . . . . . . . . . . . . . . . . . . . . . . . . . (93) (22) (115)Other non-cash (d) . . . . . . . . . . . . . . . . . . . . . . . . . . . . . . . . . . . . . . . . . . . . . . . . . . . . . . . . . . . . (51) (8) (59)
Liability balance at December 31, 2014 . . . . . . . . . . . . . . . . . . . . . . . . . . . . . . . . . . . . . . . . . . . . 435 35 470Restructuring charges, net of $61 in revisions (b) . . . . . . . . . . . . . . . . . . . . . . . . . . . . . . . . . . (33) 7 (26)Payments . . . . . . . . . . . . . . . . . . . . . . . . . . . . . . . . . . . . . . . . . . . . . . . . . . . . . . . . . . . . . . . . . . . (141) (14) (155)Other non-cash (c) . . . . . . . . . . . . . . . . . . . . . . . . . . . . . . . . . . . . . . . . . . . . . . . . . . . . . . . . . . . . (23) (5) (28)
Liability balance as of December 31, 2015 (e) . . . . . . . . . . . . . . . . . . . . . . . . . . . . . . . . . . . . . . . . $ 238 $ 23 $ 261
(a) Other primarily includes facility exit and contract termination costs.(b) Revisions primarily relate to higher than anticipated redeployments of displaced employees to other positions within the Company, business
changes and modifications to existing initiatives.(c) Consists primarily of foreign exchange impacts.(d) Consists of $42 million reserve transferred to the GBT JV in the second quarter of 2014 as part of the GBT sale and $17 million of foreign
exchange and other non-cash charges.(e) The majority of cash payments related to the remaining restructuring liabilities are expected to be completed in 2016, and to a lesser extent
certain contractual long-term severance arrangements and lease obligations are expected to be completed in 2017 and 2020, respectively.
The following table summarizes the Company’s restructuring charges, net of revisions, by reportable operatingsegment and Corporate & Other for the year ended December 31, 2015, and the cumulative amounts relating to therestructuring programs that were in progress during 2015 and initiated at various dates between 2009 and 2015.
2015Cumulative Restructuring Expense Incurred To Date On
In-Progress Restructuring Programs
(Millions)
Total RestructuringCharges, net
revisions Severance Other Total
USCS . . . . . . . . . . . . . . . . . . . . . . . . . . . . . . . . . . . . . . $ (7) $ 35 $ — $ 35ICS . . . . . . . . . . . . . . . . . . . . . . . . . . . . . . . . . . . . . . . . (17) 198 — 198GCS . . . . . . . . . . . . . . . . . . . . . . . . . . . . . . . . . . . . . . . . (16) 113 — 113GNMS . . . . . . . . . . . . . . . . . . . . . . . . . . . . . . . . . . . . . . (1) 57 — 57Corporate & Other . . . . . . . . . . . . . . . . . . . . . . . . . . . 15 154 73 227(a)
Total . . . . . . . . . . . . . . . . . . . . . . . . . . . . . . . . . . . . . . . $(26) $557 $73 $630(b)
(a) Corporate & Other includes certain severance and other charges of $151 million related to Companywide support functions which were notallocated to the Company’s reportable operating segments, as these were corporate initiatives, which is consistent with how such charges werereported internally.
(b) As of December 31, 2015, the total expenses to be incurred for previously approved restructuring activities that were in progress are notexpected to be materially different than the cumulative expenses incurred to date for these programs.
147

NOTE 21
INCOME TAXESThe components of income tax expense for the years ended December 31 included in the Consolidated
Statements of Income were as follows:
(Millions) 2015 2014 2013
Current income tax expense:U.S. federal . . . . . . . . . . . . . . . . . . . . . . . . . . . . . . . . . . . . . . . . . . . . . . . . . . . . . . . . . . . . . . . . . . $ 2,107 $2,136 $ 1,730U.S. state and local . . . . . . . . . . . . . . . . . . . . . . . . . . . . . . . . . . . . . . . . . . . . . . . . . . . . . . . . . . . . 335 264 288Non-U.S. . . . . . . . . . . . . . . . . . . . . . . . . . . . . . . . . . . . . . . . . . . . . . . . . . . . . . . . . . . . . . . . . . . . . . 416 412 514
Total current income tax expense . . . . . . . . . . . . . . . . . . . . . . . . . . . . . . . . . . . . . . . . . . . . . 2,858 2,812 2,532
Deferred income tax expense (benefit):U.S. federal . . . . . . . . . . . . . . . . . . . . . . . . . . . . . . . . . . . . . . . . . . . . . . . . . . . . . . . . . . . . . . . . . . (23) 352 113U.S. state and local . . . . . . . . . . . . . . . . . . . . . . . . . . . . . . . . . . . . . . . . . . . . . . . . . . . . . . . . . . . . (5) 39 4Non-U.S. . . . . . . . . . . . . . . . . . . . . . . . . . . . . . . . . . . . . . . . . . . . . . . . . . . . . . . . . . . . . . . . . . . . . . (55) (97) (120)
Total deferred income tax expense . . . . . . . . . . . . . . . . . . . . . . . . . . . . . . . . . . . . . . . . . . . . (83) 294 (3)Total income tax expense . . . . . . . . . . . . . . . . . . . . . . . . . . . . . . . . . . . . . . . . . . . . . . . . . . . . . . . . $ 2,775 $3,106 $2,529
A reconciliation of the U.S. federal statutory rate of 35 percent to the Company’s actual income tax rate for theyears ended December 31 on continuing operations was as follows:
2015 2014 2013
U.S. statutory federal income tax rate . . . . . . . . . . . . . . . . . . . . . . . . . . . . . . . . . . . . . . . . . . . . . . . 35.0% 35.0% 35.0%(Decrease) increase in taxes resulting from:
Tax-exempt income . . . . . . . . . . . . . . . . . . . . . . . . . . . . . . . . . . . . . . . . . . . . . . . . . . . . . . . . . . . . (1.7) (1.5) (1.6)State and local income taxes, net of federal benefit . . . . . . . . . . . . . . . . . . . . . . . . . . . . . . . . . 2.8 2.7 3.1Non-U.S. subsidiaries earnings (a) . . . . . . . . . . . . . . . . . . . . . . . . . . . . . . . . . . . . . . . . . . . . . . . . . (1.8) (2.2) (2.8)Tax settlements (b) . . . . . . . . . . . . . . . . . . . . . . . . . . . . . . . . . . . . . . . . . . . . . . . . . . . . . . . . . . . . . (0.2) (0.5) (1.9)Non deductible expenses (c) . . . . . . . . . . . . . . . . . . . . . . . . . . . . . . . . . . . . . . . . . . . . . . . . . . . . . 0.9 — —All other . . . . . . . . . . . . . . . . . . . . . . . . . . . . . . . . . . . . . . . . . . . . . . . . . . . . . . . . . . . . . . . . . . . . . . — 1.0 0.3
Actual tax rates (a) . . . . . . . . . . . . . . . . . . . . . . . . . . . . . . . . . . . . . . . . . . . . . . . . . . . . . . . . . . . . 35.0% 34.5% 32.1%
(a) Results for all years primarily included tax benefits associated with the undistributed earnings of certain non-U.S. subsidiaries that weredeemed to be reinvested indefinitely.
(b) Relates to the resolution of tax matters in various jurisdictions.(c) Relates to the nondeductible portion of the EG goodwill impairment.
The Company records a deferred income tax (benefit) provision when there are differences between assets andliabilities measured for financial reporting and for income tax return purposes. These temporary differences result intaxable or deductible amounts in future years and are measured using the tax rates and laws that will be in effect whensuch differences are expected to reverse.
148

The significant components of deferred tax assets and liabilities as of December 31 are reflected in the followingtable:
(Millions) 2015 2014
Deferred tax assets:Reserves not yet deducted for tax purposes . . . . . . . . . . . . . . . . . . . . . . . . . . . . . . . . . . . . . . . . . . . . . . $ 3,771 $3,926Employee compensation and benefits . . . . . . . . . . . . . . . . . . . . . . . . . . . . . . . . . . . . . . . . . . . . . . . . . . . 648 789Other . . . . . . . . . . . . . . . . . . . . . . . . . . . . . . . . . . . . . . . . . . . . . . . . . . . . . . . . . . . . . . . . . . . . . . . . . . . . . . . 520 266
Gross deferred tax assets . . . . . . . . . . . . . . . . . . . . . . . . . . . . . . . . . . . . . . . . . . . . . . . . . . . . . . . . . . . . 4,939 4,981Valuation allowance . . . . . . . . . . . . . . . . . . . . . . . . . . . . . . . . . . . . . . . . . . . . . . . . . . . . . . . . . . . . . . . . . (58) (75)
Deferred tax assets after valuation allowance . . . . . . . . . . . . . . . . . . . . . . . . . . . . . . . . . . . . . . . . . . . 4,881 4,906
Deferred tax liabilities:Intangibles and fixed assets . . . . . . . . . . . . . . . . . . . . . . . . . . . . . . . . . . . . . . . . . . . . . . . . . . . . . . . . . . . . 1,547 1,597Deferred revenue . . . . . . . . . . . . . . . . . . . . . . . . . . . . . . . . . . . . . . . . . . . . . . . . . . . . . . . . . . . . . . . . . . . . . 509 498Deferred interest . . . . . . . . . . . . . . . . . . . . . . . . . . . . . . . . . . . . . . . . . . . . . . . . . . . . . . . . . . . . . . . . . . . . . 323 350Asset securitization . . . . . . . . . . . . . . . . . . . . . . . . . . . . . . . . . . . . . . . . . . . . . . . . . . . . . . . . . . . . . . . . . . . — 162Investment in joint ventures . . . . . . . . . . . . . . . . . . . . . . . . . . . . . . . . . . . . . . . . . . . . . . . . . . . . . . . . . . . . 231 223Other . . . . . . . . . . . . . . . . . . . . . . . . . . . . . . . . . . . . . . . . . . . . . . . . . . . . . . . . . . . . . . . . . . . . . . . . . . . . . . . 120 62
Gross deferred tax liabilities . . . . . . . . . . . . . . . . . . . . . . . . . . . . . . . . . . . . . . . . . . . . . . . . . . . . . . . . . . 2,730 2,892
Net deferred tax assets . . . . . . . . . . . . . . . . . . . . . . . . . . . . . . . . . . . . . . . . . . . . . . . . . . . . . . . . . . . . . . . . . . $ 2,151 $ 2,014
A valuation allowance is established when management determines that it is more likely than not that all or someportion of the benefit of the deferred tax assets will not be realized. The valuation allowances as of December 31, 2015and 2014 are associated with net operating losses and other deferred tax assets in certain non-U.S. operations of theCompany.
Accumulated earnings of certain non-U.S. subsidiaries, which totaled approximately $9.9 billion as ofDecember 31, 2015, are intended to be permanently reinvested outside the United States. The Company does notprovide for federal income taxes on foreign earnings intended to be permanently reinvested outside the United States.Accordingly, federal taxes, which would have aggregated approximately $3.0 billion as of December 31, 2015, have notbeen provided on those earnings.
Net income taxes paid by the Company during 2015, 2014 and 2013, were approximately $3.4 billion, $2.5 billionand $2.0 billion, respectively. These amounts include estimated tax payments and cash settlements relating to priortax years.
The Company is subject to the income tax laws of the United States, its states and municipalities and those of theforeign jurisdictions in which the Company operates. These tax laws are complex, and the manner in which they applyto the taxpayer’s facts is sometimes open to interpretation. Given these inherent complexities, the Company mustmake judgments in assessing the likelihood that a tax position will be sustained upon examination by the taxingauthorities based on the technical merits of the tax position. A tax position is recognized only when, based onmanagement’s judgment regarding the application of income tax laws, it is more likely than not that the tax positionwill be sustained upon examination. The amount of benefit recognized for financial reporting purposes is based onmanagement’s best judgment of the largest amount of benefit that is more likely than not to be realized on ultimatesettlement with the taxing authority given the facts, circumstances and information available at the reporting date. TheCompany adjusts the level of unrecognized tax benefits when there is new information available to assess thelikelihood of the outcome.
The Company is under continuous examination by the Internal Revenue Service (IRS) and tax authorities in othercountries and states in which the Company has significant business operations. The tax years under examination andopen for examination vary by jurisdiction. The IRS has completed its field examination of the Company’s federal taxreturns for years through 2007; however, refund claims for certain years continue to be reviewed by the IRS. Inaddition, the Company is currently under examination by the IRS for the years 2008 through 2011.
149

The following table presents changes in unrecognized tax benefits:
(Millions) 2015 2014 2013
Balance, January 1 . . . . . . . . . . . . . . . . . . . . . . . . . . . . . . . . . . . . . . . . . . . . . . . . . . . . . . . . . . . . . . . $ 909 $1,044 $1,230Increases:
Current year tax positions . . . . . . . . . . . . . . . . . . . . . . . . . . . . . . . . . . . . . . . . . . . . . . . . . . . . . . . 81 4 124Tax positions related to prior years . . . . . . . . . . . . . . . . . . . . . . . . . . . . . . . . . . . . . . . . . . . . . . . 177 111 176
Decreases:Tax positions related to prior years . . . . . . . . . . . . . . . . . . . . . . . . . . . . . . . . . . . . . . . . . . . . . . . (256) (181) (371)Settlements with tax authorities . . . . . . . . . . . . . . . . . . . . . . . . . . . . . . . . . . . . . . . . . . . . . . . . . . (15) (67) (94)Lapse of statute of limitations . . . . . . . . . . . . . . . . . . . . . . . . . . . . . . . . . . . . . . . . . . . . . . . . . . . . (26) (1) (21)Effects of foreign currency translations . . . . . . . . . . . . . . . . . . . . . . . . . . . . . . . . . . . . . . . . . . . — (1) —
Balance, December 31 . . . . . . . . . . . . . . . . . . . . . . . . . . . . . . . . . . . . . . . . . . . . . . . . . . . . . . . . . . . . $ 870 $ 909 $1,044
Included in the unrecognized tax benefits of $0.9 billion, $0.9 billion and $1.0 billion for December 31, 2015, 2014and 2013 are approximately $502 million, $412 million and $427 million, respectively that, if recognized, wouldfavorably affect the effective tax rate in a future period.
The Company believes it is reasonably possible that its unrecognized tax benefits could decrease within the next12 months by as much as $231 million principally as a result of potential resolutions of prior years’ tax items withvarious taxing authorities. The prior years’ tax items include unrecognized tax benefits relating to the deductibility ofcertain expenses or losses and the attribution of taxable income to a particular jurisdiction or jurisdictions. Of the $231million of unrecognized tax benefits, approximately $21 million relates to amounts that, if recognized, would berecorded in shareholders’ equity and would not impact the Company’s results of operations or its effective tax rate.
Interest and penalties relating to unrecognized tax benefits are reported in the income tax provision. For the yearended December 31, 2015, the Company recognized approximately $38 million in expenses for interest and penalties.For the years ended December 31, 2014 and 2013, the Company recognized benefits of approximately, $19 million and$31 million, respectively, of interest and penalties. The Company has approximately $164 million and $126 millionaccrued for the payment of interest and penalties as of December 31, 2015 and 2014, respectively.
150
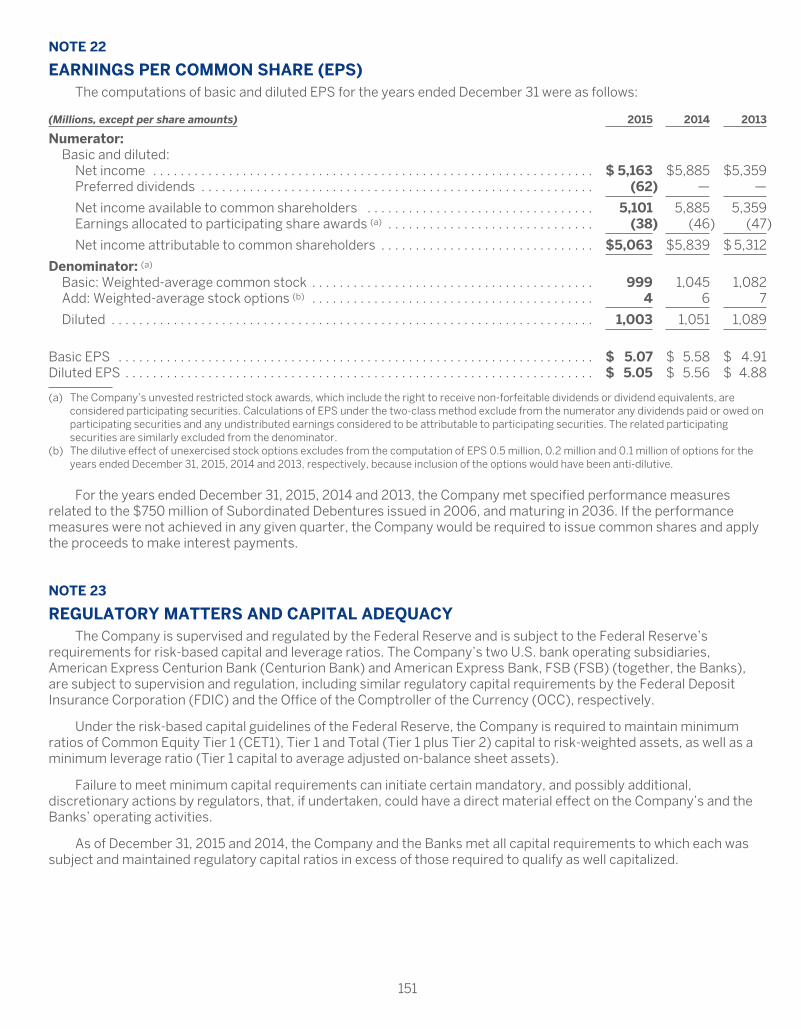
NOTE 22
EARNINGS PER COMMON SHARE (EPS)The computations of basic and diluted EPS for the years ended December 31 were as follows:
(Millions, except per share amounts) 2015 2014 2013
Numerator:Basic and diluted:
Net income . . . . . . . . . . . . . . . . . . . . . . . . . . . . . . . . . . . . . . . . . . . . . . . . . . . . . . . . . . . . . . . . $ 5,163 $5,885 $5,359Preferred dividends . . . . . . . . . . . . . . . . . . . . . . . . . . . . . . . . . . . . . . . . . . . . . . . . . . . . . . . . . (62) — —
Net income available to common shareholders . . . . . . . . . . . . . . . . . . . . . . . . . . . . . . . . . 5,101 5,885 5,359Earnings allocated to participating share awards (a) . . . . . . . . . . . . . . . . . . . . . . . . . . . . . . (38) (46) (47)
Net income attributable to common shareholders . . . . . . . . . . . . . . . . . . . . . . . . . . . . . . . $5,063 $5,839 $ 5,312
Denominator: (a)
Basic: Weighted-average common stock . . . . . . . . . . . . . . . . . . . . . . . . . . . . . . . . . . . . . . . . . 999 1,045 1,082Add: Weighted-average stock options (b) . . . . . . . . . . . . . . . . . . . . . . . . . . . . . . . . . . . . . . . . . 4 6 7
Diluted . . . . . . . . . . . . . . . . . . . . . . . . . . . . . . . . . . . . . . . . . . . . . . . . . . . . . . . . . . . . . . . . . . . . . . 1,003 1,051 1,089
Basic EPS . . . . . . . . . . . . . . . . . . . . . . . . . . . . . . . . . . . . . . . . . . . . . . . . . . . . . . . . . . . . . . . . . . . . . $ 5.07 $ 5.58 $ 4.91Diluted EPS . . . . . . . . . . . . . . . . . . . . . . . . . . . . . . . . . . . . . . . . . . . . . . . . . . . . . . . . . . . . . . . . . . . . $ 5.05 $ 5.56 $ 4.88
(a) The Company’s unvested restricted stock awards, which include the right to receive non-forfeitable dividends or dividend equivalents, areconsidered participating securities. Calculations of EPS under the two-class method exclude from the numerator any dividends paid or owed onparticipating securities and any undistributed earnings considered to be attributable to participating securities. The related participatingsecurities are similarly excluded from the denominator.
(b) The dilutive effect of unexercised stock options excludes from the computation of EPS 0.5 million, 0.2 million and 0.1 million of options for theyears ended December 31, 2015, 2014 and 2013, respectively, because inclusion of the options would have been anti-dilutive.
For the years ended December 31, 2015, 2014 and 2013, the Company met specified performance measuresrelated to the $750 million of Subordinated Debentures issued in 2006, and maturing in 2036. If the performancemeasures were not achieved in any given quarter, the Company would be required to issue common shares and applythe proceeds to make interest payments.
NOTE 23
REGULATORY MATTERS AND CAPITAL ADEQUACYThe Company is supervised and regulated by the Federal Reserve and is subject to the Federal Reserve’s
requirements for risk-based capital and leverage ratios. The Company’s two U.S. bank operating subsidiaries,American Express Centurion Bank (Centurion Bank) and American Express Bank, FSB (FSB) (together, the Banks),are subject to supervision and regulation, including similar regulatory capital requirements by the Federal DepositInsurance Corporation (FDIC) and the Office of the Comptroller of the Currency (OCC), respectively.
Under the risk-based capital guidelines of the Federal Reserve, the Company is required to maintain minimumratios of Common Equity Tier 1 (CET1), Tier 1 and Total (Tier 1 plus Tier 2) capital to risk-weighted assets, as well as aminimum leverage ratio (Tier 1 capital to average adjusted on-balance sheet assets).
Failure to meet minimum capital requirements can initiate certain mandatory, and possibly additional,discretionary actions by regulators, that, if undertaken, could have a direct material effect on the Company’s and theBanks’ operating activities.
As of December 31, 2015 and 2014, the Company and the Banks met all capital requirements to which each wassubject and maintained regulatory capital ratios in excess of those required to qualify as well capitalized.
151

The following table presents the regulatory capital ratios for the Company and the Banks:
(Millions, except percentages)CET1
capitalTier 1
capitalTotal
capital
CET1capital
ratio
Tier 1capital
ratio
Totalcapital
ratio
Tier 1leverage
ratio
December 31, 2015: (a)
American Express Company . . . . . . . . . . . . . . . . . . . . $16,747 $18,265 $20,551 12.4% 13.5% 15.2% 11.7%American Express Centurion Bank . . . . . . . . . . . . . . . 6,013 6,013 6,460 16.9 16.9 18.2 17.7American Express Bank, FSB . . . . . . . . . . . . . . . . . . . . 6,927 6,927 7,601 13.7 13.7 15.1 13.2
December 31, 2014: (a)
American Express Company . . . . . . . . . . . . . . . . . . . . $ 17,525 $ 18,176 $20,801 13.1% 13.6% 15.6% 11.8%American Express Centurion Bank . . . . . . . . . . . . . . . 6,174 6,174 6,584 18.8 18.8 20.1 18.7American Express Bank, FSB . . . . . . . . . . . . . . . . . . . . 6,722 6,722 7,604 14.2 14.2 16.0 15.1
Well-capitalized ratios (b) . . . . . . . . . . . . . . . . . . . . . . . . . 6.5%(c) 8.0% 10.0% 5.0%(d)Minimum capital ratios (b) . . . . . . . . . . . . . . . . . . . . . . . . . 4.5% 6.0% 8.0% 4.0%
(a) Beginning in 2015, as a Basel III Advanced Approaches institution, capital ratios are reported using Basel III capital definitions, inclusive oftransition provisions, and risk-weighted assets using the Basel III Standardized Approaches. As of December 31, 2014, capital ratios werereported using Basel III capital definitions, inclusive of transition provisions and Basel I risk-weighted assets.
(b) As defined by the regulations issued by the Federal Reserve, OCC and FDIC for the year ended December 31, 2015.(c) Beginning January 1, 2015, Basel III CET1 well-capitalized ratios became relevant capital measures under the prompt and corrective action
requirements defined by the regulations for Advanced Approaches institutions.(d) Represents requirements for banking subsidiaries to be considered “well-capitalized” pursuant to regulations issued under the Federal Deposit
Insurance Corporation Improvement Act. There is no “well-capitalized” definition for the Tier 1 leverage ratio for a bank holding company.
RESTRICTED NET ASSETS OF SUBSIDIARIES
Certain of the Company’s subsidiaries are subject to restrictions on the transfer of net assets under debtagreements and regulatory requirements. These restrictions have not had any effect on the Company’s shareholderdividend policy and management does not anticipate any impact in the future. Procedures exist to transfer net assetsbetween the Company and its subsidiaries, while ensuring compliance with the various contractual and regulatoryconstraints. As of December 31, 2015, the aggregate amount of net assets of subsidiaries that are restricted to betransferred to the Company was approximately $11.3 billion.
BANK HOLDING COMPANY DIVIDEND RESTRICTIONS
The Company is limited in its ability to pay dividends by the Federal Reserve, which could prohibit a dividend thatwould be considered an unsafe or unsound banking practice. It is the policy of the Federal Reserve that bank holdingcompanies generally should pay dividends on preferred and common stock only out of net income available tocommon shareholders generated over the past year, and only if prospective earnings retention is consistent with theorganization’s current and expected future capital needs, asset quality and overall financial condition. Moreover, bankholding companies are required by statute to be a source of strength to their insured depository institutionsubsidiaries and should not maintain dividend levels that undermine their ability to do so. On an annual basis, theCompany is required to develop and maintain a capital plan, which includes planned dividends over a two-year horizon,and to submit the capital plan to the Federal Reserve.
BANKS’ DIVIDEND RESTRICTIONS
In the years ended December 31, 2015 and 2014, Centurion Bank paid dividends from retained earnings to itsparent of $2.0 billion and $1.9 billion, respectively, and FSB paid dividends from retained earnings to its parent of $2.2billion and $2.1 billion, respectively.
The Banks are subject to statutory and regulatory limitations on their ability to pay dividends. The total amount ofdividends that may be paid at any date, subject to supervisory considerations of the Banks’ regulators, is generallylimited to the retained earnings of the respective bank. As of December 31, 2015 and 2014, the Banks’ retainedearnings, in the aggregate, available for the payment of dividends were $3.2 billion and $3.6 billion, respectively. Indetermining the dividends to pay their parent, the Banks must also consider the effects on applicable risk-basedcapital and leverage ratio requirements, as well as policy statements of the federal regulatory agencies. In addition, theBanks’ banking regulators have authority to limit or prohibit the payment of a dividend by the Banks under a number ofcircumstances, including if, in the banking regulator’s opinion, payment of a dividend would constitute an unsafe orunsound banking practice in light of the financial condition of the banking organization.
152

NOTE 24
SIGNIFICANT CREDIT CONCENTRATIONSConcentrations of credit risk exist when changes in economic, industry or geographic factors similarly affect
groups of counterparties whose aggregate credit exposure is material in relation to American Express’ total creditexposure. The Company’s customers operate in diverse industries, economic sectors and geographic regions.
The following table details the Company’s maximum credit exposure by category, including the credit exposureassociated with derivative financial instruments, as of December 31:
(Billions) 2015 2014
On-balance sheet:Individuals (a) . . . . . . . . . . . . . . . . . . . . . . . . . . . . . . . . . . . . . . . . . . . . . . . . . . . . . . . . . . . . . . . . . . . . . . . . . . . . . . . $104 $ 101Financial institutions (b) . . . . . . . . . . . . . . . . . . . . . . . . . . . . . . . . . . . . . . . . . . . . . . . . . . . . . . . . . . . . . . . . . . . . . . 25 25U.S. Government and agencies (c) . . . . . . . . . . . . . . . . . . . . . . . . . . . . . . . . . . . . . . . . . . . . . . . . . . . . . . . . . . . . . 4 4All other (d) . . . . . . . . . . . . . . . . . . . . . . . . . . . . . . . . . . . . . . . . . . . . . . . . . . . . . . . . . . . . . . . . . . . . . . . . . . . . . . . . . 17 17
Total on-balance sheet (e) . . . . . . . . . . . . . . . . . . . . . . . . . . . . . . . . . . . . . . . . . . . . . . . . . . . . . . . . . . . . . . . . . . . . 150 147
Unused lines-of-credit — individuals (f) . . . . . . . . . . . . . . . . . . . . . . . . . . . . . . . . . . . . . . . . . . . . . . . . . . . . . . . . . $297 $278
(a) Individuals primarily include Card Member receivables and loans, including the HFS portfolios.(b) Financial institutions primarily include debt obligations of banks, broker-dealers, insurance companies and savings and loan associations.(c) U.S. Government and agencies represent debt obligations of the U.S. Government and its agencies, states and municipalities and government-
sponsored entities.(d) All other primarily includes Card Member receivables from other corporate institutions.(e) Certain distinctions between categories require management judgment.(f) Because charge card products generally have no preset spending limit, the associated credit limit on charge products is not quantifiable.
Therefore, the quantified unused line-of-credit amounts only include the approximate credit line available on lending products.
As of December 31, 2015 and 2014, the Company’s most significant concentration of credit risk was withindividuals, including Card Member receivables and loans. These amounts are generally advanced on an unsecuredbasis. However, the Company reviews each potential customer’s credit application and evaluates the applicant’sfinancial history and ability and willingness to repay. The Company also considers credit performance by customertenure, industry and geographic location in managing credit exposure.
The following table details the Company’s Card Member loans and receivables exposure (including unused lines-of-credit on Card Member loans) in the United States and outside the United States as of December 31:
(Billions) 2015 2014
On-balance sheet:U.S. (a) . . . . . . . . . . . . . . . . . . . . . . . . . . . . . . . . . . . . . . . . . . . . . . . . . . . . . . . . . . . . . . . . . . . . . . . . . . . . . . . . . . . . $ 99 $ 94Non-U.S. . . . . . . . . . . . . . . . . . . . . . . . . . . . . . . . . . . . . . . . . . . . . . . . . . . . . . . . . . . . . . . . . . . . . . . . . . . . . . . . . . . 19 21
On-balance sheet (b)(c) . . . . . . . . . . . . . . . . . . . . . . . . . . . . . . . . . . . . . . . . . . . . . . . . . . . . . . . . . . . . . . . . . . . . . . . 118 115
Unused lines-of-credit — individuals:U.S. (a) . . . . . . . . . . . . . . . . . . . . . . . . . . . . . . . . . . . . . . . . . . . . . . . . . . . . . . . . . . . . . . . . . . . . . . . . . . . . . . . . . . . . 259 234Non-U.S. . . . . . . . . . . . . . . . . . . . . . . . . . . . . . . . . . . . . . . . . . . . . . . . . . . . . . . . . . . . . . . . . . . . . . . . . . . . . . . . . . . 38 44
Total unused lines-of-credit — individuals . . . . . . . . . . . . . . . . . . . . . . . . . . . . . . . . . . . . . . . . . . . . . . . . . . . . . . $297 $278
(a) Includes on-balance sheet Card Member loans and receivables HFS and unused lines-of-credit for Card Member loans HFS, as of December 31,2015.
(b) Represents Card Member loans to individuals as well as receivables from individuals and corporate institutions as discussed in footnotes(a) and (d) from the previous table.
(c) The remainder of the Company’s on-balance sheet exposure includes cash, investments, other loans, other receivables and other assetsincluding derivative financial instruments. These balances are primarily within the United States.
153

NOTE 25
REPORTABLE OPERATING SEGMENTS AND GEOGRAPHIC OPERATIONS
REPORTABLE OPERATING SEGMENTS
The Company is a global services company that is principally engaged in businesses comprising four reportableoperating segments: USCS, ICS, GCS and Global Network & Merchant Services (GNMS).
The Company considers a combination of factors when evaluating the composition of its reportable operatingsegments, including the results reviewed by the chief operating decision maker, economic characteristics, productsand services offered, classes of customers, product distribution channels, geographic considerations (primarily UnitedStates versus outside the United States), and regulatory environment considerations.
The following is a brief description of the primary business activities of the Company’s four reportable operatingsegments:
• USCS offers a wide range of card products and services to consumers and small businesses in the UnitedStates, provides travel services to Card Members and other consumers, and operates a coalition loyaltybusiness.
• ICS offers a wide range of card products and services to consumers and small businesses outside the UnitedStates, provides travel services to Card Members and other consumers, and operates a coalition loyaltybusiness in various countries.
• GCS offers global corporate payment services to large and mid-sized companies. The Company’s businesstravel operations, which had been included in GCS, were deconsolidated effective June 30, 2014 in connectionwith the formation of the GBT JV, discussed previously. Therefore, there is a lack of comparability againstperiods prior to the deconsolidation. The Company’s proportional share of the GBT JV net income or loss isreported within Other revenues.
• GNMS operates a global payments network that processes and settles proprietary and non-proprietary cardtransactions. GNMS acquires merchants; leverages the Company’s global closed-loop network to offer multi-channel marketing programs and capabilities, services and reporting and analytical data to the Company’smerchants around the world; and provides financing products for qualified merchants. It also enters intopartnership agreements with third-party card issuers and acquirers to license the American Express brand andbroaden the Card Member and merchant base for the Company’s network worldwide.
• Corporate functions and certain other businesses, including the Company’s EG business, as well as otherCompany operations are included in Corporate & Other.
154

The following table presents certain selected financial information for the Company’s reportable operatingsegments and Corporate & Other as of or for the years ended December 31, 2015, 2014 and 2013:
(Millions, except where indicated) USCS ICS GCS GNMSCorporate &
Other (a) Consolidated
2015Non-interest revenues . . . . . . . . . . . . . . . . . . . . . . . . . . . . . . . . . . $13,180 $4,321 $ 3,513 $5,236 $ 646 $26,896Interest income . . . . . . . . . . . . . . . . . . . . . . . . . . . . . . . . . . . . . . . . 6,267 939 14 98 227 7,545Interest expense . . . . . . . . . . . . . . . . . . . . . . . . . . . . . . . . . . . . . . . 654 242 185 (194) 736 1,623Total revenues net of interest expense . . . . . . . . . . . . . . . . . . . . 18,793 5,018 3,342 5,528 137 32,818Total provisions (b) . . . . . . . . . . . . . . . . . . . . . . . . . . . . . . . . . . . . . 1,453 329 148 54 4 1,988Pretax income (loss) from continuing operations . . . . . . . . . . . 5,355 508 1,073 2,775 (1,773) 7,938Income tax provision (benefit) . . . . . . . . . . . . . . . . . . . . . . . . . . . 1,942 87 407 1,004 (665) 2,775Net income (loss) . . . . . . . . . . . . . . . . . . . . . . . . . . . . . . . . . . . . . . 3,413 421 666 1,771 (1,108) 5,163
Total assets (billions) (c) . . . . . . . . . . . . . . . . . . . . . . . . . . . . . . . . . 117 35 18 24 (33) 161
Total equity (billions) . . . . . . . . . . . . . . . . . . . . . . . . . . . . . . . . . . . 10.3 2.9 3.7 2.4 1.4 20.7
2014Non-interest revenues . . . . . . . . . . . . . . . . . . . . . . . . . . . . . . . . . . 12,628 4,737 5,173 5,426 752 28,716Interest income . . . . . . . . . . . . . . . . . . . . . . . . . . . . . . . . . . . . . . . . 5,786 1,085 15 52 241 7,179Interest expense . . . . . . . . . . . . . . . . . . . . . . . . . . . . . . . . . . . . . . . 604 330 240 (269) 802 1,707Total revenues net of interest expense . . . . . . . . . . . . . . . . . . . . 17,810 5,492 4,948 5,747 191 34,188Total provisions . . . . . . . . . . . . . . . . . . . . . . . . . . . . . . . . . . . . . . . 1,396 370 180 93 5 2,044Pretax income (loss) from continuing operations . . . . . . . . . . . 5,100 449 2,408 2,620 (1,586) 8,991Income tax provision (benefit) . . . . . . . . . . . . . . . . . . . . . . . . . . . 1,900 38 865 960 (657) 3,106Net income (loss) . . . . . . . . . . . . . . . . . . . . . . . . . . . . . . . . . . . . . . 3,200 411 1,543 1,660 (929) 5,885
Total assets (billions) (c) . . . . . . . . . . . . . . . . . . . . . . . . . . . . . . . . . 113 31 19 18 (22) 159
Total equity (billions) . . . . . . . . . . . . . . . . . . . . . . . . . . . . . . . . . . . 10.4 3.0 3.8 2.0 1.5 20.7
2013Non-interest revenues . . . . . . . . . . . . . . . . . . . . . . . . . . . . . . . . . . 12,019 4,644 5,085 5,229 846 27,823Interest income . . . . . . . . . . . . . . . . . . . . . . . . . . . . . . . . . . . . . . . . 5,565 1,118 13 32 277 7,005Interest expense . . . . . . . . . . . . . . . . . . . . . . . . . . . . . . . . . . . . . . . 693 361 245 (252) 911 1,958Total revenues net of interest expense . . . . . . . . . . . . . . . . . . . . 16,891 5,401 4,853 5,513 212 32,870Total provisions . . . . . . . . . . . . . . . . . . . . . . . . . . . . . . . . . . . . . . . 1,250 388 129 67 (2) 1,832Pretax income (loss) from continuing operations . . . . . . . . . . . 4,994 643 1,244 2,469 (1,462) 7,888Income tax provision (benefit) . . . . . . . . . . . . . . . . . . . . . . . . . . . 1,801 12 384 894 (562) 2,529Net income (loss) . . . . . . . . . . . . . . . . . . . . . . . . . . . . . . . . . . . . . . 3,193 631 860 1,575 (900) 5,359
Total assets (billions) (c) . . . . . . . . . . . . . . . . . . . . . . . . . . . . . . . . . $ 104 $ 31 $ 19 $ 17 $ (18) $ 153
Total equity (billions) . . . . . . . . . . . . . . . . . . . . . . . . . . . . . . . . . . . $ 9.3 $ 3.1 $ 3.7 $ 2.0 $ 1.4 $ 19.5
(a) Corporate & Other includes adjustments and eliminations for intersegment activity.(b) Effective December 1, 2015, in the USCS segment, total provisions does not include credit costs related to Card Member loans and receivables
HFS, which are now reported in Other expenses through a valuation allowance adjustment.(c) As of September 30, 2015, and prospectively, certain intercompany balances have been reclassified between operating segments, as a result of
systems enhancements.
Total Revenues Net of Interest Expense
The Company allocates discount revenue and certain other revenues among segments using a transfer pricingmethodology. Within the USCS, ICS and GCS segments, discount revenue reflects the issuer component of the overalldiscount revenue generated by each segment’s Card Members; within the GNMS segment, discount revenue reflectsthe network and acquirer component of the overall discount revenue. Net card fees and travel commissions and feesare directly attributable to the segment in which they are reported.
Interest and fees on loans and certain investment income is directly attributable to the segment in which it isreported. Interest expense represents an allocated funding cost based on a combination of segment fundingrequirements and internal funding rates.
Provisions for Losses
The provisions for losses are directly attributable to the segment in which they are reported.
Expenses
Marketing and promotion expenses are included in each segment based on actual expenses incurred, with theexception of brand advertising, which is primarily reflected in the GNMS and USCS segments. Rewards and CardMember services expenses are included in each segment based on actual expenses incurred within each segment.
155

Salaries and employee benefits and other operating expenses includes expenses such as professional services,occupancy and equipment and communications incurred directly within each segment. In addition, expenses relatedto support services, such as technology costs, are allocated to each segment primarily based on support serviceactivities directly attributable to the segment. Other overhead expenses, such as staff group support functions, areallocated from Corporate & Other to the other segments based on a mix of each segment’s direct consumption ofservices and relative level of pretax income.
Capital
Each business segment is allocated capital based on established business model operating requirements, riskmeasures and regulatory capital requirements. The business model operating requirements include capital needed tosupport operations and specific balance sheet items. The risk measures include considerations for credit, market andoperational risk.
Income Taxes
An income tax provision (benefit) is allocated to each business segment based on the effective tax ratesapplicable to various businesses that comprise the segment.
GEOGRAPHIC OPERATIONS
The following table presents the Company’s total revenues net of interest expense and pretax income (loss) fromcontinuing operations in different geographic regions:
(Millions)UnitedStates EMEA (a) JAPA (a) LACC (a)
OtherUnallocated (b) Consolidated
2015 (c)
Total revenues net of interest expense . . . . . . . . . . . . . . $24,791 $ 3,161 $2,649 $2,384 $ (167) $32,818Pretax income (loss) from continuing operations . . . . . 8,010 534 456 658 (1,720) 7,938
2014 (c)
Total revenues net of interest expense . . . . . . . . . . . . . . $ 24,751 $ 3,767 $ 2,934 $ 2,888 $ (152) $ 34,188Pretax income (loss) from continuing operations . . . . . 8,869 525 463 683 (1,549) 8,991
2013 (c)
Total revenues net of interest expense . . . . . . . . . . . . . . $ 23,641 $3,700 $ 2,952 $2,900 $ (323) $32,870Pretax income (loss) from continuing operations . . . . . 7,679 524 488 701 (1,504) 7,888
(a) EMEA represents Europe, the Middle East and Africa; JAPA represents Japan, Asia/Pacific and Australia; and LACC represents Latin America,Canada and the Caribbean.
(b) Other Unallocated includes net costs which are not directly allocable to specific geographic regions, including costs related to the net negativeinterest spread on excess liquidity funding and executive office operations expenses.
(c) The data in the above table is, in part, based upon internal allocations, which necessarily involve management’s judgment.
156
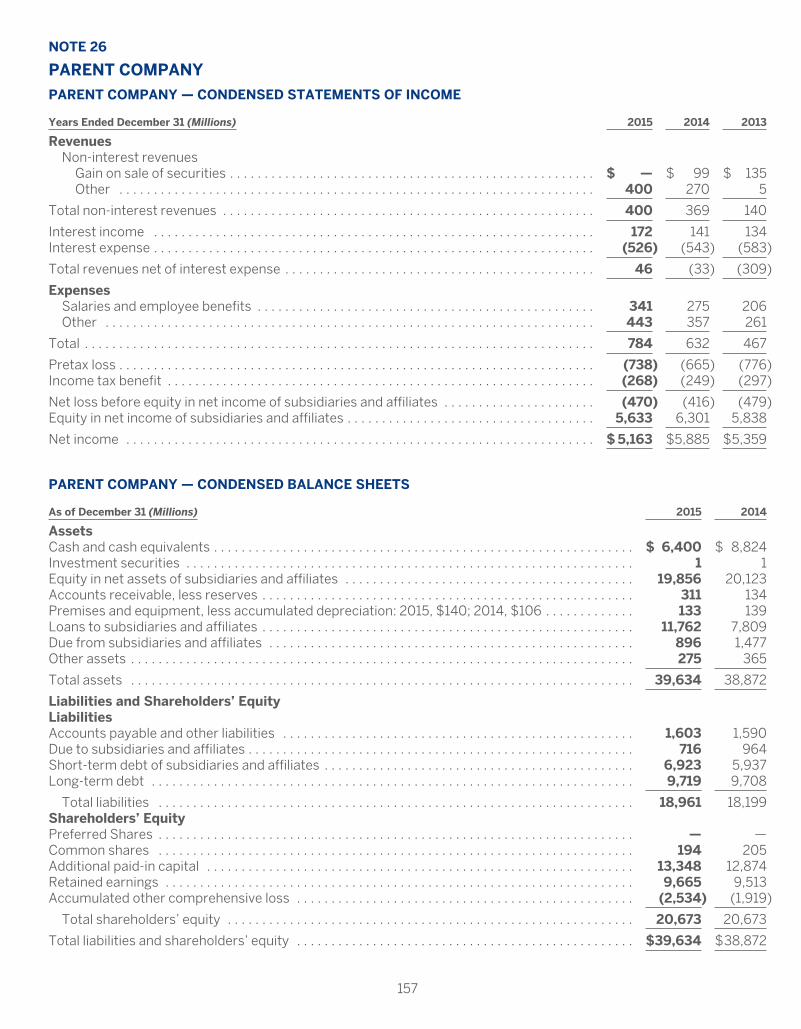
NOTE 26
PARENT COMPANY
PARENT COMPANY — CONDENSED STATEMENTS OF INCOME
Years Ended December 31 (Millions) 2015 2014 2013
RevenuesNon-interest revenues
Gain on sale of securities . . . . . . . . . . . . . . . . . . . . . . . . . . . . . . . . . . . . . . . . . . . . . . . . . . . . . $ — $ 99 $ 135Other . . . . . . . . . . . . . . . . . . . . . . . . . . . . . . . . . . . . . . . . . . . . . . . . . . . . . . . . . . . . . . . . . . . . . 400 270 5
Total non-interest revenues . . . . . . . . . . . . . . . . . . . . . . . . . . . . . . . . . . . . . . . . . . . . . . . . . . . . . . 400 369 140
Interest income . . . . . . . . . . . . . . . . . . . . . . . . . . . . . . . . . . . . . . . . . . . . . . . . . . . . . . . . . . . . . . . . 172 141 134Interest expense . . . . . . . . . . . . . . . . . . . . . . . . . . . . . . . . . . . . . . . . . . . . . . . . . . . . . . . . . . . . . . . . (526) (543) (583)
Total revenues net of interest expense . . . . . . . . . . . . . . . . . . . . . . . . . . . . . . . . . . . . . . . . . . . . . 46 (33) (309)
ExpensesSalaries and employee benefits . . . . . . . . . . . . . . . . . . . . . . . . . . . . . . . . . . . . . . . . . . . . . . . . . 341 275 206Other . . . . . . . . . . . . . . . . . . . . . . . . . . . . . . . . . . . . . . . . . . . . . . . . . . . . . . . . . . . . . . . . . . . . . . . 443 357 261
Total . . . . . . . . . . . . . . . . . . . . . . . . . . . . . . . . . . . . . . . . . . . . . . . . . . . . . . . . . . . . . . . . . . . . . . . . . . 784 632 467
Pretax loss . . . . . . . . . . . . . . . . . . . . . . . . . . . . . . . . . . . . . . . . . . . . . . . . . . . . . . . . . . . . . . . . . . . . . (738) (665) (776)Income tax benefit . . . . . . . . . . . . . . . . . . . . . . . . . . . . . . . . . . . . . . . . . . . . . . . . . . . . . . . . . . . . . . (268) (249) (297)
Net loss before equity in net income of subsidiaries and affiliates . . . . . . . . . . . . . . . . . . . . . . (470) (416) (479)Equity in net income of subsidiaries and affiliates . . . . . . . . . . . . . . . . . . . . . . . . . . . . . . . . . . . . 5,633 6,301 5,838
Net income . . . . . . . . . . . . . . . . . . . . . . . . . . . . . . . . . . . . . . . . . . . . . . . . . . . . . . . . . . . . . . . . . . . . $ 5,163 $5,885 $5,359
PARENT COMPANY — CONDENSED BALANCE SHEETS
As of December 31 (Millions) 2015 2014
AssetsCash and cash equivalents . . . . . . . . . . . . . . . . . . . . . . . . . . . . . . . . . . . . . . . . . . . . . . . . . . . . . . . . . . . . . $ 6,400 $ 8,824Investment securities . . . . . . . . . . . . . . . . . . . . . . . . . . . . . . . . . . . . . . . . . . . . . . . . . . . . . . . . . . . . . . . . . 1 1Equity in net assets of subsidiaries and affiliates . . . . . . . . . . . . . . . . . . . . . . . . . . . . . . . . . . . . . . . . . . 19,856 20,123Accounts receivable, less reserves . . . . . . . . . . . . . . . . . . . . . . . . . . . . . . . . . . . . . . . . . . . . . . . . . . . . . . 311 134Premises and equipment, less accumulated depreciation: 2015, $140; 2014, $106 . . . . . . . . . . . . . 133 139Loans to subsidiaries and affiliates . . . . . . . . . . . . . . . . . . . . . . . . . . . . . . . . . . . . . . . . . . . . . . . . . . . . . . 11,762 7,809Due from subsidiaries and affiliates . . . . . . . . . . . . . . . . . . . . . . . . . . . . . . . . . . . . . . . . . . . . . . . . . . . . . 896 1,477Other assets . . . . . . . . . . . . . . . . . . . . . . . . . . . . . . . . . . . . . . . . . . . . . . . . . . . . . . . . . . . . . . . . . . . . . . . . . 275 365
Total assets . . . . . . . . . . . . . . . . . . . . . . . . . . . . . . . . . . . . . . . . . . . . . . . . . . . . . . . . . . . . . . . . . . . . . . . . . 39,634 38,872
Liabilities and Shareholders’ EquityLiabilitiesAccounts payable and other liabilities . . . . . . . . . . . . . . . . . . . . . . . . . . . . . . . . . . . . . . . . . . . . . . . . . . . 1,603 1,590Due to subsidiaries and affiliates . . . . . . . . . . . . . . . . . . . . . . . . . . . . . . . . . . . . . . . . . . . . . . . . . . . . . . . . 716 964Short-term debt of subsidiaries and affiliates . . . . . . . . . . . . . . . . . . . . . . . . . . . . . . . . . . . . . . . . . . . . . 6,923 5,937Long-term debt . . . . . . . . . . . . . . . . . . . . . . . . . . . . . . . . . . . . . . . . . . . . . . . . . . . . . . . . . . . . . . . . . . . . . . 9,719 9,708
Total liabilities . . . . . . . . . . . . . . . . . . . . . . . . . . . . . . . . . . . . . . . . . . . . . . . . . . . . . . . . . . . . . . . . . . . . . 18,961 18,199Shareholders’ EquityPreferred Shares . . . . . . . . . . . . . . . . . . . . . . . . . . . . . . . . . . . . . . . . . . . . . . . . . . . . . . . . . . . . . . . . . . . . . — —Common shares . . . . . . . . . . . . . . . . . . . . . . . . . . . . . . . . . . . . . . . . . . . . . . . . . . . . . . . . . . . . . . . . . . . . . 194 205Additional paid-in capital . . . . . . . . . . . . . . . . . . . . . . . . . . . . . . . . . . . . . . . . . . . . . . . . . . . . . . . . . . . . . . 13,348 12,874Retained earnings . . . . . . . . . . . . . . . . . . . . . . . . . . . . . . . . . . . . . . . . . . . . . . . . . . . . . . . . . . . . . . . . . . . . 9,665 9,513Accumulated other comprehensive loss . . . . . . . . . . . . . . . . . . . . . . . . . . . . . . . . . . . . . . . . . . . . . . . . . (2,534) (1,919)
Total shareholders’ equity . . . . . . . . . . . . . . . . . . . . . . . . . . . . . . . . . . . . . . . . . . . . . . . . . . . . . . . . . . . 20,673 20,673
Total liabilities and shareholders’ equity . . . . . . . . . . . . . . . . . . . . . . . . . . . . . . . . . . . . . . . . . . . . . . . . . $39,634 $38,872
157
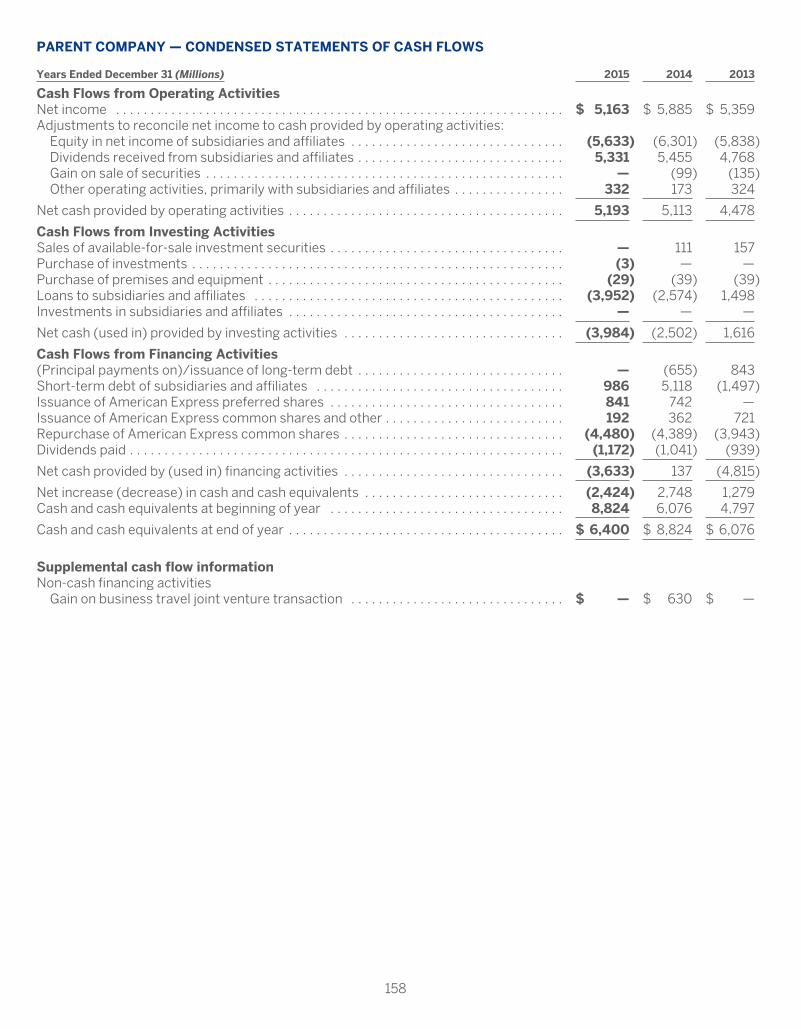
PARENT COMPANY — CONDENSED STATEMENTS OF CASH FLOWS
Years Ended December 31 (Millions) 2015 2014 2013
Cash Flows from Operating ActivitiesNet income . . . . . . . . . . . . . . . . . . . . . . . . . . . . . . . . . . . . . . . . . . . . . . . . . . . . . . . . . . . . . . . . . $ 5,163 $ 5,885 $ 5,359Adjustments to reconcile net income to cash provided by operating activities:
Equity in net income of subsidiaries and affiliates . . . . . . . . . . . . . . . . . . . . . . . . . . . . . . . (5,633) (6,301) (5,838)Dividends received from subsidiaries and affiliates . . . . . . . . . . . . . . . . . . . . . . . . . . . . . . 5,331 5,455 4,768Gain on sale of securities . . . . . . . . . . . . . . . . . . . . . . . . . . . . . . . . . . . . . . . . . . . . . . . . . . . . — (99) (135)Other operating activities, primarily with subsidiaries and affiliates . . . . . . . . . . . . . . . . 332 173 324
Net cash provided by operating activities . . . . . . . . . . . . . . . . . . . . . . . . . . . . . . . . . . . . . . . . 5,193 5,113 4,478
Cash Flows from Investing ActivitiesSales of available-for-sale investment securities . . . . . . . . . . . . . . . . . . . . . . . . . . . . . . . . . . — 111 157Purchase of investments . . . . . . . . . . . . . . . . . . . . . . . . . . . . . . . . . . . . . . . . . . . . . . . . . . . . . . (3) — —Purchase of premises and equipment . . . . . . . . . . . . . . . . . . . . . . . . . . . . . . . . . . . . . . . . . . . (29) (39) (39)Loans to subsidiaries and affiliates . . . . . . . . . . . . . . . . . . . . . . . . . . . . . . . . . . . . . . . . . . . . . (3,952) (2,574) 1,498Investments in subsidiaries and affiliates . . . . . . . . . . . . . . . . . . . . . . . . . . . . . . . . . . . . . . . . — — —
Net cash (used in) provided by investing activities . . . . . . . . . . . . . . . . . . . . . . . . . . . . . . . . (3,984) (2,502) 1,616
Cash Flows from Financing Activities(Principal payments on)/issuance of long-term debt . . . . . . . . . . . . . . . . . . . . . . . . . . . . . . — (655) 843Short-term debt of subsidiaries and affiliates . . . . . . . . . . . . . . . . . . . . . . . . . . . . . . . . . . . . 986 5,118 (1,497)Issuance of American Express preferred shares . . . . . . . . . . . . . . . . . . . . . . . . . . . . . . . . . . 841 742 —Issuance of American Express common shares and other . . . . . . . . . . . . . . . . . . . . . . . . . . 192 362 721Repurchase of American Express common shares . . . . . . . . . . . . . . . . . . . . . . . . . . . . . . . . (4,480) (4,389) (3,943)Dividends paid . . . . . . . . . . . . . . . . . . . . . . . . . . . . . . . . . . . . . . . . . . . . . . . . . . . . . . . . . . . . . . . (1,172) (1,041) (939)
Net cash provided by (used in) financing activities . . . . . . . . . . . . . . . . . . . . . . . . . . . . . . . . (3,633) 137 (4,815)
Net increase (decrease) in cash and cash equivalents . . . . . . . . . . . . . . . . . . . . . . . . . . . . . (2,424) 2,748 1,279Cash and cash equivalents at beginning of year . . . . . . . . . . . . . . . . . . . . . . . . . . . . . . . . . . 8,824 6,076 4,797
Cash and cash equivalents at end of year . . . . . . . . . . . . . . . . . . . . . . . . . . . . . . . . . . . . . . . . $ 6,400 $ 8,824 $ 6,076
Supplemental cash flow informationNon-cash financing activities
Gain on business travel joint venture transaction . . . . . . . . . . . . . . . . . . . . . . . . . . . . . . . $ — $ 630 $ —
158

NOTE 27
QUARTERLY FINANCIAL DATA (UNAUDITED)
(Millions, except per share amounts) 2015 2014
Quarters Ended . . . . . . . . . . . . . . . . . . . . . . . . . . . . 12/31 9/30 6/30 3/31 12/31 9/30 6/30 3/31
Total revenues net of interest expense . . . . . . . . $ 8,391 $8,193 $8,284 $7,950 $ 9,081 $8,303 $ 8,631 $ 8,173Pretax income . . . . . . . . . . . . . . . . . . . . . . . . . . . . . 1,454 1,938 2,230 2,316 2,225 2,246 2,312 2,208Net income . . . . . . . . . . . . . . . . . . . . . . . . . . . . . . . 899 1,266 1,473 1,525 1,447 1,477 1,529 1,432Earnings Per Common Share — Basic:
Net income attributable to commonshareholders (a) . . . . . . . . . . . . . . . . . . . . . . . . $ 0.89 $ 1.24 $ 1.43 $ 1.49 $ 1.40 $ 1.41 $ 1.44 $ 1.34
Earnings Per Common Share — Diluted:Net income attributable to common
shareholders (a) . . . . . . . . . . . . . . . . . . . . . . . . 0.89 1.24 1.42 1.48 1.39 1.40 1.43 1.33Cash dividends declared per common share . . . 0.29 0.29 0.29 0.26 0.26 0.26 0.26 0.23Common share price:
High . . . . . . . . . . . . . . . . . . . . . . . . . . . . . . . . . 77.85 81.66 81.92 93.94 94.89 96.24 96.04 94.35Low . . . . . . . . . . . . . . . . . . . . . . . . . . . . . . . . . . $ 67.57 $ 71.71 $ 76.53 $ 77.12 $ 78.41 $ 85.75 $83.99 $82.63
(a) Represents net income, less (i) earnings allocated to participating share awards of $6 million, $10 million, $11 million and $11 million for thequarters ended December 31, September 30, June 30 and March 31, 2015, respectively, and $11 million, $11 million, $12 million and $12 millionfor the quarters ended December 31, September 30, June 30 and March 31, 2014, respectively, and (ii) dividends on preferred shares of $20million, $22 million and $20 million, for the quarters ended December 31, September 30 and June 30, 2015, respectively, and nil for all othercomparative periods.
159
ITEM 9. CHANGES IN AND DISAGREEMENTS WITH ACCOUNTANTS ON ACCOUNTING ANDFINANCIAL DISCLOSURE
Not applicable.
ITEM 9A. CONTROLS AND PROCEDURESThe Company’s management, with the participation of the Company’s Chief Executive Officer and Chief Financial
Officer, has evaluated the effectiveness of the Company’s disclosure controls and procedures (as such term is definedin Rules 13a-15(e) and 15d-15(e) under the Exchange Act) as of the end of the period covered by this Report. Based onsuch evaluation, our Chief Executive Officer and Chief Financial Officer have concluded that, as of the end of suchperiod, the Company’s disclosure controls and procedures are effective and designed to ensure that the informationrequired to be disclosed in our reports filed or submitted under the Exchange Act is recorded, processed, summarizedand reported within the requisite time periods specified in the applicable rules and forms, and that it is accumulatedand communicated to our management, including our principal executive officer and principal financial officer, asappropriate, to allow timely decisions regarding required disclosure.
There have not been any changes in the Company’s internal control over financial reporting (as such term isdefined in Rules 13a-15(f) and 15d-15(f) under the Exchange Act) during the Company’s fourth quarter that havematerially affected, or are reasonably likely to materially affect, the Company’s internal control over financialreporting.
“Management’s Report on Internal Control over Financial Reporting,” which sets forth management’s evaluationof internal control over financial reporting, and the “Report of Independent Registered Public Accounting Firm” on theeffectiveness of the Company’s internal control over financial reporting as of December 31, 2015 are set forth in“Financial Statements and Supplementary Data.”
ITEM 9B. OTHER INFORMATIONNot applicable.
PART III
ITEMS 10, 11, 12 and 13. DIRECTORS, EXECUTIVE OFFICERS AND CORPORATE GOVERNANCE;EXECUTIVE COMPENSATION; SECURITY OWNERSHIP OF CERTAINBENEFICIAL OWNERS AND MANAGEMENT AND RELATED STOCKHOLDERMATTERS; CERTAIN RELATIONSHIPS AND RELATED TRANSACTIONS,AND DIRECTOR INDEPENDENCE
We expect to file with the SEC in March 2016 (and, in any event, not later than 120 days after the close of our lastfiscal year), a definitive proxy statement, pursuant to SEC Regulation 14A in connection with our Annual Meeting ofShareholders to be held May 2, 2016, which involves the election of directors. The following information to be includedin such proxy statement is incorporated herein by reference:
• Information included under the caption “Corporate Governance at American Express — Our Board’sIndependence”
• Information included under the caption “Corporate Governance at American Express — BoardCommittees — Board Committee Responsibilities”
• Information included under the caption “Proxy Summary and Voting Roadmap — Item 1 Election of DirectorsFor a Term of One Year – Director Attendance”
• Information included under the caption “Corporate Governance at American Express — Compensation ofDirectors”
• Information included under the caption “Stock Ownership Information”
• Information included under the caption “Corporate Governance at American Express — Item 1 — Election ofDirectors for a Term of One Year”
• Information included under the caption “Executive Compensation”
• Information under the caption “Corporate Governance at American Express — Certain Relationships andTransactions”
• Information under the caption “Stock Ownership Information — Section 16(a) Beneficial Ownership ReportingCompliance”
160

In addition, the information regarding executive officers called for by Item 401(b) of Regulation S-K may be foundunder the caption “Executive Officers of the Company” in this Report.
We have adopted a set of Corporate Governance Principles, which together with the charters of the six standingcommittees of the Board of Directors (Audit and Compliance; Compensation and Benefits; Innovation and Technology;Nominating and Governance; Public Responsibility; and Risk), our Code of Conduct (which constitutes our code ofethics) and the Code of Business Conduct for the Members of the Board of Directors, provide the framework for ourgovernance. A complete copy of our Corporate Governance Principles, the charters of each of the Board committees,the Code of Conduct (which applies not only to our Chief Executive Officer, Chief Financial Officer and Comptroller, butalso to all our other employees) and the Code of Business Conduct for the Members of the Board of Directors may befound by clicking on the “Corporate Governance” link found on our Investor Relations website athttp://ir.americanexpress.com. You may also access our Investor Relations website through our main website atwww.americanexpress.com by clicking on the “About American Express” link, which is located at the bottom of theCompany’s homepage. (Information from such sites is not incorporated by reference into this Report.) You may alsoobtain free copies of these materials by writing to our Secretary at our headquarters.
ITEM 14. PRINCIPAL ACCOUNTING FEES AND SERVICES
The information set forth under the heading “Item 2 — Ratification of Appointment of Independent RegisteredPublic Accounting Firm — PricewaterhouseCoopers LLP Fees and Services,” which will appear in our definitive proxystatement in connection with our Annual Meeting of Shareholders to be held May 2, 2016, is incorporated herein byreference.
PART IV
ITEM 15. EXHIBITS, FINANCIAL STATEMENT SCHEDULES
(a)
1. Financial Statements:
See the “Index to Consolidated Financial Statements” under “Financial Statements and Supplementary Data.”
2. Financial Statement Schedules:
All schedules are omitted since the required information is either not applicable, not deemed material, or shown inthe Consolidated Financial Statements.
3. Exhibits:
The list of exhibits required to be filed as exhibits to this Report is listed on pages E-1 through E-4 hereof under“Exhibit Index.”
161
SIGNATURES
Pursuant to the requirements of Section 13 or 15(d) of the Securities Exchange Act of 1934, the Company has dulycaused this report to be signed on its behalf by the undersigned, thereunto duly authorized.
AMERICAN EXPRESS COMPANY
/S/ JEFFREY C. CAMPBELL
Jeffrey C. CampbellExecutive Vice President and
Chief Financial Officer
February 19, 2016
Pursuant to the requirements of the Securities Exchange Act of 1934, this report has been signed below by thefollowing persons on behalf of the Company and in the capacities and on the date indicated.
/S/ KENNETH I. CHENAULT
Kenneth I. ChenaultChairman, Chief Executive Officer and Director
/S/ MICHAEL O. LEAVITT
Michael O. LeavittDirector
/S/ JEFFREY C. CAMPBELL
Jeffrey C. CampbellExecutive Vice President and Chief Financial Officer
/S/ THEODORE J. LEONSIS
Theodore J. LeonsisDirector
/S/ LINDA ZUKAUCKAS
Linda ZukauckasExecutive Vice President and Corporate Comptroller
/S/ RICHARD C. LEVIN
Richard C. LevinDirector
/S/ CHARLENE BARSHEFSKY
Charlene BarshefskyDirector
/S/ SAMUEL J. PALMISANO
Samuel J. PalmisanoDirector
/S/ URSULA M. BURNS
Ursula M. BurnsDirector
/S/ DANIEL VASELLA
Daniel VasellaDirector
/S/ PETER CHERNIN
Peter CherninDirector
/S/ ROBERT D. WALTER
Robert D. WalterDirector
/S/ ANNE LAUVERGEON
Anne LauvergeonDirector
/S/ RONALD A. WILLIAMS
Ronald A. WilliamsDirector
February 19, 2016
162

GUIDE 3 – STATISTICAL DISCLOSURE BY BANK HOLDING COMPANIES
The accompanying supplemental information should be read in conjunction with the “MD&A”, ConsolidatedFinancial Statements and notes thereto. The disclosures presented are excluding amounts associated with CardMember loans and receivables HFS, unless otherwise indicated.
Certain reclassifications of prior period amounts have been made to conform to the current period presentation.These reclassifications did not have a material impact on the Company’s financial position or results of operations.
Distribution of Assets, Liabilities, and Shareholders’ Equity; Interest Rates and Interest Differential
The following tables provide a summary of the Company’s consolidated average balances including majorcategories of interest-earning assets and interest-bearing liabilities along with an analysis of net interest earnings.Consolidated average balances, interest, and average yields are segregated between U.S. and non-U.S. offices. Assets,liabilities, interest income and interest expense are attributed to the United States and outside the United Statesbased on the location of the office recording such items.
2015 2014 2013Years Ended December 31,(Millions, except percentages)
AverageBalance (a)
InterestIncome
AverageYield
AverageBalance (a)
InterestIncome
AverageYield
AverageBalance (a)
InterestIncome
AverageYield
Interest-earning assetsInterest-bearing deposits in other banks (b)
U.S. . . . . . . . . . . . . . . . . . . . . . . . . . . . . . . . . . . . . . . . . $ 19,255 $ 50 0.3% $ 16,851 $ 41 0.2% $19,230 $ 49 0.3%Non-U.S. . . . . . . . . . . . . . . . . . . . . . . . . . . . . . . . . . . . 2,137 16 0.7 2,091 18 0.9 2,409 26 1.1
Federal funds sold and securities purchased underagreements to resellNon-U.S. . . . . . . . . . . . . . . . . . . . . . . . . . . . . . . . . . . . 188 6 3.2 235 8 3.4 136 5 3.7
Short-term investment securitiesU.S. . . . . . . . . . . . . . . . . . . . . . . . . . . . . . . . . . . . . . . . . 12 — — 62 — — 154 — —Non-U.S. . . . . . . . . . . . . . . . . . . . . . . . . . . . . . . . . . . . 393 3 0.8 272 1 0.4 204 1 0.5
Card Member loans, including loans HFS (c)(d)U.S. . . . . . . . . . . . . . . . . . . . . . . . . . . . . . . . . . . . . . . . . 61,911 6,258 10.1 57,826 5,778 10.0 54,845 5,555 10.1Non-U.S. . . . . . . . . . . . . . . . . . . . . . . . . . . . . . . . . . . . 7,093 930 13.1 8,211 1,072 13.1 8,431 1,111 13.2
Other loans (c)U.S. . . . . . . . . . . . . . . . . . . . . . . . . . . . . . . . . . . . . . . . . 891 93 10.4 547 49 9.0 329 29 8.8Non-U.S. . . . . . . . . . . . . . . . . . . . . . . . . . . . . . . . . . . . 154 28 18.2 209 30 14.4 235 23 9.8
Taxable investment securities (e)U.S. . . . . . . . . . . . . . . . . . . . . . . . . . . . . . . . . . . . . . . . . 607 10 1.7 611 10 1.7 596 12 2.1Non-U.S. . . . . . . . . . . . . . . . . . . . . . . . . . . . . . . . . . . . 535 14 2.7 329 13 4.1 255 11 4.5
Non-taxable investment securities (e)U.S. . . . . . . . . . . . . . . . . . . . . . . . . . . . . . . . . . . . . . . . . 3,083 133 6.9 3,806 154 6.4 4,331 175 6.3
Other assets (f)Primarily U.S. . . . . . . . . . . . . . . . . . . . . . . . . . . . . . . . 1 4 n.m. 45 5 n.m. 222 8 n.m.
Total interest-earningassets (g) . . . . . . . . . . . . . . . . . . . . . . . . . . . . . . . . $96,260 $ 7,545 7.9% $91,095 $ 7,179 8.0% $ 91,377 $7,005 7.8%
U.S. . . . . . . . . . . . . . . . . . . . . . . . . . . . . . . . . . . . . . . . . 85,760 6,548 79,748 6,037 79,707 5,828Non-U.S. . . . . . . . . . . . . . . . . . . . . . . . . . . . . . . . . . . . 10,500 997 11,347 1,142 11,670 1,177
A-1

2015 2014 2013
Years Ended December 31, (Millions, except percentages)Average
Balance (a)Average
Balance (a)Average
Balance (a)
Non-interest-earning assetsCash and due from banks
U.S. . . . . . . . . . . . . . . . . . . . . . . . . . . . . . . . . . . . . . . . . . . . . . . . . . . . . . . . . . . . . . . . . . . . . . . . . . . . $ 2,501 $ 2,125 $ 2,082Non-U.S. . . . . . . . . . . . . . . . . . . . . . . . . . . . . . . . . . . . . . . . . . . . . . . . . . . . . . . . . . . . . . . . . . . . . . . . 565 671 580
Card Member receivables, net, including receivables HFS (d)
U.S. . . . . . . . . . . . . . . . . . . . . . . . . . . . . . . . . . . . . . . . . . . . . . . . . . . . . . . . . . . . . . . . . . . . . . . . . . . . 22,126 21,679 21,197Non-U.S. . . . . . . . . . . . . . . . . . . . . . . . . . . . . . . . . . . . . . . . . . . . . . . . . . . . . . . . . . . . . . . . . . . . . . . . 21,667 22,701 21,386
Other receivables, netU.S. . . . . . . . . . . . . . . . . . . . . . . . . . . . . . . . . . . . . . . . . . . . . . . . . . . . . . . . . . . . . . . . . . . . . . . . . . . . 1,678 1,585 1,553Non-U.S. . . . . . . . . . . . . . . . . . . . . . . . . . . . . . . . . . . . . . . . . . . . . . . . . . . . . . . . . . . . . . . . . . . . . . . . 1,032 1,618 1,733
Reserves for Card Member and other loans lossesU.S. . . . . . . . . . . . . . . . . . . . . . . . . . . . . . . . . . . . . . . . . . . . . . . . . . . . . . . . . . . . . . . . . . . . . . . . . . . . (1,004) (1,014) (1,172)Non-U.S. . . . . . . . . . . . . . . . . . . . . . . . . . . . . . . . . . . . . . . . . . . . . . . . . . . . . . . . . . . . . . . . . . . . . . . . (153) (173) (185)
Other assets (h)
U.S. . . . . . . . . . . . . . . . . . . . . . . . . . . . . . . . . . . . . . . . . . . . . . . . . . . . . . . . . . . . . . . . . . . . . . . . . . . . 10,218 10,686 10,868Non-U.S. . . . . . . . . . . . . . . . . . . . . . . . . . . . . . . . . . . . . . . . . . . . . . . . . . . . . . . . . . . . . . . . . . . . . . . . 3,837 3,453 2,862
Total non-interest-earning assets . . . . . . . . . . . . . . . . . . . . . . . . . . . . . . . . . . . . . . . . . . . . . . . 62,467 63,331 60,904
U.S. . . . . . . . . . . . . . . . . . . . . . . . . . . . . . . . . . . . . . . . . . . . . . . . . . . . . . . . . . . . . . . . . . . . . . . . . . . 35,519 35,061 34,528Non-U.S. . . . . . . . . . . . . . . . . . . . . . . . . . . . . . . . . . . . . . . . . . . . . . . . . . . . . . . . . . . . . . . . . . . . . . 26,948 28,270 26,376
Total assets . . . . . . . . . . . . . . . . . . . . . . . . . . . . . . . . . . . . . . . . . . . . . . . . . . . . . . . . . . . . . . . . . . . $158,727 $154,426 $152,281
U.S. . . . . . . . . . . . . . . . . . . . . . . . . . . . . . . . . . . . . . . . . . . . . . . . . . . . . . . . . . . . . . . . . . . . . . . . . . . 121,279 114,809 114,235Non-U.S. . . . . . . . . . . . . . . . . . . . . . . . . . . . . . . . . . . . . . . . . . . . . . . . . . . . . . . . . . . . . . . . . . . . . . 37,448 39,617 38,046
Percentage of total average assets attributable to non-U.S. activities . . . . . . . . . . . . . . . . . . 23.6% 25.7% 25.0%
(a) Averages based on month end balances.(b) Amounts include (i) average interest-bearing restricted cash balances of $818 million, $945 million and $832 million for 2015, 2014 and 2013,
respectively, which are included in other assets on the Consolidated Balance Sheets, and (ii) the associated interest income.(c) Average non-accrual loans were included in the average Card Member loan balances in amounts of $202 million, $269 million and $349 million
in U.S. as well as nil, nil and $4 million in non-U.S. for 2015, 2014 and 2013, respectively. Average other loan balances for U.S. include averagenon-accrual loans of $1 million, nil and nil for 2015, 2014 and 2013, respectively. Average non-accrual loans are considered to determine theaverage yield on loans.
(d) Amount for 2015 include average Card Member loans and average Card Member receivables HFS of $1,143 million and $10 million, respectively,and the associated interest income.
(e) Average yields for both taxable and non taxable investment securities have been calculated using amortized cost balances and do not includechanges in fair value recorded in other comprehensive loss. Average yield on non-taxable investment securities is calculated on a tax-equivalentbasis using the U.S. federal statutory tax rate of 35 percent.
(f) Amounts include (i) average equity securities balances, which are included in investment securities on the Consolidated Balance Sheets, and(ii) the associated income. The average yield on other assets has not been shown as it would not be meaningful (n.m.).
(g) The average yield on total interest-earning assets is adjusted for the impacts of the items mentioned in footnote (e).(h) Includes premises and equipment, net of accumulated depreciation and amortization.
A-2

2015 2014 2013Years Ended December 31,(Millions, except percentages)
AverageBalance (a)
InterestExpense
AverageRate
AverageBalance (a)
InterestExpense
AverageRate
AverageBalance (a)
InterestExpense
AverageRate
Interest-bearing liabilitiesCustomer deposits
U.S.Savings . . . . . . . . . . . . . . . . . . . . . . . . . . . . . . . . . $ 36,706 $ 283 0.8% $ 34,689 239 0.7% $ 31,650 232 0.7%Time . . . . . . . . . . . . . . . . . . . . . . . . . . . . . . . . . . . . 10,171 185 1.8 6,961 129 1.9 9,047 206 2.3Demand . . . . . . . . . . . . . . . . . . . . . . . . . . . . . . . . . 185 1 0.5 176 1 0.6 228 1 0.4
Non-U.S.Other time and savings . . . . . . . . . . . . . . . . . . . . 21 2 9.5 7 1 14.3 3 — 6.4Other demand . . . . . . . . . . . . . . . . . . . . . . . . . . . 87 4 4.6 104 3 2.9 121 3 2.6
Short-term borrowingsU.S. . . . . . . . . . . . . . . . . . . . . . . . . . . . . . . . . . . . . . . 1,416 4 0.3 1,060 2 0.2 767 1 0.1Non-U.S. . . . . . . . . . . . . . . . . . . . . . . . . . . . . . . . . . . 2,198 15 0.7 2,534 21 0.8 2,454 21 0.9
Long-term debt (b)U.S. . . . . . . . . . . . . . . . . . . . . . . . . . . . . . . . . . . . . . . 51,623 1,092 2.1 52,476 1,226 2.3 52,125 1,392 2.7Non-U.S. . . . . . . . . . . . . . . . . . . . . . . . . . . . . . . . . . . 1,271 29 2.3 2,206 60 2.7 2,553 78 3.1
Other liabilities (c)Primarily U.S. . . . . . . . . . . . . . . . . . . . . . . . . . . . . . . 133 8 n.m. 353 25 n.m. 325 24 n.m.
Total interest-bearing liabilities . . . . . . . . . . . . $ 103,811 $ 1,623 1.6% $100,566 $ 1,707 1.7% $ 99,273 $ 1,958 2.0%
U.S. . . . . . . . . . . . . . . . . . . . . . . . . . . . . . . . . . . . . 100,234 1,573 95,715 1,622 94,142 1,856Non-U.S. . . . . . . . . . . . . . . . . . . . . . . . . . . . . . . . . 3,577 50 4,851 85 5,131 102
Non-interest-bearing liabilitiesTravelers Cheques and other prepaid products
U.S. . . . . . . . . . . . . . . . . . . . . . . . . . . . . . . . . . . . . . . 3,160 3,641 4,075Non-U.S. . . . . . . . . . . . . . . . . . . . . . . . . . . . . . . . . . . 110 128 129
Accounts payableU.S. . . . . . . . . . . . . . . . . . . . . . . . . . . . . . . . . . . . . . . 7,238 7,321 7,225Non-U.S. . . . . . . . . . . . . . . . . . . . . . . . . . . . . . . . . . . 4,589 5,084 4,989
Customer Deposits (d)U.S. . . . . . . . . . . . . . . . . . . . . . . . . . . . . . . . . . . . . . . 386 349 167Non-U.S. . . . . . . . . . . . . . . . . . . . . . . . . . . . . . . . . . . 324 358 229
Other liabilitiesU.S. . . . . . . . . . . . . . . . . . . . . . . . . . . . . . . . . . . . . . . 13,302 12,350 12,507Non-U.S. . . . . . . . . . . . . . . . . . . . . . . . . . . . . . . . . . . 4,313 4,375 4,433
Total non-interest-bearing liabilities . . . . . . . . 33,422 33,606 33,754
U.S. . . . . . . . . . . . . . . . . . . . . . . . . . . . . . . . . . . . . 24,086 23,661 23,974Non-U.S. . . . . . . . . . . . . . . . . . . . . . . . . . . . . . . . . 9,336 9,945 9,780
Total liabilities . . . . . . . . . . . . . . . . . . . . . . . . . . . . 137,233 134,172 133,027
U.S. . . . . . . . . . . . . . . . . . . . . . . . . . . . . . . . . . . . . 124,320 119,376 118,116Non-U.S. . . . . . . . . . . . . . . . . . . . . . . . . . . . . . . . . 12,913 14,796 14,911
Total shareholders’ equity . . . . . . . . . . . . . . . . . 21,494 20,254 19,254
Total liabilities and shareholders’ equity . . . . . . $ 158,727 $ 154,426 $ 152,281
Percentage of total average liabilitiesattributable to non-U.S. activities . . . . . . . . . . . . 9.4% 11.0% 11.2%Interest rate spread . . . . . . . . . . . . . . . . . . . . . . . . . 6.3% 6.3% 5.8%
Net interest income and net average yield oninterest-earning assets (e) . . . . . . . . . . . . . . . . . $5,922 6.2% $5,472 6.1% $5,047 5.6%
(a) Averages based on month end balances.(b) Interest expense incurred on derivative instruments in qualifying hedging relationships has been reported along with the related interest
expense incurred on the hedged debt instrument.(c) Amounts include (i) average deferred compensation liability balances, which are included in other liabilities on the Consolidated Balance Sheets,
and (ii) the associated interest expense. The average rate on other liabilities has not been shown as it would not be meaningful (n.m.).(d) U.S. non-interest-bearing Customer deposits include average Card Member credit balances of $326 million, $313 million and $150 million for
2015, 2014 and 2013, respectively, and non-U.S. non-interest-bearing Customer deposits include average Card Member credit balances of $311million, $344 million and $219 million for 2015, 2014 and 2013, respectively.
(e) Net average yield on interest-earning assets is defined as net interest income divided by average total interest-earning assets as adjusted forthe items mentioned in footnote (e) from the previous table.
A-3

Changes in Net Interest Income — Volume and Rate Analysis (a)
The following table presents the amount of changes in interest income and interest expense due to changes inboth average volume and average rate. Major categories of interest-earning assets and interest-bearing liabilities havebeen segregated between U.S. and non-U.S. offices. Average volume/rate changes have been allocated between theaverage volume and average rate variances on a consistent basis based upon the respective percentage changes inaverage balances and average rates.
2015 vs. 2014 2014 vs. 2013Increase
(Decrease) due tochange in:
Increase(Decrease) due to
change in:
Years Ended December 31, (Millions)AverageVolume
AverageRate
NetChange
AverageVolume
AverageRate
NetChange
Interest-earning assetsInterest-bearing deposits in other banks
U.S. . . . . . . . . . . . . . . . . . . . . . . . . . . . . . . . . . . . . . . . . . . . . . . . . . . . . $ 6 $ 3 $ 9 $ (6) $ (2) $ (8)Non-U.S. . . . . . . . . . . . . . . . . . . . . . . . . . . . . . . . . . . . . . . . . . . . . . . . — (2) (2) (3) (5) (8)
Federal funds sold and securities purchased under agreementsto resellNon-U.S. . . . . . . . . . . . . . . . . . . . . . . . . . . . . . . . . . . . . . . . . . . . . . . . (2) — (2) 4 (1) 3
Short-term investment securitiesU.S. . . . . . . . . . . . . . . . . . . . . . . . . . . . . . . . . . . . . . . . . . . . . . . . . . . . . — — — — — —Non-U.S. . . . . . . . . . . . . . . . . . . . . . . . . . . . . . . . . . . . . . . . . . . . . . . . — 2 2 — — —
Card Member loans, including loans HFSU.S. . . . . . . . . . . . . . . . . . . . . . . . . . . . . . . . . . . . . . . . . . . . . . . . . . . . . 408 72 480 302 (79) 223Non-U.S. . . . . . . . . . . . . . . . . . . . . . . . . . . . . . . . . . . . . . . . . . . . . . . . (146) 4 (142) (29) (10) (39)
Other loansU.S. . . . . . . . . . . . . . . . . . . . . . . . . . . . . . . . . . . . . . . . . . . . . . . . . . . . . 31 13 44 19 1 20Non-U.S. . . . . . . . . . . . . . . . . . . . . . . . . . . . . . . . . . . . . . . . . . . . . . . . (8) 6 (2) (3) 10 7
Taxable investment securitiesU.S. . . . . . . . . . . . . . . . . . . . . . . . . . . . . . . . . . . . . . . . . . . . . . . . . . . . . — — — — (2) (2)Non-U.S. . . . . . . . . . . . . . . . . . . . . . . . . . . . . . . . . . . . . . . . . . . . . . . . 8 (7) 1 3 (1) 2
Non-taxable investment securitiesU.S. . . . . . . . . . . . . . . . . . . . . . . . . . . . . . . . . . . . . . . . . . . . . . . . . . . . . (30) 9 (21) (23) 2 (21)
Other assetsPrimarily U.S. . . . . . . . . . . . . . . . . . . . . . . . . . . . . . . . . . . . . . . . . . . . (5) 4 (1) (6) 3 (3)
Change in interest income . . . . . . . . . . . . . . . . . . . . . . . . . . . . 262 104 366 258 (84) 174Interest-bearing liabilities
Customer depositsU.S.
Savings . . . . . . . . . . . . . . . . . . . . . . . . . . . . . . . . . . . . . . . . . . . . . . 14 30 44 22 (15) 7Time . . . . . . . . . . . . . . . . . . . . . . . . . . . . . . . . . . . . . . . . . . . . . . . . . 59 (3) 56 (47) (30) (77)Demand . . . . . . . . . . . . . . . . . . . . . . . . . . . . . . . . . . . . . . . . . . . . . . — — — — — —
Non-U.S.Other time and savings . . . . . . . . . . . . . . . . . . . . . . . . . . . . . . . . . 2 (1) 1 — 1 1Other demand . . . . . . . . . . . . . . . . . . . . . . . . . . . . . . . . . . . . . . . . — 1 1 — — —
Short-term borrowingsU.S. . . . . . . . . . . . . . . . . . . . . . . . . . . . . . . . . . . . . . . . . . . . . . . . . . . . . 1 1 2 — 1 1Non-U.S. . . . . . . . . . . . . . . . . . . . . . . . . . . . . . . . . . . . . . . . . . . . . . . . (3) (3) (6) 1 (1) —
Long-term debtU.S. . . . . . . . . . . . . . . . . . . . . . . . . . . . . . . . . . . . . . . . . . . . . . . . . . . . . (20) (114) (134) 9 (175) (166)Non-U.S. . . . . . . . . . . . . . . . . . . . . . . . . . . . . . . . . . . . . . . . . . . . . . . . (25) (6) (31) (11) (7) (18)
Other liabilitiesPrimarily U.S. . . . . . . . . . . . . . . . . . . . . . . . . . . . . . . . . . . . . . . . . . . . (16) (1) (17) 2 (1) 1
Change in interest expense . . . . . . . . . . . . . . . . . . . . . . . . . . . 12 (96) (84) (24) (227) (251)Change in net interest income . . . . . . . . . . . . . . . . . . . . . . . . . $ 250 $200 $ 450 $282 $ 143 $ 425
(a) Refer to footnotes from “Distribution of Assets, Liabilities and Shareholders’ Equity” for additional information.
A-4

Loans and Card Member Receivables Portfolios
The following table presents gross loans and Card Member receivables by customer type, segregated betweenU.S. and non-U.S., based on the domicile of the borrowers. Refer to Notes 3 and 4 to the Consolidated FinancialStatements for additional information.
December 31, (Millions) 2015 2014 2013 2012 2011
Loans (a) (b)
U.S. loansCard Member (c) (d) . . . . . . . . . . . . . . . . . . . . . . . . . . . . . . . $ 51,446 $ 62,592 $ 58,530 $ 56,104 $ 53,850Other (e) . . . . . . . . . . . . . . . . . . . . . . . . . . . . . . . . . . . . . . . . 1,073 726 411 285 108
Non-U.S. loansCard Member (c) (d) . . . . . . . . . . . . . . . . . . . . . . . . . . . . . . . 7,127 7,793 8,708 9,125 8,771Other (e) . . . . . . . . . . . . . . . . . . . . . . . . . . . . . . . . . . . . . . . . 201 206 210 286 329
Total loans . . . . . . . . . . . . . . . . . . . . . . . . . . . . . . . . . . . $ 59,847 $ 71,317 $ 67,859 $ 65,800 $ 63,058
Card Member receivables (a) (b)
U.S. Card Member receivablesConsumer (f) . . . . . . . . . . . . . . . . . . . . . . . . . . . . . . . . . . . . 23,255 22,468 21,842 21,124 20,645Commercial (g) . . . . . . . . . . . . . . . . . . . . . . . . . . . . . . . . . . . 8,961 9,082 8,480 7,924 7,495
Non-U.S. Card Member receivablesConsumer (f) . . . . . . . . . . . . . . . . . . . . . . . . . . . . . . . . . . . . 7,101 7,800 7,930 7,967 7,412Commercial (g) . . . . . . . . . . . . . . . . . . . . . . . . . . . . . . . . . . . 4,816 5,501 5,911 5,751 5,338
Total Card Member receivables . . . . . . . . . . . . . . . . . . $ 44,133 $ 44,851 $ 44,163 $ 42,766 $ 40,890
(a) As of December 31, 2015, the Company had approximately $211 billion of unused credit available to Card Members as part of establishedlending product agreements. Total unused credit available to Card Members does not represent potential future cash requirements, as asignificant portion of this unused credit will likely not be drawn. The Company’s charge card products generally have no preset spending limit,the associated credit limit on charge products is not quantifiable, and therefore is not reflected in unused credit available to Card Members.
(b) As of December 31, 2015, the Company’s exposure to any concentration of gross loans and Card Member receivables combined, which exceeds10 percent of total loans and Card Member receivables is further split between $89 billion for individuals and $15 billion for commercial. Loansand Card Member receivables concentrations are defined as loans and Card Member receivables due from multiple borrowers engaged insimilar activities that would cause these borrowers to be impacted similarly to certain economic or other related conditions. Refer to Note 24 tothe Consolidated Financial Statements for additional information on concentrations.
(c) Card Member loans include unamortized net card fees of $140 million for 2011. Beginning in 2012, unamortized net card fees are reported underOther liabilities.
(d) Represents loans to individual and small business consumers.(e) Other loans primarily represent loans to merchants.(f) Represents receivables from individual and small business charge card consumers.(g) Represents receivables from corporate charge card clients.
A-5

Maturities and Sensitivities to Changes in Interest Rates
The following table presents contractual maturities of loans and Card Member receivables by customer type, andsegregated between U.S. and non-U.S. borrowers, and distribution between fixed and floating interest rates for loansdue after one year based upon the stated terms of the loan agreements.
December 31, (Millions) 2015Within
1 year (a) (b)1-5
years (b) (c)After
5 years (c) Total
LoansU.S. loans
Card Member . . . . . . . . . . . . . . . . . . . . . . . . . . . . . . . . . . . . . . . . . . . . . . . . . $ 51,393 $ 53 $ — $51,446Other . . . . . . . . . . . . . . . . . . . . . . . . . . . . . . . . . . . . . . . . . . . . . . . . . . . . . . . . 646 248 179 1,073
Non-U.S. loansCard Member . . . . . . . . . . . . . . . . . . . . . . . . . . . . . . . . . . . . . . . . . . . . . . . . . 7,125 1 1 7,127Other . . . . . . . . . . . . . . . . . . . . . . . . . . . . . . . . . . . . . . . . . . . . . . . . . . . . . . . . 119 82 — 201
Total loans . . . . . . . . . . . . . . . . . . . . . . . . . . . . . . . . . . . . . . . . . . . . . . . . . . . $59,283 $384 $180 $59,847
Loans due after one year at fixed interest rates . . . . . . . . . . . . . . . . . . . $308 $ 79 $ 387Loans due after one year at variable interest rates . . . . . . . . . . . . . . . . 76 101 177
Total loans . . . . . . . . . . . . . . . . . . . . . . . . . . . . . . . . . . . . . . . . . . . . . . . $384 $180 $ 564
Card Member receivablesU.S. Card Member receivables
Consumer . . . . . . . . . . . . . . . . . . . . . . . . . . . . . . . . . . . . . . . . . . . . . . . . . . . . $23,252 $ 3 $ — $23,255Commercial . . . . . . . . . . . . . . . . . . . . . . . . . . . . . . . . . . . . . . . . . . . . . . . . . . 8,961 — — 8,961
Non-U.S. Card Member receivablesConsumer . . . . . . . . . . . . . . . . . . . . . . . . . . . . . . . . . . . . . . . . . . . . . . . . . . . . 7,101 — — 7,101Commercial . . . . . . . . . . . . . . . . . . . . . . . . . . . . . . . . . . . . . . . . . . . . . . . . . . 4,816 — — 4,816
Total Card Member receivables . . . . . . . . . . . . . . . . . . . . . . . . . . . . . . $44,130 $ 3 $ — $44,133
(a) Card Member loans have no stated maturity and are therefore included in the due within one year category. However, many of the Company’sCard Members will revolve their balances, which may extend their repayment period beyond one year for balances due at December 31, 2015.
(b) Card Member receivables are immediately due upon receipt of Card Member statements and have no stated interest rate and are includedwithin the due within one year category. Receivables due after one year represent modification programs classified as Troubled DebtRestructurings (TDRs), wherein the terms of a receivable have been modified for Card Members that are experiencing financial difficulties and along-term concession (more than 12 months) has been granted to the borrower.
(c) Card Member and other loans due after one year primarily represent installment loans and approximately $55 million of TDRs.
A-6

Risk Elements
The following table presents the amounts of non-performing loans and Card Member receivables that are eithernon-accrual, past due, or restructured, segregated between U.S. and non-U.S. borrowers. Past due loans are loansthat are contractually past due 90 days or more as to principal or interest payments. Restructured loans and CardMember receivables are those that meet the definition of a TDR.
December 31, (Millions) 2015 2014 2013 2012 2011
LoansNon-accrual loans (a)
U.S. . . . . . . . . . . . . . . . . . . . . . . . . . . . . . . . . . . . . . . . . . . . . . . . . . . . . . . . . . . . . $ 154 $ 241 $ 294 $ 433 $ 529Non-U.S. . . . . . . . . . . . . . . . . . . . . . . . . . . . . . . . . . . . . . . . . . . . . . . . . . . . . . . . . — — 4 8 9
Total non-accrual loans . . . . . . . . . . . . . . . . . . . . . . . . . . . . . . . . . . . . . . . . . . 154 241 298 441 538
Loans contractually 90 days past-due and still accruing interest (b)
U.S. . . . . . . . . . . . . . . . . . . . . . . . . . . . . . . . . . . . . . . . . . . . . . . . . . . . . . . . . . . . . 164 162 174 77 64Non-U.S. . . . . . . . . . . . . . . . . . . . . . . . . . . . . . . . . . . . . . . . . . . . . . . . . . . . . . . . . 52 58 54 61 70
Total loans contractually 90 days past-due and still accruing interest . . . 216 220 228 138 134
Restructured loans (c)
U.S. . . . . . . . . . . . . . . . . . . . . . . . . . . . . . . . . . . . . . . . . . . . . . . . . . . . . . . . . . . . . 279 286 351 627 736Non-U.S. . . . . . . . . . . . . . . . . . . . . . . . . . . . . . . . . . . . . . . . . . . . . . . . . . . . . . . . . — — 5 6 8
Total restructured loans . . . . . . . . . . . . . . . . . . . . . . . . . . . . . . . . . . . . . . . . . 279 286 356 633 744
Total non-performing loans . . . . . . . . . . . . . . . . . . . . . . . . . . . . . . . . . . . . $ 649 $ 747 $ 882 $ 1,212 $ 1,416
Card Member receivablesRestructured Card Member receivables (c)
U.S. . . . . . . . . . . . . . . . . . . . . . . . . . . . . . . . . . . . . . . . . . . . . . . . . . . . . . . . . . . . . 33 48 50 117 174
Total restructured Card Member receivables . . . . . . . . . . . . . . . . . . . . $ 33 $ 48 $ 50 $ 117 $ 174
(a) Non-accrual loans not in modification programs primarily include certain Card Member loans placed with outside collection agencies for whichthe Company has ceased accruing interest.
(b) The Company’s policy is generally to accrue interest through the date of write-off (typically 180 days past due). The Company establishesreserves for interest that it believes will not be collected. Amounts presented exclude loans classified as a TDR.
(c) The Company may modify, through various programs, Card Member loans and receivables in instances where the Card Member is experiencingfinancial difficulty in order to minimize losses and improve collectability, while providing Card Members with temporary or permanent financialrelief. The Company has classified Card Member loans and receivables in these modification programs as TDRs. Such modifications to the loansand receivables primarily include (i) temporary interest rate reductions (possibly as low as zero percent, in which case the loan is characterizedas non-accrual in the Company’s TDR disclosures), (ii) placing the Card Member on a fixed payment plan not to exceed 60 months and(iii) suspending delinquency fees until the Card Member exits the modification program. Beginning January 1, 2015, on a prospective basis theCompany continues to classify Card Member accounts that have exited a modification program as a TDR, with such accounts identified as “Outof Program TDRs”. Refer to Note 3 to the Consolidated Financial Statements for additional information.
A-7

Impact of Non-performing Loans on Interest Income
The following table presents the gross interest income for both non-accrual and restructured loans for 2015 thatwould have been recognized if such loans had been current in accordance with their original contractual terms, andhad been outstanding throughout the period or since origination if held for only part of 2015. The table also presentsthe interest income related to these loans that was actually recognized for the period. These amounts are segregatedbetween U.S. and non-U.S. borrowers.
2015Year Ended December 31, (Millions) U.S. Non-U.S. Total
Gross amount of interest income that would have been recorded in accordance with theoriginal contractual terms (a) . . . . . . . . . . . . . . . . . . . . . . . . . . . . . . . . . . . . . . . . . . . . . . . . . . . . . . . $ 66 $ — $ 66
Interest income actually recognized . . . . . . . . . . . . . . . . . . . . . . . . . . . . . . . . . . . . . . . . . . . . . . . . . . 17 — 17
Total interest revenue foregone . . . . . . . . . . . . . . . . . . . . . . . . . . . . . . . . . . . . . . . . . . . . . . . . . $ 49 $ — $ 49
(a) The Company determines the original effective interest rate as the interest rate in effect prior to the imposition of any penalty interest rate.
Potential Problem Loans and Receivables
This disclosure presents outstanding amounts as well as specific reserves for certain loans and receivables whereinformation about possible credit problems of the borrowers causes management to have serious doubts as to theability of such borrowers to comply with the present repayment terms. At December 31, 2015, the Company did notidentify any potential problem loans or receivables within the Card Member loans and receivables portfolio that werenot already included in the “Risk Elements” section.
A-8

Cross-border Outstandings
Cross-border disclosure is based upon the Federal Financial Institutions Examination Council’s (FFIEC) guidelinesgoverning the determination of cross-border risk, which have been revised effective December 31, 2013, and thisdisclosure has been revised accordingly.
The primary differences between the FFIEC and Guide 3 guidelines for reporting cross-border exposure are: i) theFFIEC methodology includes mark-to-market exposures of derivative assets which are excluded under Guide 3; and ii)investments in unconsolidated subsidiaries are included under FFIEC but excluded under Guide 3.
The following table presents the aggregate amount of cross-border outstandings from borrowers orcounterparties for each foreign country that exceeds 1 percent of consolidated total assets for any of the periodsreported below. Cross-border outstandings include loans, receivables, interest-bearing deposits with other banks,other interest-bearing investments and other monetary assets that are denominated in either dollars or other non-local currency.
The table separately presents the amounts of cross-border outstandings by type of borrower includingGovernments and official institutions, Banks and other financial institutions, Non-Bank Financial Institutions (NBFIs)and Other.
Years Ended December 31,(Millions)
Governmentsand officialinstitutions
Banks andother
financialinstitutions NBFIs Other
Totalcross-borderoutstandings
Grossforeign-
officeliabilities
Totalexposure
(net ofliabilities)
Cross-bordercommitments
Australia . . . . . . . . . . . . . . . . . . . . . . . . . . . . . . . . . . . 2015 $ — $ 193 $ — $ 2,786 $2,979 $ 419 $2,560 $ 5,4102014 — 287 — 3,089 3,376 488 2,888 5,9152013 8 227 — 3,499 3,734 529 3,205 6,648
Canada . . . . . . . . . . . . . . . . . . . . . . . . . . . . . . . . . . . . 2015 $356 $ 705 $36 $2,433 $3,530 $1,383 $ 2,147 $11,8452014 710 353 52 3,416 4,531 1,731 2,800 17,7632013 513 890 57 4,271 5,731 3,027 2,704 19,927
United Kingdom . . . . . . . . . . . . . . . . . . . . . . . . . . . . . 2015 $ 107 $2,068 $32 $3,422 $5,629 $3,174 $2,455 $12,2932014 23 2,415 16 3,466 5,920 3,465 2,455 11,1832013 37 2,164 17 3,205 5,423 3,318 2,105 10,291
Mexico . . . . . . . . . . . . . . . . . . . . . . . . . . . . . . . . . . . . . 2015 $ 98 $ 61 $ 8 $ 1,890 $2,057 $ 552 $ 1,505 $ 1,0532014 115 241 5 1,997 2,358 622 1,736 1,1542013 128 191 7 2,133 2,459 647 1,812 1,313
Japan . . . . . . . . . . . . . . . . . . . . . . . . . . . . . . . . . . . . . . 2015 $ 4 $ 56 $92 $2,058 $ 2,210 $2,071 $ 139 $ 792014 1 41 62 1,824 1,928 1,804 124 662013 1 64 31 1,812 1,908 1,794 114 68
Other countries (a) . . . . . . . . . . . . . . . . . . . . . . . . . . . 2015 $ 81 $ 154 $ 11 $4,025 $ 4,271 $ 835 $3,436 $ 6132014 105 208 17 4,951 5,281 976 4,305 7062013 127 203 16 4,351 4,697 1,034 3,663 832
(a) Cross-border outstandings between 0.75 percent and 1.0 percent of consolidated total assets are included in Other Countries. Forcomparability, countries that meet the threshold for any year presented are included for all years. Countries included are France, Italy,Netherlands and Germany.
A-9

Summary of Loan Loss Experience — Analysis of the Allowance for Loan Losses
The following table summarizes the changes to the Company’s allowance for Card Member loan losses. The tablesegregates such changes between U.S. and non-U.S. borrowers.
Years Ended December 31, (Millions, except percentages) 2015 2014 2013 2012 2011
Card Member loansAllowance for loan losses at beginning of year
U.S. loans . . . . . . . . . . . . . . . . . . . . . . . . . . . . . . . . . . . . . . . . . . . . . . . . . . . . . . . . . . . . . . . . . $ 1,036 $ 1,083 $ 1,274 $ 1,611 $ 3,153Non-U.S. loans . . . . . . . . . . . . . . . . . . . . . . . . . . . . . . . . . . . . . . . . . . . . . . . . . . . . . . . . . . . . 165 178 197 263 493
Total allowance for losses . . . . . . . . . . . . . . . . . . . . . . . . . . . . . . . . . . . . . . . . . . . . . . . . . . . 1,201 1,261 1,471 1,874 3,646
Card Member lending provisions (a)
U.S. loans . . . . . . . . . . . . . . . . . . . . . . . . . . . . . . . . . . . . . . . . . . . . . . . . . . . . . . . . . . . . . . . . . 1,032 944 916 882 79Non-U.S. loans . . . . . . . . . . . . . . . . . . . . . . . . . . . . . . . . . . . . . . . . . . . . . . . . . . . . . . . . . . . . 158 194 199 148 66
Total Card Member lending provisions . . . . . . . . . . . . . . . . . . . . . . . . . . . . . . . . . . . 1,190 1,138 1,115 1,030 145
Write-offsU.S. loans . . . . . . . . . . . . . . . . . . . . . . . . . . . . . . . . . . . . . . . . . . . . . . . . . . . . . . . . . . . . . . . . . (1,321) (1,346) (1,463) (1,621) (2,105)Non-U.S. loans . . . . . . . . . . . . . . . . . . . . . . . . . . . . . . . . . . . . . . . . . . . . . . . . . . . . . . . . . . . . (226) (269) (280) (309) (394)
Total write-offs . . . . . . . . . . . . . . . . . . . . . . . . . . . . . . . . . . . . . . . . . . . . . . . . . . . . . . . . . (1,547) (1,615) (1,743) (1,930) (2,499)
RecoveriesU.S. loans . . . . . . . . . . . . . . . . . . . . . . . . . . . . . . . . . . . . . . . . . . . . . . . . . . . . . . . . . . . . . . . . . 359 356 368 395 477Non-U.S. loans . . . . . . . . . . . . . . . . . . . . . . . . . . . . . . . . . . . . . . . . . . . . . . . . . . . . . . . . . . . . 59 72 84 98 101
Total recoveries . . . . . . . . . . . . . . . . . . . . . . . . . . . . . . . . . . . . . . . . . . . . . . . . . . . . . . . . 418 428 452 493 578
Net write-offs (b) . . . . . . . . . . . . . . . . . . . . . . . . . . . . . . . . . . . . . . . . . . . . . . . . . . . . . . . . . . . . (1,129) (1,187) (1,291) (1,437) (1,921)
Transfer of reserves on HFS loans portfoliosU.S. loans . . . . . . . . . . . . . . . . . . . . . . . . . . . . . . . . . . . . . . . . . . . . . . . . . . . . . . . . . . . . . . . . . (224) — — — —
Other (c)
U.S. loans . . . . . . . . . . . . . . . . . . . . . . . . . . . . . . . . . . . . . . . . . . . . . . . . . . . . . . . . . . . . . . . . . — (1) (12) 7 7Non-U.S. loans . . . . . . . . . . . . . . . . . . . . . . . . . . . . . . . . . . . . . . . . . . . . . . . . . . . . . . . . . . . . (10) (10) (22) (3) (3)
Total other . . . . . . . . . . . . . . . . . . . . . . . . . . . . . . . . . . . . . . . . . . . . . . . . . . . . . . . . . . . . . . . . . (10) (11) (34) 4 4
Allowance for loan losses at end of yearU.S. loans . . . . . . . . . . . . . . . . . . . . . . . . . . . . . . . . . . . . . . . . . . . . . . . . . . . . . . . . . . . . . . . . . 882 1,036 1,083 1,274 1,611Non-U.S. loans . . . . . . . . . . . . . . . . . . . . . . . . . . . . . . . . . . . . . . . . . . . . . . . . . . . . . . . . . . . . 146 165 178 197 263
Total allowance for losses . . . . . . . . . . . . . . . . . . . . . . . . . . . . . . . . . . . . . . . . . . . . . . . . . . . $ 1,028 $ 1,201 $ 1,261 $ 1,471 $ 1,874
Principal only net write-offs / average Card Member loans outstanding (d) (e) . . . . 1.4% 1.5% 1.8% 2.1% 2.9%Principal, interest and fees net write-offs /
average Card Member loans outstanding (d) (e) . . . . . . . . . . . . . . . . . . . . . . . . . . . . . . 1.7% 1.8% 2.0% 2.3% 3.3%
(a) Refer to Note 4 to the Consolidated Financial Statements for a discussion of management’s process for evaluating the allowance for loan losses.(b) Net write-offs include principal, interest and fees balances.(c) Includes foreign currency translation adjustments and other items. Additionally, 2014 includes an adjustment related to reserves for card-
related fraud losses of $(6) million, which was reclassified to Other liabilities.(d) The net write-off rate presented is on a worldwide basis and is based on principal losses only (i.e., excluding interest and fees) to be consistent
with industry convention. In addition, because the Company considers uncollectible interest and fees in estimating its reserves for credit losses,a net write-off rate including principal, interest and fees is also presented. The year ended December 31, 2015, reflects the impact of a change inthe timing of charge-offs for Card Member loans in certain modification programs from 180 days past due to 120 days past due, which was fullyrecognized during the three months ended March 31, 2015.
(e) Average Card Member loans outstanding are based on month end balances.
A-10

The following table summarizes the changes to the Company’s allowance for other loan losses. The tablesegregates such changes between U.S. and non-U.S. borrowers.
Years Ended December 31, (Millions, except percentages) 2015 2014 2013 2012 2011
Other loansAllowance for loan losses at beginning of year
U.S. loans . . . . . . . . . . . . . . . . . . . . . . . . . . . . . . . . . . . . . . . . . . . . . . . . . . . . . . . . . . . . . . $ 8 $ 8 $ 8 $ 3 $ 2Non-U.S. loans . . . . . . . . . . . . . . . . . . . . . . . . . . . . . . . . . . . . . . . . . . . . . . . . . . . . . . . . . . 4 5 12 15 22
Total allowance for losses . . . . . . . . . . . . . . . . . . . . . . . . . . . . . . . . . . . . . . . . . . . . . . . . 12 13 20 18 24
Provisions for other loan losses (a)
U.S. loans . . . . . . . . . . . . . . . . . . . . . . . . . . . . . . . . . . . . . . . . . . . . . . . . . . . . . . . . . . . . . . 21 5 3 6 2Non-U.S. loans . . . . . . . . . . . . . . . . . . . . . . . . . . . . . . . . . . . . . . . . . . . . . . . . . . . . . . . . . . 1 3 4 7 11
Total provisions for other loan losses . . . . . . . . . . . . . . . . . . . . . . . . . . . . . . . . . . 22 8 7 13 13
Write-offsU.S. loans . . . . . . . . . . . . . . . . . . . . . . . . . . . . . . . . . . . . . . . . . . . . . . . . . . . . . . . . . . . . . . (15) (7) (7) (1) (2)Non-U.S. loans . . . . . . . . . . . . . . . . . . . . . . . . . . . . . . . . . . . . . . . . . . . . . . . . . . . . . . . . . . (3) (7) (13) (16) (24)
Total write-offs . . . . . . . . . . . . . . . . . . . . . . . . . . . . . . . . . . . . . . . . . . . . . . . . . . . . . . (18) (14) (20) (17) (26)
RecoveriesU.S. loans . . . . . . . . . . . . . . . . . . . . . . . . . . . . . . . . . . . . . . . . . . . . . . . . . . . . . . . . . . . . . . 3 2 4 — 1Non-U.S. loans . . . . . . . . . . . . . . . . . . . . . . . . . . . . . . . . . . . . . . . . . . . . . . . . . . . . . . . . . . 1 3 3 5 6
Total recoveries . . . . . . . . . . . . . . . . . . . . . . . . . . . . . . . . . . . . . . . . . . . . . . . . . . . . . . 4 5 7 5 7
Net write-offs . . . . . . . . . . . . . . . . . . . . . . . . . . . . . . . . . . . . . . . . . . . . . . . . . . . . . . . . . . . . (14) (9) (13) (12) (19)
Other (b)
Non-U.S. loans . . . . . . . . . . . . . . . . . . . . . . . . . . . . . . . . . . . . . . . . . . . . . . . . . . . . . . . . . . — — (1) 1 —
Total other . . . . . . . . . . . . . . . . . . . . . . . . . . . . . . . . . . . . . . . . . . . . . . . . . . . . . . . . . . . . . . — — (1) 1 —
Allowance for loan losses at end of yearU.S. loans . . . . . . . . . . . . . . . . . . . . . . . . . . . . . . . . . . . . . . . . . . . . . . . . . . . . . . . . . . . . . . 17 8 8 8 3Non-U.S. loans . . . . . . . . . . . . . . . . . . . . . . . . . . . . . . . . . . . . . . . . . . . . . . . . . . . . . . . . . . 3 4 5 12 15
Total allowance for losses . . . . . . . . . . . . . . . . . . . . . . . . . . . . . . . . . . . . . . . . . . . . . . . . $ 20 $ 12 $ 13 $ 20 $ 18
Net write-offs/average other loans outstanding (c) . . . . . . . . . . . . . . . . . . . . . . . . . 1.3% 1.2% 2.3% 2.5% 4.7%
(a) Provisions for other loan losses are determined based on a specific identification methodology and models that analyze specific portfoliostatistics.
(b) Includes primarily foreign currency translation adjustments.(c) The net write-off rate presented is on a worldwide basis and is based on write-offs of principal, interest and fees. Average other loans
outstanding are based on month end balances.
A-11

The following table summarizes the changes to the Company’s allowance for Card Member receivables losses.The table segregates such changes between U.S. and non-U.S. borrowers.
Years Ended December 31, (Millions, except percentages) 2015 2014 2013 2012 2011
Card Member receivablesAllowance for losses at beginning of year
U.S. receivablesConsumer . . . . . . . . . . . . . . . . . . . . . . . . . . . . . . . . . . . . . . . . . . . . . . . . . $ 276 $ 216 $ 273 $ 293 $ 193Commercial . . . . . . . . . . . . . . . . . . . . . . . . . . . . . . . . . . . . . . . . . . . . . . . 53 35 37 33 79
Total U.S. receivables . . . . . . . . . . . . . . . . . . . . . . . . . . . . . . . . . . . 329 251 310 326 272Non-U.S. receivables
Consumer . . . . . . . . . . . . . . . . . . . . . . . . . . . . . . . . . . . . . . . . . . . . . . . . . 93 98 86 86 84Commercial . . . . . . . . . . . . . . . . . . . . . . . . . . . . . . . . . . . . . . . . . . . . . . . 43 37 32 26 30
Total non-U.S. receivables . . . . . . . . . . . . . . . . . . . . . . . . . . . . . . . 136 135 118 112 114
Total allowance for losses . . . . . . . . . . . . . . . . . . . . . . . . . . . . . . . . . . . . . 465 386 428 438 386
Provisions for losses (a)U.S. receivables
Consumer . . . . . . . . . . . . . . . . . . . . . . . . . . . . . . . . . . . . . . . . . . . . . . . . . 420 451 336 372 438Commercial . . . . . . . . . . . . . . . . . . . . . . . . . . . . . . . . . . . . . . . . . . . . . . . 76 98 53 57 7
Total U.S. provisions . . . . . . . . . . . . . . . . . . . . . . . . . . . . . . . . . . . . 496 549 389 429 445Non-U.S. receivables
Consumer . . . . . . . . . . . . . . . . . . . . . . . . . . . . . . . . . . . . . . . . . . . . . . . . . 169 172 188 128 130Commercial . . . . . . . . . . . . . . . . . . . . . . . . . . . . . . . . . . . . . . . . . . . . . . . 72 71 71 44 29
Total non-U.S. provisions . . . . . . . . . . . . . . . . . . . . . . . . . . . . . . . . 241 243 259 172 159
Total provisions for losses . . . . . . . . . . . . . . . . . . . . . . . . . . . . . . . . . 737 792 648 601 604
Write-offsU.S. receivables
Consumer . . . . . . . . . . . . . . . . . . . . . . . . . . . . . . . . . . . . . . . . . . . . . . . . . (698) (618) (662) (674) (576)Commercial . . . . . . . . . . . . . . . . . . . . . . . . . . . . . . . . . . . . . . . . . . . . . . . (123) (120) (92) (92) (90)
Total U.S. write-offs . . . . . . . . . . . . . . . . . . . . . . . . . . . . . . . . . . . . . (821) (738) (754) (766) (666)Non-U.S. receivables
Consumer . . . . . . . . . . . . . . . . . . . . . . . . . . . . . . . . . . . . . . . . . . . . . . . . . (204) (211) (227) (190) (187)Commercial . . . . . . . . . . . . . . . . . . . . . . . . . . . . . . . . . . . . . . . . . . . . . . . (89) (92) (90) (67) (56)
Total non-U.S. write-offs . . . . . . . . . . . . . . . . . . . . . . . . . . . . . . . . . (293) (303) (317) (257) (243)
Total write-offs . . . . . . . . . . . . . . . . . . . . . . . . . . . . . . . . . . . . . . . . . . . $(1,114) $(1,041) $(1,071) $(1,023) $(909)
A-12
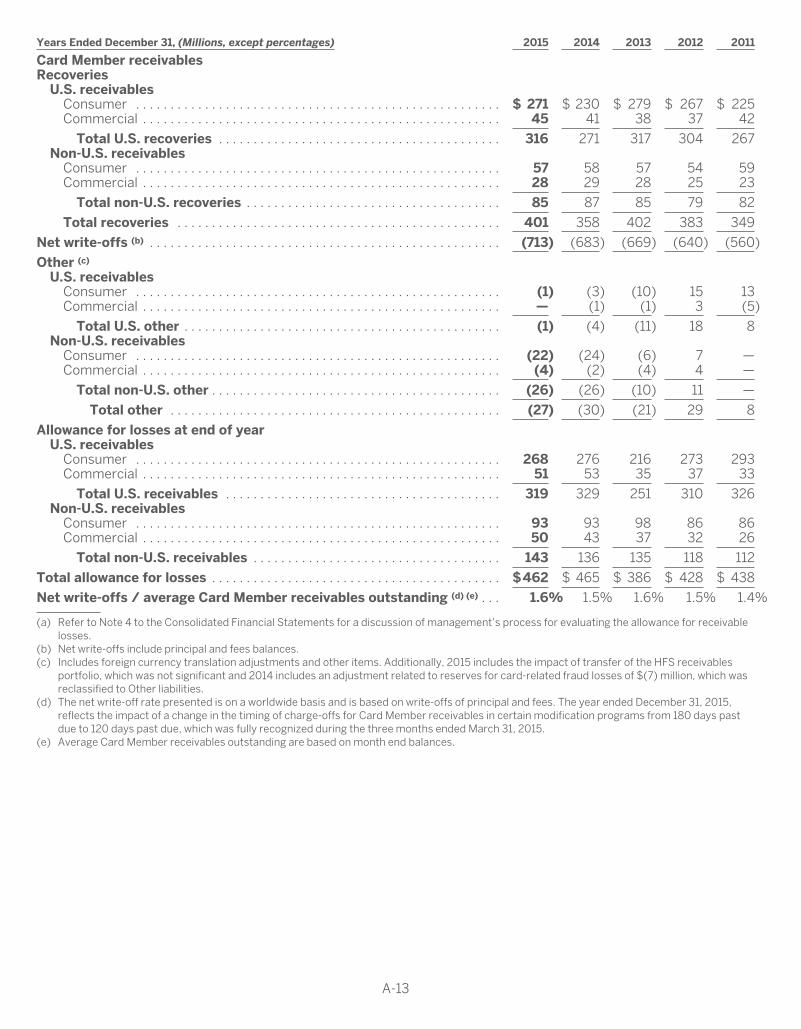
Years Ended December 31, (Millions, except percentages) 2015 2014 2013 2012 2011
Card Member receivablesRecoveries
U.S. receivablesConsumer . . . . . . . . . . . . . . . . . . . . . . . . . . . . . . . . . . . . . . . . . . . . . . . . . . . . . $ 271 $ 230 $ 279 $ 267 $ 225Commercial . . . . . . . . . . . . . . . . . . . . . . . . . . . . . . . . . . . . . . . . . . . . . . . . . . . . 45 41 38 37 42
Total U.S. recoveries . . . . . . . . . . . . . . . . . . . . . . . . . . . . . . . . . . . . . . . . . 316 271 317 304 267Non-U.S. receivables
Consumer . . . . . . . . . . . . . . . . . . . . . . . . . . . . . . . . . . . . . . . . . . . . . . . . . . . . . 57 58 57 54 59Commercial . . . . . . . . . . . . . . . . . . . . . . . . . . . . . . . . . . . . . . . . . . . . . . . . . . . . 28 29 28 25 23
Total non-U.S. recoveries . . . . . . . . . . . . . . . . . . . . . . . . . . . . . . . . . . . . . 85 87 85 79 82
Total recoveries . . . . . . . . . . . . . . . . . . . . . . . . . . . . . . . . . . . . . . . . . . . . . . . 401 358 402 383 349
Net write-offs (b) . . . . . . . . . . . . . . . . . . . . . . . . . . . . . . . . . . . . . . . . . . . . . . . . . . . (713) (683) (669) (640) (560)
Other (c)
U.S. receivablesConsumer . . . . . . . . . . . . . . . . . . . . . . . . . . . . . . . . . . . . . . . . . . . . . . . . . . . . . (1) (3) (10) 15 13Commercial . . . . . . . . . . . . . . . . . . . . . . . . . . . . . . . . . . . . . . . . . . . . . . . . . . . . — (1) (1) 3 (5)
Total U.S. other . . . . . . . . . . . . . . . . . . . . . . . . . . . . . . . . . . . . . . . . . . . . . . (1) (4) (11) 18 8Non-U.S. receivables
Consumer . . . . . . . . . . . . . . . . . . . . . . . . . . . . . . . . . . . . . . . . . . . . . . . . . . . . . (22) (24) (6) 7 —Commercial . . . . . . . . . . . . . . . . . . . . . . . . . . . . . . . . . . . . . . . . . . . . . . . . . . . . (4) (2) (4) 4 —
Total non-U.S. other . . . . . . . . . . . . . . . . . . . . . . . . . . . . . . . . . . . . . . . . . . (26) (26) (10) 11 —
Total other . . . . . . . . . . . . . . . . . . . . . . . . . . . . . . . . . . . . . . . . . . . . . . . . (27) (30) (21) 29 8
Allowance for losses at end of yearU.S. receivables
Consumer . . . . . . . . . . . . . . . . . . . . . . . . . . . . . . . . . . . . . . . . . . . . . . . . . . . . . 268 276 216 273 293Commercial . . . . . . . . . . . . . . . . . . . . . . . . . . . . . . . . . . . . . . . . . . . . . . . . . . . . 51 53 35 37 33
Total U.S. receivables . . . . . . . . . . . . . . . . . . . . . . . . . . . . . . . . . . . . . . . . 319 329 251 310 326Non-U.S. receivables
Consumer . . . . . . . . . . . . . . . . . . . . . . . . . . . . . . . . . . . . . . . . . . . . . . . . . . . . . 93 93 98 86 86Commercial . . . . . . . . . . . . . . . . . . . . . . . . . . . . . . . . . . . . . . . . . . . . . . . . . . . . 50 43 37 32 26
Total non-U.S. receivables . . . . . . . . . . . . . . . . . . . . . . . . . . . . . . . . . . . . 143 136 135 118 112
Total allowance for losses . . . . . . . . . . . . . . . . . . . . . . . . . . . . . . . . . . . . . . . . . . $462 $ 465 $ 386 $ 428 $ 438
Net write-offs / average Card Member receivables outstanding (d) (e) . . . 1.6% 1.5% 1.6% 1.5% 1.4%
(a) Refer to Note 4 to the Consolidated Financial Statements for a discussion of management’s process for evaluating the allowance for receivablelosses.
(b) Net write-offs include principal and fees balances.(c) Includes foreign currency translation adjustments and other items. Additionally, 2015 includes the impact of transfer of the HFS receivables
portfolio, which was not significant and 2014 includes an adjustment related to reserves for card-related fraud losses of $(7) million, which wasreclassified to Other liabilities.
(d) The net write-off rate presented is on a worldwide basis and is based on write-offs of principal and fees. The year ended December 31, 2015,reflects the impact of a change in the timing of charge-offs for Card Member receivables in certain modification programs from 180 days pastdue to 120 days past due, which was fully recognized during the three months ended March 31, 2015.
(e) Average Card Member receivables outstanding are based on month end balances.
A-13
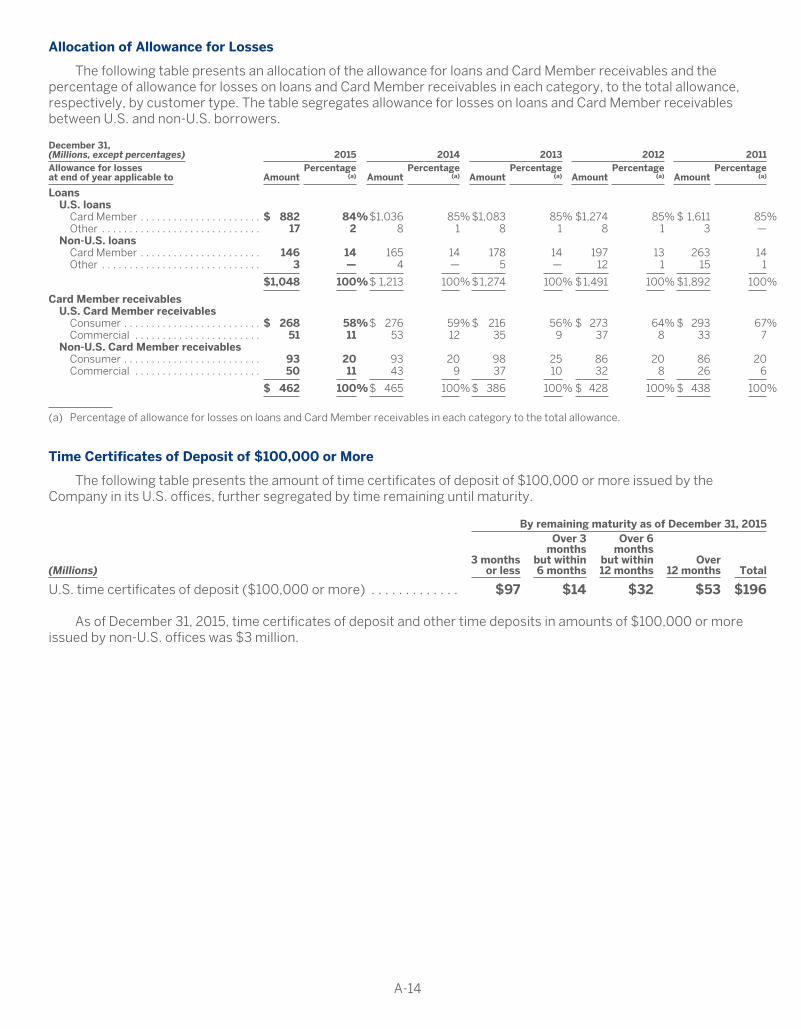
Allocation of Allowance for Losses
The following table presents an allocation of the allowance for loans and Card Member receivables and thepercentage of allowance for losses on loans and Card Member receivables in each category, to the total allowance,respectively, by customer type. The table segregates allowance for losses on loans and Card Member receivablesbetween U.S. and non-U.S. borrowers.
December 31,(Millions, except percentages) 2015 2014 2013 2012 2011Allowance for lossesat end of year applicable to Amount
Percentage(a) Amount
Percentage(a) Amount
Percentage(a) Amount
Percentage(a) Amount
Percentage(a)
LoansU.S. loans
Card Member . . . . . . . . . . . . . . . . . . . . . . $ 882 84%$1,036 85% $1,083 85% $1,274 85% $ 1,611 85%Other . . . . . . . . . . . . . . . . . . . . . . . . . . . . . 17 2 8 1 8 1 8 1 3 —
Non-U.S. loansCard Member . . . . . . . . . . . . . . . . . . . . . . 146 14 165 14 178 14 197 13 263 14Other . . . . . . . . . . . . . . . . . . . . . . . . . . . . . 3 — 4 — 5 — 12 1 15 1
$1,048 100%$ 1,213 100% $1,274 100% $1,491 100% $1,892 100%
Card Member receivablesU.S. Card Member receivables
Consumer . . . . . . . . . . . . . . . . . . . . . . . . . $ 268 58%$ 276 59% $ 216 56% $ 273 64% $ 293 67%Commercial . . . . . . . . . . . . . . . . . . . . . . . 51 11 53 12 35 9 37 8 33 7
Non-U.S. Card Member receivablesConsumer . . . . . . . . . . . . . . . . . . . . . . . . . 93 20 93 20 98 25 86 20 86 20Commercial . . . . . . . . . . . . . . . . . . . . . . . 50 11 43 9 37 10 32 8 26 6
$ 462 100%$ 465 100% $ 386 100% $ 428 100% $ 438 100%
(a) Percentage of allowance for losses on loans and Card Member receivables in each category to the total allowance.
Time Certificates of Deposit of $100,000 or More
The following table presents the amount of time certificates of deposit of $100,000 or more issued by theCompany in its U.S. offices, further segregated by time remaining until maturity.
By remaining maturity as of December 31, 2015
(Millions)3 months
or less
Over 3months
but within6 months
Over 6months
but within12 months
Over12 months Total
U.S. time certificates of deposit ($100,000 or more) . . . . . . . . . . . . . $97 $14 $32 $53 $196
As of December 31, 2015, time certificates of deposit and other time deposits in amounts of $100,000 or moreissued by non-U.S. offices was $3 million.
A-14

EXHIBIT INDEX
The following exhibits are filed as part of this Annual Report. The exhibit numbers preceded by an asterisk(*) indicate exhibits electronically filed herewith. All other exhibit numbers indicate exhibits previously filed and arehereby incorporated herein by reference. Exhibits numbered 10.1 through 10.44 are management contracts orcompensatory plans or arrangements.
3.1 Company’s Amended and Restated Certificate of Incorporation as amended through February 27, 2015(incorporated by reference to Exhibit 3.1 the Company’s Quarterly Report on Form 10-Q (CommissionFile No. 1-7657) for the quarter ended March 31, 2015).
3.2 Company’s By-Laws, as amended through October 20, 2014, (incorporated by reference to Exhibit 3.1 ofthe Company’s Current Report on Form 8-K (Commission File No. 1-7657), dated October 20, 2014).
4.1 The instruments defining the rights of holders of long-term debt securities of the Company and itssubsidiaries are omitted pursuant to Section (b)(4)(iii)(A) of Item 601 of Regulation S-K. The Companyhereby agrees to furnish copies of these instruments to the SEC upon request.
10.1 American Express Company 1998 Incentive Compensation Plan, as amended through July 25, 2005(incorporated by reference to Exhibit 10.4 of the Company’s Annual Report on Form 10-K (CommissionFile No. 1-7657) for the year ended December 31, 2005).
10.2 American Express Company 1998 Incentive Compensation Plan Master Agreement, dated April 27, 1998(for awards made prior to January 22, 2007) (incorporated by reference to Exhibit 10.1 of theCompany’s Quarterly Report on Form 10-Q (Commission File No. 1-7657) for the quarter endedSeptember 30, 2004).
10.3 Amendment of American Express Company 1998 Incentive Compensation Plan Master Agreement,dated April 27, 1998 (for awards made prior to January 22, 2007) (incorporated by reference to Exhibit10.1 of the Company’s Quarterly Report on Form 10-Q (Commission File No. 1-7657) for the quarterended March 31, 2000).
10.4 American Express Company 1998 Incentive Compensation Plan Master Agreement, dated January 22,2007 (for awards made on or after such date) (as amended and restated effective January 1, 2009)(incorporated by reference to Exhibit 10.4 of the Company’s Annual Report on Form 10-K (CommissionFile No. 1-7657) for the year ended December 31, 2008).
10.5 American Express Company 2007 Incentive Compensation Plan (incorporated by reference to Exhibit10.1 of the Company’s Current Report on Form 8-K (Commission File No. 1-7657), dated April 23, 2007(filed April 27, 2007)).
10.6 American Express Company 2007 Incentive Compensation Plan Master Agreement (as amended andrestated effective January 1, 2011), (incorporated by reference to Exhibit 10.8 of the Company’s AnnualReport on Form 10-K (Commission File No. 1-7657) for the year ended December 31, 2010).
10.7 Form of award agreement for executive officers in connection with Performance Grant awards (a/k/aIncentive Awards) under the American Express Company 2007 Incentive Compensation Plan (as amendedand restated effective January 1, 2009) (incorporated by reference to Exhibit 10.11 of the Company’sAnnual Report on Form 10-K (Commission File No. 1-7657) for the year ended December 31, 2008).
10.8 American Express Company Deferred Compensation Plan for Directors and Advisors, as amendedthrough March 23, 2015 (incorporated by reference to Exhibit 10.1 of the Company’s Quarterly Report onForm 10-Q (Commission File No. 1-7657) for the quarter ended March 31, 2015).
10.9 American Express Company 2007 Pay-for-Performance Deferral Program Document (incorporated byreference to Exhibit 10.1 of the Company’s Current Report on Form 8-K (Commission File No. 1-7657),dated November 20, 2006 (filed November 22, 2006)).
10.10 Description of amendments to 1994–2006 Pay-for-Performance Deferral Programs (incorporated byreference to Exhibit 10.13 of the Company’s Annual Report on Form 10-K (Commission File No. 1-7657)for the year ended December 31, 2006).
10.11 American Express Company 2006 Pay-for-Performance Deferral Program Guide (incorporated byreference to Exhibit 10.1 of the Company’s Current Report on Form 8-K (Commission File No. 1-7657),dated November 21, 2005 (filed November 23, 2005)).
10.12 American Express Company 2005 Pay-for-Performance Deferral Program Guide (incorporated byreference to Exhibit 10.10 of the Company’s Annual Report on Form 10-K (Commission File No. 1-7657)for the year ended December 31, 2004).
E-1
10.13 Description of American Express Company Pay-for-Performance Deferral Program (incorporated byreference to Exhibit 10.2 of the Company’s Current Report on Form 8-K (Commission File No. l-7657),dated November 22, 2004 (filed January 28, 2005)).
10.14 Amendment to the Pre-2008 Nonqualified Deferred Compensation Plans of American Express Company(incorporated by reference to Exhibit 10.19 of the Company’s Annual Report on Form 10-K (CommissionFile No. 1-7657) for the year ended December 31, 2008).
10.15 American Express Company Retirement Plan for Non-Employee Directors, as amended (incorporated byreference to Exhibit 10.12 of the Company’s Annual Report on Form 10-K (Commission File No. 1-7657)for the year ended December 31, 1988).
10.16 Certificate of Amendment of the American Express Company Retirement Plan for Non-EmployeeDirectors dated March 21, 1996 (incorporated by reference to Exhibit 10.11 of the Company’s AnnualReport on Form 10-K (Commission File No. 1-7657) for the year ended December 31, 1995).
10.17 American Express Key Executive Life Insurance Plan, as amended (incorporated by reference to Exhibit10.12 of the Company’s Annual Report on Form 10-K (Commission File No. 1-7657) for the fiscal yearended December 31, 1991).
10.18 Amendment to American Express Company Key Executive Life Insurance Plan (incorporated byreference to Exhibit 10.3 of the Company’s Quarterly Report on Form 10-Q (Commission File No. 1-7657)for the quarter ended September 30, 1994).
10.19 Amendment to American Express Company Key Executive Life Insurance Plan, effective as of January22, 2007 (incorporated by reference to Exhibit 10.22 of the Company’s Annual Report on Form 10-K(Commission File No. 1-7657) for the year ended December 31, 2006).
10.20 Amendment to American Express Company Key Executive Life Insurance Plan, effective as of January 1,2011 (incorporated by reference to Exhibit 10.24 of the Company’s Annual Report on Form 10-K(Commission File No. 1-7657) for the year ended December 31, 2010).
10.21 American Express Key Employee Charitable Award Program for Education (incorporated by reference toExhibit 10.13 of the Company’s Annual Report on Form 10-K (Commission File No. 1-7657) for the yearended December 31, 1990).
10.22 American Express Directors’ Charitable Award Program (incorporated by reference to Exhibit 10.14 ofthe Company’s Annual Report on Form 10-K (Commission File No. 1-7657) for the year ended December31, 1990).
10.23 American Express Company Salary/Bonus Deferral Plan (incorporated by reference to Exhibit 10.20 ofthe Company’s Annual Report on Form 10-K (Commission File No. 1-7657) for the year ended December31, 1988).
10.24 Amendment to American Express Company Salary/Bonus Deferral Plan (incorporated by reference toExhibit 10.4 of the Company’s Quarterly Report on Form 10-Q (Commission File No. 1-7657) for thequarter ended September 30, 1994).
10.25 American Express Company 1993 Directors’ Stock Option Plan, as amended (incorporated by referenceto Exhibit 10.11 of the Company’s Quarterly Report on Form 10-Q (Commission File No. 1-7657) for thequarter ended March 31, 2000).
10.26 American Express Senior Executive Severance Plan, effective January 1, 1994 (as amended and restatedthrough January 1, 2011) (incorporated by reference to Exhibit 10.30 of the Company’s Annual Report onForm 10-K (Commission File No. 1-7657) for the year ended December 31, 2010).
10.27 First Amendment to the American Express Senior Executive Severance Plan (incorporated by referenceto Exhibit 10.1 of the Company’s Quarterly Report on Form 10-Q (Commission File No. 1-7657) for thequarter ended September 30, 2012).
10.28 Second Amendment to the American Express Senior Executive Severance Plan (incorporated byreference to Exhibit 10.1 of the Company’s Current Report on Form 8-K (Commission File No. 1-7657),dated July 22, 2013 (filed July 25, 2013)).
E-2

10.29 Amendments of (i) the American Express Salary/Bonus Deferral Plan and (ii) the American Express KeyExecutive Life Insurance Plan (incorporated by reference to Exhibit 10.37 of the Company’s AnnualReport on Form 10-K (Commission File No. 1-7657) for the year ended December 31, 1997).
10.30 Second Amendment and Restatement of the American Express Retirement Restoration Plan (f/k/aSupplemental Retirement Plan) (as amended and restated effective as of January 1, 2012) (incorporatedby reference to Exhibit 10.28 of the Company’s Annual Report on Form 10-K (Commission File No. 1-7657) for the year ended December 31, 2011).
10.31 Third Amendment to the American Express Retirement Restoration Plan (f/k/a SupplementalRetirement Plan) (as amended and restated effective as of January 1, 2012) (incorporated by referenceto Exhibit 10.1 of the Company’s Quarterly Report on Form 10-Q (Commission File No. 1-7657) for thequarter ended March 31, 2012).
10.32 Fourth Amendment to the American Express Retirement Restoration Plan (f/k/a SupplementalRetirement Plan) (as amended and restated effective as of January 1, 2013) (incorporated by referenceto Exhibit 10.31 of the Company’s Annual Report on Form 10-K (Commission File No. 1-7657) for the yearended December 31, 2012).
10.33 Fifth Amendment to the American Express Retirement Restoration Plan (f/k/a SupplementalRetirement Plan) (dated May 1, 2013) (incorporated by reference to Exhibit 10.1 of the Company’sQuarterly Report on Form 10-Q (Commission File No. 1-7657) for the quarter ended March 31, 2013).
10.34 Sixth Amendment to the American Express Retirement Restoration Plan (f/k/a Supplemental RetirementPlan) (dated August 16, 2013) (incorporated by reference to Exhibit 10.1 of the Company’s QuarterlyReport on Form 10-Q (Commission File No. 1-7657) for the quarter ended September 30, 2013).
10.35 Seventh Amendment to the American Express Retirement Restoration Plan (f/k/a SupplementalRetirement Plan) (dated September 26, 2013) (incorporated by reference to Exhibit 10.2 of theCompany’s Quarterly Report on Form 10-Q (Commission File No. 1-7657) for the quarter endedSeptember 30, 2013).
10.36 Eighth Amendment to the American Express Retirement Restoration Plan (f/k/a SupplementalRetirement Plan) (dated December 1, 2013) (incorporated by reference to Exhibit 10.36 of the Company’sAnnual Report on Form 10-K (Commission File No. 1-7657) for the year ended December 31, 2013).
10.37 American Express Annual Incentive Award Plan (as amended and restated effective January 1, 2011)(incorporated by reference to Exhibit 10.34 of the Company’s Annual Report on Form 10-K (CommissionFile No. 1-7657) for the year ended December 31, 2010).
*10.38 American Express Company 2003 Share Equivalent Unit Plan for Directors, as amended and restated,effective January 1, 2015.
10.39 Description of Compensation Payable to Non-Management Directors effective January 1, 2015(incorporated by reference to Exhibit 10.39 of the Company’s Annual Report on Form 10-K (CommissionFile No. 1-7657) for the year ended December 31, 2014).
10.40 American Express Company 2007 Incentive Compensation Plan Master Agreement (as amended andrestated effective January 23, 2012) (incorporated by reference to Exhibit 10.1 of the Company’s CurrentReport on Form 8-K (Commission File No. 1-7657), dated January 23, 2012 (filed January 27, 2012)).
10.41 Form of award agreement for executive officers in connection with Performance Grant awards (a/k/aIncentive Awards) under the American Express Company 2007 Incentive Compensation Plan (forawards made after January 29, 2013) (incorporated by reference to Exhibit 10.38 of the Company’sAnnual Report on Form 10-K (Commission File No. 1-7657) for the year ended December 31, 2012).
10.42 Form of award agreement for executive officers in connection with Portfolio Grant awards under theAmerican Express Company 2007 Incentive Compensation Plan (for awards made after January 29,2013) (incorporated by reference to Exhibit 10.39 of the Company’s Annual Report on Form 10-K(Commission File No. 1-7657) for the year ended December 31, 2012).
E-3

*10.43 Form of nonqualified stock option award agreement for executive officers under the American ExpressCompany 2007 Incentive Compensation Plan (for awards made after January 26, 2016)
*10.44 Form of restricted stock unit award agreement for executive officers under the American ExpressCompany 2007 Incentive Compensation Plan (for awards made after January 26, 2016)
10.45 Agreement dated February 27, 1995 between the Company and Berkshire Hathaway Inc. (incorporatedby reference to Exhibit 10.43 of the Company’s Annual Report on Form 10-K (Commission File No. 1-7657) for the year ended December 31, 1994).
10.46 Agreement dated July 20, 1995 between the Company and Berkshire Hathaway Inc. and its subsidiaries(incorporated by reference to Exhibit 10.1 of the Company’s Quarterly Report on Form 10-Q(Commission File No. 1-7657) for the quarter ended September 30, 1995).
10.47 Amendment dated September 8, 2000 to the agreement dated February 27, 1995 between the Companyand Berkshire Hathaway Inc. (incorporated by reference to Exhibit 99.3 of the Company’s Current Reporton Form 8-K (Commission File No. 1-7657), dated January 22, 2001 (filed January 22, 2001)).
10.48 Tax Allocation Agreement, dated as of September 30, 2005, by and between American Express Companyand Ameriprise Financial, Inc. (incorporated by reference to Exhibit 10.2 of the Company’s Current Reporton Form 8-K (Commission File No. 1-7657), dated September 30, 2005 (filed October 6, 2005)).
10.49 Amended and Restated Time Sharing Agreement, dated March 26, 2014, by and between AmericanExpress Travel Related Services Company, Inc. and Kenneth I. Chenault (incorporated by reference toExhibit 10.1 of the Company’s Quarterly Report on Form 10-Q (Commission File No. 1-7657) for thequarter ended March 31, 2014).
10.50 Amendment No. 1, dated February 12, 2015, to the Amended and Restated Time Sharing Agreement,dated March 26, 2014, by and between American Express Travel Related Services Company, Inc. andKenneth I. Chenault (incorporated by reference to Exhibit 10.51 of the Company’s Annual Report onForm 10-K (Commission File No. 1-7657) for the year ended December 31, 2014).
10.51 Amendment No. 2, dated March 26, 2015, to the Amended and Restated Time Sharing Agreement,dated March 26, 2014, by and between American Express Travel Related Services Company, Inc. andKenneth I. Chenault (incorporated by reference to Exhibit 10.2 of the Company’s Quarterly Report onForm 10-Q (Commission File No. 1-7657) for the quarter ended March 31, 2015).
*12 Computation in Support of Ratio of Earnings to Combined Fixed Charges and Preferred Stock Dividends.
*21 Subsidiaries of the Company.
*23.1 Consent of PricewaterhouseCoopers LLP.
*31.1 Certification of Kenneth I. Chenault, Chief Executive Officer, pursuant to Rule 13a-14(a) promulgatedunder the Securities Exchange Act of 1934, as amended.
*31.2 Certification of Jeffrey C. Campbell, Chief Financial Officer, pursuant to Rule 13a-14(a) promulgatedunder the Securities Exchange Act of 1934, as amended.
*32.1 Certification of Kenneth I. Chenault, Chief Executive Officer, pursuant to 18 U.S.C. Section 1350, asadopted pursuant to Section 906 of the Sarbanes-Oxley Act of 2002.
*32.2 Certification of Jeffrey C. Campbell, Chief Financial Officer, pursuant to 18 U.S.C. Section 1350, asadopted pursuant to Section 906 of the Sarbanes-Oxley Act of 2002.
*101.INS XBRL Instance Document
*101.SCH XBRL Taxonomy Extension Schema Document
*101.CAL XBRL Taxonomy Extension Calculation Linkbase Document
*101.LAB XBRL Taxonomy Extension Label Linkbase Document
*101.PRE XBRL Taxonomy Extension Presentation Linkbase Document
*101.DEF XBRL Taxonomy Extension Definition Linkbase Document
E-4

AMERICAN EXPRESS COMPANY | ANNUAL REPORT 2015 A
Appendices to the Chairman’s letterAPPENDIX IRECONCILIATION OF ADJUSTMENTS
Revenues Net of Interest Expense Adjusted for FX, Gain on the Sale of the Concur Investment and Global Business Travel Operations
YoY%
(MILLIONS, EXCEPT PERCENTAGES) 2015 2014 INC/(DEC)
GAAP Total Revenues Net of Interest Expense $ 32,818 $ 34,188 (4)
Global Business Travel Total Revenues, Net of Interest Expense1 (741)
Q4’14 Gain on Sale of Concur Investment (719)
Adjusted Total Revenues Net of Interest Expense $ 32,818 $ 32,728 0
FX-Adjusted2 Total Revenues Net of Interest Expense Excluding Concur & Global Business Travel $ 32,818 $ 31,539 4
1 Represents operating performance of Global Business Travel as reported in H1’14, due to the deconsolidation of our global business travel operations as a result of the joint venture transaction that closed June 30, 2014. Does not include other Global Business Travel-related items, including equity earnings from the joint venture and impacts related to a transition services agreement that will phase out over time.
2 FX-adjusted information assumes a constant exchange rate between the periods being compared for purposes of currency translation into U.S. dollars (e.g., assumes the foreign exchange rates used to determine results for 2015 apply to the period(s) against which such results are being compared). Certain amounts included in the calculations of FX-adjusted revenues are subject to management allocations.

B AMERICAN EXPRESS COMPANY | ANNUAL REPORT 2015
Appendices to the Chairman’s letterAPPENDIX IIRECONCILIATION OF ADJUSTMENTS
Worldwide Loan Growth Adjusted Held for Sale (HFS) Loan Classification
YoY%
(BILLIONS, EXCEPT PERCENTAGES) 2015 2014 INC/(DEC)
GAAP Worldwide Loans $ 58.6 $ 70.4 (17%)
Q’4 14 Card Member Loan Balances Related to Cobrand Partnerships with Costco in the U.S. and JetBlue, Classified as Held for Sale on the Consolidated Balance Sheets Effective December 1, 2015 $ 15.8
Adjusted Worldwide Loans Excluding Loans Related to Costco in the U.S. and JetBlue $ 58.6 $ 54.6 7%

AMERICAN EXPRESS COMPANY | ANNUAL REPORT 2015
EXECUTIVE OFFICERS
Kenneth I. ChenaultChairman and Chief Executive Officer
Douglas E. Buckminster President, Global Consumer Services
James P. Bush President, Global Network and International Consumer Services
Jeffrey C. CampbellExecutive Vice President and Chief Financial Officer
L. Kevin Cox Chief Human Resources Officer
Paul D. FabaraPresident, Global Risk & Compliance and Chief Risk Officer
Marc D. GordonExecutive Vice President and Chief Information Officer
Ash Gupta President, Credit Risk and Global Information Management
Michael J. O’Neill Executive Vice President, Corporate Affairs and Communications
Laureen E. SeegerExecutive Vice President and General Counsel
Susan SobbottPresident, Global Commercial Payments
Stephen J. SqueriVice Chairman
Anré WilliamsPresident, Global Merchant Services & Loyalty Group
BOARD OF DIRECTORS
Charlene Barshefsky Senior International Partner WilmerHale
Ursula M. Burns Chairman and Chief Executive Officer Xerox Corporation
Kenneth I. Chenault Chairman and Chief Executive Officer American Express Company
Peter Chernin Founder and Chief Executive OfficerChernin Entertainment, Inc.
Anne LauvergeonChairman and Chief Executive OfficerA.L.P. SAS
Michael O. LeavittFounder and Chairman Leavitt Partners, LLC
Theodore J. Leonsis Chairman and Chief Executive Officer Monumental Sports & Entertainment, LLC
Richard C. Levin Chief Executive OfficerCoursera
Samuel J. Palmisano Former Chairman, President and Chief Executive Officer International Business Machines Corporation (IBM)
Daniel L. VasellaHonorary Chairman and Former Chairman and Chief Executive OfficerNovartis AG
Robert D. WalterFounder and Former Chairman and Chief Executive OfficerCardinal Health, Inc.
Ronald A. WilliamsFormer Chairman and Chief Executive OfficerAetna Inc.
ADVISORS TO THE
BOARD OF DIRECTORS
Vernon E. Jordan, Jr. Senior Managing Director Lazard Frères & Co. LLC
Henry A. KissingerChairman, Kissinger Associates, Inc.Former Secretary of State of the United States of America
Frank P. PopoffFormer Chairman and Chief Executive OfficerThe Dow Chemical Company

AMERICAN EXPRESS COMPANY | ANNUAL REPORT 2015
EXECUTIVE OFFICES
American Express Company 200 Vesey Street New York, NY 10285 212.640.2000
INFORMATION AVAILABLE TO
SHAREHOLDERS
Copies of the Company’s Form 10-K, proxy statement, press releases and other documents, as well as information on financial results, products and services, are available on the American Express website at americanexpress.com. Information on the Company’s corporate social responsibility programs and a report on the Company’s federal and state political contributions are available at americanexpress.com. Written copies of these materials are available without charge upon written request to the Secretary’s Office at the address above.
TRANSFER AGENT AND REGISTRAR
Computershare, Inc. 250 Royall Street, Canton, MA 02021 800.463.5911 or 201.680.6578 Hearing impaired: 1.800.231.5469 www.computershare.com/investor
STOCK EXCHANGE LISTING
New York Stock Exchange (Symbol: AXP)
INDEPENDENT REGISTERED PUBLIC
ACCOUNTING FIRM
PricewaterhouseCoopers LLP 300 Madison Avenue New York, NY 10017-6204
ANNUAL MEETING
The Annual Meeting of Shareholders of American Express Company will be held at the Company’s headquarters at 200 Vesey Street, New York, NY 10285, on Monday, May 2, 2016, at 9:00 a.m., Eastern Time. A live audio webcast of the meeting will be accessible to the general public through the American Express Investor Relations website at ir.americanexpress.com and an audio replay will be available on the website following the event. A written transcript of the meeting will be available upon written request to the Secretary’s Office.
CORPORATE GOVERNANCE
Copies of American Express Company’s governance documents, including its Corporate Governance Principles, as well as the charters of the standing committees of the Board of Directors and the American Express Company Code of Conduct, are available on the Company’s Investor Relations website at ir.americanexpress.com. Copies of these materials are also available without charge upon written request to the Secretary’s Office at the address above.
DIRECT DEPOSIT OF DIVIDENDS
The Company has established an Electronic Direct Deposit of Dividends service for the electronic payment of quarterly dividends on the Company’s common shares. With this service, registered shareholders may have their dividend payments sent electronically to their checking account or financial institution on the payment date. Shareholders interested in enrolling in this service should call Computershare, Inc. at 1.800.463.5911.
STOCK PURCHASE PLAN
The CIP Plan, a direct stock purchase plan sponsored and administered by Computershare, Inc., provides shareholders and new investors with a convenient way to purchase common shares through optional cash investments and reinvestment of dividends.
For more information, contact: Computershare, Inc.P.O. Box 30170 College Station, TX 77842-3170 1.800.463.5911 www.computershare.com/investor
SHAREHOLDER AND
INVESTOR INQUIRIES
Written shareholder inquiries may be sent either to Computershare, Inc. Investor Care Network, P.O. Box 30170, College Station, TX 77842-3170, or to the Secretary’s Office at American Express Company’s executive offices at the address above. Written inquiries from the investment community
should be sent to Investor Relations at American Express Company’s executive offices at the address above.
TRADEMARKS AND SERVICE MARKS
The following American Express trademarks and service marks may appear in this report:
American Express® American Express Blue Box Logo® American Express Card Design® American Express® Essential™American Express Serve® American Express World Service & Design® Amex EveryDay®Bluebird® Blue Cash ®Blue Cash Everyday®Blue for Business®Centurion® Global Assist®LoyaltyEdge®Membership Rewards® OPEN Forum®OPEN Savings®OptBlue®Payback®Platinum Card® Plenti®Plum Card®Relationship Care®Select & Pay Later®SimplyCash®Shop Small® Small Business Saturday®
FORWARD-LOOKING STATEMENTS
Various forward-looking statements are made in this Annual Report, which generally include the words “believe,” “expect,” “anticipate,” “optimistic,” “intend,” “plan,” “aim,” “will,” “should,” “could,” “would,” “likely,” and similar expressions. Certain factors that may affect these forward-looking statements, including American Express Company’s ability to achieve its goals referred to herein, are discussed on pages 95-97.
©2016 American Express Company. All rights reserved.
GENERAL INFORMATION

A M E R I C A N E X P R E S S C O M PA N Y
200 Vesey Street, New York, NY 10285212.640.2000 www.americanexpress.com