Transaction Costs Transparency - Financial Conduct … !6...
37
1 Transaction Costs Transparency Prepared for the FCA by Novarca December 2014 Novarca International Ltd. Office: +41 55 511 21 21 / Fax: +41 55 511 21 22 Oberdorfstrasse 11 | 8808 Pfaeffikon | Switzerland http://www.novarca.com [email protected]
Transcript of Transaction Costs Transparency - Financial Conduct … !6...
1
Transaction Costs Transparency
Prepared for the FCA by Novarca December 2014
Novarca International Ltd. Office: +41 55 511 21 21 / Fax: +41 55 511 21 22 Oberdorfstrasse 11 | 8808 Pfaeffikon | Switzerland
http://www.novarca.com
2
Contents 1. Objectives and remit page 3 2. Executive summary page 4 3. Methodology and approach page 5 4. Identifying transaction-‐related costs that exist
within GPP products page 7 5. Determining which costs are relevant
to assessing value for money page 12
6. Recommend a practical method for measuring these costs page 16
7. Examine how cost information can be disclosed so that a value-‐for-‐money assessments can be made page 26 8. Pension cost transparency in the Netherlands page 31 9. Reporting templates page 34
3
1. Objectives & Remit Novarca was commissioned by the FCA to examine transaction cost transparency within Group Personal Pension (GPP) products. The goal of the study was to:
A. Identify the various transaction-‐related costs that exist within GPP products
B. Determine which costs are relevant to assessing value for money C. Recommend a practical method for measuring these costs D. Propose standards for disclosing cost information so that IGCs can
make value-‐for-‐money assessments
Novarca focused on the following questions: A. Identify ing costs
• where do transaction costs occur within GPP products • what other investment-‐related costs might impact returns
B. Relevant costs
• can the cost be measured accurately • is the cost material • can the cost be controlled or reduced
C. Measuring costs
• what data sources exist • how accurate is the data • are there technical challenges to capturing and analysing the data
D. Disc losing cost information
• how can costs be reported at the scheme or portfolio level • what comparative data is appropriate
4
2. Executive summary
Calculating transaction costs is not an exact science. Not all costs are directly observable; there is a qualitative component to many costs and competing methodologies for calculating them. Despite these complications, the bulk of the costs that are most likely to occur within the investment portfolios of GPP products can either be measured directly or estimated with enough accuracy to give Independent Governance Committees (IGCs) a good view of the impact of transaction costs on the portfolios underlying their schemes. Partial transaction cost transparency could therefore be introduced quickly. The pensions industry in the Netherlands has followed this approach successfully,
implementing a simplified transaction cost reporting requirement. This is discussed in section 8. The GPP industry is not currently prepared for industrial-‐scale reporting of transaction costs. Neither the GPP providers nor their underlying portfolio managers systematically calculate or collate transaction cost data. However all the providers we spoke to were willing to address this problem. Most preferred that common standards for calculating costs be applied across the industry. This would speed up data gathering by individual providers and make cross-‐industry comparisons possible, as all providers would be using the same methodologies. The absolute level of transaction costs does not necessarily reflect value for money. A passively managed bond fund will incur lower transaction costs than an actively managed equity fund. IGCs need additional information to assess whether their transaction costs represent value for money, and the ability to compare across schemes. Benchmarks can be constructed that take the underlying investment exposure into account. The detailed list of transaction costs and other uncapped investment costs that may be incurred by a GPP scheme, depending on its underlying investment portfolios, is over 40 items long (please see table 1 in section 4). However just eight cost categories provide enough information to give IGCs an informed view of transaction costs, as shown in table 2. It should be straightforward to obtain the data for these cost categories. Section 9 presents reporting templates that could form the basis for a rapid and simple implementation of transaction cost transparency at the IGC level.
• The most significant transaction costs can be made transparent quickly, using good estimates or proxies for some costs
• There are technical challenges to collecting data at the scheme level, but data is available at the portfolio level
• GPP providers have asked for common standards for measuring and reporting costs. This would encourage market participants to provide information and make industry benchmarking possible
• The absolute level of costs does not tell the whole story about value for money. The degree of portfolio turnover and the underlying investment strategy should be taken into account
• The Netherlands provides an example of the benefits of introducing simplified transaction cost reporting
5
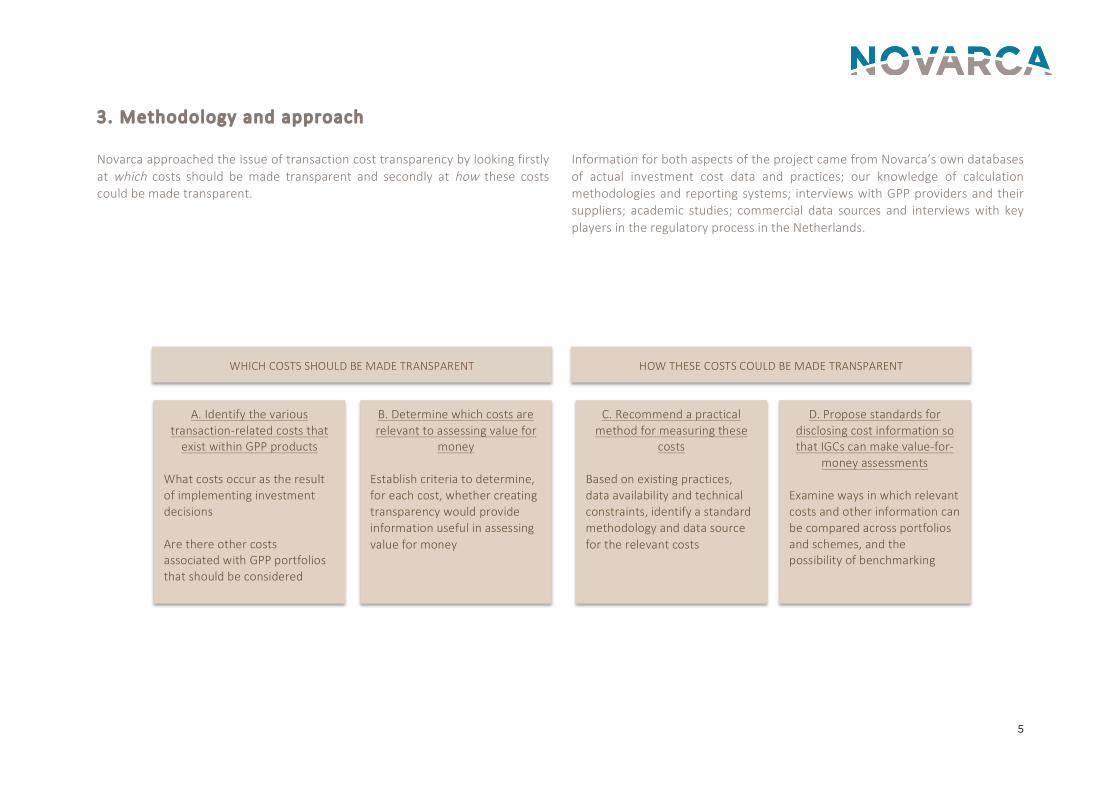
3. Methodology and approach
Novarca approached the issue of transaction cost transparency by looking firstly at which costs should be made transparent and secondly at how these costs could be made transparent.
Information for both aspects of the project came from Novarca’s own databases of actual investment cost data and practices; our knowledge of calculation methodologies and reporting systems; interviews with GPP providers and their suppliers; academic studies; commercial data sources and interviews with key players in the regulatory process in the Netherlands.
WHICH COSTS SHOULD BE MADE TRANSPARENT HOW THESE COSTS COULD BE MADE TRANSPARENT
A. Identify the various transaction-‐related costs that exist within GPP products
What costs occur as the result of implementing investment decisions Are there other costs associated with GPP portfolios that should be considered
B. Determine which costs are relevant to assessing value for
money Establish criteria to determine, for each cost, whether creating transparency would provide information useful in assessing value for money
C. Recommend a practical method for measuring these
costs Based on existing practices, data availability and technical constraints, identify a standard methodology and data source for the relevant costs
D. Propose standards for disclosing cost information so that IGCs can make value-‐for-‐
money assessments Examine ways in which relevant costs and other information can be compared across portfolios and schemes, and the possibility of benchmarking
6
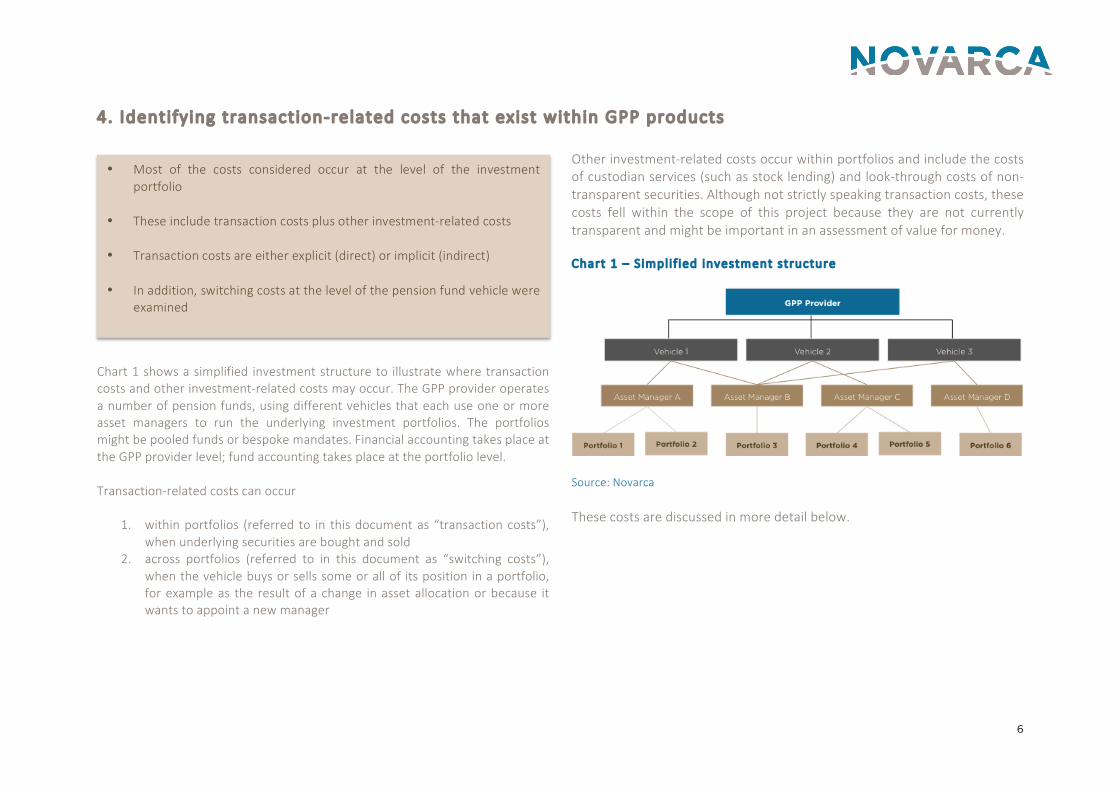
4. Identifying transaction-‐related costs that exist within GPP products
Chart 1 shows a simplified investment structure to illustrate where transaction costs and other investment-‐related costs may occur. The GPP provider operates a number of pension funds, using different vehicles that each use one or more asset managers to run the underlying investment portfolios. The portfolios might be pooled funds or bespoke mandates. Financial accounting takes place at the GPP provider level; fund accounting takes place at the portfolio level. Transaction-‐related costs can occur
1. within portfolios (referred to in this document as “transaction costs”), when underlying securities are bought and sold
2. across portfolios (referred to in this document as “switching costs”), when the vehicle buys or sells some or all of its position in a portfolio, for example as the result of a change in asset allocation or because it wants to appoint a new manager
Other investment-‐related costs occur within portfolios and include the costs of custodian services (such as stock lending) and look-‐through costs of non-‐transparent securities. Although not strictly speaking transaction costs, these costs fell within the scope of this project because they are not currently transparent and might be important in an assessment of value for money. Chart 1 – S implif ied investment structure
Source: Novarca These costs are discussed in more detail below.
• Most of the costs considered occur at the level of the investment portfolio
• These include transaction costs plus other investment-‐related costs • Transaction costs are either explicit (direct) or implicit (indirect) • In addition, switching costs at the level of the pension fund vehicle were
examined
7
VEHICLE-‐LEVEL COSTS -‐ SWITCHING COSTS Switching costs are the costs incurred by a vehicle when it reduces its holding in one portfolio and increases its holding in another, for instance if the GPP provider decides that it wants a new manager for a specific asset class or if it changes its top-‐down asset allocation. In selling one underlying fund and buying another, the vehicle would incur a spread cost on each leg of the trade; some managers may also impose entry or exit fees. These purchases and sales would also generate transactions within the funds being traded and so create transaction costs at the portfolio level. We assume that existing measures designed to protect investors, such as dilution levies or swing pricing, cover the risk of double-‐counting transaction costs created by switching decisions. The same is true of transactions generated by subscriptions or redemptions at the level of the pension fund. GPP providers with in-‐house asset managers can keep their switching costs low by paying a fixed annual fee to the asset manager that includes asset allocation changes. Crossing can also reduce switching costs: if an asset manager has a big enough platform and fund range, it can match buyers and sellers so that each side trades at the mid price. GPP providers whose internal asset managers have good crossing platforms can enjoy very low switching costs, potentially incurring no spread at all when they switch between underlying funds.
PORTFOLIO-‐LEVEL COSTS – HOLDING, MANAGING AND TRANSACTION COSTS Portfolio costs can be categorised a number of ways, for example into fixed and variable costs, or asset-‐based costs and monetary charges. We categorise them as • Holding costs: the costs of safeguarding the assets and of meeting
regulatory requirements • Managing costs: the costs of taking investment decisions and of running the
business • Transaction costs: the costs of implementing investment decisions by
trading assets A summary of the costs included in each category is shown in chart 2. Most of the costs considered in this report are transaction costs, however there are some other investment-‐related costs that fell within the scope of the project. Chart 2 – Summary of portfol io costs by category
Source: Novarca
8
Before discussing transaction costs in detail, we describe the other investment-‐related costs that were considered. Within holding costs, the cost of custodian services such as foreign exchange hedging, interest income and the share of proceeds from securities lending are not always disclosed1. In foreign exchange, we do not attempt here to split out the hedging costs that are generated by individual trades in securities denominated in foreign currencies, but include them in the overall costs of portfolio hedging. The custodian should hold the necessary information for calculating holding costs. The choice of underlying assets falls under managing costs. The look-‐through costs of underlying assets are not usually reported. For example, the direct cost of purchasing an ETF can be observed, and is a transaction cost. By contrast, the investment costs within the ETF – that is, the full costs of the trading and securities lending that take place within the ETF – are not available from standard reporting. The manager of the underlying asset should be able to provide at least some of this information. Similarly, a fund-‐of-‐funds manager will pay management fees to the managers of the underlying funds and may receive retrocessions from them; the underlying funds will also have trading costs and other costs within their own portfolios. TRANSACTION COSTS Transaction costs can be divided into explicit and implicit costs. Explicit costs are directly observable: typically prices are written into a contract and when the costs are incurred, an invoice is (or could be) generated. Examples
1 These costs could potentially be categorised as managing costs, for example asset managers may do their own currency hedging rather than use their custodian for this service. If this is the case, the asset manager holds the necessary data.
of explicit costs include brokerage fees, taxes such as stamp duty and custodian ticket fees. Invoices cannot be issued for implicit costs. Therefore they cannot be directly observed, as they are netted off investment returns rather than being reported on a stand-‐alone basis. This means that the valuation of a security when it is added to the portfolio will include the implicit costs generated in purchasing that security; similarly, the profits from selling a security will be reduced by the implicit costs of the sale. Examples of implicit costs include bid-‐ask spreads, market impact and mark-‐ups on OTC instruments. There is a qualitative as well as a quantitative aspect to implicit costs. For example, market impact measures the impact of a trade on the price of the security being traded. It therefore indicates how well the trader has placed the order in the market. In spread-‐only trades, all the costs of the trade are captured in the spread, including all the information about the level at which the trade was executed and the costs of execution and whether these were reasonable or not. Table 1 lists the transaction-‐related costs that were identified within the investment structure. Note that not all costs are applicable to all vehicles and not all transaction costs are applicable to all transactions, however we have tried to be as exhaustive as possible. Some of these costs are easier and quicker to make transparent than others, as discussed in the next section.
9
Table 1 – detai led l ist of costs Vehic le-‐ level costs Type Cost Descript ion Switching costs Implicit Cost of changing allocations to underlying portfolios e.g. selling the full holding in one
underlying fund and replacing it with another fund Transaction costs – tradit ional asset c lasses Asset c lass/venue Type Cost Descript ion Exchange-‐traded e.g. equity2 Explicit Broker commission Share of total broker fee that is payment for executing trade Exchange fee Paid to trading venue for executing on their platform; usually included in broker commission Settlement fee3 Cost of transfer of ownership of security; may be included in exchange fee Custodian ticket fee Cost of transfer of ownership of security; may include settlement fee Transaction taxes Stamp duty and other taxes Implicit Broker research costs Share of total broker fee that is not payment for executing trade (e.g. payment for research,
analytics, trading technology) Implementation shortfall4 The difference between the decision price and the execution price of a trade Market impact Change in price of security caused by the pressure of the trade (e.g. a big buy order in a
market with limited liquidity will move the price up, against the buyer). May be included in implementation shortfall
OTC e.g. bonds Implicit Spread Difference between the bid and offer prices of a security Custodian ticket fee Cost of transfer of ownership of security; may include settlement fee Exchange fee Paid to trading venue for executing on their platform; usually included in spread Settlement fee Cost of transfer of ownership of security; may be included in exchange fee Broker research costs Share of total broker fee that is not payment for executing trade (e.g. payment for research,
analytics, trading technology) Implementation shortfall The difference between the decision price and the execution price of a trade
2 equity traded as principal should be treated as OTC 3 either or both custodian fee and settlement fee may be observed in the trade 4 see section 5 for detailed discussion of what may be included under different methodologies
10
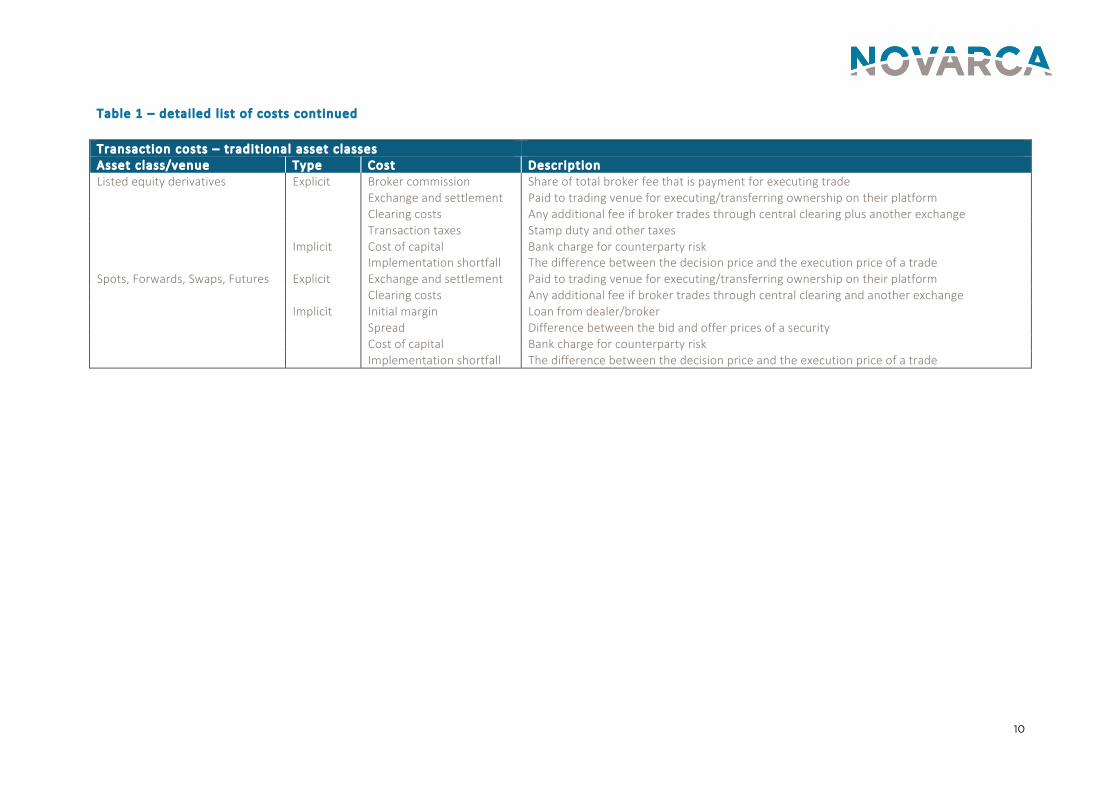
Table 1 – detai led l ist of costs continued Transaction costs – tradit ional asset c lasses Asset c lass/venue Type Cost Descript ion Listed equity derivatives Explicit Broker commission Share of total broker fee that is payment for executing trade Exchange and settlement Paid to trading venue for executing/transferring ownership on their platform Clearing costs Any additional fee if broker trades through central clearing plus another exchange Transaction taxes Stamp duty and other taxes Implicit Cost of capital Bank charge for counterparty risk Implementation shortfall The difference between the decision price and the execution price of a trade Spots, Forwards, Swaps, Futures Explicit Exchange and settlement Paid to trading venue for executing/transferring ownership on their platform Clearing costs Any additional fee if broker trades through central clearing and another exchange Implicit Initial margin Loan from dealer/broker Spread Difference between the bid and offer prices of a security Cost of capital Bank charge for counterparty risk Implementation shortfall The difference between the decision price and the execution price of a trade
11
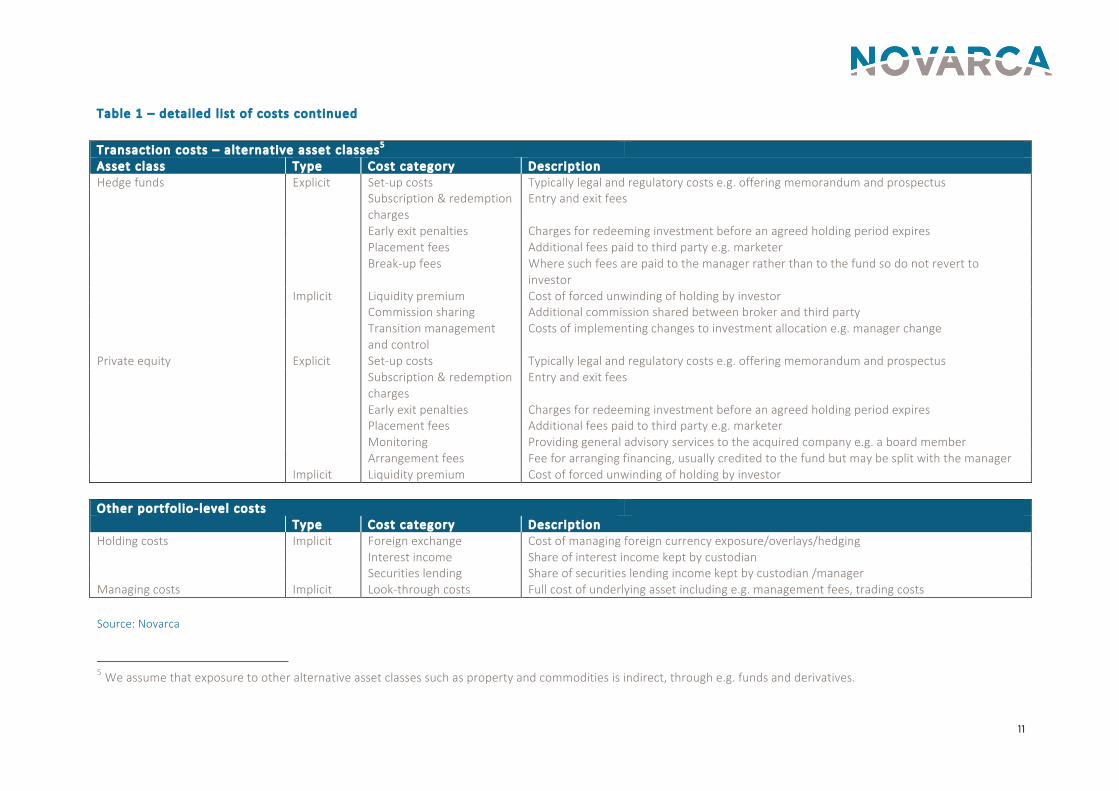
Table 1 – detai led l ist of costs continued
Transaction costs – a lternative asset c lasses5 Asset c lass Type Cost category Descript ion Hedge funds Explicit Set-‐up costs Typically legal and regulatory costs e.g. offering memorandum and prospectus Subscription & redemption
charges Entry and exit fees
Early exit penalties Charges for redeeming investment before an agreed holding period expires Placement fees Additional fees paid to third party e.g. marketer Break-‐up fees Where such fees are paid to the manager rather than to the fund so do not revert to
investor Implicit Liquidity premium Cost of forced unwinding of holding by investor Commission sharing Additional commission shared between broker and third party Transition management
and control Costs of implementing changes to investment allocation e.g. manager change
Private equity Explicit Set-‐up costs Typically legal and regulatory costs e.g. offering memorandum and prospectus Subscription & redemption
charges Entry and exit fees
Early exit penalties Charges for redeeming investment before an agreed holding period expires Placement fees Additional fees paid to third party e.g. marketer Monitoring Providing general advisory services to the acquired company e.g. a board member Arrangement fees Fee for arranging financing, usually credited to the fund but may be split with the manager Implicit Liquidity premium Cost of forced unwinding of holding by investor Other portfol io-‐ level costs Type Cost category Descript ion Holding costs Implicit Foreign exchange Cost of managing foreign currency exposure/overlays/hedging Interest income Share of interest income kept by custodian Securities lending Share of securities lending income kept by custodian /manager Managing costs Implicit Look-‐through costs Full cost of underlying asset including e.g. management fees, trading costs Source: Novarca
5 We assume that exposure to other alternative asset classes such as property and commodities is indirect, through e.g. funds and derivatives.
12
5. Determining which costs are relevant to assessing value for money
All the costs that had been identified were tested against the three following criteria to determine whether they were important to value-‐for-‐money decisions 1 . CAN THE COST BE MEASURED ACCURATELY: CAN WE OBSERVE IT DIRECTLY, OR DOES A USEFUL PROXY OR ESTIMATE EXIST For almost all transaction costs that are likely to occur within a GPP product portfolio, the answer is “yes”. Some costs can be observed directly: brokers issue invoices; the revenue share of a securities lending arrangement is written into a contract. There is a good proxy or estimate for most implicit costs, such as spreads for OTC instruments and broker estimates for market impact and implementation shortfall. These proxies are not perfect but they are a good starting point.
Some data that is needed for estimates that is not currently available as standard in the UK can be found elsewhere. Managers of alternative asset classes, such as hedge funds and private equity, reveal very little information about the full set-‐up costs of their investments. However additional information exists in some jurisdictions: for example, Switzerland requires private equity funds to disclose their TER. 2 . IS THE COST MATERIAL: DOES IT HAVE A SIGNIFICANT IMPACT ON
POLICYHOLDERS’ RETURNS It is impossible to determine in advance how material each different type of transaction cost within a portfolio will be, as the total cost is driven by the turnover rate. Past levels of turnover and of charges provide some indication of expected future magnitude. Some costs are small in absolute terms, for example custodian ticket fees may be as low as 2bp, but when adjusted for turnover they may be significant. Other costs, such as early exit fees from alternative investments, are much higher in absolute terms but are one-‐off costs (and less likely to be part of the asset allocation of recently-‐launched DC funds).
• The criteria for determining relevant costs are: is it measurable, is it material, can it be controlled or reduced
• Almost all costs can be measured either directly or using a good proxy
or estimate • Additional effort is needed to categorise some implicit costs • Certain explicit and implicit costs cannot be influenced by the GPP
provider in the short term
13
3.CAN THE COST BE CONTROLLED OR REDUCED: ONCE THE COST IS MADE
TRANSPARENT, CAN THE GPP PROVIDER INFLUENCE IT Once costs are made transparent, many of them can be controlled. For example, broker fees can be challenged or new contract terms agreed for securities lending. However, even when we can measure a cost, we cannot always influence it. This is true of stamp duty and other transaction taxes. Exchange fees could also be considered “fixed” to the extent that an individual client is a price-‐taker, although it is possible that longer term, clients could put pressure on exchanges to lower their costs. ISSUES WITH IMPLICIT COSTS Some implicit costs are straightforward to consider. Brokers routinely prepare very accurate models of market impact, in order to develop strategies for reducing it. Others are more complicated, such as implementation shortfall (see box opposite). Implementation shortfall has a material impact on portfolio returns and several sources of good estimates for this cost exist. However it is relatively time-‐consuming and expensive to measure and it is not obvious how to control or reduce implementation shortfall in the short term.
Implementation shortfal l Implementation shortfall was originally defined as the difference between the net returns on a paper portfolio (which does not incur any transaction costs) and the net returns on a real portfolio (which does). Several competing definitions exist but they all describe the difference between the price at which an investment manager decides to buy or sell a security and the actual price achieved when the trade is executed. Depending on the definition, different costs can be included: missed trade opportunity costs (unrealised profit/loss from the failure to complete a trade in a timely manner); delay costs (caused by having to carry part of an order over from one day to the next); market impact; commissions; netting off market movements etc. Can it be measured? In order to measure implementation shortfall, we have to decide which definition to use. The different data points needed to make the calculation – the decision price, intermediate benchmark prices, the execution price, the proportion of the order filled at different prices… – must be agreed upon and collected post-‐trade. Collecting and analysing this data carries a cost and is often outsourced to specialist analytics firms6. Is it material? Although definitions vary, it is accepted that implementation shortfall is a material cost: calculations go as high as 50+ basis points for a one-‐way trade. Can it be controlled or reduced? Implementation shortfall is a real cost but it is not clear that anyone is benefiting from it. No-‐one “earns” the whole of the implementation shortfall; rather the cost is lost within the investment chain because of inefficiencies in executing trades. These inefficiencies might occur at any one of the steps in the investment chain: at the asset manager, between the asset manager and the broker, between the broker and the market and so on. Making implementation shortfall transparent could set an incentive to improve efficiency but this would be hard to quantify in the short term.
6 Novarca has activities in this area
14
SUMMARY TABLE Table 2 summarises the results of testing the costs identified in table 1 against the three criteria. We also note whether or not we believe it would be practical to make each cost transparent. It is not possible for IGCs to assess value for money based on netted returns, so the more transparency that can be achieved the better their assessment will be, but there are arguments for ignoring some costs. As discussed in section 8, the Netherlands deliberately and successfully chose to keep transparency requirements simple, in order to gain consensus across the industry and to speed up delivery. Exchange and settlement fees are a case in point. These fees have been falling over recent years. For a cost such as exchange fees, which are relatively small and cannot be influenced in the short term, it is worth considering how much effort should be put into estimating such costs on a standalone basis rather than accepting them as bundled and concentrating instead on the bigger costs. Note that when we classify a cost as “observable”, this does not mean that the data is necessarily already accessible by the GPP provider. However we believe that this data is usually stored somewhere at the portfolio level. For example, broker costs can be made available quickly and it should be easy to achieve transparency. Placement fees are observable to the extent that they are contractual but they are not routinely collated. We highlight in grey the costs where transparency is readily achievable in the short term and which would provide a large amount of useful information. There seem to us to be no serious obstacles to making this information available on a portfolio-‐by-‐portfolio basis to IGCs (as discussed in the next section, we believe that it would be difficult at this stage to calculate these costs for the vehicle as a whole.)
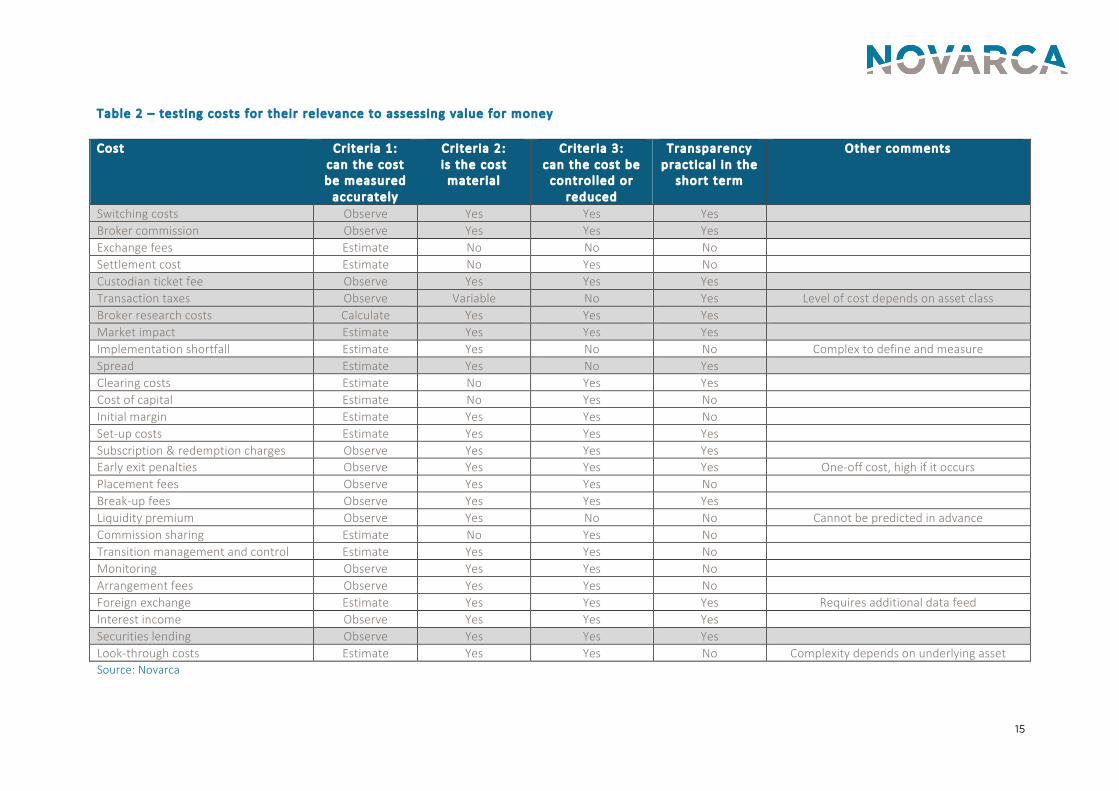
15
Table 2 – test ing costs for their relevance to assessing value for money Cost Cr iter ia 1:
can the cost be measured accurately
Criter ia 2: is the cost material
Cr iter ia 3: can the cost be control led or
reduced
Transparency practical in the
short term
Other comments
Switching costs Observe Yes Yes Yes Broker commission Observe Yes Yes Yes Exchange fees Estimate No No No Settlement cost Estimate No Yes No Custodian ticket fee Observe Yes Yes Yes Transaction taxes Observe Variable No Yes Level of cost depends on asset class Broker research costs Calculate Yes Yes Yes Market impact Estimate Yes Yes Yes Implementation shortfall Estimate Yes No No Complex to define and measure Spread Estimate Yes No Yes Clearing costs Estimate No Yes Yes Cost of capital Estimate No Yes No Initial margin Estimate Yes Yes No Set-‐up costs Estimate Yes Yes Yes Subscription & redemption charges Observe Yes Yes Yes Early exit penalties Observe Yes Yes Yes One-‐off cost, high if it occurs Placement fees Observe Yes Yes No Break-‐up fees Observe Yes Yes Yes Liquidity premium Observe Yes No No Cannot be predicted in advance Commission sharing Estimate No Yes No Transition management and control Estimate Yes Yes No Monitoring Observe Yes Yes No Arrangement fees Observe Yes Yes No Foreign exchange Estimate Yes Yes Yes Requires additional data feed Interest income Observe Yes Yes Yes Securities lending Observe Yes Yes Yes Look-‐through costs Estimate Yes Yes No Complexity depends on underlying asset Source: Novarca
16
6. Recommend a practical method for measuring these costs
In table 3 at the end of this section, we set out suggested methodologies, data sources and expected values for different transaction costs. There are competing methodologies and data sources as well as technical challenges to compiling information. We have therefore tried to choose the simplest measures even where these are just approximations. MULTIPLE DATA SOURCES AND METHODOLOGIES As noted in the discussion of implementation shortfall, there are several different data sources and calculation methodologies in use to measure the different transaction costs. Both the data and the methodologies vary across asset classes, over time and by source. Equities data is more variable than fixed income data.
An EDHEC survey7 of the buy-‐side (asset managers and hedge fund managers) from 2007 already revealed the use of 7 different benchmarks for post-‐trade transaction cost analysis, with analysis conducted by several different providers or internally. Among the firms that did pre-‐trade analysis, internal, bespoke tools were the most popular source of information.
On the sell side, many brokers have sophisticated pre-‐trade models to aid their trading strategies.
Potentia l sources of data and calculat ion methodologies include
• observation of expl ic it costs • asset managers and their suppl iers, for example custodians
and dealers • special ist analyt ical services • exchanges • f inancial data vendors
ESTABLISHING COMMON STANDARDS GPP providers were unanimous in asking for common standards for calculating transaction costs. Most will have to invest in new systems to capture the transaction cost information coming from different sources, aggregate it and produce reports. They see a risk that if they each build systems around their own designs for creating transparency, they will have to change them in the future if they choose the “wrong” methodology or data source.
7 Transaction Cost Analysis in Europe: Current and Best Practices, European Survey January 2007
• Multiple data sources and measurement methods exist – a common standard would make it easier for GPP providers to achieve transparency
• Estimates provide valuable information • Transaction cost data already exists at the portfolio level. Some
technical challenges to collecting and analysing this data remain • Measurement can influence behaviour. There are strategies to offset
this risk
17
This means agreeing on the standard calculation methodology to be used, for example using average spreads as a proxy for OTC trading costs. It then means agreeing on the standard data to be used within the calculation, such as establishing the rate for the average spread for each fixed income asset class, or the reference price to be used in equity trades (VWAP, market close etc.) In the Netherlands, the Federation of Dutch Pension funds sets the standard data (see section 8)
Options for establ ishing standard data
• set by the regulator • set by the industry • provided by f inancial data providers, dealers or exchanges
We believe that providing common standards will speed up compliance and ensure that all GPP providers give their IGCs the same degree of transparency. It will also mean that data can be compared within and across GPP providers.
USING ESTIMATES Any common standard based on estimates will be an imperfect measure of individual scheme costs. For example, average bond spreads are a reasonable proxy for fixed income transaction costs, but the variation around the average can be high depending on transaction size, issuer rating, issuer sector, market volatility and so on.
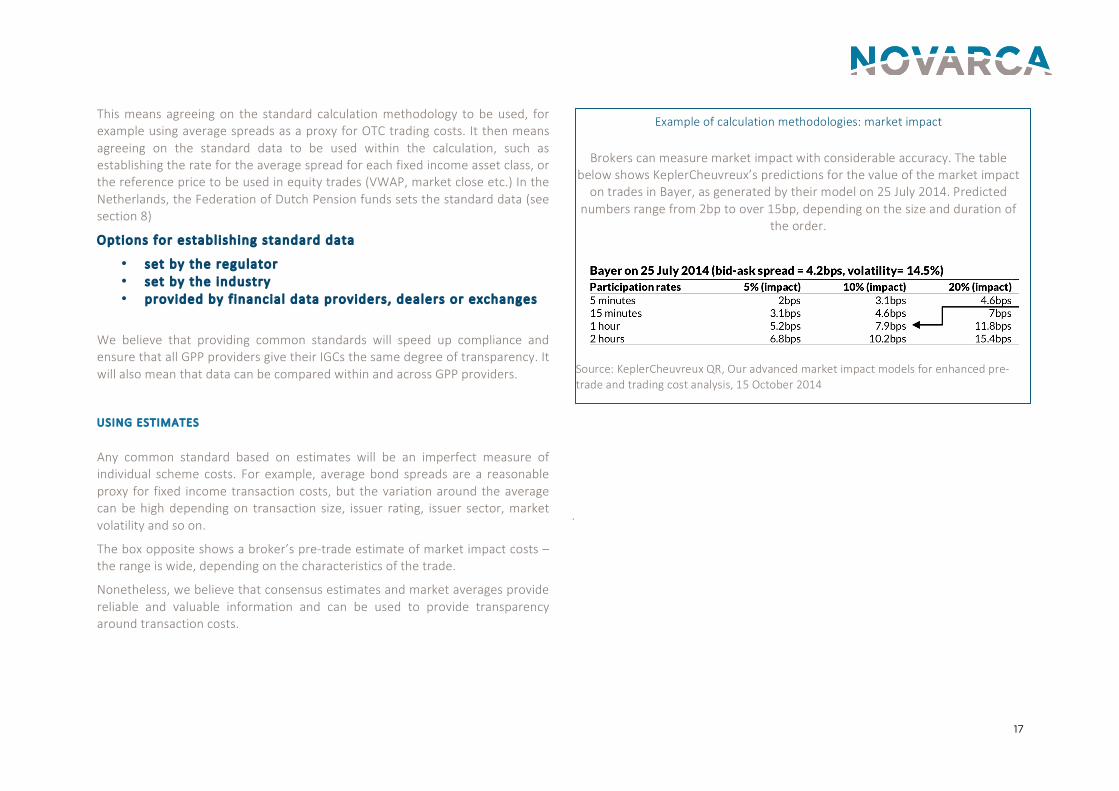
The box opposite shows a broker’s pre-‐trade estimate of market impact costs – the range is wide, depending on the characteristics of the trade.
Nonetheless, we believe that consensus estimates and market averages provide reliable and valuable information and can be used to provide transparency around transaction costs.
.
Example of calculation methodologies: market impact
Brokers can measure market impact with considerable accuracy. The table
below shows KeplerCheuvreux’s predictions for the value of the market impact on trades in Bayer, as generated by their model on 25 July 2014. Predicted
numbers range from 2bp to over 15bp, depending on the size and duration of the order.
Source: KeplerCheuvreux QR, Our advanced market impact models for enhanced pre-‐trade and trading cost analysis, 15 October 2014
18
DATA ACCURACY WILL INCREASE OVER TIME We expect that data accuracy will increase over time
• GPP providers and their asset managers will put new systems in place to collect and collate a greater volume of data
• Proxies will be refined • GPP providers and their asset managers will try to provide actual data
to avoid the problems of proxies An example of a proxy that could be refined is the spreads used to measure bond transaction costs. As a first step, using the bid-‐offer spread is a good proxy for OTC transaction costs. However, most trades do not take place at exactly the bid or offer price. A better proxy would be the effective spread, which measures the actual trading price and the time of trade mid-‐point (if the dealer does better than the quoted spread, the effective spread will be smaller than the bid-‐offer spread). This is still not a perfect measure, as it does not tell us whether the timing of the trade was good (the reference itself reflects the time that the trade was executed) which is an important element of the quality of the trade.
TECHNICAL CHALLENGES GPP providers have told us that it is very difficult for them to calculate transaction and other costs, including explicit costs.
• They do not get complete data from their asset managers • They do not have calculation engines to compute transaction costs
from this data • They are unable to allocate costs across schemes
These challenges can be overcome. In our experience, almost all portfolio costs are measured somewhere along the line, but a lot of this data is not collated or analysed. Asset managers should be encouraged to make the data available to GPP providers. Even where transaction cost data is available at the portfolio level, GPP providers may be unable to allocate those costs across the various schemes they operate. The example below reflects the current accounting framework for life and pension funds. Nevertheless, it seems unlikely that ImCo could not provide the explicit cost information at the fund level for a simple fund-‐of-‐funds structure even if the underlying funds are used in several different vehicles. However, even for a simple structure, many GPP providers would have to do most of the transaction cost calculations manually. This is impractical for product ranges that include a large number of vehicles and structures and especially those with more complex arrangements such as blends-‐of-‐blends.
19
GPP providers and their asset managers will have to invest in IT systems to collect data and compute costs. As a rough guide, a detailed, one-‐off transaction cost analysis for a diversified portfolio can cost around £50,000 (it will be cheaper for a less complicated fund). Upgrading systems to provide industrial-‐scale reporting for complex product ranges could cost several million pounds, depending on how powerful the GPP’s existing systems are. However, it should cost less for asset managers to provide portfolio-‐level data. Table 2 above showed that a relatively high level of transparency could be achieved at the portfolio level in the short term. We believe that asset managers could produce workable calculations for individual portfolios in just a few days using the data that they collect in the normal course of their operations. IT investment requirements should also be lower. Building calculation engines is a major investment but this investment will also be useful in meeting reporting requirements that will be associated with upcoming MiFID II, PRIIPs and Solvency 2 regulations, as long as GPP providers and asset managers are able to future-‐proof their systems.
MEASUREMENT CAN INFLUENCE BEHAVIOUR There are three principal risks to the methodologies we set out in table 3.
• the standards are not equitable across asset classes • asset managers will use other instruments to avoid transparency
requirements • “good” asset managers will be penalised by using industry-‐wide
averages The standards are not equitable across asset classes The methodologies selected capture a greater proportion of transaction costs for OTC-‐traded securities than they do for exchange-‐traded securities. A simplified equation for transaction costs is
Transaction cost = dealer’s costs + execution costs + dealer’s prof it + qual ity of trade
In an OTC trade, the dealer earns his entire fee on the spread: the difference between what he pays for the security and what he then sells it on for. All the costs of the transaction are swept into the spread: the dealer’s commission, his profit and any other execution costs8. The quality of the trade – how wide the spread was, how close the dealer was to the effective spread and how high other costs were – is all captured (and hidden) within the spread. In an exchange trade, the dealer also faces a spread but he charges his client an explicit fee that covers his costs and his profit. Other execution costs are also explicit, such as the custodian ticket fee. The quality of the trade is not captured by the explicit costs.
8 note that we have seen examples of custodians splitting out ticket fees for bond trades
Example of cost allocation
GPP provider LifeCo uses an in-‐house asset manager, ImCo, to manage several underlying funds for its schemes.
LifeCo pays ImCo a pre-‐determined internal charge for managing these funds. If ImCo buys £1,000,000-‐worth of BT shares and allocates them to three different
underlying funds, it will charge the total explicit cost to LifeCo.
LifeCo does not have the middle office systems in place to attribute the right proportion of costs to each of the underlying funds and so to the relevant
schemes.
20
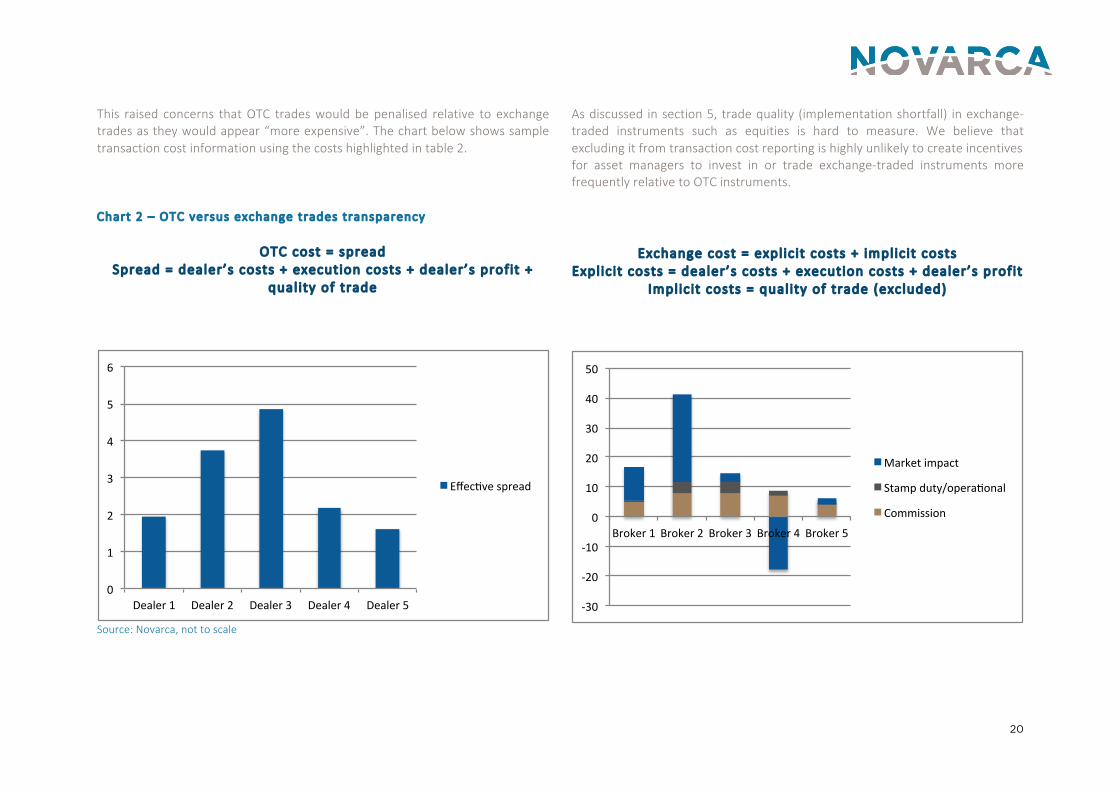
This raised concerns that OTC trades would be penalised relative to exchange trades as they would appear “more expensive”. The chart below shows sample transaction cost information using the costs highlighted in table 2.
As discussed in section 5, trade quality (implementation shortfall) in exchange-‐traded instruments such as equities is hard to measure. We believe that excluding it from transaction cost reporting is highly unlikely to create incentives for asset managers to invest in or trade exchange-‐traded instruments more frequently relative to OTC instruments.
Chart 2 – OTC versus exchange trades transparency
OTC cost = spread Spread = dealer’s costs + execution costs + dealer’s prof it +
qual ity of trade
Source: Novarca, not to scale
Exchange cost = expl ic it costs + implic it costs Expl ic it costs = dealer’s costs + execution costs + dealer’s prof it
Implic it costs = qual ity of trade (excluded)
0"
1"
2"
3"
4"
5"
6"
Dealer"1" Dealer"2" Dealer"3" Dealer"4" Dealer"5"
Effec1ve"spread"
!30$
!20$
!10$
0$
10$
20$
30$
40$
50$
Broker$1$ Broker$2$ Broker$3$ Broker$4$ Broker$5$
Market$impact$
Stamp$duty/opera:onal$
Commission$
21
Asset managers will use other instruments to avoid transparency requirements The transaction costs identified as relevant apply in the main to direct investments. An asset manager could decide to get exposure to certain asset classes indirectly, for example by buying an ETF rather than investing in individual equities or a listed private equity vehicle rather than making a commitment to a private equity fund. In both cases, the costs incurred in buying the listed vehicle would be picked up, but the underlying fees and charges of the vehicle would not be. The underlying portfolio of the ETF will incur holding, managing and moving costs. Similarly, the full costs of a listed private equity vehicle are likely to be higher than the reported costs. This could create distortions by encouraging asset managers to move to listed vehicles to get round transparency requirements. As discussed in section 4, including look-‐through costs in the definition of transaction costs mitigates this risk.
“Good” asset managers will be penalised by using industry-‐wide averages GPP providers and their suppliers who believe themselves to be low cost are concerned that they will be penalised by common data sources that use averages. We therefore recommend that those GPP providers who are able to report accurate data about their transaction costs should be allowed to do so, rather than estimating their costs in line with the common standard. COMMON STANDARDS AND DATA SOURCES Table 3 sets out ideas for the methodology and data sources for the various cost categories. .
22
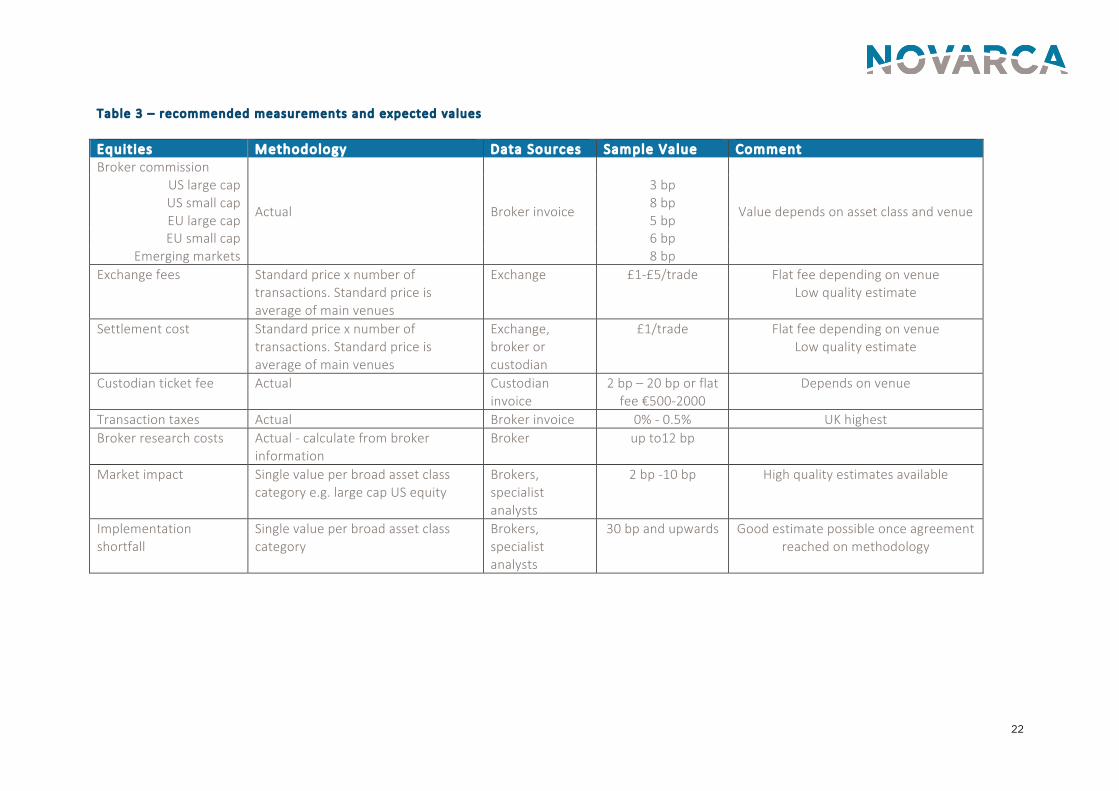
Table 3 – recommended measurements and expected values Equit ies Methodology Data Sources Sample Value Comment Broker commission
Actual Broker invoice
Value depends on asset class and venue
US large cap 3 bp US small cap 8 bp EU large cap 5 bp EU small cap 6 bp
Emerging markets 8 bp Exchange fees Standard price x number of
transactions. Standard price is average of main venues
Exchange £1-‐£5/trade Flat fee depending on venue Low quality estimate
Settlement cost Standard price x number of transactions. Standard price is average of main venues
Exchange, broker or custodian
£1/trade Flat fee depending on venue Low quality estimate
Custodian ticket fee Actual Custodian invoice
2 bp – 20 bp or flat fee €500-‐2000
Depends on venue
Transaction taxes Actual Broker invoice 0% -‐ 0.5% UK highest Broker research costs Actual -‐ calculate from broker
information Broker up to12 bp
Market impact Single value per broad asset class category e.g. large cap US equity
Brokers, specialist analysts
2 bp -‐10 bp High quality estimates available
Implementation shortfall
Single value per broad asset class category
Brokers, specialist analysts
30 bp and upwards Good estimate possible once agreement reached on methodology
23
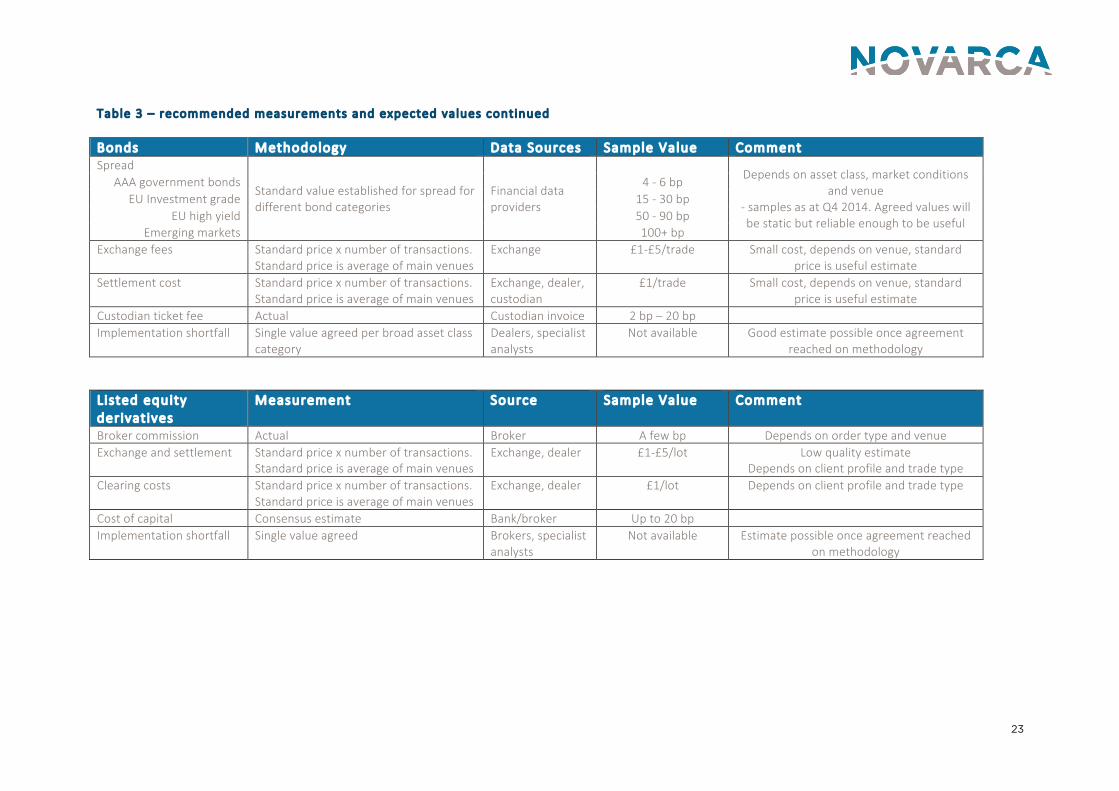
Table 3 – recommended measurements and expected values continued Bonds Methodology Data Sources Sample Value Comment Spread
Standard value established for spread for different bond categories
Financial data providers
Depends on asset class, market conditions
and venue -‐ samples as at Q4 2014. Agreed values will be static but reliable enough to be useful
AAA government bonds 4 -‐ 6 bp EU Investment grade 15 -‐ 30 bp
EU high yield 50 -‐ 90 bp Emerging markets 100+ bp
Exchange fees Standard price x number of transactions. Standard price is average of main venues
Exchange £1-‐£5/trade Small cost, depends on venue, standard price is useful estimate
Settlement cost Standard price x number of transactions. Standard price is average of main venues
Exchange, dealer, custodian
£1/trade Small cost, depends on venue, standard price is useful estimate
Custodian ticket fee Actual Custodian invoice 2 bp – 20 bp Implementation shortfall Single value agreed per broad asset class
category Dealers, specialist analysts
Not available Good estimate possible once agreement reached on methodology
L isted equity derivat ives
Measurement Source Sample Value Comment
Broker commission Actual Broker A few bp Depends on order type and venue Exchange and settlement Standard price x number of transactions.
Standard price is average of main venues Exchange, dealer £1-‐£5/lot Low quality estimate
Depends on client profile and trade type Clearing costs Standard price x number of transactions.
Standard price is average of main venues Exchange, dealer £1/lot Depends on client profile and trade type
Cost of capital Consensus estimate Bank/broker Up to 20 bp Implementation shortfall Single value agreed Brokers, specialist
analysts Not available Estimate possible once agreement reached
on methodology
24
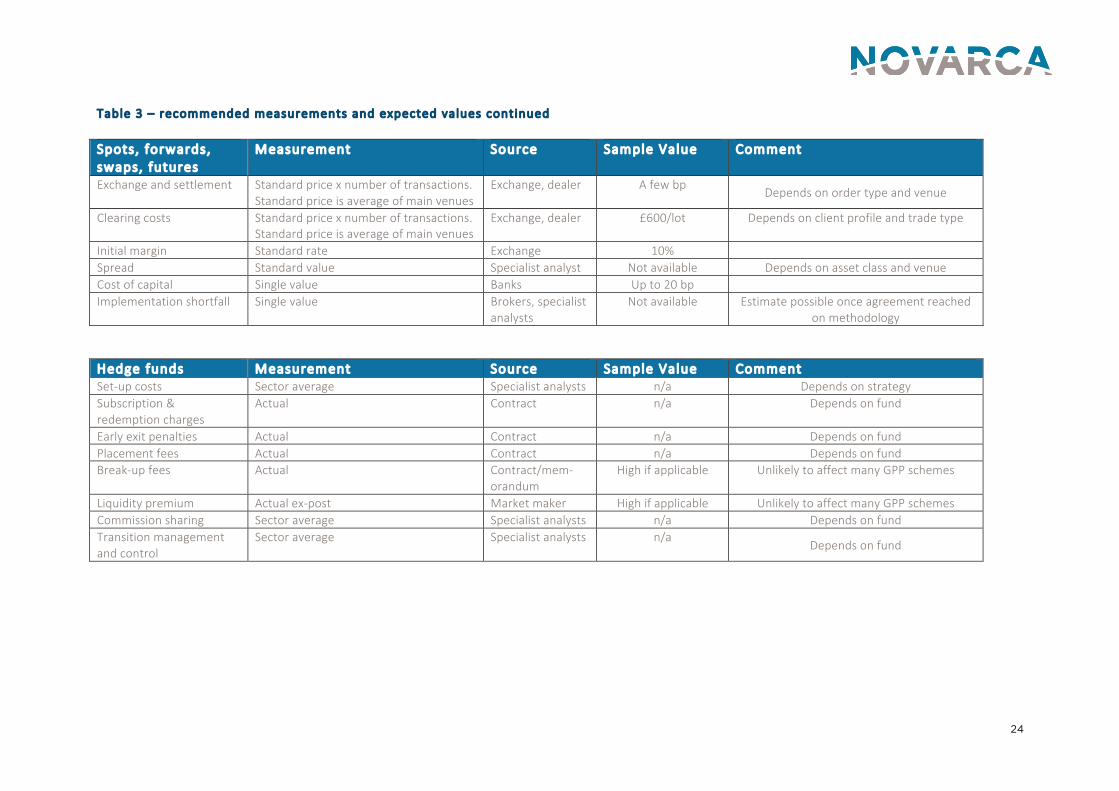
Table 3 – recommended measurements and expected values continued Spots, forwards, swaps, futures
Measurement Source Sample Value Comment
Exchange and settlement Standard price x number of transactions. Standard price is average of main venues
Exchange, dealer A few bp Depends on order type and venue
Clearing costs Standard price x number of transactions. Standard price is average of main venues
Exchange, dealer £600/lot Depends on client profile and trade type
Initial margin Standard rate Exchange 10% Spread Standard value Specialist analyst Not available Depends on asset class and venue Cost of capital Single value Banks Up to 20 bp Implementation shortfall Single value Brokers, specialist
analysts Not available Estimate possible once agreement reached
on methodology Hedge funds Measurement Source Sample Value Comment Set-‐up costs Sector average Specialist analysts n/a Depends on strategy Subscription & redemption charges
Actual Contract n/a Depends on fund
Early exit penalties Actual Contract n/a Depends on fund Placement fees Actual Contract n/a Depends on fund Break-‐up fees Actual Contract/mem-‐
orandum High if applicable Unlikely to affect many GPP schemes
Liquidity premium Actual ex-‐post Market maker High if applicable Unlikely to affect many GPP schemes Commission sharing Sector average Specialist analysts n/a Depends on fund Transition management and control
Sector average Specialist analysts n/a Depends on fund
25
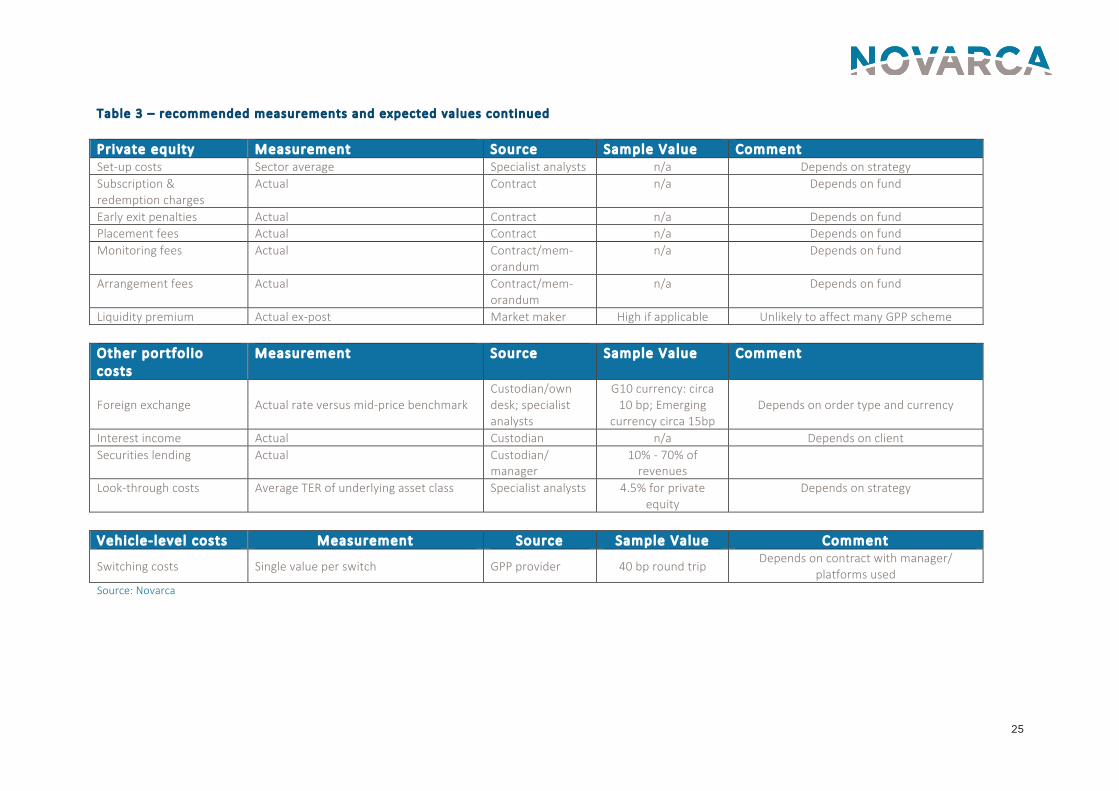
Table 3 – recommended measurements and expected values continued Pr ivate equity Measurement Source Sample Value Comment Set-‐up costs Sector average Specialist analysts n/a Depends on strategy Subscription & redemption charges
Actual Contract n/a Depends on fund
Early exit penalties Actual Contract n/a Depends on fund Placement fees Actual Contract n/a Depends on fund Monitoring fees Actual Contract/mem-‐
orandum n/a Depends on fund
Arrangement fees Actual Contract/mem-‐orandum
n/a Depends on fund
Liquidity premium Actual ex-‐post Market maker High if applicable Unlikely to affect many GPP scheme Other portfol io costs
Measurement Source Sample Value Comment
Foreign exchange Actual rate versus mid-‐price benchmark Custodian/own desk; specialist analysts
G10 currency: circa 10 bp; Emerging
currency circa 15bp Depends on order type and currency
Interest income Actual Custodian n/a Depends on client Securities lending Actual Custodian/
manager 10% -‐ 70% of revenues
Look-‐through costs Average TER of underlying asset class Specialist analysts 4.5% for private equity
Depends on strategy
Vehic le-‐ level costs Measurement Source Sample Value Comment
Switching costs Single value per switch GPP provider 40 bp round trip Depends on contract with manager/
platforms used Source: Novarca
26
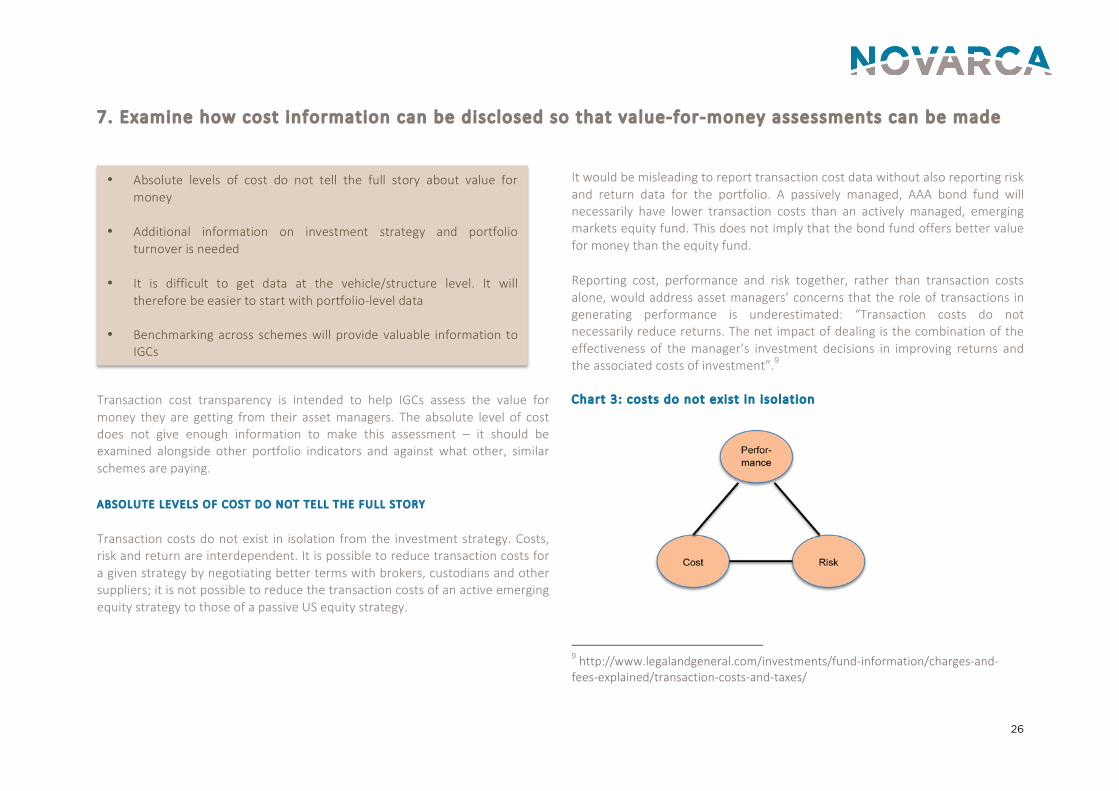
7. Examine how cost information can be disclosed so that value-‐for-‐money assessments can be made
Transaction cost transparency is intended to help IGCs assess the value for money they are getting from their asset managers. The absolute level of cost does not give enough information to make this assessment – it should be examined alongside other portfolio indicators and against what other, similar schemes are paying. ABSOLUTE LEVELS OF COST DO NOT TELL THE FULL STORY Transaction costs do not exist in isolation from the investment strategy. Costs, risk and return are interdependent. It is possible to reduce transaction costs for a given strategy by negotiating better terms with brokers, custodians and other suppliers; it is not possible to reduce the transaction costs of an active emerging equity strategy to those of a passive US equity strategy.
It would be misleading to report transaction cost data without also reporting risk and return data for the portfolio. A passively managed, AAA bond fund will necessarily have lower transaction costs than an actively managed, emerging markets equity fund. This does not imply that the bond fund offers better value for money than the equity fund. Reporting cost, performance and risk together, rather than transaction costs alone, would address asset managers’ concerns that the role of transactions in generating performance is underestimated: “Transaction costs do not necessarily reduce returns. The net impact of dealing is the combination of the effectiveness of the manager’s investment decisions in improving returns and the associated costs of investment”.9 Chart 3: costs do not exist in isolat ion
9 http://www.legalandgeneral.com/investments/fund-‐information/charges-‐and-‐fees-‐explained/transaction-‐costs-‐and-‐taxes/
• Absolute levels of cost do not tell the full story about value for money
• Additional information on investment strategy and portfolio
turnover is needed • It is difficult to get data at the vehicle/structure level. It will
therefore be easier to start with portfolio-‐level data • Benchmarking across schemes will provide valuable information to
IGCs
27
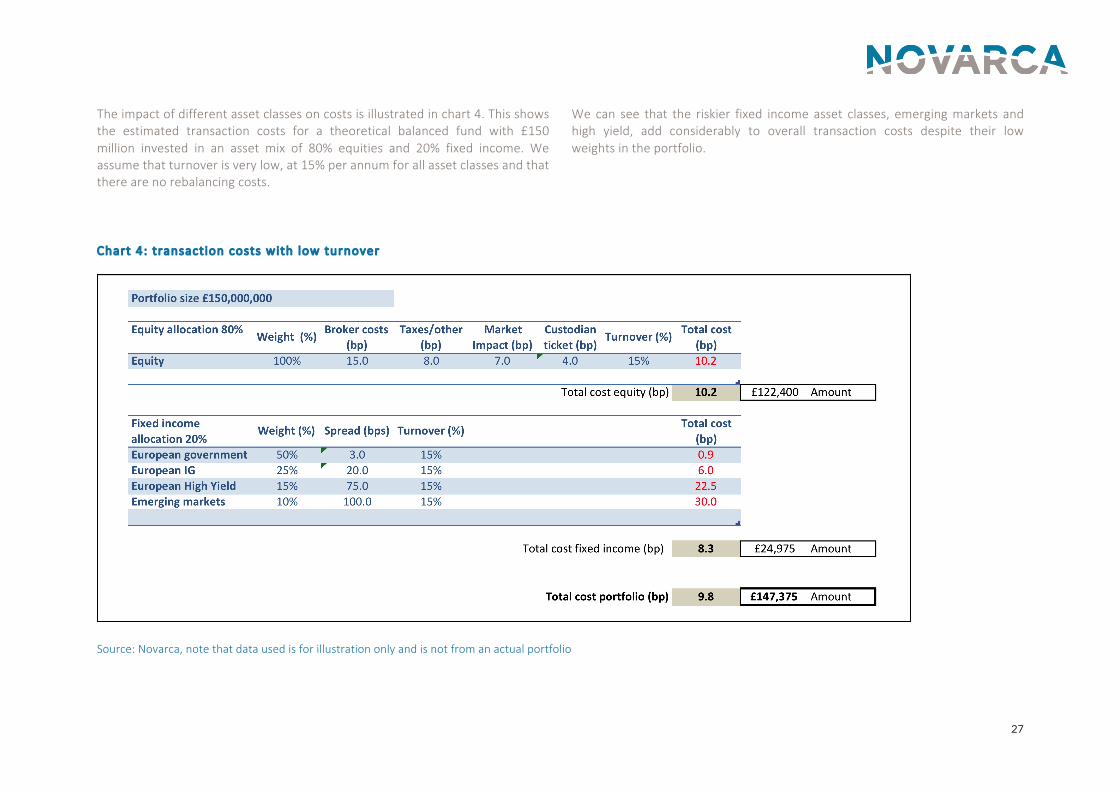
The impact of different asset classes on costs is illustrated in chart 4. This shows the estimated transaction costs for a theoretical balanced fund with £150 million invested in an asset mix of 80% equities and 20% fixed income. We assume that turnover is very low, at 15% per annum for all asset classes and that there are no rebalancing costs.
We can see that the riskier fixed income asset classes, emerging markets and high yield, add considerably to overall transaction costs despite their low weights in the portfolio.
Chart 4: transaction costs with low turnover
Source: Novarca, note that data used is for illustration only and is not from an actual portfolio
28
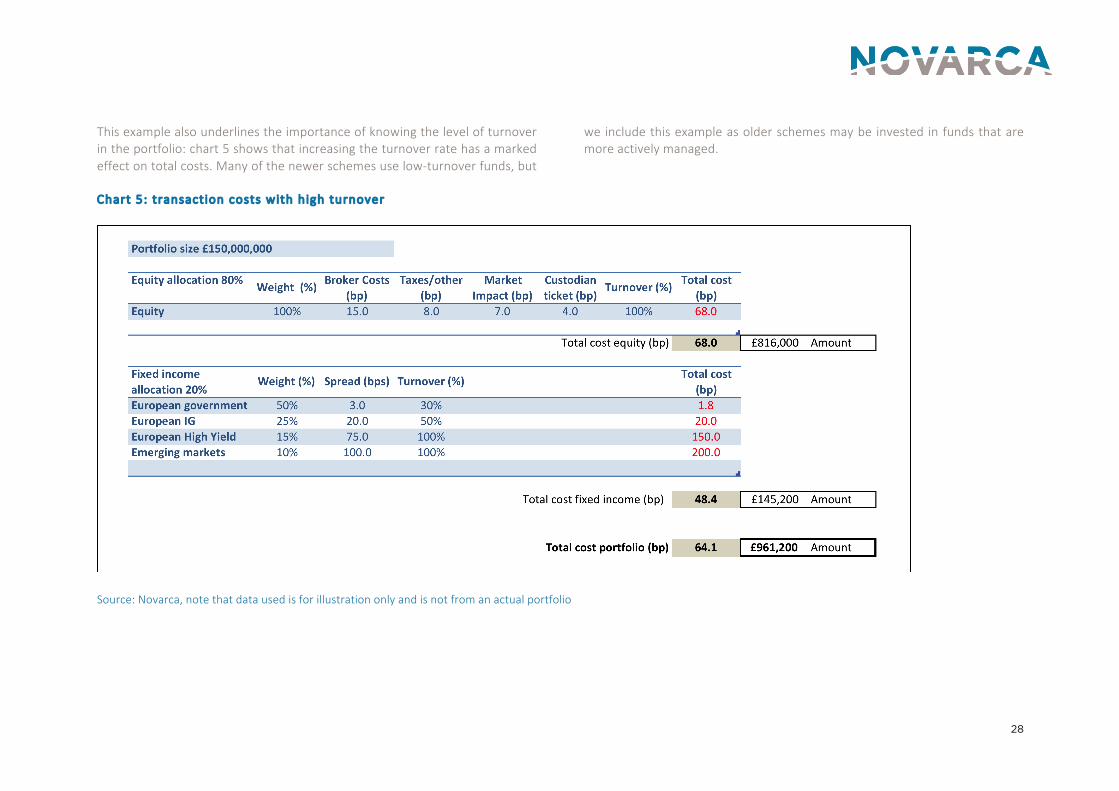
This example also underlines the importance of knowing the level of turnover in the portfolio: chart 5 shows that increasing the turnover rate has a marked effect on total costs. Many of the newer schemes use low-‐turnover funds, but
we include this example as older schemes may be invested in funds that are more actively managed.
Chart 5: transaction costs with high turnover
Source: Novarca, note that data used is for illustration only and is not from an actual portfolio
29
PORTFOLIO-‐LEVEL VERSUS SCHEME-‐LEVEL DATA We discussed in section 6 the challenges of aggregating transaction cost data at the vehicle level. However the data is much more readily available at the underlying portfolio level, especially the eight cost categories we identified in table 2 as being relatively easy to make transparent and as providing a lot of useful information: broker commission, custodian ticket fees, stamp duty and other taxes, market impact and spread. Providing this information to IGCs on a portfolio-‐level basis would enable them to
• Compare across providers within an asset class o for example, are all managers with US large cap equity
exposure generating the same level of transaction costs o if not, is this due to differences in the turnover rate or to
differences in fee levels?
• Compare across asset classes o in conjunction with the risk and return data discussed above,
are the US large cap equity managers getting the same value for money from their transactions as the emerging market bond managers
o if not, is this due to the nature of the asset class or the behaviour of the managers?
• Make scheme-‐level estimates based on the overall asset allocation and
the average costs of the underlying asset classes as revealed at the portfolio level
BENCHMARKING ACROSS SCHEMES As well as comparing the costs reported by their own asset managers, it would be valuable for IGCs to be able to compare their costs to those of other GPP providers. A benchmark can be constructed for broad investment categories (private equity, active large cap equity...) by taking the average of the figures reported to IGCs (and potentially other trustee-‐type bodies e.g. master trusts). The benchmark would not be perfect
1. it would be biased by the weight of the largest in-‐house asset managers, which could penalise smaller external managers
2. transaction costs are currently under-‐reported so the average would probably understate true costs initially
However it would give IGCs additional insight into the behaviour of their underlying managers in relation to transactions. The reporting templates illustrated in section 9 are designed to capture cost data in a format suitable for benchmarking as well as for internal use by IGCs.
30
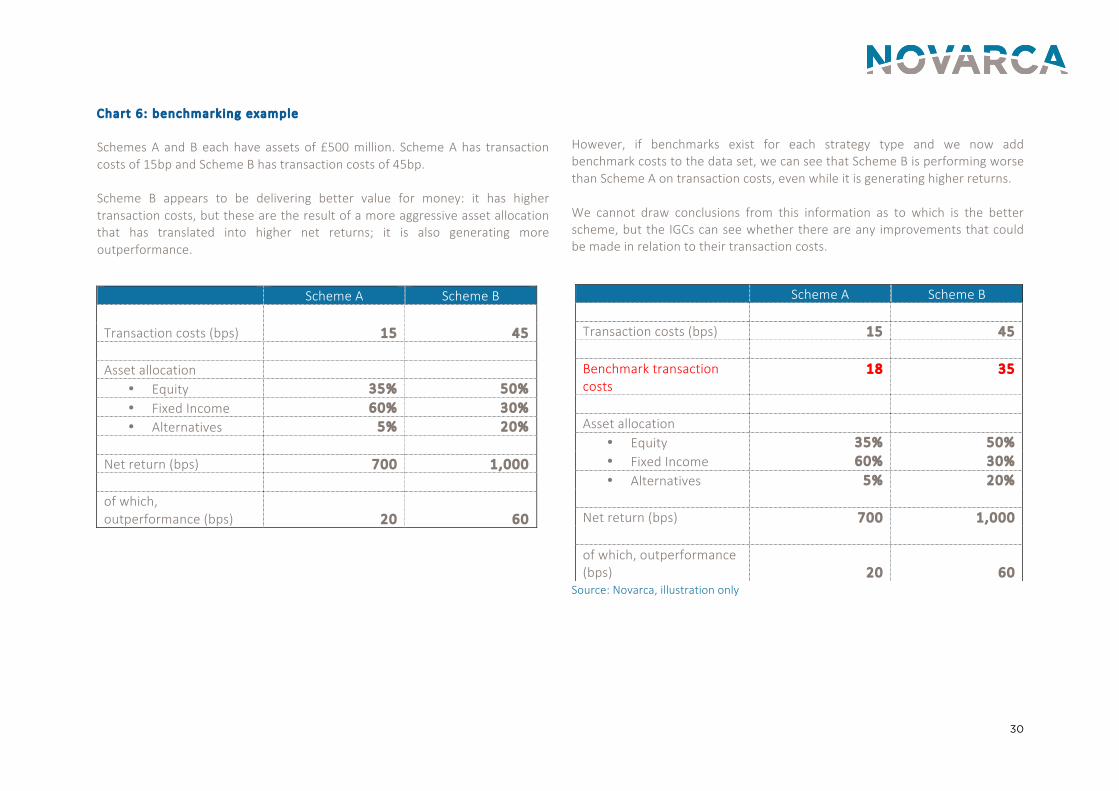
Chart 6: benchmarking example Schemes A and B each have assets of £500 million. Scheme A has transaction costs of 15bp and Scheme B has transaction costs of 45bp. Scheme B appears to be delivering better value for money: it has higher transaction costs, but these are the result of a more aggressive asset allocation that has translated into higher net returns; it is also generating more outperformance.
However, if benchmarks exist for each strategy type and we now add benchmark costs to the data set, we can see that Scheme B is performing worse than Scheme A on transaction costs, even while it is generating higher returns. We cannot draw conclusions from this information as to which is the better scheme, but the IGCs can see whether there are any improvements that could be made in relation to their transaction costs.
Source: Novarca, illustration only
Scheme A Scheme B Transaction costs (bps) 15 45 Asset allocation
• Equity 35% 50% • Fixed Income 60% 30% • Alternatives 5% 20%
Net return (bps) 700 1,000 of which, outperformance (bps) 20 60
Scheme A Scheme B Transaction costs (bps) 15 45 Benchmark transaction costs
18 35
Asset allocation
• Equity 35% 50% • Fixed Income 60% 30% • Alternatives 5% 20%
Net return (bps) 700 1,000 of which, outperformance (bps) 20 60
31
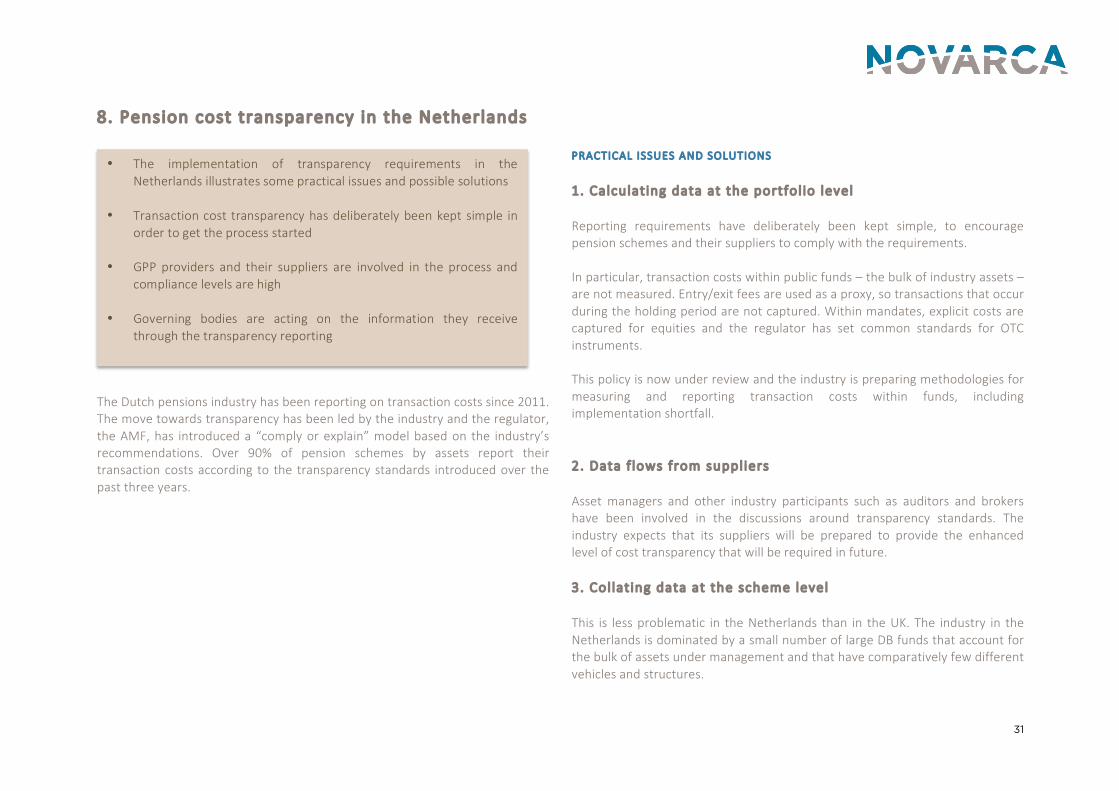
8. Pension cost transparency in the Netherlands
The Dutch pensions industry has been reporting on transaction costs since 2011. The move towards transparency has been led by the industry and the regulator, the AMF, has introduced a “comply or explain” model based on the industry’s recommendations. Over 90% of pension schemes by assets report their transaction costs according to the transparency standards introduced over the past three years.
PRACTICAL ISSUES AND SOLUTIONS 1. Calculat ing data at the portfol io level Reporting requirements have deliberately been kept simple, to encourage pension schemes and their suppliers to comply with the requirements. In particular, transaction costs within public funds – the bulk of industry assets – are not measured. Entry/exit fees are used as a proxy, so transactions that occur during the holding period are not captured. Within mandates, explicit costs are captured for equities and the regulator has set common standards for OTC instruments. This policy is now under review and the industry is preparing methodologies for measuring and reporting transaction costs within funds, including implementation shortfall. 2 . Data f lows from suppl iers Asset managers and other industry participants such as auditors and brokers have been involved in the discussions around transparency standards. The industry expects that its suppliers will be prepared to provide the enhanced level of cost transparency that will be required in future. 3 . Col lat ing data at the scheme level This is less problematic in the Netherlands than in the UK. The industry in the Netherlands is dominated by a small number of large DB funds that account for the bulk of assets under management and that have comparatively few different vehicles and structures.
• The implementation of transparency requirements in the Netherlands illustrates some practical issues and possible solutions
• Transaction cost transparency has deliberately been kept simple in
order to get the process started • GPP providers and their suppliers are involved in the process and
compliance levels are high • Governing bodies are acting on the information they receive
through the transparency reporting
32
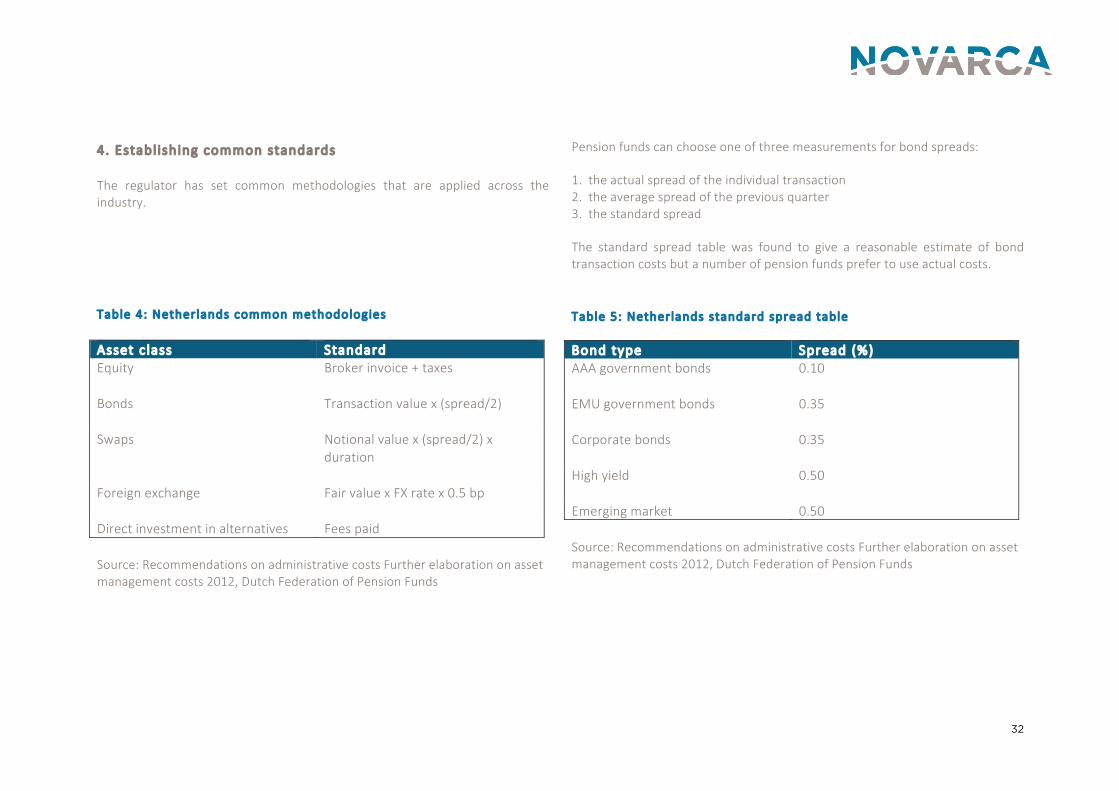
4 . Establ ishing common standards The regulator has set common methodologies that are applied across the industry.
Table 4: Netherlands common methodologies Asset c lass Standard Equity
Broker invoice + taxes
Bonds
Transaction value x (spread/2)
Swaps Notional value x (spread/2) x duration
Foreign exchange
Fair value x FX rate x 0.5 bp
Direct investment in alternatives Fees paid Source: Recommendations on administrative costs Further elaboration on asset management costs 2012, Dutch Federation of Pension Funds
Pension funds can choose one of three measurements for bond spreads:
1. the actual spread of the individual transaction 2. the average spread of the previous quarter 3. the standard spread
The standard spread table was found to give a reasonable estimate of bond transaction costs but a number of pension funds prefer to use actual costs. Table 5: Netherlands standard spread table Bond type Spread (%) AAA government bonds
0.10
EMU government bonds
0.35
Corporate bonds 0.35
High yield
0.50
Emerging market 0.50 Source: Recommendations on administrative costs Further elaboration on asset management costs 2012, Dutch Federation of Pension Funds
33
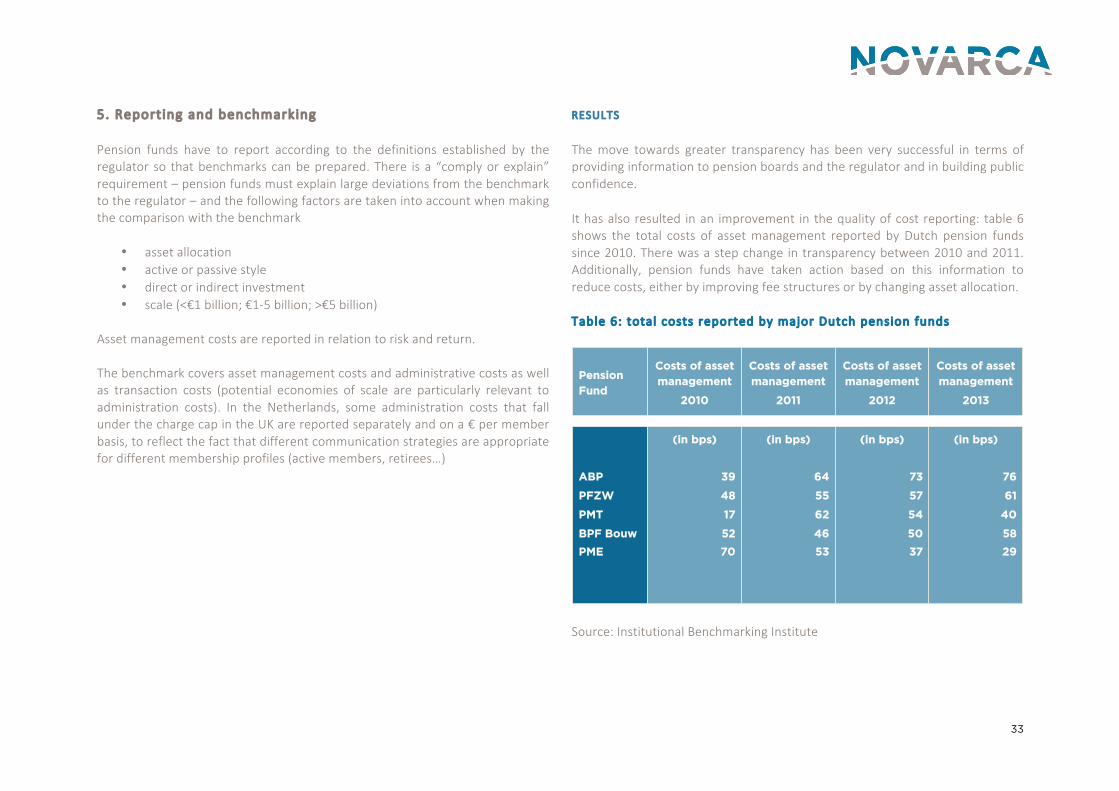
5. Report ing and benchmarking Pension funds have to report according to the definitions established by the regulator so that benchmarks can be prepared. There is a “comply or explain” requirement – pension funds must explain large deviations from the benchmark to the regulator – and the following factors are taken into account when making the comparison with the benchmark
• asset allocation • active or passive style • direct or indirect investment • scale (<€1 billion; €1-‐5 billion; >€5 billion)
Asset management costs are reported in relation to risk and return. The benchmark covers asset management costs and administrative costs as well as transaction costs (potential economies of scale are particularly relevant to administration costs). In the Netherlands, some administration costs that fall under the charge cap in the UK are reported separately and on a € per member basis, to reflect the fact that different communication strategies are appropriate for different membership profiles (active members, retirees…)
RESULTS The move towards greater transparency has been very successful in terms of providing information to pension boards and the regulator and in building public confidence. It has also resulted in an improvement in the quality of cost reporting: table 6 shows the total costs of asset management reported by Dutch pension funds since 2010. There was a step change in transparency between 2010 and 2011. Additionally, pension funds have taken action based on this information to reduce costs, either by improving fee structures or by changing asset allocation. Table 6: total costs reported by major Dutch pension funds
Source: Institutional Benchmarking Institute
ABP
PFZW
PMT
BPF Bouw
PME
Pension Fund
(in bps)
39
48
17
52
70
(in bps)
64
55
62
46
53
(in bps)
76
61
40
58
29
Costs of asset management
2011
(in bps)
73
57
54
50
37
Costs of asset management
2010
Costs of asset management
2012
Costs of asset management
2013
34
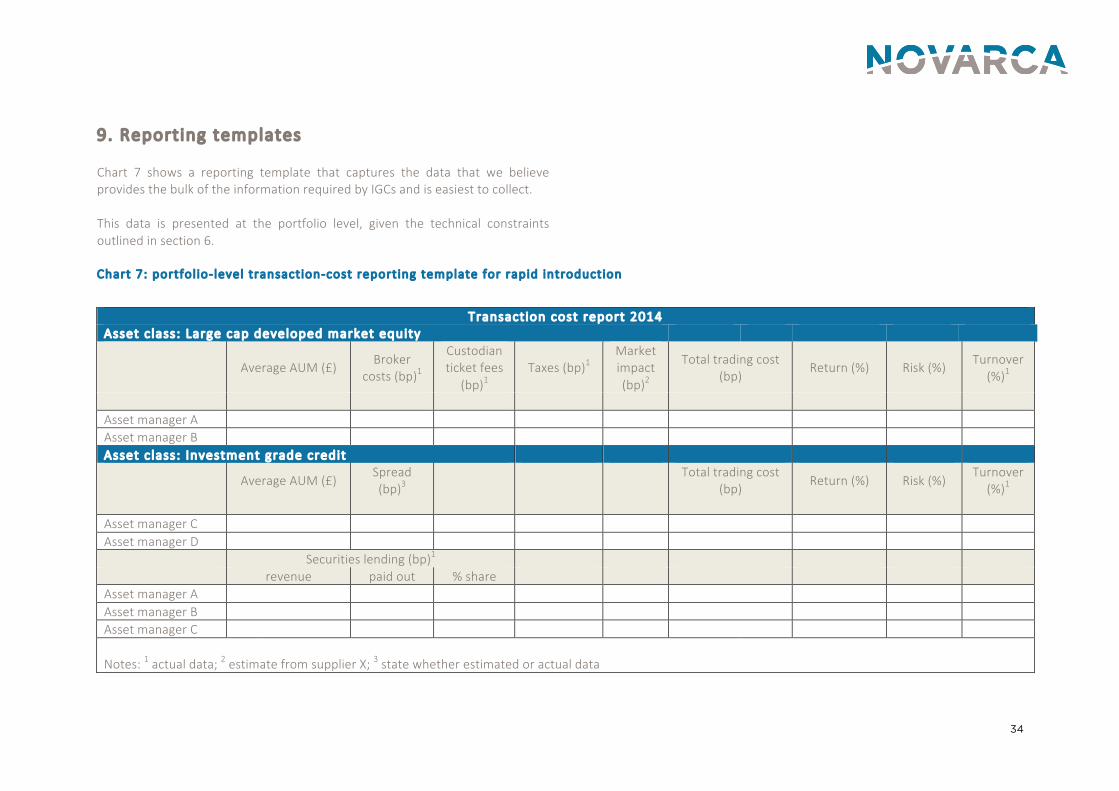
9. Reporting templates Chart 7 shows a reporting template that captures the data that we believe provides the bulk of the information required by IGCs and is easiest to collect. This data is presented at the portfolio level, given the technical constraints outlined in section 6.
Chart 7: portfol io-‐ level transaction-‐cost report ing template for rapid introduction
Transaction cost report 2014 Asset c lass: Large cap developed market equity
Average AUM (£) Broker
costs (bp)1
Custodian ticket fees
(bp)1 Taxes (bp)1
Market impact (bp)2
Total trading cost (bp)
Return (%) Risk (%) Turnover
(%)1
Asset manager A Asset manager B Asset c lass: Investment grade credit
Average AUM (£) Spread (bp)3
Total trading cost
(bp) Return (%) Risk (%)
Turnover (%)1
Asset manager C Asset manager D
Securities lending (bp)1 revenue paid out % share
Asset manager A Asset manager B Asset manager C Notes: 1 actual data; 2 estimate from supplier X; 3 state whether estimated or actual data
35
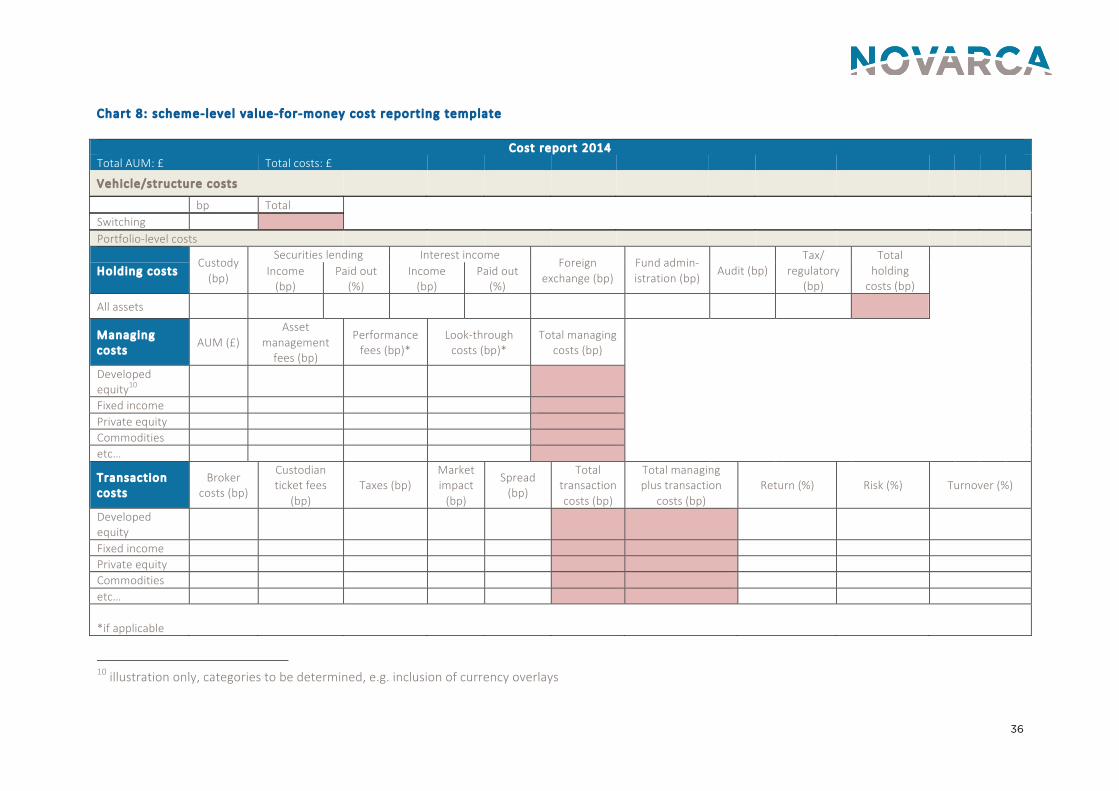
Chart 8 shows a template that captures scheme-‐level data (as this becomes available) and allows benchmarking across schemes of both portfolio costs and other costs. As GPP providers and asset managers become better at collecting and collating data, it will be possible to include more implicit costs in the portfolio-‐level reports and to calculate totals at the level of the scheme. Portfolio-‐level costs are reported by asset class, building on the data gathered in chart 7. This means that IGCs can benchmark themselves against other GPP providers while taking into account the important differences in underlying investment strategies. Given the expected differences between the results for active versus passive portfolios, there is an argument for keeping the reporting for the two investment styles separate. The template includes data that is outside the scope of this report, such as asset management fees, but that is important in assessing value for money. The template thus gives IGCs a broad overview of the most relevant costs, including some costs that fall within the charge cap. The data is very similar to what is collected in the Netherlands, although as discussed above their transaction cost data is less granular, and holding costs are reported in less detail.
36
Chart 8: scheme-‐level value-‐for-‐money cost report ing template
Cost report 2014 Total AUM: £ Total costs: £
Vehicle/structure costs
bp Total Switching Portfolio-‐level costs
Custody (bp)
Securities lending Interest income Foreign
exchange (bp) Fund admin-‐istration (bp)
Audit (bp) Tax/
regulatory (bp)
Total holding costs (bp)
Holding costs Income
(bp) Paid out
(%) Income (bp)
Paid out (%)
All assets
Managing costs
AUM (£) Asset
management fees (bp)
Performance fees (bp)*
Look-‐through costs (bp)*
Total managing costs (bp)
Developed equity10
Fixed income Private equity Commodities etc…
Transaction costs
Broker costs (bp)
Custodian ticket fees
(bp) Taxes (bp)
Market impact (bp)
Spread (bp)
Total transaction costs (bp)
Total managing plus transaction
costs (bp) Return (%) Risk (%) Turnover (%)
Developed equity
Fixed income Private equity Commodities etc… *if applicable
10 illustration only, categories to be determined, e.g. inclusion of currency overlays
37
DISCLAIMER Novarca has prepared this report for the FCA. This document is for information purposes. No part of this report may be reproduced without the written permission of Novarca. Novarca makes every effort to ensure that the sources and information used to prepare this report are reliable but accepts no responsibility for any errors or omissions, or for the actions of third parties. This report and the information contained in it do not constitute advice. Opinions expressed within this document are subject to change without notice.