Trade advantages and specialisation dynamics in acceding countries · the Lafay index shows with...
52
WORKING PAPER NO 249 TRADE ADVANTAGES AND SPECIALISATION DYNAMICS IN ACCEDING COUNTRIES BY ANDREA ZAGHINI August 2003 EUROPEAN CENTRAL BANK WORKING PAPER SERIES
Transcript of Trade advantages and specialisation dynamics in acceding countries · the Lafay index shows with...
��������������� ��
������������������������������������������������������
��������������
������ !
� � � � � � � � � � � � � � � � � �
�����������������
��������������� ��
�������������������������������������������������������
���������������
������ !
� ������������� ���� ��� ���������������� ����������� ������������������ ��� ������ ��������� ����������� ���������������� ���� �� ���� ���!���������������� �� �������� �"�#������ �� ��������������������� �� ������� ����$�����%��&��� ���������������� '�� ����'��� ���������� ������())'''��������� ��� ������ ������������������*�' �&����� �������������(�����())������ �)��������+��,440923.
- ��� ���� $������ %��&�� ����� ���� � ������ . ������ /����������� -0�� �1234��� 5���&���� ��� ������ 6������� �1����(������7������8�������
� � � � � � � � � � � � � � � � � �
�����������������
� ������������ ��������
������� ���������������
���������������� !��
"�� �#
$���� ������� $�����%&������
���������������� !��
"�� �#
'� ��&�� ()�����))�
*����� &���+,,---.�%/.��
��0 ()�����))����
'� �0 )���))�%/�
��������������� �������������
�����������������������������������������������������������������������������������������������
��������������������������������������������������������������� ������!����
�������������� ����
���������������������
������������ ������������������������� �
��������
��������
�� ����������������� �
�� ������������ �
�� ������������������������������������� ���� ���� �!�������"��!����������������������������� ���� �������#����������$��������������������� ��
�� %������������������� �&��� '�!!�������������������������������!��������������� �&��� �����������!��������������������������� ��������������������� ��
� �����������������������(�������������������� �&�� )��������#�*���������������������������� �&�� ���������!�������������+� ��
�� ,���������� ��
-�!������� ��
���������� �.
/��������,�������0��1�(��1��#������������� �
������������ �������������������������
Abstract
The paper analyses the evolution of the trade specialisation pattern in the ten
countries which will join the EU in 2004, by studying the dynamics of their comparative
advantages over the period 1993-2000. The study finds that, although some countries
are still broadly relying on natural resources, most of them enjoy significant comparative
advantages in many manufactured goods. Moreover, in spite of large technological gaps
inherited from the long period of centrally planned economy, some were able to
specialise in “high tech” products. Finally, most countries recorded large specialisation
improvements in items for which the world demand expanded at the fastest rate over the
Nineties; in particular, Estonia, Hungary, Malta and Slovenia showed an overall positive
comparative advantage in the set of the most demanded products.
Keywords: Revealed comparative advantages, International Specialisation model,
Distribution dynamics.
JEL Classification: F14, F15, E23.

������������ ������������������������� �
Non-technical Summary
The paper analyses the evolution of the trade specialisation pattern in the ten
countries that are going to join the European Union in 2004 (“Acceding countries”). The
fast developments in trade flows and the changes in the distribution of comparative
advantages that characterised the economies of the former communist bloc in the 1990s
might well be regarded as an exceptional case. In fact, the progress over time of the
international trade pattern is a phenomenon that usually takes long time to unfold
reflecting deep structural changes in the whole economic system of a country.
The study of the specialisation dynamics relies on two different methodological
approaches. The first is based on the regression of the trade structure at two points in
time, i.e. the beginning and the end of the time sample. The second refers to a technique
successfully implemented in cross-country income convergence works and imported
only recently in the empirical trade analysis: the Markov transition probabilities
analysis. In particular, this approach is able to capture exactly the movements of the
entire distribution over time, instead of focusing on the changes occurring to the
external shape only.
Overall the analysis shows that Acceding countries have high comparative
advantages in many manufactured goods and that they rely less on natural resources and
raw materials than most other emerging economies. They generally display an
increasing specialisation trend and high mobility, even though changes are particularly
frequent in the middle of the distribution. Moreover, some countries (Hungary, Estonia
and the Czech Republic) display a fast catching-up in several “high-tech” products, in
spite of the significant technological gap they inherited from the planned economy era.
This unexpected evolution of the trade pattern might be attributable, at least partially, to
the phenomenon known as “advantage of backwardness”; namely, the need to rebuilt
and modernise the entire capital stock and the production plants allows firms to jump
close to the technological frontier by installing the most modern apparatus and
benefiting from the most update technology.
������������ �������������������������&
In addition the paper also investigates the evolution of comparative advantages
with respect to the world demand, in order to verify whether the specialisation pattern of
Acceding countries has moved towards the most dynamic manufactured goods. In
particular, four countries (Estonia, Hungary, Malta and Slovenia) show a positive
comparative advantage in the group of the 52 most demanded products over the 1990s,
though a widespread improvement in the exchange of many expanding items has been
recorded.
������������ ������������������������� �
1. Introduction
The evolution over time of trade specialisation is a phenomenon that often reflects
deep structural changes in the whole economic system of a country. It usually takes long
time to unfold since comparative advantages in trade are not gained in few days and are
structural almost by definition. However, there are few exceptions to this common
pattern. It might happen that sudden changes in the modalities of production are brought
about by external factors as wars, the diffusion of a completely new technology and vast
institutional changes. In this paper we analyse one of such exceptional cases: the
evolution of the trade specialisation pattern in the countries of the former communist
bloc that are going to join the European Union.
The evolution of trade in Acceding countries has been remarkable in the 1990s.
The degree of openness increased dramatically; the integration with the EU market
(boosted by the Association Agreement signed bilaterally by those countries) led to a
doubling of their market shares in EU trade; FDI soared, allowing almost entirely the
financing of large current account deficits (IMF, 2000). Thus, in spite of the shortness of
data availability for trade flows in Acceding countries (1993-2000), the radical changes
in the productive structure occurred during the transition process from a centrally
planned economy towards a fully-fledged market economy allow us to witness
important modifications in the distribution of comparative advantages, even in this
relatively short lapse of time.
In analysing the specialisation dynamics of the 10 countries that will be integral
part of the European Union in mid-20043 we rely on a recent strand of the literature,
which is trying to address the issue of overtaking the limit of the empirical trade analysis
in the context of the traditional concept of trade specialisation (Ricardian and
Heckscher-Ohlin models). In fact, the empirical literature has been involved in the study
3 Even though Cyprus and Malta did not belong to the former communist bloc and did not undergo any
transition process, for the sake of completeness they are included in the present study together with theCzech Republic, Estonia, Hungary, Latvia, Lithuania, Poland, the Slovak Republic and Slovenia. At thesame time, since Bulgaria and Romania will join the EU in a later stage they are excluded.
������������ �������������������������.
of the international specialisation pattern of countries mainly from a static point of view,
i.e. at a given point in time, whereas the theoretical literature on growth and trade
highlights the dynamic and endogenous properties of comparative advantages
(Krugman, 1987; Lucas 1988, Grossman and Helpman, 1991). However, the theoretical
literature often yields ambiguous conclusions. For instance, sector-specific learning-by-
doing is a self-reinforcing mechanism that typically induces persistence, while
knowledge spillovers and technology transfers give rise to mobility. Eventually, whether
a country exhibits persistence or mobility over time is a matter of empirical assessment.
To bridge the gap between theory and empirical works Proudman and Redding
(2000), Brasili et al. (2000) and Redding (2002) borrowed from the cross-country
studies on income convergence the empirical approach of the Markov transition
matrices. Through this approach it is possible to exactly identify the movement over
time of the entire distribution of comparative advantages characterising a given country.
With respect to the quoted papers, we apply this methodology to a larger number of
items and we employ a different index of specialisation. In particular, we compute the
Lafay Index of international specialisation for 208 items of the 3-digit SITC
classification. The choice of a different index is attributable to several appealing features
the Lafay index shows with respect to alternative measures of specialisation, especially
that of taking into account both exports and imports flows, which is a quite important
fact due the increasing role of intra-industry trade all over the world.
In addition to the analysis of changes in trade specialisation per sé, we also
investigate the evolution of comparative advantage with respect to the world demand, in
order to verify whether the specialisation pattern of Acceding countries has moved
towards the most dynamic manufactured goods, as it has happened, for instance, in
emerging Asian economies (Carolan et al; 1998).
Overall our analysis shows that Acceding countries have high comparative
advantages in many manufactured goods and that they rely less on natural resources and
raw materials than other emerging economies. They generally display an increasing
specialisation trend and high mobility, even though changes are particularly frequent in
the middle of the distribution. The three Baltic countries (Estonia, Latvia and Lithuania)
������������ ������������������������� �
and the Czech Republic are somehow more dynamic economies, whereas Poland,
Slovenia and the two Mediterranean islands more static. Moreover, some countries
(Hungary, Estonia and the Czech Republic) display a fast catching-up in some “high-
tech” products, in spite of the significant technological gap they inherited from the
planned economy era. This unexpected evolution of the trade pattern might be
attributable, at least partly, to the phenomenon known as “advantage of backwardness”;
namely, the need to rebuilt and modernise the entire capital stock and the production
plants allows firms to jump close to the technological frontier by installing the most
modern apparatus and benefiting from the most update technology.
With respect to the world demand only four countries (Estonia, Hungary, Malta
and Slovenia) show a positive comparative advantage in the group of the 52 most
demanded products, though a widespread improvement in the exchange of many
expanding items has been recorded. However, many differences remain among
Acceding countries both in the degree of specialisation and in the capacity of adjusting
towards a rapidly changing world demand.
The paper is organised as follows: in Section 2 we examine the international
specialisation pattern of Acceding countries at the end of the 1990s; in Section 3 we
introduce the analytical framework of the dynamic trade analysis and we assess the
structural stability of the model both by looking at the changes that have occurred to the
shape of the distribution of comparative advantages and by taking into account intra-
distribution dynamics; in Section 4 we investigate the evolution of the specialisation
pattern of Acceding countries with respect to the world demand; Section 5 concludes.
2. International specialisation patterns
2.1 The Lafay index of international specialisation
Different indicators might measure the extent of a country’s specialisation in a
given sector. In this paper the analysis of trade advantages is carried out through the
index of international specialisation proposed by Lafay (1992). The choice of the right
������������ ��������������������������+
index depends on many circumstances; our opinion is that in the current context of
increasing intra-industry trade, a careful assessment of international comparative
advantages requires to take into consideration not only exports but also imports. In fact,
the process of “International fragmentation of production” (IFP), i.e. the mechanism by
which foreign firms (especially from the EU) delocalise into Acceding countries part of
their production, both through the establishment of affiliates and subsidiaries and by
outsourcing agreements with local firms, generates trade flows of parts, semi-finished
and intermediate goods between foreign and Acceding countries firms. Thus, the
distortion introduced in the analysis depends on the level of data disaggregation: for
fairly aggregated groups of products the size of intra-industry trade flows becomes
quickly significant and any evaluation of the trade performance based only on exports
turns out to be a poor indicator.4 The Lafay index (LFI), by taking into account imports,
allows to control for intra-industry trade and re-export flows; in this sense it is superior
to the traditional Revealed Comparative Advantages index (Balassa, 1965) and the
Beneficial Structural Change index (Bender, 2001).
Moreover, unlike other two well know indexes as the Michaely index and the
Trade Specialisation index, it also controls for distortions induced by macroeconomic
fluctuations.5 Since comparative advantages are structural, by definition, it is crucial to
eliminate the influence of cyclical factors, which can affect the magnitude of trade flows
in the short run. The Lafay index takes into account these effects by considering the
difference between each item’s normalised trade balance and the overall normalised
trade balance. Finally, the Lafay index weights each product’s contribution according to
the respective importance in trade.
For a given country, i, and for any given product, j, the Lafay index is defined as:
4 For the relevance of the intra-industry trade phenomenon in Accession countries see Fidrmuc et al.
(1999).5 In Appendix A, the alternative specialisation indexes quoted in the text are expressed in analytical
terms.

������������ ������������������������� ��
(1)
∑∑
∑
==
=
+
+
+
−−
+−
=N
j
ij
ij
ij
ij
N
j
ij
ij
N
j
ij
ij
ij
ij
ij
iji
j
mx
mx
mx
mx
mx
mxLFI
11
1
)()(
)(
100 ;
where ijx and i
jm are exports and imports of product j of country i, towards and from
the rest of the world, respectively, and N is the number of items. According to the index,
the comparative advantage of country i in the production of item j is thus measured by
the deviation of product j normalised trade balance from the overall normalised trade
balance, multiplied by the share of trade (imports plus exports) of product j on total
trade.6
Given that the index measures each group’s contribution to the overall normalised
trade balance, the following relation holds: 01
=∑=
N
j
ijLFI . Positive values of the Lafay
index indicate the existence of comparative advantages in a given item; the larger the
value the higher the degree of specialisation. On the contrary, negative values points to
de-specialisation.7
2.2 Acceding countries’ trade specialisation
The main data-set for the analysis of the trade specialisation scheme of the 10
Acceding countries that are going to join the European Union in 2004 is the World
Trade Analyzer by Statistics Canada. This dataset consistently recompiles UN trade data
over the period 1993-2000 for the whole set of countries. Needless to say, the reference
period has been one of dramatic changes in these countries, many of which did not even
6 The index used in the paper slightly differs from the original one, since the weights proposed by
Lafay (1992) are the shares of trade in each sector relative to GDP.7 Even if in the paper we will refer to a negative value of the Lafay index as “de-specialisation” or
“comparative disadvantage”, this does not mean that the trade in those sectors is not advantageous interms of welfare for the economy.
������������ ���������������������������
exist as independent States at the beginning of the1990s. It is also likely that such deep
structural changes have strongly affected the productive structure.8
However, the use of trade data has some drawbacks: they are usually quite erratic,
and they are expressed only in nominal terms (current dollars in the WTA data base), so
that it is impossible to tell apart ‘quantity’ and ‘price’ effects, which would have been of
extreme interest in the present analysis. Moreover, also the different degree of openness
of the countries, and the overall size of trade flows may vary across-countries.9
The Lafay index for the 10 countries has been computed at a fairly disaggregate
level, 208 items from the 3-digit SITC classification. In order to reduce the problem of
dealing with erratic data, calculations refer to average annual data over the period 1999-
2000. Moreover, to avoid the distortions arising from trade flows that are not classified
in the standard framework of the SITC classification, the group Commodities not
classified elsewhere (9) was not considered in the calculation of the Lafay index.10 Table
1 reports for each country the three items of top specialisation while in Appendix B the
10 items of the highest specialisation and the 10 of the highest de-specialisation for the
Acceding countries are listed, together with the relative weight on national trade
(exports plus imports) and the share on international markets.
8 Note that is not uncommon in the literature, given the lack of data on production at industry level, to
use trade flows pattern as a proxy for the productive structure of a country. Thus, the present paper mightshed some light also on the productive specialization strictu sensu of the Acceding countries (see forinstance Eichengreen and Kohl, 1998). For a thorough empirical analysis of the relationship among tradeand productivity in developing countries, see Rauch and Weinhold (1999).
9 The use of nominal data is common in the trade literature when dealing with developing andemerging economies. For instance, Brasili et al. (2000) relied on the same database of this paper in orderto compare the trade performance of the advanced countries with that of some dynamic Asian economies.As for the Acceding countries, after the large oscillations in the exchange rate and the burst of inflationrecorded in the early phase of the transition process, the exchange rate with respect to the dollar hassomehow stabilised, such that the JP Morgan real broad effective exchange rate index reports changesover the period 1995-2000 well within a range of ±10% with respect to the base year.
10 The 3-digit SITC (Rev. 2) classification includes 233 different items; we have excluded all those forwhich data were not available for all countries and those belonging to group 9. The 208 items hereconsidered cover a share of total trade usually close to 95 per cent for each country. The broad 1-digitcategories to which we will refer in the paper are: Food and live animals chiefly for food (0), Beveragesand tobacco (1), Crude materials, inedible, except fuels (2), Mineral fuels, lubricants and related materials(3), Animal and vegetable oils, fats and waxes (4), Chemicals and related products (5), Manufacturedgoods classified chiefly (6), Machinery and transport equipment (7), Miscellaneous manufactured articles(8).
������������ ������������������������� ��
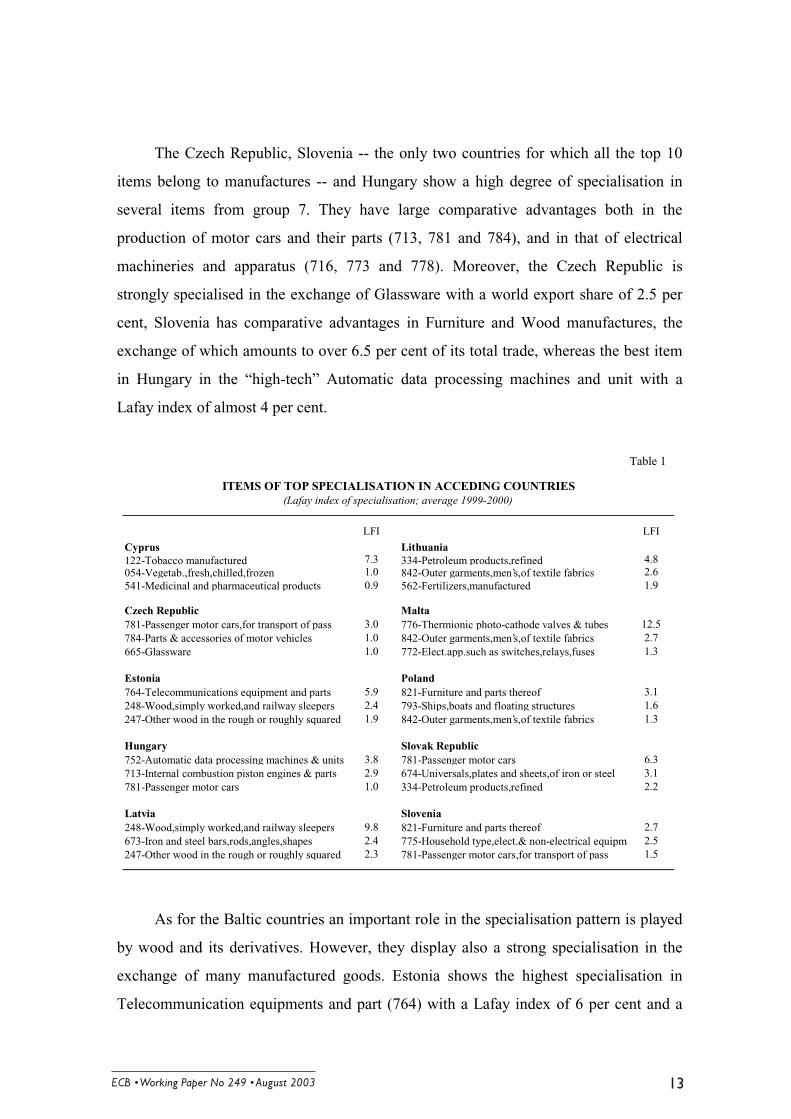
The Czech Republic, Slovenia -- the only two countries for which all the top 10
items belong to manufactures -- and Hungary show a high degree of specialisation in
several items from group 7. They have large comparative advantages both in the
production of motor cars and their parts (713, 781 and 784), and in that of electrical
machineries and apparatus (716, 773 and 778). Moreover, the Czech Republic is
strongly specialised in the exchange of Glassware with a world export share of 2.5 per
cent, Slovenia has comparative advantages in Furniture and Wood manufactures, the
exchange of which amounts to over 6.5 per cent of its total trade, whereas the best item
in Hungary in the “high-tech” Automatic data processing machines and unit with a
Lafay index of almost 4 per cent.
As for the Baltic countries an important role in the specialisation pattern is played
by wood and its derivatives. However, they display also a strong specialisation in the
exchange of many manufactured goods. Estonia shows the highest specialisation in
Telecommunication equipments and part (764) with a Lafay index of 6 per cent and a
Table 1
LFI LFI
Cyprus Lithuania122-Tobacco manufactured 7.3 334-Petroleum products,refined 4.8054-Vegetab.,fresh,chilled,frozen 1.0 842-Outer garments,men’s,of textile fabrics 2.6541-Medicinal and pharmaceutical products 0.9 562-Fertilizers,manufactured 1.9
Czech Republic Malta781-Passenger motor cars,for transport of pass 3.0 776-Thermionic photo-cathode valves & tubes 12.5784-Parts & accessories of motor vehicles 1.0 842-Outer garments,men’s,of textile fabrics 2.7665-Glassware 1.0 772-Elect.app.such as switches,relays,fuses 1.3
Estonia Poland764-Telecommunications equipment and parts 5.9 821-Furniture and parts thereof 3.1248-Wood,simply worked,and railway sleepers 2.4 793-Ships,boats and floating structures 1.6247-Other wood in the rough or roughly squared 1.9 842-Outer garments,men’s,of textile fabrics 1.3
Hungary Slovak Republic752-Automatic data processing machines & units 3.8 781-Passenger motor cars 6.3713-Internal combustion piston engines & parts 2.9 674-Universals,plates and sheets,of iron or steel 3.1781-Passenger motor cars 1.0 334-Petroleum products,refined 2.2
Latvia Slovenia248-Wood,simply worked,and railway sleepers 9.8 821-Furniture and parts thereof 2.7673-Iron and steel bars,rods,angles,shapes 2.4 775-Household type,elect.& non-electrical equipm 2.5247-Other wood in the rough or roughly squared 2.3 781-Passenger motor cars,for transport of pass 1.5
ITEMS OF TOP SPECIALISATION IN ACCEDING COUNTRIES(Lafay index of specialisation; average 1999-2000)

������������ ��������������������������
weight on trade of 12 per cent, while Lithuania has two items from group 7 among the
best 10 (773 and 776); in Latvia 8 of the top items belong to manufactured products (5
from group 6 and 3 from group 8).
Poland and the Slovak Republic exhibit comparative advantages in several items
from group 7 and 8 but also in Copper (Poland) and Aluminium (Slovak Rep.) from
group 6 and in non-manufactured goods as Fruit, preserved and fruit preparation
(Poland) and Petroleum products (Slovak Rep.). Malta concentrates its comparative
advantage in Thermionic valves and tubes (776), with a weight of almost 40 per cent of
its total trade, and a world export share of 0.5 per cent, which is remarkable given the
small size of the economy. The value of the Lafay index for this item (12.5 per cent) is
the largest of the whole set of Acceding countries. Finally, Cyprus has a specialisation
pattern that largely differs from the rest of the economies under analysis. It exhibits a
strong comparative advantage in Tobacco (122), for which its world export share is
surprisingly high (2 per cent), and in many other non-manufactured goods. The only
manufactured item in which the value of the Lafay index is close to 1 per cent is
Medical and pharmaceutical products.
As for disadvantages, the pattern is strikingly common across Acceding countries.
They all have disadvantages, sometimes indeed large, in manufactured goods from all
groups and in petroleum products both refined and raw. Only Latvia has among the
bottom 10 items a non-manufactured product (Meat), with a negative value of the Lafay
index of almost 1 per cent.
Comparing these findings with the results from recent studies on other emerging
market economies it is possible to detect many similarities among the specialisation
pattern of some CEE countries (Slovenia, Czech Republic and Hungary) and fast
developing Asian economies such as Thailand, Malaysia and the Philippines (Bentivogli
and Monti, 2001; Bender and Li, 2002). On the other hand, even the Baltic countries
with their still relatively strong dependence on natural resources are more oriented
toward manufactures than the vast majority of Latin American countries (Caselli and
Zaghini, 2003).
������������ ������������������������� ��
Usually the catching-up path of a developing country is expected to start in sectors
in which the economy displays relative comparative advantages, i.e. low-tech industries.
Only when the initial gap has been closed (or broadly reduced) in those sectors, the
country speeds up the closure of the gap in the next (more) technology-intensive
industries. Thus, the lagging country is expected to improve in more sophisticated
branches only later on, moving from step to step as if climbing a technological ladder
(Krugman, 1986). It might also happen that in the catching-up process the economy
lagging behind improves quickly in sectors in which the productivity gains are sizeable,
namely where the technology gap is the largest. This “jumping-up” implies that the
effort in learning, skill acquisition and organisational and managerial capacities is
usually significant. Yet, the “backwardness” of the productive structure might become
an advantage since it is possible to skip intermediate states of development by adopting
immediately the most updated technology (Landesmann and Stehrer, 2001).
The “jumping-up” approach might help explain the international specialisation
pattern that characterises the trade performance of Acceding countries. The static
analysis of comparative advantages as revealed by trade flows highlighted that even
though there are many differences in the specialisation pattern of the Acceding
countries, the general model is oriented towards many manufactured goods some of
which “high-tech” products. This accomplishment is indeed remarkable given the
starting point of these economies. In fact, the transition from a socialist to a market
economy began with a productive structure built in a framework which lacked market-
induced signals about the relative scarcity of outputs and inputs and with a highly
distorted system of relative prices. Moreover, the ideological suppression of profit
concerns reduced innovation entailing a growing technology gap between the centrally
planned and the advanced market-oriented economies. However, Acceding countries
were also endowed with a share of skilled-labour force much larger than that prevailing
in developing countries with comparable per-capita income. This circumstance might
have allowed firms to skip several steps in the technological ladder by taking full
advantage of the large investment flows provided by EU countries.
������������ ��������������������������&
In the following paragraph we analyse in detail the evolution over time of the
distribution of comparative advantages by taking into account the dynamics of trade
patterns both with respect to changes in the overall degree of specialisation, and by
considering intra-distribution dynamics to address the issue of the persistence of
international specialisation models and to shed some light on the comparative
advantages switchovers in Acceding countries.
3. Structural stability
3.1 Different approaches to the study of trade dynamics
The analytical tools we are going to apply to the study of the stability of the
international specialisation pattern of Acceding countries are inspired by two different
approaches. A first one, based on the seminal contributions of Pavitt (1989) and
Cantwell (1989), exploits the following regression equation:
(2) NjSISI ijSTARTijii
ENDij ,...1 =++= εβα .
The dependent variable is the distribution of a given international specialisation
index for country i at the end of the time sample, the exogenous variable is the
distribution of the same index at the beginning of the period, α and β are the standard
linear regression parameters and ε is the residual term. The interpretation of the
regression results is straightforward: a β coefficient equal to 1 means that the
specialisation pattern has remained unchanged over time; a coefficient β >1 shows that
the country has become more (less) specialised in sectors in which it already had a
competitive advantage (disadvantage); 0<β <1 denotes that on average the signs of the
specialisation pattern have remained the same but the index has improved in sectors
with initial low values and worsened in sectors with initial high values.11 In the special
11 In particular, when β <1, disadvantaged sectors improve their initial position and advantages sectors
slip back; this is what is usually referred to as “regression towards the mean”, thus the value (1-β) is alsocalled “regression effect” (Cantwell, 1989).
������������ ������������������������� ��
case β <0, the specialisation ranking has reversed. It should be also pointed out that
nothing can be said on the determinants of the initial specialisation pattern and that the
method is one of comparing two cross-sections at two points in time, i.e. there is no
element of time across the observations.
However, the analysis of the regression coefficient per sé is not enough to
conclude that changes in scheme of comparative advantages/disadvantages determine a
variation in the degree of specialisation. In fact, the regression coefficient tells us what
happens on average and nothing about the changes in the dispersion of the distribution.
To gain some hints also about the changes occurred in the dispersion of the distribution
of comparative advantages it is possible to exploit the following relation deriving
directly from the regression equation (2):
(3)( )
( ) 2
2
i
iSTARTi
ENDi
RSIVAR
SIVAR β= ;
where VAR(SIEND) and VAR(SISTART) are the variances of the endogenous and exogenous
variable, respectively, and R2 is coefficient of determination (the square of the
correlation coefficient).
It follows that when β =R the dispersion of the distribution is unchanged, when β
>R (equivalent to a rise in the dispersion) the degree of specialisation has increased,
when β <R (equivalent to a reduction in the dispersion) the degree of specialisation has
decreased. Note that the correlation coefficient R is a measure of the mobility of sectors
along the distribution. A large value of the coefficient denotes that the relative position
of the items is almost unchanged, whereas a low level indicates that some sectors are
moving closer together and other are shifting farther apart. The value (1-R) is thus often
quoted as the “mobility effect”.
The joint analysis of the “regression” and “mobility” effects is able to shed some
light on the changes of the distribution of the comparative advantages over time. In fact,
it may well happen that the regression coefficient suggest a fall in the degree of
specialisation due to a proportional move of the sectors towards the average (regression
������������ ��������������������������.
effect), but the overall effect is in the opposite direction due to a change in the
proportional position of sectors (mobility effect).
The second and most recent approach to the study of trade dynamics, is based on a
technique successfully implemented in the study of cross-country income convergence
and imported in the trade analysis by Proudman and Redding (2000), Brasili et al.
(2000) and Redding (2002). This kind of analysis is able to capture exactly the
movements of the entire distribution over time, instead of focusing on some indicators.
Following Quah (1993 and 1996), let ( )SIFt denote the distribution across sectors
of a given specialisation index at time t. Corresponding to Ft it is possible to define a
probability measure λ such that:
(4) ( ) ( ) ℜ∈∀=−∞ sisiFsi tt ],(λ .
The evolution of the distribution is then modelled as a stochastic difference
equation:
(5) ( )ttt uM ,* 1−= λλ ;
where {ut: integer t} is a sequence of disturbances and M* is an operator that maps
probability measures (and disturbances) into probability measures, and tracks where
points in Ft-1 end up in Ft. Thus, M* encodes information on intra-distribution
dynamics. By setting the disturbances to zero and assuming that the operator M* is time
invariant, we can iterate forward the first-order stochastic difference equation to obtain:
(6) ( ) ts
st M λλ *=+ .
If the space of possible values for si is divided into a number of discrete intervals,
M* becomes a matrix, and the value of each cell turns out to be a transition probability;
namely, the probability that an item beginning in a given cell i, to which is associated a
segment of the specialisation range, moves to another distinct cell j, characterised by a
different specialisation interval. The probabilities may be easily estimated by counting
the number of transitions out of and into each cell. From the transition probabilities, it is
possible to infer the extent of the mobility among different segments of the distribution:
������������ ������������������������� ��
high values of transition probabilities along the diagonal indicate persistence, while
larger off-diagonal terms imply greater mobility. Moreover, the stationary (or ergodic)
distribution of Ft is obtained by taking the limit →s ∞ in equation (6).12
3.2 The shape of the distribution and intra-distribution dynamics
In order to analyse the changes in the external shape of the specialisation
distribution over time, in Table 2 we compare the values of some reference indexes at
the beginning and the end of the time sample. The range of the distribution has
increased in all countries but Cyprus and Poland, usually because of an increase in the
maximum value of the Lafay index. The standard deviation, the most common index
used in the empirical literature to test for changes in the degree of specialisation, has
increased in six countries, remained broadly unchanged in two, and decreased in
Lithuania and Poland. In the latter countries also the sum of the Lafay index for the top
5 items decreased, whereas for all the other economies it increased or remained
unchanged. The number of items belonging to the central interval of the distribution
(-σ/8, +σ/8), and thus those for which the Lafay index is close to zero, has strongly
increased, such that, regardless of whether the number of positive items has increased or
decreased over time, the contribution of positive values has generally decreased.
However, the number of items showing a positive specialisation is always smaller than
the number of products for which the Lafay index is negative; only for the Czech
Republic the two sets are almost of the same size.
The general picture that is possible to draw from this set of indexes is that, even
though the frequency mass of the distribution tended to concentrate around intermediate
values, the increase in the dispersion of the distribution and the growing relative weight
of the top items point to a likely increase in the specialisation of these countries. This
finding is supported by a recent work by Tajoli (2003), which reports evidence of
12 Analytically, the resulting long-run distribution is simply the eigenvector associated with the largest
eigenvalue of the transition probability matrix.

������������ ��������������������������+
increasing specialisation in Acceding countries over the period 1994-2000, by looking at
the Herfindahl index for the export concentration in 16 manufacturing sectors.
Yet, there are two exceptions: Lithuania and Poland. For these economies the
variance diminished over time as well as the sum of the top 5 and top 10 items, for
Poland also the range of the distribution shrank, while Lithuania is the only country for
which the number of items close to zero diminished. Thus, the changes in the value of
the indicators suggest a reduction in the specialisation instead of an increase for Poland
and Lithuania, a result that is in line with the current empirical literature on trade
dynamics. In fact, the general finding of increasing specialisation for Acceding countries
partly contrasts to the available studies on advanced economies (Proudmann and
Redding, 2000; Laursen, 2000; Redding, 2002) and Asian developing countries (Brasili
et al., 2000), all pointing to a reduction in the international specialisation. However,
comparison with other economies are of extreme difficulty dealing with Acceding
countries, since they represent a somewhat unique case given the impressive
Table 2
c
1993-94 1999-00 1993-94 1999-00 1993-94 1999-00 1993-94 1999-00 1993-94 1999-00
Maximum 5.11 7.28 2.16 3.01 2.77 5.94 2.04 3.82 6.19 9.82Minimum -5.22 -2.93 -1.92 -1.40 -2.01 -1.85 -2.18 -1.77 -3.82 -4.03Range 10.33 10.21 4.08 4.41 4.78 7.79 4.22 5.59 10.01 13.85Standard Deviation 0.58 0.57 0.35 0.34 0.52 0.58 0.38 0.43 0.70 0.85Relative weight of top 10 items 14.04 12.16 8.51 8.81 16.36 16.67 10.30 12.28 20.98 22.77Relative weight of top 5 items 10.59 10.48 6.07 6.62 10.80 12.93 6.70 9.50 16.15 17.88Number of positive items 52 49 101 102 72 63 85 81 74 50Contribution of positive items 0.37 0.29 0.19 0.16 0.40 0.36 0.25 0.23 0.40 0.56Number of central items 117 147 69 86 81 105 74 102 93 126
R2
ββ / R
1993-94 1999-00 1993-94 1999-00 1993-94 1999-00 1993-94 1999-00 1993-94 1999-00
Maximum 7.57 4.84 9.10 12.52 2.36 3.11 5.33 6.27 2.06 2.71Minimum -2.45 -5.44 -2.96 -4.90 -3.48 -2.57 -1.81 -3.35 -1.96 -2.48Range 10.02 10.29 12.06 17.42 5.84 5.68 7.13 9.62 4.02 5.20Standard Deviation 0.67 0.64 0.76 1.01 0.50 0.42 0.50 0.65 0.37 0.40Relative weight of top 10 items 17.50 17.46 18.76 21.14 14.76 10.81 13.48 16.00 11.80 12.40Relative weight of top 5 items 13.87 12.23 15.35 18.48 9.97 7.84 10.29 13.28 8.02 9.07Number of positive items 81 70 35 38 81 93 77 78 71 72Contribution of positive items 0.33 0.36 0.62 0.58 0.33 0.22 0.30 0.30 0.27 0.26Number of central items 104 100 132 160 78 91 78 112 70 97
R2
ββ / R 1.1030.945 1.324 0.831 1.285
0.7720.584 1.290 0.732 0.661 0.9690.383 0.950 0.776 0.265
0.0820.3501.223
0.4160.6360.987
0.0520.2531.105
0.028
Hungary
0.1891.139
0.7390.8480.986
INDEXES OF POLARISATION AND REGRESSION RESULTS
Latvia
Lithuania Malta Poland Slovak Republic Slovenia
Cyprus Czech Republic Estonia
������������ ������������������������� ��
institutional changes and substantial economic transformations they experienced in
recent years.
By the simple informal analysis of Table 2 we were able to gather some
information about the shape of the distribution of the Lafay index, but nothing could be
said as regards the changes of the relative position of any single item. In what follows
we propose an investigation of intra-distribution dynamics that allows us to analyse the
mobility of items over time within the distribution.
The last three rows of Table 2 show the results of the following regression,
country by country:13
(7) 208,...1 94930099 =++= −− jLFILFI jjj εβα .
As introduced in Section 2 the dependent variable is the Lafay index at the end of
the time sample (average of 1999-2000 flows), while the exogenous variable is the
Lafay index at the beginning of the period (average of 1993-1994 flows). The
β coefficient is always significantly different from both 0 and 1, so that it is possible to
reject the hypotheses of both random pattern and average structural stability,
respectively, with the only exception of Slovenia for which the test accepted the null of
a stable pattern. Moreover, the coefficient is always smaller than 1 (0<β<1), with the
exception of Malta, for which it is significantly larger than 1. This implies that in all
country but Malta and Slovenia the international specialisation has increased for
products in which countries were initially relatively less specialised and has decreased
for those in which they were initially highly specialised. Nevertheless, there are
remarkable differences among countries: the value of β is very small for Estonia and
Hungary, thus pointing at large changes within the distribution, it is much higher for
Cyprus and Poland, then indicating a relative stability of the specialisation pattern, and
somehow intermediate for the remaining countries.
13 All the values reported in the last three rows of Table 2 are significant at the 5% level of confidence
to the tests performed, unless otherwise specified in the text.
������������ ���������������������������
The result of the regression coefficient alone would suggest an average reduction
in the trade specialisation; however also the correlation coefficient R must be taken into
account, since it is a measure of the mobility of sectors along the distribution. From
Table 2 it is possible to see that the value of R is so low in some countries, that the
strong “mobility effect” is able to offset the “regression effect”. Indeed, the correlation
coefficient indicates that many sectors are moving closer together and other are shifting
farther apart, i.e. there is high mobility within the distribution. Eventually, the ratio of
the two coefficients suggests an increase in the specialisation of six economies (Estonia,
Hungary, Latvia, Malta, Slovak Republic and Slovenia) towards a more “narrow”
distribution; this interpretation being confirmed by the increasing number of items close
to zero already reported.14
The linear regression gives us information about the conditional average of the
distribution, but a broader econometric analysis is required in order to gain a complete
picture of the mobility of sector specialisation within the distribution. The evolution of
the entire LFI distribution over time may be modelled formally, employing a technique
successfully used in the cross-country growth literature to analyse income convergence:
the Markov transition analysis (e.g., Quah, 1993 and 1996).
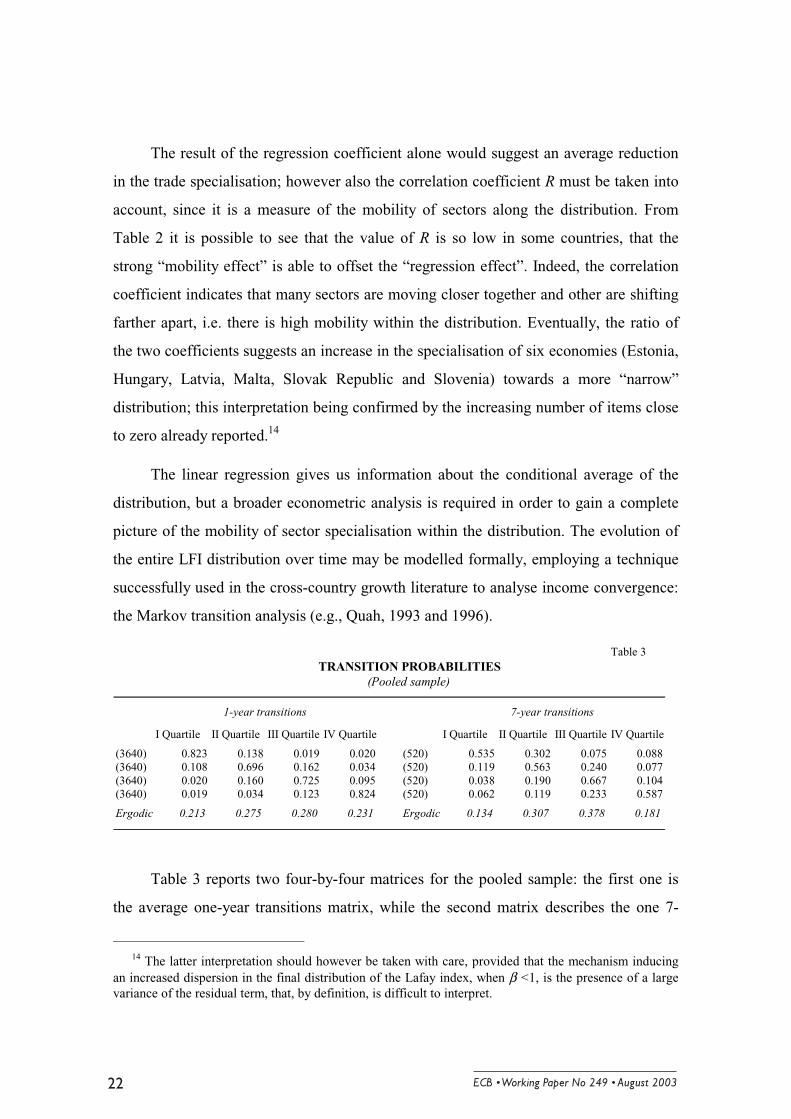
Table 3 reports two four-by-four matrices for the pooled sample: the first one is
the average one-year transitions matrix, while the second matrix describes the one 7-
14 The latter interpretation should however be taken with care, provided that the mechanism inducing
an increased dispersion in the final distribution of the Lafay index, when β <1, is the presence of a largevariance of the residual term, that, by definition, is difficult to interpret.
Table 3
I Quartile II Quartile III Quartile IV Quartile I Quartile II Quartile III Quartile IV Quartile
(3640) 0.823 0.138 0.019 0.020 (520) 0.535 0.302 0.075 0.088(3640) 0.108 0.696 0.162 0.034 (520) 0.119 0.563 0.240 0.077(3640) 0.020 0.160 0.725 0.095 (520) 0.038 0.190 0.667 0.104(3640) 0.019 0.034 0.123 0.824 (520) 0.062 0.119 0.233 0.587
Ergodic 0.213 0.275 0.280 0.231 Ergodic 0.134 0.307 0.378 0.181
TRANSITION PROBABILITIES
7-year transitions1-year transitions
(Pooled sample)

������������ ������������������������� ��
year transition from 1993 to 2000. The pooled analysis is provided only as a benchmark,
since it implies that the stochastic process determining the evolution of the LFI
distribution is the same in each economy. Thus, transition probability matrices are also
estimated for each of the Acceding countries individually (see Appendix B).
As for the one-year matrix, each cell (i, j) contains the probability that a sector in
the relative specialisation group i at time t transits to the specialisation group j at time
t+1, with the values along the same row adding up to one. The boundaries between cells
have been chosen so that the observations are equally divided into the grid cells. Thus,
the upper endpoints changes over time and the values of the estimated transition
probabilities characterise the degree of mobility between different quartiles of the LFI
distribution.15 For instance, the first row of the matrix presents the probability that a
product starting in the first quartile moves into the lower-intermediate (second quartile),
higher-intermediate (third quartile) and highest (fourth quartile) state of international
specialisation, respectively. The last row of the table gives the implied ergodic
distribution, i.e. the limit to which the specialisation pattern would tend were the
evolution process to last indefinitely. Finally, the first column of the table reports the
total number of items-year observations beginning in each cell.
Table 3 shows large values of the transition probabilities only for the diagonal
elements. In particular, the persistence is strong at the two ends of the distribution: the
value of cell (1, 1) and (4, 4), being larger than 80 per cent. This implies that it is
difficult for Acceding countries to improve from a situation of high de-specialisation,
but it is also true that once obtained a large comparative advantage they will likely
maintain it over time. Comparing our results with those obtained by Proudman and
Redding (2000) by pooling data from 5 industrialised economies, we can notice a
significantly lower persistence for Acceding countries, highlighted in particular by much
larger off-diagonal values. This evidence must not come to a surprise since it is well
15 To test for the robustness of the results, we have also computed the transition matrices by imposing
that the upper endpoints were equal to the values corresponding to the four quartiles of the initialdistribution; we thus allowed the number of observations per row to vary, even though they were stillroughly equally divided. The results are very similar to those reported in the table.
������������ ��������������������������
known that mature economies exhibit less dynamic patterns of international
specialisation.
Coming to single countries’ experiences, the probability of moving out of a given
cell after one period ranges from 10% to 38%, with Estonia, Latvia, Lithuania and the
Slovak Republic showing a somewhat larger mobility than the remaining countries.
Slovenia exhibits a very low mobility: for instance, the probability of an item moving
away from the first grid cell is as low as 13%, and that of shifting from the first to the
fourth is only 0.3%, the smallest in the whole sample. At the same time, an item of large
comparative advantage has a probability close to 90% to remain in the top specialisation
interval. Among the countries with large estimated mobility, Latvia shows the lowest
probability of remaining in the same sector for the lower and lower-intermediate quartile
(74 and 62 per cent, respectively), Estonia has the lowest value in the upper-
intermediate quartile, and Estonia and Lithuania together in the upper quartile. In
general, the off-diagonal elements of the matrix are largest in the lower- and upper-
intermediate grid cell, highlighting a greater mobility in the middle of the distribution,
i.e. in the items for which Acceding countries’ comparative advantages/disadvantages
are close to zero.
Concerning the 1993-2000 transitions matrix, each cell (i, j) contains the
probability that a sector in the relative specialisation group i in 1993 (time t) transits to
the specialisation group j in 2000 (time t+7). As expected, from Table 3 it is possible to
see that diagonal values are now smaller than in the one-year matrix, thus suggesting a
larger mobility within the LFI distribution. In fact, the probabilities in the 7-year matrix
are generally larger because their estimates are relative to a longer period. It is also
interesting to notice that the values relative to the two ends of the distribution on the
main diagonal are smaller than those in the middle of the distribution. Namely, over the
7-year horizon it is easier to maintain a mild advantage (disadvantage) than a strong one,
the opposite with respect to the one-year case. This circumstance might be interpreted
again as Acceding countries being able to gain comparative advantages relatively fast in
sectors for which they initially displayed a large gap in terms of international
competitiveness. Thus somehow supporting the idea that they were able to jump to the
������������ ������������������������� ��
technological frontier in sectors in which they were strongly lagging behind in the early
phases of the transition.
In line with these findings and with the “jumping-up” hypothesis is the work by
Kaitila (2001), which depicts how the factor intensity of comparative advantages has
changed from 1993 to 1998 in some manufacturing sectors. In particular, the study
suggests that for Hungary, Estonia, the Czech Republic and Lithuania the share of
comparative advantages with respect to the EU has increased significantly in products
with high and medium-high intensity in skilled work. At the same time, the categories
intensive in low skilled work still accounted in 1998 for a share of close or above 80 per
cent for the remaining economies. As for cross-country comparison, a similar
development in the trade pattern, i.e. the change over time from a large disadvantage to
a significant advantage in some “high tech” goods is reported by Stehrer and Wörz
(2001) for a group of 6 Asian countries (Hong Kong, Indonesia, South Korea, Malaysia,
Singapore and Thailand) and by Caselli and Zaghini (2003) for Mexico, even though in
a much longer time horizon (1981-1997 and 1980-2000, respectively).
When looking at the country level, there is again large heterogeneity. For instance
Malta and Slovenia show very high probabilities of an item remaining both in the first
and in the fourth quartile, while in Poland not only the probability of remaining in the
fourth quartile is over 80 per cent, but that of moving away from the fourth quartile to
the first half of the distribution is almost zero. The opposite is true for Hungary, for
which the probability of remaining in the first quartile or at most moving to the second
is 85 per cent. In the Czech Republic the estimated matrix suggests that the probability
of shifting position after 7 years is almost independent of the initial quartile, since the
values on the main diagonal range from 52 to 58 per cent only.
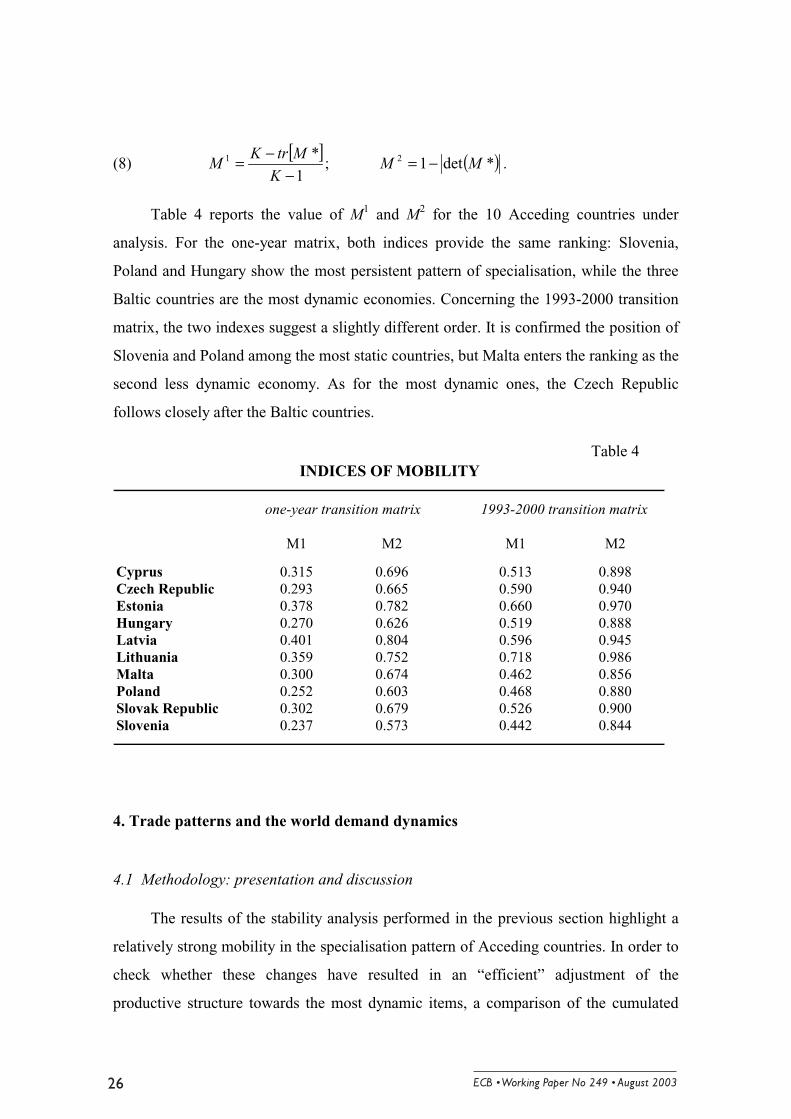
In order to facilitate direct comparisons, we propose two indexes of mobility,
which formally evaluate the degree of mobility throughout the entire LFI distribution
(Shorrocks; 1978). The index M1 captures the relative magnitude of diagonal and off-
diagonal terms by evaluating the trace of the transition probability matrix, while index
M2 refers to the determinant of the matrix:
������������ ��������������������������&
(8) [ ] ( )*det1 ;1
* 21 MMK
MtrKM −=
−−= .
Table 4 reports the value of M1 and M2 for the 10 Acceding countries under
analysis. For the one-year matrix, both indices provide the same ranking: Slovenia,
Poland and Hungary show the most persistent pattern of specialisation, while the three
Baltic countries are the most dynamic economies. Concerning the 1993-2000 transition
matrix, the two indexes suggest a slightly different order. It is confirmed the position of
Slovenia and Poland among the most static countries, but Malta enters the ranking as the
second less dynamic economy. As for the most dynamic ones, the Czech Republic
follows closely after the Baltic countries.
4. Trade patterns and the world demand dynamics
4.1 Methodology: presentation and discussion
The results of the stability analysis performed in the previous section highlight a
relatively strong mobility in the specialisation pattern of Acceding countries. In order to
check whether these changes have resulted in an “efficient” adjustment of the
productive structure towards the most dynamic items, a comparison of the cumulated
Table 4
M1 M2 M1 M2
Cyprus 0.315 0.696 0.513 0.898Czech Republic 0.293 0.665 0.590 0.940Estonia 0.378 0.782 0.660 0.970Hungary 0.270 0.626 0.519 0.888Latvia 0.401 0.804 0.596 0.945Lithuania 0.359 0.752 0.718 0.986Malta 0.300 0.674 0.462 0.856Poland 0.252 0.603 0.468 0.880Slovak Republic 0.302 0.679 0.526 0.900Slovenia 0.237 0.573 0.442 0.844
one-year transition matrix 1993-2000 transition matrix
INDICES OF MOBILITY
������������ ������������������������� ��
curve of the Lafay index at the beginning and at the end of the period with respect to the
world demand is now proposed. In particular, a specialisation model is labelled as
“efficient” when the country gains comparative advantages in items for which the world
demand has increased the most, thus implying the ability of the economy to strengthen
its trade shares on world markets.
First, the 208 items of the 3-digit SITC classification have been ordered according
to the average growth rates of world imports in the 1990s, then the resulting cumulated
curves of the Lafay index at the beginning and the end of the sample period have been
compared. The cumulated curve is computed by adding up the values of the Lafay index
for each item, following the ascending order of the world demand. Two caveats must be
born in mind: first, although the growth rates of world imports are averages over a
relatively long time-span (a decade), the standing is computed on values at current
prices (US dollars) and thus it might be influenced by currency volatility; secondly, in
the ordering the relative weight of each item is not considered, so that a good whose
demand has increased very rapidly gets a high position in the standing, even though it
represents a small share of the world demand.
Before analysing the cumulated Lafay curves, we shortly discuss the
characteristics of the standing and how items are distributed along it. The average rate of
growth of world imports over the period 1990-2000 was 6.7 per cent a year, with 15
items (almost all non-manufactured goods) displaying a negative rate. Among the 208
items selected in the paper, the rate of growth ranges from a negative rate of 5.3 per cent
of the worst performing item (Works of art & Antiques) to a positive 19.3 per cent of
the best item (Optical instruments and apparatus). Grouping the 208 products into four
sets starting from the slowest to the fastest, we can classify them as low (1st to 52nd),
medium-low (53rd to 104th), medium-high (105th to 156th) and high (157th to 208th)
growth items.16 The bulk of non-manufactured goods (more than three quarters) belongs
to the first half of the table, while the vast majority of manufactures (almost two thirds)
are located in the second half of the rank. In particular, in the high growth set, in which
16 The average growth rates of the four groups are 0.9%, 3.8%, 6.0% and 9.0%, respectively.

������������ ��������������������������.
the rate of expansion ranges from 7.0 to 19.3 per cent, there are only 8 items belonging
to groups 0 to 4 of the SITC classification.
Figure 1 depicts for the pooled sample the comparison of the specialisation pattern
at the beginning and the end of the period. The dotted line refers to the average 1993-
1994 while the continuous line refers to the average 1999-2000 for both the cumulated
curve and the histogram. On the x-axis there are the items ordered according to world
demand, whereas on the y-axis the value of the Lafay index is reported. As for the
cumulative distributions of the Lafay index, since the sum of all values is zero by
definition, the graph starts with the value of the index (positive or negative) associated
to the slowest item and ends at zero when adding the value of the index (positive or
negative) associated to the fastest item. The shape of the distribution is increasing in the
items which display a comparative advantage (positive Lafay index) and decreasing in
Specialization model of pooled sample and its evolution over time(Cumulated Lafay index; items ordered by world imports’ growth rate)
-6
-4
-2
0
2
4
6
8
1 53 105 157
-6
-4
-2
0
2
4
6
8
1999-2000
1993-1994
1999-2000
1993-1994
Wood simply workedPassenger motor cars
Petroleum oils
Furniture
Electricity equipments
������������ ������������������������� ��
the opposite case (negative Lafay index).17 The histogram displays the sum of the Lafay
index in each of the four 52-item sets described above: when it is positive there is an
aggregate comparative advantage in the group, de-specialisation is instead reported
when it is negative.
Following our definition of efficiency, a reduction over time of the comparative
advantage (or an increase in the disadvantage) in the low and medium-low growth
groups is interpreted as “positive”, whereas a similar change (reduction of the
comparative advantage or increase in the disadvantage) is considered “negative” if
reported in the medium-high and high growth groups. The underlying rationale is that a
dynamic economy, whose productive structure is relatively flexible and competitive,
should be able to improve its comparative advantages in favour of products whose
world demand has been increasing more rapidly.
4.2 Trade shifts in the 1990s
The shape of the 1993-1994 curve reported in Figure 1 highlights a pattern that is
common to many developing countries. Although the cumulated value for each growth
set is relatively mild, comparative advantages are massed in the first part of the rank,
while deficiencies are mainly located in the most dynamic items. Important changes are
reported at the end of the 1990s. The 1999-2000 curve is much closer to the horizontal
axis, thus indicating that negative and positive signs alternate almost in a continuos way.
Moreover, the depicted changes are always in the right direction: for the low and
medium-low growth sets of items the comparative advantages have been significantly
reduced, in the medium-high set an overall balance has been achieved and in the high
growth set the cumulated negative value of the Lafay index has more than halved.
As for single countries (see Appendix B), the shape of the cumulated curve at the
beginning of the time sample shows a strong similarity in the trade specialisation of the
Baltic countries. The graph is ascending in the first part of the rank and descending in
17 In the figure we indicate with an arrow the items corresponding to the most important changes in the
shape of the distribution.
������������ ��������������������������+
the second: the histograms for the low and medium-low growth groups display large
values of the cumulated Lafay index (from 3 to 6 per cent), while those for the medium-
high and high growth groups show negative aggregate values (from –2 to –8 per cent).
At the end of the period the cumulated curves suggest different evolutions. On the one
hand, Latvia increased its specialisation in the medium-low set, in which it already had a
large advantage (essentially due to the presence of wood and by-products), and it did not
change much in the other sets. On the other hand, Lithuania and Estonia switched to a
positive value in the medium-high and high growth set, respectively. The improvement
in Lithuania was due mainly to an increase in the specialisation in refined petroleum
products.18 In Estonia, although a relatively significant specialisation in the production
of wood was maintained, a strong positive value of the Lafay index emerged in the
production of a highly requested manufactured item: Telecommunications equipment
and parts (5.9 per cent in 1999-2000 from –1.3 in 1993-1994). Moreover, Estonia was
able to switch -- although in a less significant fashion -- from disadvantages at the
beginning of the period to advantages at the end in other fast growing items, some of
which usually classified as “high-tech” (Rotating electric plant and parts; Non-electric
engines & motors; Measuring, checking and analysing instruments). Also the
circumstance that all the changes in the histograms were in the right direction points to
an efficient structural adjustment in trade flows.
In Poland and Hungary the scenario in 1993-1994 was close to that of the Baltic
countries: the cumulated curve was increasing in the first half of the rank and then
gradually decreasing with just few big upwards and downwards jumps. The outlook has
improved significantly at the end of the 1990s, especially for Hungary, with the changes
in the histogram being always in the right direction. Though important switches from
negative to positive comparative advantages were not registered, Poland was able to
improve a lot in the high growth set, by reducing the disadvantage in the production of
oil and strengthening the specialisation in two largely traded items from group 8: Outer
18 However, at the same time a decrease of about the same size in crude oil in the high growth group
must be acknowledged. This circumstance is due to Russian oil traveling trough the country and thus itdoes not represent a true comparative advantage or disadvantage.
������������ ������������������������� ��
garments of textile fabrics and Furniture and parts thereof. Stronger changes
characterised the evolution of the Hungarian trade pattern. In 1999-2000, the first half of
the curve is almost flat, with negative and positive values of the Lafay index alternating
evenly: the only significant comparative advantage that was maintained over time is that
in the production of Meat (0.9 per cent). The second part of the curve, and in particular
that concerning high growth items, underwent major changes: the value of the
cumulated Lafay index for the last 52 items increased from –3.6 to 1.4 per cent. This
happened because Hungary was able to reach a large comparative advantage, from a
disadvantage at the beginning of the period, in several fast growing manufactured
items,19 thus successfully adapting the specialisation pattern towards the most dynamic
products.
The Czech and the Slovak Republic are both characterised by a strong and
increasing comparative advantage in the medium-high growth set. In particular, the
product for which they recorded the largest progress, and which account for almost the
whole improvement in the set, is Passenger motor cars. The Slovak Republic switched
from a negative value in 1993-1994 (–0.8 per cent) to a large positive one at the end of
the 1990s (5.2 per cent), whereas the Czech Republic improved its specialisation in both
Passengers cars and in the related item Parts & Accessories for cars and motor vehicles
for transport. However, the changes in the specialisation scheme of the Czech Republic
seem to be more evenly distributed than those of the Slovak Republic. The former
economy improved its position in all four growth groups, while the latter underwent
adjustment in the wrong direction in the first and fourth set. In particular, in the high
growth group the Czech Republic reduced its dependence from oil, maintained its
comparative advantages in the production of Glassware, Furniture and Wood
manufactures, and switched from negative to positive specialisation in two of the best
performing items of the 1990s: Equipment for distributing electricity and Electrical
machinery and apparatus. Meanwhile, in the same set, the Slovak Republic augmented
19 Telecommunications equipment and parts; Automatic data processing machines & units; Internal
combustion piston engines & parts.
������������ ���������������������������
the de-specialisation in Petroleum oil, Natural Gas and Medicinal and pharmaceutical
products, letting the cumulate value of the Lafay index reaching -11 per cent from -7.8
in 1993-1994.
With respect to world dynamics, Slovenia is the Acceding country with the best
pattern of international specialisation: its comparative advantages are mainly located in
the second half of the rank, while disadvantages are to be found in the low and medium-
low growth sets. Although the cumulated value of the top growing items has slightly
shrunk over time, Slovenia maintains a significant advantage and it is the country,
together with the Czech Republic, with the largest number of positive values of the
Lafay index in the group (22 items).
Finally, Cyprus and Malta, the two economies characterised by a strong
specialisation in a single item, show indeed little changes over time: the discrepancies
between the two cumulated curves are due to a further increase in the value of the Lafay
index for Tobacco and Thermionic photo-cathode, valves and tubes, respectively. Thus,
as expected, both countries display a strong positive advantage in a single set of items
and a negative specialisation in the remaining three. But while Cyprus has its maximum
comparative advantage in the low growth group, Malta can enjoy a strong position in the
fastest growing group.
5. Conclusions
The paper studied the evolution of the specialisation pattern of the 10 Acceding
countries which will join the EU in 2004 by analysing their comparative advantages as
“revealed” by trade flows over the period 1993-2000. Obviously, the relevant time
horizon is too short to come to a conclusive assessment and the very concept of revealed
comparative advantages can only be applied to the countries of the former communist
bloc with extreme caution, since they inherited production capacities intended to serve
the Council for Mutual Economic Assistance (CMEA), whose policy bias towards
autarky disregarded potential gains from international trade. Yet, preliminary evidence
suggests that the structural changes that have happened at institutional, political and
������������ ������������������������� ��
economic levels have already triggered important productive shifts and affected
significantly the trade specialisation pattern.
In the early 1990s the vast majority of Acceding countries of Central and Eastern
Europe started the transition toward the market economy with a relatively abundance of
agricultural land, raw materials as well as skilled and unskilled labour. However, the
legacy of the long planned-economy period resulted in outdated capital stock and
technology. Because of the different factor endowment with respect to the EU, early
analyses of trade patterns (Begg et al., 1990; Collins and Rodrik, 1991) hinted that
Acceding countries would have specialised in products intensive in labour, raw
materials and land. This paper suggests instead that less than 10 years later they show
significant comparative advantages in many manufactured goods especially from group
7 of the SITC classification (Machinery and Transport Equipment) and some “high-
tech” products. This unexpected catching-up evolution might be explained by referring
to a positive legacy of state socialism: human capital endowment with respect to both
health standard and level of education was relatively high in many countries of the
communist bloc compared to market-oriented economies with similar level of per-capita
income. This fact, together with the proximity to the EU market and the strong inflows
of FDI attracted by the prospect of the enlargement, have helped firms to surpass
intermediate steps in development and benefit fully of the most updated technology, at
least in some industries.
However, since Acceding countries have liberalised and reformed their economies
to a varying degree, and given the differences in their earlier manufacturing bases,
political stability, administrative reforms and geographical locations, different
developments in comparative advantages result across-countries. The Baltic countries
are still largely relying on natural resources; the Czech Republic, Hungary and Slovenia
are the most oriented towards manufactures with Poland and the Slovak Republic
following closely. Cyprus and Malta display instead a specialisation pattern that largely
differs from the rest of the sample since they are strongly committed to the export
performance of a single item: Tobacco and Thermionic photo-cathode, valves and tubes,
respectively.

������������ ��������������������������
As for the ability of these countries in adjusting to the world demand, a common
pattern of trade specialisation linked the Acceding countries at the beginning of the
1990s: with the exception of Slovenia and Malta, they all showed strong comparative
advantages in the production of items for which the world demand was relatively weak
and gathered their disadvantages in the most dynamic products. However, some
important changes unfolded over the decade: at the end of the 1990s there emerges a
clear subdivision of the 10 economies in two broad sets. The first is made up by those
countries for which the trade orientation has changed only slightly: Latvia, Cyprus,
Malta and, partially, Lithuania. The comparative advantages and disadvantages
remained in the same growth groups and in some instances even increased. The second
set is characterised by those countries for which signs of productive adjustments are
already visible: Estonia, Czech Republic, Slovak Republic, Hungary and Poland. In
these countries, the improvement in the second half of the rank points to a shift in the
structure of comparative advantages towards the items for which world demand has
been more sustained. Thus, their specialisation pattern might be labelled as “efficient”
and their overall weight on international trade might well increase over time. Slovenia is
a border case: although its specialisation patter has changed very little over the period
under analysis, its comparative advantages were already oriented towards many of the
most dynamic items of the 1990s.

������������ ������������������������� ��
References
Balassa, B. (1965), “Trade liberalization and ‘revealed’ comparative advantages”, TheManchester School of Economic and Social Studies, Vol.32, No.2, pp.99/123.
Begg, D., J.P. Dantine, F. Giavazzi, C. Hamilton, D. Neven, V. Norman, A. Sapir, A.Smith, L.A. Winter and C. Wyplosz (1990), Monitoring European integration –The impact of Eastern Europe, CEPR, London.
Bender, S. (2001), “Suggestion for Two New Trade Performance Indices: TradeSpecialization Index and Beneficial Structural Change Index”, Economic GrowthCenter, Yale University, Working Paper Series, March.
Bender, S. and K.W. Li (2002), “The Changing Trade and Revealed ComparativeAdvantages of Asian and Latin American Manufacture Exports”, EconomicGrowth Center, Yale University, Discussion Paper No. 843.
Bentivogli, C. and P. Monti (2001), “International Transmission Via Trade Links:Theoretically Consistent Indicators of interdependence for Latin America andSouth-East Asia”, Banca d’Italia, Discussion Paper No. 410.
Brasili, A., P. Epifani and R. Helg (2000), “On the Dynamics of Trade Patterns”, DeEconomist, Vol.148, No.2, pp.233-257.
Cantwell, J. (1989), Technological Innovation and Multinational Corporations, Oxford,Blackwell Publisher.
Carolan, T., N. Singh and C. Talati (1998), “The Composition of US-East Asia Tradeand Changing Comparative Advantages”, Journal of Development Economics,Vol.57, No.2, pp.361-389.
Caselli, P. and A. Zaghini (2003), “International Specialization Models in LatinAmerica: the Case of Argentina”. Banca d’Italia, mimeo. Paper presented at the2002 Latin American Meeting of the Econometric Society
Collins, S.M. and D. Rodrik (1991), Eastern Europe and the Soviet Union in the WorldEconomy, Institute of International Economics, Washington D.C.
Eichengreen, B. and R. Khol (1998), “The External Sector, the State and Developmentin Eastern Europe”, BRIE, Working Paper No.125.
Fidrmuc, J, D. Grozea-Helmenstein and A. Wörgötter (1999), “East-West Intra-IndustryTrade Dynamics" Weltwirtschaftliches Archive, Vol.135, No.2, pp.332-346.
Fischer, S. and R. Sahay (2000), “The Transition Economies after ten Years”, IMFWorking Paper No.30.
Grossman, G. and E. Helpman (1991), Innovation and Growth in the Global Economy,MIT Press, Cambridge MA.
IMF (2000), World Economic Outlook, Focus on Transition Economies, October,Washington D.C.
������������ ���������������������������
Kaitila, V. (2001), “Accession Countries’ comparative advantage in the Internal Market:a Trade and Factor Analysis”, BOFIT, Working Paper, No.3.
Krugmann, P. (1986), “A technology gap model of international trade” in K. Jungenfeldtand D. Hague eds., Structural Adjustment in Advanced Economies. Macmillan,New York.
Krugmann, P. (1987), “The narrow moving Band, the Dutch Disease and theCompetitive Consequences of Mrs Tatcher: Notes on Trade in the Presence ofScale Economies”, Journal of Development Economics, Vol.27, pp.41-55.
Lafay, G. (1992), “The Measurement of Revealed Comparative Advantages”, in M.G.Dagenais and P.A. Muet eds., International Trade Modeling, Chapman & Hill,London.
Landesmann, M.A. and R. Stehrer (2001), “Convergence Patterns and Switchovers inComparative Advantages”, Structural Change and Economic Dynamics, Vol.12,pp.399-423.
Laursen, K. (2000), “Do export and Technological Specialisation Patterns Co-evolve inTerms of Convergence or Divergence?”, Journal of Evolutionary Economics,Vol.10, pp.415-436.
Lucas, R. (1988), “On the Mechanics of Economic Development”, Journal of MonetaryEconomics, Vol.22, pp.3-22.
Michaely, M. (1967), Concentration in International Trade, Contribution to EconomicAnalysis, North Holland Publishing Company, Amsterdam.
Pavitt (1989) K.L.R., "International Patterns of Technological Accumulation", in N.Hood and J.E. Vahlne (eds.), Strategies in Global Competition, Croom HelmPublisher, London.
Proudman, J. and S. Redding, (2000), “Evolving Patterns of International Trade”,Review of International Economics, Vol.8, No.3, pp.373-396.
Quah, D. (1993), “Empirical Cross-Section Dynamics in Economic Growth”, EuropeanEconomic Review, Vol.37, pp.426-434.
Quah, D. (1996), “Empirics for Economics Growth and Convergence”, EuropeanEconomic Review, Vol.40, pp.1353-1375..
Rauch, J. E. and D. Weinhold (1999), “Openness, Specialization, and ProductivityGrowth in Less Developed Countries”, Canadian Journal of Economics, Vol.32,pp.1009-1032.
Redding, S. (2002), “Specialization Dynamics”, Journal of International Economics,Vol.58, No.2, pp.299-334.
Shorrocks, A. (1978) “The Measurement of Mobility”, Econometrica, Vol.46, pp.1013-1024.
������������ ������������������������� ��
Stehrer, R and J. Wörz (2001), “Technological Convergence and Trade Patterns”,WWIW - Institute for Comparative Advantages, WP No.19, Vienna.
Tajoli, L. (2003), “EU-CEECs Convergence in Trade Structures: a Closer Look to thePast Decade”, Quaderno Global Watch ISPI, Milan, February.
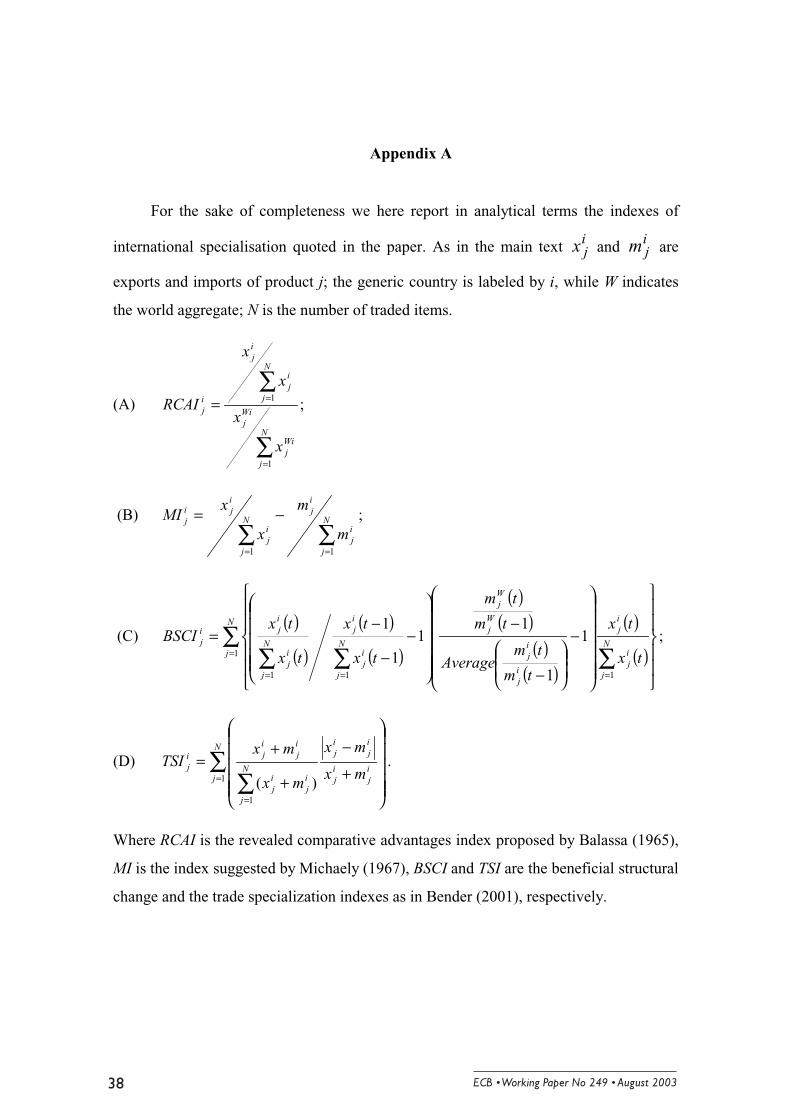
������������ ��������������������������.
Appendix A
For the sake of completeness we here report in analytical terms the indexes of
international specialisation quoted in the paper. As in the main text ijx and i
jm are
exports and imports of product j; the generic country is labeled by i, while W indicates
the world aggregate; N is the number of traded items.
(A)
∑
∑
=
==N
j
Wij
Wij
N
j
ij
ij
ij
x
x
x
x
RCAI
1
1 ;
(B)
∑∑==
−= N
j
ij
ij
N
j
ij
iji
j
m
m
x
xMI
11
;
(C)( )
( )
( )
( )
( )( )
( )( )
( )
( )∑
∑∑∑=
===
−
−
−
−−
−=
N
jN
j
ij
ij
ij
ij
Wj
Wj
N
j
ij
ij
N
j
ij
iji
j
tx
tx
tm
tmAverage
tm
tm
tx
tx
tx
txBSCI
1
111
1
1
11
1
1;
(D) ∑∑=
=
+
−
+
+=
N
jij
ij
ij
ij
N
j
ij
ij
ij
iji
j mx
mx
mx
mxTSI
1
1
)(.
Where RCAI is the revealed comparative advantages index proposed by Balassa (1965),
MI is the index suggested by Michaely (1967), BSCI and TSI are the beneficial structural
change and the trade specialization indexes as in Bender (2001), respectively.

������������ ������������������������� ��
Appendix B
TOP BOTTOM
LFI WES WOT LFI WES WOT
122-Tobacco manufactured 7.28 1.93 12.0 793-Ships,boats and floating structures -2.93 0.01 8.19054-Vegetab.,fresh,chilled,frozen 0.96 0.14 0.86 333-Petroleum oils -0.69 0.00 1.91541-Medicinal and pharmaceutical products 0.94 0.05 2.68 752-Automatic data processing machines & units -0.68 0.00 2.27057-Fruit & nuts fresh 0.81 0.10 0.71 598-Miscellaneous chemical products -0.63 0.01 2.26112-Alcoholic beverages 0.49 0.07 0.94 764-Telecommunications equipment and parts -0.51 0.00 2.15661-Lime,cement,and fabricated construction 0.41 0.15 0.60 641-Paper and paperboard -0.40 0.00 1.15781-Passenger motor cars 0.41 0.02 5.74 741-Heating & cooling equipment and parts -0.29 0.01 1.44024-Cheese and curd 0.35 0.14 0.51 775-Household type,elect.& non-electrical equipment -0.25 0.00 0.79653-Fabrics,woven,of man-made fibres 0.28 0.06 1.15 553-Perfumery,cosmetics and toilet preparation -0.23 0.02 1.22058-Fruit,preserved,and fruit preparations 0.23 0.07 0.25 583-Polymerization and copolymerization products -0.23 0.00 0.80
Source: WTA Statistics Canada. Period 1999-2000.
ITEMS OF TOP AND BOTTOM SPECIALIZATION IN CYPRUS(Lafay Index, World Export Share, Weight on Trade)
Specialization model of Cyprus and its evolution over time(Cumulated Lafay index; items ordered by world imports’ growth rate)
-12
-8
-4
0
4
8
12
16
1 53 105 157-12
-8
-4
0
4
8
12
16
1999-2000
1993-1994
1999-2000
1993-1994
Tobacco manufactured
Ships and boats
Medicinal and pharmaceutical products
I Quartile II Quartile III Quartile IV Quartile I Quartile II Quartile III Quartile IV Quartile
(364) 0.830 0.124 0.025 0.022 (52) 0.519 0.288 0.077 0.115(364) 0.126 0.676 0.168 0.030 (52) 0.115 0.538 0.231 0.115(364) 0.016 0.132 0.736 0.115 (52) 0.019 0.096 0.846 0.038(364) 0.025 0.038 0.124 0.813 (52) 0.077 0.173 0.192 0.558
Ergodic 0.237 0.236 0.286 0.242 Ergodic 0.097 0.224 0.548 0.131
Transition probabilities - Cyprus
1-year transitions 7-year transitions

������������ �������������������������+
TOP BOTTOM
LFI WES WOT LFI WES WOT
781-Passenger motor cars,for transport of pass 3.01 0.78 5.28 341-Gas,natural and manufactured -1.40 0.01 1.47784-Parts & accessories of motor vehicles 1.05 1.14 4.56 764-Telecommunications equipment and parts -1.29 0.11 2.22665-Glassware 1.01 2.53 1.67 333-Petroleum oils -1.24 0.01 1.34821-Furniture and parts thereof 0.83 1.26 2.01 541-Medicinal and pharmaceutical products -0.90 0.19 1.67778-Electrical machinery and apparatus 0.73 1.19 3.35 752-Automatic data processing machines & units -0.83 0.09 1.50635-Wood manufactures 0.50 1.94 0.78 334-Petroleum products,refined -0.78 0.16 1.57673-Iron and steel bars,rods,angles,shapes 0.48 2.03 1.13 674-Universals,plates and sheets,of iron or steel -0.63 0.40 1.58699-Manufactures of base metal 0.44 1.56 2.27 583-Polymerization and copolymerization products -0.48 0.41 1.76773-Equipment for distributing electricity 0.41 1.58 1.75 776-Thermionic,cold & photo-cathode valves,tubes -0.45 0.07 1.12625-Rubber tyres,tyre cases,etc.for wheels 0.37 1.33 0.85 874-Measuring,checking,analysing instruments -0.43 0.22 1.01
Source: WTA Statistics Canada. Period 1999-2000.
ITEMS OF TOP AND BOTTOM SPECIALIZATION IN THE CZECH REPBLIC(Lafay Index, World Export Share, Weight on Trade)
Specialization model of Czech Rep. and its evolution over time(Cumulated Lafay index; items ordered by world imports’ growth rate)
-12
-8
-4
0
4
8
12
16
1 53 105 157-12
-8
-4
0
4
8
12
16
1999-2000
1993-1994
1999-2000
1993-1994
Iron and steel bars
Passenger motor cars
Glassware
Petroleum oils
I Quartile II Quartile III Quartile IV Quartile I Quartile II Quartile III Quartile IV Quartile
(364) 0.846 0.129 0.014 0.011 (52) 0.519 0.346 0.096 0.038(364) 0.099 0.717 0.165 0.019 (52) 0.154 0.577 0.231 0.038(364) 0.033 0.140 0.723 0.104 (52) 0.077 0.135 0.577 0.212(364) 0.008 0.025 0.132 0.835 (52) 0.058 0.115 0.269 0.558
Ergodic 0.240 0.264 0.275 0.220 Ergodic 0.172 0.300 0.329 0.198
Transition probabilities - Czech Republic
1-year transitions 7-year transitions
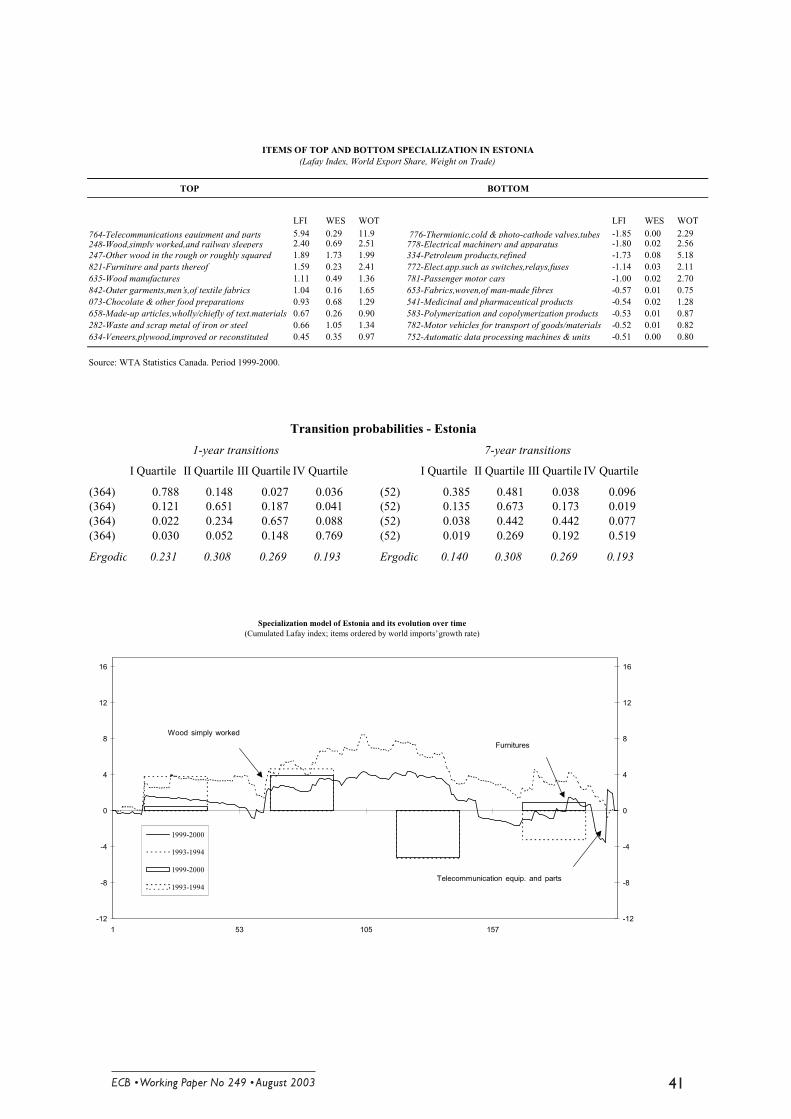
������������ ������������������������� �
TOP BOTTOM
LFI WES WOT LFI WES WOT
764-Telecommunications equipment and parts 5.94 0.29 11.9 776-Thermionic,cold & photo-cathode valves,tubes -1.85 0.00 2.29248-Wood,simply worked,and railway sleepers 2.40 0.69 2.51 778-Electrical machinery and apparatus -1.80 0.02 2.56247-Other wood in the rough or roughly squared 1.89 1.73 1.99 334-Petroleum products,refined -1.73 0.08 5.18821-Furniture and parts thereof 1.59 0.23 2.41 772-Elect.app.such as switches,relays,fuses -1.14 0.03 2.11635-Wood manufactures 1.11 0.49 1.36 781-Passenger motor cars -1.00 0.02 2.70842-Outer garments,men’s,of textile fabrics 1.04 0.16 1.65 653-Fabrics,woven,of man-made fibres -0.57 0.01 0.75073-Chocolate & other food preparations 0.93 0.68 1.29 541-Medicinal and pharmaceutical products -0.54 0.02 1.28658-Made-up articles,wholly/chiefly of text.materials 0.67 0.26 0.90 583-Polymerization and copolymerization products -0.53 0.01 0.87282-Waste and scrap metal of iron or steel 0.66 1.05 1.34 782-Motor vehicles for transport of goods/materials -0.52 0.01 0.82634-Veneers,plywood,improved or reconstituted 0.45 0.35 0.97 752-Automatic data processing machines & units -0.51 0.00 0.80
Source: WTA Statistics Canada. Period 1999-2000.
ITEMS OF TOP AND BOTTOM SPECIALIZATION IN ESTONIA(Lafay Index, World Export Share, Weight on Trade)
Specialization model of Estonia and its evolution over time(Cumulated Lafay index; items ordered by world imports’ growth rate)
-12
-8
-4
0
4
8
12
16
1 53 105 157-12
-8
-4
0
4
8
12
16
1999-2000
1993-1994
1999-2000
1993-1994
Wood simply worked
Telecommunication equip. and parts
Furnitures
I Quartile II Quartile III Quartile IV Quartile I Quartile II Quartile III Quartile IV Quartile
(364) 0.788 0.148 0.027 0.036 (52) 0.385 0.481 0.038 0.096(364) 0.121 0.651 0.187 0.041 (52) 0.135 0.673 0.173 0.019(364) 0.022 0.234 0.657 0.088 (52) 0.038 0.442 0.442 0.077(364) 0.030 0.052 0.148 0.769 (52) 0.019 0.269 0.192 0.519
Ergodic 0.231 0.308 0.269 0.193 Ergodic 0.140 0.308 0.269 0.193
1-year transitions 7-year transitions
Transition probabilities - Estonia

������������ ��������������������������
TOP BOTTOM
LFI WES WOT LFI WES WOT
752-Automatic data processing machines & units 3.82 1.27 5.35 776-Thermionic,cold & photo-cathode valves,tubes -1.77 0.05 2.39713-Internal combustion piston engines & parts 2.89 3.96 7.11 341-Gas,natural and manufactured -1.25 0.02 1.35781-Passenger motor cars 1.04 0.47 4.22 333-Petroleum oils -1.10 0.00 0.62764-Telecommunications equipment and parts 0.88 0.80 5.93 728-Mach.& equipment specialized for particular tasks-0.77 0.15 1.33011-Meat,edible meat offals, fresh, chilled 0.87 1.33 0.98 782-Motor vehicles for transport of goods/materials -0.77 0.03 0.90773-Equipment for distributing electricity 0.63 2.08 2.35 749-Non-electric parts and accessories -0.63 0.34 1.50821-Furniture and parts thereof 0.61 0.91 1.54 751-Office machines -0.58 0.84 5.22842-Outer garments,men’s,of textile fabrics 0.59 0.74 1.08 772-Elect.app.such as switches,relays,fuses -0.55 0.76 3.16778-Electrical machinery and apparatus 0.55 1.01 3.08 893-Articles of materials described in divisio -0.47 0.42 1.50762-Radio-broadcast receivers 0.40 1.56 0.66 784-Parts & accessories of motor vehicles -0.47 0.50 3.10
Source: WTA Statistics Canada. Period 1999-2000.
ITEMS OF TOP AND BOTTOM SPECIALIZATION IN HUNGARY(Lafay Index, World Export Share, Weight on Trade)
Specialization model of Hungary and its evolution over time(Cumulated Lafay index; items ordered by world imports’ growth rate)
-12
-8
-4
0
4
8
12
16
1 53 105 157-12
-8
-4
0
4
8
12
16
1999-2000
1993-1994
1999-2000
1993-1994
Automatic data processing machines
Internal combustion piston engines
Passenger motor cars
Meat
I Quartile II Quartile III Quartile IV Quartile I Quartile II Quartile III Quartile IV Quartile
(364) 0.852 0.118 0.014 0.016 (52) 0.673 0.173 0.058 0.096(364) 0.093 0.745 0.148 0.014 (52) 0.096 0.654 0.192 0.058(364) 0.025 0.146 0.764 0.066 (52) 0.058 0.288 0.654 0.000(364) 0.011 0.016 0.143 0.830 (52) 0.096 0.038 0.404 0.462
Ergodic 0.246 0.293 0.297 0.162 Ergodic 0.197 0.389 0.338 0.076
Transition probabilities - Hungary
1-year transitions 7-year transitions
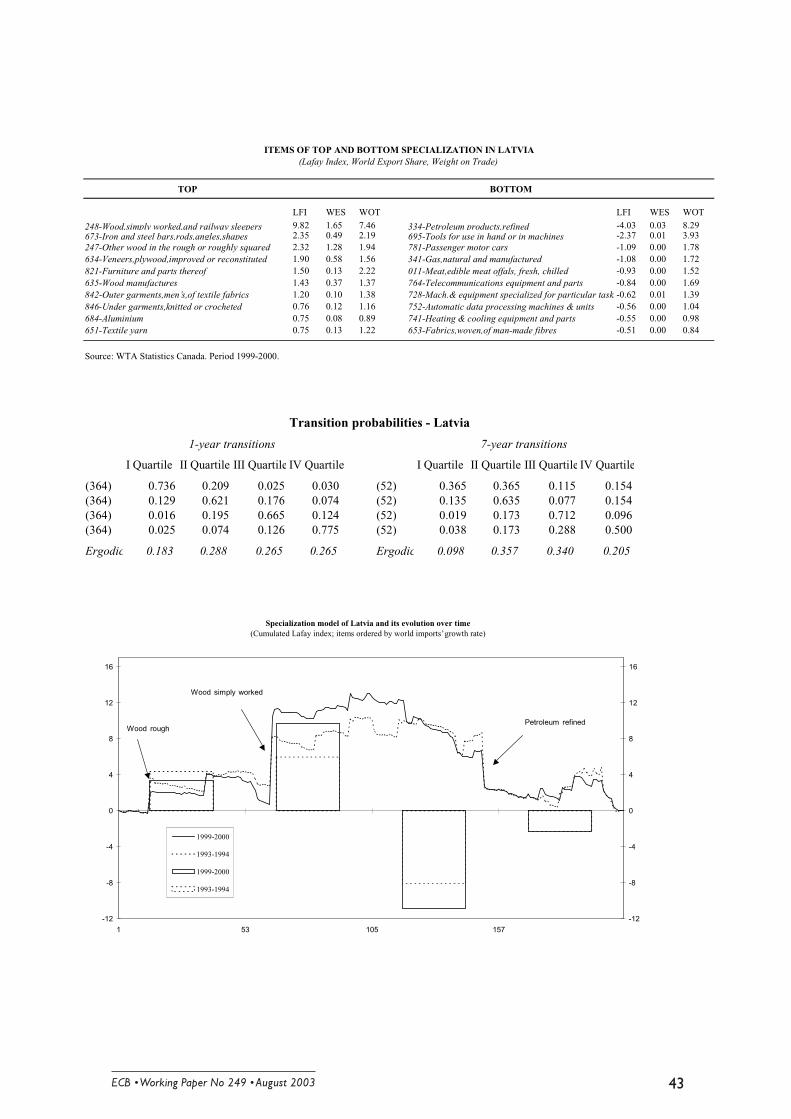
������������ ������������������������� �
TOP BOTTOM
LFI WES WOT LFI WES WOT
248-Wood,simply worked,and railway sleepers 9.82 1.65 7.46 334-Petroleum products,refined -4.03 0.03 8.29673-Iron and steel bars,rods,angles,shapes 2.35 0.49 2.19 695-Tools for use in hand or in machines -2.37 0.01 3.93247-Other wood in the rough or roughly squared 2.32 1.28 1.94 781-Passenger motor cars -1.09 0.00 1.78634-Veneers,plywood,improved or reconstituted 1.90 0.58 1.56 341-Gas,natural and manufactured -1.08 0.00 1.72821-Furniture and parts thereof 1.50 0.13 2.22 011-Meat,edible meat offals, fresh, chilled -0.93 0.00 1.52635-Wood manufactures 1.43 0.37 1.37 764-Telecommunications equipment and parts -0.84 0.00 1.69842-Outer garments,men’s,of textile fabrics 1.20 0.10 1.38 728-Mach.& equipment specialized for particular tasks-0.62 0.01 1.39846-Under garments,knitted or crocheted 0.76 0.12 1.16 752-Automatic data processing machines & units -0.56 0.00 1.04684-Aluminium 0.75 0.08 0.89 741-Heating & cooling equipment and parts -0.55 0.00 0.98651-Textile yarn 0.75 0.13 1.22 653-Fabrics,woven,of man-made fibres -0.51 0.00 0.84
Source: WTA Statistics Canada. Period 1999-2000.
ITEMS OF TOP AND BOTTOM SPECIALIZATION IN LATVIA(Lafay Index, World Export Share, Weight on Trade)
Specialization model of Latvia and its evolution over time(Cumulated Lafay index; items ordered by world imports’ growth rate)
-12
-8
-4
0
4
8
12
16
1 53 105 157-12
-8
-4
0
4
8
12
16
1999-2000
1993-1994
1999-2000
1993-1994
Wood rough
Wood simply worked
Petroleum refined
I Quartile II Quartile III Quartile IV Quartile I Quartile II Quartile III Quartile IV Quartile
(364) 0.736 0.209 0.025 0.030 (52) 0.365 0.365 0.115 0.154(364) 0.129 0.621 0.176 0.074 (52) 0.135 0.635 0.077 0.154(364) 0.016 0.195 0.665 0.124 (52) 0.019 0.173 0.712 0.096(364) 0.025 0.074 0.126 0.775 (52) 0.038 0.173 0.288 0.500
Ergodic 0.183 0.288 0.265 0.265 Ergodic 0.098 0.357 0.340 0.205
Transition probabilities - Latvia
1-year transitions 7-year transitions
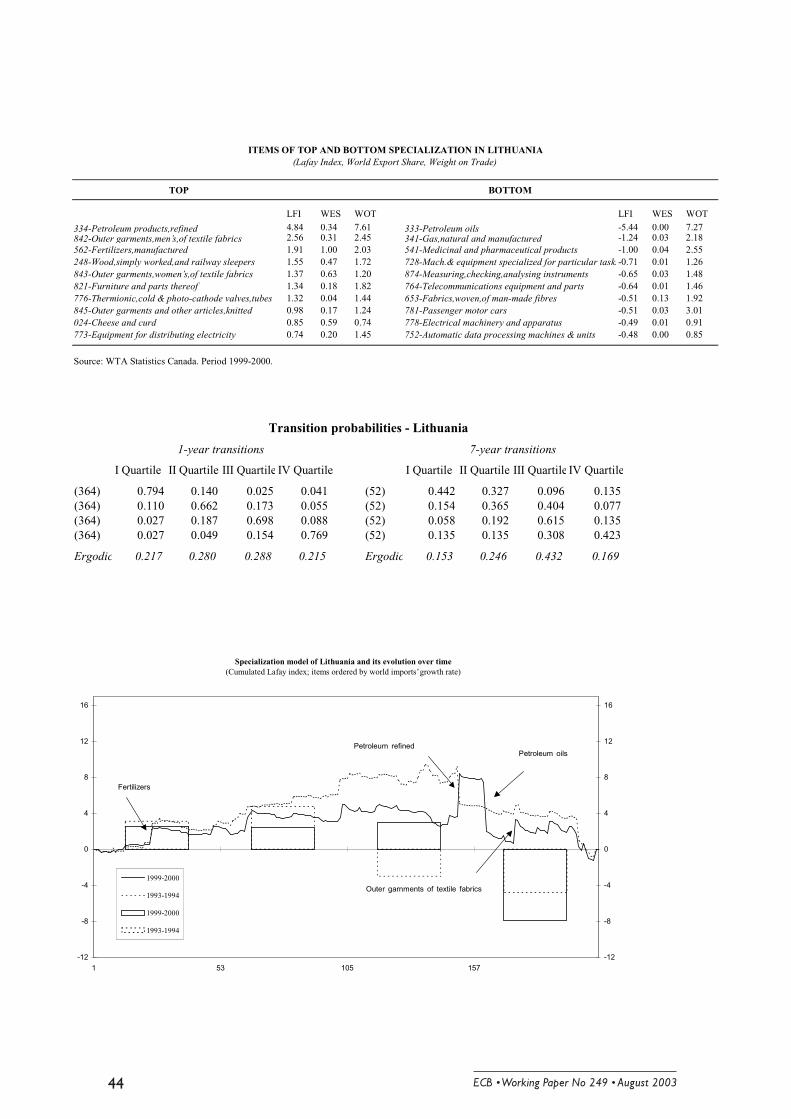
������������ �������������������������
TOP BOTTOM
LFI WES WOT LFI WES WOT
334-Petroleum products,refined 4.84 0.34 7.61 333-Petroleum oils -5.44 0.00 7.27842-Outer garments,men’s,of textile fabrics 2.56 0.31 2.45 341-Gas,natural and manufactured -1.24 0.03 2.18562-Fertilizers,manufactured 1.91 1.00 2.03 541-Medicinal and pharmaceutical products -1.00 0.04 2.55248-Wood,simply worked,and railway sleepers 1.55 0.47 1.72 728-Mach.& equipment specialized for particular tasks-0.71 0.01 1.26843-Outer garments,women’s,of textile fabrics 1.37 0.63 1.20 874-Measuring,checking,analysing instruments -0.65 0.03 1.48821-Furniture and parts thereof 1.34 0.18 1.82 764-Telecommunications equipment and parts -0.64 0.01 1.46776-Thermionic,cold & photo-cathode valves,tubes 1.32 0.04 1.44 653-Fabrics,woven,of man-made fibres -0.51 0.13 1.92845-Outer garments and other articles,knitted 0.98 0.17 1.24 781-Passenger motor cars -0.51 0.03 3.01024-Cheese and curd 0.85 0.59 0.74 778-Electrical machinery and apparatus -0.49 0.01 0.91773-Equipment for distributing electricity 0.74 0.20 1.45 752-Automatic data processing machines & units -0.48 0.00 0.85
Source: WTA Statistics Canada. Period 1999-2000.
ITEMS OF TOP AND BOTTOM SPECIALIZATION IN LITHUANIA(Lafay Index, World Export Share, Weight on Trade)
Specialization model of Lithuania and its evolution over time(Cumulated Lafay index; items ordered by world imports’ growth rate)
-12
-8
-4
0
4
8
12
16
1 53 105 157-12
-8
-4
0
4
8
12
16
1999-2000
1993-1994
1999-2000
1993-1994
Petroleum refinedPetroleum oils
Fertilizers
Outer garnments of textile fabrics
I Quartile II Quartile III Quartile IV Quartile I Quartile II Quartile III Quartile IV Quartile
(364) 0.794 0.140 0.025 0.041 (52) 0.442 0.327 0.096 0.135(364) 0.110 0.662 0.173 0.055 (52) 0.154 0.365 0.404 0.077(364) 0.027 0.187 0.698 0.088 (52) 0.058 0.192 0.615 0.135(364) 0.027 0.049 0.154 0.769 (52) 0.135 0.135 0.308 0.423
Ergodic 0.217 0.280 0.288 0.215 Ergodic 0.153 0.246 0.432 0.169
Transition probabilities - Lithuania
1-year transitions 7-year transitions

������������ ������������������������� �
TOP BOTTOM
LFI WES WOT LFI WES WOT
776-Thermionic,cold & photo-cathode valves,tubes 12.5 0.45 38.7 793-Ships,boats and floating structures -4.90 0.01 7.08842-Outer garments,men’s,of textile fabrics 2.73 0.23 2.60 334-Petroleum products,refined -3.63 0.06 8.68772-Elect.app.such as switches,relays,fuses 1.28 0.09 1.95 781-Passenger motor cars -1.23 0.00 1.89628-Articles of rubber 1.05 0.46 0.92 874-Measuring,checking,analysing instruments -0.57 0.01 1.26894-Baby carriages,toys and games 0.90 0.11 1.08 652-Cotton fabrics,woven -0.52 0.00 0.73892-Printed matter 0.76 0.17 1.15 641-Paper and paperboard -0.45 0.00 0.62872-Medical instruments and appliances 0.68 0.11 0.71 583-Polymerization and copolymerization products -0.40 0.00 0.62612-Manufactures of leather 0.59 0.45 0.54 728-Mach.& equipment specialized for particular tasks-0.36 0.00 0.70098-Edible products and preparations 0.38 0.18 0.71 741-Heating & cooling equipment and parts -0.35 0.04 1.40655-Knitted or crocheted fabrics 0.25 0.09 0.27 598-Miscellaneous chemical products -0.28 0.00 0.41
Source: WTA Statistics Canada. Period 1999-2000.
ITEMS OF TOP AND BOTTOM SPECIALIZATION IN MALTA(Lafay Index, World Export Share, Weight on Trade)
Specialization model of Malta and its evolution over time(Cumulated Lafay index; items ordered by world imports’ growth rate)
-20
-16
-12
-8
-4
0
4
8
12
16
20
1 53 105 157-20
-16
-12
-8
-4
0
4
8
12
16
20
1999-2000
1993-1994
1999-2000
1993-1994
Ships and boats
Petroleum refined
Outer garments of textile fabrics
Thermionic photo-cathode, valves and tubes
I Quartile II Quartile III Quartile IV Quartile I Quartile II Quartile III Quartile IV Quartile
(364) 0.857 0.121 0.008 0.014 (52) 0.750 0.231 0.019 0.000(364) 0.099 0.720 0.148 0.033 (52) 0.058 0.635 0.192 0.115(364) 0.014 0.143 0.717 0.126 (52) 0.019 0.192 0.558 0.231(364) 0.030 0.047 0.118 0.805 (52) 0.115 0.096 0.115 0.673
Ergodic 0.261 0.276 0.244 0.220 Ergodic 0.210 0.314 0.214 0.262
Transition probabilities - Malta
1-year transitions 7-year transitions
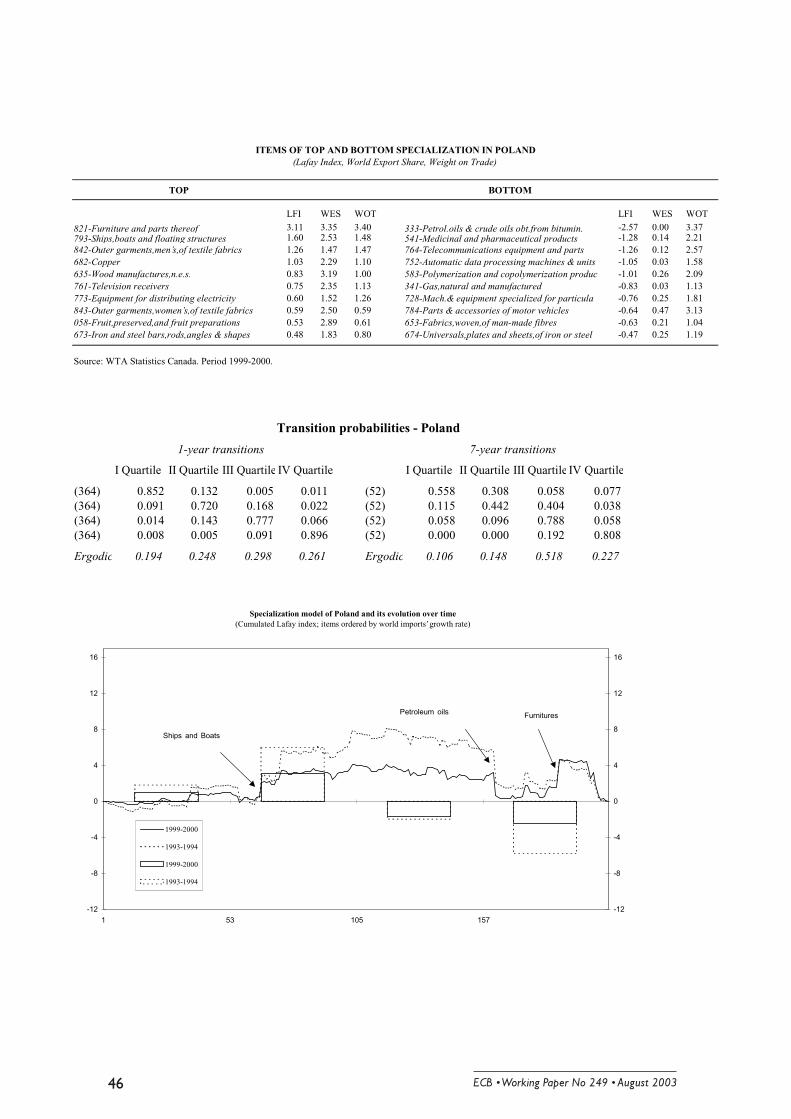
������������ �������������������������&
TOP BOTTOM
LFI WES WOT LFI WES WOT
821-Furniture and parts thereof 3.11 3.35 3.40 333-Petrol.oils & crude oils obt.from bitumin. -2.57 0.00 3.37793-Ships,boats and floating structures 1.60 2.53 1.48 541-Medicinal and pharmaceutical products -1.28 0.14 2.21842-Outer garments,men’s,of textile fabrics 1.26 1.47 1.47 764-Telecommunications equipment and parts -1.26 0.12 2.57682-Copper 1.03 2.29 1.10 752-Automatic data processing machines & units -1.05 0.03 1.58635-Wood manufactures,n.e.s. 0.83 3.19 1.00 583-Polymerization and copolymerization produc -1.01 0.26 2.09761-Television receivers 0.75 2.35 1.13 341-Gas,natural and manufactured -0.83 0.03 1.13773-Equipment for distributing electricity 0.60 1.52 1.26 728-Mach.& equipment specialized for particula -0.76 0.25 1.81843-Outer garments,women’s,of textile fabrics 0.59 2.50 0.59 784-Parts & accessories of motor vehicles -0.64 0.47 3.13058-Fruit,preserved,and fruit preparations 0.53 2.89 0.61 653-Fabrics,woven,of man-made fibres -0.63 0.21 1.04673-Iron and steel bars,rods,angles & shapes 0.48 1.83 0.80 674-Universals,plates and sheets,of iron or steel -0.47 0.25 1.19
Source: WTA Statistics Canada. Period 1999-2000.
ITEMS OF TOP AND BOTTOM SPECIALIZATION IN POLAND(Lafay Index, World Export Share, Weight on Trade)
Specialization model of Poland and its evolution over time(Cumulated Lafay index; items ordered by world imports’ growth rate)
-12
-8
-4
0
4
8
12
16
1 53 105 157-12
-8
-4
0
4
8
12
16
1999-2000
1993-1994
1999-2000
1993-1994
FurnituresPetroleum oils
Ships and Boats
I Quartile II Quartile III Quartile IV Quartile I Quartile II Quartile III Quartile IV Quartile
(364) 0.852 0.132 0.005 0.011 (52) 0.558 0.308 0.058 0.077(364) 0.091 0.720 0.168 0.022 (52) 0.115 0.442 0.404 0.038(364) 0.014 0.143 0.777 0.066 (52) 0.058 0.096 0.788 0.058(364) 0.008 0.005 0.091 0.896 (52) 0.000 0.000 0.192 0.808
Ergodic 0.194 0.248 0.298 0.261 Ergodic 0.106 0.148 0.518 0.227
7-year transitions1-year transitions
Transition probabilities - Poland
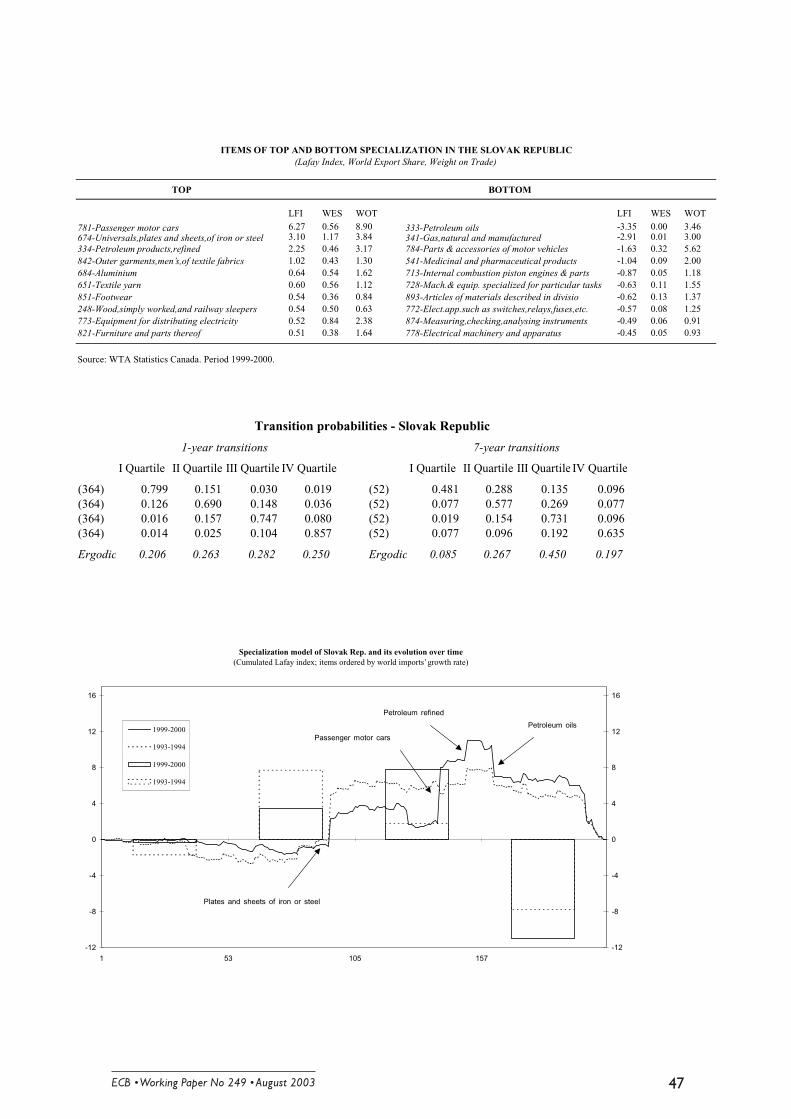
������������ ������������������������� �
TOP BOTTOM
LFI WES WOT LFI WES WOT
781-Passenger motor cars 6.27 0.56 8.90 333-Petroleum oils -3.35 0.00 3.46674-Universals,plates and sheets,of iron or steel 3.10 1.17 3.84 341-Gas,natural and manufactured -2.91 0.01 3.00334-Petroleum products,refined 2.25 0.46 3.17 784-Parts & accessories of motor vehicles -1.63 0.32 5.62842-Outer garments,men’s,of textile fabrics 1.02 0.43 1.30 541-Medicinal and pharmaceutical products -1.04 0.09 2.00684-Aluminium 0.64 0.54 1.62 713-Internal combustion piston engines & parts -0.87 0.05 1.18651-Textile yarn 0.60 0.56 1.12 728-Mach.& equip. specialized for particular tasks -0.63 0.11 1.55851-Footwear 0.54 0.36 0.84 893-Articles of materials described in divisio -0.62 0.13 1.37248-Wood,simply worked,and railway sleepers 0.54 0.50 0.63 772-Elect.app.such as switches,relays,fuses,etc. -0.57 0.08 1.25773-Equipment for distributing electricity 0.52 0.84 2.38 874-Measuring,checking,analysing instruments -0.49 0.06 0.91821-Furniture and parts thereof 0.51 0.38 1.64 778-Electrical machinery and apparatus -0.45 0.05 0.93
Source: WTA Statistics Canada. Period 1999-2000.
ITEMS OF TOP AND BOTTOM SPECIALIZATION IN THE SLOVAK REPUBLIC(Lafay Index, World Export Share, Weight on Trade)
Specialization model of Slovak Rep. and its evolution over time(Cumulated Lafay index; items ordered by world imports’ growth rate)
-12
-8
-4
0
4
8
12
16
1 53 105 157-12
-8
-4
0
4
8
12
16
1999-2000
1993-1994
1999-2000
1993-1994
Passenger motor cars
Plates and sheets of iron or steel
Petroleum oils
Petroleum refined
I Quartile II Quartile III Quartile IV Quartile I Quartile II Quartile III Quartile IV Quartile
(364) 0.799 0.151 0.030 0.019 (52) 0.481 0.288 0.135 0.096(364) 0.126 0.690 0.148 0.036 (52) 0.077 0.577 0.269 0.077(364) 0.016 0.157 0.747 0.080 (52) 0.019 0.154 0.731 0.096(364) 0.014 0.025 0.104 0.857 (52) 0.077 0.096 0.192 0.635
Ergodic 0.206 0.263 0.282 0.250 Ergodic 0.085 0.267 0.450 0.197
Transition probabilities - Slovak Republic
1-year transitions 7-year transitions
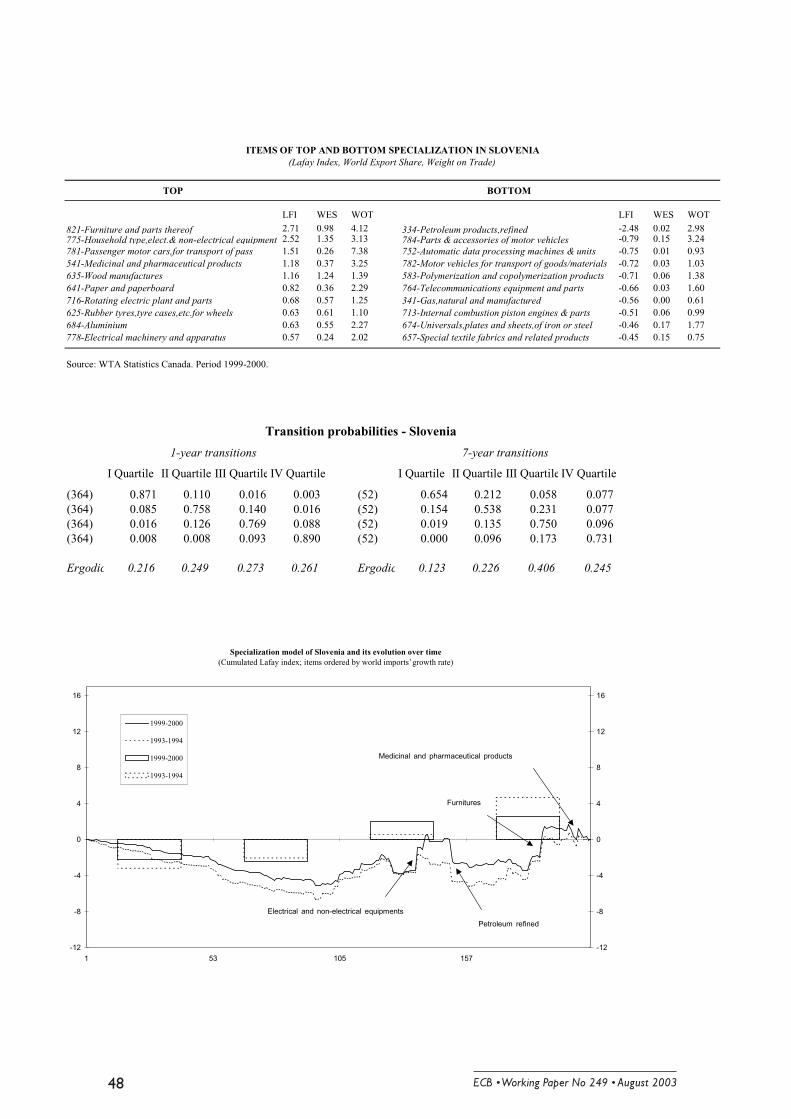
������������ �������������������������.
TOP BOTTOM
LFI WES WOT LFI WES WOT
821-Furniture and parts thereof 2.71 0.98 4.12 334-Petroleum products,refined -2.48 0.02 2.98775-Household type,elect.& non-electrical equipment 2.52 1.35 3.13 784-Parts & accessories of motor vehicles -0.79 0.15 3.24781-Passenger motor cars,for transport of pass 1.51 0.26 7.38 752-Automatic data processing machines & units -0.75 0.01 0.93541-Medicinal and pharmaceutical products 1.18 0.37 3.25 782-Motor vehicles for transport of goods/materials -0.72 0.03 1.03635-Wood manufactures 1.16 1.24 1.39 583-Polymerization and copolymerization products -0.71 0.06 1.38641-Paper and paperboard 0.82 0.36 2.29 764-Telecommunications equipment and parts -0.66 0.03 1.60716-Rotating electric plant and parts 0.68 0.57 1.25 341-Gas,natural and manufactured -0.56 0.00 0.61625-Rubber tyres,tyre cases,etc.for wheels 0.63 0.61 1.10 713-Internal combustion piston engines & parts -0.51 0.06 0.99684-Aluminium 0.63 0.55 2.27 674-Universals,plates and sheets,of iron or steel -0.46 0.17 1.77778-Electrical machinery and apparatus 0.57 0.24 2.02 657-Special textile fabrics and related products -0.45 0.15 0.75
Source: WTA Statistics Canada. Period 1999-2000.
ITEMS OF TOP AND BOTTOM SPECIALIZATION IN SLOVENIA(Lafay Index, World Export Share, Weight on Trade)
Specialization model of Slovenia and its evolution over time(Cumulated Lafay index; items ordered by world imports’ growth rate)
-12
-8
-4
0
4
8
12
16
1 53 105 157-12
-8
-4
0
4
8
12
16
1999-2000
1993-1994
1999-2000
1993-1994
Electrical and non-electrical equipments
Furnitures
Petroleum refined
Medicinal and pharmaceutical products
I Quartile II Quartile III Quartile IV Quartile I Quartile II Quartile III Quartile IV Quartile
(364) 0.871 0.110 0.016 0.003 (52) 0.654 0.212 0.058 0.077(364) 0.085 0.758 0.140 0.016 (52) 0.154 0.538 0.231 0.077(364) 0.016 0.126 0.769 0.088 (52) 0.019 0.135 0.750 0.096(364) 0.008 0.008 0.093 0.890 (52) 0.000 0.096 0.173 0.731
Ergodic 0.216 0.249 0.273 0.261 Ergodic 0.123 0.226 0.406 0.245
Transition probabilities - Slovenia
1-year transitions 7-year transitions

������������ ������������������������� �
�������������� ���������������������
�������� ���� ���������������������� ������������������� ���� ������������!��"������#����$%%"""&���&���'&
()( *+������� ������������������� ��������,����+&�� -��.&�.��/������0&�1����0����())�&
()� *.������ ���� ��������������������� ��������������/��������������-- �,����&���� ��������2&�1�����0����())�&
()3 *+��������������������������� ���������� �� ��/������������������,���2&������ ���4&�&���� �����5&�1�������0����())�&
()6 *4� ��7������������������8����� ��8������8���� �"���������� ���������,����&�.�������0����())�&
()9 *������ ������������������������������������������,�����&�:������������&�4������0����())�&
()� *+����������� ������ ������������� ���������,�����&�4&��;�-��0����())�&
()< *�������������������������������������=�� �������������������� ���,���+&�+������+&�.�� �����0����())�&
()> *+����"�������� �� ���������� ������������,�����&���������?&�@�����&�+����8A��������&�:��-B �-��0����())�&
(C) *+����������4��������������������������7����������� �$������ �������������� ������ ������,����1&�1������8:��D����.&�E�����0����())�&
(CC *1� �8����� ����� ����,�����&�.���� ����0&�&�F�� ��0����())�&
(C( *.��� ����������� ��������� �������������������� ������,�����&�: �-����.&�1���������0����())�&
(C� *+��������������������� ������ ��,����1&����������0&�.�����������())�&
(C3 *G�������� ������������������������ �,����+&�H��������2&�5� ����������())�&
(C6 *��������������������������� ����������������� �������������������������,���@&�: ������������())�&
(C9 *I���������������������������������������� ����������������$�������� ����������,����.&��!?�-�����4&�+&����1������������())�&
(C� *I���� �������������������� ����������������������������� ������,����0&�.������.���())�&
������������ ��������������������������+
(C< *I���-��8�������8����������������� ����������7��������������������� ������0��,����:&�����������F&���� ����.���())�&
(C> *�7�8���������������������������������7������������8������,����&�+��������.���())�&
(() *I��� ������������������������������������� ������$�������� ��� ����,����.&�4���+�� �())�&
((C *������������������������������������,����+&���D��1&�� J������4&��� ����+�� �())�&
((( *H�� �������������������J���� ���7�����������������E������1����,����5&�+�����.&���� ��+�� �())�&
((� *G���� ���������� ����"�����������������������" ����,����5&�+����+�� �())�&
((3 *I������������������ ��8K8 �������#*���������,'����$����������������������������������� �=,�����&�G�����4&�4;��������&�1����-��+�� �())�&
((6 *������� �����������#*���������,'����8�� ��7��������,�����&�G������&�F�J�� ����&�1����-��+�� �())�&
((9 *I������� �����������������$�/�������������������������� ���������,���2&�5� ������1&�.���� ���+�� �())�&
((� *.�������� �������� �"����8��������� �������,����I&�.���� ���+�� �())�&
((< *.�������� �����������L������������� � ������������,����.&�5 ��������.��())�&
((> *@�"���������������������� ����=,�����&�1������.��())�&
(�) *I��������������� �������$������������������������� ����������� ��,����&�@������+&�.�� �������1&�.���� ���.��())�&
(�C *��������� ���������������� ����������� ������"��������� ������������������������-��,����:&���������+&�G�����������F&���� ����.��())�&
(�( *�����������������!����������"����I� ��� ��$��������������������������������=,����&����� ��� ���.��())�&
(�� *I������ �� ���������������������������,����A&�:����� �����A&�F �.��())�&
(�3 *E���� �����������������������������,����.&�2�M�82����������&�.�+���.��())�&
(�6 *F� �� �������������������������������$�� ������������������/��������,���A&����� �����&�.����0����())�&
������������ ������������������������� ��
(�9 *1"�������������������C>�38C>>9$������ ���������� ��� ����� ����,����:&�4�����0���())�&
(�� *:�"����7��������������� �� �"�������������� ����������,����G&����D���.&�.� ����4&�1��������0����())�&
(�< *I�������������������������������������,����4&�+��������4&��&�� �"������&�I� ������0����())�&
(�> *I������������������ ���� ��������������������8����� ������������,����&�0&��������0����())�&
(3) *.�������� ���������������������������$����������������.E=,����H&�+��� ������.&��������0� ��())�&
(3C .������������������ ������������8� �����$���� ����"�����������������=,����&�����������F&�:����0� ��())�&
(3( *��� �������������������$������������ ���������,����+&�+�������2&�1������������F&�I�-���0� ��())�&
(3� *���8�����������7��� �������������������� ����,�����&�@����0� ��())�&
(33 *@�"�������������� ��� �/��������������"��� ������������������������=�+� ��������������� �� ������,����1&��J���� ���&�.����.�������2&�1�����0� ��())�&
(36 *.���������������$���������������� �,�����&�@� �����������&�.�������0� ��())�&
(39 *��� �������������� ���8������"������������L�� ��������������� ����� ����,����&�4&����N � �I��J������4&�1������0� ��())�&
(3� *������������������� ����$��������������������������@H����������������� �������������=,����5&�@�������+������())�&
(3< *�7��������������������� �,�����&����� ����5&��&�������+������())�&
(3> *I���� �������������� ����������������������������������,����+&�?�������+�����())�&