TPC Benchmark TM E Full Disclosure...
36
TPC Benchmark TM E Full Disclosure Report for IBM® System x® 3650 M4 using Microsoft® SQL Server 2012 Enterprise Edition and Microsoft Windows® Server 2008 R2 Enterprise Edition SP1 TPC-E Version 1.12.0 First Edition Submitted for Review March 6, 2012
Transcript of TPC Benchmark TM E Full Disclosure...
TPC BenchmarkTM E Full Disclosure Report
for IBM® System x® 3650 M4
using Microsoft® SQL Server 2012
Enterprise Edition and
Microsoft Windows® Server 2008 R2 Enterprise Edition SP1
TPC-E Version 1.12.0
First Edition
Submitted for Review March 6, 2012
©IBM Corporation TPC-E Benchmark Full Disclosure Report – March 2012 2
First Edition – March 2012
THE INFORMATION CONTAINED IN THIS DOCUMENT IS DISTRIBUTED ON AN AS IS BASIS WITHOUT ANY WARRANTY EITHER EXPRESSED OR IMPLIED. The use of this information or the implementation of any of these techniques is the customer’s responsibility and depends on the customer’s ability to evaluate and integrate them into the customer’s operational environment. While each item has been reviewed by IBM for accuracy in a specific situation, there is no guarantee that the same or similar results will be obtained elsewhere. Customers attempting to adapt these techniques to their own environment do so at their own risk.
In this document, any references made to an IBM licensed program are not intended to state or imply that only IBM’s licensed program may be used; any functionally equivalent program may be used.
This publication was produced in the United States. IBM may not offer the products, services, or features discussed in this document in other countries, and the information is subject to change without notice. Consult your local IBM representative for information on products and services available in your area.
© Copyright International Business Machines Corporation 2012. All rights reserved.
Permission is hereby granted to reproduce this document in whole or in part, provided the copyright notice as printed above is set forth in full text on the title page of each item reproduced.
U.S. Government Users - Documentation related to restricted rights: Use, duplication, or disclosure is subject to restrictions set forth in GSA ADP Schedule Contract with IBM Corp.
Trademarks
IBM, the IBM logo, System x, and System Storage are trademarks or registered trademarks of International Business Machines Corporation.
The following terms used in this publication are trademarks of other companies as follows: TPC Benchmark, TPC-E, tpsE, and $/tpsE trademark of Transaction Processing Performance Council; Intel and Xeon are trademarks or registered trademarks of Intel Corporation; Microsoft and Windows are trademarks or registered trademarks of Microsoft Corporation. Other company, product, or service names, which may be denoted by two asterisks (**), may be trademarks or service marks of others.
Notes 1 GHz and MHz only measures microprocessor internal clock speed, not application performance. Many factors affect application performance. 2 When referring to hard disk capacity, GB, or gigabyte, means one thousand million bytes. Total user-accessible capacity may be less.

©IBM Corporation TPC-E Benchmark Full Disclosure Report – March 2012 3
Abstract
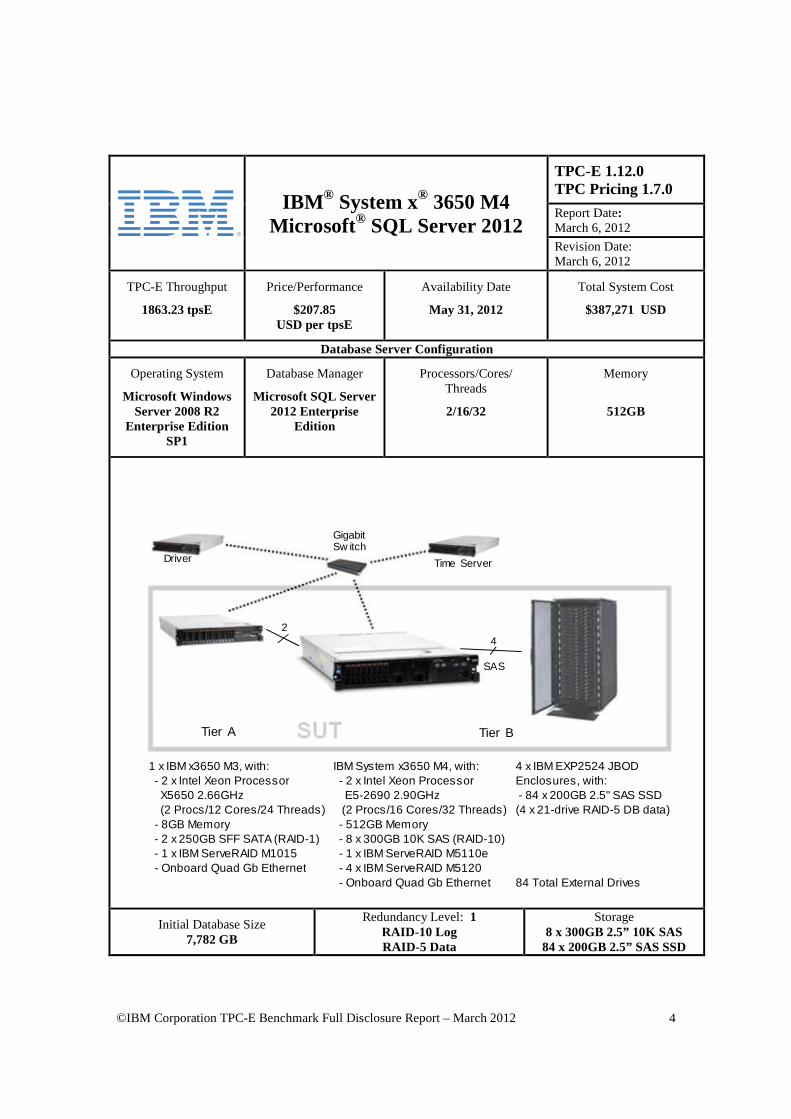
IBM Corporation conducted the TPC BenchmarkTM E on the IBM® System x®3650 M4 configured as a client/server system. This report documents the full disclosure information required by the TPC Benchmark E Standard Specification, Revision 1.12.0, including the methodology used to achieve the reported results. All testing fully complied with this revision level.
The software used on the IBM System x3650 M4 system included Microsoft® Windows® Server 2008 R2 Enterprise Edition and Microsoft SQL Server 2012 Enterprise Edition.
Standard metrics, transactions per second-E (tpsE), price per tpsE ($/tpsE) and Availability Date, are reported as required by the TPC Benchmark E Standard Specification.
The benchmark results are summarized in the following table:
Hardware Software Total System Cost tpsE $ USD /tpsE Total Solution
Availability Date
IBM System x3650 M4
Microsoft SQL Server 2012 Enterprise
Edition
Microsoft Windows
Server 2008 R2 Enterprise
Edition SP1
$387,271 USD 1863.23 $207.85 USD May 31, 2012
The benchmark implementation and results were audited by Doug Johnson for InfoSizing (www.sizing.com). The auditor’s attestation letter is contained in this report.
©IBM Corporation TPC-E Benchmark Full Disclosure Report – March 2012 4
IBM ® System x® 3650 M4 Microsoft® SQL Server 2012
TPC-E 1.12.0 TPC Pricing 1.7.0
Report Date: March 6, 2012
Revision Date: March 6, 2012
TPC-E Throughput
1863.23 tpsE
Price/Performance
$207.85 USD per tpsE
Availability Date
May 31, 2012
Total System Cost
$387,271 USD
Database Server Configuration
Operating System
Microsoft Windows Server 2008 R2
Enterprise Edition SP1
Database Manager
Microsoft SQL Server 2012 Enterprise
Edition
Processors/Cores/ Threads
2/16/32
Memory
512GB
1 x IBM x3650 M3, with: IBM System x3650 M4, with: 4 x IBM EXP2524 JBOD - 2 x Intel Xeon Processor - 2 x Intel Xeon Processor Enclosures, with: X5650 2.66GHz E5-2690 2.90GHz - 84 x 200GB 2.5" SAS SSD (2 Procs/12 Cores/24 Threads) (2 Procs/16 Cores/32 Threads) (4 x 21-drive RAID-5 DB data) - 8GB Memory - 512GB Memory - 2 x 250GB SFF SATA (RAID-1) - 8 x 300GB 10K SAS (RAID-10) - 1 x IBM ServeRAID M1015 - 1 x IBM ServeRAID M5110e - Onboard Quad Gb Ethernet - 4 x IBM ServeRAID M5120
- Onboard Quad Gb Ethernet 84 Total External Drives
11
SAS
Tier A Tier B
Time ServerDriver
GigabitSw itch
2 4
SAS
Tier A Tier B
Time ServerDriver
GigabitSw itch
2
Initial Database Size 7,782 GB
Redundancy Level: 1 RAID-10 Log RAID-5 Data
Storage 8 x 300GB 2.5” 10K SAS 84 x 200GB 2.5” SAS SSD
©IBM Corporation TPC-E Benchmark Full Disclosure Report – March 2012 5
IBM System x3650 M4 Microsoft SQL Server 2012
TPC-E 1.12.0
TPC Pricing 1.7.0 Report Date: March 6, 2012 Revision Date: March 6, 2012 Availability Date: May 31, 2012
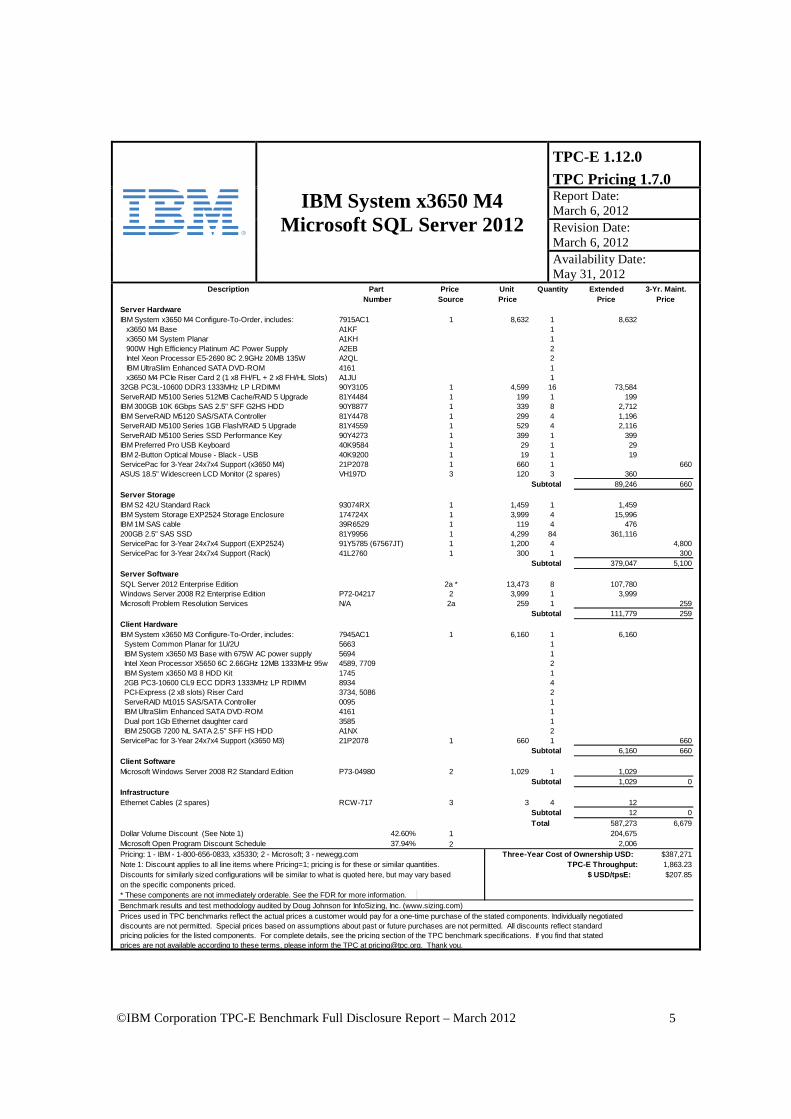
Description Part Price Unit Quantity Extended 3-Yr. Maint.Number Source Price Price Price
Server HardwareIBM System x3650 M4 Configure-To-Order, includes: 7915AC1 1 8,632 1 8,632
x3650 M4 Base A1KF 1x3650 M4 System Planar A1KH 1900W High Efficiency Platinum AC Power Supply A2EB 2Intel Xeon Processor E5-2690 8C 2.9GHz 20MB 135W A2QL 2IBM UltraSlim Enhanced SATA DVD-ROM 4161 1x3650 M4 PCIe Riser Card 2 (1 x8 FH/FL + 2 x8 FH/HL Slots) A1JU 1
32GB PC3L-10600 DDR3 1333MHz LP LRDIMM 90Y3105 1 4,599 16 73,584ServeRAID M5100 Series 512MB Cache/RAID 5 Upgrade 81Y4484 1 199 1 199IBM 300GB 10K 6Gbps SAS 2.5" SFF G2HS HDD 90Y8877 1 339 8 2,712IBM ServeRAID M5120 SAS/SATA Controller 81Y4478 1 299 4 1,196ServeRAID M5100 Series 1GB Flash/RAID 5 Upgrade 81Y4559 1 529 4 2,116ServeRAID M5100 Series SSD Performance Key 90Y4273 1 399 1 399IBM Preferred Pro USB Keyboard 40K9584 1 29 1 29IBM 2-Button Optical Mouse - Black - USB 40K9200 1 19 1 19ServicePac for 3-Year 24x7x4 Support (x3650 M4) 21P2078 1 660 1 660ASUS 18.5" Widescreen LCD Monitor (2 spares) VH197D 3 120 3 360
Subtotal 89,246 660Server StorageIBM S2 42U Standard Rack 93074RX 1 1,459 1 1,459IBM System Storage EXP2524 Storage Enclosure 174724X 1 3,999 4 15,996IBM 1M SAS cable 39R6529 1 119 4 476200GB 2.5" SAS SSD 81Y9956 1 4,299 84 361,116ServicePac for 3-Year 24x7x4 Support (EXP2524) 91Y5785 (67567JT) 1 1,200 4 4,800ServicePac for 3-Year 24x7x4 Support (Rack) 41L2760 1 300 1 300
Subtotal 379,047 5,100Server SoftwareSQL Server 2012 Enterprise Edition 2a * 13,473 8 107,780Windows Server 2008 R2 Enterprise Edition P72-04217 2 3,999 1 3,999Microsoft Problem Resolution Services N/A 2a 259 1 259
Subtotal 111,779 259Client Hardware IBM System x3650 M3 Configure-To-Order, includes: 7945AC1 1 6,160 1 6,160 System Common Planar for 1U/2U 5663 1 IBM System x3650 M3 Base with 675W AC power supply 5694 1 Intel Xeon Processor X5650 6C 2.66GHz 12MB 1333MHz 95w 4589, 7709 2 IBM System x3650 M3 8 HDD Kit 1745 1 2GB PC3-10600 CL9 ECC DDR3 1333MHz LP RDIMM 8934 4 PCI-Express (2 x8 slots) Riser Card 3734, 5086 2 ServeRAID M1015 SAS/SATA Controller 0095 1 IBM UltraSlim Enhanced SATA DVD-ROM 4161 1 Dual port 1Gb Ethernet daughter card 3585 1 IBM 250GB 7200 NL SATA 2.5" SFF HS HDD A1NX 2ServicePac for 3-Year 24x7x4 Support (x3650 M3) 21P2078 1 660 1 660
Subtotal 6,160 660Client Software Microsoft Windows Server 2008 R2 Standard Edition P73-04980 2 1,029 1 1,029
Subtotal 1,029 0InfrastructureEthernet Cables (2 spares) RCW-717 3 3 4 12 Subtotal 12 0
Total 587,273 6,679Dollar Volume Discount (See Note 1) 42.60% 1 204,675Microsoft Open Program Discount Schedule 37.94% 2 2,006Pricing: 1 - IBM - 1-800-656-0833, x35330; 2 - Microsoft; 3 - newegg.com $387,271Note 1: Discount applies to all line items where Pricing=1; pricing is for these or similar quantities. TPC-E Throu ghput: 1,863.23Discounts for similarly sized configurations will be similar to what is quoted here, but may vary based $ USD/tpsE: $207.85on the specific components priced.* These components are not immediately orderable. See the FDR for more information.Benchmark results and test methodology audited by Doug Johnson for InfoSizing, Inc. (www.sizing.com)
discounts are not permitted. Special prices based on assumptions about past or future purchases are not permitted. All discounts reflect standardPrices used in TPC benchmarks reflect the actual prices a customer would pay for a one-time purchase of the stated components. Individually negotiated
prices are not available according to these terms, please inform the TPC at [email protected]. Thank you.pricing policies for the listed components. For complete details, see the pricing section of the TPC benchmark specifications. If you find that stated
Three-Year Cost of Ownership USD:
©IBM Corporation TPC-E Benchmark Full Disclosure Report – March 2012 6
IBM System x3650 M4 Microsoft SQL Server 2012
TPC-E 1.12.0
TPC Pricing 1.7.0 Report Date: March 6, 2012 Revision Date: March 6, 2012 Availability Date: May 31, 2012
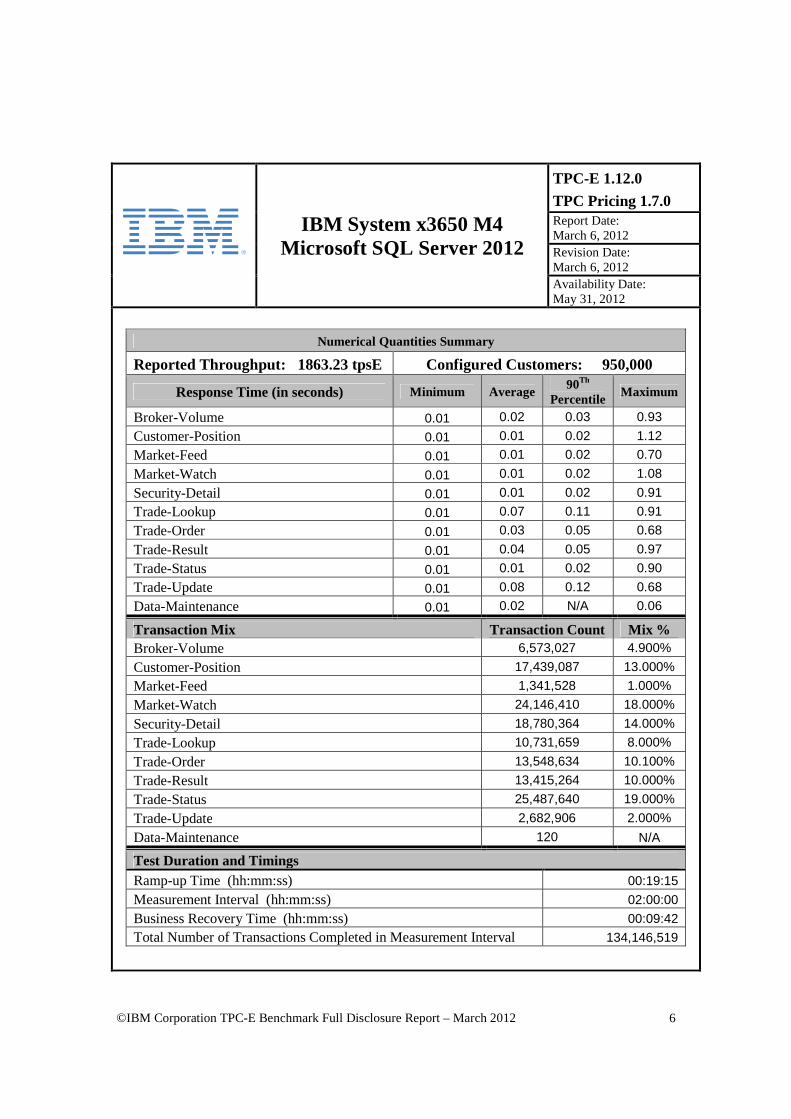
Numerical Quantities Summary
Reported Throughput: 1863.23 tpsE Configured Customers: 950,000
Response Time (in seconds) Minimum Average 90Th
Percentile Maximum
Broker-Volume 0.01 0.02 0.03 0.93
Customer-Position 0.01 0.01 0.02 1.12
Market-Feed 0.01 0.01 0.02 0.70
Market-Watch 0.01 0.01 0.02 1.08
Security-Detail 0.01 0.01 0.02 0.91
Trade-Lookup 0.01 0.07 0.11 0.91
Trade-Order 0.01 0.03 0.05 0.68
Trade-Result 0.01 0.04 0.05 0.97
Trade-Status 0.01 0.01 0.02 0.90
Trade-Update 0.01 0.08 0.12 0.68
Data-Maintenance 0.01 0.02 N/A 0.06
Transaction Mix Transaction Count Mix % Broker-Volume 6,573,027 4.900%
Customer-Position 17,439,087 13.000%
Market-Feed 1,341,528 1.000%
Market-Watch 24,146,410 18.000%
Security-Detail 18,780,364 14.000%
Trade-Lookup 10,731,659 8.000%
Trade-Order 13,548,634 10.100%
Trade-Result 13,415,264 10.000%
Trade-Status 25,487,640 19.000%
Trade-Update 2,682,906 2.000%
Data-Maintenance 120 N/A
Test Duration and Timings Ramp-up Time (hh:mm:ss) 00:19:15
Measurement Interval (hh:mm:ss) 02:00:00
Business Recovery Time (hh:mm:ss) 00:09:42
Total Number of Transactions Completed in Measurement Interval 134,146,519
©IBM Corporation TPC-E Benchmark Full Disclosure Report – March 2012 7
Table of Contents
Abstract ......................................................................................................................................................... 3
Table of Contents .......................................................................................................................................... 7
Clause 0 – Preamble ..................................................................................................................................... 9
Clause 1 – Introduction ...............................................................................................................................11
Benchmark Sponsor ..................................................................................................................................11
Configuration Diagrams ...........................................................................................................................11
Measured and Priced Configurations ........................................................................................................11
Figure 1-1. Measured Configuration ....................................................................................................11
Hardware and Software Configuration Steps ...........................................................................................12
Clause 2- Database Design, Scaling, and Population ................................................................................13 Database Creation and Table Definitions .................................................................................................13
Database Physical Organization ...............................................................................................................13
Horizontal/Vertical Partitioning ...............................................................................................................14
Replication ................................................................................................................................................14 Table Attributes ........................................................................................................................................14
Cardinality of Tables ................................................................................................................................14
Table 2-1. Initial Cardinality of Tables ................................................................................................15
Distribution of Tables and Logs ...............................................................................................................16
Table 2-2. Data Distribution for the Measured and Priced Configuration ...........................................16 Database Interface and Model Implemented ............................................................................................18
Database Load Methodology ....................................................................................................................18
Clause 3 – Transaction Related Items .......................................................................................................19
Vendor-Supplied Code .............................................................................................................................19
Database Footprint of Transactions ..........................................................................................................19
Clause 4 – SUT, Driver, and Network .......................................................................................................20
Network Configuration .............................................................................................................................20
Clause 5 – EGen ...........................................................................................................................................21
EGen Version ...........................................................................................................................................21
EGen Code and Modifications ..................................................................................................................21
EGen Files ................................................................................................................................................21
Clause 6 – Performance Metrics and Response Time ..............................................................................22 EGen Instances .........................................................................................................................................22
Measured Throughput ...............................................................................................................................22
Throughput vs. Elapsed Time for Trade-Result Transaction ....................................................................22 Figure 6-1. Test Run Graph .................................................................................................................22
Steady State Methodology ........................................................................................................................23
Work Performed During Steady State ......................................................................................................23
Transaction Statistics ................................................................................................................................23
Table 6-1. Transaction Statistics ..........................................................................................................24
Clause 7 – Transaction and System Properties .........................................................................................25
Atomicity Requirements ...........................................................................................................................25
Consistency Requirements........................................................................................................................25
Isolation Requirements .............................................................................................................................26
Durability Requirements ...........................................................................................................................26
Durability Test for Data Accessibility .................................................................................................26
Figure 7-1. Data Accessibility Graph ...................................................................................................27
Durability Test for Business Recovery ................................................................................................27
Figure 7-2. Business Recovery Time Graph ........................................................................................29

©IBM Corporation TPC-E Benchmark Full Disclosure Report – March 2012 8
Clause 8 – Pricing ........................................................................................................................................30
60-Day Space ............................................................................................................................................30
Table 8-1. Disk Space Requirements ...................................................................................................30
Availability Date.......................................................................................................................................31
Table 8-2. Ordering and Pricing Information .......................................................................................31 Supporting Files Index ..............................................................................................................................31
Auditor’s Attestation Letter ......................................................................................................................31
Appendix A – Price Quotes .........................................................................................................................34

©IBM Corporation TPC-E Benchmark Full Disclosure Report – March 2012 9
Clause 0 – Preamble
Introduction
TPC Benchmark™ E (TPC-E) is an On-Line Transaction Processing (OLTP) workload. It is a mixture of read-only and update intensive transactions that simulate the activities found in complex OLTP application environments. The database schema, data population, transactions, and implementation rules have been designed to be broadly representative of modern OLTP systems. The benchmark exercises a breadth of system components associated with such environments, which are characterized by:
• The simultaneous execution of multiple transaction types that span a breadth of complexity • Moderate system and application execution time • A balanced mixture of disk input/output and processor usage • Transaction integrity (ACID properties) • A mixture of uniform and non-uniform data access through primary and secondary keys • Databases consisting of many tables with a wide variety of sizes, attributes, and relationships with
realistic content • Contention on data access and update
The TPC-E operations are modeled as follows: The database is continuously available 24 hours a day, 7 days a week, for data processing from multiple sessions and data modifications against all tables, except possibly during infrequent (e.g., once a month) maintenance sessions. Due to the worldwide nature of the application modeled by the TPC-E benchmark, any of the transactions may be executed against the database at anytime, especially in relation to each other.
Goal of the TPC-E Benchmark
The TPC-E benchmark simulates the OLTP workload of a brokerage firm. The focus of the benchmark is the central database that executes transactions related to the firm’s customer accounts. In keeping with the goal of measuring the performance characteristics of the database system, the benchmark does not attempt to measure the complex flow of data between multiple application systems that would exist in a real environment.
The mixture and variety of transactions being executed on the benchmark system is designed to capture the characteristic components of a complex system. Different transaction types are defined to simulate the interactions of the firm with its customers as well as its business partners. Different transaction types have varying run-time requirements.
The benchmark defines:
• Two types of transactions to simulate Consumer-to-Business as well as Business-to-Business activities
• Several transactions for each transaction type • Different execution profiles for each transaction type • A specific run-time mix for all defined transactions
For example, the database will simultaneously execute transactions generated by systems that interact with customers along with transactions that are generated by systems that interact with financial markets as well as administrative systems. The benchmark system will interact with a set of driver systems that simulate the various sources of transactions without requiring the benchmark to implement the complex environment.
The performance metric reported by TPC-E is a "business throughput” measure of the number of completed Trade-Result transactions processed per second. Multiple transactions are used to simulate the business activity of processing a trade, and each transaction is subject to a response time constraint. The performance metric for the benchmark is expressed in transactions-per-second-E (tpsE). To be compliant with the TPC-E standard, all references to tpsE results must include the tpsE rate, the associated price-per-tpsE, and the availability date of the priced configuration.

©IBM Corporation TPC-E Benchmark Full Disclosure Report – March 2012 10
TPC-E uses terminology and metrics that are similar to other benchmarks, originated by the TPC and others. Such similarity in terminology does not imply that TPC-E results are comparable to other benchmarks. The only benchmark results comparable to TPC-E are other TPC-E results that conform to a comparable version of the TPC-E specification.
Restrictions and Limitations
Despite the fact that this benchmark offers a rich environment that represents many OLTP applications, this benchmark does not reflect the entire range of OLTP requirements. In addition, the extent to which a customer can achieve the results reported by a vendor is highly dependent on how closely TPC-E approximates the customer application. The relative performance of systems derived from this benchmark does not necessarily hold for other workloads or environments. Extrapolations to any other environment are not recommended.
Benchmark results are highly dependent upon workload, specific application requirements, and systems design and implementation. Relative system performance will vary because of these and other factors. Therefore, TPC-E should not be used as a substitute for specific customer application benchmarking when critical capacity planning and/or product evaluation decisions are contemplated.

©IBM Corporation TPC-E Benchmark Full Disclosure Report – March 2012 11
Clause 1 – Introduction
Benchmark Sponsor A statement identifying the benchmark Sponsor(s) and other participating companies must be reported.
This benchmark was sponsored by IBM Corporation.
Configuration Diagrams Diagrams of both the Measured and Priced Configurations must be reported, accompanied by a description of the differences. Any information and/or measurement results used to prove the validity of a Component substitution must be included in the FDR. Original and substituted Components must be clearly identified. Proof of comparable performance for substitution without a full benchmark run must be cited in the FDR.
Measured and Priced Configurations The measured configuration is shown in Figure 1-1. The priced configuration is shown above in the executive summary.
Figure 1-1. Measured Configuration
1 x IBM x3650 M3, with: IBM System x3650 M4, with: 8 x IBM EXP2524 JBOD - 2 x Intel Xeon Processor - 2 x Intel Xeon Processor Enclosures, with: X5650 2.66GHz E5-2690 2.90GHz - 84 x 200GB 2.5" SAS SSD (2 Procs/12 Cores/24 Threads) (2 Procs/16 Cores/32 Threads) (4 x 21-drive RAID-5 DB data) - 8GB Memory - 512GB Memory - 96 x 600GB 2.5" SAS HDD - 2 x 250GB SFF SATA (RAID-1) - 8 x 300GB 10K SAS (RAID-10) (4 x 24-drive RAID-10 backup - 1 x IBM ServeRAID M1015 - 1 x IBM ServeRAID M5110e and temp space) - Onboard Quad Gb Ethernet - 4 x IBM ServeRAID M5120
- Onboard Quad Gb Ethernet 180 Total External Drives
11
SAS
Tier A Tier B
Time ServerDriver
GigabitSw itch
2
2
11
SAS
Tier A Tier B
Time ServerDriver
GigabitSw itch
2 4
SAS
Tier A Tier B
Time ServerDriver
GigabitSw itch
2
2
11
SAS
Tier A Tier B
Time ServerDriver
GigabitSw itch
2 4
SAS
Tier A Tier B
Time ServerDriver
GigabitSw itch
2
11
SAS
Tier A Tier B
Time ServerDriver
GigabitSw itch
2 8
SAS
Tier A Tier B
Time ServerDriver
GigabitSw itch
2

©IBM Corporation TPC-E Benchmark Full Disclosure Report – March 2012 12
Compared to the priced configuration, the measured configuration contained extra external enclosures and drives used strictly for database backup files and temporary space used during the benchmark database load process. These extra enclosures and drives were not used at all during the benchmark runs.
Hardware and Software Configuration Steps A description of the steps taken to configure all the hardware must be reported in the Report. A description of the steps taken to configure all the software must be reported in the Report. Any and all configuration scripts or step by step GUI instructions are reported in the Supporting Files (see Clauses 9.4.1.1 and 9.4.1.2). The description, scripts and GUI instructions must be sufficient such that a reader knowledgeable of computer systems and the TPC-E specification could recreate the hardware and software environments.
Detailed instructions for installing and configuring the SUT hardware and software are included in the supporting files:
• Information specific to the Tier A client can be found in: SupportingFiles\Introduction\TierA\TierA_x3650M3_Setup.pdf
• Information specific to the Tier B database server and storage can be found in: SupportingFiles\Introduction\TierB\TierB_x3650M4_Setup.pdf
©IBM Corporation TPC-E Benchmark Full Disclosure Report – March 2012 13
Clause 2- Database Design, Scaling, and Population
Database Creation and Table Definitions A description of the steps taken to create the database for the Reported Throughput must be reported in the Report. Any and all scripts or step by step GUI instructions are reported in the Supporting Files (see Clause 9.4.2). The description, scripts and GUI instructions must be sufficient such that a reader knowledgeable of database software environments and the TPC-E specification could recreate the database.
The database was created and populated using the Microsoft TPC-E benchmark kit. Instructions for doing so are included in the supporting files. See SupportingFiles\Clause2\MSTPCE Database Setup Reference.pdf.
Changes and customizations were made to some of the kit files. First, the filegroups the database was loaded onto were changed in number from three filegroups to two. Second, several scripts were modified to customize the load to the specific hardware configuration of this SUT.
The default kit files create the database on three filegroups: fixed_fg, scaling_fg, and growing_fg. That was changed so that only two filegroups were used, fixed_fg and growing_fg. All of the items that would have been loaded onto scaling_fg were loaded instead onto fixed_fg.
The modified files are included as part of SupportingFiles\Clause2:
• Utility\Create_TID_Ranges_Table.sql • DDL\ Create_Indexes_Scaling_Tables.sql • DDL\ Create_Tables_Scaling.sql
The files that were customized for this specific SUT hardware are included in the folder SupportingFiles\Clause2\950000.Cust\Database:
• Tempdb.sql creates a larger temporary database for SQL Server • Shrinktempdb.sql shrinks it back down • Backupdev.sql creates devices for SQL Server to backup the database to • Dropbackupdev.sql removes those devices • Backup_Database.sql backs up the tpce database to the specified device names • Restore_Database.sql restores the tpce database from the specified device names • Create_Database.sql maps the database filegroups and log to physical storage • Flatfile.txt tells the database loader where to store the database flatfiles during the load • Remove_Database.sql drops the current tpce database
Database Physical Organization The physical organization of tables and User-Defined Objects, within the database, must be reported in the Report.
The following tables and related indexes were on the growing_fg filegroup:
• CASH_TRANSACTION • SETTLEMENT • TRADE • TRADE_HISTORY • TRADE_REQUEST • HOLDING • HOLDING_HISTORY • HOLDING_SUMMARY
The remaining tables and their related indexes were all on the fixed_fg filegroup.
©IBM Corporation TPC-E Benchmark Full Disclosure Report – March 2012 14
Horizontal/Vertical Partitioning While few restrictions are placed upon horizontal or vertical partitioning of tables and rows in the TPC-E benchmark (see Clause 2.3.3), any such partitioning must be reported.
Partitioning was not used for this benchmark.
Replication Replication of tables, if used, must be reported in the Report.
Replication was not used for this benchmark.
Table Attributes Additional and/or duplicated columns in any table must be reported in the Report along with a statement on the impact on performance (see Clause 2.3.5).
No additional attributes were used for this benchmark.
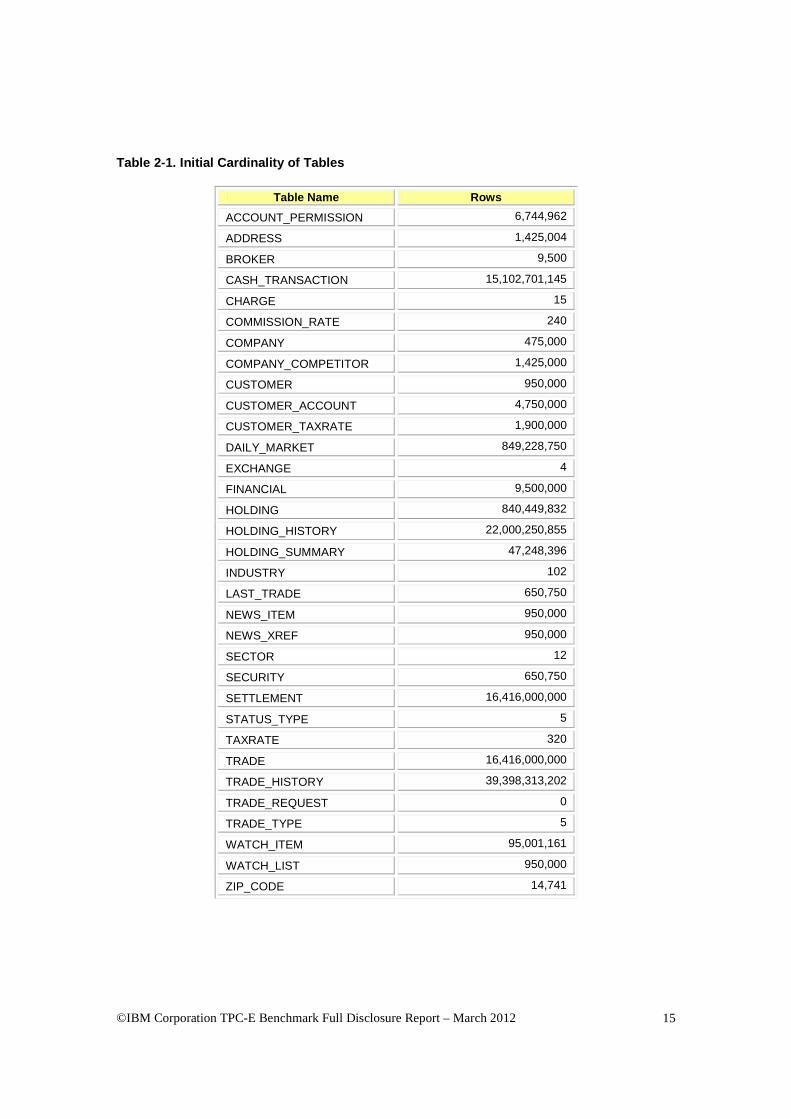
Cardinality of Tables The cardinality (e.g., the number of rows) of each table, as it existed after the database load (see Clause 2.6), must be reported in the Report.
The database was built with 950,000 customers. The cardinality is shown in Table 2-1.
©IBM Corporation TPC-E Benchmark Full Disclosure Report – March 2012 15
Table 2-1. Initial Cardinality of Tables
Table Name Rows
ACCOUNT_PERMISSION 6,744,962
ADDRESS 1,425,004
BROKER 9,500
CASH_TRANSACTION 15,102,701,145
CHARGE 15
COMMISSION_RATE 240
COMPANY 475,000
COMPANY_COMPETITOR 1,425,000
CUSTOMER 950,000
CUSTOMER_ACCOUNT 4,750,000
CUSTOMER_TAXRATE 1,900,000
DAILY_MARKET 849,228,750
EXCHANGE 4
FINANCIAL 9,500,000
HOLDING 840,449,832
HOLDING_HISTORY 22,000,250,855
HOLDING_SUMMARY 47,248,396
INDUSTRY 102
LAST_TRADE 650,750
NEWS_ITEM 950,000
NEWS_XREF 950,000
SECTOR 12
SECURITY 650,750
SETTLEMENT 16,416,000,000
STATUS_TYPE 5
TAXRATE 320
TRADE 16,416,000,000
TRADE_HISTORY 39,398,313,202
TRADE_REQUEST 0
TRADE_TYPE 5
WATCH_ITEM 95,001,161
WATCH_LIST 950,000
ZIP_CODE 14,741
©IBM Corporation TPC-E Benchmark Full Disclosure Report – March 2012 16
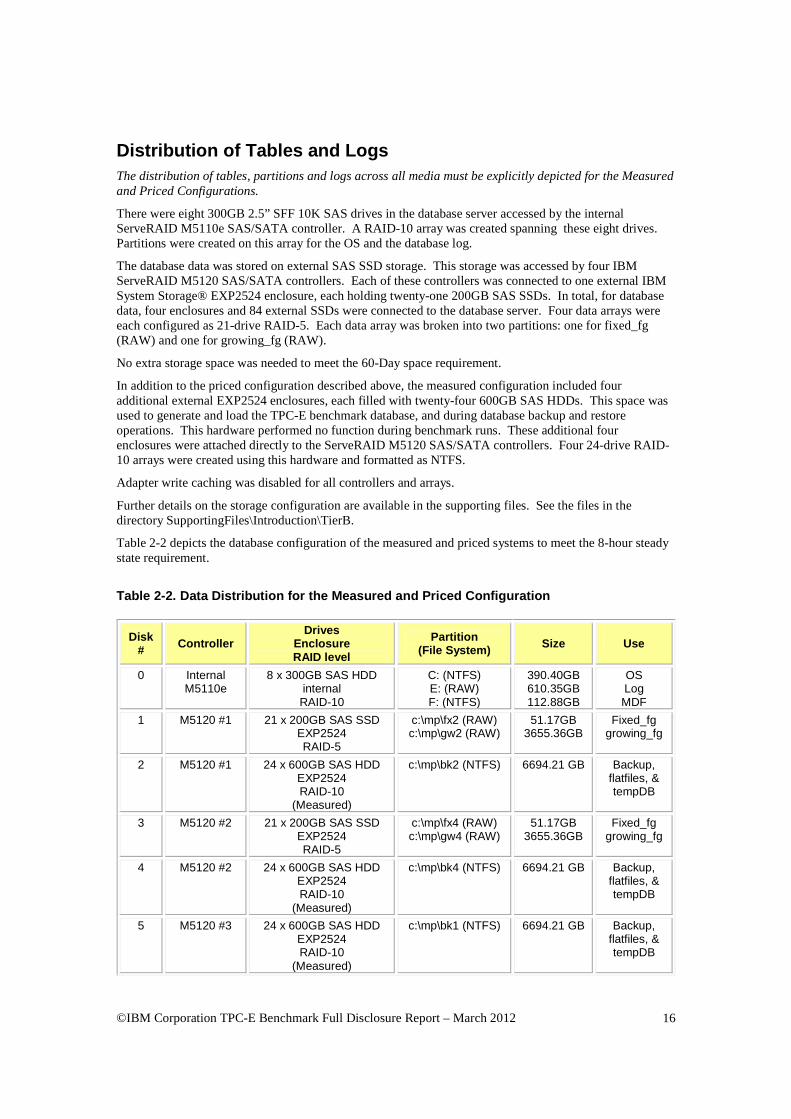
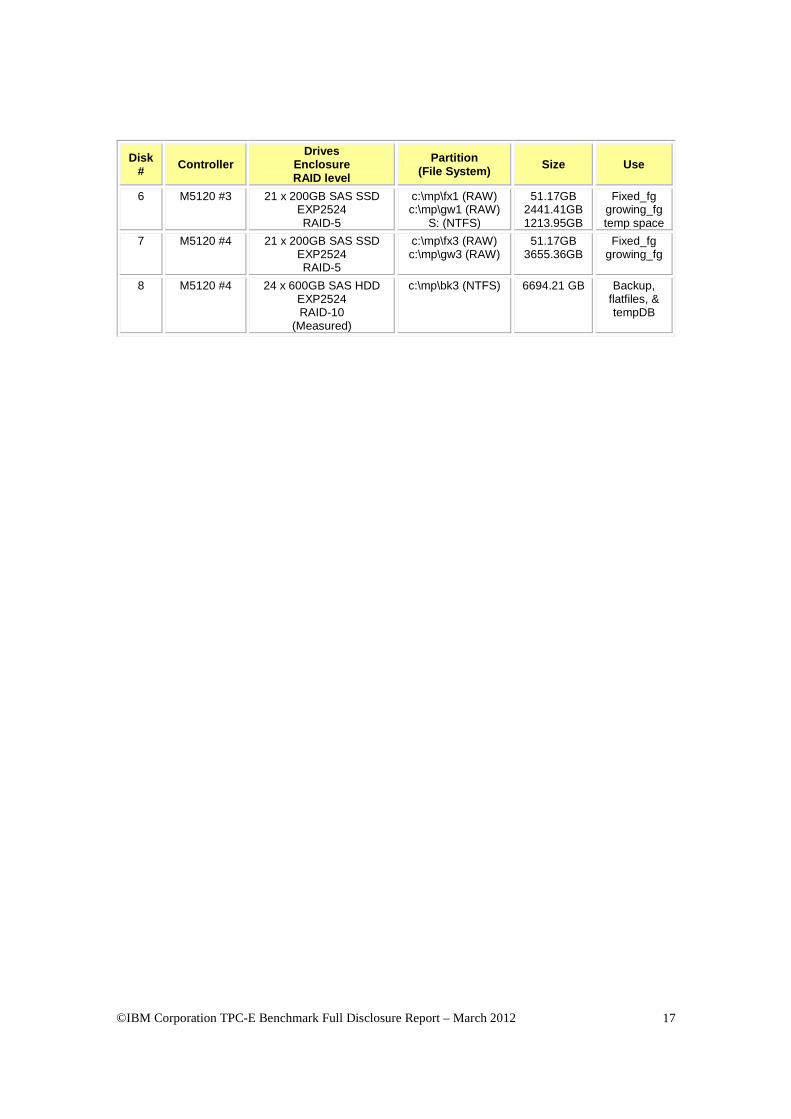
Distribution of Tables and Logs The distribution of tables, partitions and logs across all media must be explicitly depicted for the Measured and Priced Configurations.
There were eight 300GB 2.5” SFF 10K SAS drives in the database server accessed by the internal ServeRAID M5110e SAS/SATA controller. A RAID-10 array was created spanning these eight drives. Partitions were created on this array for the OS and the database log.
The database data was stored on external SAS SSD storage. This storage was accessed by four IBM ServeRAID M5120 SAS/SATA controllers. Each of these controllers was connected to one external IBM System Storage® EXP2524 enclosure, each holding twenty-one 200GB SAS SSDs. In total, for database data, four enclosures and 84 external SSDs were connected to the database server. Four data arrays were each configured as 21-drive RAID-5. Each data array was broken into two partitions: one for fixed_fg (RAW) and one for growing_fg (RAW).
No extra storage space was needed to meet the 60-Day space requirement.
In addition to the priced configuration described above, the measured configuration included four additional external EXP2524 enclosures, each filled with twenty-four 600GB SAS HDDs. This space was used to generate and load the TPC-E benchmark database, and during database backup and restore operations. This hardware performed no function during benchmark runs. These additional four enclosures were attached directly to the ServeRAID M5120 SAS/SATA controllers. Four 24-drive RAID-10 arrays were created using this hardware and formatted as NTFS.
Adapter write caching was disabled for all controllers and arrays.
Further details on the storage configuration are available in the supporting files. See the files in the directory SupportingFiles\Introduction\TierB.
Table 2-2 depicts the database configuration of the measured and priced systems to meet the 8-hour steady state requirement.
Table 2-2. Data Distribution for the Measured and P riced Configuration
Disk # Controller
Drives Enclosure RAID level
Partition (File System) Size Use
0 Internal M5110e
8 x 300GB SAS HDD internal RAID-10
C: (NTFS) E: (RAW) F: (NTFS)
390.40GB 610.35GB 112.88GB
OS Log MDF
1 M5120 #1 21 x 200GB SAS SSD EXP2524 RAID-5
c:\mp\fx2 (RAW) c:\mp\gw2 (RAW)
51.17GB 3655.36GB
Fixed_fg growing_fg
2 M5120 #1 24 x 600GB SAS HDD EXP2524 RAID-10
(Measured)
c:\mp\bk2 (NTFS) 6694.21 GB Backup, flatfiles, & tempDB
3 M5120 #2 21 x 200GB SAS SSD EXP2524 RAID-5
c:\mp\fx4 (RAW) c:\mp\gw4 (RAW)
51.17GB 3655.36GB
Fixed_fg growing_fg
4 M5120 #2 24 x 600GB SAS HDD EXP2524 RAID-10
(Measured)
c:\mp\bk4 (NTFS) 6694.21 GB Backup, flatfiles, & tempDB
5 M5120 #3 24 x 600GB SAS HDD EXP2524 RAID-10
(Measured)
c:\mp\bk1 (NTFS) 6694.21 GB Backup, flatfiles, & tempDB
©IBM Corporation TPC-E Benchmark Full Disclosure Report – March 2012 17
Disk # Controller
Drives Enclosure RAID level
Partition (File System) Size Use
6 M5120 #3 21 x 200GB SAS SSD EXP2524 RAID-5
c:\mp\fx1 (RAW) c:\mp\gw1 (RAW)
S: (NTFS)
51.17GB 2441.41GB 1213.95GB
Fixed_fg growing_fg temp space
7 M5120 #4 21 x 200GB SAS SSD EXP2524 RAID-5
c:\mp\fx3 (RAW) c:\mp\gw3 (RAW)
51.17GB 3655.36GB
Fixed_fg growing_fg
8 M5120 #4 24 x 600GB SAS HDD EXP2524 RAID-10
(Measured)
c:\mp\bk3 (NTFS) 6694.21 GB Backup, flatfiles, & tempDB

©IBM Corporation TPC-E Benchmark Full Disclosure Report – March 2012 18
Database Interface and Model Implemented A statement must be provided in the Report that describes:
• The Database Interface (e.g., embedded, call level) and access language (e.g., SQL, COBOL read/write) used to implement the TPC-E Transactions. If more than one interface / access language is used to implement TPC-E, each interface / access language must be described and a list of which interface /access language is used with which Transaction type must be reported.
• The data model implemented by the DBMS (e.g., relational, network, hierarchical).
Microsoft SQL Server 2012 Enterprise Edition is a relational database. The interface used was Microsoft SQL Server stored procedures accessed with Remote Procedure Calls embedded in C++ code using the Microsoft ODBC interface.
Database Load Methodology The methodology used to load the database must be reported in the Report.
The database was loaded using the flat files option on the EGenLoader command line. This will generate flat files first, then bulk insert the data into the tables. A further description is provided in SupportingFiles\Clause2\MSTPCE Database Setup Reference.pdf.

©IBM Corporation TPC-E Benchmark Full Disclosure Report – March 2012 19
Clause 3 – Transaction Related Items
Vendor-Supplied Code
A statement that vendor-supplied code is functionally equivalent to Pseudo-code in the specification (see Clause 3.2.1.6) must be reported.
The stored procedure code for the transactions was functionally equivalent to the pseudo-code. The stored procedures can be seen in SupportingFiles\Clause3\StoredProcedures.
The code to interface the stored procedures can be found in:
• SupportingFiles\Clause3\BaseServer • SupportingFiles\Clause3\TransactionsSP • SupportingFiles\Clause3\TxnHarness
Database Footprint of Transactions A statement that the database footprint requirements (as described in Clause 3.3) were met must be reported.
The database footprint requirements were met.

©IBM Corporation TPC-E Benchmark Full Disclosure Report – March 2012 20
Clause 4 – SUT, Driver, and Network
Network Configuration The Network configurations of both the Measured and Priced Configurations must be described and reported. This includes the mandatory Network between the Driver and Tier A (see Clause 4.2.2) and any optional Database Server interface networks (see Clause 4.1.3.12).
The network configurations of the measured and priced configurations were the same. Refer to Figure 1-1 for a diagram of the network connections.
The Tier A client and Tier B database server were connected by two Gb Ethernet crossover cables. These cables were connected to onboard Gb Ethernet ports in both servers. These crossover networks handled all of the network traffic between Tier A and Tier B while a measurement was underway.
Another network connected the driver, the database server, the client, and a time server. This network, which was connected via a gigabit Ethernet switch, used one of the onboard Ethernet ports on the client and database server. This network fulfills the mandatory network between the driver and Tier A. It also allows the driver, client, and database server to synchronize and verify their times with the time server.
©IBM Corporation TPC-E Benchmark Full Disclosure Report – March 2012 21
Clause 5 – EGen
EGen Version
The version of EGen used in the benchmark must be reported (see Clause 5.3.1).
EGen v1.12.0 was used in the benchmark.
EGen Code and Modifications
A statement that all required TPC-provided EGen code was used in the benchmark must be reported. If the Test Sponsor modified EGen, a statement EGen has been modified must be reported in the Report. All formal waivers from the TPC documenting the allowed changes to EGen must also be reported (see Clause 5.3.7.1). If any of the changes to EGen do not have a formal waiver, that must also be reported. If the Test Sponsor extended EGenLoader, the use of the extended EGenLoader and the audit of the extension code by an Auditor must be reported (see Clause 5.7.4).
All required TPC-provided EGen code was used in the benchmark.
EGen was not modified for use in this benchmark.
EGenLoader was not extended for this benchmark.
EGen Files The make/project files used to compile/link EGenLoader and EGenValidate must be reported in the Supporting Files. The compiler/linker options and flags used to compile/link EGen objects for the SUT must be reported in the Supporting Files.
See the supporting files directory SupportingFiles\Clause3\prj for the files related to EGenLoader and EGenValidate.
See the supporting files directory SupportingFiles\Clause3\SUT_CE_Server for the files related to the SUT_CE_Server.
See the supporting files directory SupportingFiles\Clause3\SUT_MEE_Server for the files related to the SUT_MEE_Server.
©IBM Corporation TPC-E Benchmark Full Disclosure Report – March 2012 22
Clause 6 – Performance Metrics and Response Time
EGen Instances
The number of EGenDriverMEE and EGenDriverCE instances used in the benchmark must be reported (see Clause 6.2.5).
There were 16 EGenDriverCEs with a total of 304 EGenDriverCE instances used in the benchmark.
There were 16 EGenDriverMEEs with a dynamic number of instances used in the benchmark.
Measured Throughput
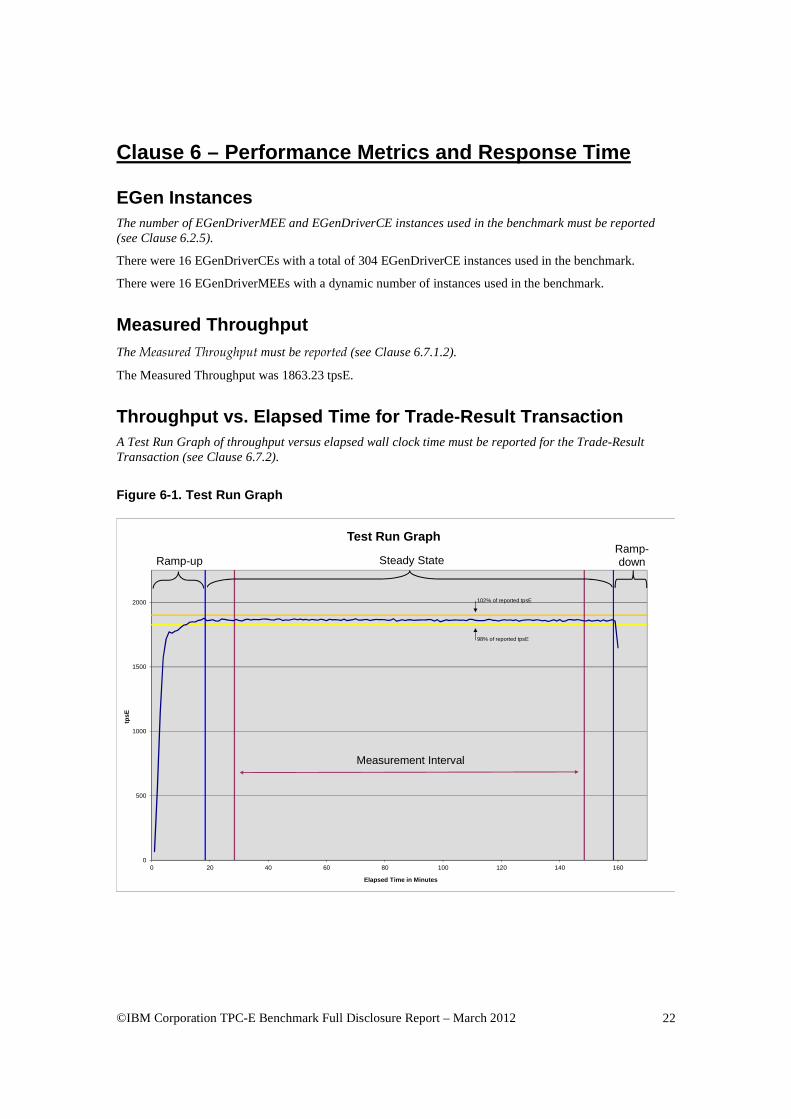
The Measured Throughput must be reported (see Clause 6.7.1.2).
The Measured Throughput was 1863.23 tpsE.
Throughput vs. Elapsed Time for Trade-Result Transa ction
A Test Run Graph of throughput versus elapsed wall clock time must be reported for the Trade-Result Transaction (see Clause 6.7.2).
Figure 6-1. Test Run Graph
0
500
1000
1500
2000
0 20 40 60 80 100 120 140 160
tpsE
Elapsed Time in Minutes
Test Run Graph
Measurement Interval
Ramp-upRamp-downSteady State
98% of reported tpsE
102% of reported tpsE
©IBM Corporation TPC-E Benchmark Full Disclosure Report – March 2012 23
Steady State Methodology
The method used to determine that the SUT had reached a Steady State prior to commencing the Measurement Interval must be reported.
During the run, observation of the tpsE as the benchmark ran was used to determine Steady State. After the run, Steady State was confirmed by:
1. Looking at the Test Run Graph and verifying that tpsE was steady prior to commencing the Measurement Interval.
2. Calculating the average tpsE over 60-minute windows during Steady State, with the start of each window 10 minutes apart. Then it was confirmed that the minimum 60-minute average tpsE was not less than 98% of the Reported Throughput, and that the maximum 60-minute average tpsE was not greater than 102% of the Reported Throughput.
3. Calculating the average tpsE over 10-minute windows during Steady State, with the start of each window 1 minute apart. Then it was confirmed that the minimum 10-minute average tpsE was not less than 80% of the Reported Throughput, and the maximum 10-minute average tpsE was not greater than 120% of the Reported Throughput.
Work Performed During Steady State
A description of how the work normally performed during a Test Run, actually occurred during the Measurement Interval must be reported (e.g., checkpointing, writing Undo/Redo Log records).
Checkpoints had a duration of 430 seconds and were scheduled to run every 447 seconds.
Data-Maintenance was run every 60 seconds.
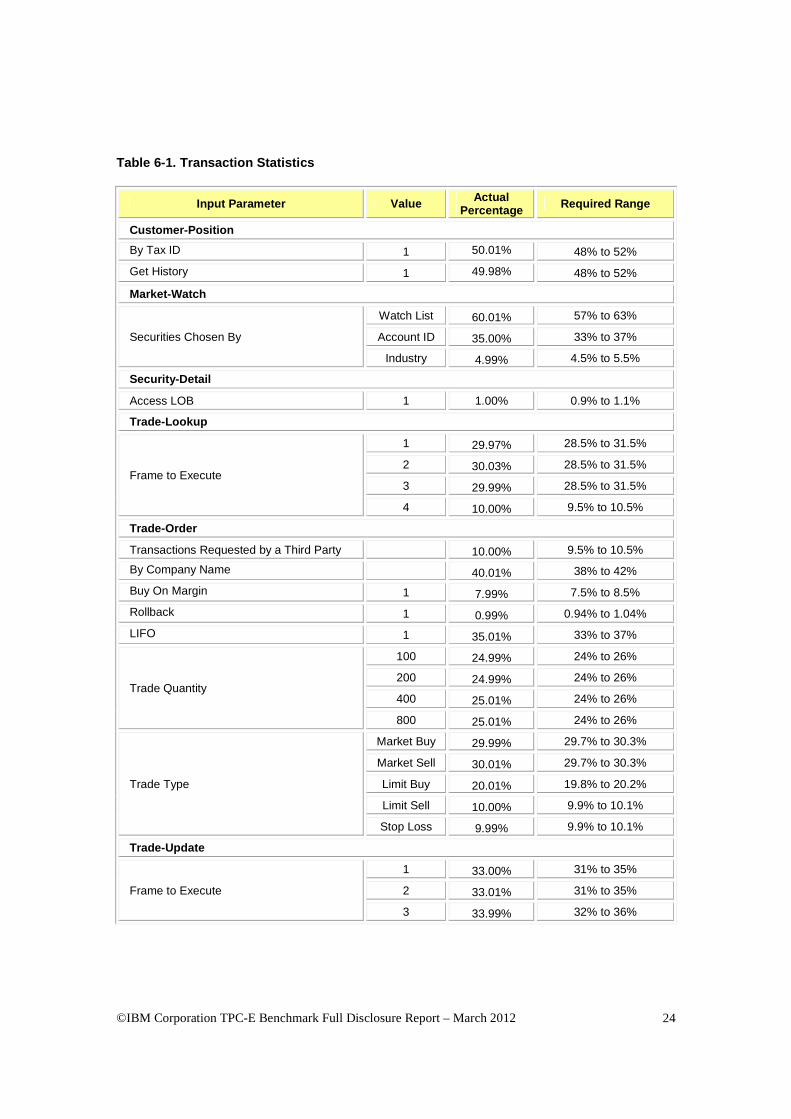
Transaction Statistics
The recorded averages over the Measurement Interval for each of the Transaction input parameters specified by clause 6.4.1 must be reported.
Table 6-1 contains the transaction statistics.
©IBM Corporation TPC-E Benchmark Full Disclosure Report – March 2012 24
Table 6-1. Transaction Statistics
Input Parameter Value Actu al Percentage Required Range
Customer-Position
By Tax ID 1 50.01% 48% to 52%
Get History 1 49.98% 48% to 52%
Market-Watch
Securities Chosen By
Watch List 60.01% 57% to 63%
Account ID 35.00% 33% to 37%
Industry 4.99% 4.5% to 5.5%
Security-Detail
Access LOB 1 1.00% 0.9% to 1.1%
Trade-Lookup
Frame to Execute
1 29.97% 28.5% to 31.5%
2 30.03% 28.5% to 31.5%
3 29.99% 28.5% to 31.5%
4 10.00% 9.5% to 10.5%
Trade-Order
Transactions Requested by a Third Party 10.00% 9.5% to 10.5%
By Company Name 40.01% 38% to 42%
Buy On Margin 1 7.99% 7.5% to 8.5%
Rollback 1 0.99% 0.94% to 1.04%
LIFO 1 35.01% 33% to 37%
Trade Quantity
100 24.99% 24% to 26%
200 24.99% 24% to 26%
400 25.01% 24% to 26%
800 25.01% 24% to 26%
Trade Type
Market Buy 29.99% 29.7% to 30.3%
Market Sell 30.01% 29.7% to 30.3%
Limit Buy 20.01% 19.8% to 20.2%
Limit Sell 10.00% 9.9% to 10.1%
Stop Loss 9.99% 9.9% to 10.1%
Trade-Update
Frame to Execute
1 33.00% 31% to 35%
2 33.01% 31% to 35%
3 33.99% 32% to 36%
©IBM Corporation TPC-E Benchmark Full Disclosure Report – March 2012 25
Clause 7 – Transaction and System Properties
The ACID (Atomicity, Consistency, Isolation, and Durability) properties of transaction processing systems must be supported by the System Under Test during the running of this benchmark. It is the intent of this section to define the ACID properties informally and to specify a series of tests that must be performed to demonstrate that these properties are met. The results of the ACID tests must be reported in the Report along with a description of how the ACID requirements were met, and how the ACID tests were run.
Atomicity Requirements The System Under Test must guarantee that Database Transactions are atomic; the system will either perform all individual operations on the data, or will ensure that no partially completed operations leave any effects on the data..
All ACID tests were conducted according to specification. The following steps were performed to verify the Atomicity of the Trade-Order transactions:
• Perform a market Trade-Order Transaction with the roll_it_back flag set to false. Verify that the appropriate rows have been inserted in the TRADE and TRADE_HISTORY tables.
• Perform a market Trade-Order Transaction with the roll_it_back flag set to true. Verify that no rows associated with the rolled back Trade-Order have been added to the TRADE and TRADE_HISTORY tables.
The procedure for running the atomicity tests is documented in the file SupportingFiles\Clause7\MSTPCE ACID Procedures.pdf.
The atomicity scripts and outputs are located in the directory SupportingFiles\Clause7\Atomicity.
Consistency Requirements Consistency is the property of the Application that requires any execution of a Database Transaction to take the database from one consistent state to another. A TPC-E database when first populated by EGenLoader must meet these consistency conditions. The three consistency conditions must be tested after initial database population and after any Business Recovery tests. Consistency condition 1: Entries in the BROKER and TRADE tables must satisfy the relationship: B_NUM_TRADES = count(*) For each broker defined by: (B_ID = CA_B_ID) and (CA_ID = T_CA_ID) and (T_ST_ID = ―CMPT‘). Consistency condition 2: Entries in the BROKER and TRADE tables must satisfy the relationship: B_COMM_TOTAL = sum(T_COMM) For each broker defined by: (B_ID = CA_B_ID) and (CA_ID = T_CA_ID) and (T_ST_ID = ―CMPT‘). Consistency condition 3: Entries in the HOLDING_SUMMARY and HOLDING tables must satisfy the relationship: HS_QTY = sum(H_QTY) For each holding summary defined by: (HS_CA_ID = H_CA_ID) and (HS_S_SYMB = H_S_SYMB).
©IBM Corporation TPC-E Benchmark Full Disclosure Report – March 2012 26
Consistency conditions 1, 2, and 3 were tested using a batch file to issue queries to the database after the database was loaded and after the Business Recovery Test. The results of the queries demonstrated that the database was consistent for all three tests.
The procedure for running the consistency tests is documented in the file SupportingFiles\Clause7\MSTPCE ACID Procedures.pdf.
The consistency scripts and outputs are located in the directory SupportingFiles\Clause7\Consistency.
Isolation Requirements The isolation property of a Transaction is the level to which it is isolated from the actions of other concurrently executing Transactions. Systems that implement Transaction isolation using a locking and/or versioning scheme must demonstrate compliance with the isolation requirements by executing the tests described in Clause 7.4.2.
Isolation tests 1 through 4 were successfully done following the procedure documented in the file SupportingFiles\Clause7\MSTPCE ACID Procedures.pdf.
The isolation scripts and outputs are located in the directory SupportingFiles\Clause7\Isolation.
Durability Requirements The SUT must provide Durability. In general, state that persists across failures is said to be Durable and an implementation that ensures state persists across failures is said to provide Durability. In the context of the benchmark, Durability is more tightly defined as the SUT‘s ability to ensure all Committed data persist across a Single Point of Failure.
Durability Test for Data Accessibility The Test Sponsor must report in the Report the Redundancy Level (see Clause 7.6.7.1) and describe the Data Accessibility test(s) used to demonstrate compliance. A Data Accessibility Graph for each run demonstrating a Redundancy Level must be reported in the Report (see Clause 7.6.7.2).
This benchmark result used Redundancy Level 1. The test for Redundancy Level 1 is the test for permanent irrecoverable failure of any single Durable Medium.
To prove Redundancy Level 1, the following steps were successfully performed:
1. Restored the database to its freshly-loaded, proven-consistent state.
2. Determined the current number of completed trades in the database, count1.
3. Started a run, using the profile from the measured run, with checkpoints, and met the Durability Throughput Requirements for at least 5 minutes.
4. Induced the first failure, which in this case was failing a drive in a database data array by physically removing it from its enclosure. Since the database data arrays are RAID protected, transaction processing continued.
5. Waited until the Durability Throughput Requirements were met again for at least 5 minutes.
6. Induced the second failure, which in this case was failing a drive in the database log array by physically removing it from its enclosure. Since the database log array is RAID protected, transaction processing continued.
7. After a few minutes passed, a new drive was inserted into the log enclosure to replace the failed log drive. The log array rebuilding process was started.

©IBM Corporation TPC-E Benchmark Full Disclosure Report – March 2012 27
8. After a few minutes passed, a new drive was inserted into the data enclosure to replace the failed data drive. The data array rebuilding process was started.
9. Continued running the benchmark for at least 20 minutes.
10. Terminated the run gracefully.
11. Retrieved the new number of completed trades in the database by running select count(*) as count2 from SETTLEMENT.
12. Verified that (count2 – count1), which is the number of actual completed Trade-Result Transactions done during the run, equaled the number of successful Trade-Result transactions reported by the Driver.
13. Allowed the recovery process to complete.
Figure 7-1 is a graph of the measured throughput versus elapsed time for the data accessibility run. The timings of the induced failures as well as the recovery process are indicated.
Figure 7-1. Data Accessibility Graph
0
200
400
600
800
1000
1200
1400
1600
1800
2000
0 10 20 30 40 50 60 70 80 90 100 110
tpsE
Elapsed Time in Minutes
Data Accessibility Graph
20 minutes
95% of reported tpsE
Start Steady State
Pull data disk
Replace log diskPull log disk
Replace data disk
The files related to this data accessibility test are located in SupportingFiles\Clause7\Durability\DataAccessibility.
Durability Test for Business Recovery The Test Sponsor must describe in the Report the test(s) used to demonstrate Business Recovery . The Business Recovery Time must be reported on the Executive Summary Statement and in the Report. If the failures described in Clauses 7.6.2.2, 7.6.2.3 and 7.6.2.4 were not combined into one Durability test (usually powering off the Database Server during the run), then the Business Recovery Time for the failure described for instantaneous interruption is the Business Recovery Time that must be reported in the Executive Summary Statement. All the Business Recovery Times for each test requiring Business Recovery must be reported in the Report.
©IBM Corporation TPC-E Benchmark Full Disclosure Report – March 2012 28
The Business Recovery Time Graph (see Clause 7.6.7.4) must be reported in the Report for all Business Recovery tests.
The tests for “Loss of processing,” “Loss of Vulnerable Storage Component,” and “Loss of all external power to the SUT” were combined.
The following steps were successfully performed to test Business Recovery:
1. Restored the database to its freshly-loaded, proven-consistent state.
2. Determined the current number of completed trades in the database, count1.
3. Started a run, using the profile from the measured run, with checkpoints, and met the Durability Throughput Requirements for at least 20 minutes.
4. Pulled the power cords from the database server.
5. Stopped submitting Transactions.
6. Plugged in and restarted the database server.
7. Started SQL Server on the database server. It automatically began recovery of the tpce database. The timestamp in the SQL Server ERRORLOG of the first message related to database tpce is considered the start of Database Recovery.
8. Waited for SQL Server to finish recovering the database. The timestamp in the SQL Server ERRORLOG of the message indicating that the recovery of database tpce is complete is considered the end of Database Recovery.
9. Since there was a time gap between the end of Database Recovery and the start of Application Recovery, and the Drivers and Transactions needed to be started again (not just continued), the Trade-Cleanup Transaction was executed during this time gap.
10. Started a run, using the profile from the measured run, with checkpoints. The time when the first transaction is submitted to the database is considered the start of Application Recovery.
11. Let the run proceed until a 20 minute window existed such that the first minute of the window and the entire window both scored at least 95% of the Reported Throughput. The time of the beginning of that 20-minute window is considered the end of Application Recovery.
12. Terminated the run gracefully.
13. Verified that no errors were reported during steps 8 through 12.
14. Retrieved the new number of completed trades in the database by running select count(*) as count2 from SETTLEMENT.
15. Verified that (count2 – count1), which is the number of actual completed Trade-Result Transactions done during the two runs, was greater than or equal to the combined number of successful Trade-Result Transactions reported by the Driver for both runs. In the case of an inequality, verified that the difference was less than or equal to the maximum number of transactions that could be simultaneously in-flight from the Driver to the SUT.
16. Verified database consistency.
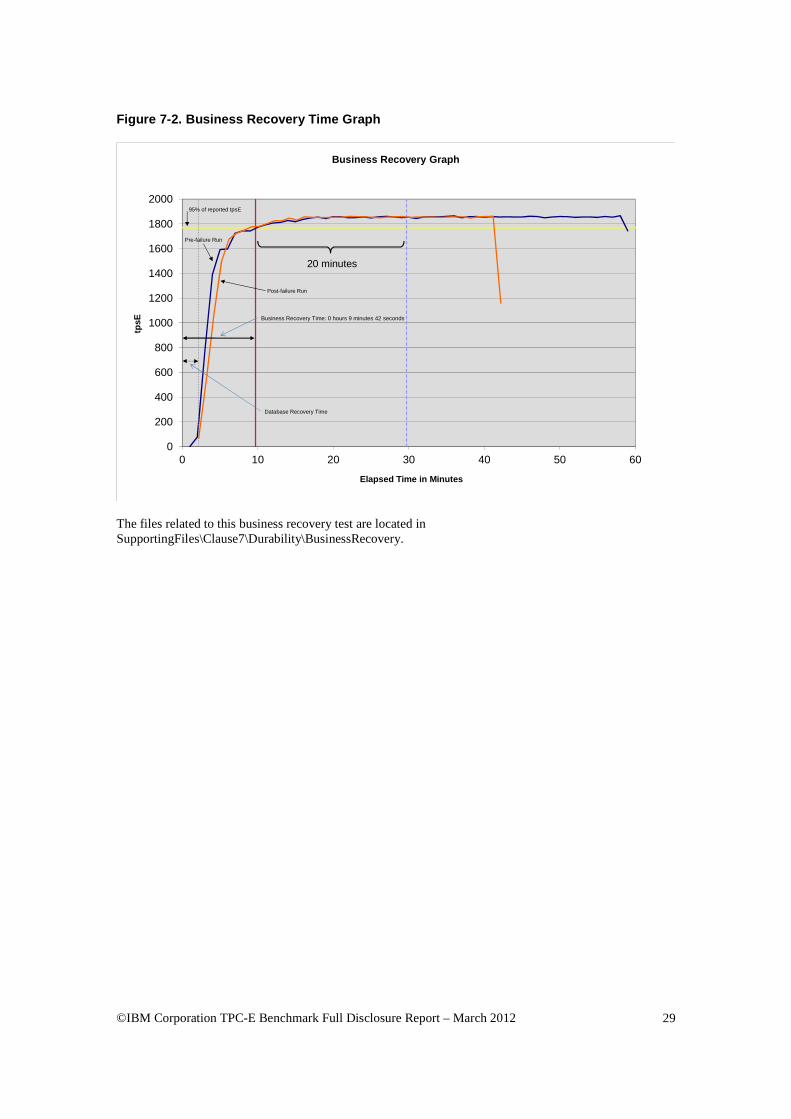
Figure 7-2 is a graph of the measured throughput versus elapsed time for Business Recovery.
The Database Recovery Time was 00:02:11. The Application Recovery Time was 00:07:31. The Business Recovery Time, which is the sum of the Database Recovery Time and the Application Recovery Time, was 00:09:42.
©IBM Corporation TPC-E Benchmark Full Disclosure Report – March 2012 29
Figure 7-2. Business Recovery Time Graph
0
200
400
600
800
1000
1200
1400
1600
1800
2000
0 10 20 30 40 50 60
tpsE
Elapsed Time in Minutes
Business Recovery Graph
20 minutes
Business Recovery Time: 0 hours 9 minutes 42 seconds
Pre-failure Run
95% of reported tpsE
Post-failure Run
Database Recovery Time
The files related to this business recovery test are located in SupportingFiles\Clause7\Durability\BusinessRecovery.
©IBM Corporation TPC-E Benchmark Full Disclosure Report – March 2012 30
Clause 8 – Pricing
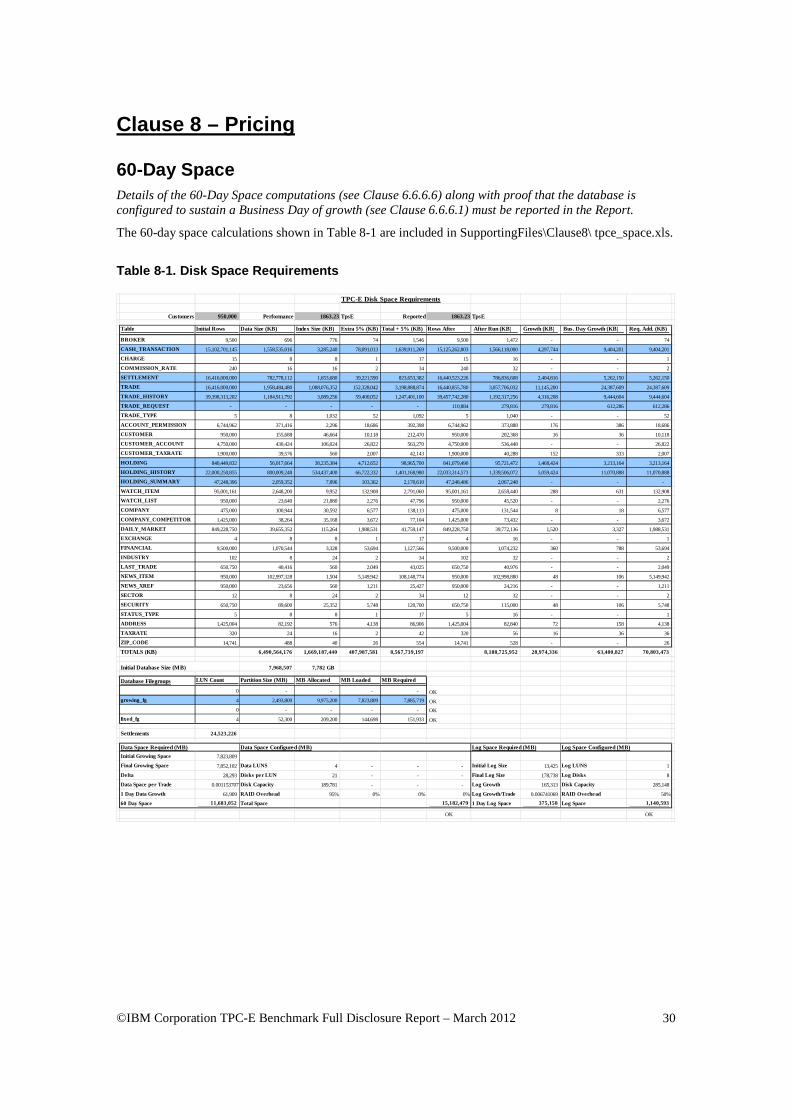
60-Day Space Details of the 60-Day Space computations (see Clause 6.6.6.6) along with proof that the database is configured to sustain a Business Day of growth (see Clause 6.6.6.1) must be reported in the Report.
The 60-day space calculations shown in Table 8-1 are included in SupportingFiles\Clause8\ tpce_space.xls.
Table 8-1. Disk Space Requirements
Customers 950,000 Performance 1863.23 TpsE Reported 1863.23TpsE
Table Initial Rows Data Size (KB) Index Size (KB) Extra 5% (KB) Total + 5% (KB) Rows After After Run (KB) Growth (KB) Bus. Day Growth (KB) Req. Add. (KB)
BROKER 9,500 696 776 74 1,546 9,500 1,472 - - 74
CASH_TRANSACTION 15,102,701,145 1,558,535,016 3,285,240 78,091,013 1,639,911,269 15,125,262,803 1,566,118,000 4,297,744 9,404,201 9,404,201
CHARGE 15 8 8 1 17 15 16 - - 1
COMMISSION_RATE 240 16 16 2 34 240 32 - - 2
SETTLEMENT 16,416,000,000 782,778,112 1,653,680 39,221,590 823,653,382 16,440,523,226 786,836,608 2,404,816 5,262,150 5,262,150
TRADE 16,416,000,000 1,958,484,480 1,088,076,352 152,328,042 3,198,888,874 16,440,855,780 3,057,706,032 11,145,200 24,387,609 24,387,609
TRADE_HISTORY 39,398,313,202 1,184,911,792 3,089,256 59,400,052 1,247,401,100 39,457,742,280 1,192,317,256 4,316,208 9,444,604 9,444,604
TRADE_REQUEST - - - - - 110,884 279,816 279,816 612,286 612,286
TRADE_TYPE 5 8 1,032 52 1,092 5 1,040 - - 52
ACCOUNT_PERMISSION 6,744,962 371,416 2,296 18,686 392,398 6,744,962 373,888 176 386 18,686
CUSTOMER 950,000 155,688 46,664 10,118 212,470 950,000 202,368 16 36 10,118
CUSTOMER_ACCOUNT 4,750,000 430,424 106,024 26,822 563,270 4,750,000 536,448 - - 26,822
CUSTOMER_TAXRATE 1,900,000 39,576 560 2,007 42,143 1,900,000 40,288 152 333 2,007
HOLDING 840,449,832 56,017,664 38,235,384 4,712,652 98,965,700 841,079,490 95,721,472 1,468,424 3,213,164 3,213,164
HOLDING_HISTORY 22,000,250,855 800,009,248 534,437,400 66,722,332 1,401,168,980 22,033,314,573 1,339,506,072 5,059,424 11,070,888 11,070,888
HOLDING_SUMMARY 47,248,396 2,059,352 7,896 103,362 2,170,610 47,248,486 2,067,248 - - -
WATCH_ITEM 95,001,161 2,648,200 9,952 132,908 2,791,060 95,001,161 2,658,440 288 631 132,908
WATCH_LIST 950,000 23,640 21,880 2,276 47,796 950,000 45,520 - - 2,276
COMPANY 475,000 100,944 30,592 6,577 138,113 475,000 131,544 8 18 6,577
COMPANY_COMPETITOR 1,425,000 38,264 35,168 3,672 77,104 1,425,000 73,432 - - 3,672
DAILY_MARKET 849,228,750 39,655,352 115,264 1,988,531 41,759,147 849,228,750 39,772,136 1,520 3,327 1,988,531
EXCHANGE 4 8 8 1 17 4 16 - - 1
FINANCIAL 9,500,000 1,070,544 3,328 53,694 1,127,566 9,500,000 1,074,232 360 788 53,694
INDUSTRY 102 8 24 2 34 102 32 - - 2
LAST_TRADE 650,750 40,416 560 2,049 43,025 650,750 40,976 - - 2,049
NEWS_ITEM 950,000 102,997,328 1,504 5,149,942 108,148,774 950,000 102,998,880 48 106 5,149,942
NEWS_XREF 950,000 23,656 560 1,211 25,427 950,000 24,216 - - 1,211
SECTOR 12 8 24 2 34 12 32 - - 2
SECURITY 650,750 89,600 25,352 5,748 120,700 650,750 115,000 48 106 5,748
STATUS_TYPE 5 8 8 1 17 5 16 - - 1
ADDRESS 1,425,004 82,192 576 4,138 86,906 1,425,004 82,840 72 158 4,138
TAXRATE 320 24 16 2 42 320 56 16 36 36
ZIP_CODE 14,741 488 40 26 554 14,741 528 - - 26
TOTALS (KB) 6,490,564,176 1,669,187,440 407,987,581 8,567,739,197 8,188,725,952 28,974,336 63,400,827 70,803,473
7,968,507 7,782 GB
Database Filegroups LUN Count Partition Size (MB) MB Allocated MB Loaded MB Required
0 - - - - OK
growing_fg 4 2,493,800 9,975,200 7,823,809 7,885,719 OK
0 - - - - OK
fixed_fg 4 52,300 209,200 144,698 151,933 OK
Settlements 24,523,226
Initial Growing Space 7,823,809
Final Growing Space 7,852,102 Data LUNS 4 - - - Initial Log Size 13,425 Log LUNS 1
Delta 28,293 Disks per LUN 21 - - - Final Log Size 178,738 Log Disks 8
Data Space per Trade 0.001153707Disk Capacity 189,781 - - - Log Growth 165,313 Disk Capacity 285,148
1 Day Data Growth 61,909 RAID Overhead 95% 0% 0% 0%Log Growth/Trade 0.006741069 RAID Overhead 50%
60 Day Space 11,683,052 Total Space 15,182,479 1 Day Log Space 375,158 Log Space 1,140,593
OK OK
TPC-E Disk Space Requirements
Initial Database Size (MB)
Log Space Required (MB) Log Space Configured (MB)Data Space Configured (MB)Data Space Required (MB)

©IBM Corporation TPC-E Benchmark Full Disclosure Report – March 2012 31
Availability Date The committed Availability Date of Components used in the price calculations must be reported with a precision of one day. All hardware, software and support used in the calculations must be Orderable by Any Customer on the Availability Date. For each of the Components that are not Orderable on the report date of the FDR, the following information must be included in the FDR:
• Name and Part Number of the item that is not Orderable • The date when the Component can be ordered (on or before the Availability Date) • The method to be used to order the Component (at or below the quoted price) when the order date
arrives • The method for verifying the price
The total solution as priced will be generally available May 31, 2012. The dates for ordering and availability are detailed in Table 8-2 for those components that are not immediately orderable.
Table 8-2. Ordering and Pricing Information
Description Part Number Order Date Availability
Date Order
Method Price
Verification
Microsoft SQL Server 2012 Enterprise Edition
4-2-12 4-2-12 See note 1 See note 2
Note 1: See the attached Microsoft price quote.
Note 2: See the attached Microsoft price quote.
Supporting Files Index An index for all files required by Clause 9.4 Supporting Files must be provided.
An index of the files contained in the supporting files is here: SupportingFiles\SupportingFilesIndex.pdf
Auditor’s Attestation Letter The Auditor’s Attestation Letter, which indicates compliance, must be included in the Report.
The auditor’s Attestation Letter is on the next two pages.
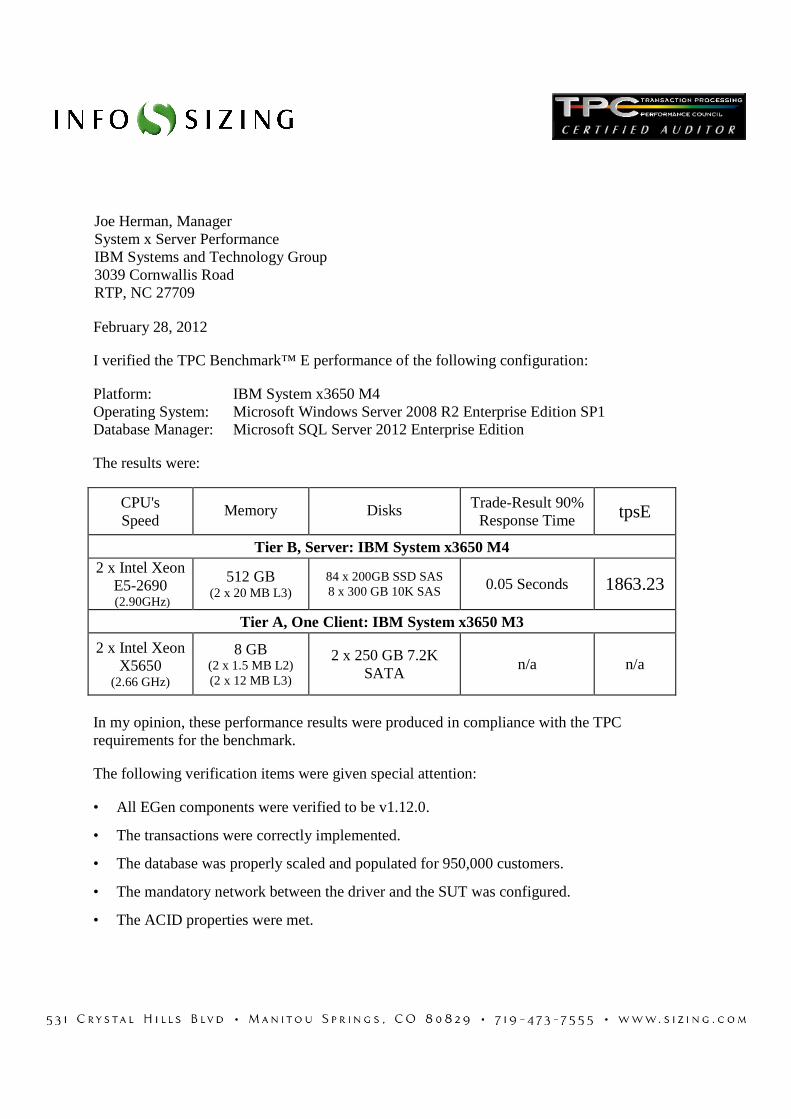
Joe Herman, Manager System x Server Performance IBM Systems and Technology Group 3039 Cornwallis Road RTP, NC 27709
February 28, 2012
I verified the TPC Benchmark™ E performance of the following configuration:
Platform: IBM System x3650 M4 Operating System: Microsoft Windows Server 2008 R2 Enterprise Edition SP1 Database Manager: Microsoft SQL Server 2012 Enterprise Edition
The results were:
CPU's Speed
Memory Disks Trade-Result 90% Response Time tpsE
Tier B, Server: IBM System x3650 M4 2 x Intel Xeon
E5-2690 (2.90GHz)
512 GB (2 x 20 MB L3)
84 x 200GB SSD SAS 8 x 300 GB 10K SAS 0.05 Seconds 1863.23
Tier A, One Client: IBM System x3650 M3
2 x Intel Xeon X5650
(2.66 GHz)
8 GB (2 x 1.5 MB L2) (2 x 12 MB L3)
2 x 250 GB 7.2K SATA
n/a n/a
In my opinion, these performance results were produced in compliance with the TPC requirements for the benchmark.
The following verification items were given special attention:
• All EGen components were verified to be v1.12.0.
• The transactions were correctly implemented.
• The database was properly scaled and populated for 950,000 customers.
• The mandatory network between the driver and the SUT was configured.
• The ACID properties were met.
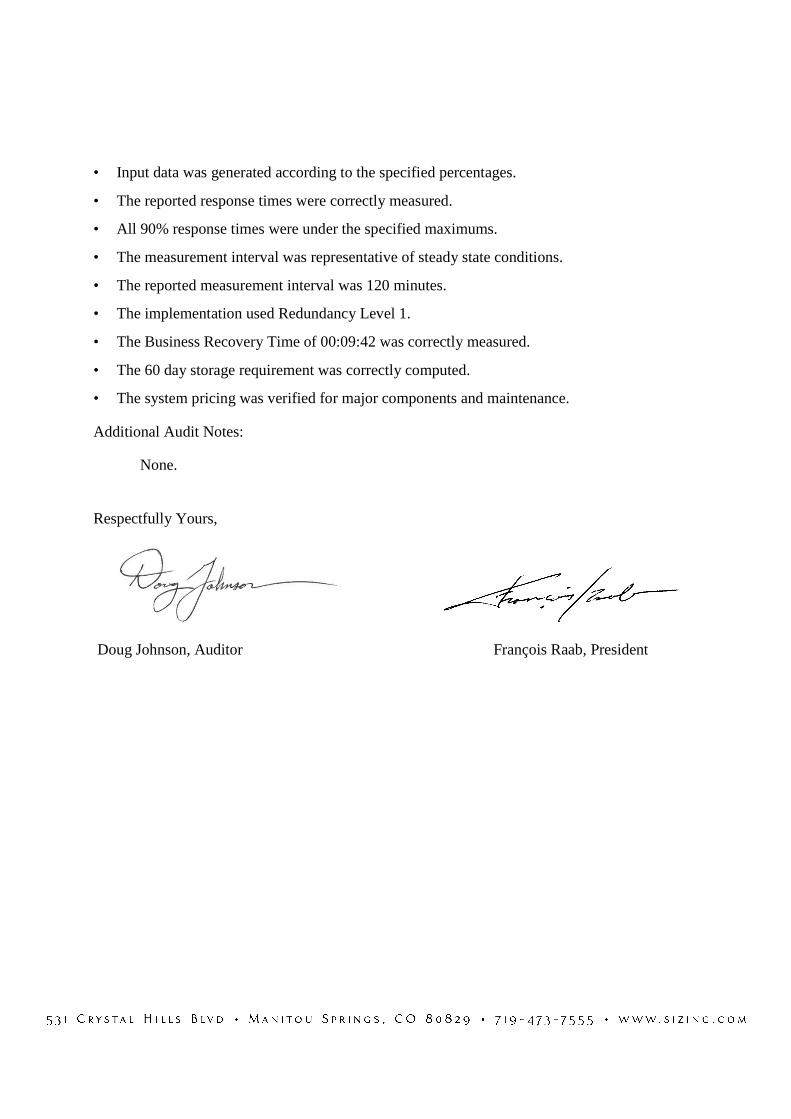
• Input data was generated according to the specified percentages.
• The reported response times were correctly measured.
• All 90% response times were under the specified maximums.
• The measurement interval was representative of steady state conditions.
• The reported measurement interval was 120 minutes.
• The implementation used Redundancy Level 1.
• The Business Recovery Time of 00:09:42 was correctly measured.
• The 60 day storage requirement was correctly computed.
• The system pricing was verified for major components and maintenance.
Additional Audit Notes:
None. Respectfully Yours,
Doug Johnson, Auditor François Raab, President
©IBM Corporation TPC-E Benchmark Full Disclosure Report – March 2012 34
Appendix A – Price Quotes
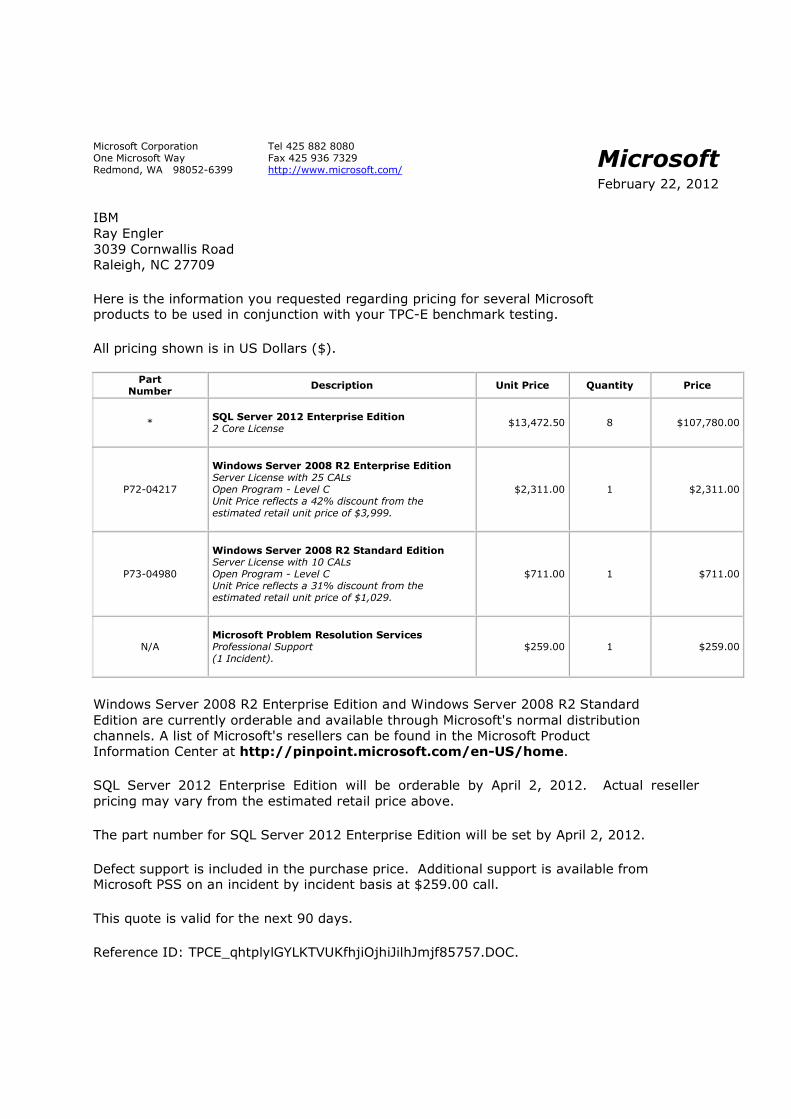
Microsoft Corporation One Microsoft Way Redmond, WA 98052-6399
Tel 425 882 8080 Fax 425 936 7329 http://www.microsoft.com/ Microsoft
February 22, 2012
IBM Ray Engler 3039 Cornwallis Road Raleigh, NC 27709
Here is the information you requested regarding pricing for several Microsoft products to be used in conjunction with your TPC-E benchmark testing.
All pricing shown is in US Dollars ($).
Part Number Description Unit Price Quantity Price
* SQL Server 2012 Enterprise Edition 2 Core License
$13,472.50 8 $107,780.00
P72-04217
Windows Server 2008 R2 Enterprise Edition Server License with 25 CALs Open Program - Level C Unit Price reflects a 42% discount from the estimated retail unit price of $3,999.
$2,311.00 1 $2,311.00
P73-04980
Windows Server 2008 R2 Standard Edition Server License with 10 CALs Open Program - Level C Unit Price reflects a 31% discount from the estimated retail unit price of $1,029.
$711.00 1 $711.00
N/A
Microsoft Problem Resolution Services Professional Support (1 Incident).
$259.00 1 $259.00
Windows Server 2008 R2 Enterprise Edition and Windows Server 2008 R2 Standard
Edition are currently orderable and available through Microsoft's normal distribution channels. A list of Microsoft's resellers can be found in the Microsoft Product Information Center at http://pinpoint.microsoft.com/en-US/home.
SQL Server 2012 Enterprise Edition will be orderable by April 2, 2012. Actual reseller
pricing may vary from the estimated retail price above.
The part number for SQL Server 2012 Enterprise Edition will be set by April 2, 2012.
Defect support is included in the purchase price. Additional support is available from Microsoft PSS on an incident by incident basis at $259.00 call.
This quote is valid for the next 90 days.
Reference ID: TPCE_qhtplylGYLKTVUKfhjiOjhiJilhJmjf85757.DOC.

Skip to: Content | Footer
Shopping Cart
Qty. Product Description Savings Total Price
1 ASUS VH197D Black 18.5" LED Backlight Widescreen LCD MonitorItem #: N82E16824236105Return Policy: Monitor Standard Return Policy
-$25.00 Instant
$119.99$94.99
1 Rosewill RCW-717 3ft. /Network Cable Cat 6 (Crossover) YellowItem #: N82E16812119153Return Policy: Standard Return Policy
$2.99
Subtotal: $97.98
Calculate Shipping
Zip Code: 27513
Shipping: $10.92
Redeem Newegg Gift Cards / Google Offer Code
Card Number: Security Code:
Apply Promo Code(s):Promo Code: $0.00
Grand Total: $108.90
Policy & Agreement | Privacy Policy © 2000-2012 Newegg Inc. All rights reserved.
Newegg.com - Once You Know, You Newegg http://secure.newegg.com/Shopping/ShoppingCartPrintVersion.aspx
1 of 1 2/28/2012 3:37 PM