
Toxicological in vitro evaluation of organic ... · How to move EFFECT BASED ANALYSIS in SCIENCE...
216
Toxicological in vitro evaluation of organic micropollutants before and after oxidative waste water treatment Dissertation zur Erlangung des akademischen Grades eines Doktors der Naturwissenschaften – Dr. rer. nat. – vorgelegt von M.Sc. Jessica Richard geboren in Wuppertal Institut für Hygiene und Arbeitsmedizin der Universität Duisburg-Essen und IWW Rheinisch-Westfälisches Institut für Wasserforschung 2012
Transcript of Toxicological in vitro evaluation of organic ... · How to move EFFECT BASED ANALYSIS in SCIENCE...
1
Toxicological in vitro evaluation of organic
micropollutants before and after oxidative
waste water treatment
Dissertation
zur Erlangung des akademischen Grades eines
Doktors der Naturwissenschaften
– Dr. rer. nat. –
vorgelegt von
M.Sc. Jessica Richard
geboren in Wuppertal
Institut für Hygiene und Arbeitsmedizin
der
Universität Duisburg-Essen
und
IWW Rheinisch-Westfälisches Institut für Wasserforschung
2012
2
Die vorliegende Arbeit wurde im Zeitraum von November 2008 bis September 2012
im Arbeitskreis von Prof. Dr. Elke Dopp am Institut für Hygiene und Arbeitsmedizin
der Universität Duisburg-Essen sowie am IWW Rheinisch-Westfälischen Institut für
Wasserforschung gGmbH durchgeführt.
Tag der Disputation:
Gutachter: Prof. Dr. Elke Dopp
Prof. Dr. Alfred V. Hirner
Vorsitzender: Prof. Dr. Eckhard Spohr
3
Diese Arbeit wurde im Rahmen des IGF-Vorhabens 15862 N der Forschungs-
vereinigung Verein zur Förderung der Energie- und Umwelttechnik e.V. (VEU) über
die AiF (Allianz Industrie Forschung) im Rahmen des Programms zur Förderung der
industriellen Gemeinschaftsforschung und –entwicklung (IGF) vom
Bundesministerium für Wirtschaft und Technologie gefördert.
Die Ergebnisse dieser Arbeit wurden bereits zu Teilen veröffentlicht:
„Peer-reviewed“ Publikationen: Janzen, N., E. Dopp, Hesse, J., Richard, J., Türk, J., Bester, K. (2011). "Transformation products and reaction kinetics of fragrances in advanced wastewater treatment with ozone." Chemosphere 85(9): 1481-1486. Chen, X., Richard, J., Liu, Z., Dopp, E., Tuerk, J., Bester, K. (2012). "Ozonation products of triclosan in advanced wastewater treatment." Water Research 46(7): 2247-2256. Richard, J., Börgers, A., vom Eyser, C., Bester, K., Türk, J., Dopp, E. (2012). "Toxicity of the micropollutants bisphenol A, ciprofloxacin, metoprolol and sulfamethoxazole before and after oxidative waste water treatment." Submitted to International Journal of Hygiene and Environmental Health
Sonstige Publikationen: Tuerk, J., Richard, J., vom Eyser, C., Boergers, A., Bester, K., Dopp, E. (2011). "Chemical and toxicological evaluation of by-products during oxidative treatment of waste water treatment plant effluents." Ozone-Science & Engineering Conference Proceedings. Geneva (CH); 28. – 30.04.2010 Türk, J., Börgers, A., vom Eyser, C., Richard, J., Dopp, E., Bester, K. (2012). "Untersuchungen zur Bewertung und Vermeidung von toxischen Oxidationsnebenprodukten bei der oxidativen Abwasserbehandlung von Fluorquinolonen". Mitteilungen der Fachgruppe Umweltchemie und Ökotoxikologie - Gesellschaft Deutscher Chemiker 18. Jahrgang (2/12): 28-31
4
Weiterhin sind die Ergebnisse des Projektes auf folgenden Tagungen national und
international vorgestellt worden:
Vortrag:
Dopp, E., Richard, J., (2012) "In vitro assessment of organic micropollutants in water systems“. First joint German-Dutch Meeting of The Societies of Toxicology; October 4th – 5th; Düsseldorf, Germany
Richard, J., (2012) "Toxikologische Beurteilung von Spurenstoffen im Kläranlagenablauf vor und nach der oxidativen Abwasserbehandlung“. Treffen der IAWR Biologen; April 4th; Düsseldorf, Germany
Richard, J., Börgers, A., Bester, K., Türk, J., Dopp, E. (2012) "Chemical and toxicological analyses of micropollutants in wastewater treatment plant effluents before and after oxidative treatment”. 243rd ACS National Meeting; March 25th – 29th; San Diego, USA
Richard, J., Börgers, A., vom Eyser, C., Chen, X., Janzen, N., Bester, K., Türk, J., Dopp, E. (2011) "Toxicological evaluation of micropollutants in waste water treatment plant effluents before and after oxidative treatment”. 3rd Seminar of European PhD Students on Water & Health; June 27th – 29th; Cannes, France
Richard, J., Börgers, A., vom Eyser, C., Chen, X., Bester, K., Türk, K., Dopp, E. (2011) "Toxikologische Beurteilung von Spurenstoffen im Abwasser vor und nach der oxidativen Abwasserbehandlung“. Jahrestagung der Wasserchemischen Gesellschaft; May 30th – June 1st; Norderney, Germany
Richard, J., Börgers, A., vom Eyser, C., Bester, K., Türk, K., Dopp, E. (2010) "Assessment of genotoxicity and estrogen-like activity in ozone treated waste water”. 5th BioDetectors Workshop. How to move EFFECT BASED ANALYSIS in SCIENCE and POLICY? BioDetection Systems; October 14th – 15th; Amsterdam, Netherlands
Richard, J., Börgers, A., Türk, J., Bester, K., Dopp, E. (2010) "Genotoxic properties of water contaminants before and after oxidative waste water treatment”. Genotoxicity in aquatic systems: Causes, effects and future needs. 3rd International Symposium; September 22nd – 24th; Freiburg im Breisgau, Germany
Türk, J., Börgers, A., Richard, J., Dopp, E., Wolff, M., Janzen, N., Tavian, M., Chen, X., Bester, K. (2010) "Chemical and toxicological identification of by-products during oxidative waste water treatment”. Ozone & Related Oxidants: Solutions for Emerging Pollutants of Concern to the Water and the Environment, International Conference; April 28th – 30th; Geneva, Switzerland
5
Poster:
Richard, J., Wutschke, D., vom Eyser, C., Türk, J., Wilhelm, M., Dopp, E. (2012) "Toxikologische Bewertung von organischen Spurenstoffen im Abwasser vor und nach der oxidativen Behandlung“. DWA-Workshop „Relevanz von Transformationsprodukten im urbanen Wasserkreislauf“; April 23rd – 24th; Koblenz, Germany
Richard, J., Bester, K., Türk, J., Dopp, E. (2011) “Genotoxicity of drug residues and biocides in waste water”. Emerging Risks from Ballast Water Treatment; October 19th – 21st;Berlin, Germany
Richard, J., Börgers, A., Chen, X., Tavian, M., Janzen, N., Türk, J., bester, K., Dopp, E. (2010) "Identification of oxidation by-products during oxidative waste water treatment. Part 2: Toxicological in vitro analyses“. SETAC; May 23rd – 27th; Sevilla, Spain
Börgers, A., Richard, J., Dopp, E., Tavian, M., Bester, K., Türk, J. (2010) "Identification of oxidation by-products during oxidative waste water treatment. Part 1: Oxidative processes and chemical analysis”. SETAC; May 23rd – 27th; Sevilla, Spain
Chen, X., Liu, Y., Richard, J., Tavian, M., Wolff, M., Nielsen, JL., Türk, J., Dopp, E., Bester, K. (2010) "Oxidation of Triclosan by ozone and formation of toxic chlorophenols”. SETAC; May 23rd – 27th; Sevilla, Spain
Wolff, M., Janzen, N., Tavian, M., Chen, X., Richard, J., Dopp, E., Türk, J., Bester, K. (2010) "Identification and toxicity evaluation of oxidation by-products of the biocide Terbutryn oxidized with ozone”. SETAC; May 23rd – 27th; Sevilla, Spain
Tavian, M., Janzen, N., Türk, J., Richard, J., Dopp, E., Chen, X., Bester, K. (2010) "Identification of oxidation by-products in poststream ozonisation in waste water treatment plants”. Analytica; March 23rd – 26th; München, Germany
Türk, J., Börgers, A., Richard, J., Dopp, E., Janzen, N., Tavian, M., Wolff, M., Chen, X., Bester, K. (2010) "Chemische und toxikologische Evaluierung von Transformationsprodukten bei der oxidativen Abwasserbehandlung“. Jahrestagung der Wasserchemischen Gesellschaft; May 10th – 12th; Bayreuth, Germany
J. Richard, M. Tavian, N. Janzen, M. Gerhards , X. Chen, J. Tuerk, K. Bester, E. Dopp (2009) "Identification of oxidation by-products in post stream ozonisation in waste water treatment plants Part B: Toxicity directed evaluation-identification“. Jahrestagung der GDCh-Fachgruppe Umweltchemie und Ökotoxikologie; September 23rd – 25th; Trier, Germany
Tavian, M., Janzen, N., Türk, J., Cyris, M., Richard, J., Dopp, E., Chen, X., Bester, K. (2009) " Identification of oxidation by-products in poststream ozonisation in waste water treatment plants Part A: Chemical Identification”. Jahrestagung der GDCH-Fachgruppe Umweltchemie und Ökötoxikologie; September 23rd – 25th; Trier, Germany
6
Acknowledgements
At this point I would like to thank all those people who participated in the successful
completion of my PhD thesis:
Prof. Dr. Elke Dopp for the opportunity to pursue a PhD and for being a
supportive mentor and for her encouragement throughout this time.
Prof. Dr. Alfred V. Hirner for his support as a reviewer.
Melanie Gerhards and Ricarda Zdrenka for being not only great colleagues
but also friends and their helpful discussions and support during this time.
Dr. Jochen Türk, Andrea Börgers and Claudia vom Eyser for preparing and
providing the water samples, performing the oxidation experiments and also
for their helpful discussions and support and for making it a successful
project.
Dr. Kai Bester as well as his working group for also providing water samples
and performing the oxidative treatment.
My colleagues from the Institute of Hygiene and Occupational Medicine at the
University Hospital Essen especially Gabriele Zimmer and Ute Zimmermann.
All my colleagues at the IWW for the opportunity to finish my thesis, for their
suppor,t and for making it a great place to work.
Dr. Peter Behnisch for his advice and helpful discussions as well his
colleagues from BDS for their support and troubleshooting with the ER Calux.
Dr. Tamara Grummt from the Umweltbundesamt for her helpful discussions
and suggestions regarding this project.
I am also grateful to my family and friends for their support, encouragement and
patience throughout this time.
7
Table of Contents
Acknowledgements ----------------------------------------------------------------------------------- 6
I List of Figures --------------------------------------------------------------------------------------- 13
II List of Tables --------------------------------------------------------------------------------------- 19
III List of Abbreviations ---------------------------------------------------------------------------- 21
1. Summary ----------------------------------------------------------------------------------------- 27
2. Introduction -------------------------------------------------------------------------------------- 29
2.1. Micropollutants in waste water treatment plant effluents and surface
water ----------------------------------------------------------------------------------------------- 30
2.1.1. Guidelines for water quality control ------------------------------------------------ 30
2.1.2. Emission of micropollutants --------------------------------------------------------- 31
2.1.3. Substances detected in waste water treatment plant effluents ------------ 32
2.1.4. Waste water quality control ---------------------------------------------------------- 32
2.1.5. Common Waste water treatment --------------------------------------------------- 34
2.1.6. Advanced waste water treatment -------------------------------------------------- 36
2.1.6.1. Filtration----------------------------------------------------------------------------- 36
2.1.6.2. Sorption: Activated Carbon ---------------------------------------------------- 38
2.1.6.3. Advanced Oxidation Processes (AOP) ------------------------------------- 39
2.2. Toxicological testing for the determination of biological effects of
micropollutants -------------------------------------------------------------------------------- 44
2.2.1. Cytotoxicity ------------------------------------------------------------------------------- 52
2.2.2. Genotoxicity------------------------------------------------------------------------------ 52
2.2.3. Mutagenicity ----------------------------------------------------------------------------- 54
2.2.4. Estrogenicity ----------------------------------------------------------------------------- 55
8
3. Aims of the study ------------------------------------------------------------------------------ 57
4. Material and Methods ------------------------------------------------------------------------ 58
4.1. Solutions ------------------------------------------------------------------------------------------ 58
4.1.1. Cell Culture ------------------------------------------------------------------------------ 58
4.1.1.1. CHO cells -------------------------------------------------------------------------- 58
4.1.1.2. T47D cells -------------------------------------------------------------------------- 58
4.1.2. PAN I Multitox Test -------------------------------------------------------------------- 59
4.1.3. MTT Test --------------------------------------------------------------------------------- 59
4.1.4. Alkaline Comet Assay ----------------------------------------------------------------- 60
4.1.5. Ames Test -------------------------------------------------------------------------------- 61
4.1.6. ER Calux --------------------------------------------------------------------------------- 61
4.2. Cell Culture methods ------------------------------------------------------------------------ 62
4.2.1. CHO cells --------------------------------------------------------------------------------- 62
4.2.1.1. Thawing ----------------------------------------------------------------------------- 62
4.2.1.2. Subculturing ----------------------------------------------------------------------- 62
4.2.1.3. Freezing ---------------------------------------------------------------------------- 63
4.2.2. T47D cells -------------------------------------------------------------------------------- 63
4.2.2.1. Thawing ----------------------------------------------------------------------------- 64
4.2.2.2. Subculturing ----------------------------------------------------------------------- 64
4.2.2.3. Freezing ---------------------------------------------------------------------------- 64
4.3. Toxicological methods --------------------------------------------------------------------- 65
4.3.1. Cytotoxicity ------------------------------------------------------------------------------- 65
4.3.1.1. PAN I: LDHe – XTT – NR – SRB -------------------------------------------- 65
4.3.1.2. MTT Test --------------------------------------------------------------------------- 71
4.3.2. Degree of Cytotoxicity ----------------------------------------------------------------- 73
4.3.3. Genotoxicity------------------------------------------------------------------------------ 74
4.3.3.1. Alkaline Comet Assay ----------------------------------------------------------- 74
4.3.4. Mutagenicity ----------------------------------------------------------------------------- 78
4.3.4.1. Ames Test -------------------------------------------------------------------------- 78
9
4.3.5. Estrogenicity ----------------------------------------------------------------------------- 81
4.3.5.1. ER Calux --------------------------------------------------------------------------- 81
4.4. Oxidation of water samples -------------------------------------------------------------- 84
4.4.1. Ozonation -------------------------------------------------------------------------------- 86
4.4.1.1. Laboratory scale ozonation ---------------------------------------------------- 86
4.4.1.2. Pilot scale ozonation (IUTA e.V.) -------------------------------------------- 87
4.4.2. UV/H2O2 oxidation --------------------------------------------------------------------- 87
4.4.2.1. Laboratory scale UV oxidation with and without H2O2 (IUTA e.V.)-- 87
4.4.2.2. UV/H2O2 oxidation of TPP, TBEP and TCPP (UDE) -------------------- 87
4.4.2.3. Pilot scale UV oxidation with and without H2O2 (IUTA e.V.) ---------- 88
4.4.2.4. UV and UV/H2O2 oxidation using the flow through system
(IUTA e.V.) ------------------------------------------------------------------------- 88
4.4.2.5. UV and UV/H2O2 oxidation at the flow through system (Waste
water treatment plant) ----------------------------------------------------------- 88
4.5. Extraction methods -------------------------------------------------------------------------- 89
4.5.1. Solid Phase Extraction (SPE) ------------------------------------------------------- 89
4.5.2. Liquid-liquid-extraction (LLE) -------------------------------------------------------- 89
4.6. Analytical Chemistry ------------------------------------------------------------------------ 90
4.6.1. HPLC-MS/MS --------------------------------------------------------------------------- 90
4.6.2. GC-MS ------------------------------------------------------------------------------------ 93
4.7. Peroxide testing ------------------------------------------------------------------------------- 94
4.8. Waste water treatment plant effluent used for testing ------------------------ 95
4.9. Sample preparation before toxicological testing ------------------------------- 95

10
5. Results -------------------------------------------------------------------------------------------- 96
5.1. Adaptation of toxicological methods------------------------------------------------- 96
5.1.1. MTT Test, PAN I and Alkaline Comet Assay ----------------------------------- 96
5.1.2. ER Calux --------------------------------------------------------------------------------- 97
5.1.3. Ames Test -------------------------------------------------------------------------------- 98
5.1.4. H2O2 --------------------------------------------------------------------------------------- 98
5.1.5. Contaminations ----------------------------------------------------------------------- 100
5.2. Matrix controls ------------------------------------------------------------------------------- 101
5.2.1. HPLC-water ---------------------------------------------------------------------------- 101
5.2.2. Waste water treatment plant effluent-------------------------------------------- 103
5.3. ß-Blocker --------------------------------------------------------------------------------------- 105
5.3.1. Atenolol --------------------------------------------------------------------------------- 105
5.3.2. Metoprolol ------------------------------------------------------------------------------ 106
5.4. Estrogenic substances ------------------------------------------------------------------- 108
5.4.1. Ethinylestradiol ------------------------------------------------------------------------ 109
5.4.2. Bisphenol A ---------------------------------------------------------------------------- 110
5.5. Antibiotics -------------------------------------------------------------------------------------- 112
5.5.1. Sulfamethoxazole -------------------------------------------------------------------- 113
5.5.2. Ciprofloxacin --------------------------------------------------------------------------- 117
5.5.3. Ofloxacin -------------------------------------------------------------------------------- 122
5.5.4. Triclosan and 2,4-Dichlorophenol ------------------------------------------------ 124
5.6. Biocides ----------------------------------------------------------------------------------------- 126
5.6.1. Irgarol 1051 ---------------------------------------------------------------------------- 126
5.6.2. Terbutryn ------------------------------------------------------------------------------- 127
11
5.7. Musk fragrances ----------------------------------------------------------------------------- 128
5.7.1. AHTN ------------------------------------------------------------------------------------ 128
5.7.2. HHCB ------------------------------------------------------------------------------------ 130
5.8. Organophosphates ------------------------------------------------------------------------- 132
5.8.1. Tris(2-chloro-1-methylethyl) phosphate (TCPP) ----------------------------- 132
5.8.2. Tris(2-chloroethyl)phosphate (TCEP) ------------------------------------------- 133
5.8.3. Triphenyl phosphate (TPP) -------------------------------------------------------- 134
6. Discussion ------------------------------------------------------------------------------------- 136
6.1. Endocrine disruption ---------------------------------------------------------------------- 137
6.2. Antibacterial activity during advanced oxidation processes ------------ 139
6.3. Mixture effects ------------------------------------------------------------------------------- 141
6.4. Use of toxicological in vitro methods for water quality control -------- 143
6.5. Applicability of ozonation and UV/H2O2 oxidation during waste
water treatment --------------------------------------------------------------------------- 145
6.6. Concentration of water samples ----------------------------------------------------- 147
6.7. ß-blocker ---------------------------------------------------------------------------------------- 148
6.8. Estrogenic substances ------------------------------------------------------------------- 150
6.8.1. Ethinylestradiol ------------------------------------------------------------------------ 150
6.8.2. Bisphenol A ---------------------------------------------------------------------------- 151
12
6.9. Antibiotics -------------------------------------------------------------------------------------- 153
6.9.1. Sulfamethoxazole -------------------------------------------------------------------- 153
6.9.2. Fluoroquinolone antibiotics -------------------------------------------------------- 154
6.9.3. Triclosan and 2.4-Dichlorophenol ------------------------------------------------ 157
6.10. Biocides ----------------------------------------------------------------------------------------- 159
6.10.1. Irgarol 1051 ------------------------------------------------------------------------- 159
6.10.2. Terbutryn ---------------------------------------------------------------------------- 161
6.11. Musk fragrances ----------------------------------------------------------------------------- 163
6.11.1. AHTN and HHCB ------------------------------------------------------------------ 163
6.12. Organophosphates: TCEP, TCPP and TPP -------------------------------------- 165
6.13. Conclusions and future directions -------------------------------------------------- 168
7. References ------------------------------------------------------------------------------------- 169
8. Annex -------------------------------------------------------------------------------------------- 193
8.1. List of Chemicals ---------------------------------------------------------------------------- 193
8.2. List of Materials ------------------------------------------------------------------------------ 196
8.3. List of Equipment --------------------------------------------------------------------------- 197
8.4. Curriculum vitae ----------------------------------------------------------------------------- 199
8.5. Raw data ---------------------------------------------------------------------------------------- 205
8.6. Erklärung --------------------------------------------------------------------------------------- 216
13
I List of Figures
Figure 1: Routes of micropollutant contamination of surface waters ........................ 31
Figure 2: Schematic of a waste water treatment plant. AOP = Advanced Oxidation Processes .................................................................................................. 35
Figure 3: Membrane separation processes overview [42]. ....................................... 36
Figure 4: Suitability of water treatment technologies according to the chemical oxygen demand (COD in g/L) [51]. ............................................................ 40
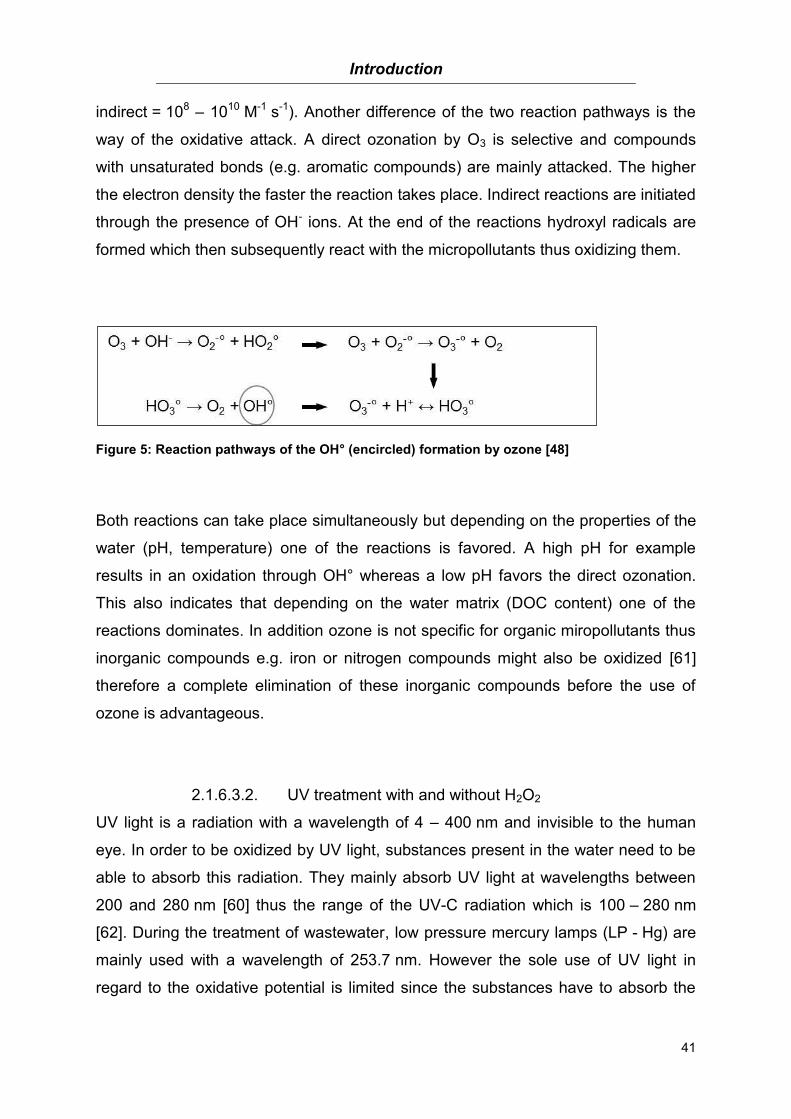
Figure 5: Reaction pathways of the OH° (encircled) formation by ozone [48] .......... 41
Figure 6: Oxidation and reaction pathways of the UV treatment without (a) and with (b) H2O2 ..................................................................................................... 42
Figure 7: Fenton reaction ......................................................................................... 43
Figure 8: Photo-Fenton reaction ............................................................................... 43
Figure 9: Reaction pathway of the TiO2 photocatalysis ............................................ 44
Figure 10: Testing strategy proposed by the Committee on Toxicity Testing and Assessment of Environmental Agents [74] .............................................. 46
Figure 11: Bioanalytical tools for the assessment of human health risks adapted from Escher et al. 2011 [26] .................................................................... 47
Figure 12: Level of toxicological effect and time until manifestation of effects in regard to the method, adapted from Kase et al. 2009 [71]. ..................... 48
Figure 13: Schematic of toxicological and chemical (grey box) testing as part of this project. Chemical analyses have been performed by the working groups of the IUTA e.V. or the University of Duisburg-Essen. ................. 51
Figure 14: CHO cells; passage 30 ........................................................................... 62
Figure 15: T47D cells; passage 22 ........................................................................... 64

14
Figure 16: Chemical equation of the XTT cleavage to XTT formazan by succinate dehydrogenases ...................................................................................... 66
Figure 17: Structural formula of neutral red .............................................................. 67
Figure 18: Structural formula of Sulforhodamine B .................................................. 67
Figure 19: Layout of the 96 well plate seeded with CHO cells (20000 cells/0.2 mL). B = 200 μL blank control: culture medium + solvent without cells; GC = 200 μL cell growth control: culture medium + cells; SC = 200 μL solvent control: culture medium + cells + solvent; TL = 200 μL positive control: culture medium + cells + 1 % Triton® X-100 ........................................... 68
Figure 20: Equation used to calculate the extracellular NADH amount .................... 70
Figure 21: Equation used to calculate the percent of viable cells ............................. 70
Figure 22: Chemical equation of the MTT cleavage to MTT formazan ..................... 72
Figure 23: Comet Assay analysis of undamaged (a) and damaged (b) CHO cells stained with SYBR Green® and analyzed using the Comet Assay 4 Software. ................................................................................................. 75
Figure 24: a) Gelbond film containing eight microgels. b) Scoring pattern of a single microgel. pos = positive control; neg = negative control; 1 – 6 = gels containing cells exposed to the samples. ................................................ 76
Figure 25: 384-Well plate after 48 h of exposure. The medium of the positive wells containing bacteria with reversed mutations has changed to yellow and the medium of the wells without mutated bacteria is purple. ................... 80
Figure 26: ER Calux exposure plate. E2 = 17ß-ethinylestradiol; E2-0 to E2-30 = 17ß-ethinylestradiol concentration [pM/well]; DMSO = wells containing 1 % DMSO; medium = wells containing medium only; 1 – 10 = wells containing the cells exposed to different samples. ........... 82
Figure 27: Peroxide Test-strips (Quantofix®). Left: negative for peroxides; right: peroxides detected .................................................................................. 94
Figure 28: Luminescence measurement of a Luciferase standard using a white and a black 96-well plate. ........................................................................ 98
15
Figure 29: a) Cytotoxic effects of UV/H2O2 treated samples. b) DNA damaging effects of UV/H2O2 treated samples. The addition of catalase resulted in the elimination of toxic effects. ............................................................. 99
Figure 30: Blood agar plates with bacterial growth after plating an unfiltered WWTP effluent sample (a) and a plate without colonies after plating a filtered sample (b) incubated for 24 h at 37 °C. ..................................... 100
Figure 31: No cytotoxicity (a) and genotoxicity (b) of HPLC-water before and after ozonation (2 mg O3/L) or UV/H2O2 treatment. ....................................... 101
Figure 32: No genotoxicity of HPLC water extracts (C18 and Strata X) before and after 60 mintes of ozonation .................................................................. 102
Figure 33: Waste water treatment plant effluent before and after oxidative treatment. No cytotoxic (a) or genotoxic (b) effects. .............................. 103
Figure 34: No genotoxicity of WWTP extracts (C18 and Strata X) of WWTP effluent before and after ozonation ........................................................ 104
Figure 35: No cytotoxicity (a) and genotoxicity (b) of 0.2 mg/L Atenolol in HPLC-water before and after ozonation (2 mg O3/L). ...................................... 106
Figure 36: a) No cytotoxicity or genotoxicity (b) of HPLC-water containing 1.4 mg/L Metoprolol before and after ozonation or 0.1 mg/L Metoprolol before and after UV/H2O2 treatment for 60 minutes. ............................. 107
Figure 37: a) No cytotoxicity or genotoxicity (b) of WWTP effluent with 1.4 mg/L Metoprolol before and after ozonation or of 0.1 mg/L Metoprolol after UV/H2O2 treatment for 60 minutes. ........................................................ 107
Figure 38: No cytotoxicity of 1.5 mg/L Ethinylestradiol before and after UV/H2O2 treatment or ozonation (1-10 mg/L O3). ................................................. 109
Figure 39: a) No cytotoxic effects of HPLC-water containing 1.4 mg/L Bisphenol A after ozonation, but cytotoxic effects after UV/H2O2 treatment. b) No genotoxic effects of tested samples. No cytotoxic (c) or genotoxic (d) effects of WWTP effluent containing Bisphenol A before and after ozonation or UV/H2O2 treatment. cytotoxic effects ;# = not tested ..... 111

16
Figure 40: Sulfamethoxazole (0.1 mg/L) in HPLC-water before and after UV/H2O2 treatment. No cytotoxicity (a) or genotoxicity (b) detected. .................... 114
Figure 41: Sulfamethoxazole (1.4 mg/L) in HPLC-water before and after ozonation. No cytotoxicity (a) or genotoxicity (b) detected. ..................................... 115
Figure 42: No cytotoxicity (a) and genotoxicity (b) of 1.4 mg/L Sulfamethoxazole in WWTP effluent before (0 min) and after (60 min) ozonation (5 mg/L O3). ........................................................................................... 116
Figure 43: No cytotoxicity (a) and genotoxicity (b) of 0.1 mg/L Sulfamethoxazole in WWTP effluent before and after UV/H2O2 treatment. ............................ 117
Figure 44: a) Cytotoxic effects of 1.7 mg/L Ciprofloxacin in HPLC-water after 60 min UV/H2O2 treatment. b) No genotoxic effects before and after a maximum of 30 min UV/H2O2 oxidation. c) No cytotoxic or (d) genotoxic effects of 1.4 mg/L of Ciprofloxacin in HPLC-water before and after ozonation. Cytotoxic; n.t. = not tested ............................................... 118
Figure 45: WWTP effluent containing 1.4 mg/L Ciprofloxacin show no cytotoxic (a) and genotoxic (b) effects after ozonation (5 mg/L). .......................... 119
Figure 46: a) No cytotoxic and b) genotoxic effects of untreated and UV/H2O2 (Hg-LP, 15 W; 1 g/L H2O2) treated WWTP effluent with 0.1 mg/L Ciprofloxacin. ......................................................................................... 120
Figure 47: Cytotoxicity (a) and genotoxicity (b) testing of HPLC-water containing 18 mg/L Ofloxacin before and after ozonation (10 mg/L O3). No cytotoxicity (c) or genotoxicity (d) of 18 mg/L Ofloxacin in HPLC water before and after UV/H2O2 treatment. ..................................................... 122
Figure 48: No cytotoxicity (a) or genotoxicity (b) of 18 mg/L Ofloxacin in WWTP effluent before (Matrix control) and after 60 min of ozonation (10 mg/L O3) or UV/H2O2 treatment. ...................................................... 123
Figure 49: HPLC-MS/MS Q1-Scan chromatogram of a sample with different triclosan:ozone ratios of 1:1, 1:3 and 1:5 [173]. ..................................... 124
Figure 50: a) No cytotoxicity of 0 – 100 µg/L Triclosan or 2,4-Dichlorophenol. b) Genotoxic effects of triclosan but not 2,4-Dichlorophenol at higher concentrations. ...................................................................................... 125

17
Figure 51: No cytotoxicity (a) or genotoxicity (b) of 0.75 mg/L Irgarol 1051 after ozonation. .............................................................................................. 126
Figure 52: a) No cytotoxic effects of 490 µg/L Terbutryn in HPLC water before and after ozonation. b) Genotoxic effects of Terbutryn before and after ozonation (0 – 195 µg/L O3) but no genotoxicity using 800 µg/L O3. ..... 127
Figure 53: UV/H2O2 oxidation of 0.1 mg/L AHTN in HPLC water. a) Weak cytotoxic effects after 20 min UV treatment. B) No genotoxic effects before and after UV treatment. cytotoxic effects ................................. 129
Figure 54: Ozonation (10 mg/L O3) of 0.1 mg/L AHTN in HPLC-water. No cytotoxic (a) and genotoxic effects (b). .................................................. 129
Figure 55: No cytotoxicity (a) and genotoxicity (b) of HHCB and its oxidation by-products HHCB Lactone at concentrations between 0.05 and 50 µg/L. ................................................................................................. 130
Figure 56: Cytotoxicity (a) and genotoxicity (b) of 0.1 mg/L HHCB in HPLC-water before (0 min) and after 30 min or 60 min of UV/H2O2 treatment (15 W).
cytotoxic effects; n.t. = not tested ....................................................... 131
Figure 57: a) Relative light units (RLU) of the 17ß-Estradiol standard series. b) Relative light units of 0.5 – 50 µg/L HHCB. ........................................... 132
Figure 58: a) Cytotoxicity and b) genotoxicity of 0.1 mg/L TCPP before (0 min) and after (60 min) ozonation or UV/H2O2 treatment. cytotoxic effects; n.t. = not tested...................................................................................... 133
Figure 59: a) No cytotoxicity of untreated and ozonated TCEP in HPLC-water (0.1 mg/L), but cytotoxic effects after 60 min UV/H2O2 treatment. b) No genotoxic effects of non cytotoxic TCEP samples. cytotoxic effects; n.t.=not tested ....................................................................................... 134
Figure 60: a) No cytotoxicity of 0.1 mg/L TPP in HPLC-water before and after ozonation or UV/H2O2 treatment. b) Genotoxicity only before oxidative treatment (0 min) ................................................................................... 135
Figure 61: In vitro test methods for the determination of endocrine effects adapted from Kase et al. 2009 [71] ..................................................................... 139
18
Figure 62: Schematic overview of the EDA (effect directed analysis) of mixtures published by Werner Brack [234]. ......................................................... 144
Figure 63: Adverse Outcome Pathway proposed by the US EPA for risk assessment based on in vitro and in vivo methods [236]. ..................... 144
19
II List of Tables
Table 1: Requirements of the waste water treatment plant effluent at the discharge point at 12 °C according to the German “Abwasserverordnung” (concentrations in mg/L) [40]. .................................................................... 33
Table 2: Definition of the Gesundheitliche Orientierungswerte (health assessment values) adapted from the German Umweltbundesamt [73] ....................... 45
Table 3: Summary of toxicological test systems required according to correspon- ding guidelines .......................................................................................... 49
Table 4: Used test systems ...................................................................................... 50
Table 5: Cytotoxicity tests required according to DIN EN ISO 10993-5:2009-10 ..... 52
Table 6: Selection of in vitro tests for the detection of genotoxic effects .................. 53
Table 7: Selection of in vitro tests for the detection of mutagenic effects ................. 54
Table 8: Selection of in vitro tests for the determination of estrogenic effects .......... 55
Table 9: Cell culture solutions for CHO cells ............................................................ 58
Table 10: Cell culture solution for T47D cells ........................................................... 58
Table 11: Solutions for the PAN I Multitox test ......................................................... 59
Table 12: Solutions for the MTT test ........................................................................ 59
Table 13: Solutions for the Alkaline Comet Assay .................................................... 60
Table 14: Solutions for the Ames Test ..................................................................... 61
Table 15: Solutions for the ER Calux ....................................................................... 61
Table 16: Steps of calculating the viability of the LDHe test ..................................... 71
20
Table 17: Degree of cytotoxicity ............................................................................... 73
Table 18: Significance of DNA damage according to the Mann Whitney Test ......... 77
Table 19: Scheme of pipetting for exposure ............................................................. 79
Table 20: Ames MPF® 98/100 quality standards ..................................................... 80
Table 21: ER Calux quality standards ...................................................................... 83
Table 22: Chemicals and investigated substances used for oxidation experiments . 84
Table 23: Systems used for oxidation experiments of the tested samples, and their final concentration during toxicological testing. IUTA = Institut für Energie- und Umwelttechnik e.V.; UDE = Institute of Environmental Chemistry, University Duisburg-Essen .................................................... 85
Table 24: Mass changes of the analytes during HPLC-MS/MS ................................ 91
Table 25: Measurement settings for pharmaceutical quantification using the API 3000 system ............................................................................................ 92
Table 26: Mass transfer of the analytes during GC-MS measurements ................... 94
Table 27: Toxic effects of different amounts of water in exposure medium .............. 97
Table 28: Estrogenicity of 1.5 mg/L Ethinylestradiol dissolved in HPLC-water before and after UV treatment and ozonation. ....................................... 110
Table 29: EEQ values [pM/100 µL] of 0.1 mg/l Bisphenol A in HPLC-water .......... 112
Table 30: Ames test results of 1.4 mg/L Ciprofloxacin in HPLC-water before and after UV/H2O2 treatment showing the average number of positive wells. ..................................................................................................... 121
Table 31: Possible mixture effects in regard to biological effects ........................... 142
Table 32: Summary of EC50 or LC50 values of Irgarol 1051 and M1 found in the literature ................................................................................................ 161
21
III List of Abbreviations * significant ** very significant *** highly significant °C degree Celsius 2-AA 2-aminoanthracene 2-NF 2-nitrofluorene 3R Replacement, Refinement, Reduction 4-NQO 4-Nitroquinoline 1-oxide A. salina Artemia salina ACN Acetonitrile AHTN 1-(3,5,5,6,8,8-hexamethyl-6,7-dihydronaphthalen-2-yl)ethanone AIF Allianz Industrie Forschung AOP Advanced Oxidation Process AOX Adsorbable organic halogen compounds ATP Adenosine triphosphate A-YES Yeast estrogen screen using the yeast Arxula adeninivorans B Blank control BDS BioDetection Systems BHK-21 Syrian hamster kidney fibroblasts BKH BKH Consulting Engineers BOD Biological Oxygen Demand BOD5 BOD of five days c concentration C4H2Mg5O14 Magnesium hydroxide carbonate C. dubia Ceriodaphnia dubia CH Switzerland CHO-9 Chinese Hamster Ovary cm centimeter(s) CoRAP Community Rolling Action Plan CO2 Carbon dioxide COD Chemical Oxygen Demand D Germany d day(s) D. magna Daphnia magna D. duplex Daphnia duplex Da Dalton DIN Deutsches Institut für Normung (German Institute for
Standardization) DDD Defined Daily Dose DMEM F12 Dulbecco’s Modified Eagles Medium DMSO Dimethyl sulfoxide DNA Deoxyribonucleic acid DOC Dissolved Organic Carbon D. rerio Danio rerio DTT Dithiothreitol e- electron
22
List of Abbreviations
E2 17ß-Estradiol Eawag Eidgenössische Anstalt für Wasserversorgung,
Abwasserreinigung und Gewässerschutz (Swiss Federal Institute of Aquatic Science and Technology)
EC European Commission EC50 half maximal effective concentration ECHA European Chemicals Agency EDA Effect Directed Analysis EDC Endocrine Disrupting Compound EDTA Ethylenediaminetetraacetic acid EDTA Endocrine Disruptor Testing ans Assessment EE2 Ethinylestradiol EEQ Estradiol Equivalents EGTA ethylene glycol tetraacetic acid ELRA Enzyme linked receptor assay EN European Norm ENU N-ethyl-N-nitrosourea EPA United States Environmental Protection Agency EQS Environmental Quality Standard ERE Estrogen Responsive Element ER Calux Estrogen Receptor - Chemical Activated Luciferase gene
expression ESI Electron Spray Ionization EU European Union eV electron-volt e.V. eingetragener Verein FCS Fetal Calf Serum FDA Food & Drug Administration Fe(II) Iron(II)-oxide Fe2+ divalent iron Fe3+ trivalent iron g gram G-6-P Glucose 6-phosphate - GAC Granular Activated Carbon GC Growth control GC-MS Gas chromatography-mass spectroscopy GOW Gesundheitlicher Orientierungswert (health assessment value) H+ Ptoton h+ (electron) hole h hour(s) H. azteka Hyalella azteca H2O2 Hydrogen peroxide HAM’s HAM’s F12 Nutrient Mixture HCl Hydrogen chloride HClO Hypochlorite HCOOH Formic acid H2O Water HeLa human cervical cancer cells
23
List of Abrreviations
HeLa-9903 HeLA cells transfected with an estrogen receptor and a luciferase gene
HepG2 human hepatocellular carcinoma cells Hg-Lp UV lamp Mercury-low pressure UV lamp HHCB 4,6,6,7,8,8-hexamethyl-1,3,4,7-tetrahydrocyclo-
penta[g]isochromene HO2°
- Hydroperoxy radical HO3°
- Hydrogenozonide radical HPLC High performance liquid chromatography HPLC-MS/MS High performance liquid chromatography coupled to tandem
mass spectrometry HPRT Hypoxanthine-guanine-phosphoribosyltransferase IC50 half maximal inhibitory concentration IDA Information Dependent Acquisition IGF Industrielle Gemeinschaftsforschung ISO International Organization for Standardization IUTA Institut für Energie- und Umwelttechnik e.V. KB Human cervix carcinoma cells kg kilogram(s) kDA kilo dalton kU Kilo units kW Kilo Watt L929 Mouse fibroblast cells L Liter L. gibba Lemna gibba L. minor Lemna minor L. sativa Lactica sativa LC50 median lethal concentration LC-MS/MS Liquid chromatography-Mass spectrometry/Mass spectrometry LDH Lactate Dehydrogenase LDHe Extracellular Lactate Dehydrogenase LLE Liquid-liquid extraction L.M.P. Low Melting Point LOD Limit of Detection LOEC Lowest observed effect concentration LOQ Limit of Quantitation LP-Hg Low pressure mercury lamp LUC Luciferase reporter gene M Mole M1 2-Methylthio-4-tert-butylamino-6-amino-s-triazine m3 cubic meter(s) m/z mass-to-charge ratio mA milliampere mbar millibar MCF-7 Michigan Cancer Foundation-7; human breast cancer cells MF Microfiltration mg milligram(s)
24
List of Abbreviations
MgSO4 Magnesium sulfate min minute(s) mL milliliter(s) mm millimetres mM millimole(s) MMAIII Monomethylarsonous acid mmu Milli Mass Unit MPF Microplate formate mol mole(s) MRM Multiple Reaction Monitoring MS Mass spectrometer MTBE Methyl tert-butyl ether MTS 3-(4,5-dimethylthiazol-2-yl)-5-(3-carboxymethoxyphenyl)-2-(4-
sulfophenyl)-2H-tetrazolium MTT 3-(4,5-dimethylthiazol-2-yl)-2,5-diphenyl tetrazolium bromide MVLN human breast cancer cell line (MCF-7) stably transfected with
the luciferase gene NaCl Sodium chloride NAD+ Nicotinamide adenine dinucleotide NADH Nicotinamide adenine dinucleotide NADP Nicotinamide adenine dinucleotide phosphate NaOH Sodium hydroxide NCI-H295R Human Adrenal Gland carcinoma cells NEAA Non-essential amino acids neg negative NF Nanofiltration NL Netherlands Ntot Total Nitrogen ng nanogram(s) NH4-N Ammonium nitrogen nm nanometer(s) NR Neutral Red n.s. not significant n.t. not tested NY New York O2 Oxygen O3 Ozone OD Optical Density OECD Organisation for Economic Co-operation and Development OH° Hydroxyl radicals OH- Hydroxide ONP Oxidationsnebenprodukt(e): Oxidation by-product(s) OSPAR Convention for the Protection of the Marine Environment of the
North-East Atlantic OTM Olive Tail Moment ox oxidized/oxidation p p-Value
25
List of Abbreviations
pM picomole(s) Ptot Total Phosphate PAC Powdered Activated Carbon PAN I Cytotoxicity Test kit PBS Phosphate Buffered Saline PC12 rat pheochromocytoma pEREtata-Luc Gene construct containing an estrogen-responsive element
linked to a luciferase reporter gene pH negative decimal logarithm of the hydrogen ion activity in a
solution Pharm. Pharmaceutical(s) PNEC Predicted no effect concentration pM picomole pos positive psi Pounds per square inch PTV Programmed Temperature Vaporizer QSAR Quantitative structure-activity relationship R2 Coefficient of determination REACH Registration, Evaluation, Authorization and Restriction of
Chemicals RLU Relative Light Units RO Reverse Osmosis ROS Reactive oxygen species rpm rounds per minute RTG2 Rainbow trut goad tissue cells rt-YES rainbow trout Yeast estrogen screen s second(s) S. capricornotum Selenastrum capricornotum S9 Liver enzyme mix SC Solvent control (negative control) SD Standard deviation SE Sweden SEM Standard Error of Mean SIM Selected Ion Monitoring SPE Solid Phase Extraction SRB Sulforhodamine B SVHC Substances of very high concern t time T. platyurus Thamnocepharus platyurus T47D Human breast carcinoma cells TA98 Salmonella typhimurium strain TA98 TA100 Salmonella typhimurium strain TA100 TAE Tris-acetate-EDTA TEER Transepithelial electrical resistance TCEP Tris(2-carboxyethyl)phosphine TCPP Tris(2-chloroisopropyl)phosphate TG Test Guideline
26
List of Abbreviations
TiO2 Titanium dioxide TK Thymidine kinase TK6 human lymphoblasts TOC Total Organic Carbon TOF-MS Time of flight mass spectroscopy TPP Triphenylphosphate TL Total LDH control (positive control) U2-OS human osteosarcoma cells UDE University Duisburg-Essen UDS Unscheduled DNA Synthesis UF Ultrafiltration US United States of America umu Test Genotoxicity test using the umuC (uv-mutagenesis) gene UV Ultra violet UV-C Ultra violet C V Volt V. fischeri Vibrio fischeri Vero African green monkey kidney fibroblasts VIS Visible light W Watt WFD Water Framework Directive WTK-1 Human lymphoblastoid cells WWTP Waste water treatment plant XPRT Xanthin-Guanine-Phosphoribosyltransferase XTT 2.3-bis(2-methoxy-4-nitro-5-sulfopheny)-2H-tetrazolium-5-
carboxyanilide inner salt YES Yeast Estrogen Screen µg microgram(s) µL microlitre(s) µm micrometer(s) µM micromole(s)
27
1. Summary
The contamination of surface waters with organic micropollutants is a well known
problem and increased over the last decades. One reason for their release and
consequently their detection in surface waters is their incomplete degradation and
therefore insufficient removal during conventional waste water treatment processes.
To overcome this problem advanced oxidation processes have been proposed as an
additional treatment step, since the formation of highly reactive hydroxyl radicals
helps to degrade those substances.
This study was therefore designed to investigate the toxicological properties
(cytotoxic, genotoxic, mutagenic and estrogenic) of several substances before and
after ozonation or UV/H2O2 treatment in either waste water treatment plant effluents
or HPLC-water using toxicological in vitro methods. These methods are able to
identify biological effects of the whole water sample thus the entire complexity of
chemicals. In addition cellular based methods will give an overview on possible
induction mechanisms which will lead to a manifestation of effects on the organ or
even organism level.
In the case of Terbutryn its genotoxicity before treatment was first increased at low
ozone dosages (36, 100, and 195 µg/L) but was removed at the highest ozone
dosage (800 µg). Similar results have been shown for TPP. Genotoxic effects were
only seen before ozonation, but after 60 minutes of ozonation these effects were
removed.
The ozonation of Triclosan resulted in the formation of the by-product 2,4-
Dichlorophenol. Both substances did not exhibit cytotoxic effects up to a maximum
tested concentration of 100 µg/L. Genotoxic effects were only seen for Triclosan
starting at a concentration of 10 µg/L. Thus a less genotoxic by-product has been
formed during ozonation.
The estrogenicity tests showed that HPLC-water containing Bisphenol A did no
longer have estrogenic effects after UV/H2O2 treatment whereas neither the
ozonation nor the UV/H2O2 treatment of Ethinylestradiol for 60 minutes resulted in a
28
complete loss of estrogenic activity. The musk fragrance HHCB in contrast did not
show estrogenic effects, neither before nor after ozonation.
For the two beta blockers (Atenolol and Metoprolol), the antibiotics Sulfamethoxazole
and Ofloxacin as well as the musk fragrance AHTN neither before nor after
ozonation or UV/H2O2 oxidation cytotoxic effects were detected. The ozonation of
Irgaol 1051 did also not lead to cyto- or genotoxic effects. The results of the
oxidation experiments with Bisphenol A, Ciprofloxacin and HHCB demonstrated that
formed oxidation by-products differ in regard to toxicity depending on treatment
method and water matrix. Cytotoxic effects for all three substances were only
detected in HPLC-water after 60 minutes of UV/H2O2 but not in waste water
treatment plant effluent. In addition no toxicity was detected after the same time of
oxidation using ozone. The tested concentrations of TCPP as well as TCEP were not
toxic before oxidative treatment. However cytotoxic effects were detected after
UV/H2O2 treatment whereas the ozonation did not induce cytotoxicity.
In general it can be concluded that ozonation as well as UV/H2O2 oxidation are two
useful methods for the removal of the here tested substances from the effluents of
waste water treatment plants in regard to their degradation and to prevent the
formation of toxic oxidation by-products considering the used test methods (MTT
Test, PAN I, Alkaline Comet Assay, Ames Test, and ER Calux). However a
generalized statement about micropollutants their removal and toxicity is not
possible, and needs to be established on a case by case basis since operating
conditions as well as the matrix composition vary over time. The successful use of
toxicological in vitro methods for the detection of biological effects of waste water
treatment plant effluents in combination with advanced oxidation processes is
confirmed by other studies, e.g. a study performed by the Eawag at the waste water
treatment plant in Regensdorf or the PILLS project.
Introduction
29
2. Introduction
Water is essential for life and therefore one of the most precious goods on earth.
Since the amount of fresh water is limited its quality is the most important factor. The
distribution of safe water, the removal of contaminants as well as the protection of
the ecosystem and the human health have been a concern for many generations
and even more to come.
The occurrence of pharmaceuticals, personal care products and various other
anthropogenic substances, so called micropollutants, in fresh water and waste water
treatment plant (WWTP) influents is a well known problem [1-5]. Waste waters
contain a high diversity of components varying over time and place. These
components are microorganisms, metals, inorganic substances, organic substances,
and biodegradable organic substances as well as nutrients [6]. For many of these
components e.g. nutrients the removal efficiency is high but others like organic
substances are released into the environment posing a threat to the environment.
Most of these organic substances are biologically active and thus might have effects
on the ecosystems and in the end on the human health. Due to an improvement in
analytical methods the detection limits of micropollutants are becoming lower. It has
been shown that these substances are not eliminated during waste water treatment
and reach surface waters resulting in ng/L to even µg/L concentrations [3, 4, 7-14].
Because of this discovery waste water treatment plants have to face new problems,
including new treatment methods as well as new methods to control the quality of
WWTP effluents. Hereby the contaminated WWTP effluent might pose a threat to
human health and lead to problems in drinking water treatment since e.g.
pharmaceuticals are designed to work at low concentrations. Therefore appropriate
methods need to be developed. These methods need to take into account the
complete degradation of water contaminants to harmless molecules. Due to the
variety of those contaminants there is no common treatment until now. The use of
advanced oxidation processes (AOP) has been widely studied and AOP have been
shown to be a promising method although in some cases a downstream filtration
(e.g. through activated carbon or sand) is needed [8, 11, 14-23]. It has also been
shown that an incomplete degradation promotes the formation of oxidation by-
Introduction
30
products that differ in structure and function from their parent compound and might
therefore also have different toxicological effects on the environment [24, 25].
Therefore methods which are able to detect biological effects of organic
micropollutants are required. Toxicological in vitro methods are helpful in the
detection of these effects since there is a great variety of tests available with different
endpoints which allow the identification of a complex mixture of substances in waste
water treatment plant effeluents as a precursor for the manifestation of effects on the
level of organs or organisms [26, 27].
Micropollutants in waste water treatment plant effluents and 2.1.
surface water
2.1.1. Guidelines for water quality control
Although a variety of regulations for the safety and cleanliness of water systems
have already been established in regard to the water quality on a national basis, the
implementation of the Water framework directive (WFD) by the European Union is a
step toward a more sincere water quality management internationally. This directive
requires the monitoring of biological, chemical, and quantitative parameters for an
environmental risk assessment. As part of the WFD 33 substances have been
chosen as priority substances [28], and environmental quality standards have been
regulated in an EU directive (2008/105/EG) to prevent short term as well as long
term effects of priority substances on the environment with maximum concentrations
between 0.004 and 50 µg/L depending on the substance [29]. In addition to the
European regulations other substances which are not regulated in these directives
can be regulated by each member state. The German “Oberflächen-
gewässerverordnung” (Regulation for the protection of surface waters) regulates a
variety of parameters in accordance with the two above mentioned directives. Priority
as well as other substances need to be measured 4 – 13 times each year depending
on their classification [30].

Introduction
31
2.1.2. Emission of micropollutants
The routes by which micropollutants reach the water system are adverse (Figure 1).
Pharmaceuticals are mainly introduced via the fecal-oral-cycle or by the disposal
through the plumbing system finally reaching the waste water treatment plant. But
not only the drug itself reaches the water systems, its metabolites are also
introduced. After the ingestion of drugs only a part of them gets completely
metabolized resulting in an input of residues as well as the original substance into
the water system via excretion. This is true for both, human and veterinary
pharmaceuticals. The same route can also be applied for personal care products
which are used in the everyday life. Shampoos, soaps, perfumes etc. containing e.g.
musk fragrances, are used on a daily basis and are also flushed down the drain
reaching the water system. Biocides like herbicides, algicides, and insecticides are
mainly introduced into the water by runoff from areas where they have been applied.
Other sources of introduction are industrial and hospital waste waters which usually
contain a high amount of organic substances. In addition to these common routes
accidental spills or the intentional illegal disposal of chemicals etc. also contribute to
the presence of anthropogenic substances in the water system. Thus it is either a
direct input into the surface water or an input through waste water treatment plant
effluents after an incomplete removal.
Figure 1: Routes of micropollutant contamination of surface waters
Introduction
32
2.1.3. Substances detected in waste water treatment plant effluents
The group of organic micropollutants detected in waste water treatment plant
effluents is composed of a variety of substances including pharmaceuticals,
pesticides, personal care products, and other chemicals. Thus substances with
different fields of application and a huge variety of properties are detected in WWTP
effluents and receiving surface waters [31, 32]. The presence of pharmaceuticals is
due to their ubiquitous use with 8280 drugs allowed in human medicine in Germany
[33], as well as their high persistence. In 2010 the volume of defined daily doses
(DDD) of the 30 most prescribed pharmaceuticals increased of 3.5 % to an amount
of 35384 million DDD which reflects the trend of the last years [34] although the
amount of DDD for some pharmaceuticals is decreasing. However this number only
gives the amount of pharmaceuticals with the need of a prescription (6288 drugs) not
taking into account over-the-counter drugs (1992 drugs), which have to be added to
this number. Most of the pharmaceuticals commonly detected are also part of the
WHO Model List of Essential Medicines, thus a bigger decline in its uses is
improbable [35]. A literature and database review by Bergmann et al. (2011)
demonstrates the large amount of pharmaceuticals present in water systems as well
as the lack of information on their behavior in the environment [12]. In addition to
human pharmaceuticals veterinary drugs need to be considered since they also
reach waste water treatment plants and surface waters. Musk fragrances are
another group of substances frequently detected in surface waters. They are
constituents of personal care products and are thus also used on a daily basis. Like
pharmaceuticals they are not easily biodegradable which leads to their detection in
WWTP effluents and subsequently in surface waters and sediments [36-38].
2.1.4. Waste water quality control
Due to the presence of a variety of substances in the influents of waste water
treatment plants the treatment efficiency of the plants needs to be surveyed to
prevent the contamination of receiving surface waters. The quality control of waste
water treatment plant effluents in Germany is usually determined by physical and
chemical parameters. Sum parameters like the COD (chemical oxygen demand),
Introduction
33
BOD (biological oxygen demand), TOC (total organic carbon), DOC (dissolved
organic carbon), and the conductivity are determined. Group parameters describing
substances with similar chemical properties, e.g. total nitrogen, are also determined.
In addition characteristics like the color, turbidity and smell are recorded [39]. All
these parameters are regulated in the “Abwasserverordnung” (Waste Water
Ordinance) which defines the limit values allowed to release the waste water
treatment plant effluent into surface waters (Table 1) taking into account different
industrial waste waters. A variety of anions (e.g. fluoride, nitrogen compounds,
phosphate, sulfate) and cations (e.g. aluminium, arsenic, copper, mercury) as well as
adsorbable organic halogen compounds (AOX) and lipophilic compounds need to be
determined. Besides these many other parameters need to be monitored. In regard
to biologically active substances two in vitro methods, the umu-test for the
determination of mutagenic effects and the luminescent bacteria inhibition test for the
detection of cytotoxic effects are recommended in the German Abwasserverordnung.
However these methods are based on bacterial responses and effects might differ
when tested with eukaryotic cells. The in vivo methods listed in the
Abwasserverordnung include the fish-egg test and the testing for toxicity in daphnia
and algae, performed according to the corresponding DIN rules [40].
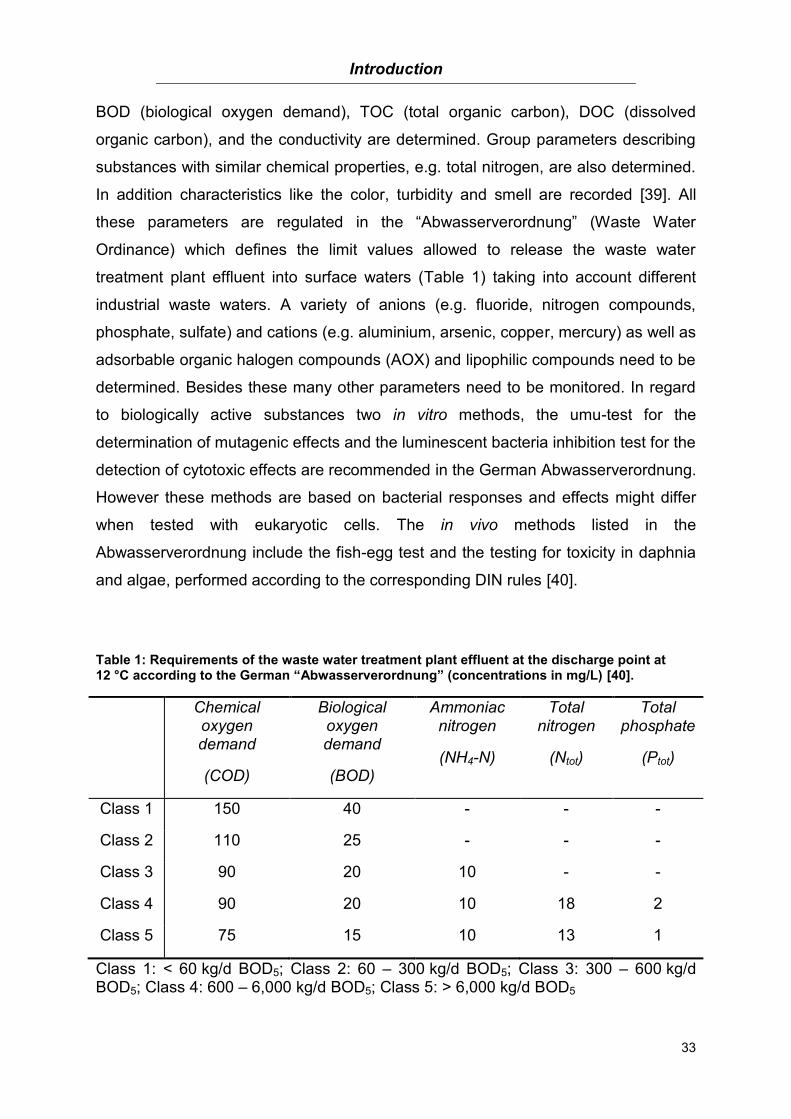
Table 1: Requirements of the waste water treatment plant effluent at the discharge point at 12 °C according to the German “Abwasserverordnung” (concentrations in mg/L) [40].
Chemical oxygen demand
(COD)
Biological oxygen demand
(BOD)
Ammoniac nitrogen
(NH4-N)
Total nitrogen
(Ntot)
Total phosphate
(Ptot)
Class 1 150 40 - - -
Class 2 110 25 - - -
Class 3 90 20 10 - -
Class 4 90 20 10 18 2
Class 5 75 15 10 13 1
Class 1: < 60 kg/d BOD5; Class 2: 60 – 300 kg/d BOD5; Class 3: 300 – 600 kg/d BOD5; Class 4: 600 – 6,000 kg/d BOD5; Class 5: > 6,000 kg/d BOD5

Introduction
34
Depending on their classification, waste water treatment plants need to meet certain
criteria. The waste water treatment plants are classified according to the BOD5 value.
This value describes the amount of oxygen needed for the aerobic degradation of
organic materials by microorganisms. Thus it gives a measure for the degree of
pollution. It is an approximate measure for the amount of oxidized organic
substances after five days because at that time most of the organic matter is
supposed to be degraded by microorganisms [6]. The BOD5 therefore is a value of
the population equivalent describing the pollution load.
2.1.5. Common waste water treatment
The first ideas of waste water treatment reach back to ancient times. However the
development of techniques used during waste water treatment nowadays has been
started in the late 19th century followed by a steady development of new techniques
and ways of treatment [41].
A common waste water treatment plant consists of a pre-treatment and three
subsequent treatment steps (Figure 2). Before the primary treatment is applied the
waste water is commonly subjected to the pre-treatment (mechanical treatment)
where materials like branches, leaves or litter are mechanically removed by a rack.
During primary treatment, the incoming pre-treated waste water reaches a tank
where it remains for some time to allow the settlement of bigger solid particles (e.g.
sand). Dissolved as well as suspended organic matter which was not removed
during primary treatment is removed during secondary treatment (aerobic-biological
treatment). This step includes a basin where microorganisms degrade the remaining
organic matter by the addition of oxygen for an aerobic environment. The best
possible outcome of this treatment step is a complete degradation of the organic
matter as well as an oxidation of the inorganic matter. The last step before the water
is finally released into the environment is the tertiary treatment where the activated
sludge originating from secondary treatment is removed by deposition. Part of the
activated sludge is transported back into the secondary treatment basin whereas the
Introduction
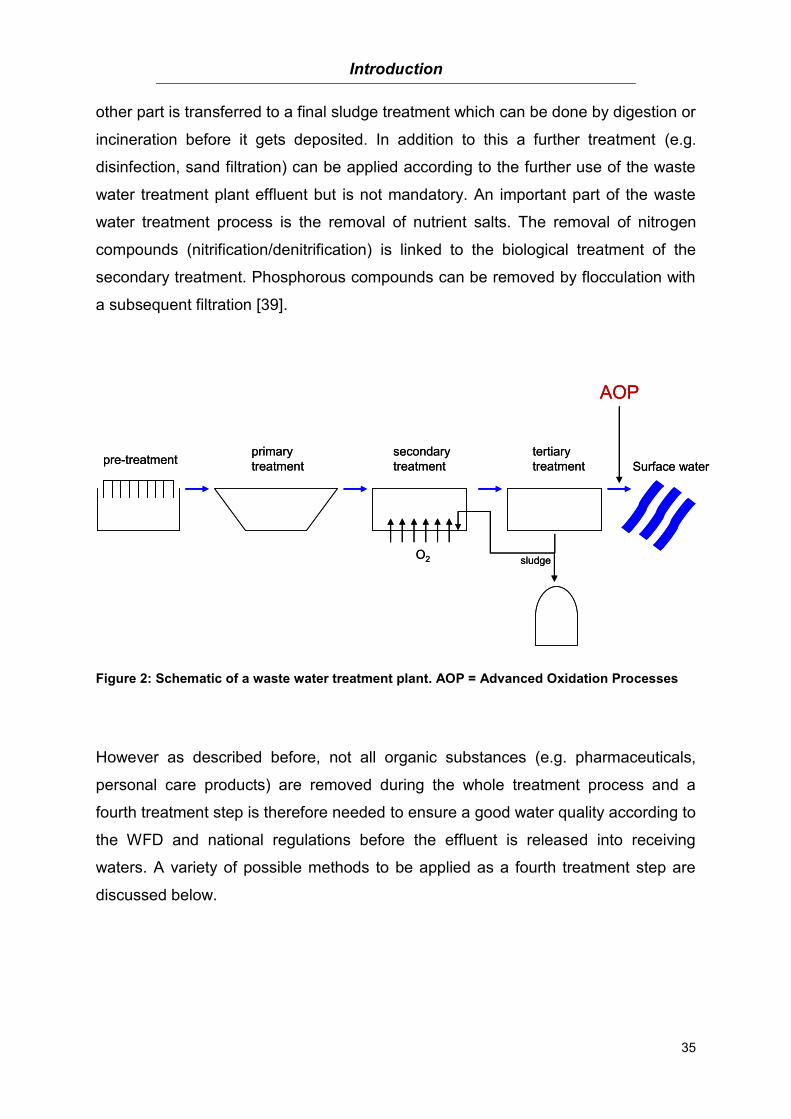
35
other part is transferred to a final sludge treatment which can be done by digestion or
incineration before it gets deposited. In addition to this a further treatment (e.g.
disinfection, sand filtration) can be applied according to the further use of the waste
water treatment plant effluent but is not mandatory. An important part of the waste
water treatment process is the removal of nutrient salts. The removal of nitrogen
compounds (nitrification/denitrification) is linked to the biological treatment of the
secondary treatment. Phosphorous compounds can be removed by flocculation with
a subsequent filtration [39].
Figure 2: Schematic of a waste water treatment plant. AOP = Advanced Oxidation Processes
However as described before, not all organic substances (e.g. pharmaceuticals,
personal care products) are removed during the whole treatment process and a
fourth treatment step is therefore needed to ensure a good water quality according to
the WFD and national regulations before the effluent is released into receiving
waters. A variety of possible methods to be applied as a fourth treatment step are
discussed below.
primary
treatment
secondary
treatment
sludge
tertiary
treatment Surface waterpre-treatment
AOP
O2
primary
treatment
secondary
treatment
sludge
tertiary
treatment Surface waterpre-treatment
AOP
O2
Introduction
36
2.1.6. Advanced waste water treatment
2.1.6.1. Filtration
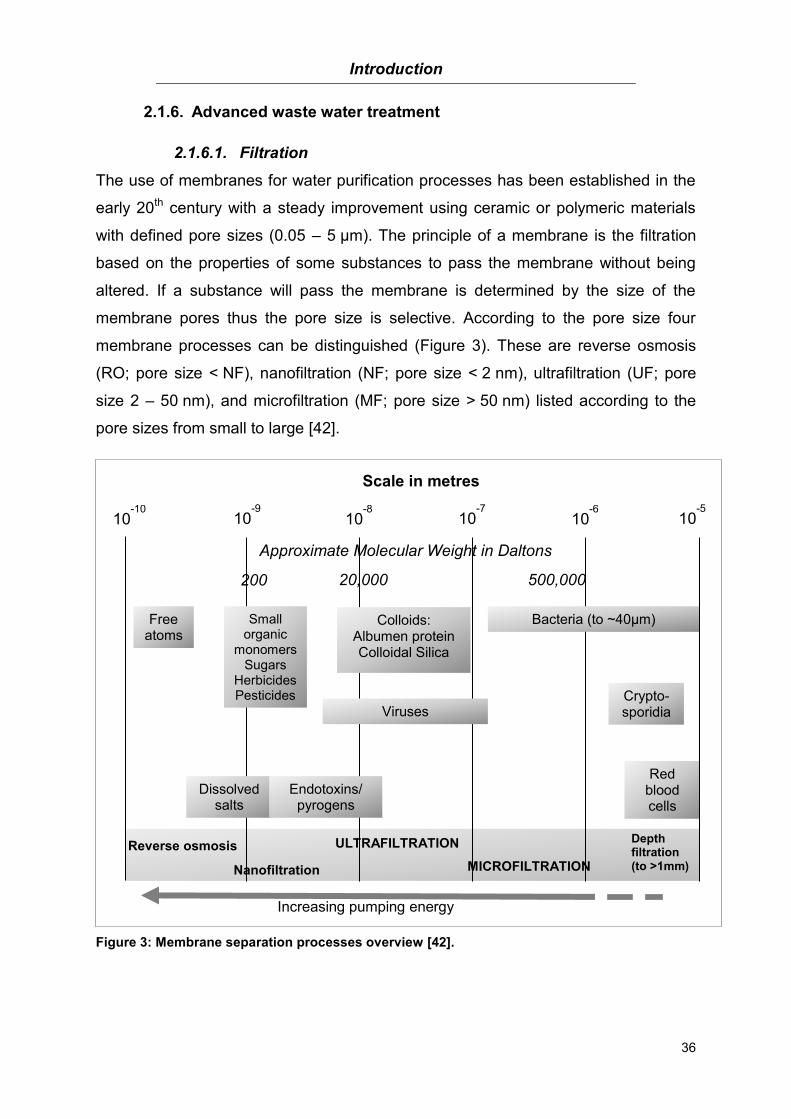
The use of membranes for water purification processes has been established in the
early 20th century with a steady improvement using ceramic or polymeric materials
with defined pore sizes (0.05 – 5 µm). The principle of a membrane is the filtration
based on the properties of some substances to pass the membrane without being
altered. If a substance will pass the membrane is determined by the size of the
membrane pores thus the pore size is selective. According to the pore size four
membrane processes can be distinguished (Figure 3). These are reverse osmosis
(RO; pore size < NF), nanofiltration (NF; pore size < 2 nm), ultrafiltration (UF; pore
size 2 – 50 nm), and microfiltration (MF; pore size > 50 nm) listed according to the
pore sizes from small to large [42].
Figure 3: Membrane separation processes overview [42].
Red blood cells
10-10
10-9
10-8
10-7
10-6
10-5
Approximate Molecular Weight in Daltons
200 20,000 500,000
Reverse osmosis
Nanofiltration
ULTRAFILTRATION
MICROFILTRATION
Depth filtration (to >1mm)
Increasing pumping energy
Scale in metres
Free atoms
Crypto-sporidia
Small organic
monomers Sugars
Herbicides Pesticides
Dissolved salts
Endotoxins/ pyrogens
Viruses
Colloids: Albumen protein Colloidal Silica
Bacteria (to ~40µm)
Introduction
37
Reverse osmosis is a technique commonly used for the desalination of seawater by
separating the water molecules and the ions through a membrane under pressure
(20 – 100 bar) [31]. This method is also thought of as an additional treatment step to
remove remaining micropollutants after waste water treatment. However there are
some limitations. Organic substances might be dissolved in the membrane remaining
there for a certain time before they are released. Thus also the water is thought to be
clean, at some point it might be polluted again. Another limitation is the property of
organic substances to penetrate the membrane more easily than the water
molecules resulting in no removal at all [31, 43]. Nanofiltration is used for the
separation of dissolved organic matter (> 200 g/mol), divalent cations and anions. It
is therefore often used for the softening of water. During ultrafiltration viruses and
colloids are rejected by the membrane whereas the microfiltration technique having
the biggest pore size is only able to separate suspended solids, e.g. bacteria and
bigger materials from the water [42]. This defined pore size is at the same time the
limitation of the filtration process because the pores might easily clog or biofilms are
formed which leads to a high energy consumption [39, 43]. Other facts like biofouling
also limit the time of usage of the membranes. These facts in addition with high costs
and the operating expenses limit the use of especially reverse osmosis but also the
other three filtration techniques as a fourth treatment step.
Although oxidative treatment methods have been proven successfully in the
complete removal of micropollutants a further treatment using filtration techniques
might be useful especially for the removal of oxidation by-products. One of these
filtration methods is the sand filtration. Sand filters are commonly used for the
purification of water, both during drinking and waste water treatment. While sand
filters are mainly used for disinfection purposes of drinking water and the removal of
odor and taste they are used as an additional step during waste water treatment as a
filter for the adsorption of remaining organic matter. The final report of the Eawag
(Swiss Federal Institute of Aquatic Science and Technology) regarding the ozonation
of treated waste water showed that the ozonation of the WWTP effluent already
resulted in a high removal efficiency, however after sand filtration the removal rate
was even higher especially with regard to formed by-products [14, 44].

Introduction
38
2.1.6.2. Sorption: Activated Carbon
Activated carbon describes a class of carbon materials produced synthetically from
materials like wood, nut shells or coal. One advantage of activated carbon is its
highly porous surface and therefore big area which allows reactions with substances
[43, 45]. The porous surface is produced by drying and heating the carbon material
using air, steam or carbon dioxide. A subsequent heating step using oxidation gases
or CO2 at temperatures above 800 °C is applied for activating the surface area by
increasing it [46]. Although activated carbon is used in many fields (e.g. product
purification) its main application is during environmental processes for a pollution
control. Two types of activated carbon are available: Granular Activated Carbon
(GAC) and Powdered Activated Carbon (PAC). GAC is composed of crushed
granules originating from coal or shell and the particles are between 0.2 and 5 mm.
PAC in contrast is made from wood with a particle size of 15 to 25 µm. While PAC
can either be added to the activated sludge or in a separate tank, GAC is always
used as a separate treatment step.
Besides the use in drinking water treatment activated carbon is also used during
waste water treatment. The first application of activated carbon for waste water
treatment was in California in 1965 in a municipal plant. Nowadays activated carbon
is mainly used for the treatment of industrial waste waters [45].
During waste water treatment activated carbon is used as a material to adsorb
dissolved organic matter because of the high adsorbance capacity [47-50]. It has
also been proven to remove the toxic activity after ozonation [24]. Due to its high
costs e.g. through the processing for reuse, it is usually only applied when no other
treatment is successful or as a last treatment step when most of the micropollutants
have already been removed and only substances which are not biodegradable are
present [45].

Introduction
39
2.1.6.3. Advanced Oxidation Processes (AOP)
Since organic micropollutants are not removed during the different steps of common
waste water treatment and some of them are highly persistent another fourth
treatment step is needed. Currently it is being discussed which technique would be
the best to eliminate these substances and thus there are a variety of requirements.
From an economic point of view the fourth step needs to be easy to apply and most
efficient with low costs. Another fact that needs to be considered is the minimization
of an environmental risk through the use of an additional treatment step. In this
context advanced oxidation processes (AOP’s) are believed to be the best possible
method and thus different methods have been developed and successfully applied
[51-55]. However, the oxidation of micropollutants has some disadvantages. It has
been shown for drinking water treatment that the presence of e.g. bromide results in
the formation bromate, a suspected carcinogen, through disinfection processes [56,
57]. To avoid this disadvantage of oxidation processes, the chosen AOP is of great
importance and might vary depending on the composition of the waste water.
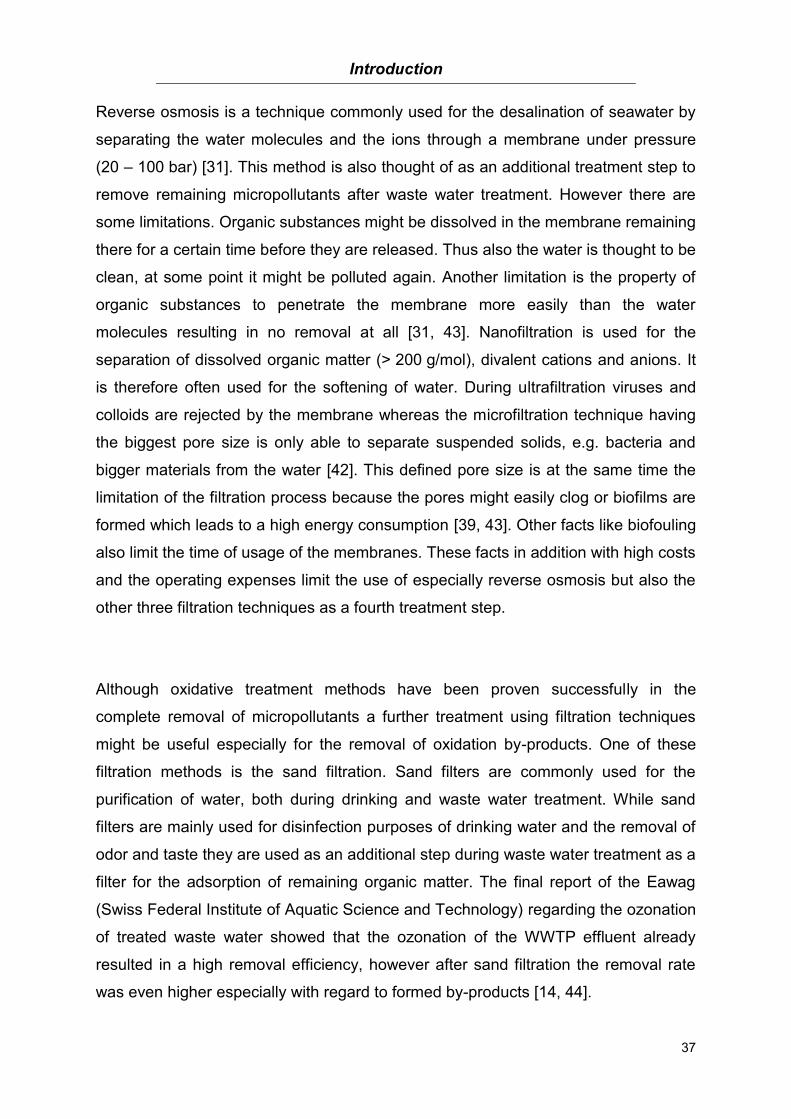
Advanced oxidation processes are defined as processes which initiate the formation
of hydroxyl radicals (OH°) in such amounts that they are able to support the water
purification [58] by degrading water contaminants. Due to their highly reactive
(second order rate constants 106 – 109 M-1 s-1) and mostly unselective properties as
well as their high oxidation potential (2.8 V) they react with the organic matter
resulting in an oxidation of the pollutants [59, 60]. Another similarity of all possible
AOP’s is the need of a pre-treated wastewater with a low chemical oxygen demand
(COD; ≤ 5 g/L) since the AOP alone is not sufficient in removing the organic matter
(Figure 4). A high organic load would increase the amount of oxidant needed and
would not only raise the treatment costs but would also lower the efficiency of
treatment. The best possible outcome after an oxidative treatment is the complete
mineralization of the micropollutants to CO2, H2O or an inorganic product. An
incomplete mineralization only promotes the formation of by-products [51]. The
degradation process itself is mainly unknown for many substances and is specific for
each applied method.
Introduction
40
Figure 4: Suitability of water treatment technologies according to the chemical oxygen
demand (COD in g/L) [51].
2.1.6.3.1. Ozone
Apart from chlorine, ozone is nowadays one of the most used disinfectants during
water treatment processes. Besides its beneficial effects during drinking water
treatment, e.g. removing taste, color, and odor, as well as the elimination of
microorganisms and humic substances, the use of ozone still has some
disadvantages. Although ozone is known to be unstable in water it easily undergoes
reactions with water compounds resulting in the formation of by-products. The
mechanisms already described for drinking water treatment can also be applied for
the use of ozone as an additional step in waste water treatment. In contrast to
drinking water treatment the focus of the ozone usage during waste water treatment
is the removal of organic micropollutants and not on disinfection. In addition the
resulting by-products might differ from those known for drinking water depending on
the much more complex water matrix.
The ozonation itself can take place in two ways with different reactions. The
reactions can either occur through a direct reaction by the ozone molecule itself or
an indirect reaction through the formation of OH° (Figure 5), thus leading to different
oxidation by-products and different reaction rate constants (direct = 1.0 – 106 M-1 s-1,
Introduction
41
indirect = 108 – 1010 M-1 s-1). Another difference of the two reaction pathways is the
way of the oxidative attack. A direct ozonation by O3 is selective and compounds
with unsaturated bonds (e.g. aromatic compounds) are mainly attacked. The higher
the electron density the faster the reaction takes place. Indirect reactions are initiated
through the presence of OH- ions. At the end of the reactions hydroxyl radicals are
formed which then subsequently react with the micropollutants thus oxidizing them.
Figure 5: Reaction pathways of the OH° (encircled) formation by ozone [48]
Both reactions can take place simultaneously but depending on the properties of the
water (pH, temperature) one of the reactions is favored. A high pH for example
results in an oxidation through OH° whereas a low pH favors the direct ozonation.
This also indicates that depending on the water matrix (DOC content) one of the
reactions dominates. In addition ozone is not specific for organic miropollutants thus
inorganic compounds e.g. iron or nitrogen compounds might also be oxidized [61]
therefore a complete elimination of these inorganic compounds before the use of
ozone is advantageous.
2.1.6.3.2. UV treatment with and without H2O2
UV light is a radiation with a wavelength of 4 – 400 nm and invisible to the human
eye. In order to be oxidized by UV light, substances present in the water need to be
able to absorb this radiation. They mainly absorb UV light at wavelengths between
200 and 280 nm [60] thus the range of the UV-C radiation which is 100 – 280 nm
[62]. During the treatment of wastewater, low pressure mercury lamps (LP - Hg) are
mainly used with a wavelength of 253.7 nm. However the sole use of UV light in
regard to the oxidative potential is limited since the substances have to absorb the
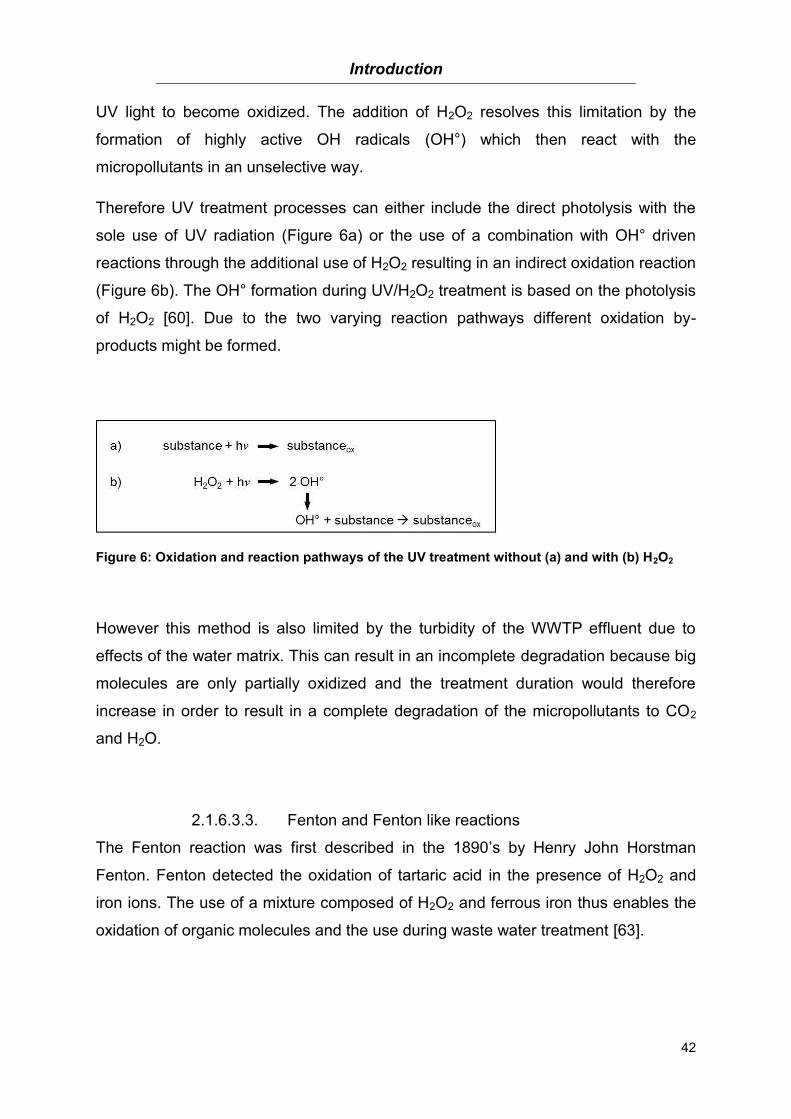
Introduction
42
UV light to become oxidized. The addition of H2O2 resolves this limitation by the
formation of highly active OH radicals (OH°) which then react with the
micropollutants in an unselective way.
Therefore UV treatment processes can either include the direct photolysis with the
sole use of UV radiation (Figure 6a) or the use of a combination with OH° driven
reactions through the additional use of H2O2 resulting in an indirect oxidation reaction
(Figure 6b). The OH° formation during UV/H2O2 treatment is based on the photolysis
of H2O2 [60]. Due to the two varying reaction pathways different oxidation by-
products might be formed.
Figure 6: Oxidation and reaction pathways of the UV treatment without (a) and with (b) H2O2
However this method is also limited by the turbidity of the WWTP effluent due to
effects of the water matrix. This can result in an incomplete degradation because big
molecules are only partially oxidized and the treatment duration would therefore
increase in order to result in a complete degradation of the micropollutants to CO2
and H2O.
2.1.6.3.3. Fenton and Fenton like reactions
The Fenton reaction was first described in the 1890’s by Henry John Horstman
Fenton. Fenton detected the oxidation of tartaric acid in the presence of H2O2 and
iron ions. The use of a mixture composed of H2O2 and ferrous iron thus enables the
oxidation of organic molecules and the use during waste water treatment [63].
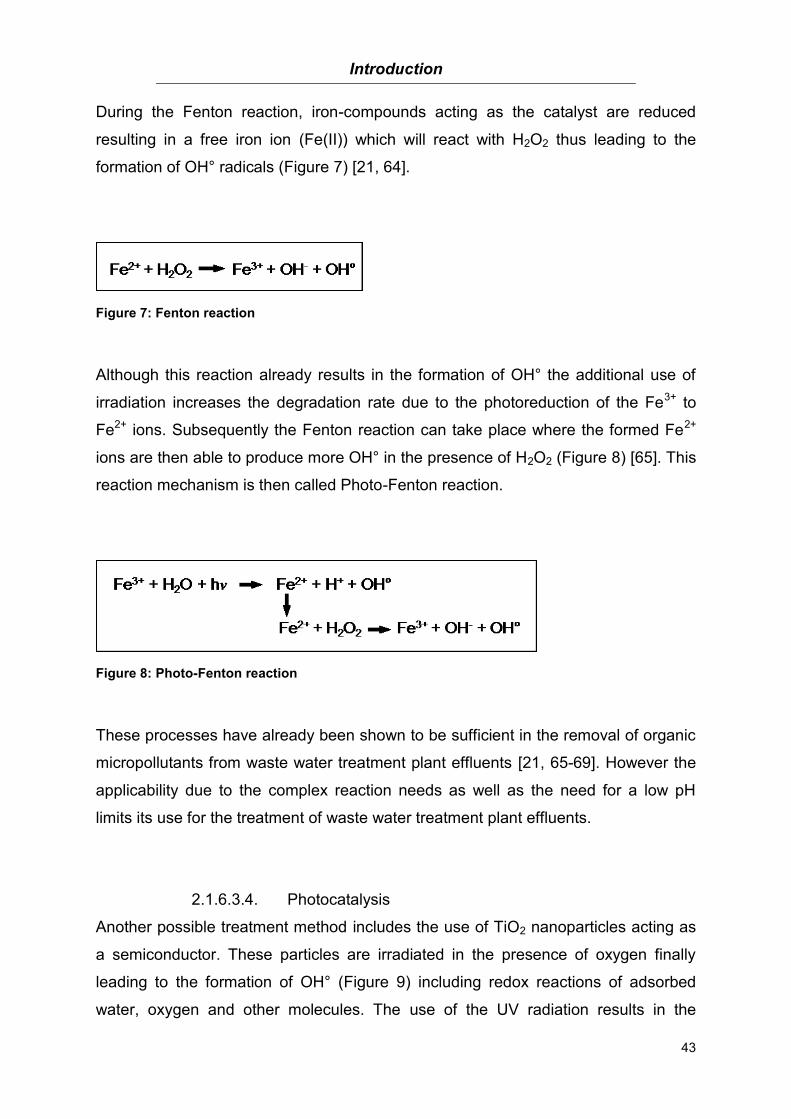
Introduction
43
During the Fenton reaction, iron-compounds acting as the catalyst are reduced
resulting in a free iron ion (Fe(II)) which will react with H2O2 thus leading to the
formation of OH° radicals (Figure 7) [21, 64].
Figure 7: Fenton reaction
Although this reaction already results in the formation of OH° the additional use of
irradiation increases the degradation rate due to the photoreduction of the Fe3+ to
Fe2+ ions. Subsequently the Fenton reaction can take place where the formed Fe2+
ions are then able to produce more OH° in the presence of H2O2 (Figure 8) [65]. This
reaction mechanism is then called Photo-Fenton reaction.
Figure 8: Photo-Fenton reaction
These processes have already been shown to be sufficient in the removal of organic
micropollutants from waste water treatment plant effluents [21, 65-69]. However the
applicability due to the complex reaction needs as well as the need for a low pH
limits its use for the treatment of waste water treatment plant effluents.
2.1.6.3.4. Photocatalysis
Another possible treatment method includes the use of TiO2 nanoparticles acting as
a semiconductor. These particles are irradiated in the presence of oxygen finally
leading to the formation of OH° (Figure 9) including redox reactions of adsorbed
water, oxygen and other molecules. The use of the UV radiation results in the

Introduction
44
formation of an electron-hole pair subsequently followed by a transfer of the electron
leading to the formation of OH° radicals [21, 64, 70].
Figure 9: Reaction pathway of the TiO2 photocatalysis
However, despite all these possible methods only few of them are feasible.
Photocatalysis, as well as membrane and Fenton processes are limited due to their
quite complicated requirements as well as the high costs when applying these
methods. In contrast processes like ozonation and UV/H2O2 treatment are more
efficient in regard to costs, applicability and the removal of micropollutants through
OH° formation. All methods also might result in the formation of oxidation by-
products due to an incomplete degradation which should be prevented by finding the
most applicable treatment setting.
Toxicological testing for the determination of biological 2.2.
effects of micropollutants
The use of toxicological methods helps to identify substances as well as the
conditions (e.g. concentration, time of exposure) which lead to biological effects in a
dose dependent manner. In fact not one single test is sufficient in predicting the
possible risk, thus many tests need to be performed in order to perform a risk
assessment. For example Kase et al. (2009) proposed a multistep process for the
investigation of endocrine or reproductive effects suggesting the combination of
different in vivo and in vitro methods which allow the detection of toxicological effects
at the molecular, cellular as well as organism level. These tests should be able to
identify effects selectively and mode of action based and an extrapolation of these
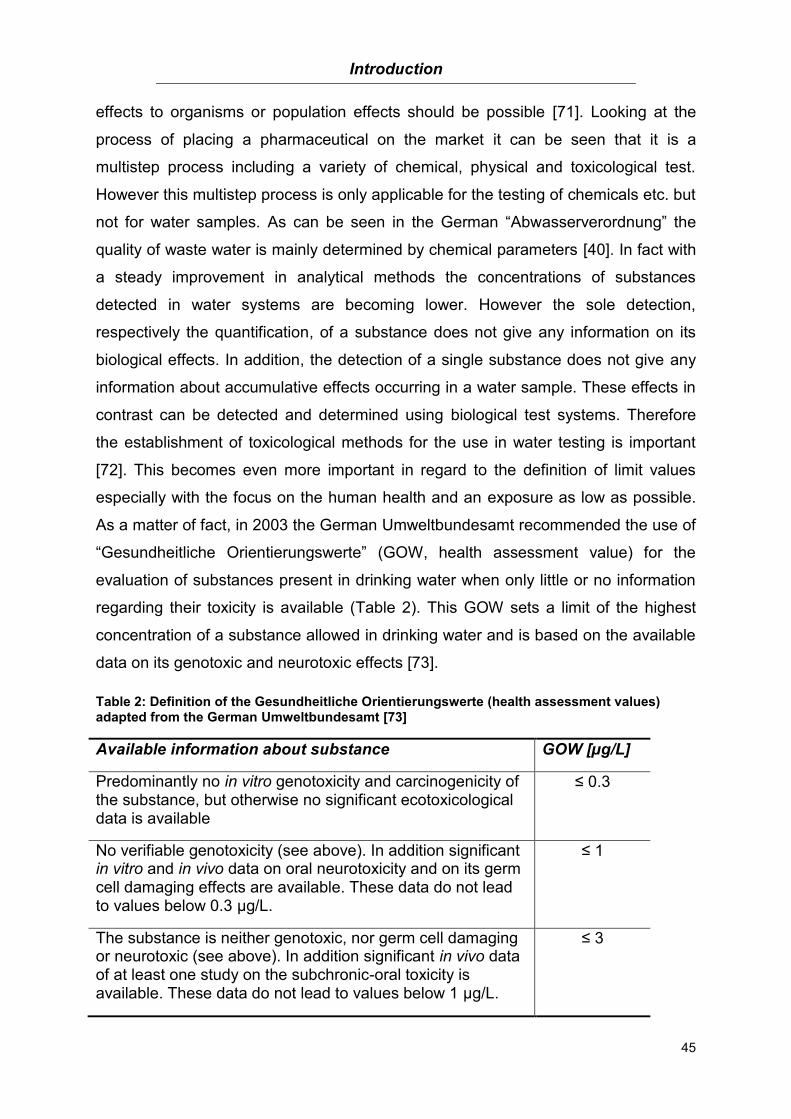
Introduction
45
effects to organisms or population effects should be possible [71]. Looking at the
process of placing a pharmaceutical on the market it can be seen that it is a
multistep process including a variety of chemical, physical and toxicological test.
However this multistep process is only applicable for the testing of chemicals etc. but
not for water samples. As can be seen in the German “Abwasserverordnung” the
quality of waste water is mainly determined by chemical parameters [40]. In fact with
a steady improvement in analytical methods the concentrations of substances
detected in water systems are becoming lower. However the sole detection,
respectively the quantification, of a substance does not give any information on its
biological effects. In addition, the detection of a single substance does not give any
information about accumulative effects occurring in a water sample. These effects in
contrast can be detected and determined using biological test systems. Therefore
the establishment of toxicological methods for the use in water testing is important
[72]. This becomes even more important in regard to the definition of limit values
especially with the focus on the human health and an exposure as low as possible.
As a matter of fact, in 2003 the German Umweltbundesamt recommended the use of
“Gesundheitliche Orientierungswerte” (GOW, health assessment value) for the
evaluation of substances present in drinking water when only little or no information
regarding their toxicity is available (Table 2). This GOW sets a limit of the highest
concentration of a substance allowed in drinking water and is based on the available
data on its genotoxic and neurotoxic effects [73].
Table 2: Definition of the Gesundheitliche Orientierungswerte (health assessment values) adapted from the German Umweltbundesamt [73]
Available information about substance GOW [µg/L]
Predominantly no in vitro genotoxicity and carcinogenicity of the substance, but otherwise no significant ecotoxicological data is available
≤ 0.3
No verifiable genotoxicity (see above). In addition significant in vitro and in vivo data on oral neurotoxicity and on its germ cell damaging effects are available. These data do not lead to values below 0.3 µg/L.
≤ 1
The substance is neither genotoxic, nor germ cell damaging or neurotoxic (see above). In addition significant in vivo data of at least one study on the subchronic-oral toxicity is available. These data do not lead to values below 1 µg/L.
≤ 3
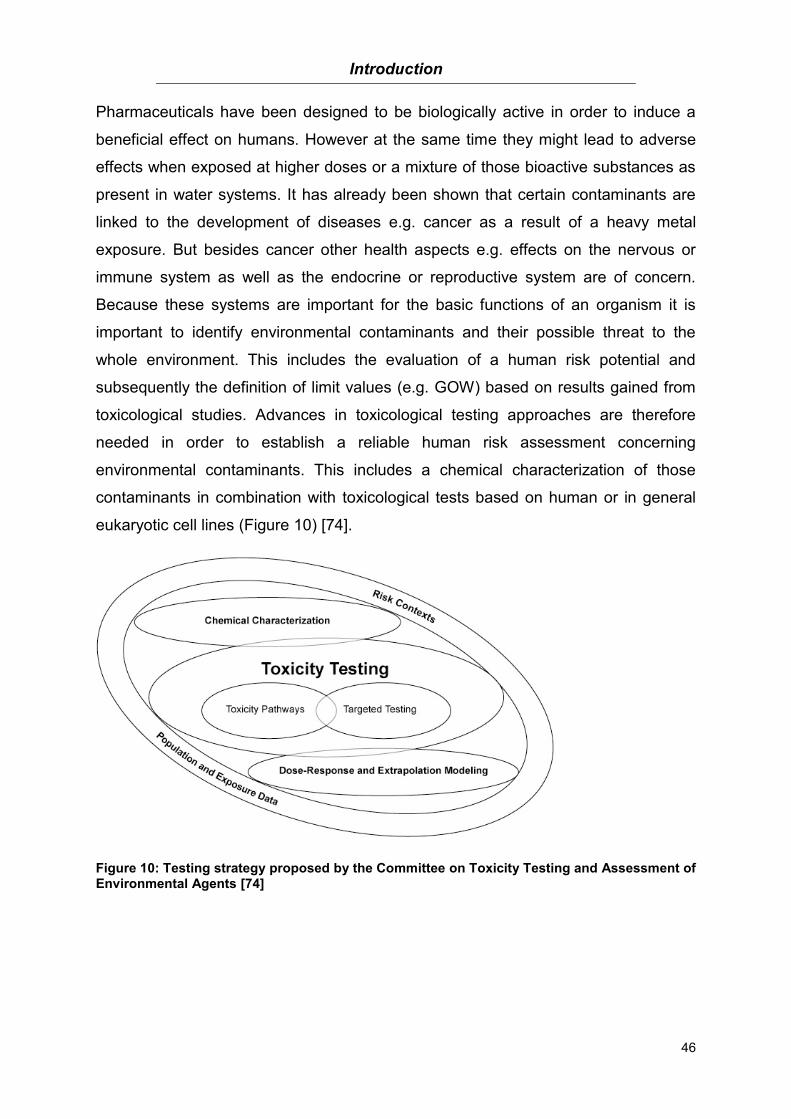
Introduction
46
Pharmaceuticals have been designed to be biologically active in order to induce a
beneficial effect on humans. However at the same time they might lead to adverse
effects when exposed at higher doses or a mixture of those bioactive substances as
present in water systems. It has already been shown that certain contaminants are
linked to the development of diseases e.g. cancer as a result of a heavy metal
exposure. But besides cancer other health aspects e.g. effects on the nervous or
immune system as well as the endocrine or reproductive system are of concern.
Because these systems are important for the basic functions of an organism it is
important to identify environmental contaminants and their possible threat to the
whole environment. This includes the evaluation of a human risk potential and
subsequently the definition of limit values (e.g. GOW) based on results gained from
toxicological studies. Advances in toxicological testing approaches are therefore
needed in order to establish a reliable human risk assessment concerning
environmental contaminants. This includes a chemical characterization of those
contaminants in combination with toxicological tests based on human or in general
eukaryotic cell lines (Figure 10) [74].
Figure 10: Testing strategy proposed by the Committee on Toxicity Testing and Assessment of Environmental Agents [74]

Introduction
47
Toxicological in vitro methods using cell culture based systems are thereby important
first step approaches to identify possible risks at the molecular level to gain
information on outcomes at the organisms or population level (Figure 11) [26].
Figure 11: Bioanalytical tools for the assessment of human health risks adapted from Escher et al. 2011 [26]
The field of toxicology in general deals with the detection and identification of
substance properties in regard to their potential to cause harm. The use of
toxicological in vitro methods for the testing of chemicals is widespread because they
can be used to gain data on the mechanisms of cell damage which in fact can be
transferred to humans. Especially with the focus on the REACH regulation
(Registration, Evaluation, Authorization and Restriction of Chemicals) by the EU
council the minimization of animal testing through the use of in vitro methods is
supposed [75].
On the basis of various of initiatives to reduce the number of animals in toxicity
testing [76-79] in regard to the “3R” principle (Replacement, Reduction, Refinement)
in vitro methods should be established and performed. A variety of studies have
been published proving a good correlation between in vivo and in vitro data but a
combination of both would be most favorable [80, 81]. In vivo studies require a large
amount of testing animals and range from short term acute studies to long term
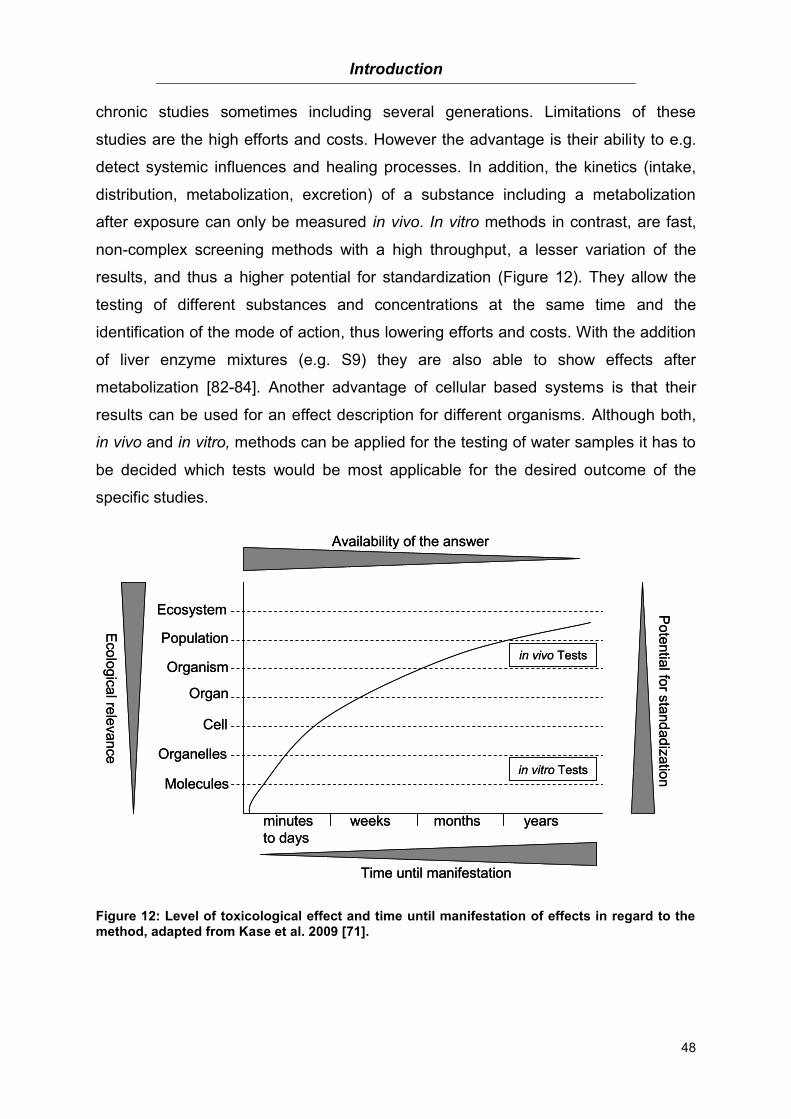
Introduction
48
chronic studies sometimes including several generations. Limitations of these
studies are the high efforts and costs. However the advantage is their ability to e.g.
detect systemic influences and healing processes. In addition, the kinetics (intake,
distribution, metabolization, excretion) of a substance including a metabolization
after exposure can only be measured in vivo. In vitro methods in contrast, are fast,
non-complex screening methods with a high throughput, a lesser variation of the
results, and thus a higher potential for standardization (Figure 12). They allow the
testing of different substances and concentrations at the same time and the
identification of the mode of action, thus lowering efforts and costs. With the addition
of liver enzyme mixtures (e.g. S9) they are also able to show effects after
metabolization [82-84]. Another advantage of cellular based systems is that their
results can be used for an effect description for different organisms. Although both,
in vivo and in vitro, methods can be applied for the testing of water samples it has to
be decided which tests would be most applicable for the desired outcome of the
specific studies.
Figure 12: Level of toxicological effect and time until manifestation of effects in regard to the method, adapted from Kase et al. 2009 [71].
in vitro Tests
in vivo Tests
minutes
to days
weeks months years
Time until manifestation
Pote
ntia
l for
sta
ndadiz
atio
n
Ecolo
gic
alre
leva
nce
Ecosystem
Population
Organism
Organ
Cell
Organelles
Molecules
Availability of the answer
in vitro Tests
in vivo Tests
minutes
to days
weeks months years
Time until manifestation
Pote
ntia
l for
sta
ndadiz
atio
n
Ecolo
gic
alre
leva
nce
Ecosystem
Population
Organism
Organ
Cell
Organelles
Molecules
Availability of the answer
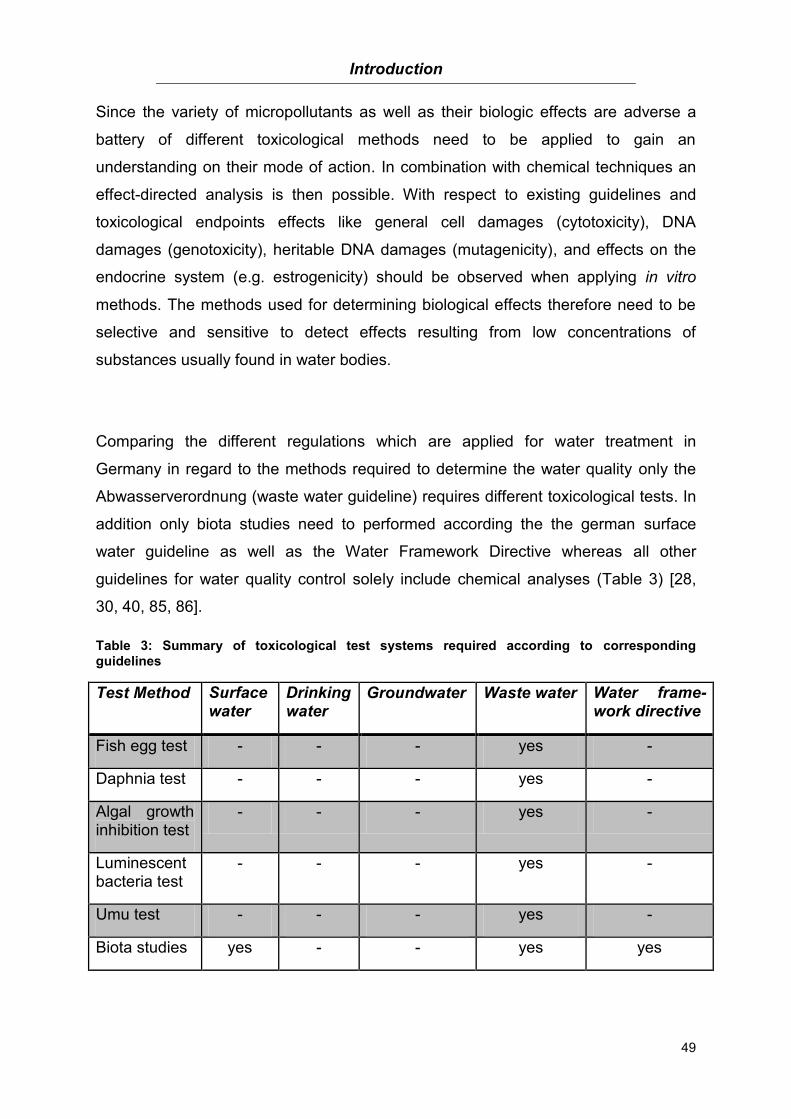
Introduction
49
Since the variety of micropollutants as well as their biologic effects are adverse a
battery of different toxicological methods need to be applied to gain an
understanding on their mode of action. In combination with chemical techniques an
effect-directed analysis is then possible. With respect to existing guidelines and
toxicological endpoints effects like general cell damages (cytotoxicity), DNA
damages (genotoxicity), heritable DNA damages (mutagenicity), and effects on the
endocrine system (e.g. estrogenicity) should be observed when applying in vitro
methods. The methods used for determining biological effects therefore need to be
selective and sensitive to detect effects resulting from low concentrations of
substances usually found in water bodies.
Comparing the different regulations which are applied for water treatment in
Germany in regard to the methods required to determine the water quality only the
Abwasserverordnung (waste water guideline) requires different toxicological tests. In
addition only biota studies need to performed according the the german surface
water guideline as well as the Water Framework Directive whereas all other
guidelines for water quality control solely include chemical analyses (Table 3) [28,
30, 40, 85, 86].
Table 3: Summary of toxicological test systems required according to corresponding guidelines
Test Method Surface water
Drinking water
Groundwater Waste water Water frame-work directive
Fish egg test - - - yes -
Daphnia test - - - yes -
Algal growth inhibition test
- - - yes -
Luminescent bacteria test
- - - yes -
Umu test - - - yes -
Biota studies yes - - yes yes

Introduction
50
A battery of four different biological in vitro tests was therefore used in this study to
determine the behavior of micropollutants in waste water treatment plant effluents
based on their cytotoxic, genotoxic, mutagenic, and estrogenic effects. Displayed in
Table 4 are the used test methods according to the mode of action.
Table 4: Used test systems
Cytotoxicity MTT Test Mitochondrial activity
PAN I:
LDHe
XTT Test
Neutral Red
Sulforhodamine B
Membrane integrity Mitochondrial activity Lysosomal activity Total protein content
Genotoxicity Alkaline Comet Assay Single strand and double strand DNA breaks, alkali labile sites
Mutagenicity Ames Test Frameshift (TA98) and base pair substitution mutations (TA100)
Estrogenicity ER Calux Human estrogen receptor activation
These in vitro tests were chosen since the focus was laid on the effects of
micropollutants and their oxidation by-products on the human health and considering
the requirements of the GOW concept which also includes the use of in vitro data for
the establishment of limit values. The tests were also chosen with regard to their
possible application for screening purposes due to their ease of applicability, low
costs and high throughput.
This battery of tests was then applied to the non-oxidized as well as to the oxidized
samples after ozonation or UV ± H2O2 treatment and first tested for cytotoxic
effects. In case of no cytotoxic effects the samples were then subsequently tested for
genotoxicity. The occurrence of mutagenic or estrogenic effects was further on only
investigated when the substances were known or supposed to induce such effects
(Figure 13). Chemical analyses (grey box) of the same samples were also performed
by collaborating groups but not as a part of this thesis.
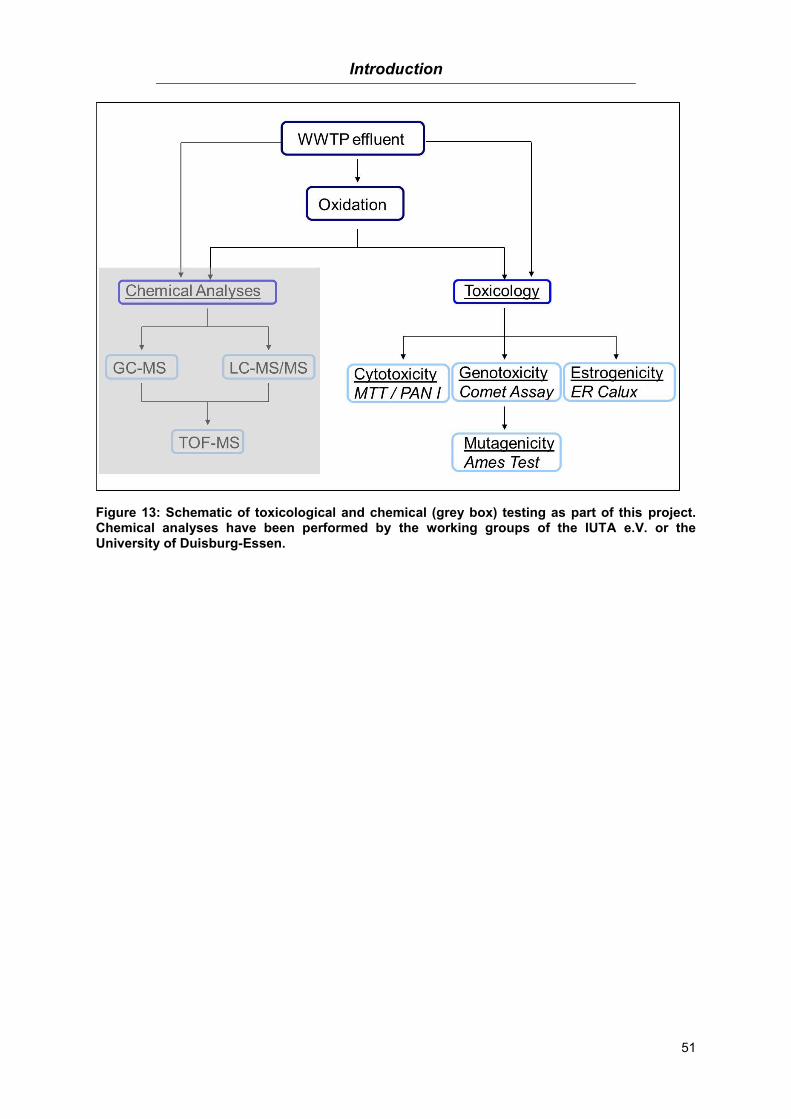
Introduction
51
Figure 13: Schematic of toxicological and chemical (grey box) testing as part of this project. Chemical analyses have been performed by the working groups of the IUTA e.V. or the University of Duisburg-Essen.

Introduction
52
2.2.1. Cytotoxicity
A substance is defined as cytotoxic when cellular functions are disturbed or if it
induces cell death. Tests to determine the cytotoxic effects of a single substance or a
mixture are used for the investigation of damages to basic cellular functions e.g.
membrane integrity or mitochondrial activity. These results can then be further used
for the investigation of other toxic effects (e.g. genotoxicity, mutagenicity and
estrogenicity) using sub-cytotoxic concentrations [84]. Due to the complexity of a
cell, the mode of action of chemicals differs depending on their affinity for certain
structures (e.g. membrane, mitochondria, lysosomes). So far no in vitro method
using mammalian cells for the detection of cytotoxic effects of water samples is
recommended in a guideline. However these in vitro methods are regulated in the
DIN EN ISO 10993-5:2009-10 guideline for the biological evaluation of medical
devices which includes the standard procedure for four different cytotoxicity methods
(Table 5) [87].
Table 5: Cytotoxicity tests required according to DIN EN ISO 10993-5:2009-10
Test method Toxicological endpoint
Neutral Red Test Lysosomal activity
Colony formation Test Ability to form colonies
MTT Test Mitochondrial activity
XTT Test Mitochondrial activity
However, despite these four tests, many others are available (e.g. trypanblue assay,
LDH) to investigate the variety of possible cytotoxic effects.
2.2.2. Genotoxicity
The field of genotoxicity deals with the identification of DNA damages previous to
mutations. These tests therefore give information on the level of structural DNA
damages but do not necessarily provide evidence for mutations. A variety of test
systems have been developed in order to detect changes at the DNA level. However
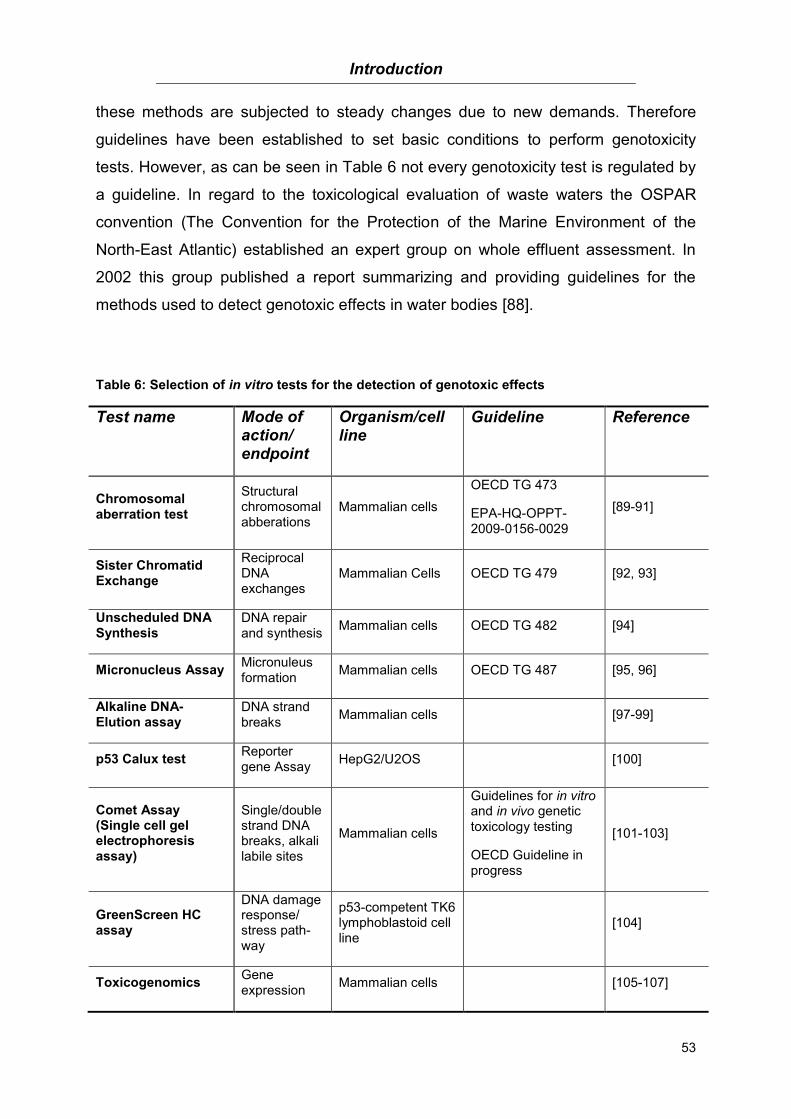
Introduction
53
these methods are subjected to steady changes due to new demands. Therefore
guidelines have been established to set basic conditions to perform genotoxicity
tests. However, as can be seen in Table 6 not every genotoxicity test is regulated by
a guideline. In regard to the toxicological evaluation of waste waters the OSPAR
convention (The Convention for the Protection of the Marine Environment of the
North-East Atlantic) established an expert group on whole effluent assessment. In
2002 this group published a report summarizing and providing guidelines for the
methods used to detect genotoxic effects in water bodies [88].
Table 6: Selection of in vitro tests for the detection of genotoxic effects
Test name Mode of action/ endpoint
Organism/cell line
Guideline Reference
Chromosomal aberration test
Structural chromosomal abberations
Mammalian cells
OECD TG 473
EPA-HQ-OPPT-2009-0156-0029
[89-91]
Sister Chromatid Exchange
Reciprocal DNA exchanges
Mammalian Cells OECD TG 479 [92, 93]
Unscheduled DNA Synthesis
DNA repair and synthesis
Mammalian cells OECD TG 482 [94]
Micronucleus Assay Micronuleus formation
Mammalian cells OECD TG 487 [95, 96]
Alkaline DNA-Elution assay
DNA strand breaks
Mammalian cells [97-99]
p53 Calux test Reporter gene Assay
HepG2/U2OS [100]
Comet Assay (Single cell gel electrophoresis assay)
Single/double strand DNA breaks, alkali labile sites
Mammalian cells
Guidelines for in vitro and in vivo genetic
toxicology testing
OECD Guideline in progress
[101-103]
GreenScreen HC assay
DNA damage response/ stress path-way
p53-competent TK6 lymphoblastoid cell line
[104]
Toxicogenomics Gene expression
Mammalian cells [105-107]
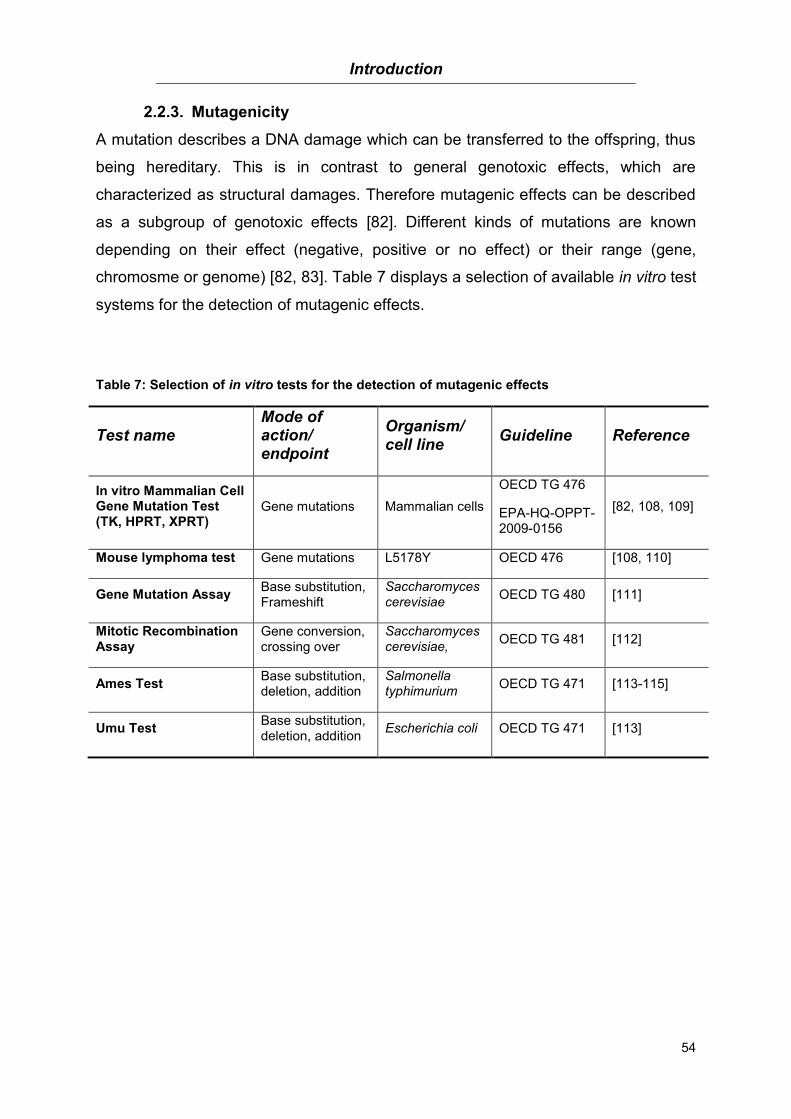
Introduction
54
2.2.3. Mutagenicity
A mutation describes a DNA damage which can be transferred to the offspring, thus
being hereditary. This is in contrast to general genotoxic effects, which are
characterized as structural damages. Therefore mutagenic effects can be described
as a subgroup of genotoxic effects [82]. Different kinds of mutations are known
depending on their effect (negative, positive or no effect) or their range (gene,
chromosme or genome) [82, 83]. Table 7 displays a selection of available in vitro test
systems for the detection of mutagenic effects.
Table 7: Selection of in vitro tests for the detection of mutagenic effects
Test name Mode of action/ endpoint
Organism/ cell line
Guideline Reference
In vitro Mammalian Cell Gene Mutation Test (TK, HPRT, XPRT)
Gene mutations Mammalian cells
OECD TG 476
EPA-HQ-OPPT-2009-0156
[82, 108, 109]
Mouse lymphoma test Gene mutations L5178Y OECD 476 [108, 110]
Gene Mutation Assay Base substitution, Frameshift
Saccharomyces cerevisiae
OECD TG 480 [111]
Mitotic Recombination Assay
Gene conversion, crossing over
Saccharomyces cerevisiae,
OECD TG 481 [112]
Ames Test Base substitution, deletion, addition
Salmonella typhimurium
OECD TG 471 [113-115]
Umu Test Base substitution, deletion, addition
Escherichia coli OECD TG 471 [113]
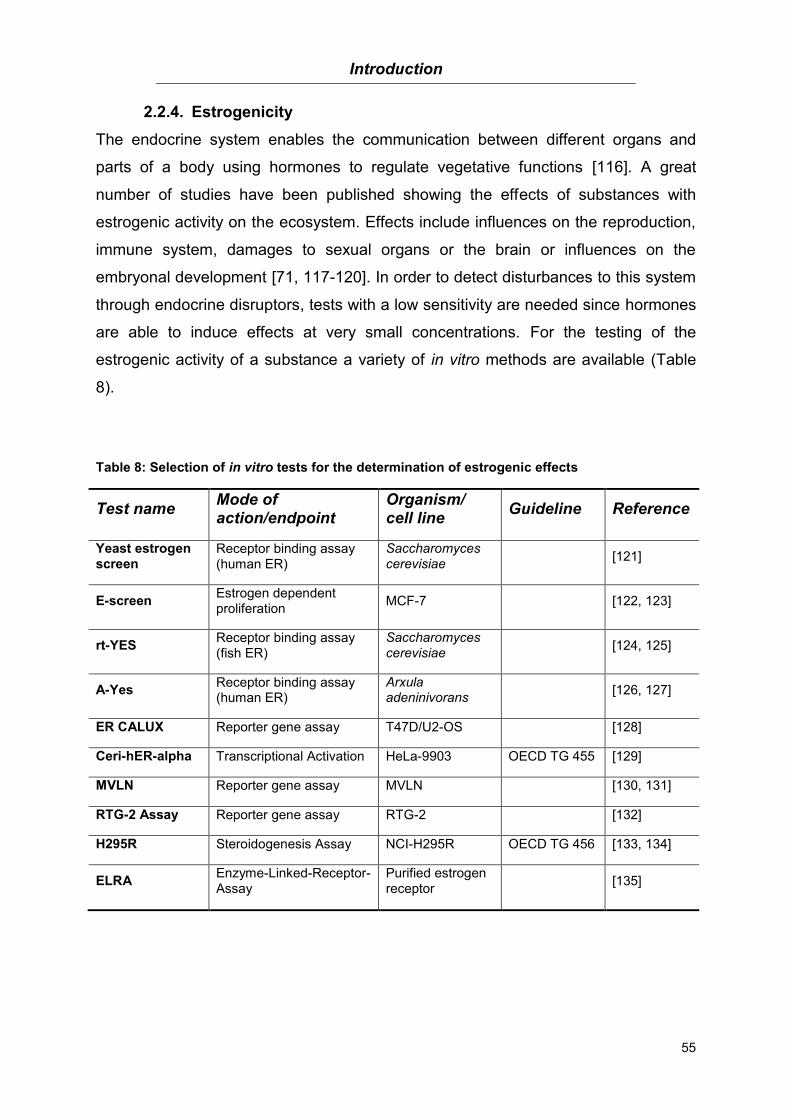
Introduction
55
2.2.4. Estrogenicity
The endocrine system enables the communication between different organs and
parts of a body using hormones to regulate vegetative functions [116]. A great
number of studies have been published showing the effects of substances with
estrogenic activity on the ecosystem. Effects include influences on the reproduction,
immune system, damages to sexual organs or the brain or influences on the
embryonal development [71, 117-120]. In order to detect disturbances to this system
through endocrine disruptors, tests with a low sensitivity are needed since hormones
are able to induce effects at very small concentrations. For the testing of the
estrogenic activity of a substance a variety of in vitro methods are available (Table
8).
Table 8: Selection of in vitro tests for the determination of estrogenic effects
Test name Mode of action/endpoint
Organism/ cell line
Guideline Reference
Yeast estrogen screen
Receptor binding assay (human ER)
Saccharomyces cerevisiae
[121]
E-screen Estrogen dependent proliferation
MCF-7 [122, 123]
rt-YES Receptor binding assay (fish ER)
Saccharomyces cerevisiae
[124, 125]
A-Yes Receptor binding assay (human ER)
Arxula adeninivorans
[126, 127]
ER CALUX Reporter gene assay T47D/U2-OS [128]
Ceri-hER-alpha Transcriptional Activation HeLa-9903 OECD TG 455 [129]
MVLN Reporter gene assay MVLN [130, 131]
RTG-2 Assay Reporter gene assay RTG-2 [132]
H295R Steroidogenesis Assay NCI-H295R OECD TG 456 [133, 134]
ELRA Enzyme-Linked-Receptor-Assay
Purified estrogen receptor
[135]
Introduction
56
Due to the variety of methods available, in vitro and in vivo, the OECD initiated a
task force on Endocrine Disruptor Testing and Assessment (EDTA) in the late 1990s
[136]. In 2002 the Conceptual Framework for the Testing and Assessment of
Endocrine Disrupting Chemicals was then released [137]. This framework includes
five levels of testing starting with a classification/sorting based on available
information (level 1) followed by in vitro assays (level 2) and in vivo testing (levels 3
to 5) suggesting test systems to be used. Kase et al. (2009) also supposed the use
of a combination of in vitro and in vivo test systems to evaluate endocrine effects as
well as others [71, 138]. This is in accordance to the OECD Conceptual Framework
which supposes a simultaneous measurement of cytotoxic and estrogenic effects
[137].
Although the number of available test systems for the evaluation of estrogenic
effects is high, only a few of them are regulated through guidelines. Therefore in
2011 a DIN working group has been formed in Germany to establish a guideline for
the estrogenicity testing in water systems (DIN-Arbeitskreis NA 119-01-03-05-09 AK
"Hormonelle Wirkungen (Xenohormone)).
Despite the variety of available toxicological test systems only few of them are
applied in water testing on a regular basis. Just a few of these methods are
regulated through guidelines and are not part of any guideline for the evaluation of
water quality.
Aims of the study
57
3. Aims of the study
Micropollutants are commonly detected in the aqueous environment because they
are not sufficiently removed durig conventional waste water treatment. These
micropollutants include biocides, pharmaceuticals, personal care products as well as
other chemicals. Since many of them are designed to be biologically active they
might pose a risk to the environment. In addition for most of these substances
knowledge about their environmental fate and toxicity is scarce. Thus additional
waste water treatment steps are needed. Therefore the aims of this study were
the adaptation and optimization of toxicological in vitro test methods for the
testing of water samples
the application of toxicological methods for the comparison of ozonation and
UV oxidation with H2O2 in regard to the removal of organic micropollutants
the comparison of ozonation and UV oxidation with H2O2 in regard to the
formation of toxic oxidation by-products
the toxicological evaluation of micropollutants and their oxidation by-products
before and after oxidative treatment
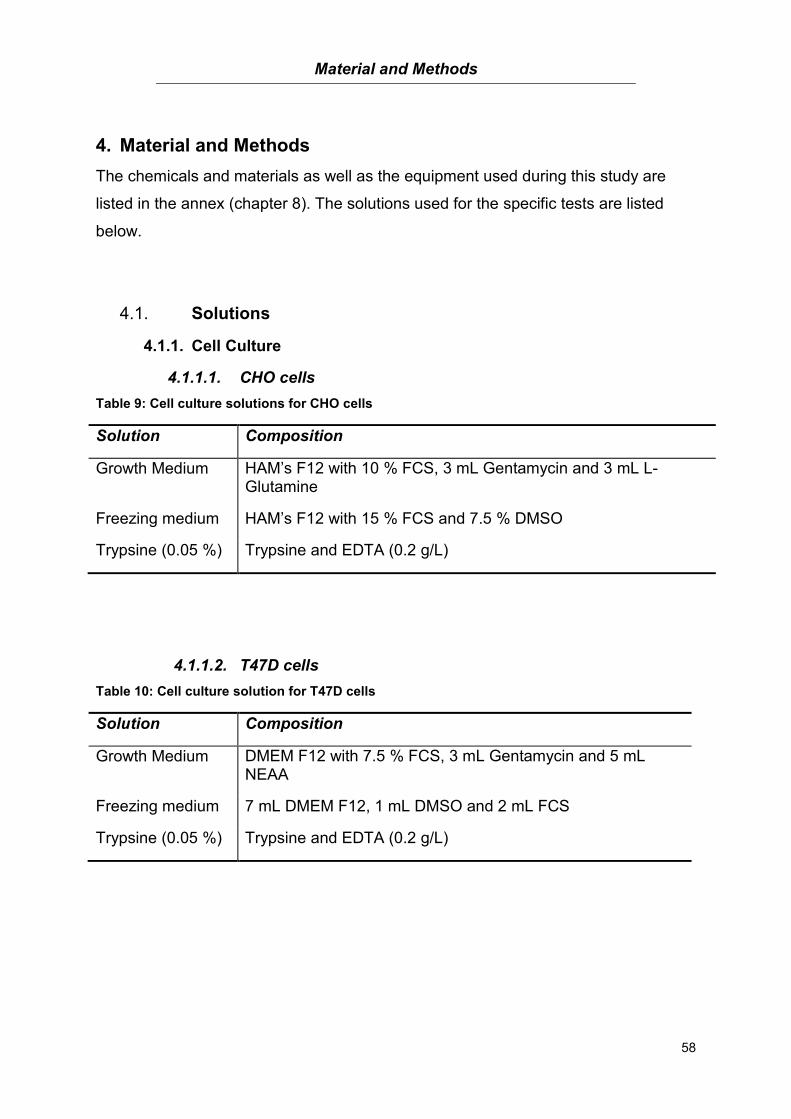
Material and Methods
58
4. Material and Methods
The chemicals and materials as well as the equipment used during this study are
listed in the annex (chapter 8). The solutions used for the specific tests are listed
below.
Solutions 4.1.
4.1.1. Cell Culture
4.1.1.1. CHO cells
Table 9: Cell culture solutions for CHO cells
Solution Composition
Growth Medium HAM’s F12 with 10 % FCS, 3 mL Gentamycin and 3 mL L-Glutamine
Freezing medium HAM’s F12 with 15 % FCS and 7.5 % DMSO
Trypsine (0.05 %) Trypsine and EDTA (0.2 g/L)
4.1.1.2. T47D cells
Table 10: Cell culture solution for T47D cells
Solution Composition
Growth Medium DMEM F12 with 7.5 % FCS, 3 mL Gentamycin and 5 mL NEAA
Freezing medium 7 mL DMEM F12, 1 mL DMSO and 2 mL FCS
Trypsine (0.05 %) Trypsine and EDTA (0.2 g/L)

Material and Methods
59
4.1.2. PAN I Multitox Test
Table 11: Solutions for the PAN I Multitox test
Solution Composition
Solvent control 4.5 mL HAM’s F12 and 0.5 mL Millipore water
Positive control 0.7 mL HAM’s F12 and 1 % Triton® X-100
LDH II / LDH III mix (1 plate) 16 mL LDH II and 3.4 mL LDH III
XTT I / XTT II mix (1 plate) 4 mL XTT I and 40 µL XTT II
4.1.3. MTT Test
Table 12: Solutions for the MTT test
Solution Composition
Solvent control 4.5 mL HAM’s F12 and 0.5 mL Millipore water
Positive control 0.7 mL HAM’s F12 and 1 % Triton® X-100
MTT solution 0.125 g 3-(4,5-Dimethylthiazol-2-yl)-2,5-diphenyltetrazoliumbromid dissolved in 25 mL DPBS and filter sterilized
Lysis solution 99.4 mL DMSO, 0.6 mL 100 % acetic acid and 10 g SDS
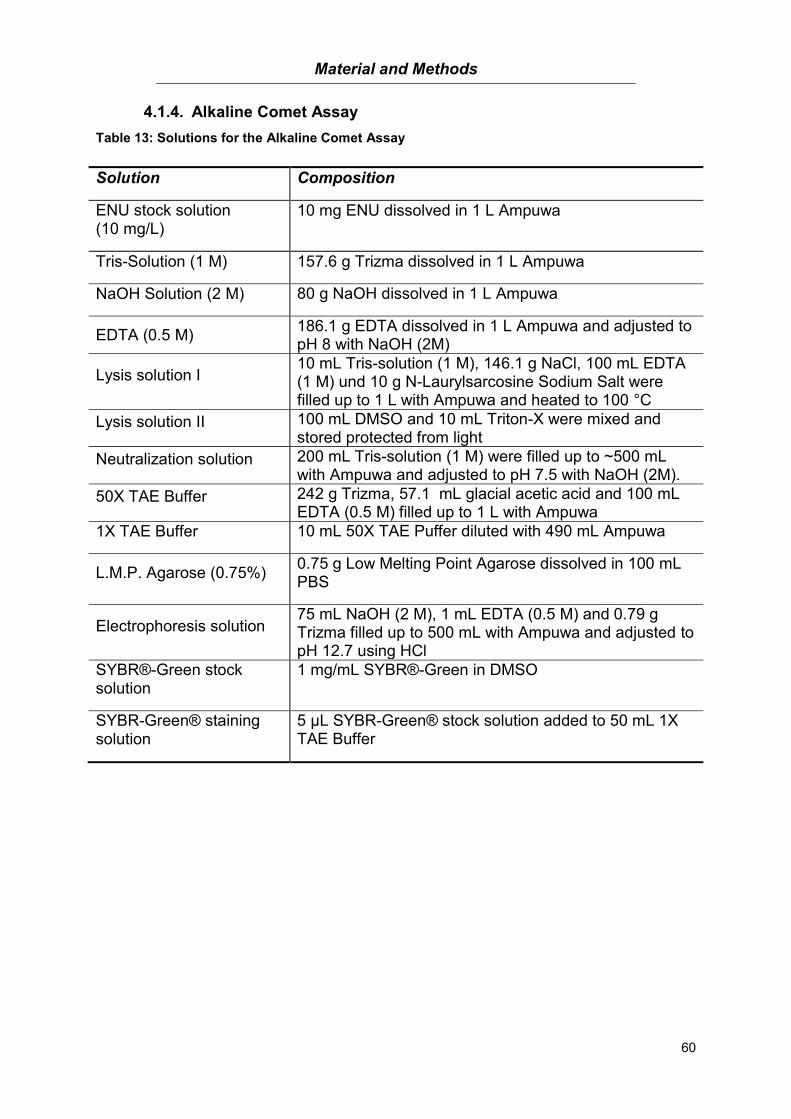
Material and Methods
60
4.1.4. Alkaline Comet Assay
Table 13: Solutions for the Alkaline Comet Assay
Solution Composition
ENU stock solution (10 mg/L)
10 mg ENU dissolved in 1 L Ampuwa
Tris-Solution (1 M) 157.6 g Trizma dissolved in 1 L Ampuwa
NaOH Solution (2 M) 80 g NaOH dissolved in 1 L Ampuwa
EDTA (0.5 M) 186.1 g EDTA dissolved in 1 L Ampuwa and adjusted to pH 8 with NaOH (2M)
Lysis solution I 10 mL Tris-solution (1 M), 146.1 g NaCl, 100 mL EDTA (1 M) und 10 g N-Laurylsarcosine Sodium Salt were filled up to 1 L with Ampuwa and heated to 100 °C
Lysis solution II 100 mL DMSO and 10 mL Triton-X were mixed and stored protected from light
Neutralization solution 200 mL Tris-solution (1 M) were filled up to ~500 mL with Ampuwa and adjusted to pH 7.5 with NaOH (2M).
50X TAE Buffer 242 g Trizma, 57.1 mL glacial acetic acid and 100 mL EDTA (0.5 M) filled up to 1 L with Ampuwa
1X TAE Buffer 10 mL 50X TAE Puffer diluted with 490 mL Ampuwa
L.M.P. Agarose (0.75%) 0.75 g Low Melting Point Agarose dissolved in 100 mL PBS
Electrophoresis solution 75 mL NaOH (2 M), 1 mL EDTA (0.5 M) and 0.79 g Trizma filled up to 500 mL with Ampuwa and adjusted to pH 12.7 using HCl
SYBR®-Green stock solution
1 mg/mL SYBR®-Green in DMSO
SYBR-Green® staining solution
5 µL SYBR-Green® stock solution added to 50 mL 1X TAE Buffer

Material and Methods
61
4.1.5. Ames Test
Table 14: Solutions for the Ames Test
Solution Composition
S9 Mix 1.438 mL S9 buffer salts, 0.063 mL S9 G-6-P, 0.250 mL S9 NADP, 0.750 mL S9 Fraction
4.1.6. ER Calux
Table 15: Solutions for the ER Calux
Solution Composition
Assay Medium I DMEM F12 (without phenol red) with 5 % stripped FCS and 5 mL NEAA
Assay Medium II 9 mL Assay Medium I and 1 mL Ampuwa
Assay Medium III 11 mL Assay Medium I and 11 µL DMSO
Lysis reagent (400 mL; pH 7.8) [purchased from BDS]
33.03 g Glycylglycine, 36.97 g MgSO4, 15.22 g EGTA, 4 mL Triton® X-100; 0.2 M NaOH to adjust pH
GlowMix (1 L; pH 7.8) [purchased from BDS]
3.58 g Tricine, 0.52 g C4H2Mg5O14, 0.60 g MgSO4, 0.037 g EDTA, 5.14 g DTT, 0.21 g Co-enzyme A, 0.15 g Luciferine, 0.29 g ATP

Material and Methods
62
Cell Culture methods 4.2.
4.2.1. CHO cells
CHO cells (Figure 14) are a permanent epithelian cell line derived from the ovaries of
the Chinese Hamster Cricetulus griseus by Puck et al. in 1957 [139]. These are
adherent cells cultivated in HAM’s F12 medium supplemented with 10 % FCS, 0.5 %
L-Glutamine and 0.5 % Gentamycin and grown at 37 °C with 5 % CO2 and 95 %
humidity.
Figure 14: CHO cells; passage 30
4.2.1.1. Thawing
Before the cells are thawed a cell culture flask (25 cm2) is filled with 10 mL preheated
HAM’s F12 medium (37 °C). The cryovial is then taken out of the liquid nitrogen and
quickly thawed using a waterbath (37 °C) until only a small frozen part is left.
Subsequently the cell suspension is transferred to the prepared culture flask and
stored in the incubator (37 °C, 5 % CO2, 95 % humidity). The next day the medium is
changed and the cells are again incubated until further use.
4.2.1.2. Subculturing
For passaging the medium is removed and the cells are washed once with PBS.
Culture flasks with a confluent cell growth are then trypsinated for 10 to 15 seconds
using a 0.05 % trypsin solution with EDTA. After discarding the trypsin the cells are
Material and Methods
63
incubated for 3 minutes at 37 °C. The trypsinated cells are then resuspended in
HAM’s F12 medium and counted with a Neubauer Chamber to determine the total
cell number. Depending on the further use, new culture flasks or well plates are then
seeded with the appropriate cell number.
4.2.1.3. Freezing
For the cryoconservation the CHO cells are trypsinated as described above and
resuspended in 15 mL HAM’s F12 medium. The cell suspension is then transferred
to a 15 mL vial and centrifuged at room temperature and 1200 rpm for 5 min. After
centrifugation the supernatant is removed and the cells are resuspended in cooled
(4 °C) freezing medium (HAM’s F12 with 15 % FCS and 7.5 % DMSO) and aliquots
of 1.8 mL are transferred to cryovials. The vials containing the cell suspension are
then frozen in a three step process. First the vials are kept at -20 °C for 1 hour and
then stored at -80 °C over night before they are kept in liquid nitrogen until further
use.
4.2.2. T47D cells
T47D cells (Figure 15) are cultivated in DMEM F12 (Dulbecco’s Modified Eagles
Medium: Nutrient Mixture F12) medium with phenolred in a CO2 incubator at 37 °C
with 5 % CO2 and 95 % humidity. These cells are a human breast adenocarcinoma
cell line which is stably transfected with an estrogen-responsive luciferase reporter
gene (pEREtata-Luc). This pEREtata-Luc reporter gene regulates the response of a
luciferase reporter gene construct containing three human estrogen-responsive
elements [128].

Material and Methods
64
Figure 15: T47D cells; passage 22
4.2.2.1. Thawing
Three new culture flasks are filled with 10 mL of growth medium and kept in the
incubator for 4 h. The cells in the cryovial are thawed until just a little ice is visible
before 0.5 mL of growth medium from the culture flask is added to the cryovial. Then
the cell suspension is transferred into the three previously prepared culture flasks as
described below, before the flasks are stored in the incubator until further use:
Culture flask 1: 150 μL cell suspension
Culture flask 2: 450 μL cell suspension
Culture flask 3: 900 μL cell suspension
4.2.2.2. Subculturing
When a confluent growth of 85 – 95 % is reached the cells are subcultured into new
culture flasks. For this the medium is removed, the cells are washed with 5 mL PBS
and trypsinated with 2 mL trypsin for 10 seconds. The trypsin is then removed and
the flask is stored in the incubator for 5 minutes. After this step, the cells are
resuspended in 10 mL growth medium and the appropriate volume of suspension is
added to a new culture flask.
4.2.2.3. Freezing
The freezing medium is prepared fresh and stored on ice until use. The cells are
trypsinated as described above and resuspended in 10 mL growth medium. The

Material and Methods
65
suspension is transferred into a sterile tube and centrifuged at 1100 rpm for
5 minutes. Then the supernatant is removed and the cell pellet is resuspended in
4 mL of ice-cold freezing medium. 1 mL of this suspension is then pipetted into the
cryovials which have been stored on ice. After storing the cryovials at -80 °C for one
day they are transferred to liquid nitrogen for long-term storage.
Toxicological methods 4.3.
4.3.1. Cytotoxicity
4.3.1.1. PAN I: LDHe – XTT – NR – SRB
For the determination of cytotoxicity the PAN I: LDHe-XTT-NR-SRB test was used.
This test allows the combined colorimetric detection of plasma membrane integrity,
mitochondrial activity, lysosomal integrity and the rate of protein synthesis of cells
exposed to various substances, i.e. chemicals, pharmaceuticals or other
anthropogenic compounds. The advantage of this approach is the sequential
measurement of four parameters using just one cell culture.
LDHe
This test allows the detection of the extracellular lactate dehydrogenase by
measuring the oxidation rate of NADH to NAD+ as well as the reduction of pyruvate
to lactate:
The lactate dehydrogenase (LDH) is a stable enzyme present in the cytoplasm of all
cells. Damages to the cell membrane result in a release of LDH into the cell culture
medium. However since LDH has a molecular weight of 140 kDa it does not easily
penetrate the cell membrane and a high amount of damage is needed in order to
Pyruvate + NADH + H+ → Lactate + NAD
+

Material and Methods
66
detect LDH outside the cytoplasm [140]. This release can then be determined
kinetically by measuring the consumption of NADH.
XTT
The mitochondrial activity is determined using the XTT test. XTT (2.3-bis(2-methoxy-
4-nitro-5-sulfophenyl)-2H-tetrazolium-5-carboxyanilide inner salt) is a yellow
tetrazolium salt which gets cleaved to an orange formazan by the enzyme succinate
dehydrogenase (Figure 16) [140]. For their survival viable cells need an intact
mitochondrial respiratory chain. In the case of an exposure to a cytotoxic substance
which affects the mitochondria, XTT will not be cleaved and a change in enzyme
activity can then be measured photometrically. The reduction rate of XTT therefore
directly correlates with the mitochondrial activity/integrity.
Figure 16: Chemical equation of the XTT cleavage to XTT formazan by succinate
dehydrogenases
Neutral Red (NR)
Neutral Red (Figure 17) is a cationic dye used to determine the viability of cells since
it penetrates the cell membrane by nonionic passive diffusion and binds to anionic
and phosphate groups within the lysosomes. This is possible due to the pH gradient
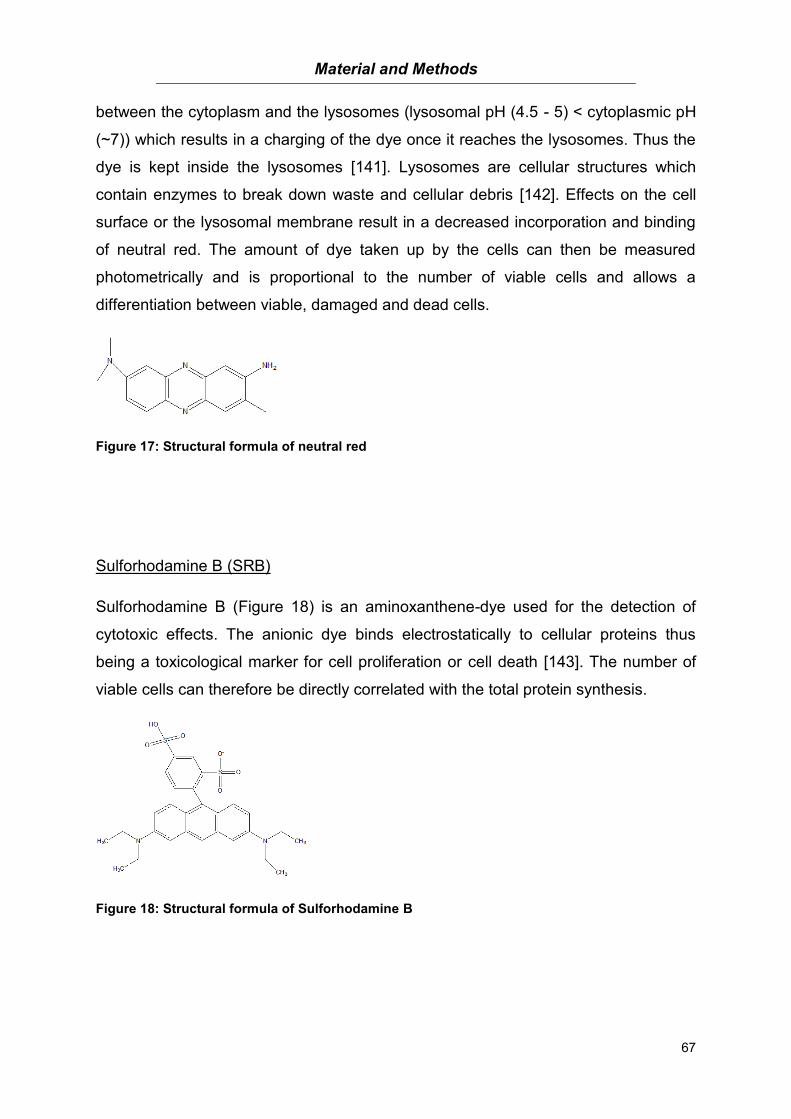
Material and Methods
67
between the cytoplasm and the lysosomes (lysosomal pH (4.5 - 5) < cytoplasmic pH
(~7)) which results in a charging of the dye once it reaches the lysosomes. Thus the
dye is kept inside the lysosomes [141]. Lysosomes are cellular structures which
contain enzymes to break down waste and cellular debris [142]. Effects on the cell
surface or the lysosomal membrane result in a decreased incorporation and binding
of neutral red. The amount of dye taken up by the cells can then be measured
photometrically and is proportional to the number of viable cells and allows a
differentiation between viable, damaged and dead cells.
Figure 17: Structural formula of neutral red
Sulforhodamine B (SRB)
Sulforhodamine B (Figure 18) is an aminoxanthene-dye used for the detection of
cytotoxic effects. The anionic dye binds electrostatically to cellular proteins thus
being a toxicological marker for cell proliferation or cell death [143]. The number of
viable cells can therefore be directly correlated with the total protein synthesis.
Figure 18: Structural formula of Sulforhodamine B
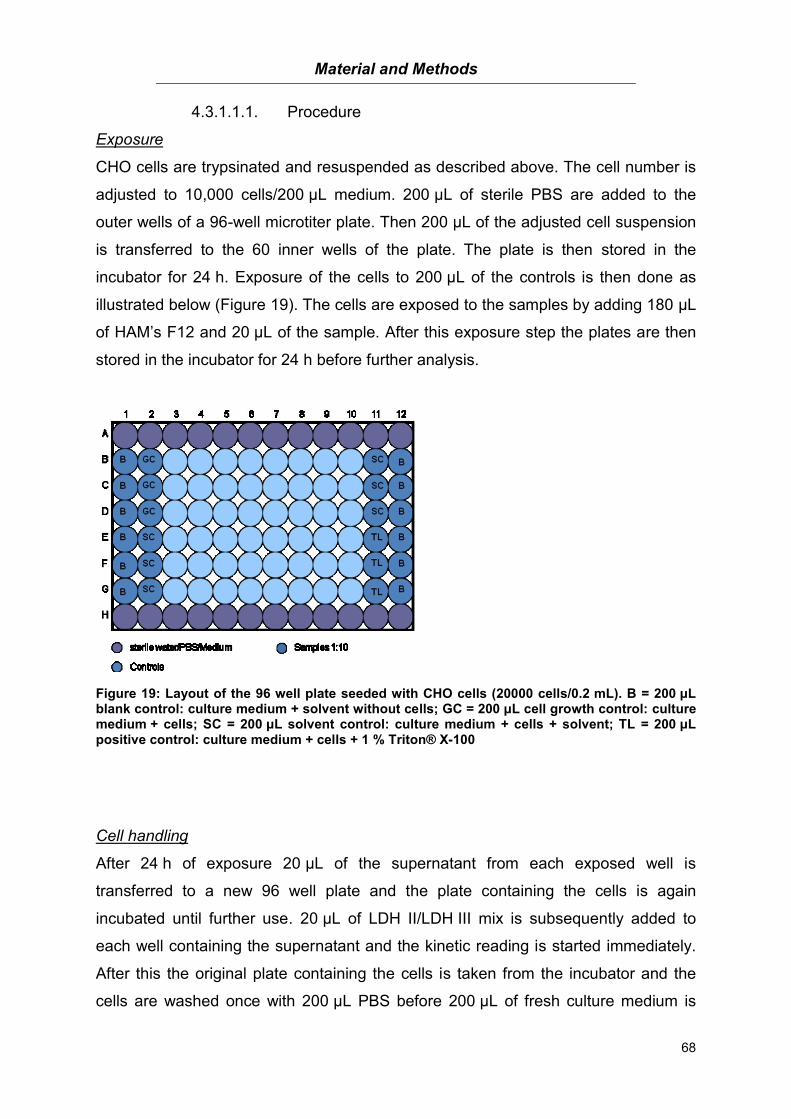
Material and Methods
68
4.3.1.1.1. Procedure
Exposure
CHO cells are trypsinated and resuspended as described above. The cell number is
adjusted to 10,000 cells/200 μL medium. 200 μL of sterile PBS are added to the
outer wells of a 96-well microtiter plate. Then 200 μL of the adjusted cell suspension
is transferred to the 60 inner wells of the plate. The plate is then stored in the
incubator for 24 h. Exposure of the cells to 200 μL of the controls is then done as
illustrated below (Figure 19). The cells are exposed to the samples by adding 180 μL
of HAM’s F12 and 20 μL of the sample. After this exposure step the plates are then
stored in the incubator for 24 h before further analysis.
Figure 19: Layout of the 96 well plate seeded with CHO cells (20000 cells/0.2 mL). B = 200 μL blank control: culture medium + solvent without cells; GC = 200 μL cell growth control: culture medium + cells; SC = 200 μL solvent control: culture medium + cells + solvent; TL = 200 μL positive control: culture medium + cells + 1 % Triton® X-100
Cell handling
After 24 h of exposure 20 μL of the supernatant from each exposed well is
transferred to a new 96 well plate and the plate containing the cells is again
incubated until further use. 20 μL of LDH II/LDH III mix is subsequently added to
each well containing the supernatant and the kinetic reading is started immediately.
After this the original plate containing the cells is taken from the incubator and the
cells are washed once with 200 μL PBS before 200 μL of fresh culture medium is
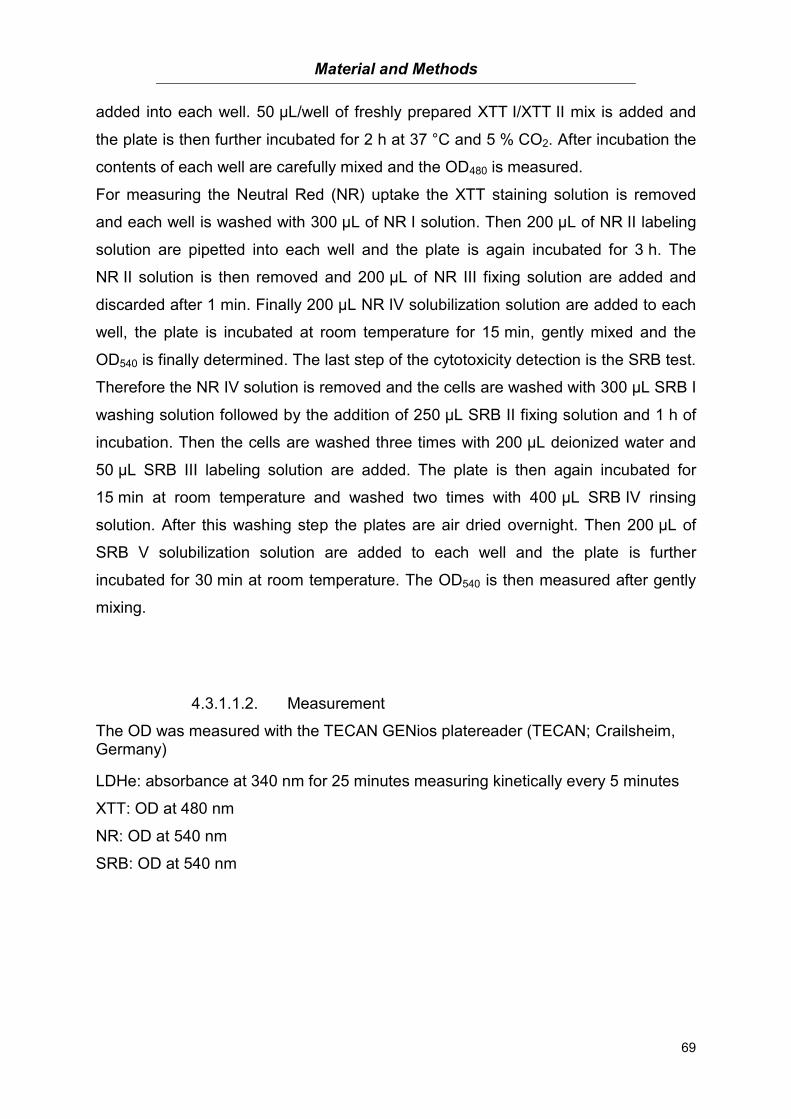
Material and Methods
69
added into each well. 50 μL/well of freshly prepared XTT I/XTT II mix is added and
the plate is then further incubated for 2 h at 37 °C and 5 % CO2. After incubation the
contents of each well are carefully mixed and the OD480 is measured.
For measuring the Neutral Red (NR) uptake the XTT staining solution is removed
and each well is washed with 300 μL of NR I solution. Then 200 μL of NR II labeling
solution are pipetted into each well and the plate is again incubated for 3 h. The
NR II solution is then removed and 200 μL of NR III fixing solution are added and
discarded after 1 min. Finally 200 μL NR IV solubilization solution are added to each
well, the plate is incubated at room temperature for 15 min, gently mixed and the
OD540 is finally determined. The last step of the cytotoxicity detection is the SRB test.
Therefore the NR IV solution is removed and the cells are washed with 300 μL SRB I
washing solution followed by the addition of 250 μL SRB II fixing solution and 1 h of
incubation. Then the cells are washed three times with 200 μL deionized water and
50 μL SRB III labeling solution are added. The plate is then again incubated for
15 min at room temperature and washed two times with 400 μL SRB IV rinsing
solution. After this washing step the plates are air dried overnight. Then 200 μL of
SRB V solubilization solution are added to each well and the plate is further
incubated for 30 min at room temperature. The OD540 is then measured after gently
mixing.
4.3.1.1.2. Measurement
The OD was measured with the TECAN GENios platereader (TECAN; Crailsheim, Germany)
LDHe: absorbance at 340 nm for 25 minutes measuring kinetically every 5 minutes
XTT: OD at 480 nm
NR: OD at 540 nm
SRB: OD at 540 nm
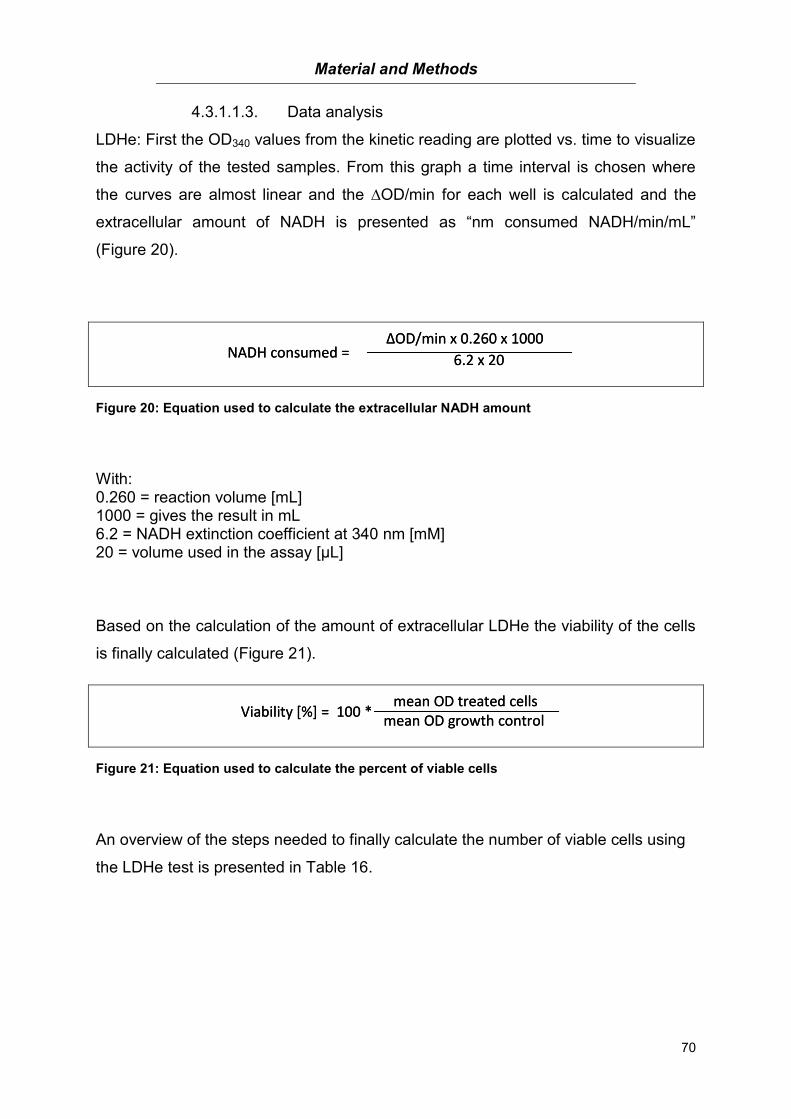
Material and Methods
70
4.3.1.1.3. Data analysis
LDHe: First the OD340 values from the kinetic reading are plotted vs. time to visualize
the activity of the tested samples. From this graph a time interval is chosen where
the curves are almost linear and the ∆OD/min for each well is calculated and the
extracellular amount of NADH is presented as “nm consumed NADH/min/mL”
(Figure 20).
Figure 20: Equation used to calculate the extracellular NADH amount
With: 0.260 = reaction volume [mL] 1000 = gives the result in mL 6.2 = NADH extinction coefficient at 340 nm [mM] 20 = volume used in the assay [μL]
Based on the calculation of the amount of extracellular LDHe the viability of the cells
is finally calculated (Figure 21).
Figure 21: Equation used to calculate the percent of viable cells
An overview of the steps needed to finally calculate the number of viable cells using
the LDHe test is presented in Table 16.
NADH consumed = ∆OD/min x 0.260 x 1000
6.2 x 20NADH consumed = ∆OD/min x 0.260 x 1000
6.2 x 20
Viability [%] = 100 * mean OD treated cells
mean OD growth controlViability [%] = 100 *
mean OD treated cellsmean OD growth control

Material and Methods
71
Table 16: Steps of calculating the viability of the LDHe test
Step Calculation
1. tstart linearity – tend linearity
2. (tstart linearity – tend linearity)/min
3. (tstart linearity – tend linearity)/min - blank
4. Units NADH consumed
5. Viability
The % viability in the XTT, the NR and SRB test is calculated the same way. First the
mean OD values for each sample and control are calculated. Then the mean OD
values of the samples and the controls are corrected by subtracting the mean OD of
the blank. Finally the viability is determined using the following equation:
4.3.1.2. MTT Test
The MTT test is a colorimetric assay used to detect cytotoxic effects based on the
cleavage of the MTT tetrazolium salt (3-(4,5-dimethylthiazol-2-yl)-2,5-diphenyl
tetrazolium bromide). The principle of the MTT test is the same as for the XTT test
with the difference in the solubility of the tetrazolium salts. Mitochondrial
dehydrogenases cleave the MTT resulting in an unsoluble formazan (Figure 22) thus
measuring the mitochondrial activity. Cells which are exposed to a cytotoxic sample
might have a compromised mitochondrial respiratory chain resulting in a lesser
content of the formazan which allows a direct correlation of transformed MTT and the
number of viable cells [144, 145].
Viability [%] = 100 * corrected mean OD sample
corrected mean OD solvent controlViability [%] =
100 * corrected mean OD sample
corrected mean OD solvent control
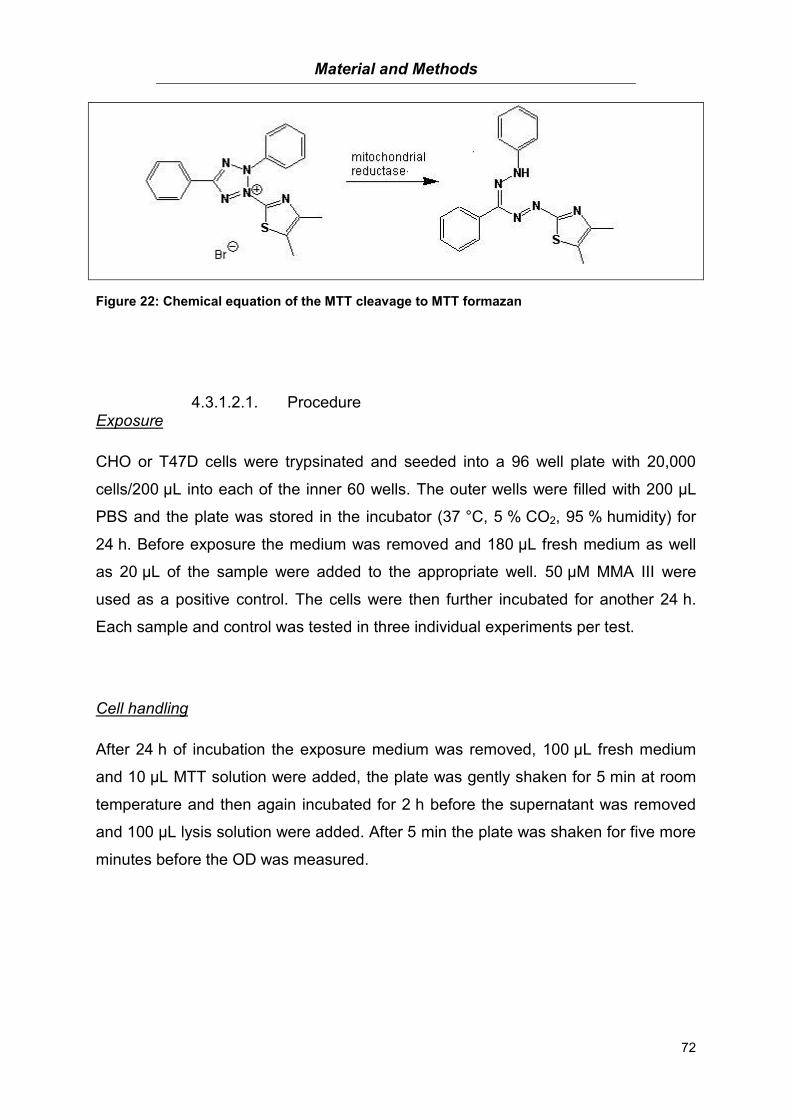
Material and Methods
72
Figure 22: Chemical equation of the MTT cleavage to MTT formazan
4.3.1.2.1. Procedure Exposure
CHO or T47D cells were trypsinated and seeded into a 96 well plate with 20,000
cells/200 µL into each of the inner 60 wells. The outer wells were filled with 200 µL
PBS and the plate was stored in the incubator (37 °C, 5 % CO2, 95 % humidity) for
24 h. Before exposure the medium was removed and 180 µL fresh medium as well
as 20 µL of the sample were added to the appropriate well. 50 µM MMA III were
used as a positive control. The cells were then further incubated for another 24 h.
Each sample and control was tested in three individual experiments per test.
Cell handling
After 24 h of incubation the exposure medium was removed, 100 µL fresh medium
and 10 µL MTT solution were added, the plate was gently shaken for 5 min at room
temperature and then again incubated for 2 h before the supernatant was removed
and 100 µL lysis solution were added. After 5 min the plate was shaken for five more
minutes before the OD was measured.
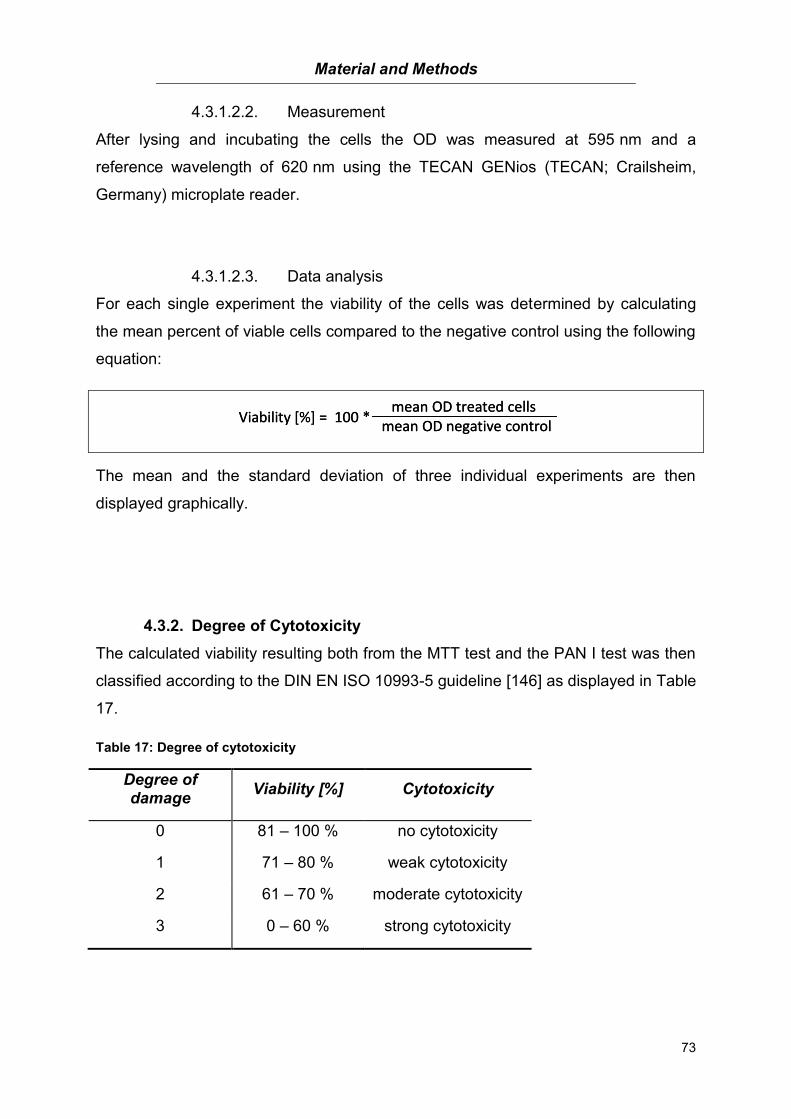
Material and Methods
73
4.3.1.2.2. Measurement
After lysing and incubating the cells the OD was measured at 595 nm and a
reference wavelength of 620 nm using the TECAN GENios (TECAN; Crailsheim,
Germany) microplate reader.
4.3.1.2.3. Data analysis
For each single experiment the viability of the cells was determined by calculating
the mean percent of viable cells compared to the negative control using the following
equation:
The mean and the standard deviation of three individual experiments are then
displayed graphically.
4.3.2. Degree of Cytotoxicity
The calculated viability resulting both from the MTT test and the PAN I test was then
classified according to the DIN EN ISO 10993-5 guideline [146] as displayed in Table
17.
Table 17: Degree of cytotoxicity
Degree of damage
Viability [%] Cytotoxicity
0 81 – 100 % no cytotoxicity
1 71 – 80 % weak cytotoxicity
2 61 – 70 % moderate cytotoxicity
3 0 – 60 % strong cytotoxicity
Viability [%] = 100 * mean OD treated cells
mean OD negative controlViability [%] = 100 *
mean OD treated cellsmean OD negative control

Material and Methods
74
4.3.3. Genotoxicity
4.3.3.1. Alkaline Comet Assay
The Comet Assay is a technique used to measure DNA damage. These damages
can result from two different types of effects. Either endogenous e.g. through
reactive oxygen species (ROS) formed during metabolic activity, or exogenous
caused by different types of radiation or chemicals, thus substances from outside the
cell. DNA damaging agents can then induce a variety of effects on the DNA. One
type of damage is the DNA strand break. These breaks can occur either directly by
ROS attacking the sugar-phosphate backbone of the DNA or through the activity of
endonucleases during DNA repair processes. Another type of DNA damage are
alkali-labile sites. These are then transformed into DNA single-strand breaks under
alkaline conditions and can therefore also be detected using the alkaline comet
assay [82].
The Comet Assay is a sensitive microgel electrophoresis technique to detect DNA
damage in single cells and was first described by Ostling et al. in 1984 [102]. They
embedded the cells in agarose, lysed them in a neutral detergent solution and
applied a weak electric field. During electrophoresis the positively charged DNA
migrates towards the anode. In case of a damage DNA fragments of different sizes
will migrate in a certain pattern which looks like a comet, while undamaged DNA
appears as a solid circle (Figure 23). Various fluorescent stains which bind DNA can
then be used to visualize the DNA and to analyze its degree of damage by means of
the migration pattern. However, the limitation of this approach is the neutral lysing
condition since this only allows the detection of double strand breaks. Therefore
Singh et al. (1988) further optimized this method. They used alkaline conditions
during lysis and electrophoresis which resulted in a more sensitive assay detecting
both single strand and double strand DNA breaks as well as alkali labile sites [103].
In the present study I further modified the method described above for the use of
CHO cells and the testing of water samples according to the procedures described
by Singh et al. and to the guidelines for in vitro testing published by Tice et al. (2000)
[101].

Material and Methods
75
Figure 23: Comet Assay analysis of undamaged (a) and damaged (b) CHO cells stained with SYBR Green® and analyzed using the Comet Assay 4 Software.
4.3.3.1.1. Procedure
Exposure:
CHO cells were cultured in HAM’s F12 medium. 24 h prior to exposure the cells were
seeded in 24 well plates with 100,000 cells per well in 2 mL medium. Before
exposure the medium was removed and fresh medium was added. The cells were
then exposed to the samples for 24 h at a 1:10 ratio (1.8 mL medium and 0.2 ml
sample). 0.1 mg/mL N-ethyl-N-nitrosourea (ENU) were used as a positive control
and the cells were exposed for 30 min.
Microgel preparation:
Microgels were prepared by sticking a chamber slide with eight chambers to a
GelBond® film. Each chamber was sealed by adding 50 μL low melting point
(L.M.P.) agarose which was then allowed to solidify on ice.
Cell handling:
After exposure the medium was discarded and the cells were washed with 1 mL
PBS. Then the cells were trypsinated for 10 sec followed by 3 min of incubation at
37 °C without trypsin. Depending on their confluency they were then resuspended in
PBS, counted, and the cell number was adjusted to 8000 cells/20 μL. These 20 µL of
each cell suspension were then mixed with 45 μL L.M.P. agarose and added to the
prepared chambers. After all gels were solidified, the chamber slides were removed

Material and Methods
76
and the film was placed in a 4 °C tempered lysis solution and stored at 4 °C over
night.
Electrophoresis:
For electrophoresis the freshly prepared solution was cooled down to 4 °C before
use. Prior to applying the electric field the films were incubated in electrophoresis
solution for 20 min and the electrophoresis was then run for 20 min at 300 mA. Then
the films were transferred to neutralization solution for 30 min and further transferred
to ethanol absolute for 2 h before the gels were left to dry over night.
Staining:
The dried gels were stained with the SYBR-Green® working solution for 18 min and
gently washed with water. To avoid air bubbles a few water drops were added onto
the film before a cover glass was applied.
4.3.3.1.2. Analysis
For analysis the Comet Assay 4 software from Perceptive Instruments was used.
Each gelbond film contains eight microgels including a positive and a negative
control (Figure 24a). The gels were analyzed in an s-shaped pattern (Figure 24b)
always starting at the top left corner until 50 nuclei had been scored. As a measure
of DNA damage the Olive Tail Moment [147] is displayed graphically
Figure 24: a) Gelbond film containing eight microgels. b) Scoring pattern of a single microgel. pos = positive control; neg = negative control; 1 – 6 = gels containing cells exposed to the samples.

Material and Methods
77
4.3.3.1.3. Statistics
Statistical analysis was done using GraphPad Prism column analysis. The data of
three individual experiments were summarized and plotted using their mean value
and the standard error of mean. The significance of DNA damage compared to the
negative control was analyzed using the Mann-Whitney Test and classified
according to the p-value (Table 18).
Table 18: Significance of DNA damage according to the Mann Whitney Test
P-value > 0.05 0.01 – 0.05 0.001 – 0.01 < 0.001
P-value summary
n.s. * ** ***
Significance not significant significant very significant highly
significant

Material and Methods
78
4.3.4. Mutagenicity
4.3.4.1. Ames Test
Mutagenic activity of water samples containing chemicals and other substances was
detected using the Ames MPFTM 98/100 Aqua. The two used histidin-dependent
Salmonella typhimurium strains TA98 and TA100 either carry a frameshift mutation
(TA98) or a base substitution mutation (TA100) in their histidin operon [148]. Thus
they are not able to synthesize histidin themselves and need histidin-containing
medium to grow. Once the Salmonella are exposed to samples with mutagenic
activity and a frameshift or base substitution mutation takes place the bacteria are
able to grow in histidin-free medium, since they regained their ability to synthesize
histidin [149].
The test is then performed in two different ways. Due to the fact that some
substances are only activated through metabolization and bacteria lack the
appropriate eukaryotic metabolic enzymes the exposure is done with and without the
addition of a liver enzyme mix (S9 Mix). This addition results in an in vitro
metabolization of the tested substances thus the mutagenic activity of metabolites
can also be detected [148, 149].
4.3.4.1.1. Procedure
The Ames test was performed using the AMES MPFTM 98/100 Aqua version
provided by Xenomtrix (CH). This test includes the Salmonella typhimurium strains
TA98 and TA100. Two Erlenmeyer flasks were filled with 10 mL growth medium and
10 µL ampicillin (50 mg/mL). In addition a third Erlenmeyer flask was filled with
10 mL medium only as a negative control. The vials containing the bacterial
suspension were thawed and 50 µL of the suspension were transferred to the
prepared Erlenmeyer flasks which were then incubated for 16 h in a shaking water
bath at 37 °C. After incubation the OD was measured at 600 nm. For that purpose
900 µL of growth medium and 100 µL of the bacterial suspension as well as the
negative control were filled into cuvettes and measured. The samples were then
tested in triplicate with and without metabolic activation by S9 using a 24-Well plate.
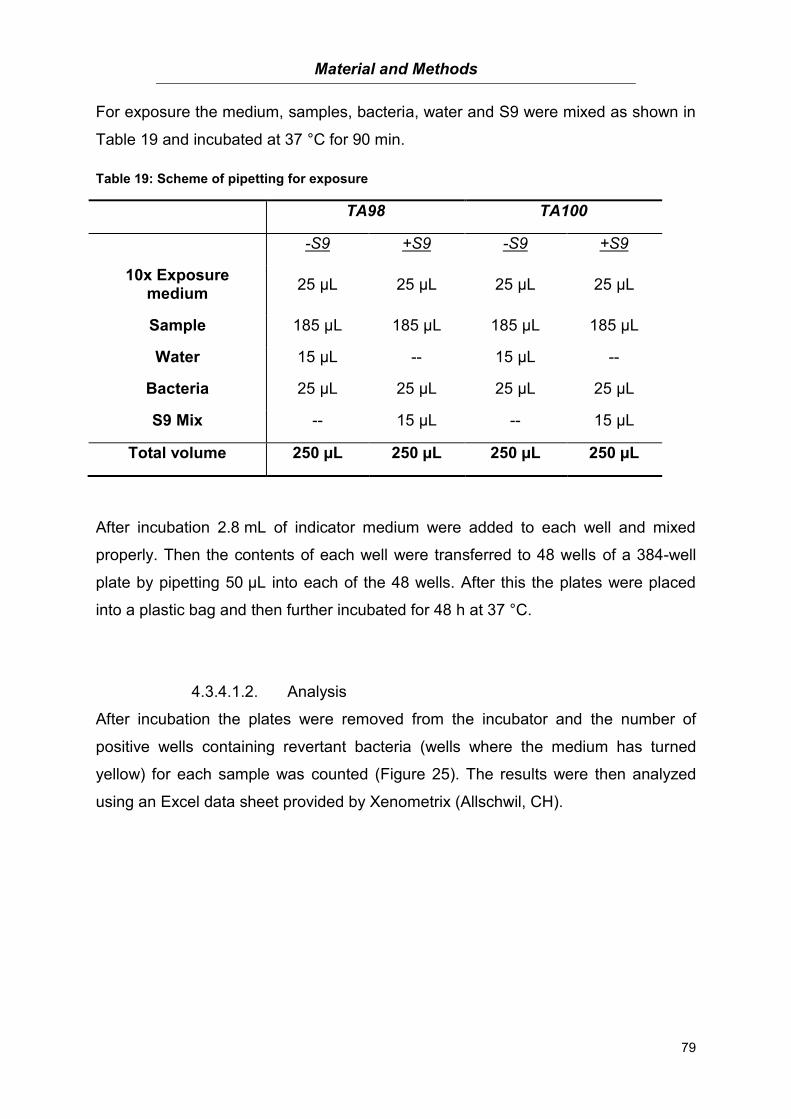
Material and Methods
79
For exposure the medium, samples, bacteria, water and S9 were mixed as shown in
Table 19 and incubated at 37 °C for 90 min.
Table 19: Scheme of pipetting for exposure
TA98 TA100
-S9 +S9 -S9 +S9
10x Exposure medium
25 µL 25 µL 25 µL 25 µL
Sample 185 µL 185 µL 185 µL 185 µL
Water 15 µL -- 15 µL --
Bacteria 25 µL 25 µL 25 µL 25 µL
S9 Mix -- 15 µL -- 15 µL
Total volume 250 µL 250 µL 250 µL 250 µL
After incubation 2.8 mL of indicator medium were added to each well and mixed
properly. Then the contents of each well were transferred to 48 wells of a 384-well
plate by pipetting 50 µL into each of the 48 wells. After this the plates were placed
into a plastic bag and then further incubated for 48 h at 37 °C.
4.3.4.1.2. Analysis
After incubation the plates were removed from the incubator and the number of
positive wells containing revertant bacteria (wells where the medium has turned
yellow) for each sample was counted (Figure 25). The results were then analyzed
using an Excel data sheet provided by Xenometrix (Allschwil, CH).

Material and Methods
80
Figure 25: 384-Well plate after 48 h of exposure. The medium of the positive wells containing bacteria with reversed mutations has changed to yellow and the medium of the wells without mutated bacteria is purple.
4.3.4.1.3. Statistics
The statistical analysis was done using the provided Excel data sheets (Xenometrix;
Allschwil, CH). A sample was classified mutagenic when the amount of positive wells
was two-times higher than the negative control (fold increase over baseline ≥ 2).
Statistical analysis was done using the 1-sided t-test based on unpaired data.
The results are declared reliable when the quality standards listed in Table 20 are
met. The number of positive wells thereby describes the wells which have turned
yellow or contain a colony, thus wells containing bacteria with reversed mutations.
Table 20: Ames MPF® 98/100 quality standards
Controls Mean number of positive wells
TA98 TA100
Negative control Solvent ≤ 8 ≤ 12
Positive controls 4-NQO ≥ 25 ≥ 25
2-NF ≥ 25 ≥ 25
2-AA (only +S9) ≥ 25 ≥ 25
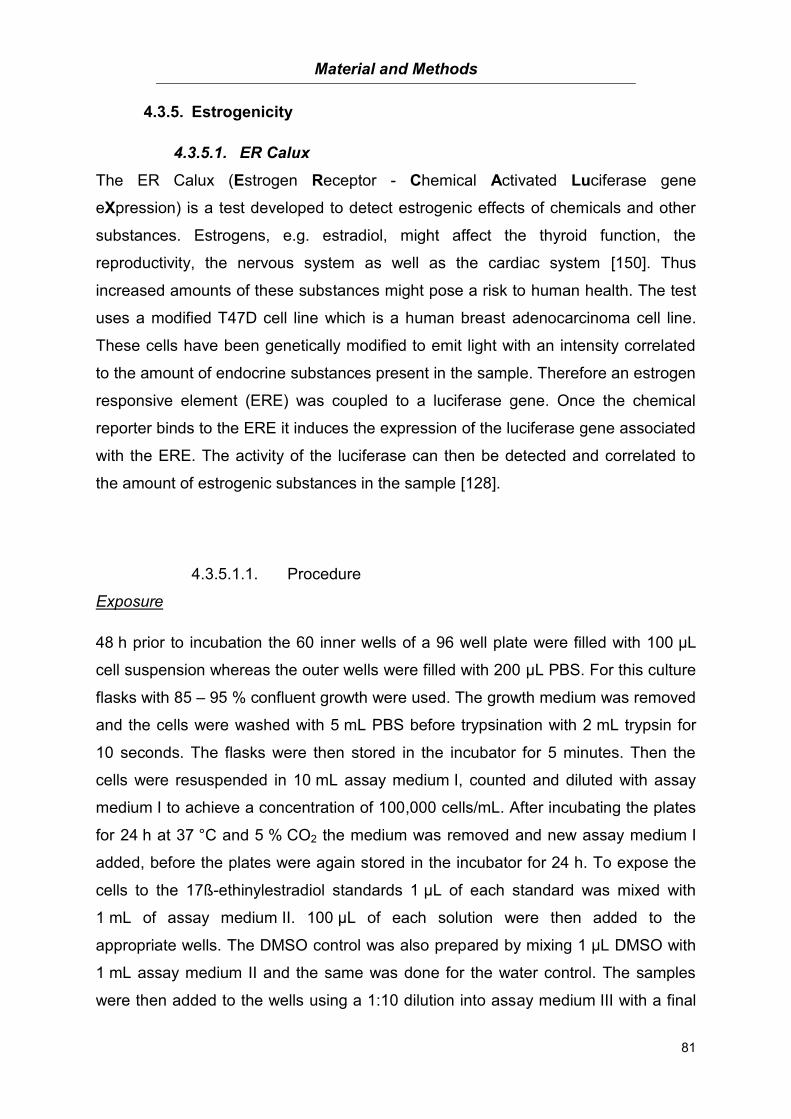
Material and Methods
81
4.3.5. Estrogenicity
4.3.5.1. ER Calux
The ER Calux (Estrogen Receptor - Chemical Activated Luciferase gene
eXpression) is a test developed to detect estrogenic effects of chemicals and other
substances. Estrogens, e.g. estradiol, might affect the thyroid function, the
reproductivity, the nervous system as well as the cardiac system [150]. Thus
increased amounts of these substances might pose a risk to human health. The test
uses a modified T47D cell line which is a human breast adenocarcinoma cell line.
These cells have been genetically modified to emit light with an intensity correlated
to the amount of endocrine substances present in the sample. Therefore an estrogen
responsive element (ERE) was coupled to a luciferase gene. Once the chemical
reporter binds to the ERE it induces the expression of the luciferase gene associated
with the ERE. The activity of the luciferase can then be detected and correlated to
the amount of estrogenic substances in the sample [128].
4.3.5.1.1. Procedure
Exposure
48 h prior to incubation the 60 inner wells of a 96 well plate were filled with 100 μL
cell suspension whereas the outer wells were filled with 200 μL PBS. For this culture
flasks with 85 – 95 % confluent growth were used. The growth medium was removed
and the cells were washed with 5 mL PBS before trypsination with 2 mL trypsin for
10 seconds. The flasks were then stored in the incubator for 5 minutes. Then the
cells were resuspended in 10 mL assay medium I, counted and diluted with assay
medium I to achieve a concentration of 100,000 cells/mL. After incubating the plates
for 24 h at 37 °C and 5 % CO2 the medium was removed and new assay medium I
added, before the plates were again stored in the incubator for 24 h. To expose the
cells to the 17ß-ethinylestradiol standards 1 µL of each standard was mixed with
1 mL of assay medium II. 100 µL of each solution were then added to the
appropriate wells. The DMSO control was also prepared by mixing 1 µL DMSO with
1 mL assay medium II and the same was done for the water control. The samples
were then added to the wells using a 1:10 dilution into assay medium III with a final
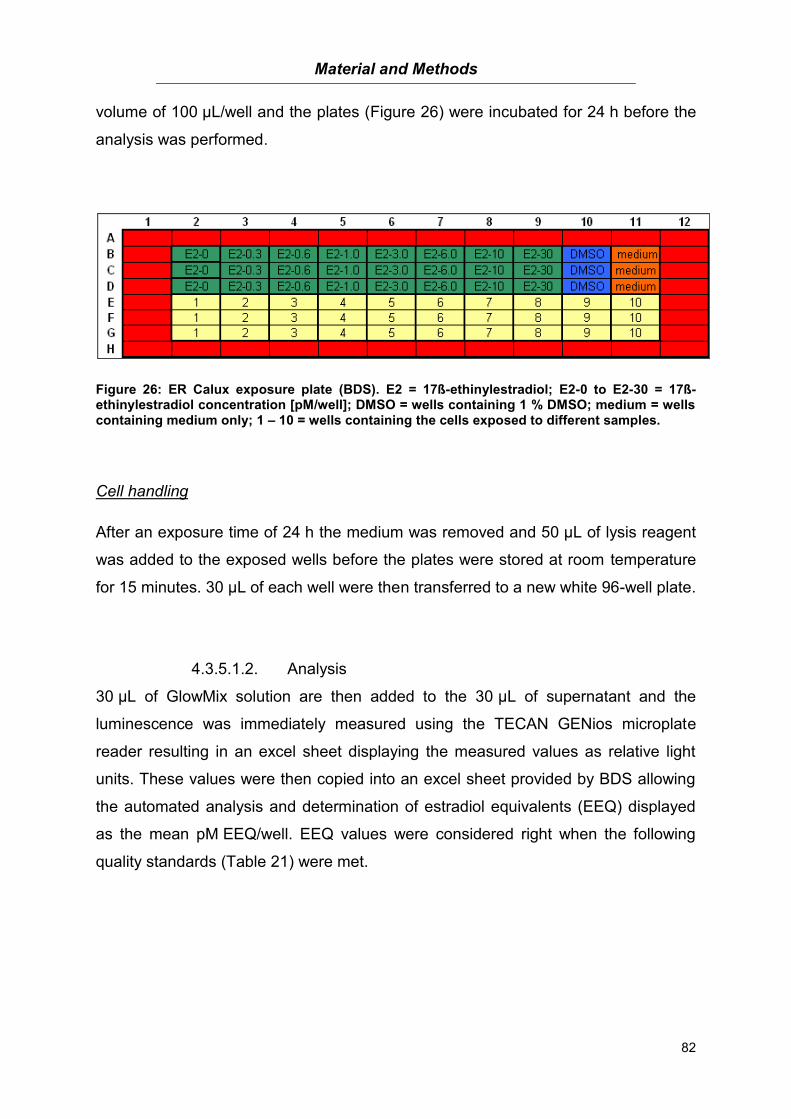
Material and Methods
82
volume of 100 µL/well and the plates (Figure 26) were incubated for 24 h before the
analysis was performed.
Figure 26: ER Calux exposure plate (BDS). E2 = 17ß-ethinylestradiol; E2-0 to E2-30 = 17ß-ethinylestradiol concentration [pM/well]; DMSO = wells containing 1 % DMSO; medium = wells containing medium only; 1 – 10 = wells containing the cells exposed to different samples.
Cell handling
After an exposure time of 24 h the medium was removed and 50 μL of lysis reagent
was added to the exposed wells before the plates were stored at room temperature
for 15 minutes. 30 µL of each well were then transferred to a new white 96-well plate.
4.3.5.1.2. Analysis
30 μL of GlowMix solution are then added to the 30 µL of supernatant and the
luminescence was immediately measured using the TECAN GENios microplate
reader resulting in an excel sheet displaying the measured values as relative light
units. These values were then copied into an excel sheet provided by BDS allowing
the automated analysis and determination of estradiol equivalents (EEQ) displayed
as the mean pM EEQ/well. EEQ values were considered right when the following
quality standards (Table 21) were met.
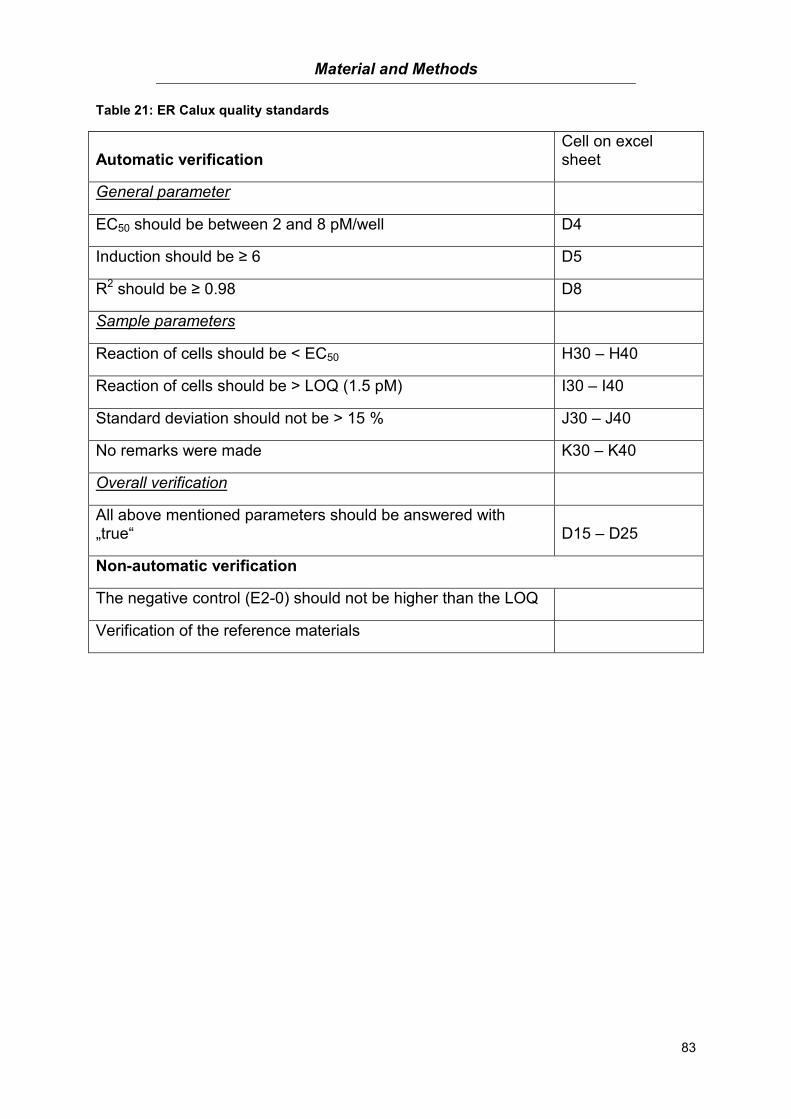
Material and Methods
83
Table 21: ER Calux quality standards
Automatic verification Cell on excel sheet
General parameter
EC50 should be between 2 and 8 pM/well D4
Induction should be ≥ 6 D5
R2 should be ≥ 0.98 D8
Sample parameters
Reaction of cells should be < EC50 H30 – H40
Reaction of cells should be > LOQ (1.5 pM) I30 – I40
Standard deviation should not be > 15 % J30 – J40
No remarks were made K30 – K40
Overall verification
All above mentioned parameters should be answered with „true“ D15 – D25
Non-automatic verification
The negative control (E2-0) should not be higher than the LOQ
Verification of the reference materials

Material and Methods
84
Oxidation of water samples 4.4.
The water samples were prepared, oxidized and chemically analyzed either by the
working group of Dr. Jochen Türk at the Institut für Energie und Umwelttechnik e.V.
in Duisburg (IUTA e.V.) or by the working group of Dr. Kai Bester at the Department
of Environmental Chemistry at the University Duisburg-Essen (UDE). Experimental
conditions as well as the operating procedures were adapted from the final report of
the IGF project No. 15862 N “Oxidationsnebenprodukte” [151]. The investigated
substances and chemicals used for the oxidation experiments and chemical
analyses are listed in Table 22.
Table 22: Chemicals and investigated substances used for oxidation experiments
Chemical Company
2,4-Dichlorophenol Sigma-Aldrich; Steinheim, D
Acetone Merck; Darmstadt, D
Acetonitrile LGC Promochem; Wesel, D
AHTN Dr. Ehrensdorfer; Augsburg, D
Atenolol Sigma-Aldrich; Steinheim, D
Bisphenol A Dr. Ehrensdorfer; Augsburg, D
Catalase (Aspergillus niger) Sigma-Aldrich; Steinheim, D
Ciprofloxacin Sigma-Aldrich; Steinheim, D
Ethinylestradiol Riedel-de Häen; Seelze, D
HHCB Dr. Ehrensdorfer; Augsburg, D
HHCB-Lacton Dr. Ehrensdorfer; Augsburg, D
HPLC-water J.T.Baker; Deventer, NL
Hydrogen peroxide (H2O2) Sigma-Aldrich; Steinheim, D
Irgarol 1051 Hempel; Pinnberg, D
Methanol Merck; Darmstadt, D
Methyl tert-butyl ether (MTBE) Merck; Darmstadt, D
Metoprolol Sigma-Aldrich; Steinheim, D
N-Butyl Methyl Ether J.T.Baker; Deventer, NL
Ofloxacin Sigma-Aldrich; Steinheim, D
Sulfamethoxazole Sigma-Aldrich; Steinheim, D
Terbutryn Dr. Ehrensdorfer; Augsburg, D
Toluol Merck; Darmstadt, D
Triclosan Dr. Ehrensdorfer; Augsburg, D
Triphenylphosphate (TPP) Sigma-Aldrich; Steinheim, D
Tris-(2-butoxyethyl)-phosphate (TBEP) Sigma-Aldrich; Steinheim, D
Tris-(1-chloro-2-propyl)-phosphate (TCPP) Akzo Nobel; Amersfoort, NL

Material and Methods
85
Stock solutions:
The substances were dissolved in HPLC-water containing 50 % acetonitrile with a
concentration of 1 g/L. Substance concentrations during the oxidation experiments
were between 0.1 and 18 mg/L. Table 23 displays the systems used for the oxidation
of the individual samples.
Table 23: Systems used for oxidation experiments of the tested samples, and their final concentration during toxicological testing. IUTA = Institut für Energie- und Umwelttechnik e.V.; UDE = Institute of Environmental Chemistry, University Duisburg-Essen
Substance System
(Place)
Final concentration after exposure for
toxicological tests
AHTN (UDE) 0.1 mg/L
Atenolol (UDE) 0.2 mg/L
Bisphenol A (IUTA ) 1.4 mg/L (Ozonation); 0.1 mg/L (UV/H2O2)
Ciprofloxacin (IUTA) 1.4 mg/L (Ozonation); 0.1 mg/L (UV/H2O2)
Ethinylestradiol (IUTA) 1.5 mg/L
HHCB (UDE) 0 – 50 µg/L; 0.1 mg/L (UV/H2O2)
HHCB-Lacton (UDE) 0 – 50 µg/L
Irgarol 1051 (UDE) 0.75 mg/L
Metoprolol (IUTA) 1.4 mg/L (Ozonation); 0.1 mg/L (UV/H2O2)
Ofloxacin (IUTA) 18 mg/L
Sulfamethoxazole (IUTA) 1.4 mg/L (Ozonation); 0.1 mg/L (UV/H2O2)
TCEP (UDE) 0.1 mg/L
TCPP (UDE) 0.1 mg/L
TPP (UDE) 0.1 mg/L
Terbutryn (UDE) 0.49 mg/L
Triclosan (UDE) 0 – 100 µg/L
2.4-Dichlorophenol (UDE) 0 – 100 µg/L
Material and Methods
86
4.4.1. Ozonation
4.4.1.1. Laboratory scale ozonation
Institut für Energie und Umwelttechnik e.V. (IUTA e.V.):
During laboratory scale ozonation experiments (up to 1 L of sample), the ozone gas
was produced using technical oxygen and an ozone generator (COM AD-01;
Anseros, Tübingen, D). To produce ozone water, the gas was directed through
distilled, cooled water immediately after generation. A platinum catalyzer was used
to destroy the remaining excessive ozone. The ozone concentration was determined
photometrically at 260 nm (SPECORD® PC 200 UV VIS Spectrophotometer;
Analytik Jena AG, Jena, D) in regard to the Lambert-Beer law using a molar
absorption coefficient of 3300 mol-1 cm-1.
Pure water as well as WWTP effluents were then spiked with the single substances
before the previously prepared ozone water was then added to the samples. After
the reactions of the ozone with the water contaminants the samples were filter
sterilized (Chromafil RC, 0.45 µm; Macherey-Nagel, Düren, D) and either directly
stored in HPLC-MS-vials or after a subsequent solid phase extraction (SPE; see
chapter 4.5.1). In addition WWTP effluent was also oxidized and analyzed without
the addition of substances.
Department of Environmental Chemistry:
All tested substances were dissolved either in HPLC-water or WWTP effluent with
concentrations between 0.1 and 44 mg/L. These solutions were then used for
ozonation experiments. Residue-free methanol, toluol, acetone or MTBE were used
to terminate the OH° formation. Mixing the solutions with O3 at different ratios,
samples with different mole-ratios were gained (1:1 up to 1:10). Ozone was
produced using an ozone generator (Enaly 1000BT-12, Enaly M&E Ltd, Shanghai,
China) and technical oxygen (0.5 L/min) resulting in an ozone input of 2-5 mg/L into
the system. The amount of ozone was detected using UV-VIS spectrometry
(Shimadzu, Duisburg, Germany) and samples were taken time-dependent.
Material and Methods
87
4.4.1.2. Pilot scale ozonation (IUTA e.V.)
To perform experiments with a sample volume of 200 to 500 L a pilot plant (OCS
H2O2-UV; Wedeco, Herford, D) with an attached ozone generator (OCS-GSO 20;
Wedeco, Herford, D) and an ozone surveillance device (DH 5; BMT Messtechnik.
Berlin, D) was used. The ozone generator was adjusted to discharge 80 – 90 g/m3
gaseous ozone into the pilot plant with a flow rate of 0.5 m3/h. All experiments were
performed at 20 °C and before starting an experiment the plant was rinsed with the
used water. Samples were then taken in a time-dependent manner.
4.4.2. UV/H2O2 oxidation
4.4.2.1. Laboratory scale UV oxidation with and without H2O2
(IUTA e.V.)
Oxidation experiments using UV light were performed at a laboratory scale system
with a volume of 1 L. The construction was coupled to a low pressure UV lamp
(TNN15/32 Hg lamp, 254 nm; Heraeus, Hanau. D). Before the oxidation, spiked and
non-spiked pure water as well as WWTP effluents were evenly distributed in the
system and the oxidation was started. At the beginning of the experiments performed
with the addition of H2O2 the UV lamp was allowed to reach full power (5 min) before
H2O2 (0.3 g/L) was added. To remove remaining peroxides after treatment catalase
(0.25 mL; c = 0.4 kU/mL) was added to the system. All experiments were performed
at 30 °C and sampling was done time-dependent.
4.4.2.2. UV/H2O2 oxidation of TPP, TBEP and TCPP (UDE)
Each of the three organophosphates was dissolved in 1 L HPLC-water with a final
concentration of 1 mg/L and subjected to UV treatment. The samples were treated
with UV light (Heraeus TNN15/32; 3 Watt, 254 nm; Hg-LP; Heraeus, Hanau,
Deutschland) and 1 mg/L H2O2 for up to 120 min with a time-dependent sampling.
After sampling, 100 µL catalase (0.4 kU/mL) were added to remove remaining
peroxides. Subsequent a SPE (see chapter 4.5.2) was performed before GC-MS-
Screening.
Material and Methods
88
4.4.2.3. Pilot scale UV oxidation with and without H2O2 (IUTA e.V.)
The previously described pilot scale plant (Volume = 200 L) was also used for UV
experiments. All samples were UV treated the same way as was done during
ozonation. For oxidation a low pressure UV lamp (XLR 10, 33 W, 180 nm and
254 nm; Wedeco, Herford, D) or a medium pressure lamp (uviblox® WTP; 2x4 Watt;
IBL, Heidelberg, D) was used. During oxidation experiments with hydrogen peroxide
the lamp was switched on 10 min prior to the addition of 0.3 g/L H2O2. Again the
samples were taken time-dependently and catalase (0.25 mL; c = 0.4 kU/mL) was
added to terminate the reaction.
4.4.2.4. UV and UV/H2O2 oxidation using the flow through system
(IUTA e.V.)
The IBL uviblox® WTP 2x4 flow-through unit (IBL, Heidelberg, D) equipped with two
4 kW medium pressure lamps was used for oxidation experiments. For this purpose
the water sample was stored in a 1 m3-IBC-Container and directly pumped into the
system passing the UV lamps and dispatched back into the container.
4.4.2.5. UV and UV/H2O2 oxidation at the flow through system
(Waste water treatment plant)
The above described system was also placed at a waste water treatment plant
taking the water directly from the effluent of the plant and releasing it into the
discharge system. When H2O2 was added to the water an amount of 1 L/h (c = 35 %)
was pumped into the system. The flow-through as well as the power of the UV lamps
varied (3 – 12 m3, 1x0.8 – 2x4 kW).
Material and Methods
89
Extraction methods 4.5.
4.5.1. Solid Phase Extraction (SPE)
Chemical analyses were performed either using the filtered undiluted non-enriched
sample or samples after solid phase extraction. Prior to extraction the samples were
filter sterilized using a 1 µm glass-fiber filter (Pall Life Science, Washington, NY, US).
Extraction was done using an automated Gilson-System (Valvemate® II; Gilson
International B.V., Limburg, D) with Strata X (Phenomenex, Aschaffenburg, D),
Strata XL (Phenomenex, Aschaffenburg, D), and ENV+ (Biotage, Uppsala, SE)
cartridges. Before extraction, the samples were adjusted to pH 3 and internal
standards were added. After extraction the samples were concentrated under
nitrogen gas. Pharmaceuticals were eluted with 1 mL water:ACN (50:50) containing
1 % formic acid. Extracts containing Bisphenol A were concentrated under nitrogen
gas, eluted using 1 mL methanol, again concentrated and eluted in 100 µL Bis-
(trimethylsilyl)-trifluoro-acetamide with 1 % trimethylchlorosilane, mixed and
derivatized at 70 °C for 30 min. The extracts of the three organophosphates (TPP,
TCEP, TCPP), HHCB and AHTN were stored at -20 °C for 2 h to remove remaining
water and afterwards concentrated using a Büchi-Syncore system (Büchi, Flawil,
CH) with 60 °C, 40 mbar and 180 rpm (organophosphates) or 50 °C, 60 mbar and
180 rpm (HHCB, AHTN) resulting in a final volume of 1 mL. In addition to the
concentration of the organophosphates, the solvent was changed to toluol by adding
10 mL toluol to the sample and concentrating it to 1 mL twice. All samples were then
transferred to a vial for measurement. Irgarol 1051 and Terbutryn were transferred to
a vial directly after extraction without any further handling.
4.5.2. Liquid-liquid-extraction (LLE)
The three organophosphates as well as the biocides Irgarol 1051 and Terbutryn
were extracted using a liquid-liquid-extraction method. Therefore 2 mL of each
sample were mixed with 2 mL toluol and 100 µL internal standard was added. After
mixing the sample and the toluol for 20 min at 500 rpm the sample was stored at -
20 °C for at least two hours. 1 mL of the toluol phase was then aspirated and
transferred to a GC-vial for further testing.
Material and Methods
90
Analytical Chemistry 4.6.
Part of the analytical chemistry is the qualitative and quantitative determination of
compounds as well as the identification of structures through separation processes.
These processes include chromatographic as well as spectroscopic methods. A
linkage of both results in a more sensitive analytical tool which allows an
improvement in the detection and identification of substances.
Chromatography
During chromatographic separation processes the substance to be analyzed is
dissolved in the mobile phase (liquid, gas) and moved over the stationary phase
(column, flat-bed). The separation then takes place due to interactions of the
compound with the stationary phase resulting in a chromatogram. As the name
implies, the gas chromatography is based on a gas used as the mobile phase. After
evaporation the sample is then moved across the stationary phase by this gas
resulting in a time dependent detection of each compound (retention time). Another
type of chromatography is the high performance liquid chromatography (HPLC). The
HPLC is a chromatography method using a liquid mobile phase [152].
Mass Spectroscopy
During mass spectroscopy the compounds to be measured are transformed into fast
moving, ionizing gases and then detected according to the mass to charge ratio
(m/z). This ratio deflects the separation of the ions in an electric or magnetic field
[152].
4.6.1. HPLC-MS/MS
A HPLC-MS/MS method was performed to quantify the analytes with the API 3000
(CTC Analytics, Zwingen, CH) and a Q Trap 3200 (AB Sciex, Darmstadt, D) using a
Multiple Reaction Monitoring (MRM) mode. Two characteristic mass changes were
detected for each substance (Table 24). Chromatographic division was done using a
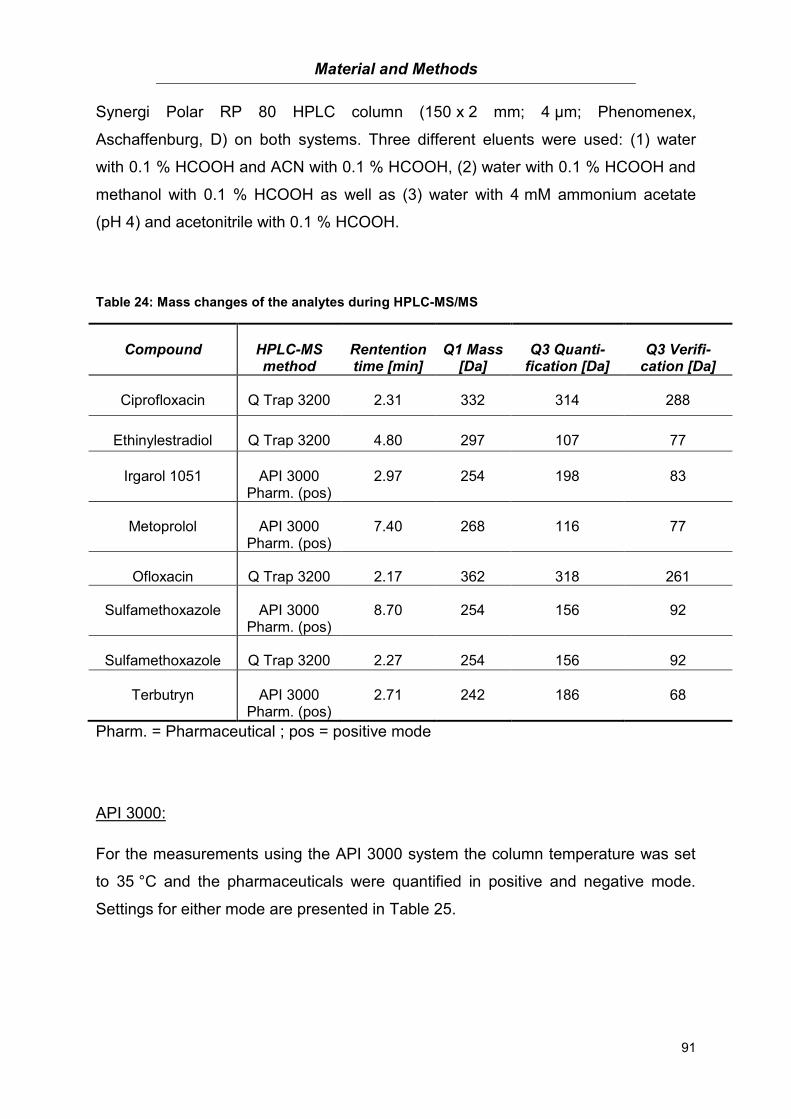
Material and Methods
91
Synergi Polar RP 80 HPLC column (150 x 2 mm; 4 µm; Phenomenex,
Aschaffenburg, D) on both systems. Three different eluents were used: (1) water
with 0.1 % HCOOH and ACN with 0.1 % HCOOH, (2) water with 0.1 % HCOOH and
methanol with 0.1 % HCOOH as well as (3) water with 4 mM ammonium acetate
(pH 4) and acetonitrile with 0.1 % HCOOH.
Table 24: Mass changes of the analytes during HPLC-MS/MS
Compound HPLC-MS method
Rentention time [min]
Q1 Mass [Da]
Q3 Quanti-fication [Da]
Q3 Verifi-cation [Da]
Ciprofloxacin Q Trap 3200 2.31 332 314 288
Ethinylestradiol Q Trap 3200 4.80 297 107 77
Irgarol 1051 API 3000 Pharm. (pos)
2.97 254 198 83
Metoprolol API 3000 Pharm. (pos)
7.40 268 116 77
Ofloxacin Q Trap 3200 2.17 362 318 261
Sulfamethoxazole API 3000 Pharm. (pos)
8.70 254 156 92
Sulfamethoxazole Q Trap 3200 2.27 254 156 92
Terbutryn API 3000 Pharm. (pos)
2.71 242 186 68
Pharm. = Pharmaceutical ; pos = positive mode
API 3000:
For the measurements using the API 3000 system the column temperature was set
to 35 °C and the pharmaceuticals were quantified in positive and negative mode.
Settings for either mode are presented in Table 25.
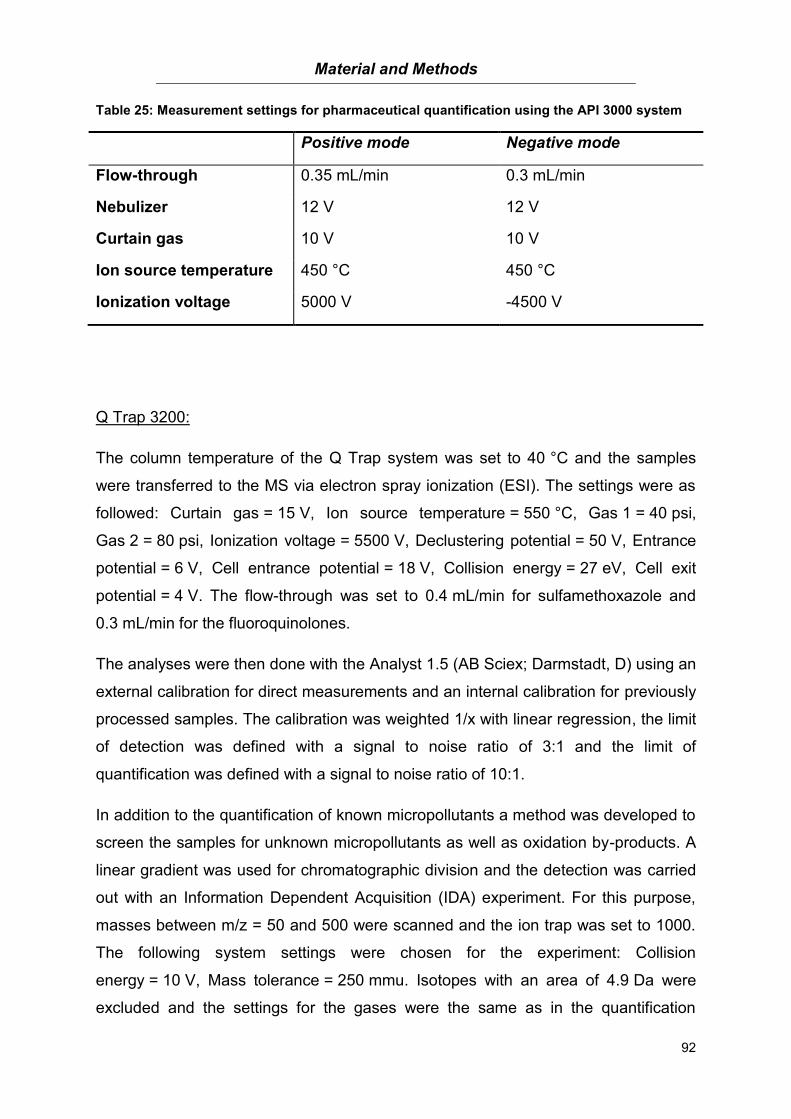
Material and Methods
92
Table 25: Measurement settings for pharmaceutical quantification using the API 3000 system
Positive mode Negative mode
Flow-through 0.35 mL/min 0.3 mL/min
Nebulizer 12 V 12 V
Curtain gas 10 V 10 V
Ion source temperature 450 °C 450 °C
Ionization voltage 5000 V -4500 V
Q Trap 3200:
The column temperature of the Q Trap system was set to 40 °C and the samples
were transferred to the MS via electron spray ionization (ESI). The settings were as
followed: Curtain gas = 15 V, Ion source temperature = 550 °C, Gas 1 = 40 psi,
Gas 2 = 80 psi, Ionization voltage = 5500 V, Declustering potential = 50 V, Entrance
potential = 6 V, Cell entrance potential = 18 V, Collision energy = 27 eV, Cell exit
potential = 4 V. The flow-through was set to 0.4 mL/min for sulfamethoxazole and
0.3 mL/min for the fluoroquinolones.
The analyses were then done with the Analyst 1.5 (AB Sciex; Darmstadt, D) using an
external calibration for direct measurements and an internal calibration for previously
processed samples. The calibration was weighted 1/x with linear regression, the limit
of detection was defined with a signal to noise ratio of 3:1 and the limit of
quantification was defined with a signal to noise ratio of 10:1.
In addition to the quantification of known micropollutants a method was developed to
screen the samples for unknown micropollutants as well as oxidation by-products. A
linear gradient was used for chromatographic division and the detection was carried
out with an Information Dependent Acquisition (IDA) experiment. For this purpose,
masses between m/z = 50 and 500 were scanned and the ion trap was set to 1000.
The following system settings were chosen for the experiment: Collision
energy = 10 V, Mass tolerance = 250 mmu. Isotopes with an area of 4.9 Da were
excluded and the settings for the gases were the same as in the quantification
Material and Methods
93
experiments. During each IDA experiment the two masses with the highest intensity
were filtered and further fractioned to gain information on the molecular structure of
the unknown substances.
4.6.2. GC-MS
Bisphenol A was analyzed with a GC-MS (Trace GC Ultra coupled to a DSQ Mass
spectrometer; Thermo-Scientific, Dreieich, D) using a Restek Rxi – 5Sil-MS column
(30 m x 0.25 mm, 0.25 µm; Restek, Bellefonte, PA, US). Helium 5.0 (Air Liquide,
Düsseldorf, D) was used as carrier gas and the oven temperature was set to 100 °C.
The heating rate was 40 °C/min until 260 °C were reached. Then the heating rate
was adjusted to 5 °C/min until reaching 310 °C. A DB-5MS column (15 m x 0.25 mm,
0.25 µm; J&W Scientific, Folsom, US) with a linear temperature setting (increasing
from 70 °C to 280 °C in 30 min) was used for the analyses of the organophosphates,
Triclosan, HHCB and AHTN.
The samples were then vaporized using a Programmed Temperature Vaporizer-
(PTV) cooled injection system and transferred to the MS device. The injection
volume was set to 1 µL and Helium 5.0 was used as carrier gas (Flow-rate =
1.3 mL/min). Between 100 °C and 320 °C the heating rate was 14.5 °C/min and the
temperature of the ion source was 200 °C (Bisphenol A) or 230 °C
(Organophosphates, Triclosan, HHCB and AHTN). The Selected Ion Monitoring
(SIM) method was used for measurements. Mass transfers for the quantification are
depicted in Table 26. The Xcalibur software from Thermo-Scientific (Dreieich, D) was
used for the analysis, including a linear regression. The limit of detection was defined
with a signal to noise ratio of 3:1 and the limit of quantification was defined with a
signal to noise ratio of 10:1.
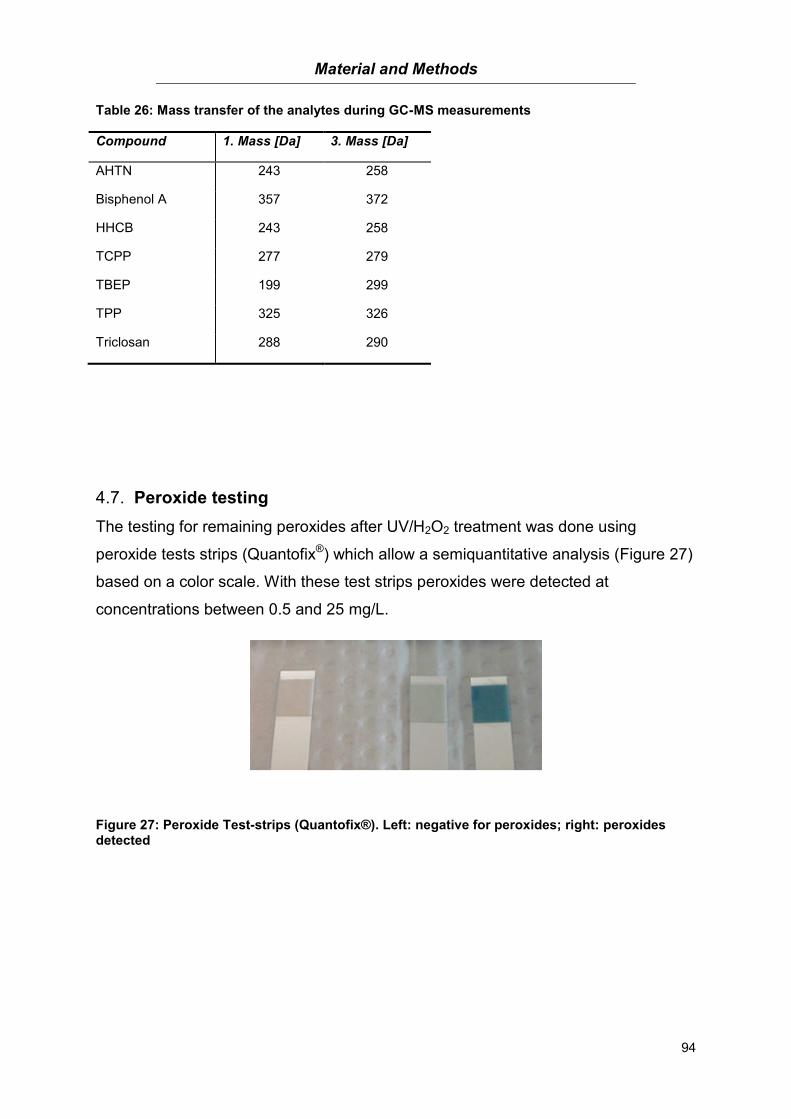
Material and Methods
94
Table 26: Mass transfer of the analytes during GC-MS measurements
Compound 1. Mass [Da] 3. Mass [Da]
AHTN 243 258
Bisphenol A 357 372
HHCB 243 258
TCPP 277 279
TBEP 199 299
TPP 325 326
Triclosan 288 290
Peroxide testing 4.7.
The testing for remaining peroxides after UV/H2O2 treatment was done using
peroxide tests strips (Quantofix®) which allow a semiquantitative analysis (Figure 27)
based on a color scale. With these test strips peroxides were detected at
concentrations between 0.5 and 25 mg/L.
Figure 27: Peroxide Test-strips (Quantofix®). Left: negative for peroxides; right: peroxides detected
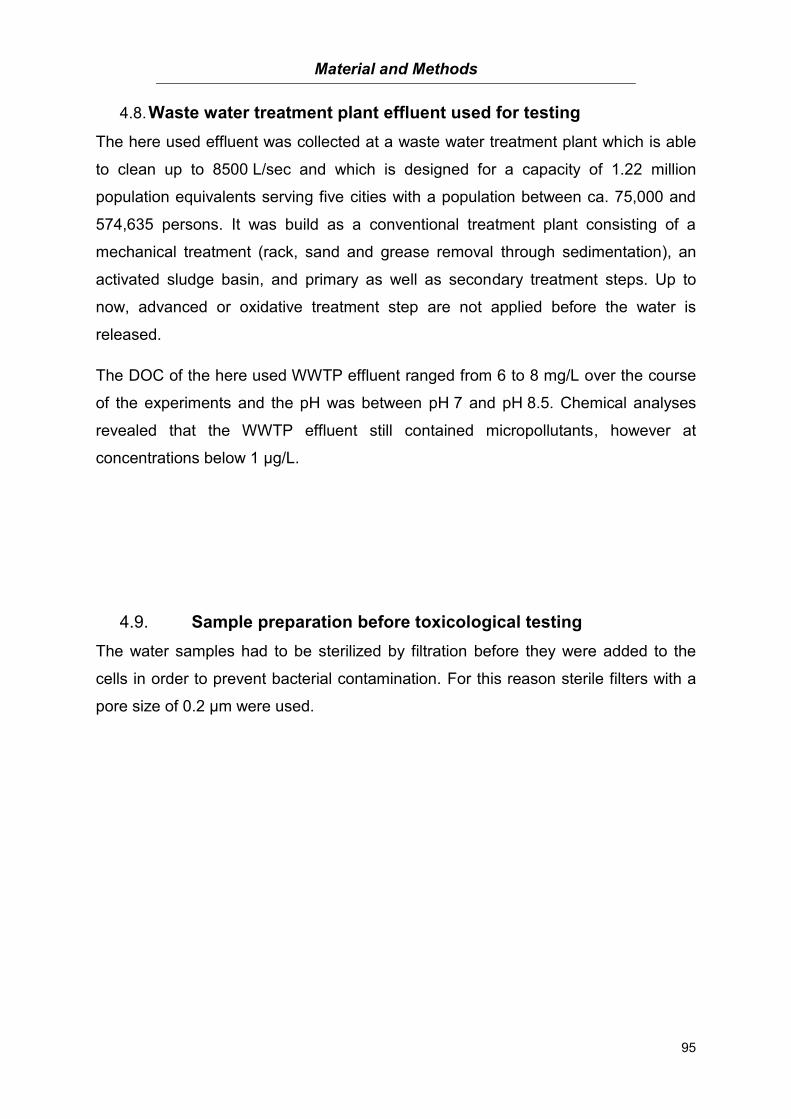
Material and Methods
95
Waste water treatment plant effluent used for testing 4.8.
The here used effluent was collected at a waste water treatment plant which is able
to clean up to 8500 L/sec and which is designed for a capacity of 1.22 million
population equivalents serving five cities with a population between ca. 75,000 and
574,635 persons. It was build as a conventional treatment plant consisting of a
mechanical treatment (rack, sand and grease removal through sedimentation), an
activated sludge basin, and primary as well as secondary treatment steps. Up to
now, advanced or oxidative treatment step are not applied before the water is
released.
The DOC of the here used WWTP effluent ranged from 6 to 8 mg/L over the course
of the experiments and the pH was between pH 7 and pH 8.5. Chemical analyses
revealed that the WWTP effluent still contained micropollutants, however at
concentrations below 1 µg/L.
Sample preparation before toxicological testing 4.9.
The water samples had to be sterilized by filtration before they were added to the
cells in order to prevent bacterial contamination. For this reason sterile filters with a
pore size of 0.2 µm were used.
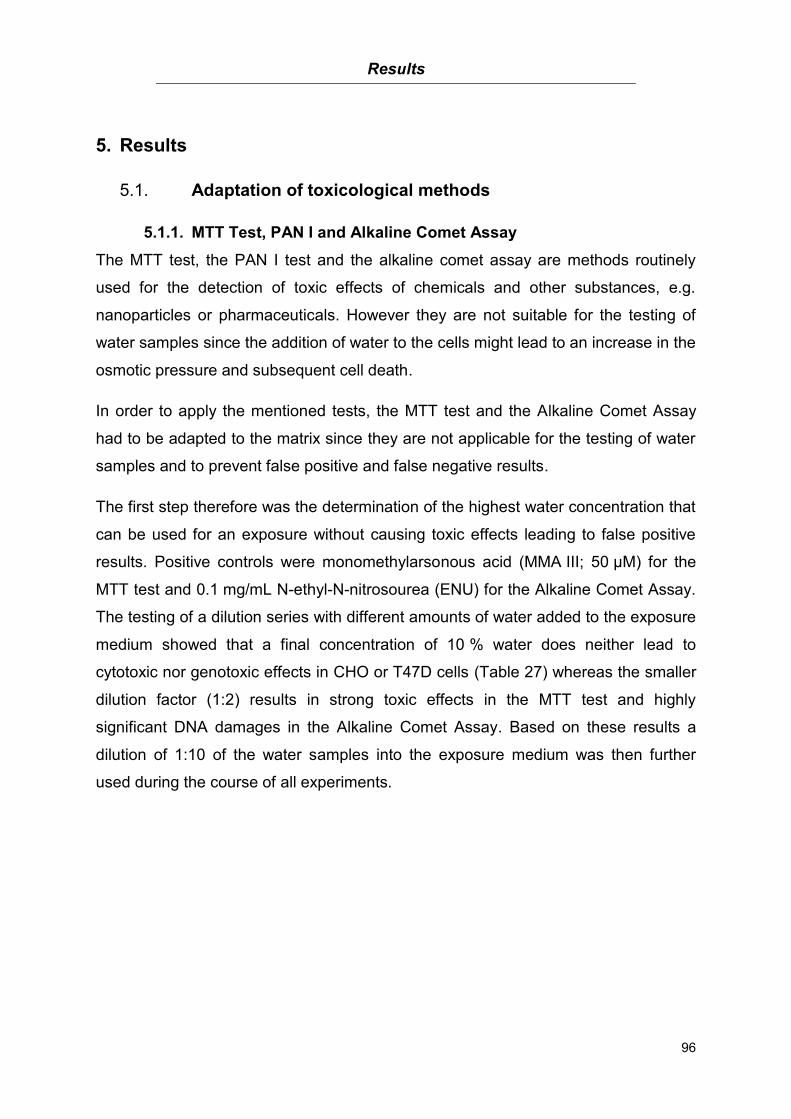
Results
96
5. Results
Adaptation of toxicological methods 5.1.
5.1.1. MTT Test, PAN I and Alkaline Comet Assay
The MTT test, the PAN I test and the alkaline comet assay are methods routinely
used for the detection of toxic effects of chemicals and other substances, e.g.
nanoparticles or pharmaceuticals. However they are not suitable for the testing of
water samples since the addition of water to the cells might lead to an increase in the
osmotic pressure and subsequent cell death.
In order to apply the mentioned tests, the MTT test and the Alkaline Comet Assay
had to be adapted to the matrix since they are not applicable for the testing of water
samples and to prevent false positive and false negative results.
The first step therefore was the determination of the highest water concentration that
can be used for an exposure without causing toxic effects leading to false positive
results. Positive controls were monomethylarsonous acid (MMA III; 50 µM) for the
MTT test and 0.1 mg/mL N-ethyl-N-nitrosourea (ENU) for the Alkaline Comet Assay.
The testing of a dilution series with different amounts of water added to the exposure
medium showed that a final concentration of 10 % water does neither lead to
cytotoxic nor genotoxic effects in CHO or T47D cells (Table 27) whereas the smaller
dilution factor (1:2) results in strong toxic effects in the MTT test and highly
significant DNA damages in the Alkaline Comet Assay. Based on these results a
dilution of 1:10 of the water samples into the exposure medium was then further
used during the course of all experiments.
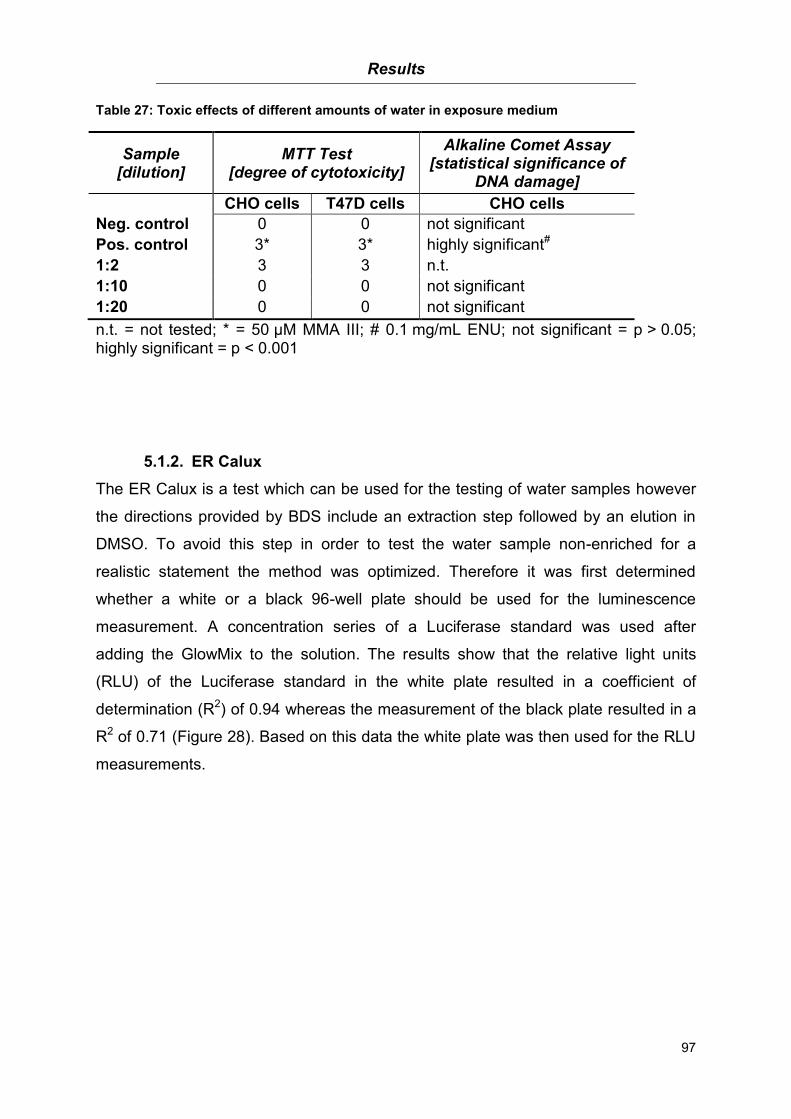
Results
97
Table 27: Toxic effects of different amounts of water in exposure medium
Sample [dilution]
MTT Test [degree of cytotoxicity]
Alkaline Comet Assay [statistical significance of
DNA damage]
CHO cells T47D cells CHO cells
Neg. control 0 0 not significant
Pos. control 3* 3* highly significant#
1:2 3 3 n.t.
1:10 0 0 not significant
1:20 0 0 not significant
n.t. = not tested; * = 50 µM MMA III; # 0.1 mg/mL ENU; not significant = p > 0.05; highly significant = p < 0.001
5.1.2. ER Calux
The ER Calux is a test which can be used for the testing of water samples however
the directions provided by BDS include an extraction step followed by an elution in
DMSO. To avoid this step in order to test the water sample non-enriched for a
realistic statement the method was optimized. Therefore it was first determined
whether a white or a black 96-well plate should be used for the luminescence
measurement. A concentration series of a Luciferase standard was used after
adding the GlowMix to the solution. The results show that the relative light units
(RLU) of the Luciferase standard in the white plate resulted in a coefficient of
determination (R2) of 0.94 whereas the measurement of the black plate resulted in a
R2 of 0.71 (Figure 28). Based on this data the white plate was then used for the RLU
measurements.
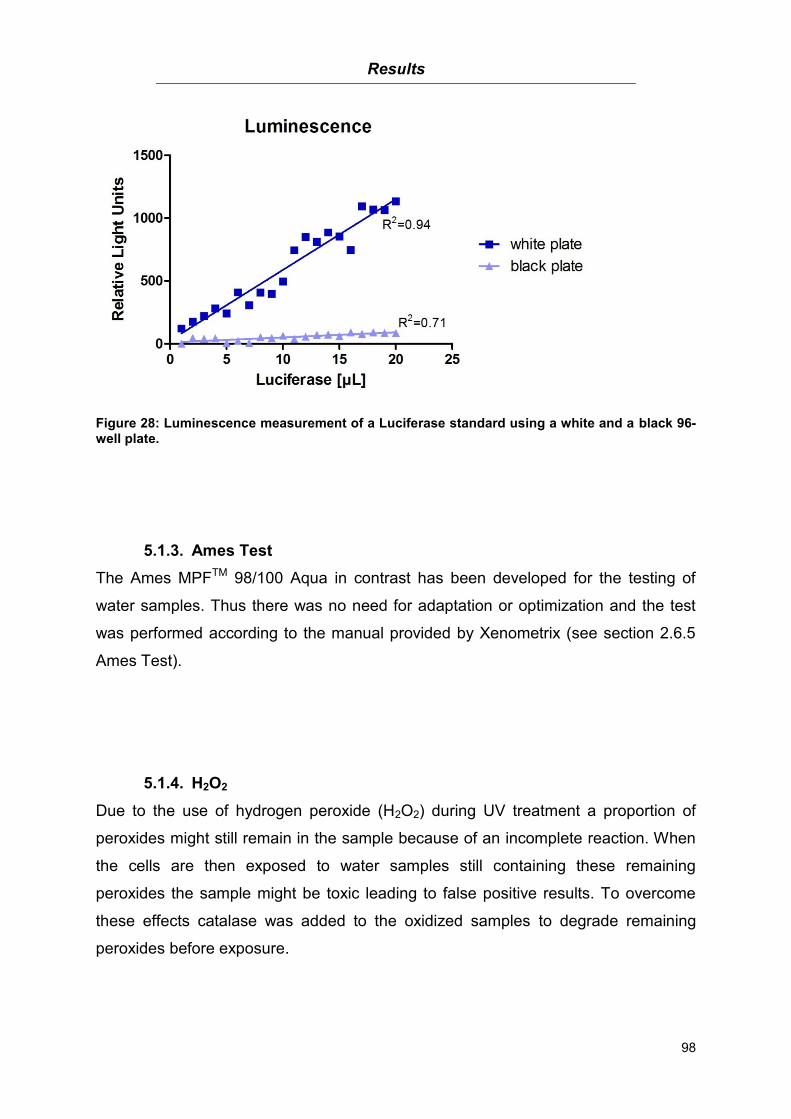
Results
98
Figure 28: Luminescence measurement of a Luciferase standard using a white and a black 96-well plate.
5.1.3. Ames Test
The Ames MPFTM 98/100 Aqua in contrast has been developed for the testing of
water samples. Thus there was no need for adaptation or optimization and the test
was performed according to the manual provided by Xenometrix (see section 2.6.5
Ames Test).
5.1.4. H2O2
Due to the use of hydrogen peroxide (H2O2) during UV treatment a proportion of
peroxides might still remain in the sample because of an incomplete reaction. When
the cells are then exposed to water samples still containing these remaining
peroxides the sample might be toxic leading to false positive results. To overcome
these effects catalase was added to the oxidized samples to degrade remaining
peroxides before exposure.
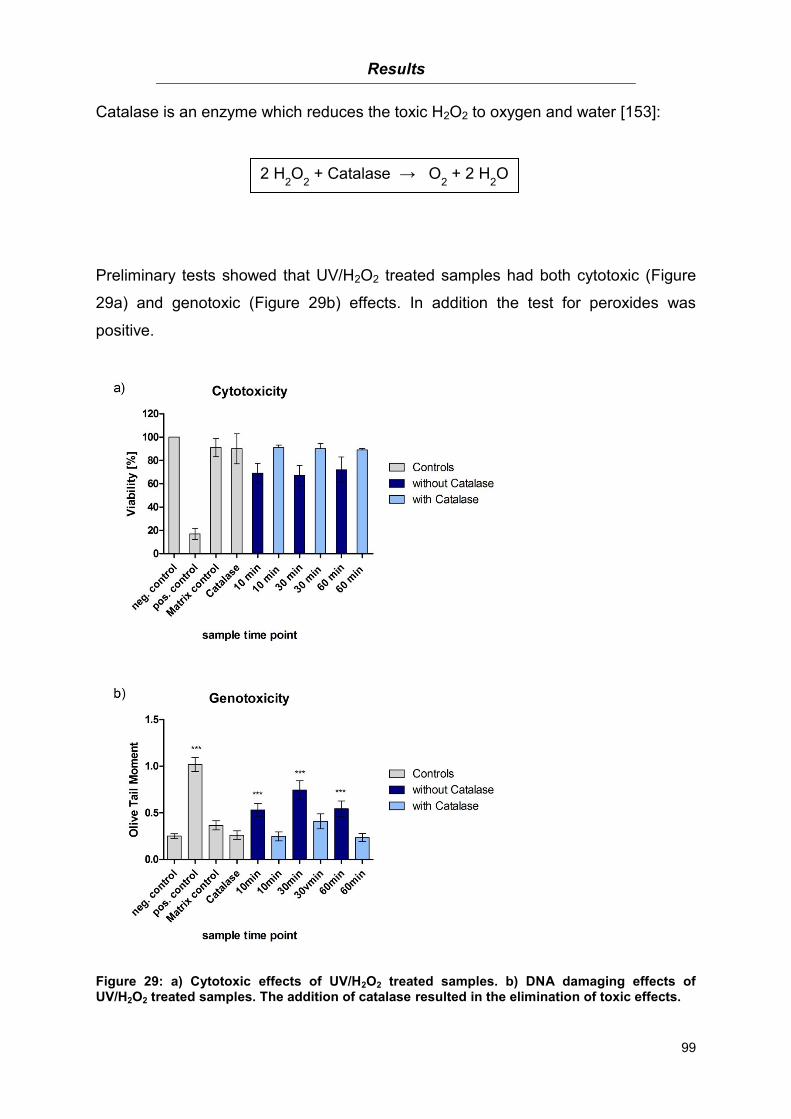
Results
99
Catalase is an enzyme which reduces the toxic H2O2 to oxygen and water [153]:
Preliminary tests showed that UV/H2O2 treated samples had both cytotoxic (Figure
29a) and genotoxic (Figure 29b) effects. In addition the test for peroxides was
positive.
Figure 29: a) Cytotoxic effects of UV/H2O2 treated samples. b) DNA damaging effects of UV/H2O2 treated samples. The addition of catalase resulted in the elimination of toxic effects.
2 H2O
2 + Catalase → O
2 + 2 H
2O
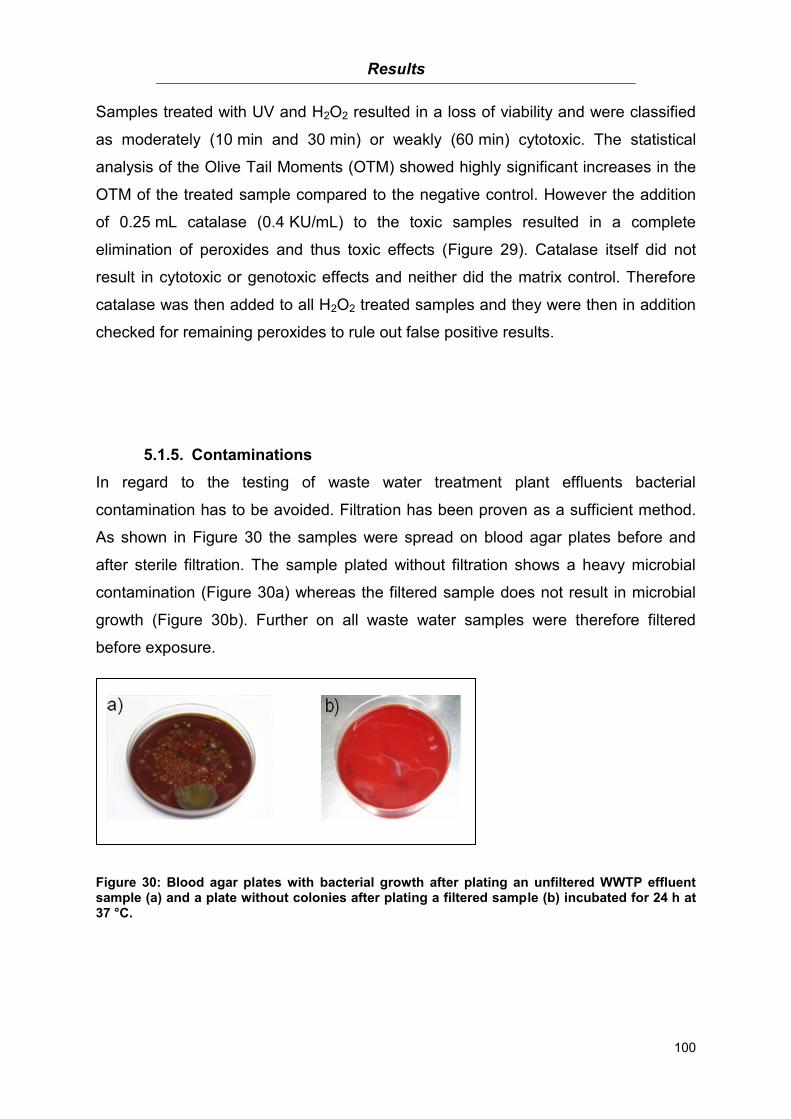
Results
100
Samples treated with UV and H2O2 resulted in a loss of viability and were classified
as moderately (10 min and 30 min) or weakly (60 min) cytotoxic. The statistical
analysis of the Olive Tail Moments (OTM) showed highly significant increases in the
OTM of the treated sample compared to the negative control. However the addition
of 0.25 mL catalase (0.4 KU/mL) to the toxic samples resulted in a complete
elimination of peroxides and thus toxic effects (Figure 29). Catalase itself did not
result in cytotoxic or genotoxic effects and neither did the matrix control. Therefore
catalase was then added to all H2O2 treated samples and they were then in addition
checked for remaining peroxides to rule out false positive results.
5.1.5. Contaminations
In regard to the testing of waste water treatment plant effluents bacterial
contamination has to be avoided. Filtration has been proven as a sufficient method.
As shown in Figure 30 the samples were spread on blood agar plates before and
after sterile filtration. The sample plated without filtration shows a heavy microbial
contamination (Figure 30a) whereas the filtered sample does not result in microbial
growth (Figure 30b). Further on all waste water samples were therefore filtered
before exposure.
Figure 30: Blood agar plates with bacterial growth after plating an unfiltered WWTP effluent sample (a) and a plate without colonies after plating a filtered sample (b) incubated for 24 h at 37 °C.
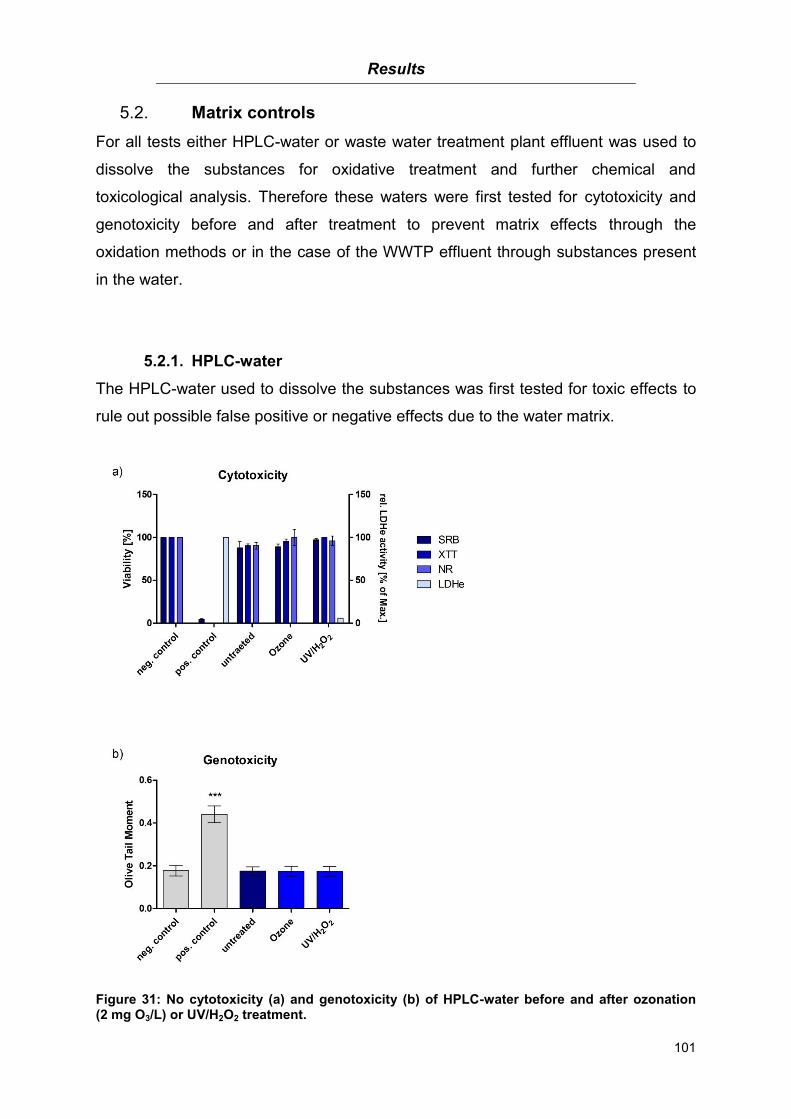
Results
101
Matrix controls 5.2.
For all tests either HPLC-water or waste water treatment plant effluent was used to
dissolve the substances for oxidative treatment and further chemical and
toxicological analysis. Therefore these waters were first tested for cytotoxicity and
genotoxicity before and after treatment to prevent matrix effects through the
oxidation methods or in the case of the WWTP effluent through substances present
in the water.
5.2.1. HPLC-water
The HPLC-water used to dissolve the substances was first tested for toxic effects to
rule out possible false positive or negative effects due to the water matrix.
Figure 31: No cytotoxicity (a) and genotoxicity (b) of HPLC-water before and after ozonation (2 mg O3/L) or UV/H2O2 treatment.
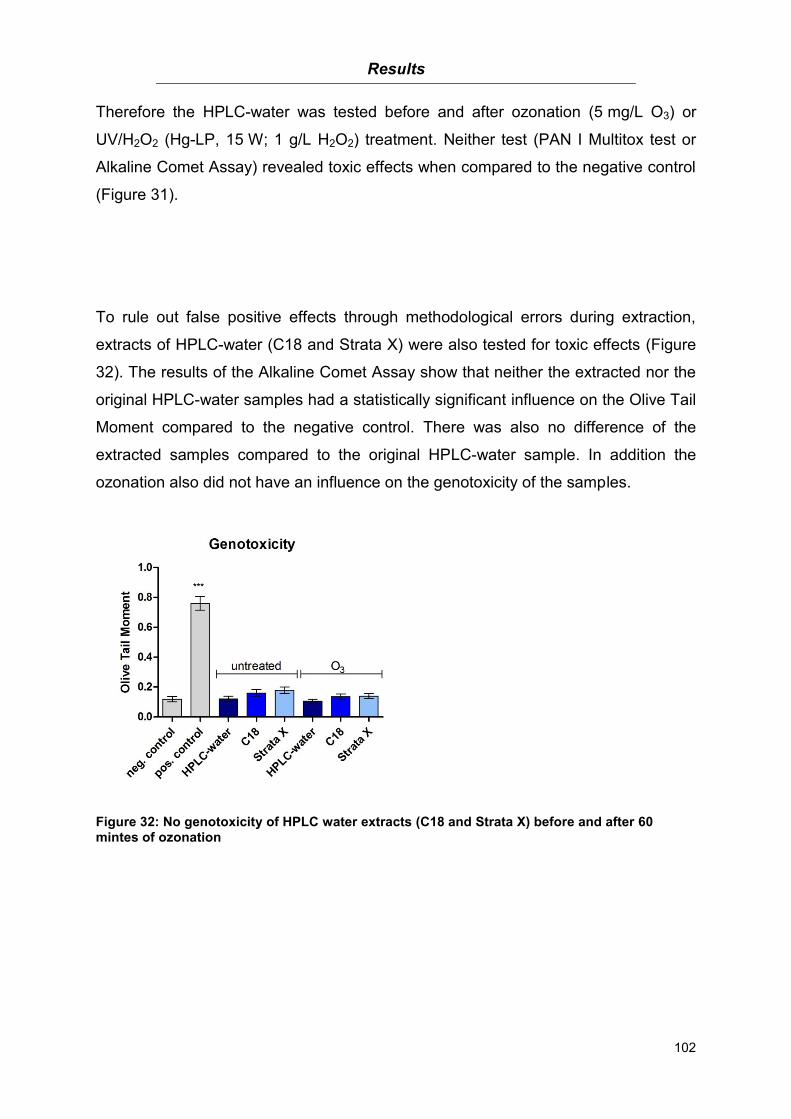
Results
102
Therefore the HPLC-water was tested before and after ozonation (5 mg/L O3) or
UV/H2O2 (Hg-LP, 15 W; 1 g/L H2O2) treatment. Neither test (PAN I Multitox test or
Alkaline Comet Assay) revealed toxic effects when compared to the negative control
(Figure 31).
To rule out false positive effects through methodological errors during extraction,
extracts of HPLC-water (C18 and Strata X) were also tested for toxic effects (Figure
32). The results of the Alkaline Comet Assay show that neither the extracted nor the
original HPLC-water samples had a statistically significant influence on the Olive Tail
Moment compared to the negative control. There was also no difference of the
extracted samples compared to the original HPLC-water sample. In addition the
ozonation also did not have an influence on the genotoxicity of the samples.
Figure 32: No genotoxicity of HPLC water extracts (C18 and Strata X) before and after 60 mintes of ozonation
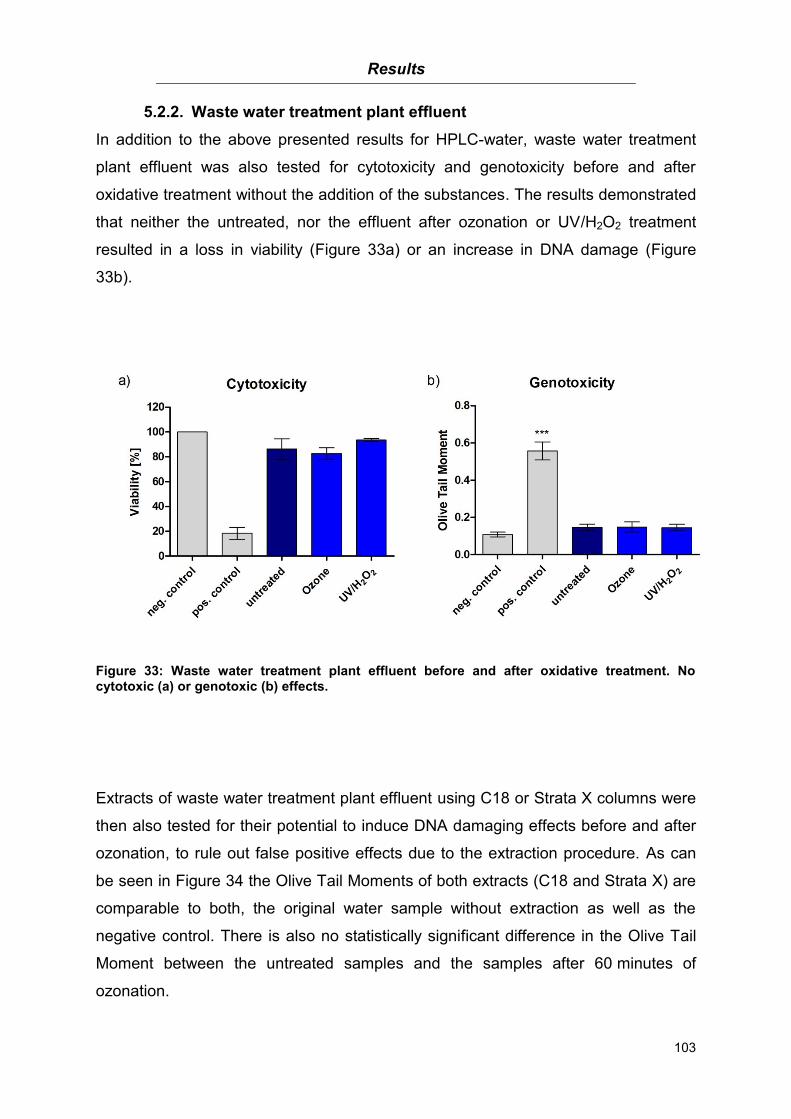
Results
103
5.2.2. Waste water treatment plant effluent
In addition to the above presented results for HPLC-water, waste water treatment
plant effluent was also tested for cytotoxicity and genotoxicity before and after
oxidative treatment without the addition of the substances. The results demonstrated
that neither the untreated, nor the effluent after ozonation or UV/H2O2 treatment
resulted in a loss in viability (Figure 33a) or an increase in DNA damage (Figure
33b).
Figure 33: Waste water treatment plant effluent before and after oxidative treatment. No cytotoxic (a) or genotoxic (b) effects.
Extracts of waste water treatment plant effluent using C18 or Strata X columns were
then also tested for their potential to induce DNA damaging effects before and after
ozonation, to rule out false positive effects due to the extraction procedure. As can
be seen in Figure 34 the Olive Tail Moments of both extracts (C18 and Strata X) are
comparable to both, the original water sample without extraction as well as the
negative control. There is also no statistically significant difference in the Olive Tail
Moment between the untreated samples and the samples after 60 minutes of
ozonation.

Results
104
Figure 34: No genotoxicity of WWTP extracts (C18 and Strata X) of WWTP effluent before and after ozonation
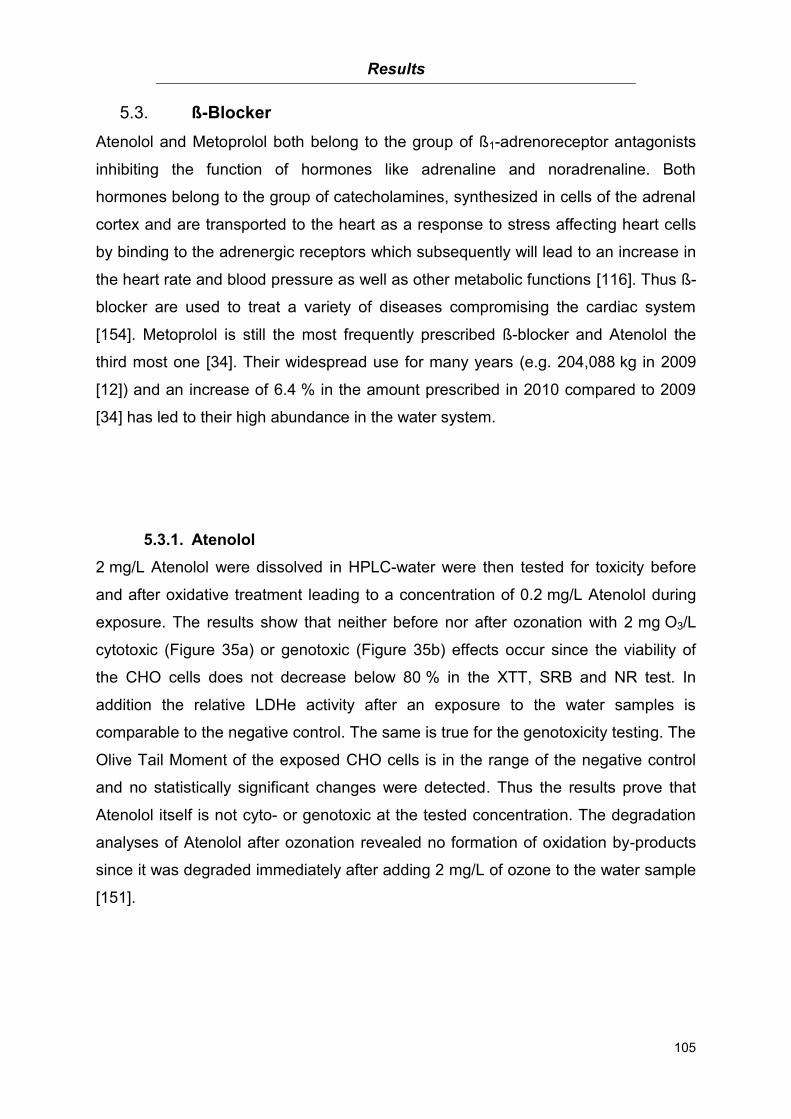
Results
105
ß-Blocker 5.3.
Atenolol and Metoprolol both belong to the group of ß1-adrenoreceptor antagonists
inhibiting the function of hormones like adrenaline and noradrenaline. Both
hormones belong to the group of catecholamines, synthesized in cells of the adrenal
cortex and are transported to the heart as a response to stress affecting heart cells
by binding to the adrenergic receptors which subsequently will lead to an increase in
the heart rate and blood pressure as well as other metabolic functions [116]. Thus ß-
blocker are used to treat a variety of diseases compromising the cardiac system
[154]. Metoprolol is still the most frequently prescribed ß-blocker and Atenolol the
third most one [34]. Their widespread use for many years (e.g. 204,088 kg in 2009
[12]) and an increase of 6.4 % in the amount prescribed in 2010 compared to 2009
[34] has led to their high abundance in the water system.
5.3.1. Atenolol
2 mg/L Atenolol were dissolved in HPLC-water were then tested for toxicity before
and after oxidative treatment leading to a concentration of 0.2 mg/L Atenolol during
exposure. The results show that neither before nor after ozonation with 2 mg O3/L
cytotoxic (Figure 35a) or genotoxic (Figure 35b) effects occur since the viability of
the CHO cells does not decrease below 80 % in the XTT, SRB and NR test. In
addition the relative LDHe activity after an exposure to the water samples is
comparable to the negative control. The same is true for the genotoxicity testing. The
Olive Tail Moment of the exposed CHO cells is in the range of the negative control
and no statistically significant changes were detected. Thus the results prove that
Atenolol itself is not cyto- or genotoxic at the tested concentration. The degradation
analyses of Atenolol after ozonation revealed no formation of oxidation by-products
since it was degraded immediately after adding 2 mg/L of ozone to the water sample
[151].
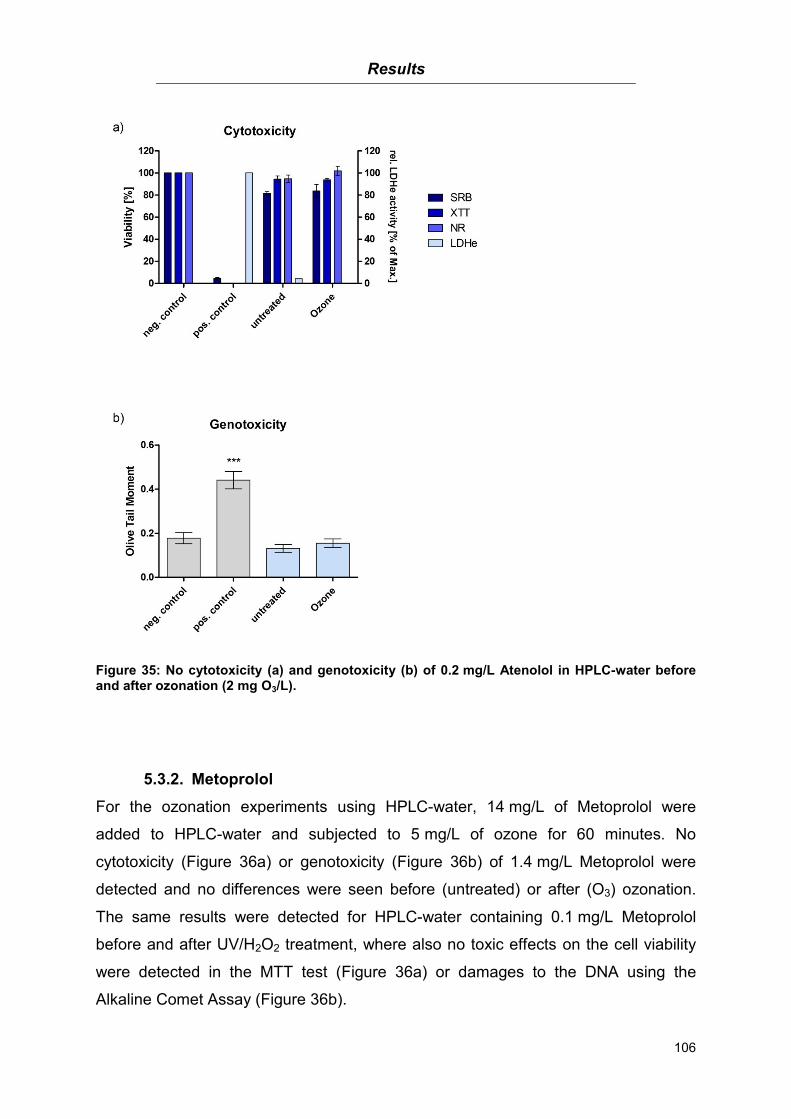
Results
106
Figure 35: No cytotoxicity (a) and genotoxicity (b) of 0.2 mg/L Atenolol in HPLC-water before and after ozonation (2 mg O3/L).
5.3.2. Metoprolol
For the ozonation experiments using HPLC-water, 14 mg/L of Metoprolol were
added to HPLC-water and subjected to 5 mg/L of ozone for 60 minutes. No
cytotoxicity (Figure 36a) or genotoxicity (Figure 36b) of 1.4 mg/L Metoprolol were
detected and no differences were seen before (untreated) or after (O3) ozonation.
The same results were detected for HPLC-water containing 0.1 mg/L Metoprolol
before and after UV/H2O2 treatment, where also no toxic effects on the cell viability
were detected in the MTT test (Figure 36a) or damages to the DNA using the
Alkaline Comet Assay (Figure 36b).
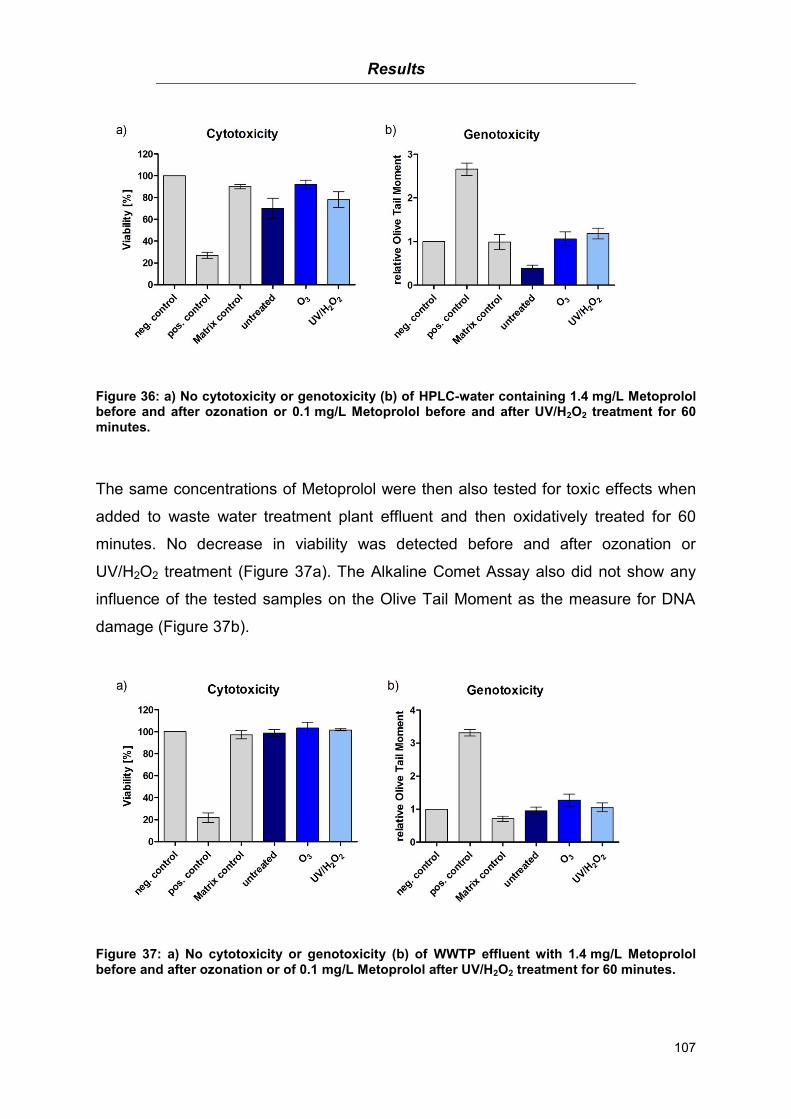
Results
107
Figure 36: a) No cytotoxicity or genotoxicity (b) of HPLC-water containing 1.4 mg/L Metoprolol before and after ozonation or 0.1 mg/L Metoprolol before and after UV/H2O2 treatment for 60 minutes.
The same concentrations of Metoprolol were then also tested for toxic effects when
added to waste water treatment plant effluent and then oxidatively treated for 60
minutes. No decrease in viability was detected before and after ozonation or
UV/H2O2 treatment (Figure 37a). The Alkaline Comet Assay also did not show any
influence of the tested samples on the Olive Tail Moment as the measure for DNA
damage (Figure 37b).
Figure 37: a) No cytotoxicity or genotoxicity (b) of WWTP effluent with 1.4 mg/L Metoprolol before and after ozonation or of 0.1 mg/L Metoprolol after UV/H2O2 treatment for 60 minutes.

Results
108
Estrogenic substances 5.4.
Estrogens like estradiol or estrone are hormones, promoting the development of the
female secondary sex characteristics. Besides this they play a role e.g. during
osteogenesis or the lipid metabolism [116]. Their mode of action is based on the
diffusion through the cell membrane followed by binding to an estrogen receptor only
present in specific tissues (e.g. breast, uterus, ovaries). The now activated
estrogen:receptor complex migrates into the nucleus and binds to an estrogen
responsive element of the DNA initiating DNA transcription and the production of
proteins. Naturally, estrogens are synthesized in vertebrates and also some
invertebrates through the transformation of male sexual hormones. Synthetic
estrogens, also known as xenoestrogens, are present as chemicals, plasticizers (e.g.
Bisphenol A), pharmaceuticals (e.g. 17α-ethinylestradiol) and cosmetics [155].
Although the use of estrogens and xenoestrogens in medicine is widespread the
amount of prescribed pharmaceuticals containing estradiol slightly decreased
(0.9 %) in 2010 compared to the amount prescribed in 2009 [34].
Synthetic estrogens are the most important compounds described as endocrine
disrupting chemicals (EDC). The word endocrine defines the process of the
formation of a hormone in an organ and its transport to the target location via the
blood [116]. EDC is the term for exogenous substances which mimic the action of
natural hormones thus affecting the hormonal system by interfering with natural
signaling pathways resulting in a variety of possible health effects [156, 157].
The most prevalent effects of EDC in the water system have been detected in fish. In
order to develop the female type estrogens are essential [116]. Thus if estrogens are
present in the environment at high concentrations a feminization of this fish
population might take place. Despite this, in vitro test sytems have also been able to
show the presence of EDC in different water bodies [158].
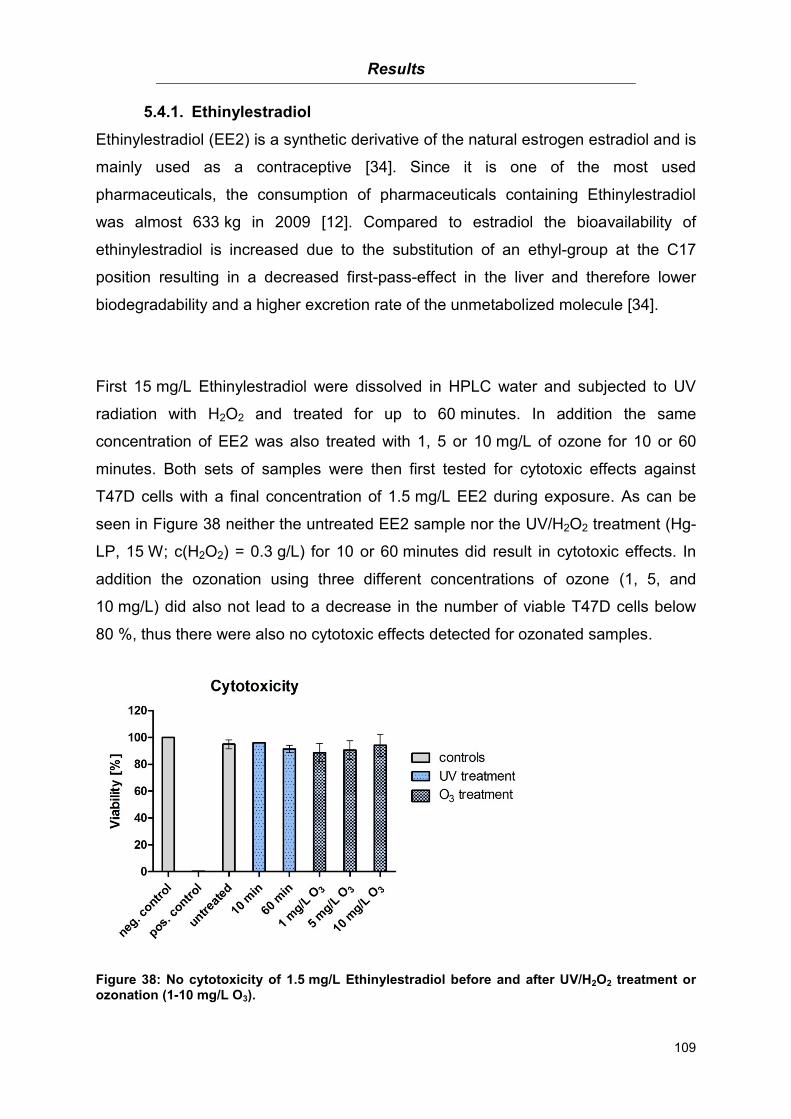
Results
109
5.4.1. Ethinylestradiol
Ethinylestradiol (EE2) is a synthetic derivative of the natural estrogen estradiol and is
mainly used as a contraceptive [34]. Since it is one of the most used
pharmaceuticals, the consumption of pharmaceuticals containing Ethinylestradiol
was almost 633 kg in 2009 [12]. Compared to estradiol the bioavailability of
ethinylestradiol is increased due to the substitution of an ethyl-group at the C17
position resulting in a decreased first-pass-effect in the liver and therefore lower
biodegradability and a higher excretion rate of the unmetabolized molecule [34].
First 15 mg/L Ethinylestradiol were dissolved in HPLC water and subjected to UV
radiation with H2O2 and treated for up to 60 minutes. In addition the same
concentration of EE2 was also treated with 1, 5 or 10 mg/L of ozone for 10 or 60
minutes. Both sets of samples were then first tested for cytotoxic effects against
T47D cells with a final concentration of 1.5 mg/L EE2 during exposure. As can be
seen in Figure 38 neither the untreated EE2 sample nor the UV/H2O2 treatment (Hg-
LP, 15 W; c(H2O2) = 0.3 g/L) for 10 or 60 minutes did result in cytotoxic effects. In
addition the ozonation using three different concentrations of ozone (1, 5, and
10 mg/L) did also not lead to a decrease in the number of viable T47D cells below
80 %, thus there were also no cytotoxic effects detected for ozonated samples.
Figure 38: No cytotoxicity of 1.5 mg/L Ethinylestradiol before and after UV/H2O2 treatment or ozonation (1-10 mg/L O3).

Results
110
Since Ethinylestradiol is a synthetic estrogen the samples were also tested for the
induction of estrogenic effects before and after oxidative treatment using the ER
Calux. Displayed in Table 28 are the results of the testing before and after ozonation
or UV/H2O2 treatment of HPLC-water containing 1.5 mg/L Ethinylestradiol. The EEQ
values clearly show that there is a decrease in estrogenicity after both treatment
methods compared to the untreated sample. An increase in treatment duration
(UV/H2O2) and ozone concentration leads to a decrease in estrogenic activity. In fact
the UV/H2O2 treatment resulted in a lower estrogenic activity after 60 min than the
highest ozone concentration (10 mg/L) after 60 minutes. However both methods did
not result in a complete elimination of the estrogenic activity from the water sample
and only slight differences in EEQ values were seen after treatment.
Table 28: Estrogenicity of 1.5 mg/L Ethinylestradiol dissolved in HPLC-water before and after UV treatment and ozonation.
Sample Estrogenicity
(ER Calux EEQ [pM/Well])
Estrogenicity (ER Calux EEQ
[ng/L])
untreated 1.8 4.90
10 min UV* 1.4 3.81
60 min UV* 0.9 2.45
1 mg/L O3 # 1.6 4.36
5 mg/L O3 # 1.3 3.54
10 mg/L O3 # 1.1 3.00
* Hg-LP, 15 W; c(H2O2) = 0.3 g/L; # duration = 60 min
5.4.2. Bisphenol A
According to the European Food Safety Authority, Bisphenol A is a chemical
substance mainly used as a basic material for the synthesis of polycarbonates and it
is also used as an antioxidant in plasticizers. These polycarbonates are then used in
everyday products e.g. storage boxes and plastic bottles. Due to its widespread use
(global production = 3.8 million tonnes in 2006 [159]), it has been detected in surface
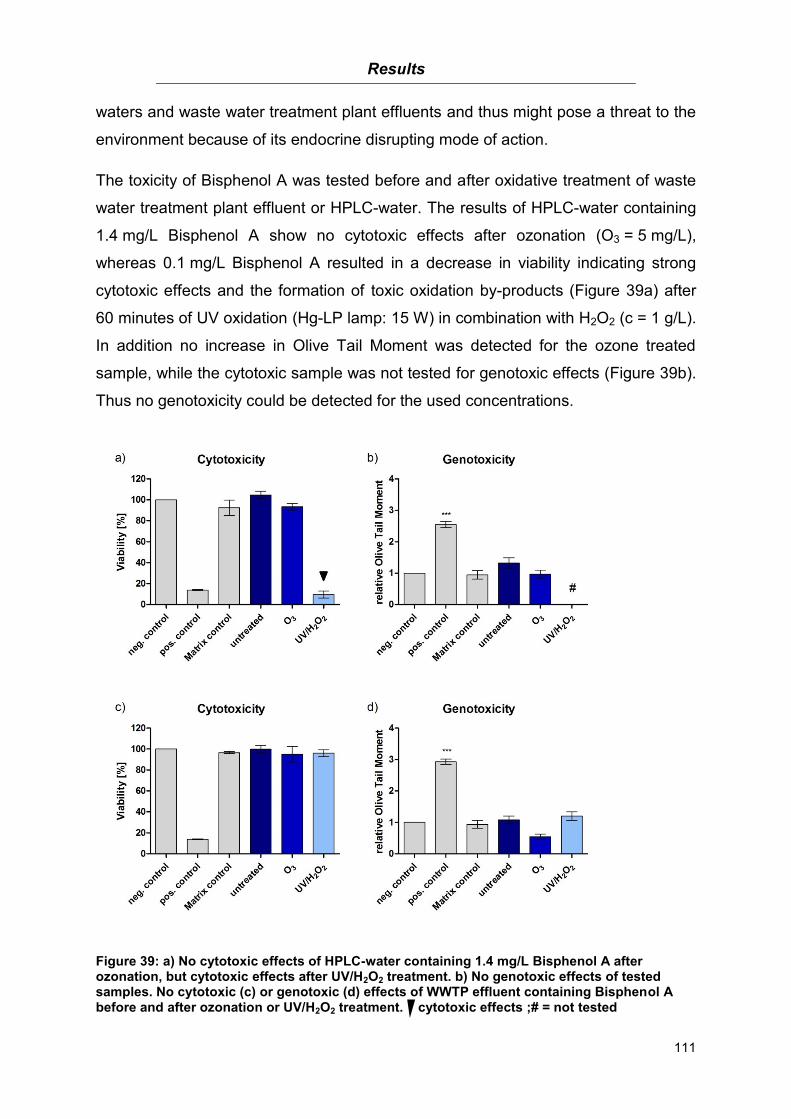
Results
111
waters and waste water treatment plant effluents and thus might pose a threat to the
environment because of its endocrine disrupting mode of action.
The toxicity of Bisphenol A was tested before and after oxidative treatment of waste
water treatment plant effluent or HPLC-water. The results of HPLC-water containing
1.4 mg/L Bisphenol A show no cytotoxic effects after ozonation (O3 = 5 mg/L),
whereas 0.1 mg/L Bisphenol A resulted in a decrease in viability indicating strong
cytotoxic effects and the formation of toxic oxidation by-products (Figure 39a) after
60 minutes of UV oxidation (Hg-LP lamp: 15 W) in combination with H2O2 (c = 1 g/L).
In addition no increase in Olive Tail Moment was detected for the ozone treated
sample, while the cytotoxic sample was not tested for genotoxic effects (Figure 39b).
Thus no genotoxicity could be detected for the used concentrations.
Figure 39: a) No cytotoxic effects of HPLC-water containing 1.4 mg/L Bisphenol A after ozonation, but cytotoxic effects after UV/H2O2 treatment. b) No genotoxic effects of tested samples. No cytotoxic (c) or genotoxic (d) effects of WWTP effluent containing Bisphenol A before and after ozonation or UV/H2O2 treatment. cytotoxic effects ;# = not tested
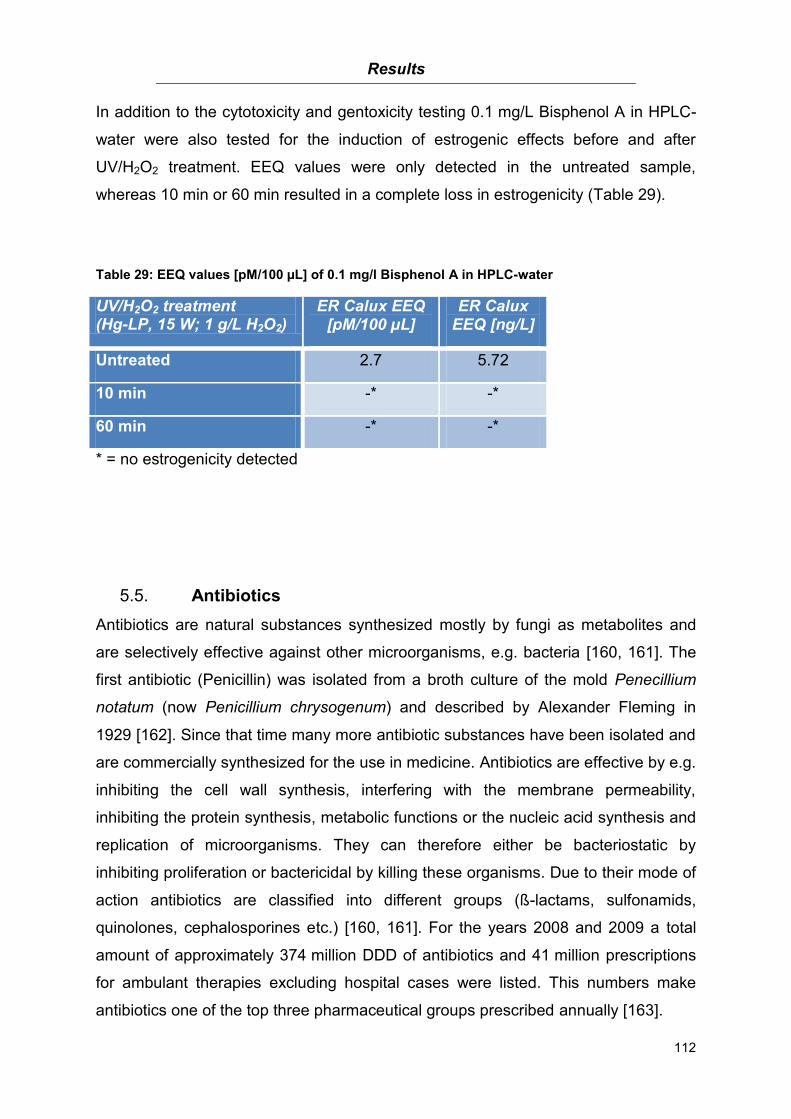
Results
112
In addition to the cytotoxicity and gentoxicity testing 0.1 mg/L Bisphenol A in HPLC-
water were also tested for the induction of estrogenic effects before and after
UV/H2O2 treatment. EEQ values were only detected in the untreated sample,
whereas 10 min or 60 min resulted in a complete loss in estrogenicity (Table 29).
Table 29: EEQ values [pM/100 µL] of 0.1 mg/l Bisphenol A in HPLC-water
UV/H2O2 treatment (Hg-LP, 15 W; 1 g/L H2O2)
ER Calux EEQ [pM/100 µL]
ER Calux EEQ [ng/L]
Untreated 2.7 5.72
10 min -* -*
60 min -* -*
* = no estrogenicity detected
Antibiotics 5.5.
Antibiotics are natural substances synthesized mostly by fungi as metabolites and
are selectively effective against other microorganisms, e.g. bacteria [160, 161]. The
first antibiotic (Penicillin) was isolated from a broth culture of the mold Penecillium
notatum (now Penicillium chrysogenum) and described by Alexander Fleming in
1929 [162]. Since that time many more antibiotic substances have been isolated and
are commercially synthesized for the use in medicine. Antibiotics are effective by e.g.
inhibiting the cell wall synthesis, interfering with the membrane permeability,
inhibiting the protein synthesis, metabolic functions or the nucleic acid synthesis and
replication of microorganisms. They can therefore either be bacteriostatic by
inhibiting proliferation or bactericidal by killing these organisms. Due to their mode of
action antibiotics are classified into different groups (ß-lactams, sulfonamids,
quinolones, cephalosporines etc.) [160, 161]. For the years 2008 and 2009 a total
amount of approximately 374 million DDD of antibiotics and 41 million prescriptions
for ambulant therapies excluding hospital cases were listed. This numbers make
antibiotics one of the top three pharmaceutical groups prescribed annually [163].

Results
113
In this project the antibiotics Sulfamethoxazole, Ciprofloxacin, Ofloxacin, and
Triclosan were investigated for their toxicological effects before and after oxidative
treatment.
5.5.1. Sulfamethoxazole
Sulfamethoxazole belongs to the group of sulfonamide antibiotics and is used for the
treatment of e.g. urinary tract infections and pneumonia [160]. It is always applied in
combination with Trimethoprim, another bacteriostatic agent [164]. Sulfonamide
antibiotics work by inhibiting the 4-Aminobenzoic acid, an intermediate during the
synthesis of folate, which in the end leads to interruptions of DNA and RNA
synthesis and thus a disturbed synthesis of amino acids, proteins and nucleotides. It
can be used in human medicine since humans do not synthesize folic acid
themselves and therefore will not be affected by this group of antibiotics [160]. The
sum of Sulfamethoxazole containing antibiotics added up to 15.8 million DDD in
2011 which is a decline of 3.5 % compared to 2009. In fact sulfonamide antibiotics
are the group with the lowest number of prescriptions in 2011 compared to other
groups of antibiotics, e.g. fluoroquinolones or makrolides [34].
As can be seen in Figure 40 the viability of CHO cells exposed to HPLC-water
containing 0.1 mg/L Sulfamethoxazole before and after UV/H2O2 treatment (Hg-LP
lamp, 15 W; 1 g/L H2O2) did not result in a decrease of the viability below 80 %, and
therefore no cytotoxicity was detected. The Olive Tail Moment of the CHO cells
exposed to the same samples did also not increase significantly in comparison to the
negative control. Thus there are neither cytotoxic nor genotoxic effects of
Sulfamethoxazole itself and its oxidation by-products in HPLC-water.

Results
114
Figure 40: Sulfamethoxazole (0.1 mg/L) in HPLC-water before and after UV/H2O2 treatment. No cytotoxicity (a) or genotoxicity (b) detected.
The ozonation (5 mg/L O3) of HPLC-water containing 14 mg/L Sulfamethoxazol did
also not lead to the detection of cytotoxic (Figure 41a) or genotoxic (Figure 41b)
effects in CHO cells after an exposure to 1.4 mg/L Sulfamethoxazole. There was no
significant difference between the untreated (0 in) and treated (60 min) samples.
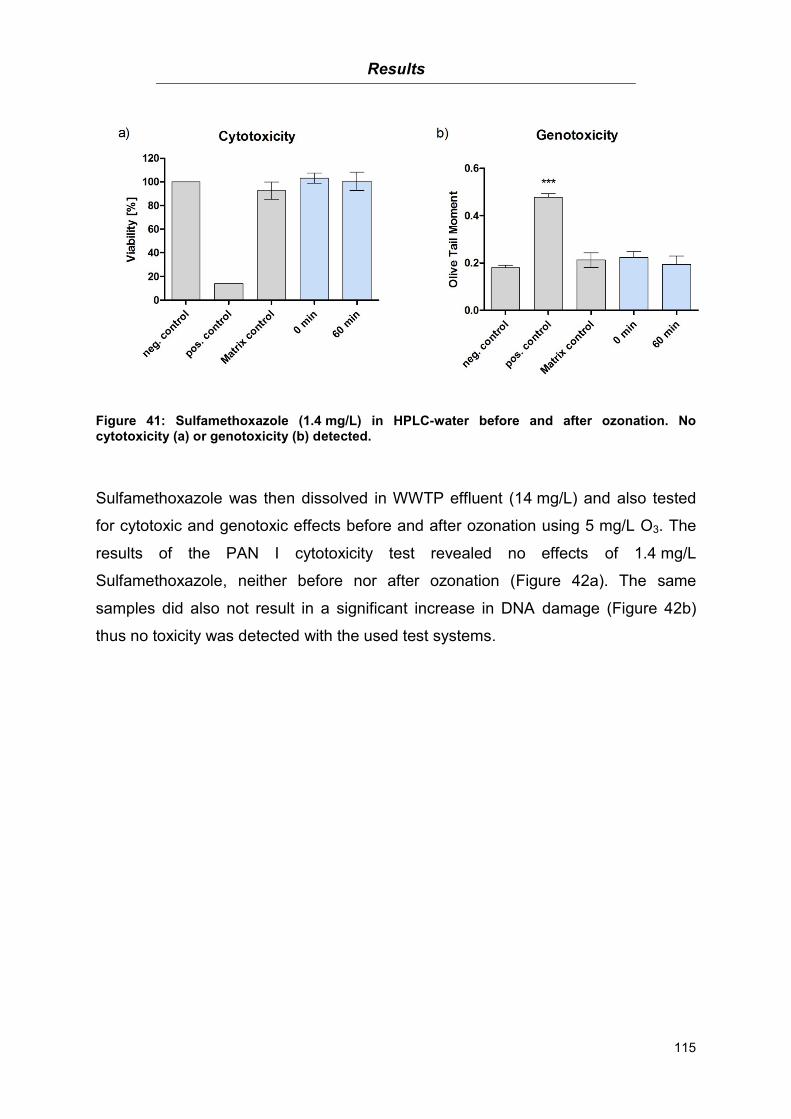
Results
115
Figure 41: Sulfamethoxazole (1.4 mg/L) in HPLC-water before and after ozonation. No cytotoxicity (a) or genotoxicity (b) detected.
Sulfamethoxazole was then dissolved in WWTP effluent (14 mg/L) and also tested
for cytotoxic and genotoxic effects before and after ozonation using 5 mg/L O3. The
results of the PAN I cytotoxicity test revealed no effects of 1.4 mg/L
Sulfamethoxazole, neither before nor after ozonation (Figure 42a). The same
samples did also not result in a significant increase in DNA damage (Figure 42b)
thus no toxicity was detected with the used test systems.
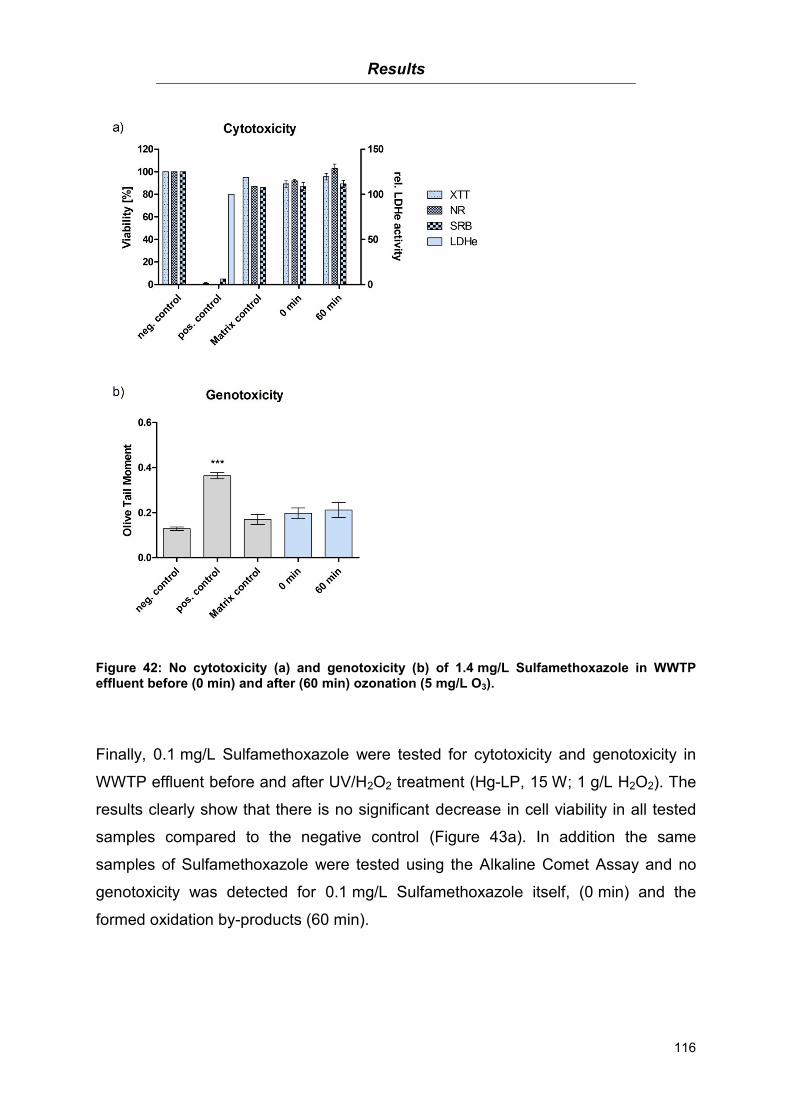
Results
116
Figure 42: No cytotoxicity (a) and genotoxicity (b) of 1.4 mg/L Sulfamethoxazole in WWTP effluent before (0 min) and after (60 min) ozonation (5 mg/L O3).
Finally, 0.1 mg/L Sulfamethoxazole were tested for cytotoxicity and genotoxicity in
WWTP effluent before and after UV/H2O2 treatment (Hg-LP, 15 W; 1 g/L H2O2). The
results clearly show that there is no significant decrease in cell viability in all tested
samples compared to the negative control (Figure 43a). In addition the same
samples of Sulfamethoxazole were tested using the Alkaline Comet Assay and no
genotoxicity was detected for 0.1 mg/L Sulfamethoxazole itself, (0 min) and the
formed oxidation by-products (60 min).
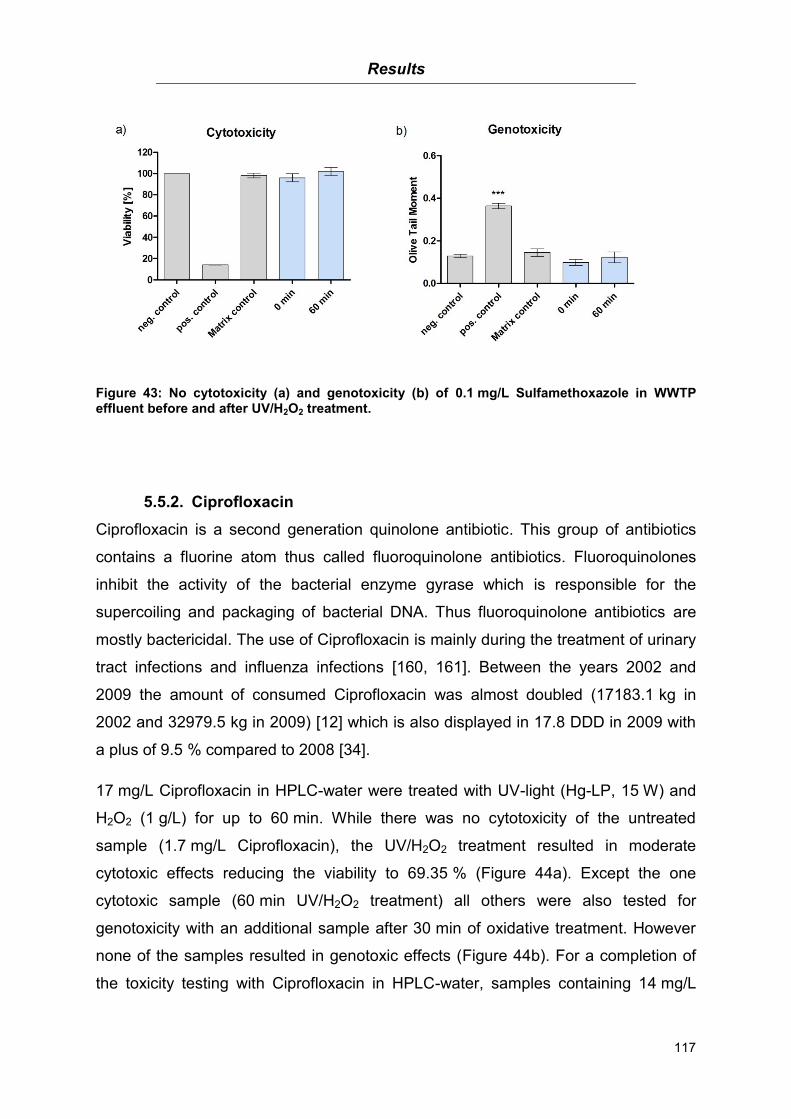
Results
117
Figure 43: No cytotoxicity (a) and genotoxicity (b) of 0.1 mg/L Sulfamethoxazole in WWTP effluent before and after UV/H2O2 treatment.
5.5.2. Ciprofloxacin
Ciprofloxacin is a second generation quinolone antibiotic. This group of antibiotics
contains a fluorine atom thus called fluoroquinolone antibiotics. Fluoroquinolones
inhibit the activity of the bacterial enzyme gyrase which is responsible for the
supercoiling and packaging of bacterial DNA. Thus fluoroquinolone antibiotics are
mostly bactericidal. The use of Ciprofloxacin is mainly during the treatment of urinary
tract infections and influenza infections [160, 161]. Between the years 2002 and
2009 the amount of consumed Ciprofloxacin was almost doubled (17183.1 kg in
2002 and 32979.5 kg in 2009) [12] which is also displayed in 17.8 DDD in 2009 with
a plus of 9.5 % compared to 2008 [34].
17 mg/L Ciprofloxacin in HPLC-water were treated with UV-light (Hg-LP, 15 W) and
H2O2 (1 g/L) for up to 60 min. While there was no cytotoxicity of the untreated
sample (1.7 mg/L Ciprofloxacin), the UV/H2O2 treatment resulted in moderate
cytotoxic effects reducing the viability to 69.35 % (Figure 44a). Except the one
cytotoxic sample (60 min UV/H2O2 treatment) all others were also tested for
genotoxicity with an additional sample after 30 min of oxidative treatment. However
none of the samples resulted in genotoxic effects (Figure 44b). For a completion of
the toxicity testing with Ciprofloxacin in HPLC-water, samples containing 14 mg/L
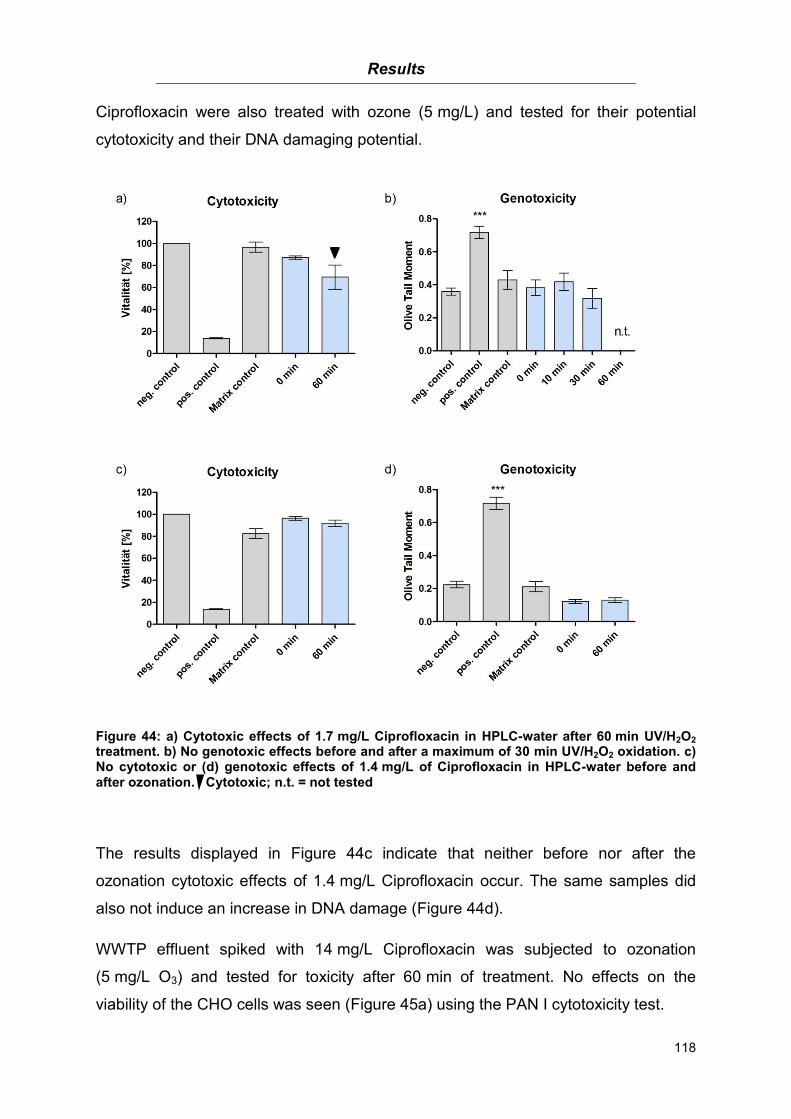
Results
118
Ciprofloxacin were also treated with ozone (5 mg/L) and tested for their potential
cytotoxicity and their DNA damaging potential.
Figure 44: a) Cytotoxic effects of 1.7 mg/L Ciprofloxacin in HPLC-water after 60 min UV/H2O2 treatment. b) No genotoxic effects before and after a maximum of 30 min UV/H2O2 oxidation. c) No cytotoxic or (d) genotoxic effects of 1.4 mg/L of Ciprofloxacin in HPLC-water before and after ozonation. Cytotoxic; n.t. = not tested
The results displayed in Figure 44c indicate that neither before nor after the
ozonation cytotoxic effects of 1.4 mg/L Ciprofloxacin occur. The same samples did
also not induce an increase in DNA damage (Figure 44d).
WWTP effluent spiked with 14 mg/L Ciprofloxacin was subjected to ozonation
(5 mg/L O3) and tested for toxicity after 60 min of treatment. No effects on the
viability of the CHO cells was seen (Figure 45a) using the PAN I cytotoxicity test.
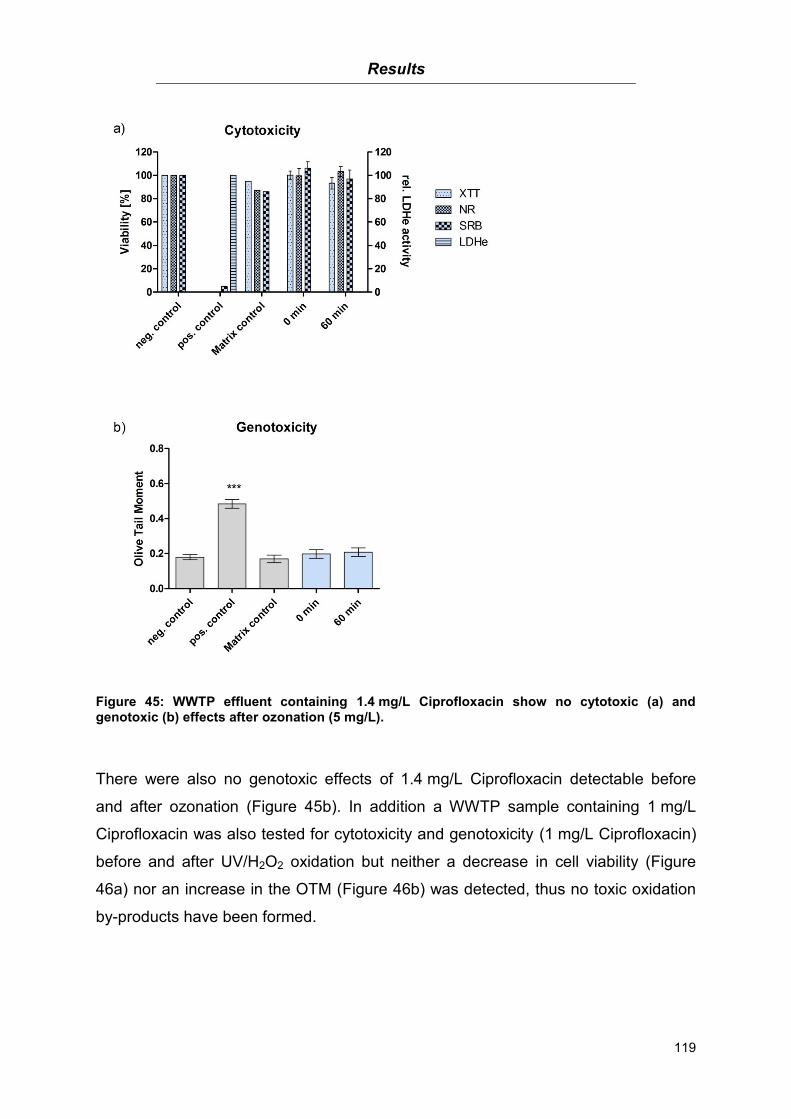
Results
119
Figure 45: WWTP effluent containing 1.4 mg/L Ciprofloxacin show no cytotoxic (a) and genotoxic (b) effects after ozonation (5 mg/L).
There were also no genotoxic effects of 1.4 mg/L Ciprofloxacin detectable before
and after ozonation (Figure 45b). In addition a WWTP sample containing 1 mg/L
Ciprofloxacin was also tested for cytotoxicity and genotoxicity (1 mg/L Ciprofloxacin)
before and after UV/H2O2 oxidation but neither a decrease in cell viability (Figure
46a) nor an increase in the OTM (Figure 46b) was detected, thus no toxic oxidation
by-products have been formed.
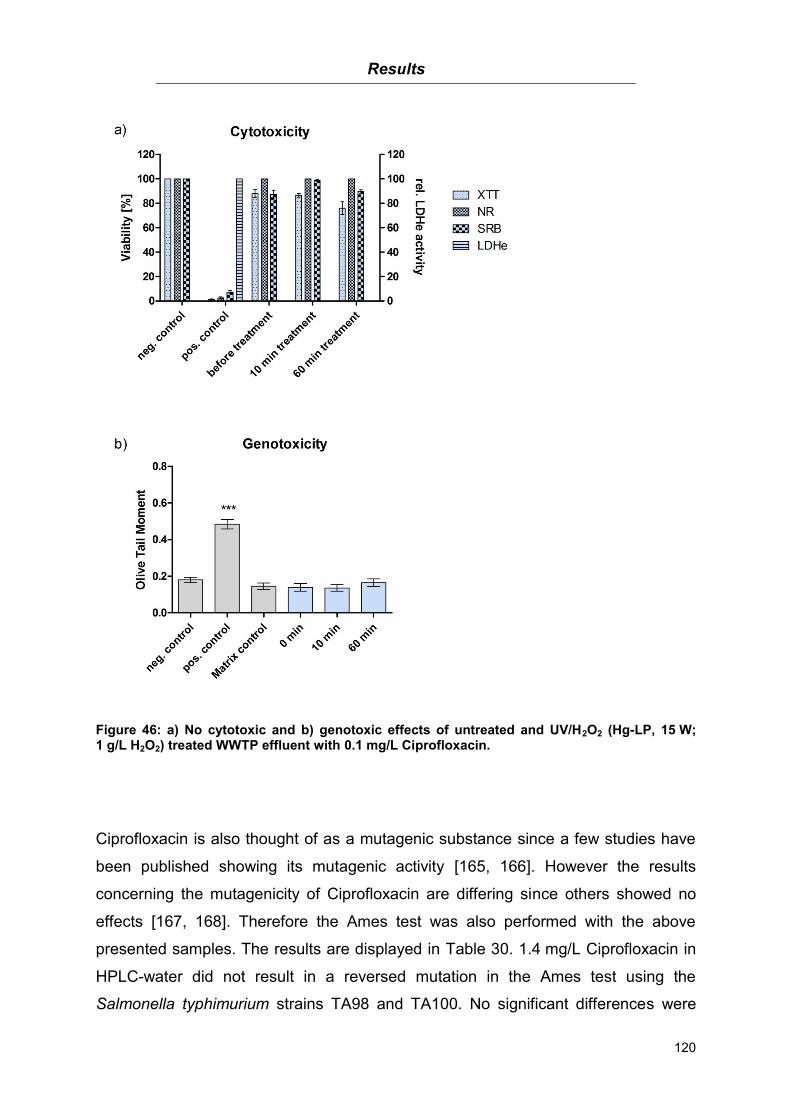
Results
120
Figure 46: a) No cytotoxic and b) genotoxic effects of untreated and UV/H2O2 (Hg-LP, 15 W; 1 g/L H2O2) treated WWTP effluent with 0.1 mg/L Ciprofloxacin.
Ciprofloxacin is also thought of as a mutagenic substance since a few studies have
been published showing its mutagenic activity [165, 166]. However the results
concerning the mutagenicity of Ciprofloxacin are differing since others showed no
effects [167, 168]. Therefore the Ames test was also performed with the above
presented samples. The results are displayed in Table 30. 1.4 mg/L Ciprofloxacin in
HPLC-water did not result in a reversed mutation in the Ames test using the
Salmonella typhimurium strains TA98 and TA100. No significant differences were
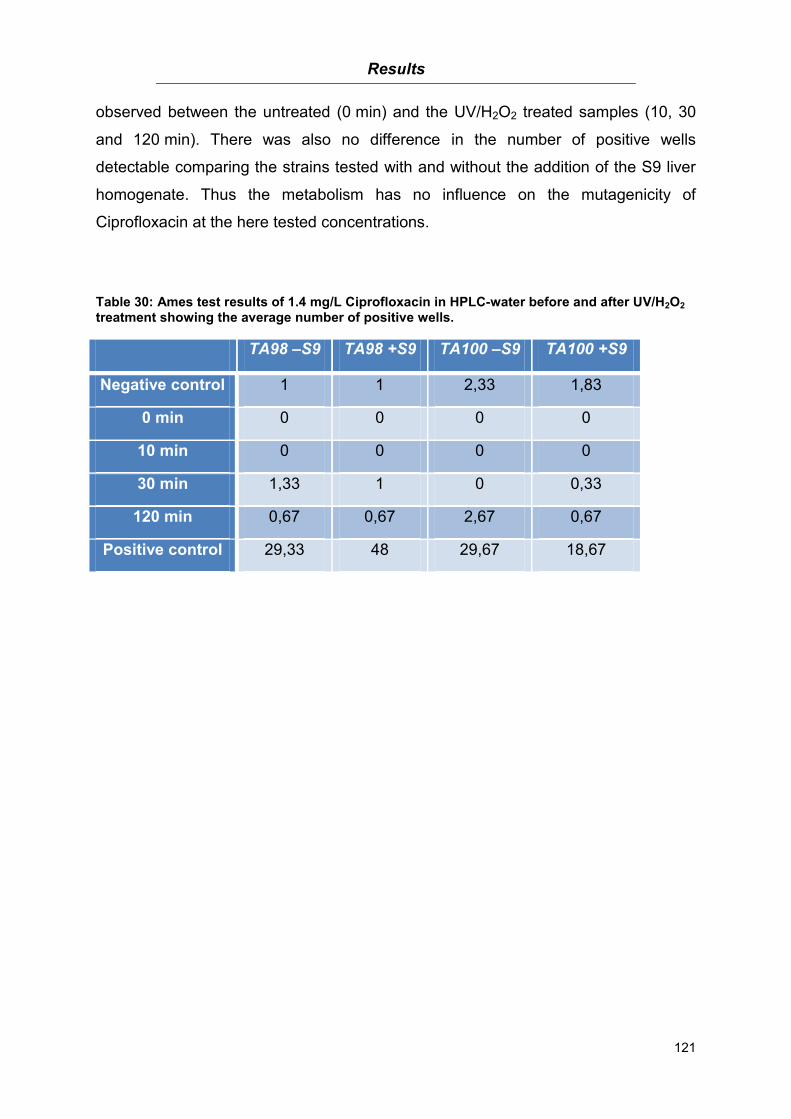
Results
121
observed between the untreated (0 min) and the UV/H2O2 treated samples (10, 30
and 120 min). There was also no difference in the number of positive wells
detectable comparing the strains tested with and without the addition of the S9 liver
homogenate. Thus the metabolism has no influence on the mutagenicity of
Ciprofloxacin at the here tested concentrations.
Table 30: Ames test results of 1.4 mg/L Ciprofloxacin in HPLC-water before and after UV/H2O2 treatment showing the average number of positive wells.
TA98 –S9 TA98 +S9 TA100 –S9 TA100 +S9
Negative control 1 1 2,33 1,83
0 min 0 0 0 0
10 min 0 0 0 0
30 min 1,33 1 0 0,33
120 min 0,67 0,67 2,67 0,67
Positive control 29,33 48 29,67 18,67
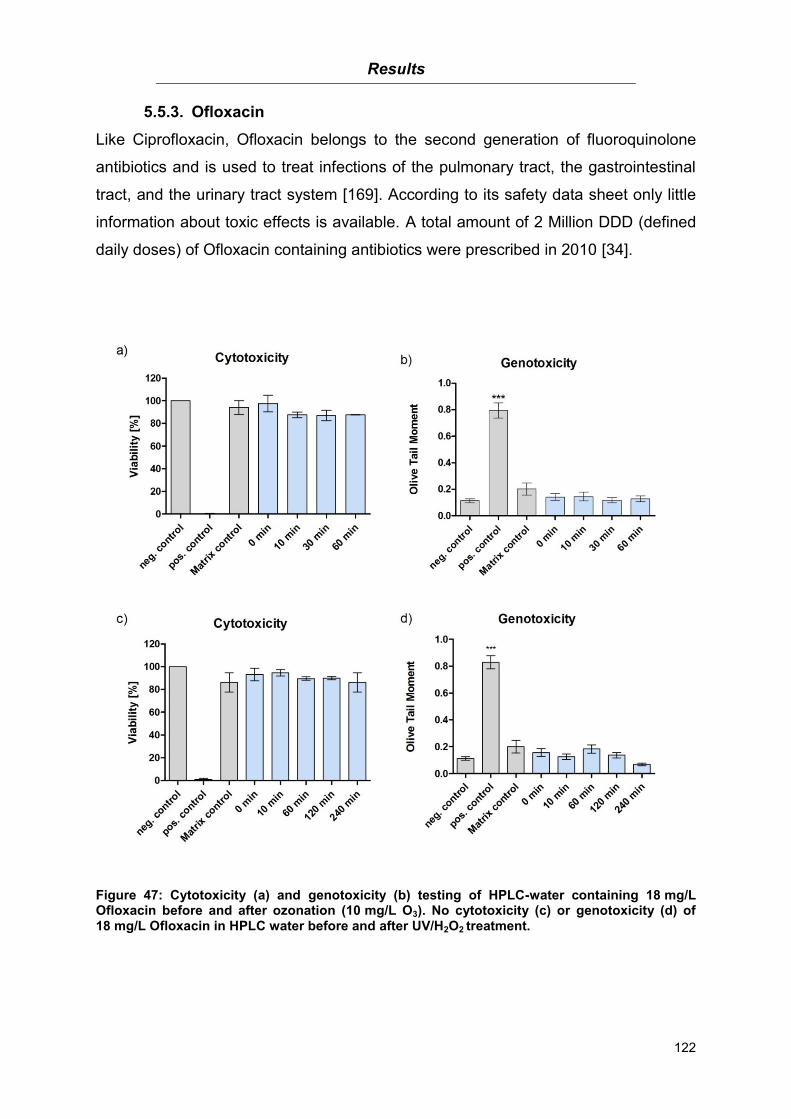
Results
122
5.5.3. Ofloxacin
Like Ciprofloxacin, Ofloxacin belongs to the second generation of fluoroquinolone
antibiotics and is used to treat infections of the pulmonary tract, the gastrointestinal
tract, and the urinary tract system [169]. According to its safety data sheet only little
information about toxic effects is available. A total amount of 2 Million DDD (defined
daily doses) of Ofloxacin containing antibiotics were prescribed in 2010 [34].
Figure 47: Cytotoxicity (a) and genotoxicity (b) testing of HPLC-water containing 18 mg/L Ofloxacin before and after ozonation (10 mg/L O3). No cytotoxicity (c) or genotoxicity (d) of 18 mg/L Ofloxacin in HPLC water before and after UV/H2O2 treatment.
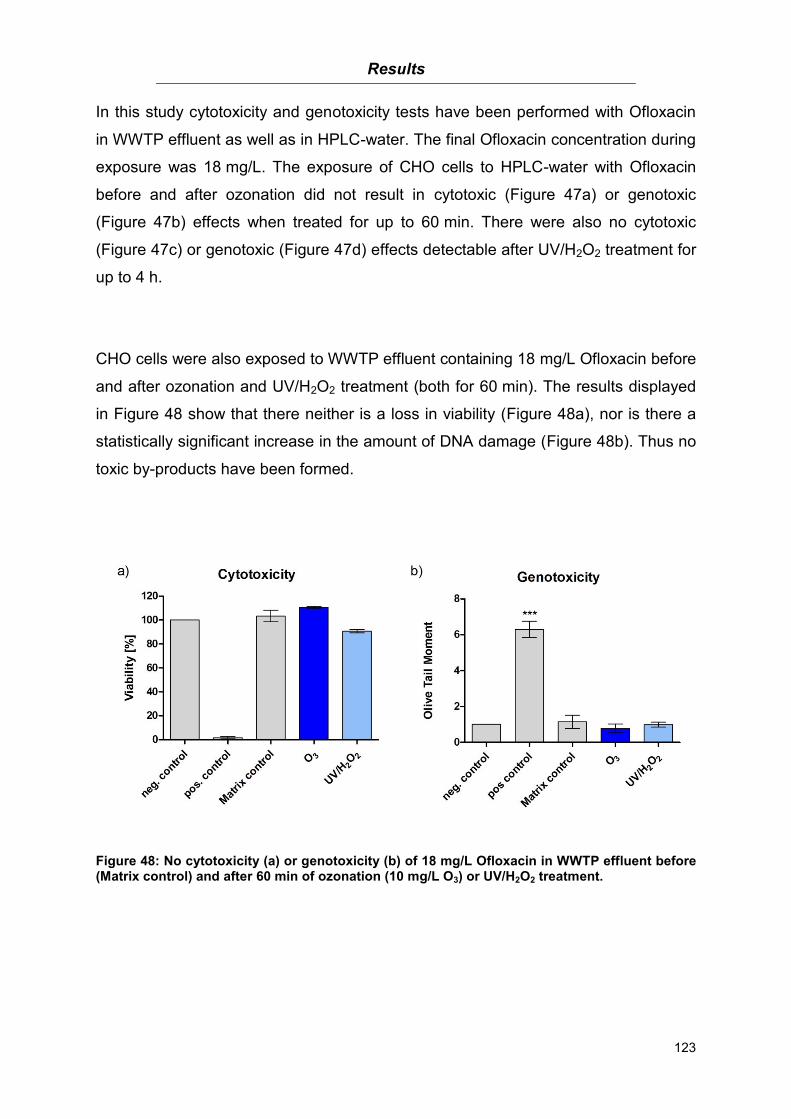
Results
123
In this study cytotoxicity and genotoxicity tests have been performed with Ofloxacin
in WWTP effluent as well as in HPLC-water. The final Ofloxacin concentration during
exposure was 18 mg/L. The exposure of CHO cells to HPLC-water with Ofloxacin
before and after ozonation did not result in cytotoxic (Figure 47a) or genotoxic
(Figure 47b) effects when treated for up to 60 min. There were also no cytotoxic
(Figure 47c) or genotoxic (Figure 47d) effects detectable after UV/H2O2 treatment for
up to 4 h.
CHO cells were also exposed to WWTP effluent containing 18 mg/L Ofloxacin before
and after ozonation and UV/H2O2 treatment (both for 60 min). The results displayed
in Figure 48 show that there neither is a loss in viability (Figure 48a), nor is there a
statistically significant increase in the amount of DNA damage (Figure 48b). Thus no
toxic by-products have been formed.
Figure 48: No cytotoxicity (a) or genotoxicity (b) of 18 mg/L Ofloxacin in WWTP effluent before (Matrix control) and after 60 min of ozonation (10 mg/L O3) or UV/H2O2 treatment.

Results
124
5.5.4. Triclosan and 2,4-Dichlorophenol
Triclosan (2,4,4’-trichloro-2’hydroxydiphenylether) is an antimicrobial agent used in a
variety of everyday life products, e.g. toothpaste, kitchen supplies, sports clothing,
cosmetics, childrens toys etc. [170, 171]. Although it is not used as a pharmaceutical
agent, its ubiquitous use has led to detections in water systems, including WWTP
effluents and surface waters, in concentrations up to several µg/L where it might
pose a threat to the environment [171, 172].
The ozonation of Triclosan using three different Triclosan:ozone ratios (1:1, 1:3 and
1:5) resulted in the formation of a variety of oxidation by-products with 2,4-
Dichlorophenol being the most prevalent one as shown in Figure 49 [173].
Figure 49: HPLC-MS/MS Q1-Scan chromatogram of a sample with different triclosan:ozone ratios of 1:1, 1:3 and 1:5 [173].
Therefore sterile concentration series of Triclosan and 2,4-Dichlorophenol (0 –
100 µg/L) were prepared in Ampuwa and the cytotoxicity as well as the genotoxicity
were determined. The MTT test showed that neither substance had cytotoxic effects
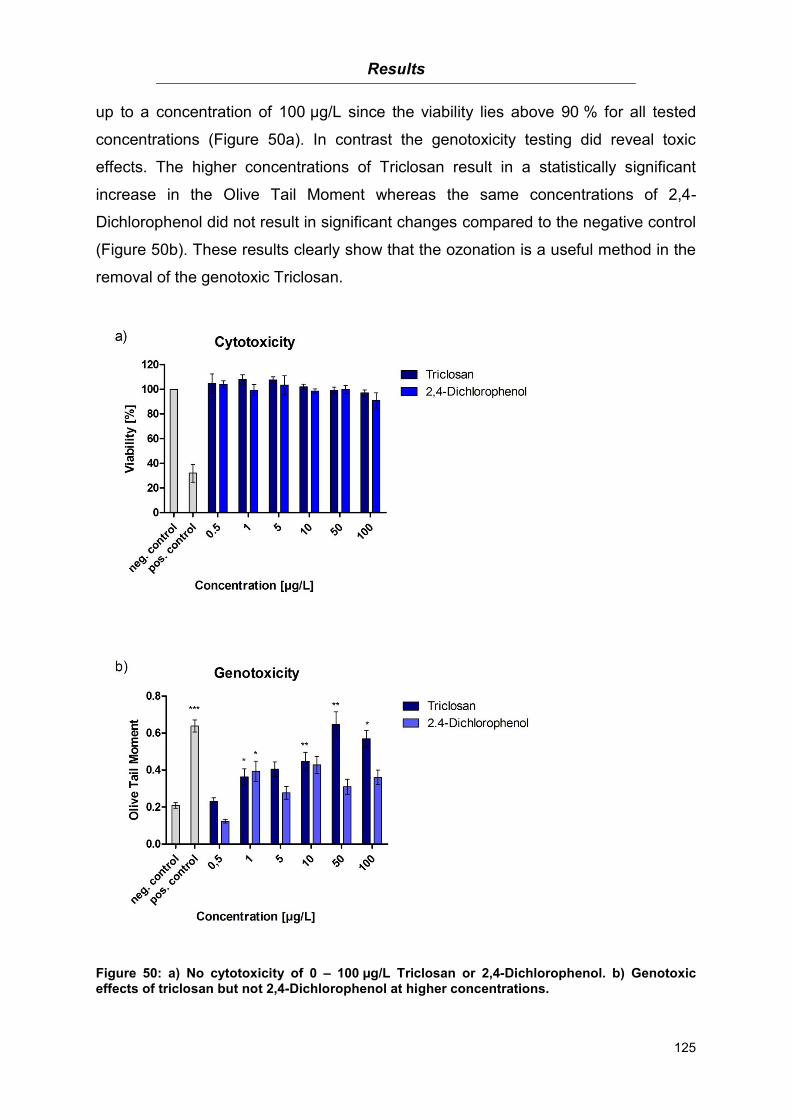
Results
125
up to a concentration of 100 µg/L since the viability lies above 90 % for all tested
concentrations (Figure 50a). In contrast the genotoxicity testing did reveal toxic
effects. The higher concentrations of Triclosan result in a statistically significant
increase in the Olive Tail Moment whereas the same concentrations of 2,4-
Dichlorophenol did not result in significant changes compared to the negative control
(Figure 50b). These results clearly show that the ozonation is a useful method in the
removal of the genotoxic Triclosan.
Figure 50: a) No cytotoxicity of 0 – 100 µg/L Triclosan or 2,4-Dichlorophenol. b) Genotoxic effects of triclosan but not 2,4-Dichlorophenol at higher concentrations.
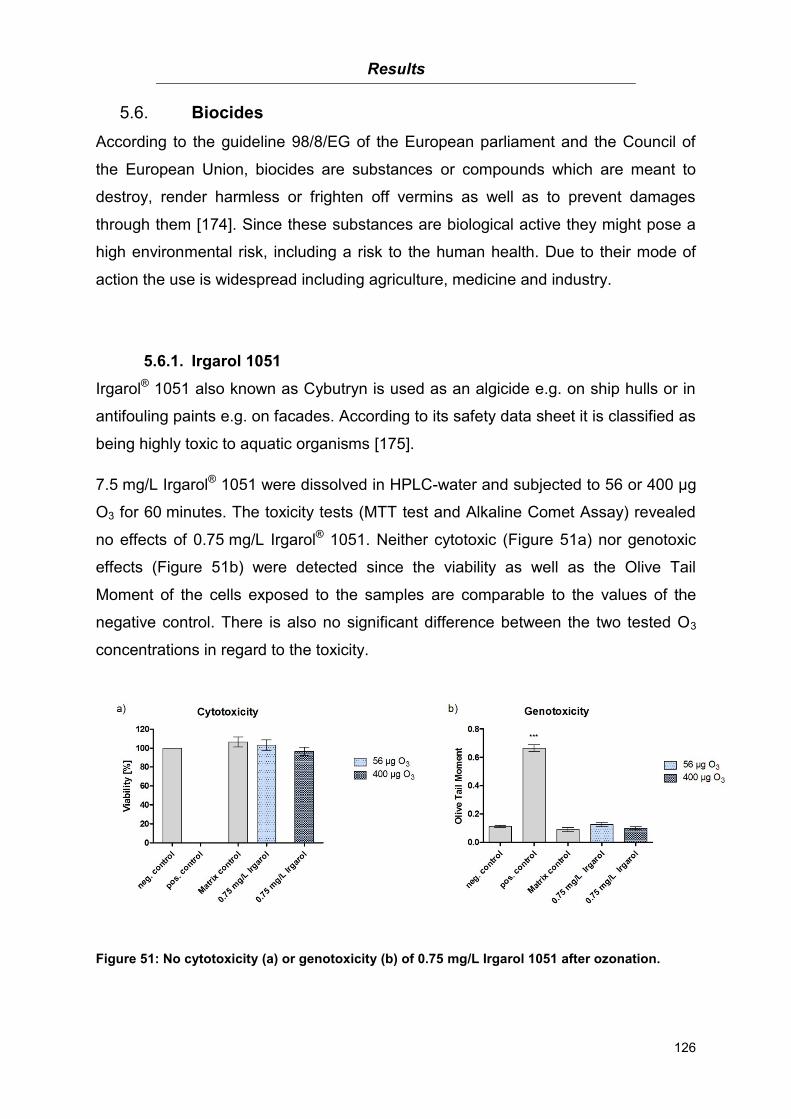
Results
126
Biocides 5.6.
According to the guideline 98/8/EG of the European parliament and the Council of
the European Union, biocides are substances or compounds which are meant to
destroy, render harmless or frighten off vermins as well as to prevent damages
through them [174]. Since these substances are biological active they might pose a
high environmental risk, including a risk to the human health. Due to their mode of
action the use is widespread including agriculture, medicine and industry.
5.6.1. Irgarol 1051
Irgarol® 1051 also known as Cybutryn is used as an algicide e.g. on ship hulls or in
antifouling paints e.g. on facades. According to its safety data sheet it is classified as
being highly toxic to aquatic organisms [175].
7.5 mg/L Irgarol® 1051 were dissolved in HPLC-water and subjected to 56 or 400 µg
O3 for 60 minutes. The toxicity tests (MTT test and Alkaline Comet Assay) revealed
no effects of 0.75 mg/L Irgarol® 1051. Neither cytotoxic (Figure 51a) nor genotoxic
effects (Figure 51b) were detected since the viability as well as the Olive Tail
Moment of the cells exposed to the samples are comparable to the values of the
negative control. There is also no significant difference between the two tested O3
concentrations in regard to the toxicity.
Figure 51: No cytotoxicity (a) or genotoxicity (b) of 0.75 mg/L Irgarol 1051 after ozonation.
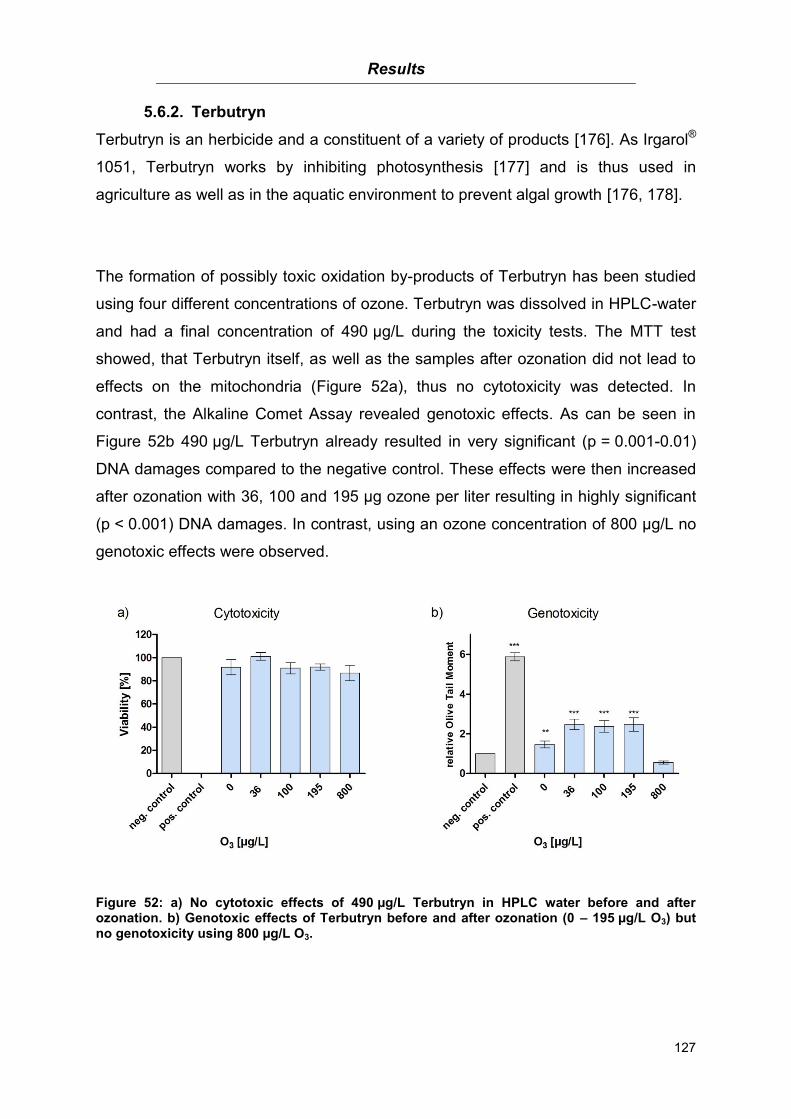
Results
127
5.6.2. Terbutryn
Terbutryn is an herbicide and a constituent of a variety of products [176]. As Irgarol®
1051, Terbutryn works by inhibiting photosynthesis [177] and is thus used in
agriculture as well as in the aquatic environment to prevent algal growth [176, 178].
The formation of possibly toxic oxidation by-products of Terbutryn has been studied
using four different concentrations of ozone. Terbutryn was dissolved in HPLC-water
and had a final concentration of 490 µg/L during the toxicity tests. The MTT test
showed, that Terbutryn itself, as well as the samples after ozonation did not lead to
effects on the mitochondria (Figure 52a), thus no cytotoxicity was detected. In
contrast, the Alkaline Comet Assay revealed genotoxic effects. As can be seen in
Figure 52b 490 µg/L Terbutryn already resulted in very significant (p = 0.001-0.01)
DNA damages compared to the negative control. These effects were then increased
after ozonation with 36, 100 and 195 µg ozone per liter resulting in highly significant
(p < 0.001) DNA damages. In contrast, using an ozone concentration of 800 µg/L no
genotoxic effects were observed.
Figure 52: a) No cytotoxic effects of 490 µg/L Terbutryn in HPLC water before and after ozonation. b) Genotoxic effects of Terbutryn before and after ozonation (0 – 195 µg/L O3) but no genotoxicity using 800 µg/L O3.

Results
128
Musk fragrances 5.7.
Musk fragrances are aromatic substances used in personal care products (e.g.
shampoo, perfume, soap, etc.) with AHTN and HHCB being two of the most used
compounds [179]. Their ubiquitous use (both classified as high production volume
chemicals) has led to their detection in surface waters [38] and WWTP effluents
since they are not removed during conventional treatment processes. Their presence
in the water system is of great concern since musk xylene has already been added
to the candidate list of substances of very high concern for authorization by the
European Chemicals Agency (ECHA) [180]. In addition polycyclic musks, like AHTN
and HHCB have also been detected in water and fish samples as well as in human
fat [181].
5.7.1. AHTN
AHTN (8 1-(3,5,5,6,8,8-hexamethyl-6,7-dihydronaphthalen-2-yl)ethanone) also
known as Tonalid is one of the most used polycyclic musks in cosmetics [179]. The
exposure of AHTN on a daily basis was shown to be 409 µg/d after an application to
the skin. Blood concentrations range up to a maximum of 0.29 µg/L [182] and
environmental concentrations have been reported to be in the range of ng/L to µg/L
concentrations [36, 37, 183, 184]. According to the SCHER risk assessment report,
AHTN is not considered genotoxic or carcinogenic [185].
Up to 5 min UV treatment (low pressure UV-Hg lamp; 254 nm) of 1 mg/L AHTN in
HPLC-water had no influence on the cytotoxicity, whereas 20 min UV treatment
resulted in cytotoxic effects (Figure 53a) after an exposure to 0.1 mg/L AHTN. The
viability of the used CHO cells was decreased to 74.3 % (± 7.7 %) thus the sample
was classified as weakly cytotoxic. In addition, the cytotoxic sample was tested for
remaining peroxides but none were detected indicating the formation of cytotoxic
oxidation by-products since there was also no initial cytotoxicity of AHTN before the
application of UV treatment. The Alkaline Comet Assay in contrast did not show any
effects for all three time points of UV treatment (Figure 53b).
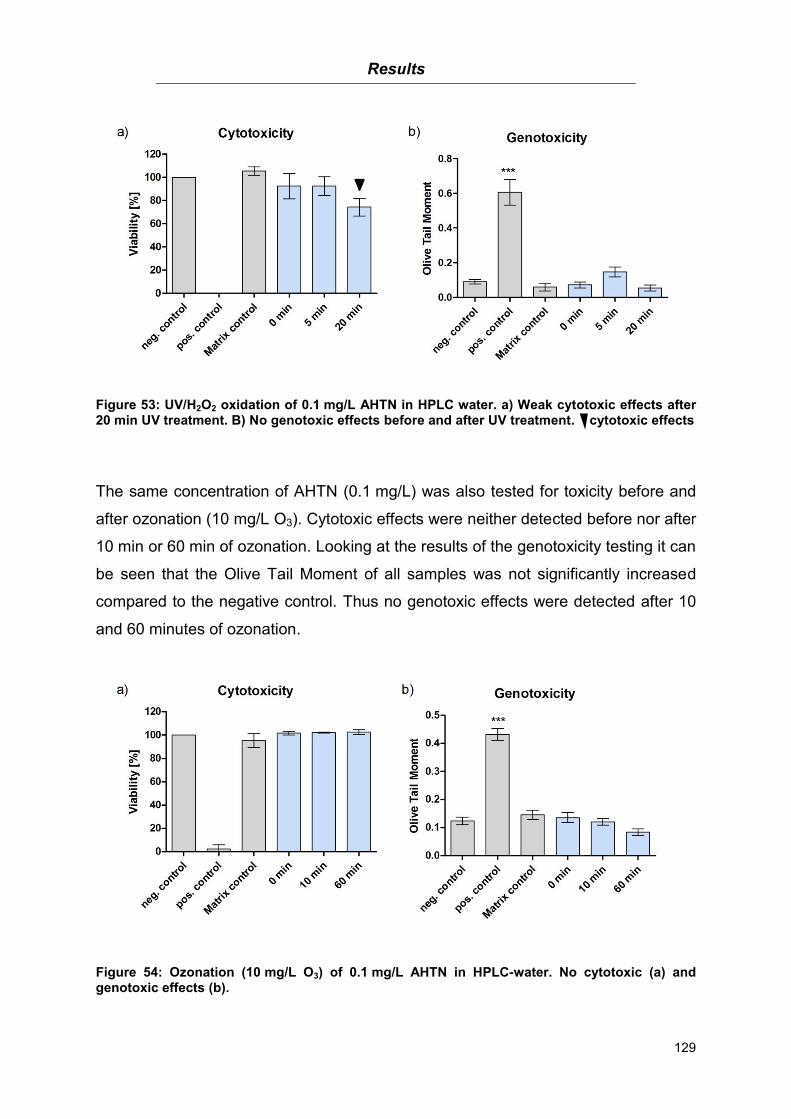
Results
129
Figure 53: UV/H2O2 oxidation of 0.1 mg/L AHTN in HPLC water. a) Weak cytotoxic effects after 20 min UV treatment. B) No genotoxic effects before and after UV treatment. cytotoxic effects
The same concentration of AHTN (0.1 mg/L) was also tested for toxicity before and
after ozonation (10 mg/L O3). Cytotoxic effects were neither detected before nor after
10 min or 60 min of ozonation. Looking at the results of the genotoxicity testing it can
be seen that the Olive Tail Moment of all samples was not significantly increased
compared to the negative control. Thus no genotoxic effects were detected after 10
and 60 minutes of ozonation.
Figure 54: Ozonation (10 mg/L O3) of 0.1 mg/L AHTN in HPLC-water. No cytotoxic (a) and genotoxic effects (b).
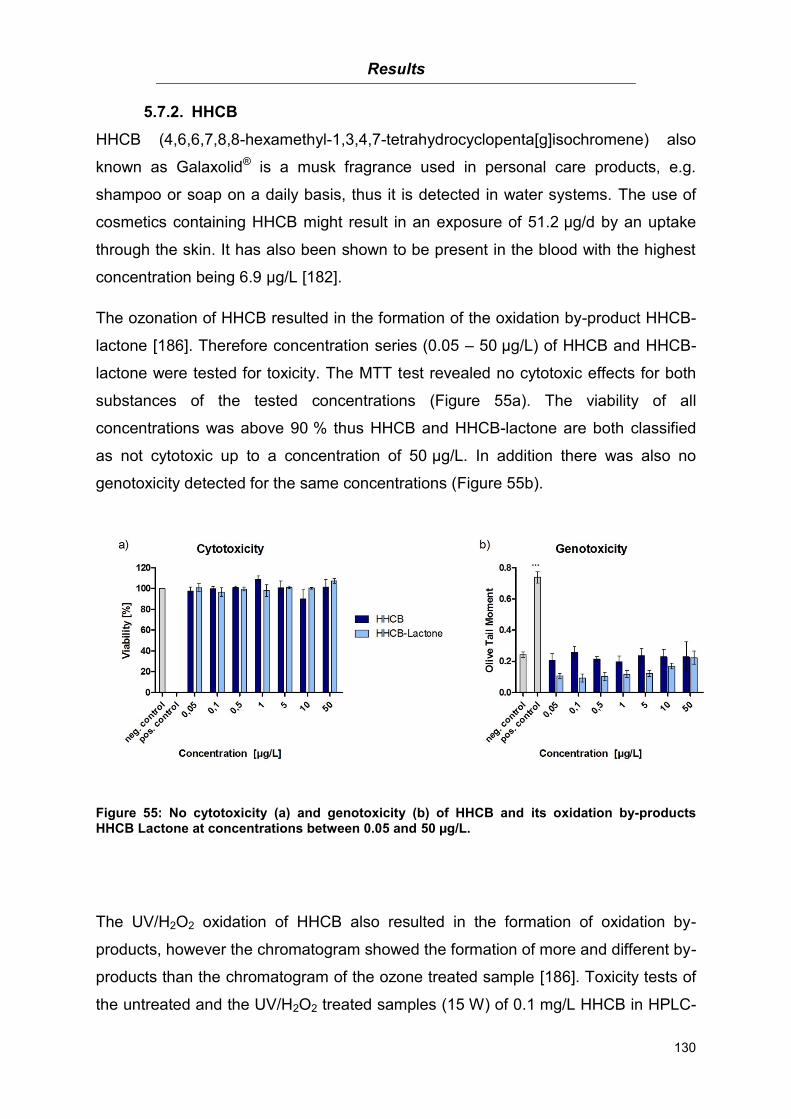
Results
130
5.7.2. HHCB
HHCB (4,6,6,7,8,8-hexamethyl-1,3,4,7-tetrahydrocyclopenta[g]isochromene) also
known as Galaxolid® is a musk fragrance used in personal care products, e.g.
shampoo or soap on a daily basis, thus it is detected in water systems. The use of
cosmetics containing HHCB might result in an exposure of 51.2 µg/d by an uptake
through the skin. It has also been shown to be present in the blood with the highest
concentration being 6.9 µg/L [182].
The ozonation of HHCB resulted in the formation of the oxidation by-product HHCB-
lactone [186]. Therefore concentration series (0.05 – 50 µg/L) of HHCB and HHCB-
lactone were tested for toxicity. The MTT test revealed no cytotoxic effects for both
substances of the tested concentrations (Figure 55a). The viability of all
concentrations was above 90 % thus HHCB and HHCB-lactone are both classified
as not cytotoxic up to a concentration of 50 µg/L. In addition there was also no
genotoxicity detected for the same concentrations (Figure 55b).
Figure 55: No cytotoxicity (a) and genotoxicity (b) of HHCB and its oxidation by-products HHCB Lactone at concentrations between 0.05 and 50 µg/L.
The UV/H2O2 oxidation of HHCB also resulted in the formation of oxidation by-
products, however the chromatogram showed the formation of more and different by-
products than the chromatogram of the ozone treated sample [186]. Toxicity tests of
the untreated and the UV/H2O2 treated samples (15 W) of 0.1 mg/L HHCB in HPLC-
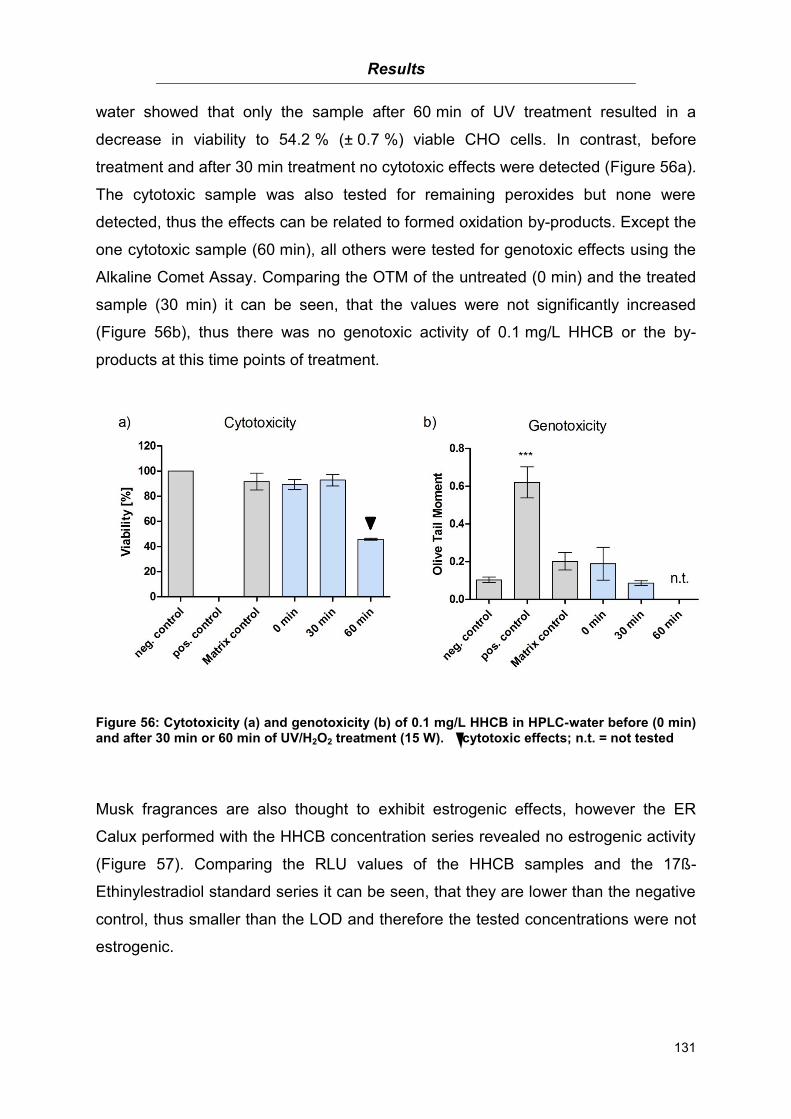
Results
131
water showed that only the sample after 60 min of UV treatment resulted in a
decrease in viability to 54.2 % (± 0.7 %) viable CHO cells. In contrast, before
treatment and after 30 min treatment no cytotoxic effects were detected (Figure 56a).
The cytotoxic sample was also tested for remaining peroxides but none were
detected, thus the effects can be related to formed oxidation by-products. Except the
one cytotoxic sample (60 min), all others were tested for genotoxic effects using the
Alkaline Comet Assay. Comparing the OTM of the untreated (0 min) and the treated
sample (30 min) it can be seen, that the values were not significantly increased
(Figure 56b), thus there was no genotoxic activity of 0.1 mg/L HHCB or the by-
products at this time points of treatment.
Figure 56: Cytotoxicity (a) and genotoxicity (b) of 0.1 mg/L HHCB in HPLC-water before (0 min) and after 30 min or 60 min of UV/H2O2 treatment (15 W). cytotoxic effects; n.t. = not tested
Musk fragrances are also thought to exhibit estrogenic effects, however the ER
Calux performed with the HHCB concentration series revealed no estrogenic activity
(Figure 57). Comparing the RLU values of the HHCB samples and the 17ß-
Ethinylestradiol standard series it can be seen, that they are lower than the negative
control, thus smaller than the LOD and therefore the tested concentrations were not
estrogenic.
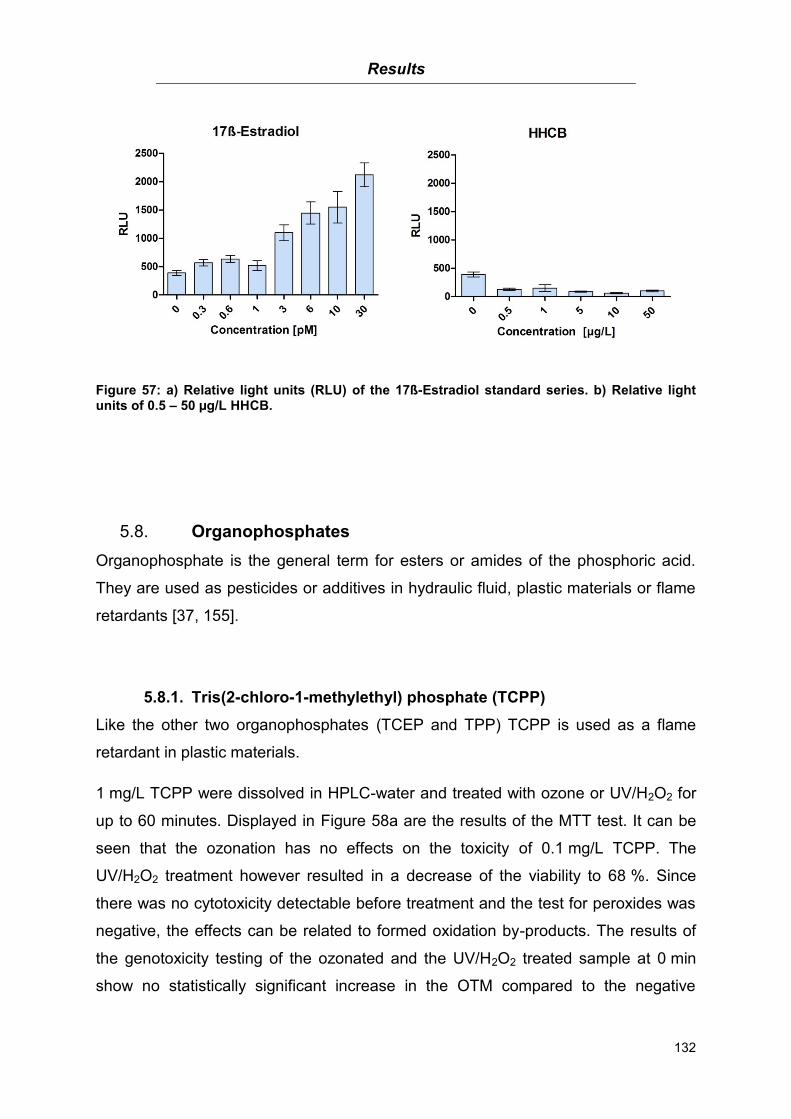
Results
132
Figure 57: a) Relative light units (RLU) of the 17ß-Estradiol standard series. b) Relative light units of 0.5 – 50 µg/L HHCB.
Organophosphates 5.8.
Organophosphate is the general term for esters or amides of the phosphoric acid.
They are used as pesticides or additives in hydraulic fluid, plastic materials or flame
retardants [37, 155].
5.8.1. Tris(2-chloro-1-methylethyl) phosphate (TCPP)
Like the other two organophosphates (TCEP and TPP) TCPP is used as a flame
retardant in plastic materials.
1 mg/L TCPP were dissolved in HPLC-water and treated with ozone or UV/H2O2 for
up to 60 minutes. Displayed in Figure 58a are the results of the MTT test. It can be
seen that the ozonation has no effects on the toxicity of 0.1 mg/L TCPP. The
UV/H2O2 treatment however resulted in a decrease of the viability to 68 %. Since
there was no cytotoxicity detectable before treatment and the test for peroxides was
negative, the effects can be related to formed oxidation by-products. The results of
the genotoxicity testing of the ozonated and the UV/H2O2 treated sample at 0 min
show no statistically significant increase in the OTM compared to the negative
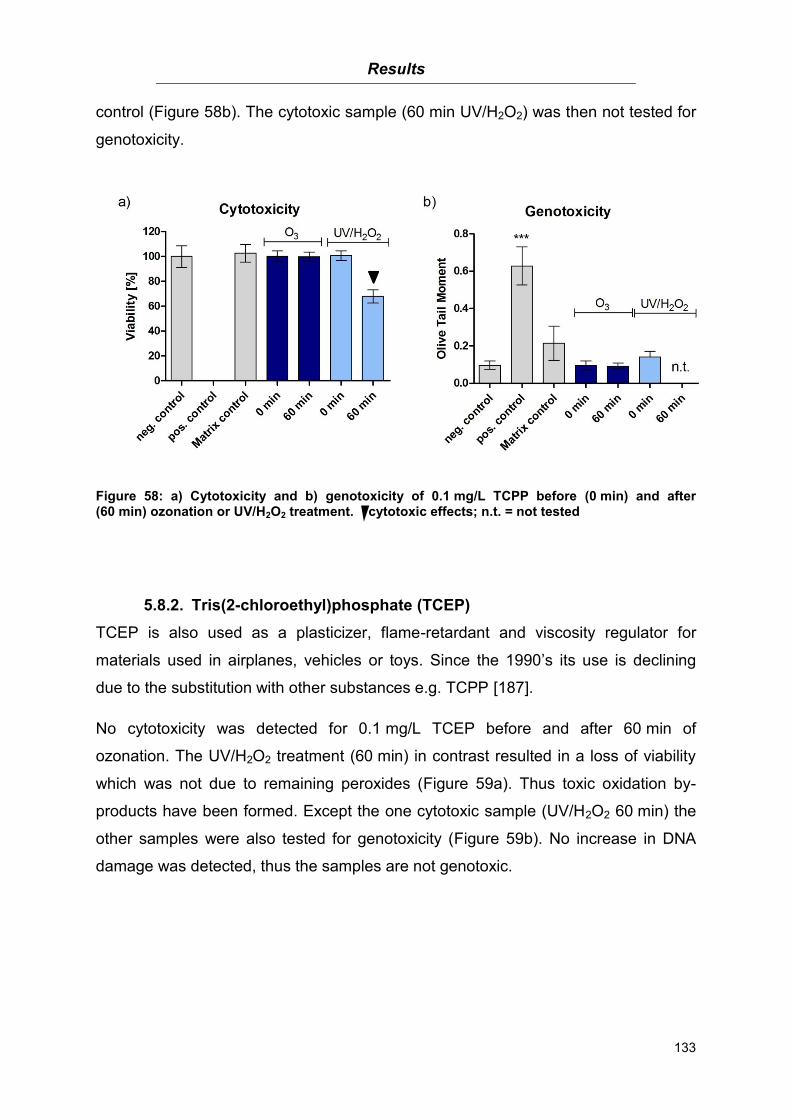
Results
133
control (Figure 58b). The cytotoxic sample (60 min UV/H2O2) was then not tested for
genotoxicity.
Figure 58: a) Cytotoxicity and b) genotoxicity of 0.1 mg/L TCPP before (0 min) and after (60 min) ozonation or UV/H2O2 treatment. cytotoxic effects; n.t. = not tested
5.8.2. Tris(2-chloroethyl)phosphate (TCEP)
TCEP is also used as a plasticizer, flame-retardant and viscosity regulator for
materials used in airplanes, vehicles or toys. Since the 1990’s its use is declining
due to the substitution with other substances e.g. TCPP [187].
No cytotoxicity was detected for 0.1 mg/L TCEP before and after 60 min of
ozonation. The UV/H2O2 treatment (60 min) in contrast resulted in a loss of viability
which was not due to remaining peroxides (Figure 59a). Thus toxic oxidation by-
products have been formed. Except the one cytotoxic sample (UV/H2O2 60 min) the
other samples were also tested for genotoxicity (Figure 59b). No increase in DNA
damage was detected, thus the samples are not genotoxic.
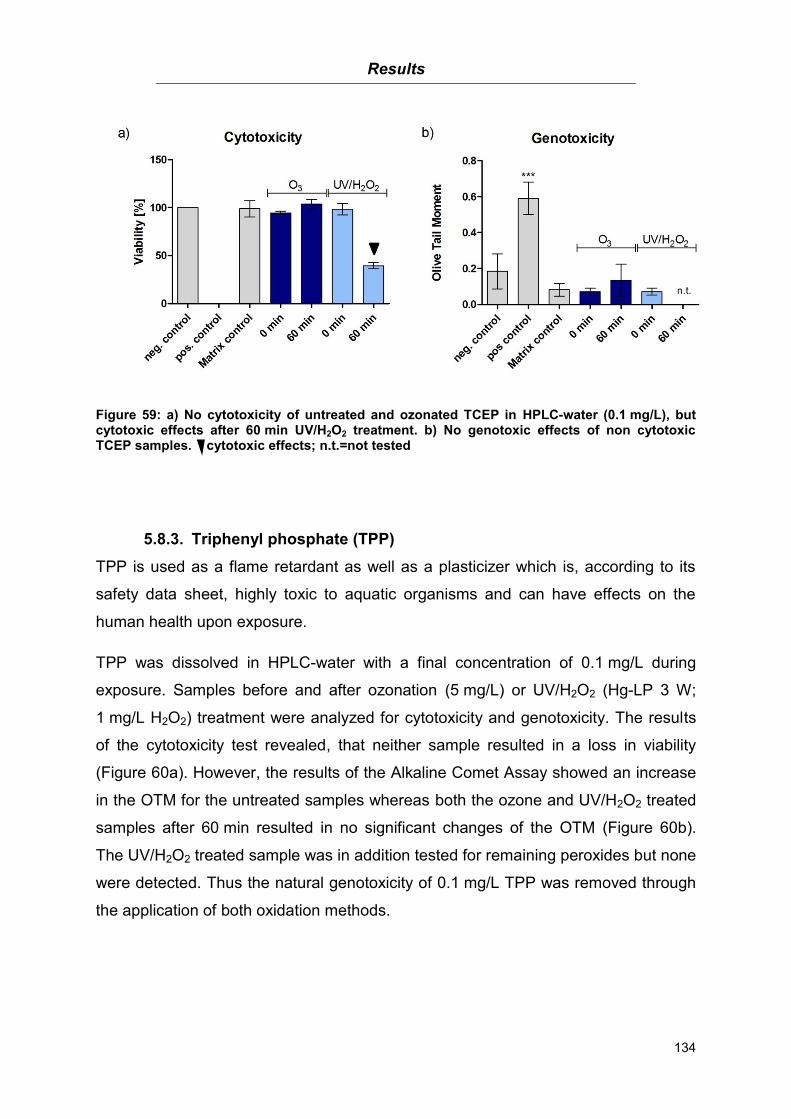
Results
134
Figure 59: a) No cytotoxicity of untreated and ozonated TCEP in HPLC-water (0.1 mg/L), but cytotoxic effects after 60 min UV/H2O2 treatment. b) No genotoxic effects of non cytotoxic TCEP samples. cytotoxic effects; n.t.=not tested
5.8.3. Triphenyl phosphate (TPP)
TPP is used as a flame retardant as well as a plasticizer which is, according to its
safety data sheet, highly toxic to aquatic organisms and can have effects on the
human health upon exposure.
TPP was dissolved in HPLC-water with a final concentration of 0.1 mg/L during
exposure. Samples before and after ozonation (5 mg/L) or UV/H2O2 (Hg-LP 3 W;
1 mg/L H2O2) treatment were analyzed for cytotoxicity and genotoxicity. The results
of the cytotoxicity test revealed, that neither sample resulted in a loss in viability
(Figure 60a). However, the results of the Alkaline Comet Assay showed an increase
in the OTM for the untreated samples whereas both the ozone and UV/H2O2 treated
samples after 60 min resulted in no significant changes of the OTM (Figure 60b).
The UV/H2O2 treated sample was in addition tested for remaining peroxides but none
were detected. Thus the natural genotoxicity of 0.1 mg/L TPP was removed through
the application of both oxidation methods.
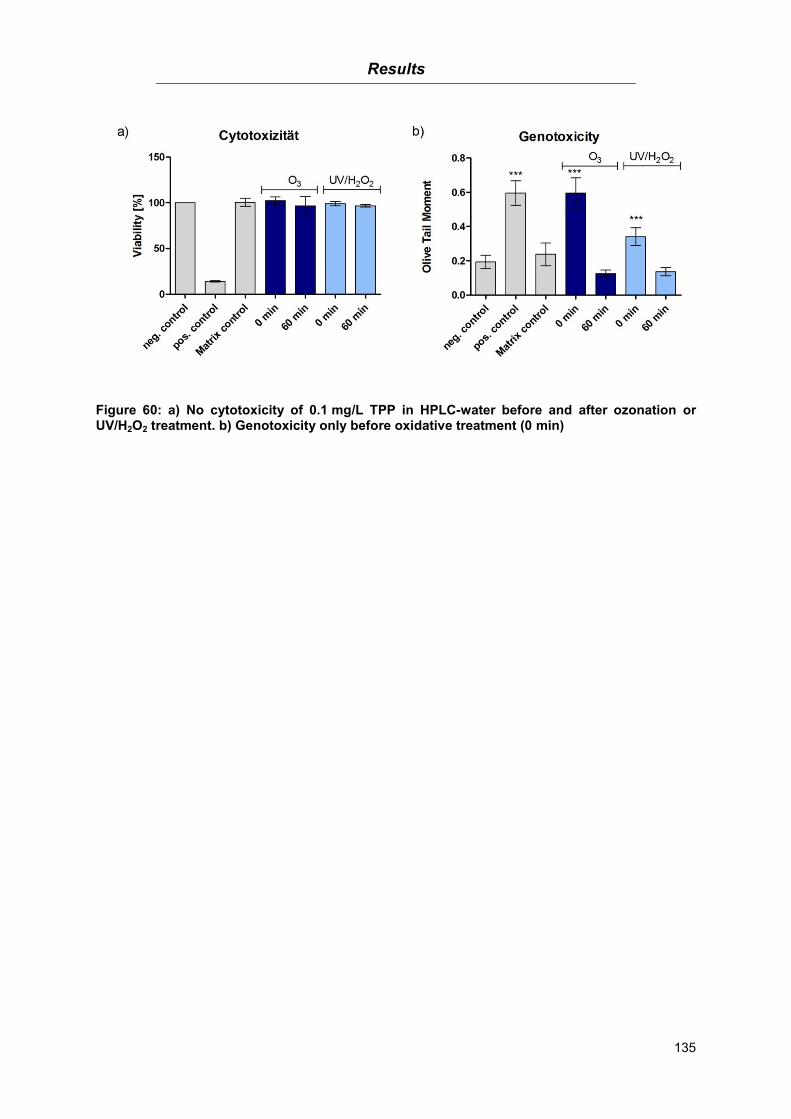
Results
135
Figure 60: a) No cytotoxicity of 0.1 mg/L TPP in HPLC-water before and after ozonation or UV/H2O2 treatment. b) Genotoxicity only before oxidative treatment (0 min)
Discussion
136
6. Discussion
Substances of anthropogenic origin are introduced into the water system by a variety
of pathways. One major source of their introduction into surface waters is the effluent
of waste water treatment plants. For most of these substances only a small part is
removed during the common waste water treatment process. Since a large amount
of those substances is designed to be biologically active they might have an
influence on the ecosystem and even on the human health. Therefore additional
treatment steps are needed in order to remove remaining micropollutants and at the
same time preventing their release into the environment where they might cause
harm. Despite the variety of possible removal methods, advanced oxidation
processes are the most promising techniques due to their low costs, ease of
applicability and efficiency. However one drawback of these processes is the
formation of oxidation by-products through an incomplete degradation. These by-
products might then differ in their toxicological properties. Due to a lack of
information on the toxicity of many micropollutants and their by-products a general
statement on the safe use of Advanced Oxidation Processes is difficult.
The efficiency of the here used AOP methods (Ozonation and UV/H2O2 oxidation)
was evaluated based on the formation of oxidation by-products and their toxicity.
Therefore pure water as well as waste water treatment plant effluent samples were
spiked with pharmaceuticals, musk fragrances, estrogenic substances, biocides or
organophosphates and subjected to oxidation. Samples were taken time
dependently starting before the oxidation. Afterwards their ability to induce cytotoxic
and genotoxic as well as to some part estrogenic and mutagenic effects was
examined.
Discussion
137
Endocrine disruption 6.1.
Although the focus of this work in regard to endocrine disruption was laid on
estrogenicity, other effects like androgenicity, glucocorticoid activity or thyroid
hormone like activity of water samples etc. can not be excluded. Different classes of
chemicals (phthalates, polychlorinated biphenyls, pesticides etc.), either of natural or
synthetic origin, detected in water systems have already been identified to be
endocrine disrupting because of their structural similarity compared to hormones
[188-192]. In 2000 the BKH Consulting Engineers published a list of priority
substances based on existing lists resulting in 564 substances which are suspected
to be endocrine disrupting. Out of this list 146 chemicals were evaluated and 66
were classified as “Category 1” chemicals indicating that there is certain evidence for
endocrine disrupting effects in living organisms. Most of these Category 1 chemicals
were also considered having a high exposure concern [193]. Outcomes of an
exposure to endocrine disruptors, e.g. the feminization of alligators, birds or fish
have been linked to the presence of endocrine disruptors [194-198]. Most of the
endocrine effects detected so far are affecting the estrogenic cycle. It has been
shown that e.g. obesity or certain kinds of cancer besides other health effects are
related to an exposure to estrogens [199-204]. This is supported by the US EPA
stating that endocrine disruption is a mode of action which potentially might lead to
adverse effects e.g. carcinogenic, developmental or reproductive effects. However
they also state, that only a limited number of studies are available showing a direct
correlation between estrogen exposure and adverse effects in humans especially in
the development of cancer [191].
It is now questionable whether humans who are exposed to endocrine disrupting
chemicals in drinking water, food, etc. are susceptible to hormonal disturbances thus
adverse health effects. Even though there is no direct linkage between endocrine
disruptors in the environment and human health impacts it can not be neglected.
Animal data clearly proves a correlation between biological active substances and
endocrine disruption. Due to the high persistence of these substances long-term
studies investigating single compounds as well as complex mixtures are needed for
a risk assessment. Long-term studies covering chronic exposures are also important
in regard to low-dose effects (concentrations below the physiological level) of single
substances and complex substance mixtures because this is the most probable
Discussion
138
scenario of exposure in the environment. The term low-dose effects has been
defined as those biological effects which occur at the range of a typical human
exposure or a dose lower than those which are typically used in the US EPA
standard testing paradigm [205]. Although endocrine disrupting effects are usually
detected at concentrations higher than those found in the environment, knowledge
about a chronic exposure to low concentrations is scarce. In a review by Vandenberg
et al. (2012) it is concluded that results from a high-dose exposure study can not be
used to predict effects of a low-dose exposure [206]. In addition combination effects
such as additive or synergistic effects occurring in complex water matrices through
the presence of a variety of substances with the same mode of action need to be
considered when discussing low-dose effects (see chapter 6.3 on mixture effects).
Low-dose effects also might differ from effects detected at higher concentrations.
Reasons for this might be cytotoxic effects as well as a down-regulation of the
receptors of high concentrations whereas low-doses might result in an increased
receptor acitivity thus an up-regulation of specific genes [206]. Therefore measures
should be taken not only to detect and identify endocrine disrupting micropollutants
in water samples but also to investigate their possible health effects at high and low
doses and finally to develop methods to successfully remove them from the
environment.
Since the effects of hormones occur at very low concentrations it is necessary to use
test systems which are able to detect endocrine disruptors at those low
concentrations. Kase et al. (2009) therefore reviewed available test systems applied
in the aquatic environment for the detection of endocrine disrupting substances. A
huge variety of in vitro test systems is available and examples as well as their mode
of action are displayed in Figure 61. This battery of tests then allows a mode of
action based risk assessment which can also be modified according to certain
needs. They conclude that a combination of in vivo and in vitro methods is needed to
gather information on the different levels, namely the hormone activity and endocrine
disruption as well as reproductive effects [71].
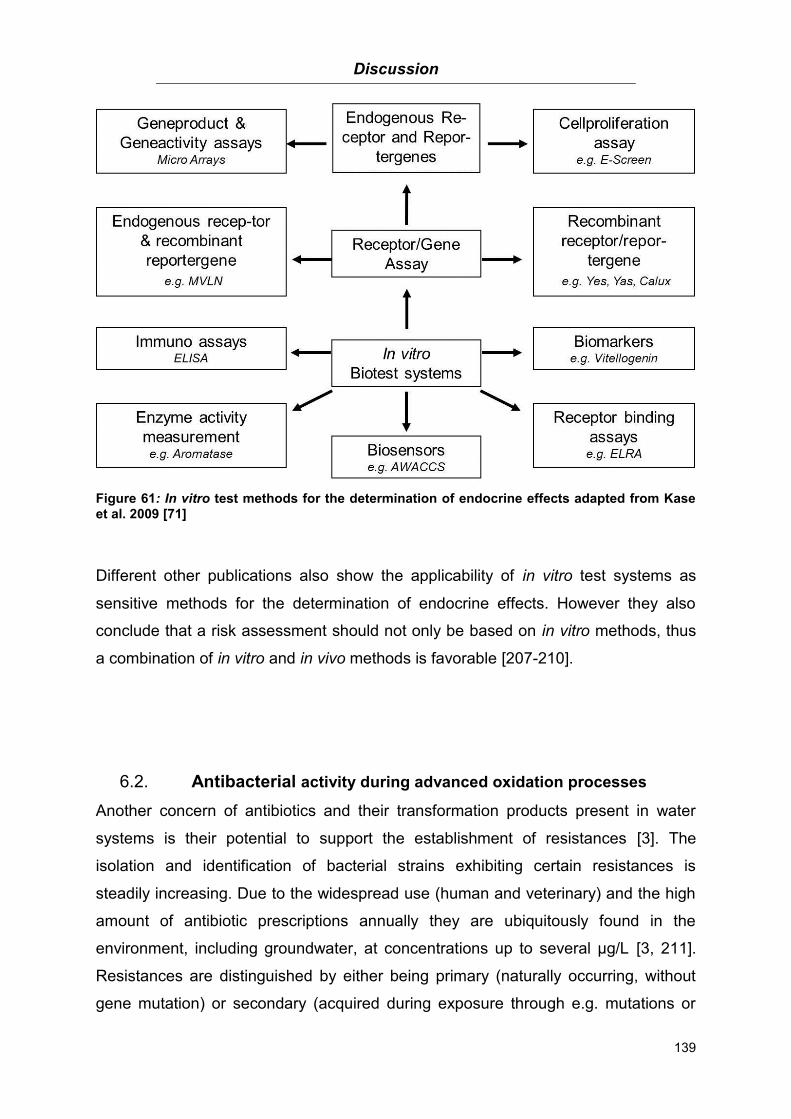
Discussion
139
Figure 61: In vitro test methods for the determination of endocrine effects adapted from Kase et al. 2009 [71]
Different other publications also show the applicability of in vitro test systems as
sensitive methods for the determination of endocrine effects. However they also
conclude that a risk assessment should not only be based on in vitro methods, thus
a combination of in vitro and in vivo methods is favorable [207-210].
Antibacterial activity during advanced oxidation processes 6.2.
Another concern of antibiotics and their transformation products present in water
systems is their potential to support the establishment of resistances [3]. The
isolation and identification of bacterial strains exhibiting certain resistances is
steadily increasing. Due to the widespread use (human and veterinary) and the high
amount of antibiotic prescriptions annually they are ubiquitously found in the
environment, including groundwater, at concentrations up to several µg/L [3, 211].
Resistances are distinguished by either being primary (naturally occurring, without
gene mutation) or secondary (acquired during exposure through e.g. mutations or
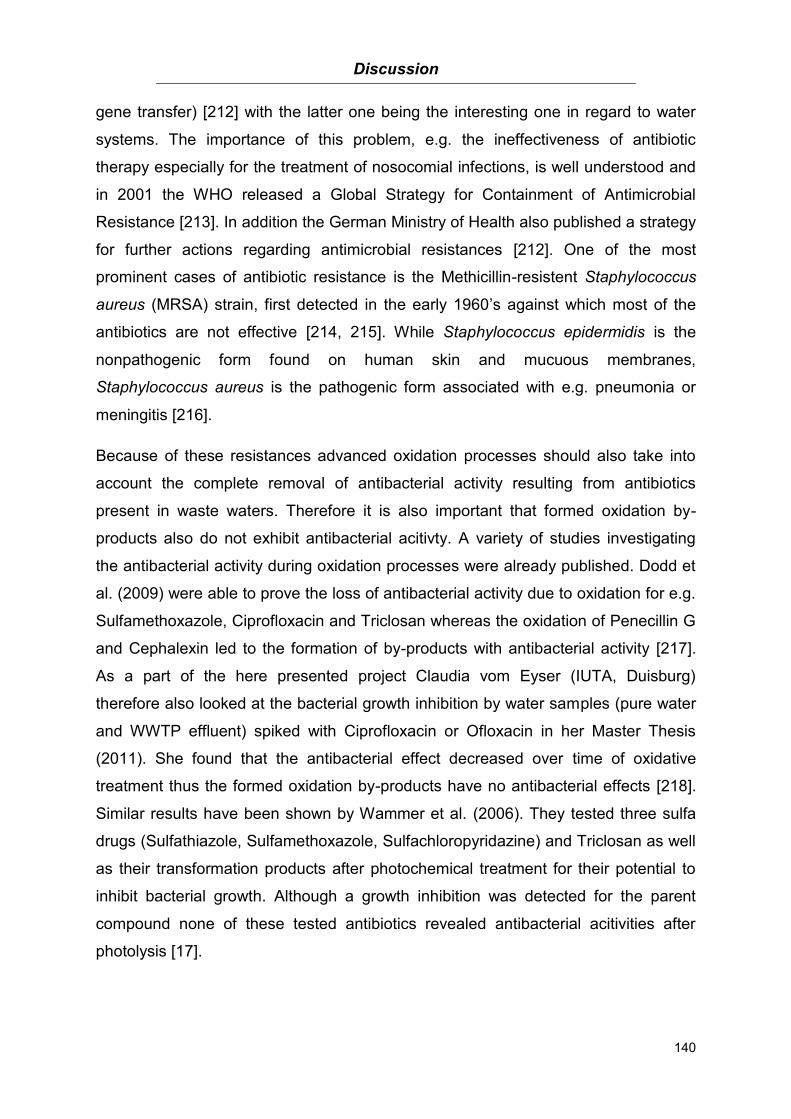
Discussion
140
gene transfer) [212] with the latter one being the interesting one in regard to water
systems. The importance of this problem, e.g. the ineffectiveness of antibiotic
therapy especially for the treatment of nosocomial infections, is well understood and
in 2001 the WHO released a Global Strategy for Containment of Antimicrobial
Resistance [213]. In addition the German Ministry of Health also published a strategy
for further actions regarding antimicrobial resistances [212]. One of the most
prominent cases of antibiotic resistance is the Methicillin-resistent Staphylococcus
aureus (MRSA) strain, first detected in the early 1960’s against which most of the
antibiotics are not effective [214, 215]. While Staphylococcus epidermidis is the
nonpathogenic form found on human skin and mucuous membranes,
Staphylococcus aureus is the pathogenic form associated with e.g. pneumonia or
meningitis [216].
Because of these resistances advanced oxidation processes should also take into
account the complete removal of antibacterial activity resulting from antibiotics
present in waste waters. Therefore it is also important that formed oxidation by-
products also do not exhibit antibacterial acitivty. A variety of studies investigating
the antibacterial activity during oxidation processes were already published. Dodd et
al. (2009) were able to prove the loss of antibacterial activity due to oxidation for e.g.
Sulfamethoxazole, Ciprofloxacin and Triclosan whereas the oxidation of Penecillin G
and Cephalexin led to the formation of by-products with antibacterial activity [217].
As a part of the here presented project Claudia vom Eyser (IUTA, Duisburg)
therefore also looked at the bacterial growth inhibition by water samples (pure water
and WWTP effluent) spiked with Ciprofloxacin or Ofloxacin in her Master Thesis
(2011). She found that the antibacterial effect decreased over time of oxidative
treatment thus the formed oxidation by-products have no antibacterial effects [218].
Similar results have been shown by Wammer et al. (2006). They tested three sulfa
drugs (Sulfathiazole, Sulfamethoxazole, Sulfachloropyridazine) and Triclosan as well
as their transformation products after photochemical treatment for their potential to
inhibit bacterial growth. Although a growth inhibition was detected for the parent
compound none of these tested antibiotics revealed antibacterial acitivities after
photolysis [17].

Discussion
141
Mixture effects 6.3.
Although the here presented results as well as published data demonstrate that
adverse toxicological effects of single substances mostly occur at much higher
concentrations than those usually detected in waste water treatment plant effluents
and surface waters, mixture effects need to be considered. This becomes even more
apparent since not each single micropollutant as well as their metabolites and
transformation products can be determined or investigated regarding its toxicity.
Organisms are usually not solely exposed to single substances but rather to complex
mixtures containing a variety of substances with different toxic effetcs. In addition the
amount of TOC (total organic carbon) does not give any information on the biological
activity especially the toxicity and therefore whole effluent samples should be
analyzed. A variety of studies have been performed proving a good accuracy of
concentration addition models for substances with a similar mode of action [219-
221]. In this context e.g. Chèvre et al. (2006) propose the use of a risk quotient for
the assessment of herbicides with a similar mode of action based on a concentration
addition model rather than using a limit value of 0.1 µg/L for each individual pesticide
as a water qualitiy criteria in Switzerland [222]. In Germany the drinking water
guideline also sets a limit value of 0.1 µg/L for individual biocides and their
metabolites as well as a limit value of 0.5 µg/L for the sum of pesticides [85]. Brian et
al. (2005) investigated the estrogenic effects of Estradiol, Ethinyestradiol,
Nonylphenol, Octylphenol, and Bisphenol A individually for each substance as well
as for mixtures. They found that even a concentration below the effect level of each
single substance will result in effects after mixing with a good correlation to a
concentration addition model [223]. But it has also to be noted that a concentration
addition model can only be applied when the constituents of a mixture as well as
their concentrations are known. In contrast, the effect prediction of mixtures
containing substances from different classes and different modes of action are not
that easily estimated by concentration addition or response addition since
synergistic, antagonistic or additive effects might occur (Table 31) [224-226].
Hernando et al. (2003) were able to show that the toxicity of pesticides increased in
the presence of Methyl-tert-butyl-ether, a fuel oxygenate also commonly found in
water systems [227]. In another study with different pesticides synergistic,
antagonistic as well as additive effects of substance mixtures on different organisms
Discussion
142
were seen. The results also indicated that the mixture effects were not always the
same in different aquatic organisms [228].
However, despite these studies, knowledge about mixture effects is still scarce
especially for water environments and needs to be further investigated for a secure
risk assessment.
Table 31: Possible mixture effects in regard to biological effects
Effect Description
Synergistic Substances acting together resulting in an increased effect, thus an effect higher than would have been predicted by the addition of the potency of the single compounds
Antagonistic Inhibition of a substance by another substance resulting in a decreased effect
Additive All substances of a mixture with a common mode of action resulting in a jointly action of effect addition, by proportionally contributing to the overall effect even at a concentration lower than their observed effect level
To overcome this gap of knowledge on mixture effects, methods like the QSAR
approach (Quantitative Structure-Activity Relationship) or the use of –omics
techniques might be a solution. Modelling the effects of single substances using
QSAR approaches can then be used for an assessment of mixture toxicity.
Discussion
143
Use of toxicological in vitro methods for water quality control 6.4.
Most regulations nowadays still require the use of animals for risk assessments.
However, the vast amount of compounds (existing and new ones) which need to be
analyzed by means of toxicity is far too huge to be tested in vivo. Animal testing
requires a large amount of test animals and in addition it is cost and time consuming.
Another fact to consider is the extrapolation of results gained from in vivo studies
e.g. aquatic or rodent studies to a human health risk assessment. Due to inter- or
intraspecies effects this extrapolation is not always possible and a certain risk
remains. To overcome this gap uncertainty factors also called safety factors have
been used to set values for an acceptable daily intake. These take into account the
intra- as well as the interspecies variation and the quality of the data (e.g. short-term,
long-term, study size) [229, 230]. Although uncertainty factors can be applied, there
still might remain a possible risk for humans.
To fully understand the whole range of possible health effects through emerging
contaminants, an approach at the cellular level for a screening purpose is promising.
Cellular test methods can be applied as high-throughput systems with low costs. An
improvement in this matter are reporter gene assays, e.g. Calux test systems, which
are more sensitive than e.g. yeast cell based assays [71]. The use of the so called
“–omics” techniques might be another step towards the application of cellular based
test systems. These techniques allow an analysis on the whole organism situation
e.g. changes in DNA expression (genomics) or protein profiles (proteomics) [231].
For further or more detailed analyses in vivo methods might then be applied after
limiting the vast amount of adverse effects through in vitro testing.
Although the use of toxicological in vitro methods is not a general parameter in most
guidelines for water quality testing, they have been proven as a relevant
enhancement in this matter [22, 26, 232, 233]. Chemical methods are limited to a
qualitative and quantitative detection of micropollutants, but a statement about their
biological effects (e.g. toxic, bactericidal) is not possible. In this context a combined
approach of chemical and biological analyses, called effect-directed analysis (EDA)
combining chemical analyses, biological test systems and fractionation processes for
a cause-effect relationship is most promising [234, 235] (Figure 62).
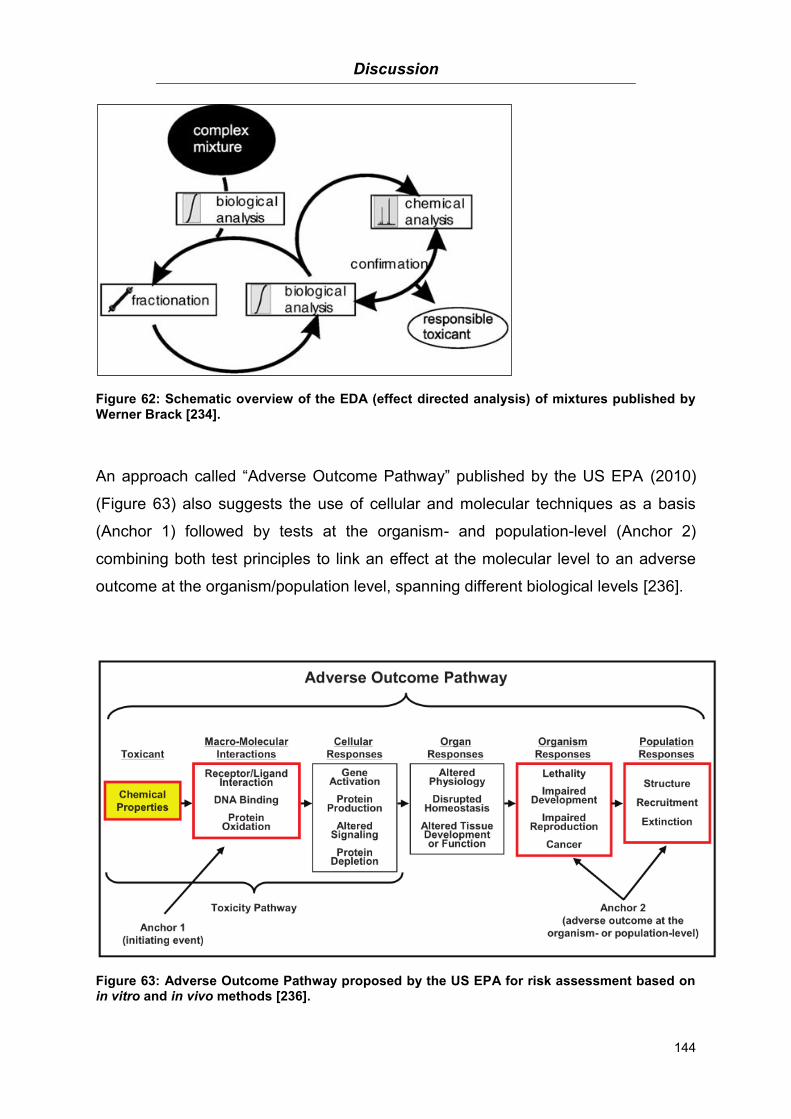
Discussion
144
Figure 62: Schematic overview of the EDA (effect directed analysis) of mixtures published by Werner Brack [234].
An approach called “Adverse Outcome Pathway” published by the US EPA (2010)
(Figure 63) also suggests the use of cellular and molecular techniques as a basis
(Anchor 1) followed by tests at the organism- and population-level (Anchor 2)
combining both test principles to link an effect at the molecular level to an adverse
outcome at the organism/population level, spanning different biological levels [236].
Figure 63: Adverse Outcome Pathway proposed by the US EPA for risk assessment based on in vitro and in vivo methods [236].
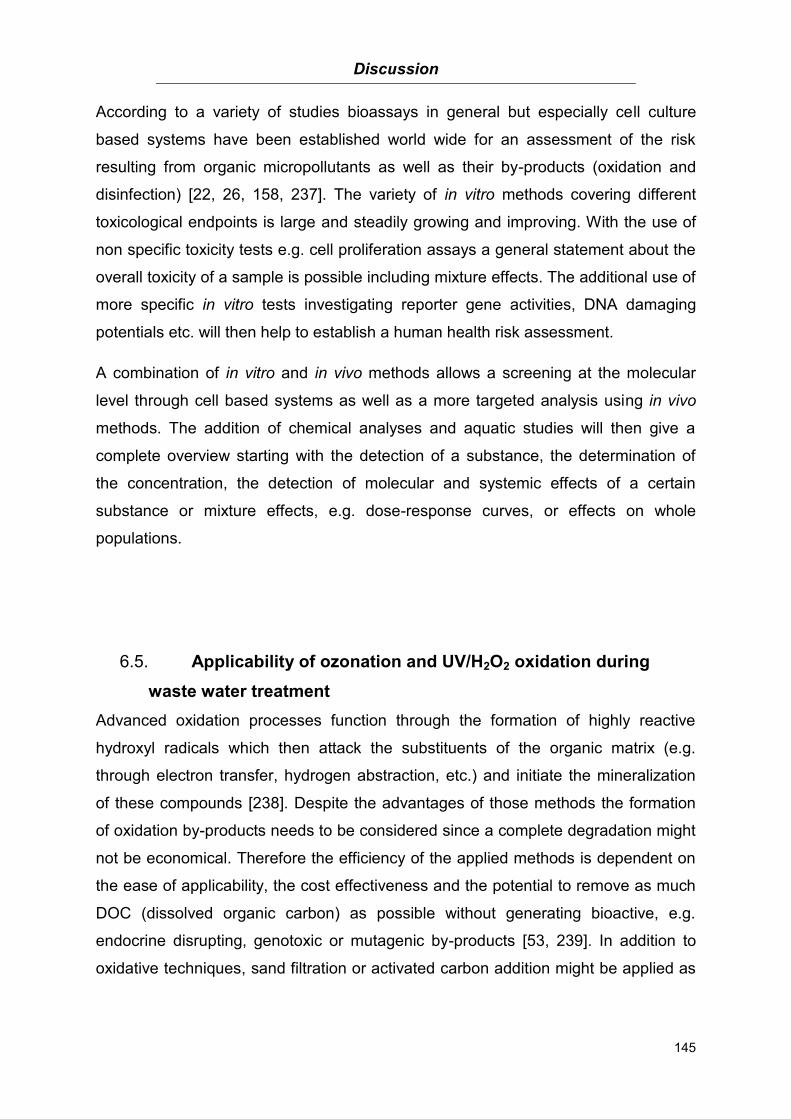
Discussion
145
According to a variety of studies bioassays in general but especially cell culture
based systems have been established world wide for an assessment of the risk
resulting from organic micropollutants as well as their by-products (oxidation and
disinfection) [22, 26, 158, 237]. The variety of in vitro methods covering different
toxicological endpoints is large and steadily growing and improving. With the use of
non specific toxicity tests e.g. cell proliferation assays a general statement about the
overall toxicity of a sample is possible including mixture effects. The additional use of
more specific in vitro tests investigating reporter gene activities, DNA damaging
potentials etc. will then help to establish a human health risk assessment.
A combination of in vitro and in vivo methods allows a screening at the molecular
level through cell based systems as well as a more targeted analysis using in vivo
methods. The addition of chemical analyses and aquatic studies will then give a
complete overview starting with the detection of a substance, the determination of
the concentration, the detection of molecular and systemic effects of a certain
substance or mixture effects, e.g. dose-response curves, or effects on whole
populations.
Applicability of ozonation and UV/H2O2 oxidation during 6.5.
waste water treatment
Advanced oxidation processes function through the formation of highly reactive
hydroxyl radicals which then attack the substituents of the organic matrix (e.g.
through electron transfer, hydrogen abstraction, etc.) and initiate the mineralization
of these compounds [238]. Despite the advantages of those methods the formation
of oxidation by-products needs to be considered since a complete degradation might
not be economical. Therefore the efficiency of the applied methods is dependent on
the ease of applicability, the cost effectiveness and the potential to remove as much
DOC (dissolved organic carbon) as possible without generating bioactive, e.g.
endocrine disrupting, genotoxic or mutagenic by-products [53, 239]. In addition to
oxidative techniques, sand filtration or activated carbon addition might be applied as
Discussion
146
the last treatment step to yield a higher degree of micropollutant and especially
metabolite and oxidation by-product removal [14, 24, 240, 241].
In regard to the efficiency of the two in this study investigated advanced oxidation
processes (UV/H2O2 and Ozonation), the results of the toxicological testing
presented here demonstrate that these methods are applicable for waste water
treatment plant effluent matrices. Neither cytotoxic nor genotoxic effects were
detected before and after the oxidative treatment of the two ß-blocker Atenolol and
Metoprolol, the antibiotics Ciprofloxacin, Ofloxacin and Sulfamethoxazole as well as
the musk fragrance AHTN and the biocide Irgarol 1051 at the tested concentrations.
In addition Ciprofloxacin was also found not to be mutagenic in the Ames test using
the Salmonella typhimurium strains TA98 and TA100.
The results also indicate that their oxidation by-products, formed as a result of an
incomplete degradation, are also not toxic and the UV/H2O2 treatment as well as the
ozonation are sufficient methods for the successful removal of these micropollutants
from the effluents of waste water treatment plants using the above mentioned
settings. Although other studies showed toxic effects of these substances the
concentrations used were to some extent much higher than the concentrations used
in this study and the concentrations detected in water bodies.
The oxidation of HHCB, Ciprofloxacin, and Bisphenol A clearly showed that the
structure of the formed oxidation by-products as well as their toxicity might be
dependent on the used method as well as the water matrix which is supported by
other published studies [16, 20, 66, 242].
Overall these results clearly demonstrate that the treatment duration, the used
amount of oxidant as well as the oxidation method are of great importance in regard
to a complete removal of the substances and the loss of biological (antibacterial,
toxic, endocrine etc.) activity. It has also been shown, that the here used in vitro
methods are applicable for the testing of water samples which is supported by other
previously published studies, proving the usefulness and applicability of a variety of
in vitro test systems [14, 22, 26, 232, 243].
These results are in accordance with other published studies, proving the
applicability of oxidative methods for water purification. It has been long known that

Discussion
147
oxidative methods are useful in the removal of organic micropollutants. However, it is
also known that an incomplete oxidation might result in the formation of oxidation by-
products with different toxicological profiles and therefore should be prevented and
measures be taken [241, 244-246].
Concentration of water samples 6.6.
The steady improvement of chemical analytical methods is one reason for the
increase in the amount of detected organic micropollutants over the last years. The
concentration of water samples and high resolution analytical tools allow the
detection of substances as low as ng/L concentrations. In addition to the benefit of a
lower detection limit disturbing substances e.g. phosphate, nitrate or ammonia are
also removed during concentration. A disadvantage of the concentration step before
a biological test might be the loss of substances. Therefore the extraction method
should take into account a yield of as much substance as possible and at the same
time an exclusion of as many interfering substances as possible. Desbrow et al.
(1998) were able to show that the concentration of an effluent sample using a C18
column resulted in a loss of estrogenic activity of 80 % depending on the elution
method [247]. Erger et al. (2012) investigated the influence of water residuals on the
SPE performance and subsequent chemical analysis and found far-reaching
influences on the performance of the GC-MS analysis [248]. Thus extraction
methods should be thoroughly evaluated (e.g. using an internal control) to e.g.
prevent the loss of substances.
Another advantage of extraction methods is that they can also be used to improve
the sensitivity of biological test systems as well as analytical tools and to identify
substances with a low concentration in water samples. This is especially important in
the case of bioactive substances, e.g. those mimicking the hormonal activity,
because they are usually active at very low concentrations. Since environmental
samples contain a complex matrix extraction methods should also be capable of
extracting several pollutants at the same time.
Discussion
148
A further approach in regard to the monitoring and detection efficiencies is the
method of passive sampling. The principle behind this method, independent of the
used system, is the free analyte flow from the tested medium (e.g. waste water
treatment plant effluent) to the sampler material which due to different chemical
gradients is a result of varying e.g. concentrations or pressures [249, 250]. An
advantage of passive sampling is the identification of the average concentration of
the analytes over a certain period of time, called time-weighted analysis [250]. A few
studies as well as reviews already showed the use of passive samplers in
environmental analyses, especially with water systems. They are for example used
during monitoring processes of micropollutants as a screening tool [249, 251]. Their
use in research over the past years is increasing and has been shown as a good
alternative to active sampling [252-255]. Since each method has its advantages and
its disadvantages there is no single method for all applications. Filtration steps
before an SPE might result in the loss of substance whereas liquid-liquid extractions
require organic solvents which are toxic and the whole procedure is time consuming.
Thus depending on the purpose of the study each method should be evaluated and
optimised before analyses.
ß-blocker 6.7.
Due to their longterm use and high amount of ß-blocker intake they are commonly
detected in water systems and might pose a threat to the environment.
Concentrations of Metoprolol in waste water treatment plant effluents range up to
almost 4 µg/L [256]. Therefore two of the most prescribed ß-blocker, namely
Metoprolol and Atenolol, were investigated.
In the here presented study no cyto- or genotoxicity was detected for Atenolol and
Metoprolol (chapter 5.3) before and after ozonation or UV/H2O2 oxidation. There
were also no differences observed between pure water and waste water treatment
plant effluent spiked with either of the ß-blocker. These results reflect what has
already been published by others. Using Ceriodaphnia dubia (C. dubia) an EC50 of
33.4 mg/L for Atenolol and 45.3 mg/L for Metoprolol was determined by Fraysse et
Discussion
149
al. (2005) [257]. An acute toxicity study using the same organism also revealed that
the EC50 values range from 1.4 to 163.4 mg/L after two days of exposure depending
on the tested ß-blocker (Acebutolol, Atenolol, Metoprolol, Nadolol, Oxprenolol,
Propranolol) [257]. Cheong et al. (2008) used the MTT test to detect cytotoxic effects
of ß-blockers, including Atenolol and Metoprolol, on human corneal epithelial and
retinal cells. They also found great differences in IC50 values when comparing eight
ß-blockers. Atenolol resulted in an IC50 of 6.13 g/L and the IC50 for Metoprolol was
2.74 g/L [258].
Another study showed that no genotoxic effects occurred after a chronic exposure to
50 mg Atenolol per day [259]. In addition, tests with different cell types
(haematocytes, gill and digestive gland primary cells) of the zebra mussel did not
reveal notable toxic effects [260]. Ioannou et al. (2011) were able to show that the
solar/TiO2 degradation of 10 mg/L Atenolol first resulted in an increased mortality of
D. magna which then decreased over time thus they concluded that the formation of
toxic oxidation by-products led to these effects [261].
Huggett et al. (2002) also tested the toxicity of Metoprolol and found 48 h LC50
values of 63.9 mg/L in D. magna and 8.8 mg/L in C. dubia whereas the LC50 values
were above 100 mg/L when using H. azteca and Medaka as test organisms [262]
and the EC50 in Danio rerio was determined as 31 mg/L [263]. Tests with Daphnia
magna resulted in an EC50 value of 200 mg/L [264] or an LOEC of 12 mg/L after a 9-
day exposure [265]. Thus great species differences can be seen
Compared to the concentrations used in this study (Atenolol = 0.2 mg/L;
Metoprolol = 0.1 and 1.4 mg/L) toxic effects are detected at much higher
concentrations. The amounts of ß-blockers commonly found in waste water
treatment plant effluents and surface waters are usually in the µg/L range or even
lower [2, 8, 266]. Benner et al. (2009) were able to demonstrate the formation of
oxidation by-products as well as reaction pathways of Metoprolol after ozonation
[267]. A few of these ONP have been confirmed by our own studies but new ones
were also found [151]. However, although by-products were found after oxidative
treatment they did not have an effect on CHO cells in the here used test systems. As
has been shown by own studies as well as published data by other groups toxic
effects occur at concentrations much higher than commonly found in water bodies.
Discussion
150
Estrogenic substances 6.8.
6.8.1. Ethinylestradiol
As a main constituent of contraceptive pills Ethinylestradiol is excreted and found in
waste water treatment plant effluents as well as other water systems at ng/L
concentrations [4, 268-270] and might therefore have an influence on e.g. the
reproduction of aquatic organisms. Therefore these substances should be
completely eliminated during waste water treatment before the effluent reaches
surface waters.
Own results show that there was no cytotoxicity detected for Ethinylestradiol but
estrogenic effects have been detected before and throughout the entire duration of
oxidative treatment, however slightly diminished because only a minor decrease was
seen over time. A variety of studies have been published concerning the toxicity,
including the estrogenicity of Ethinylestradiol. No mutagenic effects were detected
using the chromosomal aberration test in human lymphocytes and mouse bone
marrow cells [271] and the Ames test [272]. However, Siddique et al. (2005) were
able to show genotoxic effects of 5 µM (~ 1.5 mg) Ethinylestradiol. These effects, in
fact, were only detected after metabolic activation and the addition of NADP [273].
Estrogenic effects were, amongst others, detected by Dussault et al. (2008) showing
an influence on the reproduction starting at 0.36 mg/L Ethinylestradiol [269]. Medaka
exposed to 0.06 mg/L Ethinylestradiol revealed effects on their fertility [274] and
Salierno et al. (2009) detected behavioral changes as well as changes of the
hormonal system and the sex characteristics in fish exposed to 0.04 mg/L
Ethinylestradiol [275]. Thus comparing the above results to the concentration used in
this study, a possible impact on the environment might occur after the release of
Ethinylestradiol into surface waters. This is also supported by a study published by
Caldwell at al. (2008). They reviewed the available literature on the aquatic toxicity of
17α-Ethinylestradiol to derive a PNEC (predicted no effect concentration) value and
concluded that a PNEC of 0.35 ng/L could be recommended as a safe measure for
water systems, even for chronic exposures. They also concluded, that even a
concentration of 0.5 ng/L might have no effects on the ecosystem [276]. However
this value does not take into account e.g. additive effects resulting from the complex
matrix of a water sample as well as low dose and long term effects (see chapter 6.1).

Discussion
151
Comparing this PNEC value to the results from this study it can be seen, that the
here used ozonation and UV oxidation did not lead to a decrease of Ethinyestradiol
below 0.35 ng/L thus in this case both treatment methods were not sufficient in
removing the biological activity.
6.8.2. Bisphenol A
As a basic material during polycarbonate synthesis, Bisphenol A is found in many
products of the everyday life e.g. reusable water bottles and other food containers.
Trace amounts of it might then leach into foods and drinks. Because of its health
impacts the EU enacted a directive (2011/8/EU) which banned Bisphenol A from the
production of infant feeding bottles made of plastics starting in March 2011 [277].
Own toxicity tests with Bisphenol A performed in the here presented study indicated
that toxic effects are linked to the used water matrix (chapter 5.4.2). The oxidation of
waste water treatment plant effluent containing Bisphenol A did not result in the
formation of toxic oxidation by-products. In addition, no effects were detected before
and after ozonation of pure water containing 1.4 mg/L Bisphenol A whereas cytotoxic
effects were seen after the UV oxidation of 0.1 mg/L Bisphenol A in pure water.
These effects can be related to formed oxidation by-products since no remaining
peroxides were detected in the sample. Comparing these results to published data it
can be seen that differences in toxic effects between pure water and waste water
treatment plant effluent due to different reaction pathways and competing reactions
have already been described before [16]. When comparing distilled and surface
water a better degradation of Clofibric acid and Ibuprofen was observed in distilled
water [20]. Trovo et al. (2009) were able to demonstrate that the Photo-Fenton
treatment of distilled water and seawater containing Sulfamethoxazole only resulted
in an increase in toxicity when oxidatively treating seawater [66]. Differences in
regard to toxic effects of substances were also seen when dissolved in seawater or
distilled water, thus again the water matrix (salinity, amount of other sustances) had
an effect on the structure of the formed by-products and thus the toxicity [242].
Apart from the cytotoxicity and genotoxicity testing the estrogenic activity of
Bisphenol A before and after UV/H2O2 oxidation was also examined as a part of the
Discussion
152
here presented study. The results displayed in chapter 5.4.2 show that the oxidation
was sufficient in removing the estrogenic activity of 0.1 mg/L Bisphenol A from
HPLC-water. While there were estrogenic effects observable before UV/H2O2
treatment, there were no more estrogenic effects detected after 10 and 60 min of
treatment.
Toxic or in general biological effects of Bisphenol A described in the literature are
mainly based on its estrogenic effects [278]. As already shown for other substances,
EC50 values vary (10 – 253 µg/L) between organisms, test methods and the duration
of exposure used [279, 280]. Golub et al. (2010) reviewed the available literature in
regard to toxic effects of Bisphenol A and found that it mainly affects the offspring
viability, the sex-differentiation, the immune hyperresponsiveness and the gender-
differentiated morphology, with the specific endpoint being dose related [281]. In
addition to the already published data, Bisphenol A is one of 90 substances listed in
the Community Rolling Action Plan (CoRAP) released by the ECHA in February
2012. The CoRAP includes substances which are suspected to have a risk on
human health and therefore need to be further evaluated within the next three years.
Bisphenol A was added to this list because of its potential endocrine disruptive
activity as well as its widespread use [282, 283].
The results for Ethinylestradiol and Bisphenol A from our study demonstrate that
there are differences in their degradation according to the detection of estrogenic
effects. UV/H2O2 treatment of Bisphenol A resulted in a complete removal of
estrogenic effects. In contrast, neither the UV/H2O2 treatment for up to 60 min, nor
the use of up to 10 mg/L ozone resulted in a complete removal of the estrogenic
activity of Ethinylestradiol after 60 min of treatment. Schrank et al. (2009) proved that
the removal efficiency of estrogenic effects is strongly related to treatment
parameters, especially the pH. Low pH values resulted in an increase in
estrogenicity while a high pH during treatment resulted in a complete removal of
estrogenic effects. This might be due to the fact that a decomposition of ozone takes
place at higher pH values leading to the formation of radicals [284]. Schrank et al.
(2009) also showed that despite a decrease in acute toxicity towards V. fisheri and
D. magna, estrogenic effects occur after ozonation even though the untreated
sample did not exhibit estrogenic effects [244]. A reason for this might be the
Discussion
153
elimination of substances which are structurally similar to estrogens and have a
higher binding affinity thus blocking the estrogen receptor and preventing estrogenic
substances from binding to it. Once these antagonistic substances are removed from
the sample through ozonation estrogenic substances are then able to bind to the
receptor and initiate DNA transcription. Another fact to consider in regard to
estrogenicity and endocrine disruption in general is the exposure to low doses over
long periods of time (see chapter 6.1 on low-dose effects).
Antibiotics 6.9.
Antibiotics are pharmaceuticals ubiquitously used for the treatment of a great variety
of infections. Depending on their mode of action and point of attack they are
classified into different groups. Antibiotics are biologically active and might therefore
pose a threat to the environment. Concentrations commonly detected in waste water
treatment plant effluents are in the µg/L range. In this study one antibiotic from the
group of sulfonamides (Sulfamethoxazole) and two fluoroquinolones (Ciprofloxacin
and Ofloxacin) as well as the bactericide Triclosan have been investigated.
6.9.1. Sulfamethoxazole
Sulfamethoxazole belongs to the group of sulfonamide antibiotics which were
originally used as bactericides. Nowadays some diuretics are also based on the
sulfonamide group. The widespread use of sulfonamides has led to their detection in
water bodies with concentrations up to 2 µg/L [285]. Therefore techniques for a
complete removal of these substances are needed. Sulfamethoxazole was chosen
as a representative of this group of antibiotics to investigate the effects of oxidative
treatment on its toxic properties.
The above presented results for Sulfamethoxazole (5.5.1) indicate that neither the
ozonation nor the UV/H2O2 oxidation resulted in toxic effects. Although the formation
of oxidation by-products has been described [151, 286-288] none of the treated
samples had an effect. This is in agreement with the results published by Yargeau et
al. (2008) who tested a mixture of Sulfamethoxazole degradation products on human
Discussion
154
hepatocellular carcinoma cells (HepG2) and found no toxic effects on cell
morphology or metabolism [288]. Another study showed that using TiO2, the
photocatalysis of Sulfamtheoxazole also leads to the formation of by-products which
show a lesser toxicity on the green alga Chlorella vulgaris than the parent compound
[289]. In contrast Dirany et al. (2011) detected toxic effects of intermediates formed
during the electro-Fenton treatment of Sulfamtheoxazol in the V. fischeri
luminescence test and thus an increase in toxicity compared to the untreated
solution [245]. Toxic effects were also reported by del Mar Gomez-Ramos et al.
(2011) after the ozonation of Sulfamethoxazole using Daphnia magna and
Pseudokirchneriella subcapitata as test organisms proving the formation of toxic
oxidation by-products [290]. Dantas et al. (2008) used the V. fischeri luminescence
test and also showed an increase in toxicity within the first 30 minutes of ozonation
followed by an increase over the next 30 minutes of treatment, thus a degradation
dependent toxicity was observed [291]. Reported EC50 values range from 1.57 mg/L
to 210 mg/L depending on the organism used for testing [17, 232, 289, 292].
Differences in toxicity can be due to the use of much higher initial conentrations of
Sulfamethoxazole before treatment than used in this study. All these results indicate
that different oxidation by-products might be formed depending on the oxidation
method used. Additionally a great variance in organism susceptibility might be the
reason for these differing effects.
6.9.2. Fluoroquinolone antibiotics
Fluoroquinolone antibiotics are commonly used as broad spectrum-antibiotcs in
human as well as veterinary medicine. In human medicine they are an important part
during the treatment of nosocomial infections. In addition to their widespread use a
general misuse of antibiotics has led not only to the development of multi-resistant
bacterial strains but also to their detection in waters of up to 124 µg/L [293].
Fluoroquinolones are of great concern due to their widespread and common use.
Two antibiotics of this group (Ciprofloxacin and Ofloxacin) were therefore chosen for
comparative analyses regarding their toxicity before and after oxidative treatment.
Discussion
155
The results of Ciprofloxacin gained in this study (chapter 5.5.2) demonstrate that
again the toxicity after oxidation is dependent on the water matrix (e.g. pure water,
waste water). While there were no cytotoxic or genotoxic effects after the treatment
of WWTP effluent containing Ciprofloxacin, weak cytotoxic effects have been
detected after the treatment of HPLC water. Cytotoxic effects of Ciprofloxacin were
shown by Gürbay et al. (2005) with Ciprofloxacin concentrations > 50 mg/L in HeLa
cells [294]. The V. fischeri test performed by Hernando et al. (2007) revealed no
toxic effects and the EC50 value (> 5.9 mg/L) was above the water solubility [242]. A
study with Giardia lambia however showed toxic effects of Ciprofloxacin looking at a
variety of endpoints [295].
Another endpoint often investigated is the mutagenic activity of Ciprofloxacin. The
results presented above (chapter 5.5.2), show that Ciprofloxacin itself as well as the
samples after UV/H2O2 treatment are not mutagenic in the Ames test using the S.
typhimurium strains TA98 and TA100. This is in contrast to published data. Clerch et
al. (1996) tested the effects of Ciprofloxacin on a variety of S. typhimurium strains
and found it to be mutagenic [296]. Hartmann et al. (1998) tested hospital waste
waters using the umuC test and identified Ciprofloxacin as a main source for toxic
effects in this test [293].
Like Ciprofloxacin, Ofloxacin is a fluoroquinolone antibiotic. The results of the tests
with Ofloxacin (chapter 5.5.3) are similar to those with Ciprofloxacin. No initial toxicity
was detected and the tests after ozonation or UV/H2O2 treatment did also show no
toxic effects in the here used test systems. A literature research by Ferrari et al.
(2004) revealed EC50 values of acute toxicity tests between 0.01 mg/L and even
more than 90 mg/L of Ofloxacin depending on the organism and exposure time used
(bacterium, protozoan, algae, crustacean, fish) [297]. Since fluoroquinolones are
also commonly used in medical treatment by eye care professionals e.g. for the
treatment of bacterial keratitis Bezwada et al. (2008) tested their cytotoxic effects on
human corneal keratocytes and endothelial cells. While Ciprofloxacin was cytotoxic
at all tested concentrations (10 µg/L – 1 g/L), Ofloxacin only showed statistically
significant effects at the highest tested concentration after 15 min of exposure,
however an exposure time dependent toxicity (decrease in concentration resulting in
effects) was detected [298]. A similar study was performed by Tsai et al. (2010).
Discussion
156
They also tested the cytotoxic effects of fluoroquinolone antibiotics on human
corneal epithelial cells. Toxic effects were also shown to be exposure time
dependent, however Ciprofloxacin had stronger cytotoxic effects in all three tests
(MTS (3-(4,5-dimethylthiazol-2-yl)-5-(3-carboxymethoxyphenyl)-2-(4-sulfophenyl)-
2H-tetrazolium) assay, TEER (Trans Epithelial Electric Resistance) test, cell
morphology) than Ofloxacin [299]. In addition the cytotoxicity of Ofloxacin against
rabbit corneal epithelial cells was tested by Scuderi et al. (2003). Both test systems,
the MTT and the Neutral Red assay, resulted in a dose (1.5 – 6 g/L) and time
dependent (8 – 72 h) decrease in cell viability. However the lowest dose (1.5 g/L)
already resulted in a statistically significant loss of viability after the shortest
exposure time (8 h) [300]. The phototoxic effects of Oflocaxin on HL60 and K 562
cells have been studied by Trisciuoglio et al. (2002) since photosensitizing effects on
the skin are a well known side effect during drug therapy. They report
photosensitizing effects only in Ofloxacin treated cells (0.05 mM) irradiated with a
wavelength of 330 nm [301]. Genotoxic effects of fluoroquinolones were investigated
by Itoh et al. (2006) using human lymphoma cells (WTK-1) in the Alkaline Comet
Assay. A maximum of 1 g/L of Ofloxacin did not induce DNA damage after up to 20 h
of exposure. In contrast the same test with Ciprofloxacin resulted in significant
effects which are again exposure time and concentration dependent. The lowest
concentration resulting in genotoxic effects was 250 mg/L after 20 hours of
exposure. Besides these two, they also tested six other quinolone antibiotics
(Naladixic acid, Pipemidic acid, Oxolinic acid, Piromidic acid, Enoxacin and
Norfloxacin), however only Norfloxacin also showed an increase in DNA damage
after exposure [302]. This study indicated that substances from the same class of
antibiotics do not necessarily result in the same cell damaging effects. Since these
effects were observed in vitro, McQueen et al. (1991) performed a comparative study
looking at in vitro and in vivo genotoxic effects of quinolone antibiotics in rat
hepatocytes. Genotoxic effects (unscheduled DNA synthesis (UDS)) were only
detected in vitro possibly due to a missing metabolism in isolated hepatocytes.
However except Naladixic acid, all tested quninolone antibiotics induced UDS,
including Ciprofloxacin and Ofloxacin with an effective concentration of 400 µg/mL
[303].
Discussion
157
6.9.3. Triclosan and 2.4-Dichlorophenol
Triclosan is a bactericide and a constituent of disinfection products, preservatives,
and everyday products e.g. toothpaste or sports clothing. Although it is found in
many different products it raises concern. As well as Bisphenol A, Triclosan has also
been added to the CoRAP list because of its persistent, bioaccumulative, and toxic
properties [282, 304]. Because of this reason it was selected to be investigated in
this study for a better understanding of its behavior during oxidative treatment and
the resulting toxicity since it was found in influents of waste water treatment plants
with the highest detected concentrations around 80 µg/L [305].
Triclosan has been described as toxic towards a variety of species. The adverse
effects of Triclosan include cytotoxic, genotoxic and endocrine properties. These
effects have been shown by various groups. Jirasripongpun et al. (2008) tested
Triclosan for its cytotoxic and genotoxic effects towards three animal cell lines (BHK-
21, Vero and KB cells). Reported IC50 values range from 9.8 – 75.28 mg/L
depending on the cell line indicating a higher susceptibility to Triclosan of the primate
cell lines (Vero and KB) than the rodent cell line (BHK-21). In terms of genotoxicity
they report initial effects in the Comet Assay after a three day exposure to 6.66 mg/L
which increased after five days of exposure [306]. Genotoxic effects of Triclosan
were also described by Binelli et al. (2009) using the in vitro Alkaline Comet Assay in
zebra mussel hemocytes after an exposure time of 60 minutes. Significant increases
in DNA damage were already detected at the lowest tested concentration
(28.95 µg/L) [307] which is comparable to the concentrations (0-100 µg/L) used here
in this study (chapter 5.5.4), with the first significant effect detected at 1 µg/L after
24 h of exposure. Another Comet Assay was performed by Ciniglia et al. (2005)
describing a significant increase in tail moment, thus DNA damage, after an
exposure of Closterium ehrengergii to 0.25 mg/L Triclosan. Cytotoxic effects were
detected at 0.187 mg/L [308]. Zuckerbraun et al. (1998) describe first notable effects
in different cytotoxicity tests starting at 2.9 mg/L [309]. As has been shown for other
substances EC50 values vary between test, exposure time and organisms used. An
exposure to Triclosan resulted in EC50 values in the range of 0.7 µg/L to 350 µg/L
depending on the organism [305, 310-312]. First effects on algae were seen at
0.015 µg/L [313]. Besides its cyto- and genotoxic effects, Triclosan was also reported
being an endocrine-disrupting compound in aquatic organisms however at
Discussion
158
concentrations much higher than commonly found in water bodies [188, 314].
Despite all these reported toxic effects a review on Triclosan and its environmental
impacts by Dann et al. (2011) summarizes that the use of Triclosan can be
considered as safe, however further research regarding its impact on the ecosystem
and the human health needs to be done [171]. A similar statement was published by
the Scientific Committee on Consumer Products (2009). They conclude that its use
as a preservative is safe, however its use in e.g. body lotions and mouth washs
might not be safe because of the high levels of exposure [315]. The US FDA (2008)
in addition classified Triclosan as a Category III product due to insufficient
information on the safety and effectiveness, especially on missing data of its possible
dermal carcinogenicity [316].
2,4-Dichlorophenol is a substance originating not only from the ozonation and
photodegradation of Triclosan, but also from its metabolization [173, 317]. In the
German surface water guideline, 2,4-Dichlorophenol has been regulated with an
environmental qualitiy standard of 10 µg/L. Environmental quality standards are
applied when a substances is belived to have a negative impact for the environment
or human health [30]. The toxicity of 2,4-Dichlorophenol was amongst others
investigated by Chen et al. (2004) using L929 (mouse fibroblasts). The EC50 value
after a 24 h exposure was 135.29 mg/L. Additionally Chen et al. (2004) were able to
show the properties of 2,4-Dichlorophenol to induce DNA fragmentation and
apoptosis. Looking at other chlorophenols they also found that the cytotoxicity
increased with an increasing number of chlorine atoms [318]. This was also reported
by Jiang et al. (2004) who also investigated the cytotoxicity of chlorophenols on L929
but also on HepG2 cells. The LC50 values of 127.3 mg/L (L929) and 128.77 mg/L
(HepG2) for both cells lines are comparable. In regard to the simultaneously
performed QSAR approach correlating the chemical structure and biological activity
of 2,4-Dichlorophenol they not only found a relationship of cytotoxicity and the
number of chlorine atoms, they also found a connection between toxicity and the
position of the chlorine atoms [319]. An increase in chromosomal aberrations after
an exposure of CHO cells to 97.8 mg/L (with S9) and 195.6 mg/L (without S9) was
shown whereas no statistically significant effects were seen in TK6 cells [320]. The
effects of 2,4-Dichlorophenol were also investigated by Ensley et al. (1994). Using
the angiosperm Lemna gibba for their experiments they detected an EC50 of
Discussion
159
1.5 mg/L and a lethal concentration of 6.52 mg/L [321]. Own tests with 2,4-
Dichlorophenol demonstrate that neither cytotoxic nor genotoxic effects have been
detected at concentrations between 0 and 100 µg/L (chapter 5.5.4). Comparing
these results to the environmental quality standard (EQS) of 10 µg/L it can be said
that this value seems to be a safe measure.
Overall it can be concluded that Triclosan can be removed from water by ozonation
and that the ozonation leads to the formation of the less genotoxic by-product 2,4-
Dichlorophenol. However an EQS for 2,4-Dichlorophenol has been established and
its formation should therefore be avoided.
Biocides 6.10.
6.10.1. Irgarol 1051
Irgarol® 1051 is a constituent of paints used e.g. on ship hulls to prevent algal growth
or on facades reaching waste water treatment plants through leaching and wahs-off
into the sewage system [322]. Therefore its presence in the water system is likely
(up to 2.5 µg/L in freshwater [323]) and a reason it was investigated in this project.
Own results showed that although the ozonation of Irgarol led to the formation of
different oxidation by-products [151] no cytotoxic or genotoxic effects were detected
before or after ozonation. In addition no differences in cell viability or Olive Tail
Moment were observed comparing the use of 56 µg or 400 µg ozone (chapter 5.6.1).
Published studies showed that the toxicity of Irgarol 1051 has been investigated
using a variety of aquatic organisms, since they are most affected by its presence in
water systems. Although Irgarol is produced as a biocide effects in non-target
organisms should be avoided. EC50 values gained from the V. fischeri luminescence
test range from 2.42 mg/L to more than 50 mg/L depending on the exposure time
[227, 228, 324-326]. Irgarol has also been tested for its effects on D. magna resulting
in EC50 values of 7.3 or 8.3 mg/L [227, 228, 324, 325] and in the microalgae
Selenastrum capricronotum with EC50 values between 0.01 and 15.5 mg/L [174, 228,
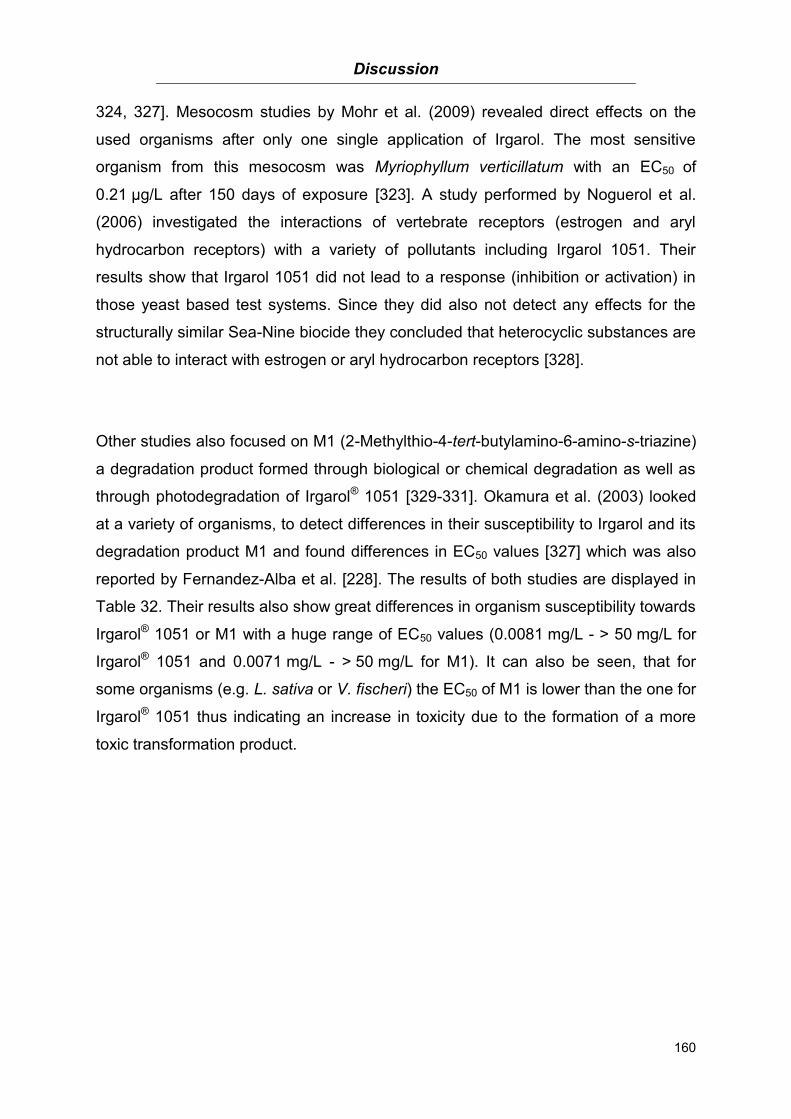
Discussion
160
324, 327]. Mesocosm studies by Mohr et al. (2009) revealed direct effects on the
used organisms after only one single application of Irgarol. The most sensitive
organism from this mesocosm was Myriophyllum verticillatum with an EC50 of
0.21 µg/L after 150 days of exposure [323]. A study performed by Noguerol et al.
(2006) investigated the interactions of vertebrate receptors (estrogen and aryl
hydrocarbon receptors) with a variety of pollutants including Irgarol 1051. Their
results show that Irgarol 1051 did not lead to a response (inhibition or activation) in
those yeast based test systems. Since they did also not detect any effects for the
structurally similar Sea-Nine biocide they concluded that heterocyclic substances are
not able to interact with estrogen or aryl hydrocarbon receptors [328].
Other studies also focused on M1 (2-Methylthio-4-tert-butylamino-6-amino-s-triazine)
a degradation product formed through biological or chemical degradation as well as
through photodegradation of Irgarol® 1051 [329-331]. Okamura et al. (2003) looked
at a variety of organisms, to detect differences in their susceptibility to Irgarol and its
degradation product M1 and found differences in EC50 values [327] which was also
reported by Fernandez-Alba et al. [228]. The results of both studies are displayed in
Table 32. Their results also show great differences in organism susceptibility towards
Irgarol® 1051 or M1 with a huge range of EC50 values (0.0081 mg/L - > 50 mg/L for
Irgarol® 1051 and 0.0071 mg/L - > 50 mg/L for M1). It can also be seen, that for
some organisms (e.g. L. sativa or V. fischeri) the EC50 of M1 is lower than the one for
Irgarol® 1051 thus indicating an increase in toxicity due to the formation of a more
toxic transformation product.
Discussion
161
Table 32: Summary of EC50 or LC50 values of Irgarol 1051 and M1 found in the literature
Author Organism (Exposure time)
Irgarol® 1051
EC50 [mg/L]
M1 EC50 [mg/L]
Reference
Okamura et al. S. capricornotum (3 d) 1.6 19 [325, 327]
L. gibba (7 d) 0.11 0.12
L. minor (7 d) 0.0081 0.0071
L. sativa (5 d) > 50 4.3
V. fischeri (30 min) > 50 > 50
D. magna (48 h) 8.3 (LC50) 11 (LC50)
D. duplex (24 h) 5.7 (LC50) 27 (LC50)
T. platyurus (24 h) 12 (LC50) 19 (LC50)
A. salina (24 h) > 40 > 40
Fernandez-Alba et al. V. fischeri (15 min) 50.8 6.5 [228]
S. capricornotum (30 h) 15.5 4.7
D. magna (48 h) 7.3 18.9
6.10.2. Terbutryn
Terbutryn is a biocide and as Irgarol® 1051 it is used in paints for facades or ship
hulls. It is also used as a control agent for grasses and weeds which might also lead
to a washing-off into surface waters. Due to rain events Terbutryn might leach
directly into surface water or the sewer system and after an incomplete removal in a
waste water treatment plant it might also reach surface waters [322]. Velisek et al.
(2010) reported a concentration of 5.6 µg/L detected in surface waters.
For Terbutryn the above presented results of this study show an influence of the
ozone concentration on the toxicity (chapter 5.6.2). It could be shown that the
substance itself already has genotoxic effects. Depending on the O3 concentration
the effects became even stronger indicated by an increase in the Olive Tail Moment
compared to the untreated samples but genotoxic effects were completely removed
at the highest O3 concentration (800 µg). This indicates that using 800 µg O3 the
genotoxic Terbutryn had been degraded without the formation of toxic oxidation by-
Discussion
162
products which have only been formed at the lower ozone concentrations (36 –
195 µg). However ozone concentrations commonly applied during waste water
treatment are usually higher than 800 µg. Thus there probably is no risk in applying
ozone to waters containing Terbutryn since the toxic Terbutryn is removed by ozone
and the formed genotoxic oxidation by-products only occur at low O3 concentrations.
The toxicity of Terbutryn itself has been shown by others before, however with
differing results. Arufe et al. (2004) observed a LC50 value of 1.4 mg/L using Sparus
aurata larvae (gilt-head bream) while the EC50 value derived from Vibrio fischeri was
15.94 mg/L [332]. In contrast, Hernando et al. (2007) classified Terbutryn as non-
harmful for Vibrio fischeri according to the toxicity categories of the EU legislation
[242]. The general toxicity of Terbutryn was also tested using V. fisheri by Gaggi et
al. (1995) resulting in an EC50 of 13 mg/L, comparable to the published data by Arufe
et al. In comparison, the EC50 values for two algae were 2.7 mg/L (Selenastrum
capricornutum) or 3.1 mg/L (Dunaliella tertiolecta) and 22 mg/L for the brine shrimp
Artemia salina [333]. Genotoxic effects of Terbutryn in human peripheral blood
leukocytes were detected at a concentration of 5 mg/L using the Alkaline Comet
Assay [176, 334] whereas no effects were seen in the Sister Chromatid Exchange
and in the Micronucleus Assay testing concentrations up to 150 mg/L [176]. Toxic
effects of Terbutryn on aquatic organisms were tested by Velisek et al. (2010) and
Plhalova et al. (2010) LC50 values for juvenile Poecilia reticulata and Danio rerio (D.
rerio) were 2.85 mg/L and 5.71 mg/L whereas the LC50 value for embryonic D. rerio
was determined as 8.04 mg/L, thus showing great differences in susceptibility
according to age and organism [335]. Velisek at al. investigated various parameters
(hematology, histology, blood, biochemistry and biometric parameters) in carp
exposed to Terbutryn and found effects starting at 0.04 mg/L [336] and even lower
effective concentrations (0.02 µg/L) on the early life stages of carp [337].
The above described results (chapter 5.6.2) from this PhD study clearly show an
increase in genotoxic effects after ozonation of Terbutryn which can be related to
formed oxidation by-products. Brix et al. (2009) also found an increase in toxicity
after oxidative treatment of Terbutryn. In their study they looked at disinfection by-
products after hypochlorite (HClO) treatment. The toxicity was determined by the
Vibrio fischeri luminescence test and showed a decrease of the EC50 value of

Discussion
163
Terbutryn from 24 mg/L in untreated water to 15 mg/L in HClO treated water thus
they concluded the formation of disinfection by-products which are more toxic than
Terbutryn itself [338].
Own results as well as results from other studies demonstrated the formation of toxic
by-products resulting from the oxidation of Terbutryn. Terbutryn has toxic effects
even at low concentrations and its presence in water bodies therefore is a risk for the
environment. However higher amounts of oxidant seem to be effective in removing
Terbutryn as well as its toxic by-products and lower its risk potential.
Musk fragrances 6.11.
6.11.1. AHTN and HHCB
Musk fragrances like AHTN and HHCB are aromatic substances ubiquitously used in
cosmetics, perfumery and detergents. Since they have a low water solubility they
easily bioaccumulate. This characteristic has led to their detection in the environment
(up to 45 µg/L [1]) as well as human blood samples. The use of musk fragrances in
cosmetics etc. has been classified as safe however their behavior and fate in the
environment needs further investigation [339].
Comparing own results of AHTN (chapter 5.7.1) before, during, and after ozonation
or UV/H2O2 treatment it can be seen, that the ozonation does not result in the
formation of toxic by-products, whereas after 20 min of UV/H2O2 treatment weak
cytotoxic effects occur. These effects are related to formed oxidation by-products,
since no remaining peroxides were detected. Although oxidation by-products were
also formed during ozonation [186] no cytotoxic or genotoxic effects were observed.
HHCB-lactone was tested for toxicity at concentrations between 0 µg/L and 50 µg/L
but neither cytotoxic nor genotoxic effects occurred. Cytotoxic effects however, were
only detected after 60 min UV/H2O2 oxidation of 0.1 mg/L HHCB. This reflects the
findings for Bisphenol A (chapter 5.4.2), where only the UV/H2O2 treatment resulted
in a reduced viability, indicating that different oxidation by-products are formed
depending on the applied oxidation method. The toxicity of both substances, HHCB
Discussion
164
and its oxidation by-product HHCB-lactone, has been studied before by others and
resulted in a classification as not harmful for the environment based on PNEC
(predicted non effect concentration) values for soil dry weight and for aquatic species
[340]. The genotoxicity tests performed in this study confirm previously published
results by Api et al. (1999) who did not find genotoxic or mutagenic effects of AHTN
and HHCB in different test systems (Ames Test, Chromosome abberations,
Unscheduled DNA synthesis and Micronucleus test) [341]. Effects of AHTN and
HHCB on the early life stages of zebrafish have been investigated by Carlsson et al.
(2004). While AHTN had effects on the heart rate (LOEC = 33 µg/L) no effects were
seen on the survival time with a maximum concentration of 100 µg/L. HHCB in
contrast had no effects in both tests up to a concentration of 1 mg/L [342]. However,
Randelli et al. (2011) reported effects of AHTN on the regulation of
immunoregulatory genes in gonadal cells of the rainbrow trout, while there were no
effects on cell viability [343].
In addition to the cytotoxicity and genotoxicity testing in this study HHCB and HHCB-
lactone were also tested for estrogenicity (chapter 5.7.1 and 5.7.2), but no effects
were detected supporting other published results. Estrogenic effects of AHTN and
HHCB have been studied by Seinen et al. (1999) They found effects on the uterus
weight of mice starting at 50 ppm AHTN and an induction of the ERα transcription
starting at 50 µM AHTN. However, they concluded that compared to effects resulting
from a 17ß-estradiol exposure the effects induced by AHTN are not noteworthy.
Thus, they also state that AHTN does not have a negative effect on the environment
[344]. Schreurs et al. (2005) investigated the interactions of musk fragrances with
different hormonal receptors and found AHTN as well as HHCB to be antagonists
towards the ERß receptor [345] which confirms the above presented findings of our
own investigations where no estrogenic activity of HHCB was detected.
Antiestrogenic effects of HHCB were also reported by Simmons et al. (2012) after
performing the Yes-assay, as well as other in vitro and in vivo test systems [346]. A
set of different reporter gene assays (estrogen, androgen, progesterone, and
glucocorticoid) was used to test HHCB and AHTN for their potential endocrine
effects. Here again it was reported that neither substance had agonistic effects
whereas antagonistic effects were detected in each assay except the glucocorticoid
system [347]. Another study by Schreurs et al. (2003) also proves the antiestrogenic
Discussion
165
effect, this time using a transgenic zebrafish assay [348]. The same findings on the
antagonistic mode of action by polycyclic musks have been reported in a literature
review by Witorsch and Thomas (2010) [349]. Although HHCB has been shown to
act estrogenic, the concentrations inducing these effects were much higher
(2.58 mg/L) than those used in our study (max. 0.1 mg/L) [350]. Schreurs et al. (2002
and 2005) were also able to prove, that the endocrine mode of action (agonistic or
antagonistic) of HHCB is cell line dependent, and HHCB does not always result in
estrogenic effects [345, 351]. Despite the published data on the toxicity and
endocrine activity of HHCB and AHTN further analyses especially in regard to the
formation of oxidation by-products should be performed since both substances are
frequently detected in water systems [36, 352].
Organophosphates: TCEP, TCPP and TPP 6.12.
Organophosphates are substances commonly used as constituents of biocides and
thus are designed to be biologically active. Besides this they are also used as flame
retardants and might therefore reach water systems. Although despite their
widespread use, toxicological data about the three here used organophosphates is
scarce.
TCEP has been added to the candidate list of substances of very high concern
(SVHC) by the ECHA due to its classification as a reproductive toxicant [180]. The
SVHC supporting document also indicates neurotoxic effects after an exposure to
TCEP [353].
The toxicity of TPP has been investigated by Lin et al. (2009). They report LC50
values of 0.51 mg/L and 0.09 mg/L for Daphnia magna exposed to TPP for 24 h or
48 h [221]. Föllmann et al. (2006) tested TCEP and TCPP for their potential to
induce cytotoxic, genotoxic, mutagenic, and estrogenic effects in vitro. The results
show, that an exposure of V79 cells (hamster fibroblasts) to both substances did not
result in genotoxic and mutagenic effects using the Alkaline Comet Assay and the
Discussion
166
Ames test with and without metabolic activation (S9). In addition no estrogenic or
anti-estrogenic effects were detected for a maximum concentration of 1 mM (TCEP =
250 mg/L; TCPP = 327.55 mg/L). However, cytotoxic effects for both substances
were seen at concentrations above 10 µM for TCEP and 1 mM for TCPP but only in
the presence of the S9 liver homogenate [354]. Similar results for genotoxic or
mutagenic effects were also published by others [355-358]. Ren et al. (2009) were
able to show cytotoxic effects to start at 1 mg/L in the LDH assay using primary rat
renal cells. At these concentrations TCEP also had an influence on the ion uptake
and the expression of ion-transporters [359]. Another study of the same group also
showed possible risks on the ecosystem and the human health [360]. Endocrine
effects of organophsophates on H295R and MVLN cells have been investigated by
Liu et al. (2012) demonstrating the potential of endocrine disruption of TCEP, TCPP
and TPP as well as other organophosphates starting at low µg/L concentrations. At
the same time they were able to show differences in the mode of action [361].
Comparing the published data for TCEP and TCPP to results obtained during this
study it can be seen, that effects occur at mainly much higher concentrations than
tested here (chapter 5.8.2 and 5.8.3). 0.1 mg/L of the organophosphates did not
result in cytotoxic or genotoxic effects. Cytotoxic effects were only seen after
UV/H2O2 treatment but not after ozonation, indicating the formation of toxic oxidation
by-products.
In contrast to the above mentioned data from the literature, Higley et al. (2012)
performed a study with sediments from the upper Danube river using an effect-
directed analysis looking at endocrine disrupting, mutagenic, and teratogenic effects.
Although they found toxic effects for some fractions of the extracted sediments, the
fractions containing organophosphates did not result in any effects [362].
The results for TPP however are different. 0.1 mg/L TPP did not result in a decrease
in cell viability neither before nor after ozonation. Genotoxic effects however were
detected before oxidative treatment but not after 60 min of treatment. Thus ozonation
and UV/H2O2 oxidation were useful to remove the toxic TPP from water samples.
Flaskos et al. (1994) report an IC50 value of 250 mg/L for TPP in PC12 cells (rat
pheochromocytoma cells) [363]. This IC50 value in fact is a lot higher than the
concentration tested here.

Discussion
167
In conclusion it can be said that these results show that substances belonging to the
same class of chemicals do not necessarily exhibit the same mode of action and
oxidative treatment might result in different outcomes.
Discussion
168
Conclusions and future directions 6.13.
The results of this study also demonstrate that a generalized statement about toxic
effects of waste water treatment plant effluents is not possible. The water
composition as well as the waste water treatment plant design and the operating
conditions might vary between different plants and over time. In addition four in vitro
tests have been applied in this study and most of the substances and treatment
conditions resulted in no toxic effects. However, other toxicological test methods as
well as in vivo methods might give different results, due to a different mode of action
or in case of in vivo methods, the metabolization of micropollutants. Therefore further
research (e.g. EDA) regarding the toxicity of micropollutants, their metabolites as
well as their oxidation by-products is needed especially since up to now the methods
of waste water treatment have not been applied or modified in regard to
micropollutant removal.
Another step towards a better surveillance of water quality by means of toxicity is the
development or establishment of existing online monitoring systems, for a faster on-
site analysis in combination with other test systems.
Further technologies that might also be applied for a risk assessment of organic
micropollutants in water systems are the QSAR-approaches or toxicogenomics as
well as biosensors which allow a toxicological analysis at the source, e.g. directly at
the WWTP effluent discharge point or even in front of it. The use of the so called
“–omics” techniques might be another step towards the application of cellular based
test systems. These techniques allow an analysis on the whole organism situation
e.g. changes in DNA expression (genomics) or protein profiles (proteomics) [231].
For further or more detailed analyses in vivo methods might then be applied after
limiting the vast amount of adverse effects through in vitro testing. Concepts like the
Adverse Outcome Pathways proposed by the US EPA (2010), effect directed
analysis or procedures as suggested by Kase et al. (2009) are most promising for a
secure risk assessment [71, 234, 236].
.

References
169
7. References
1. Carballa, M., F. Omil, J.M. Lema, M. Llompart, C. Garcia-Jares, I. Rodriguez, M. Gomez, and T. Ternes, Behavior of pharmaceuticals, cosmetics and hormones in a sewage treatment plant. Water Research, 2004. 38(12): p. 2918-2926.
2. Fick, J., H. Söderström, R.H. Lindberg, C. Phan, M. Tysklind, and D.G.J. Larsson, Contamination of surface, ground, and drinking water from pharmaceutical production. Environmental Toxicology and Chemistry, 2009. 28(12): p. 2522-2527.
3. Hirsch, R., T. Ternes, K. Haberer, and K.L. Kratz, Occurrence of antibiotics in the aquatic environment. Science of the Total Environment, 1999. 225(1-2): p. 109-118.
4. Tambosi, J.L., L.Y. Yamanaka, H.J. Jose, R. Moreira, and H.F. Schroder, Recent Research Data on the Removal of Pharmaceuticals from Sewage Treatment Plants (STP). Quimica Nova, 2010. 33(2): p. 411-420.
5. Vieno, N., T. Tuhkanen, and L. Kronberg, Elimination of pharmaceuticals in sewage treatment plants in Finland. Water Research, 2007. 41(5): p. 1001-1012.
6. Henze, M., Harremoes, P., la Cour Jansen, J., Arvin, E., Wastewater Treatment: Biological and Chemical Processes. Springer, 2002. 3. Edition.
7. Tauxe-Wuersch, A., L.F. De Alencastro, D. Grandjean, and J. Tarradellas, Occurrence of several acidic drugs in sewage treatment plants in Switzerland and risk assessment. Water Research, 2005. 39(9): p. 1761-1772.
8. Ternes, T.A., J. Stuber, N. Herrmann, D. McDowell, A. Ried, M. Kampmann, and B. Teiser, Ozonation: a tool for removal of pharmaceuticals, contrast media and musk fragrances from wastewater? Water Research, 2003. 37(8): p. 1976-1982.
9. Nikolaou, A., S. Meric, and D. Fatta, Occurrence patterns of pharmaceuticals in water and wastewater environments. Analytical and Bioanalytical Chemistry, 2007. 387(4): p. 1225-1234.
10. Rosal, R., A. Rodriguez, J. Antonio Perdigon-Melon, A. Petre, E. Garcia-Calvo, M. Jose Gomez, A. Aguera, and A.R. Fernandez-Alba, Occurrence of emerging pollutants in urban wastewater and their removal through biological treatment followed by ozonation. Water Research, 2010. 44(2): p. 578-588.
11. Schaar, H., Kreuzinger, N., Endbericht KomOzon: Technische Umsetzung und Implementierung einer Ozonungsstufe für nach dem Stand der Technik gereinigtes kommunales Abwasser Heranführung an den Stand der Technik. Lebensministerium Wien, 2011.
12. Bergmann, A., Fohrmann, R., Weber, F./A., Zusammenstellung von Monitoringdaten zu Umweltkonzentrationen von Arzneimitteln. Umweltbundesamt, 2011.
13. Ternes, T., Occurrence of drugs in German sewage treatment plants and rivers. Water Research, 1998. 32(11): p. 3245-3260.
14. Abegglen, C., Ozonung von gereinigtem Abwasser Schlussbericht Pilotversuch Regensdorf. 2009.
15. Rizzo, L., S. Meric, D. Kassinos, M. Guida, F. Russo, and V. Belgiorno, Degradation of diclofenac by TiO2 photocatalysis: UV absorbance kinetics
References
170
and process evaluation through a set of toxicity bioassays. Water Research, 2009. 43(4): p. 979-988.
16. Sein, M.M., T.C. Schmidt, A. Golloch, and C. von Sonntag, Oxidation of some typical wastewater contaminants (tributyltin, clarithromycin, metoprolol and diclofenac) by ozone. Water Science and Technology, 2009. 59(8): p. 1479-1485.
17. Wammer, K.H., T.M. Lapara, K. McNeill, W.A. Arnold, and D.L. Swackhamer, Changes in antibacterial activity of triclosan and sulfa drugs due to photochemical transformations. Environmental Toxicology and Chemistry, 2006. 25(6): p. 1480-1486.
18. Hollender, J., S.G. Zimmermann, S. Koepke, M. Krauss, C.S. McArdell, C. Ort, H. Singer, U. von Gunten, and H. Siegrist, Elimination of Organic Micropollutants in a Municipal Wastewater Treatment Plant Upgraded with a Full-Scale Post-Ozonation Followed by Sand Filtration. Environmental Science & Technology, 2009. 43(20): p. 7862-7869.
19. Reungoat, J., M. Macova, B.I. Escher, S. Carswell, J.F. Mueller, and J. Keller, Removal of micropollutants and reduction of biological activity in a full scale reclamation plant using ozonation and activated carbon filtration. Water Research, 2010. 44(2): p. 625-637.
20. Zwiener, C. and F.H. Frimmel, Oxidative treatment of pharmaceuticals in water. Water Research, 2000. 34(6): p. 1881-1885.
21. Bauer, R. and H. Fallmann, The Photo-Fenton Oxidation — A cheap and efficient wastewater treatment method. Research on Chemical Intermediates, 1997. 23(4): p. 341-354.
22. Macova, M., B.I. Escher, J. Reungoat, S. Carswell, K.L. Chue, J. Keller, and J.F. Mueller, Monitoring the biological activity of micropollutants during advanced wastewater treatment with ozonation and activated carbon filtration. Water Research, 2010. 44(2, Sp. Iss. SI): p. 477-492.
23. Vieno, N.M., H. Harkki, T. Tuhkanen, and L. Kronberg, Occurrence of pharmaceuticals in river water and their elimination in a pilot-scale drinking water treatment plant. Environmental Science & Technology, 2007. 41(14): p. 5077-5084.
24. Stalter, D., A. Magdeburg, and J. Oehlmann, Comparative toxicity assessment of ozone and activated carbon treated sewage effluents using an in vivo test battery. Water Research, 2010. 44(8): p. 2610-2620.
25. Petala, M., P. Samaras, A. Zouboulis, A. Kungolos, and G.P. Sakellaropoulos, Influence of ozonation on the in vitro mutagenic and toxic potential of secondary effluents. Water Research, 2008. 42(20): p. 4929-4940.
26. Escher, B., Leusch F., Bioanalytical tools for safe water supplies: using cellular response to show toxicity effect. Water21, 2011: p. 31-33.
27. Kavlock, R.J., C.P. Austin, and R.R. Tice, Toxicity Testing in the 21st Century: Implications for Human Health Risk Assessment. Risk Analysis, 2009. 29(4): p. 485-487.
28. EU WRRL (2000): Richtlinie 2000/60/EG des Europäischen Parlaments und des Rates vom 23. Oktober 2000 zur Schaffung eines Ordnungsrahmens für Maßnahmen der Gemeinschaft im Bereich der Wasserpolitik.
29. Richtlinie 2008/105/EG des Europäischen Parlaments und des Rates vom 16. Dezember 2008 über Umweltqualitätsnormen im Bereich der Wasserpolitik.

References
171
30. Verordnung zum Schutz der Oberflächengewässer (Oberflächengewässerverordnung - OGewV); Ausfertigungsdatum: 20.07.2011.
31. Grohmann, A.N., Jekel, M., Grohmann, A., Szewzyk, R., Szewzyk, U., Wasser: Chemie, Mikrobiologie und nachhaltige Nutzun. de Gruyter, 2011. ISBN: 978-3-11-021308-9.
32. Schwarzenbach, R.P., B.I. Escher, K. Fenner, T.B. Hofstetter, C.A. Johnson, U. von Gunten, and B. Wehrli, The challenge of micropollutants in aquatic systems. Science, 2006. 313(5790): p. 1072-1077.
33. Rote Liste® 2011: Arzneimittelverzeichnis für Deutschland (einschließlich EU-Zulassungen und bestimmter Medizinprodukte). Rote Liste Service GmbH, 2011. ISBN: 978-3-939192-50-3.
34. Schwabe, U., Paffrath, D., Arzneiverordnungs-Report 2011; Aktuelle Daten, Kosten, Trends und Kommentare. Springer, 2011. ISBN: 978-3-642-21991-7.
35. WHO, WHO Model List of Essential Medicines. 17th list, 2011. 36. Bester, K., Polycyclic musks in the Ruhr catchment area - transport,
discharges of waste water, and transformations of HHCB, AHTN and HHCB-lactone. Journal of Environmental Monitoring, 2005. 7(1): p. 43-51.
37. Chen, X. and K. Bester, Determination of organic micro-pollutants such as personal care products, plasticizers and flame retardants in sludge. Analytical and Bioanalytical Chemistry, 2009. 395(6): p. 1877-1884.
38. Heberer, T., S. Gramer, and H.J. Stan, Occurrence and distribution of organic contaminants in the aquatic system in Berlin. Part III: Determination of synthetic musks in Berlin surface water applying solid-phase microextraction (SPME) and gas chromatography-mass spectrometry (GC-MS). Acta Hydrochimica Et Hydrobiologica, 1999. 27(3): p. 150-156.
39. Rüffer, H., Masannek, R., Wasser: Nutzung im Kreislauf Hygiene, Analyse und Bewertung (Höll, K., Grohmen, A.). de Gruyter, 2002. 8. Edition.
40. Abwasserverordnung in der Fassung der Bekanntmachung vom 17. Juni 2004 (BGBI. I S. 1108, 2625), die zuletzt durch Artikel 20 des Gesetztes vom 31. Juli 2009 (BGBI. I S. 2585) geändert worden ist. 2009.
41. Cooper, P.F., "Historical aspects of wastewater treatment" in Decentralised Sanitation and Reuse: Concenpts, systems and implementation. IWA Publishing, 2001.
42. Judd, S., Judd, C., The MBR Book: Principles and Applications of Membrane Bioreactors for Water and Wastewater Treatment. ElSEVIER Butterworth-Heinemann, 2011. 2. Edition: p. ISBN: 978-0-08-096682-3.
43. Bartel, H., Wasser: Nutzung im Kreislauf Hygiene, Analyse und Bewertung (Höll, K., Grohmen, A.), de Gruyter, 2002. 8. Edition.
44. Zimmermann, S.G., M. Wittenwiler, J. Hollender, M. Krauss, C. Ort, H. Siegrist, and U. von Gunten, Kinetic assessment and modeling of an ozonation step for full-scale municipal wastewater treatment: Micropollutant oxidation, by-product formation and disinfection. Water Research, 2011. 45(2): p. 605-617.
45. Cecen, F., Aktas, Ö., Activated Carbon for Water and Wastewater Treatment: Integration of Adsorption and Biological Treatment. Wiley-VCH, 2011. ISBN: 978-3-527-32471-2.
46. Anderson, D., Activated Carbon Treatment of Waste Waters. Effluent & Water Treatment Journal, 1971. 11(3): p. 144-&.

References
172
47. Serrano, D., S. Suárez, J.M. Lema, and F. Omil, Removal of persistent pharmaceutical micropollutants from sewage by addition of PAC in a sequential membrane bioreactor. Water Research, 2011. 45(16): p. 5323-5333.
48. Serrano, D., J.M. Lema, and F. Omil, Influence of the employment of adsorption and coprecipitation agents for the removal of PPCPs in conventional activated sludge (CAS) systems. Water Science and Technology, 2010. 62(3): p. 728-735.
49. Tomaszewska, M. and S. Mozia, Removal of organic matter from water by PAC/UF system. Water Research, 2002. 36(16): p. 4137-4143.
50. Westerhoff, P., Y. Yoon, S. Snyder, and E. Wert, Fate of Endocrine-Disruptor, Pharmaceutical, and Personal Care Product Chemicals during Simulated Drinking Water Treatment Processes. Environmental Science & Technology, 2005. 39(17): p. 6649-6663.
51. Andreozzi, R., V. Caprio, A. Insola, and R. Marotta, Advanced oxidation processes (AOP) for water purification and recovery. Catalysis Today, 1999. 53(1): p. 51-59.
52. Ikehata, K., M. Gamal El-Din, and S.A. Snyder, Ozonation and advanced oxidation treatment of emerging organic pollutants in water and wastewater. Ozone-Science & Engineering, 2008. 30(1): p. 21-26.
53. Tuerk, J., B. Sayder, A. Boergers, H. Vitz, T.K. Kiffmeyer, and S. Kabasci, Efficiency, costs and benefits of AOPs for removal of pharmaceuticals from the water cycle. Water Science and Technology, 2010. 61(4): p. 985-993.
54. Somensi, C.A., E.L. Simionatto, S.L. Bertoli, A. Wisniewski, Jr., and C.M. Radetski, Use of ozone in a pilot-scale plant for textile wastewater pre-treatment: Physico-chemical efficiency, degradation by-products identification and environmental toxicity of treated wastewater. Journal of Hazardous Materials, 2010. 175(1-3): p. 235-240.
55. Huber, M.M., A. Gobel, A. Joss, N. Hermann, D. Loffler, C.S. McArdell, A. Ried, H. Siegrist, T.A. Ternes, and U. von Gunten, Oxidation of pharmaceuticals during ozonation of municipal wastewater effluents: A pilot study. Environmental Science & Technology, 2005. 39(11): p. 4290-4299.
56. Kurokawa, Y., A. Maekawa, M. Takahashi, and Y. Hayashi, Toxicity and Carcinogenicity of Potassium Bromate - A New Renal Carcinogen. Environmental Health Perspectives, 1990. 87: p. 309-335.
57. Siddiqui, M.S., G.L. Amy, and R.G. Rice, Bromate Ion Formation - A Critical-Review. Journal American Water Works Association, 1995. 87(10): p. 58-70.
58. Glaze, W.H., J.W. Kang, and D.H. Chapin, The Chemistry of Water-Treatment Processes Involving Ozone, Hydrogen-Peroxide and Ultraviolet-Radiation. Ozone-Science & Engineering, 1987. 9(4): p. 335-352.
59. Hoigné, J. and H. Bader, Rate constants of reactions of ozone with organic and inorganic compounds in water—II: Dissociating organic compounds. Water Research, 1983. 17(2): p. 185-194.
60. Parsons, S.A., Williams, M., Advanced Oxidation Processes for Water and Wastewater Treatment. IWA Publishing, 2004. 1. Edition(ISBN: 14 84339 017 5).
61. Gottschalk, C., Libra, .A., Saupe, A., Ozonation of Water and Waste Water: A Practical Guide to Understanding Ozone and its Applications. Wiley-VCH, 2010. 2. Edition(ISBN: 978-3-527-31962-6).
References
173
62. DIN 5031-7 (1984-01-00): Strahlungsphysik im optischen Bereich und Lichttechnik - Teil 7: Benennung der Wellenlängenbereiche.
63. Barbusinski, K., Fenton Reaction - Controversy Concerning The Chemistry. Ecological Chemistry and Engineering S-Chemia I Inzynieria Ekologiczna S, 2009. 16(3): p. 347-358.
64. Bauer, R., Applicability of Solar Irradiation for Photochemical Waste-Water Treatment. Chemosphere, 1994. 29(6): p. 1225-1233.
65. Ruppert, G., R. Bauer, and G. Heisler, The Photo-Fenton Reaction - An Effective Photochemical Waste-Water Treatment Process. Journal of Photochemistry and Photobiology a-Chemistry, 1993. 73(1): p. 75-78.
66. Trovo, A.G., R.F.P. Nogueira, A. Aguera, A.R. Fernandez-Alba, C. Sirtori, and S. Malato, Degradation of sulfamethoxazole in water by solar photo-Fenton. Chemical and toxicological evaluation. Water Research, 2009. 43(16): p. 3922-3931.
67. Ruppert, G., R. Bauer, and G. Heisler, UV-O3, UV-H2O2, UV-TIO2 and the Photo-Fenton Reaction - Comparison of Advanced Oxidation Processes for Waste-Water Treatment. Chemosphere, 1994. 28(8): p. 1447-1454.
68. Li, W., V. Nanaboina, Q. Zhou, and G.V. Korshin, Effects of Fenton treatment on the properties of effluent organic matter and their relationships with the degradation of pharmaceuticals and personal care products. Water Research, 2012. 46(2): p. 403-412.
69. De la Cruz, N., J. Gimenez, S. Esplugas, D. Grandjean, L.F. de Alencastro, and C. Pulgarin, Degradation of 32 emergent contaminants by UV and neutral photo-fenton in domestic wastewater effluent previously treated by activated sludge. Water Research, 2012. 46(6): p. 1947-57.
70. Oppenländer, T., Photochemical Purification of Water and Air. Wiley-VCH, 2002. 1. Edition(ISBN: 978-3-527-30563-6).
71. Kase, R., Kunz, P., Gerhardt, A, Identifikation geeigneter Nachweismöglichkeiten von hormonaktiven und reproduktionstoxischen Wirkungen in aquatischen Ökosystemen. Umweltwissenschaften und Schadstoff-Forschung, 2009. 21(4): p. 339-378.
72. Grummt, T., Wasser: Nutzung im Kreislauf Hygiene, Analyse und Bewertung (Höll, K., Grohmen, A.). de Gruyter, 2002. 8. Edition.
73. Umweltbundesamt, Bewertung der Anwesenheit teil- oder nicht bewertbarer Stoffe im Trinkwasser aus gesundheitlicher Sicht: Empfehlung des Umweltbundesamtes nach Anhörung der Trinkwasserkommission beim Umweltbundesamt. Bundesgesundheitsbl - Gesundheitsforsch - Gesundheitsschutz, 2003. 46: p. 249-251.
74. Krewski, D., D. Acosta, M. Andersen, H. Anderson, J.C. Bailar, K. Boekelheide, R. Brent, G. Charnley, V.G. Cheung, S. Green, K.T. Kelsey, N.I. Kerkvliet, A.A. Li, L. McCray, O. Meyer, R.D. Patterson, W. Pennie, R.A. Scala, G.M. Solomon, M. Stephens, J. Yager, L. Zeise, and A. Staff Comm Toxicity Testing, Toxicity Testing in the 21ST Century: A Vision and a Strategy. Journal of Toxicology and Environmental Health-Part B-Critical Reviews, 2010. 13(2-4): p. 51-138.
75. The European Parliament and the Council of the European Union (2006); REGULATION (EC) No 1907/2006 OF THE EUROPEAN PARLIAMENT AND OF THE COUNCIL of 18 December 2006 concerning the Registration, Evaluation, Authorisation and Restriction of Chemicals (REACH), establishing a European Chemicals Agency, amending Directive 1999/45/EC and
References
174
repealing Council Regulation (EEC) No 793/93 and Commission Regulation (EC) No 1488/94 as well as Council Directive 76/769/EEC and Commission Directives 91/155/EEC, 93/67/EEC, 93/105/EC and 2000/21/EC.
76. http://ecvam.jrc.it/index.htm. 77. EU, Directive 2012/63/EU OF THE EUROPEAN PARLIAMENT AND OF THE
COUNCIL of 22 September 2010 on the protection of animals used for scientific purposes. 2010.
78. 3R Research Foundation Switzerland: Annual Report 2010. 2010. 79. http://www.bfr.bund.de/de/zebet-1433.html. 80. NIH, Guidance Document on using In Vitro Data to Estimate In Vivo Starting
Doses for Acute Toxicity. NIH Publication No: 01-4500, 2001. 81. Barile, F.A., P.J. Dierickx, and U. Kristen, In-vitro Cytotoxicity Testing for
Prediction of Acute Human Toxicity. Cell Biology and Toxicology, 1994. 10(3): p. 155-162.
82. Greim, H., Dreml, E., Toxikologie. Eine Einführung für Naturwissenschaftler und Mediziner. Wiley-VCH, 1996.
83. Eisenbrand, G., Netzler, M., Hennecke, F.J., Toxikologie für Naturwissenschaftler und Mediziner; Stoffe, Mechanismen, Prüfverfahren, 2005, Wiley-VCH.
84. Eisenbrand, G., B. Pool-Zobel, V. Baker, M. Balls, B.J. Blaauboer, A. Boobis, A. Carere, S. Kevekordes, J.C. Lhuguenot, R. Pieters, and J. Kleiner, Methods of in vitro toxicology. Food and Chemical Toxicology, 2002. 40(2-3): p. 193-236.
85. Verordnung über die Qualität von Wasser für den menschlichen Gebrauch. 2011.
86. Verordnung zum Schutz des Grundwassers: Grundwasserverordnung vom 9. November 2010 (BGBI. I S. 1513). 2010.
87. DIN EN ISO 10993-5:2009-10: Biologische Beurteilung von Medizinprodukten.
88. OSPAR, Survey on Genotoxicity Test Methods for the Evaluation of Waste Water within Whole Effluent Assessment. 2002.
89. Galloway, S.M., M.J. Aardema, M. Ishidate, J.L. Ivett, D.J. Kirkland, T. Morita, P. Mosesso, and T. Sofuni, Report from Working Group on In-vitro Tests for Chromosomal-Aberrations. Mutation Research, 1994. 312(3): p. 241-261.
90. EPA, Health Effects Test Guidelines OPPTS 870.5375: In Vitro Mammalian Chromosome Abberation Test. 1998.
91. OECD, Test No. 473: Guideline for the Testing of Chemicals: In vitro Mammalian Chromosome Abberation Test. 1997.
92. OECD, Test No. 479: Genetic Toxicology: In Vitro Sister Chromatid Exchange Assay in Mammalian Cells. 1986.
93. Latt, S.A., J. Allen, S.E. Bloom, A. Carrano, E. Falke, D. Kram, E. Schneider, R. Schreck, R. Tice, B. Whitfield, and S. Wolff, Sister-Chromatid Echanges - A Report of the Gene-Tox Program. Mutation Research, 1981. 87(1): p. 17-62.
94. OECD, Test No. 482: Genetic Toxicology: DNA Damage and Repair/Unscheduled DNA Synthesis in Mammalian Cells in vitro. 1986.
95. OECD, Test No. 473: OECD Guideline for the Testing of Chemicals - In Vitro Mammalian Cell Micronucleus Test. 2010.
96. Kirsch-Volders, M., A. Elhajouji, E. Cundari, and P. Van Hummelen, The in vitro micronucleus test: a multi-endpoint assay to detect simultaneously mitotic delay, apoptosis, chromosome breakage, chromosome loss and non-
References
175
disjunction. Mutation Research/Genetic Toxicology and Environmental Mutagenesis, 1997. 392(1): p. 19-30.
97. Kohn, K.W. and Grimekew.Ra, Alkaline Elution Analysis, a New Approach to the Study of DNA Single-Strand Interruptions in Cells. Cancer Research, 1973. 33(8): p. 1849-1853.
98. Storer, R.D., T.W. McKelvey, A.R. Kraynak, M.C. Elia, J.E. Barnum, L.S. Harmon, W.W. Nichols, and J.G. DeLuca, Revalidation of the in vitro alkaline elution rat hepatocyte assay for DNA damage: Improved criteria for assessment of cytotoxicity and genotoxicity and results for 81 compounds. Mutation Research-Genetic Toxicology, 1996. 368(2): p. 59-101.
99. Swenberg, J.A., G.L. Petzold, and P.R. Harbach, Invitro DNA Damage Alkaline Elution Assay for Predicting Carcinogenic Potential. Biochemical and Biophysical Research Communications, 1976. 72(2): p. 732-738.
100. BDS. http://www.biodetectionsystems.com/1/news/76.php. 2010. 101. Tice, R.R., E. Agurell, D. Anderson, B. Burlinson, A. Hartmann, H. Kobayashi,
Y. Miyamae, E. Rojas, J.C. Ryu, and Y.F. Sasaki, Single cell gel/comet assay: Guidelines for in vitro and in vivo genetic toxicology testing. Environmental and Molecular Mutagenesis, 2000. 35(3): p. 206-221.
102. Ostling, O. and K.J. Johanson, Microelectrophoretic Study of Radiation-Induced DNA Damages in Individual Mammalian-Cells. Biochemical and Biophysical Research Communications, 1984. 123(1): p. 291-298.
103. Singh, N.P., M.T. McCoy, R.R. Tice, and E.L. Schneider, A Simple Technique for Quantitation of Low-Levels of DNA Damage In Individual Cells. Experimental Cell Research, 1988. 175(1): p. 184-191.
104. Walmsley, R.M., GADD45a-GFP GreenScreen HC genotoxicity screening assay. Expert Opinion on Drug Metabolism & Toxicology, 2008. 4(6): p. 827-835.
105. Aardema, M.J. and J.T. MacGregor, Toxicology and genetic toxicology in the new era of "toxicogenomics": impact of "-omics" technologies. Mutation Research-Fundamental and Molecular Mechanisms of Mutagenesis, 2002. 499(1): p. 13-25.
106. Malik, A.I., A. Williams, C.L. Lemieux, P.A. White, and C.L. Yauk, Hepatic mRNA, microRNA, and miR-34a-Target responses in mice after 28 days exposure to doses of benzo(a)pyrene that elicit DNA damage and mutation. Environmental and Molecular Mutagenesis, 2012. 53(1): p. 10-21.
107. Scott, D.J., A.S. Devonshire, Y.A. Adeleye, M.E. Schutte, M.R. Rodrigues, T.M. Wilkes, M.G. Sacco, L. Gribaldo, M. Fabbri, S. Coecke, M. Whelan, N. Skinner, A. Bennett, A. White, and C.A. Foy, Inter- and intra-laboratory study to determine the reproducibility of toxicogenomics datasets. Toxicology, 2011. 290(1): p. 50-58.
108. OECD, Test No: 476 Guideline for the Testing of Chemicals: In vitro Mammalian Cell Gene Mutation Test. 1997.
109. EPA, Health Effects Test Guidelines: OPPTS 870.5300: Detection of Gene Mutations in Somatic Cells in Culture. 1996.
110. Clive, D. and J.F.S. Spector, Laboratory Procedure for Assessing Specific Locus Mutations at TK Locus in Cultured L5178Y Mouse Lymphoma-Cells. Mutation Research, 1975. 31(1): p. 17-29.
111. OECD, Test No: 480 Guideline for the Testing of Chemicals: genetic Toxicology: Saccharomyces cerevisiae, Gene Mutation Assay. 1986.

References
176
112. OECD, Test No: 481 Guideline for the Testing of Chemicals: Genetic Toxicology: Saccharomyces cerevisiae, Mitotic Recombination Assay. 1986.
113. OECD, Test No: 471 Guideline for the Testing Of Chemicals: Bacterial Reverse Mutation Test. 1997.
114. FDA, http://www.fda.gov/Food/GuidanceComplianceRegulatoryInformation/GuidanceDocuments/FoodIngredientsandPackaging/Redbook/ucm078330.htm. 2000.
115. Ames, B.N., F.D. Lee, and W.E. Durston, Improved Bacterial Test System for Detection and Classification of Mutagens and Carcinogens. Proceedings of the National Academy of Sciences of the United States of America, 1973. 70(3): p. 782-786.
116. Kleine, B., Rossmanith, W., Hormone und Hormonsystem, Lehrbuch der Endokrinologie. Springer, 2010. 2. Edition.
117. Routledge, E.J., D. Sheahan, C. Desbrow, G.C. Brighty, M. Waldock, and J.P. Sumpter, Identification of estrogenic chemicals in STW effluent. 2. In vivo responses in trout and roach. Environmental Science & Technology, 1998. 32(11): p. 1559-1565.
118. Kidd, K.A., P.J. Blanchfield, K.H. Mills, V.P. Palace, R.E. Evans, J.M. Lazorchak, and R.W. Flick, Collapse of a fish population after exposure to a synthetic estrogen. Proceedings of the National Academy of Sciences, 2007. 104(21): p. 8897-8901.
119. Kramer, V.J., S. Miles-Richardson, S.L. Pierens, and J.P. Giesy, Reproductive impairment and induction of alkaline-labile phosphate, a biomarker of estrogen exposure, in fathead minnows (Pimephales promelas) exposed to waterborne 17β-estradiol. Aquatic Toxicology, 1998. 40(4): p. 335-360.
120. Sheahan, S.A., D. Bucke, J.P. Matthiessen, J.P. Sumpter, M.F. Kirby, M. Neall, and M. Waldock, The effects of low level 17-a ethynylestradiol upon plasma vitellogenin levels in male and female rainbow trout. M. R. L. R. (Ed.). Sublethal and Chronic Effects of Pollutants on Freshwater Fish. FAD, Fishing News Books, Oxford, 1994.
121. Routledge, E.J. and J.P. Sumpter, Estrogenic activity of surfactants and some of their degradation products assessed using a recombinant yeast screen. Environmental Toxicology and Chemistry, 1996. 15(3): p. 241-248.
122. Soto, A.M., C. Sonnenschein, K.L. Chung, M.F. Fernandez, N. Olea, and F.O. Serrano, The E-Screen Assay as a Tool to Identify Estrogens - An Update on Estrogenic Environemntal-Pollutants. Environmental Health Perspectives, 1995. 103: p. 113-122.
123. Soto, A.M., K.L. Chung, and C. Sonnenschein, The Pesticides Endosulfan, Toxaphene, and Dieldrin have Estrogenic Effects on Human Estrogen-Sensitive Cells. Environmental Health Perspectives, 1994. 102(4): p. 380-383.
124. Petit, F., Y. Valotaire, and F. Pakdel, Differential Functional Activities of Rainbow-Trout and Human Estrogen-Receptors Expressed in the Yeast Saccharomyces-Cerevisiae. European Journal of Biochemistry, 1995. 233(2): p. 584-592.
125. Kunz, P.Y., H.F. Galicia, and K. Fent, Comparison of in vitro and in vivo estrogenic activity of UV filters in fish. Toxicological Sciences, 2006. 90(2): p. 349-361.
126. Uhlig, S. and P. Gowik, Factorial interlaboratory tests for microbiological measurement methods. Journal für Verbraucherschutz und Lebensmittelsicherheit, 2010. 5(1): p. 35-46.
References
177
127. Hahn, T., K. Tag, K. Riedel, S. Uhlig, K. Baronian, G. Gellissen, and G. Kunze, A novel estrogen sensor based on recombinant Arxula adeninivorans cells. Biosensors and Bioelectronics, 2006. 21(11): p. 2078-2085.
128. Legler, J., van den Brink, C.E., Brouwer, A., Murk, A.J., van der Saag, P.T., Vethaak, A.D., van der Burg, B., Development of a Stably Transfected Estrogen Receptor-Mediated Luciferase Reporter Gene Assay in the Human T47D Breast Cancer Cell Line. Toxicological Science, 1999. 48: p. 55-66.
129. OECD, Test No. 455: Guideline for the testing of chemicals: Stably Transfected Human Estrogen-α Transcriptional Activation Assay for Detection of Estrogenic Agonist-Activity of Chemicals. 2009.
130. Demirpence, E., M.-J. Duchesne, E. Badia, D. Gagne, and M. Pons, MVLN Cells: A bioluminescent MCF-7-derived cell line to study the modulation of estrogenic activity. The Journal of Steroid Biochemistry and Molecular Biology, 1993. 46(3): p. 355-364.
131. Pons, M., D. Gagne, J.C. Nicolas, and M. Mehtali, A new cellular model of response to estrogens: a bioluminescent test to characterize (anti) estrogen molecules. BioTechniques, 1990. 9(4): p. 450-9.
132. Ackermann, G.E., E. Brombacher, and K. Fent, Development of a fish reporter gene system for the assessment of estrogenic compounds and sewage treatment plant effluents. Environmental Toxicology and Chemistry, 2002. 21(9): p. 1864-1875.
133. Gazdar, A.F., H.K. Oie, C.H. Shackleton, T.R. Chen, T.J. Triche, C.E. Myers, G.P. Chrousos, M.F. Brennan, C.A. Stein, and R.V. Larocca, Establishment and Characterization of a Human Adrenocortical Carcinoma Cell-Line That Expresses Multiple Pathways of Steroid-Biosynthesis. Cancer Research, 1990. 50(17): p. 5488-5496.
134. OECD, Test No. 456: Guideline for the testing of chemicals: H295R Steroidogenesis Assay. 2011.
135. Seifert, M., S. Haindl, and B. Hock, Development of an enzyme linked receptor assay (ELRA) for estrogens and xenoestrogens. Analytica Chimica Acta, 1999. 386(3): p. 191-199.
136. Huet, M.-C., OECD Activity on Endocrine Disrupters Test Guidelines Development. Ecotoxicology, 2000. 9: p. 77-84.
137. OECD, Conceptual Framework for the Testing and Assessment of Endocrine Disrupting Chemicals. 2002.
138. Gelbke, H.P., M. Kayser, and A. Poole, OECD test strategies and methods for endocrine disruptors. Toxicology, 2004. 205(1-2): p. 17-25.
139. Puck, T.T., Cieciura, S.J. and Robinson, A., Genetics of somatic mammalian cells. III. Long-term cultivation of euploid cells from human and animal subjects. J Exp Med, 1958. 108(6): p. 945-956.
140. Schmitz, S., Der Experimentator Zellkultur. Spektrum Akademischer Verlag, 2009. 2. Auflage: p. ISBN 978-3-8274-2108-1.
141. Repetto, G., A. del Peso, and J.L. Zurita, Neutral red uptake assay for the estimation of cell viability/cytotoxicity. Nature Protocols, 2008. 3(7): p. 1125-1131.
142. Karp, G., Molekulare Zellbiologie. Springer, 2005. 4. Auflage. 143. Skehan, P., R. Storeng, D. Scudiero, A. Monks, J. McMahon, D. Vistica, J.T.
Warren, H. Bokesch, S. Kenney, and M.R. Boyd, New Colorimetric Cytotoxicity Assay for Anticancer-Drug Screening. Journal of the National Cancer Institute, 1990. 82(13): p. 1107-1112.

References
178
144. Mosmann, T., Rapid colorimetric assay for cellular growth and survival: Application to proliferation and cytotoxicity assays. Journal of Immunological Methods, 1983. 65(1-2): p. 55-63.
145. Gareis, M., Diagnostischer Zellkulturtest (MTT-Test) für den Nachweis von zytotoxischen Kontaminanten und Rückständen. Journal für Verbraucherschutz und Lebensmittelsicherheit, 2006. 1(4): p. 354-363.
146. DIN EN ISO 10993-5: Biologische Beurteilung von Medizinprodukten - Teil 5: Prüfungen auf In-vitro-Zytotoxizität 2009.
147. Olive, P.L., J.P. Banáth, and R.E. Durand, Heterogeneity in Radiation-Induced DNA Damage and Repair in Tumor and Normal Cells Measured Using the "Comet" Assay. Radiation Research, 1990. 122(1): p. 86-94.
148. Ames, B.N., J. McCann, and E. Yamasaki, Methods for detecting carcinogens and mutagens with the salmonella/mammalian-microsome mutagenicity test. Mutation Research/Environmental Mutagenesis and Related Subjects, 1975. 31(6): p. 347-363.
149. Mortelmans, K. and E. Zeiger, The Ames Salmonella/microsome mutagenicity assay. Mutation Research/Fundamental and Molecular Mechanisms of Mutagenesis, 2000. 455(1-2): p. 29-60.
150. BUND, Hormonaktive Substanzen im Wasser - Gefahr für Gewässer und Mensch. BUNDhintergrund, 2001.
151. Abschlussbericht für das IGF-Forschungsvorhaben 15862 N: "Untersuchungen zur Bewertung und Vermeidung von toxischen Oxidationsnebenprodukten bei der oxidativen Abwasserbehandlung" 2011.
152. Otto, M., Analytische Chemie. Wiley-VCH, 2000. 2. Edition: p. ISBN 3-527-29840-1.
153. Lexikon der Biochemie in zwei Teilen. ELSEVIER Spektrum Akademischer Verlag, 2000. ISBN: 3-8274-1580-2.
154. Sanderson, J.E., S.K.W. Chan, G. Yip, L.Y.C. Yeung, K.W. Chan, K. Raymond, and K.S. Woo, Beta-blockade in heart failure - A comparison of carvedilol with metoprolol. Journal of the American College of Cardiology, 1999. 34(5): p. 1522-1528.
155. Aktories, K., Förtstermann, U., Hofmann, F.B., Starke, K., Allgemeine und spezielle Pharmakologie und Toxikologie. ELSEVIER Urban & Fischer, 2005. 9. Edition: p. ISBN: 978-3-437-44490-6.
156. Swedenborg, E., J. Ruegg, S. Makela, and I. Pongratz, Endocrine disruptive chemicals: mechanisms of action and involvement in metabolic disorders. Journal of Molecular Endocrinology, 2009. 43(1-2): p. 1-10.
157. Casals-Casas, C. and B. Desvergne, Endocrine disruptors: from endocrine to metabolic disruption. Annu Rev Physiol, 2011. 73: p. 135-62.
158. Van der Linden, S.C., M.B. Heringa, H.Y. Man, E. Sonneveld, L.M. Puijker, A. Brouwer, and B. Van der Burg, Detection of multiple hormonal activities in wastewater effluents and surface water, using a panel of steroid receptor CALUX bioassays. Environmental Science & Technology, 2008. 42(15): p. 5814-5820.
159. EHSC, Note on: WHY DO WE WORRY ABOUT BISPHENOL-A. http://www.rsc.org/images/bisphenol-a_tcm18-217036.pdf, 2012.
160. Burgis, E., Intensivkurs Allgemeine und spezielle Pharmakologie ELSEVIER Urban & Fischer, 2008. 4. Auflage.
161. Kuse, M., Sandner F., BASICS Allgemeine Pharmakologie. ELSEVIER Urban & Fischer, 2009. 1. Auflage.
References
179
162. Fleming, A., On the specific antibacterial properties of penicillin and potassium tellurite - Incorporating a method of demonstrating some bacterial antiagonisms. Journal of Pathology and Bacteriology, 1932. 35(6): p. 831-842.
163. GERMAP 2010 - Antibiotika-Resistenz und -Verbrauch. Bundesamt für Verbaucherschutz und Lebensmittelsicherheit, 2011. ISBN: 978-3-00-031622-7(1. Auflage).
164. PubChem, Sulfamethoxazole - Compound Summary http://pubchem.ncbi.nlm.nih.gov/summary/summary.cgi?sid=602530&viewopt=PubChem&ncount=15#x94.
165. Power, E.G. and I. Phillips, Induction of the SOS gene (umuC) by 4-quinolone antibacterial drugs. J Med Microbiol, 1992. 36(2): p. 78-82.
166. Mamber, S.W., B. Kolek, K.W. Brookshire, D.P. Bonner, and J. Fung-Tomc, Activity of quinolones in the Ames Salmonella TA102 mutagenicity test and other bacterial genotoxicity assays. Antimicrobial Agents and Chemotherapy, 1993. 37(2): p. 213-217.
167. Hartmann, A., E.M. Golet, S. Gartiser, A.C. Alder, T. Koller, and R.M. Widmer, Primary DNA damage but not mutagenicity correlates with ciprofloxacin concentrations in German hospital wastewaters. Archives of Environmental Contamination and Toxicology, 1999. 36(2): p. 115-119.
168. Prival, M.J. and E. Zeiger, Chemicals mutagenic in Salmonella typhimurium strain TA1535 but not in TA100. Mutation Research-Genetic Toxicology and Environmental Mutagenesis, 1998. 412(3): p. 251-260.
169. Oliphant, C.M., Green, G.M., Quinolones: a comprehensive review. American Family Physician, 2002. 65(3): p. 455-465.
170. Adolfsson-Erici, M., M. Pettersson, J. Parkkonen, and J. Sturve, Triclosan, a commonly used bactericide found in human milk and in the aquatic environment in Sweden. Chemosphere, 2002. 46(9-10): p. 1485-1489.
171. Dann, A.B. and A. Hontela, Triclosan: environmental exposure, toxicity and mechanisms of action. Journal of Applied Toxicology, 2011. 31(4): p. 285-311.
172. Bester, K., Fate of triclosan and triclosan-methyl in sewage treatment plants and surface waters. Archives of Environmental Contamination and Toxicology, 2005. 49(1): p. 9-17.
173. Chen, X., J. Richard, Y. Liu, E. Dopp, J. Tuerk, and K. Bester, Ozonation products of triclosan in advanced wastewater treatment. Water Research, 2012. 46(7): p. 2247-2256.
174. EU, Richtlinie 98/8/EG des Europäischen Parlaments und des Rates vom 16. Februar 1998 über das Inverkehrbringen von Biozid-Produkten. 1998.
175. Projekt SEA - Stoffdatenblatt Irgarol 1051. http://www.sea.eawag.ch/inhalt/sites/stoffe/pdf/Biozide_d.pdf.
176. Moretti, M., M. Marcarelli, M. Villarini, C. Fatigoni, G. Scassellati-Sforzolini, and R. Pasquini, In vitro testing for genotoxicity of the herbicide terbutryn: cytogenetic and primary DNA damage. Toxicology in Vitro, 2002. 16(1): p. 81-88.
177. Broser, M., C. Gloeckner, A. Gabdulkhakov, A. Guskov, J. Buchta, J. Kern, F. Mueh, H. Dau, W. Saenger, and A. Zouni, Structural basis of cyanobacterial photosystem II inhibition by the herbicide terbutryn. Journal of Biological Chemistry, 2011.
178. Nilson, E.L. and R.F. Unz, Antialgal substances for iodine-disinfected swimming pools. Applied and Environmental Microbiology, 1977. 34(6): p. 815-822.

References
180
179. HERA, Polycyclic musks AHTN (CAS 1506-02-1) and HHCB (CAS 1222-05-05). 2004.
180. ECHA, Candidate List of Substances of Very High Concern for Authorisation. http://echa.europa.eu/web/guest/candidate-list-table, 2011.
181. Rimkus, G.G., Synthetic musk fragrances as a new class of environmental pollutants. Symposia Papers presented before the Division of Environmental Chemistry, Americal Chemical Society, 1999.
182. Uhl, M., Hutter, H.P. Lorbeer, G., Polymuschusverbindungen in Humanblut II: Humanbiomonitoring von Moschusduftstoffen. Final Report for the Austrian Ministry of Health 2005.
183. Kupper, T., C. Plagellat, R.C. Braendli, L.F. de Alencastro, D. Grandjean, and J. Tarradellas, Fate and removal of polycyclic musks, UV filters and biocides during wastewater treatment. Water Research, 2006. 40(14): p. 2603-2612.
184. Simonich, S.L., T.W. Federle, W.S. Eckhoff, A. Rottiers, S. Webb, D. Sabaliunas, and W. De Wolf, Removal of fragrance materials during US and European wastewater treatment. Environmental Science & Technology, 2002. 36(13): p. 2839-2847.
185. EC, SCHER, scientific opinion on the risk assessment report on 1-(5,6,7,8-tetrahydro-3.5.56.8.8-hexamethyl-2-naphtyl)ethan-1-one (AHTN), human health part, 20 September 2007. 2007.
186. Janzen, N., E. Dopp, J. Hesse, J. Richards, J. Türk, and K. Bester, Transformation products and reaction kinetics of fragrances in advanced wastewater treatment with ozone. Chemosphere, 2011. 85(9): p. 1481-1486.
187. Sagunski, H. and E. Roßkamp, Richtwerte üfr die Innenraumluft: Tris(2-chloroethyl)phosphat. Budensgesundheitsbl - Gesundheitsforsch - Gesundheitsschutz, 2002. 45: p. 300-306.
188. Raut, S.A. and R.A. Angus, Triclosan has Endocrine-Disrupting Effects in Male Western Mosquitofish, Gambusia affinis. Environmental Toxicology and Chemistry, 2010. 29(6): p. 1287-1291.
189. Sumpter, J.P., Endocrine disrupters in the aquatic environment: An overview. Acta Hydrochimica Et Hydrobiologica, 2005. 33(1): p. 9-16.
190. Johnson, A. and M. Jurgens, Endocrine active industrial chemicals: Release and occurrence in the environment. Pure and Applied Chemistry, 2003. 75(11-12): p. 1895-1904.
191. Crisp, T.M., Clegg, E.D., Coper, R.L., Anderson, D.G., Baetcke, K.P., Hoffmann, J.L., Morrow, M.S., Rodier, D.J., Schaeffer, J.E., Touart, L.W., Zeeman, M.G., Patel, Y.M., Wood, W.P., Special Report on Environmental Endocrine Disruption: An Effects Assessment and Analysis. EPA/630/R-96/012, 1997.
192. Lintelmann, J., A. Katayama, N. Kurihara, L. Shore, and A. Wenzel, Endocrine disruptors in the environment - (IUPAC Technical Report). Pure and Applied Chemistry, 2003. 75(5): p. 631-681.
193. BKH, European Commission DG ENV. Towards the establishment of a priority list of substances for further evaluation of their role in endocrine disruption - preparation of a candidate list of substances as a basis for priority setting. Final Report. BKH Consulting Engineers , Delft, The Netherlands in association woth TNO nutrition and Food Research, Zeist, The Netherlands. 2000.
194. Jobling, S., R. Williams, A. Johnson, A. Taylor, M. Gross-Sorokin, M. Nolan, C.R. Tyler, R. van Aerle, E. Santos, and G. Brighty, Predicted exposures to

References
181
steroid estrogens in UK rivers correlate with widespread sexual disruption in wild fish populations. Environmental Health Perspectives, 2006. 114: p. 32-39.
195. Jobling, S., M. Nolan, C.R. Tyler, G. Brighty, and J.P. Sumpter, Widespread sexual disruption in wild fish. Environmental Science & Technology, 1998. 32(17): p. 2498-2506.
196. Guillette, L.J., D.A. Crain, M.P. Gunderson, S.A.E. Kools, M.R. Milnes, E.F. Orlando, A.A. Rooney, and A.R. Woodward, Alligators and endocrine disrupting contaminants: A current perspective. American Zoologist, 2000. 40(3): p. 438-452.
197. Liney, K.E., J.A. Hagger, C.R. Tyler, M.H. Depledge, T.S. Galloway, and S. Jobling, Health effects in fish of long-term exposure to effluents from wastewater treatment works. Environmental Health Perspectives, 2006. 114: p. 81-89.
198. Giesy, J.P., L.A. Feyk, P.D. Jones, K. Kannan, and T. Sanderson, Review of the effects of endocrine-disrupting chemicals in birds. Pure and Applied Chemistry, 2003. 75(11-12): p. 2287-2303.
199. Newbold, R.R., E. Padilla-Banks, W.N. Jefferson, and J.J. Heindel, Effects of endocrine disruptors on obesity. International Journal of Andrology, 2008. 31(2): p. 201-207.
200. Newbold, R.R., E. Padilla-Banks, R.J. Snyder, and W.N. Jefferson, Perinatal exposure to environmental estrogens and the development of obesity. Molecular Nutrition & Food Research, 2007. 51(7): p. 912-917.
201. Davis, D.L., H.L. Bradlow, M. Wolff, T. Woodruff, D.G. Hoel, and H. Antonculver, Medical Hypothesis - Xenoestrogens as Preventable Causes of Breast-Cancer. Environmental Health Perspectives, 1993. 101(5): p. 372-377.
202. Donna, A., P.G. Betta, F. Robutti, P. Crosignani, F. Berrino, and D. Bellingeri, Ovarian Mesothelial Tumors and Herbicieds - A Case-Control Study. Carcinogenesis, 1984. 5(7): p. 941-942.
203. Donna, A., CORRECTION. Carcinogenesis, 1984. 5(10): p. 1380-1380. 204. Carpenter, D.O., Human health effects of environmental pollutants: New
insights. Environmental Monitoring and Assessment, 1998. 53(1): p. 245-258. 205. Melnick, R., G. Lucier, M. Wolfe, R. Hall, G. Stancel, G. Prins, M. Gallo, K.
Reuhl, S.M. Ho, T. Brown, J. Moore, J. Leakey, J. Haseman, and M. Kohn, Summary of the National Toxicology Program's report of the endocrine disruptors low-dose peer review. Environ Health Perspect, 2002. 110(4): p. 427-31.
206. Vandenberg, L.N., T. Colborn, T.B. Hayes, J.J. Heindel, D.R. Jacobs, D.H. Lee, T. Shioda, A.M. Soto, F.S. vom Saal, W.V. Welshons, R.T. Zoeller, and J.P. Myers, Hormones and Endocrine-Disrupting Chemicals: Low-Dose Effects and Nonmonotonic Dose Responses. Endocrine Reviews, 2012. 33(3): p. 378-455.
207. Andersen, H.R., A.M. Vinggaard, T.H. Rasmussen, I.M. Gjermandsen, and E.C. Bonefeld-Jorgensen, Effects of currently used pesticides in assays for estrogenicity, androgenicity, and aromatase activity in vitro. Toxicology and Applied Pharmacology, 2002. 179(1): p. 1-12.
208. Kinnberg, K., Evaluation of in vitro assays for determination of estrogenic activity in the environment. Working Report No. 43, Danish Environmental Protection Agency, 2003.
209. Shelby, M.D., R.R. Newbold, D.B. Tully, K. Chae, and V.L. Davis, Assessing environmental chemicals for estrogenicity using a combination of in vitro and
References
182
in vivo assays. Environmental Health Perspectives, 1996. 104(12): p. 1296-1300.
210. Shanle, E.K. and W. Xu, Endocrine Disrupting Chemicals Targeting Estrogen Receptor Signaling: Identification and Mechanisms of Action. Chemical Research in Toxicology, 2011. 24(1): p. 6-19.
211. Giger, W., Alder, A.C., Golet, E. M., Kohler, H.-P.E., McArdell, C. S., Molnar, E., Siegrist, H., Suter, M.J.F., Occurrence and Fate of Antibiotics as Trace Contaminants in Wastewaters, Sewage Sludges, and Surface Waters CHIMIA International Journal for Chemistry, 2003. 9(9): p. 485-491.
212. BMG, Budesministerium für Gesundheit: DART German Antimicrobial Resistance Strategy. http://www.bmelv.de/SharedDocs/Downloads/EN/Agriculture/GermanAntimicrobialResistanceStrategy.pdf?__blob=publicationFile, 2008.
213. WHO, World Health Organization, Department of essential drugs and medicines policy: WHO Workshop on containment of antimicrobial resistance in Europe, 26–27 February 2004 in Wernigerode, Germany. Bundesgesundheitsbl - Gesundheitsforsch - Gesundheitsschutz, 2005. 48: p. 221-131.
214. Jevons, M.P., G.N. Rolinson, and R. Knox, CELBENIN-RESISTANT STAPHYLOCOCCI. British Medical Journal, 1961. 1(521): p. 124-&.
215. Livermore, D.M., Antibiotic resistance in staphylococci. International Journal of Antimicrobial Agents, 2000. 16: p. S3-S10.
216. Madigan, M.T., J.M. Martinko, and J. Parker, Brock Mikrobiologie, ed. G. W.2002, Berlin: Spektrum Akademischer Verlag Heidelberg Berlin.
217. Dodd, M.C., H.-P.E. Kohler, and U. Von Gunten, Oxidation of Antibacterial Compounds by Ozone and Hydroxyl Radical: Elimination of Biological Activity during Aqueous Ozonation Processes. Environmental Science & Technology, 2009. 43(7): p. 2498-2504.
218. vom Eyser, C., Degradation of Fluoroquinolones Ofloxacin and Ciprofloxacin via Ozonation and UV-Oxidation. Master Thesis, 2011.
219. Altenburger, R., T. Backhaus, W. Boedeker, M. Faust, M. Scholze, and L.H. Grimme, Predictability of the toxicity of multiple chemical mixtures to Vibrio fischeri: Mixtures composed of similarly acting chemicals. Environmental Toxicology and Chemistry, 2000. 19(9): p. 2341-2347.
220. Porsbring, T., T. Backhaus, P. Johansson, M. Kuylenstierna, and H. Blanck, Mixture Toxicity from Photosystem II Inhibitors on Microalgal Community Succession is Predictable by Concentration Addition. Environmental Toxicology and Chemistry, 2010. 29(12): p. 2806-2813.
221. Lin, K., Joint acute toxicity of tributyl phosphate and triphenyl phosphate to Daphnia magna. Environmental Chemistry Letters, 2009. 7(4): p. 309-312.
222. Chevre, N., C. Loeppe, H. Singer, C. Stamm, K. Fenner, and B.I. Escher, Including mixtures in the determination of water quality criteria for herbicides in surface water. Environmental Science & Technology, 2006. 40(2): p. 426-435.
223. Brian, J.V., C.A. Harris, M. Scholze, T. Backhaus, P. Booy, M. Lamoree, G. Pojana, N. Jonkers, T. Runnalls, A. Bonfa, A. Marcomini, and J.P. Sumpter, Accurate prediction of the response of freshwater fish to a mixture of estrogenic chemicals. Environmental Health Perspectives, 2005. 113(6): p. 721-728.
References
183
224. Altenburger, R., H. Walter, and M. Grote, What contributes to the combined effect of a complex mixture? Environmental Science & Technology, 2004. 38(23): p. 6353-6362.
225. Escher, B.I. and J.L.M. Hermens, Modes of action in ecotoxicology: Their role in body burdens, species sensitivity, QSARs, and mixture effects. Environmental Science & Technology, 2002. 36(20): p. 4201-4217.
226. Kortenkamp, A. and R. Altenburger, Approaches to assessing combination effects of oestrogenic environmental pollutants. Science of the Total Environment, 1999. 233(1-3): p. 131-140.
227. Hernando, M.D., M. Ejerhoon, A.R. Fernandez-Alba, and Y. Chisti, Combined toxicity effects of MTBE and pesticides measured with Vibrio fischeri and Daphnia magna bioassays. Water Research, 2003. 37(17): p. 4091-4098.
228. Fernandez-Alba, A.R., M.D. Hernando, L. Piedra, and Y. Chisti, Toxicity evaluation of single and mixed antifouling biocides measured with acute toxicity bioassays. Analytica Chimica Acta, 2002. 456(2): p. 303-312.
229. Dourson, M.L. and J.F. Stara, Regulatory history and experimental support of uncertainty (safety) factors. Regulatory Toxicology and Pharmacology, 1983. 3(3): p. 224-238.
230. Fairhurst, S., The Uncertainty Factor in the Setting of Occupational Exposure Standards. Annals of Occupational Hygiene, 1995. 39(3): p. 375-385.
231. Xiong, J., Essential Bioinformatics2007, New York: Cambridge University Press.
232. Escher, B.I., N. Bramaz, R.I.L. Eggen, and M. Richter, In vitro assessment of modes of toxic action of pharmaceuticals in aquatic life. Environmental Science & Technology, 2005. 39(9): p. 3090-3100.
233. Escher, B.I., W. Pronk, M.J.F. Suter, and M. Maurer, Monitoring the removal efficiency of pharmaceuticals and hormones in different treatment processes of source-separated urine with bioassays. Environmental Science & Technology, 2006. 40(16): p. 5095-5101.
234. Brack, W., Effect-directed analysis: a promising tool for the identification of organic toxicants in complex mixtures? Analytical and Bioanalytical Chemistry, 2003. 377(3): p. 397-407.
235. Hecker, M. and H. Hollert, Effect-directed analysis (EDA) in aquatic ecotoxicology: state of the art and future challenges. Environmental Science and Pollution Research, 2009. 16(6): p. 607-613.
236. Ankley, G.T., R.S. Bennett, R.J. Erickson, D.J. Hoff, M.W. Hornung, R.D. Johnson, D.R. Mount, J.W. Nichols, C.L. Russom, P.K. Schmieder, J.A. Serrrano, J.E. Tietge, and D.L. Villeneuve, Adverse Outcome Pathways: A Conceptual Framework to Support Ecotoxicological Research and Risk Assessment. Environmental Toxicology and Chemistry, 2010. 29(3): p. 730-741.
237. Escher, B., Jose Farre, M., Neale, P., Risk-oriented screening of disinfection by-products. Water21, 2012(August 2012).
238. Stasinakis, A.S., G. Gatidou, D. Mamais, N.S. Thomaidis, and T.D. Lekkas, Occurrence and fate of endocrine disrupters in Greek sewage treatment plants. Water Research, 2008. 42(6-7): p. 1796-1804.
239. Joss, A., H. Siegrist, and T.A. Ternes, Are we about to upgrade wastewater treatment for removing organic micropollutants? Water Science and Technology, 2008. 57(2): p. 251-255.
References
184
240. Stalter, D., A. Magdeburg, M. Wagner, and J. Oehlmann, Ozonation and activated carbon treatment of sewage effluents: Removal of endocrine activity and cytotoxicity. Water Research, 2011. 45(3): p. 1015-1024.
241. Guzzella, L., D. Feretti, and S. Monarca, Advanced oxidation and adsorption technologies for organic micropollutant removal from lake water used as drinking-water supply. Water Research, 2002. 36(17): p. 4307-4318.
242. Hernando, M.D., S. Vettori, M.J.M. Bueno, and A.R. Fernandez-Alba, Toxicity evaluation with Vibrio fischeri test of organic chemicals used in aquaculture. Chemosphere, 2007. 68(4): p. 724-730.
243. Farre, M. and D. Barcelo, Toxicity testing of wastewater and sewage sludge by biosensors, bioassays and chemical analysis. Trac-Trends in Analytical Chemistry, 2003. 22(5): p. 299-310.
244. Schrank, S.G., U. Bieling, H.J. Jose, R. Moreira, and H.F. Schroder, Generation of endocrine disruptor compounds during ozone treatment of tannery wastewater confirmed by biological effect analysis and substance specific analysis. Water Science and Technology, 2009. 59(1): p. 31-38.
245. Dirany, A., S.E. Aaron, N. Oturan, I. Sires, M.A. Oturan, and J.J. Aaron, Study of the toxicity of sulfamethoxazole and its degradation products in water by a bioluminescence method during application of the electro-Fenton treatment. Analytical and Bioanalytical Chemistry, 2011. 400(2): p. 353-360.
246. Trovo, A.G., R.F.P. Nogueira, A. Aguera, A.R. Fernandez-Alba, and S. Malato, Degradation of the antibiotic amoxicillin by photo-Fenton process - Chemical and toxicological assessment. Water Research, 2011. 45(3): p. 1394-1402.
247. Desbrow, C., E.J. Routledge, G.C. Brighty, J.P. Sumpter, and M. Waldock, Identification of estrogenic chemicals in STW effluent. 1. Chemical fractionation and in vitro biological screening. Environmental Science & Technology, 1998. 32(11): p. 1549-1558.
248. Erger, C., P. Balsaa, F. Werres, and T.C. Schmidt, Occurrence of residual water within disk-based solid-phase extraction and its effect on GC-MS measurement of organic extracts of environmental samples. Analytical and Bioanalytical Chemistry, 2012. 403(9): p. 2541-2552.
249. Zabiegala, B., A. Kot-Wasik, M. Urbanowicz, and J. Namiesnik, Passive sampling as a tool for obtaining reliable analytical information in environmental quality monitoring. Analytical and Bioanalytical Chemistry, 2010. 396(1): p. 273-296.
250. Gorecki, T. and J. Namiesnik, Passive sampling. Trac-Trends in Analytical Chemistry, 2002. 21(4): p. 276-291.
251. Seethapathy, S., T. Gorecki, and X.J. Li, Passive sampling in environmental analysis. Journal of Chromatography A, 2008. 1184(1-2): p. 234-253.
252. Chen, C.E., H. Zhang, and K.C. Jones, A novel passive water sampler for in situ sampling of antibiotics. Journal of Environmental Monitoring, 2012. 14(6): p. 1523-1530.
253. Vystavna, Y., F. Huneau, V. Grynenko, Y. Vergeles, H. Celle-Jeanton, N. Tapie, H. Budzinski, and P. Le Coustumer, Pharmaceuticals in Rivers of Two Regions with Contrasted Socio-Economic Conditions: Occurrence, Accumulation, and Comparison for Ukraine and France. Water Air and Soil Pollution, 2012. 223(5): p. 2111-2124.
254. Cernoch, I., M. Franek, I. Diblikova, K. Hilscherova, T. Randak, T. Ocelka, and L. Blaha, POCIS sampling in combination with ELISA: Screening of
References
185
sulfonamide residues in surface and waste waters. Journal of Environmental Monitoring, 2012. 14(1): p. 250-257.
255. Vermeirssen, E.L.M., O. Korner, R. Schonenberger, M.J.F. Suter, and P. Burkhardt-Holm, Characterization of environmental estrogens in river water using a three pronged approach: Active and passive water sampling and the analysis of accumulated estrogens in the bile of caged fish. Environmental Science & Technology, 2005. 39(21): p. 8191-8198.
256. Lacey, C., S. Basha, A. Morrissey, and J.M. Tobin, Occurrence of pharmaceutical compounds in wastewater process streams in Dublin, Ireland. Environmental Monitoring and Assessment, 2012. 184(2): p. 1049-1062.
257. Fraysse, B. and J. Garric, Prediction and experimental validation of acute toxicity of beta-blockers in Ceriodaphnia dubia. Environmental Toxicology and Chemistry, 2005. 24(10): p. 2470-2476.
258. Cheong, H.I., J. Johnson, M. Cormier, and K. Hosseini, In vitro cytotoxicity of eight beta-blockers in human corneal epithelial and retinal pigment epithelial cell lines: Comparison with epidermal keratinocytes and dermal fibroblasts. Toxicology in Vitro, 2008. 22(4): p. 1070-1076.
259. Telez, M., B. Martinez, B. Criado, C.M. Lostao, O. Penagarikano, B. Ortega, P. Flores, E. Ortiz-Lastra, R.M. Alonso, R.M. Jimenez, and I. Arrieta, In vitro and in vivo evaluation of the antihypertensive drug atenolol in cultured human lymphocytes: effects of long-term therapy. Mutagenesis, 2000. 15(3): p. 195-202.
260. Parolini, M., B. Quinn, A. Binelli, and A. Provini, Cytotoxicity assessment of four pharmaceutical compounds on the zebra mussel (Dreissena polymorpha) haemocytes, gill and digestive gland primary cell cultures. Chemosphere, 2011. 84(1): p. 91-100.
261. Ioannou, L.A., E. Hapeshi, M.I. Vasquez, D. Mantzavinos, and D. Fatta-Kassinos, Solar/TiO(2) photocatalytic decomposition of beta-blockers atenolol and propranolol in water and wastewater. Solar Energy, 2011. 85(9): p. 1915-1926.
262. Huggett, D.B., B.W. Brooks, B. Peterson, C.M. Foran, and D. Schlenk, Toxicity of select beta adrenergic receptor-blocking pharmaceuticals (B-blockers) on aquatic organisms. Archives of Environmental Contamination and Toxicology, 2002. 43(2): p. 229-235.
263. van den Brandhof, E.J. and M. Montforts, Fish embryo toxicity of carbamazepine, diclofenac and metoprolol. Ecotoxicology and Environmental Safety, 2010. 73(8): p. 1862-1866.
264. Hernando, M.D., M. Petrovic, A.R. Fernandez-Alba, and D. Barcelo, Analysis by liquid chromatography-electro spray ionization tandem mass spectrometry and acute toxicity evaluation for beta-blockers and lipid-regulating agents in wastewater samples. Journal of Chromatography A, 2004. 1046(1-2): p. 133-140.
265. Dzialowski, E.M., P.K. Turner, and B.W. Brooks, Physiological and reproductive effects of beta adrenergic receptor antagonists in Daphnia magna. Archives of Environmental Contamination and Toxicology, 2006. 50(4): p. 503-510.
266. Maurer, M., B.I. Escher, P. Richle, C. Schaffner, and A.C. Alder, Elimination of beta-blockers in sewage treatment plants. Water Research, 2007. 41(7): p. 1614-1622.

References
186
267. Benner, J. and T.A. Ternes, Ozonation of Metoprolol: Elucidation of Oxidation Pathways and Major Oxidation Products. Environmental Science & Technology, 2009. 43(14): p. 5472-5480.
268. Vethaak, A.D., J. Lahr, S.M. Schrap, A.C. Belfroid, G.B.J. Rijs, A. Gerritsen, J. de Boer, A.S. Bulder, G.C.M. Grinwis, R.V. Kuiper, J. Legler, T.A.J. Murk, W. Peijnenburg, H.J.M. Verhaar, and P. de Voogt, An integrated assessment of estrogenic contamination and biological effects in the aquatic environment of The Netherlands. Chemosphere, 2005. 59(4): p. 511-524.
269. Dussault, E.B., V.K. Balakrishnan, K.R. Solomon, and P.K. Sibley, Chronic Toxicity of the Synthetic Hormone 17 alpha-Ethinylestradiol to Chironomus tentans and Hyalella azteca. Environmental Toxicology and Chemistry, 2008. 27(12): p. 2521-2529.
270. Murk, A.J., J. Legler, M.M.H. van Lipzig, J.H.N. Meerman, A.C. Belfroid, A. Spenkelink, B. van der Burg, G.B.J. Rijs, and D. Vethaak, Detection of estrogenic potency in wastewater and surface water with three in vitro bioassays. Environmental Toxicology and Chemistry, 2002. 21(1): p. 16-23.
271. Lang, R. and R. Reimann, Studies for a Genotoxicity Potential of Some Endogenous and Exogebous Sex Steroids. 1. Communication - Examination for the Induction of Gene-Mutations Using the Ames Salmonella Microsome Test and the HGPRT Test in V79 Cells. Environmental and Molecular Mutagenesis, 1993. 21(3): p. 272-304.
272. Reimann, R., S. Kalweit, and R. Lang, Studies for a genotoxic potential of some endogenous and exogenous sex steroids .2. Communication: Examination for the induction of cytogenetic damage using the chromosomal aberration assay on human lymphocytes in vitro and the mouse bone marrow micronucleus test in vivo. Environmental and Molecular Mutagenesis, 1996. 28(2): p. 133-144.
273. Siddique, Y.H., T. Beg, and M. Afzal, Genotoxic potential of ethinylestradiol in cultured mammalian cells. Chemico-Biological Interactions, 2005. 151(2): p. 133-141.
274. Hashimoto, S., E. Watanabe, M. Ikeda, Y. Terao, C.A. Struessmann, M. Inoue, and A. Hara, Effects of Ethinylestradiol on Medaka (Oryzias latipes) as Measured by Sperm Motility and Fertilization Success. Archives of Environmental Contamination and Toxicology, 2009. 56(2): p. 253-259.
275. Salierno, J.D. and A.S. Kane, 17 alpha-Ethinylestradiol Alters Reproductive Behaviors, Circulating Hormones, and Sexual Morphology in Male Fathead Minnows (Pimephales promelas). Environmental Toxicology and Chemistry, 2009. 28(5): p. 953-961.
276. Caldwell, D.J., F. Mastrocco, T.H. Hutchinson, R. Lange, D. Heijerick, C. Janssen, P.D. Anderson, and J.P. Sumpter, Derivation of an aquatic predicted no-effect concentration for the synthetic hormone, 17 alpha-ethinyl estradiol. Environmental Science & Technology, 2008. 42(19): p. 7046-7054.
277. Commission, E., Commission Directive 2011/8/EU of 28 January 2011 amending Directive 2002/72/EC as regards the restriction of use of Bisphenol A in plastic infant feeding bottles. 2011.
278. Metcalfe, C.D., T.L. Metcalfe, Y. Kiparissis, B.G. Koenig, C. Khan, R.J. Hughes, T.R. Croley, R.E. March, and T. Potter, Estrogenic potency of chemicals detected in sewage treatment plant effluents as determined by in vivo assays with Japanese medaka (Oryzias latipes). Environmental Toxicology and Chemistry, 2001. 20(2): p. 297-308.

References
187
279. Wu, M.H., H. Xu, M. Yang, and G. Xu, Effects of chronic bisphenol A exposure on hepatic antioxidant parameters in medaka (Oryzias latipes). Toxicological and Environmental Chemistry, 2011. 93(2): p. 270-278.
280. Zhang, H., F.X. Kong, Y. Yu, X.L. Shi, M. Zhang, and H.E. Tian, Assessing the combination effects of environmental estrogens in fish. Ecotoxicology, 2010. 19(8): p. 1476-1486.
281. Golub, M.S., K.L. Wu, F.L. Kaufman, L.H. Li, F. Moran-Messen, L. Zeise, G.V. Alexeeff, and J.M. Donald, Bisphenol A: Developmental Toxicity from Early Prenatal Exposure. Birth Defects Research Part B-Developmental and Reproductive Toxicology, 2010. 89(6): p. 441-466.
282. ECHA, Community Rolling Action Plan (CoRAP). 2012. 283. ECHA, http://apps.echa.europa.eu/registered/data/dossiers/DISS-9dbe071c-
c12d-0fe1-e044-00144f67d249/DISS-9dbe071c-c12d-0fe1-e044-00144f67d249_DISS-9dbe071c-c12d-0fe1-e044-00144f67d249.html. Bisphenol A.
284. Sotelo, J.L., F.J. Beltran, F.J. Benitez, and J. Beltranheredia, HENRYS LAW CONSTANT FOR THE OZONE WATER-SYSTEM. Water Research, 1989. 23(10): p. 1239-1246.
285. Ternes, T., Assessment of Technologies for the Removal of Pharmaceuticals and Personal Care Products in Sewage and Drinking Water Facilities to Improve the Indirect Potable Water Reuse. Final Report POSEIDON Project, 2006.
286. Abellan, M.N., W. Gebhardt, and H.F. Schroder, Detection and identification of degradation products of sulfamethoxazole by means of LC/MS and -MSn after ozone treatment. Water Science and Technology, 2008. 58(9): p. 1803-1812.
287. Lam, M.W. and S.A. Mabury, Photodegradation of the pharmaceuticals atorvastatin, carbamazepine, levofloxacin, and sulfamethoxazole in natural waters. Aquatic Sciences, 2005. 67(2): p. 177-188.
288. Yargeau, V., J.C. Huot, A. Rodayan, L. Rouleau, R. Roy, and R.L. Leask, Impact of degradation products of sulfamethoxazole on mammalian cultured cells. Environmental Toxicology, 2008. 23(4): p. 492-498.
289. Baran, W., J. Sochacka, and W. Wardas, Toxicity and biodegradability of sulfonamides and products of their photocatalytic degradation in aqueous solutions. Chemosphere, 2006. 65(8): p. 1295-1299.
290. del Mar Gomez-Ramos, M., M. Mezcua, A. Agueera, A.R. Fernandez-Alba, S. Gonzalo, A. Rodriguez, and R. Rosal, Chemical and toxicological evolution of the antibiotic sulfamethoxazole under ozone treatment in water solution. Journal of Hazardous Materials, 2011. 192(1): p. 18-25.
291. Dantas, R.F., S. Contreras, C. Sans, and S. Esplugas, Sulfamethoxazole abatement by means of ozonation. Journal of Hazardous Materials, 2008. 150(3): p. 790-794.
292. Escher, B.I., N. Bramaz, M. Maurer, M. Richter, D. Sutter, C. von Kanel, and M. Zschokke, Screening test battery for pharmaceuticals in urine and wastewater. Environmental Toxicology and Chemistry, 2005. 24(3): p. 750-758.
293. Hartmann, A., A.C. Alder, T. Koller, and R.M. Widmer, Identification of fluoroquinolone antibiotics as the main source of umuC genotoxicity in native hospital wastewater. Environmental Toxicology and Chemistry, 1998. 17(3): p. 377-382.
References
188
294. Gurbay, A., M. Osman, A. Favier, and F. Hincal, Ciprofloxacin-induced cytotoxicity and apoptosis in HeLa cells. Toxicology Mechanisms and Methods, 2005. 15(5): p. 339-342.
295. Sousa, M.C. and J. Poiares-da-Silva, The cytotoxic effects of ciprofloxacin in Giardia lamblia trophozoites. Toxicology in Vitro, 2001. 15(4-5): p. 297-301.
296. Clerch, B., J.M. Bravo, and M. Llagostera, Analysis of the ciprofloxacin-induced mutations in Salmonella typhimurium. Environmental and Molecular Mutagenesis, 1996. 27(2): p. 110-115.
297. Ferrari, B., R. Mons, B. Vollat, B. Fraysse, N. Paxeus, R. Lo Giudice, A. Pollio, and J. Garric, Environmental risk assessment of six human pharmaceuticals: Are the current environmental risk assessment procedures sufficient for the protection of the aquatic environment? Environmental Toxicology and Chemistry, 2004. 23(5): p. 1344-1354.
298. Bezwada, P., L.A. Clark, and S. Schneider, Intrinsic cytotoxic effects of fluoroquinolones on human corneal keratocytes and endothelial cells. Current Medical Research and Opinion, 2008. 24(2): p. 419-424.
299. Tsai, T.H., W.L. Chen, and F.R. Hu, Comparison of fluoroquinolones: cytotoxicity on human corneal epithelial cells. Eye, 2010. 24(5): p. 909-917.
300. Scuderi, A.C., G.M. Paladino, C. Marino, and F. Trombetta, In vitro toxicity of netilmicin and ofloxacin on corneal epithelial cells. Cornea, 2003. 22(5): p. 468-472.
301. Trisciuoglio, D., E. Krasnowska, A. Maggi, R. Pozzi, T. Parasassi, and O. Sapora, Phototoxic effect of fluoroquinolones on two human cell lines. Toxicology in Vitro, 2002. 16(4): p. 449-456.
302. Itoh, T., K. Mitsumori, S. Kawaguchi, and Y.F. Sasaki, Genotoxic potential of quinolone antimicrobials in the in vitro comet assay and micronucleus test. Mutation Research-Genetic Toxicology and Environmental Mutagenesis, 2006. 603(2): p. 135-144.
303. McQueen, C.A., B.M. Way, S.M. Queener, G. Schluter, and G.M. Williams, Study of Potential Invitro and Invivo Genotoxicity in Hepatocytes of Quinolone Antibiotics. Toxicology and Applied Pharmacology, 1991. 111(2): p. 255-262.
304. ECHA, http://apps.echa.europa.eu/registered/data/dossiers/DISS-9ea3b5cc-80fb-15ea-e044-00144f67d031/DISS-9ea3b5cc-80fb-15ea-e044-00144f67d031_DISS-9ea3b5cc-80fb-15ea-e044-00144f67d031.html. Triclosan.
305. Bedoux, G., B. Roig, O. Thomas, V. Dupont, and B. Le Bot, Occurrence and toxicity of antimicrobial triclosan and by-products in the environment. Environmental Science and Pollution Research, 2012. 19(4): p. 1044-1065.
306. Jirasripongpun, K., Wongarethornkul, T. and Mulliganavin, S., Risk Assessment of Triclosan Using Animal Cell Lines. Kasetsart Journal Natural Science, 2008. 42: p. 353-359.
307. Binelli, A., D. Cogni, M. Parolini, C. Riva, and A. Provini, Cytotoxic and genotoxic effects of in vitro exposure to Triclosan and Trimethoprim on zebra mussel (Dreissena polymorpha) hemocytes. Comparative Biochemistry and Physiology C-Toxicology & Pharmacology, 2009. 150(1): p. 50-56.
308. Ciniglia, C., C. Cascone, R. Lo Giudice, G. Pinto, and A. Pollio, Application of methods for assessing the geno- and cytotoxicity of Triclosan to C-ehrenbergii. Journal of Hazardous Materials, 2005. 122(3): p. 227-232.
References
189
309. Zuckerbraun, H.L., H. Babich, R. May, and M.C. Sinensky, Triclosan: cytotoxicity, mode of action, and induction of apoptosis in human gingival cells in vitro. European Journal of Oral Sciences, 1998. 106(2): p. 628-636.
310. Farre, M., D. Asperger, L. Kantiani, S. Gonzalez, M. Petrovic, and D. Barcelo, Assessment of the acute toxicity of triclosan and methyl triclosan in wastewater based on the bioluminescence inhibition of Vibrio fischeri. Analytical and Bioanalytical Chemistry, 2008. 390(8): p. 1999-2007.
311. Lindstrom, A., I.J. Buerge, T. Poiger, P.A. Bergqvist, M.D. Muller, and H.R. Buser, Occurrence and environmental behavior of the bactericide triclosan and its methyl derivative in surface waters and in wastewater. Environmental Science & Technology, 2002. 36(11): p. 2322-2329.
312. Orvos, D.R., D.J. Versteeg, J. Inauen, M. Capdevielle, A. Rothenstein, and V. Cunningham, Aquatic toxicity of triclosan. Environmental Toxicology and Chemistry, 2002. 21(7): p. 1338-1349.
313. Wilson, B.A., V.H. Smith, F. Denoyelles, and C.K. Larive, Effects of three pharmaceutical and personal care products on natural freshwater algal assemblages. Environmental Science & Technology, 2003. 37(9): p. 1713-1719.
314. Ishibashi, H., N. Matsumura, M. Hirano, M. Matsuoka, H. Shiratsuchi, Y. Ishibashi, Y. Takao, and K. Arizono, Effects of triclosan on the early life stages and reproduction of medaka Oryzias latipes and induction of hepatic vitellogenin. Aquatic Toxicology, 2004. 67(2): p. 167-179.
315. EC, SSCP (Scientific Committee on Consumer Products), Opinion on Triclosan. SSCP/1192/08, 2009.
316. FDA, Nomination Profile Triclosan - Supporting Information for Toxicological Evaluation by the National Toxicology Program. U.S. Food & Drug Administration Department of Health and Human Services, 2008.
317. Fang, J.-L., R.L. Stingley, F.A. Beland, W. Harrouk, D.L. Lumpkins, and P. Howard, Occurrence, Efficacy, Metabolism, and Toxicity of Triclosan. Journal of Environmental Science and Health Part C-Environmental Carcinogenesis & Ecotoxicology Reviews, 2010. 28(3): p. 147-171.
318. Chen, J., J. Jiang, F. Zhang, H. Yu, and J. Zhang, Cytotoxic effects of environmentally relevant chlorophenols on L929 cells and their mechanisms. Cell Biology and Toxicology, 2004. 20(3): p. 183-196.
319. Jiang, J., J.N. Chen, H.X. Yu, F. Zhang, J.F. Zhang, and L.S. Wang, Quantitative structure activity relationship and toxicity mechanisms of chlorophenols on cells in vitro. Chinese Science Bulletin, 2004. 49(6): p. 562-566.
320. Hilliard, C.A., M.J. Armstrong, C.I. Bradt, R.B. Hill, S.K. Greenwood, and S.M. Galloway, Chromosome aberrations in vitro related to cytotoxicity of nonmutagenic chemicals and metabolic poisons. Environmental and Molecular Mutagenesis, 1998. 31(4): p. 316-326.
321. Ensley, H.E., J.T. Barber, M.A. Polito, and A.I. Oliver, Toxicity and Metabolism of 2,4-Dichlorophenol by the Aquatic Angiosperm Lemna-gibba. Environmental Toxicology and Chemistry, 1994. 13(2): p. 325-331.
322. Burkhardt, M., S. Zuleeg, R. Vonbank, K. Bester, J. Carmeliet, M. Boller, and T. Wangler, Leaching of Biocides from Facades under Natural Weather Conditions. Environmental Science & Technology, 2012. 46(10): p. 5497-5503.

References
190
323. Mohr, S., R. Berghahn, W. Mailahn, R. Schmiediche, M. Feibicke, and R. Schmidt, Toxic and Accumulative Potential of the Antifouling Biocide and TBT Successor Irgarol on Freshwater Macrophytes: A Pond Mesocosm Study. Environmental Science & Technology, 2009. 43(17): p. 6838-6843.
324. Mezcua, M., M.D. Hernando, L. Piedra, A. Aguera, and A.R. Fernandez-Alba, Chromatography-mass spectrometry and toxicity evaluation of selected contaminants in seawater. Chromatographia, 2002. 56(3-4): p. 199-206.
325. Okamura, H., I. Aoyama, D. Liu, R.J. Maguire, G.J. Pacepavicius, and Y.L. Lau, Fate and ecotoxicity of the new antifouling compound Irgarol 1051 in the aquatic environment. Water Research, 2000. 34(14): p. 3523-3530.
326. Zhou, X., H. Okamura, and S. Nagata, Applicability of luminescent assay using fresh cells of Vibrio fischeri for toxicity evaluation. Journal of Health Science, 2006. 52(6): p. 811-816.
327. Okamura, H., T. Nishida, Y. Ono, and W.J. Shim, Phytotoxic effects of antifouling compounds on nontarget plant species. Bulletin of Environmental Contamination and Toxicology, 2003. 71(5): p. 881-886.
328. Noguerol, T.N., S. Boronat, M. Casado, D. Raldua, D. Barcelo, and B. Pina, Evaluating the interactions of vertebrate receptors with persistent pollutants and antifouling pesticides using recombinant yeast assays. Analytical and Bioanalytical Chemistry, 2006. 385(6): p. 1012-1019.
329. Liu, D., R.J. Maguire, Y.L. Lau, G.J. Pacepavicius, H. Okamura, and I. Aoyama, Transformation of the new antifouling compound Irgarol 1051 by Phanerochaete chrysosporium. Water Research, 1997. 31(9): p. 2363-2369.
330. Liu, D., G.J. Pacepavicius, R.J. Maguire, Y.L. Lau, H. Okamura, and I. Aoyama, Mercuric chloride-catalyzed hydrolysis of the new antifouling compound Irgarol 1051. Water Research, 1999. 33(1): p. 155-163.
331. Okamura, H., Photodegradation of the antifouling compounds Irgarol 1051 and Diuron released from a commercial antifouling paint. Chemosphere, 2002. 48(1): p. 43-50.
332. Arufe, M.I., J. Arellano, M.J. Moreno, and C. Sarasquete, Toxicity of a commercial herbicide containing terbutryn and triasulfuron to seabream (Sparus aurata L.) larvae: a comparison with the Microtox test. Ecotoxicology and Environmental Safety, 2004. 59(2): p. 209-216.
333. Gaggi, C., G. Sbrilli, A.M.H. Elnaby, M. Bucci, M. Duccini, and E. Bacci, Toxicity and Hazard Ranking of S-Triazine Herbicides Using Microtox®), 2 Green Algal Species and a Marine Crustacean. Environmental Toxicology and Chemistry, 1995. 14(6): p. 1065-1069.
334. Villarini, M., G. Scassellati-Sforzolini, M. Moretti, and R. Pasquini, In vitro genotoxicity of terbutryn evaluated by the alkaline single-cell microgel-electrophoresis "comet" assay. Cell Biology and Toxicology, 2000. 16(5): p. 285-292.
335. Plhalova, L., S. Macova, P. Dolezelova, P. Marsalek, Z. Svobodova, V. Pistekova, I. Bedanova, E. Voslarova, and H. Modra, Comparison of Terbutryn Acute Toxicity to Danio rerio and Poecilia reticulata. Acta Veterinaria Brno, 2010. 79(4): p. 593-598.
336. Velisek, J., E. Sudova, J. Machova, and Z. Svobodova, Effects of sub-chronic exposure to terbutryn in common carp (Cyprinus carpio L.). Ecotoxicology and Environmental Safety, 2010. 73(3): p. 384-390.
337. Velisek, J., A. Stara, J. Machova, P. Dvorak, E. Zuskova, M. Prokes, and Z. Svobodova, Effect of terbutryn at environmental concentrations on early life
References
191
stages of common carp (Cyprinus carpio L.). Pesticide Biochemistry and Physiology, 2012. 102(1): p. 102-108.
338. Brix, R., N. Bahi, M.J.L. de Alda, M. Farre, J.-M. Fernandez, and D. Barcelo, Identification of disinfection by-products of selected triazines in drinking water by LC-Q-ToF-MS/MS and evaluation of their toxicity. Journal of Mass Spectrometry, 2009. 44(3): p. 330-337.
339. Umweltbundesamt, Fact Sheet Polymoschusverbindungen. 340. Balk, F. and R.A. Ford, Environmental risk assessment for the polycyclic
musks, AHTN and HHCB - II. Effect assessment and risk characterisation. Toxicology Letters, 1999. 111(1-2): p. 81-94.
341. Api, A.M. and R.H.C. San, Genotoxicity tests with 6-acetyl-1,1,2,4,4,7-hexamethyltetraline and 1,3,4,6,7,8-hexahydro-4,6,6,7,8,8-hexamethylcyclo-penta-gamma-2-benzopyra n. Mutation Research-Genetic Toxicology and Environmental Mutagenesis, 1999. 446(1): p. 67-81.
342. Carlsson, G. and L. Norrgren, Synthetic musk toxicity to early life stages of zebrafish (Danio rerio). Archives of Environmental Contamination and Toxicology, 2004. 46(1): p. 102-105.
343. Randelli, E., V. Rossini, I. Corsi, S. Focardi, A.M. Fausto, F. Buonocore, and G. Scapigliati, Effects of the polycyclic ketone tonalide (AHTN) on some cell viability parameters and transcription of P450 and immunoregulatory genes in rainbow trout RTG-2 cells. Toxicology in Vitro, 2011. 25(8): p. 1596-1602.
344. Seinen, W., J.C. Lemmen, R.H.H. Pieters, E.M.J. Verbruggen, and B. van der Burg, AHTN and HHCB show weak estrogenic - but no uterotrophic activity. Toxicology Letters, 1999. 111(1-2): p. 161-168.
345. Schreurs, R., E. Sonneveld, J.H.J. Jansen, W. Seinen, and B. van der Burg, Interaction of polycyclic musks and UV filters with the estrogen receptor (ER), androgen receptor (AR), and progesterone receptor (PR) in reporter gene bioassays. Toxicological Sciences, 2005. 83(2): p. 264-272.
346. Simmons, D.B.D., V.L. Marlatt, V.L. Trudeau, J.P. Sherry, and C.D. Metcalfe, Interaction of Galaxolide (R) with the human and trout estrogen receptor-alpha. Science of the Total Environment, 2010. 408(24): p. 6158-6164.
347. van der Burg, B., R. Schreurs, S. van der Linden, W. Seinen, A. Brouwer, and E. Sonneveld, Endocrine effects of polycyclic musks: do we smell a rat? International Journal of Andrology, 2008. 31(2): p. 188-193.
348. Schreurs, R.H.M.M., J. Legler, E. Artola-Garicano, T.L. Sinnige, P.H. Lanser, W. Seinen, and B. van der Burg, In Vitro and in Vivo Antiestrogenic Effects of Polycyclic Musks in Zebrafish. Environmental Science & Technology, 2003. 38(4): p. 997-1002.
349. Witorsch, R.J. and J.A. Thomas, Personal care products and endocrine disruption: A critical review of the literature. Critical Reviews in Toxicology, 2010. 40: p. 1-30.
350. Schreurs, R., E. Sonneveld, P.T. van der Saag, B. van der Burg, and W. Seinen, Examination of the in vitro (anti) estrogenic, (anti) androgenic and (anti)dioxin-like activities of tetralin, indane and isochroman derivatives using receptor-specific bioassays. Toxicology Letters, 2005. 156(2): p. 261-275.
351. Schreurs, R., M.E. Quaedackers, W. Seinen, and B. van der Burg, Transcriptional activation of estrogen receptor ER alpha and ER beta by polycyclic musks is cell type dependent. Toxicology and Applied Pharmacology, 2002. 183(1): p. 1-9.
References
192
352. Balk, F. and R.A. Ford, Environmental risk assessment for the polycyclic musks AHTN and HHCB in the EU - I. Fate and exposure assessment. Toxicology Letters, 1999. 111(1-2): p. 57-79.
353. ECHA, SVHC Support Document. http://echa.europa.eu/documents/10162/d0f5c171-5086-49c3-a6a3-3a31cb4e08eb, 2009.
354. Follmann, W. and J. Wober, Investigation of cytotoxic, genotoxic, mutagenic, and estrogenic effects of the flame retardants tris-(2-chloroethyl)-phosphate (TCEP) and tris-(2-chloropropyl)-phosphate (TCPP) in vitro. Toxicology Letters, 2006. 161(2): p. 124-134.
355. Haworth, S., T. Lawlor, K. Mortelmans, W. Speck, and E. Zeiger, Salmonella mutagenicity test results for 250 chemicals. Environmental mutagenesis, 1983. 5 Suppl 1: p. 1-142.
356. Zeiger, E., B. Anderson, S. Haworth, T. Lawlor, and K. Mortelmans, Salmonella Mutagenicity Tests. 5. Results from the Testing of 311 Chemicals. Environmental and Molecular Mutagenesis, 1992. 19: p. 2-141.
357. Sala, M., Z.G. Gu, G. Moens, and I. Chouroulinkov, Invivo and Invitro Biological Effects of the Flame Retardants Tris(2,3-Dibromopropyl)-phosphate and Tris(2-Chloroethyl)-orthophosphate. European Journal of Cancer & Clinical Oncology, 1982. 18(12): p. 1337-1344.
358. Galloway, S.M., M.J. Armstrong, C. Reuben, S. Colman, B. Brown, C. Cannon, A.D. Bloom, F. Nakamura, M. Ahmed, S. Duk, J. Rimpo, B.H. Margolin, M.A. Resnick, B. Anderson, and E. Zeiger, Chromosome-Aberrations and Sister Chromatid Exchanges in Chinese-Hamster Ovary Cells - Evaluations of 108 Chemicals. Environmental and Molecular Mutagenesis, 1987. 10: p. 1-175.
359. Ren, X., Y.J. Lee, H.J. Han, and I.S. Kim, Cellular effect evaluation of micropollutants using transporter functions of renal proximal tubule cells. Chemosphere, 2009. 77(7): p. 968-974.
360. Ren, X., Y.J. Lee, H.J. Han, and I.S. Kim, Effect of tris-(2-chloroethyl)-phosphate (TCEP) at environmental concentration on the levels of cell cycle regulatory protein expression in primary cultured rabbit renal proximal tubule cells. Chemosphere, 2008. 74(1): p. 84-88.
361. Liu, X., K. Ji, and K. Choi, Endocrine disruption potentials of organophosphate flame retardants and related mechanisms in H295R and MVLN cell lines and in zebrafish. Aquatic Toxicology, 2012. 114: p. 173-181.
362. Higley, E., S. Grund, P.D. Jones, T. Schulze, T.-B. Seiler, U.L.-v. Varel, W. Brack, J. Wölz, H. Zielke, J.P. Giesy, H. Hollert, and M. Hecker, Endocrine disrupting, mutagenic, and teratogenic effects of upper Danube River sediments using effect-directed analysis. Environmental Toxicology and Chemistry, 2012. 31(5): p. 1053-1062.
363. Flaskos, J., W.G. McLean, and A.J. Hargreaves, The Toxicity of Organophosphate Compounds Towards Cultured PC12 Cells. Toxicology Letters, 1994. 70(1): p. 71-76.

Annex
193
8. Annex
List of Chemicals 8.1.Product Company
CHO Cells ECACC; Salisbury, UK
T47D Cells BioDetectionSystems (BDS); Amsterdam, NL
Salmonella typhimurium TA98 Xenometrix; Allschwil, CH
Salmonella typhimurium TA100 Xenometrix; Allschwil, CH
17ß-Ethinylestradiol BDS; Amsterdam, NL
2-Aminoanthracene Xenometrix; Allschwil, CH
2-Nitrofluorene Xenometrix; Allschwil, CH
4-Nitroquinolone-N-Oxide Xenometrix; Allschwil, CH
Acetic acid AppliChem; Darmstadt, D
Ames MPF Aqua 98/100 Test Kit (J10-210) Xenometrix; Allschwil, CH
Ames Exposure Medium Solution A (10x) Xenometrix; Allschwil, CH
Ames Exposure Medium Solution B (10x) Xenometrix; Allschwil, CH
Ampicillin Xenometrix; Allschwil, CH
Ampuwa (sterile water) Fresenius Kabi; Bad Homburg, D
Blood agar plates Oxoid; Wesel, D
CO2 (N45) Air Liquide; Düsseldorf, D
Dimethylsulfoxide (DMSO) Sigma-Aldrich; Steinheim, D
DMEM F12 with Phenolred Gibco; Karlsruhe, D
DMEM F12 without Phenolred Gibco; Karlsruhe, D
Ethylenediaminetetraacetic acid (EDTA) Sigma-Aldrich; Steinheim, D
N-ethyl-N-nitrosourea (ENU) Sigma-Aldrich; Steinheim, D
Fetal Calf Serum (FCS) Gibco; Karsruhe, D
Gentamycin c.c.pro; Oberdorla, D
GlowMix BDS; Amsterdam, NL
Growth Medium (Ames) Xenometrix; Allschwil, CH
HAM’s F12 c.c.pro; Oberdorla, D
Hydrochloric acid (HCl) Merck; Darmstadt, D

Annex
194
Product Company
Indicator Medium (Ames) Xenometrix; Allschwil, CH
LDH I (Reconstitution Solution) Xenometrix; Allschwil, CH
LDH II (NADH) Xenometrix; Allschwil, CH
LDH III (Pyruvate) Xenometrix; Allschwil, CH
L-Glutamine c.c.pro; Oberdorla, D
Liquid nitrogen Air products; Bochum, D
Low melting point (L.M.P.) Agarose Invitrogen; Paisley, UK
Lysis solution ER Calux BDS; Amsterdam, NL
MTT Sigma-Aldrich; Steinheim, D
MMAIII (Monomethylarsonous acid) Argus Chemicals; Vernio, I
Sodiumchloride (NaCl) Merck; Darmstadt, D
Sodiumhydroxide (NaOH) Sigma-Aldrich; Steinheim, D
N-Laurylsarcosine Sodium Salt Sigma-Aldrich; Steinheim, D
Non-essential amino acids (NEAA) c.c.pro; Oberdorla, D
NR I (Washing solution) Xenometrix; Allschwil, CH
NR II (Labeling solution) Xenometrix; Allschwil, CH
NR III (Fixing solution) Xenometrix; Allschwil, CH
NR IV (Solubilization solution) Xenometrix; Allschwil, CH
PAN I Cytotoxicity Kit (PAN I 96.1200) Xenometrix; Allschwil, CH
Phosphate Buffered Saline (PBS) Gibco; Karlsruhe, D
Reference water BDS; Amsterdam, NL
S9 Fraction Xenometrix; Allschwil, CH
S9 Buffer Salts Xenometrix; Allschwil, CH
S9 G-6-P Xenometrix; Allschwil, CH
S9 NADP Xenometrix; Allschwil, CH
Sodium dodecyl sulfate (SDS) Sigma-Aldrich; Steinheim, D
SRB I (Washing solution) Xenometrix; Allschwil, CH
SRB II (Fixing solution) Xenometrix; Allschwil, CH
SRB III (labeling solution) Xenometrix; Allschwil, CH
SRB IV (Rinsing solution) Xenometrix; Allschwil, CH

Annex
195
Product Company
SRB V (Solubilization solution) Xenometrix; Allschwil, CH
Stripped FCS (Fetal Calf Serum) BDS; Amsterdam, NL
SYBR-Green® Sigma-Aldrich, Steinheim, D
Triton-X Merck; Darmstadt, D
Trizma Sigma-Aldrich; Steinheim, D
Trypsin-EDTA c.c.pro; Oberdorla, D
XTT I (Substrate) Xenometrix; Allschwil, CH
XTT II (Buffer) Xenometrix; Allschwil, CH
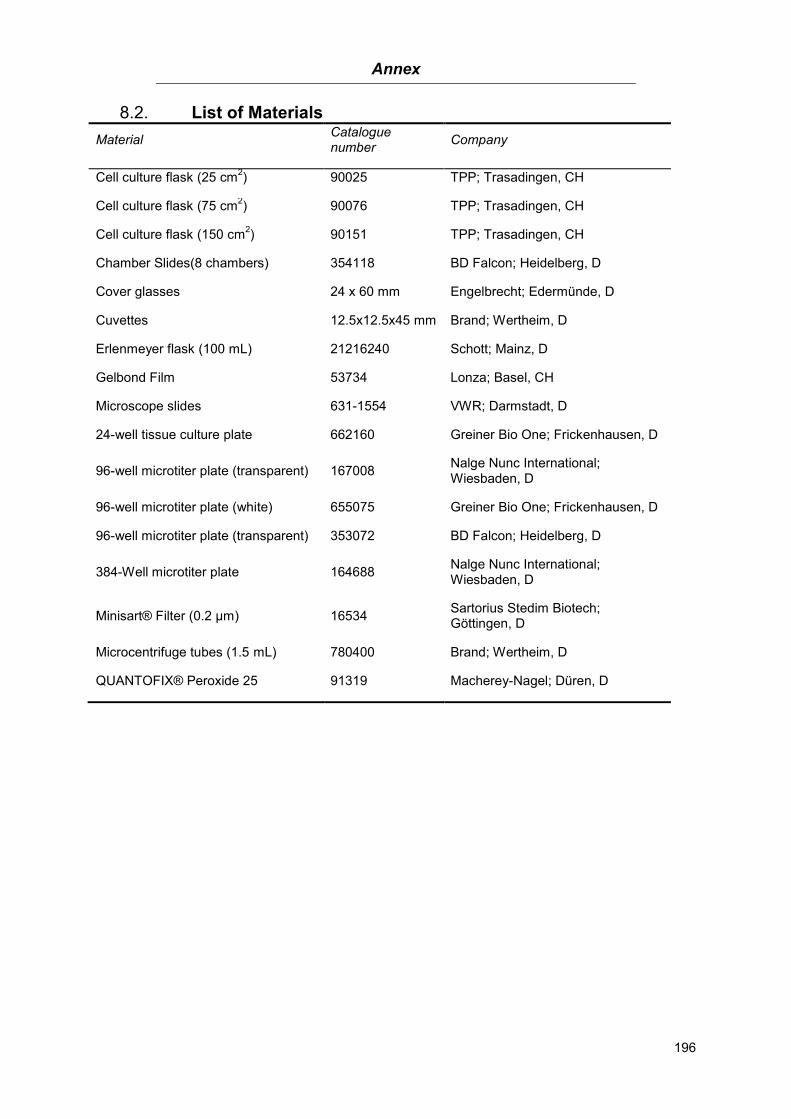
Annex
196
List of Materials 8.2.
Material Catalogue number
Company
Cell culture flask (25 cm2) 90025 TPP; Trasadingen, CH
Cell culture flask (75 cm2) 90076 TPP; Trasadingen, CH
Cell culture flask (150 cm2) 90151 TPP; Trasadingen, CH
Chamber Slides(8 chambers) 354118 BD Falcon; Heidelberg, D
Cover glasses 24 x 60 mm Engelbrecht; Edermünde, D
Cuvettes 12.5x12.5x45 mm Brand; Wertheim, D
Erlenmeyer flask (100 mL) 21216240 Schott; Mainz, D
Gelbond Film 53734 Lonza; Basel, CH
Microscope slides 631-1554 VWR; Darmstadt, D
24-well tissue culture plate 662160 Greiner Bio One; Frickenhausen, D
96-well microtiter plate (transparent) 167008 Nalge Nunc International; Wiesbaden, D
96-well microtiter plate (white) 655075 Greiner Bio One; Frickenhausen, D
96-well microtiter plate (transparent) 353072 BD Falcon; Heidelberg, D
384-Well microtiter plate 164688 Nalge Nunc International; Wiesbaden, D
Minisart® Filter (0.2 µm) 16534 Sartorius Stedim Biotech; Göttingen, D
Microcentrifuge tubes (1.5 mL) 780400 Brand; Wertheim, D
QUANTOFIX® Peroxide 25 91319 Macherey-Nagel; Düren, D
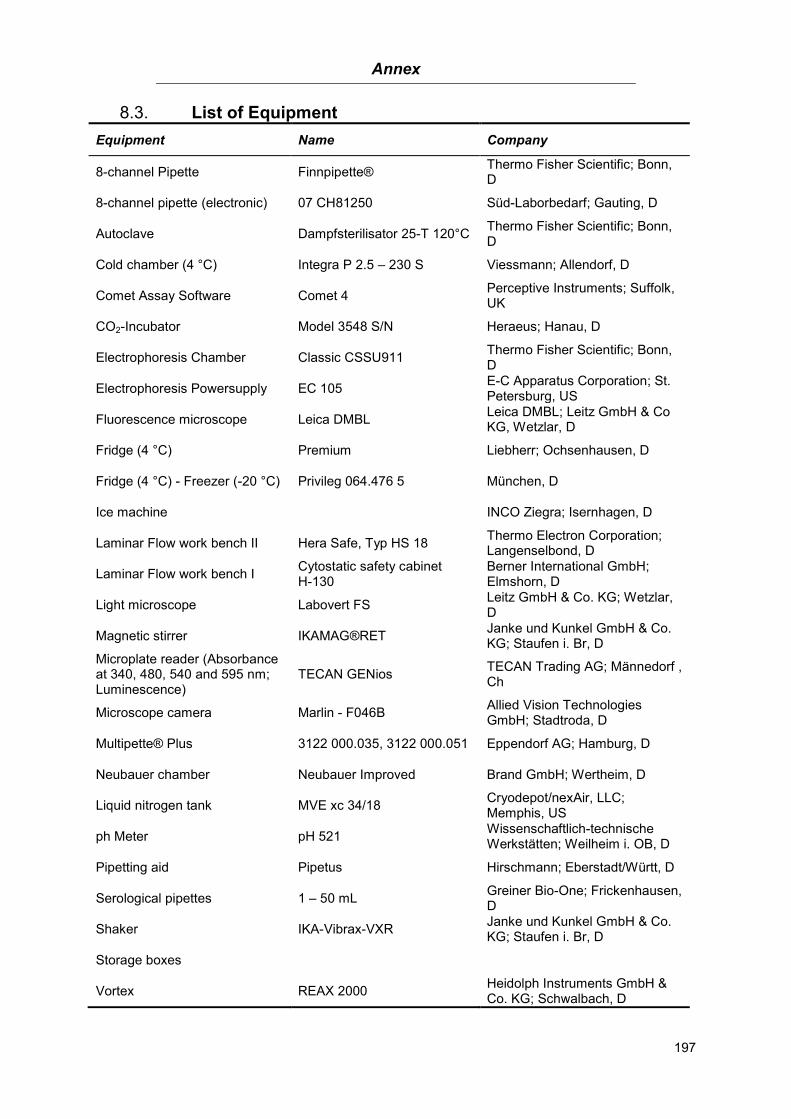
Annex
197
List of Equipment 8.3.
Equipment Name Company
8-channel Pipette Finnpipette® Thermo Fisher Scientific; Bonn, D
8-channel pipette (electronic) 07 CH81250 Süd-Laborbedarf; Gauting, D
Autoclave Dampfsterilisator 25-T 120°C Thermo Fisher Scientific; Bonn, D
Cold chamber (4 °C) Integra P 2.5 – 230 S Viessmann; Allendorf, D
Comet Assay Software Comet 4 Perceptive Instruments; Suffolk, UK
CO2-Incubator Model 3548 S/N Heraeus; Hanau, D
Electrophoresis Chamber Classic CSSU911 Thermo Fisher Scientific; Bonn, D
Electrophoresis Powersupply EC 105 E-C Apparatus Corporation; St. Petersburg, US
Fluorescence microscope Leica DMBL Leica DMBL; Leitz GmbH & Co KG, Wetzlar, D
Fridge (4 °C) Premium Liebherr; Ochsenhausen, D
Fridge (4 °C) - Freezer (-20 °C) Privileg 064.476 5 München, D
Ice machine INCO Ziegra; Isernhagen, D
Laminar Flow work bench II Hera Safe, Typ HS 18 Thermo Electron Corporation; Langenselbond, D
Laminar Flow work bench I Cytostatic safety cabinet H-130
Berner International GmbH; Elmshorn, D
Light microscope Labovert FS Leitz GmbH & Co. KG; Wetzlar, D
Magnetic stirrer IKAMAG®RET Janke und Kunkel GmbH & Co. KG; Staufen i. Br, D
Microplate reader (Absorbance at 340, 480, 540 and 595 nm; Luminescence)
TECAN GENios TECAN Trading AG; Männedorf , Ch
Microscope camera Marlin - F046B Allied Vision Technologies GmbH; Stadtroda, D
Multipette® Plus 3122 000.035, 3122 000.051 Eppendorf AG; Hamburg, D
Neubauer chamber Neubauer Improved Brand GmbH; Wertheim, D
Liquid nitrogen tank MVE xc 34/18 Cryodepot/nexAir, LLC; Memphis, US
ph Meter pH 521 Wissenschaftlich-technische Werkstätten; Weilheim i. OB, D
Pipetting aid Pipetus Hirschmann; Eberstadt/Württ, D
Serological pipettes 1 – 50 mL Greiner Bio-One; Frickenhausen, D
Shaker IKA-Vibrax-VXR Janke und Kunkel GmbH & Co. KG; Staufen i. Br, D
Storage boxes
Vortex REAX 2000 Heidolph Instruments GmbH & Co. KG; Schwalbach, D
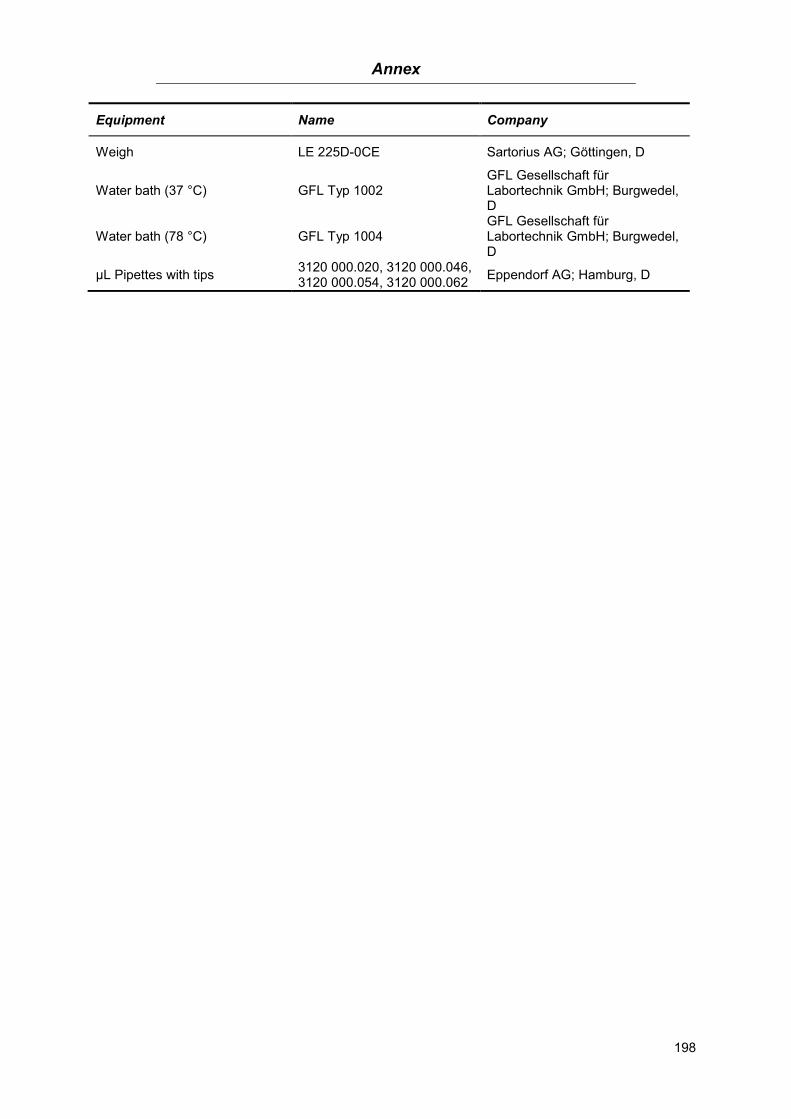
Annex
198
Equipment Name Company
Weigh LE 225D-0CE Sartorius AG; Göttingen, D
Water bath (37 °C) GFL Typ 1002 GFL Gesellschaft für Labortechnik GmbH; Burgwedel, D
Water bath (78 °C) GFL Typ 1004 GFL Gesellschaft für Labortechnik GmbH; Burgwedel, D
µL Pipettes with tips 3120 000.020, 3120 000.046, 3120 000.054, 3120 000.062
Eppendorf AG; Hamburg, D
Annex
199
Curriculum vitae 8.5.
Der Lebenslauf ist in der Online-Version aus Gründen des Datenschutzes nicht enthalten

Annex
200
Der Lebenslauf ist in der Online-Version aus Gründen des Datenschutzes nicht enthalten
Annex
201
Der Lebenslauf ist in der Online-Version aus Gründen des Datenschutzes nicht enthalten

Annex
202
Der Lebenslauf ist in der Online-Version aus Gründen des Datenschutzes nicht enthalten

Annex
203
Der Lebenslauf ist in der Online-Version aus Gründen des Datenschutzes nicht enthalten

Annex
204
Der Lebenslauf ist in der Online-Version aus Gründen des Datenschutzes nicht enthalten
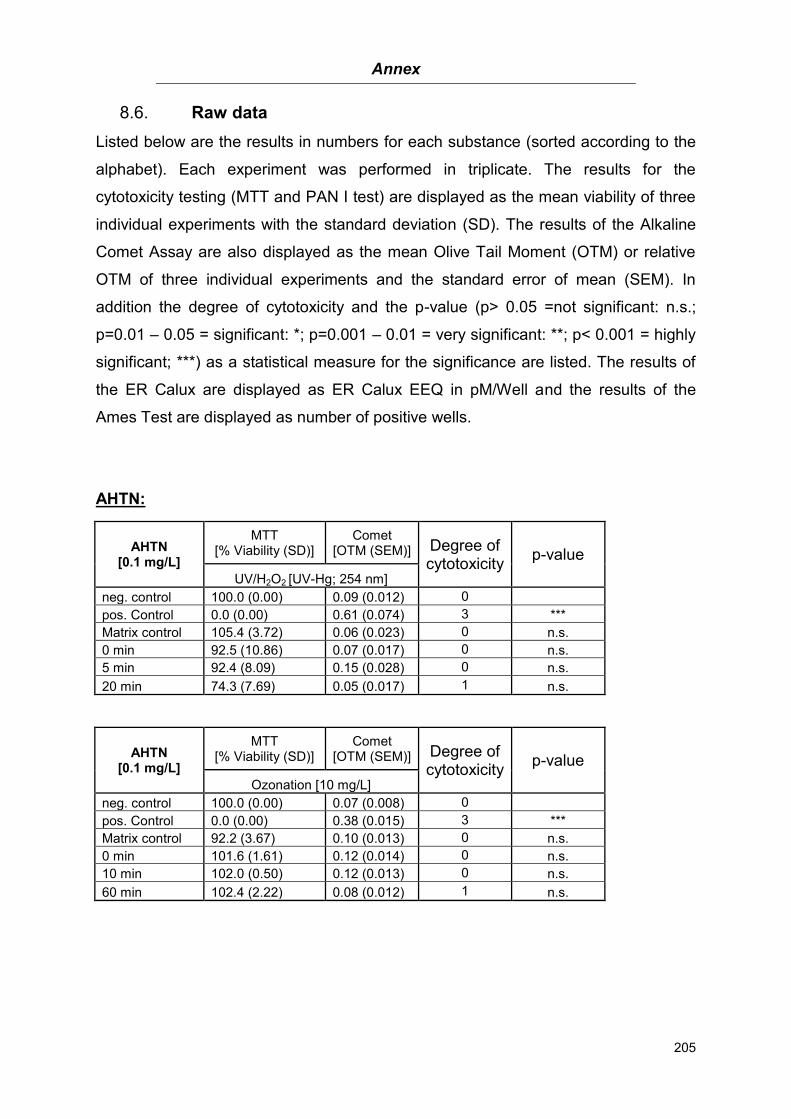
Annex
205
Raw data 8.6.
Listed below are the results in numbers for each substance (sorted according to the
alphabet). Each experiment was performed in triplicate. The results for the
cytotoxicity testing (MTT and PAN I test) are displayed as the mean viability of three
individual experiments with the standard deviation (SD). The results of the Alkaline
Comet Assay are also displayed as the mean Olive Tail Moment (OTM) or relative
OTM of three individual experiments and the standard error of mean (SEM). In
addition the degree of cytotoxicity and the p-value (p> 0.05 =not significant: n.s.;
p=0.01 – 0.05 = significant: *; p=0.001 – 0.01 = very significant: **; p< 0.001 = highly
significant; ***) as a statistical measure for the significance are listed. The results of
the ER Calux are displayed as ER Calux EEQ in pM/Well and the results of the
Ames Test are displayed as number of positive wells.
AHTN:
AHTN [0.1 mg/L]
MTT [% Viability (SD)]
Comet [OTM (SEM)] Degree of
cytotoxicity p-value
UV/H2O2 [UV-Hg; 254 nm]
neg. control 100.0 (0.00) 0.09 (0.012) 0
pos. Control 0.0 (0.00) 0.61 (0.074) 3 ***
Matrix control 105.4 (3.72) 0.06 (0.023) 0 n.s.
0 min 92.5 (10.86) 0.07 (0.017) 0 n.s.
5 min 92.4 (8.09) 0.15 (0.028) 0 n.s.
20 min 74.3 (7.69) 0.05 (0.017) 1 n.s.
AHTN [0.1 mg/L]
MTT [% Viability (SD)]
Comet [OTM (SEM)] Degree of
cytotoxicity p-value
Ozonation [10 mg/L]
neg. control 100.0 (0.00) 0.07 (0.008) 0
pos. Control 0.0 (0.00) 0.38 (0.015) 3 ***
Matrix control 92.2 (3.67) 0.10 (0.013) 0 n.s.
0 min 101.6 (1.61) 0.12 (0.014) 0 n.s.
10 min 102.0 (0.50) 0.12 (0.013) 0 n.s.
60 min 102.4 (2.22) 0.08 (0.012) 1 n.s.
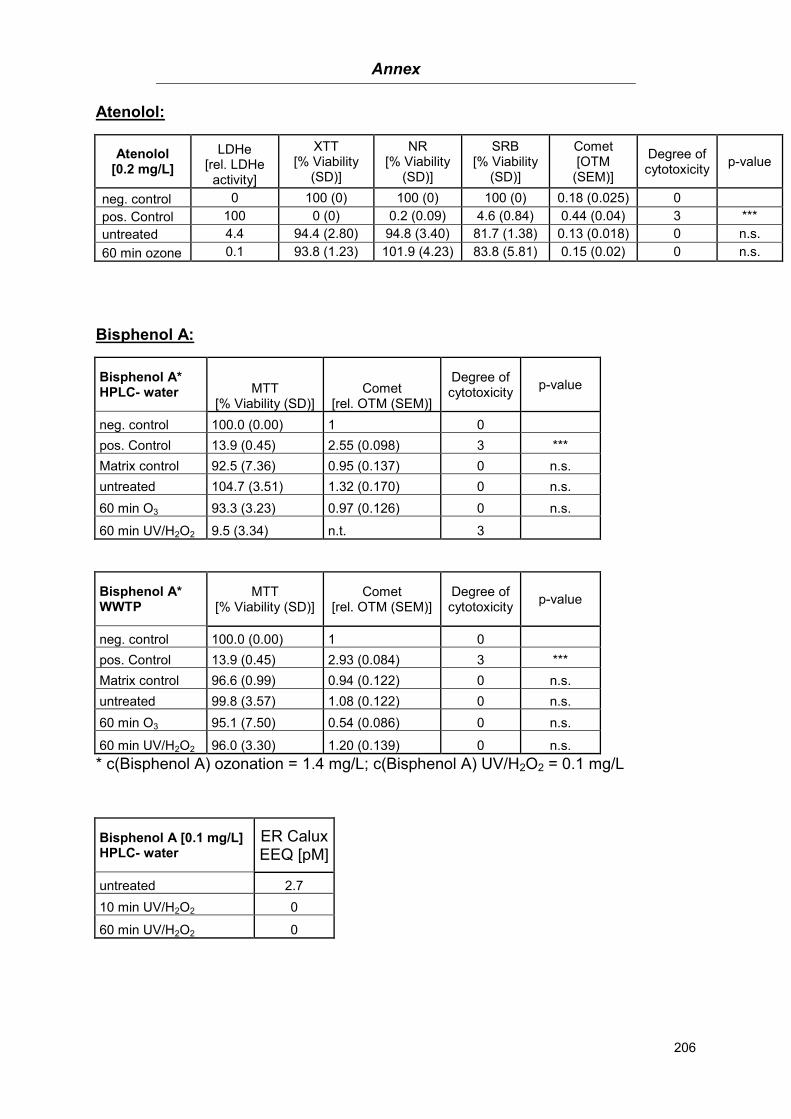
Annex
206
Atenolol:
Atenolol [0.2 mg/L]
LDHe [rel. LDHe
activity]
XTT [% Viability
(SD)]
NR [% Viability
(SD)]
SRB [% Viability
(SD)]
Comet [OTM
(SEM)]
Degree of cytotoxicity
p-value
neg. control 0 100 (0) 100 (0) 100 (0) 0.18 (0.025) 0
pos. Control 100 0 (0) 0.2 (0.09) 4.6 (0.84) 0.44 (0.04) 3 ***
untreated 4.4 94.4 (2.80) 94.8 (3.40) 81.7 (1.38) 0.13 (0.018) 0 n.s.
60 min ozone 0.1 93.8 (1.23) 101.9 (4.23) 83.8 (5.81) 0.15 (0.02) 0 n.s.
Bisphenol A:
Bisphenol A* HPLC- water MTT
[% Viability (SD)] Comet
[rel. OTM (SEM)]
Degree of cytotoxicity
p-value
neg. control 100.0 (0.00) 1 0
pos. Control 13.9 (0.45) 2.55 (0.098) 3 ***
Matrix control 92.5 (7.36) 0.95 (0.137) 0 n.s.
untreated 104.7 (3.51) 1.32 (0.170) 0 n.s.
60 min O3 93.3 (3.23) 0.97 (0.126) 0 n.s.
60 min UV/H2O2 9.5 (3.34) n.t. 3
Bisphenol A* WWTP
MTT [% Viability (SD)]
Comet [rel. OTM (SEM)]
Degree of cytotoxicity
p-value
neg. control 100.0 (0.00) 1 0
pos. Control 13.9 (0.45) 2.93 (0.084) 3 ***
Matrix control 96.6 (0.99) 0.94 (0.122) 0 n.s.
untreated 99.8 (3.57) 1.08 (0.122) 0 n.s.
60 min O3 95.1 (7.50) 0.54 (0.086) 0 n.s.
60 min UV/H2O2 96.0 (3.30) 1.20 (0.139) 0 n.s.
* c(Bisphenol A) ozonation = 1.4 mg/L; c(Bisphenol A) UV/H2O2 = 0.1 mg/L
Bisphenol A [0.1 mg/L] HPLC- water
ER Calux EEQ [pM]
untreated 2.7
10 min UV/H2O2 0
60 min UV/H2O2 0
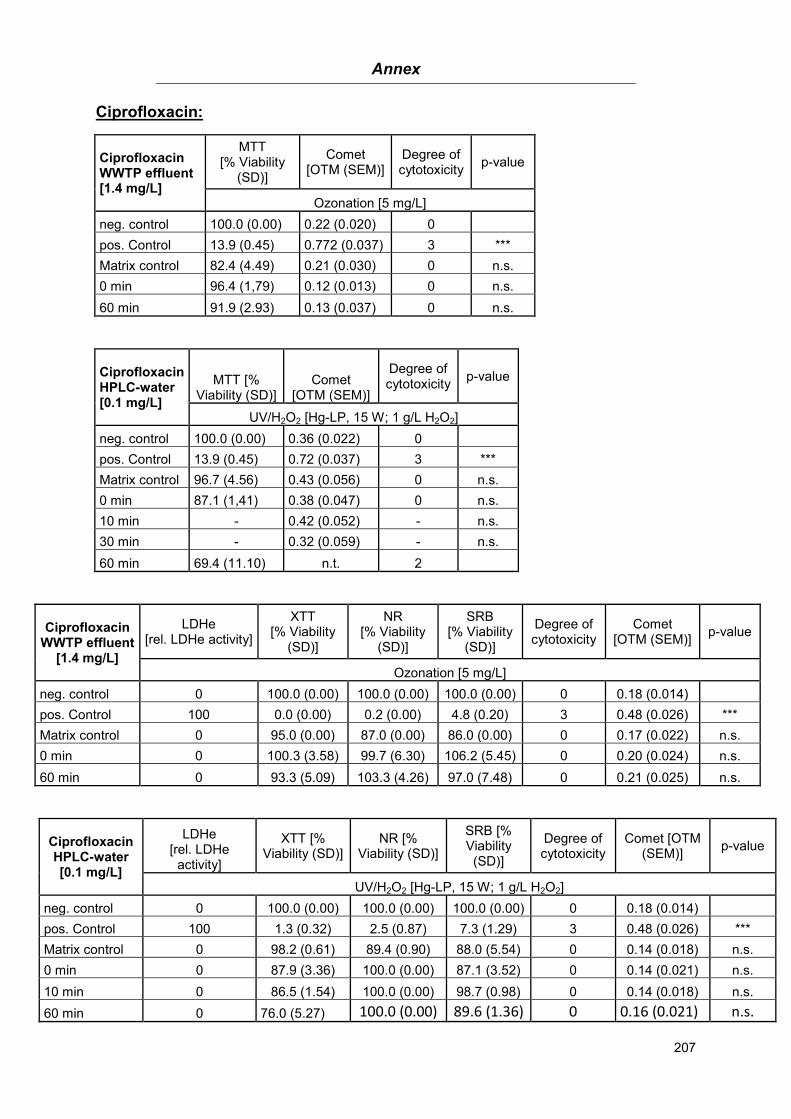
Annex
207
Ciprofloxacin:
Ciprofloxacin WWTP effluent [1.4 mg/L]
MTT [% Viability
(SD)]
Comet [OTM (SEM)]
Degree of cytotoxicity
p-value
Ozonation [5 mg/L]
neg. control 100.0 (0.00) 0.22 (0.020) 0
pos. Control 13.9 (0.45) 0.772 (0.037) 3 ***
Matrix control 82.4 (4.49) 0.21 (0.030) 0 n.s.
0 min 96.4 (1,79) 0.12 (0.013) 0 n.s.
60 min 91.9 (2.93) 0.13 (0.037) 0 n.s.
Ciprofloxacin HPLC-water [0.1 mg/L]
MTT [% Viability (SD)]
Comet [OTM (SEM)]
Degree of cytotoxicity
p-value
UV/H2O2 [Hg-LP, 15 W; 1 g/L H2O2]
neg. control 100.0 (0.00) 0.36 (0.022) 0
pos. Control 13.9 (0.45) 0.72 (0.037) 3 ***
Matrix control 96.7 (4.56) 0.43 (0.056) 0 n.s.
0 min 87.1 (1,41) 0.38 (0.047) 0 n.s.
10 min - 0.42 (0.052) - n.s.
30 min - 0.32 (0.059) - n.s.
60 min 69.4 (11.10) n.t. 2
Ciprofloxacin WWTP effluent
[1.4 mg/L]
LDHe [rel. LDHe activity]
XTT [% Viability
(SD)]
NR [% Viability
(SD)]
SRB [% Viability
(SD)]
Degree of cytotoxicity
Comet [OTM (SEM)]
p-value
Ozonation [5 mg/L]
neg. control 0 100.0 (0.00) 100.0 (0.00) 100.0 (0.00) 0 0.18 (0.014)
pos. Control 100 0.0 (0.00) 0.2 (0.00) 4.8 (0.20) 3 0.48 (0.026) ***
Matrix control 0 95.0 (0.00) 87.0 (0.00) 86.0 (0.00) 0 0.17 (0.022) n.s.
0 min 0 100.3 (3.58) 99.7 (6.30) 106.2 (5.45) 0 0.20 (0.024) n.s.
60 min 0 93.3 (5.09) 103.3 (4.26) 97.0 (7.48) 0 0.21 (0.025) n.s.
Ciprofloxacin HPLC-water [0.1 mg/L]
LDHe [rel. LDHe
activity]
XTT [% Viability (SD)]
NR [% Viability (SD)]
SRB [% Viability (SD)]
Degree of cytotoxicity
Comet [OTM (SEM)]
p-value
UV/H2O2 [Hg-LP, 15 W; 1 g/L H2O2]
neg. control 0 100.0 (0.00) 100.0 (0.00) 100.0 (0.00) 0 0.18 (0.014)
pos. Control 100 1.3 (0.32) 2.5 (0.87) 7.3 (1.29) 3 0.48 (0.026) ***
Matrix control 0 98.2 (0.61) 89.4 (0.90) 88.0 (5.54) 0 0.14 (0.018) n.s.
0 min 0 87.9 (3.36) 100.0 (0.00) 87.1 (3.52) 0 0.14 (0.021) n.s.
10 min 0 86.5 (1.54) 100.0 (0.00) 98.7 (0.98) 0 0.14 (0.018) n.s.
60 min 0 76.0 (5.27) 100.0 (0.00) 89.6 (1.36) 0 0.16 (0.021) n.s.
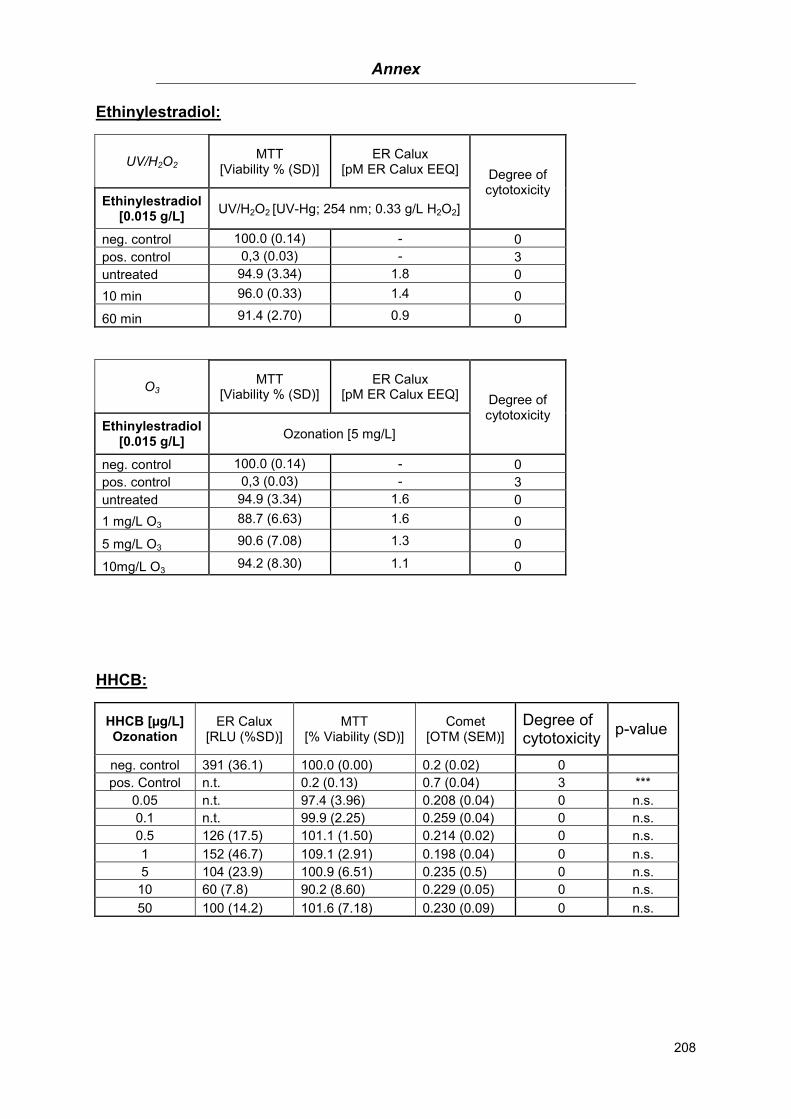
Annex
208
Ethinylestradiol:
UV/H2O2 MTT
[Viability % (SD)] ER Calux
[pM ER Calux EEQ] Degree of cytotoxicity
Ethinylestradiol [0.015 g/L]
UV/H2O2 [UV-Hg; 254 nm; 0.33 g/L H2O2]
neg. control 100.0 (0.14) - 0
pos. control 0,3 (0.03) - 3
untreated 94.9 (3.34) 1.8 0
10 min 96.0 (0.33) 1.4 0
60 min 91.4 (2.70) 0.9 0
O3 MTT
[Viability % (SD)] ER Calux
[pM ER Calux EEQ] Degree of cytotoxicity
Ethinylestradiol [0.015 g/L]
Ozonation [5 mg/L]
neg. control 100.0 (0.14) - 0
pos. control 0,3 (0.03) - 3
untreated 94.9 (3.34) 1.6 0
1 mg/L O3 88.7 (6.63) 1.6 0
5 mg/L O3 90.6 (7.08) 1.3 0
10mg/L O3 94.2 (8.30) 1.1 0
HHCB:
HHCB [µg/L] Ozonation
ER Calux [RLU (%SD)]
MTT [% Viability (SD)]
Comet [OTM (SEM)]
Degree of cytotoxicity
p-value
neg. control 391 (36.1) 100.0 (0.00) 0.2 (0.02) 0
pos. Control n.t. 0.2 (0.13) 0.7 (0.04) 3 ***
0.05 n.t. 97.4 (3.96) 0.208 (0.04) 0 n.s.
0.1 n.t. 99.9 (2.25) 0.259 (0.04) 0 n.s.
0.5 126 (17.5) 101.1 (1.50) 0.214 (0.02) 0 n.s.
1 152 (46.7) 109.1 (2.91) 0.198 (0.04) 0 n.s.
5 104 (23.9) 100.9 (6.51) 0.235 (0.5) 0 n.s.
10 60 (7.8) 90.2 (8.60) 0.229 (0.05) 0 n.s.
50 100 (14.2) 101.6 (7.18) 0.230 (0.09) 0 n.s.
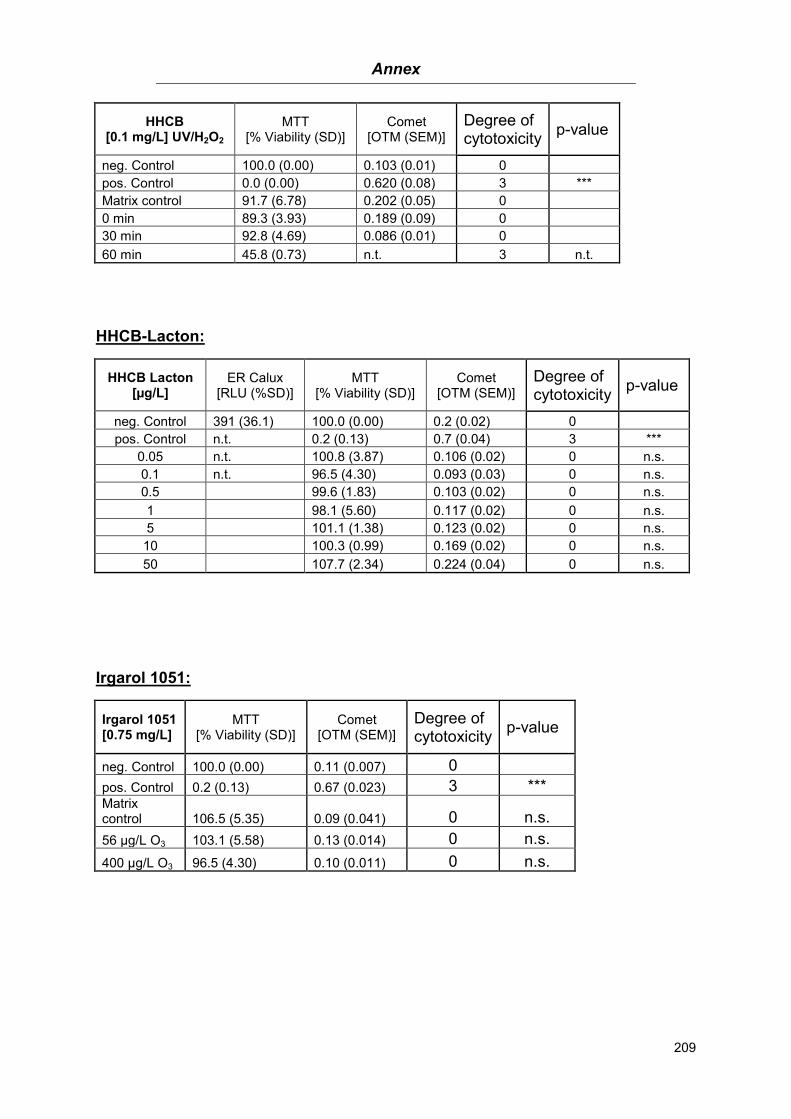
Annex
209
HHCB [0.1 mg/L] UV/H2O2
MTT [% Viability (SD)]
Comet [OTM (SEM)]
Degree of cytotoxicity
p-value
neg. Control 100.0 (0.00) 0.103 (0.01) 0
pos. Control 0.0 (0.00) 0.620 (0.08) 3 ***
Matrix control 91.7 (6.78) 0.202 (0.05) 0
0 min 89.3 (3.93) 0.189 (0.09) 0
30 min 92.8 (4.69) 0.086 (0.01) 0
60 min 45.8 (0.73) n.t. 3 n.t.
HHCB-Lacton:
HHCB Lacton [µg/L]
ER Calux [RLU (%SD)]
MTT [% Viability (SD)]
Comet [OTM (SEM)]
Degree of cytotoxicity
p-value
neg. Control 391 (36.1) 100.0 (0.00) 0.2 (0.02) 0
pos. Control n.t. 0.2 (0.13) 0.7 (0.04) 3 ***
0.05 n.t. 100.8 (3.87) 0.106 (0.02) 0 n.s.
0.1 n.t. 96.5 (4.30) 0.093 (0.03) 0 n.s.
0.5 99.6 (1.83) 0.103 (0.02) 0 n.s.
1 98.1 (5.60) 0.117 (0.02) 0 n.s.
5 101.1 (1.38) 0.123 (0.02) 0 n.s.
10 100.3 (0.99) 0.169 (0.02) 0 n.s.
50 107.7 (2.34) 0.224 (0.04) 0 n.s.
Irgarol 1051:
Irgarol 1051 [0.75 mg/L]
MTT [% Viability (SD)]
Comet [OTM (SEM)]
Degree of cytotoxicity
p-value
neg. Control 100.0 (0.00) 0.11 (0.007) 0
pos. Control 0.2 (0.13) 0.67 (0.023) 3 *** Matrix control 106.5 (5.35) 0.09 (0.041) 0 n.s.
56 µg/L O3 103.1 (5.58) 0.13 (0.014) 0 n.s.
400 µg/L O3 96.5 (4.30) 0.10 (0.011) 0 n.s.
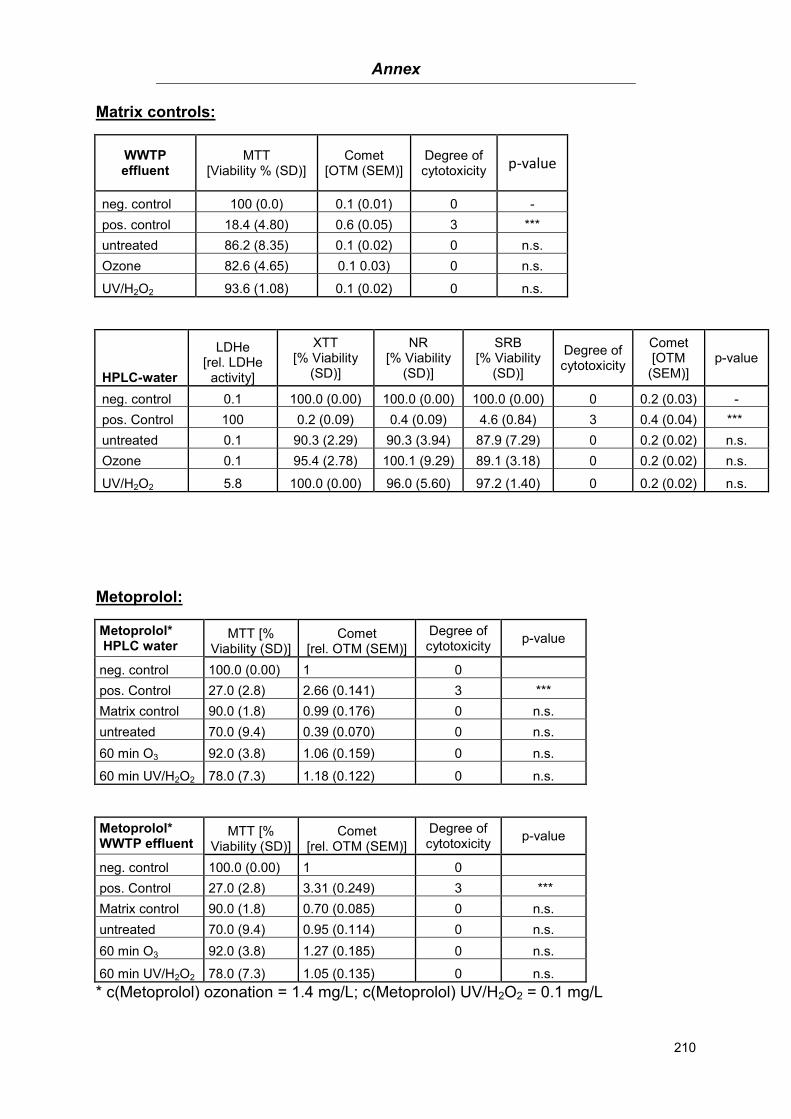
Annex
210
Matrix controls:
WWTP effluent
MTT [Viability % (SD)]
Comet [OTM (SEM)]
Degree of cytotoxicity
p-value
neg. control 100 (0.0) 0.1 (0.01) 0 -
pos. control 18.4 (4.80) 0.6 (0.05) 3 ***
untreated 86.2 (8.35) 0.1 (0.02) 0 n.s.
Ozone 82.6 (4.65) 0.1 0.03) 0 n.s.
UV/H2O2 93.6 (1.08) 0.1 (0.02) 0 n.s.
HPLC-water
LDHe [rel. LDHe
activity]
XTT [% Viability
(SD)]
NR [% Viability
(SD)]
SRB [% Viability
(SD)]
Degree of cytotoxicity
Comet [OTM
(SEM)] p-value
neg. control 0.1 100.0 (0.00) 100.0 (0.00) 100.0 (0.00) 0 0.2 (0.03) -
pos. Control 100 0.2 (0.09) 0.4 (0.09) 4.6 (0.84) 3 0.4 (0.04) ***
untreated 0.1 90.3 (2.29) 90.3 (3.94) 87.9 (7.29) 0 0.2 (0.02) n.s.
Ozone 0.1 95.4 (2.78) 100.1 (9.29) 89.1 (3.18) 0 0.2 (0.02) n.s.
UV/H2O2 5.8 100.0 (0.00) 96.0 (5.60) 97.2 (1.40) 0 0.2 (0.02) n.s.
Metoprolol:
Metoprolol* HPLC water
MTT [% Viability (SD)]
Comet [rel. OTM (SEM)]
Degree of cytotoxicity
p-value
neg. control 100.0 (0.00) 1 0
pos. Control 27.0 (2.8) 2.66 (0.141) 3 ***
Matrix control 90.0 (1.8) 0.99 (0.176) 0 n.s.
untreated 70.0 (9.4) 0.39 (0.070) 0 n.s.
60 min O3 92.0 (3.8) 1.06 (0.159) 0 n.s.
60 min UV/H2O2 78.0 (7.3) 1.18 (0.122) 0 n.s.
Metoprolol* WWTP effluent
MTT [% Viability (SD)]
Comet [rel. OTM (SEM)]
Degree of cytotoxicity
p-value
neg. control 100.0 (0.00) 1 0
pos. Control 27.0 (2.8) 3.31 (0.249) 3 ***
Matrix control 90.0 (1.8) 0.70 (0.085) 0 n.s.
untreated 70.0 (9.4) 0.95 (0.114) 0 n.s.
60 min O3 92.0 (3.8) 1.27 (0.185) 0 n.s.
60 min UV/H2O2 78.0 (7.3) 1.05 (0.135) 0 n.s.
* c(Metoprolol) ozonation = 1.4 mg/L; c(Metoprolol) UV/H2O2 = 0.1 mg/L

Annex
211
Ofloxacin:
Ofloxacin [0.1 mg/L]
HPLC water
MTT [% Viability (SD)]
Comet [OTM (SEM)] Degree of
cytotoxicity p-value
Ozonation [10 mg/L]
neg. control 100.0 (0.00) 0.11 (0.057) 0
pos. Control 0.4 (0.50) 0.79 (0.057) 3 ***
Matrix control 94.0 (8.63) 0.20 (0.046) 0 n.s.
0 min 97.7 (10.47) 0.14 (0.025) 0 n.s.
10 min 87.7 (3.46) 0.15 (0.034) 0 n.s.
30 min 87.1 (6.43) 0.12 (0.019) 0 n.s.
60 min 87.6 (0.28) 0.13 (0.022) 0 n.s.
Ofloxacin [0.1 mg/L]
WWTP effluent
MTT [% Viability (SD)]
Comet [OTM (SEM)] Degree of
cytotoxicity p-value
UV/H2O2 [UV-Hg; 254 nm]
neg. control 100.0 (0.00) 1.00 (0.000) 0
pos. Control 1.7 (1.41) 6.30 (0.446) 3 ***
Matrix control 103.3 (8.31) 1.14 (0.370) 0 n.s.
O3 110.5 (1.27) 0.78 (0.237) 0 n.s.
UV/H2O2 90.7 (1.84) 0.99 (0.070) 0 n.s.
Sulfamethoxazole:
Sulfamethoxazole [1.4 mg/L] HPLC
MTT [% Viability (SD)]
Comet [OTM (SEM)] Degree of
cytotoxicity p-value
5 mg/L O3
neg. control 100.0 (0.00) 0.18 (0.010) 0
pos. Control 14.0 (0.08) 0.48 (0.015) 3 ***
Matrix control 92.5 (7.36) 0.21 (0.031) 0 n.s.
0 min 103.2 (4.37) 0.22 (0.024) 0 n.s.
60 min 100.5 (7.63) 0.19 (0.035) 0 n.s.
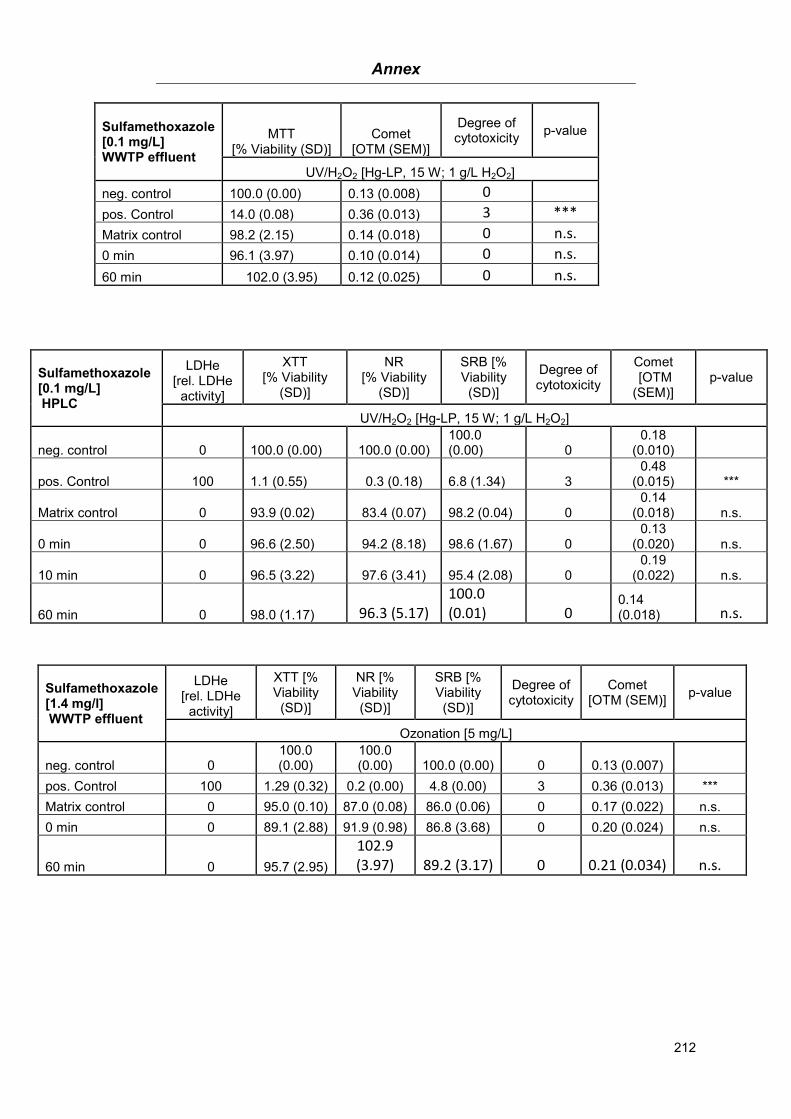
Annex
212
Sulfamethoxazole [0.1 mg/L] WWTP effluent
MTT [% Viability (SD)]
Comet [OTM (SEM)]
Degree of cytotoxicity
p-value
UV/H2O2 [Hg-LP, 15 W; 1 g/L H2O2]
neg. control 100.0 (0.00) 0.13 (0.008) 0
pos. Control 14.0 (0.08) 0.36 (0.013) 3 ***
Matrix control 98.2 (2.15) 0.14 (0.018) 0 n.s.
0 min 96.1 (3.97) 0.10 (0.014) 0 n.s.
60 min 102.0 (3.95) 0.12 (0.025) 0 n.s.
Sulfamethoxazole [0.1 mg/L] HPLC
LDHe [rel. LDHe
activity]
XTT [% Viability
(SD)]
NR [% Viability
(SD)]
SRB [% Viability (SD)]
Degree of cytotoxicity
Comet [OTM (SEM)]
p-value
UV/H2O2 [Hg-LP, 15 W; 1 g/L H2O2]
neg. control 0 100.0 (0.00) 100.0 (0.00) 100.0 (0.00) 0
0.18 (0.010)
pos. Control 100 1.1 (0.55) 0.3 (0.18) 6.8 (1.34) 3 0.48
(0.015) ***
Matrix control 0 93.9 (0.02) 83.4 (0.07) 98.2 (0.04) 0 0.14
(0.018) n.s.
0 min 0 96.6 (2.50) 94.2 (8.18) 98.6 (1.67) 0 0.13
(0.020) n.s.
10 min 0 96.5 (3.22) 97.6 (3.41) 95.4 (2.08) 0 0.19
(0.022) n.s.
60 min 0 98.0 (1.17) 96.3 (5.17) 100.0 (0.01) 0
0.14 (0.018) n.s.
Sulfamethoxazole [1.4 mg/l] WWTP effluent
LDHe [rel. LDHe
activity]
XTT [% Viability (SD)]
NR [% Viability (SD)]
SRB [% Viability (SD)]
Degree of cytotoxicity
Comet [OTM (SEM)]
p-value
Ozonation [5 mg/L]
neg. control 0 100.0 (0.00)
100.0 (0.00) 100.0 (0.00) 0 0.13 (0.007)
pos. Control 100 1.29 (0.32) 0.2 (0.00) 4.8 (0.00) 3 0.36 (0.013) ***
Matrix control 0 95.0 (0.10) 87.0 (0.08) 86.0 (0.06) 0 0.17 (0.022) n.s.
0 min 0 89.1 (2.88) 91.9 (0.98) 86.8 (3.68) 0 0.20 (0.024) n.s.
60 min 0 95.7 (2.95)
102.9 (3.97) 89.2 (3.17) 0 0.21 (0.034) n.s.
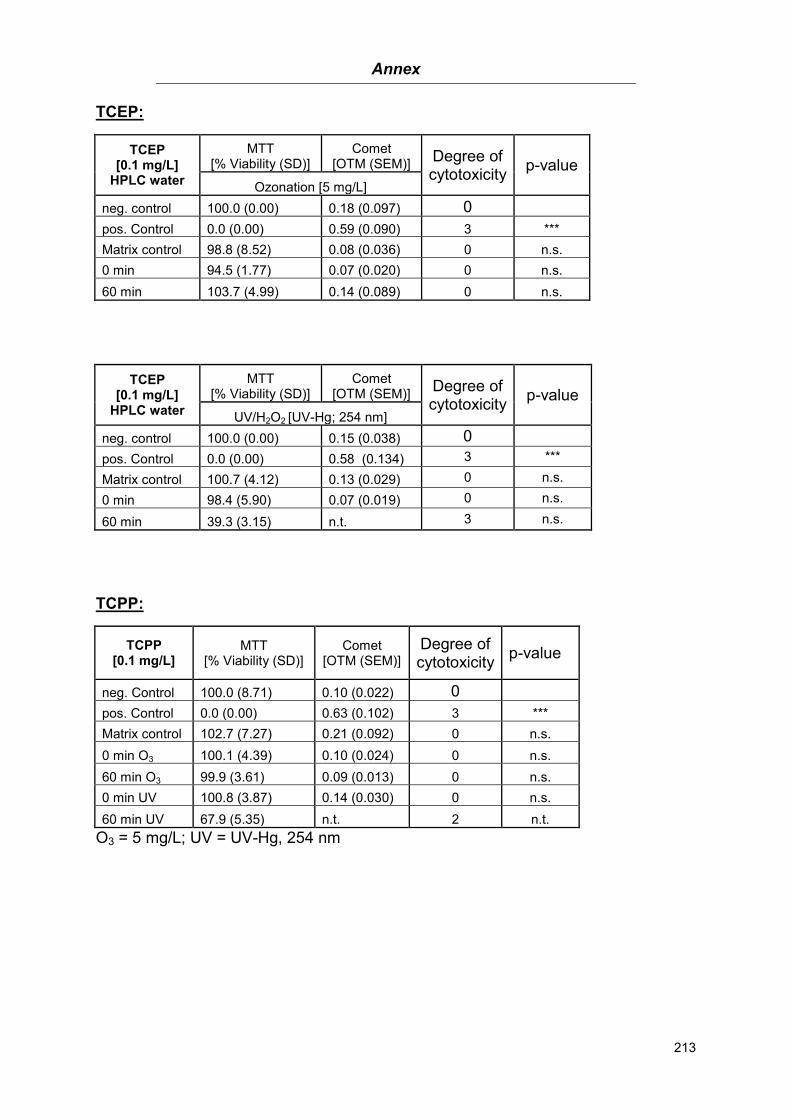
Annex
213
TCEP:
TCEP [0.1 mg/L]
HPLC water
MTT [% Viability (SD)]
Comet [OTM (SEM)]
Degree of cytotoxicity
p-value
Ozonation [5 mg/L]
neg. control 100.0 (0.00) 0.18 (0.097) 0
pos. Control 0.0 (0.00) 0.59 (0.090) 3 ***
Matrix control 98.8 (8.52) 0.08 (0.036) 0 n.s.
0 min 94.5 (1.77) 0.07 (0.020) 0 n.s.
60 min 103.7 (4.99) 0.14 (0.089) 0 n.s.
TCEP [0.1 mg/L]
HPLC water
MTT [% Viability (SD)]
Comet [OTM (SEM)]
Degree of cytotoxicity
p-value
UV/H2O2 [UV-Hg; 254 nm]
neg. control 100.0 (0.00) 0.15 (0.038) 0
pos. Control 0.0 (0.00) 0.58 (0.134) 3 ***
Matrix control 100.7 (4.12) 0.13 (0.029) 0 n.s.
0 min 98.4 (5.90) 0.07 (0.019) 0 n.s.
60 min 39.3 (3.15) n.t. 3 n.s.
TCPP:
TCPP [0.1 mg/L]
MTT [% Viability (SD)]
Comet [OTM (SEM)]
Degree of cytotoxicity
p-value
neg. Control 100.0 (8.71) 0.10 (0.022) 0
pos. Control 0.0 (0.00) 0.63 (0.102) 3 ***
Matrix control 102.7 (7.27) 0.21 (0.092) 0 n.s.
0 min O3 100.1 (4.39) 0.10 (0.024) 0 n.s.
60 min O3 99.9 (3.61) 0.09 (0.013) 0 n.s.
0 min UV 100.8 (3.87) 0.14 (0.030) 0 n.s.
60 min UV 67.9 (5.35) n.t. 2 n.t.
O3 = 5 mg/L; UV = UV-Hg, 254 nm

Annex
214
Terbutryn:
Terbutryn [0.2 mg/L]
MTT [% Viability (SD)]
Comet [OTM (SEM)]
Degree of cytotoxicity
p-value
neg. control 100.0 (0.00) 1.00 0
pos. control 0.3 (0.24) 5.88 (0.200) 3 ***
0 µg/L O3 91.8 (6.56) 1.46 (0.172) 0 **
36 µg/L O3 101.1 (3.40) 2.47 (0.263) 0 ***
100 µg/L O3 90.9 (4.72) 2.36 (0.296) 0 ***
195 µg/L O3 91.9 (2.77) 2.47 (0.341) 0 ***
800 µg/L O3 86.8 (6.52) 0.55 (0.083) 0 n.s.
TPP:
TPP [0.1 mg/L]
MTT [% Viability (SD)]
Comet [OTM (SEM)]
Degree of cytotoxicity
p-value
neg. control 100.0 (8.71) 0.19 (0.039) 0
pos. control 14.0 (0.84) 0.59 (0.071) 3 ***
Matrix control 100.5 (4.53) 0.24 (0.065) 0 n.s.
0 min O3 102.3 (4.14) 0.60 (0.090) 0 ***
60 min O3 96.6 (10.05) 0.12 (0.020) 0 n.s.
0 min UV 99.1 (3.88) 0.34 (0.052) 0 ***
60 min UV 96.7 (2.42) 0.14 (0.011) 0 n.s.
O3 = 5 mg/L; UV = UV-Hg, 254 nm
Triclosan:
Triclosan [µg/L] MTT
[% Viability (SD)] Comet
[OTM (SEM)]
Degree of cytotoxicity
p-value
neg. control 100.0 (0.00) 0.21 (0.015) 0
pos. control 32.2 (7.36) 0.64 (0.033) 3 ***
0.5 104.7 (7.93) 0.23 (0.019) 0 n.s.
1 108.0 (3.74) 0.36 (0.043) 0 *
5 107.7 (2.36) 0.40 (0.040) 0 n.s.
10 102.0 (2.16) 0.45 (0.049) 0 **
50 99.3 (2.49) 0.65 (0.069) 0 **
100 97.0 (2.45) 0.57 (0.047) 0 *
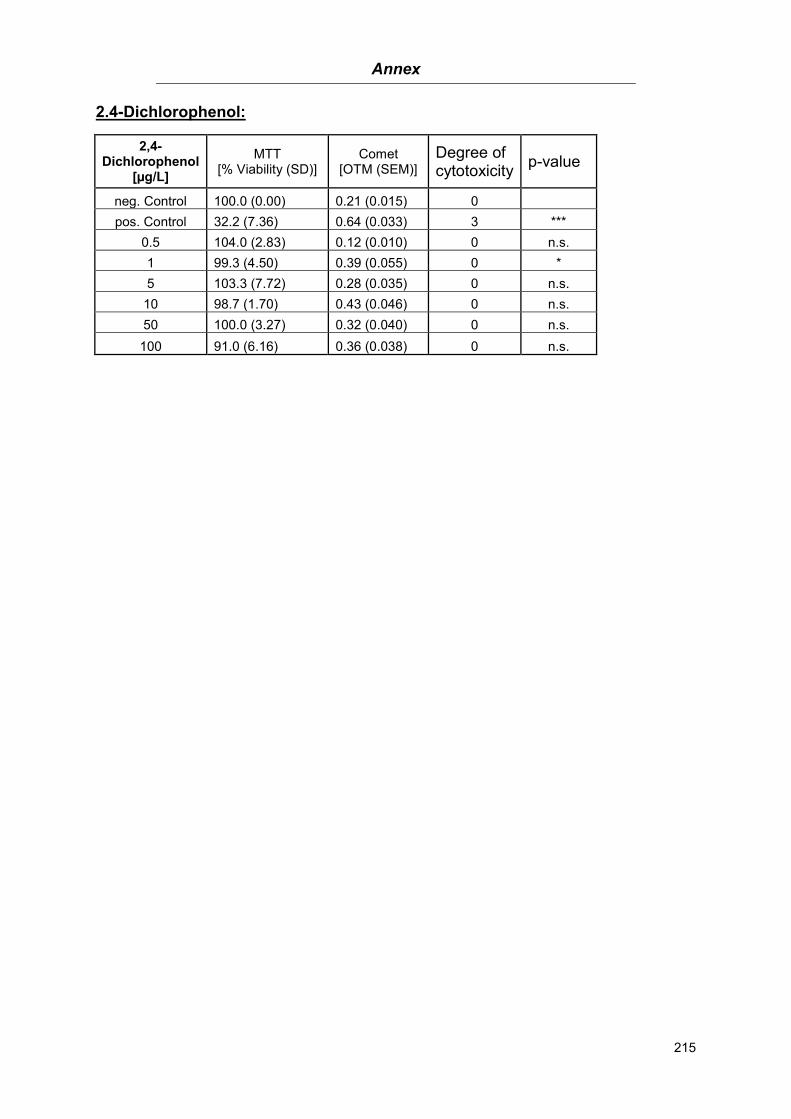
Annex
215
2.4-Dichlorophenol:
2,4-Dichlorophenol
[µg/L]
MTT [% Viability (SD)]
Comet [OTM (SEM)]
Degree of cytotoxicity
p-value
neg. Control 100.0 (0.00) 0.21 (0.015) 0
pos. Control 32.2 (7.36) 0.64 (0.033) 3 ***
0.5 104.0 (2.83) 0.12 (0.010) 0 n.s.
1 99.3 (4.50) 0.39 (0.055) 0 *
5 103.3 (7.72) 0.28 (0.035) 0 n.s.
10 98.7 (1.70) 0.43 (0.046) 0 n.s.
50 100.0 (3.27) 0.32 (0.040) 0 n.s.
100 91.0 (6.16) 0.36 (0.038) 0 n.s.
Annex
216
Erklärung 8.7.
Hiermit versichere ich, dass ich die vorliegende Arbeit mit dem Titel
„Toxicological in vitro evaluation of organic micropollutants before and after oxidative
waste water treatment”
selbst verfasst und keine außer den angegebenen Hilfsmitteln und Quellen benutzt
habe, und dass die Arbeit in dieser oder ähnlicher Form noch bei keiner anderen
Universität eingereicht wurde.
Wuppertal, im Januar 2013


![β-Myrcene [123-35-3] Review of Toxicological … 1997 Integrated Laboratory Systems β-Myrcene [123-35-3] Review of Toxicological Literature Prepared for Errol Zeiger, Ph.D. National](https://static.fdocument.pub/doc/165x107/5af18c4c7f8b9ac57a900644/-myrcene-123-35-3-review-of-toxicological-1997-integrated-laboratory-systems.jpg)