5K FINI LOOP #1 LOOP #2 MILE MARKER5K FINI LOOP #1 LOOP #2 MILE MARKER
Causal Loop Diagramming Conventions
忠北大學校 金 相 郁 敎授 [email protected]
Topic-06
System Dynamics
Spring, 2015
1. Structuring CLD
2. Diagramming Rules
3. CLD Exercises
Contents
Contents

Objective
2
The old adage "if the only tool you have is a hammer, every-thing begins to look like
a nail" can also apply to language. If our language is linear and static, we will tend to
view and interact with our world as if it were linear and static.
Taking a complex, dynamic, and circular world and linearizing it into a set of snapshots
may make things seem simpler, but we may totally misread the very reality we were
seeking to understand.
Making such inappropriate simplifications "is like putting on your brakes and then
looking at your speedometer to see how fast you were going," says Bill Isaacs of
dialogos.
Objectives and Definition 1. Structuring CLD
Definition
3
Causal loop diagrams (CLD) provide a language for articulating our understanding of the dynamic, interconnected nature of our world. We can think of them as sentences which are constructed by linking together key variables and indicating the causal relationships between them. By stringing together several loops, we can create a coherent story about a particular problem or issue.
The next page includes some suggestions on the mechanics of creating causal loop diagrams. Below are some more general guidelines that should help lead you through the process.
1. Structuring CLD
4
Theme Selection. Creating causal loop diagrams is not an end unto itself, but part of a process of articulating and communicating deeper insights about complex issues. It is pointless to begin creating a causal loop diagram without having selected a theme or issue that you wish to understand better. "To understand the implications of changing from a technology-driven to a marketing-oriented strategy," for example, is a better theme than "to better understand our strategic planning process."
Time Horizon. It is also helpful to determine an appropriate time horizon for the issue-one long enough to see the dynamics play out. For a change in corporate strategy, the time horizon may span several years, while a change in advertising campaigns may be on the order of months. Time itself should not be included as a causal agent, however. After a heavy rainfall a river level steadily rises over time, but we would not attribute it to the passage of time. You need to identify what is actual driving the change. In manufacturing, for example, costs of a new product often decline over time. It would be incorrect, however, to draw a causal connection between time and unit costs. Instead, process improvements and learning curve effects are likely causal forces.
1. Structuring CLD Articulating Reality
5
Behavior Over Time Charts. Identifying and drawing out the behavior over time of key variables is an important first step toward articulating the current understanding of the system. Drawing out future behavior means taking a risk-the risk of being wrong. The fact is, any projection of the future will be wrong, but by making it explicit, we can test our assumptions and uncover inconsistencies that may otherwise never get surfaced. For example, drawing projections of steady productivity growth while training dollars are shrinking raises the question "If training is not driving productivity, what will?" The behavior over time diagram also points out key variables that should be included in the diagram, such as training budget and productivity. Your diagram should try to capture the structure that will produce the projected behavior.
Boundary Issue. How do you know when to stop adding to your diagram? If you don't stay focused on the issue, you may quickly find yourself overwhelmed by the number of connections possible. Remember, you are not trying to draw out the whole system-only what is critical to the theme being addressed. When in doubt about including something, ask, "If I were to double or halve this variable, would it have a significant effect on the issue I am mapping?" If not, it probably can be omitted.
1. Structuring CLD

6
Level of Aggregation. How detailed should the diagram be? Again, this should be determined by the issue itself. The time horizon also can help determine how detailed the variables need to be. If the time horizon is on the order of weeks (fluctuations on the production line), variables that change slowly over a period of many years may be assumed to be constant (such as building new factories). As a rule of thumb, the variables should not describe specific events (a broken pump); they should represent patterns of behavior (pump breakdowns throughout the plant).
Significant Delays. Make sure to identify which (if any) links have significant delays relative to the rest of the diagram. Delays are important because they are often the source of imbalances that accumulate in the system. It may help to visualize pressures building up in the system by viewing the delay connection as a relief valve that either opens slowly as pressure builds or opens abruptly when the pressure hits a critical value. An example of this might be a delay between long work hours and burnout: after sustained periods of working 60+ hours per week, a sudden collapse might occur in the form of burnout.
1. Structuring CLD
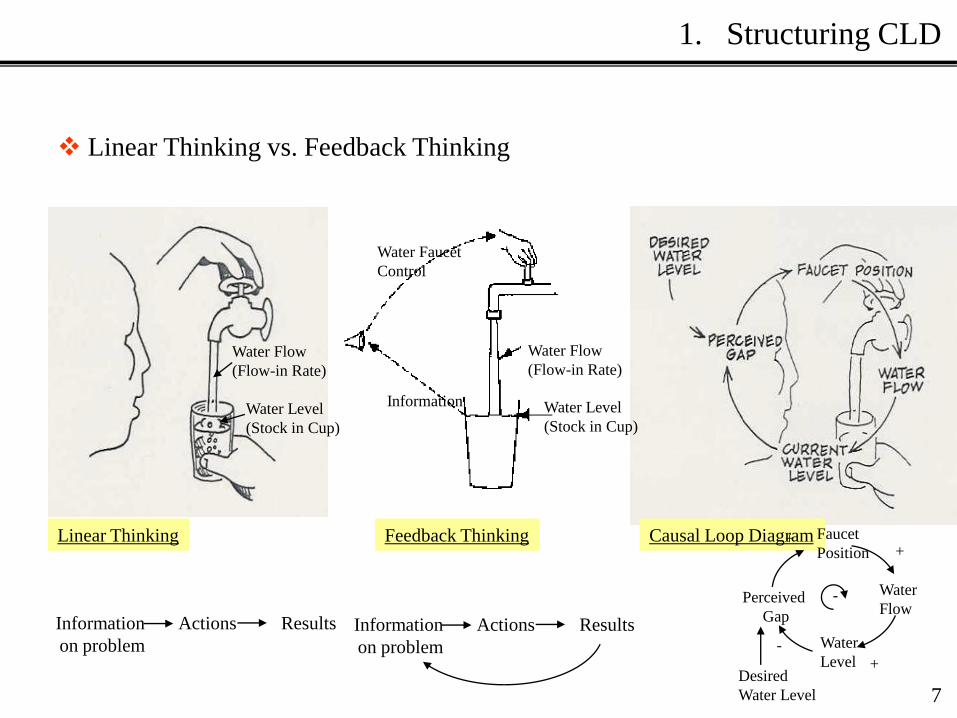
Linear Thinking vs. Feedback Thinking
Linear Thinking
Information
on problem
Actions Results
Feedback Thinking
Water Level
(Stock in Cup)
Information
Water Flow
(Flow-in Rate)
Water Faucet
Control
Causal Loop Diagram
Water
Level
Water
Flow Perceived
Gap
Faucet
Position
Desired
Water Level
+
-
+ +
-
7
1. Structuring CLD
Water Flow
(Flow-in Rate)
Water Level
(Stock in Cup)
Information
on problem
Actions Results
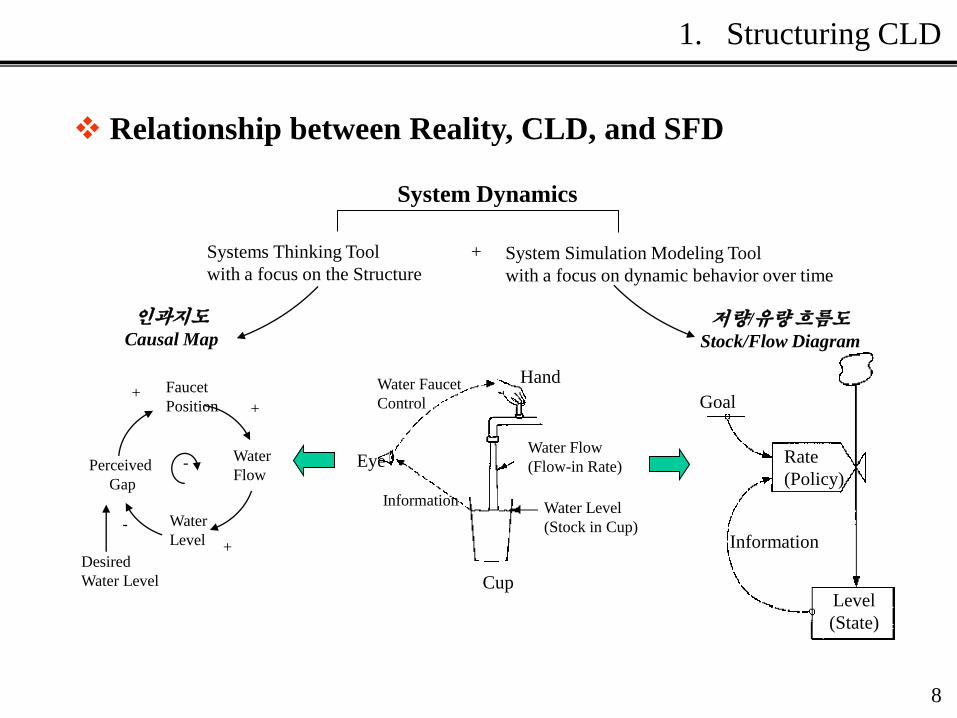
Relationship between Reality, CLD, and SFD
System Dynamics
Systems Thinking Tool
with a focus on the Structure System Simulation Modeling Tool
with a focus on dynamic behavior over time
+
Hand
Eye
Cup
Information
Rate
(Policy)
Information
Goal
Level
(State)
인과지도
Causal Map 저량/유량 흐름도
Stock/Flow Diagram
8
1. Structuring CLD
Water Faucet
Control
Water
Level
Water
Flow Perceived
Gap
Faucet
Position
Desired
Water Level
+
-
+ +
-
Water Level
(Stock in Cup)
Water Flow
(Flow-in Rate)

9
1. Structuring CLD
Systems thinking can be thought of as a language for communicating about complexities
and interdependencies. In particular, the following qualities make systems thinking a
useful framework for discussing and analyzing complex issues:
• Focuses on "closed interdependencies." The language of systems thinking is circular
rather than linear. It focuses on closed interdependencies, where x influences y, y
influences z, and z influences x.
• A "visual" language. Many of the systems thinking tools—causal loop diagrams,
behavior-over-time diagrams, systems archetypes, and structural diagrams—have a
strong visual component. They help clarify complex issues by summing up, concisely
and clearly, the key elements involved.
10
1. Structuring CLD
Diagrams also facilitate learning. Studies have shown that many people learn best
through representational images, such as pictures or stories. A systems diagram is a
powerful communication tool because it distills the essence of a problem into a format
that can be easily remembered, yet is rich in implications and insights.
• Adds precision. The specific set of "syntactical" rules that govern systems diagrams
greatly reduces the ambiguities and miscommunications that can occur when tackling
complex issues.
Example: In drawing out the relationships between key aspects of a problem, causal
links are not only indicated by arrows, but are labeled "s" (same) or "o" (opposite) to
specify how one variable affects another. Such labeling makes the nature of the
relationship more precise, ensuring only one possible interpretation.
• Forces an "explicitness" of mental models. The systems thinking language translates
"war stories" and individual perceptions of a problem into black-and-white pictures that
can reveal subtle differences in viewpoint.
Example: In one systems thinking course, a team of managers was working on an issue
they had been wrestling with for months. One manager was explaining his position,
tracing through the loops he had drawn, when a team member stopped him. "Does that
model represent your thinking about this problem?" he asked.
Variables
인과지도 구성요소
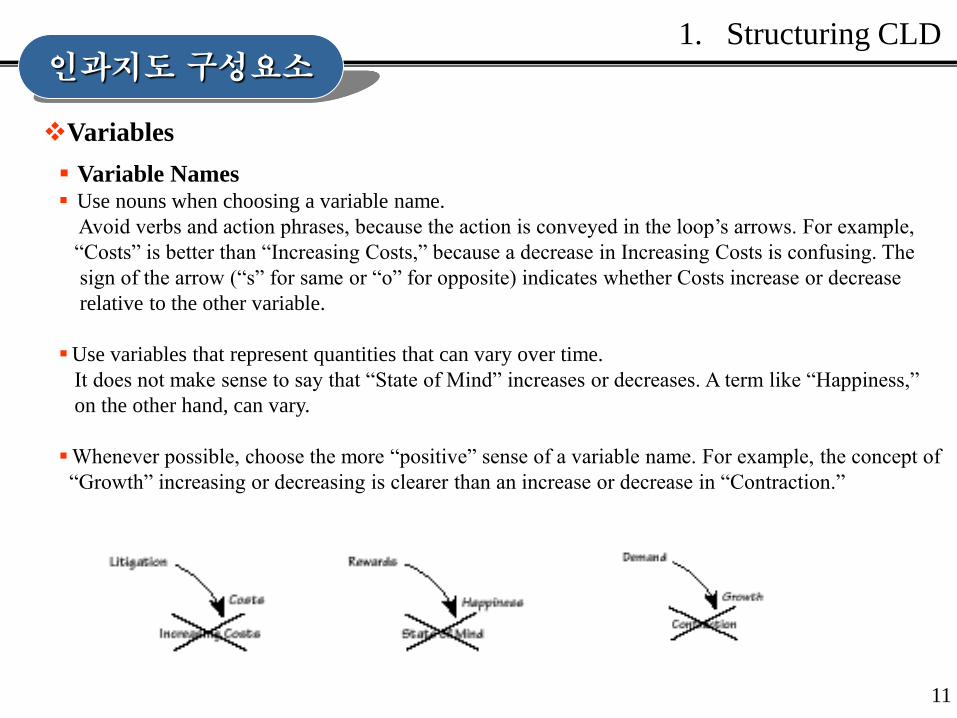
Variable Names Use nouns when choosing a variable name.
Avoid verbs and action phrases, because the action is conveyed in the loop’s arrows. For example,
“Costs” is better than “Increasing Costs,” because a decrease in Increasing Costs is confusing. The
sign of the arrow (“s” for same or “o” for opposite) indicates whether Costs increase or decrease
relative to the other variable.
Use variables that represent quantities that can vary over time.
It does not make sense to say that “State of Mind” increases or decreases. A term like “Happiness,”
on the other hand, can vary.
Whenever possible, choose the more “positive” sense of a variable name. For example, the concept of
“Growth” increasing or decreasing is clearer than an increase or decrease in “Contraction.”
11
1. Structuring CLD

변수의 종류
분류 관점 변수 명 역할
존재론적 관점
내생 변수 (Endogenous
Variables)
시스템 범주(system boundary) 내에 존재하면서 시스템
행태의 특성과 행태에 영향을 끼치는 시스템 구성요소
외생 변수 (Exogenous
Variables)
시스템 범주(system boundary) 밖에 존재하면서 내생변
수 간 함수관계를 설정하기 위해 동원되는 '보조변수 (auxiliary variable)'로 시스템의 구조에는 영향을 끼치지
않음. 변수 값의 변화에 따라 시스템의 행태 에 간접적으로 작용하지만 정작 자신은 그 시스템으로부터 영향을 받지 않음
역할론적 관점
저량/수준 변수 (Stock, Level Variables)
유량변수의 단위시간 당 변화량에 따라 그 결과로 나타나는 성과변수(performance variables)
유량/변화율 변수 (Endogenous Variables)
단위시간 당 변화에 따라 수준변수의 결과(값)에 직접적인 영향을 주는 조절변수(Control Variables)
보조 혹은 매개 변수(Auxiliary Variables, Parameters)
계량적으로 내생변수 간 함수관계를 설정하거나 변화율 변수의 계산식을 단순화하기 위해 동원되는 변수
㈜ 역할론적 관점에서의 변수의 분류는 시스템 시뮬레이션의 기초 모델이 되는 저량-유량지도(SFD: Stock-Flow Diagram)에서만 적용되며, 인과지도(CLD: Causal Loop Diagram)에서는 존재론적 관점에서의 변수 분류만이 적용 12
1. Structuring CLD
Link & Polarity
13
1. Structuring CLD
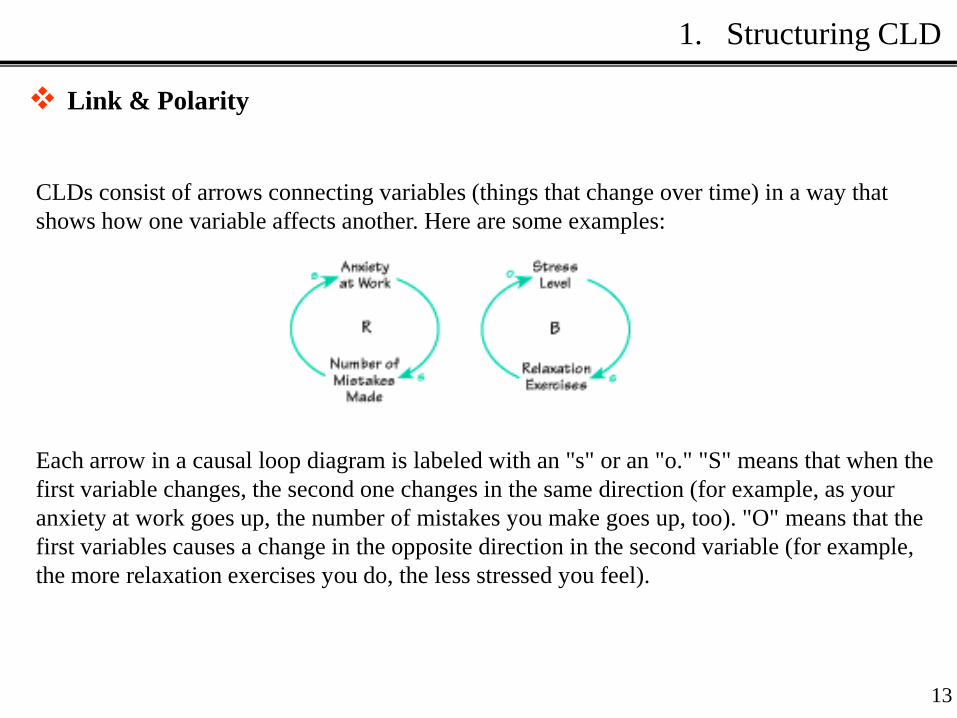
CLDs consist of arrows connecting variables (things that change over time) in a way that
shows how one variable affects another. Here are some examples:
Each arrow in a causal loop diagram is labeled with an "s" or an "o." "S" means that when the
first variable changes, the second one changes in the same direction (for example, as your
anxiety at work goes up, the number of mistakes you make goes up, too). "O" means that the
first variables causes a change in the opposite direction in the second variable (for example,
the more relaxation exercises you do, the less stressed you feel).
Link & Polarity
13
1. Structuring CLD
In CLDs, the arrows come together to form loops, and each loop is labeled with an "R" or a
"B." "R" means reinforcing; i.e., the causal relationships within the loop create exponential
growth or collapse. (For instance, the more anxious you are at work, the more mistakes you
make, and as you make more mistakes, you get even more anxious, and so on, in a vicious,
upward spiral). "B" means balancing; i.e., the causal influences in the loop keep things in
equilibrium. (For example, if you feel more stressed, you do more relaxation exercises, which
brings your stress level down.)
CLDs can contain many different "R" and "B" loops, all connected together with arrows. By
drawing these diagrams with your work team or other colleagues, you can get a rich array of
perspectives on what's happening in your organization. You can then look for ways to make
changes so as to improve things. For example, by understanding the connection between
anxiety and mistakes, you could look for ways to reduce anxiety in your organization.

Link & Polarity
Causal Link
Indicates causal relationship between variables, and its direction
+ / - (Link Polarity)
Helps you determine whether the links are positive or negative.
Chicken Egg Lions Deer
(Archetype)
(Example)
X Y
혹은
(Archetype)
(Example)
X Y +, -
X Y S, O
13
1. Structuring CLD

• All else equal, if X increases (decreases), then Y increases
(decreases) above (below) what it would have been.
In the case of accumulations, X adds to Y.
Link Polarity
Polarities must be clearly defined without any ambiguity. When you have trouble assigning
a clear and unambiguous polarity to a link it usually means there is more than one causal
pathway connecting the two variables.
• Price has at least two effects on revenue: (1) it determines
how much revenue is generated per unit sold and (2) it
affects the number of units sold.
That is, Revenue = Price * Sales, and (Unit) Sales depend
on Price (presumably the demand curve is downward
sloping: Higher prices reduce sales)
Therefore, proper diagram is left lower one.
?(+ or -)
(incorrect)
(correct)
9
1. Structuring CLD
• All else equal, if X increases (decreases), then Y decreases
(increases) below (above) what it would have been.
In the case of accumulations, X subtracts from Y.
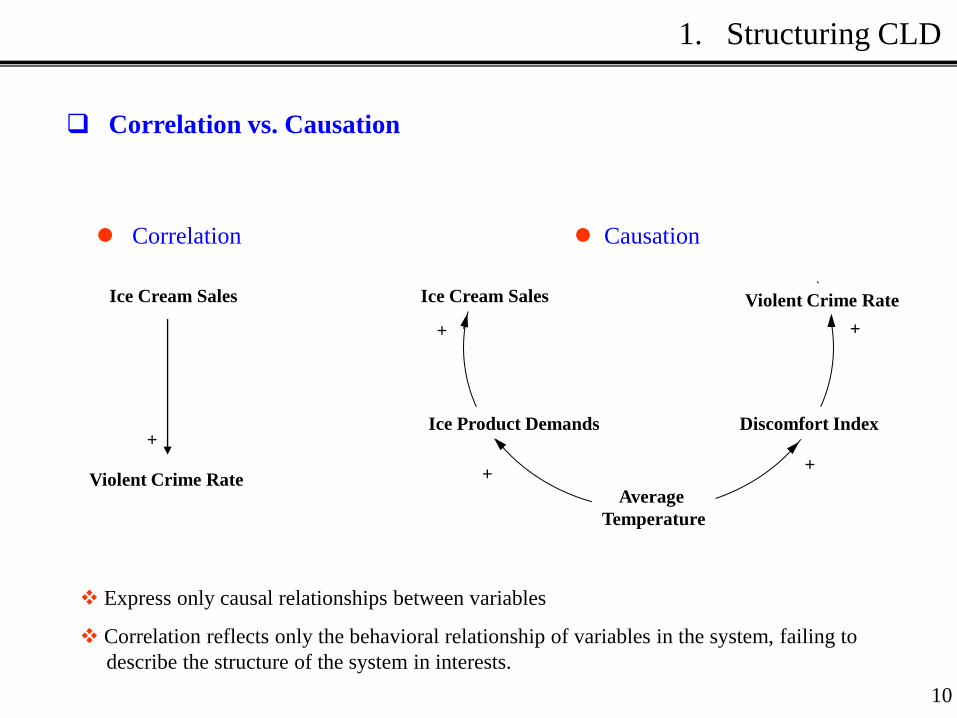
Correlation
Ice Cream Sales
Violent Crime Rate
+
Ice Cream Sales Violent Crime Rate
Average
Temperature
Ice Product Demands Discomfort Index
+ +
+ +
Express only causal relationships between variables
Correlation reflects only the behavioral relationship of variables in the system, failing to
describe the structure of the system in interests.
Causation
Correlation vs. Causation
10
1. Structuring CLD
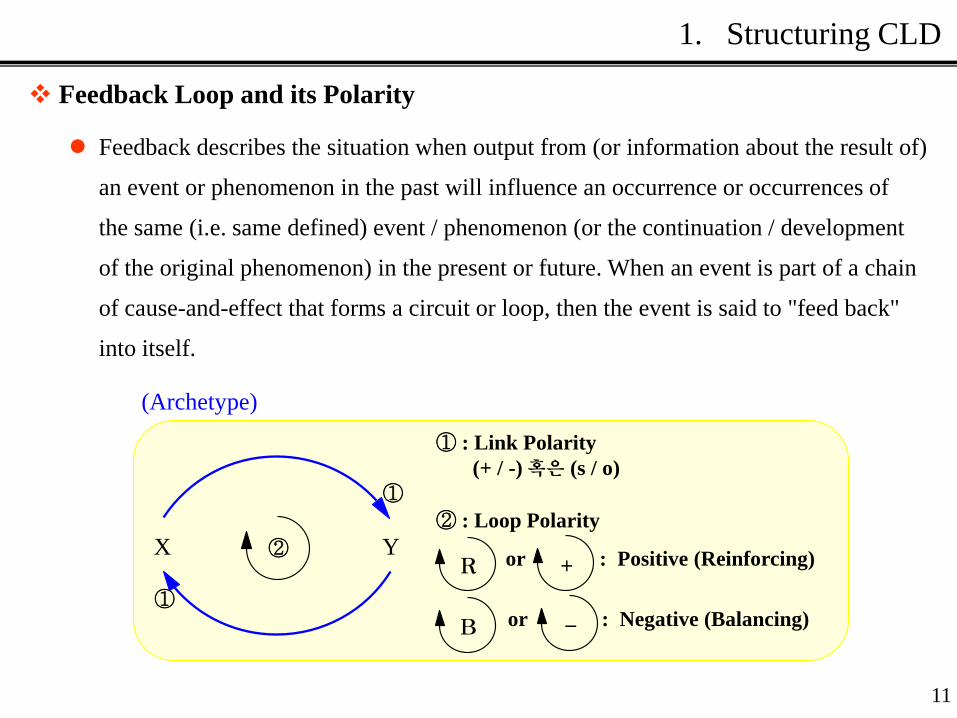
Feedback describes the situation when output from (or information about the result of)
an event or phenomenon in the past will influence an occurrence or occurrences of
the same (i.e. same defined) event / phenomenon (or the continuation / development
of the original phenomenon) in the present or future. When an event is part of a chain
of cause-and-effect that forms a circuit or loop, then the event is said to "feed back"
into itself.
(Archetype)
Y X
①
①
②
① : Link Polarity
(+ / -) 혹은 (s / o)
R + or : Positive (Reinforcing)
B - or : Negative (Balancing)
② : Loop Polarity
Feedback Loop and its Polarity
11
1. Structuring CLD
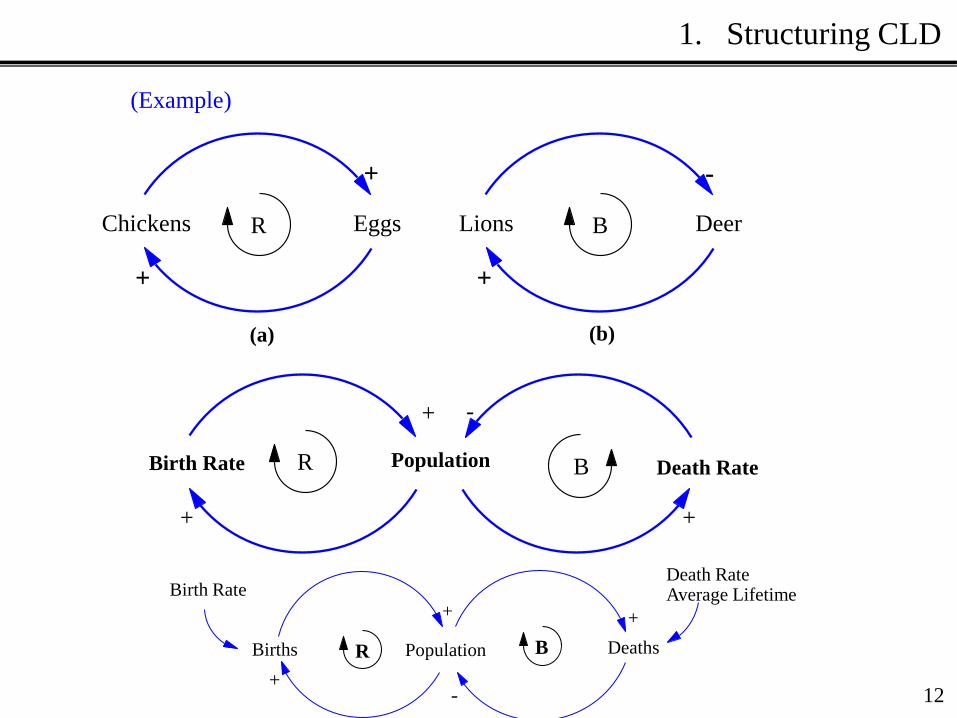
Population Birth Rate
+
+
B R
-
Death Rate
+
Eggs Chickens
+
+
R
(a)
Deer Lions
-
+
B
(b)
(Example)
Population
+
Births
+
Birth Rate
R Deaths
-
+
B
Death Rate Average Lifetime
12
1. Structuring CLD
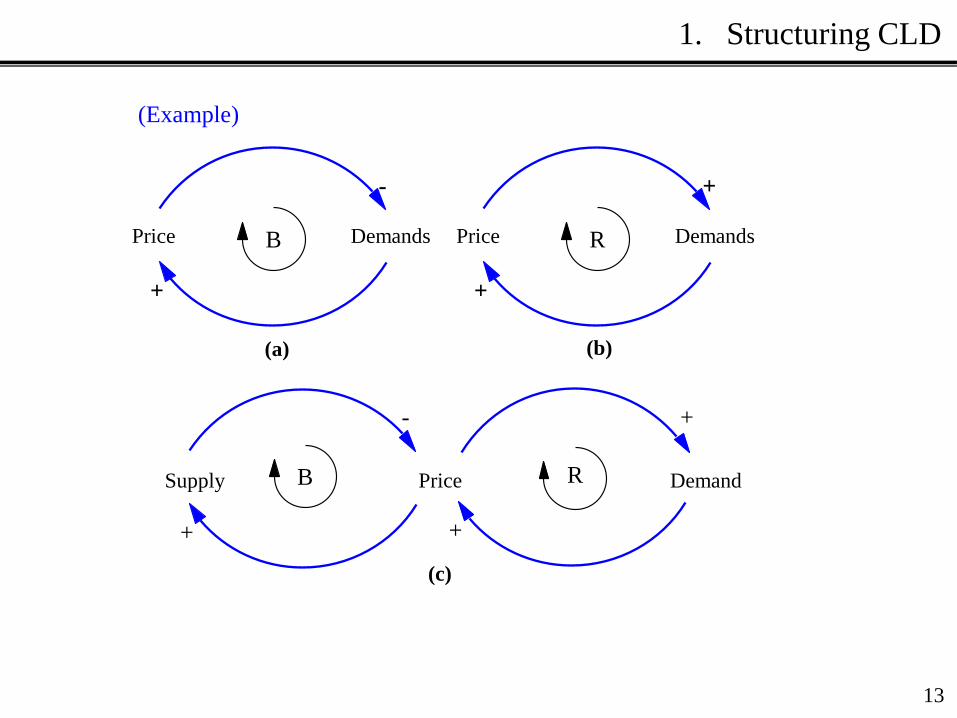
Price Supply
-
+
R B
+
Demand
+
Demands Price
-
+
B
(a)
Demands Price
+
+
R
(b)
(Example)
(c)
13
1. Structuring CLD
Digestion Digestibility
+
?
?
(a)
Digestion Digestibility
+
+
B
(b)
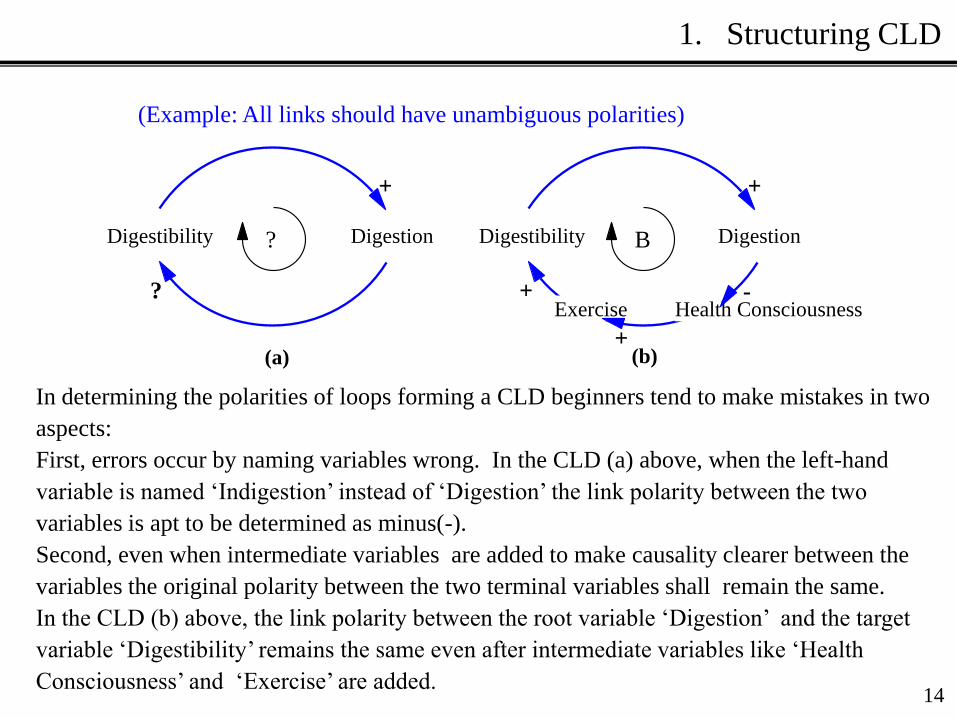
(Example: All links should have unambiguous polarities)
Health Consciousness Exercise
+
-
In determining the polarities of loops forming a CLD beginners tend to make mistakes in two
aspects:
First, errors occur by naming variables wrong. In the CLD (a) above, when the left-hand
variable is named ‘Indigestion’ instead of ‘Digestion’ the link polarity between the two
variables is apt to be determined as minus(-).
Second, even when intermediate variables are added to make causality clearer between the
variables the original polarity between the two terminal variables shall remain the same.
In the CLD (b) above, the link polarity between the root variable ‘Digestion’ and the target
variable ‘Digestibility’ remains the same even after intermediate variables like ‘Health
Consciousness’ and ‘Exercise’ are added. 14
1. Structuring CLD

Polarities of Links and Loops
Bank Cash
Reserves
Perceived Solvency of Bank
Net Withdrawals
Market
Attractiveness
Profits Number of
Competitors
Price
Cumulative
Production
Market Share
Unit Costs
Price
Clean up
Effort
Environmental
Quality
Pressure to Clean
up Environment
+
- +
+
B
-
+
+
-
R
+
+
-
B +
-
-
R
15
1. Structuring CLD
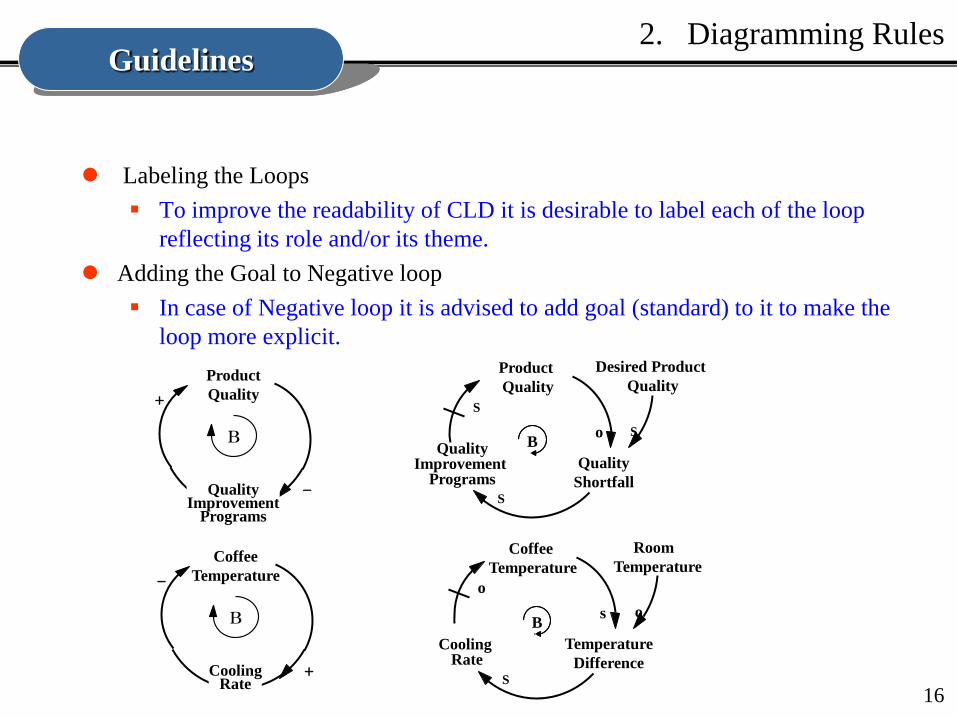
Labeling the Loops
To improve the readability of CLD it is desirable to label each of the loop
reflecting its role and/or its theme.
Adding the Goal to Negative loop
In case of Negative loop it is advised to add goal (standard) to it to make the
loop more explicit.
Product
Quality
Quality Improvement
Programs
B
+
-
Coffee
Temperature
Cooling Rate
B
-
+
Product
Quality
Quality
Shortfall
Quality Improvement
Programs
Desired Product
Quality
o
S
S
S B
Coffee
Temperature
Temperature
Difference
Cooling Rate
Room
Temperature
s
S
o
o B
Guidelines
16
2. Diagramming Rules

Cleanup
Effort
Environmental
Quality B
-
+
Cleanup
Effort
Environmental
Quality
gap
Pollution
Tolerance
+
-
+
+
Heater
Operation
Room
Temperature
-
+
Heater
Operation
Room
Temperature
차이
(gap) Desired Temperature
+
-
+
+
(a)
(b)
B
B B
17
2. Diagramming Rules

Indicate important delays in causal links
Include delays that are important to the dynamic hypothesis or significant relative to your time horizon
Variable names
Variable names should be nouns or noun phrase
Chickens Eggs
+
Delay
+
Delay
Price Supply
Price Rises Costs Rise
+ Price Costs
+
(X) (O)
18
2. Diagramming Rules
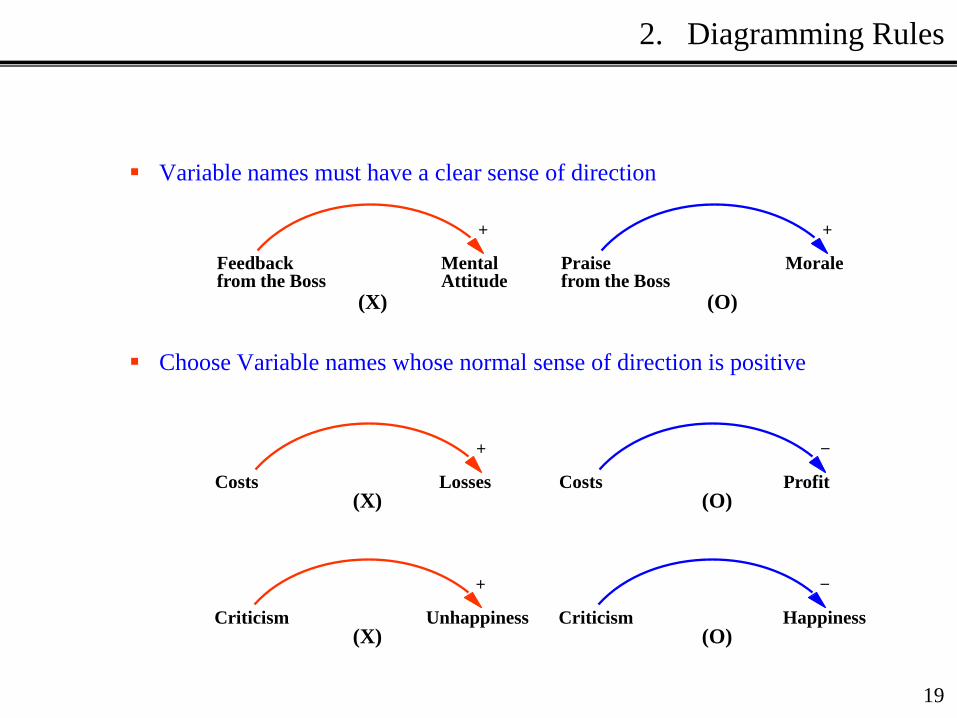
Variable names must have a clear sense of direction
Choose Variable names whose normal sense of direction is positive
Mental Attitude
Feedback from the Boss
+
Morale Praise from the Boss
+
Losses Costs
+
Profit Costs
-
Unhappiness Criticism
+
Happiness Criticism
-
(X) (O)
(X) (O)
(X) (O)
19
2. Diagramming Rules
Choose the right level of aggregation
CLDs are designed to communicate the central feedback structure of your
dynamic hypothesis. Having too much detail make it hard to see the overall
feedback loop structure and how the different loops interact.
Don’t put all the loops into one large diagram
Short-term memory can hold 72(magic number 7) chunks of information at
once.
Resist temptation to put all the loops you have identified into a single
comprehensive diagram.
Distinguish between actual and perceived conditions
Often there are significant differences between the true state of affairs and the
perception of that state by the actors in the system.
That is because there may be noise, measurement error, bias, and distortion
involved in information processing .
20
2. Diagramming Rules
Make use of interview data for developing CLD
Much of the data a modeler uses to develop a dynamic hypothesis comes from
interviews and conversations rather than from the literature
Interviews , however, are almost never sufficient alone and must be
supplemented by other source of data
People have only a local, partial understanding of the system, so you must
interview all relevant actors at multiple levels, including those outside the
organization (customers, suppliers, etc.)
Make use of modeler’s experiences and knowledge
You should draw on all the knowledge you have from your experiences with
the system to complete the diagram.
21
2. Diagramming Rules

Tips for CLD Layout
Use curved lines for information feedbacks. Curved lines help the reader
visualize the feedback loops.
Make important loops follow circular or oval path.
Organize your diagrams to minimize crossed lines.
Refrain from marking unnecessary symbols in the neighborhood of variables.
Iterate. Since you often won’t know what all the variables and loops will be
when you start, you will have to draw your diagrams, often many times, to find
the best layout.
22
2. Diagramming Rules
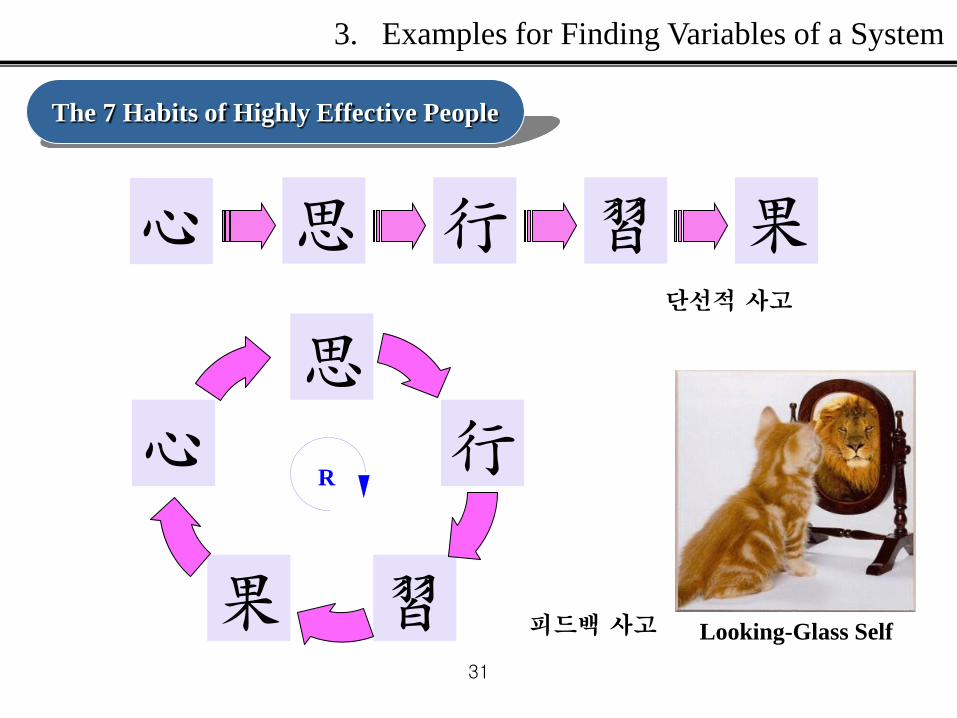
習 果 心 思 行
心
思
行
習 果
R
단선적 사고
피드백 사고
31
Looking-Glass Self
The 7 Habits of Highly Effective People
3. Examples for Finding Variables of a System
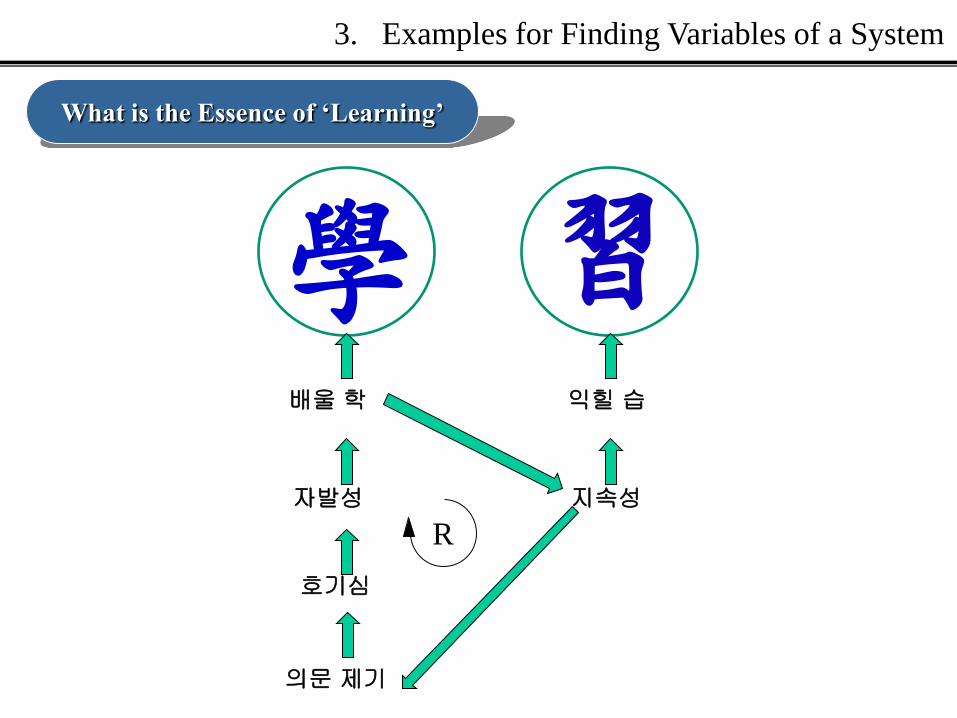
學 習 배울 학 익힐 습
자발성 지속성
호기심
의문 제기
R
What is the Essence of ‘Learning’
3. Examples for Finding Variables of a System
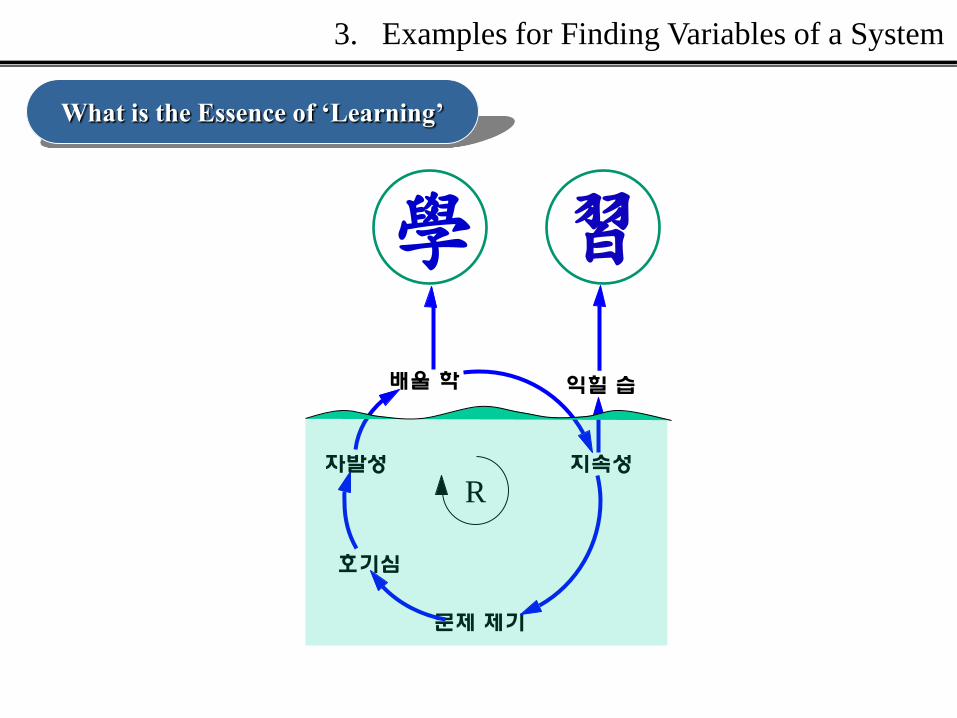
문제 제기
호기심
자발성
배울 학 익힐 습
지속성
R
學 習
What is the Essence of ‘Learning’
3. Examples for Finding Variables of a System
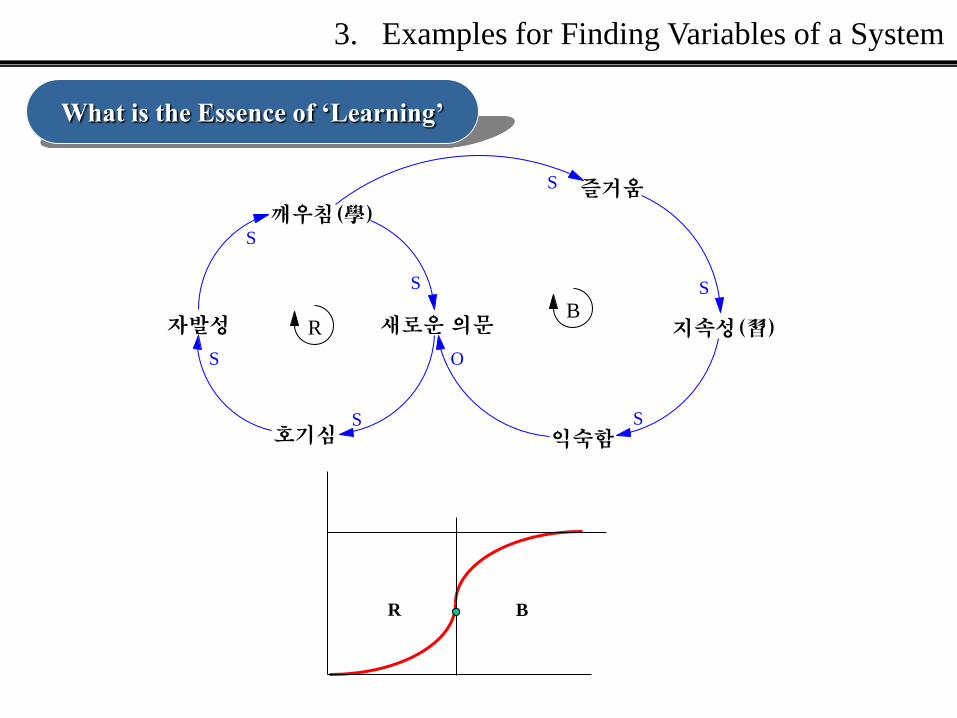
깨우침(學)
새로운 의문
호기심
자발성
즐거움
지속성(習)
익숙함
S
S
S
S
S
S
S
O
R B
R B
What is the Essence of ‘Learning’
3. Examples for Finding Variables of a System
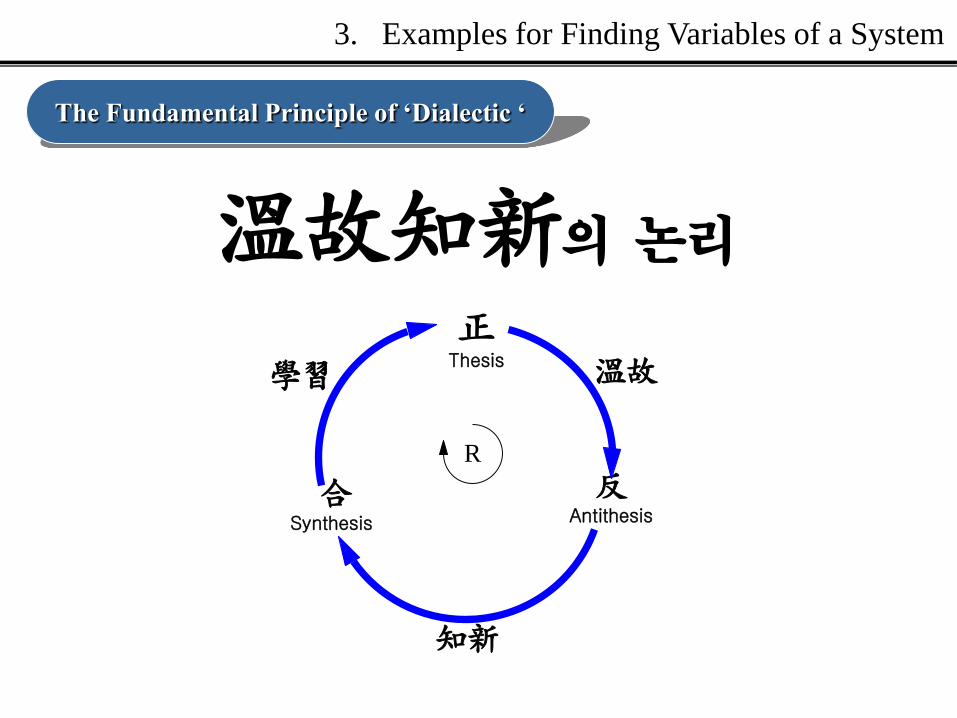
溫故知新의 논리
反 Antithesis
溫故
正 Thesis
知新
合 Synthesis
學習
R
The Fundamental Principle of ‘Dialectic ‘
3. Examples for Finding Variables of a System

36
The Lessons of 소탐대실
(incurring a great loss by pursuing a small profit)
3. Examples for Finding Variables of a System
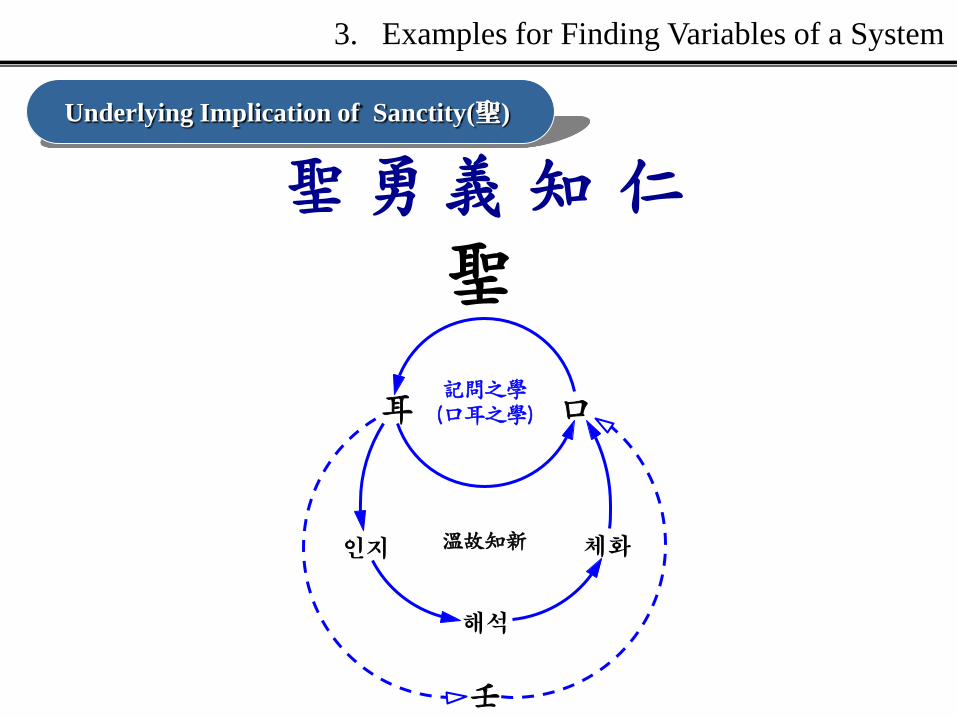
耳 口
壬
인지
해석
체화
記問之學 (口耳之學)
溫故知新
聖
聖 勇 義 知 仁
Underlying Implication of Sanctity(聖)
3. Examples for Finding Variables of a System

38
Looking at the picture below identify potential causes of the incident and classify them into
accidental and abnormal causes.
•Accidental causes:
•Abnormal causes:
As King Fredrich said, “Losing a fight can be tolerated, Being attacked by surprise shall not
be tolerated.” there are two sorts of failures; One is tolerable, the other untollerable. Most of
failures are unforgivable.
Why is it that even though similar signs (前兆) happens repeatedly, the cause of it is left
untreated?
4. Exercise
39
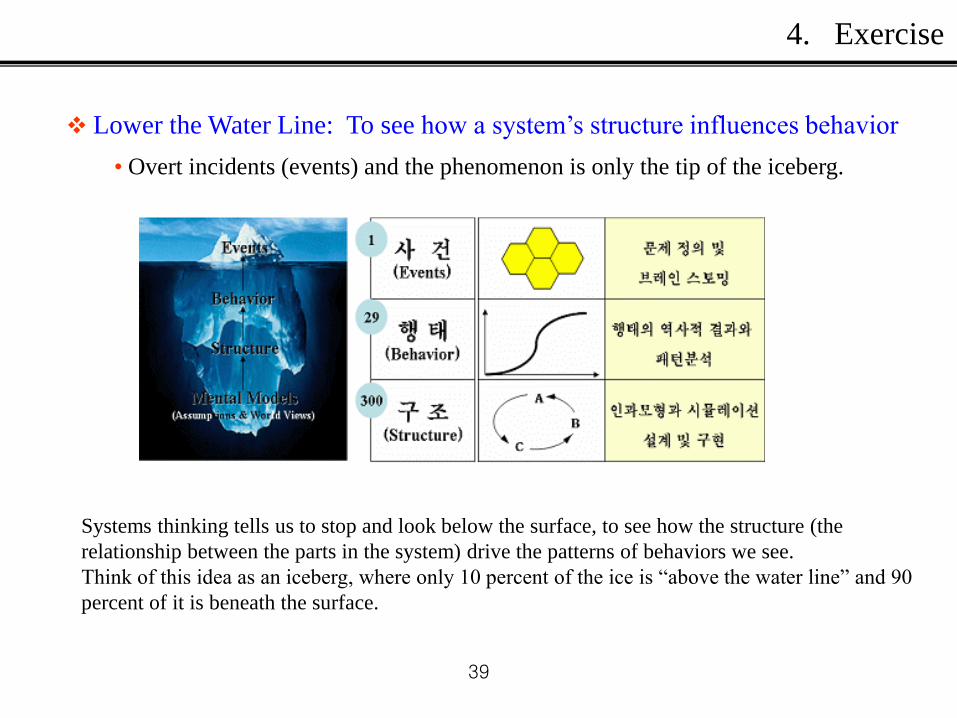
Lower the Water Line: To see how a system’s structure influences behavior
• Overt incidents (events) and the phenomenon is only the tip of the iceberg.
Systems thinking tells us to stop and look below the surface, to see how the structure (the
relationship between the parts in the system) drive the patterns of behaviors we see.
Think of this idea as an iceberg, where only 10 percent of the ice is “above the water line” and 90
percent of it is beneath the surface.
4. Exercise
40
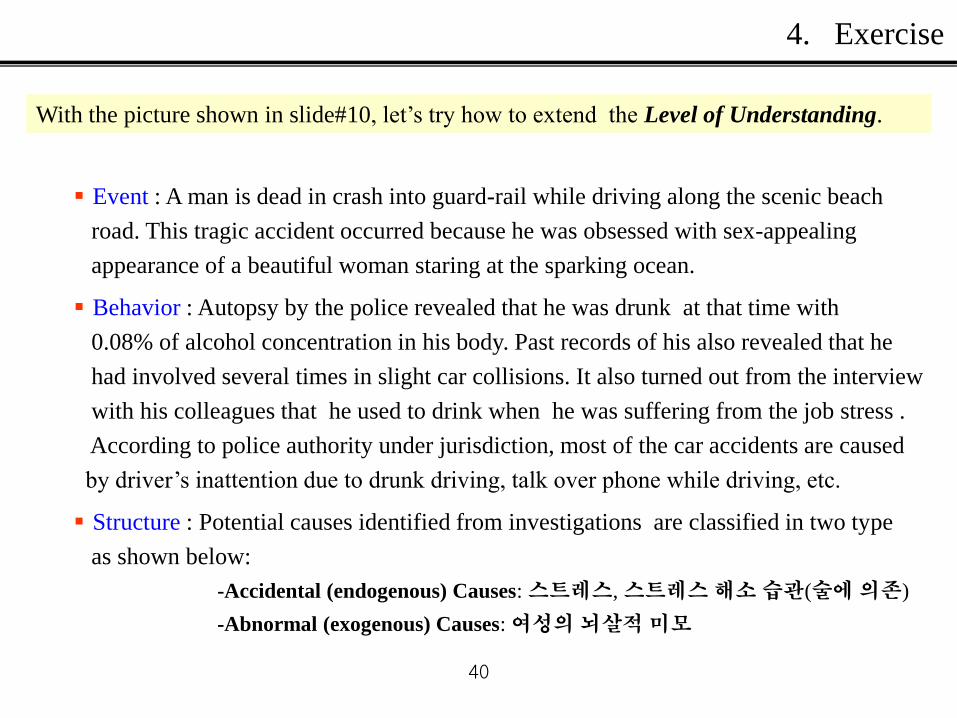
Event : A man is dead in crash into guard-rail while driving along the scenic beach
road. This tragic accident occurred because he was obsessed with sex-appealing
appearance of a beautiful woman staring at the sparking ocean.
Behavior : Autopsy by the police revealed that he was drunk at that time with
0.08% of alcohol concentration in his body. Past records of his also revealed that he
had involved several times in slight car collisions. It also turned out from the interview
with his colleagues that he used to drink when he was suffering from the job stress .
According to police authority under jurisdiction, most of the car accidents are caused
by driver’s inattention due to drunk driving, talk over phone while driving, etc.
Structure : Potential causes identified from investigations are classified in two type
as shown below:
-Accidental (endogenous) Causes: 스트레스, 스트레스 해소 습관(술에 의존)
-Abnormal (exogenous) Causes: 여성의 뇌살적 미모
With the picture shown in slide#10, let’s try how to extend the Level of Understanding.
4. Exercise

41
4. Exercise
42
World View: To find out fundamental preventive scheme for the similar car accidents
a world view (mental model) towards this problem has to be refined or extended .
As for the exemplary case we discussed before, we need to find which one of the
potential causes included in the causal loop diagram on slide #13 contributes as an
initial clue to the formulation of the fundamental scheme for the car accident prevention.
That is the variable, ‘스트레스,’ which led him to habitual drink. To disconnect this
vicious cycle permanently what kind of alternatives can you think of ?
4. Exercise

43
4. Exercise

44
Understand Unintended Consequences
• Often when we have a problem, we look for a fast way to fix it. While our solution
may ease the problem for a while, it might also have some consequences that we
never intended – and that even make the original problem worse eventually.
•(Example 1) 소탐대실(小貪大失)
4. Exercise
45
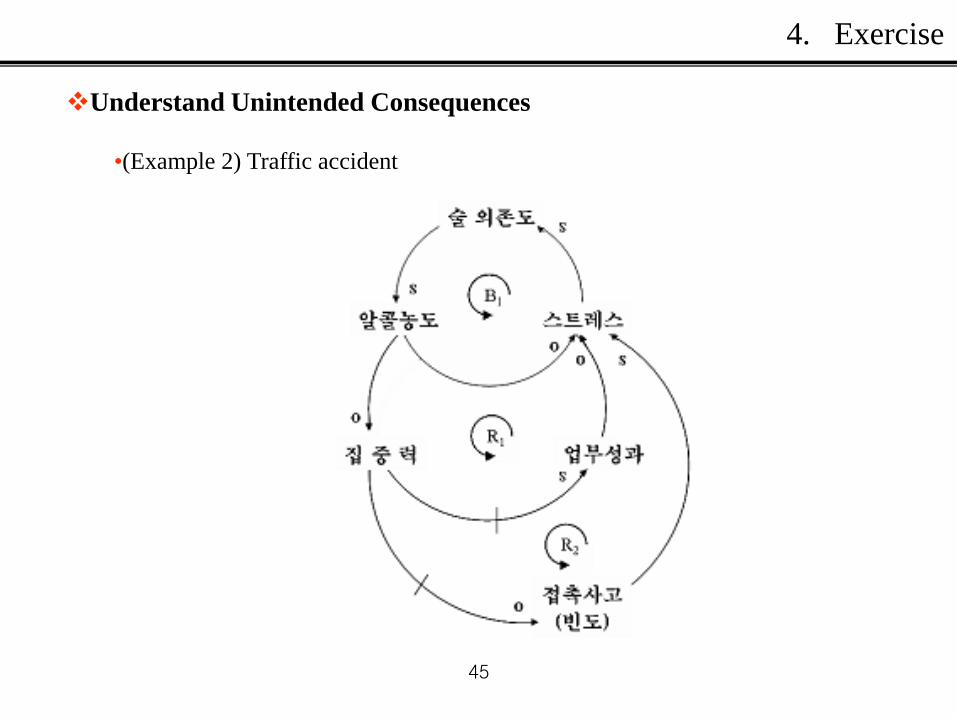
Understand Unintended Consequences
•(Example 2) Traffic accident
4. Exercise