Tools and Techniques for Debugging Embedded Linux … · Circular buffers (Case Study - MUSB) •...
38
1 Making Wireless 1 Tools and Techniques for Debugging Embedded Linux Systems
Transcript of Tools and Techniques for Debugging Embedded Linux … · Circular buffers (Case Study - MUSB) •...

1
Making Wireless
1
Tools and Techniques for DebuggingEmbedded Linux Systems
2
Making Wireless
Overview
• Debugging with prints• Logging to circular buffers• SW trace tools• ETM• Observability and GPIOs• JTAG• Register dumps and decoders

3
Making Wireless
Printf debugging
• Basic debugging technique• Simple to use

4
Making Wireless
printk loglevels
• From KERN_EMERG to KERN_DEBUG– pr_emerg to pr_debug
• Can change on the kernel command line– loglevel= parameter
• Can change after bootup– /proc/sys/kernel/printk– /proc/sysrq-trigger

5
Making Wireless
Custom debug implementations
• Example: drivers/video/omap2/dss/dss.h

6
Making Wireless
Custom debug implementations
• Example: drivers/usb/musb/musb_debug.h
7
Making Wireless
Printk tips and tricks
• CONFIG_PRINTK_TIME• CONFIG_EARLY_PRINTK
– CONFIG_DEBUG_LL and the printascii patch• CONFIG_LOG_BUF_SHIFT
• Accessing the printk buffer with a JTAG debugger
• http://elinux.org/Kernel_Debugging_Tips

8
Making Wireless
Use standard kernel debug interfaces
• pr_debug• dev_dbg
• Why?

9
Making Wireless
The problem with prints
• It can change the timing– sprintf call
• How long does this take
– serial port delays• How long does a UART transmission take?
– Does this change with USB-UARTs?» What about regular displays?
– Can we use higher baud rate?

10
Making Wireless
The problem with prints
DebugLevel
TX RX TX RX1 169 653 161 32 1.25 0.165 113 18 0.49 0.07
Prints to console disabled Prints to console enabled
Throughput (Mbps)
Notes:Debug level 3 adds 19 lines of print per transfer for TX and 40 for RXDebug level 5 adds 37 and 92 respectively
11
Making Wireless
Dynamic printks
• CONFIG_DYNAMIC_DEBUG– Introduced in 2.6.30
• Operates on pr_debug/dev_dbg
• More info– Documentation/dynamic-debug-howto.txt– http://lwn.net/Articles/434833/
12
Making Wireless
Circular buffers
• Useful when you want to capture the last fewthings that were going on in the system
• In some cases, single character circular buffersare all that you can afford (DSP SW…)
13
Making Wireless
Circular buffers (Case Study - MUSB)
• MUSB double buffering– Data transfers stop after a while when double-packet
buffering enabled– Works for short amounts of data
• Intermittent failure
– With debug enabled, cannot reproduce failure• Even if not printing to console
– No failures with single-packet buffering (existing code)
14
Making Wireless
Circular buffers (Case Study - MUSB)
• Turned off prints, and selectively enabled keyprints– No luck – still hard to reproduce
• Set up a circular buffer to which I sprintfinteresting variables– read from debugfs when the issue is reproduced– No luck – failure disappears
15
Making Wireless
Circular buffers (Case Study - MUSB)
• Set up a circular buffer to hold a single character– Instrument code to write a single character to this buffer
at interesting points in the code– Dump this buffer when we hit the failure
• Bingo!– Hit the failure, and still have a good trace of the
program flow– Now we know where to look

16
Making Wireless
Circular buffers (Case Study - MUSB)
17
Making Wireless
SW Trace Tools
• Tracepoints and markers• Ftrace• LTTng• Perf
18
Making Wireless
Protocol Analyzers
• USBMON• Wireshark
• What about other protocols?– I2C, MMC, SPI, …?
19
Making Wireless
HW trace – ETM/ETB
• What is ETM– Embedded Trace Macrocell
• The ETM can capture the program counter valueupon certain events (waypoints)– A waypoint is a point where instruction execution may
change the program flow• Branch instructions• Exceptions
20
Making Wireless
HW trace – ETM/ETB
• ETB– ETB is on SoC buffer– ETB buffer is usually small – 2k to 8k
• (about 10-30k lines of code)
• ETM– Streaming same trace content to an external trace port– Needs to be continuously read by an ‘external trace
receiver’

21
Making Wireless
HW trace – ETM/ETB
• ETM– Needs JTAG Debugger– Needs external trace receiver
• ETB– Can be dumped using just a JTAG debugger– Can be dumped using software
• See kernel driver for ETB/ETM– arch/arm/kernel/etm.c
• Analysis software:– https://github.com/virtuoso/etm2human
22
Making Wireless
HW trace – ETM/ETB
• Why is it useful– Very accurate profiling– No need to instrument the code– Can be used to reconstruct program flow– Can step back in code
• How?

23
Making Wireless
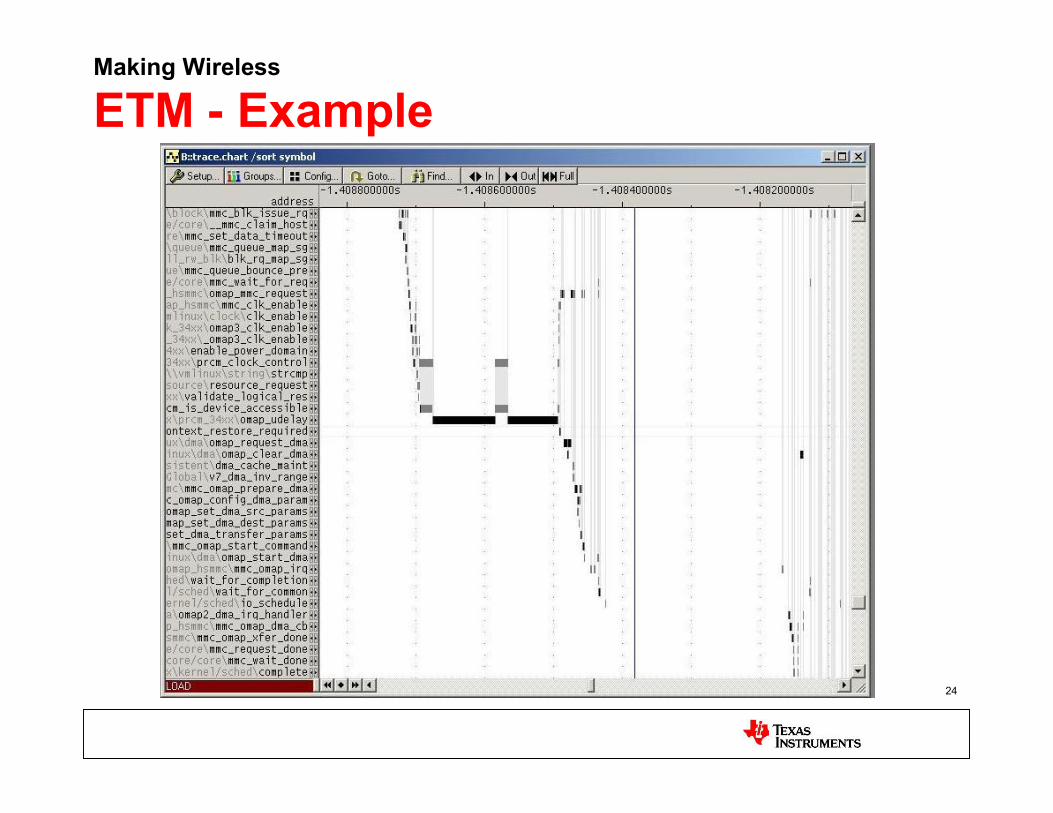
ETM - Example
24
Making Wireless
ETM - Example
25
Making Wireless
Observability of internal signals
• Some SoCs expose internal signals (DMA requestlines, interrupt request lines, …) to the outsideworld
• Since there are a limited number of pads on anSoC, there is usually a way to configure whichsignal one wants to export out– Once configured, these signals can be observed on the
corresponding pad
26
Making Wireless
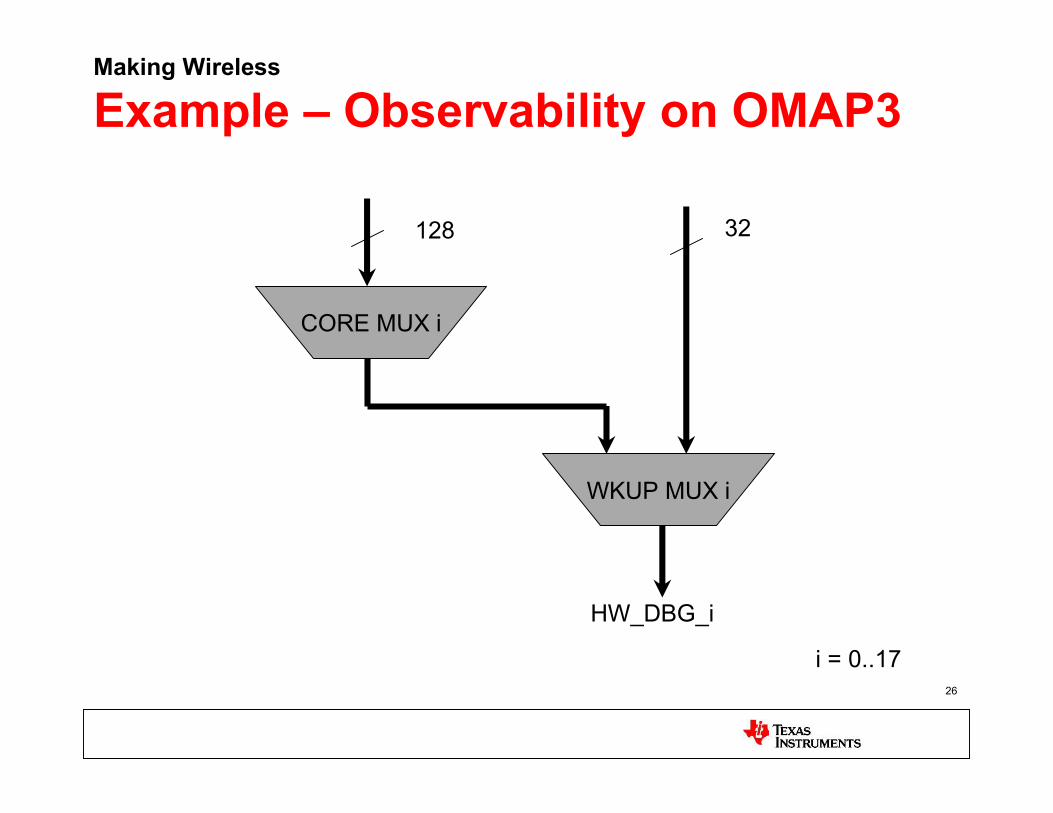
Example – Observability on OMAP3
CORE MUX i
WKUP MUX i
128 32
HW_DBG_i
i = 0..17

27
Making Wireless
Example – Observability on OMAP3• What is available
– Internal clocks– IRQ lines (any IRQ - up to 4 at a time)– DMA request lines (up to 4 at a time)– Power domain status– Wakeup events
– Tie high– Tie low
• Useful to check if the pin muxing and other settings areconfigured correctly
• and to check if you’re actually observing the correct line
• Also useful as general purpose GPIOs without going throughthe GPIO module

28
Making Wireless
GPIO markers
• Toggle GPIOs at interesting points in the code– Observe with a scope (or even better, a logic analyzer)
• Why is this technique needed?– No need to depend on time counters in the SoC– Time resolution offered by scope/LA is much better
– Can trigger on bus events + software conditions• Can cross-trigger JTAG debugger to halt the CPU as well

29
Making Wireless
Observability and GPIO markers• Advantages
– Good way to extract timing information (for debug and profilingboth), without deeply affecting the system
– Code instrumentation is simpler – may boil down to a simpleregister write
– Good profiling tool• Especially when combined with ETM
• Disadvantages– Cannot get values of variables/parameters– No framework - easy for debugger to make mistakes?– May not have enough spare pins
• Sometimes pads are not accessible on near-production boards– Scope/LA are expensive
• especially the good ones
30
Making Wireless
GPIO markers – Tips and Tricks
• Toggle each GPIO before starting to debug - tomake sure the setup is right
• Beware: opposite drives and possible boarddamage
• Toggling GPIOs from userspace– Documentation/gpio.txt
• See “Sysfs Interface for Userspace” section

31
Making Wireless
Observability – Tips and Tricks• Logic analyzer configuration
– Use transitional storage mode• Don’t observe unnecessary clock signals if you want to capture
for a long duration
• Test your setup before starting– Toggle all signals manually
• Preferably one at a time, or in a pattern• Check both high and low

32
Making Wireless
Using LEDs for debug
• Useful for initial board bringup• Very useful to use these in bootloaders
– in case of a crash before the UART comes up• No need for scope/LA
– Not useful for timing information– Very useful if all you need to know is state information
• Heartbeat LEDs– (don’t enable in production – they drain power)

33
Making Wireless
JTAG
• Examples:– Lauterbach Power Debug– ARM Realview ICE, ARM DS/5– XDS560
– Flyswatter– OpenOCD
34
Making Wireless
JTAG – tips and tricks• Lauterbach PER files
– Decode register dumps
• The while(1) loop– Sometimes you cannot connect with JTAG when the
CPU is powered down in idle paths• Workaround: add a while(1) loop after CPU powers up.
Connect with JTAG here, and then skip to the next instruction
• Read/write breakpoints on variables– Useful for debugging memory corruption
35
Making Wireless
JTAG – tips and tricks
• Console over JTAG– CONFIG_HVC_DCC– CONFIG_DEBUG_ICEDCC
– Introduced in kernel in which version?
• Extracting dmesg buffer over JTAG

36
Making Wireless
Basic register access utilities• Register access
– omap_readl/writel– readmem, devmem2– i2c-utils

37
Making Wireless
Register decoders• Example
– pxaregs
• Register dump scripts– Simple userspace scripts can be built around these
utilities– Example
• ehcidump.sh
38
Making Wireless
Register decoders• Exporting register info in debugfs
• Example - MUSB in debugfs