TLR Stimulation Produces IFN-β as the Primary Driver of ...
12
IFN Signaling in Nonlymphoid Primary Human Cells as the Primary Driver of β TLR Stimulation Produces IFN- Greenberg and Janet E. Buhlmann Edyta Tyminski, Ryan Bellmore, Anthony J. Coyle, Stefano V. Gullà, Stephen P. Berasi, Steven A. Ryan Nistler, Ankur Sharma, Katrina Meeth, Christine Huard, Christine Loreth, Alireza Kalbasi, http://www.immunohorizons.org/content/4/6/332 https://doi.org/10.4049/immunohorizons.1800054 doi: 2020, 4 (6) 332-338 ImmunoHorizons This information is current as of November 19, 2021. Material Supplementary lemental http://www.immunohorizons.org/content/suppl/2020/06/18/4.6.332.DCSupp References http://www.immunohorizons.org/content/4/6/332.full#ref-list-1 , 4 of which you can access for free at: cites 31 articles This article Email Alerts http://www.immunohorizons.org/alerts Receive free email-alerts when new articles cite this article. Sign up at: ISSN 2573-7732. All rights reserved. 1451 Rockville Pike, Suite 650, Rockville, MD 20852 The American Association of Immunologists, Inc., is an open access journal published by ImmunoHorizons by guest on November 19, 2021 http://www.immunohorizons.org/ Downloaded from by guest on November 19, 2021 http://www.immunohorizons.org/ Downloaded from by guest on November 19, 2021 http://www.immunohorizons.org/ Downloaded from by guest on November 19, 2021 http://www.immunohorizons.org/ Downloaded from by guest on November 19, 2021 http://www.immunohorizons.org/ Downloaded from by guest on November 19, 2021 http://www.immunohorizons.org/ Downloaded from
Transcript of TLR Stimulation Produces IFN-β as the Primary Driver of ...
IFN Signaling in Nonlymphoid Primary Human Cells as the Primary Driver ofβTLR Stimulation Produces IFN-
Greenberg and Janet E. BuhlmannEdyta Tyminski, Ryan Bellmore, Anthony J. Coyle, Stefano V. Gullà, Stephen P. Berasi, Steven A. Ryan Nistler, Ankur Sharma, Katrina Meeth, Christine Huard, Christine Loreth, Alireza Kalbasi,
http://www.immunohorizons.org/content/4/6/332https://doi.org/10.4049/immunohorizons.1800054doi:
2020, 4 (6) 332-338ImmunoHorizons
This information is current as of November 19, 2021.
MaterialSupplementary
lementalhttp://www.immunohorizons.org/content/suppl/2020/06/18/4.6.332.DCSupp
Referenceshttp://www.immunohorizons.org/content/4/6/332.full#ref-list-1
, 4 of which you can access for free at: cites 31 articlesThis article
Email Alertshttp://www.immunohorizons.org/alertsReceive free email-alerts when new articles cite this article. Sign up at:
ISSN 2573-7732.All rights reserved.1451 Rockville Pike, Suite 650, Rockville, MD 20852The American Association of Immunologists, Inc.,
is an open access journal published byImmunoHorizons
by guest on Novem
ber 19, 2021http://w
ww
.imm
unohorizons.org/D
ownloaded from
by guest on N
ovember 19, 2021
http://ww
w.im
munohorizons.org/
Dow
nloaded from
by guest on Novem
ber 19, 2021http://w
ww
.imm
unohorizons.org/D
ownloaded from
by guest on N
ovember 19, 2021
http://ww
w.im
munohorizons.org/
Dow
nloaded from
by guest on Novem
ber 19, 2021http://w
ww
.imm
unohorizons.org/D
ownloaded from
by guest on N
ovember 19, 2021
http://ww
w.im
munohorizons.org/
Dow
nloaded from
TLR Stimulation Produces IFN-b as the Primary Driver of IFNSignaling in Nonlymphoid Primary Human Cells
Ryan Nistler,* Ankur Sharma,* Katrina Meeth,* Christine Huard,* Christine Loreth,† Alireza Kalbasi,* Edyta Tyminski,*Ryan Bellmore,† Anthony J. Coyle,* Stefano V. Gulla,* Stephen P. Berasi,* Steven A. Greenberg,‡,§,2 and Janet E. Buhlmann*,2
*Centers for Therapeutic Innovation, Pfizer Inc., Cambridge, MA 02139; †Research Business Technology, Pfizer Inc., Cambridge, MA 02139;‡Department of Neurology, Brigham and Women’s Hospital, Boston, MA 02115; and §Boston Children’s Hospital Computational Health Informatics
Program, Harvard Medical School, Boston, MA 02115
ABSTRACT
Several human autoimmune diseases are characterized by increased expression of type 1 IFN-stimulated genes in both the peripheral
blood and tissue. The contributions of different type I IFNs to this gene signature are uncertain as the type I IFN family consists of 13
alphas and one each of b, e, k, and v subtypes. We sought to investigate the contribution of various IFNs to IFN signaling in primary
human cell types. We stimulated primary skin, muscle, kidney, and PBMCs from normal healthy human donors with various TLR
ligands and measured the expression of type I IFN subtypes and activation of downstream signaling by quantitative PCR. We show
that IFNB1 is the dominant type I IFN expressed upon TLR3 and TLR4 stimulation, and its expression profile is associated with
subsequent MX1 transcription. Furthermore, using an IFN-b–specific neutralizing Ab, we show that MX1 expression is inhibited in a
dose-dependent manner, suggesting that IFN-b is the primary driver of IFN-stimulated genes following TLR3 and TLR4 engagement.
Stimulation with TLR7/8 and TLR9 ligands induced IFNB1 and IFNA subtypes and MX1 expression only in PBMCs and not in tissue
resident cell types. Concordantly, IFN-b neutralization had no effect on MX1 expression in PBMCs potentially because of the
combination of IFNB1 and IFNA expression. Combined, these data highlight the potential role for IFN-b in driving local inflammatory
responses in clinically relevant human tissue types and opportunities to treat local inflammation by targeting IFN-b.
ImmunoHorizons, 2020, 4: 332–338.
INTRODUCTION
Type I IFNs are secreted pleiotropic cytokines that play a pivotalrole in innate and adaptive immune responses against pathogeninvasion. Among the various type I IFNs known, the most wellstudied are IFN-a (13 IFN-a subtypes exist, each encoded bya different gene) and IFN-b (1). Although these cytokines playa crucial role in pathogen defense, their sustained productioncan result in inflammation (2). Type I IFNs are linked to the
pathogenesis of autoimmune disorders, including dermatomyositis(DM), lupus nephritis (LN), cutaneous lupus erythematosus(CLE), and systemic lupus erythematosus (SLE) (3–6) as well asmonogenic autoimmune disorders such as STING-associatedvasculopathy of infancy and Aicardi-Goutieres syndrome (7, 8).Specifically, correlationof type I IFNgene signaturewithdiseaseseverity has been reported in DM, LN, and SLE (6, 9–11). Onestudy found that ectopic stimulation of cultured muscle cellswith purified IFN-a or IFN-b phenocopied the molecular
Received for publication August 3, 2018. Accepted for publication May 20, 2020.
Address correspondence and reprint requests to: Dr. Steven A. Greenberg or Dr. Janet E. Buhlmann, Brigham and Women’s Hospital, Department of Neurology, andChildren’s Hospital Informatics Program, Harvard Medical School, 75 Francis Street, Boston, MA 02115 (S.A.G.) or Centers for Therapeutic Innovation, Pfizer Inc., 610Main Street, Cambridge, MA 02139 (J.E.B.). E-mail addresses: [email protected] (S.A.G.) or [email protected] (J.E.B.)
ORCIDs: 0000-0002-6712-5241 (R.N.); 0000-0002-6657-4950 (A.K.); 0000-0002-9319-7652 (R.B.); 0000-0002-6305-5354 (J.E.B.).2S.A.G. and J.E.B. contributed equally to the work.
Abbreviations used in this article: CLE, cutaneous lupus erythematosus; Ct, cycle threshold; DM, dermatomyositis; GMC, glomerular mesangial cell; LN, lupus nephritis;NHDF, normal human dermal fibroblast; poly I:C, polyinosinic:polycytidylic acid; SLE, systemic lupus erythematosus; SMC, skeletal muscle cell.
The online version of this article contains supplemental material.
This article is distributed under the terms of the CC BY-NC-ND 4.0 Unported license.
Copyright © 2020 The Authors
332 https://doi.org/10.4049/immunohorizons.1800054
RESEARCH ARTICLE
Clinical and Translational Immunology
ImmunoHorizons is published by The American Association of Immunologists, Inc.
by guest on Novem
ber 19, 2021http://w
ww
.imm
unohorizons.org/D
ownloaded from
signature found inDMmuscle biopsieswith stronger correlationto IFN-b stimulation than IFN-a (12). Elevated blood IFN-blevels, but not IFN-a, also correlate with high type I IFN genesignature and DM disease activity (5, 9, 13). Elevated skin IFNB1transcript, but not IFNA, IFNK, or IFNO transcripts, alsocorrelate with skin type I IFN gene signature in DM (14).
The correlation of IFN-stimulated genes with disease severityhas led to recent clinical studies to treat SLEbyneutralizing IFN-asubtypes (sifalimumab, rontalizumab) or by neutralizing IFNAR1(anifrolumab) (15–17). Phase IIb clinical studies with the variousmAbs showed mixed results, with rontalizumab failing to meetits primary and secondary endpoints (18). Sifalimumab met itsprimary, but not secondary endpoints, with modest therapeuticeffect (19). Anifrolumabmet both primary and secondary endpoints,and treated patients showed improvement over patients receivingplacebo, although the result was not dose dependent and onlyobserved in patients with a high IFN gene signature at baseline(20, 21). Combined, these results suggest that targeting IFN-aalone may not be sufficient to reduce modest to severe SLE.
We sought to identify which type I IFNs are induced inclinically relevantprimaryhumancellswhenchallengedwithTLRligands. Heightened expression of TLRs in local tissue andinfiltrating cells has been observed inDMand polymyositis (PM),highlighting a potential feedback loop for inflammation (22). Inthis study, we used primary human cells fromhealthy donors thatrepresent tissues involved in DM, CLE, LN, and SLE pathologies:dermal fibroblasts, skeletal muscle cells (SMC), glomerularmesangial cells (GMC), andPBMCs.Wemeasured the expressionprofile of IFNB1 and IFNA subtypes in response to TLR3, TLR4,TLR7/8, and TLR9 activation. To evaluate downstream IFNARsignaling, we measured expression of MX1, a clinical marker fortype I IFNactivity that is overexpressed inDM,CLE,LN, andSLEpatients (23–26). In addition, we used a high-affinity anti–IFN-bAb to assess the specific role of IFN-b in drivingMX1 expressionin the various cell types. This study identifies the expressionpattern of type I IFN species in human disease-relevant tissuesand suggests a novel role for IFN-b in driving local inflammationand tissue injury that may contribute to the autoimmune diseasephenotype.
MATERIALS AND METHODS
ReagentsPolyinosinic:polycytidylic acid (poly I:C; P9582) and LPS (L2755)were purchased from Sigma-Aldrich. R848 (Tlrl-r848) andODN2216 (Tlrl-2216) were purchased from Invivogen. Anti–IFN-b Ab was generated in-house using licensed commerciallyavailable IFN-b (Peprotech) as Ag. Anti-human IFN-bAbsweregenerated by immunizing BALB/c mice with IFN-b and fusingmouse splenocytes with NS-1 myeloma cells. Hybridomas werescreened for IFN-b binders, and leading candidates werehumanized and underwent affinity maturation to improve affinity.The final IgG1 candidate was shown to have a neutralizing affinity,20 pM to human IFN-b and no cross-reactivity to mouse or rat
IFN-b. Isotype control Ab was generated in-house and showedno binding to any IFN. All procedures performed on animalswere in accordance with regulations and established guidelinesand were reviewed and approved by an institutional animal careand use committee.
Specificity of anti–IFN-b AbIFN-b (300-02BC; Peprotech) and IFN-a2 (11100-1; PBL AssayScience) were diluted with anti–IFN-b in RPMI. The final Abconcentrations ranged from 100 to 1 3 107 nM. The IFNs werediluted to a final concentration of 20 pM (IFN-b) or 50 pM (IFN-a2) with medium alone or a dose curve of the anti–IFN-b Ab in afinal volume of 50 ml and incubated for 2 h at 37°C. U-937 cellswere cultured inRPMIsupplementedwith 10%FBS, 13Glutamax(35050061; Thermo Fisher Scientific) and harvested just beforestimulation. Cells were counted and resuspended at 23 106 cells/mlin RPMI. Fifty microliters of cells was added to 50 ml of diluteda-IFNAR Ab and incubated for 2 h. After the incubations, theIFNs and diluted Abs were mixed with cells (100,000 per well)and incubated at 37°C for 15 min.
At the conclusionof the incubation, an equal volume of Cytofix(554655; BD Biosciences) was added per well, and the plate wasreturned to 37°C for 15min. After fixation, plateswere centrifugedat 1500 rpm for 5min topellet cells. Cellswerewashedwith200mlof PBS and resuspended in 100 ml of 13 Phosflow Perm Buffer IV(612597; BD Biosciences) for 15 min at room temperature. Afterincubation, plates were centrifuged and washed as describedabove. Cells were resuspended in 100 ml of PBS with 5% FBS(FACS buffer) containing TruStain FcX (422302; BioLegend) andincubated for 10 min at 4°C. After incubation, 10 ml of AF647mouse anti-STAT1 (pY701) Ab (612597; BD Biosciences) wasadded per well and incubated for 20 min. Next, 100 ml of FACSbufferwas addedperwell and centrifuged as described above. Thewash was repeated, and samples were resuspended in a finalvolume of 120 ml of FACS buffer for data acquisition on theFortessa flow cytometer (BD Biosciences).
DatawereanalyzedusingFlowJosoftware (TreeStar); forwardscatter (light) channel versus side scatter (light) channel was usedto identify cells, and the geometric mean fluorescence intensity ofthe pSTAT1 signal was determined. EC50, EC90, and IC50 analyseswere done using GraphPad Prism v 6.0. Data were transformed(concentration X = log [x]), then a nonlinear regression analysisusing a 4-parameter slope of log (inhibitor/stimulator) versusresponse (geometric mean fluorescence intensity) was performed(Supplemental Fig. 1).
Cells and cell cultureNormal humandermalfibroblasts (NHDF) (CC-2511; Lonza)werecultured in FGM-2 media (CC-3132; Lonza), and GMC (CC-2559;Lonza) were cultured in MsGM media (CC-3146; Lonza). SMC(SK-1111; Cook Myosite) were cultured in Myotonic GrowthMedium (MK-4444; Cook Myosite). At least five donors of eachcell type were purchased for experiments. PBMCs were isolatedfrom healthy donor blood using Ficoll-Paque Plus separationmedium (17-1440-03; GE Healthcare) in Leucosep tubes (227290;
https://doi.org/10.4049/immunohorizons.1800054
ImmunoHorizons TLR-STIMULATED PRIMARY CELLS PREDOMINATELY PRODUCE IFN-b 333
by guest on Novem
ber 19, 2021http://w
ww
.imm
unohorizons.org/D
ownloaded from
Greiner Bio-One) and cultured in RPMI 1640 (11875-093; LifeTechnologies) supplemented with 10% FBS (16140-071; LifeTechnologies). Informed consent was obtained from all humansubjects in accordance with Pfizer Institutional Review Boardguidelines.
Real-time quantitative PCR, data analyses, andheatmap generationRNA was isolated using RNeasy Micro Kit (74004; Qiagen), andcDNA was synthesized using a high-capacity cDNA reversetranscription kit (4368813; Applied Biosystems). TaqMan assayswere purchased from Applied Biosystems. For heatmap genera-tion, four independent donors of each cell type were assayed andthe results were averaged. For neutralization studies, at least fiveindependent donorswere used exceptwhere noted. Samples fromeach donorwere run in duplicate and averaged. Data are displayedas the average with each individual donor plotted. Relativequantification was obtained using the DD cycle threshold (Ct)method. Individual primer efficiency was tested and rangedfrom 91.99 to 109.37%.
Neutralization studiesPrimary human cells were stimulated with LPS, poly I:C, R848,or ODN2216 at the minimal dose that generated robust MX1expression (determined empirically for each cell line andstimulant). Neutralizing IFN-b Ab (100 nM) or a dose curve of0.1–100 nM was added to cells concurrently with TLR ligandsand incubated with cells for varying times (see figures fordetails). RNAwas isolated and analyzed by TaqMan quantitativePCR as described above. Expression of MX1 was measured as arelative amount per 10 ng of RNA per sample.
IFN ELISACell supernatants were collected and run neat (IFN-b) or diluted1:10 (IFN-a). IFN-b ELISA (41415-1; PBL Assay Science) and IFN-amultisubtype (41105-1; PBL Assay Science) were run according tothe manufacturer’s specifications.
RESULTS
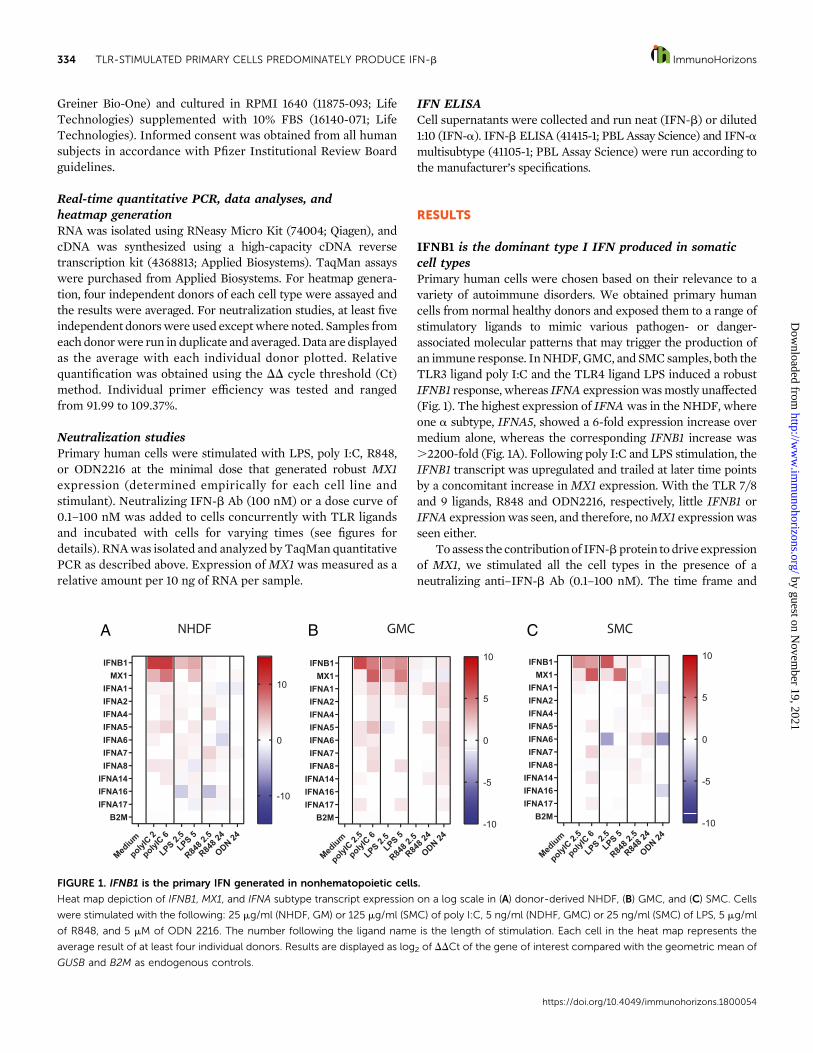
IFNB1 is the dominant type I IFN produced in somaticcell typesPrimary human cells were chosen based on their relevance to avariety of autoimmune disorders. We obtained primary humancells from normal healthy donors and exposed them to a range ofstimulatory ligands to mimic various pathogen- or danger-associated molecular patterns that may trigger the production ofan immune response. InNHDF,GMC, and SMCsamples, both theTLR3 ligand poly I:C and the TLR4 ligand LPS induced a robustIFNB1 response, whereas IFNA expressionwasmostly unaffected(Fig. 1). The highest expression of IFNAwas in the NHDF, whereone a subtype, IFNA5, showed a 6-fold expression increase overmedium alone, whereas the corresponding IFNB1 increase was.2200-fold (Fig. 1A). Following poly I:C and LPS stimulation, theIFNB1 transcript was upregulated and trailed at later time pointsby a concomitant increase inMX1 expression. With the TLR 7/8and 9 ligands, R848 and ODN2216, respectively, little IFNB1 orIFNA expressionwas seen, and therefore, noMX1 expressionwasseen either.
To assess the contributionof IFN-bprotein todrive expressionof MX1, we stimulated all the cell types in the presence of aneutralizing anti–IFN-b Ab (0.1–100 nM). The time frame and
FIGURE 1. IFNB1 is the primary IFN generated in nonhematopoietic cells.
Heat map depiction of IFNB1, MX1, and IFNA subtype transcript expression on a log scale in (A) donor-derived NHDF, (B) GMC, and (C) SMC. Cells
were stimulated with the following: 25 mg/ml (NHDF, GM) or 125 mg/ml (SMC) of poly I:C, 5 ng/ml (NDHF, GMC) or 25 ng/ml (SMC) of LPS, 5 mg/ml
of R848, and 5 mM of ODN 2216. The number following the ligand name is the length of stimulation. Each cell in the heat map represents the
average result of at least four individual donors. Results are displayed as log2 of DDCt of the gene of interest compared with the geometric mean of
GUSB and B2M as endogenous controls.
https://doi.org/10.4049/immunohorizons.1800054
334 TLR-STIMULATED PRIMARY CELLS PREDOMINATELY PRODUCE IFN-b ImmunoHorizons
by guest on Novem
ber 19, 2021http://w
ww
.imm
unohorizons.org/D
ownloaded from
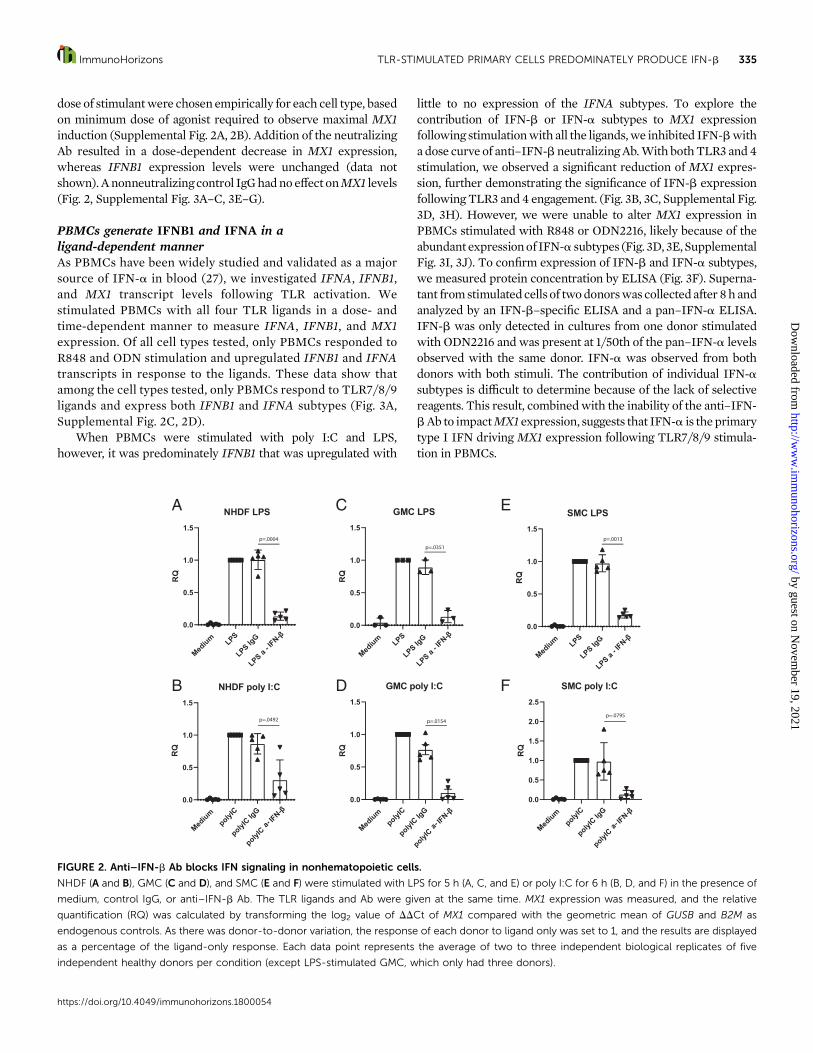
dose of stimulantwere chosen empirically for each cell type, basedon minimum dose of agonist required to observe maximal MX1induction (Supplemental Fig. 2A, 2B). Addition of the neutralizingAb resulted in a dose-dependent decrease in MX1 expression,whereas IFNB1 expression levels were unchanged (data notshown). Anonneutralizingcontrol IgGhadno effect onMX1 levels(Fig. 2, Supplemental Fig. 3A–C, 3E–G).
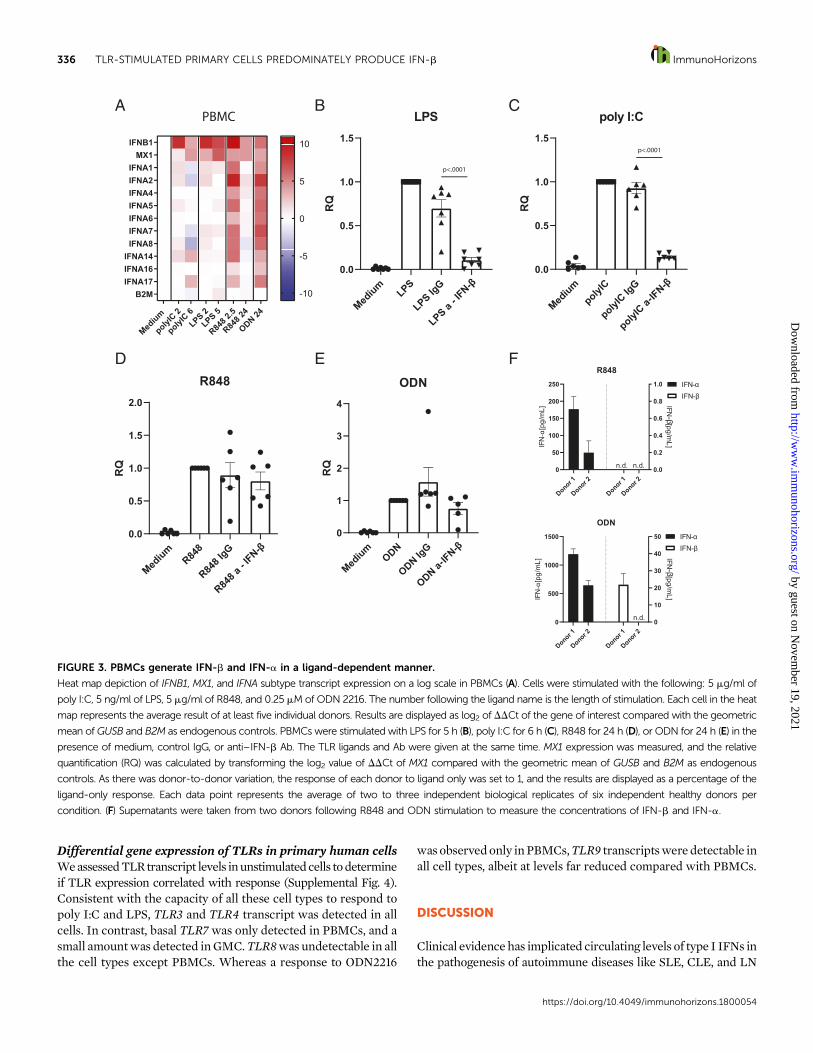
PBMCs generate IFNB1 and IFNA in aligand-dependent mannerAs PBMCs have been widely studied and validated as a majorsource of IFN-a in blood (27), we investigated IFNA, IFNB1,and MX1 transcript levels following TLR activation. Westimulated PBMCs with all four TLR ligands in a dose- andtime-dependent manner to measure IFNA, IFNB1, and MX1expression. Of all cell types tested, only PBMCs responded toR848 and ODN stimulation and upregulated IFNB1 and IFNAtranscripts in response to the ligands. These data show thatamong the cell types tested, only PBMCs respond to TLR7/8/9ligands and express both IFNB1 and IFNA subtypes (Fig. 3A,Supplemental Fig. 2C, 2D).
When PBMCs were stimulated with poly I:C and LPS,however, it was predominately IFNB1 that was upregulated with
little to no expression of the IFNA subtypes. To explore thecontribution of IFN-b or IFN-a subtypes to MX1 expressionfollowing stimulationwith all the ligands,we inhibited IFN-bwitha dose curve of anti–IFN-b neutralizingAb.With bothTLR3 and4stimulation, we observed a significant reduction of MX1 expres-sion, further demonstrating the significance of IFN-b expressionfollowing TLR3 and4 engagement. (Fig. 3B, 3C, Supplemental Fig.3D, 3H). However, we were unable to alter MX1 expression inPBMCs stimulated with R848 or ODN2216, likely because of theabundant expressionof IFN-a subtypes (Fig. 3D, 3E,SupplementalFig. 3I, 3J). To confirm expression of IFN-b and IFN-a subtypes,we measured protein concentration by ELISA (Fig. 3F). Superna-tant fromstimulatedcells of twodonorswas collectedafter 8h andanalyzed by an IFN-b–specific ELISA and a pan–IFN-a ELISA.IFN-b was only detected in cultures from one donor stimulatedwith ODN2216 andwas present at 1/50th of the pan–IFN-a levelsobserved with the same donor. IFN-a was observed from bothdonors with both stimuli. The contribution of individual IFN-asubtypes is difficult to determine because of the lack of selectivereagents. This result, combinedwith the inability of the anti–IFN-bAb to impactMX1 expression, suggests that IFN-a is theprimarytype I IFN driving MX1 expression following TLR7/8/9 stimula-tion in PBMCs.
FIGURE 2. Anti–IFN-b Ab blocks IFN signaling in nonhematopoietic cells.
NHDF (A and B), GMC (C and D), and SMC (E and F) were stimulated with LPS for 5 h (A, C, and E) or poly I:C for 6 h (B, D, and F) in the presence of
medium, control IgG, or anti–IFN-b Ab. The TLR ligands and Ab were given at the same time. MX1 expression was measured, and the relative
quantification (RQ) was calculated by transforming the log2 value of DDCt of MX1 compared with the geometric mean of GUSB and B2M as
endogenous controls. As there was donor-to-donor variation, the response of each donor to ligand only was set to 1, and the results are displayed
as a percentage of the ligand-only response. Each data point represents the average of two to three independent biological replicates of five
independent healthy donors per condition (except LPS-stimulated GMC, which only had three donors).
https://doi.org/10.4049/immunohorizons.1800054
ImmunoHorizons TLR-STIMULATED PRIMARY CELLS PREDOMINATELY PRODUCE IFN-b 335
by guest on Novem
ber 19, 2021http://w
ww
.imm
unohorizons.org/D
ownloaded from
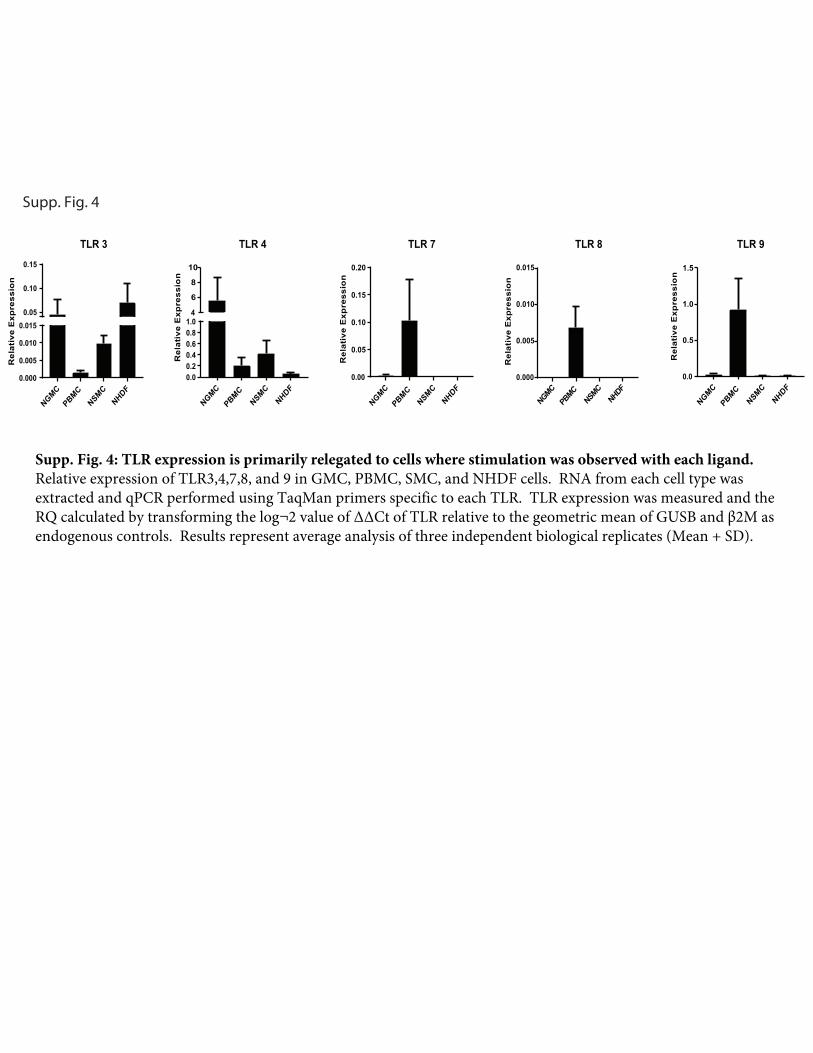
Differential gene expression of TLRs in primary human cellsWeassessedTLRtranscript levels inunstimulatedcells todetermineif TLR expression correlated with response (Supplemental Fig. 4).Consistent with the capacity of all these cell types to respond topoly I:C and LPS, TLR3 and TLR4 transcript was detected in allcells. In contrast, basal TLR7 was only detected in PBMCs, and asmall amountwas detected inGMC.TLR8was undetectable in allthe cell types except PBMCs. Whereas a response to ODN2216
was observedonly inPBMCs,TLR9 transcriptswere detectable inall cell types, albeit at levels far reduced compared with PBMCs.
DISCUSSION
Clinical evidencehas implicated circulating levels of type I IFNs inthe pathogenesis of autoimmune diseases like SLE, CLE, and LN
FIGURE 3. PBMCs generate IFN-b and IFN-a in a ligand-dependent manner.
Heat map depiction of IFNB1, MX1, and IFNA subtype transcript expression on a log scale in PBMCs (A). Cells were stimulated with the following: 5 mg/ml of
poly I:C, 5 ng/ml of LPS, 5 mg/ml of R848, and 0.25 mMof ODN 2216. The number following the ligand name is the length of stimulation. Each cell in the heat
map represents the average result of at least five individual donors. Results are displayed as log2 of DDCt of the gene of interest compared with the geometric
mean ofGUSB and B2M as endogenous controls. PBMCs were stimulated with LPS for 5 h (B), poly I:C for 6 h (C), R848 for 24 h (D), or ODN for 24 h (E) in the
presence of medium, control IgG, or anti–IFN-b Ab. The TLR ligands and Ab were given at the same time. MX1 expression was measured, and the relative
quantification (RQ) was calculated by transforming the log2 value of DDCt of MX1 compared with the geometric mean of GUSB and B2M as endogenous
controls. As there was donor-to-donor variation, the response of each donor to ligand only was set to 1, and the results are displayed as a percentage of the
ligand-only response. Each data point represents the average of two to three independent biological replicates of six independent healthy donors per
condition. (F) Supernatants were taken from two donors following R848 and ODN stimulation to measure the concentrations of IFN-b and IFN-a.
https://doi.org/10.4049/immunohorizons.1800054
336 TLR-STIMULATED PRIMARY CELLS PREDOMINATELY PRODUCE IFN-b ImmunoHorizons
by guest on Novem
ber 19, 2021http://w
ww
.imm
unohorizons.org/D
ownloaded from
(6). However, the potential for IFN-b to contribute to substantiallocal inflammation and tissue destruction remained unexplored.Measuring IFNs in diseased tissue faces technical and biologicalchallenges that have largely prohibited researchers from identi-fying IFN-b or distinguishing between IFN-a subtypes in serumand tissues from patients with autoimmune disorders. Given theheterogenous nature of autoimmune disease, the underlyingtriggers for the type I IFN response are unknown. Thus, onlymeasuring circulating IFNs may be a poor clinical biomarker fordetermining the contribution of those IFNs to disease. This studyidentifies IFNB1 as the major type I IFN produced by primaryhuman disease-relevant cells when challenged with various TLRligands. Furthermore,we show that neutralizing the production ofIFN-b in nonlymphoid primary cells can abrogate downstreamIFN signaling.
Of note, the primary cells used in this study were from healthydonors. Cells from diseased tissue may amplify the type I IFNresponse through upregulation of TLR3, TLR7, and TLR9 asreported in PBMCs from SLE patients (28), overexpression ofTLR4andTLR9as seen inDMmuscle tissues (29), andglomerularexpression of TLR9 as observed in LN but not in normal kidneys(30). These changes may render tissues susceptible to additionalupregulationof IFN-b. Using anti–IFN-bAb to block downstreamIFNAR signaling (as evidenced by loss of MX1 expression)following stimulation in nonhematopoietic cells may interferewith a cascade of inflammatory signaling (Fig. 2). To address thisquestion in vivo, we have an ongoing phase II clinical trial inhumans with DM comparing anti–IFN-b Ab to placebo controlwith a readout expected in 2021 (ClinicalTrials.gov identifier:NCT03181893).
Stimulation of TLR7/8 and TLR9 with R848 and ODN2216,respectively, resulted in a type I IFNresponse only inPBMCs, (Fig.3)which correlatedwith the expressionof their cognate receptors.As we did not isolate individual cell types out of the PBMCpopulation, the differing responses we observed based on ligandcould be due tomultiple cell types responding to different ligands.Although plasmacytoid dendritic cells likely make up the bulk ofthe TLR7/8 and 9 signaling, conventional (myeloid) dendritic cellscouldbe responsible for the IFN-bproduced followingTLR3and4engagement (31). The expression patterns of type I IFN in PBMCswere confirmed by the detection of IFN protein levels, withcumulative IFN-a protein detected at much greater concentra-tions than IFN-b (Fig. 3F).
Regardless of the stimulation, when IFN-b was the pre-dominant IFN generated, the neutralization of the proteinwith ananti–IFN-b Ab led to an abrogation ofMX1 expression. Given thatthe underlyingcauses forDMand lupus havenot been established,questions remain as to how IFN-b and IFN-a can initiate ormodulate disease. The source of IFN in these diseases couldcome from the resident tissues where the disease manifests, frominfiltrating immune cells, or some combination of the two. Ifdisease is initiatedormaintained throughresident tissuecells, thenneutralization of IFN-b in that tissuemay result in both decreasedIFN-b–driven local inflammation and concomitant recruitment ofimmune cells to the tissue. Additionally, a reduction of IFN-bmay
result in a decrease of pathogen-associated molecular patternreceptors, therefore increasing the threshold of signaling requiredto initiate or maintain a response. Further profiling of DM andlupus tissues may elucidate the source and effect of localized IFNinduction.
In summary, our results indicate that IFN-b is the dominanttype I IFN induced inhuman-derived primary tissue resident cellswhenchallengedwith variousTLR ligands. Thesefindings suggestthat IFN-b may have a critical role in local tissue damage andautoimmune disease modulation that has previously been un-derappreciated. Furthermore, specific neutralization of IFN-bresulted in an attenuation of MX1 expression, indicating thatIFN-b inhibition could be a novel therapy in the treatment ofDM, lupus, and other IFNopathies.
DISCLOSURES
R.N., A.S., K.M., C.H., C.L., A.K., E.T., R.B., A.J.C., S.P.B., and J.E.B.areorwereemployeesofPfizerandmayhold stock inPfizer. S.A.G.receives financial support from Pfizer. C.H., A.J.C., S.V.G., S.A.G.,and J.E.B. are patent authors of the anti–IFN-b Ab.
ACKNOWLEDGMENTS
We thank Leigh Zawel, Brian Bates, Robert Martinez, and Henry Wang forcritical discussions and helpful comments.
REFERENCES
1. González-Navajas, J. M., J. Lee, M. David, and E. Raz. 2012. Immu-nomodulatory functions of type I interferons. Nat. Rev. Immunol. 12:125–135.
2. Banchereau, J., and V. Pascual. 2006. Type I interferon in systemic lupuserythematosus and other autoimmune diseases. Immunity 25: 383–392.
3. Liao, A. P., M. Salajegheh, R. Nazareno, J. C. Kagan, R. G. Jubin, and S. A.Greenberg. 2011. Interferon b is associated with type 1 interferon-induciblegene expression in dermatomyositis. Ann. Rheum. Dis. 70: 831–836.
4. Greenberg, S. A. 2010. Dermatomyositis and type 1 interferons. Curr.Rheumatol. Rep. 12: 198–203.
5. Walsh, R. J., S. W. Kong, Y. Yao, B. Jallal, P. A. Kiener, J. L. Pinkus,A. H. Beggs, A. A. Amato, and S. A. Greenberg. 2007. Type Iinterferon-inducible gene expression in blood is present and reflectsdisease activity in dermatomyositis and polymyositis. Arthritis Rheum.56: 3784–3792.
6. Karageorgas, T. P., D. D. Tseronis, and C. P. Mavragani. 2011. Acti-vation of type I interferon pathway in systemic lupus erythematosus:association with distinct clinical phenotypes. J. Biomed. Biotechnol.2011: 273907.
7. Liu, Y., A. A. Jesus, B. Marrero, D. Yang, S. E. Ramsey, G. A. M. Sanchez,K. Tenbrock, H. Wittkowski, O. Y. Jones, H. S. Kuehn, et al. 2014.Activated STING in a vascular and pulmonary syndrome. N. Engl. J.Med. 371: 507–518.
8. Rice, G. I., G. M. Forte, M. Szynkiewicz, D. S. Chase, A. Aeby,M. S. Abdel-Hamid, S. Ackroyd, R. Allcock, K. M. Bailey, U. Balottin,et al. 2013. Assessment of interferon-related biomarkers in Aicardi-Goutieres syndrome associated with mutations in TREX1, RNASEH2A,RNASEH2B, RNASEH2C, SAMHD1, and ADAR: a case-control study.Lancet Neurol. 12: 1159–1169.
https://doi.org/10.4049/immunohorizons.1800054
ImmunoHorizons TLR-STIMULATED PRIMARY CELLS PREDOMINATELY PRODUCE IFN-b 337
by guest on Novem
ber 19, 2021http://w
ww
.imm
unohorizons.org/D
ownloaded from
9. Huard, C., S. V. Gulla, D. V. Bennett, A. J. Coyle, R. A. Vleugels, andS. A. Greenberg. 2017. Correlation of cutaneous disease activity withtype 1 interferon gene signature and interferon b in dermatomyositis.Br. J. Dermatol. 176: 1224–1230.
10. Higgs, B. W., Z. Liu, B. White, W. Zhu, W. I. White, C. Morehouse,P. Brohawn, P. A. Kiener, L. Richman, D. Fiorentino, et al. 2011. Patientswith systemic lupus erythematosus, myositis, rheumatoid arthritis andscleroderma share activation of a common type I interferon pathway.Ann. Rheum. Dis. 70: 2029–2036.
11. Castellano, G., C. Cafiero, C. Divella, F. Sallustio, M. Gigante,P. Pontrelli, G. De Palma, M. Rossini, G. Grandaliano, and L. Gesualdo.2015. Local synthesis of interferon-alpha in lupus nephritis is asso-ciated with type I interferons signature and LMP7 induction in renaltubular epithelial cells. Arthritis Res. Ther. 17: 72.
12. Salajegheh, M., S. W. Kong, J. L. Pinkus, R. J. Walsh, A. Liao,R. Nazareno, A. A. Amato, B. Krastins, C. Morehouse, B. W. Higgs,et al. 2010. Interferon-stimulated gene 15 (ISG15) conjugates proteins indermatomyositis muscle with perifascicular atrophy. Ann. Neurol. 67:53–63.
13. Greenberg, S. A., B. W. Higgs, C. Morehouse, R. J. Walsh, S. W. Kong,P. Brohawn, W. Zhu, A. Amato, M. Salajegheh, B. White, et al. 2012.Relationship between disease activity and type 1 interferon- and othercytokine-inducible gene expression in blood in dermatomyositis andpolymyositis. Genes Immun. 13: 207–213.
14. Wong, D., B. Kea, R. Pesich, B. W. Higgs, W. Zhu, P. Brown, Y. Yao,and D. Fiorentino. 2012. Interferon and biologic signatures in der-matomyositis skin: specificity and heterogeneity across diseases. PLoSOne 7: e29161.
15. Chuntharapai, A., J. Lai, X. Huang, V. Gibbs, K. J. Kim, L. G. Presta,and T. A. Stewart. 2001. Characterization and humanization of amonoclonal antibody that neutralizes human leukocyte interferon: acandidate therapeutic for IDDM and SLE. Cytokine 15: 250–260.
16. Wang, B., B. W. Higgs, L. Chang, I. Vainshtein, Z. Liu, K. Streicher,M. Liang, W. I. White, S. Yoo, L. Richman, et al. 2013. Pharmacoge-nomics and translational simulations to bridge indications for an anti-interferon-a receptor antibody. Clin. Pharmacol. Ther. 93: 483–492.
17. Yao, Y., L. Richman, B. W. Higgs, C. A. Morehouse, M. de los Reyes,P. Brohawn, J. Zhang, B. White, A. J. Coyle, P. A. Kiener, and B. Jallal.2009. Neutralization of interferon-alpha/beta-inducible genes anddownstream effect in a phase I trial of an anti-interferon-alphamonoclonal antibody in systemic lupus erythematosus. ArthritisRheum. 60: 1785–1796.
18. Kalunian, K. C., J. T. Merrill, R. Maciuca, J. M. McBride, M. J. Townsend,X. Wei, J. C. Davis Jr., and W. P. Kennedy. 2016. A Phase II study of theefficacy and safety of rontalizumab (rhuMAb interferon-a) in patientswith systemic lupus erythematosus (ROSE). Ann. Rheum. Dis. 75: 196–202.
19. Khamashta, M., J. T. Merrill, V. P. Werth, R. Furie, K. Kalunian,G. G. Illei, J. Drappa, L. Wang, and W. Greth, CD1067 Study In-vestigators. 2016. Sifalimumab, an anti-interferon-a monoclonalantibody, in moderate to severe systemic lupus erythematosus: arandomised, double-blind, placebo-controlled study. Ann. Rheum.Dis. 75: 1909–1916.
20. Furie, R., M. Khamashta, J. T. Merrill, V. P. Werth, K. Kalunian,P. Brohawn, G. G. Illei, J. Drappa, L. Wang, and S. Yoo, CD1013 StudyInvestigators. 2017. Anifrolumab, an anti-interferon-a receptor mono-clonal antibody, in moderate-to-severe systemic lupus erythematosus.Arthritis Rheumatol. 69: 376–386.
21. Morand, E. F., R. Furie, Y. Tanaka, I. N. Bruce, A. D. Askanase,C. Richez, S. C. Bae, P. Z. Brohawn, L. Pineda, A. Berglind, andR. Tummala, TULIP-2 Trial Investigators. 2020. Trial of anifrolumabin active systemic lupus erythematosus. N. Engl. J. Med. 382: 211–221.
22. Li, L., T. Dai, J. Lv, K. Ji, J. Liu, B. Zhang, and C. Yan. 2015. Role oftoll-like receptors and retinoic acid inducible gene I in endogenousproduction of type I interferon in dermatomyositis. J. Neuroimmunol.285: 161–168.
23. Feng, X., H. Wu, J. M. Grossman, P. Hanvivadhanakul, J. D. FitzGerald,G. S. Park, X. Dong, W. Chen, M. H. Kim, H. H. Weng, et al. 2006.Association of increased interferon-inducible gene expression withdisease activity and lupus nephritis in patients with systemic lupuserythematosus. Arthritis Rheum. 54: 2951–2962.
24. Watanabe, S., T. Imaizumi, K. Tsuruga, T. Aizawa, T. Ito,T. Matsumiya, H. Yoshida, K. Joh, E. Ito, and H. Tanaka. 2013.Glomerular expression of myxovirus resistance protein 1 in humanmesangial cells: possible activation of innate immunity in the patho-genesis of lupus nephritis. Nephrology (Carlton) 18: 833–837.
25. Wenzel, J., M. Uerlich, E. Worrenkamper, S. Freutel, T. Bieber, andT. Tuting. 2005. Scarring skin lesions of discoid lupus erythematosusare characterized by high numbers of skin-homing cytotoxic lym-phocytes associated with strong expression of the type I interferon-induced protein MxA. Br. J. Dermatol. 153: 1011–1015.
26. Wenzel, J., E. Worenkamper, S. Freutel, S. Henze, O. Haller, T. Bieber,and T. Tuting. 2005. Enhanced type I interferon signalling promotesTh1-biased inflammation in cutaneous lupus erythematosus. J. Pathol.205: 435–442.
27. Marshak-Rothstein, A. 2006. Toll-like receptors in systemic autoim-mune disease. Nat. Rev. Immunol. 6: 823–835.
28. Chauhan, S. K., V. V. Singh, R. Rai, M. Rai, and G. Rai. 2013. Distinctautoantibody profiles in systemic lupus erythematosus patients areselectively associated with TLR7 and TLR9 upregulation. J. Clin.Immunol. 33: 954–964.
29. Kim, G. T., M. L. Cho, Y. E. Park, W. H. Yoo, J. H. Kim, H. J. Oh,D. S. Kim, S. H. Baek, S. H. Lee, J. H. Lee, et al. 2010. Expression ofTLR2, TLR4, and TLR9 in dermatomyositis and polymyositis. Clin.Rheumatol. 29: 273–279.
30. Papadimitraki, E. D., M. Tzardi, G. Bertsias, E. Sotsiou, andD. T. Boumpas. 2009. Glomerular expression of toll-like receptor-9 inlupus nephritis but not in normal kidneys: implications for the am-plification of the inflammatory response. Lupus 18: 831–835.
31. Krug, A., A. Towarowski, S. Britsch, S. Rothenfusser, V. Hornung,R. Bals, T. Giese, H. Engelmann, S. Endres, A. M. Krieg, andG. Hartmann. 2001. Toll-like receptor expression reveals CpG DNA asa unique microbial stimulus for plasmacytoid dendritic cells whichsynergizes with CD40 ligand to induce high amounts of IL-12. Eur. J.Immunol. 31: 3026–3037.
https://doi.org/10.4049/immunohorizons.1800054
338 TLR-STIMULATED PRIMARY CELLS PREDOMINATELY PRODUCE IFN-b ImmunoHorizons
by guest on Novem
ber 19, 2021http://w
ww
.imm
unohorizons.org/D
ownloaded from
10-8 10-6 10-4 10-2 100 102 1040
2000
4000
6000
8000
IFNβ neutralization
Ab (nM)
pSTA
T1
α-IFNβ
α-IFNAR
10-8 10-6 10-4 10-2 100 102 1040
2000
4000
6000
8000
10000
IFNα neutralization
Ab (nM)
pSTA
T1
α-IFNβ
α-IFNAR
Supp. Fig. 1
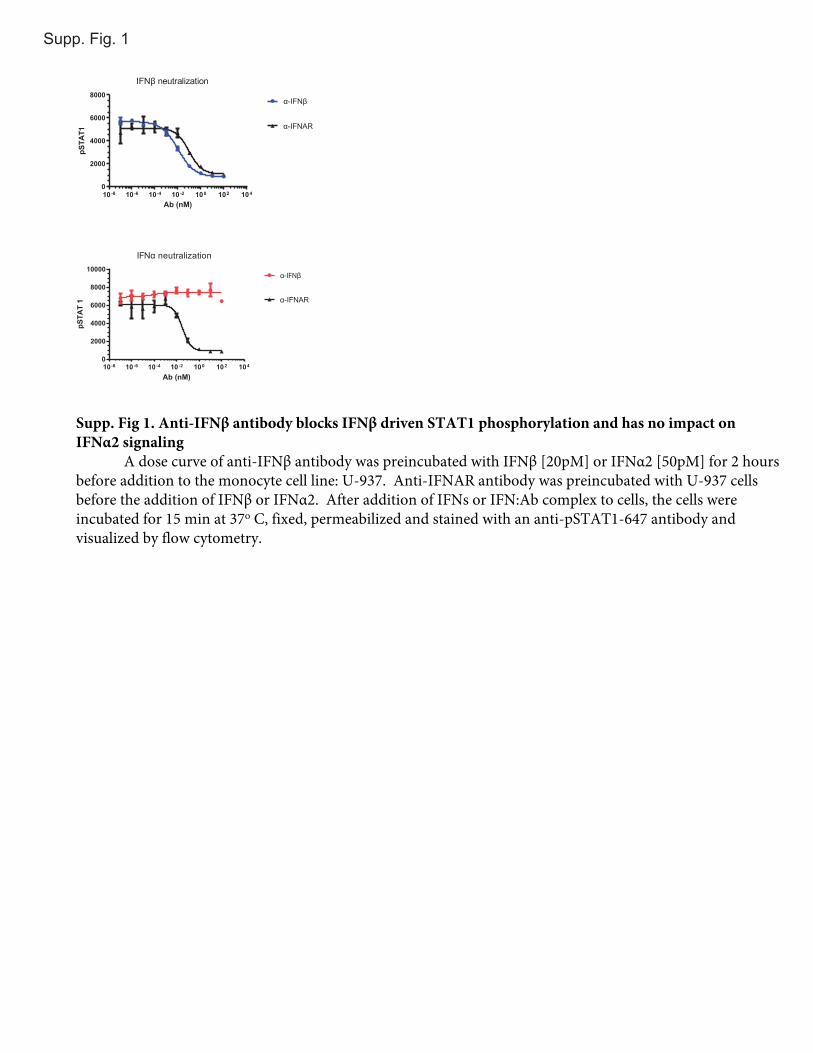
Supp. Fig 1. Anti-IFNβ antibody blocks IFNβ driven STAT1 phosphorylation and has no impact on IFNα2 signaling
A dose curve of anti-IFNβ antibody was preincubated with IFNβ [20pM] or IFNα2 [50pM] for 2 hours before addition to the monocyte cell line: U-937. Anti-IFNAR antibody was preincubated with U-937 cells before the addition of IFNβ or IFNα2. After addition of IFNs or IFN:Ab complex to cells, the cells were incubated for 15 min at 37o C, fixed, permeabilized and stained with an anti-pSTAT1-647 antibody and visualized by flow cytometry.
Unt
reat
ed Hours post stimulation1 2.5 5 8 24 48
Dermal FibroblastsHours post stimulation
1 2.5 5 8 24 48
Skeletal MuscleHours post stimulation
1 2.5 5 8 24 48
Glomerular Mesangial Hours post stimulation
1 2.5 5 8 24 48
PBMCs
Unt
reat
ed
Unt
reat
ed
Unt
reat
ed
IFN β
MX1
IFN α1
IFN α2
IFN α4
IFN α5
IFN α6
IFN α7
B2M
IFN α8
IFN α14
IFN α16
IFN α17
5 log2
-5 log2
A.
Unt
reat
ed Hours post stimulation1 2.5 5 8 24
Dermal FibroblastsHours post stimulation
1 2.5 5 8 24
Skeletal MuscleHours post stimulation
1 2.5 5 8 24
Glomerular Mesangial Hours post stimulation
1 2.5 5 8 24
PBMCs
Unt
reat
ed
Unt
reat
ed
Unt
reat
ed
IFN β
MX1
IFN α1
IFN α2
IFN α4
IFN α5
IFN α6
IFN α7
B2M
IFN α8
IFN α14
IFN α16
IFN α17
5 log2
-5 log2
B.U
ntre
ated Hours post stimulation
1 2.5 5 8 24
Dermal FibroblastsHours post stimulation
1 2.5 5 8 24
Skeletal MuscleHours post stimulation
1 2.5 5 8 24
Glomerular Mesangial Hours post stimulation
1 2.5 5 8 24
PBMCs
Unt
reat
ed
Unt
reat
ed
Unt
reat
ed
IFNβMX1IFNα1IFNα2IFNα4IFNα5IFNα6IFNα7
B2M
IFNα8IFNα14
IFNα16IFNα17
5 log2
-5 log2
C.
Unt
reat
ed Hours post stimulation1 2.5 5 8 24
Dermal FibroblastsHours post stimulation
1 2.5 5 8 24
Skeletal MuscleHours post stimulation
1 2.5 5 8 24
Glomerular Mesangial Hours post stimulation
1 2.5 5 8 24
PBMCs
Unt
reat
ed
Unt
reat
ed
Unt
reat
ed
IFN β
MX1
IFN α1
IFN α2
IFN α4
IFN α5
IFN α6
IFN α7
B2M
IFN α8
IFN α14
IFN α16
IFN α17
5 log2
-5 log2
D.
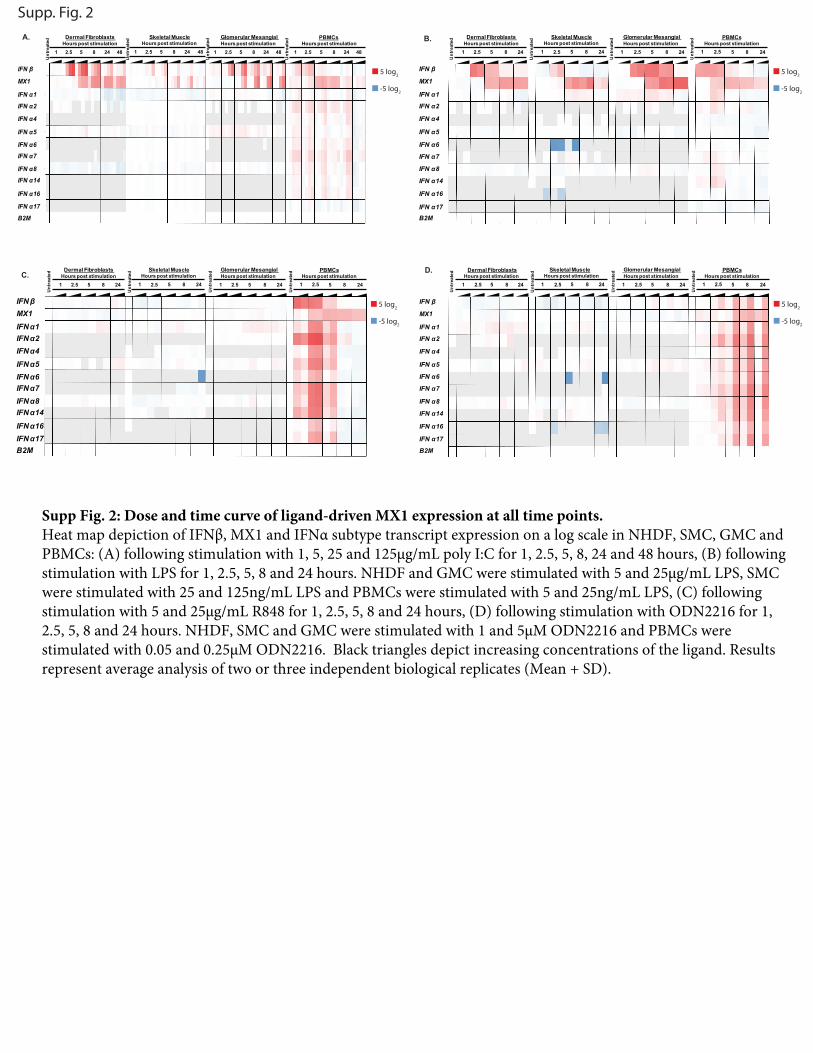
Supp. Fig. 2
Supp Fig. 2: Dose and time curve of ligand-driven MX1 expression at all time points. Heat map depiction of IFNβ, MX1 and IFNα subtype transcript expression on a log scale in NHDF, SMC, GMC and PBMCs: (A) following stimulation with 1, 5, 25 and 125µg/mL poly I:C for 1, 2.5, 5, 8, 24 and 48 hours, (B) following stimulation with LPS for 1, 2.5, 5, 8 and 24 hours. NHDF and GMC were stimulated with 5 and 25µg/mL LPS, SMC were stimulated with 25 and 125ng/mL LPS and PBMCs were stimulated with 5 and 25ng/mL LPS, (C) following stimulation with 5 and 25µg/mL R848 for 1, 2.5, 5, 8 and 24 hours, (D) following stimulation with ODN2216 for 1, 2.5, 5, 8 and 24 hours. NHDF, SMC and GMC were stimulated with 1 and 5µM ODN2216 and PBMCs were stimulated with 0.05 and 0.25µM ODN2216. Black triangles depict increasing concentrations of the ligand. Results represent average analysis of two or three independent biological replicates (Mean + SD).
0
500
1000
1500Dermal Fibroblasts
Mx1
Fol
d ch
ange P < 0.0001
0
50
100
150
200
Mx1
Fol
d ch
ange P < 0.0001
0
500
1000
1500
2000Skeletal Muscle
P < 0.0001
0
20
40
60
P < 0.0001
0
1000
2000
3000
Glomerular Mesangial
P = 0.0003
0
2000
4000
6000
8000
P < 0.0001
0
10
20
30
40
50PBMCs
P = 0.0035
0
5
10
15
P = 0.0166
Don
or 1
Don
or 2
poly I:C - + ++++ - + ++++ - + ++++ - + ++++Anti-IFNβ - - - - - - - -
B.A. C. D.
Mx1
Fol
d ch
ange
Skeletal Muscle Glomerular Mesangial PBMCs
Don
or 1
Don
or 2
LPS - + ++++ - + ++++ - + ++++ - + ++++Anti-IFNβ - - - - - - - -
0
50
100
150
Mx1
Fol
d ch
ange P < 0.0001
0
20
40
60
80
P < 0.0001
0
500
1000
1500
P < 0.0001
0
1000
2000
3000
4000
5000
P < 0.0001
0
500
1000
1500
P< 0.0001
0
200
400
600
800
1000 P< 0.0001
0
5
10
15
20
25
P = 0.0103
0
10
20
30 P = 0.0186
Dermal Fibroblasts
PBMC Donor 1 PBMC Donor 2
R848 - + ++++ - + ++++Anti-IFNβ - - - -
Mx1
Fol
d ch
ange
0
20
40
60
80 P = 0.1570
0
10
20
30
40
50 P = 0.7655
ODN 2216 + ++++ + ++++Anti-IFNβ - - - -
PBMCs Donor 1
Mx1
Fol
d ch
ange
- 0
20
40
60
80
100 P = 0.6079
PBMCs Donor 2
- 0
50
100
150 P = 0.5257
E. F. G. H.
I. J.
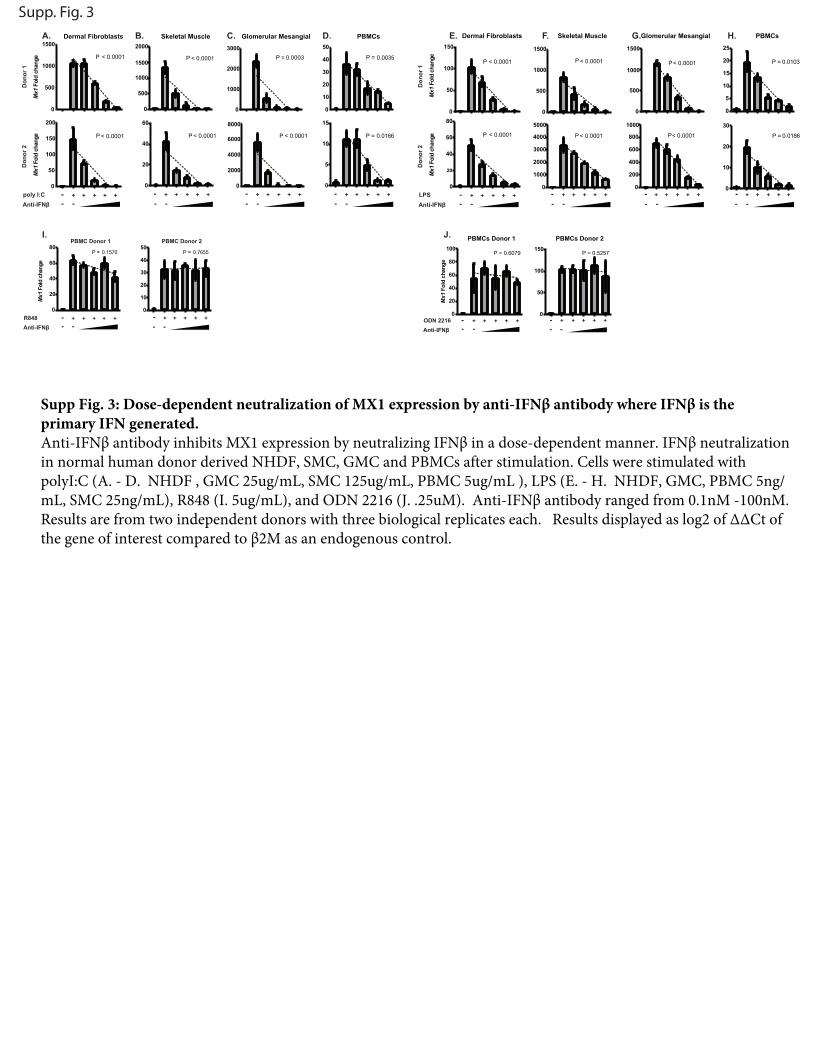
Supp. Fig. 3
Supp Fig. 3: Dose-dependent neutralization of MX1 expression by anti-IFNβ antibody where IFNβ is the primary IFN generated. Anti-IFNβ antibody inhibits MX1 expression by neutralizing IFNβ in a dose-dependent manner. IFNβ neutralization in normal human donor derived NHDF, SMC, GMC and PBMCs after stimulation. Cells were stimulated with polyI:C (A. - D. NHDF , GMC 25ug/mL, SMC 125ug/mL, PBMC 5ug/mL ), LPS (E. - H. NHDF, GMC, PBMC 5ng/mL, SMC 25ng/mL), R848 (I. 5ug/mL), and ODN 2216 (J. .25uM). Anti-IFNβ antibody ranged from 0.1nM -100nM. Results are from two independent donors with three biological replicates each. Results displayed as log2 of ΔΔCt of the gene of interest compared to β2M as an endogenous control.
NGMCPBMC
NSMCNHDF
0.000
0.005
0.010
0.0150.05
0.10
0.15
TLR 3
Rel
ativ
e E
xpre
ssio
n
NGMC
PBMC
NSMCNHDF
0.00.20.40.60.81.0
4
6
8
10
TLR 4
Rel
ativ
e E
xpre
ssio
n
NGMC
PBMC
NSMCNHDF
0.00
0.05
0.10
0.15
0.20
TLR 7
Rel
ativ
e E
xpre
ssio
n
NGMCPB
MC
NSMC
NHDF0.000
0.005
0.010
0.015
TLR 8
Rel
ativ
e E
xpre
ssio
n
NGMC
PBMC
NSMCNHDF
0.0
0.5
1.0
1.5
TLR 9
Rel
ativ
e E
xpre
ssio
n
Supp. Fig. 4
Supp. Fig. 4: TLR expression is primarily relegated to cells where stimulation was observed with each ligand.Relative expression of TLR3,4,7,8, and 9 in GMC, PBMC, SMC, and NHDF cells. RNA from each cell type was extracted and qPCR performed using TaqMan primers specific to each TLR. TLR expression was measured and the RQ calculated by transforming the log¬2 value of ΔΔCt of TLR relative to the geometric mean of GUSB and β2M as endogenous controls. Results represent average analysis of three independent biological replicates (Mean + SD).