
Title Emission spectroscopy of laser ablation plume ... · 1 Emission Spectroscopy of Laser...
21
Title Emission spectroscopy of laser ablation plume: Composition analysis of a target in water Author(s) Sakka, Tetsuo; Yamagata, Hajimu; Oguchi, Hisayuki; Fukami, Kazuhiro; Ogata, Yukio H. Citation Applied Surface Science (2009), 255(24): 9576-9580 Issue Date 2009-09 URL http://hdl.handle.net/2433/86178 Right c 2009 Elsevier B.V. All rights reserved. Type Journal Article Textversion author Kyoto University
Transcript of Title Emission spectroscopy of laser ablation plume ... · 1 Emission Spectroscopy of Laser...
Title Emission spectroscopy of laser ablation plume: Compositionanalysis of a target in water
Author(s) Sakka, Tetsuo; Yamagata, Hajimu; Oguchi, Hisayuki; Fukami,Kazuhiro; Ogata, Yukio H.
Citation Applied Surface Science (2009), 255(24): 9576-9580
Issue Date 2009-09
URL http://hdl.handle.net/2433/86178
Right c 2009 Elsevier B.V. All rights reserved.
Type Journal Article
Textversion author
Kyoto University

1
Emission Spectroscopy of Laser Ablation Plume: Composition Analysis of a Target in Water
Tetsuo Sakka,a,b,* Hajimu Yamagata,a Hisayuki Oguchi,a Kazuhiro Fukami,a Yukio H. Ogataa
a Institute of Advanced Energy, Kyoto University, Uji, Kyoto 611-0011, Japan b Research Fellow, Institute of Sustainability Science, Kyoto University
*Corresponding author: Tetsuo Sakka, Dr.
Institute of Advanced Energy, Kyoto University, Uji, Kyoto 611-0011, Japan Phone: +81-774-38-3501, Fax: +81-774-38-3499, E-mail: [email protected]
Abstract Emission spectra of the laser ablation plume formed by the irradiation of Cu65/Zn35
binary alloy in water at the room temperature with 150-ns pulsed laser were measured. The spectra were analyzed by comparing with the theoretical calculation based on the assumption that self-absorption effect is negligible and that the same temperature can be
applied to Cu atoms and Zn atoms in the plume. The calculation reproduced the spectra very well, and gave reasonable temperature as a best-fit parameter. However, the best-fit value of the Cu atomic density relative to Zn is significantly low compared with
the target composition. Care should be taken to perform in situ LIBS in liquid due to the complicated plume formation mechanism and dynamics of material intake into the plume.
PACS: 52.38.Mf
Keywords: Liquid-phase laser ablation, Laser induced breakdown spectroscopy, Composite target, Emission spectra

2
1. Introduction Emission spectroscopy of laser ablation plume is important not only for basic
study of the plume [1-6], but also for the application to surface elemental analysis of the target [7,8]. Because the plume contains atoms and ions originated from the surface, the optical emission from the plume can be used to identify the elements composing the
surface being irradiated. The application to the surfaces in liquid [9-11] is especially important [12-16], since a general method of surface elemental analysis applicable to various targets in situ in liquid is not available so far.
Although the concept of the method is simple, the realization of the quantitative or even qualitative analysis in liquid requires a few problems to be solved. One of them is that continuum often dominates the spectra [9,17], and the spectral-line
intensities are suppressed by self-absorption due to high density of the species involved in the transition [11,18,19]. This means that the spectral intensities are, in general, not proportional to the density of the species to be measured. Another one is that line
intensities depend on the plume temperature according to the Boltzmann distribution, which changes steeply with delay time from the irradiation [20]. This means that irradiation and detection conditions should be properly chosen and a calibration is
necessary. Our previous work has shown that the former effect is greatly reduced by using a long ns pulses as an ablation laser source [12]. Therefore, in the present work we basically use 150-ns pulses for the ablation source to avoid the former problems
related to the deformation of spectra, and deal with the quantitative nature of the emission spectra. On the other hand, for surface elemental analysis of composite materials, such
as alloys, relative emission intensities are expected to be affected also by the relative ablation efficiencies of each element composing the surface. In general the elemental composition of the laser-ablated species agrees quite well to the surface composition of
the target [21]. However, this has not been examined in the case of the laser ablation in liquid with using long ns pulses as ablation laser. In the present work, we measured emission spectra by the irradiation of
Cu-Zn binary alloys, and obtained the relationship between the relative emission-line intensity and the surface composition. Copper-based alloys have already been studied, and it has been shown that LIBS in gas atmosphere can be quantitatively analyzed by a
3
calibration process [22, 23]. However, the work of in-situ LIBS in water is very limited [24]. In the present work relative intensity of Cu and Zn was revealed to be quite different from the value expected from the composition of the Cu–Zn alloy by assuming
the equal ablation efficiency. We then tried to fit the spectra to a model calculation assuming the Boltzmann factors with a single temperature for Zn and Cu. Furthermore, the ablation species trapped in water after the irradiation was chemically analyzed to
determine the ablation efficiency of Cu and Zn. Based on the results, the ablation mechanism of composite materials is discussed with keeping in mind the potential applications to in situ LIBS.
2. Experiment
Experiments were performed by using fundamental oscillation (1064 nm) of a home-built Q-switched Nd:YAG laser as an excitation source. A long ns pulse, typically
150 ns, was obtained by the operation just above the lasing-threshold. The output of the laser oscillator was amplified by a Nd:YAG amplifier. The details are given in the previous publication [12]. The pulse energy of the laser was 6.6 mJ and the laser beam
was focused by a 100-mm-focal-length lens onto a target surface which is more than 10 mm below the water surface. The spot size measured in the absence of water was ~70 µm in diameter. The irradiation was performed at the same spot for several tens of laser
shots, and we did not find a noticeable change in the spectral feature. Therefore, the change of the composition across the depth of the pit is negligible for our sample. A cell made of quartz glass was used for the emission spectroscopy. Lateral emission from the
plume produced on a target immersed in liquid was collected and focused onto an entrance slit of a 275-mm-focal-length spectrograph (Acton, SpectraPro275) equipped with an intensified charge coupled device (ICCD, Princeton Instruments,
ICCD-1024MTDGE/1). The timing of the detection was controlled by applying high voltage to the intensifier by a pulser (Princeton Instruments, PG200). The pulse energy was measured by a Joule meter (Gentec, ED-200).
The measured spectra were used for analysis without any intensity calibration. The intensifier attached to the CCD and the grating in the spectrograph are the major causes of the deviation from the flat spectral sensitivity response. According to the data
4
provided from the manufacturer, the sensitivity of the intensifier is about ~10 % higher at the 480 nm than 520 nm, while the grating ~4 % less efficient. Therefore, we expect that the sensitivity within the spectral range in the present work is almost flat with only
a several-% deviation. A piece of commercially available metals was used as a target. Cu and Zn plates were purchased from Nilaco Inc. Cu-Zn binary alloy with the composition of
Cu65/Zn35 (brass) was purchased from Nilaco Inc., and Cu85/Zn15 (gilding metal) from Goodfellow Corp. For the analysis of the ablation amount, Cu and Zn in the water after the
irradiation were analyzed by the inductively-coupled plasma (ICP) spectroscopy (Jarrel-Ash, ICAP-500). The cell was filled with 25 ml of ultra-pure water from Millipore Milli-Q system. Laser irradiation was performed for 30 min with the pulse
repetition rate of 10 Hz. The pulse width of 150 ns was employed, while the 30-ns pulse was also examined. The chemical form of the ablation species can be oxides, metal, or ions dissolved in water. To dissolve particles dispersed in water concentrated HNO3 was
dropped until the water becomes perfectly clear.
3. Data analysis Spectral data were fitted to a model calculation based on the Boltzmann
distribution among the levels involved in the related transitions. A single temperature was used for the levels for both Cu and Zn atoms, i.e., thermal equilibrium is assumed between Cu and Zn in the light emitting region.
The details of the fitting are as follows. We assumed each spectral line to be Lorentzian. Then the fitting function F(λ) should be as follows,
(1)
where Ii is an intensity factor of the spectral line i, λi is the peak wavelength, Δλi is the
half width at half maxima (HWHM), and C is for the correction of the background or the continuum. Here we assume that the intensity of the spectral line is proportional to
€
F(λ) =1π
IiΔλi(λ − λi)
2 + Δλi2
i∑ + C

5
the population density of the upper level of the transition and also proportional to the Einstein A factor, which is the rate of spontaneous transition. Then we obtain,
(2)
where Ni and N0X are the population density of the upper level of the transition giving
the spectral line i and that of the ground state, respectively, gi and g0X are the statistical
weight of the upper level and the ground state, respectively, ΔEi is the energy difference
between the upper level and the ground state, k and T are the Boltzmann constant and
temperature, respectively. Superscript X represents atomic species, i.e., either Cu or Zn in the present case. The parameter α is to adjust the detection efficiency of the
measurement system. The intensity of the whole spectrum was fitted to Eq. (1) with the
intensity factor Ii given by Eq. (2). Atomic lines originated both in Cu and Zn were employed for the fitting by the above function. In the fitting process, λi , Δλi, T, N0
X (namely, N0
Cu, N0Zn), α, and C, were employed as fitting parameters. All the other
parameters were obtained from the literature [25]. A constant value for the detection efficiency factor α is assumed, since the sensitivity spectrum within the spectral range
observed in the present work should be sufficiently flat as mentioned in the
experimental section. Also, note that a single temperature was assumed for all the spectral lines analyzed in the fitting process, which means that the temperature of Cu and Zn is assumed to be the same. Within these restrictions, we obtained ground state
populations of Cu and Zn atoms, which is to be compared with the bulk composition of the target.
4. Results and discussion
Typical example of the emission spectra for a Cu65/Zn35 alloy (Cu:Zn=65:35) in water is given in Fig. 1. Spectral lines assigned to Cu and Zn appear in the spectral range of the measurement. By comparing with the spectra obtained at
different delay times, it is noticed that the line broadening and intensities of the lines vary with the delay time. It is also noticed that the line width or the broadening varies from line to line in a single spectrum. The line broadening is caused by the density of
€
Ii =αAiNi =αAiN0X gig0X exp −
ΔEi
kT
6
the plume, namely collision broadening or the Stark effect. The intensity ratio of the lines assigned to Cu and Zn should be related to the Cu/Zn ratio in the target material. The relation may be used as a calibration curve for the surface elemental composition
analysis. In Fig. 2 the intensity ratio of 515-nm line (Cu) to 481-nm line (Zn) is plotted as a function of the original bulk Cu/ Zn ratio in the target alloy. As can be seen in Fig. 2, the measurements at different delays show different behavior. Because line intensities
are in general a strong function of the plume temperature, and also because the plume temperature decays rapidly with time, the change of the intensity ratio with the delay time can be explained by the temperature decay. Incorporation of temperature as a
parameter into the data analysis procedure is quite important to improve the quantitative aspect of the elemental analysis by this method. The atomic number densities or their ratio cannot be obtained just by comparing two lines, i.e., a single line for each element.
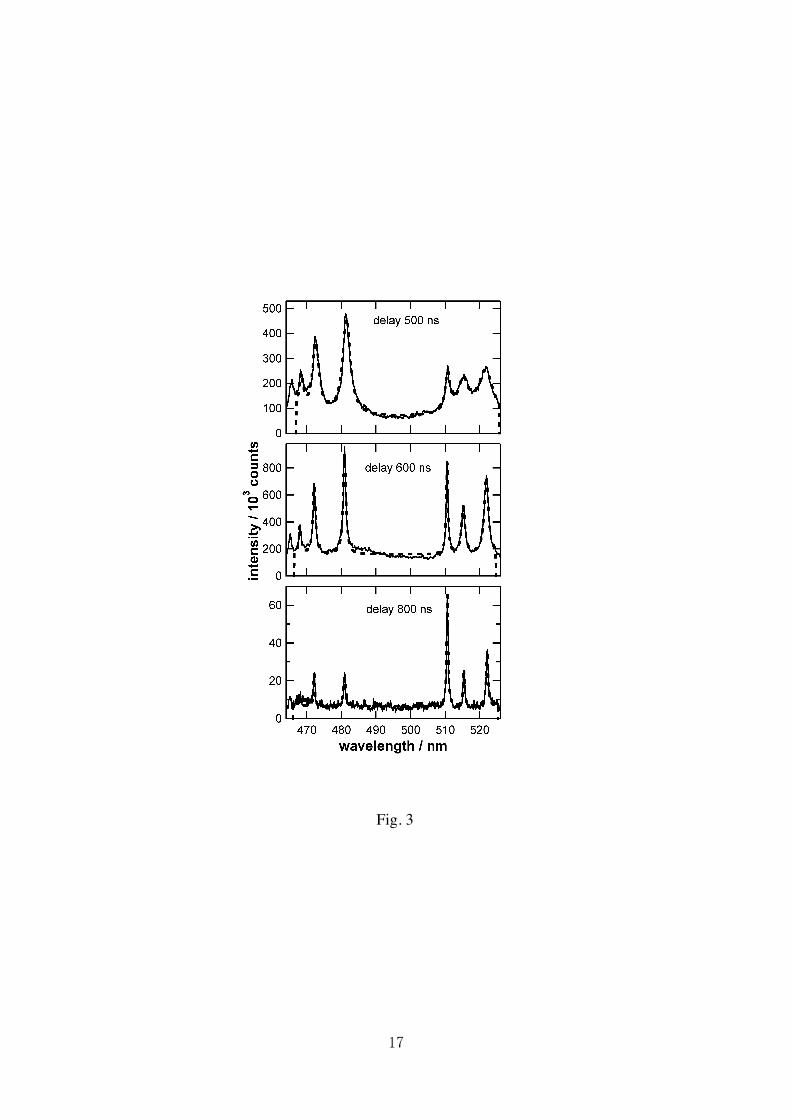
In order to improve the accuracy of the determination of the ratio Cu/Zn on the basis of the spectra, fit to the model described in section 3 was performed. The fitting results are given in Fig. 3. As can be seen in this figure, the best-fit spectrum
reproduces the observed one very well. Since the model takes account of the Boltzmann distribution of the population density, the temperature is introduced as a parameter to be determined through the
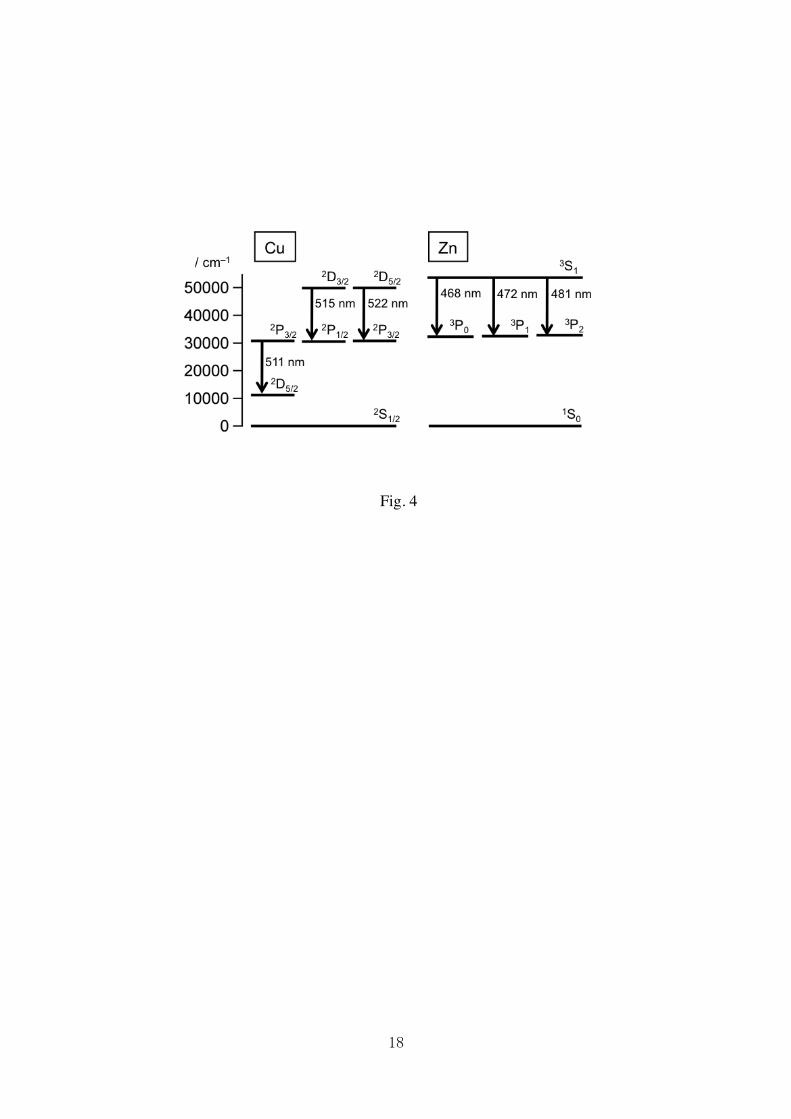
fitting process. Figure 4 shows energy diagrams of the levels involved in the transitions appearing in this work. The three transitions assigned to Zn are all from the same upper level, and therefore, we cannot obtain temperature through the Boltzmann distribution.
However, one of the three transitions assigned to Cu is from the level which is fairly-low in energy compared to the upper levels of the other two transitions. Therefore, the assumption of the Boltzmann distribution in the calculation gives temperature by
fitting to the observed spectra. It should be noted that the temperature adjustment by the fitting process is solely owing to the three Cu lines, and Zn lines do not make any effects to the temperature determination at all. Rather the temperature determined in
such a way is used to remove the Boltzmann factor of Zn-levels to determine relative population density of the ground state Zn atoms. In Fig. 5, the resultant best-fit temperature is plotted as a function of delay
time. The results give the values ranging up to around 8000 K. This is consistent to our previous studies [10,20], although a direct comparison is not fully justifiable due to the irradiation conditions and the target material being quite different from the present case.

7
Also, the temperature decreases with decay rate of several 100 ns, which is also consistent to our previous work [20]. Such temperature behavior suggests that the present modeling is properly accounting the emission spectra. In general, a specific
energy transfer among excited atoms may disturb the Boltzmann distribution of the population at a certain level [26]. However, very high density of the plume in water tends to suppress such specifically-high population of certain levels. We did not include
the self-absorption effects into the model, which is often very important for dense plasma, such as laser-induced plasma in general [4], or especially the laser plasma induced in liquid [11,18,19]. In our previous study we have shown that self-absorption
effects on the spectra are minimized by the use of a long ns laser, such as 150 ns [12]. Although the reason for this effect is not clear so far, it seems certain that the long-pulse effects have worked to suppress self-absorption effects also in this particular system.
Furthermore, the ground state, which is the highest-populated level, is not involved in the transitions, meaning that the population density related to the transitions analyzed in the present work is comparatively low, which should work as to suppress the
self-absorption effects. The intensity of the spectral line is proportional to the population density of the upper state. According to the Boltzmann distribution the population density of the
ground state is obtained from the fitting. The Cu/Zn ratio obtained as a result of fitting is plotted in Fig. 6 as a function of delay time. The Cu/Zn ratio seems to be constant with delay time. It should be noted that all the results show significantly small values
compared with the bulk composition of Cu and Zn in the target, namely Cu/Zn=1.86. Although the reason for this is not certain up to now, one explanation is that the ablation efficiency of Cu is significantly lower than Zn. Besides this explanation
several possibilities should be examined. One is that the plume is not in thermal equilibrium and Zn atoms have a temperature different from Cu atoms, although we have assumed a constant temperature in the model. Another one is that the
light-emitting region has an elemental composition different from the ablation composition as a whole, even if the ablation efficiency is equal for the two elements. Also, the self-absorption effects not considered in the present model may have to be
taken into account. To examine if our long ns pulse gives different ablation efficiency for each component of the target, the amount of Cu and Zn ablated into the water filled in the
8
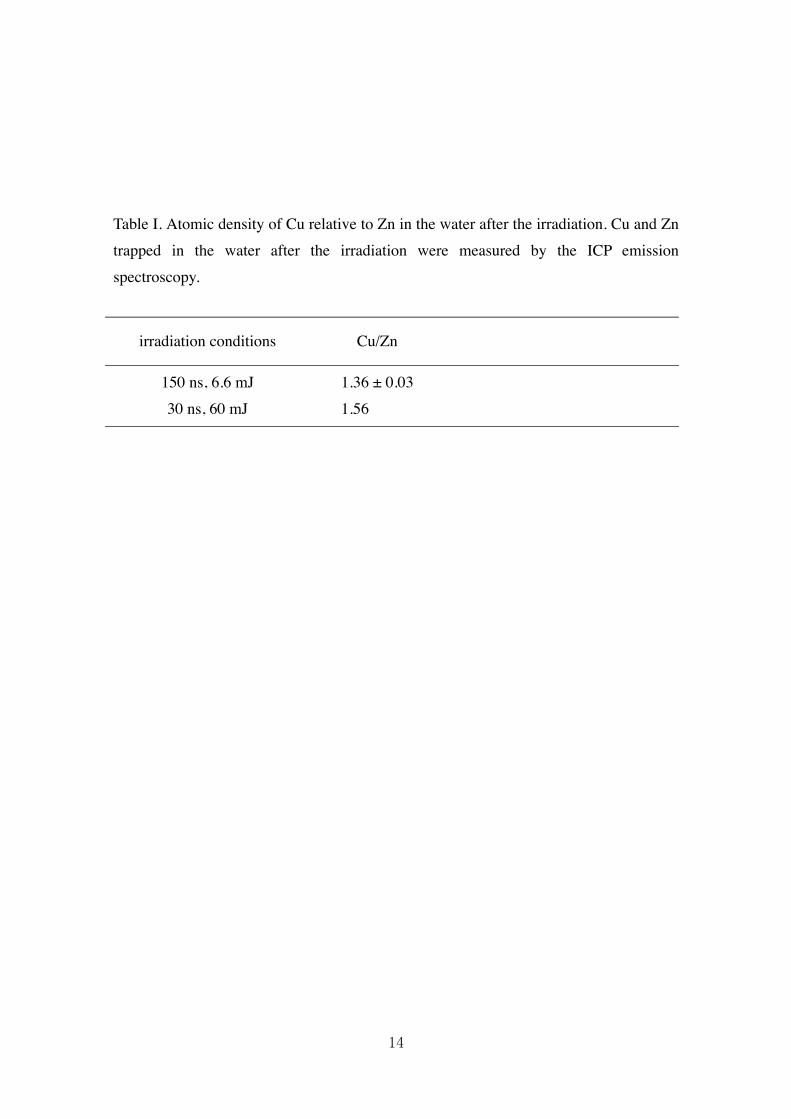
cell was examined by a quantitative chemical analysis of the water after the ablation. The analysis was performed by ICP measurements. Since all the ablated species other than those redeposit to the surface are trapped in the water in the cell, the ablation
efficiency should be quantitatively obtained by this method. The results are given in Table I. The ratio of Cu/Zn in the water was significantly close to the bulk composition 1.86, compared with those obtained by the theoretical fit to the emission spectra. There
should be some mechanism which explains a significant departure of the relative emission intensity from that expected by the relative ablation efficiency. Among the possibilities discussed above we are making special attention to
the possibility of inhomogeneous distribution of the Cu/Zn ratio between the ablation species and those incorporated into the light emitting region of the plume. We have a view that the ablation occurs either by an evaporation in the atomic form or by the
ejection in the droplet or cluster forms. The latter may further evaporate into an atomic form and contribute to the plasma plume, which is supposed to be in low density phase or gaseous phase. In this process, the evaporation of Zn into the plume can be preferable
compared with Cu. The direct ablation occurs at very high temperature compared with the melting point of any elemental materials, and therefore, the evaporation efficiency does not differ so much for different elements. However, for the ablated droplets or the
evaporated clusters staying at the periphery of the plume, where the temperature is mild or not extremely high compared with the melting point, the efficiency of the re-evaporation can differ by elements, according to their melting point. Low melting
point element can show high efficiency compared with a high melting point one. This may explain the result that the relative intensity of the emission from Zn lines is extremely higher than expected by the target composition, while we do not have any
solid evidence for this explanation so far. Although some models have been proposed on the dynamics of the plume formation in a gas environment, in relation with the droplet emission [27], the mechanism of the plume formation in water is rather unclear
and is left for a future study.
5. Conclusion

9
The emission spectra of the plume produced by the long-ns-pulse laser ablation of a Cu-Zn alloy immersed in water were examined. The theoretical spectra without taking account of the self-absorption effects fitted well to the experimental spectra.
The ratio of Cu atoms to Zn atoms evaluated by the fitting of the model calculation to experimental spectra suggested a significantly Zn-rich plume compared with the target Zn composition, while the ICP measurements suggested similar ablation
efficiency for Cu and Zn. Such discrepancy between the plume spectroscopy and the chemical analysis suggests that the quantitative nature of the emission spectroscopy is not sufficient. Further development of the calibration method is still required for the
LIBS to be established as in situ analytical method for underwater solid sample.
Acknowledgment This work was financially supported by a grant-in-aid from the Japan Society for the
Promotion of Science.

10
References [1] S. S. Harilal, C. V. Bindh, M. S. Tillack, F. Najmabadi, A. C. Gaeris, J. Appl. Phys.
93 (2003) 2380. [2] C. Vivien, J. Hermann, A. Perrone, C. Boulmer-Leborgne, A. Luches, J. Phys. D:
Appl. Phys. 31 (1998) 1263. [3] A. A. Puretzky, D. B. Geohegan, X. Fan, S. J. Pennycook, Appl. Phys. Lett. 76
(2000) 182. [4] T. Sakka, T. Nakajima, Y. H. Ogata, J. Appl. Phys. 92 (2002) 2296.
[5] H. Furusawa, T. Sakka, Y. H. Ogata, J. Appl. Phys. 96 (2004) 975.
[6] H. Furusawa, T. Sakka, Y. H. Ogata, �Appl. Phys. A79 (2004) 1291. [7] D. L. Cremers, L. J. Radziemski, Handbook of Laser-Induced Breakdown
Spectroscopy, John Wiley & Sons, New York, 2006. [8] A. W. Miziolek, V. Palleschi, I. Schechter, (Eds.), Laser-Induced Breakdown
Spectroscopy, Fundamentals and Applications, Cambridge University Press, Cambridge, 2006.
[9] T. Sakka, S. Iwanaga, Y. H. Ogata, A. Matsunawa, T. Takemoto, J. Chem. Phys. 112 (2000) 8645.
[10] T. Sakka, K. Saito, Y. H. Ogata, Appl. Surf. Sci. 197/198 (2002) 246. [11] T. Sakka, K. Saito, Y. H. Ogata, J. Appl. Phys. 97 (2005) 014902.
[12] T. Sakka, H. Oguchi, S. Masai, K. Hirata, Y. H. Ogata, M. Saeki, H. Ohba, Appl. Phys. Lett. 88 (2006) 061120.
11
[13] T. Sakka, H. Oguchi, S. Masai, Y. H. Ogata, Chem. Lett. 36 (2007) 508.
[14] A. E. Pichahchy, D. A. Cremers, M. J. Ferris, Spectrochim. Acta B 52 (1997) 25. [15] V. Lazic, F. Colao, R. Fantoni, V. Spizzicchino, Spectrochim. Acta B 60 (2005)
1002. [16] A. Casavola, A. De Giacomo, M. Dell'Aglio, F. Taccogna, G. Colonna, O. De
Pascale, S. Longo, Spectrochim. Acta B 60 (2005) 975. [17] H. Ushida, N. Takada, K. Sasaki, J. Phys: Conf. Ser. 59 (2007) 563.
[18] S. Masai, K. Hirata, T. Sakka, Y. H. Ogata, J. Phys: Conf. Ser. 59 (2007) 198.
[19] T. Sakka, H. Oguchi, Y. H. Ogata, J. Phys: Conf. Ser. 59 (2007) 559. [20] K. Saito, T. Sakka, Y. H. Ogata, J. Appl. Phys. 94 (2003) 5530.
[21] P. Yaroshchyk, D. Body, R. J. S. Morrison, B. L. Chadwick, Spectrochim. Acta B, 61 (2006) 200.
[22] G. Galbacs, I. B. Gornushkin, B. W. Smith, J. D. Winefordner, Spectrochim. Acta B, 56 (2001) 1159.
[23] L. Fornarini, f. Colao, R. Fantoni, V. Lazic, V. Spizzicchino, Spectrochim. Acta B, 60 (2005) 1186.
[24] A. De Giacomo, M. Dell'Aglio, F. Colao, R. Fantoni, V. Lazic, Appl. Surf. Sci. 247 (2005) 157.

12
[25] P. L. Smith, C. Heise, J. R. Esmond, R. L. Kurucz, Kurucz Atomic Line Database, 1995 Atomic Line Data (R.L. Kurucz and B. Bell) Kurucz CD-ROM No. 23, http://www.cfa.harvard.edu/amp/ampdata/kurucz23/sekur.html
[26] M. Saeki, K. Hirata, T. Sakka, H. Ohba, A. Yokoyama, J. Appl. Phys., 98 (2005) 044912.
[27] R. Hergenroeder, J. Anal. At. Spectrom., 21 (2006) 517.

13
Figure captions Fig. 1. Example of emission spectra of the plume. The target was a binary Cu-Zn alloy
with the composition of Cu:Zn=65:35. The delay time from the laser irradiation is 600 ns for this example. Spectral lines assigned to atomic Cu and Zn are clearly seen in the spectrum.
Fig. 2. Relative intensity of Cu 515-nm line to Zn 481-nm line is plotted against the Cu/Zn ratio of the sample. Two different time delays for the measurement were adopted:
500 ns (open square) and 600 ns (open circle). Fig. 3. Emission spectra at the delay time of 500, 600, and 800 ns, and the best-fit
results of the calculation. Experimental spectra are described by solid lines, while the best-fit calculations are described by broken lines.
Fig. 4. Energy diagram of the levels involved in the transitions. Three transitions for Cu and three for Zn seen in the spectrum given in Figs. 1 and 3 are given in this diagram.
Fig. 5. Best-fit temperatures obtained at various delay times. Fig. 6. Relative density of the ground state Cu atoms to the ground state Zn atoms
(Cu/Zn) obtained as the best-fit parameter. They are plotted as a function of the delay time. Composition of the target material is also shown by a broken line.
14
Table I. Atomic density of Cu relative to Zn in the water after the irradiation. Cu and Zn trapped in the water after the irradiation were measured by the ICP emission spectroscopy.
irradiation conditions Cu/Zn
150 ns, 6.6 mJ 1.36 ± 0.03 30 ns, 60 mJ 1.56

15
Fig. 1

16
Fig. 2
17
Fig. 3
18
Fig. 4

19
Fig. 5

20
Fig. 6