
Tierärztliche Hochschule Hannover Application of horse ...
204
Tierärztliche Hochschule Hannover Application of horse genomics to identify quantitative trait loci (QTL) for chronic pastern dermatitis in German draft horses INAUGURAL-DISSERTATION zur Erlangung des Grades einer Doktorin der Veterinärmedizin - Doctor medicinae veterinariae - (Dr. med. vet.) Vorgelegt von Evelyn Henrike Mittmann Wuppertal Hannover 2009
Transcript of Tierärztliche Hochschule Hannover Application of horse ...
Tierärztliche Hochschule Hannover
Application of horse genomics to identify quantitative trait loci
(QTL) for chronic pastern dermatitis in German draft horses
INAUGURAL-DISSERTATION
zur Erlangung des Grades einer
Doktorin der Veterinärmedizin
- Doctor medicinae veterinariae -
(Dr. med. vet.)
Vorgelegt von
Evelyn Henrike Mittmann Wuppertal
Hannover 2009
Table of contents
Scientific supervisor: Univ.-Prof. Dr. Dr. Ottmar Distl
Institute for Animal Breeding and Genetics
University of Veterinary Medicine Hannover
Examiner: Univ.-Prof. Dr. Dr. Ottmar Distl
Co-examiner: Univ.-Prof. Dr. Marion Hewicker-Trautwein
Oral examination: 10. November 2009

Dedicated to my beloved mother and father

Table of contents
Parts of this work have been published in the following journals:
1. Animal Genetics
2. Journal of Heredity
Table of contents
Table of contents
1 Introduction ...........................................................................................................2
2 Characterisation of a minimal microsatellite set for whole genome scans informative in warmblood and coldblood horse breeds....................................6
2.1 Abstract ......................................................................................................6
2.2 Introduction.................................................................................................6
2.3 Materials and Methods ...............................................................................7 2.3.1 Development of the marker set and animals for genotyping.......................7 2.3.2 PCR and genotyping of markers.................................................................9
2.4 Results......................................................................................................10
2.5 Discussion ................................................................................................11
2.6 References ...............................................................................................13
3 Identification of 21 781 equine microsatellites on the horse genome assembly 2.0 ........................................................................................................86
3.1 Source/description ....................................................................................86
3.2 Identification of microsatellites and their assignment on the horse genome.....................................................................................................86
3.3 PCR-primers.............................................................................................86
3.4 Comments ................................................................................................87
3.5 Acknowledgements...................................................................................87
3.6 References ...............................................................................................87
3.7 Tables.......................................................................................................88
3.8 Figures 1-32 .............................................................................................88
4 Whole genome scan identifies quantitative trait loci for chronic pastern dermatitis in German draft horses...................................................................108
4.1 Summary ................................................................................................108
4.2 Introduction.............................................................................................108
4.3 Material and Methods .............................................................................110 4.3.1 Animals...................................................................................................110 4.3.2 Microsatellite markers.............................................................................112 4.3.3 Genotyping .............................................................................................113 4.3.4 Statistical analysis ..................................................................................114
4.4 Results and discussion ...........................................................................115
4.5 References .............................................................................................119
Table of contents
4.6 Pedigrees of Family 2 - 32......................................................................148
5 General discussion ...........................................................................................156
5.1 Minimal screening set for the horse (MSSH) ..........................................156
5.2 Identification of new microsatellites ........................................................157
5.3 Whole genome scan for chronic pastern dermatitis ................................159
6 Summary............................................................................................................166
7 Erweiterte Zusammenfassung .........................................................................170
8 Appendix............................................................................................................184
9 List of publications ...........................................................................................190
10 Acknowledgements...........................................................................................192
Abbreviations
List of abbreviations A adenine
ABGe Animal Breeding & Genetics equus caballus
Acc. No Accession number
APS ammonium persulphate
ATP2A2 ATPase, Ca++ transporting, cardiac muscle, slow twitch 2
BLAST basic local alignment search tool
BLAT BLAST-like alignment tool
bp base pairs
C cytosine
CB Coldblood Horses
CD109 activated T-cell marker CD109
chrUn chromosome unknown
cM centiMorgan
CPD chronic pastern dermatitis
CPL chronic progressive lymphedema
DMSO dimethyl sulfoxide
DNA deoxyribonucleic acid
dNTP deoxy nucleoside 5’triphosphates (N is A, C, G or T)
E6AP E6-associated protein
ECA Equus caballus autosome
EDTA ethylenediaminetetraacetic acid
EquCab2.0 Equus caballus assembly 2.0
F forward
FOXC2 forkhead box C2 (MFH-1, mesenchyme forkhead 1)
G guanine
HET heterozygosity
HW Hanoverian warmblood
HSA Homo sapiens autosome
IBD identical by descent
INRA institut national de la recherche agronomique
IRD infrared dye
Abbreviations
kb kilobase
LD linkage disequilibrium
LOD logarithm of the odds
Mb megabase
MERLIN multipoint engine for rapid likelihood influence
MgCl2 Magnesium Chloride
MHC major histocompatibility complex
min minutes
MNA mean allele number
mM millimolar
MTMR6 myotubularin related protein 6
MSSH minimal screening set for the horse
n number
NA number of alleles
NC North Carolina
NCBI National Center for Biotechnology Information
NE Nebraska
ng nanogram
NPL non-parametric linkage
P or p error probability
PL error probability of LOD score
PZ error probability of Zmean
PCR polymerase chain reaction
PIC polymorphism information content
POS position
QTL quantitative trait locus or quantitative trait loci
R reverse
RG Rhenish German draft horse(s)
RH radiation hybrid
SAS statistical analysis system
SCHL Schleswig draft horse(s)
sec seconds
Abbreviations
SG South German draft horse(s)
SNP single nucleotide polymorphism
ST Saxon-Thuringian draft horse(s)
T thymine
Taq Thermus aquaticus (bacterium)
Ta annealing temperature
TBE tris-borate-ethylenediamine tetraacetic acid
T cell lymphocytes with a special receptor (T for thymus)
TEMED N,N,N’,N’-tetrametylenediamine
TGF-β transformimg growth factor-β
U unit
UBE3A ubiquitin protein ligase E3A
UCSC University of California Santa Cruz
USA United States of America
μl microliter
WB Warmblood horse(s)


CHAPTER 1
Introduction
2 Introduction
1 Introduction
The chronic pastern dermatitis is a severe localized skin infliction of horses’ feet that
has been known for centuries and has been the bane of existence for draft horse
breeders ever since. The chronic stage of pastern dermatitis is the verrucous form
that has early on been considered to represent a distinct disease entity that is only
found in heavy draft horses. Still, in Germany the pastern dermatitis is called ‘Mauke’
and no distinction is made between the ‘scratches’ or ‘grease heel’ of warmblood
breeds and the chronic verrucous form in draft horses. The disease processes start
at an early age, progress throughout the life until the horse presents with a
combination of progressive, severe, firm limb swelling associated with skin folds,
nodules and verrucous skin lesions that are non-responsive to therapy.
Environmental factors such as exposure to moisture and poor housing conditions
may exacerbate clinical signs and contribute to manifestations early in life.
The aetiology of chronic pastern dermatitis is still unknown, and this lack of
understanding towards the underlying pathogenic processes has resulted in new
descriptive terms for this disease. In the late 1980’s a study classified the histo-
pathologic changes that occur in affected skin regions as ’Pastern Leukocytoclastic
Vasculitis’ and provided a new effort to differentiate the common ‘grease heal’ from
the chronic pastern dermatitis in draft horses. Recent publications from the USA have
defined the new term ‘chronic progressive lymphedema’ that is derived from a
disease known in humans. The new research is neither complete nor conclusive as
to the cause and effect of the chronic pastern dermatitis, but the idea of a
generalized systemic disease with a localized affection area is becoming increasingly
popular in the scientific approaches.
Our approach was focused on the genetic factors that play an important role in the
development of chronic pastern dermatitis with heritability estimates ranging from 20
to 90% in German draft horse breeds. Due to the rapid development in equine
molecular genetics that has evolved around the second assembled genome
sequence of the horse (EquCab2.0), the prospects of dissecting the genetic
components of multigenic traits such as chronic pastern dermatitis have risen
Introduction 3
immensely. The first important step on this way has been achieved by this thesis.
This study was performed with the objective to identify the genomic regions which
are harbouring gene loci responsible for chronic pastern dermatitis in German draft
horses. Linkage studies such as this whole genome scan are based on highly
polymorphic microsatellite markers that are evenly distributed over the whole
genome. The availability of the second horse genome assembly has been essential
for the selection of equidistantly placed markers. Moreover, we made use of
EquCab2.0 to identify more than 20 000 new microsatellites by taking a
bioinformatics approach. The resulting five-fold increase of mapped microsatellites
has provided a so far unknown marker density for the horse close enough for very
successful fine mapping of quantitative trait loci. The newly identified microsatellites
were one of the new resources that helped us to increase the significance of the
whole genome scan for chronic pastern dermatitis in German draft horses.
Overview of chapters The contents of the thesis are presented in single papers according to §4(4) of the
Rules of Graduation (Promotionsordnung) of the University of Veterinary Medicine
Hanover.
Chapter 2 presents a minimal screening set for the horse that was developed to
facilitate microsatellite-based genome scans.
Chapter 3 provides the up to date largest number of mapped microsatellite markers
in the horse which were newly identified.
Chapter 4 contains a whole genome scan that was performed to identify quantitative
trait loci for chronic pastern dermatitis in German draft horses.
Chapter 5 comprises a general discussion and conclusions referring to chapters 2-4.
Chapter 6 is a concise English summary of this thesis.
Chapter 7 is an expanded, detailed German summary which takes into consideration
the overall research context.

4
CHAPTER 2
Characterisation of a minimal microsatellite set for whole genome
scans informative in warmblood and coldblood horse breeds
Evelyn H. Mittmann, Virginie Lampe, Stefanie Mömke, Alexandra Zeitz and Ottmar
Distl
Institute for Animal Breeding and Genetics, University of Veterinary Medicine
Hannover, Foundation, Germany
Journal of Heredity
Epub DOI 10.1093/jhered/esp091
6 Minimal screening set fort he horse (MSSH)
2 Characterisation of a minimal microsatellite set for whole genome scans informative in warmblood and coldblood horse breeds
2.1 Abstract
The availability of a high-quality draft sequence of the horse makes known the
physical location of microsatellites. The aim of the present study was to establish a
highly polymorphic minimal screening set of microsatellite markers for horses
(MSSH) annotated on the horse genome assembly EquCab2.0. We have used the
previously reported linkage and radiation hybrid maps and have extended these
marker sets by filling in gaps as noted from annotation on the horse sequence. This
MSSH covers all autosomes and the X chromosome with 322 evenly spaced
microsatellites whose positions were determined on the horse genome assembly
(EquCab2.0). The average chromosomal distance among markers amounts to 7.44
Mb. The characteristics established for this microsatellite set were the number of
alleles, the observed heterozygosity (HET), and the polymorphism information
content (PIC) for Hanoverian warmblood (HW) and several German coldblood horse
breeds (CB). The average number of alleles was 7.3 and 8.0 in HW and CB,
respectively. HET was at 71% for HW and CB, PIC at 65% (HW) and 67% (CB). This
MSSH allows scanning of the whole horse genome at close to 7-10 Mb resolution.
Key words: genome, heterozygositiy, horse, microsatellite, PIC The equine genome is estimated to contain approximately 2.7 billion base pairs
distributed on 31 autosomes and the X chromosome. The identification of genetic loci
and markers as well as their spacing on the chromosomes is one of the necessary
preconditions for linkage studies including fine mapping of quantitative trait loci,
parentage identification or genetic diversity analyses. We used the latest horse
Minimal screening set for the horse (MSSH) 7
genome assembly (EquCab2.0) to develop this minimal screening set of
microsatellites for horses (MSSH).
The majority of microsatellites reported in the horse are dinucleotide repeats (CA).
The comprehensive linkage maps reported by Swinburne et al. (2006), Penedo et al.
(2005) and Tozaki et al. (2004, 2007) and the radiation hybrid (RH) maps of
Chowdhary et al. (2003) and Raudsepp et al. (2008) have provided diverse sets of
microsatellite markers.
The aim of the present study was to establish a highly polymorphic microsatellite
marker set which covers the whole equine genome with evenly spaced markers and
which is anchored on the horse genome assembly EquCab2.0. This marker set
should be highly informative and facilitate mapping studies in the horse. Therefore,
the number of alleles, heterozygosity (HET) and polymorphism information content
(PIC) were determined in a random sample of the worldwide distributed Hanoverian
warmblood horse and a panel of several German coldblood horse breeds.
2.2 Materials and Methods
2.2.1 Development of the marker set and animals for genotyping
The Horsemap database at the INRA Biotechnology Laboratories Home Page
(http://locus.jouy.inra.fr) contains information on 1538 microsatellites. At the NCBI
nucleotide database (http://www.ncbi.nlm.nih.gov/) 24 124 equine microsatellites are
available since July 2009 (queries on 8/19/2009). The MSSH was developed using
microsatellites from the HORSEMAP homepage, the linkage maps of Swinburne et
al. (2006), Penedo et al. (2005) and Tozaki et al. (2004, 2007) and the RH maps of
Chowdhary et al. (2003) and Raudsepp et al. (2008). For all of these markers their
physical location on the horse genome assembly EquCab2.0 was determined using
BLAT (BLAST-like alignment tool) and an e-value of 10-5 as threshold. The expected
size range of the markers was determined using the polymerase chain reaction
(PCR) in silico function and the genome version ‘September 2007’ of the UCSC
8 Minimal screening set fort he horse (MSSH)
(University of California, Santa Cruz) Genome Browser (http://genome.ucsc.edu/cgi-
bin/hgPcr?command=start). The distances between the markers were calculated and
for all chromosomal regions being not covered by microsatellites within a distance of
10-20 Mb, we developed a total of 54 new markers to bridge these gaps in this
preliminary marker set.
Therefore, we generated permutation sequences with all variations of di-, tri- and
tetrarepeat motifs with a minimum length of 15 repeats and a maximum length of 30
repeats. For these sequences alignments were identified in the EquCab2.0 assembly
within 1-2 Mb of the targeted location. These newly developed markers are
distributed on 14 autosomes (ECA1, 2, 4, 5, 7, 10, 11, 15, 16, 18, 21, 22, 26 and 31).
Each of the chosen markers in the MSSH has been characterized using the number
of alleles, the observed HET and the PIC. HET shows the proportion of heterozygote
individuals. PIC is defined as the probability that the marker genotype of a given
offspring will, in the absence of crossing-over, allow to deduce which one of the two
marker alleles the offspring received from its parents.
The values for HET and PIC were used to test the information content of all markers
in this preliminary set. Markers which did not show a minimum value of four alleles
and a HET and PIC greater than 0.50 were removed and replaced by more
polymorphic markers as far as possible. Particularly in genomic regions with a low
marker density or with markers exhibiting low information content, new microsatellites
had to be developed. We chose several horse breeds for evaluation of the
information content of the marker set. The reason for testing the degree of
polymorphisms of the microsatellites in several breeds was that HET and PIC vary
among breeds and through genotyping of horses from several breeds, markers with a
breed specific abundance of polymorphisms should be excluded. We have chosen
the HW as a representative breed for warmblood horses. This breed may also exhibit
a similar degree of polymorphisms like Thoroughbreds or breeds with larger
proportions of Thoroughbred genes because the average proportion of Thoroughbred
genes amounts to 35% in HW. Further significant contributions to Hanoverians have
been made by Arabians, Anglo-Arabians, Trakehner and other German warmblood
strains (Hamann and Distl 2008). The HW is the largest warmblood breed worldwide
Minimal screening set for the horse (MSSH) 9
and has influenced many European warmblood breeds. The second group of horses
comprised several German coldblood horse breeds (CB), such as South German,
Rhenish German, Saxon-Thuringian and Schleswig coldblood. Each of these breeds
has been influenced and refined by a number of European coldblood lines. Rhenish
German and Saxon-Thuringian coldblood were strongly influenced by Belgian and
Ardenner coldblood horses (Aberle et al. 2004).
The markers were genotyped on an average number of 362 HW horses and 299
German coldblood horses.
2.2.2 PCR and genotyping of markers
Genomic DNA was isolated from ethylenediaminetetraacetic acid blood samples
using the QIAamp® 96 DNA Spin Blood Kit (Qiagen, Hilden, Germany). PCR was
performed on PTC 100™, PTC 200™ (MJ Research, Watertown, MA, USA) or
professional thermocyclers (Biometra, Göttingen, Germany). A PCR program with
varying annealing temperatures (Ta) and a general procedure has been used as
follows: after 4 minutes of initial denaturation at 94°C, 36 cycles of 30 seconds at
94°C, 60 sec at optimum annealing temperature, 30 sec at 72°C and the final cooling
to 4°C for 10 min were carried out. All PCR reactions were performed in 12 μl
reaction volumes using 10 ng DNA, 1.2 μl 10x incubation buffer containing 15 mM
MgCl2, 0.6 μl dimethyl sulfoxide, 0.2 μl each dNTP (100μM each) and 0.1 μl Taq
Polymerase (Qbiogene, Heidelberg, Germany). All forward primers were labelled
with the IRD700 or IRD800 at the 5’ end.
To increase efficiency, primer pairs were pooled into PCR multiplex groups of two to
nine markers. The remaining primer pairs were amplified separately. The multiplex
groups and the separately amplified PCR products were pooled according to their
size and labelling and diluted with formamide loading buffer in ratios from 1:10 to
1:30. For the analysis of the marker genotypes, the PCR products were size-
fractionated by gel electrophoresis on an automated sequencer (LI-COR 4200/S-2,
LI-COR 4300, Lincoln, NE, USA) using 4% and 6% polyacrylamide denaturing gels
(Rotiphorese Gel40, Carl Roth, Karlsruhe, Germany). Allele sizes were scored
10 Minimal screening set fort he horse (MSSH)
against IRD700- and IRD800-labeled DNA ladders. SAS/Genetics, version 9.2 (SAS
Institute, Cary, NC, USA) was employed to calculate number of alleles, HET and PIC.
2.3 Results
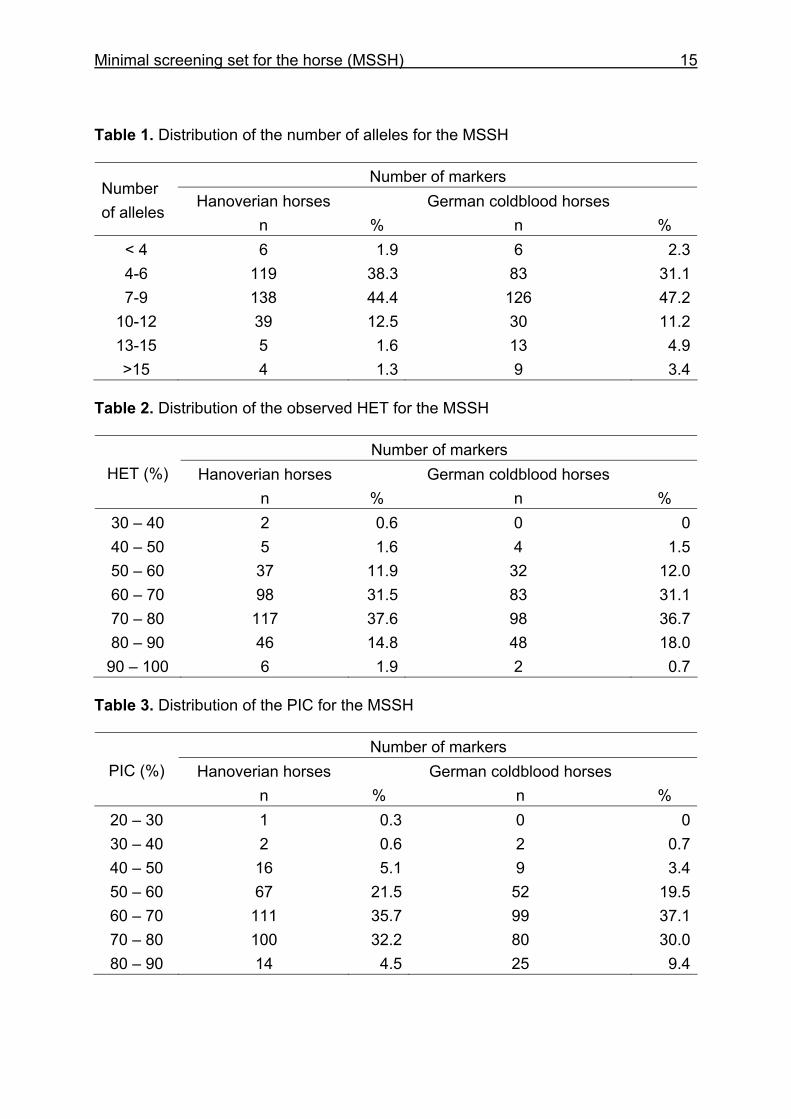
The mean number of alleles of the whole equine marker set including 322
microsatellite markers was 7.3 in HW and 8.0 in CB (Table 1). Seven microsatellites
had < 4 alleles for the HW and for the CB there were six markers with < 4 alleles.
HET and PIC with values less than 0.50 were seen in 7 and 19 markers (HW) and in
4 and 11 markers (CB). However, these markers with a lower heterozygosity were
retained as no other suitable markers were found to cover these regions.
The marker with the lowest number of alleles was UMNe244 which is located in a
region on ECA14 where only very few polymorphic microsatellites were identified.
The marker ABGe001 had the highest number of alleles with 24 for HW and 32 for
CB.
The mean values for HET and PIC slightly differed among HW and CB but overall the
CB showed a higher degree of polymorphisms. The distribution of the HET and PIC
values for the MSSH is shown in Tables 2 and 3.
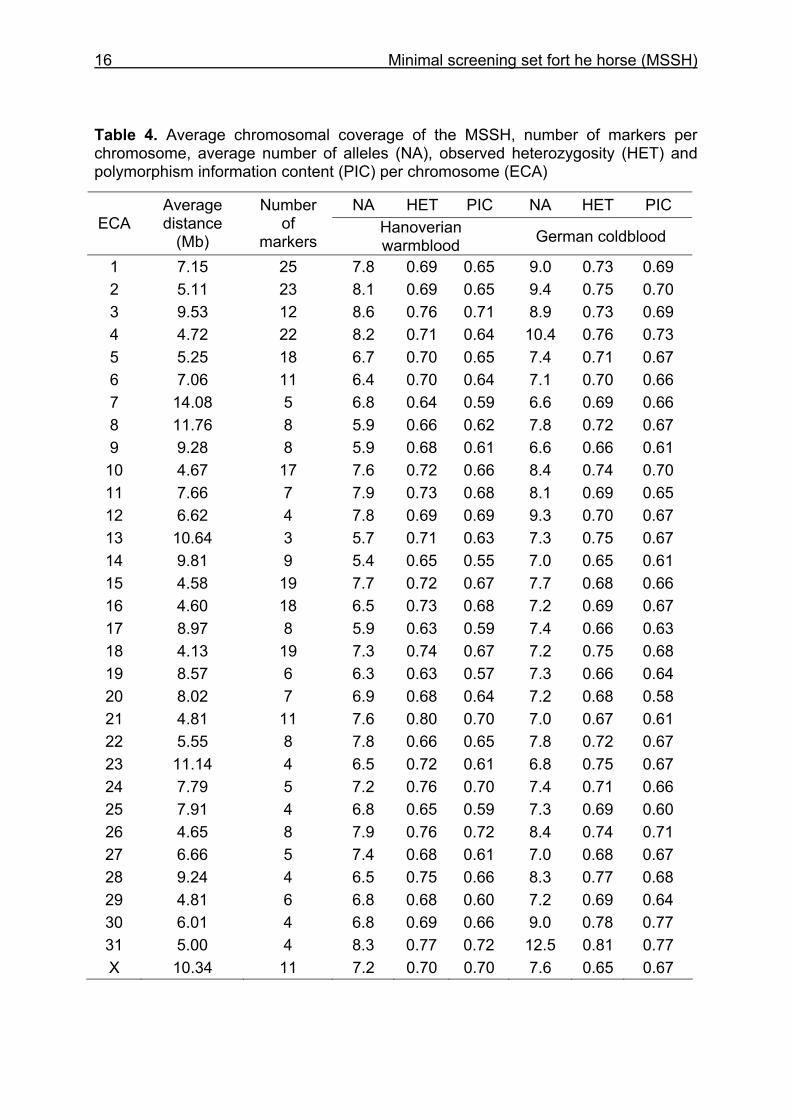
The characteristics of the MSSH such as average chromosomal marker coverage,
number of markers per chromosome, mean number of alleles per chromosome, HET
and PIC of the horses genotyped are given in Table 4. The mean spacing among the
markers of the MSSH according to the horse genome assembly EquCab2.0 was 7.44
Mb. There were two gaps of more than 20 Mb on ECA3 (21.8 Mb) and on the X
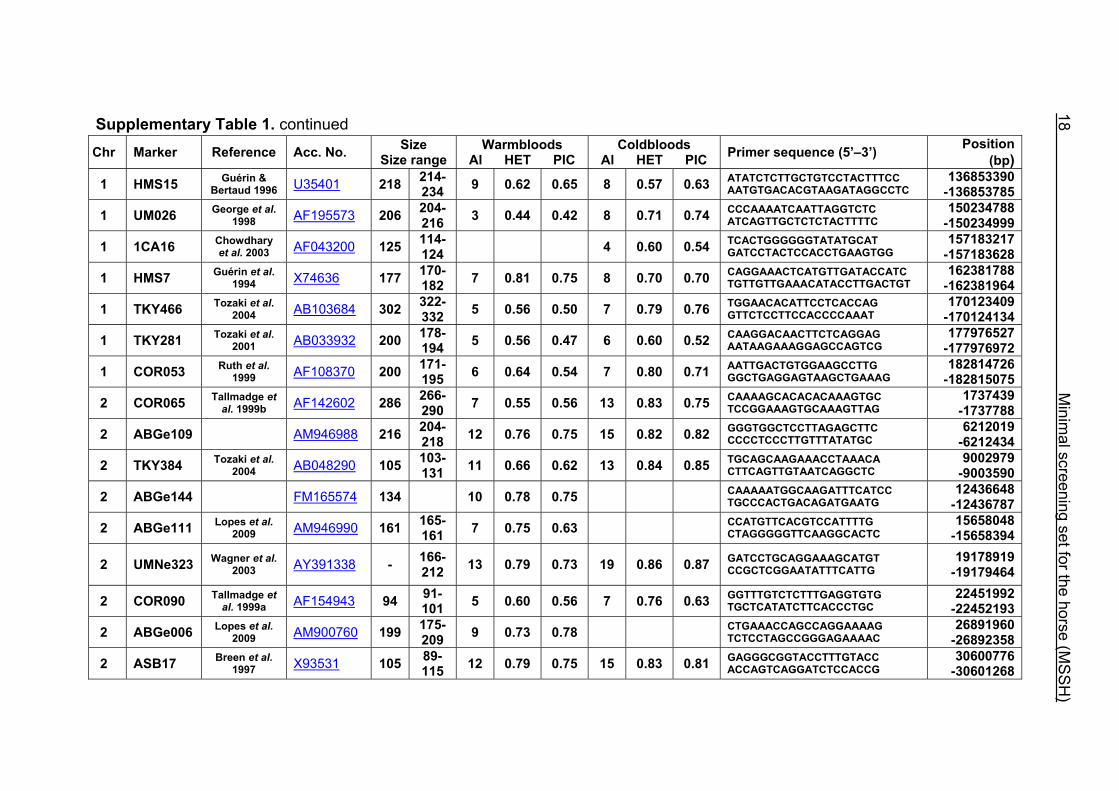
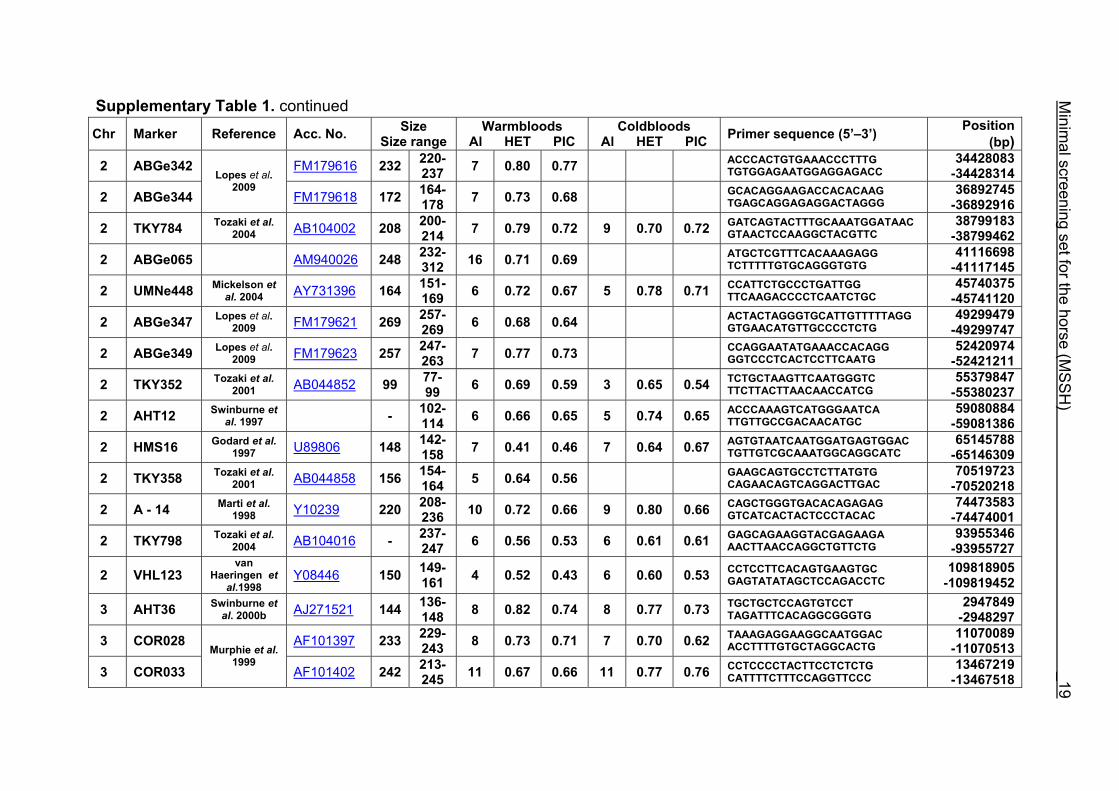
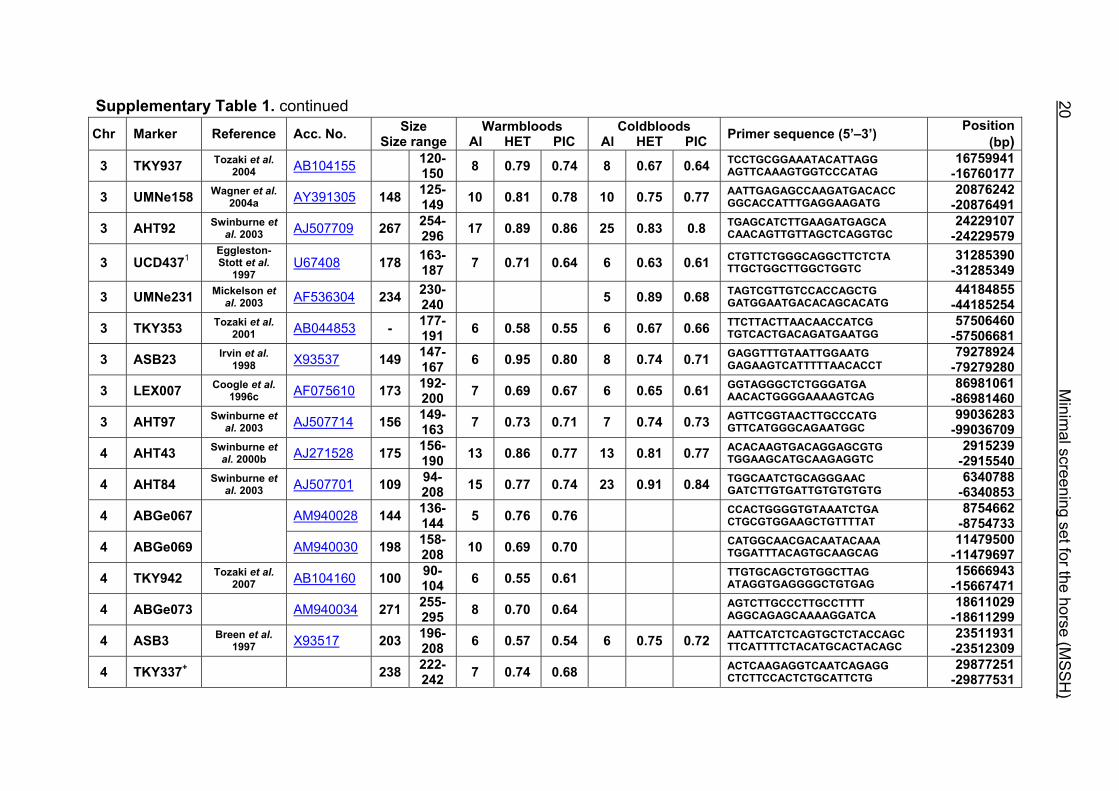
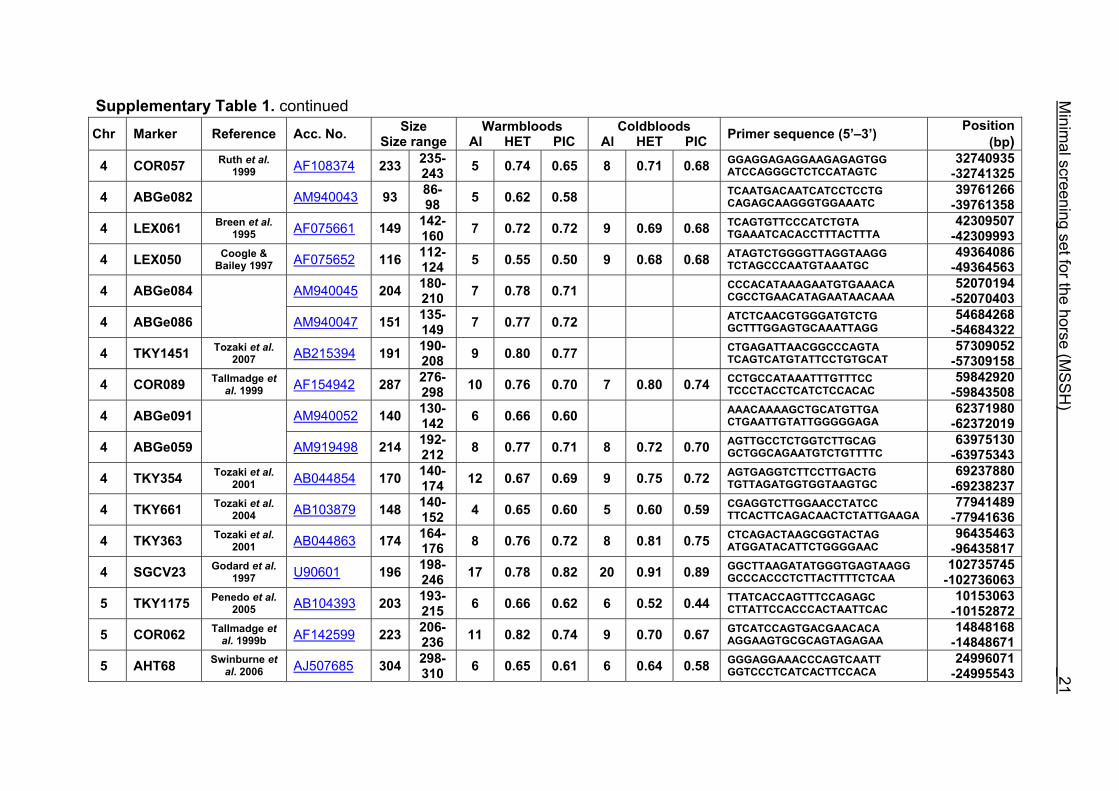
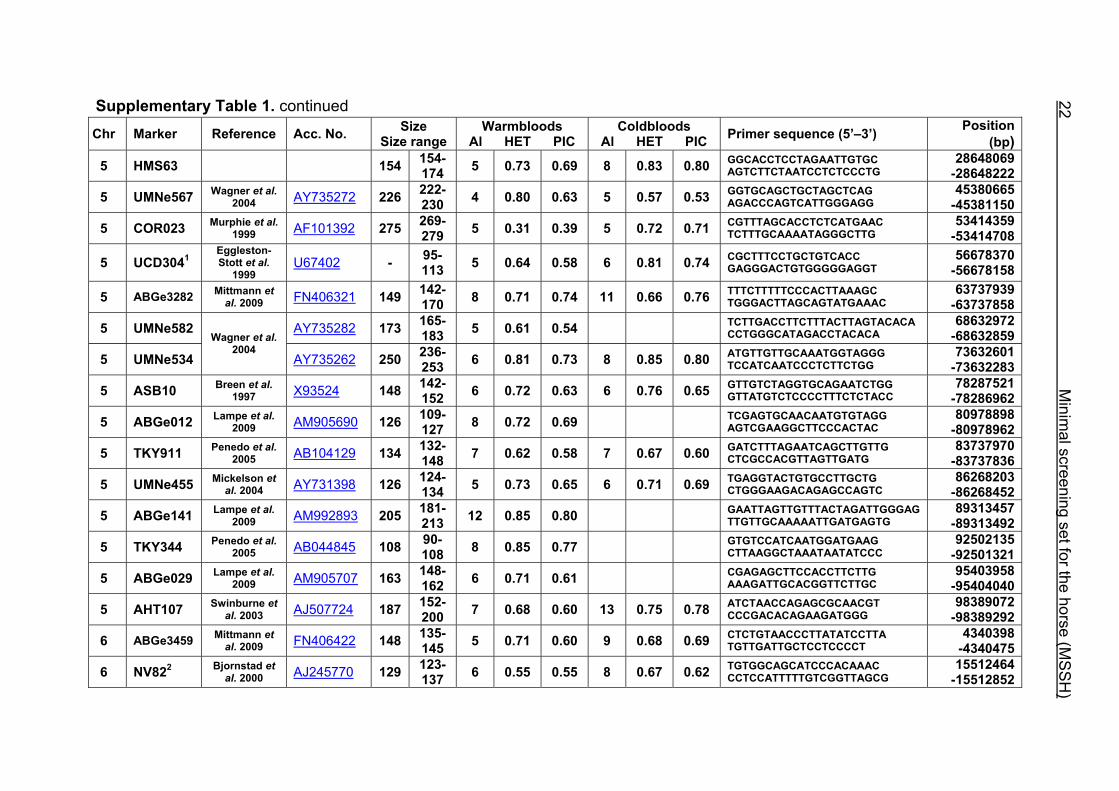
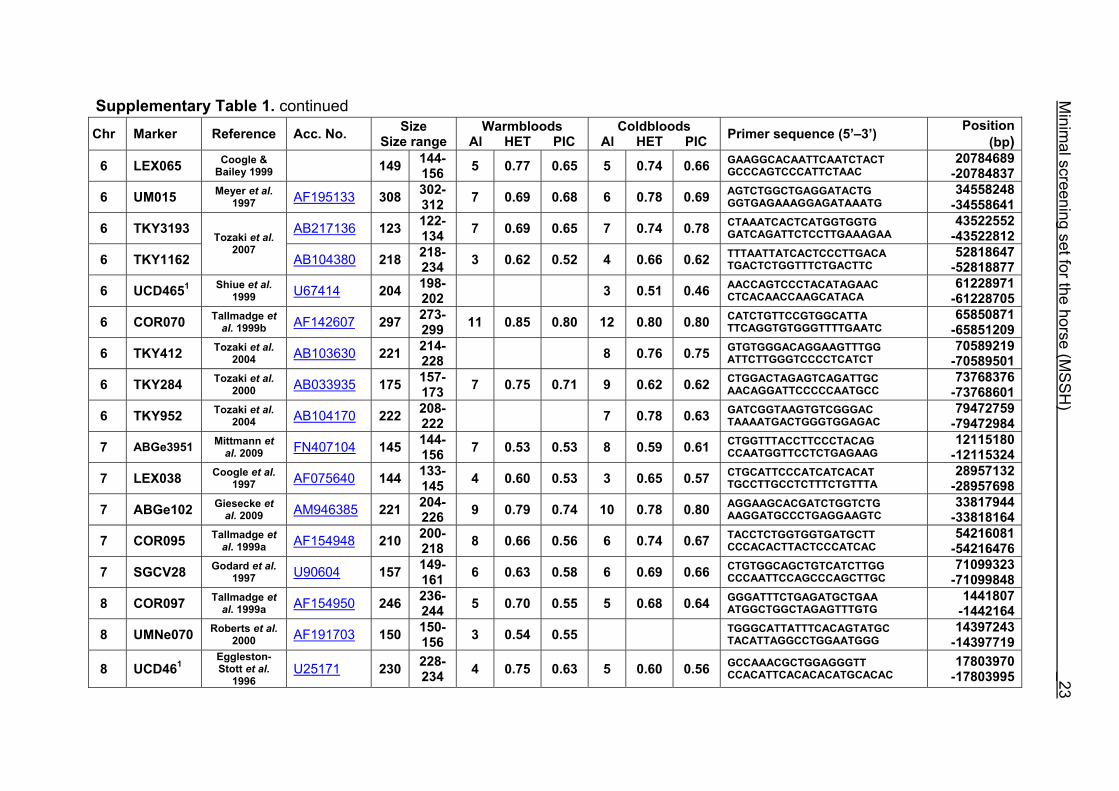
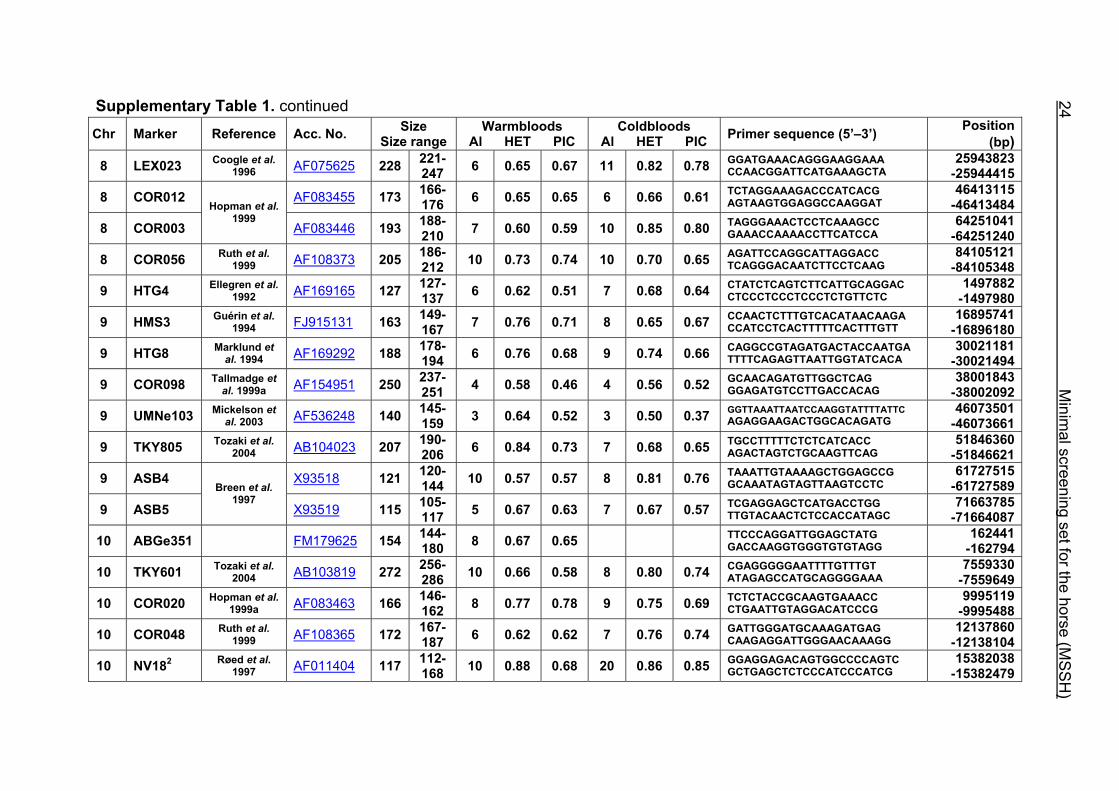
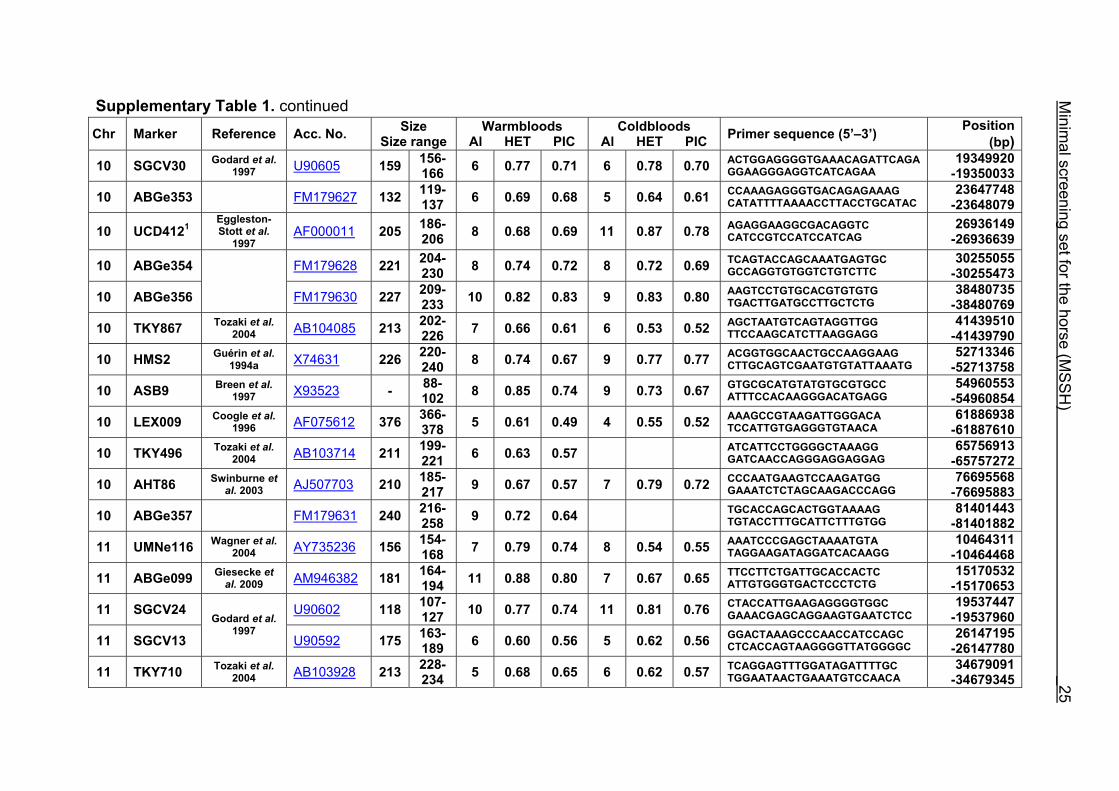
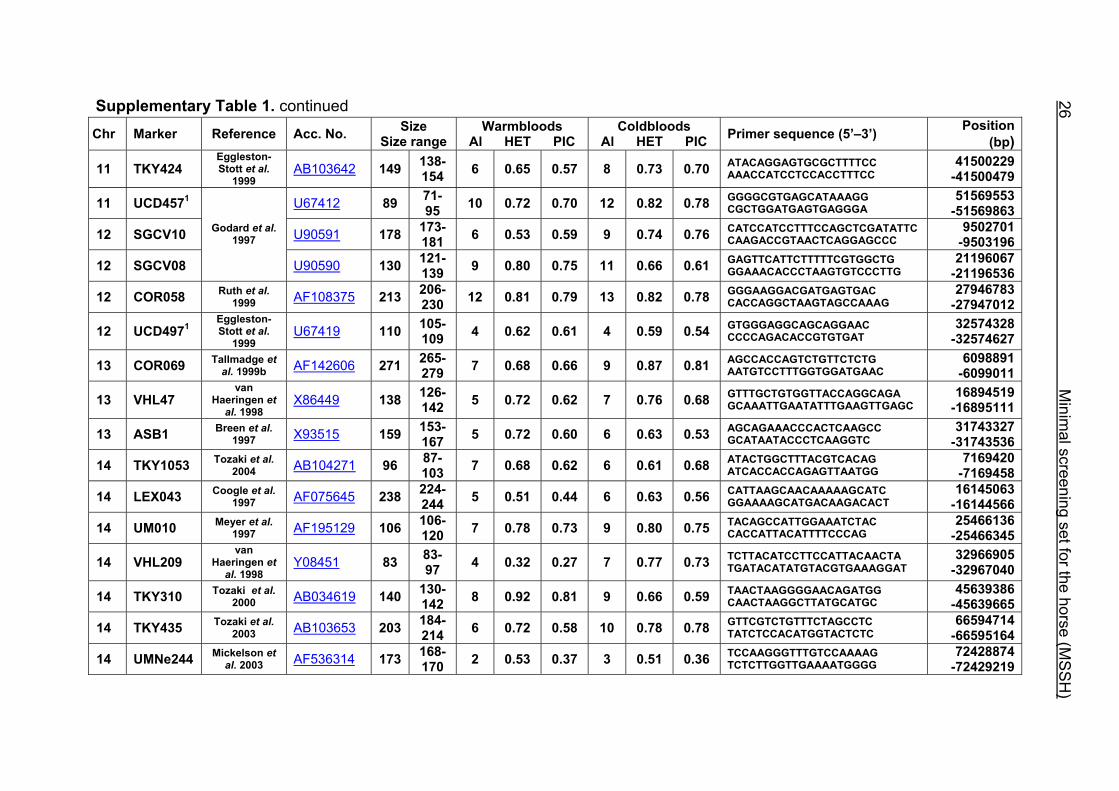
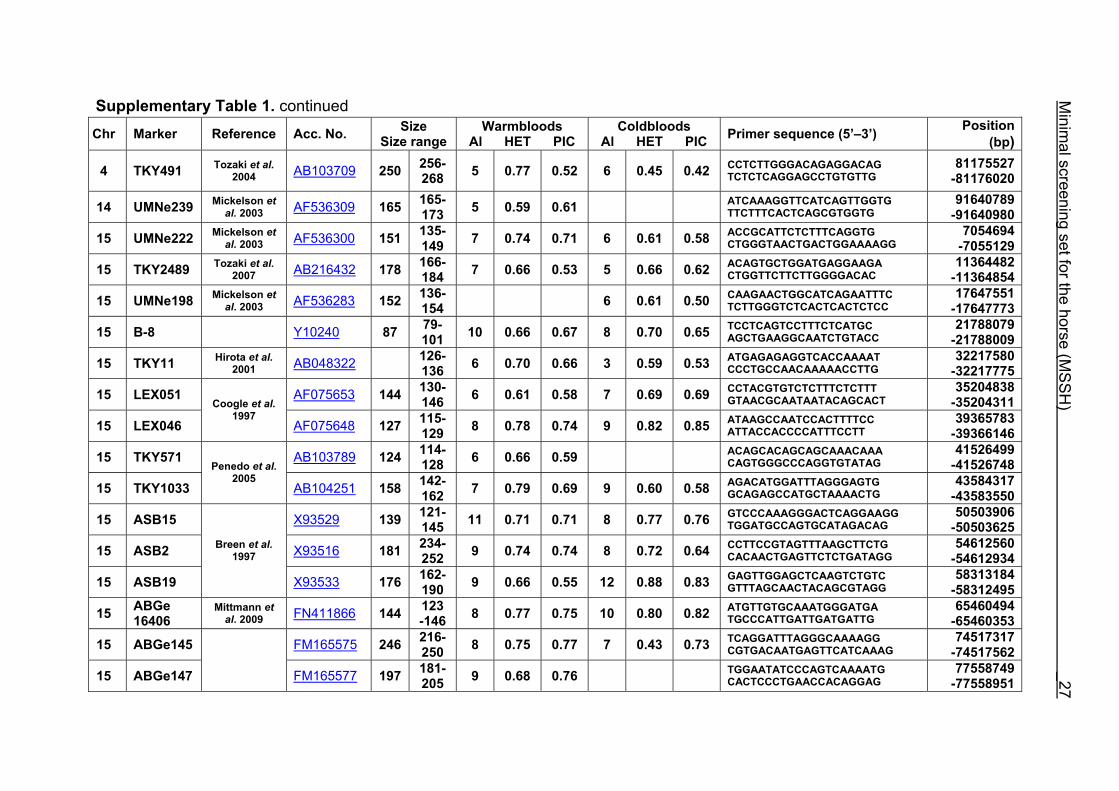
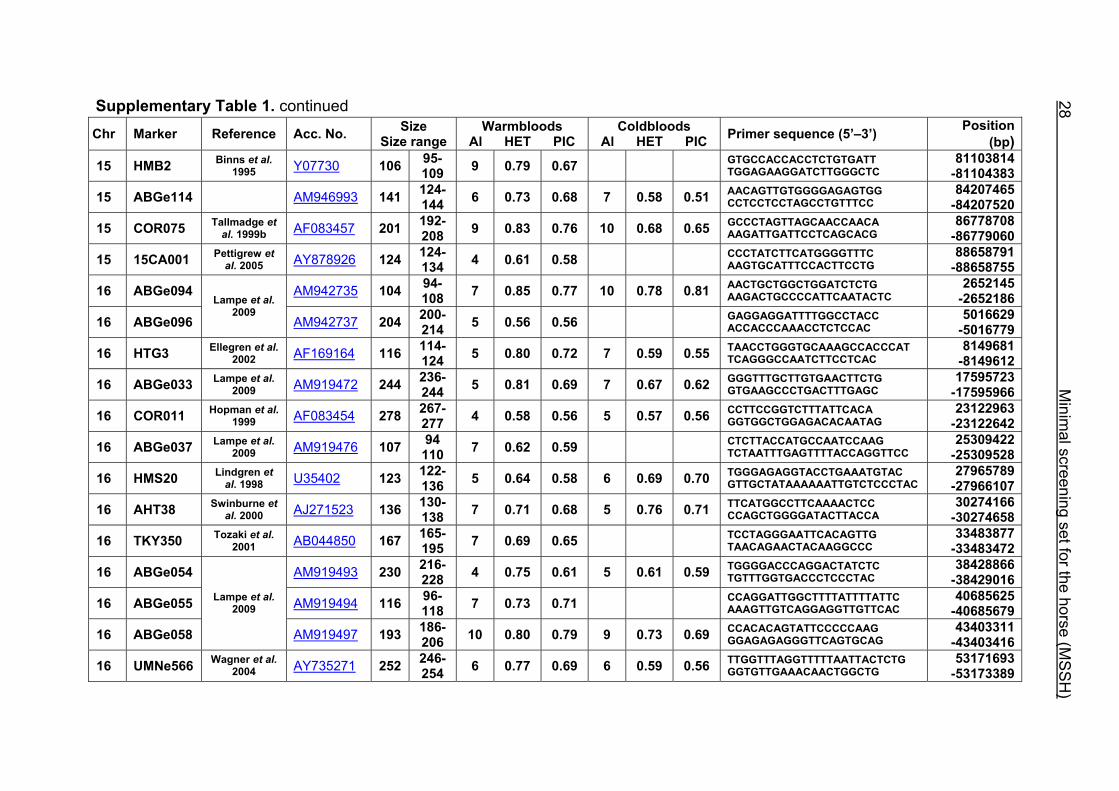
chromosome (21.67 Mb). All microsatellites of the MSSH including marker names
and references, primer sequences, chromosomal location of the markers on
EquCab2.0, accession numbers for markers, number of alleles, HET and PIC for HW
and CB are given in Supplementary Table 1. Multiplex groups for the MSSH are
provided in Supplementary Table 2. All the markers of the MSSH had amplicons in
the expected size ranges, strong and clear bands to distinguish the alleles, as low as
possible stutter bands and no multiple products.
Minimal screening set for the horse (MSSH) 11
Due to the different lengths of the chromosomes, the number of markers ranged from
three on ECA13 to 25 markers on ECA1. On ECA3, we found the markers with the
highest average number of alleles (8.6) in the HW. For the CB, ECA31 showed an
average number of alleles of 12.5. The highest marker HET was observed on ECA21
for the HW (HET: 0.80) and for the CB on ECA31 (HET: 0.81). The highest PIC
values for HW were on ECA26 and 31 (PIC: 0.72) and for CB on ECA30 and 31
(PIC: 0.77).
2.4 Discussion
The aim of this study was to establish a minimal screening set of microsatellite
markers for the horse (MSSH) that benefits scientists using a microsatellite-based
approach. Considering the 2 groups of horse breeds genotyped, the mean values for
number of alleles, observed HET and PIC of this marker set differed only slightly.
This may indicate that the markers chosen may also be similarly polymorphic in other
horse breeds. However, a number of microsatellites exhibited large differences in
their polymorphisms. Eleven markers had high information content in the HW or in
the CB but not vice versa. These markers were distributed on ten chromosomes
(ECA1, 2, 5, 14, 15, 17, 19, 22, 27 and the X chromosome). When comparing the positions of the microsatellites in the MSSH with the positions
of the markers in the linkage map of Swinburne et al. (2006), the order of the markers
on most chromosomes was consistent with the annotation on the horse genome
assembly EquCab2.0. Marker order had been switched between TKY601 and
COR020 on chromosome 10. A less subtle difference in marker position was evident
for COR062, which had been located on the proximal end of ECA19 on EquCab1.0 in
agreement with the linkage map of Swinburne et al. (2006). Using the BLAT results
from EquCab2.0, it turned out that COR062 has to be re-located on ECA5.
Swinburne et al. (2006) could neither make a distinction between the location of
COR068 and COR073 on ECA21, nor between TKY011 and LEX051 on ECA15. In
the present physical map, distances of 1.8 Mb and 3.0 Mb were found in between
these two microsatellites. On ECA25, the orientation of the markers in the linkage
12 Minimal screening set fort he horse (MSSH)
maps of Swinburne et al. (2006) and Penedo et al. (2005) as well is completely
reversed in comparison to the present annotation on EquCab2.0.
The order of the markers in the linkage map of Penedo et al. (2005) on ECA1, 4, 6,
10, 16, 18, 20 and 26 reflects minor discrepancies with the ordering in the MSSH.
Some adjacent markers switched their positions, like LEX058 and COR046 on ECA1,
UCD465 and COR070 on ECA6, TKY867 and LEX017 on ECA10 as well as TKY101
and TKY016 on ECA18. On ECA4, 10 and 20, 1 or 2 markers changed their positions
in comparison with the MSSH and were annotated more distally or proximally on the
respective chromosome. Chromosome 26 is oriented in opposite directions in the
linkage maps of Penedo et al. (2005) and Swinburne et al. (2006). The comparative
RH map of Raudsepp et al. (2008) and the linkage map of Swinburne et al. (2006)
would support the marker order found in the horse genome assembly EquCab2.0.
Between the most recently published RH map of Raudsepp et al. (2008) and the
horse genome assembly EquCab2.0, there is a strong colinearity. Only a few minor
discrepancies were found in marker positions due to local rearrangements on
ECA17, 18 and 25. The marker UMNe448 changed its location from ECA1 in the RH
map to ECA2 on horse sequence EquCab2.0. The marker UCD464 was located on
the proximal end of ECA25 using EquCab2.0, whereas its position has been
reversed to the distal end of ECA25 in the RH map.
This MSSH presents a useful tool for linkage studies in many horse breeds including
warmblood and coldblood breeds, Thoroughbreds and breeds with a significant
proportion of Thoroughbred blood. In standardbreds, ponies and primitive horse
breeds this marker set was not yet tested for its information content. A similar marker
set comprising 507 markers at 5 Mb spacing was developed for the dog (Sargan et
al. 2007). However, this MSSH does not allow identification of disease-associated
haplotypes by linkage disequilibrium (LD) mapping. Due to the high costs for LD
mapping using beadchips based on single nucleotide polymorphisms (SNPs) like the
Illumina equine 50K beadchip, microsatellite-based linkage studies may often be an
alternative and can be employed as a first option for disease and trait mapping.
When the approach for disease and quantitative trait mapping is mainly based on
affected individuals or animals with extreme phenotypes, linkage studies can be
Minimal screening set for the horse (MSSH) 13
performed and in the case of the availability of a very informative marker set, these
studies will be very worthwhile and attractive.
In summary, we have developed a resource for conducting genome-wide scans at
about 7- to 10 Mb resolution in the horse. Previously published linkage and RH maps
and especially the horse genome assembly enabled us to develop this 322
microsatellite-based marker set for horses. The integration of this marker set with
EquCab2.0 should further serve fine mapping, identification of positional candidate
genes and follow-up studies using SNP panels or SNP chips.
2.5 References Aberle K, Wrede J, Distl O. 2004. Analysis of relationships between German heavy
horse breeds based on pedigree information. Berl Münch Tierärztl Wschr.
117:72–75.
Chowdhary BP, Raudsepp T, Kata SR, Goh G, Millon LV, Allan V, Piumi F, Guérin G,
Swinburne J, Binns M, Lear TL, Mickelson J, Murray J, Antczak DF, Womack JE,
Skow LC. 2003. The first-generation whole-genome radiation hybrid map in the
horse identifies conserved segments in human and mouse genomes. Genome
Res. 13:742–751.
Hamann H, Distl O. 2008. Genetic variability in Hanoverian warmblood horses using
pedigree analysis. J Anim Sci. 86:1503–1513.
Penedo MCT, Millon LV, Bernoco D, Bailey E, Binns M, Cholewinski G, Ellis N, Flynn
J, Gralak B, Guthrie A, Hasegaw T, Lindgren G, Lyons LA, Røed KH, Swinburne
JE, Tozaki T. 2005. International equine gene mapping workshop report: a
comprehensive linkage map constructed with data from new markers and by
merging four mapping resources. Cytogenet Genome Res. 111:5–15.
Raudsepp T, Gustafson-Seabury A, Durkin K, Wagner ML, Goh G, Seabury CM,
Brinkmeyer-Langford C, Lee EJ, Agarwala R, Stallknecht-Rice E, Schäffer AA,
Skow LC, Tozaki T, Yasue H, Penedo MC, Lyons LA, Khazanehdari KA, Binns
MM, MacLeod JN, Distl O, Guérin G, Leeb T, Mickelson JR, Chowdhary BP.
2008. A 4,103 marker integrated physical and comparative map of the horse
genome. Cytogenet Genome Res. 122:28–36.

14 Minimal screening set fort he horse (MSSH)
Sargan DR, Aguirre-Hernandez J, Galibert F, Ostrander EA. 2007. An extended
microsatellite set for linkage mapping in the domestic dog. J Hered. 98:221–231.
Swinburne JE, Boursnell M, Hill G, Pettitt L, Allen T, Chowdhary B, Hasegawa T,
Kurosawa M, Leeb T, Mashima S, Mickelson JR, Raudsepp T, Tozaki T, Binns M.
2006. Single linkage group per chromosome genetic linkage map for the horse,
based on two three-generation, full-sibling, crossbred horse reference families.
Genomics. 87:1–29.
Tozaki T, Penedo MCT, Oliveira RP, Katz JP, Millon LV, Ward T, Pettigrew DC,
Brault LS, Tomita M, Kurosawa M, Hasegawa T, Hirota K. 2004. Isolation,
characterization and chromosome assignment of 341 newly isolated equine
microsatellite markers. Anim Genet. 35:462–504.
Tozaki T, Swinburne J, Hirota K, Hasegawa T, Ishida N, Tobe T. 2007. Improved
resolution of the comparative horse-human map: investigating markers with in
silico and linkage mapping approaches. Gene. 392:181–186.
Minimal screening set for the horse (MSSH) 15
Table 1. Distribution of the number of alleles for the MSSH
Number of markers Number of alleles
Hanoverian horses n
%
German coldblood horses n
%
< 4 6 1.9 6 2.34-6 119 38.3 83 31.17-9 138 44.4 126 47.2
10-12 39 12.5 30 11.213-15 5 1.6 13 4.9>15 4 1.3 9 3.4
Table 2. Distribution of the observed HET for the MSSH
Number of markers HET (%) Hanoverian horses
n
% German coldblood horses
n
% 30 – 40 2 0.6 0 040 – 50 5 1.6 4 1.550 – 60 37 11.9 32 12.060 – 70 98 31.5 83 31.170 – 80 117 37.6 98 36.780 – 90 46 14.8 48 18.0
90 – 100 6 1.9 2 0.7 Table 3. Distribution of the PIC for the MSSH
Number of markers PIC (%) Hanoverian horses
n
% German coldblood horses
n
% 20 – 30 1 0.3 0 030 – 40 2 0.6 2 0.740 – 50 16 5.1 9 3.450 – 60 67 21.5 52 19.560 – 70 111 35.7 99 37.170 – 80 100 32.2 80 30.080 – 90 14 4.5 25 9.4
16 Minimal screening set fort he horse (MSSH)
Table 4. Average chromosomal coverage of the MSSH, number of markers per chromosome, average number of alleles (NA), observed heterozygosity (HET) and polymorphism information content (PIC) per chromosome (ECA)
NA HET PIC NA HET PIC ECA
Average distance
(Mb)
Number of
markers Hanoverian warmblood German coldblood
1 7.15 25 7.8 0.69 0.65 9.0 0.73 0.69 2 5.11 23 8.1 0.69 0.65 9.4 0.75 0.70 3 9.53 12 8.6 0.76 0.71 8.9 0.73 0.69 4 4.72 22 8.2 0.71 0.64 10.4 0.76 0.73 5 5.25 18 6.7 0.70 0.65 7.4 0.71 0.67 6 7.06 11 6.4 0.70 0.64 7.1 0.70 0.66 7 14.08 5 6.8 0.64 0.59 6.6 0.69 0.66 8 11.76 8 5.9 0.66 0.62 7.8 0.72 0.67 9 9.28 8 5.9 0.68 0.61 6.6 0.66 0.61
10 4.67 17 7.6 0.72 0.66 8.4 0.74 0.70 11 7.66 7 7.9 0.73 0.68 8.1 0.69 0.65 12 6.62 4 7.8 0.69 0.69 9.3 0.70 0.67 13 10.64 3 5.7 0.71 0.63 7.3 0.75 0.67 14 9.81 9 5.4 0.65 0.55 7.0 0.65 0.61 15 4.58 19 7.7 0.72 0.67 7.7 0.68 0.66 16 4.60 18 6.5 0.73 0.68 7.2 0.69 0.67 17 8.97 8 5.9 0.63 0.59 7.4 0.66 0.63 18 4.13 19 7.3 0.74 0.67 7.2 0.75 0.68 19 8.57 6 6.3 0.63 0.57 7.3 0.66 0.64 20 8.02 7 6.9 0.68 0.64 7.2 0.68 0.58 21 4.81 11 7.6 0.80 0.70 7.0 0.67 0.61 22 5.55 8 7.8 0.66 0.65 7.8 0.72 0.67 23 11.14 4 6.5 0.72 0.61 6.8 0.75 0.67 24 7.79 5 7.2 0.76 0.70 7.4 0.71 0.66 25 7.91 4 6.8 0.65 0.59 7.3 0.69 0.60 26 4.65 8 7.9 0.76 0.72 8.4 0.74 0.71 27 6.66 5 7.4 0.68 0.61 7.0 0.68 0.67 28 9.24 4 6.5 0.75 0.66 8.3 0.77 0.68 29 4.81 6 6.8 0.68 0.60 7.2 0.69 0.64 30 6.01 4 6.8 0.69 0.66 9.0 0.78 0.77 31 5.00 4 8.3 0.77 0.72 12.5 0.81 0.77 X 10.34 11 7.2 0.70 0.70 7.6 0.65 0.67
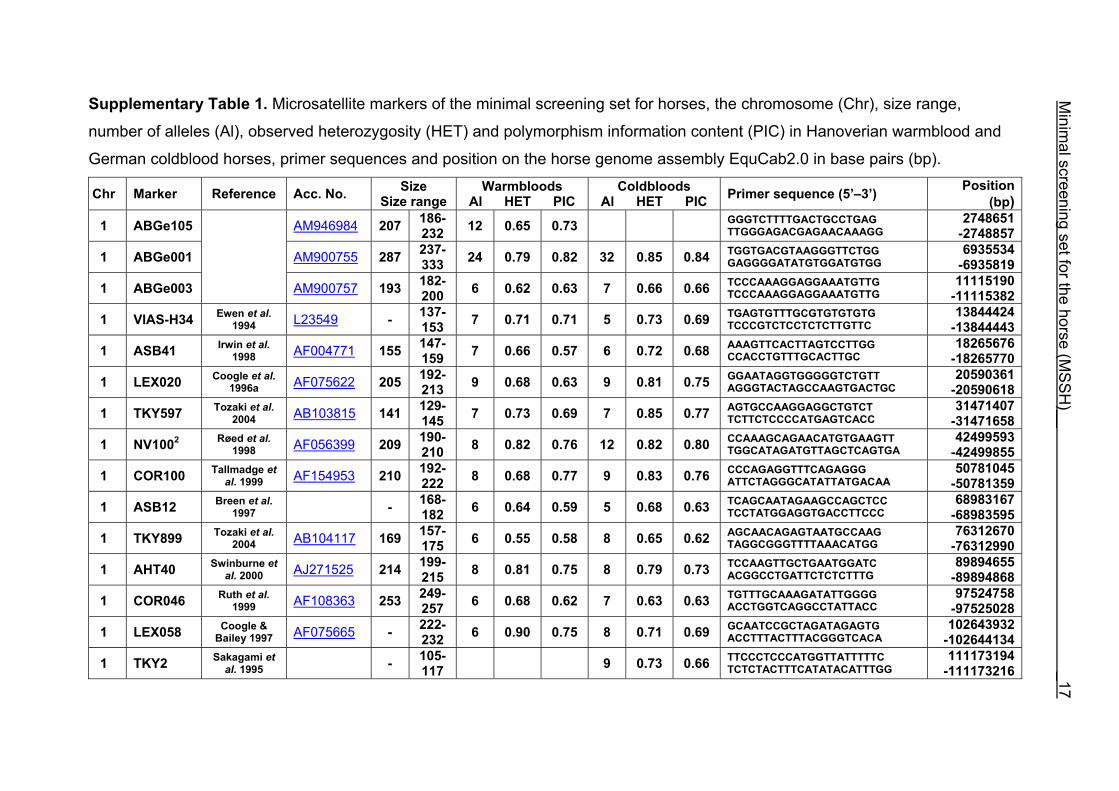
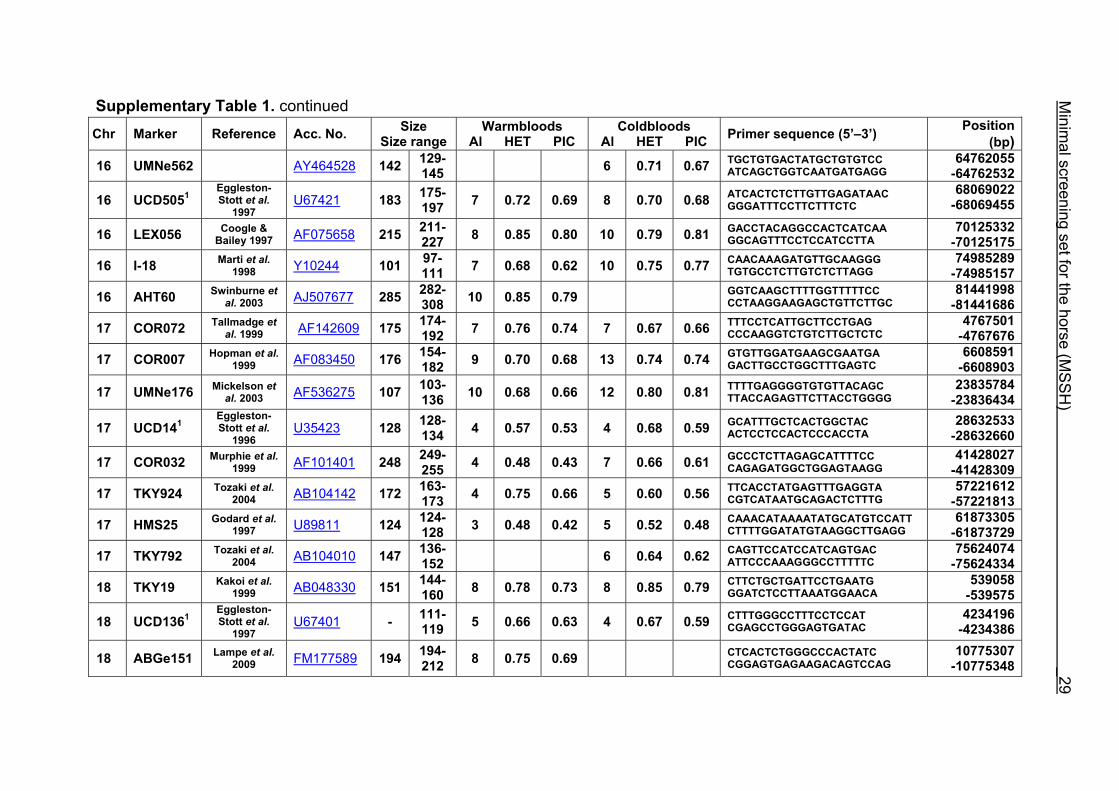
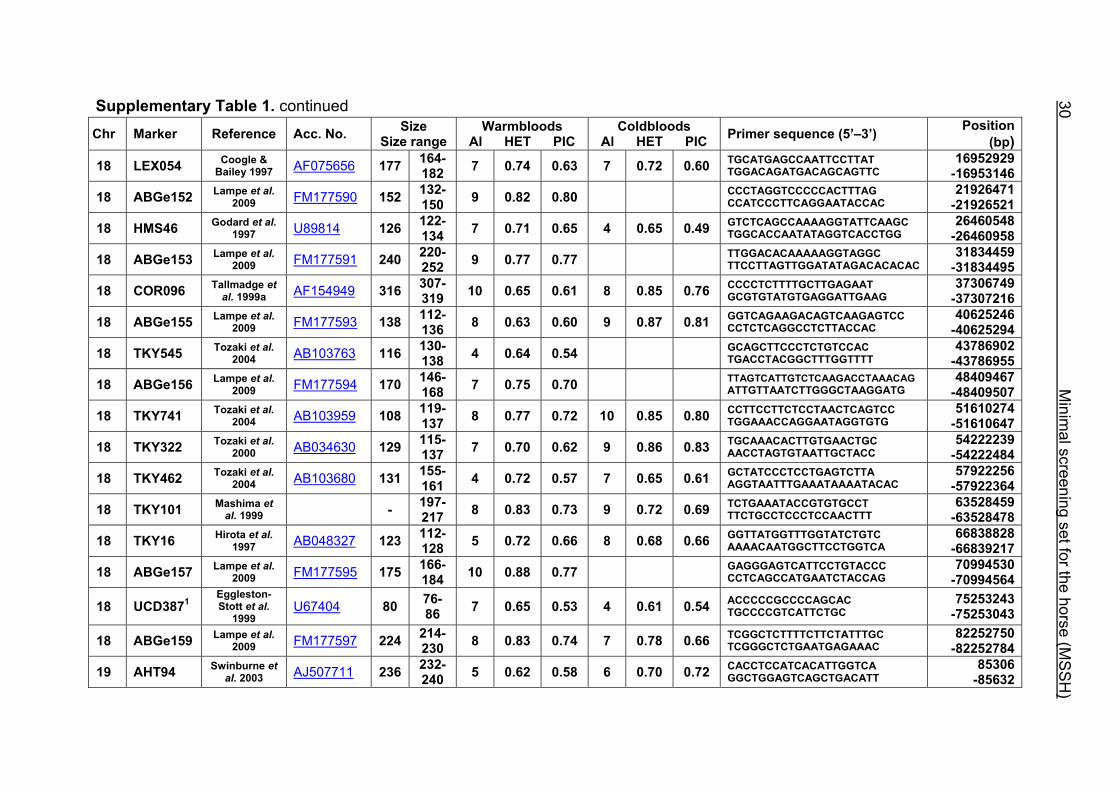
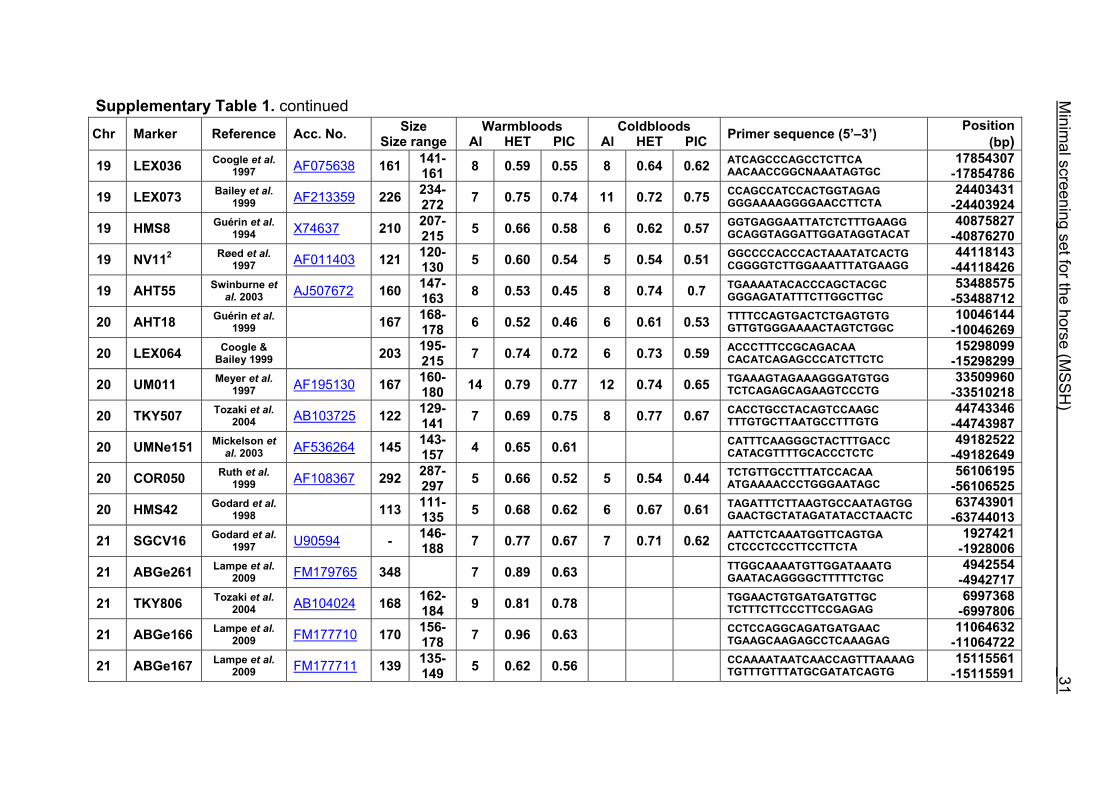
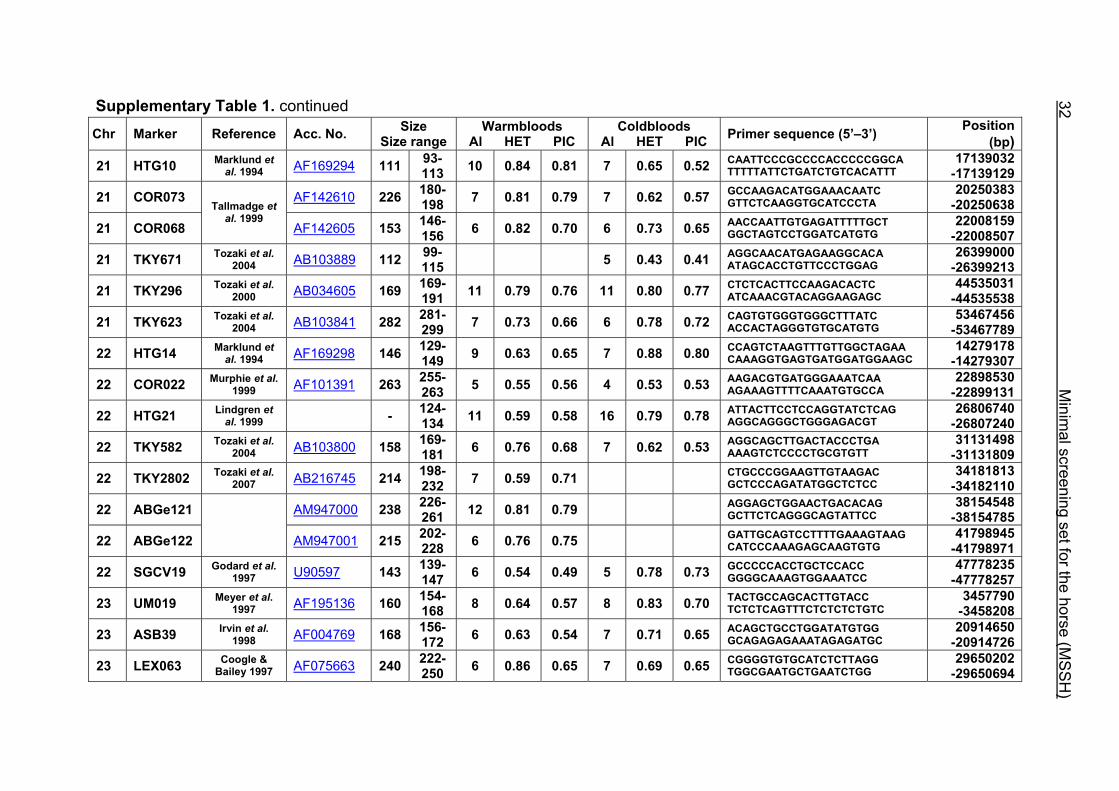
Supplementary Table 1. Microsatellite markers of the minimal screening set for horses, the chromosome (Chr), size range,
number of alleles (Al), observed heterozygosity (HET) and polymorphism information content (PIC) in Hanoverian warmblood and
German coldblood horses, primer sequences and position on the horse genome assembly EquCab2.0 in base pairs (bp).
Minim
al screening set for the horse (MS
SH
)__ _17
Chr Marker Reference Acc. No. Size Size range
Warmbloods Al HET PIC
Coldbloods Al HET PIC Primer sequence (5’–3’) Position
(bp) 1 ABGe105 AM946984 207 186-
232 12 0.65 0.73 GGGTCTTTTGACTGCCTGAG TTGGGAGACGAGAACAAAGG
2748651 -2748857
1 ABGe001 AM900755 287 237- 333 24 0.79 0.82 32 0.85 0.84 TGGTGACGTAAGGGTTCTGG
GAGGGGATATGTGGATGTGG 6935534
-6935819
1 ABGe003
AM900757 193 182- 200 6 0.62 0.63 7 0.66 0.66 TCCCAAAGGAGGAAATGTTG
TCCCAAAGGAGGAAATGTTG 11115190
-11115382
1 VIAS-H34 Ewen et al. 1994 L23549 - 137-
153 7 0.71 0.71 5 0.73 0.69 TGAGTGTTTGCGTGTGTGTG TCCCGTCTCCTCTCTTGTTC
13844424 -13844443
1 ASB41 Irwin et al. 1998 AF004771 155 147-
159 7 0.66 0.57 6 0.72 0.68 AAAGTTCACTTAGTCCTTGG CCACCTGTTTGCACTTGC
18265676 -18265770
1 LEX020 Coogle et al. 1996a AF075622 205 192-
213 9 0.68 0.63 9 0.81 0.75 GGAATAGGTGGGGGTCTGTT AGGGTACTAGCCAAGTGACTGC
20590361 -20590618
1 TKY597 Tozaki et al. 2004 AB103815 141 129-
145 7 0.73 0.69 7 0.85 0.77 AGTGCCAAGGAGGCTGTCT TCTTCTCCCCATGAGTCACC
31471407 -31471658
1 NV1002 Røed et al. 1998 AF056399 209 190-
210 8 0.82 0.76 12 0.82 0.80 CCAAAGCAGAACATGTGAAGTT TGGCATAGATGTTAGCTCAGTGA
42499593 -42499855
1 COR100 Tallmadge et al. 1999 AF154953 210 192-
222 8 0.68 0.77 9 0.83 0.76 CCCAGAGGTTTCAGAGGG ATTCTAGGGCATATTATGACAA
50781045 -50781359
1 ASB12 Breen et al. 1997 - 168-
182 6 0.64 0.59 5 0.68 0.63 TCAGCAATAGAAGCCAGCTCC TCCTATGGAGGTGACCTTCCC
68983167 -68983595
1 TKY899 Tozaki et al. 2004 AB104117 169 157-
175 6 0.55 0.58 8 0.65 0.62 AGCAACAGAGTAATGCCAAG TAGGCGGGTTTTAAACATGG
76312670 -76312990
1 AHT40 Swinburne et al. 2000 AJ271525 214 199-
215 8 0.81 0.75 8 0.79 0.73 TCCAAGTTGCTGAATGGATC ACGGCCTGATTCTCTCTTTG
89894655 -89894868
1 COR046 Ruth et al. 1999 AF108363 253 249-
257 6 0.68 0.62 7 0.63 0.63 TGTTTGCAAAGATATTGGGG ACCTGGTCAGGCCTATTACC
97524758 -97525028
1 LEX058 Coogle & Bailey 1997 AF075665 - 222-
232 6 0.90 0.75 8 0.71 0.69 GCAATCCGCTAGATAGAGTG ACCTTTACTTTACGGGTCACA
102643932 -102644134
1 TKY2 Sakagami et al. 1995 - 105-
117 9 0.73 0.66 TTCCCTCCCATGGTTATTTTTC TCTCTACTTTCATATACATTTGG
111173194 -111173216
Supplementary Table 1. continued Chr Marker Reference Acc. No. Size
Size range Warmbloods
Al HET PIC Coldbloods
Al HET PIC Primer sequence (5’–3’) Position (bp)
1 HMS15 Guérin & Bertaud 1996 U35401 218 214-
234 9 0.62 0.65 8 0.57 0.63 ATATCTCTTGCTGTCCTACTTTCC AATGTGACACGTAAGATAGGCCTC
136853390 -136853785
1 UM026 George et al. 1998 AF195573 206 204-
216 3 0.44 0.42 8 0.71 0.74 CCCAAAATCAATTAGGTCTC ATCAGTTGCTCTCTACTTTTC
150234788 -150234999
1 1CA16 Chowdhary et al. 2003 AF043200 125 114-
124 4 0.60 0.54 TCACTGGGGGGTATATGCAT GATCCTACTCCACCTGAAGTGG
157183217 -157183628
1 HMS7 Guérin et al. 1994 X74636 177 170-
182 7 0.81 0.75 8 0.70 0.70 CAGGAAACTCATGTTGATACCATC TGTTGTTGAAACATACCTTGACTGT
162381788 -162381964
1 TKY466 Tozaki et al. 2004 AB103684 302 322-
332 5 0.56 0.50 7 0.79 0.76 TGGAACACATTCCTCACCAG GTTCTCCTTCCACCCCAAAT
170123409 -170124134
1 TKY281 Tozaki et al. 2001 AB033932 200 178-
194 5 0.56 0.47 6 0.60 0.52 CAAGGACAACTTCTCAGGAG AATAAGAAAGGAGCCAGTCG
177976527 -177976972
1 COR053 Ruth et al. 1999 AF108370 200 171-
195 6 0.64 0.54 7 0.80 0.71 AATTGACTGTGGAAGCCTTG GGCTGAGGAGTAAGCTGAAAG
182814726 -182815075
2 COR065 Tallmadge et al. 1999b AF142602 286 266-
290 7 0.55 0.56 13 0.83 0.75 CAAAAGCACACACAAAGTGC TCCGGAAAGTGCAAAGTTAG
1737439 -1737788
2 ABGe109 AM946988 216 204- 218 12 0.76 0.75 15 0.82 0.82 GGGTGGCTCCTTAGAGCTTC
CCCCTCCCTTGTTTATATGC 6212019
-6212434
2 TKY384 Tozaki et al. 2004 AB048290 105 103-
131 11 0.66 0.62 13 0.84 0.85 TGCAGCAAGAAACCTAAACA CTTCAGTTGTAATCAGGCTC
9002979 -9003590
2 ABGe144 FM165574 134 10 0.78 0.75 CAAAAATGGCAAGATTTCATCC TGCCCACTGACAGATGAATG
12436648 -12436787
2 ABGe111 Lopes et al. 2009 AM946990 161 165-
161 7 0.75 0.63 CCATGTTCACGTCCATTTTG CTAGGGGGTTCAAGGCACTC
15658048 -15658394
2 UMNe323 Wagner et al. 2003 AY391338 - 166-
212 13 0.79 0.73 19 0.86 0.87 GATCCTGCAGGAAAGCATGT CCGCTCGGAATATTTCATTG
19178919 -19179464
2 COR090 Tallmadge et al. 1999a AF154943 94 91-
101 5 0.60 0.56 7 0.76 0.63 GGTTTGTCTCTTTGAGGTGTG TGCTCATATCTTCACCCTGC
22451992 -22452193
2 ABGe006 Lopes et al. 2009 AM900760 199 175-
209 9 0.73 0.78 CTGAAACCAGCCAGGAAAAG TCTCCTAGCCGGGAGAAAAC
26891960 -26892358
2 ASB17 Breen et al. 1997 X93531 105 89-
115 12 0.79 0.75 15 0.83 0.81 GAGGGCGGTACCTTTGTACC ACCAGTCAGGATCTCCACCG
30600776 -30601268
18 Minim
al screening set for the horse (MS
SH
)
Supplementary Table 1. continued Chr Marker Reference Acc. No. Size
Size range Warmbloods
Al HET PIC Coldbloods
Al HET PIC Primer sequence (5’–3’) Position (bp)
2 ABGe342 FM179616 232 220- 237 7 0.80 0.77 ACCCACTGTGAAACCCTTTG
TGTGGAGAATGGAGGAGACC 34428083
-34428314
2 ABGe344 Lopes et al.
2009 FM179618 172 164-
178 7 0.73 0.68 GCACAGGAAGACCACACAAG TGAGCAGGAGAGGACTAGGG
36892745 -36892916
2 TKY784 Tozaki et al. 2004 AB104002 208 200-
214 7 0.79 0.72 9 0.70 0.72 GATCAGTACTTTGCAAATGGATAAC GTAACTCCAAGGCTACGTTC
38799183 -38799462
2 ABGe065 AM940026 248 232- 312 16 0.71 0.69 ATGCTCGTTTCACAAAGAGG
TCTTTTTGTGCAGGGTGTG 41116698
-41117145
2 UMNe448 Mickelson et al. 2004 AY731396 164 151-
169 6 0.72 0.67 5 0.78 0.71 CCATTCTGCCCTGATTGG TTCAAGACCCCTCAATCTGC
45740375 -45741120
2 ABGe347 Lopes et al. 2009 FM179621 269 257-
269 6 0.68 0.64 ACTACTAGGGTGCATTGTTTTTAGG GTGAACATGTTGCCCCTCTG
49299479 -49299747
2 ABGe349 Lopes et al. 2009 FM179623 257 247-
263 7 0.77 0.73 CCAGGAATATGAAACCACAGG GGTCCCTCACTCCTTCAATG
52420974 -52421211
2 TKY352 Tozaki et al. 2001 AB044852 99 77-
99 6 0.69 0.59 3 0.65 0.54 TCTGCTAAGTTCAATGGGTC TTCTTACTTAACAACCATCG
55379847 -55380237
2 AHT12 Swinburne et al. 1997 - 102-
114 6 0.66 0.65 5 0.74 0.65 ACCCAAAGTCATGGGAATCA TTGTTGCCGACAACATGC
59080884 -59081386
2 HMS16 Godard et al. 1997 U89806 148 142-
158 7 0.41 0.46 7 0.64 0.67 AGTGTAATCAATGGATGAGTGGAC TGTTGTCGCAAATGGCAGGCATC
65145788 -65146309
2 TKY358 Tozaki et al. 2001 AB044858 156 154-
164 5 0.64 0.56 GAAGCAGTGCCTCTTATGTG CAGAACAGTCAGGACTTGAC
70519723 -70520218
2 A - 14 Marti et al. 1998 Y10239 220 208-
236 10 0.72 0.66 9 0.80 0.66 CAGCTGGGTGACACAGAGAG GTCATCACTACTCCCTACAC
74473583 -74474001
2 TKY798 Tozaki et al. 2004 AB104016 - 237-
247 6 0.56 0.53 6 0.61 0.61 GAGCAGAAGGTACGAGAAGA AACTTAACCAGGCTGTTCTG
93955346 -93955727
2 VHL123 van
Haeringen et al.1998
Y08446 150 149- 161 4 0.52 0.43 6 0.60 0.53 CCTCCTTCACAGTGAAGTGC
GAGTATATAGCTCCAGACCTC 109818905
-109819452
3 AHT36 Swinburne et al. 2000b AJ271521 144 136-
148 8 0.82 0.74 8 0.77 0.73 TGCTGCTCCAGTGTCCT TAGATTTCACAGGCGGGTG
2947849 -2948297
3 COR028 AF101397 233 229- 243 8 0.73 0.71 7 0.70 0.62 TAAAGAGGAAGGCAATGGAC
ACCTTTTGTGCTAGGCACTG 11070089
-11070513
3 COR033
Murphie et al. 1999
AF101402 242 213- 245 11 0.67 0.66 11 0.77 0.76 CCTCCCCTACTTCCTCTCTG
CATTTTCTTTCCAGGTTCCC 13467219
-13467518
Minim
al screening set for the horse (MS
SH
) _19
Supplementary Table 1. continued Chr Marker Reference Acc. No. Size
Size range Warmbloods
Al HET PIC Coldbloods
Al HET PIC Primer sequence (5’–3’) Position (bp)
3 TKY937 Tozaki et al. 2004 AB104155 120-
150 8 0.79 0.74 8 0.67 0.64 TCCTGCGGAAATACATTAGG AGTTCAAAGTGGTCCCATAG
16759941 -16760177
3 UMNe158 Wagner et al. 2004a AY391305 148 125-
149 10 0.81 0.78 10 0.75 0.77 AATTGAGAGCCAAGATGACACC GGCACCATTTGAGGAAGATG
20876242 -20876491
3 AHT92 Swinburne et al. 2003 AJ507709 267 254-
296 17 0.89 0.86 25 0.83 0.8 TGAGCATCTTGAAGATGAGCA CAACAGTTGTTAGCTCAGGTGC
24229107 -24229579
3 UCD4371 Eggleston-Stott et al.
1997 U67408 178 163-
187 7 0.71 0.64 6 0.63 0.61 CTGTTCTGGGCAGGCTTCTCTA TTGCTGGCTTGGCTGGTC
31285390 -31285349
3 UMNe231 Mickelson et al. 2003 AF536304 234 230-
240 5 0.89 0.68 TAGTCGTTGTCCACCAGCTG GATGGAATGACACAGCACATG
44184855 -44185254
3 TKY353 Tozaki et al. 2001 AB044853 - 177-
191 6 0.58 0.55 6 0.67 0.66 TTCTTACTTAACAACCATCG TGTCACTGACAGATGAATGG
57506460 -57506681
3 ASB23 Irvin et al. 1998 X93537 149 147-
167 6 0.95 0.80 8 0.74 0.71 GAGGTTTGTAATTGGAATG GAGAAGTCATTTTTAACACCT
79278924 -79279280
3 LEX007 Coogle et al. 1996c AF075610 173 192-
200 7 0.69 0.67 6 0.65 0.61 GGTAGGGCTCTGGGATGA AACACTGGGGAAAAGTCAG
86981061 -86981460
3 AHT97 Swinburne et al. 2003 AJ507714 156 149-
163 7 0.73 0.71 7 0.74 0.73 AGTTCGGTAACTTGCCCATG GTTCATGGGCAGAATGGC
99036283 -99036709
4 AHT43 Swinburne et al. 2000b AJ271528 175 156-
190 13 0.86 0.77 13 0.81 0.77 ACACAAGTGACAGGAGCGTG TGGAAGCATGCAAGAGGTC
2915239 -2915540
4 AHT84 Swinburne et al. 2003 AJ507701 109 94-
208 15 0.77 0.74 23 0.91 0.84 TGGCAATCTGCAGGGAAC GATCTTGTGATTGTGTGTGTG
6340788 -6340853
4 ABGe067 AM940028 144 136- 144 5 0.76 0.76 CCACTGGGGTGTAAATCTGA
CTGCGTGGAAGCTGTTTTAT 8754662
-8754733
4 ABGe069
AM940030 198 158- 208 10 0.69 0.70 CATGGCAACGACAATACAAA
TGGATTTACAGTGCAAGCAG 11479500
-11479697
4 TKY942 Tozaki et al. 2007 AB104160 100 90-
104 6 0.55 0.61 TTGTGCAGCTGTGGCTTAG ATAGGTGAGGGGCTGTGAG
15666943 -15667471
4 ABGe073 AM940034 271 255- 295 8 0.70 0.64 AGTCTTGCCCTTGCCTTTT
AGGCAGAGCAAAAGGATCA 18611029
-18611299
4 ASB3 Breen et al. 1997 X93517 203 196-
208 6 0.57 0.54 6 0.75 0.72 AATTCATCTCAGTGCTCTACCAGC TTCATTTTCTACATGCACTACAGC
23511931 -23512309
4 TKY337+ 238 222- 242 7 0.74 0.68 ACTCAAGAGGTCAATCAGAGG
CTCTTCCACTCTGCATTCTG 29877251
-29877531
20 Minim
al screening set for the horse (MS
SH
)
Supplementary Table 1. continued Chr Marker Reference Acc. No. Size
Size range Warmbloods
Al HET PIC Coldbloods
Al HET PIC Primer sequence (5’–3’) Position (bp)
4 COR057 Ruth et al. 1999 AF108374 233 235-
243 5 0.74 0.65 8 0.71 0.68 GGAGGAGAGGAAGAGAGTGG ATCCAGGGCTCTCCATAGTC
32740935 -32741325
4 ABGe082 AM940043 93 86- 98 5 0.62 0.58 TCAATGACAATCATCCTCCTG
CAGAGCAAGGGTGGAAATC 39761266
-39761358
4 LEX061 Breen et al. 1995 AF075661 149 142-
160 7 0.72 0.72 9 0.69 0.68 TCAGTGTTCCCATCTGTA TGAAATCACACCTTTACTTTA
42309507 -42309993
4 LEX050 Coogle & Bailey 1997 AF075652 116 112-
124 5 0.55 0.50 9 0.68 0.68 ATAGTCTGGGGTTAGGTAAGG TCTAGCCCAATGTAAATGC
49364086 -49364563
4 ABGe084 AM940045 204 180- 210 7 0.78 0.71 CCCACATAAAGAATGTGAAACA
CGCCTGAACATAGAATAACAAA 52070194
-52070403
4 ABGe086
AM940047 151 135- 149 7 0.77 0.72 ATCTCAACGTGGGATGTCTG
GCTTTGGAGTGCAAATTAGG 54684268
-54684322
4 TKY1451 Tozaki et al. 2007 AB215394 191 190-
208 9 0.80 0.77 CTGAGATTAACGGCCCAGTA TCAGTCATGTATTCCTGTGCAT
57309052 -57309158
4 COR089 Tallmadge et al. 1999 AF154942 287 276-
298 10 0.76 0.70 7 0.80 0.74 CCTGCCATAAATTTGTTTCC TCCCTACCTCATCTCCACAC
59842920 -59843508
4 ABGe091 AM940052 140 130- 142 6 0.66 0.60 AAACAAAAGCTGCATGTTGA
CTGAATTGTATTGGGGGAGA 62371980
-62372019
4 ABGe059
AM919498 214 192- 212 8 0.77 0.71 8 0.72 0.70 AGTTGCCTCTGGTCTTGCAG
GCTGGCAGAATGTCTGTTTTC 63975130
-63975343
4 TKY354 Tozaki et al. 2001 AB044854 170 140-
174 12 0.67 0.69 9 0.75 0.72 AGTGAGGTCTTCCTTGACTG TGTTAGATGGTGGTAAGTGC
69237880 -69238237
4 TKY661 Tozaki et al. 2004 AB103879 148 140-
152 4 0.65 0.60 5 0.60 0.59 CGAGGTCTTGGAACCTATCC TTCACTTCAGACAACTCTATTGAAGA
77941489 -77941636
4 TKY363 Tozaki et al. 2001 AB044863 174 164-
176 8 0.76 0.72 8 0.81 0.75 CTCAGACTAAGCGGTACTAG ATGGATACATTCTGGGGAAC
96435463 -96435817
4 SGCV23 Godard et al. 1997 U90601 196 198-
246 17 0.78 0.82 20 0.91 0.89 GGCTTAAGATATGGGTGAGTAAGG GCCCACCCTCTTACTTTTCTCAA
102735745 -102736063
5 TKY1175 Penedo et al. 2005 AB104393 203 193-
215 6 0.66 0.62 6 0.52 0.44 TTATCACCAGTTTCCAGAGC CTTATTCCACCCACTAATTCAC
10153063 -10152872
5 COR062 Tallmadge et al. 1999b AF142599 223 206-
236 11 0.82 0.74 9 0.70 0.67 GTCATCCAGTGACGAACACA AGGAAGTGCGCAGTAGAGAA
14848168 -14848671
5 AHT68 Swinburne et al. 2006 AJ507685 304 298-
310 6 0.65 0.61 6 0.64 0.58 GGGAGGAAACCCAGTCAATT GGTCCCTCATCACTTCCACA
24996071 -24995543
Minim
al screening set for the horse (MS
SH
) _21
Supplementary Table 1. continued Chr Marker Reference Acc. No. Size
Size range Warmbloods
Al HET PIC Coldbloods
Al HET PIC Primer sequence (5’–3’) Position (bp)
5 HMS63 154 154- 174 5 0.73 0.69 8 0.83 0.80 GGCACCTCCTAGAATTGTGC
AGTCTTCTAATCCTCTCCCTG 28648069
-28648222
5 UMNe567 Wagner et al. 2004 AY735272 226 222-
230 4 0.80 0.63 5 0.57 0.53 GGTGCAGCTGCTAGCTCAG AGACCCAGTCATTGGGAGG
45380665 -45381150
5 COR023 Murphie et al. 1999 AF101392 275 269-
279 5 0.31 0.39 5 0.72 0.71 CGTTTAGCACCTCTCATGAAC TCTTTGCAAAATAGGGCTTG
53414359 -53414708
5 UCD3041 Eggleston-Stott et al.
1999 U67402 - 95-
113 5 0.64 0.58 6 0.81 0.74 CGCTTTCCTGCTGTCACC GAGGGACTGTGGGGGAGGT
56678370 -56678158
5 ABGe3282 Mittmann et al. 2009 FN406321 149 142-
170 8 0.71 0.74 11 0.66 0.76 TTTCTTTTTCCCACTTAAAGC TGGGACTTAGCAGTATGAAAC
63737939 -63737858
5 UMNe582 AY735282 173 165- 183 5 0.61 0.54 TCTTGACCTTCTTTACTTAGTACACA
CCTGGGCATAGACCTACACA 68632972
-68632859
5 UMNe534 Wagner et al.
2004 AY735262 250 236-
253 6 0.81 0.73 8 0.85 0.80 ATGTTGTTGCAAATGGTAGGG TCCATCAATCCCTCTTCTGG
73632601 -73632283
5 ASB10 Breen et al. 1997 X93524 148 142-
152 6 0.72 0.63 6 0.76 0.65 GTTGTCTAGGTGCAGAATCTGG GTTATGTCTCCCCTTTCTCTACC
78287521 -78286962
5 ABGe012 Lampe et al. 2009 AM905690 126 109-
127 8 0.72 0.69 TCGAGTGCAACAATGTGTAGG AGTCGAAGGCTTCCCACTAC
80978898 -80978962
5 TKY911 Penedo et al. 2005 AB104129 134 132-
148 7 0.62 0.58 7 0.67 0.60 GATCTTTAGAATCAGCTTGTTG CTCGCCACGTTAGTTGATG
83737970 -83737836
5 UMNe455 Mickelson et al. 2004 AY731398 126 124-
134 5 0.73 0.65 6 0.71 0.69 TGAGGTACTGTGCCTTGCTG CTGGGAAGACAGAGCCAGTC
86268203 -86268452
5 ABGe141 Lampe et al. 2009 AM992893 205 181-
213 12 0.85 0.80 GAATTAGTTGTTTACTAGATTGGGAG TTGTTGCAAAAATTGATGAGTG
89313457 -89313492
5 TKY344 Penedo et al. 2005 AB044845 108 90-
108 8 0.85 0.77 GTGTCCATCAATGGATGAAG CTTAAGGCTAAATAATATCCC
92502135 -92501321
5 ABGe029 Lampe et al. 2009 AM905707 163 148-
162 6 0.71 0.61 CGAGAGCTTCCACCTTCTTG AAAGATTGCACGGTTCTTGC
95403958 -95404040
5 AHT107 Swinburne et al. 2003 AJ507724 187 152-
200 7 0.68 0.60 13 0.75 0.78 ATCTAACCAGAGCGCAACGT CCCGACACAGAAGATGGG
98389072 -98389292
6 ABGe3459 Mittmann et al. 2009 FN406422 148 135-
145 5 0.71 0.60 9 0.68 0.69 CTCTGTAACCCTTATATCCTTA TGTTGATTGCTCCTCCCCT
4340398 -4340475
6 NV822 Bjornstad et al. 2000 AJ245770 129 123-
137 6 0.55 0.55 8 0.67 0.62 TGTGGCAGCATCCCACAAAC CCTCCATTTTTGTCGGTTAGCG
15512464 -15512852
22 Minim
al screening set for the horse (MS
SH
)
Supplementary Table 1. continued Chr Marker Reference Acc. No. Size
Size range Warmbloods
Al HET PIC Coldbloods
Al HET PIC Primer sequence (5’–3’) Position (bp)
6 LEX065 Coogle & Bailey 1999 149 144-
156 5 0.77 0.65 5 0.74 0.66 GAAGGCACAATTCAATCTACT GCCCAGTCCCATTCTAAC
20784689 -20784837
6 UM015 Meyer et al. 1997 AF195133 308 302-
312 7 0.69 0.68 6 0.78 0.69 AGTCTGGCTGAGGATACTG GGTGAGAAAGGAGATAAATG
34558248 -34558641
6 TKY3193 AB217136 123 122- 134 7 0.69 0.65 7 0.74 0.78 CTAAATCACTCATGGTGGTG
GATCAGATTCTCCTTGAAAGAA 43522552
-43522812
6 TKY1162
Tozaki et al. 2007
AB104380 218 218- 234 3 0.62 0.52 4 0.66 0.62 TTTAATTATCACTCCCTTGACA
TGACTCTGGTTTCTGACTTC 52818647
-52818877
6 UCD4651 Shiue et al. 1999 U67414 204 198-
202 3 0.51 0.46 AACCAGTCCCTACATAGAAC CTCACAACCAAGCATACA
61228971 -61228705
6 COR070 Tallmadge et al. 1999b AF142607 297 273-
299 11 0.85 0.80 12 0.80 0.80 CATCTGTTCCGTGGCATTA TTCAGGTGTGGGTTTTGAATC
65850871 -65851209
6 TKY412 Tozaki et al. 2004 AB103630 221 214-
228 8 0.76 0.75 GTGTGGGACAGGAAGTTTGG ATTCTTGGGTCCCCTCATCT
70589219 -70589501
6 TKY284 Tozaki et al. 2000 AB033935 175 157-
173 7 0.75 0.71 9 0.62 0.62 CTGGACTAGAGTCAGATTGC AACAGGATTCCCCCAATGCC
73768376 -73768601
6 TKY952 Tozaki et al. 2004 AB104170 222 208-
222 7 0.78 0.63 GATCGGTAAGTGTCGGGAC TAAAATGACTGGGTGGAGAC
79472759 -79472984
7 ABGe3951 Mittmann et al. 2009 FN407104 145 144-
156 7 0.53 0.53 8 0.59 0.61 CTGGTTTACCTTCCCTACAG CCAATGGTTCCTCTGAGAAG
12115180 -12115324
7 LEX038 Coogle et al. 1997 AF075640 144 133-
145 4 0.60 0.53 3 0.65 0.57 CTGCATTCCCATCATCACAT TGCCTTGCCTCTTTCTGTTTA
28957132 -28957698
7 ABGe102 Giesecke et al. 2009 AM946385 221 204-
226 9 0.79 0.74 10 0.78 0.80 AGGAAGCACGATCTGGTCTG AAGGATGCCCTGAGGAAGTC
33817944 -33818164
7 COR095 Tallmadge et al. 1999a AF154948 210 200-
218 8 0.66 0.56 6 0.74 0.67 TACCTCTGGTGGTGATGCTT CCCACACTTACTCCCATCAC
54216081 -54216476
7 SGCV28 Godard et al. 1997 U90604 157 149-
161 6 0.63 0.58 6 0.69 0.66 CTGTGGCAGCTGTCATCTTGG CCCAATTCCAGCCCAGCTTGC
71099323 -71099848
8 COR097 Tallmadge et al. 1999a AF154950 246 236-
244 5 0.70 0.55 5 0.68 0.64 GGGATTTCTGAGATGCTGAA ATGGCTGGCTAGAGTTTGTG
1441807 -1442164
8 UMNe070 Roberts et al. 2000 AF191703 150 150-
156 3 0.54 0.55 TGGGCATTATTTCACAGTATGC TACATTAGGCCTGGAATGGG
14397243 -14397719
8 UCD461 Eggleston-Stott et al.
1996 U25171 230 228-
234 4 0.75 0.63 5 0.60 0.56 GCCAAACGCTGGAGGGTT CCACATTCACACACATGCACAC
17803970 -17803995
Minim
al screening set for the horse (MS
SH
) _23
Supplementary Table 1. continued Chr Marker Reference Acc. No. Size
Size range Warmbloods
Al HET PIC Coldbloods
Al HET PIC Primer sequence (5’–3’) Position (bp)
8 LEX023 Coogle et al. 1996 AF075625 228 221-
247 6 0.65 0.67 11 0.82 0.78 GGATGAAACAGGGAAGGAAA CCAACGGATTCATGAAAGCTA
25943823 -25944415
8 COR012 AF083455 173 166- 176 6 0.65 0.65 6 0.66 0.61 TCTAGGAAAGACCCATCACG
AGTAAGTGGAGGCCAAGGAT 46413115
-46413484
8 COR003
Hopman et al. 1999
AF083446 193 188- 210 7 0.60 0.59 10 0.85 0.80 TAGGGAAACTCCTCAAAGCC
GAAACCAAAACCTTCATCCA 64251041
-64251240
8 COR056 Ruth et al. 1999 AF108373 205 186-
212 10 0.73 0.74 10 0.70 0.65 AGATTCCAGGCATTAGGACC TCAGGGACAATCTTCCTCAAG
84105121 -84105348
9 HTG4 Ellegren et al. 1992 AF169165 127 127-
137 6 0.62 0.51 7 0.68 0.64 CTATCTCAGTCTTCATTGCAGGAC CTCCCTCCCTCCCTCTGTTCTC
1497882 -1497980
9 HMS3 Guérin et al. 1994 FJ915131 163 149-
167 7 0.76 0.71 8 0.65 0.67 CCAACTCTTTGTCACATAACAAGA CCATCCTCACTTTTTCACTTTGTT
16895741 -16896180
9 HTG8 Marklund et al. 1994 AF169292 188 178-
194 6 0.76 0.68 9 0.74 0.66 CAGGCCGTAGATGACTACCAATGA TTTTCAGAGTTAATTGGTATCACA
30021181 -30021494
9 COR098 Tallmadge et al. 1999a AF154951 250 237-
251 4 0.58 0.46 4 0.56 0.52 GCAACAGATGTTGGCTCAG GGAGATGTCCTTGACCACAG
38001843 -38002092
9 UMNe103 Mickelson et al. 2003 AF536248 140 145-
159 3 0.64 0.52 3 0.50 0.37 GGTTAAATTAATCCAAGGTATTTTATTC AGAGGAAGACTGGCACAGATG
46073501 -46073661
9 TKY805 Tozaki et al. 2004 AB104023 207 190-
206 6 0.84 0.73 7 0.68 0.65 TGCCTTTTTCTCTCATCACC AGACTAGTCTGCAAGTTCAG
51846360 -51846621
9 ASB4 X93518 121 120- 144 10 0.57 0.57 8 0.81 0.76 TAAATTGTAAAAGCTGGAGCCG
GCAAATAGTAGTTAAGTCCTC 61727515
-61727589
9 ASB5
Breen et al. 1997
X93519 115 105- 117 5 0.67 0.63 7 0.67 0.57 TCGAGGAGCTCATGACCTGG
TTGTACAACTCTCCACCATAGC 71663785
-71664087
10 ABGe351 FM179625 154 144- 180 8 0.67 0.65 TTCCCAGGATTGGAGCTATG
GACCAAGGTGGGTGTGTAGG 162441
-162794
10 TKY601 Tozaki et al. 2004 AB103819 272 256-
286 10 0.66 0.58 8 0.80 0.74 CGAGGGGGAATTTTGTTTGT ATAGAGCCATGCAGGGGAAA
7559330 -7559649
10 COR020 Hopman et al. 1999a AF083463 166 146-
162 8 0.77 0.78 9 0.75 0.69 TCTCTACCGCAAGTGAAACC CTGAATTGTAGGACATCCCG
9995119 -9995488
10 COR048 Ruth et al. 1999 AF108365 172 167-
187 6 0.62 0.62 7 0.76 0.74 GATTGGGATGCAAAGATGAG CAAGAGGATTGGGAACAAAGG
12137860 -12138104
10 NV182 Røed et al. 1997 AF011404 117 112-
168 10 0.88 0.68 20 0.86 0.85 GGAGGAGACAGTGGCCCCAGTC GCTGAGCTCTCCCATCCCATCG
15382038 -15382479
24
M
inimal screening set for the horse (M
SS
H)
Supplementary Table 1. continued Chr Marker Reference Acc. No. Size
Size range Warmbloods
Al HET PIC Coldbloods
Al HET PIC Primer sequence (5’–3’) Position (bp)
10 SGCV30 Godard et al. 1997 U90605 159 156-
166 6 0.77 0.71 6 0.78 0.70 ACTGGAGGGGTGAAACAGATTCAGA GGAAGGGAGGTCATCAGAA
19349920 -19350033
10 ABGe353 FM179627 132 119- 137 6 0.69 0.68 5 0.64 0.61 CCAAAGAGGGTGACAGAGAAAG
CATATTTTAAAACCTTACCTGCATAC 23647748
-23648079
10 UCD4121 Eggleston-Stott et al.
1997 AF000011 205 186-
206 8 0.68 0.69 11 0.87 0.78 AGAGGAAGGCGACAGGTC CATCCGTCCATCCATCAG
26936149 -26936639
10 ABGe354 FM179628 221 204- 230 8 0.74 0.72 8 0.72 0.69 TCAGTACCAGCAAATGAGTGC
GCCAGGTGTGGTCTGTCTTC 30255055
-30255473
10 ABGe356
FM179630 227 209- 233 10 0.82 0.83 9 0.83 0.80 AAGTCCTGTGCACGTGTGTG
TGACTTGATGCCTTGCTCTG 38480735
-38480769
10 TKY867 Tozaki et al. 2004 AB104085 213 202-
226 7 0.66 0.61 6 0.53 0.52 AGCTAATGTCAGTAGGTTGG TTCCAAGCATCTTAAGGAGG
41439510 -41439790
10 HMS2 Guérin et al. 1994a X74631 226 220-
240 8 0.74 0.67 9 0.77 0.77 ACGGTGGCAACTGCCAAGGAAG CTTGCAGTCGAATGTGTATTAAATG
52713346 -52713758
10 ASB9 Breen et al. 1997 X93523 - 88-
102 8 0.85 0.74 9 0.73 0.67 GTGCGCATGTATGTGCGTGCC ATTTCCACAAGGGACATGAGG
54960553 -54960854
10 LEX009 Coogle et al. 1996 AF075612 376 366-
378 5 0.61 0.49 4 0.55 0.52 AAAGCCGTAAGATTGGGACA TCCATTGTGAGGGTGTAACA
61886938 -61887610
10 TKY496 Tozaki et al. 2004 AB103714 211 199-
221 6 0.63 0.57 ATCATTCCTGGGGCTAAAGG GATCAACCAGGGAGGAGGAG
65756913 -65757272
10 AHT86 Swinburne et al. 2003 AJ507703 210 185-
217 9 0.67 0.57 7 0.79 0.72 CCCAATGAAGTCCAAGATGG GAAATCTCTAGCAAGACCCAGG
76695568 -76695883
10 ABGe357 FM179631 240 216- 258 9 0.72 0.64 TGCACCAGCACTGGTAAAAG
TGTACCTTTGCATTCTTTGTGG 81401443
-81401882
11 UMNe116 Wagner et al. 2004 AY735236 156 154-
168 7 0.79 0.74 8 0.54 0.55 AAATCCCGAGCTAAAATGTA TAGGAAGATAGGATCACAAGG
10464311 -10464468
11 ABGe099 Giesecke et al. 2009 AM946382 181 164-
194 11 0.88 0.80 7 0.67 0.65 TTCCTTCTGATTGCACCACTC ATTGTGGGTGACTCCCTCTG
15170532 -15170653
11 SGCV24 U90602 118 107- 127 10 0.77 0.74 11 0.81 0.76 CTACCATTGAAGAGGGGTGGC
GAAACGAGCAGGAAGTGAATCTCC 19537447
-19537960
11 SGCV13
Godard et al. 1997
U90592 175 163- 189 6 0.60 0.56 5 0.62 0.56 GGACTAAAGCCCAACCATCCAGC
CTCACCAGTAAGGGGTTATGGGGC 26147195
-26147780
11 TKY710 Tozaki et al. 2004 AB103928 213 228-
234 5 0.68 0.65 6 0.62 0.57 TCAGGAGTTTGGATAGATTTTGC TGGAATAACTGAAATGTCCAACA
34679091 -34679345
Minim
al screening set for the horse (MS
SH
) _25
Supplementary Table 1. continued Chr Marker Reference Acc. No. Size
Size range Warmbloods
Al HET PIC Coldbloods
Al HET PIC Primer sequence (5’–3’) Position (bp)
11 TKY424 Eggleston-Stott et al.
1999 AB103642 149 138-
154 6 0.65 0.57 8 0.73 0.70 ATACAGGAGTGCGCTTTTCC AAACCATCCTCCACCTTTCC
41500229 -41500479
11 UCD4571 U67412 89 71- 95 10 0.72 0.70 12 0.82 0.78 GGGGCGTGAGCATAAAGG
CGCTGGATGAGTGAGGGA 51569553
-51569863
12 SGCV10 U90591 178 173- 181 6 0.53 0.59 9 0.74 0.76 CATCCATCCTTTCCAGCTCGATATTC
CAAGACCGTAACTCAGGAGCCC 9502701
-9503196
12 SGCV08
Godard et al. 1997
U90590 130 121- 139 9 0.80 0.75 11 0.66 0.61 GAGTTCATTCTTTTTCGTGGCTG
GGAAACACCCTAAGTGTCCCTTG 21196067
-21196536
12 COR058 Ruth et al. 1999 AF108375 213 206-
230 12 0.81 0.79 13 0.82 0.78 GGGAAGGACGATGAGTGAC CACCAGGCTAAGTAGCCAAAG
27946783 -27947012
12 UCD4971 Eggleston-Stott et al.
1999 U67419 110 105-
109 4 0.62 0.61 4 0.59 0.54 GTGGGAGGCAGCAGGAAC CCCCAGACACCGTGTGAT
32574328 -32574627
13 COR069 Tallmadge et al. 1999b AF142606 271 265-
279 7 0.68 0.66 9 0.87 0.81 AGCCACCAGTCTGTTCTCTG AATGTCCTTTGGTGGATGAAC
6098891 -6099011
13 VHL47 van
Haeringen et al. 1998
X86449 138 126- 142 5 0.72 0.62 7 0.76 0.68 GTTTGCTGTGGTTACCAGGCAGA
GCAAATTGAATATTTGAAGTTGAGC 16894519
-16895111
13 ASB1 Breen et al. 1997 X93515 159 153-
167 5 0.72 0.60 6 0.63 0.53 AGCAGAAACCCACTCAAGCC GCATAATACCCTCAAGGTC
31743327 -31743536
14 TKY1053 Tozaki et al. 2004 AB104271 96 87-
103 7 0.68 0.62 6 0.61 0.68 ATACTGGCTTTACGTCACAG ATCACCACCAGAGTTAATGG
7169420 -7169458
14 LEX043 Coogle et al. 1997 AF075645 238 224-
244 5 0.51 0.44 6 0.63 0.56 CATTAAGCAACAAAAAGCATC GGAAAAGCATGACAAGACACT
16145063 -16144566
14 UM010 Meyer et al. 1997 AF195129 106 106-
120 7 0.78 0.73 9 0.80 0.75 TACAGCCATTGGAAATCTAC CACCATTACATTTTCCCAG
25466136 -25466345
14 VHL209 van
Haeringen et al. 1998
Y08451 83 83- 97 4 0.32 0.27 7 0.77 0.73 TCTTACATCCTTCCATTACAACTA
TGATACATATGTACGTGAAAGGAT 32966905
-32967040
14 TKY310 Tozaki et al. 2000 AB034619 140 130-
142 8 0.92 0.81 9 0.66 0.59 TAACTAAGGGGAACAGATGG CAACTAAGGCTTATGCATGC
45639386 -45639665
14 TKY435 Tozaki et al. 2003 AB103653 203 184-
214 6 0.72 0.58 10 0.78 0.78 GTTCGTCTGTTTCTAGCCTC TATCTCCACATGGTACTCTC
66594714 -66595164
14 UMNe244 Mickelson et al. 2003 AF536314 173 168-
170 2 0.53 0.37 3 0.51 0.36 TCCAAGGGTTTGTCCAAAAG TCTCTTGGTTGAAAATGGGG
72428874 -72429219
26
M
inimal screening set for the horse (M
SS
H)
Supplementary Table 1. continued Chr Marker Reference Acc. No. Size
Size range Warmbloods
Al HET PIC Coldbloods
Al HET PIC Primer sequence (5’–3’) Position (bp)
4 TKY491 Tozaki et al. 2004 AB103709 250 256-
268 5 0.77 0.52 6 0.45 0.42 CCTCTTGGGACAGAGGACAG TCTCTCAGGAGCCTGTGTTG
81175527 -81176020
14 UMNe239 Mickelson et al. 2003 AF536309 165 165-
173 5 0.59 0.61 ATCAAAGGTTCATCAGTTGGTG TTCTTTCACTCAGCGTGGTG
91640789 -91640980
15 UMNe222 Mickelson et al. 2003 AF536300 151 135-
149 7 0.74 0.71 6 0.61 0.58 ACCGCATTCTCTTTCAGGTG CTGGGTAACTGACTGGAAAAGG
7054694 -7055129
15 TKY2489 Tozaki et al. 2007 AB216432 178 166-
184 7 0.66 0.53 5 0.66 0.62 ACAGTGCTGGATGAGGAAGA CTGGTTCTTCTTGGGGACAC
11364482 -11364854
15 UMNe198 Mickelson et al. 2003 AF536283 152 136-
154 6 0.61 0.50 CAAGAACTGGCATCAGAATTTC TCTTGGGTCTCACTCACTCTCC
17647551 -17647773
15 B-8 Y10240 87 79- 101 10 0.66 0.67 8 0.70 0.65 TCCTCAGTCCTTTCTCATGC
AGCTGAAGGCAATCTGTACC 21788079
-21788009
15 TKY11 Hirota et al. 2001 AB048322 126-
136 6 0.70 0.66 3 0.59 0.53 ATGAGAGAGGTCACCAAAAT CCCTGCCAACAAAAACCTTG
32217580 -32217775
15 LEX051 AF075653 144 130- 146 6 0.61 0.58 7 0.69 0.69 CCTACGTGTCTCTTTCTCTTT
GTAACGCAATAATACAGCACT 35204838
-35204311
15 LEX046
Coogle et al. 1997
AF075648 127 115- 129 8 0.78 0.74 9 0.82 0.85 ATAAGCCAATCCACTTTTCC
ATTACCACCCCATTTCCTT 39365783
-39366146
15 TKY571 AB103789 124 114- 128 6 0.66 0.59 ACAGCACAGCAGCAAACAAA
CAGTGGGCCCAGGTGTATAG 41526499
-41526748
15 TKY1033 Penedo et al.
2005 AB104251 158 142-
162 7 0.79 0.69 9 0.60 0.58 AGACATGGATTTAGGGAGTG GCAGAGCCATGCTAAAACTG
43584317 -43583550
15 ASB15 X93529 139 121- 145 11 0.71 0.71 8 0.77 0.76 GTCCCAAAGGGACTCAGGAAGG
TGGATGCCAGTGCATAGACAG 50503906
-50503625
15 ASB2 X93516 181 234- 252 9 0.74 0.74 8 0.72 0.64 CCTTCCGTAGTTTAAGCTTCTG
CACAACTGAGTTCTCTGATAGG 54612560
-54612934
15 ASB19
Breen et al. 1997
X93533 176 162- 190 9 0.66 0.55 12 0.88 0.83 GAGTTGGAGCTCAAGTCTGTC
GTTTAGCAACTACAGCGTAGG 58313184
-58312495
15 ABGe 16406
Mittmann et al. 2009 FN411866 144 123
-146 8 0.77 0.75 10 0.80 0.82 ATGTTGTGCAAATGGGATGA TGCCCATTGATTGATGATTG
65460494 -65460353
15 ABGe145 FM165575 246 216- 250 8 0.75 0.77 7 0.43 0.73 TCAGGATTTAGGGCAAAAGG
CGTGACAATGAGTTCATCAAAG 74517317
-74517562
15 ABGe147
FM165577 197 181- 205 9 0.68 0.76 TGGAATATCCCAGTCAAAATG
CACTCCCTGAACCACAGGAG 77558749
-77558951
Minim
al screening set for the horse (MS
SH
) _27
Supplementary Table 1. continued Chr Marker Reference Acc. No. Size
Size range Warmbloods
Al HET PIC Coldbloods
Al HET PIC Primer sequence (5’–3’) Position (bp)
15 HMB2 Binns et al. 1995 Y07730 106 95-
109 9 0.79 0.67 GTGCCACCACCTCTGTGATT TGGAGAAGGATCTTGGGCTC
81103814 -81104383
15 ABGe114 AM946993 141 124- 144 6 0.73 0.68 7 0.58 0.51 AACAGTTGTGGGGAGAGTGG
CCTCCTCCTAGCCTGTTTCC 84207465
-84207520
15 COR075 Tallmadge et al. 1999b AF083457 201 192-
208 9 0.83 0.76 10 0.68 0.65 GCCCTAGTTAGCAACCAACA AAGATTGATTCCTCAGCACG
86778708 -86779060
15 15CA001 Pettigrew et al. 2005 AY878926 124 124-
134 4 0.61 0.58 CCCTATCTTCATGGGGTTTC AAGTGCATTTCCACTTCCTG
88658791 -88658755
16 ABGe094 AM942735 104 94- 108 7 0.85 0.77 10 0.78 0.81 AACTGCTGGCTGGATCTCTG
AAGACTGCCCCATTCAATACTC 2652145
-2652186
16 ABGe096
Lampe et al. 2009
AM942737 204 200- 214 5 0.56 0.56 GAGGAGGATTTTGGCCTACC
ACCACCCAAACCTCTCCAC 5016629
-5016779
16 HTG3 Ellegren et al. 2002 AF169164 116 114-
124 5 0.80 0.72 7 0.59 0.55 TAACCTGGGTGCAAAGCCACCCAT TCAGGGCCAATCTTCCTCAC
8149681 -8149612
16 ABGe033 Lampe et al. 2009 AM919472 244 236-
244 5 0.81 0.69 7 0.67 0.62 GGGTTTGCTTGTGAACTTCTG GTGAAGCCCTGACTTTGAGC
17595723 -17595966
16 COR011 Hopman et al. 1999 AF083454 278 267-
277 4 0.58 0.56 5 0.57 0.56 CCTTCCGGTCTTTATTCACA GGTGGCTGGAGACACAATAG
23122963 -23122642
16 ABGe037 Lampe et al. 2009 AM919476 107 94
110 7 0.62 0.59 CTCTTACCATGCCAATCCAAG TCTAATTTGAGTTTTACCAGGTTCC
25309422 -25309528
16 HMS20 Lindgren et al. 1998 U35402 123 122-
136 5 0.64 0.58 6 0.69 0.70 TGGGAGAGGTACCTGAAATGTAC GTTGCTATAAAAAATTGTCTCCCTAC
27965789 -27966107
16 AHT38 Swinburne et al. 2000 AJ271523 136 130-
138 7 0.71 0.68 5 0.76 0.71 TTCATGGCCTTCAAAACTCC CCAGCTGGGGATACTTACCA
30274166 -30274658
16 TKY350 Tozaki et al. 2001 AB044850 167 165-
195 7 0.69 0.65 TCCTAGGGAATTCACAGTTG TAACAGAACTACAAGGCCC
33483877 -33483472
16 ABGe054 AM919493 230 216- 228 4 0.75 0.61 5 0.61 0.59 TGGGGACCCAGGACTATCTC
TGTTTGGTGACCCTCCCTAC 38428866
-38429016
16 ABGe055 AM919494 116 96- 118 7 0.73 0.71 CCAGGATTGGCTTTTATTTTATTC
AAAGTTGTCAGGAGGTTGTTCAC 40685625
-40685679
16 ABGe058
Lampe et al. 2009
AM919497 193 186- 206 10 0.80 0.79 9 0.73 0.69 CCACACAGTATTCCCCCAAG
GGAGAGAGGGTTCAGTGCAG 43403311
-43403416
16 UMNe566 Wagner et al. 2004 AY735271 252 246-
254 6 0.77 0.69 6 0.59 0.56 TTGGTTTAGGTTTTTAATTACTCTG GGTGTTGAAACAACTGGCTG
53171693 -53173389
28
M
inimal screening set for the horse (M
SS
H)
Supplementary Table 1. continued Chr Marker Reference Acc. No. Size
Size range Warmbloods
Al HET PIC Coldbloods
Al HET PIC Primer sequence (5’–3’) Position (bp)
16 UMNe562 AY464528 142 129- 145 6 0.71 0.67 TGCTGTGACTATGCTGTGTCC
ATCAGCTGGTCAATGATGAGG 64762055
-64762532
16 UCD5051 Eggleston-Stott et al.
1997 U67421 183 175-
197 7 0.72 0.69 8 0.70 0.68 ATCACTCTCTTGTTGAGATAAC GGGATTTCCTTCTTTCTC
68069022 -68069455
16 LEX056 Coogle & Bailey 1997 AF075658 215 211-
227 8 0.85 0.80 10 0.79 0.81 GACCTACAGGCCACTCATCAA GGCAGTTTCCTCCATCCTTA
70125332 -70125175
16 I-18 Marti et al. 1998 Y10244 101 97-
111 7 0.68 0.62 10 0.75 0.77 CAACAAAGATGTTGCAAGGG TGTGCCTCTTGTCTCTTAGG
74985289 -74985157
16 AHT60 Swinburne et al. 2003 AJ507677 285 282-
308 10 0.85 0.79 GGTCAAGCTTTTGGTTTTTCC CCTAAGGAAGAGCTGTTCTTGC
81441998 -81441686
17 COR072 Tallmadge et al. 1999 AF142609 175 174-
192 7 0.76 0.74 7 0.67 0.66 TTTCCTCATTGCTTCCTGAG CCCAAGGTCTGTCTTGCTCTC
4767501 -4767676
17 COR007 Hopman et al. 1999 AF083450 176 154-
182 9 0.70 0.68 13 0.74 0.74 GTGTTGGATGAAGCGAATGA GACTTGCCTGGCTTTGAGTC
6608591 -6608903
17 UMNe176 Mickelson et al. 2003 AF536275 107 103-
136 10 0.68 0.66 12 0.80 0.81 TTTTGAGGGGTGTGTTACAGC TTACCAGAGTTCTTACCTGGGG
23835784 -23836434
17 UCD141 Eggleston-Stott et al.
1996 U35423 128 128-
134 4 0.57 0.53 4 0.68 0.59 GCATTTGCTCACTGGCTAC ACTCCTCCACTCCCACCTA
28632533 -28632660
17 COR032 Murphie et al. 1999 AF101401 248 249-
255 4 0.48 0.43 7 0.66 0.61 GCCCTCTTAGAGCATTTTCC CAGAGATGGCTGGAGTAAGG
41428027 -41428309
17 TKY924 Tozaki et al. 2004 AB104142 172 163-
173 4 0.75 0.66 5 0.60 0.56 TTCACCTATGAGTTTGAGGTA CGTCATAATGCAGACTCTTTG
57221612 -57221813
17 HMS25 Godard et al. 1997 U89811 124 124-
128 3 0.48 0.42 5 0.52 0.48 CAAACATAAAATATGCATGTCCATT CTTTTGGATATGTAAGGCTTGAGG
61873305 -61873729
17 TKY792 Tozaki et al. 2004 AB104010 147 136-
152 6 0.64 0.62 CAGTTCCATCCATCAGTGAC ATTCCCAAAGGGCCTTTTTC
75624074 -75624334
18 TKY19 Kakoi et al. 1999 AB048330 151 144-
160 8 0.78 0.73 8 0.85 0.79 CTTCTGCTGATTCCTGAATG GGATCTCCTTAAATGGAACA
539058 -539575
18 UCD1361 Eggleston-Stott et al.
1997 U67401 - 111-
119 5 0.66 0.63 4 0.67 0.59 CTTTGGGCCTTTCCTCCAT CGAGCCTGGGAGTGATAC
4234196 -4234386
18 ABGe151 Lampe et al. 2009 FM177589 194 194-
212 8 0.75 0.69 CTCACTCTGGGCCCACTATC CGGAGTGAGAAGACAGTCCAG
10775307 -10775348
Minim
al screening set for the horse (MS
SH
) _29
Supplementary Table 1. continued Chr Marker Reference Acc. No. Size
Size range Warmbloods
Al HET PIC Coldbloods
Al HET PIC Primer sequence (5’–3’) Position (bp)
164- 182 7 0.74 0.63 7 18 LEX054 Coogle &
Bailey 1997 AF075656 0.72 0.60 TGCATGAGCCAATTCCTTAT TGGACAGATGACAGCAGTTC
16952929 -16953146 177
18 ABGe152 Lampe et al. 2009 FM177590 152 132-
150 9 0.82 0.80 CCCTAGGTCCCCCACTTTAG CCATCCCTTCAGGAATACCAC
21926471 -21926521
18 HMS46 Godard et al. 1997 126 122-
134 7 0.71 0.65 U89814 4 0.65 0.49 GTCTCAGCCAAAAGGTATTCAAGC TGGCACCAATATAGGTCACCTGG
26460548 -26460958
18 ABGe153 Lampe et al. 2009 FM177591 240 220- TTGGACACAAAAAGGTAGGC 9 0.77 0.77 252 TTCCTTAGTTGGATATAGACACACAC
31834459 -31834495
18 COR096 AF154949 316 307- 319 10 0.65 Tallmadge et
al. 1999a 0.61 8 0.85 0.76 CCCCTCTTTTGCTTGAGAAT GCGTGTATGTGAGGATTGAAG
37306749 -37307216
18 ABGe155 Lampe et al. 2009 FM177593 138 112-
136 8 0.63 0.60 9 0.87 0.81 GGTCAGAAGACAGTCAAGAGTCC CCTCTCAGGCCTCTTACCAC
40625246 -40625294
18 TKY545 Tozaki et al. 2004 AB103763 116 130-
138 4 0.64 0.54 GCAGCTTCCCTCTGTCCAC TGACCTACGGCTTTGGTTTT
43786902 -43786955
18 ABGe156 Lampe et al. 2009 FM177594 170 146-
168 7 0.75 0.70 TTAGTCATTGTCTCAAGACCTAAACAG ATTGTTAATCTTGGGCTAAGGATG
48409467 -48409507
18 TKY741 Tozaki et al. 2004 AB103959 108 119-
137 8 0.77 0.72 10 0.85 0.80 CCTTCCTTCTCCTAACTCAGTCC TGGAAACCAGGAATAGGTGTG
51610274 -51610647
18 TKY322 Tozaki et al. 2000 AB034630 129 115-
137 7 0.70 0.62 9 0.86 0.83 TGCAAACACTTGTGAACTGC AACCTAGTGTAATTGCTACC
54222239 -54222484
18 TKY462 Tozaki et al. 2004 AB103680 131 155-
161 4 0.72 0.57 7 0.65 0.61 GCTATCCCTCCTGAGTCTTA AGGTAATTTGAAATAAAATACAC
57922256 -57922364
18 TKY101 Mashima et al. 1999 - 197-
217 8 0.83 0.73 9 0.72 0.69 TCTGAAATACCGTGTGCCT TTCTGCCTCCCTCCAACTTT
63528459 -63528478
18 TKY16 Hirota et al. 1997 AB048327 123 112-
128 5 0.72 0.66 8 0.68 0.66 GGTTATGGTTTGGTATCTGTC AAAACAATGGCTTCCTGGTCA
66838828 -66839217
18 ABGe157 Lampe et al. 2009 FM177595 175 166-
184 10 0.88 0.77 GAGGGAGTCATTCCTGTACCC CCTCAGCCATGAATCTACCAG
70994530 -70994564
18 UCD3871 Eggleston-Stott et al.
1999 U67404 80 76-
86 7 0.65 0.53 4 0.61 0.54 ACCCCCGCCCCAGCAC TGCCCCGTCATTCTGC
75253243 -75253043
18 ABGe159 Lampe et al. 2009 FM177597 224 214-
230 8 0.83 0.74 7 0.78 0.66 TCGGCTCTTTTCTTCTATTTGC TCGGGCTCTGAATGAGAAAC
82252750 -82252784
19 AHT94 Swinburne et al. 2003 AJ507711 236 232-
240 5 0.62 0.58 6 0.70 0.72 CACCTCCATCACATTGGTCA GGCTGGAGTCAGCTGACATT
85306 -85632
30
M
inimal screening set for the horse (M
SS
H)
Supplementary Table 1. continued Chr Marker Reference Acc. No. Size
Size range Warmbloods
Al HET PIC Coldbloods
Al HET PIC Primer sequence (5’–3’) Position (bp)
19 LEX036 Coogle et al. 1997 AF075638 161 141-
161 8 0.59 0.55 8 0.64 0.62 ATCAGCCCAGCCTCTTCA AACAACCGGCNAAATAGTGC
17854307 -17854786
19 LEX073 Bailey et al. 1999 AF213359 226 234-
272 7 0.75 0.74 11 0.72 0.75 CCAGCCATCCACTGGTAGAG GGGAAAAGGGGAACCTTCTA
24403431 -24403924
19 HMS8 Guérin et al. 1994 X74637 210 207-
215 5 0.66 0.58 6 0.62 0.57 GGTGAGGAATTATCTCTTTGAAGG GCAGGTAGGATTGGATAGGTACAT
40875827 -40876270
19 NV112 Røed et al. 1997 AF011403 121 120-
130 5 0.60 0.54 5 0.54 0.51 GGCCCCACCCACTAAATATCACTG CGGGGTCTTGGAAATTTATGAAGG
44118143 -44118426
19 AHT55 Swinburne et al. 2003 AJ507672 160 147-
163 8 0.53 0.45 8 0.74 0.7 TGAAAATACACCCAGCTACGC GGGAGATATTTCTTGGCTTGC
53488575 -53488712
20 AHT18 Guérin et al. 1999 167 168-
178 6 0.52 0.46 6 0.61 0.53 TTTTCCAGTGACTCTGAGTGTG GTTGTGGGAAAACTAGTCTGGC
10046144 -10046269
20 LEX064 Coogle & Bailey 1999 203 195-
215 7 0.74 0.72 6 0.73 0.59 ACCCTTTCCGCAGACAA CACATCAGAGCCCATCTTCTC
15298099 -15298299
20 UM011 Meyer et al. 1997 AF195130 167 160-
180 14 0.79 0.77 12 0.74 0.65 TGAAAGTAGAAAGGGATGTGG TCTCAGAGCAGAAGTCCCTG
33509960 -33510218
20 TKY507 Tozaki et al. 2004 AB103725 122 129-
141 7 0.69 0.75 8 0.77 0.67 CACCTGCCTACAGTCCAAGC TTTGTGCTTAATGCCTTTGTG
44743346 -44743987
20 UMNe151 Mickelson et al. 2003 AF536264 145 143-
157 4 0.65 0.61 CATTTCAAGGGCTACTTTGACC CATACGTTTTGCACCCTCTC
49182522 -49182649
20 COR050 Ruth et al. 1999 AF108367 292 287-
297 5 0.66 0.52 5 0.54 0.44 TCTGTTGCCTTTATCCACAA ATGAAAACCCTGGGAATAGC
56106195 -56106525
20 HMS42 Godard et al. 1998 113 111-
135 5 0.68 0.62 6 0.67 0.61 TAGATTTCTTAAGTGCCAATAGTGG GAACTGCTATAGATATACCTAACTC
63743901 -63744013
21 SGCV16 Godard et al. 1997 U90594 - 146-
188 7 0.77 0.67 7 0.71 0.62 AATTCTCAAATGGTTCAGTGA CTCCCTCCCTTCCTTCTA
1927421 -1928006
21 ABGe261 Lampe et al. 2009 FM179765 348 7 0.89 0.63 TTGGCAAAATGTTGGATAAATG
GAATACAGGGGCTTTTTCTGC 4942554
-4942717
21 TKY806 Tozaki et al. 2004 AB104024 168 162-
184 9 0.81 0.78 TGGAACTGTGATGATGTTGC TCTTTCTTCCCTTCCGAGAG
6997368 -6997806
21 ABGe166 Lampe et al. 2009 FM177710 170 156-
178 7 0.96 0.63 CCTCCAGGCAGATGATGAAC TGAAGCAAGAGCCTCAAAGAG
11064632 -11064722
21 ABGe167 Lampe et al. 2009 FM177711 139 135-
149 5 0.62 0.56 CCAAAATAATCAACCAGTTTAAAAG TGTTTGTTTATGCGATATCAGTG
15115561 -15115591
M
inimal screening set for the horse (M
SS
H) _31
Supplementary Table 1. continued Chr Marker Reference Acc. No. Size
Size range Warmbloods
Al HET PIC Coldbloods
Al HET PIC Primer sequence (5’–3’) Position (bp)
21 HTG10 Marklund et al. 1994 AF169294 111 93-
113 10 0.84 0.81 7 0.65 0.52 CAATTCCCGCCCCACCCCCGGCA TTTTTATTCTGATCTGTCACATTT
17139032 -17139129
21 COR073 AF142610 226 180- 198 7 0.81 0.79 7 0.62 0.57 GCCAAGACATGGAAACAATC
GTTCTCAAGGTGCATCCCTA 20250383
-20250638
21 COR068
Tallmadge et al. 1999
AF142605 153 146- 156 6 0.82 0.70 6 0.73 0.65 AACCAATTGTGAGATTTTTGCT
GGCTAGTCCTGGATCATGTG 22008159
-22008507
21 TKY671 Tozaki et al. 2004 AB103889 112 99-
115 5 0.43 0.41 AGGCAACATGAGAAGGCACA ATAGCACCTGTTCCCTGGAG
26399000 -26399213
21 TKY296 Tozaki et al. 2000 AB034605 169 169-
191 11 0.79 0.76 11 0.80 0.77 CTCTCACTTCCAAGACACTC ATCAAACGTACAGGAAGAGC
44535031 -44535538
21 TKY623 Tozaki et al. 2004 AB103841 282 281-
299 7 0.73 0.66 6 0.78 0.72 CAGTGTGGGTGGGCTTTATC ACCACTAGGGTGTGCATGTG
53467456 -53467789
22 HTG14 Marklund et al. 1994 AF169298 146 129-
149 9 0.63 0.65 7 0.88 0.80 CCAGTCTAAGTTTGTTGGCTAGAA CAAAGGTGAGTGATGGATGGAAGC
14279178 -14279307
22 COR022 Murphie et al. 1999 AF101391 263 255-
263 5 0.55 0.56 4 0.53 0.53 AAGACGTGATGGGAAATCAA AGAAAGTTTTCAAATGTGCCA
22898530 -22899131
22 HTG21 Lindgren et al. 1999 - 124-
134 11 0.59 0.58 16 0.79 0.78 ATTACTTCCTCCAGGTATCTCAG AGGCAGGGCTGGGAGACGT
26806740 -26807240
22 TKY582 Tozaki et al. 2004 AB103800 158 169-
181 6 0.76 0.68 7 0.62 0.53 AGGCAGCTTGACTACCCTGA AAAGTCTCCCCTGCGTGTT
31131498 -31131809
22 TKY2802 Tozaki et al. 2007 AB216745 214 198-
232 7 0.59 0.71 CTGCCCGGAAGTTGTAAGAC GCTCCCAGATATGGCTCTCC
34181813 -34182110
22 ABGe121 AM947000 238 226- 261 12 0.81 0.79 AGGAGCTGGAACTGACACAG
GCTTCTCAGGGCAGTATTCC 38154548
-38154785
22 ABGe122
AM947001 215 202- 228 6 0.76 0.75 GATTGCAGTCCTTTTGAAAGTAAG
CATCCCAAAGAGCAAGTGTG 41798945
-41798971
22 SGCV19 Godard et al. 1997 U90597 143 139-
147 6 0.54 0.49 5 0.78 0.73 GCCCCCACCTGCTCCACC GGGGCAAAGTGGAAATCC
47778235 -47778257
23 UM019 Meyer et al. 1997 AF195136 160 154-
168 8 0.64 0.57 8 0.83 0.70 TACTGCCAGCACTTGTACC TCTCTCAGTTTCTCTCTCTGTC
3457790 -3458208
23 ASB39 Irvin et al. 1998 AF004769 168 156-
172 6 0.63 0.54 7 0.71 0.65 ACAGCTGCCTGGATATGTGG GCAGAGAGAAATAGAGATGC
20914650 -20914726
23 LEX063 Coogle & Bailey 1997 AF075663 240 222-
250 6 0.86 0.65 7 0.69 0.65 CGGGGTGTGCATCTCTTAGG TGGCGAATGCTGAATCTGG
29650202 -29650694
32
M
inimal screening set for the horse (M
SS
H)
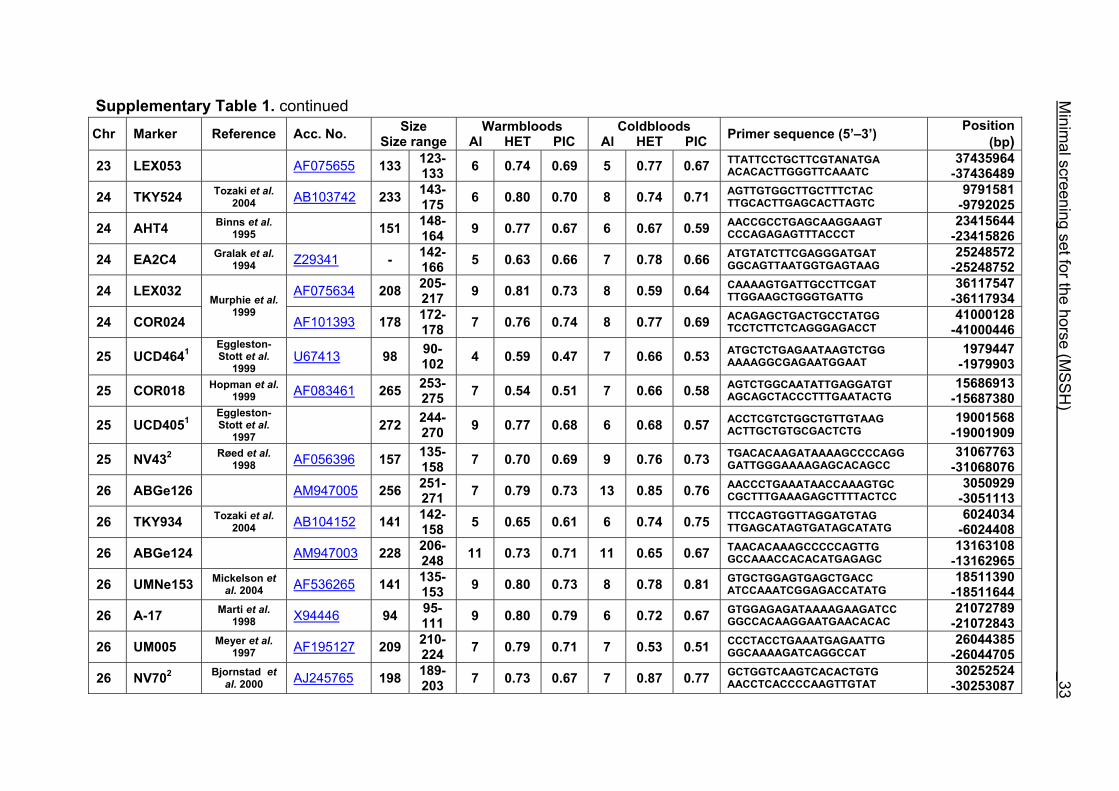
Supplementary Table 1. continued Chr Marker Reference Acc. No. Size
Size range Warmbloods
Al HET PIC Coldbloods
Al HET PIC Primer sequence (5’–3’) Position (bp)
23 LEX053 AF075655 133 123- 133 6 0.74 0.69 5 0.77 0.67 TTATTCCTGCTTCGTANATGA
ACACACTTGGGTTCAAATC 37435964
-37436489
24 TKY524 Tozaki et al. 2004 AB103742 233 143-
175 6 0.80 0.70 8 0.74 0.71 AGTTGTGGCTTGCTTTCTAC TTGCACTTGAGCACTTAGTC
9791581 -9792025
24 AHT4 Binns et al. 1995 151 148-
164 9 0.77 0.67 6 0.67 0.59 AACCGCCTGAGCAAGGAAGT CCCAGAGAGTTTACCCT
23415644 -23415826
24 EA2C4 Gralak et al. 1994 Z29341 - 142-
166 5 0.63 0.66 7 0.78 0.66 ATGTATCTTCGAGGGATGAT GGCAGTTAATGGTGAGTAAG
25248572 -25248752
24 LEX032 AF075634 208 205- 217 9 0.81 0.73 8 0.59 0.64 CAAAAGTGATTGCCTTCGAT
TTGGAAGCTGGGTGATTG 36117547
-36117934
24 COR024
Murphie et al. 1999
AF101393 178 172- 178 7 0.76 0.74 8 0.77 0.69 ACAGAGCTGACTGCCTATGG
TCCTCTTCTCAGGGAGACCT 41000128
-41000446
25 UCD4641 Eggleston-Stott et al.
1999 U67413 98 90-
102 4 0.59 0.47 7 0.66 0.53 ATGCTCTGAGAATAAGTCTGG AAAAGGCGAGAATGGAAT
1979447 -1979903
25 COR018 Hopman et al. 1999 AF083461 265 253-
275 7 0.54 0.51 7 0.66 0.58 AGTCTGGCAATATTGAGGATGT AGCAGCTACCCTTTGAATACTG
15686913 -15687380
25 UCD4051 Eggleston-Stott et al.
1997 272 244-
270 9 0.77 0.68 6 0.68 0.57 ACCTCGTCTGGCTGTTGTAAG ACTTGCTGTGCGACTCTG
19001568 -19001909
25 NV432 Røed et al. 1998 AF056396 157 135-
158 7 0.70 0.69 9 0.76 0.73 TGACACAAGATAAAAGCCCCAGG GATTGGGAAAAGAGCACAGCC
31067763 -31068076
26 ABGe126 AM947005 256 251- 271 7 0.79 0.73 13 0.85 0.76 AACCCTGAAATAACCAAAGTGC
CGCTTTGAAAGAGCTTTTACTCC 3050929
-3051113
26 TKY934 Tozaki et al. 2004 AB104152 141 142-
158 5 0.65 0.61 6 0.74 0.75 TTCCAGTGGTTAGGATGTAG TTGAGCATAGTGATAGCATATG
6024034 -6024408
26 ABGe124 AM947003 228 206- 248 11 0.73 0.71 11 0.65 0.67 TAACACAAAGCCCCCAGTTG
GCCAAACCACACATGAGAGC 13163108
-13162965
26 UMNe153 Mickelson et al. 2004 AF536265 141 135-
153 9 0.80 0.73 8 0.78 0.81 GTGCTGGAGTGAGCTGACC ATCCAAATCGGAGACCATATG
18511390 -18511644
26 A-17 Marti et al. 1998 X94446 94 95-
111 9 0.80 0.79 6 0.72 0.67 GTGGAGAGATAAAAGAAGATCC GGCCACAAGGAATGAACACAC
21072789 -21072843
26 UM005 Meyer et al. 1997 AF195127 209 210-
224 7 0.79 0.71 7 0.53 0.51 CCCTACCTGAAATGAGAATTG GGCAAAAGATCAGGCCAT
26044385 -26044705
26 NV702 Bjornstad et al. 2000 AJ245765 198 189-
203 7 0.73 0.67 7 0.87 0.77 GCTGGTCAAGTCACACTGTG AACCTCACCCCAAGTTGTAT
30252524 -30253087
Minim
al screening set for the horse (MS
SH
) _33
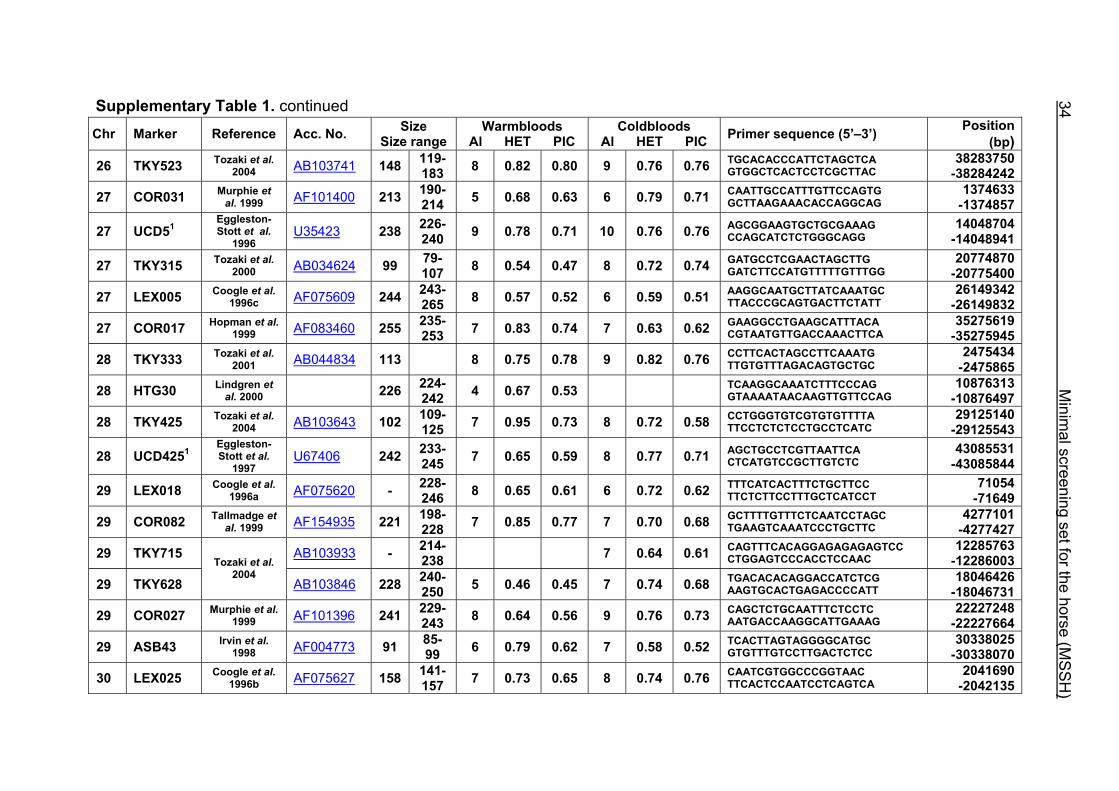
Supplementary Table 1. continued Chr Marker Reference Acc. No. Size
Size range Warmbloods
Al HET PIC Coldbloods
Al HET PIC Primer sequence (5’–3’) Position (bp)
26 TKY523 Tozaki et al. 2004 AB103741 148 119-
183 8 0.82 0.80 9 0.76 0.76 TGCACACCCATTCTAGCTCA GTGGCTCACTCCTCGCTTAC
38283750 -38284242
27 COR031 Murphie et al. 1999 AF101400 213 190-
214 5 0.68 0.63 6 0.79 0.71 CAATTGCCATTTGTTCCAGTG GCTTAAGAAACACCAGGCAG
1374633 -1374857
27 UCD51 Eggleston-Stott et al.
1996 U35423 238 226-
240 9 0.78 0.71 10 0.76 0.76 AGCGGAAGTGCTGCGAAAG CCAGCATCTCTGGGCAGG
14048704 -14048941
27 TKY315 Tozaki et al. 2000 AB034624 99 79-
107 8 0.54 0.47 8 0.72 0.74 GATGCCTCGAACTAGCTTG GATCTTCCATGTTTTTGTTTGG
20774870 -20775400
27 LEX005 Coogle et al. 1996c AF075609 244 243-
265 8 0.57 0.52 6 0.59 0.51 AAGGCAATGCTTATCAAATGC TTACCCGCAGTGACTTCTATT
26149342 -26149832
27 COR017 Hopman et al. 1999 AF083460 255 235-
253 7 0.83 0.74 7 0.63 0.62 GAAGGCCTGAAGCATTTACA CGTAATGTTGACCAAACTTCA
35275619 -35275945
28 TKY333 Tozaki et al. 2001 AB044834 113 8 0.75 0.78 9 0.82 0.76 CCTTCACTAGCCTTCAAATG
TTGTGTTTAGACAGTGCTGC 2475434
-2475865
28 HTG30 Lindgren et al. 2000
226 224- 242 4 0.67 0.53 TCAAGGCAAATCTTTCCCAG
GTAAAATAACAAGTTGTTCCAG 10876313
-10876497
28 TKY425 Tozaki et al. 2004 AB103643 102 109-
125 7 0.95 0.73 8 0.72 0.58 CCTGGGTGTCGTGTGTTTTA TTCCTCTCTCCTGCCTCATC
29125140 -29125543
28 UCD4251 Eggleston-Stott et al.
1997 U67406 242 233-
245 7 0.65 0.59 8 0.77 0.71 AGCTGCCTCGTTAATTCA CTCATGTCCGCTTGTCTC
43085531 -43085844
29 LEX018 Coogle et al. 1996a AF075620 - 228-
246 8 0.65 0.61 6 0.72 0.62 TTTCATCACTTTCTGCTTCC TTCTCTTCCTTTGCTCATCCT
71054 -71649
29 COR082 Tallmadge et al. 1999 AF154935 221 198-
228 7 0.85 0.77 7 0.70 0.68 GCTTTTGTTTCTCAATCCTAGC TGAAGTCAAATCCCTGCTTC
4277101 -4277427
29 TKY715 AB103933 - 214- 238 7 0.64 0.61 CAGTTTCACAGGAGAGAGAGTCC
CTGGAGTCCCACCTCCAAC 12285763
-12286003
29 TKY628 Tozaki et al.
2004 AB103846 228 240-
250 5 0.46 0.45 7 0.74 0.68 TGACACACAGGACCATCTCG AAGTGCACTGAGACCCCATT
18046426 -18046731
29 COR027 Murphie et al. 1999 AF101396 241 229-
243 8 0.64 0.56 9 0.76 0.73 CAGCTCTGCAATTTCTCCTC AATGACCAAGGCATTGAAAG
22227248 -22227664
29 ASB43 Irvin et al. 1998 AF004773 91 85-
99 6 0.79 0.62 7 0.58 0.52 TCACTTAGTAGGGGCATGC GTGTTTGTCCTTGACTCTCC
30338025 -30338070
30 LEX025 Coogle et al. 1996b AF075627 158 141-
157 7 0.73 0.65 8 0.74 0.76 CAATCGTGGCCCGGTAAC TTCACTCCAATCCTCAGTCA
2041690 -2042135
34
M
inimal screening set for the horse (M
SS
H)
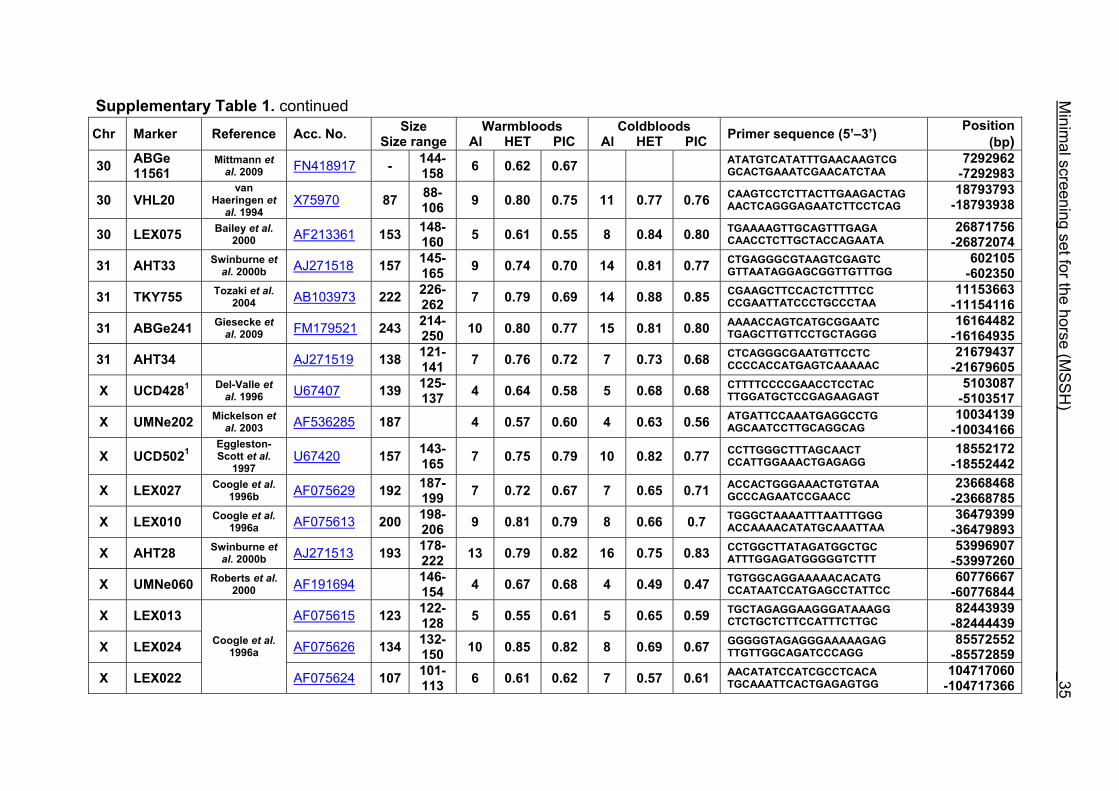
Supplementary Table 1. continued Chr Marker Reference Acc. No. Size
Size range Warmbloods
Al HET PIC Coldbloods
Al HET PIC Primer sequence (5’–3’) Position (bp)
30 ABGe 11561
Mittmann et al. 2009 FN418917 - 144-
158 6 0.62 0.67 ATATGTCATATTTGAACAAGTCG GCACTGAAATCGAACATCTAA
7292962 -7292983
30 VHL20 van
Haeringen et al. 1994
X75970 87 88- 106 9 0.80 0.75 11 0.77 0.76 CAAGTCCTCTTACTTGAAGACTAG
AACTCAGGGAGAATCTTCCTCAG 18793793
-18793938
30 LEX075 Bailey et al. 2000 AF213361 153 148-
160 5 0.61 0.55 8 0.84 0.80 TGAAAAGTTGCAGTTTGAGA CAACCTCTTGCTACCAGAATA
26871756 -26872074
31 AHT33 Swinburne et al. 2000b AJ271518 157 145-
165 9 0.74 0.70 14 0.81 0.77 CTGAGGGCGTAAGTCGAGTC GTTAATAGGAGCGGTTGTTTGG
602105 -602350
31 TKY755 Tozaki et al. 2004 AB103973 222 226-
262 7 0.79 0.69 14 0.88 0.85 CGAAGCTTCCACTCTTTTCC CCGAATTATCCCTGCCCTAA
11153663 -11154116
31 ABGe241 Giesecke et al. 2009 FM179521 243 214-
250 10 0.80 0.77 15 0.81 0.80 AAAACCAGTCATGCGGAATC TGAGCTTGTTCCTGCTAGGG
16164482 -16164935
31 AHT34 AJ271519 138 121- 141 7 0.76 0.72 7 0.73 0.68 CTCAGGGCGAATGTTCCTC
CCCCACCATGAGTCAAAAAC 21679437
-21679605
X UCD4281 Del-Valle et al. 1996 U67407 139 125-
137 4 0.64 0.58 5 0.68 0.68 CTTTTCCCCGAACCTCCTAC TTGGATGCTCCGAGAAGAGT
5103087 -5103517
X UMNe202 Mickelson et al. 2003 AF536285 187 4 0.57 0.60 4 0.63 0.56 ATGATTCCAAATGAGGCCTG
AGCAATCCTTGCAGGCAG 10034139
-10034166
X UCD5021 Eggleston-Scott et al.
1997 U67420 157 143-
165 7 0.75 0.79 10 0.82 0.77 CCTTGGGCTTTAGCAACT CCATTGGAAACTGAGAGG
18552172 -18552442
X LEX027 Coogle et al. 1996b AF075629 192 187-
199 7 0.72 0.67 7 0.65 0.71 ACCACTGGGAAACTGTGTAA GCCCAGAATCCGAACC
23668468 -23668785
X LEX010 Coogle et al. 1996a AF075613 200 198-
206 9 0.81 0.79 8 0.66 0.7 TGGGCTAAAATTTAATTTGGG ACCAAAACATATGCAAATTAA
36479399 -36479893
X AHT28 Swinburne et al. 2000b AJ271513 193 178-
222 13 0.79 0.82 16 0.75 0.83 CCTGGCTTATAGATGGCTGC ATTTGGAGATGGGGGTCTTT
53996907 -53997260
X UMNe060 Roberts et al. 2000 AF191694 146-
154 4 0.67 0.68 4 0.49 0.47 TGTGGCAGGAAAAACACATG CCATAATCCATGAGCCTATTCC
60776667 -60776844
X LEX013 AF075615 123 122- 128 5 0.55 0.61 5 0.65 0.59 TGCTAGAGGAAGGGATAAAGG
CTCTGCTCTTCCATTTCTTGC 82443939
-82444439
X LEX024 AF075626 134 132- 150 10 0.85 0.82 8 0.69 0.67 GGGGGTAGAGGGAAAAAGAG
TTGTTGGCAGATCCCAGG 85572552
-85572859
X LEX022
Coogle et al. 1996a
AF075624 107 101- 113 6 0.61 0.62 7 0.57 0.61 AACATATCCATCGCCTCACA
TGCAAATTCACTGAGAGTGG 104717060
-104717366
Minim
al screening set for the horse (MS
SH
) _35
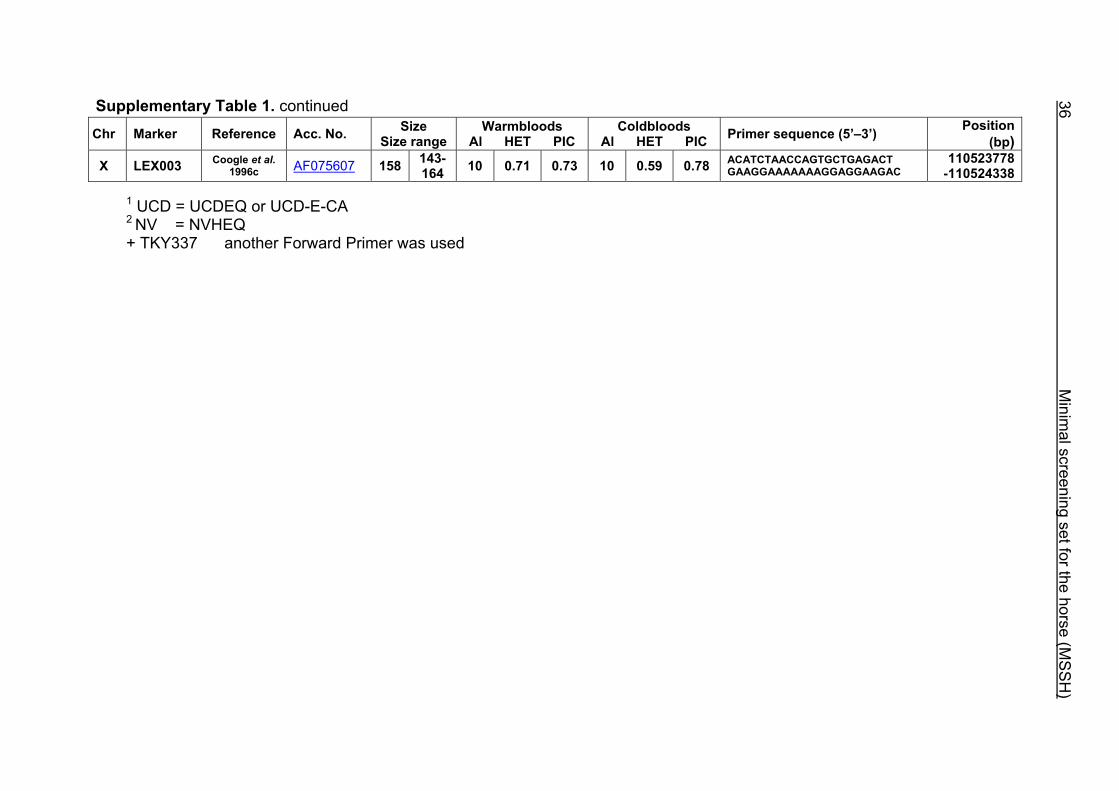
36
M
inimal screening set for the horse (M
SS
H)
Supplementary Table 1. continued Chr Marker Reference Acc. No. Size
Size range Warmbloods
Al HET PIC Coldbloods
Al HET PIC Primer sequence (5’–3’) Position (bp)
X LEX003 Coogle et al. 1996c AF075607 158 143-
164 10 0.71 0.73 10 0.59 0.78 ACATCTAACCAGTGCTGAGACT GAAGGAAAAAAAGGAGGAAGAC
110523778 -110524338
1 UCD = UCDEQ or UCD-E-CA 2 NV = NVHEQ + TKY337 another Forward Primer was used
Minimal screening set for the horse (MSSH) 37
References Bailey E, Skow L, Bernoco D, DelValle A, Scavone MD, Bowling AT, Murray JD,
2000. Equine dinucleotide repeat loci LEX071 through LEX078. Anim Genet.
31:286-287.
Bjørnstad G, Midthjell L, Røed KH, 2000. Characterization of ten equine dinucleotide
microsatellite loci: NVHEQ21. NVHEQ54. NVHEQ67. NVHEQ70. NVHEQ75.
NVHEQ77. NVHEQ79. NVHEQ81. NVHEQ82 and NVHEQ83. Anim Genet.
31:78-79.
Breen M, Lindgren G, Binns MM, Norman J, Irvin Z, Bell K, Sandberg K, Ellegren H,
1997. Genetical and physical assignments of equine microsatellites-first
integration of anchored markers in horse genome mapping. Mamm Genome.
8:267-273.
Chowdhary BP, Raudsepp T, Kata SR, Goh G, Millon LV, Allan V, Piumi F, Guérin G,
Swinburne J, Binns M, Lear TL, Mickelson J, Murray J, Antczak DF, Womack JE,
Skow LC, 2003. The first-generation whole-genome radiation hybrid map in the
horse identifies conserved segments in human and mouse genomes. Genome
Res 13:742-751.
Coogle L, Bailey E, Reid R, Russ M, 1996a. Equine dinucleotide repeat
polymorphisms at loci LEX002. -003. -004. -005. -007. -008. -009. -010. -011. -
013 and -014. Anim Genet. 27:126-127.
Coogle L, Reid R, Bailey E, 1996b. Equine dinucleotide repeat loci LEX015-LEX024.
Anim Genet. 27:217-218.
Coogle L, Reid R, Bailey E, 1996c.Equine dinucleotide repeat loci from LEX025 to
LEX033. Anim Genet. 27:289-290.
Coogle L, Reid R, Bailey E, 1997. Equine dinucleotide repeat loci LEX034-LEX048.
Anim Genet. 28:309.
Coogle L, Bailey E, 1997. Equine dinucleotide repeat loci LEX049-LEX063. Anim
Genet. 28:378.
Coogle L, Bailey E, 1999. Equine dinucleotide repeat loci LEX064 through LEX070.
Anim Genet. 30:71-72.
38_______________________________Minimal screening set for the horse (MSSH)
Eggleston-Stott ML, DelValle A, Bowling AT, Bautista M, Zahorchak R, Malyj W,
1996. Four equine dinucleotide repeats at microsatellite loci UCDEQ5.
UCDEQ14. UCDEQ46 and UCDEQ62. Anim Genet. 27:129.
Eggleston-Stott ML, DelValle A, Bautista M, Dileanis S, Wictum E, Bowling AT, 1997.
Nine equine dinucleotide repeats at microsatellite loci UCDEQ136. UCDEQ405.
UCDEQ412. UCDEQ425. UCDEQ437. UCDEQ467. UCDEQ487. UCDEQ502
and UCDEQ505. Anim Genet. 28:370-371.
Eggleston-Stott ML, DelValle A, Bautista M, Dileanis S, Wictum E, 1999. Twelve
equine dinucleotide repeats at microsatellite loci UCDEQ304. UCDEQ380.
UCDEQ387. UCDEQ411. UCDEQ439. UCDEQ440. UCDEQ455. UCDEQ457.
UCDEQ464. UCDEQ465. UCDEQ482 and UCDEQ497. Anim Genet. 30:69-70.
Ellegren H, Johansson M, Sandberg K, Andersson L, 1992. Cloning of highly
polymorphic microsatellites in the horse. Anim Genet. 23:133-142.
Godard S, Vaiman D, Oustry A, Nocart M, Bertaud M, Guzylack S, Mériaux JC,
Cribiu EP, Guérin G, 1997. Characterization. genetic and physical mapping
analysis of 36 horse plasmid and cosmid-derived microsatellites. Mamm Genome.
8:745-750.
Gralak B, Coppieters W, Van de Weghe A, 1994. Two new equine dinucleotide
repeat microsatellites at the EA2C4 and EB2E8 loci. Anim Genet. 25:285.
Guérin G, Bertaud M, Amigues Y, 1994. Characterization of seven new horse
microsatellites: HMS1. HMS2. HMS3. HMS5. HMS6. HMS7 and HMS8. Anim
Genet. 25:62.
Guérin G, Bertaud M, 1996. Characterization of two polymorphic horse
microsatellites: HMS15 and HMS20. Anim Genet. 27:123.
Hirota K, Tozaki T, Mashima S, Miura N, 2001. Cytogenetic assignment and genetic
characterization of the horse microsatellites. TKY4-18. TKY20. TKY22-24.
TKY30-41 derived from a cosmid library. Anim Genet. 32:160-162.
Hopman TJ, Han EB, Story MR, Schug MD, Aquadro CF, Bowling AT, Murray JD,
Caetano AR, Antczak DF, 1999. Equine dinucleotide repeat loci COR001-
COR020. Anim Genet. 30:225-226.
Irvin Z, Giffard J, Brandon R, Breen M, Bell K, 1998. Equine dinucleotide repeat
polymorphisms at loci ASB 21. 23. 25 and 37-43. Anim Genet. 29:67.
Minimal screening set for the horse (MSSH) 39
Lampe V, Dierks C, Distl O, 2009. Refinement of a quantitative trait locus on equine
chromosome 5 responsible for fetlock osteochondrosis in Hanoverian warmblood
horses. Anim Genet. 40:553-555.
Lampe V, 2009. Fine mapping of quantative trait loci (QTL) for osteochondrosis in
Hanoverian warmblood horses. Hanover: University of Veterinary Medicine
Hanover. 210p. http://elib.tiho-hannover.de/dissertations/lampev_ss09.pdf
Lindgren G, Persson H, Ellegren H, 1999. Five equine dinucleotide microsatellite loci
HTG17. HTG20. HTG21. HTG28 and HTG31. Anim Genet. 30:70-71.
Lindgren G, 2000. Ten equine dinucleotide microsatellite repeats HTG18-19. HTG22-
24. HTG26-27. HGT29-30 and HTG32. Anim Genet. 31:145-146.
Lopes MS, Diesterbeck U, da Câmara Machado A, Distl O. 2009. Fine mapping a
quantative trait locus on horse chromosome 2 associated with radiological signs
of navicular disease in Hanoverian warmblood horses. Anim Genet. Epub DOI
10.1111/j.1365-2052.2009.01923
Marklund S, Ellegren H, Eriksson S, Sandberg K, Andersson L, 1994. Parentage
testing and linkage analysis in the horse using a set of highly polymorphic
microsatellites. Anim Genet. 25:19-23.
Marti E, Breen M, Fischer P, Swinburne J, Binns MM, 1998. Six new cosmid derived
and physically mapped equine dinucleotide repeat microsatellites. Anim Genet.
29:236-238.
Mashima S, Tozaki T, Swinburne J, Kakoi H, Binns M, Miura N, 2001.
Characterization of equine microsatellite loci. TKY102-TKY112. Anim Genet.
32:117-119.
Meyer AH, Valberg SJ, Hillers KR, Schweitzer JK, Mickelson JR, 1997. Sixteen new
polymorphic equine microsatellites. Anim Genet. 28:69-70.
Mickelson JR, Wu JT, Morrison LY, Swinburne JE, Binns MM, Reed KM, Alexander
LJ, 2003. Eighty-three previously unreported equine microsatellite loci. Anim
Genet. 34:71-74.
Milenkovic D, Mariat D, Swinburne J, Chadi-Taourit S, Binns M, Guérin G, 2005.
Characterization and localization of 17 microsatellites derived from BACs in the
horse. Anim Genet. 36:164-166.
40_______________________________Minimal screening set for the horse (MSSH)
Murphie AM, Hopman TJ, Schug MD, Aquadro CF, Bowling AT, Murray JD, Caetano
AR, Antczak DF, 1999. Equine dinucleotide repeat loci COR021-COR040. Anim
Genet. 30:235-237.
Penedo MCT, Millon LV, Bernoco D, Bailey E, Binns M, Cholewinski G, Ellis N, Flynn
J, Gralak B, Guthrie A, Hasegaw T, Lindgren G, Lyons LA, Røed KH, Swinburne
JE, Tozaki T, 2005. International equine gene mapping workshop report: a
comprehensive linkage map constructed with data from new markers and by
merging four mapping resources. Cytogenet Genome Res. 111:5-15.
Røed KH, Midthjell L, Bjørnstad G, Olsaker I, 1997. Equine dinucleotide repeat
microsatellites at the NVHEQ5. NVHEQ7. NVHEQ11. NVHEQ18 and NVHEQ24
loci. Anim Genet. 28:381-382.
Røed KH, Midthjell L, Bjørnstad G, 1998. Eight new equine dinucleotide repeat
microsatellites at the NVHEQ26. NVHEQ29. NVHEQ31. NVHEQ40. NVHEQ43.
NVHEQ90. NVHEQ98 and NVHEQ100 loci. Anim Genet. 29:470.
Ruth LS, Hopman TJ, Schug MD, Antczak DF, 1999. Equine dinucleotide repeat loci
COR041-COR060. Anim Genet. 30:320-321.
Sargan DR, Aguirre-Hernandez J, Galibert F, Ostrander EA, 2007. An extended
microsatellite set for linkage mapping in the domestic dog. J Hered. 98:221-31.
Swinburne JE, Marti E, Breen M, Binns MM, 1997. Characterization of twelve new
horse microsatellite loci: AHT12-AHT23. Anim Genet. 28:453.
Swinburne J, Gerstenberg C, Breen M, Aldridge V, Lockhart L, Marti E, Antczak D,
Eggleston-Stott M, Bailey E, Mickelson J, Røed K, Lindgren G, von Haeringen W,
Guérin G, Bjarnason J, Allen T, Binns M, 2000a. First comprehensive low-density
horse linkage map based on two 3-generation. full-sibling. cross-bred horse
reference families. Genomics. 66:123-34.
Swinburne JE, Lockhart L, Aldridge V, Marti E, Breen M, Binns MM, 2000b.
Characterisation of 25 new physically mapped horse microsatellite loci: AHT24++-
48. Anim Genet. 31:237-238.
Swinburne JE, Turner A, Alexander LJ, Mickleson JR, Binns MM, 2003.
Characterization and linkage map assignments for 61 new horse microsatellite
loci (AHT49-109). Anim Genet. 34:65-68.
Minimal screening set for the horse (MSSH) 41
Swinburne JE, Boursnell M, Hill G, Pettitt L, Allen T, Chowdhary B, Hasegawa T,
Kurosawa M, Leeb T, Mashima S, Mickelson JR, Raudsepp T, Tozaki T, Binns M,
2005. Single linkage group per chromosome genetic linkage map for the horse.
based on two three-generation. full-sibling. crossbred horse reference families.
Genomics 87:1-29.
Tallmadge RL, Hopman TJ, Schug MD, Aquadro CF, Bowling AT, Murray JD,
Caetano AR, Antczak DF, 1999a. Equine dinucleotide repeat loci COR061-
COR080. Anim Genet. 30:462-463.
Tallmadge RL, Evans KG, Hopman TJ, Schug MD, Aquadro CF, Bowling AT, Murray
JD, Caetano AR, Antczak DF, 1999b. Equine dinucleotide repeat loci COR081-
COR100. Anim Genet. 30:470-471.
Tozaki T, Kakoi H, Mashima S, Hirota K, Hasegawa T, Ishida N, Miura N, Tomita M,
2000. The isolation and characterization of 34 equine microsatellite loci. TKY290-
TKY323. Anim Genet. 30:234-236.
Tozaki T, Mashima S, Hirota K, Miura N, Choi-Miura NH, Tomita M,
2001.Characterization of equine microsatellites and microsatellite-linked repetitive
elements (eMLREs) by efficient cloning and genotyping methods. DNA Res. 28;
8:33-45.
Tozaki T, Penedo MCT, Oliveira RP, Katz JP, Millon LV, Ward T, Pettigrew DC,
Brault LS, Tomita M, Kurosawa M, Hasegawa T, Hirota K, 2004. Isolation.
characterization and chromosome assignment of 341 newly isolated equine
microsatellite markers. Anim Genet. 35:462-504.
Tozaki T, Swinburne J, Hirota K, Hasegawa T, Ishida N, Tobe T, 2007. Improved
resolution of the comparative horse-human map: investigating markers with in
silico and linkage mapping approaches. Gene 392:181-186.
van Haeringen H, Bowling AT, Stott ML, Lenstra JA, Zwaagstra KA, 1994. A highly
polymorphic horse microsatellite locus: VHL20. Anim Genet. 25:207.
van Haeringen WA, van de Goor LH, van der Hout N, Lenstra JA, 1998.
Characterization of 24 equine microsatellite loci. Anim Genet. 29:153-156.
Wagner ML, Goh G, Wu JT, Morrison LY, Alexander LJ, Raudsepp T, Skow LC,
Chowdhary BP, Mickelson JR, 2004. Sixty-seven new equine microsatellite loci
assigned to the equine radiation hybrid map. Anim Genet. 35:484-486.
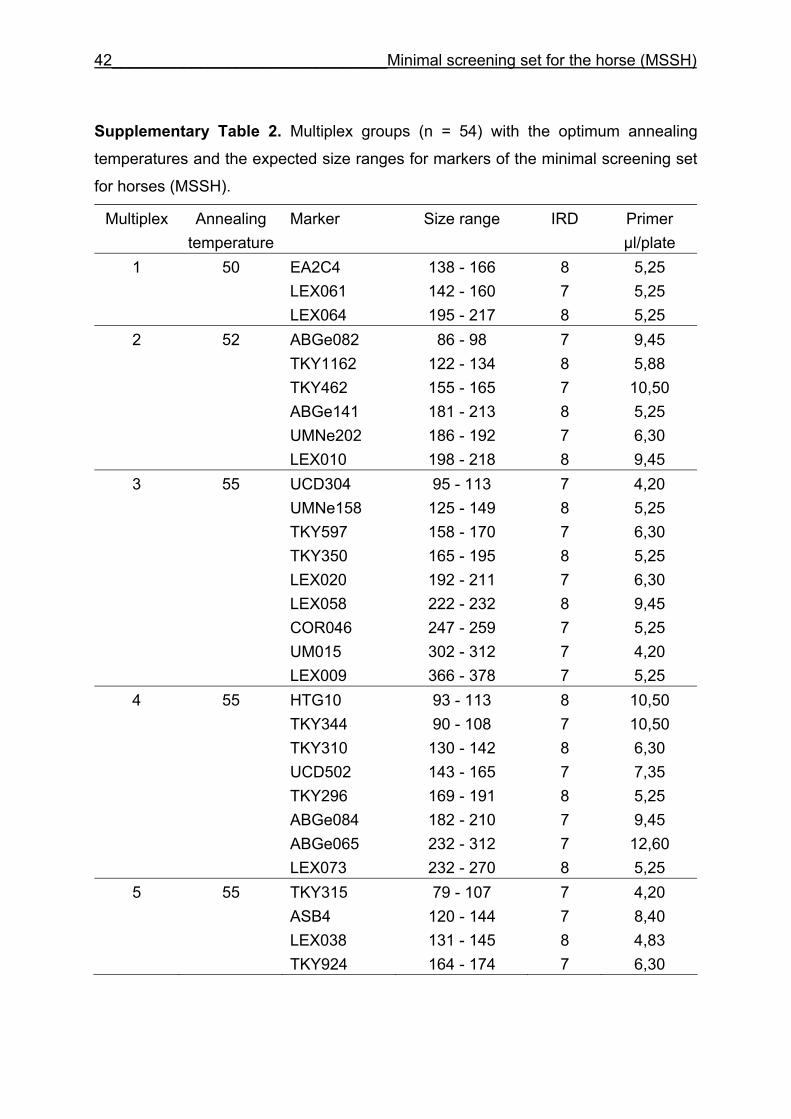
42_______________________________Minimal screening set for the horse (MSSH)
Supplementary Table 2. Multiplex groups (n = 54) with the optimum annealing
temperatures and the expected size ranges for markers of the minimal screening set
for horses (MSSH).
Multiplex Annealing temperature
Marker Size range IRD Primer μl/plate
1 50 EA2C4 138 - 166 8 5,25 LEX061 142 - 160 7 5,25 LEX064 195 - 217 8 5,25
2 52 ABGe082 86 - 98 7 9,45 TKY1162 122 - 134 8 5,88 TKY462 155 - 165 7 10,50 ABGe141 181 - 213 8 5,25 UMNe202 186 - 192 7 6,30 LEX010 198 - 218 8 9,45
3 55 UCD304 95 - 113 7 4,20 UMNe158 125 - 149 8 5,25 TKY597 158 - 170 7 6,30 TKY350 165 - 195 8 5,25 LEX020 192 - 211 7 6,30 LEX058 222 - 232 8 9,45 COR046 247 - 259 7 5,25 UM015 302 - 312 7 4,20 LEX009 366 - 378 7 5,25
4 55 HTG10 93 - 113 8 10,50 TKY344 90 - 108 7 10,50 TKY310 130 - 142 8 6,30 UCD502 143 - 165 7 7,35 TKY296 169 - 191 8 5,25 ABGe084 182 - 210 7 9,45 ABGe065 232 - 312 7 12,60 LEX073 232 - 270 8 5,25
5 55 TKY315 79 - 107 7 4,20 ASB4 120 - 144 7 8,40 LEX038 131 - 145 8 4,83 TKY924 164 - 174 7 6,30
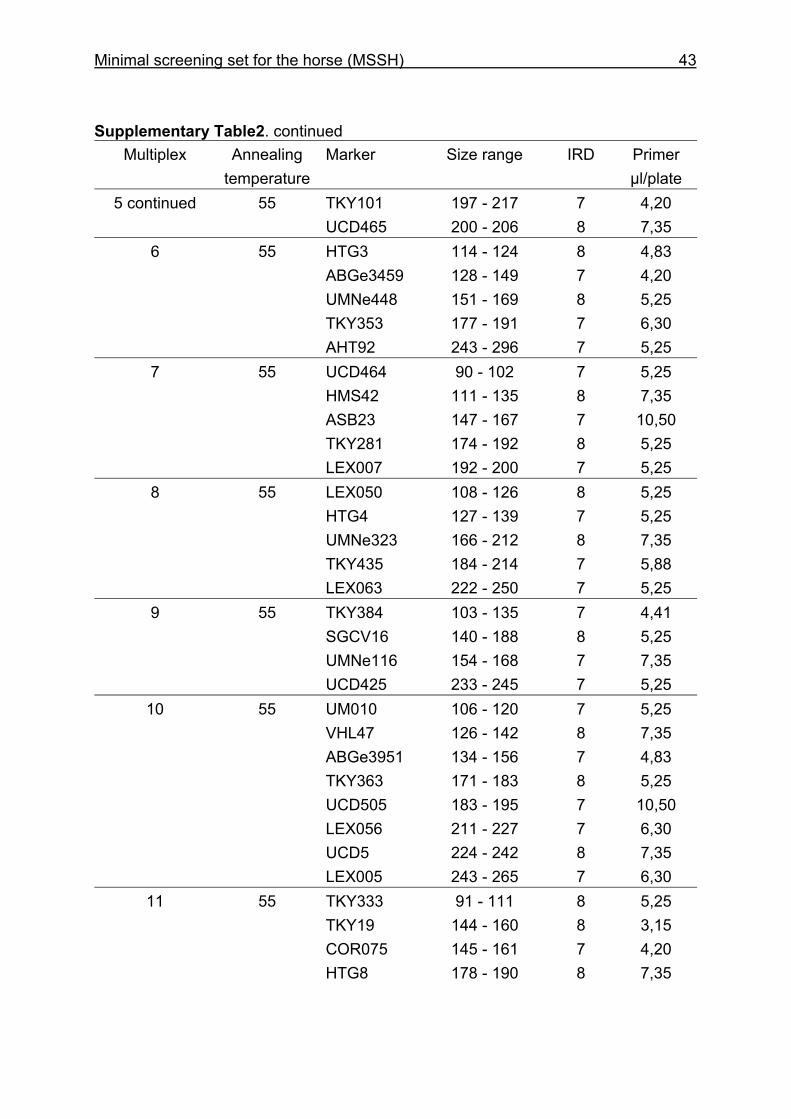
Minimal screening set for the horse (MSSH) 43
Supplementary Table2. continued Multiplex Annealing
temperature Marker Size range IRD Primer
μl/plate 5 continued 55 TKY101 197 - 217 7 4,20
UCD465 200 - 206 8 7,35 6 55 HTG3 114 - 124 8 4,83 ABGe3459 128 - 149 7 4,20 UMNe448 151 - 169 8 5,25 TKY353 177 - 191 7 6,30 AHT92 243 - 296 7 5,25 7 55 UCD464 90 - 102 7 5,25 HMS42 111 - 135 8 7,35 ASB23 147 - 167 7 10,50 TKY281 174 - 192 8 5,25 LEX007 192 - 200 7 5,25 8 55 LEX050 108 - 126 8 5,25 HTG4 127 - 139 7 5,25 UMNe323 166 - 212 8 7,35 TKY435 184 - 214 7 5,88 LEX063 222 - 250 7 5,25 9 55 TKY384 103 - 135 7 4,41 SGCV16 140 - 188 8 5,25 UMNe116 154 - 168 7 7,35 UCD425 233 - 245 7 5,25
10 55 UM010 106 - 120 7 5,25 VHL47 126 - 142 8 7,35 ABGe3951 134 - 156 7 4,83 TKY363 171 - 183 8 5,25 UCD505 183 - 195 7 10,50 LEX056 211 - 227 7 6,30 UCD5 224 - 242 8 7,35 LEX005 243 - 265 7 6,30
11 55 TKY333 91 - 111 8 5,25 TKY19 144 - 160 8 3,15 COR075 145 - 161 7 4,20
HTG8 178 - 190 8 7,35
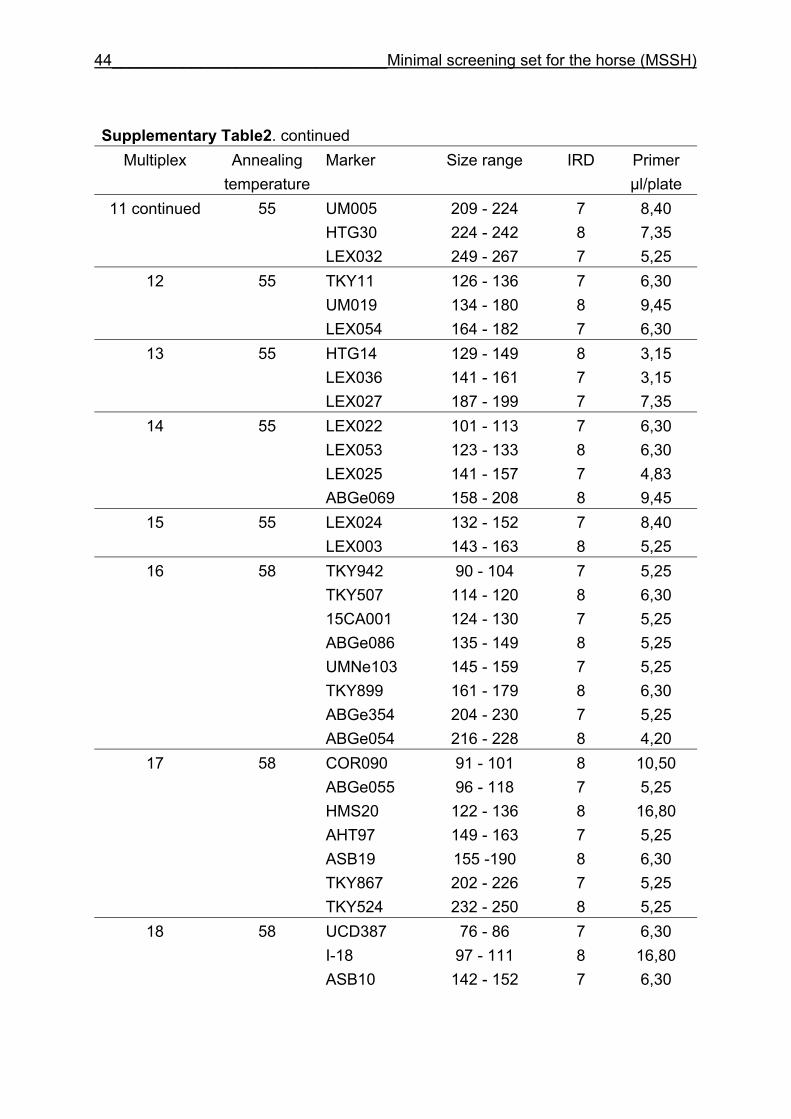
44_______________________________Minimal screening set for the horse (MSSH)
Supplementary Table2. continued Multiplex Annealing
temperature Marker Size range IRD Primer
μl/plate 11 continued 55 UM005 209 - 224 7 8,40
HTG30 224 - 242 8 7,35 LEX032 249 - 267 7 5,25
12 55 TKY11 126 - 136 7 6,30 UM019 134 - 180 8 9,45 LEX054 164 - 182 7 6,30
13 55 HTG14 129 - 149 8 3,15 LEX036 141 - 161 7 3,15 LEX027 187 - 199 7 7,35
14 55 LEX022 101 - 113 7 6,30 LEX053 123 - 133 8 6,30 LEX025 141 - 157 7 4,83 ABGe069 158 - 208 8 9,45
15 55 LEX024 132 - 152 7 8,40 LEX003 143 - 163 8 5,25
16 58 TKY942 90 - 104 7 5,25 TKY507 114 - 120 8 6,30 15CA001 124 - 130 7 5,25 ABGe086 135 - 149 8 5,25 UMNe103 145 - 159 7 5,25 TKY899 161 - 179 8 6,30 ABGe354 204 - 230 7 5,25 ABGe054 216 - 228 8 4,20
17 58 COR090 91 - 101 8 10,50 ABGe055 96 - 118 7 5,25 HMS20 122 - 136 8 16,80 AHT97 149 - 163 7 5,25 ASB19 155 -190 8 6,30 TKY867 202 - 226 7 5,25 TKY524 232 - 250 8 5,25
18 58 UCD387 76 - 86 7 6,30 I-18 97 - 111 8 16,80
ASB10 142 - 152 7 6,30
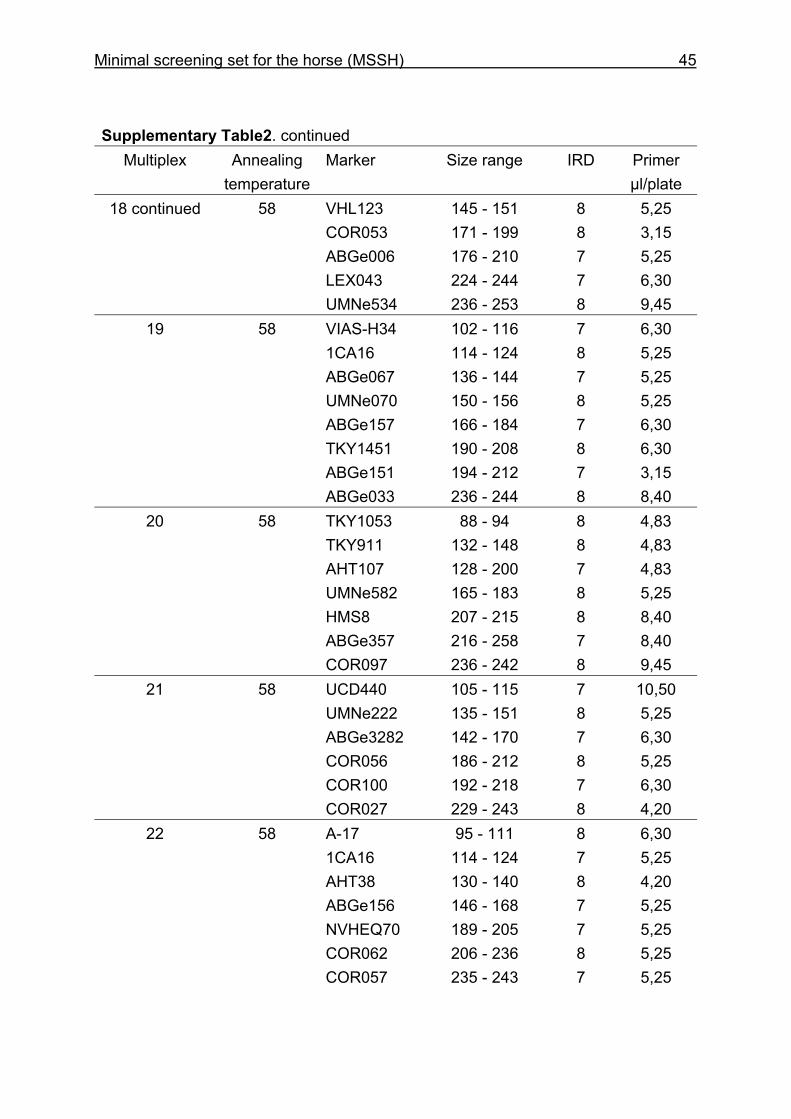
Minimal screening set for the horse (MSSH) 45
Supplementary Table2. continued Multiplex Annealing
temperature Marker Size range IRD Primer
μl/plate 18 continued 58 VHL123 145 - 151 8 5,25
COR053 171 - 199 8 3,15 ABGe006 176 - 210 7 5,25 LEX043 224 - 244 7 6,30 UMNe534 236 - 253 8 9,45
19 58 VIAS-H34 102 - 116 7 6,30 1CA16 114 - 124 8 5,25 ABGe067 136 - 144 7 5,25 UMNe070 150 - 156 8 5,25 ABGe157 166 - 184 7 6,30 TKY1451 190 - 208 8 6,30 ABGe151 194 - 212 7 3,15 ABGe033 236 - 244 8 8,40
20 58 TKY1053 88 - 94 8 4,83 TKY911 132 - 148 8 4,83 AHT107 128 - 200 7 4,83 UMNe582 165 - 183 8 5,25 HMS8 207 - 215 8 8,40 ABGe357 216 - 258 7 8,40 COR097 236 - 242 8 9,45
21 58 UCD440 105 - 115 7 10,50 UMNe222 135 - 151 8 5,25 ABGe3282 142 - 170 7 6,30 COR056 186 - 212 8 5,25 COR100 192 - 218 7 6,30 COR027 229 - 243 8 4,20
22 58 A-17 95 - 111 8 6,30 1CA16 114 - 124 7 5,25 AHT38 130 - 140 8 4,20 ABGe156 146 - 168 7 5,25 NVHEQ70 189 - 205 7 5,25 COR062 206 - 236 8 5,25
COR057 235 - 243 7 5,25
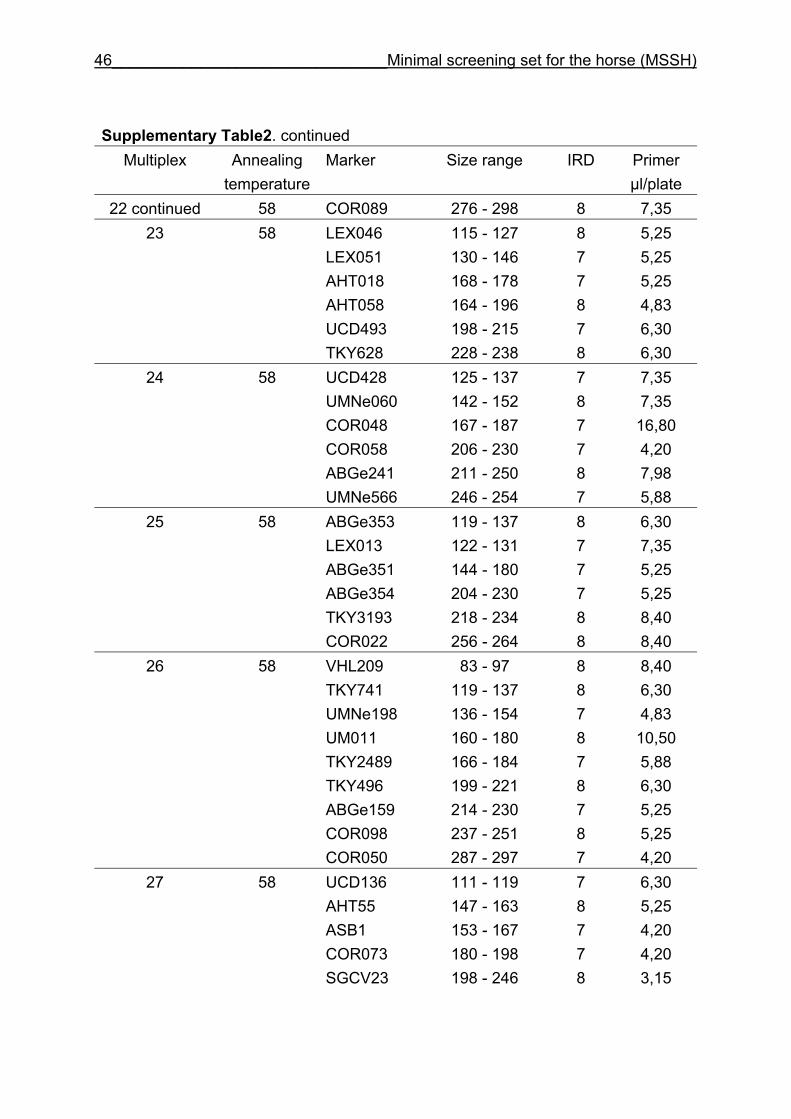
46_______________________________Minimal screening set for the horse (MSSH)
Supplementary Table2. continued Multiplex Annealing
temperature Marker Size range IRD Primer
μl/plate 22 continued 58 COR089 276 - 298 8 7,35
23 58 LEX046 115 - 127 8 5,25 LEX051 130 - 146 7 5,25 AHT018 168 - 178 7 5,25 AHT058 164 - 196 8 4,83 UCD493 198 - 215 7 6,30 TKY628 228 - 238 8 6,30
24 58 UCD428 125 - 137 7 7,35 UMNe060 142 - 152 8 7,35 COR048 167 - 187 7 16,80 COR058 206 - 230 7 4,20 ABGe241 211 - 250 8 7,98 UMNe566 246 - 254 7 5,88
25 58 ABGe353 119 - 137 8 6,30 LEX013 122 - 131 7 7,35 ABGe351 144 - 180 7 5,25 ABGe354 204 - 230 7 5,25 TKY3193 218 - 234 8 8,40 COR022 256 - 264 8 8,40
26 58 VHL209 83 - 97 8 8,40 TKY741 119 - 137 8 6,30 UMNe198 136 - 154 7 4,83 UM011 160 - 180 8 10,50 TKY2489 166 - 184 7 5,88 TKY496 199 - 221 8 6,30 ABGe159 214 - 230 7 5,25 COR098 237 - 251 8 5,25 COR050 287 - 297 7 4,20
27 58 UCD136 111 - 119 7 6,30 AHT55 147 - 163 8 5,25 ASB1 153 - 167 7 4,20 COR073 180 - 198 7 4,20
SGCV23 198 - 246 8 3,15
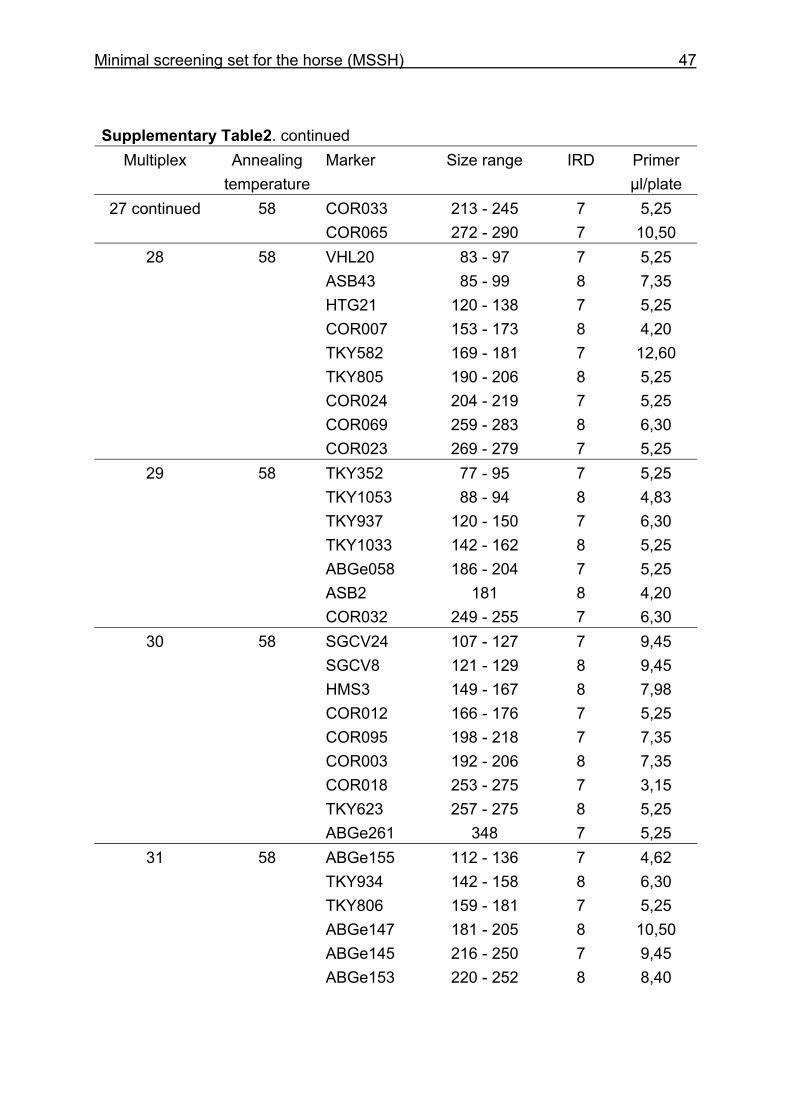
Minimal screening set for the horse (MSSH) 47
Supplementary Table2. continued Multiplex Annealing
temperature Marker Size range IRD Primer
μl/plate 27 continued 58 COR033 213 - 245 7 5,25
COR065 272 - 290 7 10,50 28 58 VHL20 83 - 97 7 5,25
ASB43 85 - 99 8 7,35 HTG21 120 - 138 7 5,25 COR007 153 - 173 8 4,20 TKY582 169 - 181 7 12,60 TKY805 190 - 206 8 5,25 COR024 204 - 219 7 5,25 COR069 259 - 283 8 6,30 COR023 269 - 279 7 5,25
29 58 TKY352 77 - 95 7 5,25 TKY1053 88 - 94 8 4,83 TKY937 120 - 150 7 6,30 TKY1033 142 - 162 8 5,25 ABGe058 186 - 204 7 5,25 ASB2 181 8 4,20 COR032 249 - 255 7 6,30
30 58 SGCV24 107 - 127 7 9,45 SGCV8 121 - 129 8 9,45 HMS3 149 - 167 8 7,98 COR012 166 - 176 7 5,25 COR095 198 - 218 7 7,35 COR003 192 - 206 8 7,35 COR018 253 - 275 7 3,15 TKY623 257 - 275 8 5,25 ABGe261 348 7 5,25
31 58 ABGe155 112 - 136 7 4,62 TKY934 142 - 158 8 6,30 TKY806 159 - 181 7 5,25 ABGe147 181 - 205 8 10,50 ABGe145 216 - 250 7 9,45
ABGe153 220 - 252 8 8,40
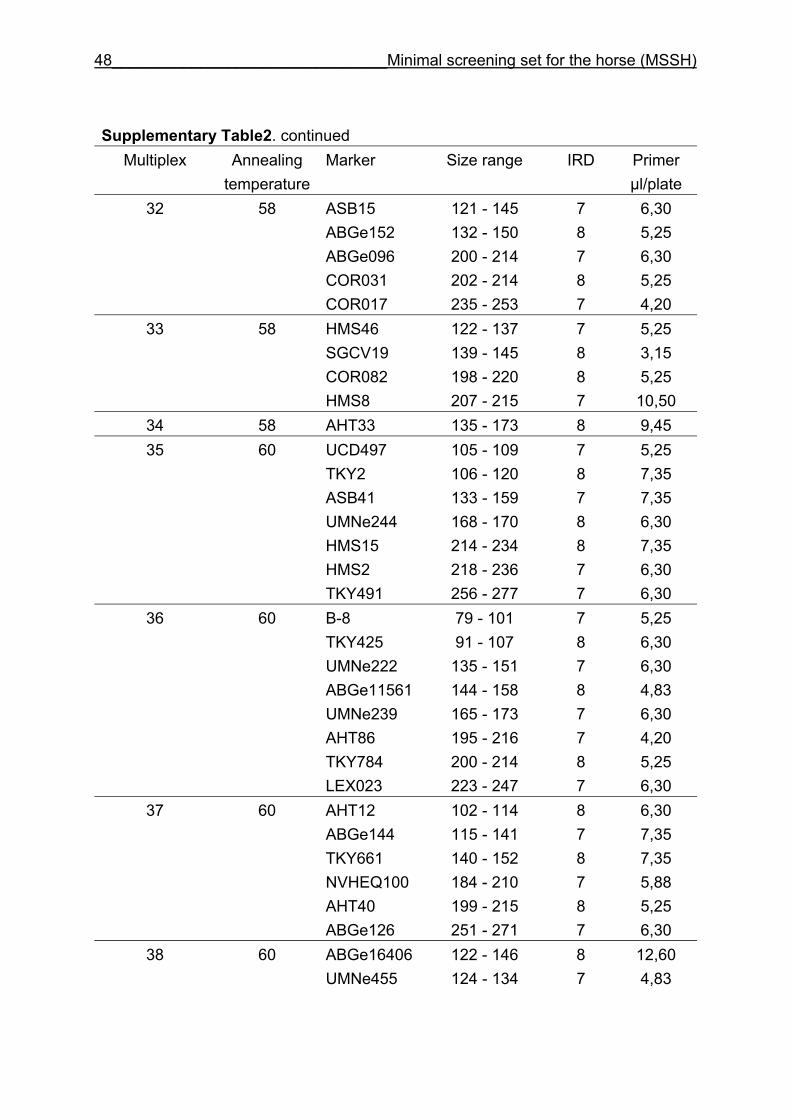
48_______________________________Minimal screening set for the horse (MSSH)
Supplementary Table2. continued Multiplex Annealing
temperature Marker Size range IRD Primer
μl/plate 32 58 ASB15 121 - 145 7 6,30 ABGe152 132 - 150 8 5,25 ABGe096 200 - 214 7 6,30 COR031 202 - 214 8 5,25 COR017 235 - 253 7 4,20
33 58 HMS46 122 - 137 7 5,25 SGCV19 139 - 145 8 3,15 COR082 198 - 220 8 5,25 HMS8 207 - 215 7 10,50
34 58 AHT33 135 - 173 8 9,45 35 60 UCD497 105 - 109 7 5,25 TKY2 106 - 120 8 7,35 ASB41 133 - 159 7 7,35 UMNe244 168 - 170 8 6,30 HMS15 214 - 234 8 7,35 HMS2 218 - 236 7 6,30 TKY491 256 - 277 7 6,30
36 60 B-8 79 - 101 7 5,25 TKY425 91 - 107 8 6,30 UMNe222 135 - 151 7 6,30 ABGe11561 144 - 158 8 4,83 UMNe239 165 - 173 7 6,30 AHT86 195 - 216 7 4,20 TKY784 200 - 214 8 5,25 LEX023 223 - 247 7 6,30
37 60 AHT12 102 - 114 8 6,30 ABGe144 115 - 141 7 7,35 TKY661 140 - 152 8 7,35 NVHEQ100 184 - 210 7 5,88 AHT40 199 - 215 8 5,25 ABGe126 251 - 271 7 6,30
38 60 ABGe16406 122 - 146 8 12,60 UMNe455 124 - 134 7 4,83
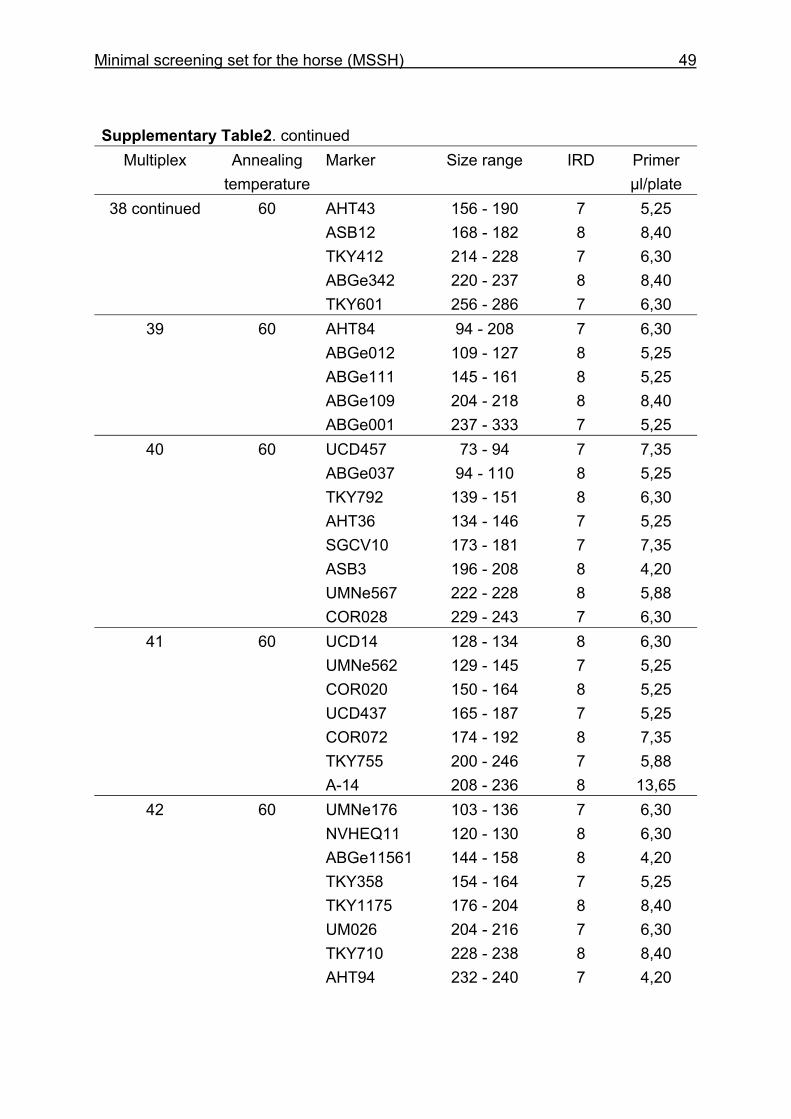
Minimal screening set for the horse (MSSH) 49
Supplementary Table2. continued Multiplex Annealing
temperature Marker Size range IRD Primer
μl/plate 38 continued 60 AHT43 156 - 190 7 5,25
ASB12 168 - 182 8 8,40 TKY412 214 - 228 7 6,30 ABGe342 220 - 237 8 8,40 TKY601 256 - 286 7 6,30
39 60 AHT84 94 - 208 7 6,30 ABGe012 109 - 127 8 5,25 ABGe111 145 - 161 8 5,25 ABGe109 204 - 218 8 8,40 ABGe001 237 - 333 7 5,25
40 60 UCD457 73 - 94 7 7,35 ABGe037 94 - 110 8 5,25 TKY792 139 - 151 8 6,30 AHT36 134 - 146 7 5,25 SGCV10 173 - 181 7 7,35 ASB3 196 - 208 8 4,20 UMNe567 222 - 228 8 5,88 COR028 229 - 243 7 6,30
41 60 UCD14 128 - 134 8 6,30 UMNe562 129 - 145 7 5,25 COR020 150 - 164 8 5,25 UCD437 165 - 187 7 5,25 COR072 174 - 192 8 7,35 TKY755 200 - 246 7 5,88 A-14 208 - 236 8 13,65
42 60 UMNe176 103 - 136 7 6,30 NVHEQ11 120 - 130 8 6,30 ABGe11561 144 - 158 8 4,20 TKY358 154 - 164 7 5,25 TKY1175 176 - 204 8 8,40 UM026 204 - 216 7 6,30 TKY710 228 - 238 8 8,40
AHT94 232 - 240 7 4,20
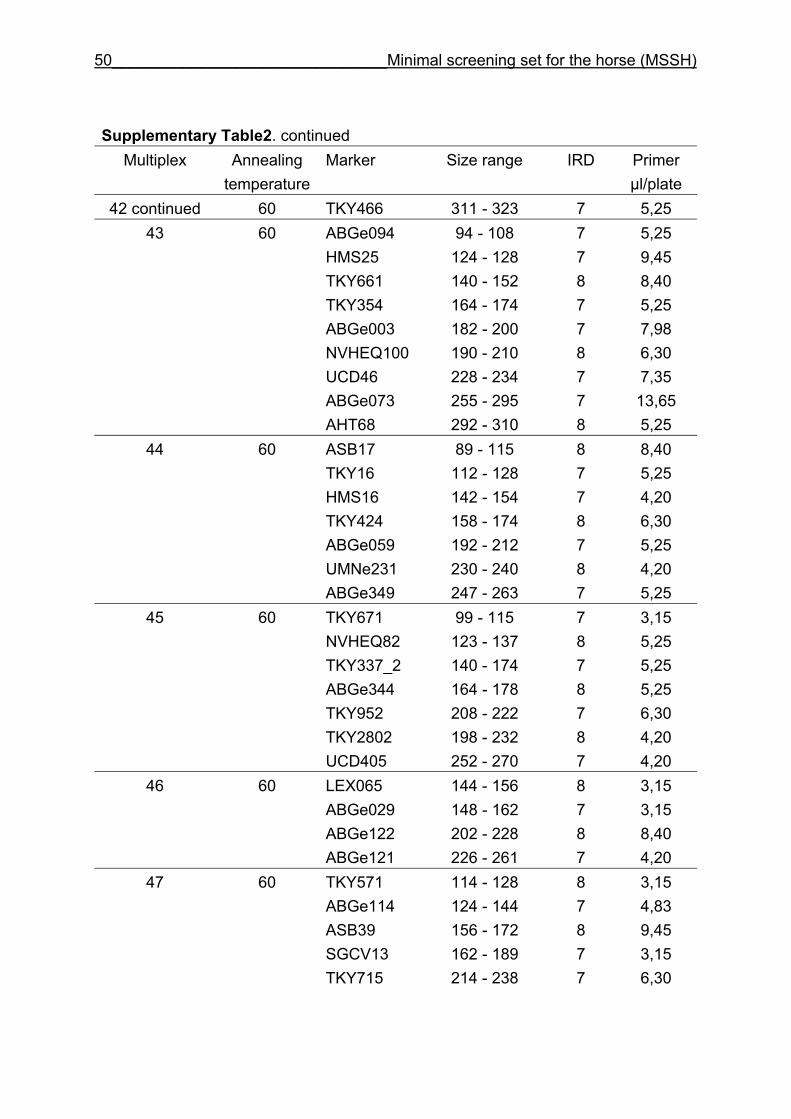
50_______________________________Minimal screening set for the horse (MSSH)
Supplementary Table2. continued Multiplex Annealing
temperature Marker Size range IRD Primer
μl/plate 42 continued 60 TKY466 311 - 323 7 5,25
43 60 ABGe094 94 - 108 7 5,25 HMS25 124 - 128 7 9,45 TKY661 140 - 152 8 8,40 TKY354 164 - 174 7 5,25 ABGe003 182 - 200 7 7,98 NVHEQ100 190 - 210 8 6,30 UCD46 228 - 234 7 7,35 ABGe073 255 - 295 7 13,65 AHT68 292 - 310 8 5,25
44 60 ASB17 89 - 115 8 8,40 TKY16 112 - 128 7 5,25 HMS16 142 - 154 7 4,20 TKY424 158 - 174 8 6,30 ABGe059 192 - 212 7 5,25 UMNe231 230 - 240 8 4,20 ABGe349 247 - 263 7 5,25
45 60 TKY671 99 - 115 7 3,15 NVHEQ82 123 - 137 8 5,25 TKY337_2 140 - 174 7 5,25 ABGe344 164 - 178 8 5,25 TKY952 208 - 222 7 6,30 TKY2802 198 - 232 8 4,20 UCD405 252 - 270 7 4,20
46 60 LEX065 144 - 156 8 3,15 ABGe029 148 - 162 7 3,15 ABGe122 202 - 228 8 8,40 ABGe121 226 - 261 7 4,20
47 60 TKY571 114 - 128 8 3,15 ABGe114 124 - 144 7 4,83 ASB39 156 - 172 8 9,45 SGCV13 162 - 189 7 3,15
TKY715 214 - 238 7 6,30
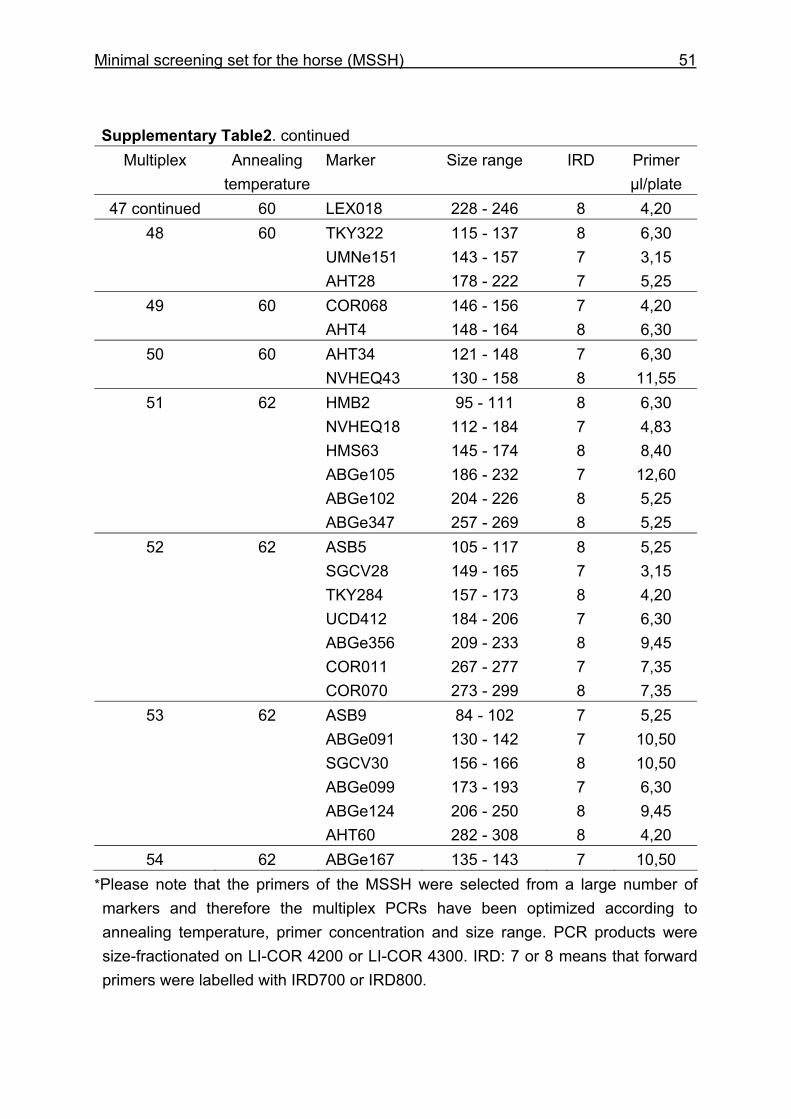
Minimal screening set for the horse (MSSH) 51
Supplementary Table2. continued Multiplex Annealing
temperature Marker Size range IRD Primer
μl/plate 47 continued 60 LEX018 228 - 246 8 4,20
48 60 TKY322 115 - 137 8 6,30 UMNe151 143 - 157 7 3,15 AHT28 178 - 222 7 5,25
49 60 COR068 146 - 156 7 4,20 AHT4 148 - 164 8 6,30
50 60 AHT34 121 - 148 7 6,30 NVHEQ43 130 - 158 8 11,55
51 62 HMB2 95 - 111 8 6,30 NVHEQ18 112 - 184 7 4,83 HMS63 145 - 174 8 8,40 ABGe105 186 - 232 7 12,60 ABGe102 204 - 226 8 5,25 ABGe347 257 - 269 8 5,25
52 62 ASB5 105 - 117 8 5,25 SGCV28 149 - 165 7 3,15 TKY284 157 - 173 8 4,20 UCD412 184 - 206 7 6,30 ABGe356 209 - 233 8 9,45 COR011 267 - 277 7 7,35 COR070 273 - 299 8 7,35
53 62 ASB9 84 - 102 7 5,25 ABGe091 130 - 142 7 10,50 SGCV30 156 - 166 8 10,50 ABGe099 173 - 193 7 6,30 ABGe124 206 - 250 8 9,45 AHT60 282 - 308 8 4,20
54 62 ABGe167 135 - 143 7 10,50 *Please note that the primers of the MSSH were selected from a large number of markers and therefore the multiplex PCRs have been optimized according to annealing temperature, primer concentration and size range. PCR products were size-fractionated on LI-COR 4200 or LI-COR 4300. IRD: 7 or 8 means that forward primers were labelled with IRD700 or IRD800.
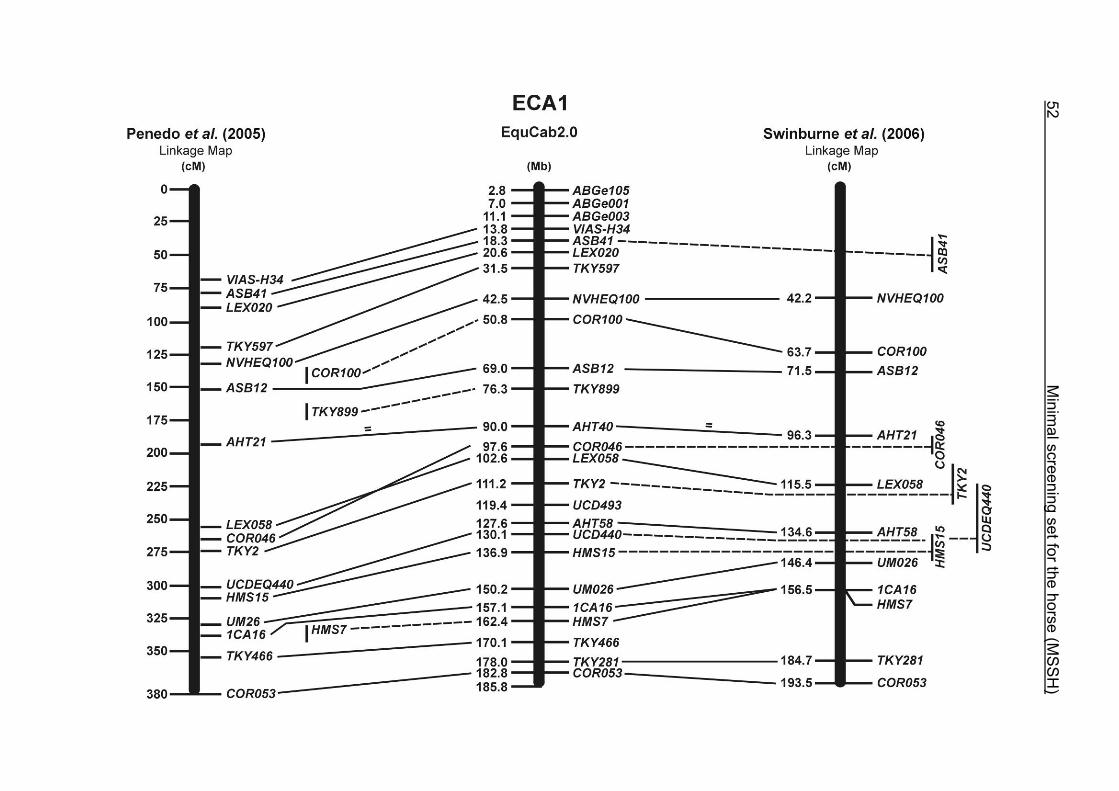
52
M
inimal screening set for the horse (M
SS
H)
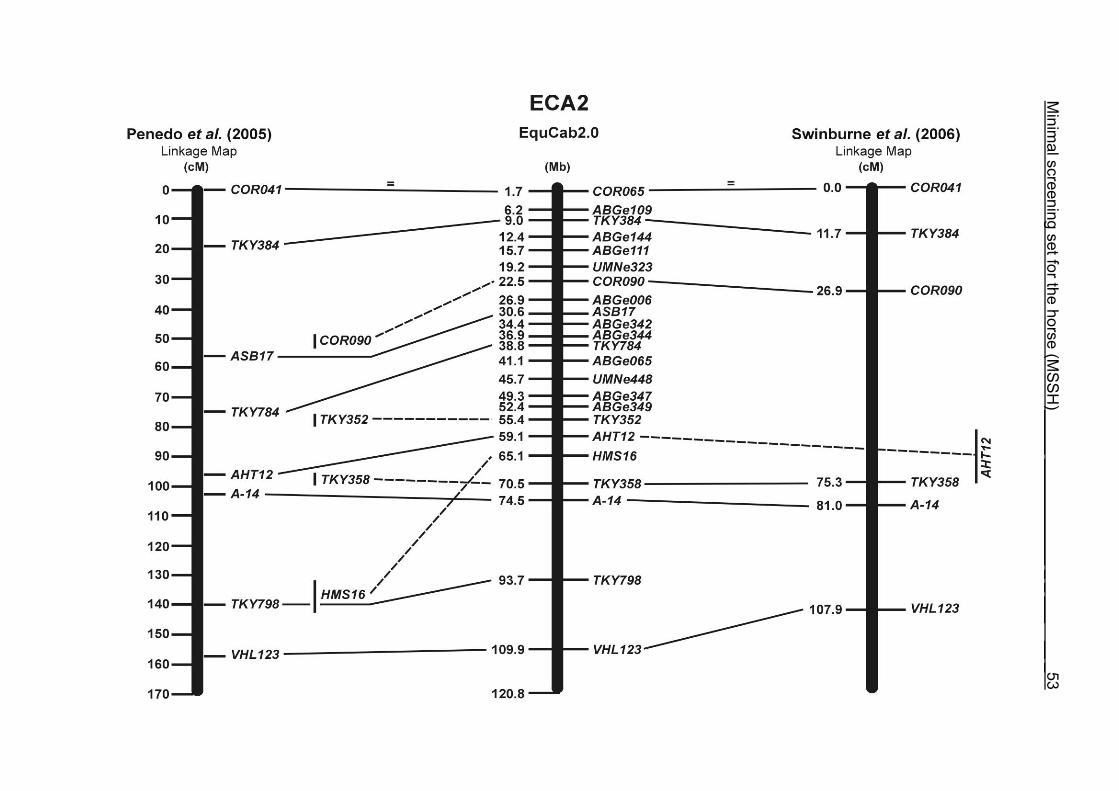
Minim
al screening set for the horse (MS
SH
)_____ ____________ _ _ ___ __ _53
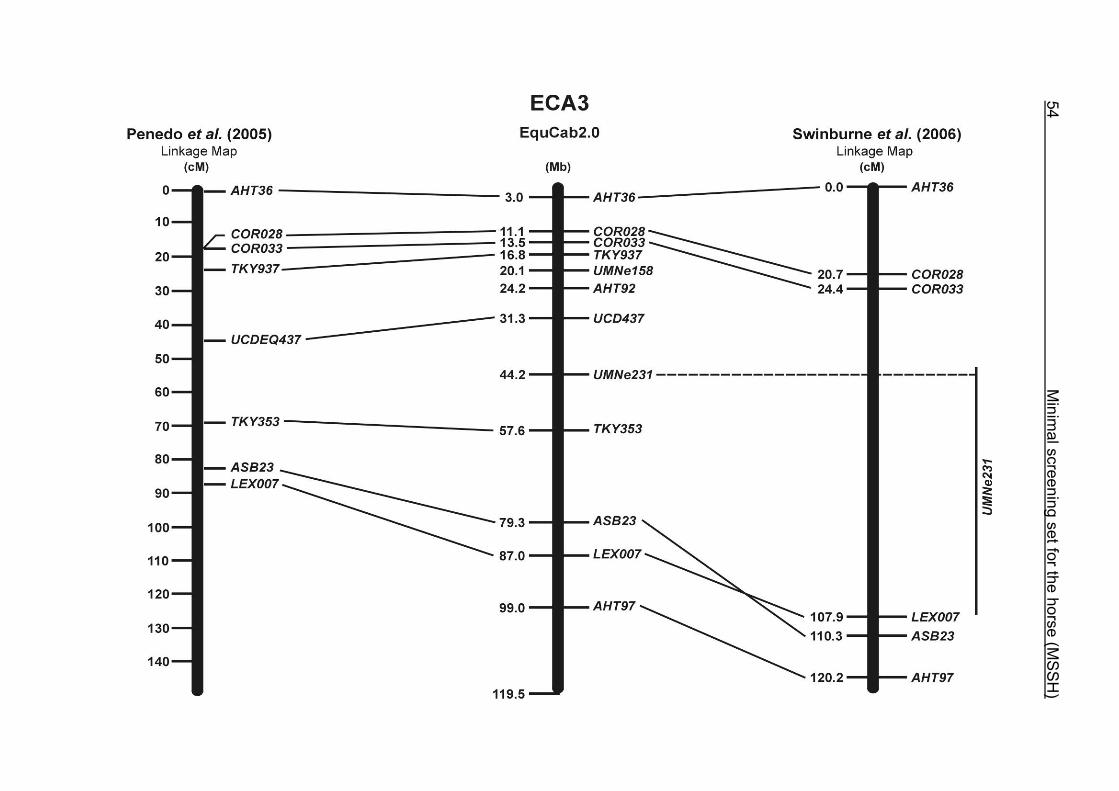
54
M
inimal screening set for the horse (M
SS
H)
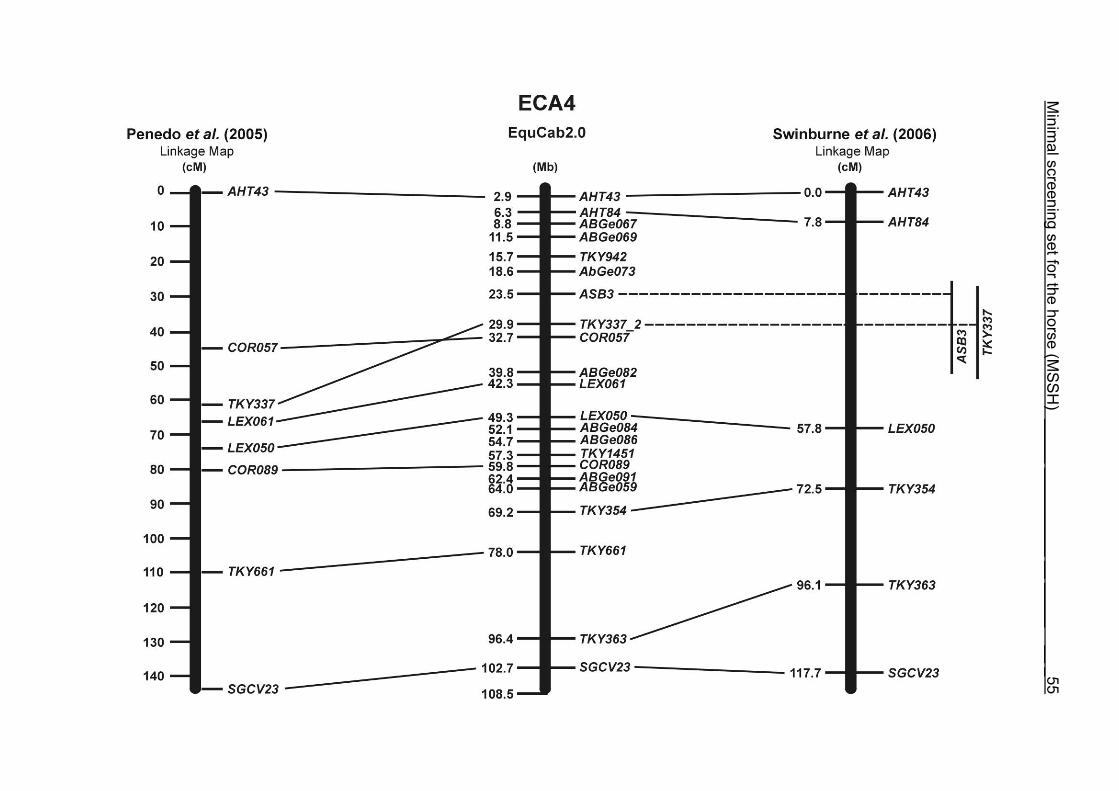
Minim
al screening set for the horse (MS
SH
) _____ __________ __ _____ __ _55
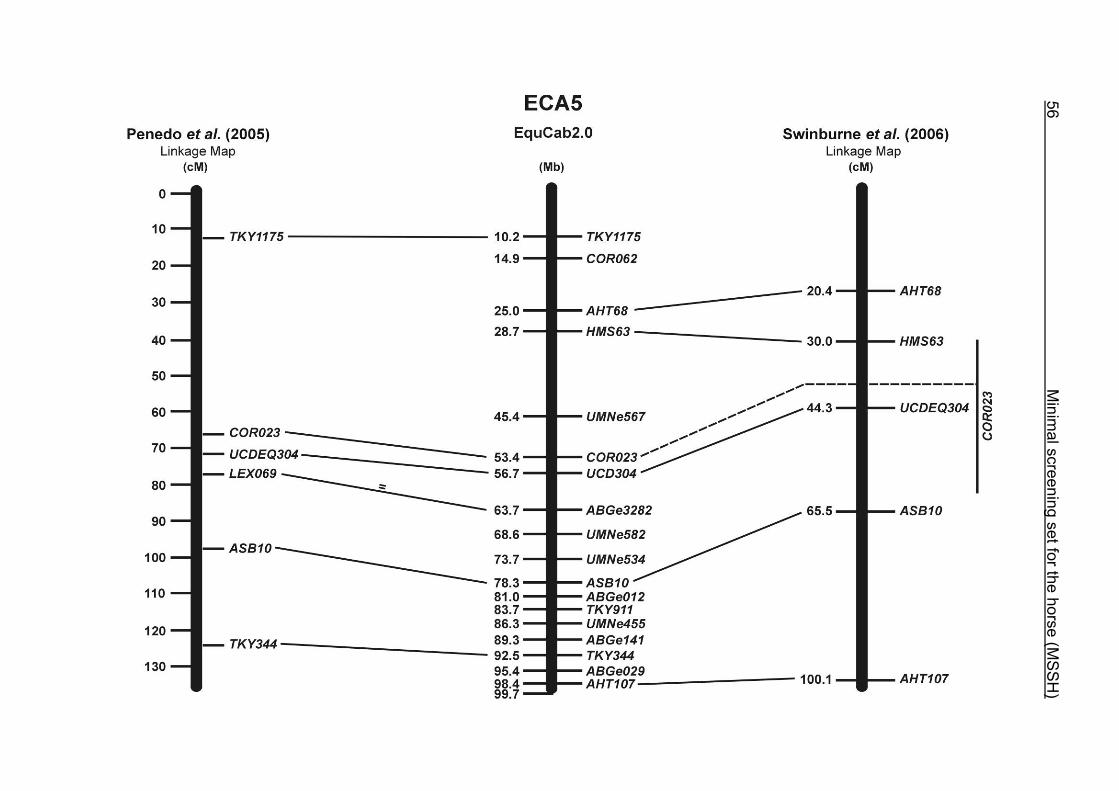
56
M
inimal screening set for the horse (M
SS
H)
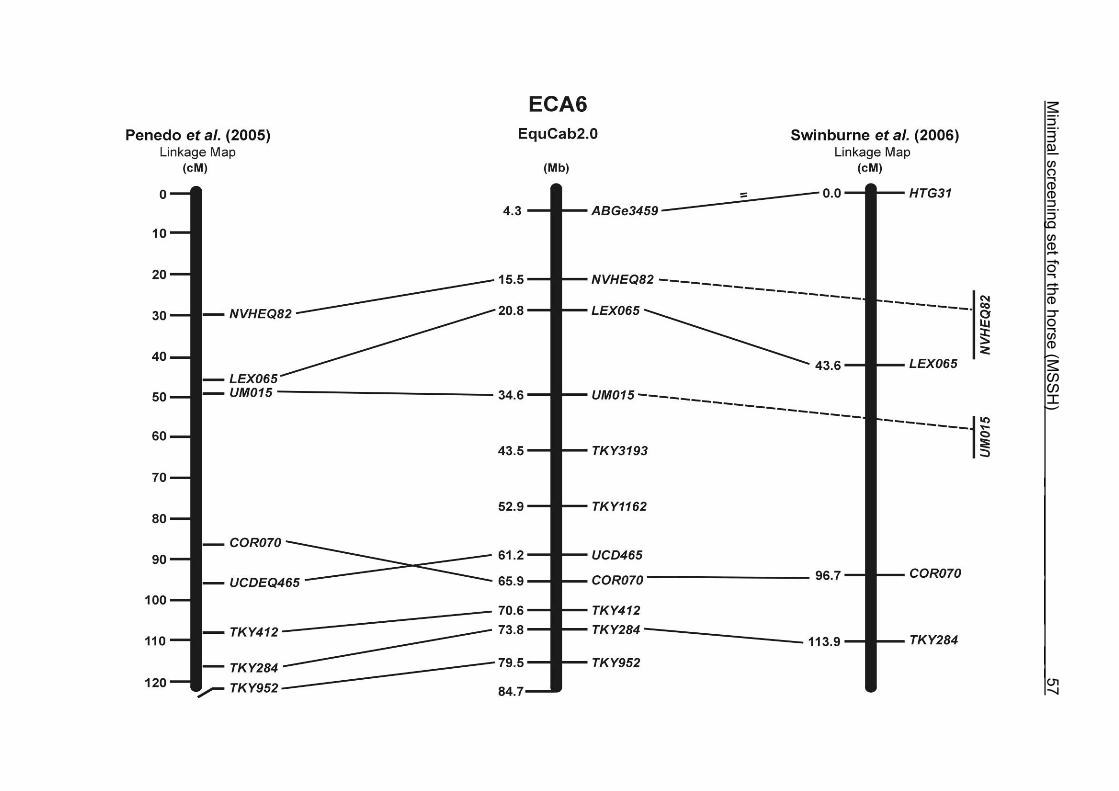
Minim
al screening set for the horse (MS
SH
) _ _________ _____ __ _57
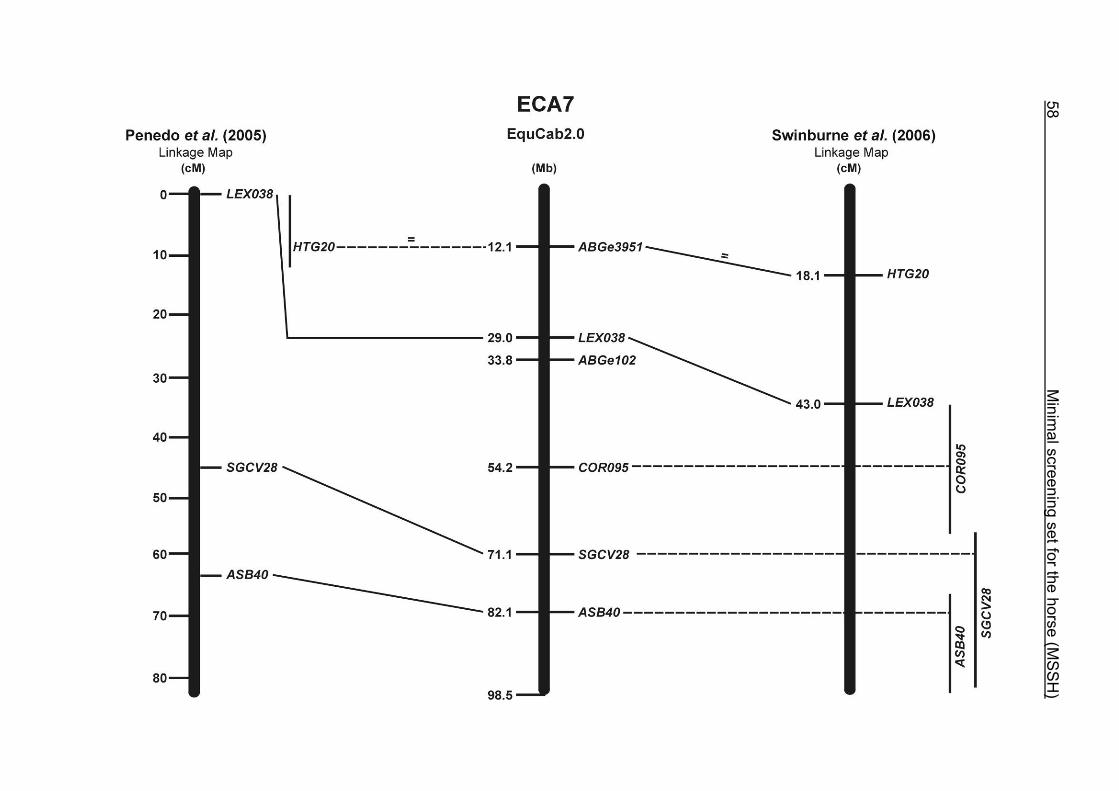
58
M
inimal screening set for the horse (M
SS
H)
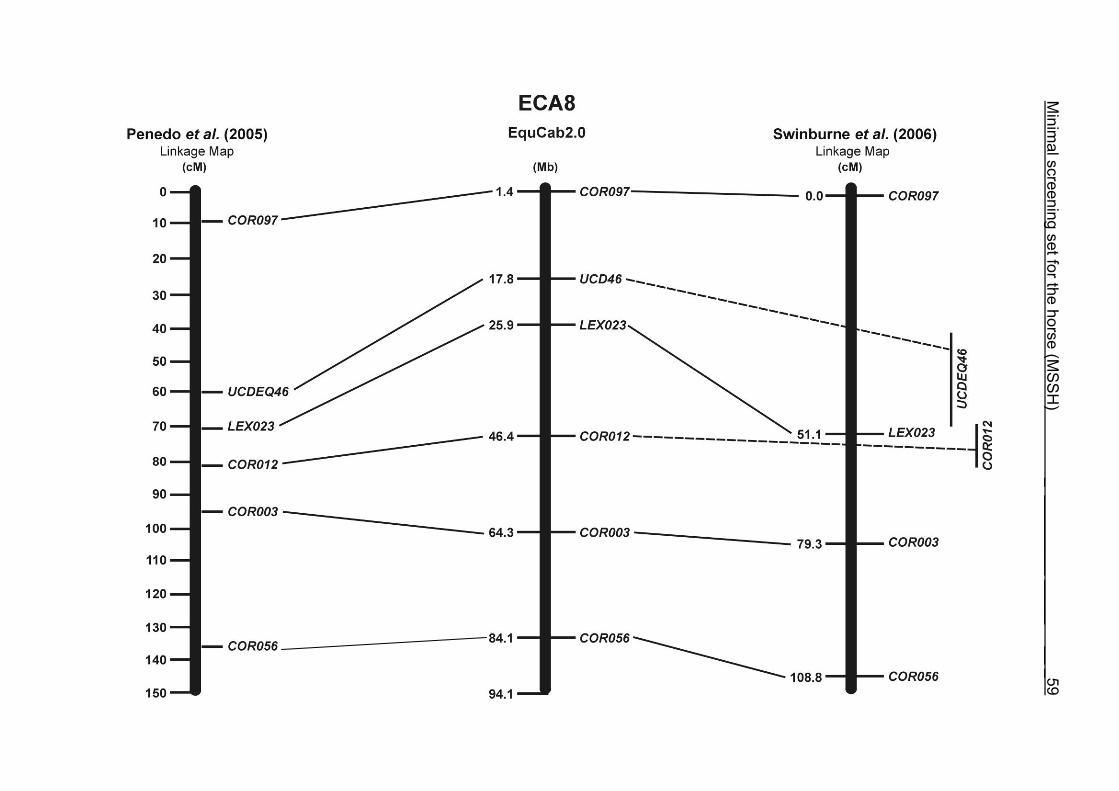
Minim
al screening set for the horse (MS
SH
) _ _________ _____ __ _59
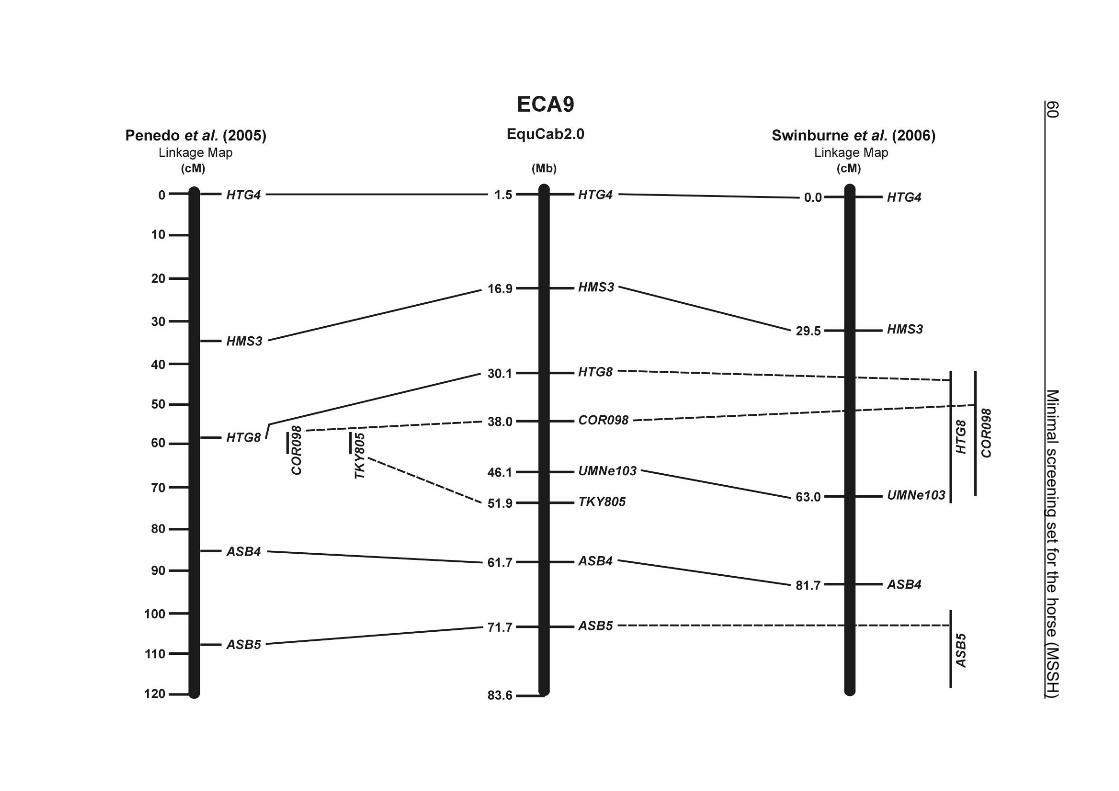
60
M
inimal screening set for the horse (M
SS
H)
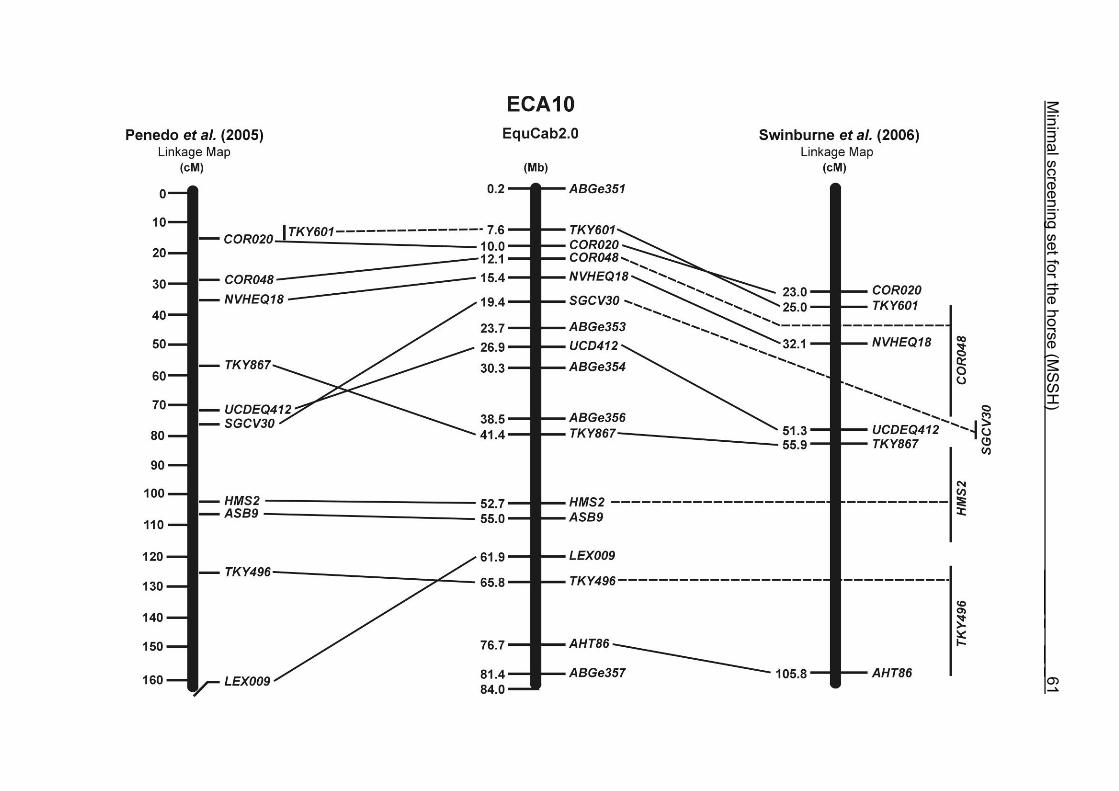
Minim
al screening set for the horse (MS
SH
) _____ _ __ _61
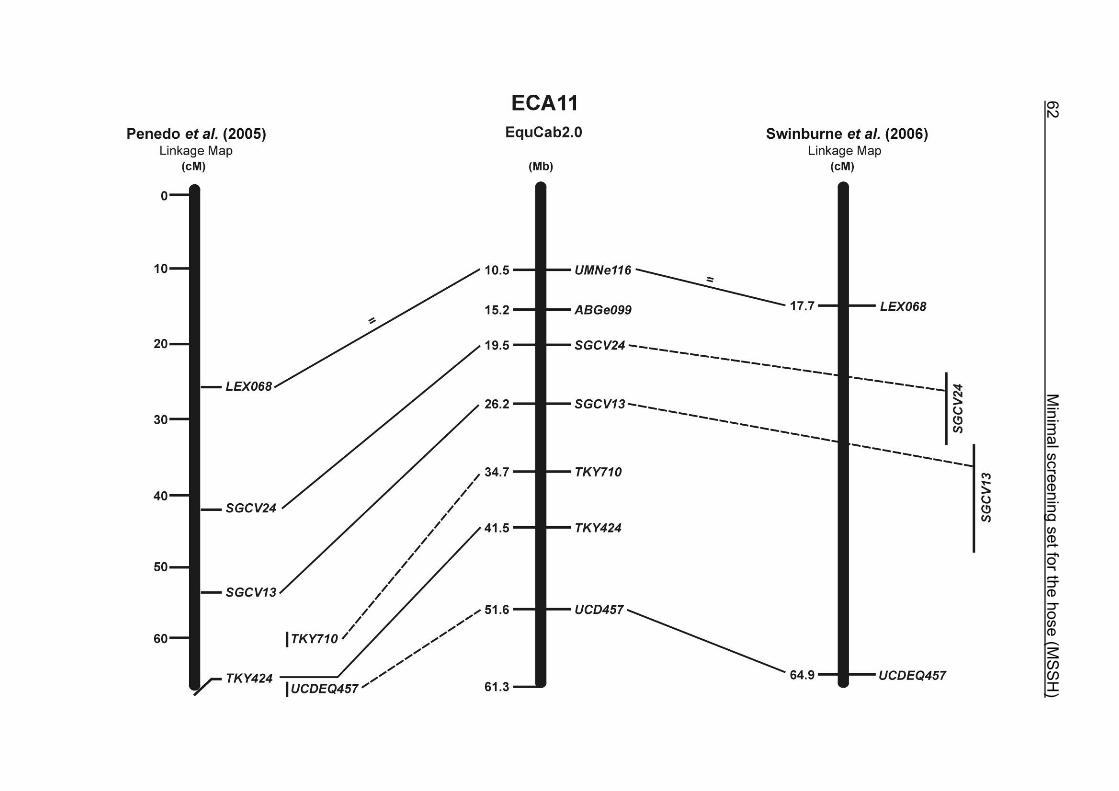
62
M
inimal screening set for the hose (M
SS
H)
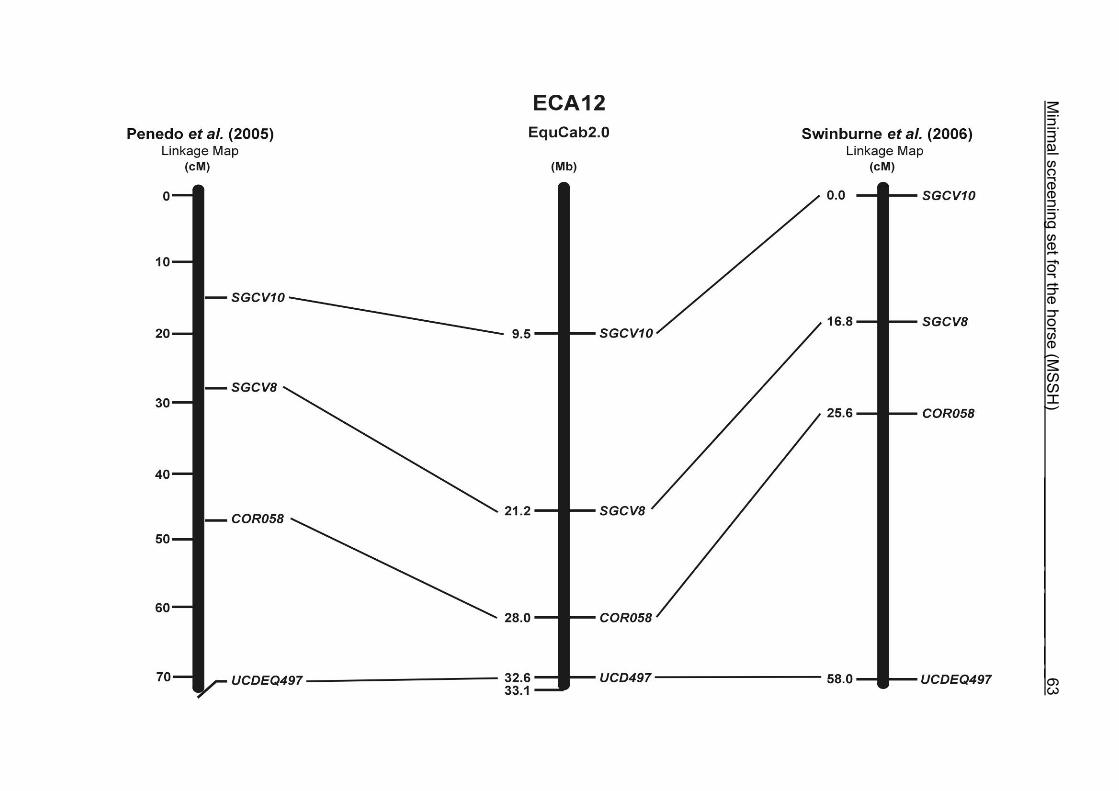
Minim
al screening set for the horse (MS
SH
) _____ ____________ ______ __ _63 M
inimal screening set for the horse (M
SS
H)
__________ __ _____ __ _63
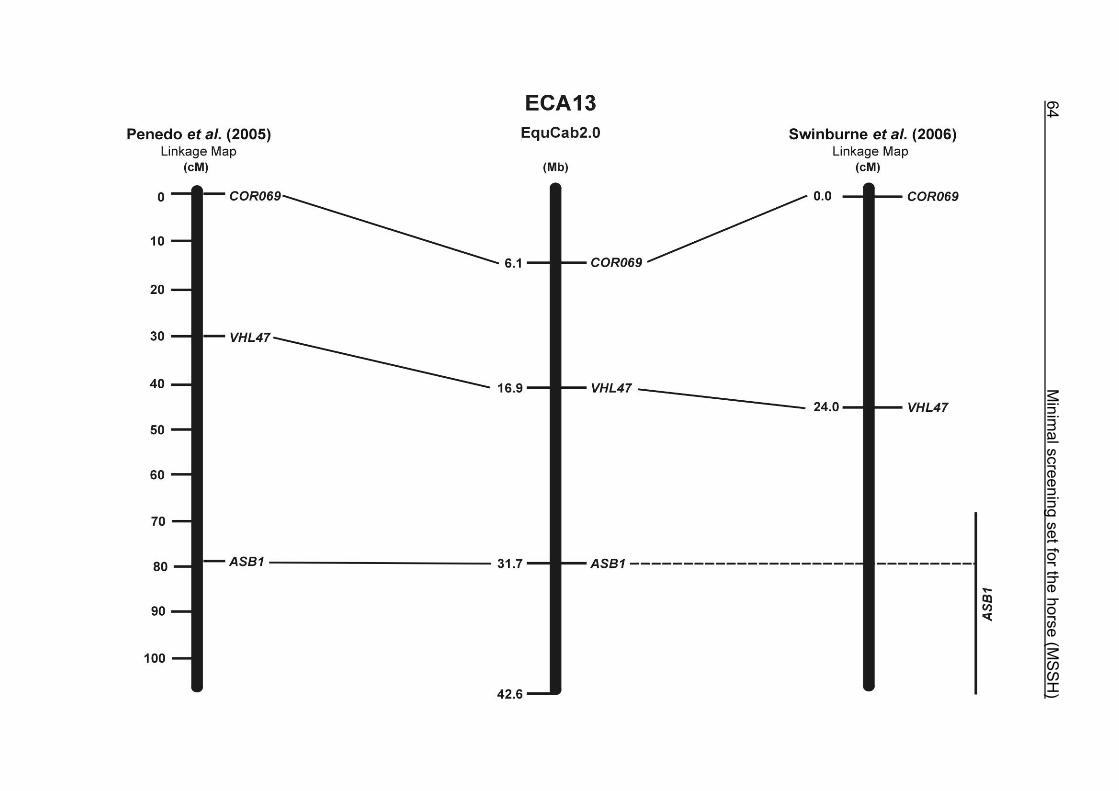
64
M
inimal screening set for the horse (M
SS
H)
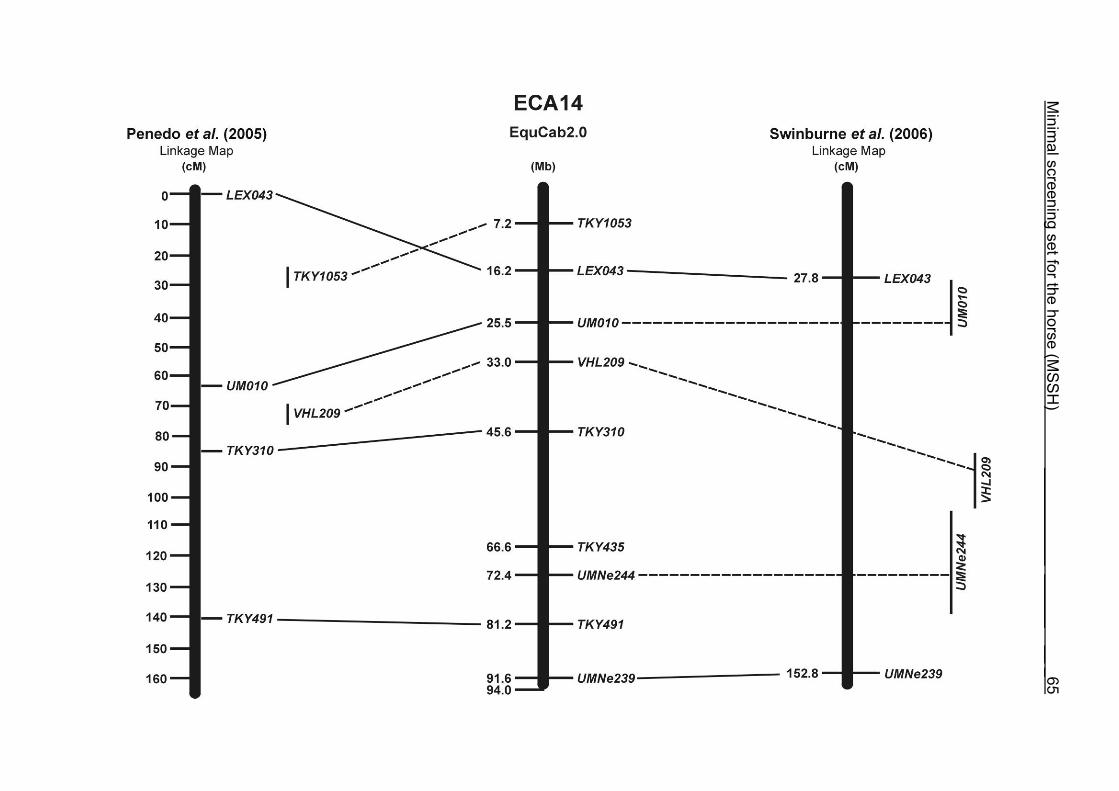
Minim
al screening set for the horse (MS
SH
) ___________ ______ __ _65
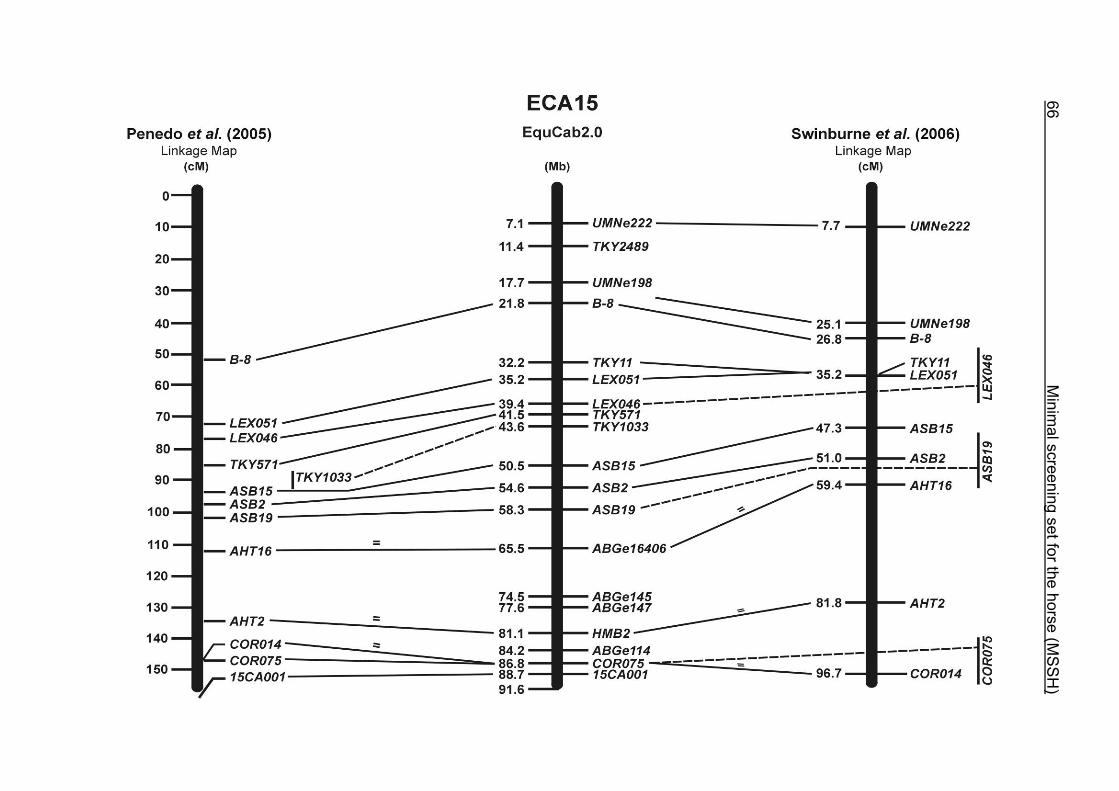
66
M
inimal screening set for the horse (M
SS
H)
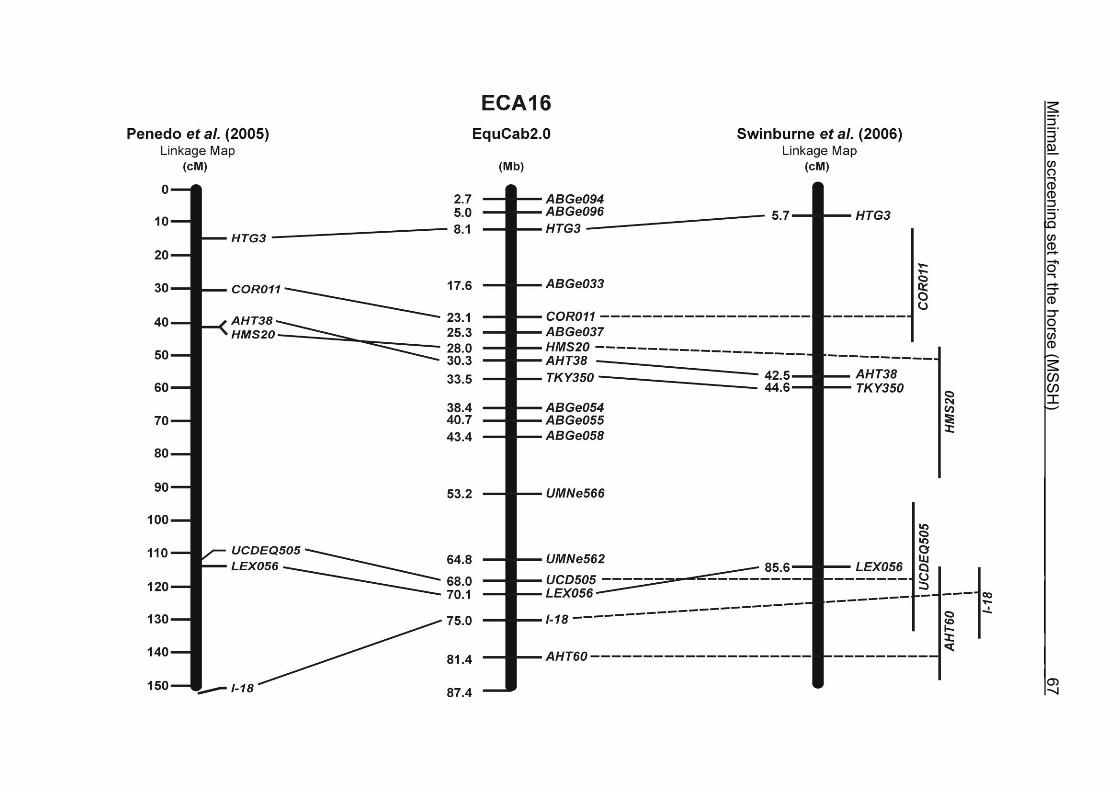
Minim
al screening set for the horse (MS
SH
) ___________ ______ __ _67
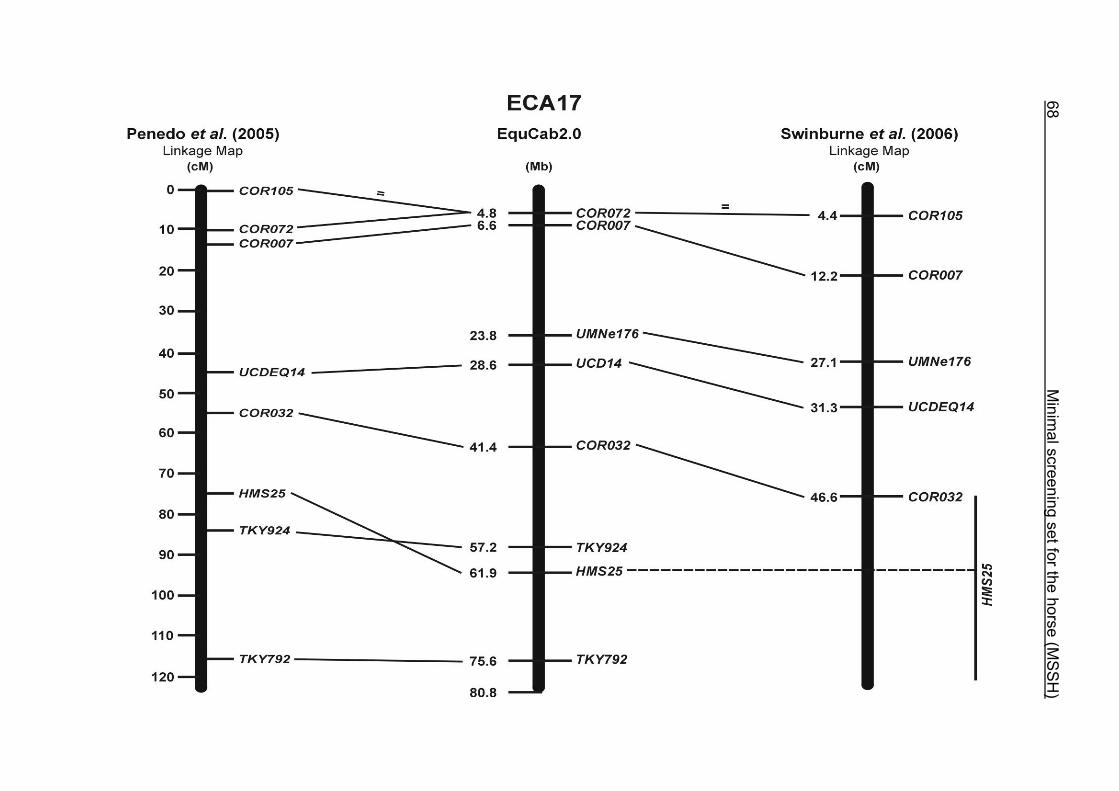
68
M
inimal screening set for the horse (M
SS
H)
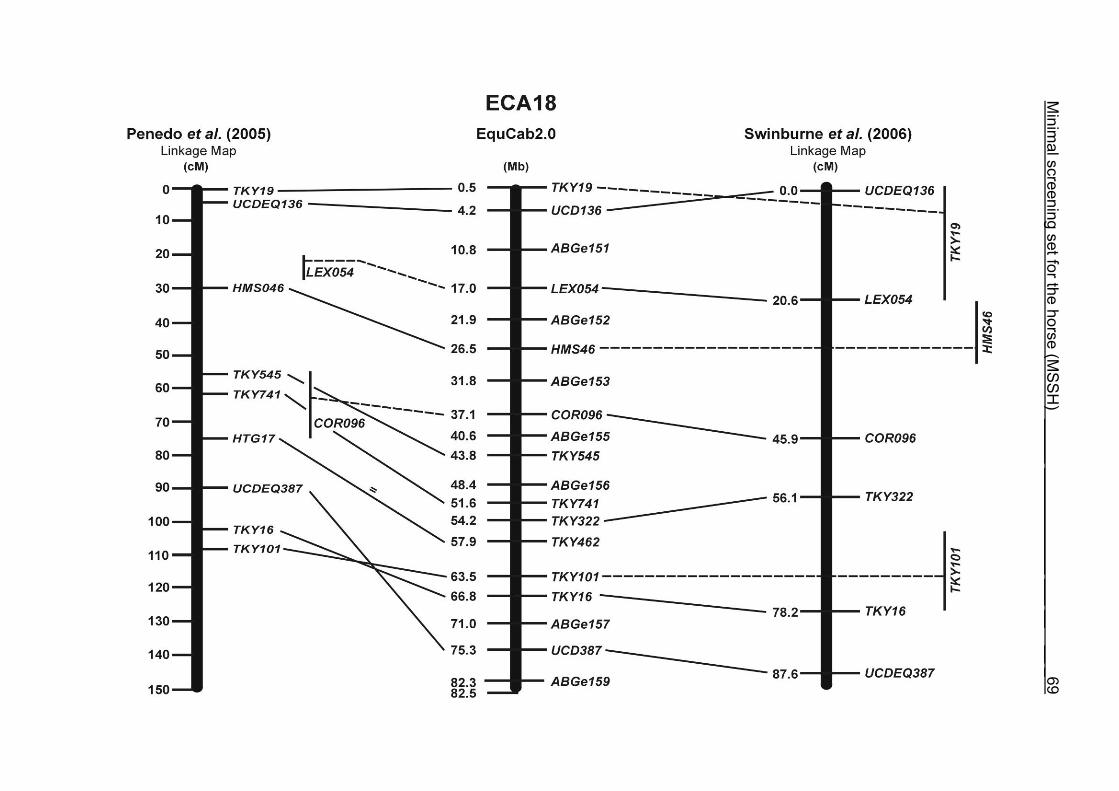
Minim
al screening set for the horse (MS
SH
) _____ ____________ ___ __ __ _69
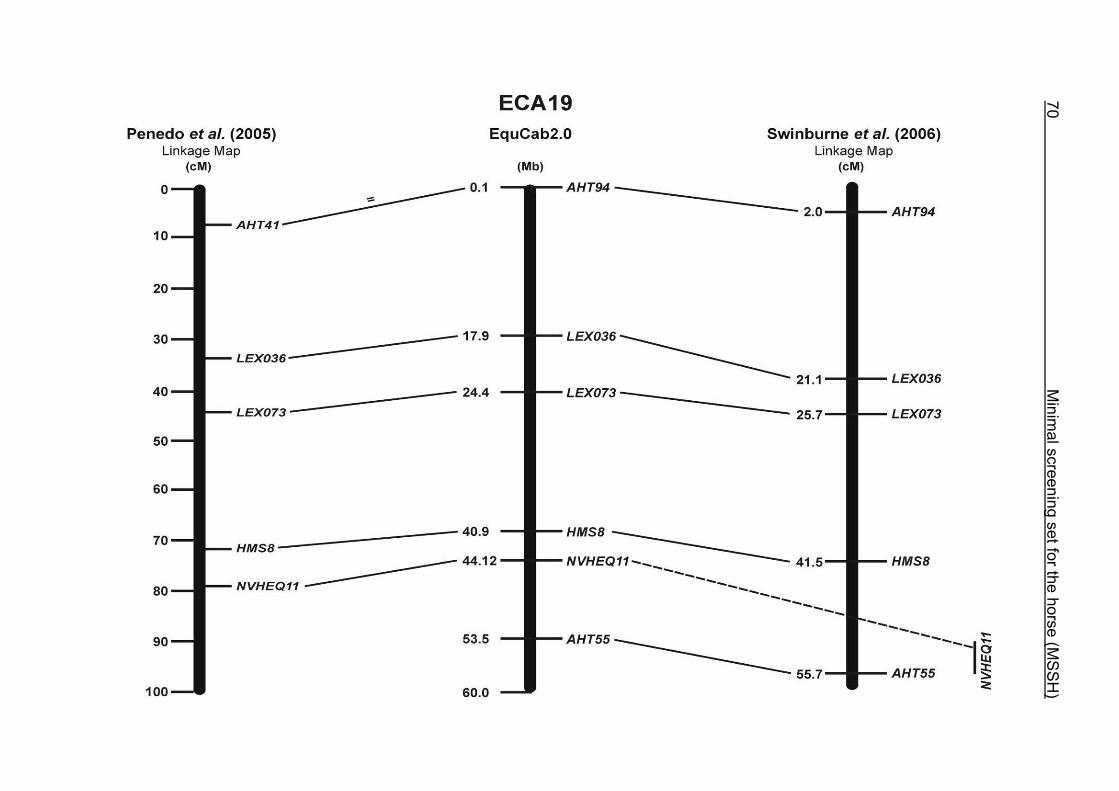
70
M
inimal screening set for the horse (M
SS
H)
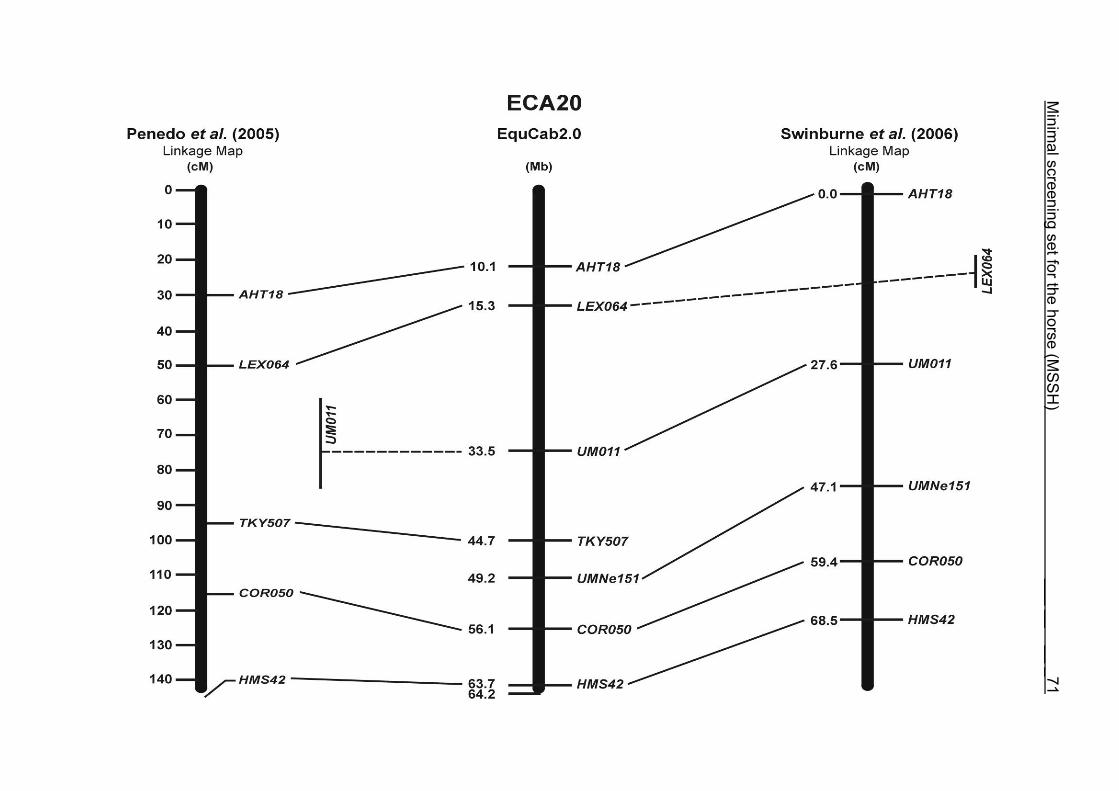
Minim
al screening set for the horse (MS
SH
) ___ __ __ _71
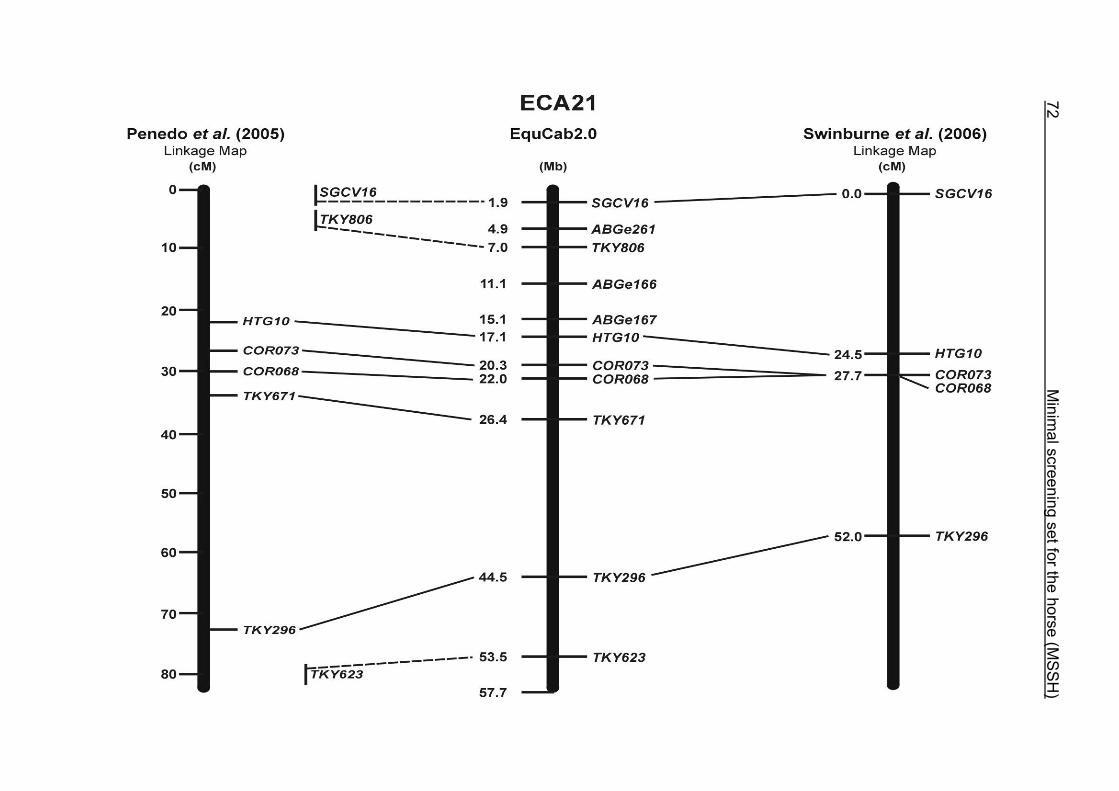
72
M
inimal screening set for the horse (M
SS
H)
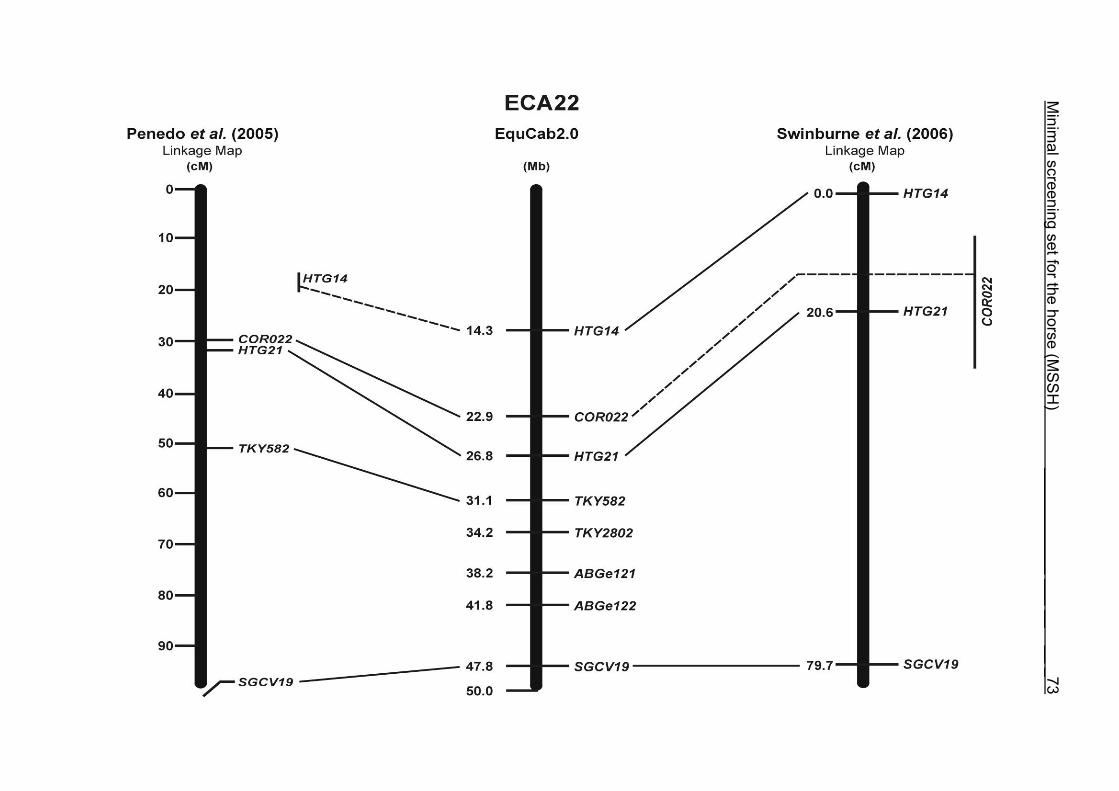
Minim
al screening set for the horse (MS
SH
) ____________ ___ __ __ _73
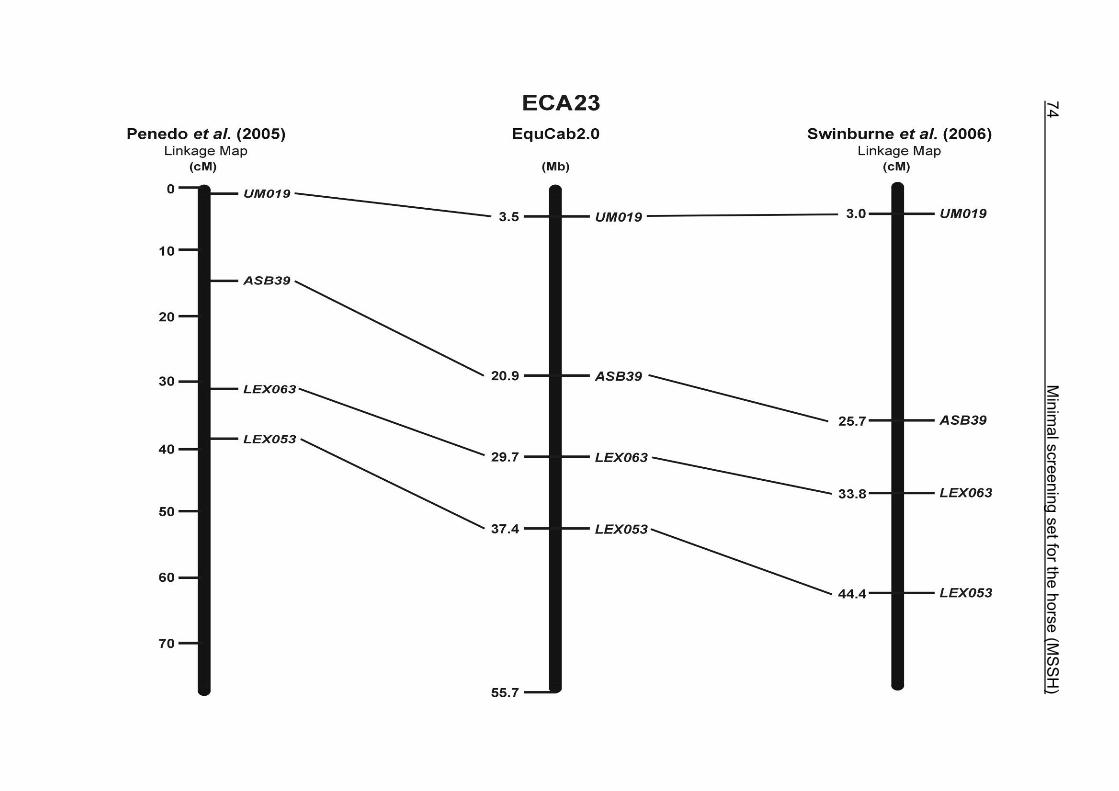
74
M
inimal screening set for the horse (M
SS
H)
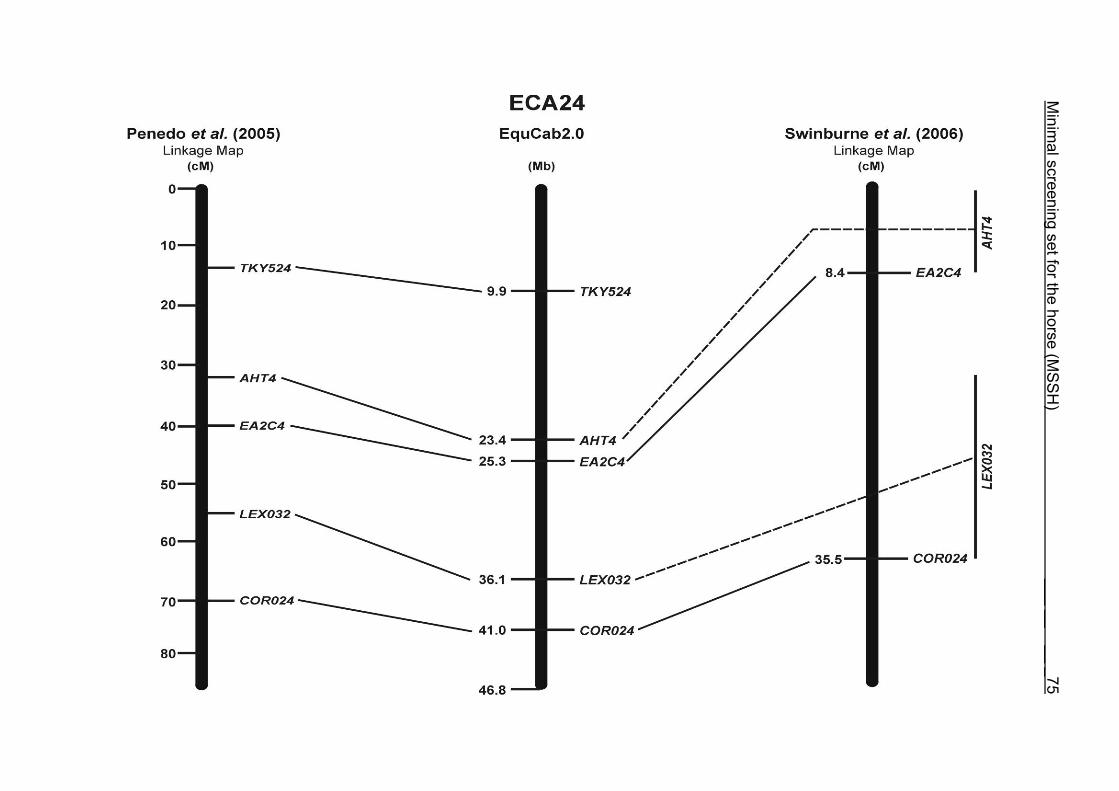
Minim
al screening set for the horse (MS
SH
) ___ __ __ _75
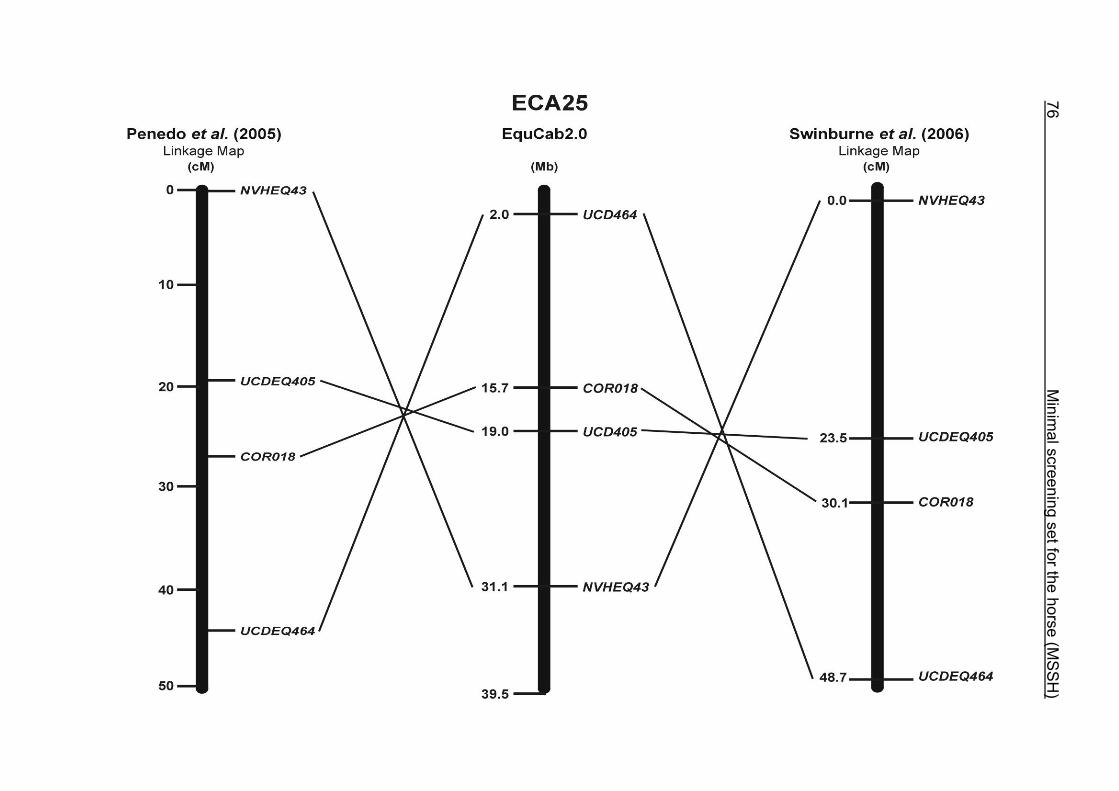
76
M
inimal screening set for the horse (M
SS
H)
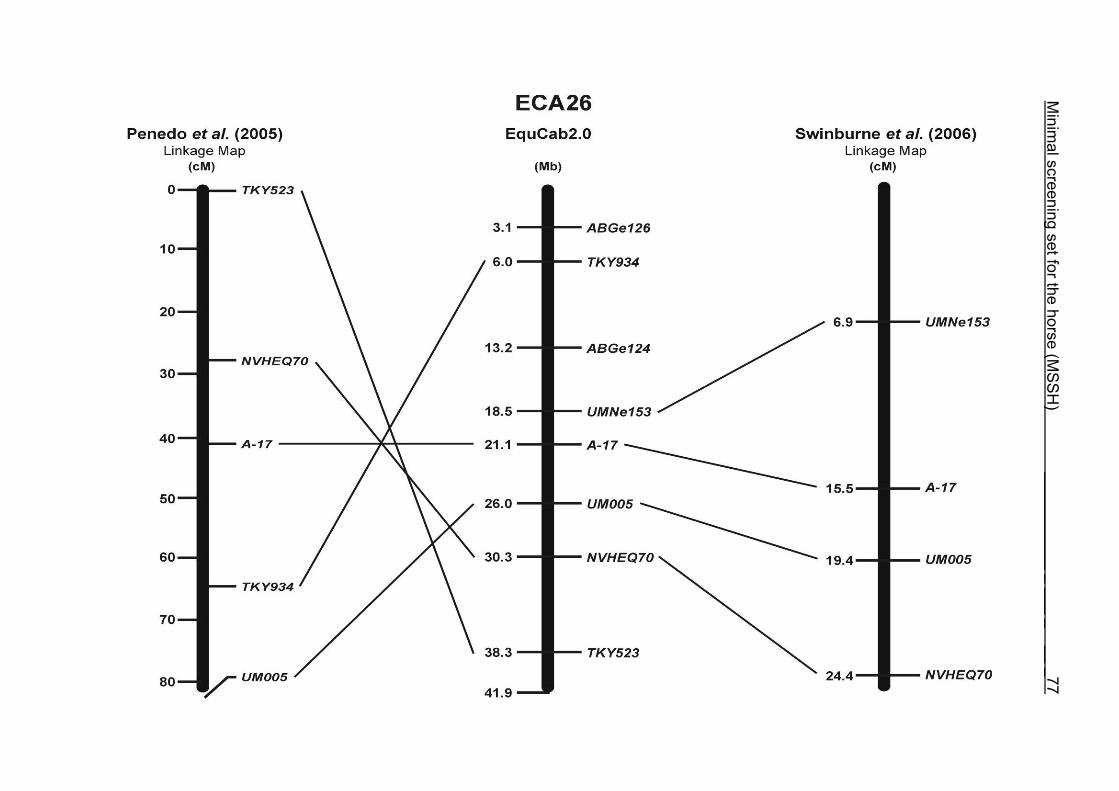
Minim
al screening set for the horse (MS
SH
) ___________ _ ___ _ __ _77
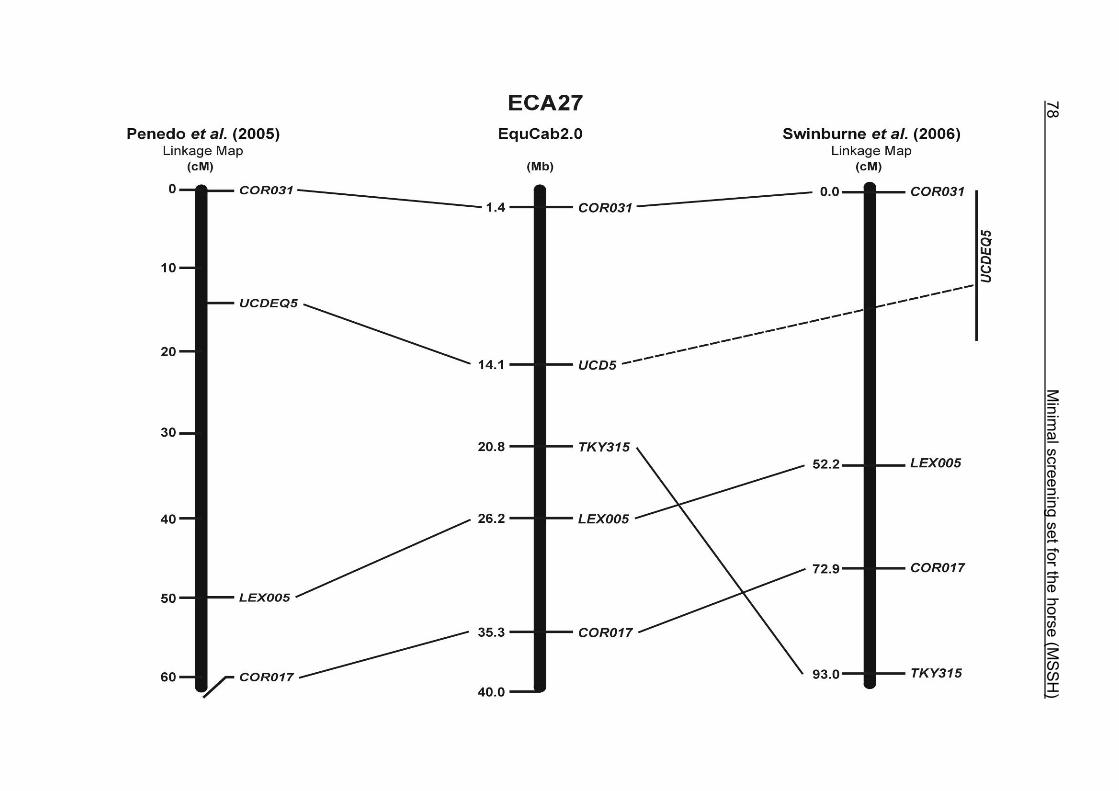
78
M
inimal screening set for the horse (M
SS
H)
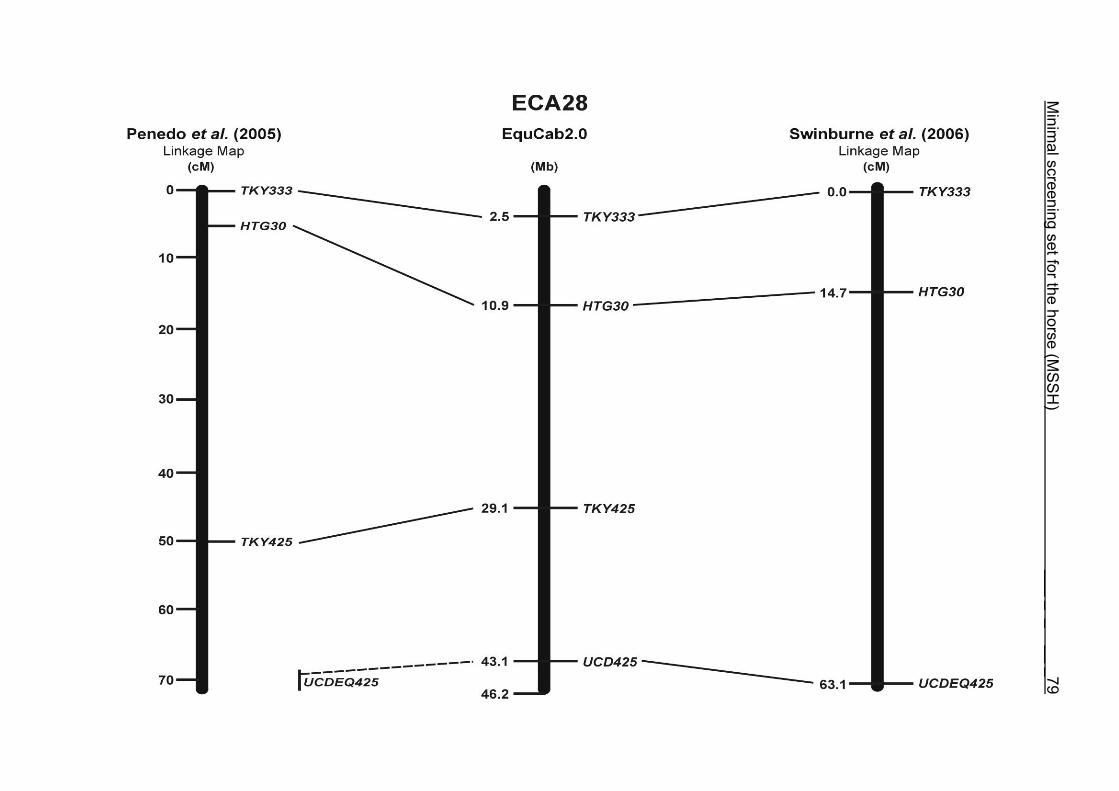
Minim
al screening set for the horse (MS
SH
) ___ _ _ __ _79
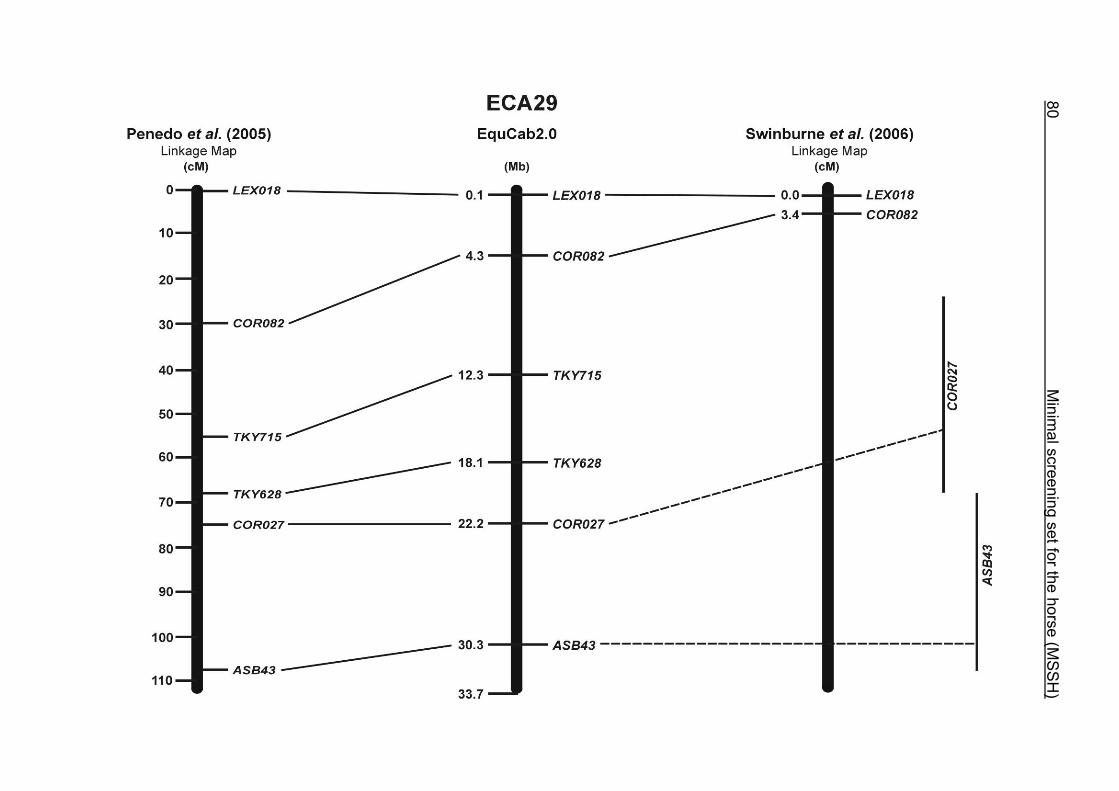
80
M
inimal screening set for the horse (M
SS
H)
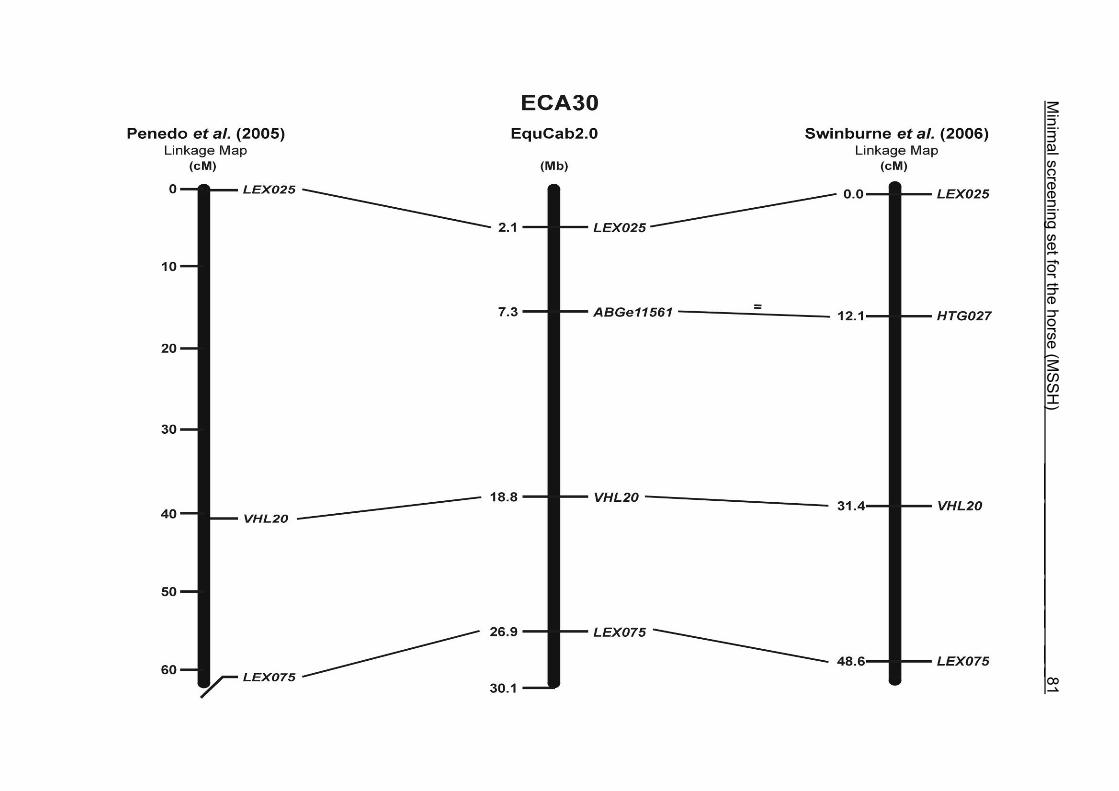
Minim
al screening set for the horse (MS
SH
) ____ ________ ___ __ __ _81
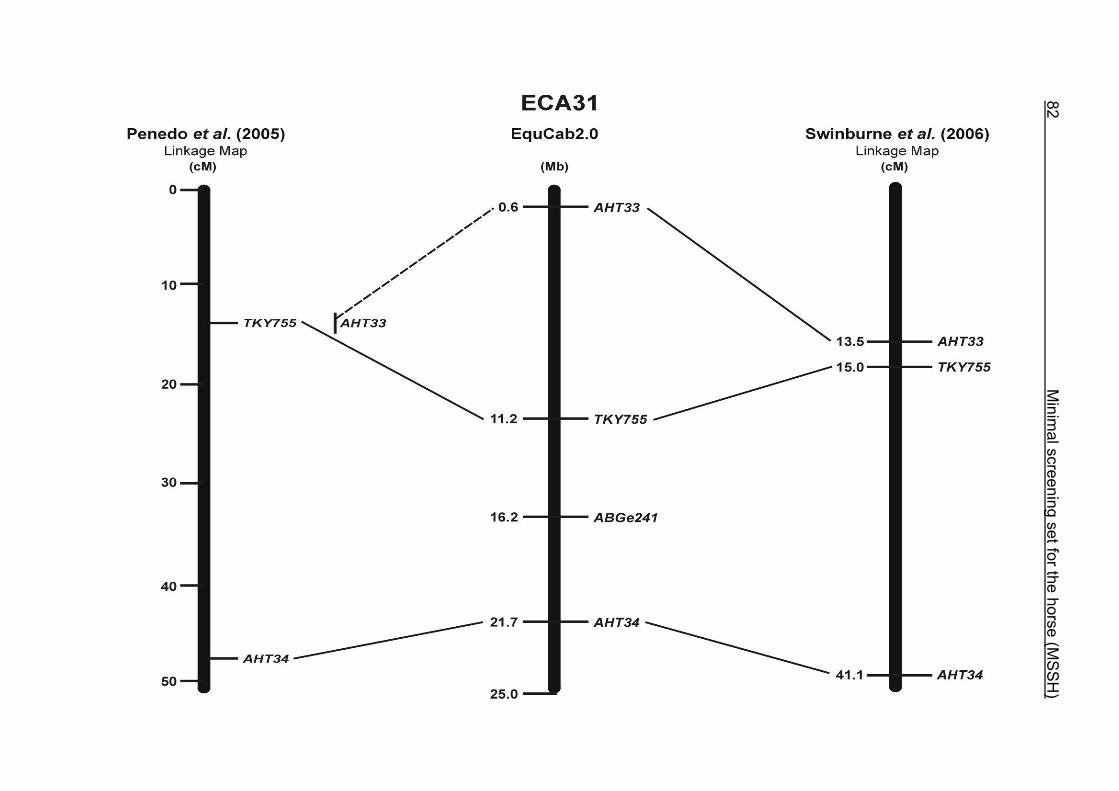
82
M
inimal screening set for the horse (M
SS
H)
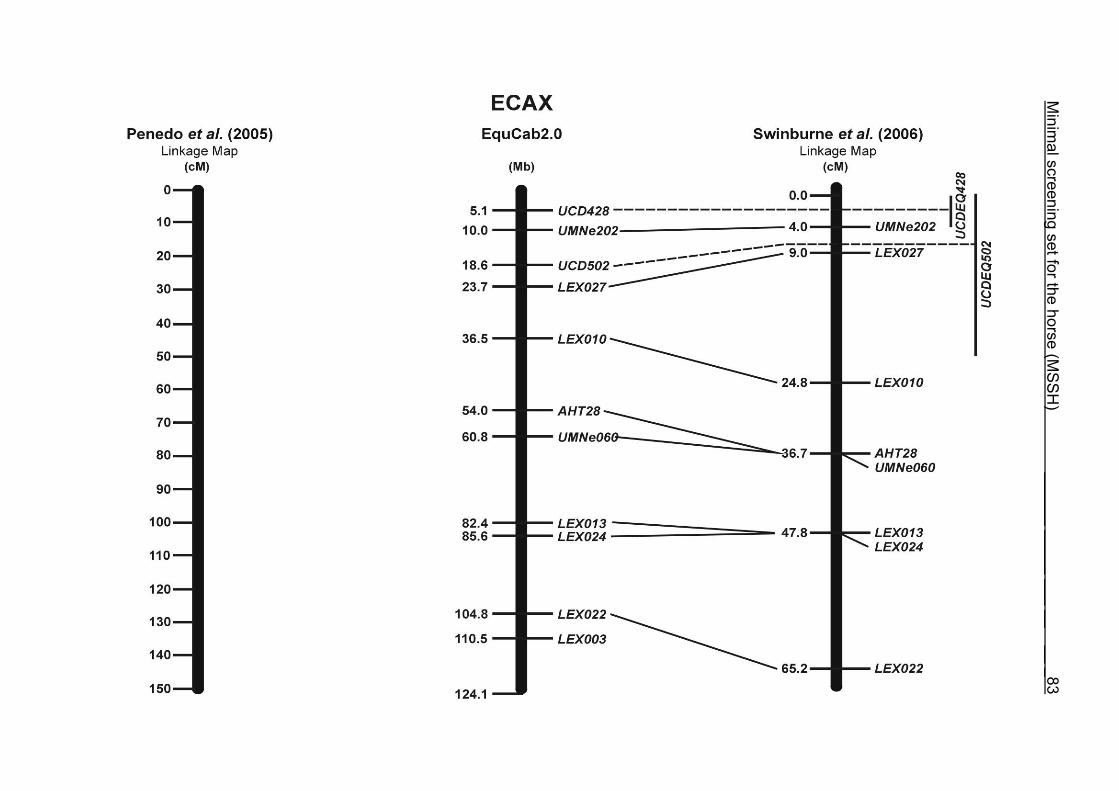
Minim
al screening set for the horse (MS
SH
) ______ _____ ___ __ __ _83

84_________________________________________________________________
CHAPTER 3
Identification of 21 781 equine microsatellites on the horse genome assembly 2.0
E. H. Mittmann, J. Wrede, J. Pook and O. Distl
Institute for Animal Breeding and Genetics, University of Veterinary Medicine
Hannover, Foundation, Germany
Animal Genetics
Epub DOI 10.1111/j.1365-2052.2009.01979.x
86________________ Identification of 21 781 equine microsatellites on EquCab2.0
3 Identification of 21 781 equine microsatellites on the horse genome assembly 2.0
3.1 Source/description We identified a total of 21,781 equine microsatellites on the second horse genome
assembly EquCab2.0 (Table S1) which can be accessed at http://www.tiho-
hannover.de/einricht/zucht/index.htm. These microsatellites cover the horse genome
with a mean distance of 112 kb and a median distance of 75 kb (Table2). Most of the
repeat motifs (72 %) were dinucleotide repeats of AC, GT and AT with frequencies of
26.4%, 26.0% and 19.4%. Trinucleotide repeats represented 3.8%, tetranucleotide
repeats 17.6% and pentanucleotide repeats 1.6% of all simple sequence repeats
(SSR). We identified adjacent SINE and LINE elements and the corresponding gene
ID for 5549 (25.5%) intragenic microsatellites. Primer pairs were designed for 12 246
microsatellites after masking repetitive elements.
3.2 Identification of microsatellites and their assignment on the horse genome
Permutation sequences including all repeat motifs of two to five bases with at least 15 and up to 30 repeats were generated for the search of EquCab2.0. We then employed a stand-alone BLAST with the Blastn mode (ftp://ftp.ncbi.nih.gov/blast/executable/) with maximum e-values of e-6 to e-10 for alignment of the permutated SSRs with di-, tri-, tetra-, or pentanucleotide sequences. The maximum number of repeat motifs was set at 30 for two to four bases and at 15 for five bases. 3.3 PCR-primers
Primer pairs were designed using PRIMER3 (version 0.4.0, http://frodo.wi.mit.edu/cgi-bin/primer3/primer3_www.cgi) after masking repetitive elements using the REPEATMASKER (version3.1.5, available at http://repeatmasker.org). Using the N-masked sequences, we could design primer pairs for 12 114 microsatellites (55.8%). For an additional 1810 microsatellites, primer pairs (8.3%) were designed using the small-masked sequences.
Identification of 21 781 equine microsatellites on EquCab2.0 87
3.4 Comments Most of the previously published microsatellites (n=4553) could be confirmed through
a BLAT search (http://genome.ucsc.edu/cgi-bin/hgBlat) on EquCab2.0 and only 97
microsatellites were assigned to ChrUn. The number of microsatellites matching with
our set was 2240. The reason why we did not retrieve all of these 4553
microsatellites was due to compound repeat motifs with a length below our threshold
of 15 repeats. Repeat motifs with less than 15 repeats were omitted as a result of
their expected lower content of polymorphisms according to the previous studies by
Karlskov-Mortensen et al.1.2 The low number of repeat motifs with more than two
base pairs is in agreement with reports for porcine microsatellites.1.2 This new
resource of microsatellites may be useful in linkage studies, for QTL and candidate
gene approaches using gene-associated markers and refinement of QTL.
3.5 Acknowledgements The authors thank the German Research Community, Bonn (DI 333/12-2) for the
financial support.
3.6 References Karlskov-Mortensen P., Hu Z. L., Gorodkin J., Reecy J. M. & Fredholm M. (2007)
Identification of 10882 porcine microsatellite sequences and virtual mapping of
4528 of these sequences. Animal Genetics 38, 401-5.
Karlskov-Mortensen P., Hu Z.L., Reecy J.M. & Fredholm M. (2008) A data resource
of 838 porcine microsatellite sequences with repeat motifs of three to six bases.
Animal Genetics 39, 85-6.
88________________ Identification of 21 781 equine microsatellites on EquCab2.0
3.7 Table S1
The Table S1 is available at http://www.tiho-hannover.de/einricht/zucht/mol_gen/ms_horse/horse_ms.htm as a compressed exel file which is updated regularly. Due to the size of this table we refrain from printing out the data. The following data can be found in Table S1:
approximately 800 base pairs of the sequence surrounding the microsatellite the chromosome (ECA) the marker name (Marker) the Accession number (Acc.No.) with the link to the NCBI Nucleotide database the repeat motif the marker length in bp for uniform and for compound repeat motifs the BLAST position of the microsatellite on EquCab2.0 in bp the annealing temperature (Ta ) the GC content (GC%) the sequence of the forward and reverse primer the PCR product size, the position of the microsatellite in the PCR product sequence in bp the PCR product sequence the information if SINE or LINE elements occur in the sequence the Ensembl gene ID and/or the gene name if the marker is located within
and if available - the number of alleles (Alleles) the observed heterozygosity (HET) the polymorphism information content (PIC) the number of horses genotyped (n) the horse breed
3.8 Supplementary Figures 1-32
These figures show the distribution of the newly identified microsatellites across each equine chromosome per megabase and depending on the size of the chromosome per 5 Mb or per 10 Mb. The position of the centromere is indicated to explain the decrease of microsatellites around this position.
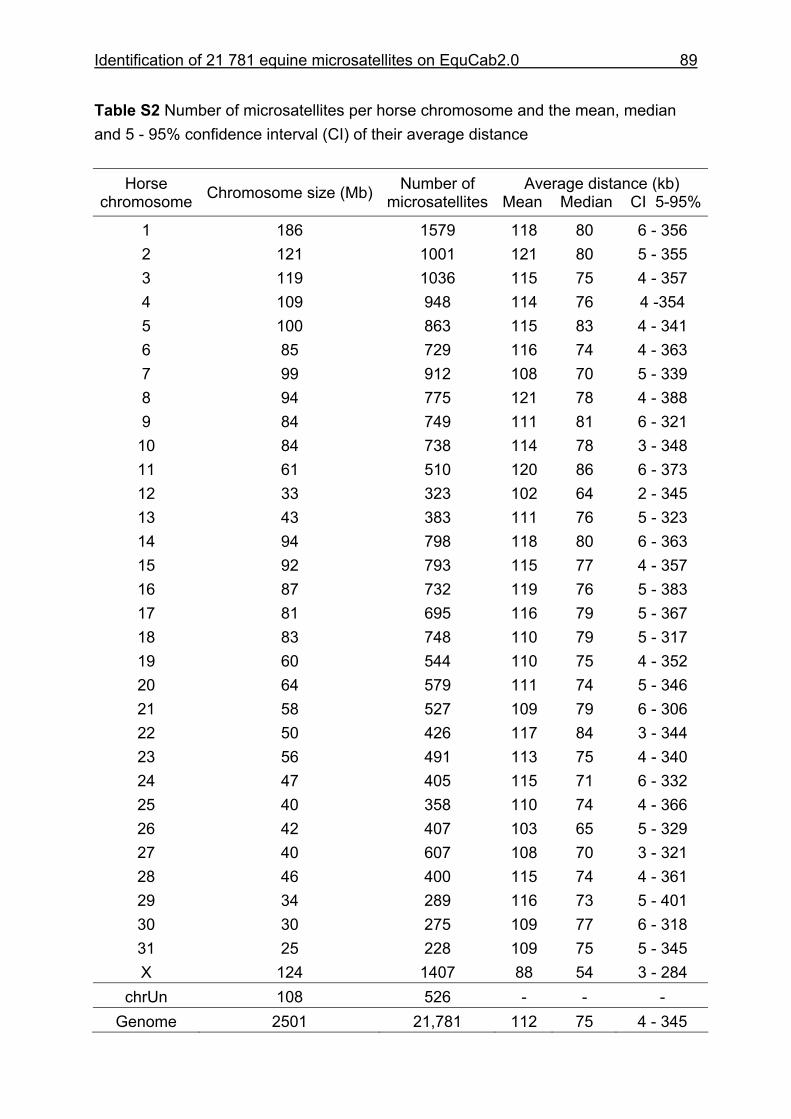
Identification of 21 781 equine microsatellites on EquCab2.0 89
Table S2 Number of microsatellites per horse chromosome and the mean, median and 5 - 95% confidence interval (CI) of their average distance
Horse chromosome Chromosome size (Mb) Number of
microsatellitesAverage distance (kb)
Mean Median CI 5-95%
1 186 1579 118 80 6 - 356 2 121 1001 121 80 5 - 355 3 119 1036 115 75 4 - 357 4 109 948 114 76 4 -354 5 100 863 115 83 4 - 341 6 85 729 116 74 4 - 363 7 99 912 108 70 5 - 339 8 94 775 121 78 4 - 388 9 84 749 111 81 6 - 321
10 84 738 114 78 3 - 348 11 61 510 120 86 6 - 373 12 33 323 102 64 2 - 345 13 43 383 111 76 5 - 323 14 94 798 118 80 6 - 363 15 92 793 115 77 4 - 357 16 87 732 119 76 5 - 383 17 81 695 116 79 5 - 367 18 83 748 110 79 5 - 317 19 60 544 110 75 4 - 352 20 64 579 111 74 5 - 346 21 58 527 109 79 6 - 306 22 50 426 117 84 3 - 344 23 56 491 113 75 4 - 340 24 47 405 115 71 6 - 332 25 40 358 110 74 4 - 366 26 42 407 103 65 5 - 329 27 40 607 108 70 3 - 321 28 46 400 115 74 4 - 361 29 34 289 116 73 5 - 401 30 30 275 109 77 6 - 318 31 25 228 109 75 5 - 345 X 124 1407 88 54 3 - 284
chrUn 108 526 - - - Genome 2501 21,781 112 75 4 - 345
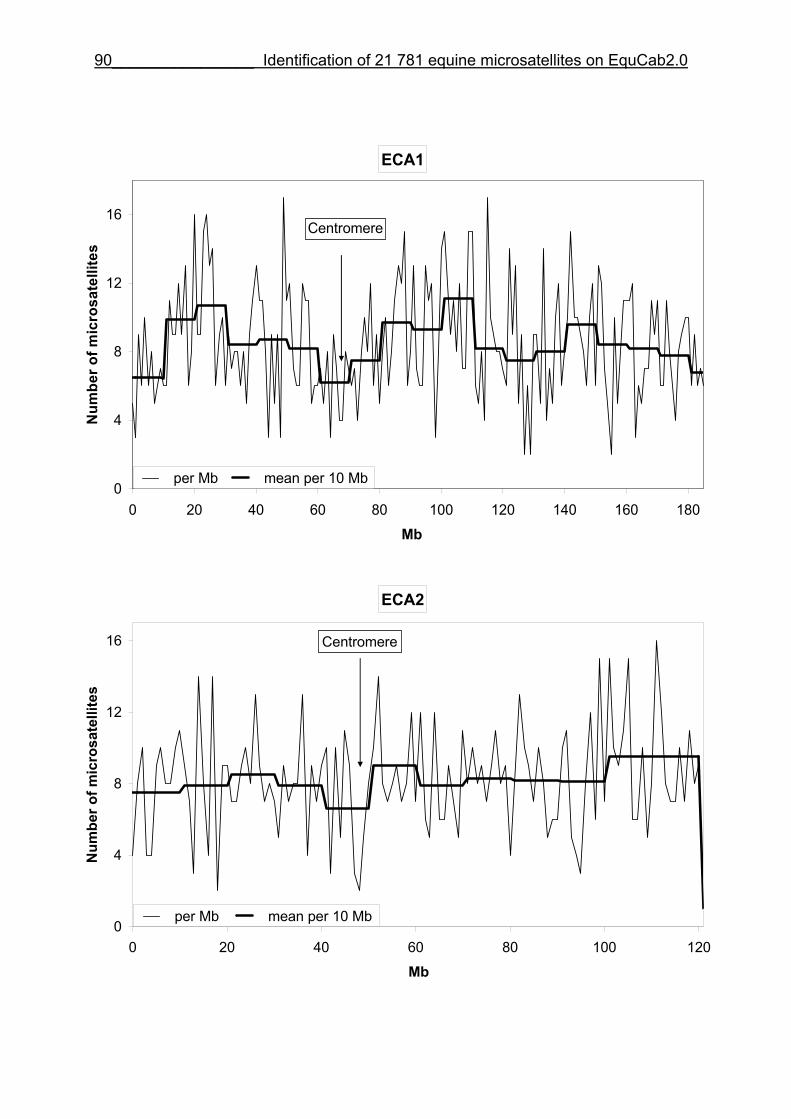
90________________ Identification of 21 781 equine microsatellites on EquCab2.0
ECA1
0
4
8
12
16
0 20 40 60 80 100 120 140 160 180
Mb
Num
ber o
f mic
rosa
telli
tes
per Mb mean per 10 Mb
Centromere
ECA2
0
4
8
12
16
0 20 40 60 80 100
Mb
Num
ber o
f mic
rosa
telli
tes
120
per Mb mean per 10 Mb
Centromere
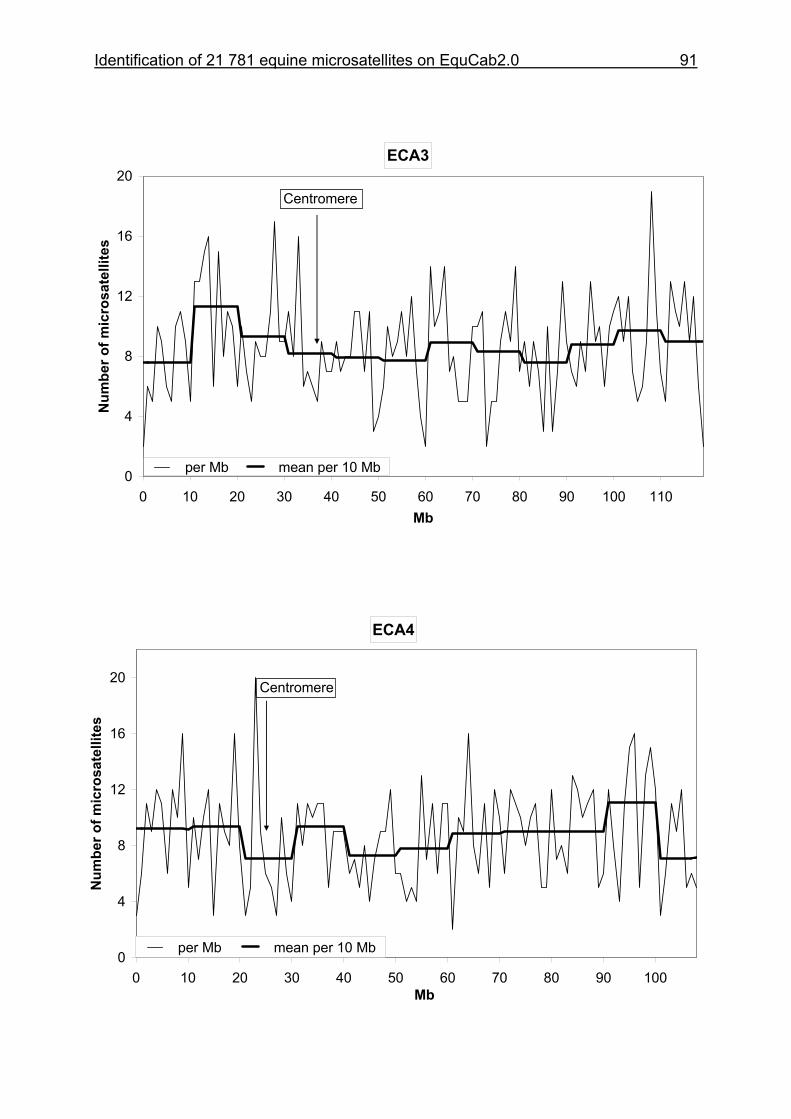
Identification of 21 781 equine microsatellites on EquCab2.0 91
ECA3
0
4
8
12
16
20
0 10 20 30 40 50 60 70 80 90 100 110Mb
Num
ber o
f mic
rosa
telli
tes
per Mb mean per 10 Mb
Centromere
ECA4
0
4
8
12
16
20
0 10 20 30 40 50 60 70 80 90 100Mb
Num
ber o
f mic
rosa
telli
tes
per Mb mean per 10 Mb
Centromere
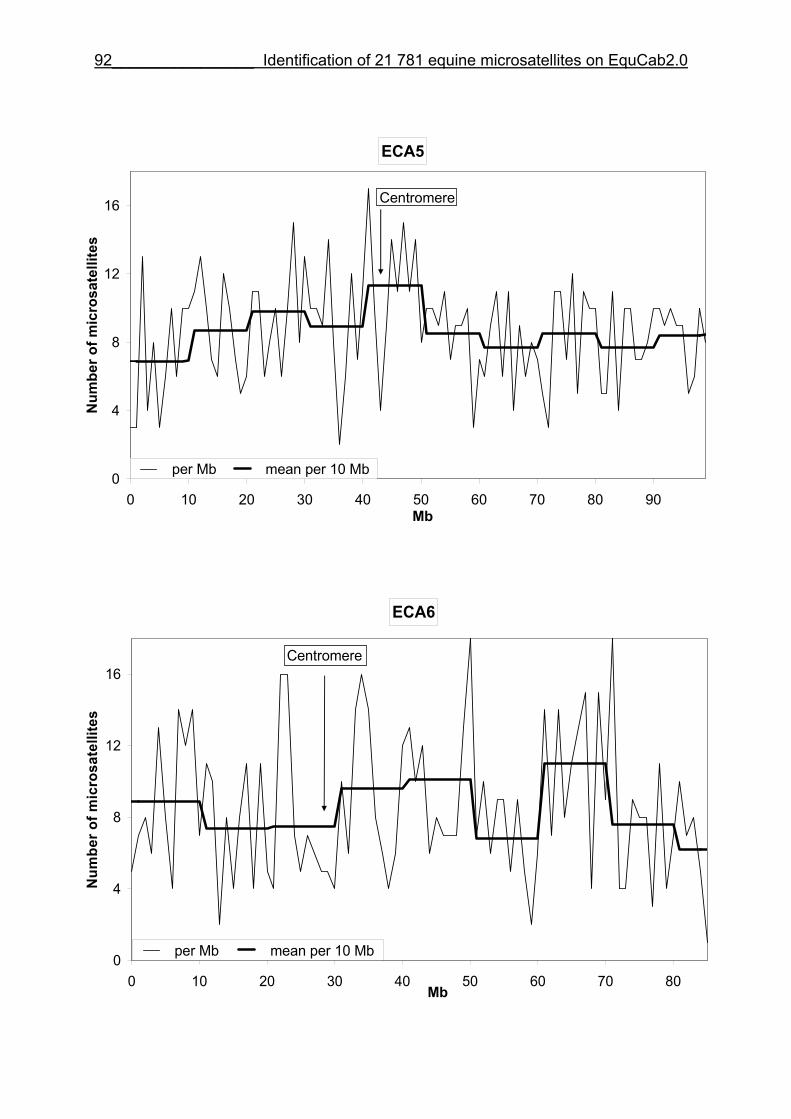
92________________ Identification of 21 781 equine microsatellites on EquCab2.0
ECA5
0
4
8
12
16
0 10 20 30 40 50 60 70 80 90Mb
Num
ber o
f mic
rosa
telli
tes
per Mb mean per 10 Mb
Centromere
ECA6
0
4
8
12
16
0 10 20 30 40 50 60 70 80Mb
Num
ber o
f mic
rosa
telli
tes
per Mb mean per 10 Mb
Centromere
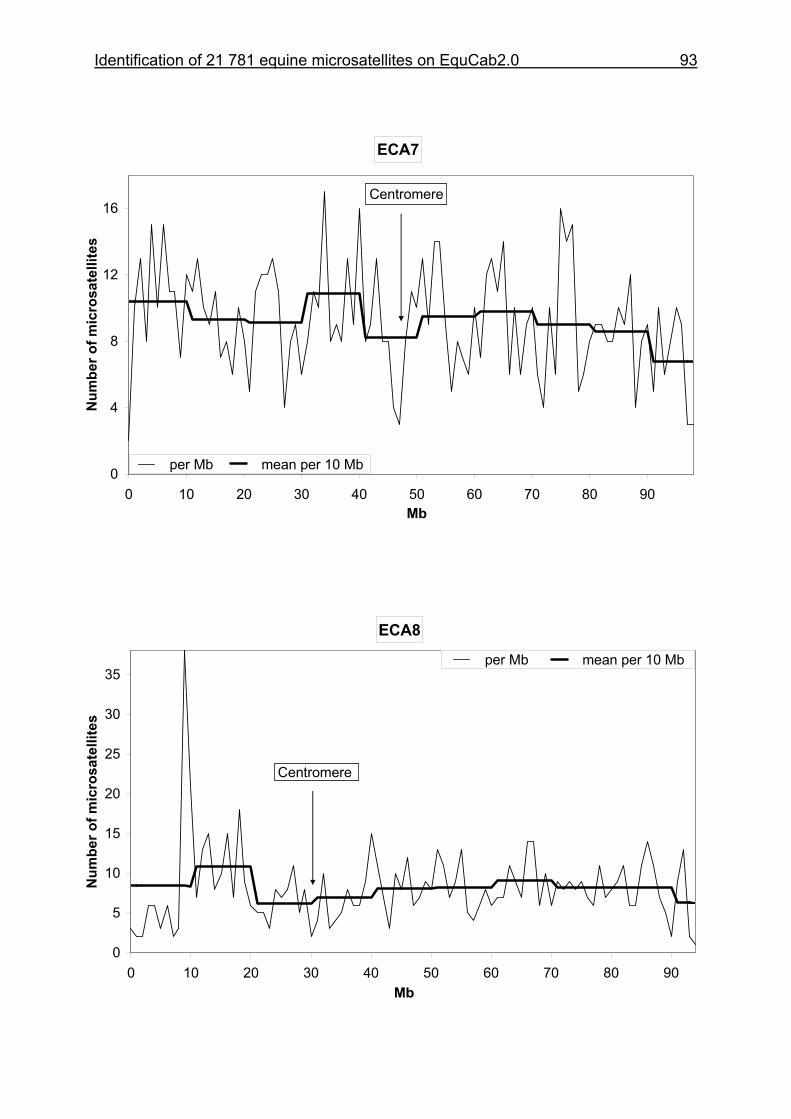
Identification of 21 781 equine microsatellites on EquCab2.0 93
ECA7
0
4
8
12
16
0 10 20 30 40 50 60 70 80 90Mb
Num
ber o
f mic
rosa
telli
tes
per Mb mean per 10 Mb
Centromere
ECA8
0
5
10
15
20
25
30
35
0 10 20 30 40 50 60 70 80 90Mb
Num
ber o
f mic
rosa
telli
tes
per Mb mean per 10 Mb
Centromere
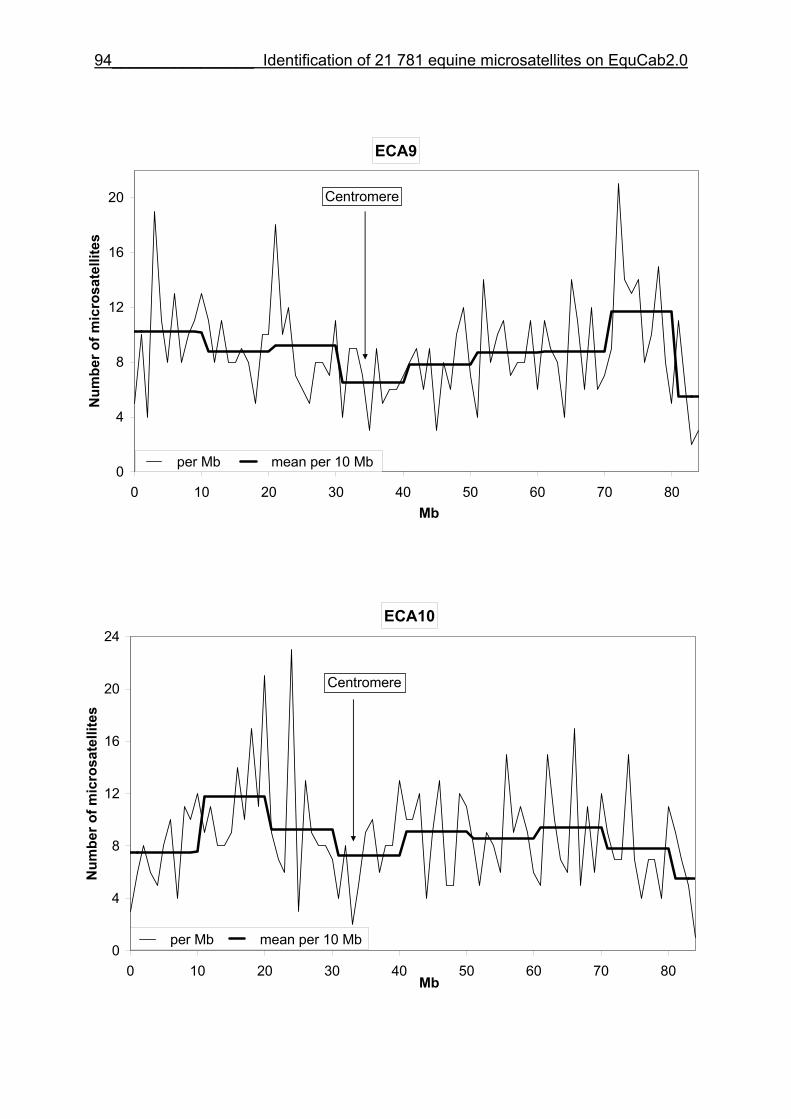
94________________ Identification of 21 781 equine microsatellites on EquCab2.0
ECA9
0
4
8
12
16
20
0 10 20 30 40 50 60 70 80Mb
Num
ber o
f mic
rosa
telli
tes
per Mb mean per 10 Mb
Centromere
ECA10
0
4
8
12
16
20
24
0 10 20 30 40 50 60 70 80Mb
Num
ber o
f mic
rosa
telli
tes
per Mb mean per 10 Mb
Centromere
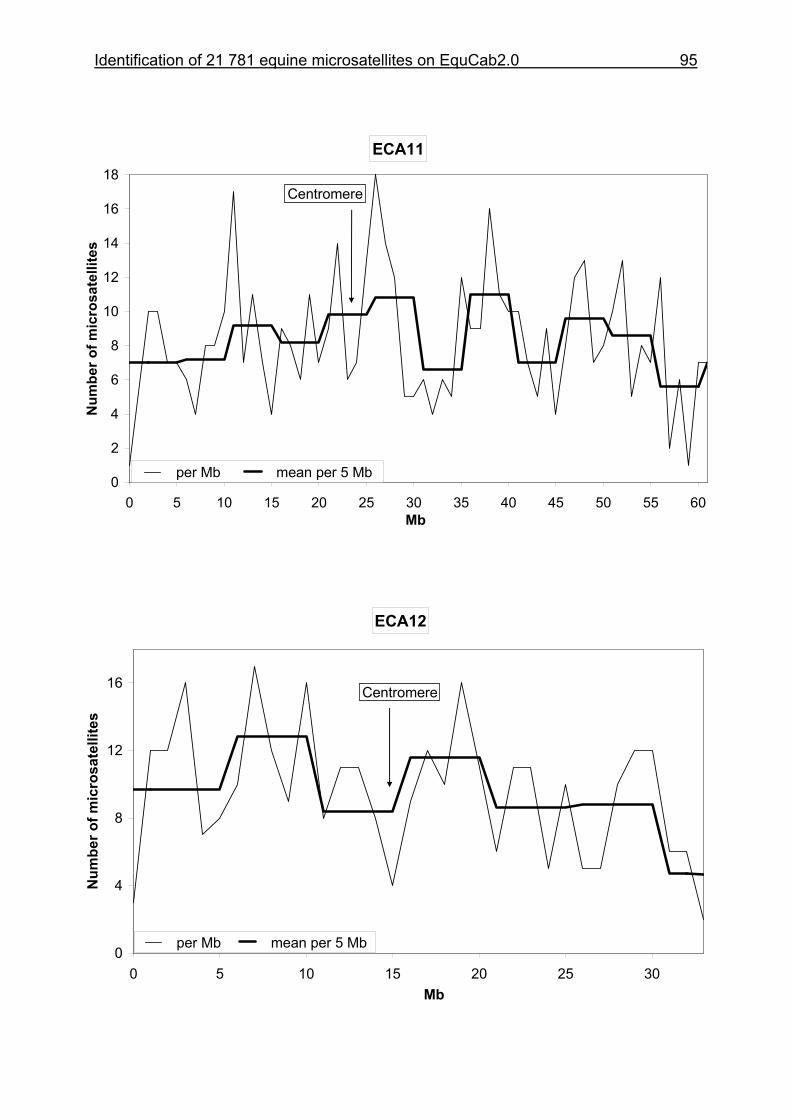
Identification of 21 781 equine microsatellites on EquCab2.0 95
ECA11
0
2
4
6
8
10
12
14
16
18
0 5 10 15 20 25 30 35 40 45 50 55 60Mb
Num
ber o
f mic
rosa
telli
tes
per Mb mean per 5 Mb
Centromere
ECA12
0
4
8
12
16
0 5 10 15 20 25 30Mb
Num
ber o
f mic
rosa
telli
tes
per Mb mean per 5 Mb
Centromere
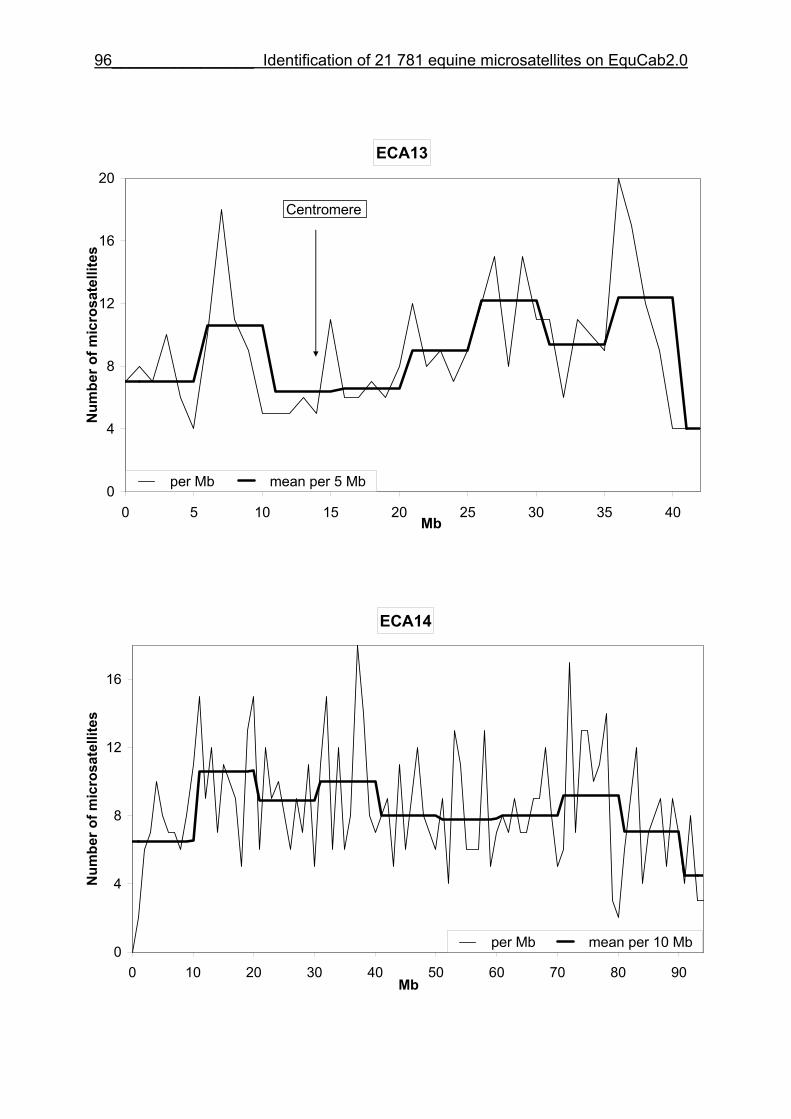
96________________ Identification of 21 781 equine microsatellites on EquCab2.0
ECA13
0
4
8
12
16
20
0 5 10 15 20 25 30 35 40Mb
Num
ber o
f mic
rosa
telli
tes
per Mb mean per 5 Mb
Centromere
ECA14
0
4
8
12
16
0 10 20 30 40 50 60 70 80 90Mb
Num
ber o
f mic
rosa
telli
tes
per Mb mean per 10 Mb
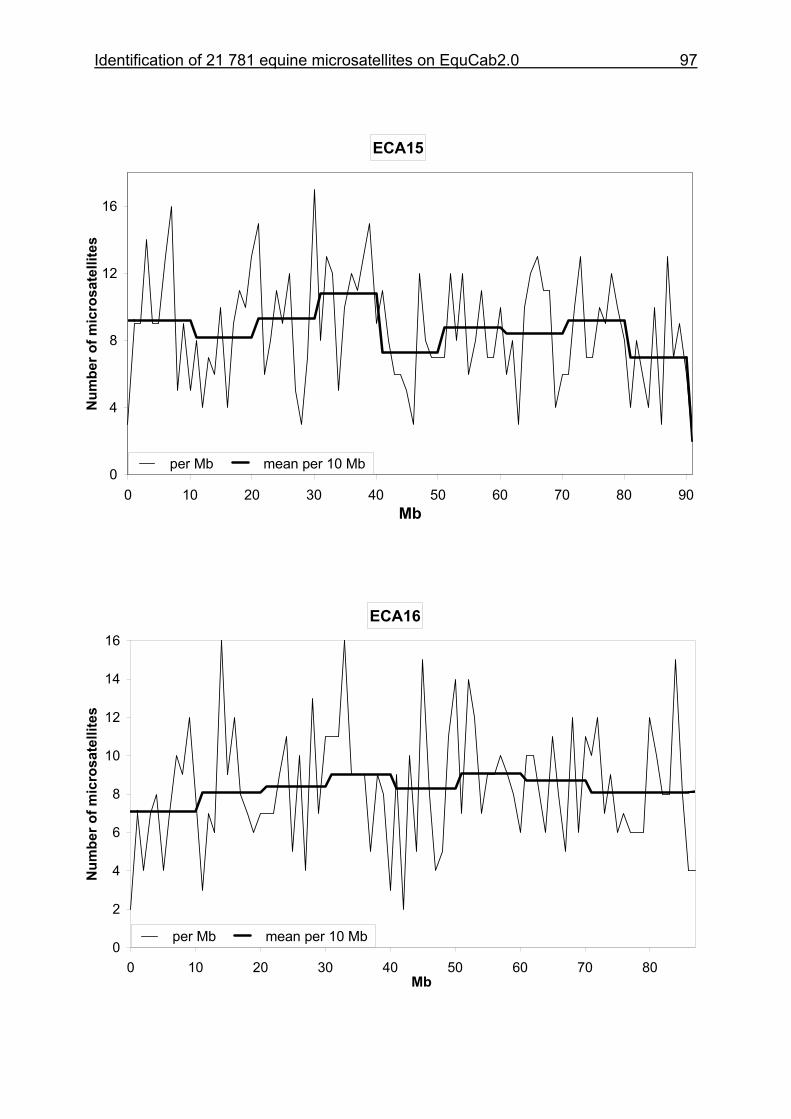
Identification of 21 781 equine microsatellites on EquCab2.0 97
ECA15
0
4
8
12
16
0 10 20 30 40 50 60 70 80 90Mb
Num
ber o
f mic
rosa
telli
tes
per Mb mean per 10 Mb
ECA16
0
2
4
6
8
10
12
14
16
0 10 20 30 40 50 60 70 80Mb
Num
ber o
f mic
rosa
telli
tes
per Mb mean per 10 Mb
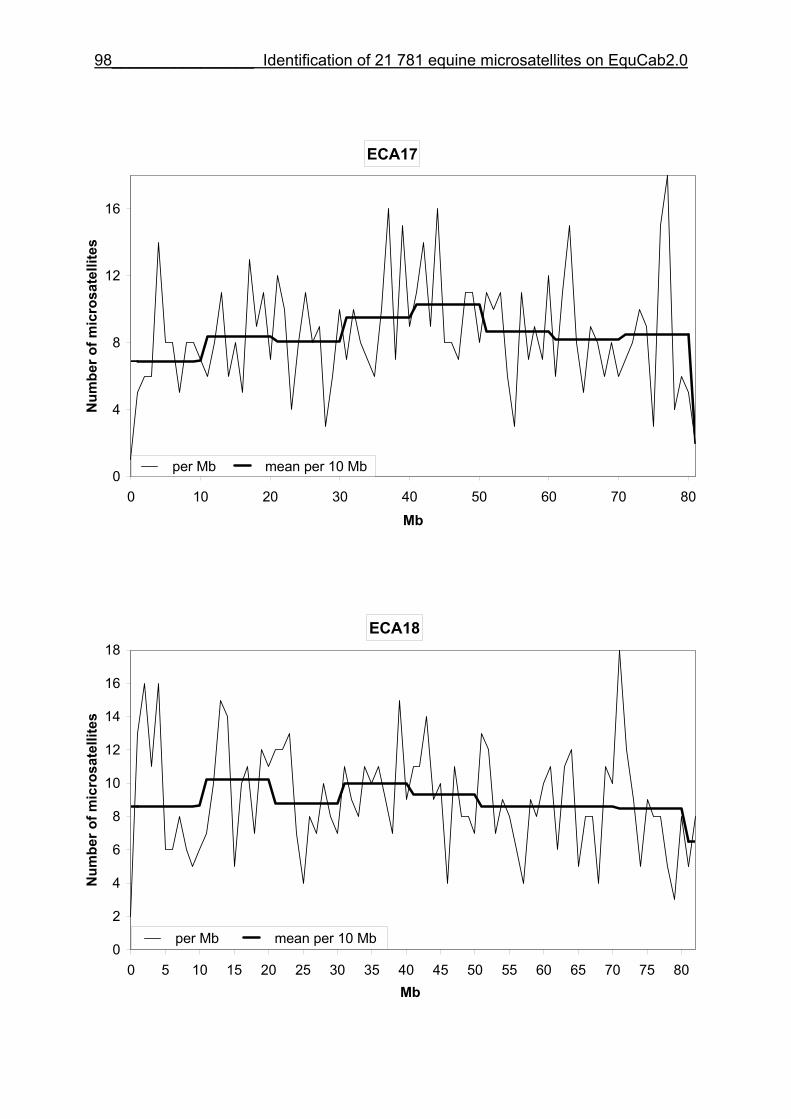
98________________ Identification of 21 781 equine microsatellites on EquCab2.0
ECA17
0
4
8
12
16
0 10 20 30 40 50 60 70 8
Mb
Num
ber o
f mic
rosa
telli
tes
0
per Mb mean per 10 Mb
ECA18
0
2
4
6
8
10
12
14
16
18
0 5 10 15 20 25 30 35 40 45 50 55 60 65 70 75 80Mb
Num
ber o
f mic
rosa
telli
tes
per Mb mean per 10 Mb
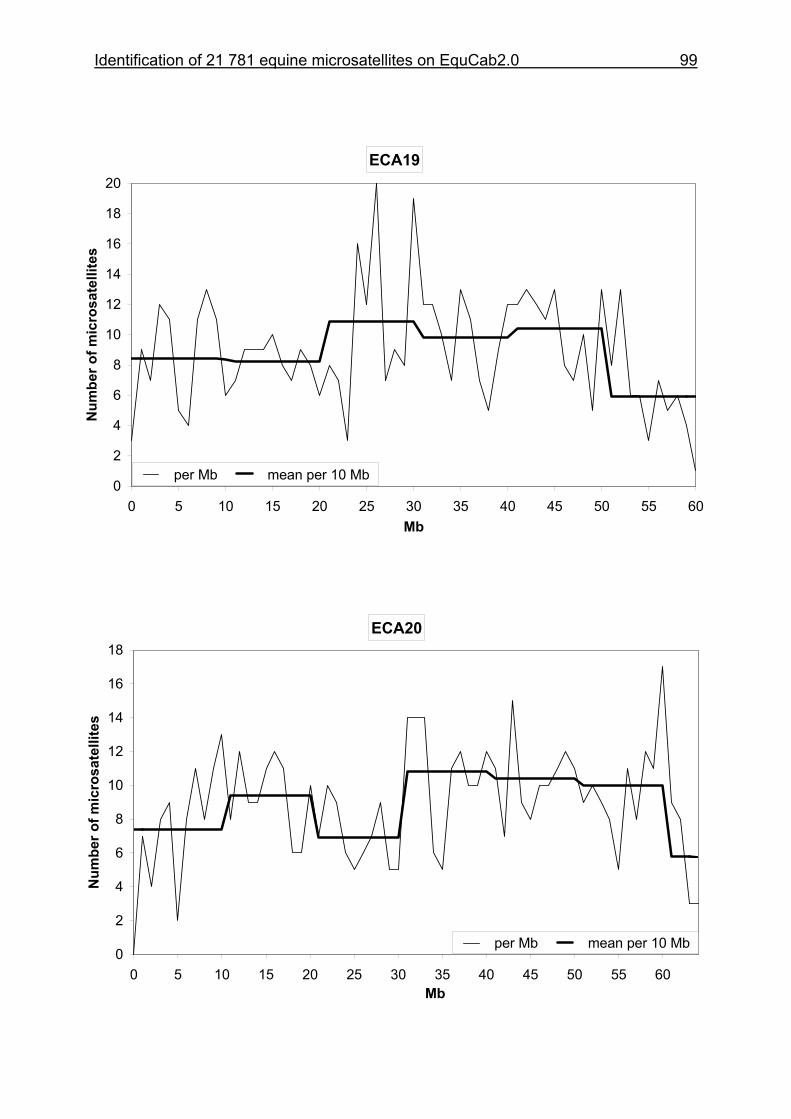
Identification of 21 781 equine microsatellites on EquCab2.0 99
ECA19
0
2
4
6
8
10
12
14
16
18
20
0 5 10 15 20 25 30 35 40 45 50 55 60Mb
Num
ber o
f mic
rosa
telli
tes
per Mb mean per 10 Mb
ECA20
0
2
4
6
8
10
12
14
16
18
0 5 10 15 20 25 30 35 40 45 50 55 60Mb
Num
ber o
f mic
rosa
telli
tes
per Mb mean per 10 Mb
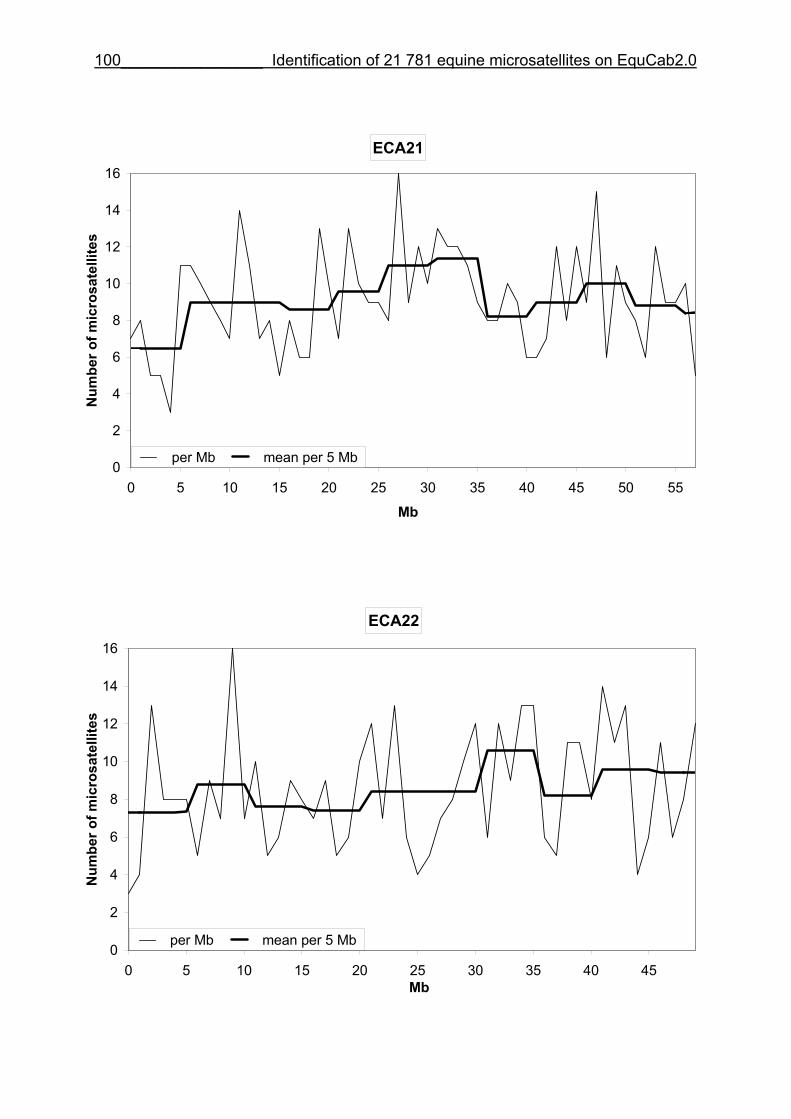
100________________ Identification of 21 781 equine microsatellites on EquCab2.0
ECA21
0
2
4
6
8
10
12
14
16
0 5 10 15 20 25 30 35 40 45 50 55
Mb
Num
ber o
f mic
rosa
telli
tes
per Mb mean per 5 Mb
ECA22
0
2
4
6
8
10
12
14
16
0 5 10 15 20 25 30 35 40 45Mb
Num
ber o
f mic
rosa
telli
tes
per Mb mean per 5 Mb
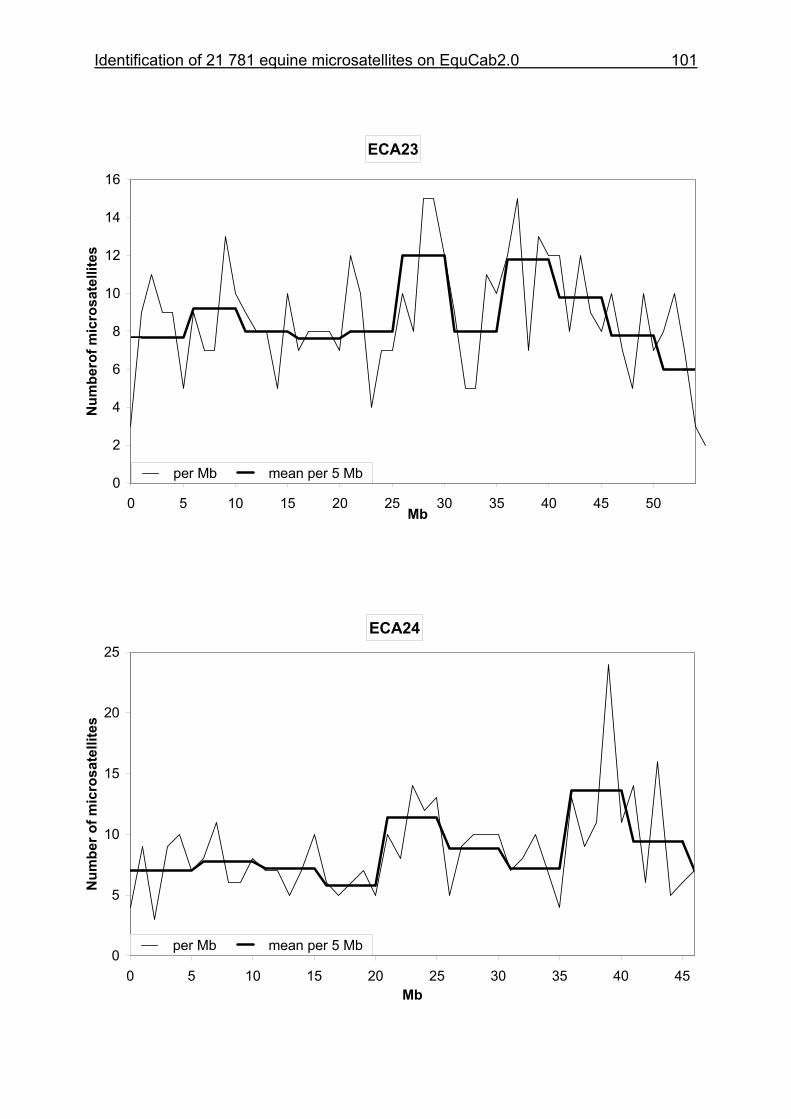
Identification of 21 781 equine microsatellites on EquCab2.0 101
ECA23
0
2
4
6
8
10
12
14
16
0 5 10 15 20 25 30 35 40 45 50Mb
Num
bero
f mic
rosa
telli
tes
per Mb mean per 5 Mb
ECA24
0
5
10
15
20
25
0 5 10 15 20 25 30 35 40 45Mb
Num
ber o
f mic
rosa
telli
tes
per Mb mean per 5 Mb
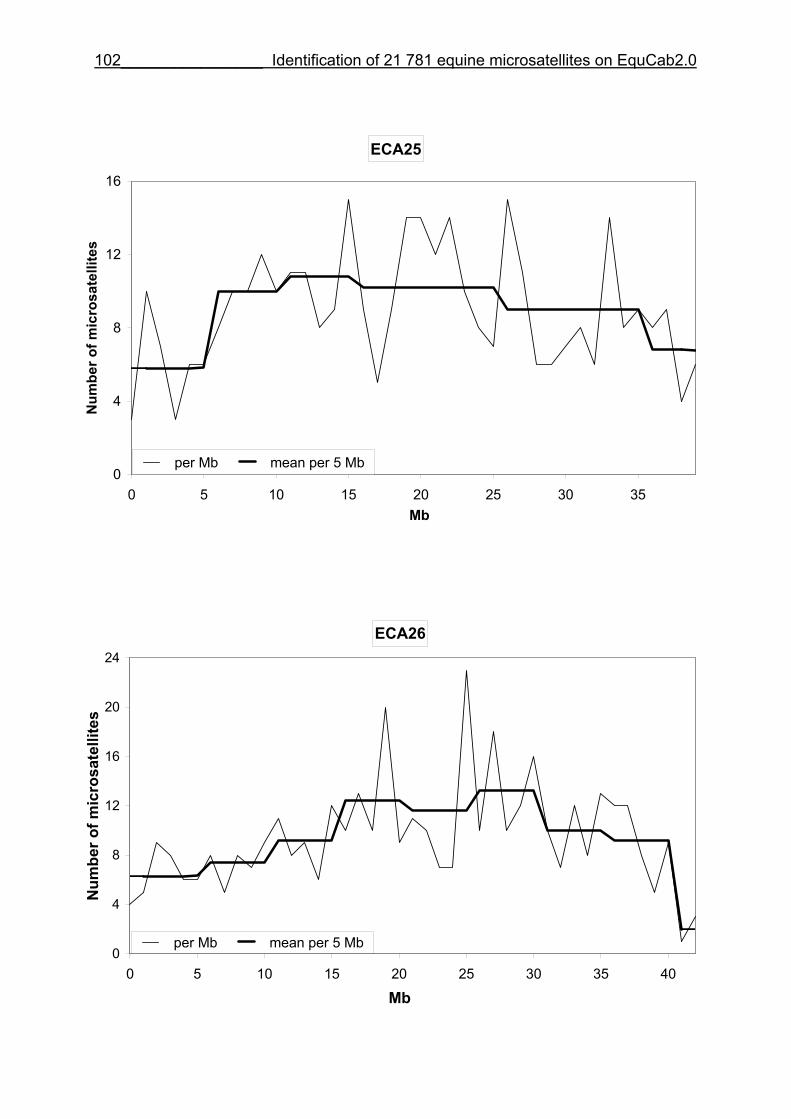
102________________ Identification of 21 781 equine microsatellites on EquCab2.0
ECA25
0
4
8
12
16
0 5 10 15 20 25 30 35Mb
Num
ber o
f mic
rosa
telli
tes
per Mb mean per 5 Mb
ECA26
0
4
8
12
16
20
24
0 5 10 15 20 25 30 35 40
Mb
Num
ber o
f mic
rosa
telli
tes
per Mb mean per 5 Mb
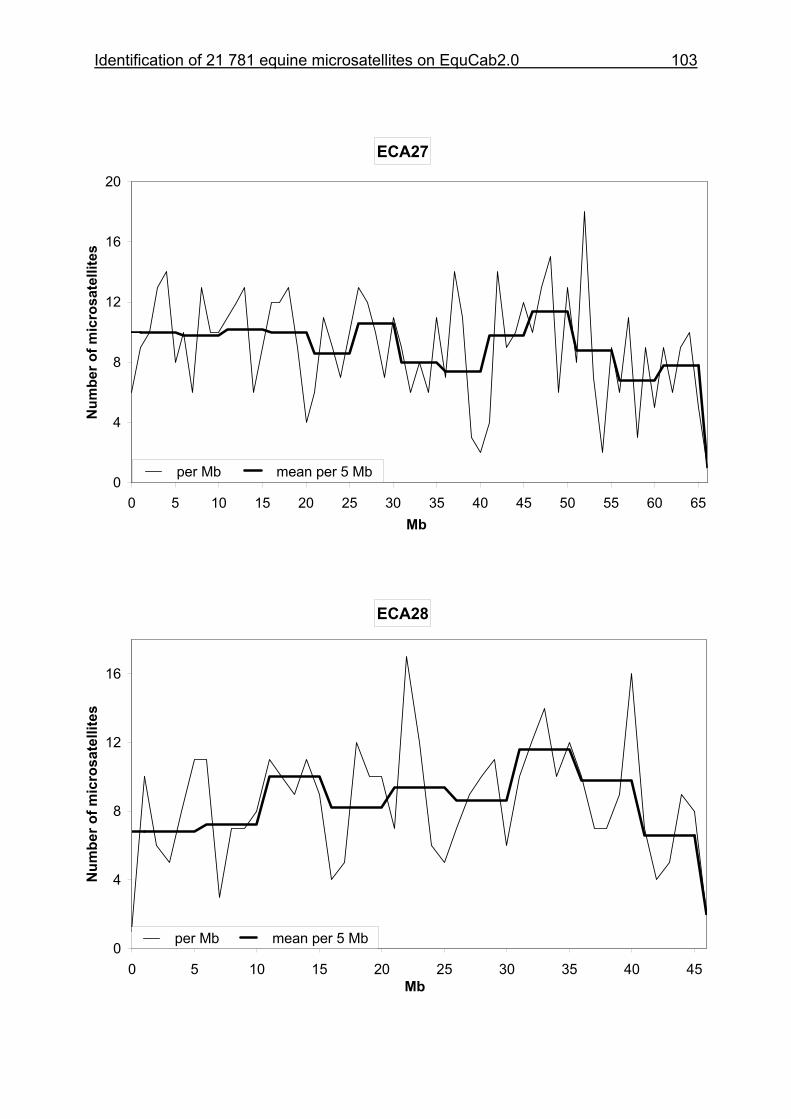
Identification of 21 781 equine microsatellites on EquCab2.0 103
ECA27
0
4
8
12
16
20
0 5 10 15 20 25 30 35 40 45 50 55 60 65Mb
Num
ber o
f mic
rosa
telli
tes
per Mb mean per 5 Mb
ECA28
0
4
8
12
16
0 5 10 15 20 25 30 35 40 45Mb
Num
ber o
f mic
rosa
telli
tes
per Mb mean per 5 Mb
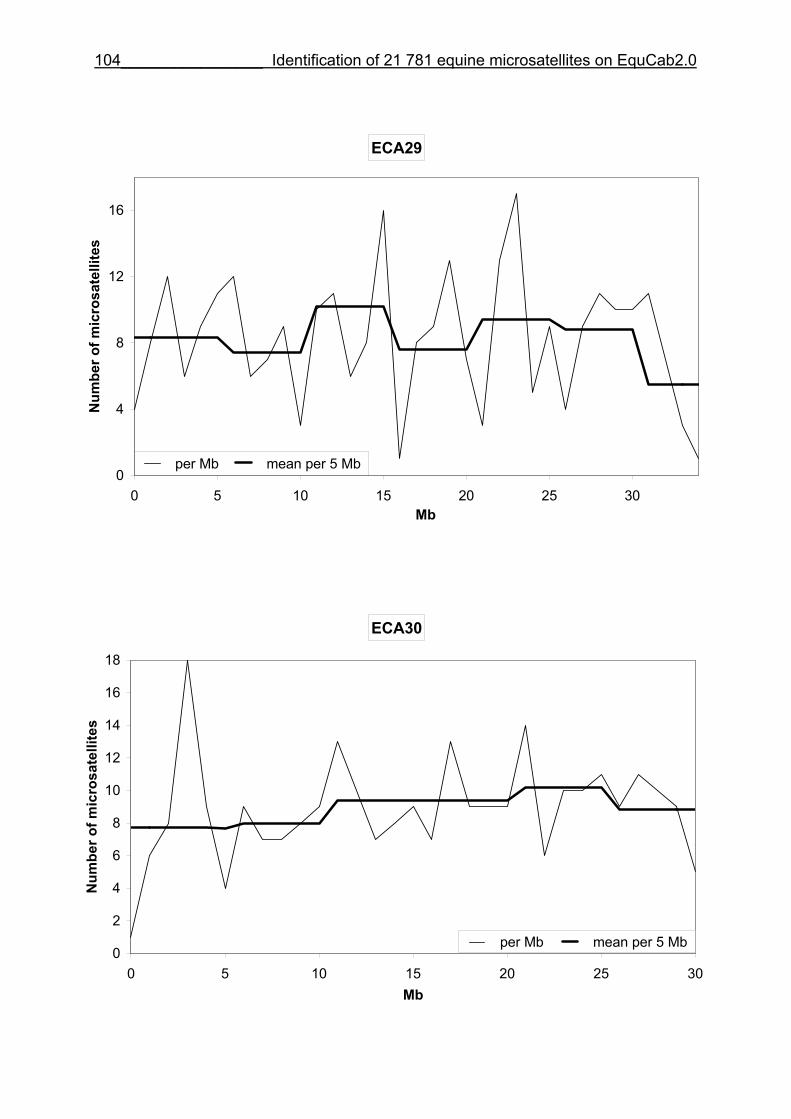
104________________ Identification of 21 781 equine microsatellites on EquCab2.0
ECA29
0
4
8
12
16
0 5 10 15 20 25 30Mb
Num
ber o
f mic
rosa
telli
tes
per Mb mean per 5 Mb
ECA30
0
2
4
6
8
10
12
14
16
18
0 5 10 15 20 25 30Mb
Num
ber o
f mic
rosa
telli
tes
per Mb mean per 5 Mb
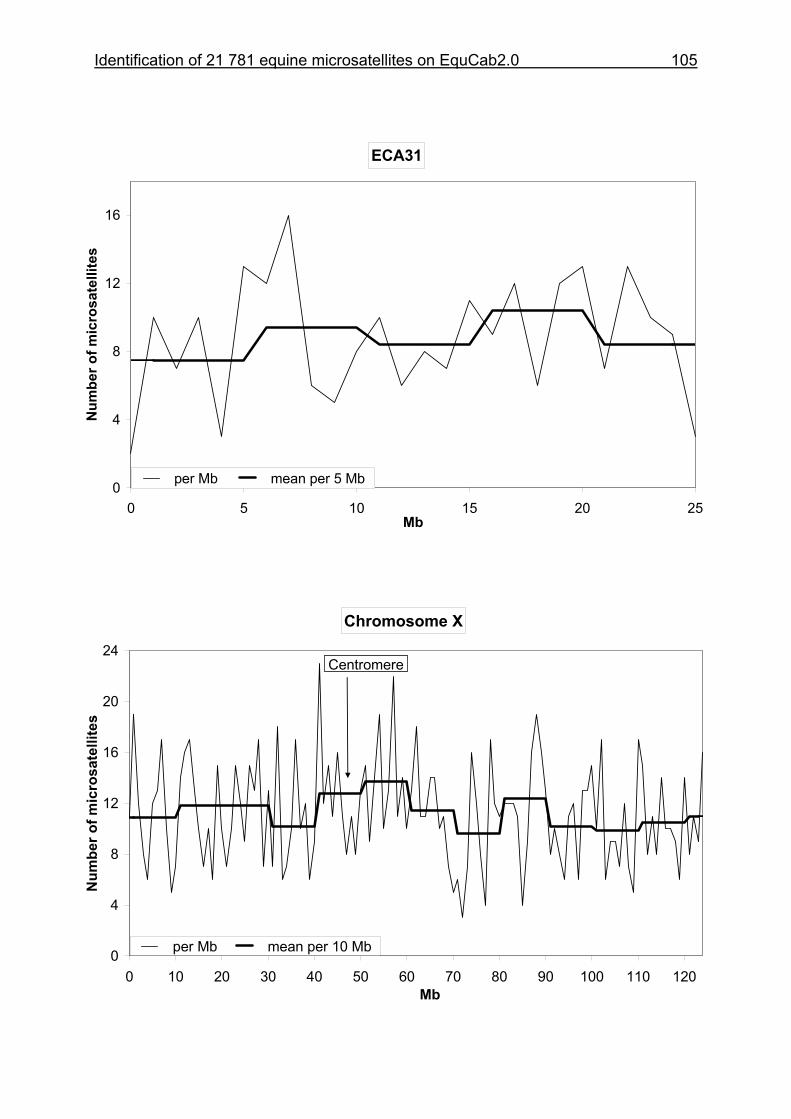
Identification of 21 781 equine microsatellites on EquCab2.0 105
ECA31
0
4
8
12
16
0 5 10 15 20 25Mb
Num
ber o
f mic
rosa
telli
tes
per Mb mean per 5 Mb
Chromosome X
0
4
8
12
16
20
24
0 10 20 30 40 50 60 70 80 90 100 110 120Mb
Num
ber o
f mic
rosa
telli
tes
per Mb mean per 10 Mb
Centromere

106________________
CHAPTER 4
Whole genome scan identifies quantitative trait loci for chronic pastern dermatitis in German draft horses
Evelyn Henrike Mittmann, Stefanie Mömke and Ottmar Distl
Institute for Animal Breeding and Genetics, University of Veterinary Medicine
Hannover, Foundation
Bünteweg 17p, 30559 Hannover, Germany
Submitted for publication
108 Genome scan for chronic pastern dermatitis
4 Whole genome scan identifies quantitative trait loci for chronic pastern dermatitis in German draft horses
4.1 Summary
Chronic pastern dermatitis (CPD), also known as chronic progressive lymphedema
(CPL), is a skin disease that affects draft horses. This disease causes painful lower
leg swelling, nodule formation and skin ulceration interfering with movement. The aim
of this whole genome scan was to identify quantitative trait loci (QTL) for CPD in
German draft horses. We recorded clinical data in 917 German draft horses for CPD
and collected blood samples from these horses. Out of these 917 horses, 31 paternal
half-sib families with 378 horses from the breeds Rhenish German, Schleswig,
Saxon-Thuringian and South German were chosen for genotyping. Each half-sib
family was constituted by only one draft horse breed. Genotyping was done for 318
polymorphic microsatellites evenly distributed on all equine autosomes and the X
chromosome with a mean distance of 7.5 Mb. An across-breed multipoint linkage
analysis revealed chromosome-wide significant QTL on horse chromosomes (ECA)
1, 9, 16 and 17. Analyses by breed confirmed the QTL on ECA1 in South German
and the QTL on ECA 9, 16 and 17 in Saxon-Thuringian draft horses. For the Rhenish
German and Schleswig draft horses, further QTL on ECA4 and 10 and for the South
German draft horses an additional QTL on ECA7 were found. This is the first whole
genome scan for CPD in draft horses and it is an important step towards the
identification of candidate genes.
Key Words: chronic pastern dermatitis, chronic progressive lymphedema, draft
horses, genome scan, quantitative trait loci
4.2 Introduction
Chronic pastern dermatitis (CPD), also known as chronic progressive lymphedema
(CPL), is a common inflammatory skin disease in draft horses, particularly in heavy
and strongly feathered breeds. CPD has been described in many heavy draft horse
Genome scan for chronic pastern dermatitis 109
breeds across Europe for centuries. This condition is characterized by progressive
painful swelling, hyperkeratosis, nodule formation and fibrosis of the distal limbs (De
Cock et al. 2003). First signs of CPD can be observed at an early age. Since there is
no successful treatment, the disease progresses throughout the horse’s life with
severe symptoms in later life. CPD often leads to a heavy disfigurement and a
pronounced discomfort that interferes with movement. Severely affected horses must
be euthanized (De Cock et al. 2003, 2006, Wallraf et al. 2004a).
CPD starts as a diffuse inflammatory dermatitis with the earliest lesions found at the
pasterns that develop from scaling into hyperkeratotic and hyperplastic plaque-like
lesions (crusts) (Geburek et al. 2005). These early signs of CPD may often go
unnoticed because of the long fetlock hairs. The papular lesions can rapidly coalesce
and produce large areas of malodorous ulceration and suppuration. Affected horses
are susceptible to secondary infections by mites and bacteria. As a result, the lower
leg enlargement becomes permanent and shows the distinctive nodules and
verrucous skin lesions that can extend and encircle the entire leg.
Histopathological examination of skin biopsies from 37 CPD-affected draft horses
from several breeds showed epidermal hyperplasia and hyperkeratosis as the
predominant pathological characteristics in all horses (Geburek et al. 2005).
Depending on the stage of CPD, an orthokeratotic and parakeratotic hyperkeratosis
and acanthosis of the epithelium could be found. All horses examined showed
perivascular dermatitis dominated by T lymphocytes with an associated increase of
MHC class II-positive dendritic-like cells. Changes in the immuno-histo-chemical
labelling for cytokeratines indicated abnormal differentiation of keratinocytes. Similar
changes in the expression of cytokeratins have been seen in human skin diseases
like psoriasis (Geburek et al. 2005).
The aetiology of CPD is unknown but genetic factors play a significant role in this
disease (Wallraf et al. 2004b, Schäper 1950). The heritability for chronic pastern
dermatitis across the different German draft horse breeds was h2=0.21. Heritability
estimates within breeds were at h2=0.98 in the Rhenish German, h2=0.82 in the
Schleswig, h2=0.20 in the Saxon-Thuringian and h2=0.14 in the South German draft
horses (Wallraf et al. 2004b). Environmental factors such as exposure to moisture
and poor housing conditions may exacerbate clinical signs and contribute to
manifestations early in life.
110 Genome scan for chronic pastern dermatitis
The objective of the study was to identify QTL using a whole genome scan for CPD
in German draft horse breeds. We chose four German draft horse breeds for the
present study since clinical and histopathological changes associated with CPD are
identical in German draft horse breeds. Furthermore, these German draft horse
breeds exhibited high prevalences of CPD and were to some degree related with
each other through a few common ancestors in their breed history. The Rhenish
German and Saxon-Thuringian draft horses were founded on the basis of Belgian
stallions and mares at the end of the 19th century (Aberle et al. 2004a). As all
German draft horse breeds underwent severe bottlenecks in the 1960’s (Aberle et al.
2004b), QTL may be different among breeds due to genetic drift and thus, linkage
analysis using several breeds should detect more QTL than an analysis within a
single draft horse breed.
4.3 Material and Methods
4.3.1 Animals
Clinical data on CPD and data on management, housing and feeding conditions were
collected from a random sample of 917 German draft horses from breeders
distributed all over Germany. This survey was performed in 2001-2002 (Wallraf et al.
2004). For each horse, data including the date of birth, breed, housing system,
feeding regime, working capacity, development and progression of the skin lesions
for each limb was collected. The clinical examination of the horses included a general
examination and a specific examination of the four limbs with emphasis on clinical
signs such as erythema, exudation, crust formation, scaling, hyperkeratotic and
hyperplastic plaque-like lesions, malodorous skin surface, nodular masses,
verrucous masses with rugged surfaces as well as other skin alterations like scars
and tumors. The clinical status and appearance of the skin lesions were documented
using schematic drawings and evaluated using a scoring system that ranged from 1-
5 depending on the size of the affected area. A superficial skin scraping was taken
from CPD-affected regions, pruritic regions or if neither one present from the pastern
region and examined for chorioptes equi mite infestation. Out of these horses, 32
horses were included in a histopathological examination (Geburek et al. 2005). The
Genome scan for chronic pastern dermatitis 111
alterations of the skin characteristic for CPD were identical for all different draft horse
breeds examined.
We selected 378 German draft horses from the breeds Rhenish German, Schleswig,
Saxon-Thuringian and South German for the present study. These horses could be
grouped into 31 paternal half-sib families that segregated for CPD. Additional 302
horses with unknown phenotypes were included in the data set for linkage analyses
in order to build up pedigrees for CPD-affected horses.
The Rhenish German was represented by 2 families and 11 affected horses, the
Schleswig by 5 families and 56 affected horses, the Saxon-Thuringian by 9 families
and 87 affected horses and the South German by 15 families and 146 affected
horses. The number of family members genotyped ranged from 5 to 24 horses. The
pedigrees are shown in Supplementary Figure 1. As the genetic background of the
four selected draft horse breeds is diverse and upgrading with other European draft
horse breeds had not been uncommon in the breed history, we calculated the genetic
contributions from the founder breeds for the horses genotyped in this study. The
calculation of the proportion of ancestral genes for the draft horses was based on all
available pedigree information going back to the late 19th century. The Rhenish
German draft horses had 34% of ancestral genes from Belgian draft horses and the
Saxon-Thuringian draft horses had 81% of ancestral genes from Rhenish German
draft horses. The sample of Schleswig draft horses had a proportion of 6% ancestral
genes from South German draft horses and 28% founder genes from Jutland draft
horses. In the South German draft horses the proportion of ancestral genes from the
Noric draft horse was 48%.
Female and male horses were unequally distributed in the genotyped sample
because preferably older horses were sampled and in this age group, the male
horses are underrepresented in these draft horse populations.
As we used a design for affected pedigree members, preferably CPD-affected horses
were genotyped. The prevalence of CPD was 70.6% in South German draft horses.
Prevalence in the other horse breeds was at 82.3% (Saxon-Thuringian), 84.1%
(Schleswig) and 90.9% (Rhenish German). The draft horses included in this study
were born in the years from 1982-2000. The mean age of unaffected horses was 4
years (Rhenish German), 4.7 years (Schleswig), 7 years (Saxon-Thuringian) and 8.8
years (South German). The mean age of CPD-affected horses was 7 years (Rhenish
112 Genome scan for chronic pastern dermatitis
German), 8.7 years (South German), 9.3 years (Schleswig) and 9.8 years (Saxon-
Thuringian) (Supplementary Table 1).
4.3.2 Microsatellite markers
For the whole genome scan, we used 318 microsatellite markers that were chosen
from the equine linkage maps (Penedo et al. 2005, Swinburne et al. 2006), the INRA
HORSEMAP database (http://locus.jouy.inra.fr), the equine RH map (Chowdhary et
al. 2003, Raudsepp et al. 2008) and from a panel of newly identified microsatellites
on the horse genome assembly EquCab2.0 (Mittmann et al. 2009). The markers
were chosen according to their position on the horse genome assembly EquCab2.0
in order to provide an even and equidistant coverage. Then their number of alleles,
polymorphism information content (PIC) and heterozygosity (HET) was evaluated to
achieve a highly informative and equidistant marker set. HET shows the proportion of
heterozygote individuals. PIC is defined as the probability that the marker genotype
of a given offspring will, in the absence of crossing-over, allow to deduce which one
of the two marker alleles the offspring received from its parents. In order to achieve a
high information content for linkage analysis over the whole equine genome, markers
with more than four alleles, HET and PIC larger than 50 % were preferentially
employed. Markers that did not fulfil these requirements were discarded from the
genome scan as long as alternate more polymorphic microsatellites could be
identified.
This whole genome scan was performed as a two step analysis. In the first step, 178
polymorphic microsatellite markers that were evenly distributed over the 31 equine
autosomes and the X-chromosome were genotyped using 8 paternal half-sib families
consisting of 68 South German draft horses with 61 CPD-affected horses. The
average distance among these markers was 12.6 Mb, the mean number of alleles
was 6.8, the average HET was 66.5% and the average PIC 60.1%. The number of
horses was consecutively increased and additional samples from further German
draft horse breeds were then genotyped using the 178 microsatellites. In the second
step, the marker density was increased for horse chromosomes (ECA) with putative
QTL regions. We chose 20 additional markers on ECA1, 6 additional markers on
ECA10 and 13 additional markers on ECA26. After the release of the second horse
genome assembly in September 2007 all positions of the markers were verified on
Equcab2.0 using a stand-alone BLAST with the Blastn mode
Genome scan for chronic pastern dermatitis 113
(ftp://ftp.ncbi.nih.gov/blast/executable). All gaps larger than 20 Mb that had emerged
in the first marker set were filled with informative markers. Thus, the marker set was
supplemented by 101 microsatellites distributed on all chromosomes with the
exception of ECA12, 13, 20, 23 and 30. The average distance between the 318
microsatellites on EquCab2.0 was 7.5 ± 8.2 Mb, with 4.76 Mb on ECA1, 3.06 Mb on
ECA10, 2.62 Mb on ECA26 and 7.9 Mb on all other chromosomes (Supplementary
Table 2). The complete marker set used for this genome scan had an average
number of 7.1 alleles, the mean value for HET was 65.7% and for PIC 63.8%,
respectively (Supplementary Table 2).There were 4 markers with an allele number of
2 (1.3%), and 26 markers with an allele number of 3 (8.2%). The number of
microsatellites with HET and PIC < 0.40 was 24 (7.5%) and 30 (9.4%). These less
polymorphic microsatellites amount to less than 10% of the marker set.
4.3.3 Genotyping
Genomic DNA was isolated from EDTA blood samples using the QIAamp® 96 DNA
Spin Blood Kit (Qiagen, Hilden, Germany). PCR was performed on PTC 100™, PTC
200™ (MJ Research, Watertown, MA, USA) or professional thermocyclers (Biometra,
Göttingen, Germany). A PCR program with varying annealing temperatures (Ta)
(Supplementary Table 1) and a general procedure has been used as follows: after 4
minutes of initial denaturation at 94°C, 36 cycles of 30 seconds at 94°C, 60 sec at
optimum annealing temperature, 30 sec at 72°C and the final cooling to 4°C for 10
min were carried out. All PCR reactions were performed in 12 μl reaction volumes
using 10 ng DNA, 1.2 μl 10x incubation buffer containing 15 mM MgCl2, 0.6 μl
DMSO, 0.2 μl each dNTP (100μM each) and 0.1 μl Taq Polymerase (Qbiogene,
Heidelberg, Germany). All forward primers were labelled with IRD700 or IRD800 at
the 5’ end.
To increase efficiency, primer pairs were pooled into PCR multiplex groups of two to
nine markers. The remaining primer pairs were amplified separately. The multiplex
groups and the separately amplified PCR products were pooled according to their
size and labelling and diluted with formamide loading buffer in ratios from 1:3 to 1:20.
For the analysis of the marker genotypes, the PCR products were size-fractionated
by gel electrophoresis on automated sequencers LI-COR 4200/S-2, LI-COR 4300
(LI-COR, Lincoln, NE, USA) using 4% and 6% polyacrylamide denaturing gels
114 Genome scan for chronic pastern dermatitis
(Rotiphorese Gel40, Carl Roth, Karlsruhe, Germany). Allele sizes were scored
against IRD700- and IRD800-labeled DNA ladders.
4.3.4 Statistical analysis
Mendelian inheritance correctness of marker transmission in the pedigrees
genotyped was confirmed using Pedstats (Wigginton and Abecasis 2005).
SAS/Genetics, version 9.2 (SAS Institute, Cary, NC, USA) was employed to calculate
number of alleles, HET and PIC. Multipoint non-parametric linkage (NPL) analyses
for the whole genome scan were performed using MERLIN software (multipoint
engine for rapid likelihood inference, version 1.1.2) (Abecasis et al. 2002). Analysis
was performed using a binary affection status for CPD (affected versus unaffected
horses). Linkage between CPD-affection and microsatellites was estimated by the
proportion of alleles identical by descent (IBD) for affected animals (Kong and Cox
1997; Kruglyak et al. 1996; Whittemore and Halpern 1994). Non-parametric linkage
analyses do not require assumptions on the mode of inheritance and the genetic
parameters of the specified model and so this approach should be useful for traits
like CPD. The Whittemore and Halpern NPL all and pairs statistics, the Zmeans and
linear model LOD (logarithm of odds) scores according to Kong and Cox (1997) were
employed for the multipoint chromosome-wide search for alleles shared among
affected family members. We employed multipoint analyses in order to use marker
information from the whole chromosome through linked informative markers and to
increase power of linkage analysis. The maximum (minimum) achievable Zmean and
linear LOD score across breeds were 160.38 (-2.97) and 33.82 (-0.02) indicating
enough power to detect genome-wide significant linkage.
In the linkage analyses within single breeds, the maximum (minimum) achievable
Zmean and linear LOD score were lowest for the Rhenish German with 4.42 (-0.90)
and 1.49 (-0.14), 29.22 (-1.43) and 5.18 (-0.04) for the Schleswig, 32.67 (-2.14) and
8.49 (-0.10) for the Saxon-Thuringian and highest for the South German draft horses
with 186.77 (-1.45) and 20.88 (-0.01). In order to detect family specific QTL regions,
families with Zmeans > 1 from all breeds were analysed together. The maximum
(minimum) achievable Zmean within single breed linkage analyses ranged from
190.80 (-1.58) to 27.06 (-1.69), and the linear LOD score ranged from 17.95 (-0.01)
to 6.35 (-0.06) showing enough power to detect genome-wide significant linkage.

Genome scan for chronic pastern dermatitis 115
In the case of no linkage, Zmean approaches the minimum achievable value due to
an equal distribution of alleles among affected relatives. When linkage is present
under the alternative hypothesis, the proportion of alleles IBD significantly deviates
from the expected IBD proportions of the null hypothesis. We determined empirical
chromosome-wide significance levels using simulated marker genotypes under the
null hypothesis. The empirical distribution for the 5% error probability was obtained
after 1000 replicates.
A chromosome-wide co-segregation of a marker allele with the phenotypic
expression of CPD was assumed for p-values < 0.05. Genome-wide probabilities
were obtained by applying a Bonferroni correction for the chromosome-wide
significant p-values with Pgenome-wide = 1 – (1 – Pchromosome-wide)1/r, where r = length of
the respective horse chromosome in Mb divided by the total equine genome length
(2680 Mb). A genome-wide co-segregation was assumed when p-values after the
Bonferroni correction were p < 0.05.
4.4 Results and discussion
The across-breed linkage analysis including the 378 German draft horses could
identify chromosome-wide significant QTL on ECA1, 9, 16 and 17. Their locations
were at 102.6-117.8 Mb on ECA1, at 46.1-71.7 Mb on ECA9, at 2.7-38.4 Mb on
ECA16 and at 0.0-23.8 Mb on ECA17 (Table 1).
Analyses within single breeds confirmed all these QTL. The QTL on ECA1 was
mainly caused by the South German (Table 2 and Figure 1). The QTL on ECA9, 16
and 17 had chromosome-wide significant LOD scores for the Saxon-Thuringian
(Table 3). Additional chromosome-wide significant QTL could be identified for single
breeds on ECA7, 10 and 11. The QTL on ECA7 at 29.0-33.8 Mb is due to the marker
ABGe101 that was significant in the South German (Table 2). For the Schleswig
chromosome-wide significant QTL could be seen on ECA10 at 19.8-38.5 Mb
including 7 markers and on ECA11 at 41.5-61.3 Mb owing to chromosome-wide
significant linkage of the marker UCD425 (Table 4).
The linkage analysis for the South German including 197 horses showed a genome-
wide significant Zmean on ECA1 for the markers 1CA43 and TKY002. When the 10
South German families with the highest per family Zmean were selected, the region
at 18.3-50.8 Mb was genome-wide significant and the region at 76.3-136.9 Mb was
116 Genome scan for chronic pastern dermatitis
chromosome-wide significant (Supplementary Table 3). A further reduction of the
genome-wide error probability could be achieved by analyzing all families with a
Zmean > 1 from all draft horse breeds (Supplementary Table 4 and Figure 1).
In the single breed analysis of the Rhenish German, markers on ECA10 reached
chromosome-wide significant LOD scores (p < 0.04-0.05). The analysis for the
Schleswig alone also revealed chromosome-wide significant linkage on ECA10
(Table 4). Combining all Rhenish German (n=12) and all Schleswig (n=64) families
resulted in two chromosome-wide QTL that were at 15.4-52.7 Mb on ECA10 (Table
5, Figure 2) and at 97.6-102.7 Mb on ECA4. Genome-wide significance was reached
by 3 markers on ECA10 when additional families from the other breeds increased the
number of affected animals (n=190) for the linkage analysis (Supplementary Table 5,
Figure 2).
The QTL on ECA16 including 5 markers between 2.7-38.4 Mb (Supplementary Table
6 and Figure 3) reached the genome-wide significance level (Pgenome-wide < 0.003-
0.021) for ABGe033 and COR011 when families (n=130 horses) were analyzed with
Zmeans > 1. On ECA17, genome-wide significant linkage could be seen for the LOD
score (Pgenome-wide < 0.023-0.026) for the markers COR072 and COR007 on the
proximal end of ECA17 at 4.77 and 6.61 Mb for all draft horse breeds (Figure 4).
It is very likely that a number of loci influence the development of CPD and the
influence of these loci may be different on CPD expression among the German draft
horse breeds analyzed here. The across-breed analysis was justified by the same
disease entity, particularly as there are no differences in the type and severity of
signs of CPD, or the age of onset among the analysed horse breeds. Furthermore,
there are genealogical relationships among these four German draft horse breeds
(Aberle et al. 2004a, 2004b) and in addition, to Belgian draft horses. Belgian draft
horses are believed to have significantly contributed to the high prevalence of CPD in
German draft horses in the first half of the last century (Schäper 1950).
The strong influence of the South German draft horses which is seen for the QTL on
ECA1 may be caused by the significantly higher number of horses from this breed.
Using families with Zmeans > 1 from the different breeds increased the likelihood to
detect chromosome-wide significant QTL. This was evident for the QTL on ECA10
that was chromosome-wide significant in the Schleswig and the Rhenish German and
reached the genome-wide significant level when families highly informative for
linkage were selected across all breeds. These results indicate that QTL for CPD
Genome scan for chronic pastern dermatitis 117
may not be detected in within-breed analyses due to low numbers of families with co-
segregating markers, whereas the across-breed analysis may reveal such QTL. In
addition, drift variance might be large in German draft horse breeds due to their
breed history and this fact may contribute to QTL segregating only in a number of
families.
There have been two previous studies attempting to identify genes responsible for
CPD through candidate gene approaches based on similar diseases in humans. In
the first study ATP2A2 on ECA8 at Mb 21.5 was analysed as a candidate gene for
CPD in German draft horses (Mömke and Distl 2007). Mutations in this gene were
previously shown to be responsible for the Darier-White disease in humans. The
acral-hemorrhagic type of this disease has a similarity with clinical signs of CPD.
Neither this previous study nor the present analysis could find significant test
statistics in that chromosome region. Therefore, it is unlikely that the ATP2A2 gene is
involved in the pathogenesis of CPD.
The second study focused on the FOXC2 candidate gene that is located on ECA3 at
33.42 Mb (Young et al. 2007). Mutations in this gene are responsible for
lymphedema-distichiasis in humans, but the association analysis of the SNPs
identified in 6 horses did not yield significant results for CPL. In agreement with this
previous study we could not find significantly linked markers on ECA3.
The four genomic regions showing genome-wide significant QTL in this study should
help to choose appropriate positional candidate genes for association studies. We
searched potential candidate genes within these QTL regions, even if these genomic
regions extend over more than 5-10 Mb. The positions of potential positional
candidate genes within the CPD-QTL were verified through BLAST analyses for
EquCab2.0.
If we assume an overregulated inflammatory autoimmune response to an initial
vector as a possible cause for CPD, the ubiquitin protein ligase E3A, CD109
molecule and the myotubularin related protein 6 may be considered as positional
candidate genes for the QTL regions on ECA1, 10 and 17 (Table 6).
A recently published study demonstrated that the annexin A1 degradation is
mediated by UBE3A in immune-modulation (Shimoji et al. 2009). UBE3A is located
on ECA1 at 110.75-110.79 Mb. An overexpression of ubiquitin protein ligase E3A
caused enhanced proteasomal degradation of annexin A1 in vivo which would result
in a highly active neutrophil extravasation and an overshooting inflammatory
118 Genome scan for chronic pastern dermatitis
response in damaged or infected tissues. Annexin A1 is anti-inflammatory and has
also been implicated in pro-apoptotic mechanisms in the cell. Mutations that reduced
the ubiquitin ligase E3A activity are associated with the Angelman syndrome, a
severe neurological disorder in humans.
The candidate gene activated T-cell marker CD109 located on ECA10 at 28.58-28.72
Mb plays a role in immune regulation as well. CD109 binds and down regulates the
transformimg growth factor-β (TGF-β) in human keratinocytes (Finnson et al. 2006).
TGF-β plays a critical role in skin development, homeostasis and wound healing.
Perturbations in the action of TGF-β have been implicated in a variety of skin
disorders, including impaired wound healing, hypertrophic scarring, psoriasis and
cancer. Results indicated that CD109 also negatively regulates the anti-proliferative
effect of TGF-β on human keratinocytes. At least five amino acid substitutions have
been identified in the CD109 coding DNA-sequence, whether they alter the function
of CD109 has not yet been determined. Because of the proliferation that is seen in
the formation of nodules and verrucous masses in CPD of draft horses, CD109 may
be a suitable candidate gene.
Myotubularin related protein 6 (MTMR6) encodes a phosphatidylinositol-3
phosphatase. This gene is located within the QTL on ECA17 at 5.09-5.12 Mb and
plays a critical role in setting a minimum threshold for a stimulus to activate T-cells
(Srivastava et al. 2006). A point mutation in the phosphatase domain of MTMR6
resulted in a significant increase of the proliferation of reactivated human CD4 T
cells. MTMR6 could be involved in the perivascular dermatitis which was dominated
by T lymphocytes (Geburek et al. 2005) and found in all CPD-affected draft horses.
Further studies will be necessary to evaluate the effects of theses candidate genes in
the pathogenesis of CPD and to detect causative mutations in these genes.
The speed of whole genome mapping has been significantly increased by tools like
the equine 50K Illumina Beadchip. However, the often notable reduction of allele
numbers of microsatellites in draft horse breeds in comparison to warmblood horse
breeds suggests an even lower degree of polymorphic single nucleotide
polymorphisms in draft horses. Testing the equine 50K Illumina Beadchip for minor
allele frequencies, HET and PIC in draft horse breeds should be done in the future
and then the suitability of this tool for genome-wide association studies can be
evaluated for these horse breeds.
Genome scan for chronic pastern dermatitis 119
This study is the very first genome-wide analysis for CPD. We could identify genome-
wide significant QTL on four chromosomes in German draft horse breeds.
4.5 References
Abecasis GR, Cherny SS, Cookson WO, Cardon LR (2002) Merlin rapid analysis of
dense genetic maps using sparse gene flow trees. Nat Genet 30:97-101
Aberle K, Wrede J, Distl O (2004a) Analysis of relationships between German heavy
horse breeds based on pedigree information. Berl Münch Tierärztl Wochenschr
117:72–75
Aberle K, Hamann H, Drögemüller C, O Distl (2004b) Genetic diversity in German
draught horse breeds compared to a group of primitive, riding and wild horses by
means of microsatellite DNA markers. Anim Genet 35:270-277
Chowdhary BP, Raudsepp T, Kata SR, Goh G, Millon LV, Allan V, Piumi F, Guérin G,
Swinburne J, Binns M, Lear TL, Mickelson J, Murray J, Antczak DF, Womack JE,
Skow LC (2003) The first-generation whole-genome radiation hybrid map in the
horse identifies conserved segments in human and mouse genomes. Genome
Res 13:742–751
De Cock HE, Affolter VK, Wisner ER, Ferraro GL, MacLachlan NJ (2003) Progressive
swelling, hyperkeratosis, and fibrosis of distal limbs in Clydesdales, Shires, and
Belgian draft horses suggestive of primary lymphedema. Lymphat Res Biol
1:191-199
De Cock HE, Affolter VK, Farver TB, Van Brantegem L, Scheuch B, Ferraro GL
(2006) Mearurement of skin desmosine as an indicator of altered cutaneous
elastin in draft horses with chronic progressive lymphedema. Lymphat Res Biol
4:67-72
Finnson KW, Tam BY, Liu K, Marcoux A, Lepage P, Roy S, Bizet AA, Philip A (2006)
Identification of CD109 as part of the TGF-beta receptor system in human
keratinocytes. Faseb J 20: -1527
Geburek F, Ohnesorge B, Deegen E, Doeleke R, Hewicker-Trautwein M (2005)
Alterations of epidermal proliferation and cytokeratin expression in skin biopsies
from heavy draught horses with chronic pastern dermatitis. Vet Dermatol 16:373-
84
120 Genome scan for chronic pastern dermatitis
Kong A, Cox NJ (1997) Allele-sharing models: LOD scores and accurate linkage
tests. Am J Hum Genet 61, 1179-1188
Kruglyak L, Daly MJ, Reeve-Daly MP, Lander ES (1996) Parametric and
nonparametric linkage analysis: a unified multipoint approach. Am J Hum Genet
58:1347-1363
Mittmann EH, Wrede J, Pook J, Distl O (2009) Identification of 21781 equine
microsatellites on the horse genome assembly 2.0. Anim Genet 10.1111/j. 1365-
2052.2009.01979.x
Mömke S, Distl O (2007a) Molecular characterization of the equine ATP2A2 gene.
Cytogenet Genome Res 116:256-262
Mömke S, Distl O (2007b) Molecular analysis of the ATP2A2 gene as candidate for
chronic pastern dermatitis in German draft horses. J Hered 98:267-271
Penedo MCT, Millon LV, Bernoco D, Bailey E, Binns M, Cholewinski G, Ellis N, Flynn
J, Gralak B, Guthrie A, Hasegaw T, Lindgren G, Lyons LA, Røed KH, Swinburne
JE, Tozaki T (2005) International equine gene mapping workshop report: a
comprehensive linkage map constructed with data from new markers and by
merging four mapping resources. Cytogenet Genome Res 111:5–15
Raudsepp T, Gustafson-Seabury A, Durkin K, Wagner ML, Goh G, Seabury CM,
Brinkmeyer-Langford C, Lee EJ, Agarwala R, Stallknecht-Rice E, Schäffer AA,
Skow LC, Tozaki T, Yasue H, Penedo MC, Lyons LA, Khazanehdari KA, Binns
MM, MacLeod JN, Distl O, Guérin G, Leeb T, Mickelson JR, Chowdhary BP (2008)
A 4,103 marker integrated physical and comparative map of the horse genome.
Cytogenet Genome Res 122:28–36
Schäper W (1950) Die Verbesserung der Konstitution unserer Haustiere. Z
Tierzüchtg Züchtgsbiol 58:1-57
Shimoji T, Murakami K, Sugiyama Y, Matsuda M, Inubushi S, Nasu J, Shirakura M,
Suzuki T, Wakita T, Kishino T, Hotta H, Miyamura T, Shoji I (2009) Identification
of annexin A1 as a novel substrate for E6AP-mediated ubiquitylation. J Cell
Biochem 106:1123-1135
Srivastava S, Ko K, Choudhury P, Li Z, Johnson AK, Nadkarni V, Unutmaz D,
Coetzee WA, Skolnik EY (2006) Phosphatidylinositol-3 phosphatase
myotubularin-related protein 6 negatively regulates CD4 T cells. Mol Cell Biol
26:5595-5602
Genome scan for chronic pastern dermatitis 121
Swinburne JE, Boursnell M, Hill G, Pettitt L, Allen T, Chowdhary B, Hasegawa T,
Kurosawa M, Leeb T, Mashima S, Mickelson JR, Raudsepp T, Tozaki T, Binns M
(2006) Single linkage group per chromosome genetic linkage map for the horse,
based on two three-generation, full-sibling, crossbred horse reference families.
Genomics 87:1–29
Wallraf A, Hamann H, Deegen E, Ohnesorge B, Distl O (2004a) Analysis of the
prevalence of pastern dermatitis in German draft horse breeds. Berl Münch
Tierärztl Wochenschr 117:148-152
Wallraf A, Hamann H, Ohnesorge B, Deegen E, O Distl (2004b)
Populationsgenetische Untersuchung zum Auftreten von Mauke beim
Süddeutschen Kaltblut. Züchtungskunde 76:246-261
Whittemore AS, Halpern J (1994) A class of tests for linkage using affected pedigree
members. Biometrics 50:118-127
Wigginton JE, Abecasis GR (2005) PEDSTATS: descriptive statistics, graphics, and
quality assessment for gene mapping data. Bioinformatics 21:3445-3447
Young AE, Bower LP, Affolter VK, De Cock HE, Ferraro GL, Bannasch DL (2007)
Evaluation of FOXC2 as a candidate gene for chronic progressive lymphedema in
draft horses. Vet J 174:397-399
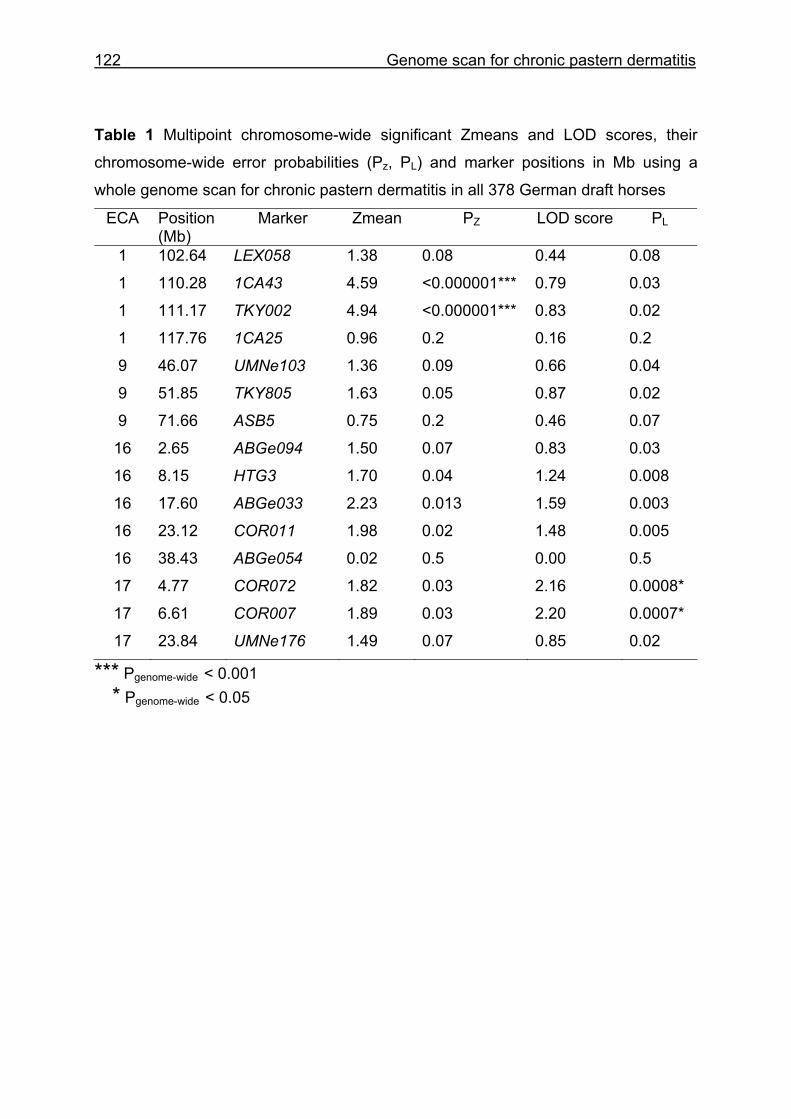
122 Genome scan for chronic pastern dermatitis
Table 1 Multipoint chromosome-wide significant Zmeans and LOD scores, their
chromosome-wide error probabilities (Pz, PL) and marker positions in Mb using a
whole genome scan for chronic pastern dermatitis in all 378 German draft horses
ECA Position (Mb)
Marker Zmean PZ LOD score PL
1 102.64 LEX058 1.38 0.08 0.44 0.08
1 110.28 1CA43 4.59 <0.000001*** 0.79 0.03
1 111.17 TKY002 4.94 <0.000001*** 0.83 0.02
1 117.76 1CA25 0.96 0.2 0.16 0.2
9 46.07 UMNe103 1.36 0.09 0.66 0.04
9 51.85 TKY805 1.63 0.05 0.87 0.02
9 71.66 ASB5 0.75 0.2 0.46 0.07
16 2.65 ABGe094 1.50 0.07 0.83 0.03
16 8.15 HTG3 1.70 0.04 1.24 0.008
16 17.60 ABGe033 2.23 0.013 1.59 0.003
16 23.12 COR011 1.98 0.02 1.48 0.005
16 38.43 ABGe054 0.02 0.5 0.00 0.5
17 4.77 COR072 1.82 0.03 2.16 0.0008*
17 6.61 COR007 1.89 0.03 2.20 0.0007*
17 23.84 UMNe176 1.49 0.07 0.85 0.02
*** Pgenome-wide < 0.001 * Pgenome-wide < 0.05
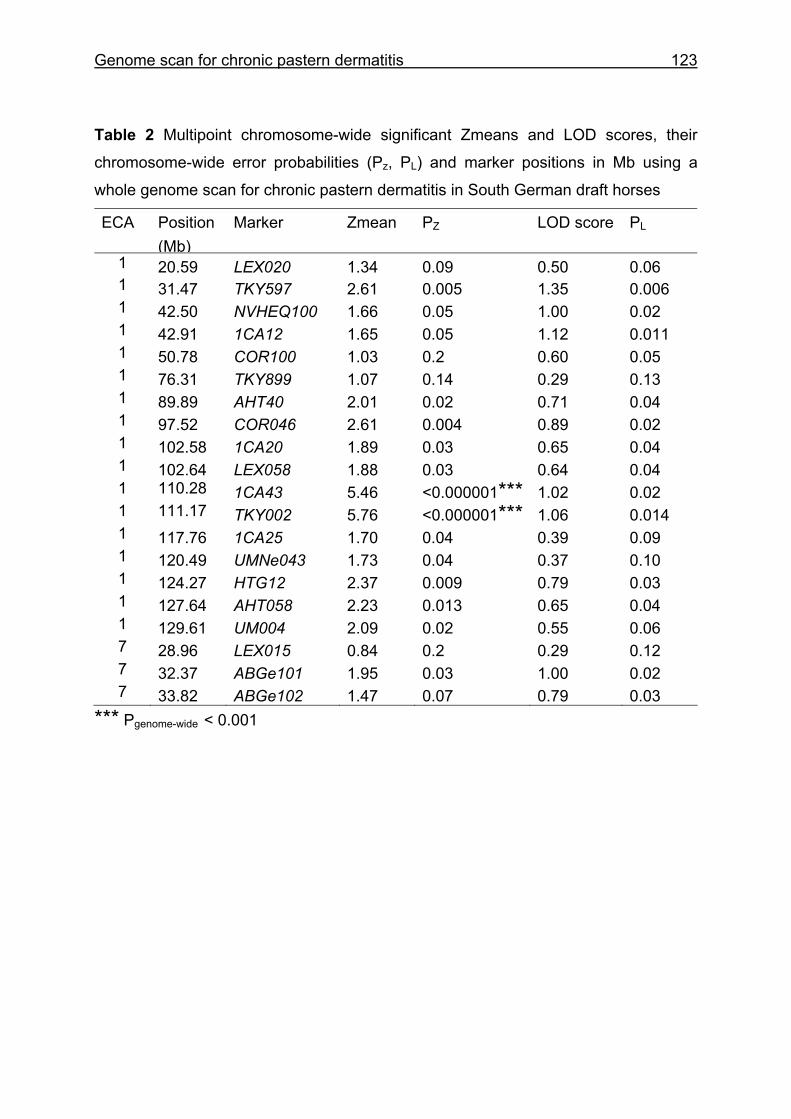
Genome scan for chronic pastern dermatitis 123
Table 2 Multipoint chromosome-wide significant Zmeans and LOD scores, their
chromosome-wide error probabilities (Pz, PL) and marker positions in Mb using a
whole genome scan for chronic pastern dermatitis in South German draft horses
ECA Position (Mb)
Marker Zmean PZ LOD score PL
1 20.59 LEX020 1.34 0.09 0.50 0.061 31.47 TKY597 2.61 0.005 1.35 0.0061 42.50 NVHEQ100 1.66 0.05 1.00 0.021 42.91 1CA12 1.65 0.05 1.12 0.0111 50.78 COR100 1.03 0.2 0.60 0.051 76.31 TKY899 1.07 0.14 0.29 0.131 89.89 AHT40 2.01 0.02 0.71 0.041 97.52 COR046 2.61 0.004 0.89 0.021 102.58 1CA20 1.89 0.03 0.65 0.041 102.64 LEX058 1.88 0.03 0.64 0.041 110.28 1CA43 5.46 <0.000001*** 1.02 0.021 111.17 TKY002 5.76 <0.000001*** 1.06 0.0141 117.76 1CA25 1.70 0.04 0.39 0.091 120.49 UMNe043 1.73 0.04 0.37 0.101 124.27 HTG12 2.37 0.009 0.79 0.031 127.64 AHT058 2.23 0.013 0.65 0.041 129.61 UM004 2.09 0.02 0.55 0.067 28.96 LEX015 0.84 0.2 0.29 0.127 32.37 ABGe101 1.95 0.03 1.00 0.027 33.82 ABGe102 1.47 0.07 0.79 0.03
*** Pgenome-wide < 0.001
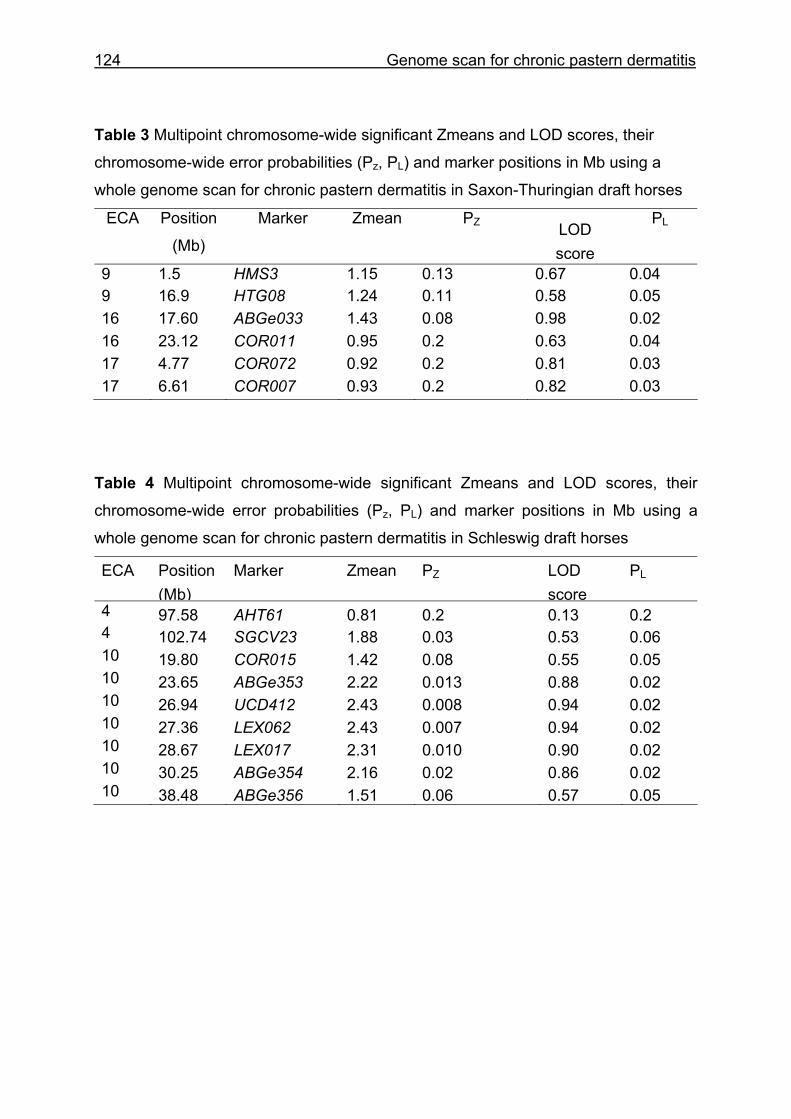
124 Genome scan for chronic pastern dermatitis
Table 3 Multipoint chromosome-wide significant Zmeans and LOD scores, their
chromosome-wide error probabilities (Pz, PL) and marker positions in Mb using a
whole genome scan for chronic pastern dermatitis in Saxon-Thuringian draft horses
ECA Position
(Mb)
Marker Zmean PZ LOD score
PL
9 1.5 HMS3 1.15 0.13 0.67 0.04 9 16.9 HTG08 1.24 0.11 0.58 0.05 16 17.60 ABGe033 1.43 0.08 0.98 0.02 16 23.12 COR011 0.95 0.2 0.63 0.04 17 4.77 COR072 0.92 0.2 0.81 0.03 17 6.61 COR007 0.93 0.2 0.82 0.03
Table 4 Multipoint chromosome-wide significant Zmeans and LOD scores, their
chromosome-wide error probabilities (Pz, PL) and marker positions in Mb using a
whole genome scan for chronic pastern dermatitis in Schleswig draft horses
ECA Position (Mb)
Marker Zmean PZ LOD score
PL
4 97.58 AHT61 0.81 0.2 0.13 0.2 4 102.74 SGCV23 1.88 0.03 0.53 0.0610 19.80 COR015 1.42 0.08 0.55 0.0510 23.65 ABGe353 2.22 0.013 0.88 0.0210 26.94 UCD412 2.43 0.008 0.94 0.0210 27.36 LEX062 2.43 0.007 0.94 0.0210 28.67 LEX017 2.31 0.010 0.90 0.0210 30.25 ABGe354 2.16 0.02 0.86 0.0210 38.48 ABGe356 1.51 0.06 0.57 0.05
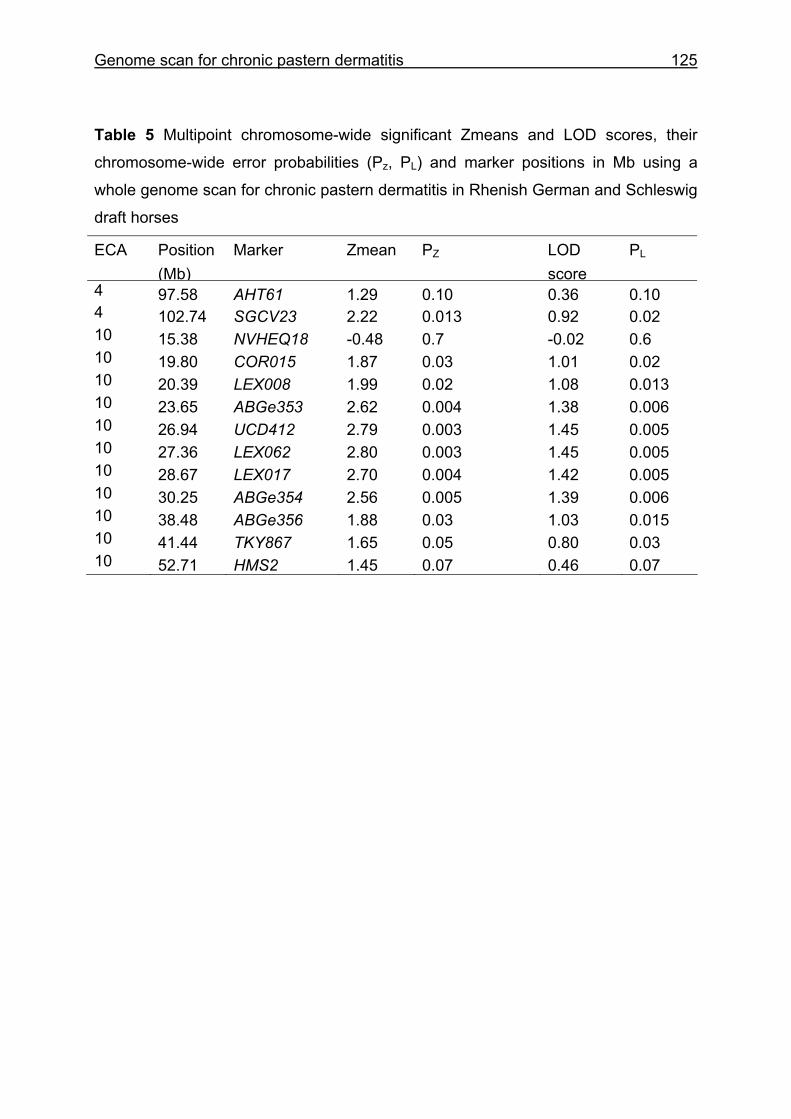
Genome scan for chronic pastern dermatitis 125
Table 5 Multipoint chromosome-wide significant Zmeans and LOD scores, their
chromosome-wide error probabilities (Pz, PL) and marker positions in Mb using a
whole genome scan for chronic pastern dermatitis in Rhenish German and Schleswig
draft horses
ECA Position (Mb)
Marker Zmean PZ LOD score
PL
4 97.58 AHT61 1.29 0.10 0.36 0.104 102.74 SGCV23 2.22 0.013 0.92 0.0210 15.38 NVHEQ18 -0.48 0.7 -0.02 0.6 10 19.80 COR015 1.87 0.03 1.01 0.0210 20.39 LEX008 1.99 0.02 1.08 0.01310 23.65 ABGe353 2.62 0.004 1.38 0.00610 26.94 UCD412 2.79 0.003 1.45 0.00510 27.36 LEX062 2.80 0.003 1.45 0.00510 28.67 LEX017 2.70 0.004 1.42 0.00510 30.25 ABGe354 2.56 0.005 1.39 0.00610 38.48 ABGe356 1.88 0.03 1.03 0.01510 41.44 TKY867 1.65 0.05 0.80 0.0310 52.71 HMS2 1.45 0.07 0.46 0.07
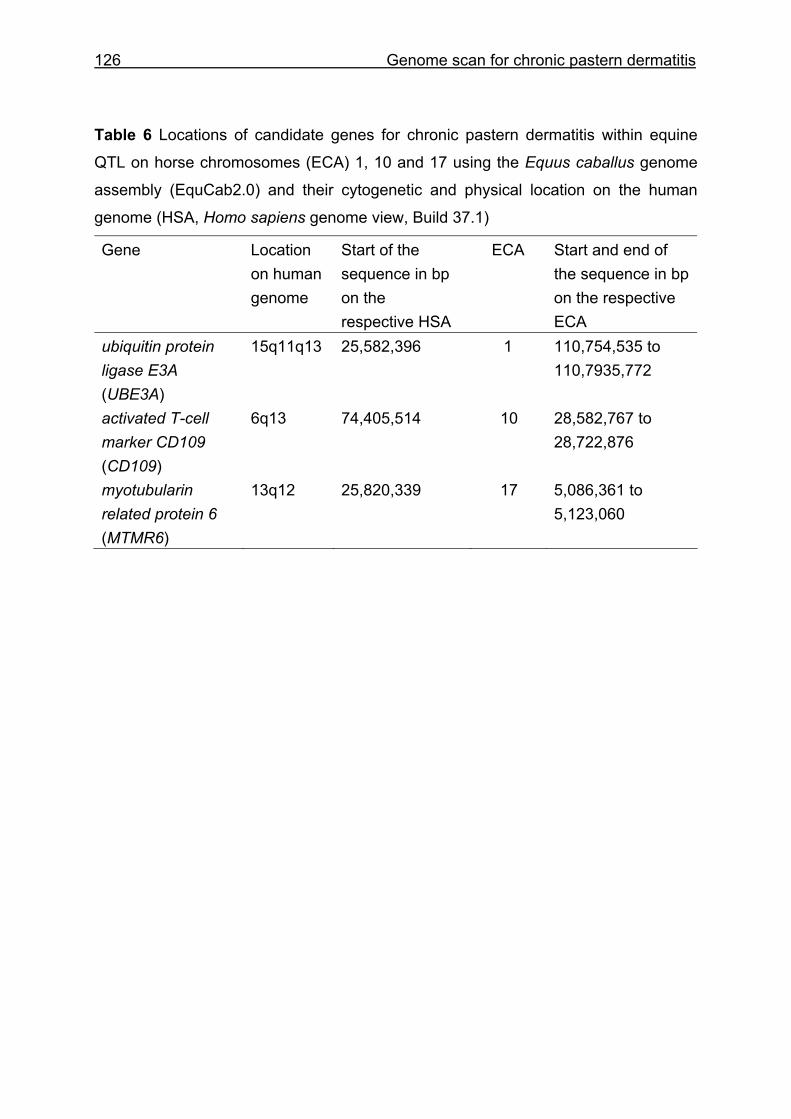
126 Genome scan for chronic pastern dermatitis
Table 6 Locations of candidate genes for chronic pastern dermatitis within equine
QTL on horse chromosomes (ECA) 1, 10 and 17 using the Equus caballus genome
assembly (EquCab2.0) and their cytogenetic and physical location on the human
genome (HSA, Homo sapiens genome view, Build 37.1)
Gene Location on human genome
Start of the sequence in bp on the respective HSA
ECA Start and end of the sequence in bp on the respective ECA
ubiquitin protein ligase E3A (UBE3A)
15q11q13 25,582,396 1 110,754,535 to 110,7935,772
activated T-cell marker CD109 (CD109)
6q13 74,405,514 10 28,582,767 to 28,722,876
myotubularin related protein 6 (MTMR6)
13q12 25,820,339 17 5,086,361 to 5,123,060
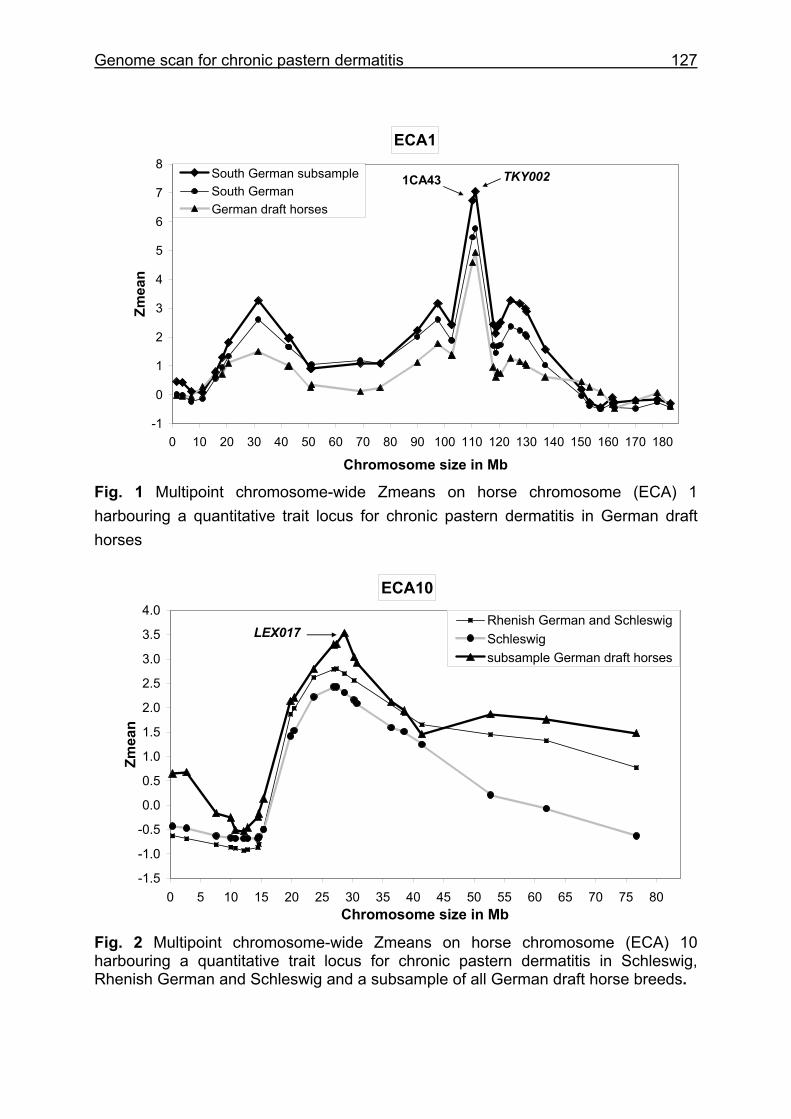
Genome scan for chronic pastern dermatitis 127
ECA1
-1
0
1
2
3
4
5
6
7
8
0 10 20 30 40 50 60 70 80 90 100 110 120 130 140 150 160 170 180
Chromosome size in Mb
Zmea
n
South German subsampleSouth GermanGerman draft horses
TKY0021CA43
Fig. 1 Multipoint chromosome-wide Zmeans on horse chromosome (ECA) 1 harbouring a quantitative trait locus for chronic pastern dermatitis in German draft horses
ECA10
-1.5
-1.0
-0.5
0.0
0.5
1.0
1.5
2.0
2.5
3.0
3.5
4.0
0 5 10 15 20 25 30 35 40 45 50 55 60 65 70 75 80Chromosome size in Mb
Zmea
n
Rhenish German and SchleswigSchleswigsubsample German draft horses
LEX017
Fig. 2 Multipoint chromosome-wide Zmeans on horse chromosome (ECA) 10 harbouring a quantitative trait locus for chronic pastern dermatitis in Schleswig, Rhenish German and Schleswig and a subsample of all German draft horse breeds.
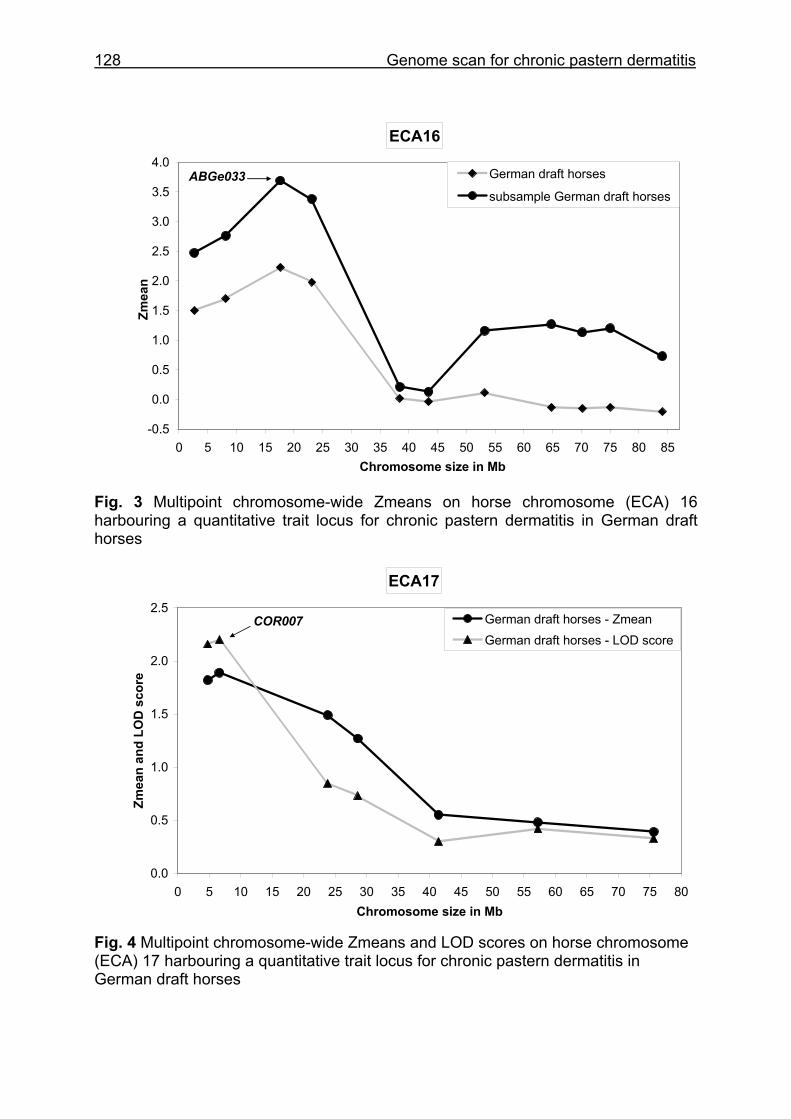
128 Genome scan for chronic pastern dermatitis
ECA16
-0.5
0.0
0.5
1.0
1.5
2.0
2.5
3.0
3.5
4.0
0 5 10 15 20 25 30 35 40 45 50 55 60 65 70 75 80 85Chromosome size in Mb
Zmea
n
German draft horses
subsample German draft horsesABGe033
Fig. 3 Multipoint chromosome-wide Zmeans on horse chromosome (ECA) 16 harbouring a quantitative trait locus for chronic pastern dermatitis in German draft horses ECA17
0.0
0.5
1.0
1.5
2.0
2.5
0 5 10 15 20 25 30 35 40 45 50 55 60 65 70 75 80Chromosome size in Mb
Zmea
n an
d LO
D s
core
German draft horses - ZmeanGerman draft horses - LOD score
COR007
Fig. 4 Multipoint chromosome-wide Zmeans and LOD scores on horse chromosome (ECA) 17 harbouring a quantitative trait locus for chronic pastern dermatitis in German draft horses
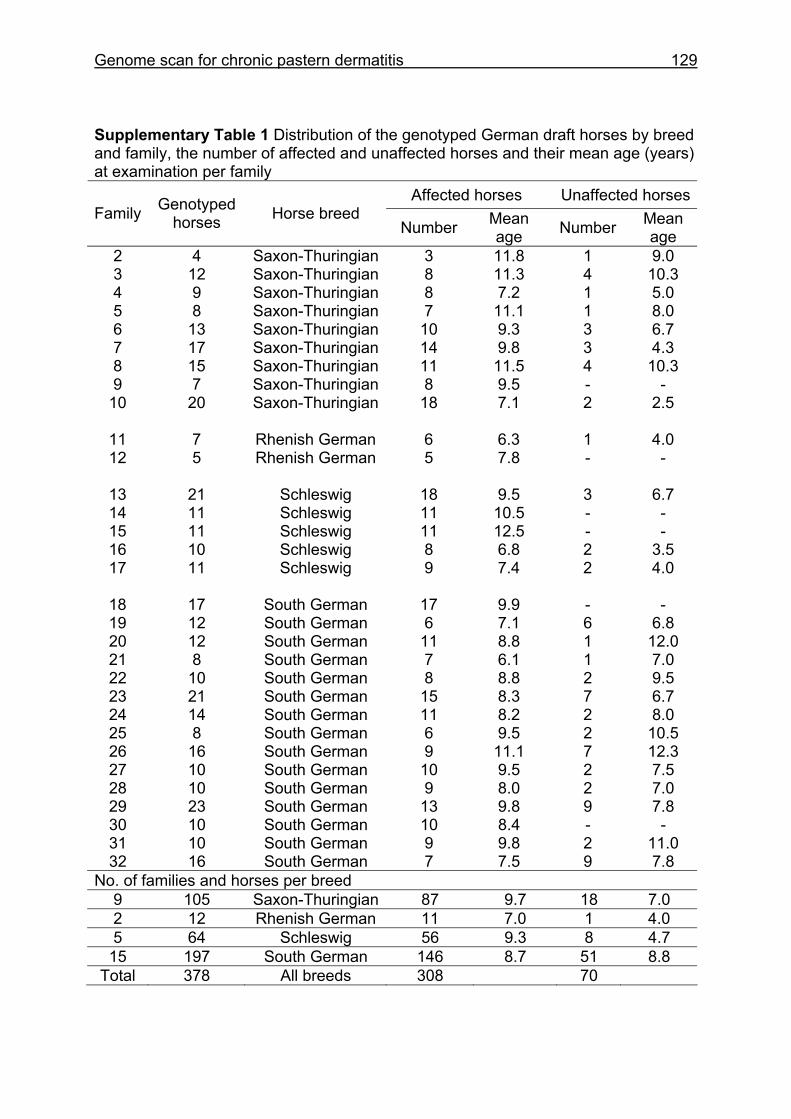
Genome scan for chronic pastern dermatitis 129
Supplementary Table 1 Distribution of the genotyped German draft horses by breed and family, the number of affected and unaffected horses and their mean age (years) at examination per family
Affected horses Unaffected horsesFamily Genotyped
horses Horse breed Number Mean
age Number Mean age
2 4 Saxon-Thuringian 3 11.8 1 9.0 3 12 Saxon-Thuringian 8 11.3 4 10.3 4 9 Saxon-Thuringian 8 7.2 1 5.0 5 8 Saxon-Thuringian 7 11.1 1 8.0 6 13 Saxon-Thuringian 10 9.3 3 6.7 7 17 Saxon-Thuringian 14 9.8 3 4.3 8 15 Saxon-Thuringian 11 11.5 4 10.3 9 7 Saxon-Thuringian 8 9.5 - -
10 20 Saxon-Thuringian 18 7.1 2 2.5
11 7 Rhenish German 6 6.3 1 4.0 12 5 Rhenish German 5 7.8 - -
13 21 Schleswig 18 9.5 3 6.7 14 11 Schleswig 11 10.5 - - 15 11 Schleswig 11 12.5 - - 16 10 Schleswig 8 6.8 2 3.5 17 11 Schleswig 9 7.4 2 4.0
18 17 South German 17 9.9 - - 19 12 South German 6 7.1 6 6.8 20 12 South German 11 8.8 1 12.0 21 8 South German 7 6.1 1 7.0 22 10 South German 8 8.8 2 9.5 23 21 South German 15 8.3 7 6.7 24 14 South German 11 8.2 2 8.0 25 8 South German 6 9.5 2 10.5 26 16 South German 9 11.1 7 12.3 27 10 South German 10 9.5 2 7.5 28 10 South German 9 8.0 2 7.0 29 23 South German 13 9.8 9 7.8 30 10 South German 10 8.4 - - 31 10 South German 9 9.8 2 11.0 32 16 South German 7 7.5 9 7.8
No. of families and horses per breed 9 105 Saxon-Thuringian 87 9.7 18 7.0 2 12 Rhenish German 11 7.0 1 4.0 5 64 Schleswig 56 9.3 8 4.7
15 197 South German 146 8.7 51 8.8 Total 378 All breeds 308 70
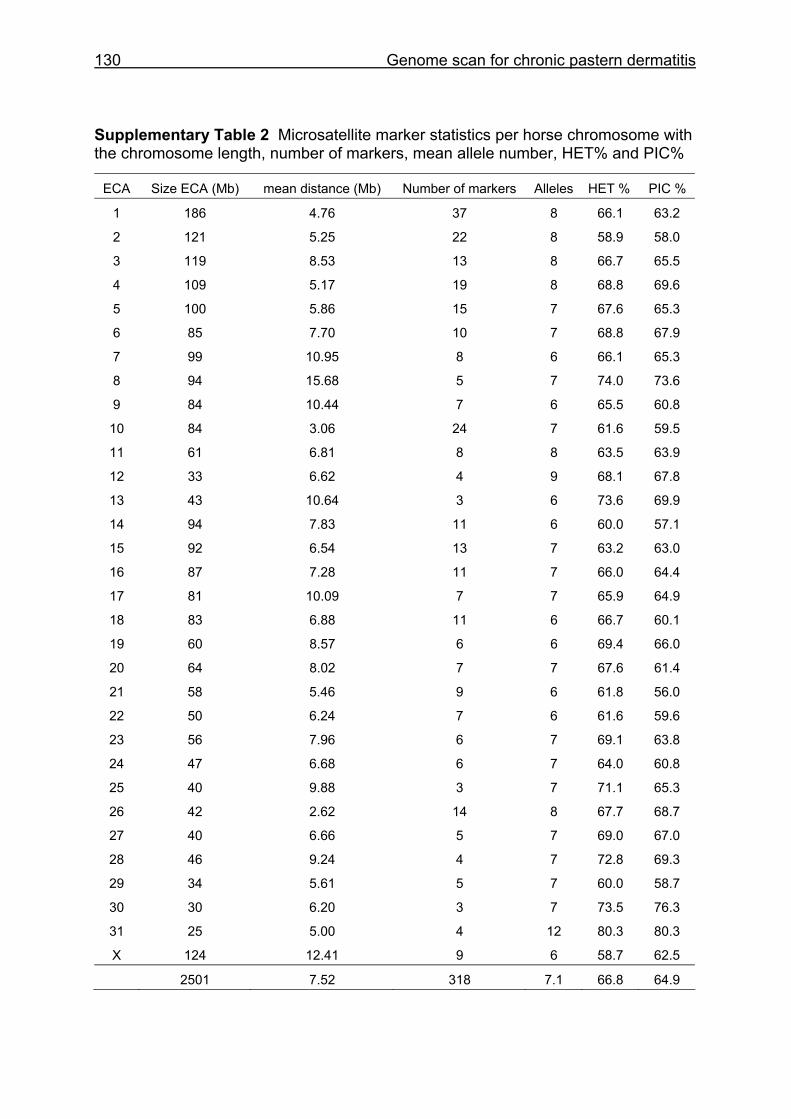
130 Genome scan for chronic pastern dermatitis
Supplementary Table 2 Microsatellite marker statistics per horse chromosome with the chromosome length, number of markers, mean allele number, HET% and PIC%
ECA Size ECA (Mb) mean distance (Mb) Number of markers Alleles HET % PIC %
1 186 4.76 37 8 66.1 63.2
2 121 5.25 22 8 58.9 58.0
3 119 8.53 13 8 66.7 65.5
4 109 5.17 19 8 68.8 69.6
5 100 5.86 15 7 67.6 65.3
6 85 7.70 10 7 68.8 67.9
7 99 10.95 8 6 66.1 65.3
8 94 15.68 5 7 74.0 73.6
9 84 10.44 7 6 65.5 60.8
10 84 3.06 24 7 61.6 59.5
11 61 6.81 8 8 63.5 63.9
12 33 6.62 4 9 68.1 67.8
13 43 10.64 3 6 73.6 69.9
14 94 7.83 11 6 60.0 57.1
15 92 6.54 13 7 63.2 63.0
16 87 7.28 11 7 66.0 64.4
17 81 10.09 7 7 65.9 64.9
18 83 6.88 11 6 66.7 60.1
19 60 8.57 6 6 69.4 66.0
20 64 8.02 7 7 67.6 61.4
21 58 5.46 9 6 61.8 56.0
22 50 6.24 7 6 61.6 59.6
23 56 7.96 6 7 69.1 63.8
24 47 6.68 6 7 64.0 60.8
25 40 9.88 3 7 71.1 65.3
26 42 2.62 14 8 67.7 68.7
27 40 6.66 5 7 69.0 67.0
28 46 9.24 4 7 72.8 69.3
29 34 5.61 5 7 60.0 58.7
30 30 6.20 3 7 73.5 76.3
31 25 5.00 4 12 80.3 80.3
X 124 12.41 9 6 58.7 62.5
2501 7.52 318 7.1 66.8 64.9
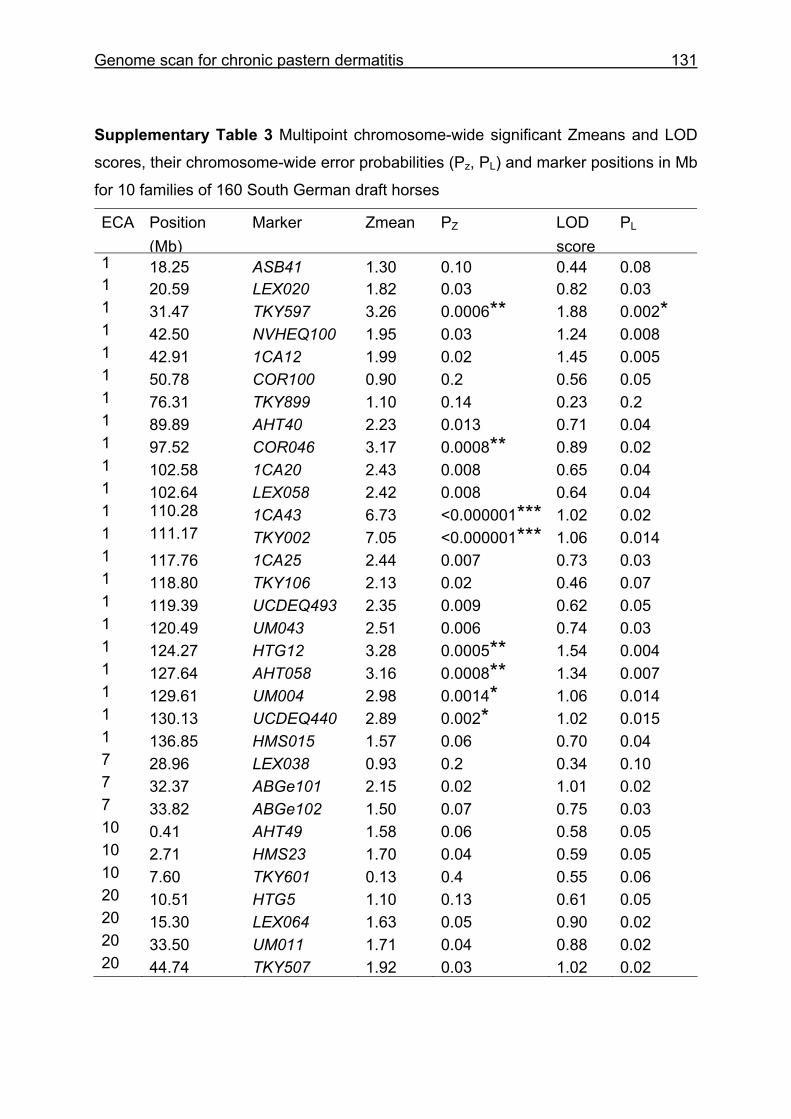
Genome scan for chronic pastern dermatitis 131
Supplementary Table 3 Multipoint chromosome-wide significant Zmeans and LOD
scores, their chromosome-wide error probabilities (Pz, PL) and marker positions in Mb
for 10 families of 160 South German draft horses
ECA Position (Mb)
Marker Zmean PZ LOD score
PL
1 18.25 ASB41 1.30 0.10 0.44 0.08 1 20.59 LEX020 1.82 0.03 0.82 0.03 1 31.47 TKY597 3.26 0.0006** 1.88 0.002*1 42.50 NVHEQ100 1.95 0.03 1.24 0.0081 42.91 1CA12 1.99 0.02 1.45 0.0051 50.78 COR100 0.90 0.2 0.56 0.05 1 76.31 TKY899 1.10 0.14 0.23 0.2 1 89.89 AHT40 2.23 0.013 0.71 0.04 1 97.52 COR046 3.17 0.0008** 0.89 0.02 1 102.58 1CA20 2.43 0.008 0.65 0.04 1 102.64 LEX058 2.42 0.008 0.64 0.04 1 110.28 1CA43 6.73 <0.000001*** 1.02 0.02 1 111.17 TKY002 7.05 <0.000001*** 1.06 0.0141 117.76 1CA25 2.44 0.007 0.73 0.03 1 118.80 TKY106 2.13 0.02 0.46 0.07 1 119.39 UCDEQ493 2.35 0.009 0.62 0.05 1 120.49 UM043 2.51 0.006 0.74 0.03 1 124.27 HTG12 3.28 0.0005** 1.54 0.0041 127.64 AHT058 3.16 0.0008** 1.34 0.0071 129.61 UM004 2.98 0.0014* 1.06 0.0141 130.13 UCDEQ440 2.89 0.002* 1.02 0.0151 136.85 HMS015 1.57 0.06 0.70 0.04 7 28.96 LEX038 0.93 0.2 0.34 0.10 7 32.37 ABGe101 2.15 0.02 1.01 0.02 7 33.82 ABGe102 1.50 0.07 0.75 0.03 10 0.41 AHT49 1.58 0.06 0.58 0.05 10 2.71 HMS23 1.70 0.04 0.59 0.05 10 7.60 TKY601 0.13 0.4 0.55 0.06 20 10.51 HTG5 1.10 0.13 0.61 0.05 20 15.30 LEX064 1.63 0.05 0.90 0.02 20 33.50 UM011 1.71 0.04 0.88 0.02 20 44.74 TKY507 1.92 0.03 1.02 0.02
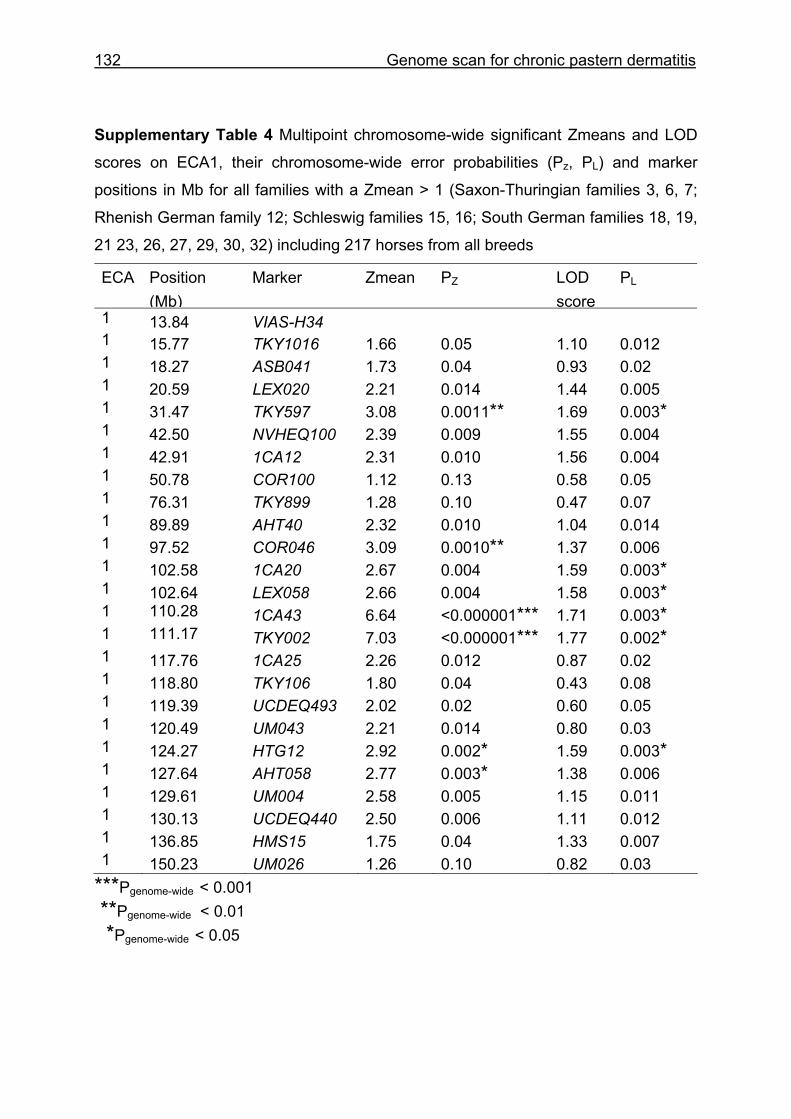
132 Genome scan for chronic pastern dermatitis
Supplementary Table 4 Multipoint chromosome-wide significant Zmeans and LOD
scores on ECA1, their chromosome-wide error probabilities (Pz, PL) and marker
positions in Mb for all families with a Zmean > 1 (Saxon-Thuringian families 3, 6, 7;
Rhenish German family 12; Schleswig families 15, 16; South German families 18, 19,
21 23, 26, 27, 29, 30, 32) including 217 horses from all breeds
ECA Position (Mb)
Marker Zmean PZ LOD score
PL
1 13.84 VIAS-H34 1 15.77 TKY1016 1.66 0.05 1.10 0.0121 18.27 ASB041 1.73 0.04 0.93 0.02 1 20.59 LEX020 2.21 0.014 1.44 0.0051 31.47 TKY597 3.08 0.0011** 1.69 0.003*1 42.50 NVHEQ100 2.39 0.009 1.55 0.0041 42.91 1CA12 2.31 0.010 1.56 0.0041 50.78 COR100 1.12 0.13 0.58 0.05 1 76.31 TKY899 1.28 0.10 0.47 0.07 1 89.89 AHT40 2.32 0.010 1.04 0.0141 97.52 COR046 3.09 0.0010** 1.37 0.0061 102.58 1CA20 2.67 0.004 1.59 0.003*1 102.64 LEX058 2.66 0.004 1.58 0.003*1 110.28 1CA43 6.64 <0.000001*** 1.71 0.003*1 111.17 TKY002 7.03 <0.000001*** 1.77 0.002*1 117.76 1CA25 2.26 0.012 0.87 0.02 1 118.80 TKY106 1.80 0.04 0.43 0.08 1 119.39 UCDEQ493 2.02 0.02 0.60 0.05 1 120.49 UM043 2.21 0.014 0.80 0.03 1 124.27 HTG12 2.92 0.002* 1.59 0.003*1 127.64 AHT058 2.77 0.003* 1.38 0.0061 129.61 UM004 2.58 0.005 1.15 0.0111 130.13 UCDEQ440 2.50 0.006 1.11 0.0121 136.85 HMS15 1.75 0.04 1.33 0.0071 150.23 UM026 1.26 0.10 0.82 0.03
***Pgenome-wide < 0.001 **Pgenome-wide < 0.01 *Pgenome-wide < 0.05
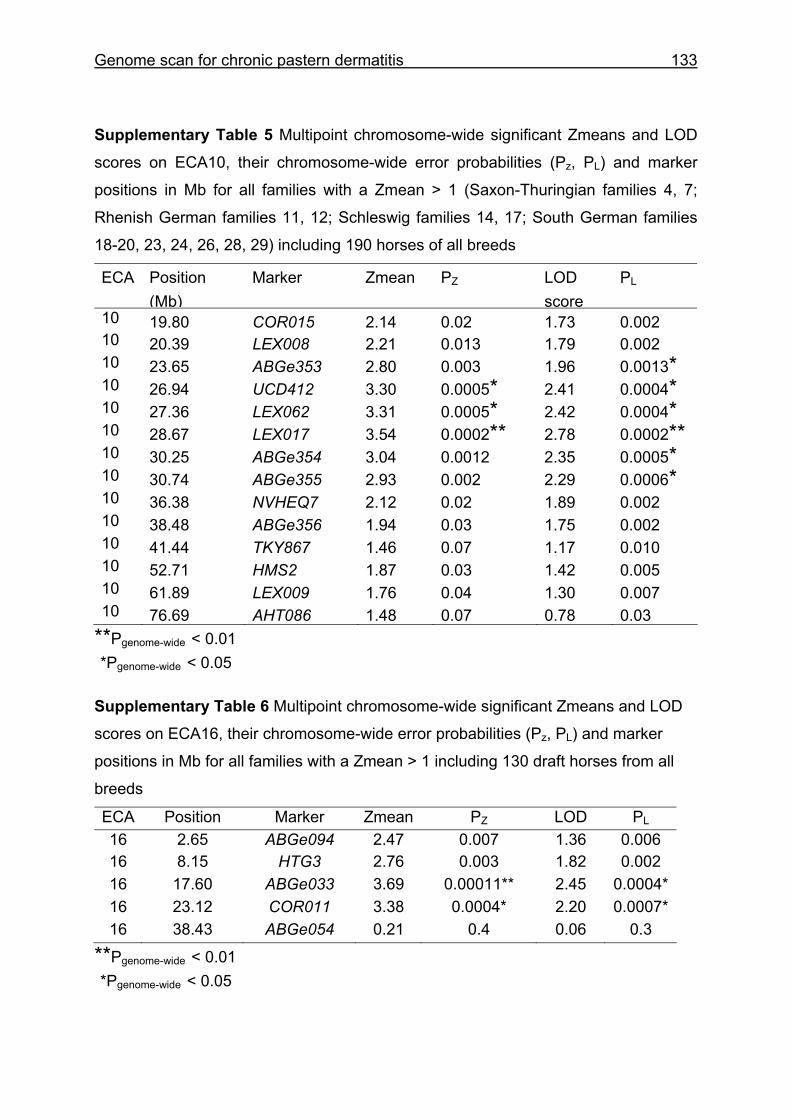
Genome scan for chronic pastern dermatitis 133
Supplementary Table 5 Multipoint chromosome-wide significant Zmeans and LOD
scores on ECA10, their chromosome-wide error probabilities (Pz, PL) and marker
positions in Mb for all families with a Zmean > 1 (Saxon-Thuringian families 4, 7;
Rhenish German families 11, 12; Schleswig families 14, 17; South German families
18-20, 23, 24, 26, 28, 29) including 190 horses of all breeds
ECA Position (Mb)
Marker Zmean PZ LOD score
PL
10 19.80 COR015 2.14 0.02 1.73 0.00210 20.39 LEX008 2.21 0.013 1.79 0.00210 23.65 ABGe353 2.80 0.003 1.96 0.0013*10 26.94 UCD412 3.30 0.0005* 2.41 0.0004*
10 27.36 LEX062 3.31 0.0005* 2.42 0.0004*
10 28.67 LEX017 3.54 0.0002** 2.78 0.0002**10 30.25 ABGe354 3.04 0.0012 2.35 0.0005*
10 30.74 ABGe355 2.93 0.002 2.29 0.0006*10 36.38 NVHEQ7 2.12 0.02 1.89 0.00210 38.48 ABGe356 1.94 0.03 1.75 0.00210 41.44 TKY867 1.46 0.07 1.17 0.01010 52.71 HMS2 1.87 0.03 1.42 0.00510 61.89 LEX009 1.76 0.04 1.30 0.00710 76.69 AHT086 1.48 0.07 0.78 0.03
**Pgenome-wide < 0.01 *Pgenome-wide < 0.05 Supplementary Table 6 Multipoint chromosome-wide significant Zmeans and LOD
scores on ECA16, their chromosome-wide error probabilities (Pz, PL) and marker
positions in Mb for all families with a Zmean > 1 including 130 draft horses from all
breeds
ECA Position Marker Zmean PZ LOD PL
16 2.65 ABGe094 2.47 0.007 1.36 0.006 16 8.15 HTG3 2.76 0.003 1.82 0.002 16 17.60 ABGe033 3.69 0.00011** 2.45 0.0004*16 23.12 COR011 3.38 0.0004* 2.20 0.0007*16 38.43 ABGe054 0.21 0.4 0.06 0.3
**Pgenome-wide < 0.01 *Pgenome-wide < 0.05
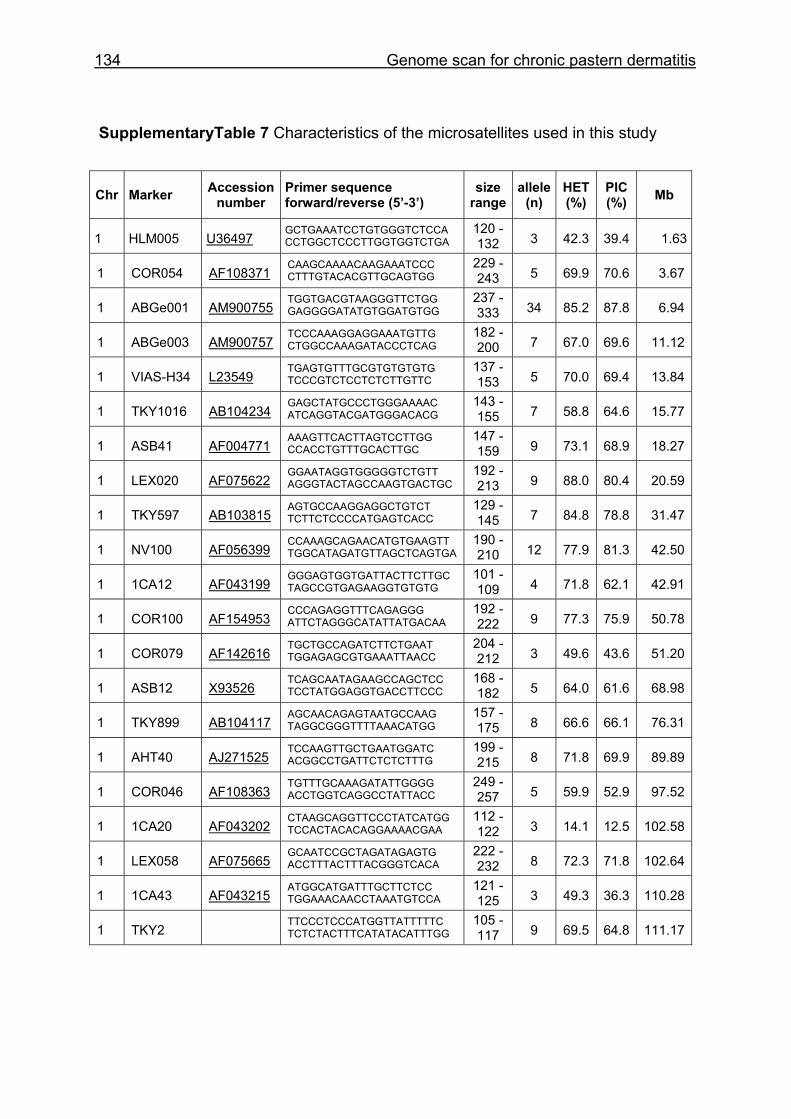
134 Genome scan for chronic pastern dermatitis
SupplementaryTable 7 Characteristics of the microsatellites used in this study
Chr Marker Accession number
Primer sequence forward/reverse (5’-3’)
size range
allele(n)
HET (%)
PIC (%) Mb
1 HLM005 U36497 GCTGAAATCCTGTGGGTCTCCA CCTGGCTCCCTTGGTGGTCTGA
120 - 132 3 42.3 39.4 1.63
1 COR054 AF108371 CAAGCAAAACAAGAAATCCC CTTTGTACACGTTGCAGTGG
229 - 243 5 69.9 70.6 3.67
1 ABGe001 AM900755 TGGTGACGTAAGGGTTCTGG GAGGGGATATGTGGATGTGG
237 - 333 34 85.2 87.8 6.94
1 ABGe003 AM900757 TCCCAAAGGAGGAAATGTTG CTGGCCAAAGATACCCTCAG
182 - 200 7 67.0 69.6 11.12
1 VIAS-H34 L23549 TGAGTGTTTGCGTGTGTGTG TCCCGTCTCCTCTCTTGTTC
137 - 153 5 70.0 69.4 13.84
1 TKY1016 AB104234 GAGCTATGCCCTGGGAAAAC ATCAGGTACGATGGGACACG
143 - 155 7 58.8 64.6 15.77
1 ASB41 AF004771 AAAGTTCACTTAGTCCTTGG CCACCTGTTTGCACTTGC
147 - 159 9 73.1 68.9 18.27
1 LEX020 AF075622 GGAATAGGTGGGGGTCTGTT AGGGTACTAGCCAAGTGACTGC
192 - 213 9 88.0 80.4 20.59
1 TKY597 AB103815 AGTGCCAAGGAGGCTGTCT TCTTCTCCCCATGAGTCACC
129 - 145 7 84.8 78.8 31.47
1 NV100 AF056399 CCAAAGCAGAACATGTGAAGTT TGGCATAGATGTTAGCTCAGTGA
190 - 210 12 77.9 81.3 42.50
1 1CA12 AF043199 GGGAGTGGTGATTACTTCTTGC TAGCCGTGAGAAGGTGTGTG
101 - 109 4 71.8 62.1 42.91
1 COR100 AF154953 CCCAGAGGTTTCAGAGGG ATTCTAGGGCATATTATGACAA
192 - 222 9 77.3 75.9 50.78
1 COR079 AF142616 TGCTGCCAGATCTTCTGAAT TGGAGAGCGTGAAATTAACC
204 - 212 3 49.6 43.6 51.20
1 ASB12 X93526 TCAGCAATAGAAGCCAGCTCC TCCTATGGAGGTGACCTTCCC
168 - 182 5 64.0 61.6 68.98
1 TKY899 AB104117 AGCAACAGAGTAATGCCAAG TAGGCGGGTTTTAAACATGG
157 - 175 8 66.6 66.1 76.31
1 AHT40 AJ271525 TCCAAGTTGCTGAATGGATC ACGGCCTGATTCTCTCTTTG
199 - 215 8 71.8 69.9 89.89
1 COR046 AF108363 TGTTTGCAAAGATATTGGGG ACCTGGTCAGGCCTATTACC
249 - 257 5 59.9 52.9 97.52
1 1CA20 AF043202 CTAAGCAGGTTCCCTATCATGG TCCACTACACAGGAAAACGAA
112 - 122 3 14.1 12.5 102.58
1 LEX058 AF075665 GCAATCCGCTAGATAGAGTG ACCTTTACTTTACGGGTCACA
222 - 232 8 72.3 71.8 102.64
1 1CA43 AF043215 ATGGCATGATTTGCTTCTCC TGGAAACAACCTAAATGTCCA
121 - 125 3 49.3 36.3 110.28
1 TKY2 TTCCCTCCCATGGTTATTTTTC TCTCTACTTTCATATACATTTGG
105 - 117 9 69.5 64.8 111.17
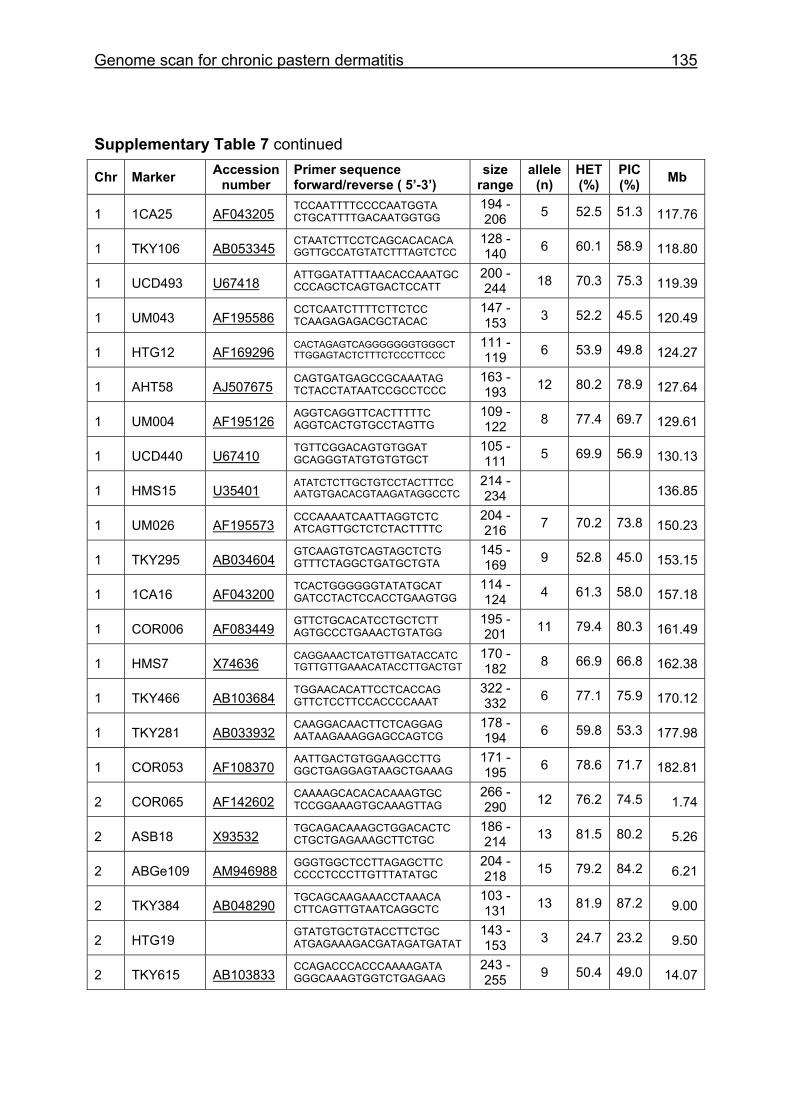
Genome scan for chronic pastern dermatitis 135
Supplementary Table 7 continued
Chr Marker Accession number
Primer sequence forward/reverse ( 5’-3’)
size range
allele (n)
HET (%)
PIC (%) Mb
1 1CA25 AF043205 TCCAATTTTCCCCAATGGTA CTGCATTTTGACAATGGTGG
194 - 206 5 52.5 51.3 117.76
1 TKY106 AB053345 CTAATCTTCCTCAGCACACACA GGTTGCCATGTATCTTTAGTCTCC
128 - 140 6 60.1 58.9 118.80
1 UCD493 U67418 ATTGGATATTTAACACCAAATGC CCCAGCTCAGTGACTCCATT
200 - 244 18 70.3 75.3 119.39
1 UM043 AF195586 CCTCAATCTTTTCTTCTCC TCAAGAGAGACGCTACAC
147 - 153 3 52.2 45.5 120.49
1 HTG12 AF169296 CACTAGAGTCAGGGGGGGTGGGCT TTGGAGTACTCTTTCTCCCTTCCC
111 - 119 6 53.9 49.8 124.27
1 AHT58 AJ507675 CAGTGATGAGCCGCAAATAG TCTACCTATAATCCGCCTCCC
163 - 193 12 80.2 78.9 127.64
1 UM004 AF195126 AGGTCAGGTTCACTTTTTC AGGTCACTGTGCCTAGTTG
109 - 122 8 77.4 69.7 129.61
1 UCD440 U67410 TGTTCGGACAGTGTGGAT GCAGGGTATGTGTGTGCT
105 - 111 5 69.9 56.9 130.13
1 HMS15 U35401 ATATCTCTTGCTGTCCTACTTTCC AATGTGACACGTAAGATAGGCCTC
214 - 234 136.85
1 UM026 AF195573 CCCAAAATCAATTAGGTCTC ATCAGTTGCTCTCTACTTTTC
204 - 216 7 70.2 73.8 150.23
1 TKY295 AB034604 GTCAAGTGTCAGTAGCTCTG GTTTCTAGGCTGATGCTGTA
145 - 169 9 52.8 45.0 153.15
1 1CA16 AF043200 TCACTGGGGGGTATATGCAT GATCCTACTCCACCTGAAGTGG
114 - 124 4 61.3 58.0 157.18
1 COR006 AF083449 GTTCTGCACATCCTGCTCTT AGTGCCCTGAAACTGTATGG
195 - 201 11 79.4 80.3 161.49
1 HMS7 X74636 CAGGAAACTCATGTTGATACCATC TGTTGTTGAAACATACCTTGACTGT
170 - 182 8 66.9 66.8 162.38
1 TKY466 AB103684 TGGAACACATTCCTCACCAG GTTCTCCTTCCACCCCAAAT
322 - 332 6 77.1 75.9 170.12
1 TKY281 AB033932 CAAGGACAACTTCTCAGGAG AATAAGAAAGGAGCCAGTCG
178 - 194 6 59.8 53.3 177.98
1 COR053 AF108370 AATTGACTGTGGAAGCCTTG GGCTGAGGAGTAAGCTGAAAG
171 - 195 6 78.6 71.7 182.81
2 COR065 AF142602 CAAAAGCACACACAAAGTGC TCCGGAAAGTGCAAAGTTAG
266 - 290 12 76.2 74.5 1.74
2 ASB18 X93532 TGCAGACAAAGCTGGACACTC CTGCTGAGAAAGCTTCTGC
186 - 214 13 81.5 80.2 5.26
2 ABGe109 AM946988 GGGTGGCTCCTTAGAGCTTC CCCCTCCCTTGTTTATATGC
204 - 218 15 79.2 84.2 6.21
2 TKY384 AB048290 TGCAGCAAGAAACCTAAACA CTTCAGTTGTAATCAGGCTC
103 - 131 13 81.9 87.2 9.00
2 HTG19 GTATGTGCTGTACCTTCTGC ATGAGAAAGACGATAGATGATAT
143 - 153 3 24.7 23.2 9.50
2 TKY615 AB103833 CCAGACCCACCCAAAAGATA GGGCAAAGTGGTCTGAGAAG
243 - 255 9 50.4 49.0 14.07
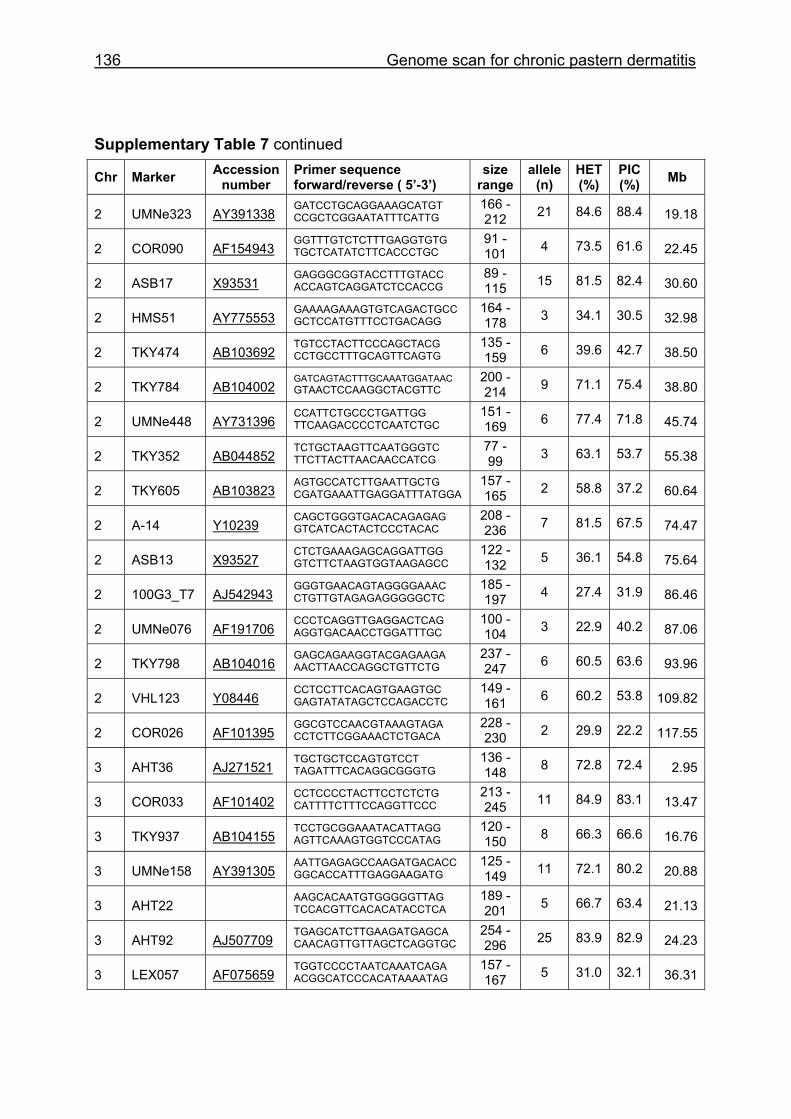
136 Genome scan for chronic pastern dermatitis
Supplementary Table 7 continued
Chr Marker Accession number
Primer sequence forward/reverse ( 5’-3’)
size range
allele (n)
HET (%)
PIC (%) Mb
2 UMNe323 AY391338 GATCCTGCAGGAAAGCATGT CCGCTCGGAATATTTCATTG
166 - 212 21 84.6 88.4 19.18
2 COR090 AF154943 GGTTTGTCTCTTTGAGGTGTG TGCTCATATCTTCACCCTGC
91 - 101 4 73.5 61.6 22.45
2 ASB17 X93531 GAGGGCGGTACCTTTGTACC ACCAGTCAGGATCTCCACCG
89 - 115 15 81.5 82.4 30.60
2 HMS51 AY775553 GAAAAGAAAGTGTCAGACTGCC GCTCCATGTTTCCTGACAGG
164 - 178 3 34.1 30.5 32.98
2 TKY474 AB103692 TGTCCTACTTCCCAGCTACG CCTGCCTTTGCAGTTCAGTG
135 - 159 6 39.6 42.7 38.50
2 TKY784 AB104002 GATCAGTACTTTGCAAATGGATAAC GTAACTCCAAGGCTACGTTC
200 - 214 9 71.1 75.4 38.80
2 UMNe448 AY731396 CCATTCTGCCCTGATTGG TTCAAGACCCCTCAATCTGC
151 - 169 6 77.4 71.8 45.74
2 TKY352 AB044852 TCTGCTAAGTTCAATGGGTC TTCTTACTTAACAACCATCG
77 - 99 3 63.1 53.7 55.38
2 TKY605 AB103823 AGTGCCATCTTGAATTGCTG CGATGAAATTGAGGATTTATGGA
157 - 165 2 58.8 37.2 60.64
2 A-14 Y10239 CAGCTGGGTGACACAGAGAG GTCATCACTACTCCCTACAC
208 - 236 7 81.5 67.5 74.47
2 ASB13 X93527 CTCTGAAAGAGCAGGATTGG GTCTTCTAAGTGGTAAGAGCC
122 - 132 5 36.1 54.8 75.64
2 100G3_T7 AJ542943 GGGTGAACAGTAGGGGAAAC CTGTTGTAGAGAGGGGGCTC
185 - 197 4 27.4 31.9 86.46
2 UMNe076 AF191706 CCCTCAGGTTGAGGACTCAG AGGTGACAACCTGGATTTGC
100 - 104 3 22.9 40.2 87.06
2 TKY798 AB104016 GAGCAGAAGGTACGAGAAGA AACTTAACCAGGCTGTTCTG
237 - 247 6 60.5 63.6 93.96
2 VHL123 Y08446 CCTCCTTCACAGTGAAGTGC GAGTATATAGCTCCAGACCTC
149 - 161 6 60.2 53.8 109.82
2 COR026 AF101395 GGCGTCCAACGTAAAGTAGA CCTCTTCGGAAACTCTGACA
228 - 230 2 29.9 22.2 117.55
3 AHT36 AJ271521 TGCTGCTCCAGTGTCCT TAGATTTCACAGGCGGGTG
136 - 148 8 72.8 72.4 2.95
3 COR033 AF101402 CCTCCCCTACTTCCTCTCTG CATTTTCTTTCCAGGTTCCC
213 - 245 11 84.9 83.1 13.47
3 TKY937 AB104155 TCCTGCGGAAATACATTAGG AGTTCAAAGTGGTCCCATAG
120 - 150 8 66.3 66.6 16.76
3 UMNe158 AY391305 AATTGAGAGCCAAGATGACACC GGCACCATTTGAGGAAGATG
125 - 149 11 72.1 80.2 20.88
3 AHT22 AAGCACAATGTGGGGGTTAG TCCACGTTCACACATACCTCA
189 - 201 5 66.7 63.4 21.13
3 AHT92 AJ507709 TGAGCATCTTGAAGATGAGCA CAACAGTTGTTAGCTCAGGTGC
254 - 296 25 83.9 82.9 24.23
3 LEX057 AF075659 TGGTCCCCTAATCAAATCAGA ACGGCATCCCACATAAAATAG
157 - 167 5 31.0 32.1 36.31
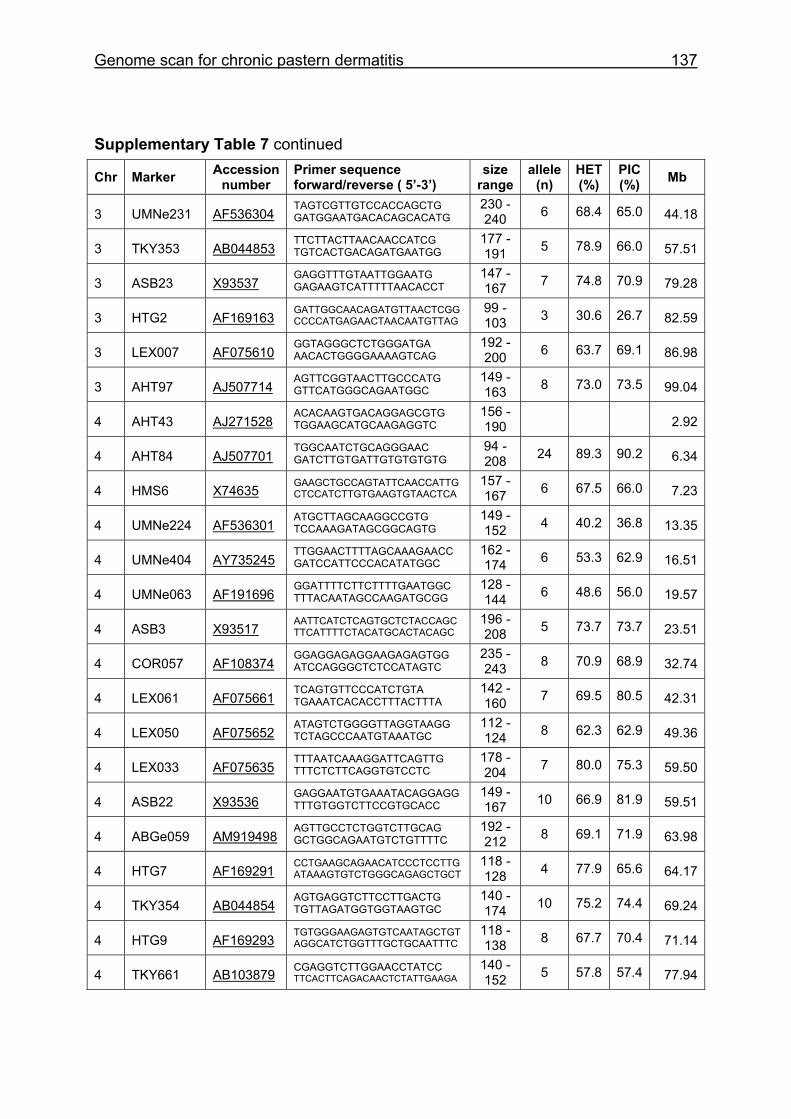
Genome scan for chronic pastern dermatitis 137
Supplementary Table 7 continued
Chr Marker Accession number
Primer sequence forward/reverse ( 5’-3’)
size range
allele (n)
HET (%)
PIC (%) Mb
3 UMNe231 AF536304 TAGTCGTTGTCCACCAGCTG GATGGAATGACACAGCACATG
230 - 240 6 68.4 65.0 44.18
3 TKY353 AB044853 TTCTTACTTAACAACCATCG TGTCACTGACAGATGAATGG
177 - 191 5 78.9 66.0 57.51
3 ASB23 X93537 GAGGTTTGTAATTGGAATG GAGAAGTCATTTTTAACACCT
147 - 167 7 74.8 70.9 79.28
3 HTG2 AF169163 GATTGGCAACAGATGTTAACTCGG CCCCATGAGAACTAACAATGTTAG
99 - 103 3 30.6 26.7 82.59
3 LEX007 AF075610 GGTAGGGCTCTGGGATGA AACACTGGGGAAAAGTCAG
192 - 200 6 63.7 69.1 86.98
3 AHT97 AJ507714 AGTTCGGTAACTTGCCCATG GTTCATGGGCAGAATGGC
149 - 163 8 73.0 73.5 99.04
4 AHT43 AJ271528 ACACAAGTGACAGGAGCGTG TGGAAGCATGCAAGAGGTC
156 - 190 2.92
4 AHT84 AJ507701 TGGCAATCTGCAGGGAAC GATCTTGTGATTGTGTGTGTG
94 - 208 24 89.3 90.2 6.34
4 HMS6 X74635 GAAGCTGCCAGTATTCAACCATTG CTCCATCTTGTGAAGTGTAACTCA
157 - 167 6 67.5 66.0 7.23
4 UMNe224 AF536301 ATGCTTAGCAAGGCCGTG TCCAAAGATAGCGGCAGTG
149 - 152 4 40.2 36.8 13.35
4 UMNe404 AY735245 TTGGAACTTTTAGCAAAGAACC GATCCATTCCCACATATGGC
162 - 174 6 53.3 62.9 16.51
4 UMNe063 AF191696 GGATTTTCTTCTTTTGAATGGC TTTACAATAGCCAAGATGCGG
128 - 144 6 48.6 56.0 19.57
4 ASB3 X93517 AATTCATCTCAGTGCTCTACCAGC TTCATTTTCTACATGCACTACAGC
196 - 208 5 73.7 73.7 23.51
4 COR057 AF108374 GGAGGAGAGGAAGAGAGTGG ATCCAGGGCTCTCCATAGTC
235 - 243 8 70.9 68.9 32.74
4 LEX061 AF075661 TCAGTGTTCCCATCTGTA TGAAATCACACCTTTACTTTA
142 - 160 7 69.5 80.5 42.31
4 LEX050 AF075652 ATAGTCTGGGGTTAGGTAAGG TCTAGCCCAATGTAAATGC
112 - 124 8 62.3 62.9 49.36
4 LEX033 AF075635 TTTAATCAAAGGATTCAGTTG TTTCTCTTCAGGTGTCCTC
178 - 204 7 80.0 75.3 59.50
4 ASB22 X93536 GAGGAATGTGAAATACAGGAGG TTTGTGGTCTTCCGTGCACC
149 - 167 10 66.9 81.9 59.51
4 ABGe059 AM919498 AGTTGCCTCTGGTCTTGCAG GCTGGCAGAATGTCTGTTTTC
192 - 212 8 69.1 71.9 63.98
4 HTG7 AF169291 CCTGAAGCAGAACATCCCTCCTTG ATAAAGTGTCTGGGCAGAGCTGCT
118 - 128 4 77.9 65.6 64.17
4 TKY354 AB044854 AGTGAGGTCTTCCTTGACTG TGTTAGATGGTGGTAAGTGC
140 - 174 10 75.2 74.4 69.24
4 HTG9 AF169293 TGTGGGAAGAGTGTCAATAGCTGT AGGCATCTGGTTTGCTGCAATTTC
118 - 138 8 67.7 70.4 71.14
4 TKY661 AB103879 CGAGGTCTTGGAACCTATCC TTCACTTCAGACAACTCTATTGAAGA
140 - 152 5 57.8 57.4 77.94
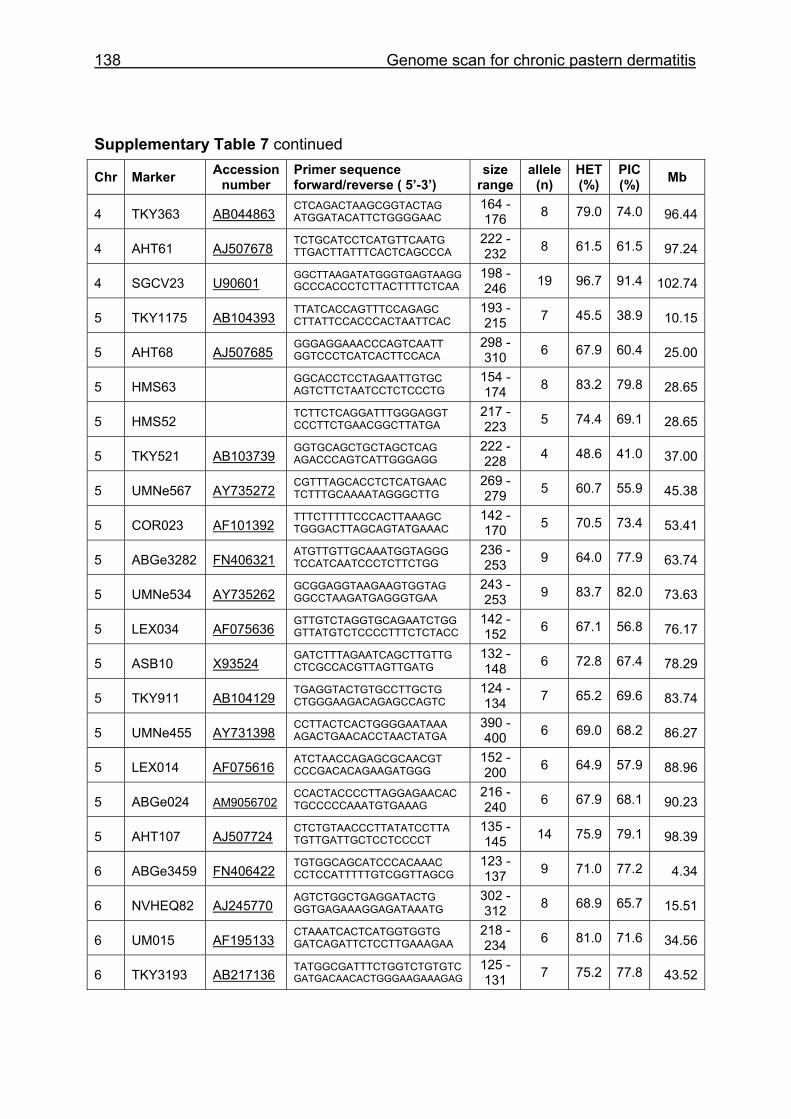
138 Genome scan for chronic pastern dermatitis
Supplementary Table 7 continued
Chr Marker Accession number
Primer sequence forward/reverse ( 5’-3’)
size range
allele (n)
HET (%)
PIC (%) Mb
4 TKY363 AB044863 CTCAGACTAAGCGGTACTAG ATGGATACATTCTGGGGAAC
164 - 176 8 79.0 74.0 96.44
4 AHT61 AJ507678 TCTGCATCCTCATGTTCAATG TTGACTTATTTCACTCAGCCCA
222 - 232 8 61.5 61.5 97.24
4 SGCV23 U90601 GGCTTAAGATATGGGTGAGTAAGG GCCCACCCTCTTACTTTTCTCAA
198 - 246 19 96.7 91.4 102.74
5 TKY1175 AB104393 TTATCACCAGTTTCCAGAGC CTTATTCCACCCACTAATTCAC
193 - 215 7 45.5 38.9 10.15
5 AHT68 AJ507685 GGGAGGAAACCCAGTCAATT GGTCCCTCATCACTTCCACA
298 - 310 6 67.9 60.4 25.00
5 HMS63 GGCACCTCCTAGAATTGTGC AGTCTTCTAATCCTCTCCCTG
154 - 174 8 83.2 79.8 28.65
5 HMS52 TCTTCTCAGGATTTGGGAGGT CCCTTCTGAACGGCTTATGA
217 - 223 5 74.4 69.1 28.65
5 TKY521 AB103739 GGTGCAGCTGCTAGCTCAG AGACCCAGTCATTGGGAGG
222 - 228 4 48.6 41.0 37.00
5 UMNe567 AY735272 CGTTTAGCACCTCTCATGAAC TCTTTGCAAAATAGGGCTTG
269 - 279 5 60.7 55.9 45.38
5 COR023 AF101392 TTTCTTTTTCCCACTTAAAGC TGGGACTTAGCAGTATGAAAC
142 - 170 5 70.5 73.4 53.41
5 ABGe3282 FN406321 ATGTTGTTGCAAATGGTAGGG TCCATCAATCCCTCTTCTGG
236 - 253 9 64.0 77.9 63.74
5 UMNe534 AY735262 GCGGAGGTAAGAAGTGGTAG GGCCTAAGATGAGGGTGAA
243 - 253 9 83.7 82.0 73.63
5 LEX034 AF075636 GTTGTCTAGGTGCAGAATCTGG GTTATGTCTCCCCTTTCTCTACC
142 - 152 6 67.1 56.8 76.17
5 ASB10 X93524 GATCTTTAGAATCAGCTTGTTG CTCGCCACGTTAGTTGATG
132 - 148 6 72.8 67.4 78.29
5 TKY911 AB104129 TGAGGTACTGTGCCTTGCTG CTGGGAAGACAGAGCCAGTC
124 - 134 7 65.2 69.6 83.74
5 UMNe455 AY731398 CCTTACTCACTGGGGAATAAA AGACTGAACACCTAACTATGA
390 - 400 6 69.0 68.2 86.27
5 LEX014 AF075616 ATCTAACCAGAGCGCAACGT CCCGACACAGAAGATGGG
152 - 200 6 64.9 57.9 88.96
5 ABGe024 AM9056702 CCACTACCCCTTAGGAGAACAC TGCCCCCAAATGTGAAAG
216 - 240 6 67.9 68.1 90.23
5 AHT107 AJ507724 CTCTGTAACCCTTATATCCTTA TGTTGATTGCTCCTCCCCT
135 - 145 14 75.9 79.1 98.39
6 ABGe3459 FN406422 TGTGGCAGCATCCCACAAAC CCTCCATTTTTGTCGGTTAGCG
123 - 137 9 71.0 77.2 4.34
6 NVHEQ82 AJ245770 AGTCTGGCTGAGGATACTG GGTGAGAAAGGAGATAAATG
302 - 312 8 68.9 65.7 15.51
6 UM015 AF195133 CTAAATCACTCATGGTGGTG GATCAGATTCTCCTTGAAAGAA
218 - 234 6 81.0 71.6 34.56
6 TKY3193 AB217136 TATGGCGATTTCTGGTCTGTGTC GATGACAACACTGGGAAGAAAGAG
125 - 131 7 75.2 77.8 43.52
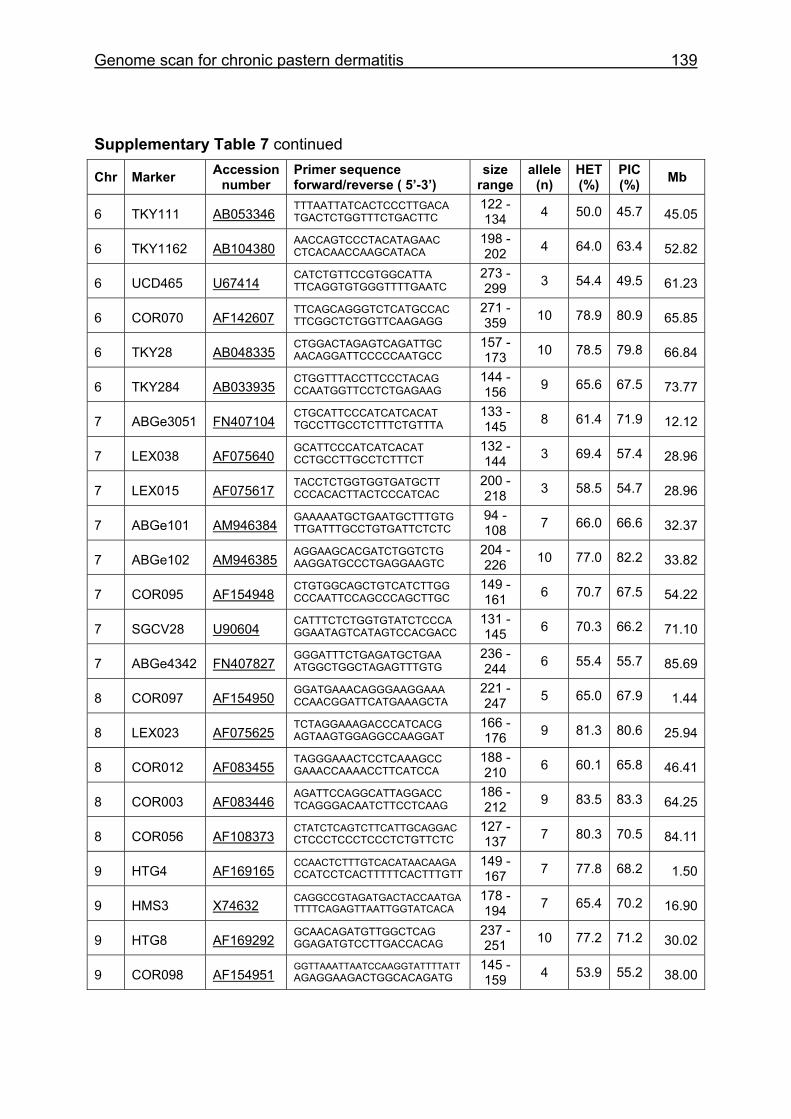
Genome scan for chronic pastern dermatitis 139
Supplementary Table 7 continued
Chr Marker Accession number
Primer sequence forward/reverse ( 5’-3’)
size range
allele (n)
HET (%)
PIC (%) Mb
6 TKY111 AB053346 TTTAATTATCACTCCCTTGACA TGACTCTGGTTTCTGACTTC
122 - 134 4 50.0 45.7 45.05
6 TKY1162 AB104380 AACCAGTCCCTACATAGAAC CTCACAACCAAGCATACA
198 - 202 4 64.0 63.4 52.82
6 UCD465 U67414 CATCTGTTCCGTGGCATTA TTCAGGTGTGGGTTTTGAATC
273 - 299 3 54.4 49.5 61.23
6 COR070 AF142607 TTCAGCAGGGTCTCATGCCAC TTCGGCTCTGGTTCAAGAGG
271 - 359 10 78.9 80.9 65.85
6 TKY28 AB048335 CTGGACTAGAGTCAGATTGC AACAGGATTCCCCCAATGCC
157 - 173 10 78.5 79.8 66.84
6 TKY284 AB033935 CTGGTTTACCTTCCCTACAG CCAATGGTTCCTCTGAGAAG
144 - 156 9 65.6 67.5 73.77
7 ABGe3051 FN407104 CTGCATTCCCATCATCACAT TGCCTTGCCTCTTTCTGTTTA
133 - 145 8 61.4 71.9 12.12
7 LEX038 AF075640 GCATTCCCATCATCACAT CCTGCCTTGCCTCTTTCT
132 - 144 3 69.4 57.4 28.96
7 LEX015 AF075617 TACCTCTGGTGGTGATGCTT CCCACACTTACTCCCATCAC
200 - 218 3 58.5 54.7 28.96
7 ABGe101 AM946384 GAAAAATGCTGAATGCTTTGTG TTGATTTGCCTGTGATTCTCTC
94 - 108 7 66.0 66.6 32.37
7 ABGe102 AM946385 AGGAAGCACGATCTGGTCTG AAGGATGCCCTGAGGAAGTC
204 - 226 10 77.0 82.2 33.82
7 COR095 AF154948 CTGTGGCAGCTGTCATCTTGG CCCAATTCCAGCCCAGCTTGC
149 - 161 6 70.7 67.5 54.22
7 SGCV28 U90604 CATTTCTCTGGTGTATCTCCCA GGAATAGTCATAGTCCACGACC
131 - 145 6 70.3 66.2 71.10
7 ABGe4342 FN407827 GGGATTTCTGAGATGCTGAA ATGGCTGGCTAGAGTTTGTG
236 - 244 6 55.4 55.7 85.69
8 COR097 AF154950 GGATGAAACAGGGAAGGAAA CCAACGGATTCATGAAAGCTA
221 - 247 5 65.0 67.9 1.44
8 LEX023 AF075625 TCTAGGAAAGACCCATCACG AGTAAGTGGAGGCCAAGGAT
166 - 176 9 81.3 80.6 25.94
8 COR012 AF083455 TAGGGAAACTCCTCAAAGCC GAAACCAAAACCTTCATCCA
188 - 210 6 60.1 65.8 46.41
8 COR003 AF083446 AGATTCCAGGCATTAGGACC TCAGGGACAATCTTCCTCAAG
186 - 212 9 83.5 83.3 64.25
8 COR056 AF108373 CTATCTCAGTCTTCATTGCAGGAC CTCCCTCCCTCCCTCTGTTCTC
127 - 137 7 80.3 70.5 84.11
9 HTG4 AF169165 CCAACTCTTTGTCACATAACAAGA CCATCCTCACTTTTTCACTTTGTT
149 - 167 7 77.8 68.2 1.50
9 HMS3 X74632 CAGGCCGTAGATGACTACCAATGA TTTTCAGAGTTAATTGGTATCACA
178 - 194 7 65.4 70.2 16.90
9 HTG8 AF169292 GCAACAGATGTTGGCTCAG GGAGATGTCCTTGACCACAG
237 - 251 10 77.2 71.2 30.02
9 COR098 AF154951 GGTTAAATTAATCCAAGGTATTTTATT AGAGGAAGACTGGCACAGATG
145 - 159 4 53.9 55.2 38.00
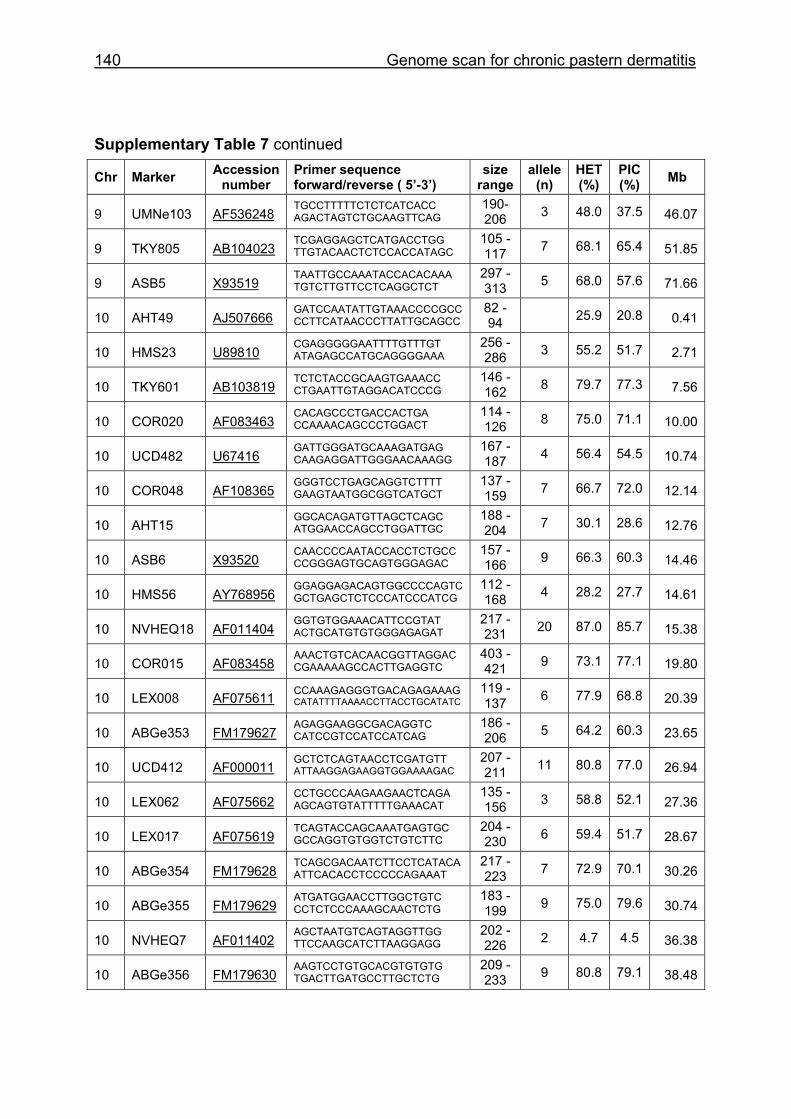
140 Genome scan for chronic pastern dermatitis
Supplementary Table 7 continued
Chr Marker Accession number
Primer sequence forward/reverse ( 5’-3’)
size range
allele (n)
HET (%)
PIC (%) Mb
9 UMNe103 AF536248 TGCCTTTTTCTCTCATCACC AGACTAGTCTGCAAGTTCAG
190-206 3 48.0 37.5 46.07
9 TKY805 AB104023 TCGAGGAGCTCATGACCTGG TTGTACAACTCTCCACCATAGC
105 - 117 7 68.1 65.4 51.85
9 ASB5 X93519 TAATTGCCAAATACCACACAAA TGTCTTGTTCCTCAGGCTCT
297 - 313 5 68.0 57.6 71.66
10 AHT49 AJ507666 GATCCAATATTGTAAACCCCGCC CCTTCATAACCCTTATTGCAGCC
82 - 94 25.9 20.8 0.41
10 HMS23 U89810 CGAGGGGGAATTTTGTTTGT ATAGAGCCATGCAGGGGAAA
256 - 286 3 55.2 51.7 2.71
10 TKY601 AB103819 TCTCTACCGCAAGTGAAACC CTGAATTGTAGGACATCCCG
146 - 162 8 79.7 77.3 7.56
10 COR020 AF083463 CACAGCCCTGACCACTGA CCAAAACAGCCCTGGACT
114 - 126 8 75.0 71.1 10.00
10 UCD482 U67416 GATTGGGATGCAAAGATGAG CAAGAGGATTGGGAACAAAGG
167 - 187 4 56.4 54.5 10.74
10 COR048 AF108365 GGGTCCTGAGCAGGTCTTTT GAAGTAATGGCGGTCATGCT
137 - 159 7 66.7 72.0 12.14
10 AHT15 GGCACAGATGTTAGCTCAGC ATGGAACCAGCCTGGATTGC
188 - 204 7 30.1 28.6 12.76
10 ASB6 X93520 CAACCCCAATACCACCTCTGCC CCGGGAGTGCAGTGGGAGAC
157 - 166 9 66.3 60.3 14.46
10 HMS56 AY768956 GGAGGAGACAGTGGCCCCAGTC GCTGAGCTCTCCCATCCCATCG
112 - 168 4 28.2 27.7 14.61
10 NVHEQ18 AF011404 GGTGTGGAAACATTCCGTAT ACTGCATGTGTGGGAGAGAT
217 - 231 20 87.0 85.7 15.38
10 COR015 AF083458 AAACTGTCACAACGGTTAGGAC CGAAAAAGCCACTTGAGGTC
403 - 421 9 73.1 77.1 19.80
10 LEX008 AF075611 CCAAAGAGGGTGACAGAGAAAG CATATTTTAAAACCTTACCTGCATATC
119 - 137 6 77.9 68.8 20.39
10 ABGe353 FM179627 AGAGGAAGGCGACAGGTC CATCCGTCCATCCATCAG
186 - 206 5 64.2 60.3 23.65
10 UCD412 AF000011 GCTCTCAGTAACCTCGATGTT ATTAAGGAGAAGGTGGAAAAGAC
207 - 211 11 80.8 77.0 26.94
10 LEX062 AF075662 CCTGCCCAAGAAGAACTCAGA AGCAGTGTATTTTTGAAACAT
135 - 156 3 58.8 52.1 27.36
10 LEX017 AF075619 TCAGTACCAGCAAATGAGTGC GCCAGGTGTGGTCTGTCTTC
204 -230 6 59.4 51.7 28.67
10 ABGe354 FM179628 TCAGCGACAATCTTCCTCATACA ATTCACACCTCCCCCAGAAAT
217 - 223 7 72.9 70.1 30.26
10 ABGe355 FM179629 ATGATGGAACCTTGGCTGTC CCTCTCCCAAAGCAACTCTG
183 - 199 9 75.0 79.6 30.74
10 NVHEQ7 AF011402 AGCTAATGTCAGTAGGTTGG TTCCAAGCATCTTAAGGAGG
202 - 226 2 4.7 4.5 36.38
10 ABGe356 FM179630 AAGTCCTGTGCACGTGTGTG TGACTTGATGCCTTGCTCTG
209 - 233 9 80.8 79.1 38.48
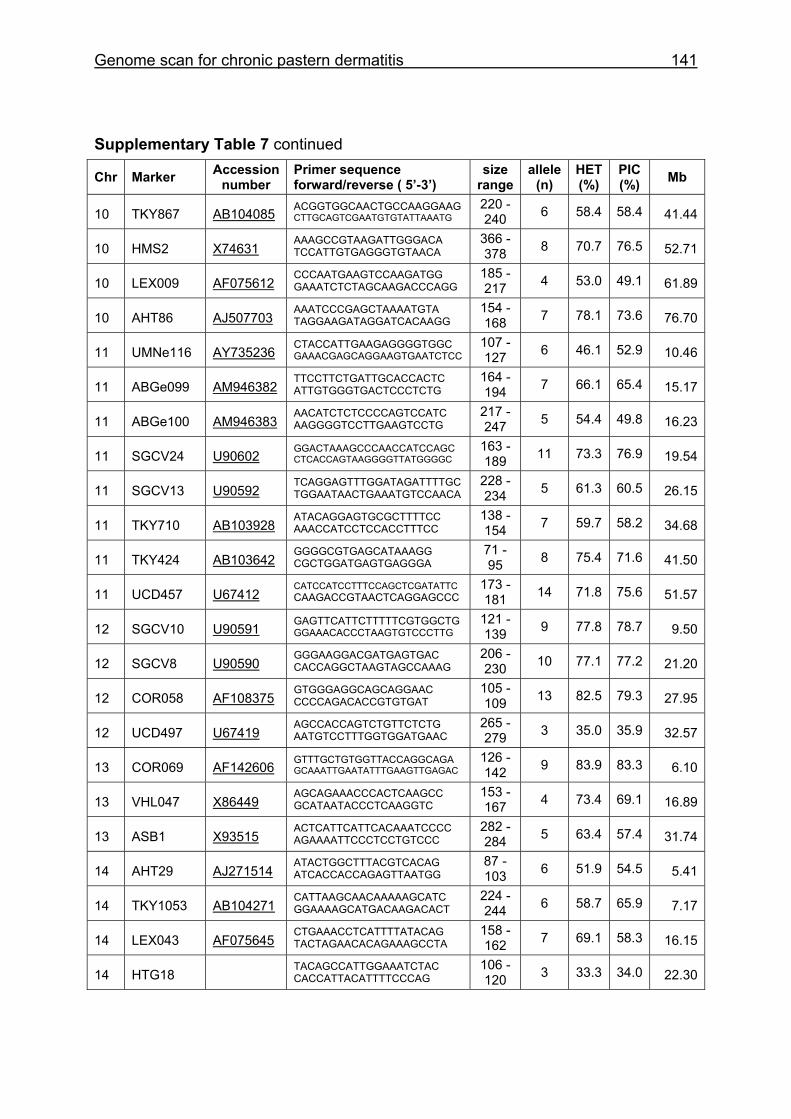
Genome scan for chronic pastern dermatitis 141
Supplementary Table 7 continued
Chr Marker Accession number
Primer sequence forward/reverse ( 5’-3’)
size range
allele (n)
HET (%)
PIC (%) Mb
10 TKY867 AB104085 ACGGTGGCAACTGCCAAGGAAG CTTGCAGTCGAATGTGTATTAAATG
220 - 240 6 58.4 58.4 41.44
10 HMS2 X74631 AAAGCCGTAAGATTGGGACA TCCATTGTGAGGGTGTAACA
366 - 378 8 70.7 76.5 52.71
10 LEX009 AF075612 CCCAATGAAGTCCAAGATGG GAAATCTCTAGCAAGACCCAGG
185 - 217 4 53.0 49.1 61.89
10 AHT86 AJ507703 AAATCCCGAGCTAAAATGTA TAGGAAGATAGGATCACAAGG
154 - 168 7 78.1 73.6 76.70
11 UMNe116 AY735236 CTACCATTGAAGAGGGGTGGC GAAACGAGCAGGAAGTGAATCTCC
107 - 127 6 46.1 52.9 10.46
11 ABGe099 AM946382 TTCCTTCTGATTGCACCACTC ATTGTGGGTGACTCCCTCTG
164 - 194 7 66.1 65.4 15.17
11 ABGe100 AM946383 AACATCTCTCCCCAGTCCATC AAGGGGTCCTTGAAGTCCTG
217 - 247 5 54.4 49.8 16.23
11 SGCV24 U90602 GGACTAAAGCCCAACCATCCAGC CTCACCAGTAAGGGGTTATGGGGC
163 - 189 11 73.3 76.9 19.54
11 SGCV13 U90592 TCAGGAGTTTGGATAGATTTTGC TGGAATAACTGAAATGTCCAACA
228 - 234 5 61.3 60.5 26.15
11 TKY710 AB103928 ATACAGGAGTGCGCTTTTCC AAACCATCCTCCACCTTTCC
138 - 154 7 59.7 58.2 34.68
11 TKY424 AB103642 GGGGCGTGAGCATAAAGG CGCTGGATGAGTGAGGGA
71 - 95 8 75.4 71.6 41.50
11 UCD457 U67412 CATCCATCCTTTCCAGCTCGATATTC CAAGACCGTAACTCAGGAGCCC
173 - 181 14 71.8 75.6 51.57
12 SGCV10 U90591 GAGTTCATTCTTTTTCGTGGCTG GGAAACACCCTAAGTGTCCCTTG
121 - 139 9 77.8 78.7 9.50
12 SGCV8 U90590 GGGAAGGACGATGAGTGAC CACCAGGCTAAGTAGCCAAAG
206 - 230 10 77.1 77.2 21.20
12 COR058 AF108375 GTGGGAGGCAGCAGGAAC CCCCAGACACCGTGTGAT
105 - 109 13 82.5 79.3 27.95
12 UCD497 U67419 AGCCACCAGTCTGTTCTCTG AATGTCCTTTGGTGGATGAAC
265 - 279 3 35.0 35.9 32.57
13 COR069 AF142606 GTTTGCTGTGGTTACCAGGCAGA GCAAATTGAATATTTGAAGTTGAGAC
126 - 142 9 83.9 83.3 6.10
13 VHL047 X86449 AGCAGAAACCCACTCAAGCC GCATAATACCCTCAAGGTC
153 - 167 4 73.4 69.1 16.89
13 ASB1 X93515 ACTCATTCATTCACAAATCCCC AGAAAATTCCCTCCTGTCCC
282 - 284 5 63.4 57.4 31.74
14 AHT29 AJ271514 ATACTGGCTTTACGTCACAG ATCACCACCAGAGTTAATGG
87 - 103 6 51.9 54.5 5.41
14 TKY1053 AB104271 CATTAAGCAACAAAAAGCATC GGAAAAGCATGACAAGACACT
224 - 244 6 58.7 65.9 7.17
14 LEX043 AF075645 CTGAAACCTCATTTTATACAG TACTAGAACACAGAAAGCCTA
158 - 162 7 69.1 58.3 16.15
14 HTG18 TACAGCCATTGGAAATCTAC CACCATTACATTTTCCCAG
106 - 120 3 33.3 34.0 22.30
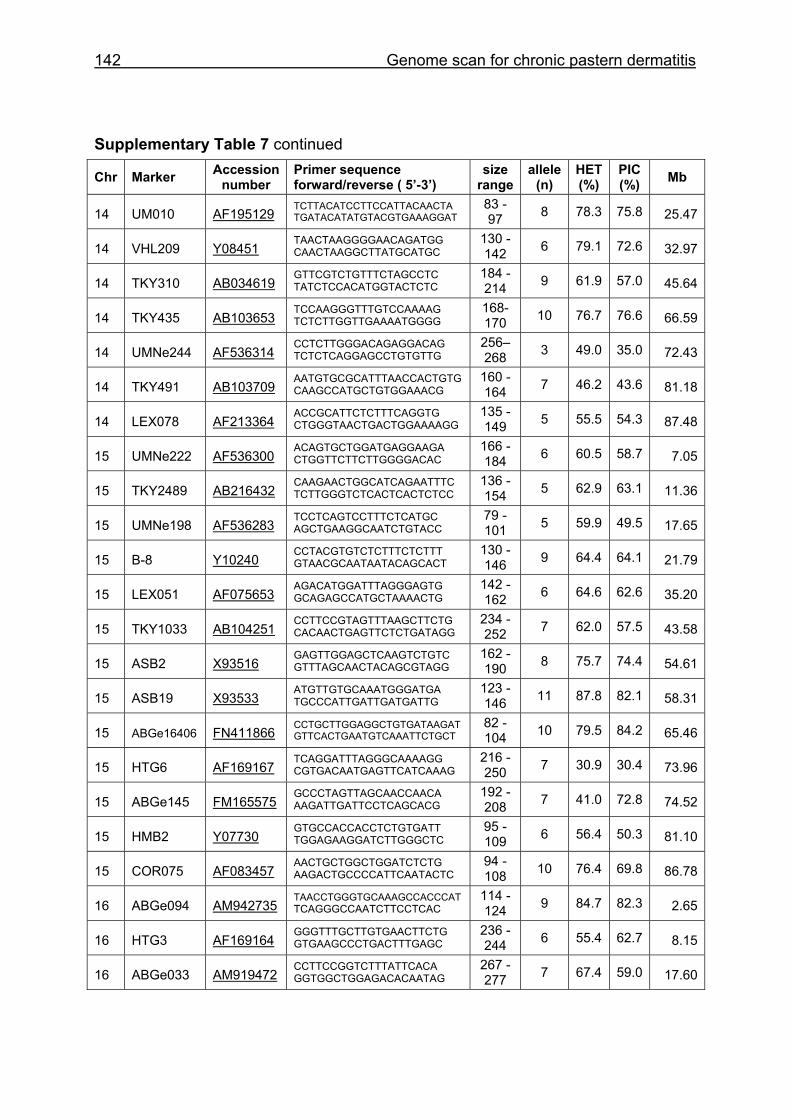
142 Genome scan for chronic pastern dermatitis
Supplementary Table 7 continued
Chr Marker Accession number
Primer sequence forward/reverse ( 5’-3’)
size range
allele (n)
HET (%)
PIC (%) Mb
14 UM010 AF195129 TCTTACATCCTTCCATTACAACTA TGATACATATGTACGTGAAAGGAT
83 - 97 8 78.3 75.8 25.47
14 VHL209 Y08451 TAACTAAGGGGAACAGATGG CAACTAAGGCTTATGCATGC
130 - 142 6 79.1 72.6 32.97
14 TKY310 AB034619 GTTCGTCTGTTTCTAGCCTC TATCTCCACATGGTACTCTC
184 - 214 9 61.9 57.0 45.64
14 TKY435 AB103653 TCCAAGGGTTTGTCCAAAAG TCTCTTGGTTGAAAATGGGG
168-170 10 76.7 76.6 66.59
14 UMNe244 AF536314 CCTCTTGGGACAGAGGACAG TCTCTCAGGAGCCTGTGTTG
256–268 3 49.0 35.0 72.43
14 TKY491 AB103709 AATGTGCGCATTTAACCACTGTG CAAGCCATGCTGTGGAAACG
160 - 164 7 46.2 43.6 81.18
14 LEX078 AF213364 ACCGCATTCTCTTTCAGGTG CTGGGTAACTGACTGGAAAAGG
135 - 149 5 55.5 54.3 87.48
15 UMNe222 AF536300 ACAGTGCTGGATGAGGAAGA CTGGTTCTTCTTGGGGACAC
166 - 184 6 60.5 58.7 7.05
15 TKY2489 AB216432 CAAGAACTGGCATCAGAATTTC TCTTGGGTCTCACTCACTCTCC
136 - 154 5 62.9 63.1 11.36
15 UMNe198 AF536283 TCCTCAGTCCTTTCTCATGC AGCTGAAGGCAATCTGTACC
79 - 101 5 59.9 49.5 17.65
15 B-8 Y10240 CCTACGTGTCTCTTTCTCTTT GTAACGCAATAATACAGCACT
130 - 146 9 64.4 64.1 21.79
15 LEX051 AF075653 AGACATGGATTTAGGGAGTG GCAGAGCCATGCTAAAACTG
142 - 162 6 64.6 62.6 35.20
15 TKY1033 AB104251 CCTTCCGTAGTTTAAGCTTCTG CACAACTGAGTTCTCTGATAGG
234 - 252 7 62.0 57.5 43.58
15 ASB2 X93516 GAGTTGGAGCTCAAGTCTGTC GTTTAGCAACTACAGCGTAGG
162 - 190 8 75.7 74.4 54.61
15 ASB19 X93533 ATGTTGTGCAAATGGGATGA TGCCCATTGATTGATGATTG
123 - 146 11 87.8 82.1 58.31
15 ABGe16406 FN411866 CCTGCTTGGAGGCTGTGATAAGAT GTTCACTGAATGTCAAATTCTGCT
82 - 104 10 79.5 84.2 65.46
15 HTG6 AF169167 TCAGGATTTAGGGCAAAAGG CGTGACAATGAGTTCATCAAAG
216 - 250 7 30.9 30.4 73.96
15 ABGe145 FM165575 GCCCTAGTTAGCAACCAACA AAGATTGATTCCTCAGCACG
192 - 208 7 41.0 72.8 74.52
15 HMB2 Y07730 GTGCCACCACCTCTGTGATT TGGAGAAGGATCTTGGGCTC
95 - 109 6 56.4 50.3 81.10
15 COR075 AF083457 AACTGCTGGCTGGATCTCTG AAGACTGCCCCATTCAATACTC
94 - 108 10 76.4 69.8 86.78
16 ABGe094 AM942735 TAACCTGGGTGCAAAGCCACCCAT TCAGGGCCAATCTTCCTCAC
114 - 124 9 84.7 82.3 2.65
16 HTG3 AF169164 GGGTTTGCTTGTGAACTTCTG GTGAAGCCCTGACTTTGAGC
236 - 244 6 55.4 62.7 8.15
16 ABGe033 AM919472 CCTTCCGGTCTTTATTCACA GGTGGCTGGAGACACAATAG
267 - 277 7 67.4 59.0 17.60
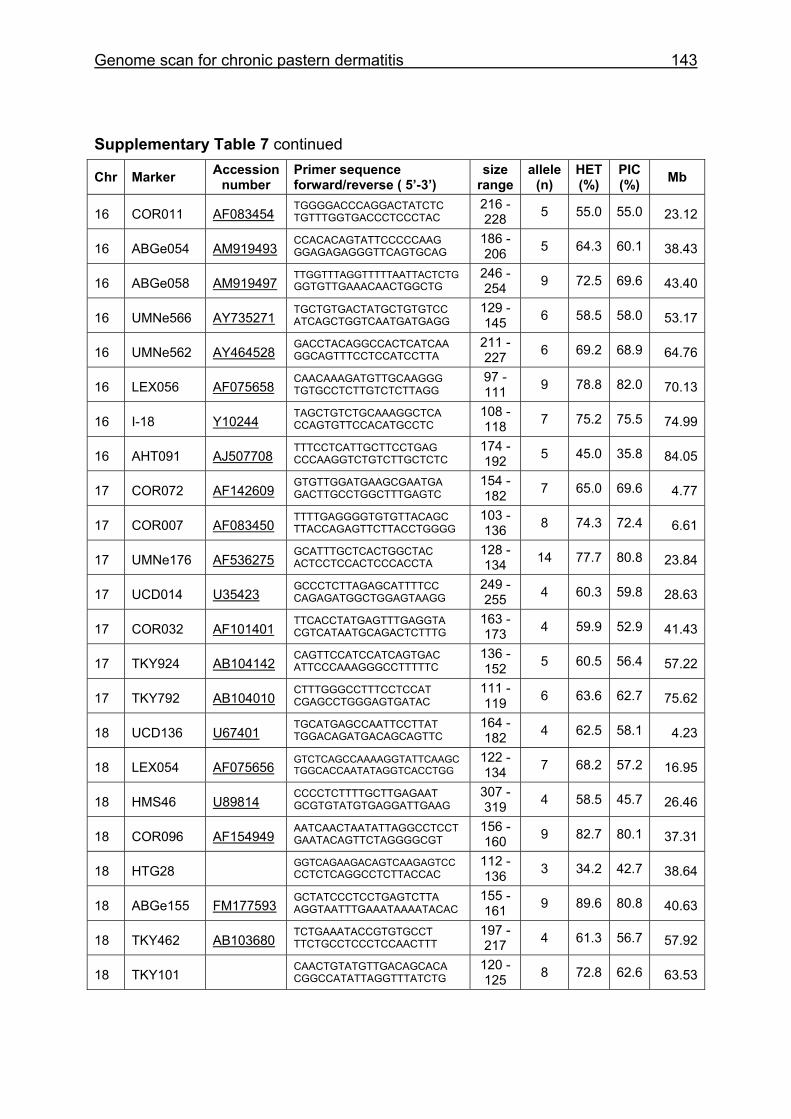
Genome scan for chronic pastern dermatitis 143
Supplementary Table 7 continued
Chr Marker Accession number
Primer sequence forward/reverse ( 5’-3’)
size range
allele (n)
HET (%)
PIC (%) Mb
16 COR011 AF083454 TGGGGACCCAGGACTATCTC TGTTTGGTGACCCTCCCTAC
216 - 228 5 55.0 55.0 23.12
16 ABGe054 AM919493 CCACACAGTATTCCCCCAAG GGAGAGAGGGTTCAGTGCAG
186 - 206 5 64.3 60.1 38.43
16 ABGe058 AM919497 TTGGTTTAGGTTTTTAATTACTCTG GGTGTTGAAACAACTGGCTG
246 - 254 9 72.5 69.6 43.40
16 UMNe566 AY735271 TGCTGTGACTATGCTGTGTCC ATCAGCTGGTCAATGATGAGG
129 - 145 6 58.5 58.0 53.17
16 UMNe562 AY464528 GACCTACAGGCCACTCATCAA GGCAGTTTCCTCCATCCTTA
211 - 227 6 69.2 68.9 64.76
16 LEX056 AF075658 CAACAAAGATGTTGCAAGGG TGTGCCTCTTGTCTCTTAGG
97 - 111 9 78.8 82.0 70.13
16 I-18 Y10244 TAGCTGTCTGCAAAGGCTCA CCAGTGTTCCACATGCCTC
108 - 118 7 75.2 75.5 74.99
16 AHT091 AJ507708 TTTCCTCATTGCTTCCTGAG CCCAAGGTCTGTCTTGCTCTC
174 - 192 5 45.0 35.8 84.05
17 COR072 AF142609 GTGTTGGATGAAGCGAATGA GACTTGCCTGGCTTTGAGTC
154 - 182 7 65.0 69.6 4.77
17 COR007 AF083450 TTTTGAGGGGTGTGTTACAGC TTACCAGAGTTCTTACCTGGGG
103 - 136 8 74.3 72.4 6.61
17 UMNe176 AF536275 GCATTTGCTCACTGGCTAC ACTCCTCCACTCCCACCTA
128 - 134 14 77.7 80.8 23.84
17 UCD014 U35423 GCCCTCTTAGAGCATTTTCC CAGAGATGGCTGGAGTAAGG
249 - 255 4 60.3 59.8 28.63
17 COR032 AF101401 TTCACCTATGAGTTTGAGGTA CGTCATAATGCAGACTCTTTG
163 - 173 4 59.9 52.9 41.43
17 TKY924 AB104142 CAGTTCCATCCATCAGTGAC ATTCCCAAAGGGCCTTTTTC
136 - 152 5 60.5 56.4 57.22
17 TKY792 AB104010 CTTTGGGCCTTTCCTCCAT CGAGCCTGGGAGTGATAC
111 - 119 6 63.6 62.7 75.62
18 UCD136 U67401 TGCATGAGCCAATTCCTTAT TGGACAGATGACAGCAGTTC
164 - 182 4 62.5 58.1 4.23
18 LEX054 AF075656 GTCTCAGCCAAAAGGTATTCAAGC TGGCACCAATATAGGTCACCTGG
122 - 134 7 68.2 57.2 16.95
18 HMS46 U89814 CCCCTCTTTTGCTTGAGAAT GCGTGTATGTGAGGATTGAAG
307 - 319 4 58.5 45.7 26.46
18 COR096 AF154949 AATCAACTAATATTAGGCCTCCT GAATACAGTTCTAGGGGCGT
156 - 160 9 82.7 80.1 37.31
18 HTG28 GGTCAGAAGACAGTCAAGAGTCC CCTCTCAGGCCTCTTACCAC
112 - 136 3 34.2 42.7 38.64
18 ABGe155 FM177593 GCTATCCCTCCTGAGTCTTA AGGTAATTTGAAATAAAATACAC
155 - 161 9 89.6 80.8 40.63
18 TKY462 AB103680 TCTGAAATACCGTGTGCCT TTCTGCCTCCCTCCAACTTT
197 - 217 4 61.3 56.7 57.92
18 TKY101 CAACTGTATGTTGACAGCACA CGGCCATATTAGGTTTATCTG
120 - 125 8 72.8 62.6 63.53
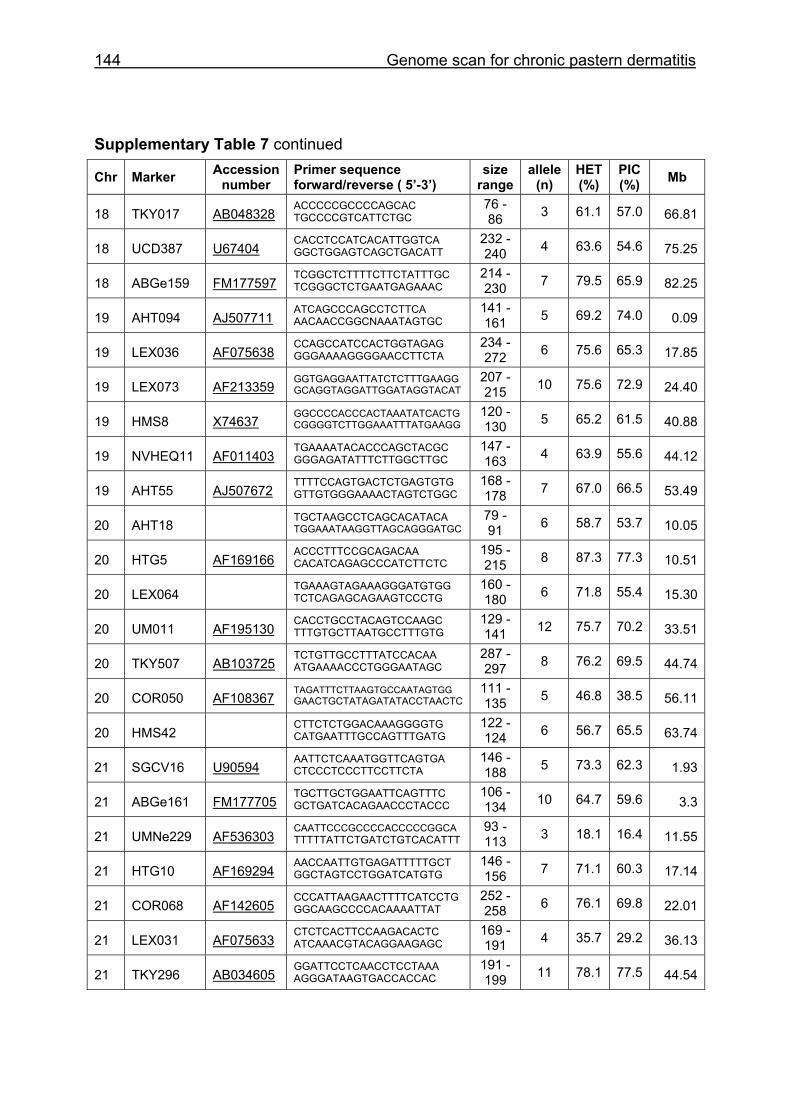
144 Genome scan for chronic pastern dermatitis
Supplementary Table 7 continued
Chr Marker Accession number
Primer sequence forward/reverse ( 5’-3’)
size range
allele (n)
HET (%)
PIC (%) Mb
18 TKY017 AB048328 ACCCCCGCCCCAGCAC TGCCCCGTCATTCTGC
76 - 86 3 61.1 57.0 66.81
18 UCD387 U67404 CACCTCCATCACATTGGTCA GGCTGGAGTCAGCTGACATT
232 - 240 4 63.6 54.6 75.25
18 ABGe159 FM177597 TCGGCTCTTTTCTTCTATTTGC TCGGGCTCTGAATGAGAAAC
214 - 230 7 79.5 65.9 82.25
19 AHT094 AJ507711 ATCAGCCCAGCCTCTTCA AACAACCGGCNAAATAGTGC
141 - 161 5 69.2 74.0 0.09
19 LEX036 AF075638 CCAGCCATCCACTGGTAGAG GGGAAAAGGGGAACCTTCTA
234 - 272 6 75.6 65.3 17.85
19 LEX073 AF213359 GGTGAGGAATTATCTCTTTGAAGG GCAGGTAGGATTGGATAGGTACAT
207 - 215 10 75.6 72.9 24.40
19 HMS8 X74637 GGCCCCACCCACTAAATATCACTG CGGGGTCTTGGAAATTTATGAAGG
120 - 130 5 65.2 61.5 40.88
19 NVHEQ11 AF011403 TGAAAATACACCCAGCTACGC GGGAGATATTTCTTGGCTTGC
147 - 163 4 63.9 55.6 44.12
19 AHT55 AJ507672 TTTTCCAGTGACTCTGAGTGTG GTTGTGGGAAAACTAGTCTGGC
168 - 178 7 67.0 66.5 53.49
20 AHT18 TGCTAAGCCTCAGCACATACA TGGAAATAAGGTTAGCAGGGATGC
79 - 91 6 58.7 53.7 10.05
20 HTG5 AF169166 ACCCTTTCCGCAGACAA CACATCAGAGCCCATCTTCTC
195 - 215 8 87.3 77.3 10.51
20 LEX064 TGAAAGTAGAAAGGGATGTGG TCTCAGAGCAGAAGTCCCTG
160 - 180 6 71.8 55.4 15.30
20 UM011 AF195130 CACCTGCCTACAGTCCAAGC TTTGTGCTTAATGCCTTTGTG
129 - 141 12 75.7 70.2 33.51
20 TKY507 AB103725 TCTGTTGCCTTTATCCACAA ATGAAAACCCTGGGAATAGC
287 - 297 8 76.2 69.5 44.74
20 COR050 AF108367 TAGATTTCTTAAGTGCCAATAGTGG GAACTGCTATAGATATACCTAACTC
111 - 135 5 46.8 38.5 56.11
20 HMS42 CTTCTCTGGACAAAGGGGTG CATGAATTTGCCAGTTTGATG
122 - 124 6 56.7 65.5 63.74
21 SGCV16 U90594 AATTCTCAAATGGTTCAGTGA CTCCCTCCCTTCCTTCTA
146 - 188 5 73.3 62.3 1.93
21 ABGe161 FM177705 TGCTTGCTGGAATTCAGTTTC GCTGATCACAGAACCCTACCC
106 - 134 10 64.7 59.6 3.3
21 UMNe229 AF536303 CAATTCCCGCCCCACCCCCGGCA TTTTTATTCTGATCTGTCACATTT
93 - 113 3 18.1 16.4 11.55
21 HTG10 AF169294 AACCAATTGTGAGATTTTTGCT GGCTAGTCCTGGATCATGTG
146 - 156 7 71.1 60.3 17.14
21 COR068 AF142605 CCCATTAAGAACTTTTCATCCTG GGCAAGCCCCACAAAATTAT
252 - 258 6 76.1 69.8 22.01
21 LEX031 AF075633 CTCTCACTTCCAAGACACTC ATCAAACGTACAGGAAGAGC
169 - 191 4 35.7 29.2 36.13
21 TKY296 AB034605 GGATTCCTCAACCTCCTAAA AGGGATAAGTGACCACCAC
191 - 199 11 78.1 77.5 44.54
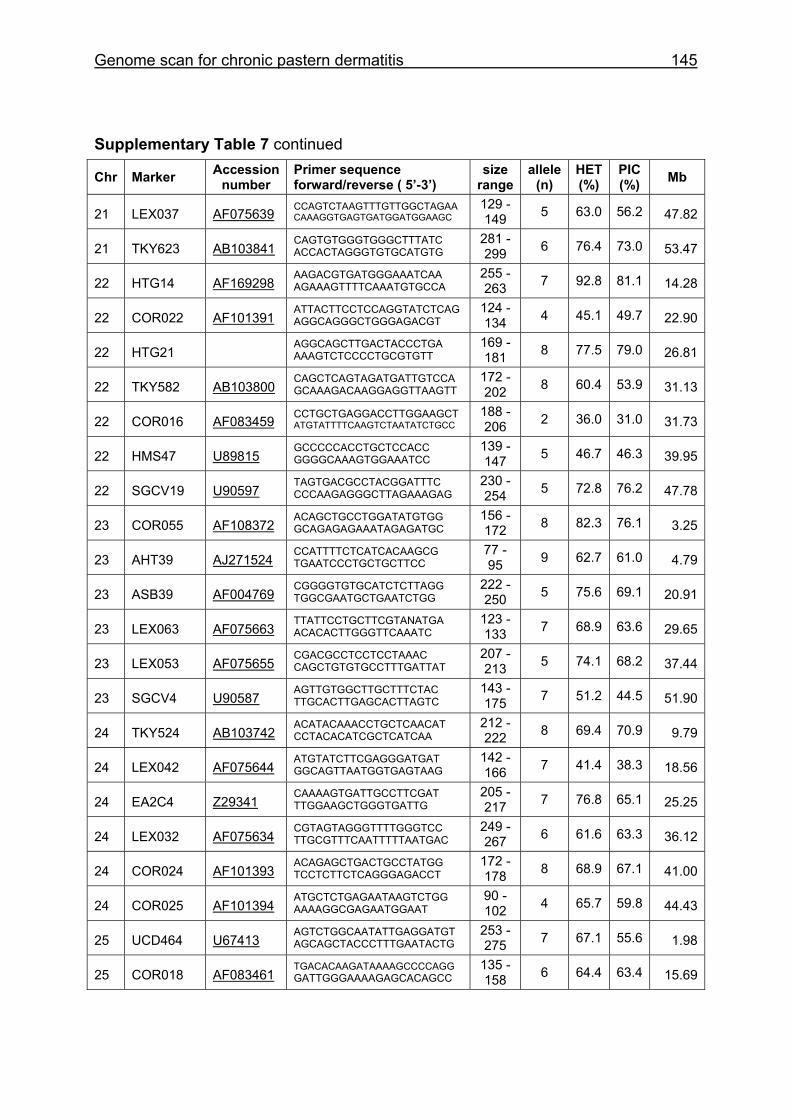
Genome scan for chronic pastern dermatitis 145
Supplementary Table 7 continued
Chr Marker Accession number
Primer sequence forward/reverse ( 5’-3’)
size range
allele (n)
HET (%)
PIC (%) Mb
21 LEX037 AF075639 CCAGTCTAAGTTTGTTGGCTAGAA CAAAGGTGAGTGATGGATGGAAGC
129 - 149 5 63.0 56.2 47.82
21 TKY623 AB103841 CAGTGTGGGTGGGCTTTATC ACCACTAGGGTGTGCATGTG
281 - 299 6 76.4 73.0 53.47
22 HTG14 AF169298 AAGACGTGATGGGAAATCAA AGAAAGTTTTCAAATGTGCCA
255 - 263 7 92.8 81.1 14.28
22 COR022 AF101391 ATTACTTCCTCCAGGTATCTCAG AGGCAGGGCTGGGAGACGT
124 - 134 4 45.1 49.7 22.90
22 HTG21 AGGCAGCTTGACTACCCTGA AAAGTCTCCCCTGCGTGTT
169 - 181 8 77.5 79.0 26.81
22 TKY582 AB103800 CAGCTCAGTAGATGATTGTCCA GCAAAGACAAGGAGGTTAAGTT
172 - 202 8 60.4 53.9 31.13
22 COR016 AF083459 CCTGCTGAGGACCTTGGAAGCT ATGTATTTTCAAGTCTAATATCTGCC
188 - 206 2 36.0 31.0 31.73
22 HMS47 U89815 GCCCCCACCTGCTCCACC GGGGCAAAGTGGAAATCC
139 - 147 5 46.7 46.3 39.95
22 SGCV19 U90597 TAGTGACGCCTACGGATTTC CCCAAGAGGGCTTAGAAAGAG
230 - 254 5 72.8 76.2 47.78
23 COR055 AF108372 ACAGCTGCCTGGATATGTGG GCAGAGAGAAATAGAGATGC
156 - 172 8 82.3 76.1 3.25
23 AHT39 AJ271524 CCATTTTCTCATCACAAGCG TGAATCCCTGCTGCTTCC
77 - 95 9 62.7 61.0 4.79
23 ASB39 AF004769 CGGGGTGTGCATCTCTTAGG TGGCGAATGCTGAATCTGG
222 - 250 5 75.6 69.1 20.91
23 LEX063 AF075663 TTATTCCTGCTTCGTANATGA ACACACTTGGGTTCAAATC
123 - 133 7 68.9 63.6 29.65
23 LEX053 AF075655 CGACGCCTCCTCCTAAAC CAGCTGTGTGCCTTTGATTAT
207 - 213 5 74.1 68.2 37.44
23 SGCV4 U90587 AGTTGTGGCTTGCTTTCTAC TTGCACTTGAGCACTTAGTC
143 - 175 7 51.2 44.5 51.90
24 TKY524 AB103742 ACATACAAACCTGCTCAACAT CCTACACATCGCTCATCAA
212 - 222 8 69.4 70.9 9.79
24 LEX042 AF075644 ATGTATCTTCGAGGGATGAT GGCAGTTAATGGTGAGTAAG
142 - 166 7 41.4 38.3 18.56
24 EA2C4 Z29341 CAAAAGTGATTGCCTTCGAT TTGGAAGCTGGGTGATTG
205 - 217 7 76.8 65.1 25.25
24 LEX032 AF075634 CGTAGTAGGGTTTTGGGTCC TTGCGTTTCAATTTTTAATGAC
249 - 267 6 61.6 63.3 36.12
24 COR024 AF101393 ACAGAGCTGACTGCCTATGG TCCTCTTCTCAGGGAGACCT
172 - 178 8 68.9 67.1 41.00
24 COR025 AF101394 ATGCTCTGAGAATAAGTCTGG AAAAGGCGAGAATGGAAT
90 - 102 4 65.7 59.8 44.43
25 UCD464 U67413 AGTCTGGCAATATTGAGGATGT AGCAGCTACCCTTTGAATACTG
253 - 275 7 67.1 55.6 1.98
25 COR018 AF083461 TGACACAAGATAAAAGCCCCAGG GATTGGGAAAAGAGCACAGCC
135 - 158 6 64.4 63.4 15.69
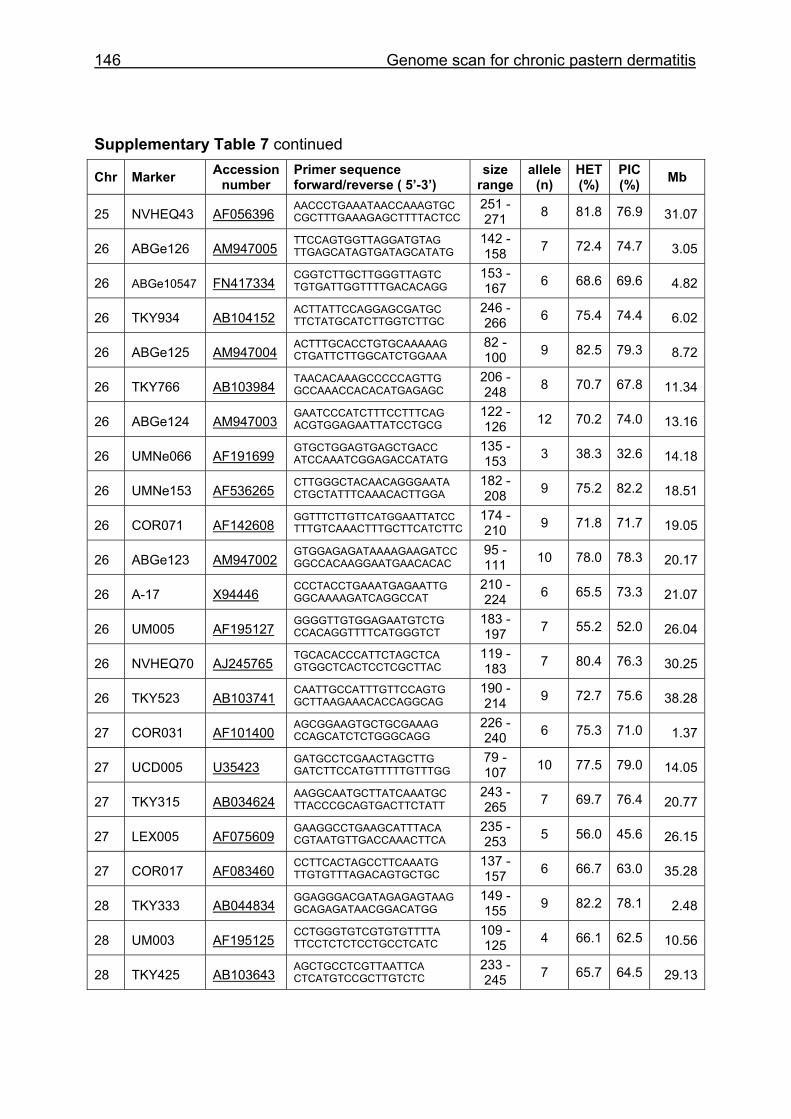
146 Genome scan for chronic pastern dermatitis
Supplementary Table 7 continued
Chr Marker Accession number
Primer sequence forward/reverse ( 5’-3’)
size range
allele (n)
HET (%)
PIC (%) Mb
25 NVHEQ43 AF056396 AACCCTGAAATAACCAAAGTGC CGCTTTGAAAGAGCTTTTACTCC
251 - 271 8 81.8 76.9 31.07
26 ABGe126 AM947005 TTCCAGTGGTTAGGATGTAG TTGAGCATAGTGATAGCATATG
142 - 158 7 72.4 74.7 3.05
26 ABGe10547 FN417334 CGGTCTTGCTTGGGTTAGTC TGTGATTGGTTTTGACACAGG
153 - 167 6 68.6 69.6 4.82
26 TKY934 AB104152 ACTTATTCCAGGAGCGATGC TTCTATGCATCTTGGTCTTGC
246 - 266 6 75.4 74.4 6.02
26 ABGe125 AM947004 ACTTTGCACCTGTGCAAAAAG CTGATTCTTGGCATCTGGAAA
82 - 100 9 82.5 79.3 8.72
26 TKY766 AB103984 TAACACAAAGCCCCCAGTTG GCCAAACCACACATGAGAGC
206 - 248 8 70.7 67.8 11.34
26 ABGe124 AM947003 GAATCCCATCTTTCCTTTCAG ACGTGGAGAATTATCCTGCG
122 - 126 12 70.2 74.0 13.16
26 UMNe066 AF191699 GTGCTGGAGTGAGCTGACC ATCCAAATCGGAGACCATATG
135 - 153 3 38.3 32.6 14.18
26 UMNe153 AF536265 CTTGGGCTACAACAGGGAATA CTGCTATTTCAAACACTTGGA
182 - 208 9 75.2 82.2 18.51
26 COR071 AF142608 GGTTTCTTGTTCATGGAATTATCC TTTGTCAAACTTTGCTTCATCTTC
174 - 210 9 71.8 71.7 19.05
26 ABGe123 AM947002 GTGGAGAGATAAAAGAAGATCC GGCCACAAGGAATGAACACAC
95 - 111 10 78.0 78.3 20.17
26 A-17 X94446 CCCTACCTGAAATGAGAATTG GGCAAAAGATCAGGCCAT
210 - 224 6 65.5 73.3 21.07
26 UM005 AF195127 GGGGTTGTGGAGAATGTCTG CCACAGGTTTTCATGGGTCT
183 - 197 7 55.2 52.0 26.04
26 NVHEQ70 AJ245765 TGCACACCCATTCTAGCTCA GTGGCTCACTCCTCGCTTAC
119 - 183 7 80.4 76.3 30.25
26 TKY523 AB103741 CAATTGCCATTTGTTCCAGTG GCTTAAGAAACACCAGGCAG
190 - 214 9 72.7 75.6 38.28
27 COR031 AF101400 AGCGGAAGTGCTGCGAAAG CCAGCATCTCTGGGCAGG
226 - 240 6 75.3 71.0 1.37
27 UCD005 U35423 GATGCCTCGAACTAGCTTG GATCTTCCATGTTTTTGTTTGG
79 - 107 10 77.5 79.0 14.05
27 TKY315 AB034624 AAGGCAATGCTTATCAAATGC TTACCCGCAGTGACTTCTATT
243 - 265 7 69.7 76.4 20.77
27 LEX005 AF075609 GAAGGCCTGAAGCATTTACA CGTAATGTTGACCAAACTTCA
235 - 253 5 56.0 45.6 26.15
27 COR017 AF083460 CCTTCACTAGCCTTCAAATG TTGTGTTTAGACAGTGCTGC
137 - 157 6 66.7 63.0 35.28
28 TKY333 AB044834 GGAGGGACGATAGAGAGTAAG GCAGAGATAACGGACATGG
149 - 155 9 82.2 78.1 2.48
28 UM003 AF195125 CCTGGGTGTCGTGTGTTTTA TTCCTCTCTCCTGCCTCATC
109 - 125 4 66.1 62.5 10.56
28 TKY425 AB103643 AGCTGCCTCGTTAATTCA CTCATGTCCGCTTGTCTC
233 - 245 7 65.7 64.5 29.13
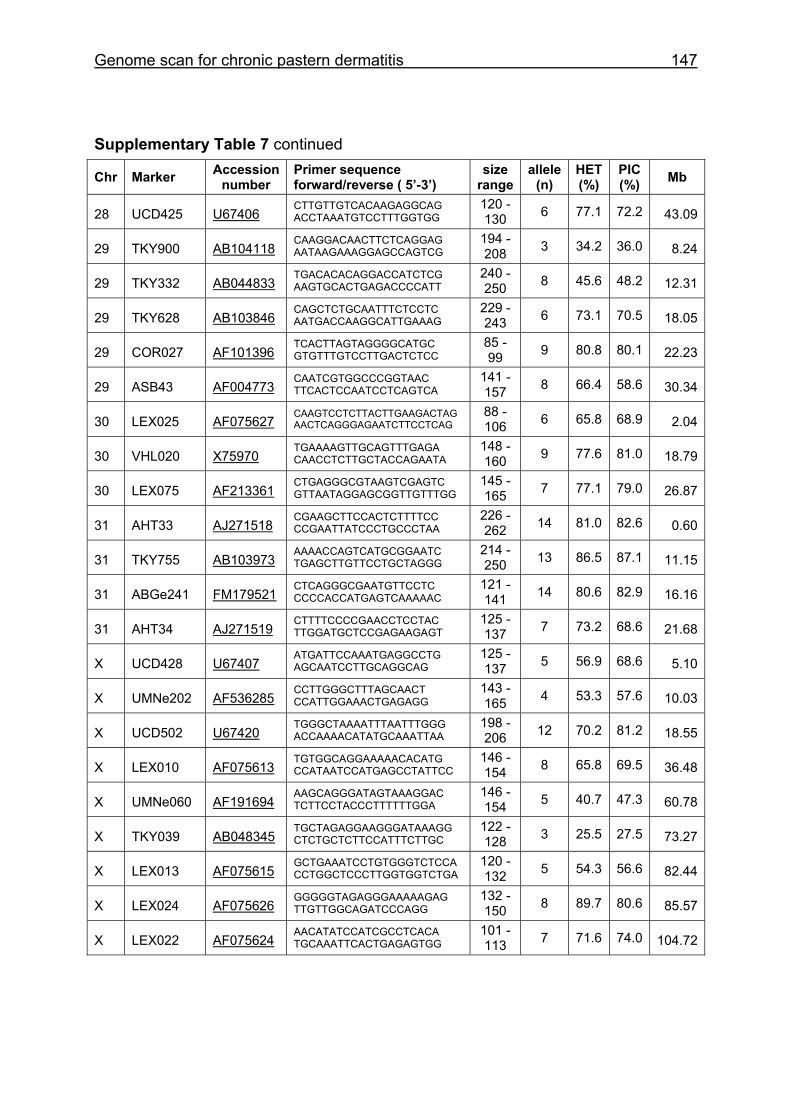
Genome scan for chronic pastern dermatitis 147
Supplementary Table 7 continued
Chr Marker Accession number
Primer sequence forward/reverse ( 5’-3’)
size range
allele (n)
HET (%)
PIC (%) Mb
28 UCD425 U67406 CTTGTTGTCACAAGAGGCAG ACCTAAATGTCCTTTGGTGG
120 - 130 6 77.1 72.2 43.09
29 TKY900 AB104118 CAAGGACAACTTCTCAGGAG AATAAGAAAGGAGCCAGTCG
194 - 208 3 34.2 36.0 8.24
29 TKY332 AB044833 TGACACACAGGACCATCTCG AAGTGCACTGAGACCCCATT
240 - 250 8 45.6 48.2 12.31
29 TKY628 AB103846 CAGCTCTGCAATTTCTCCTC AATGACCAAGGCATTGAAAG
229 - 243 6 73.1 70.5 18.05
29 COR027 AF101396 TCACTTAGTAGGGGCATGC GTGTTTGTCCTTGACTCTCC
85 - 99 9 80.8 80.1 22.23
29 ASB43 AF004773 CAATCGTGGCCCGGTAAC TTCACTCCAATCCTCAGTCA
141 - 157 8 66.4 58.6 30.34
30 LEX025 AF075627 CAAGTCCTCTTACTTGAAGACTAG AACTCAGGGAGAATCTTCCTCAG
88 - 106 6 65.8 68.9 2.04
30 VHL020 X75970 TGAAAAGTTGCAGTTTGAGA CAACCTCTTGCTACCAGAATA
148 - 160 9 77.6 81.0 18.79
30 LEX075 AF213361 CTGAGGGCGTAAGTCGAGTC GTTAATAGGAGCGGTTGTTTGG
145 - 165 7 77.1 79.0 26.87
31 AHT33 AJ271518 CGAAGCTTCCACTCTTTTCC CCGAATTATCCCTGCCCTAA
226 - 262 14 81.0 82.6 0.60
31 TKY755 AB103973 AAAACCAGTCATGCGGAATC TGAGCTTGTTCCTGCTAGGG
214 - 250 13 86.5 87.1 11.15
31 ABGe241 FM179521 CTCAGGGCGAATGTTCCTC CCCCACCATGAGTCAAAAAC
121 - 141 14 80.6 82.9 16.16
31 AHT34 AJ271519 CTTTTCCCCGAACCTCCTAC TTGGATGCTCCGAGAAGAGT
125 - 137 7 73.2 68.6 21.68
X UCD428 U67407 ATGATTCCAAATGAGGCCTG AGCAATCCTTGCAGGCAG
125 - 137 5 56.9 68.6 5.10
X UMNe202 AF536285 CCTTGGGCTTTAGCAACT CCATTGGAAACTGAGAGG
143 - 165 4 53.3 57.6 10.03
X UCD502 U67420 TGGGCTAAAATTTAATTTGGG ACCAAAACATATGCAAATTAA
198 - 206 12 70.2 81.2 18.55
X LEX010 AF075613 TGTGGCAGGAAAAACACATG CCATAATCCATGAGCCTATTCC
146 - 154 8 65.8 69.5 36.48
X UMNe060 AF191694 AAGCAGGGATAGTAAAGGAC TCTTCCTACCCTTTTTTGGA
146 - 154 5 40.7 47.3 60.78
X TKY039 AB048345 TGCTAGAGGAAGGGATAAAGG CTCTGCTCTTCCATTTCTTGC
122 - 128 3 25.5 27.5 73.27
X LEX013 AF075615 GCTGAAATCCTGTGGGTCTCCA CCTGGCTCCCTTGGTGGTCTGA
120 - 132 5 54.3 56.6 82.44
X LEX024 AF075626 GGGGGTAGAGGGAAAAAGAG TTGTTGGCAGATCCCAGG
132 - 150 8 89.7 80.6 85.57
X LEX022 AF075624 AACATATCCATCGCCTCACA TGCAAATTCACTGAGAGTGG
101 - 113 7 71.6 74.0 104.72
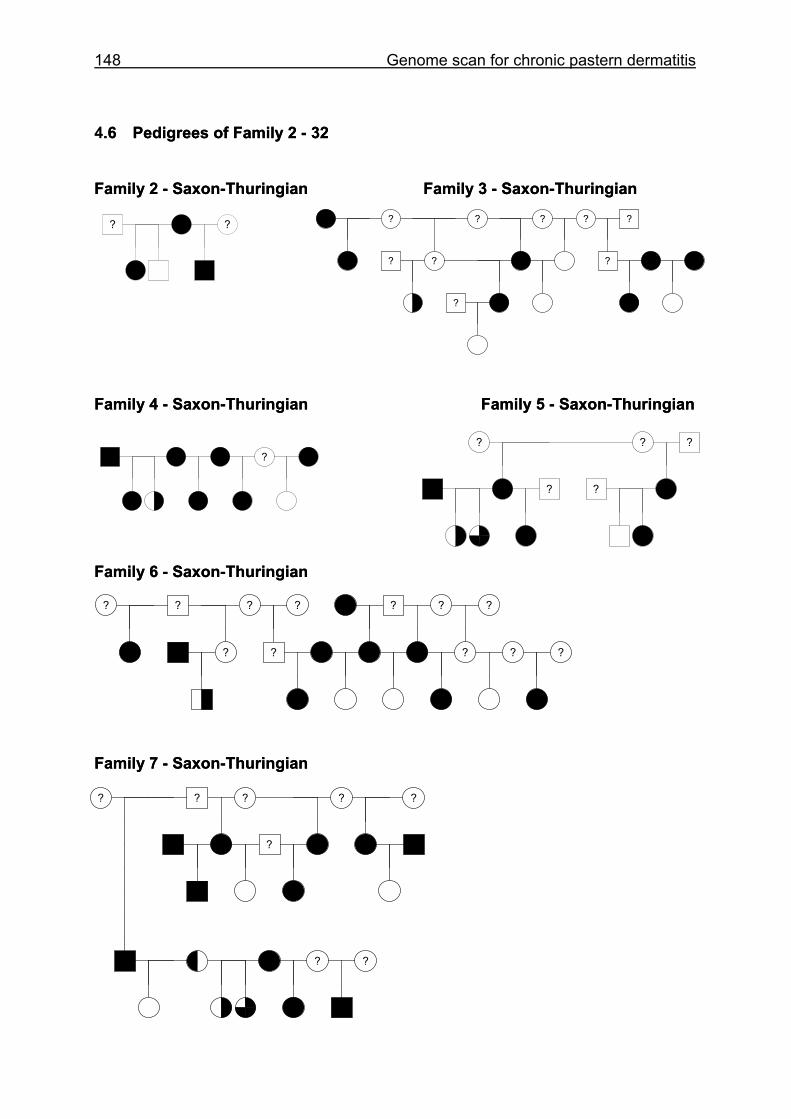
148 Genome scan for chronic pastern dermatitis
4.6 Pedigrees of Family 2 - 32 .6 Pedigrees of Family 2 - 32
Family 2 - Saxon-Thuringian Family 3 - Saxon-Thuringian Family 2 - Saxon-Thuringian Family 3 - Saxon-Thuringian
? ? ? ? ? ? ?
? ? ?
?
Family 4 - Saxon-Thuringian Family 5 - Saxon-Thuringian Family 4 - Saxon-Thuringian Family 5 - Saxon-Thuringian
? ?
? ?
? ?
Family 6 - Saxon-Thuringian Family 6 - Saxon-Thuringian
? ? ? ? ? ? ?
? ? ? ? ?
Family 7 - Saxon-Thuringian Family 7 - Saxon-Thuringian
? ? ? ?
?
? ?
?
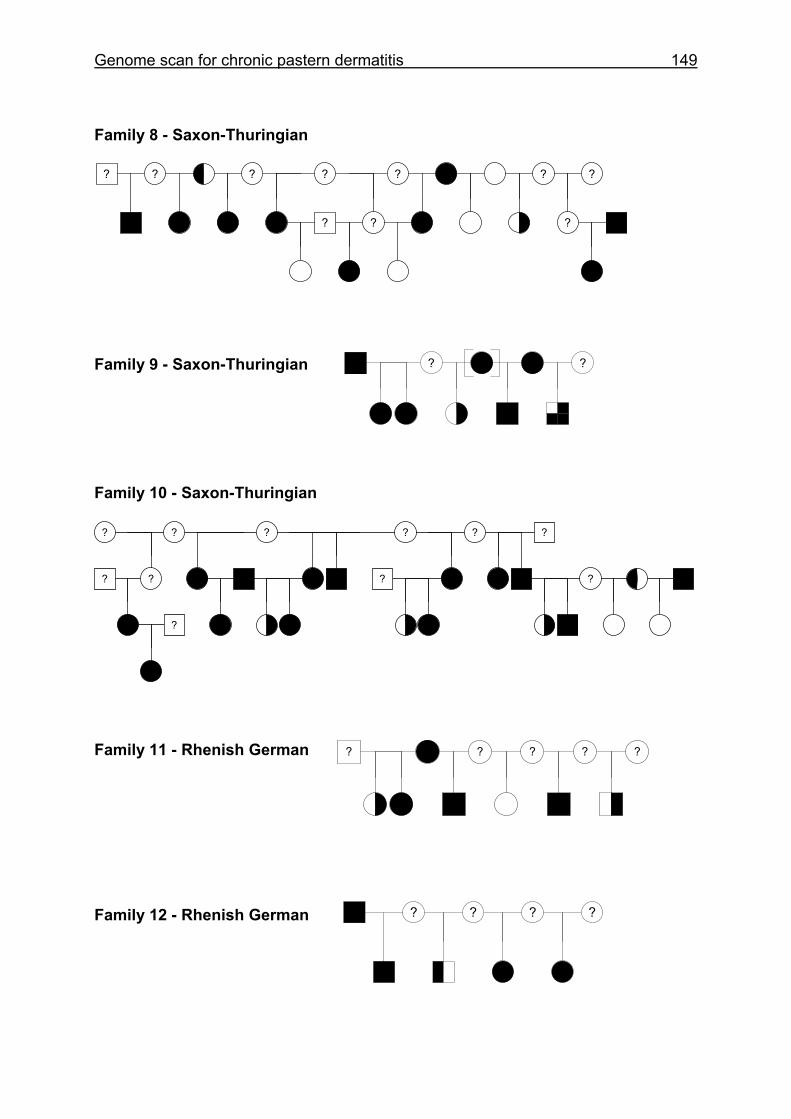
Genome scan for chronic pastern dermatitis 149
Family 8 - Saxon-Thuringian
? ? ? ? ? ? ?
? ? ?
? ?Family 9 - Saxon-Thuringian Family 10 - Saxon-Thuringian
? ? ? ? ? ?
? ? ? ?
?
Family 11 - Rhenish German ? ? ? ? ?
? ? ? ?Family 12 - Rhenish German
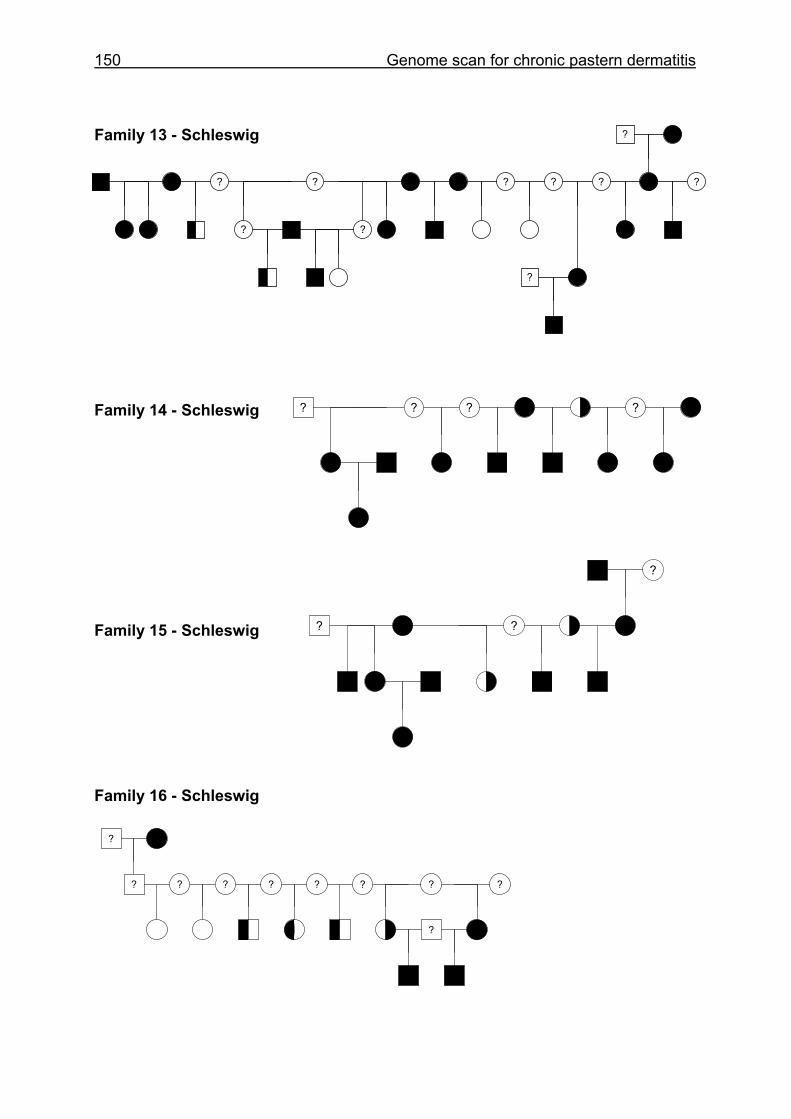
150 Genome scan for chronic pastern dermatitis
Family 13 - Schleswig
?
? ? ? ? ?
? ?
?
?
? ? ? ?Family 14 - Schleswig
?
? ?
Family 15 - Schleswig Family 16 - Schleswig ?
? ? ? ? ? ? ? ?
?
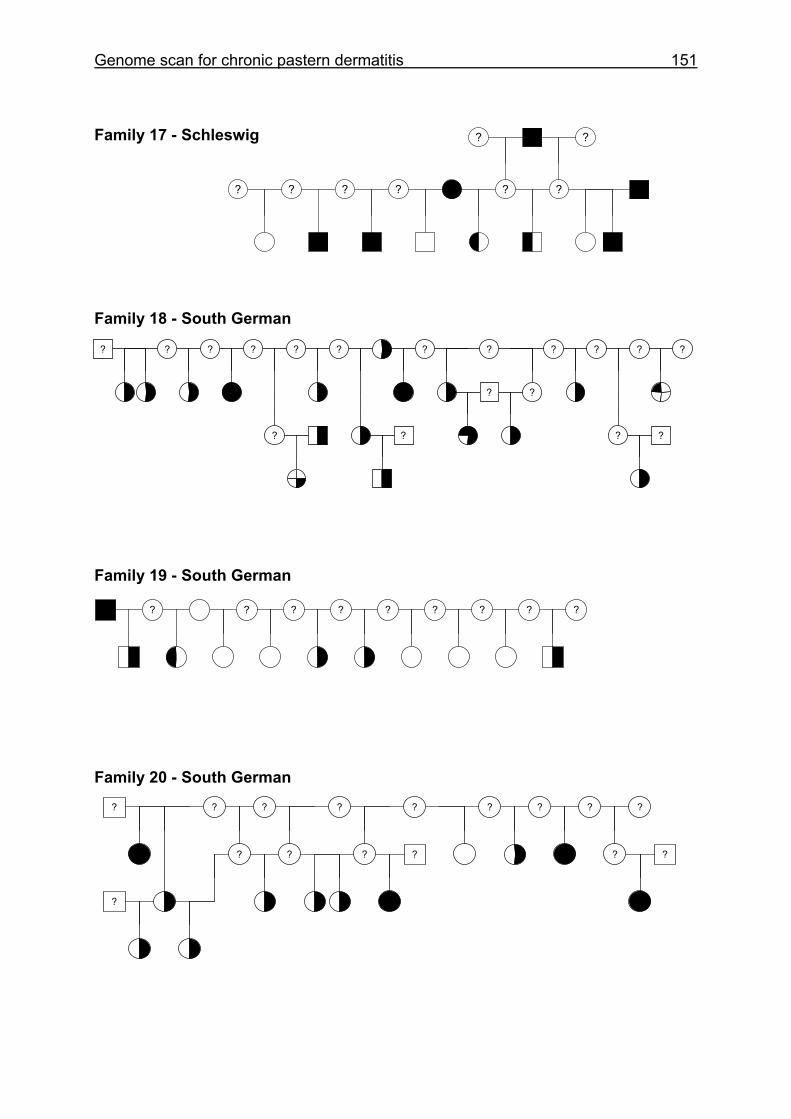
Genome scan for chronic pastern dermatitis 151
Family 17 - Schleswig ? ?
? ? ? ? ? ?
Family 18 - South German
? ? ? ? ? ? ? ? ? ? ? ?
? ?
? ? ? ?
Family 19 - South German
? ? ? ? ? ? ? ? ?
Family 20 - South German
? ? ? ? ? ? ? ? ?
? ? ? ? ? ?
?
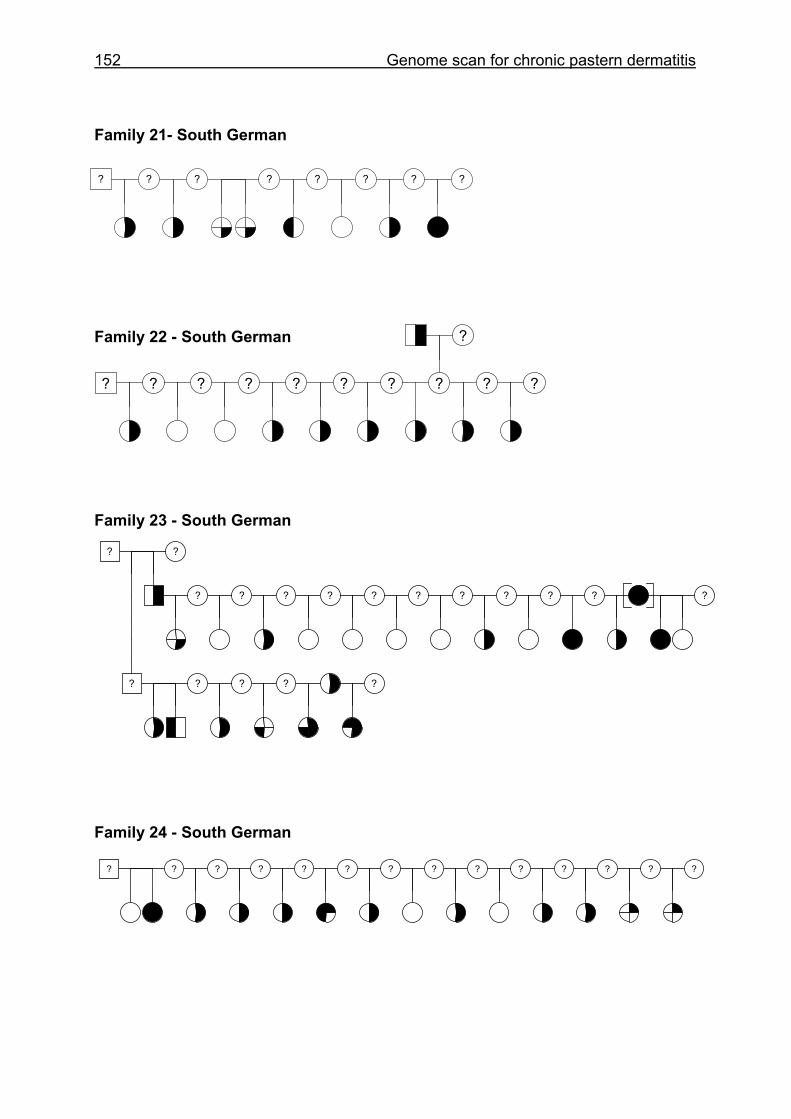
152 Genome scan for chronic pastern dermatitis
Family 21- South German
? ? ? ? ? ? ? ?
Family 22 - South German
?
? ? ? ? ? ? ? ? ? ?
Family 23 - South German
? ?
? ? ? ? ? ? ? ? ? ? ?
? ? ? ? ?
Family 24 - South German
? ? ? ? ? ? ? ? ? ? ? ? ? ?
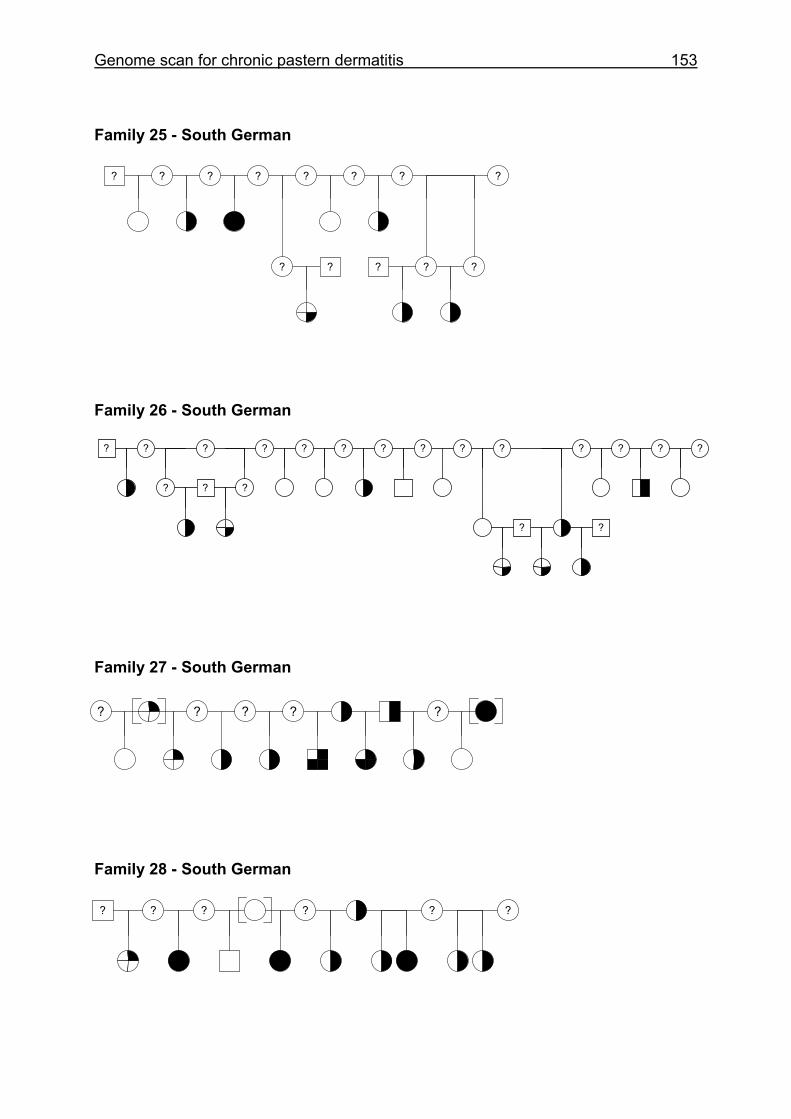
Genome scan for chronic pastern dermatitis 153
Family 25 - South German ? ? ? ? ? ? ? ?
? ? ? ? ?
Family 26 - South German
? ? ? ? ? ? ? ? ? ? ? ? ? ?
? ? ?
? ?
Family 27 - South German
? ? ? ? ?
Family 28 - South German
? ? ? ? ? ?
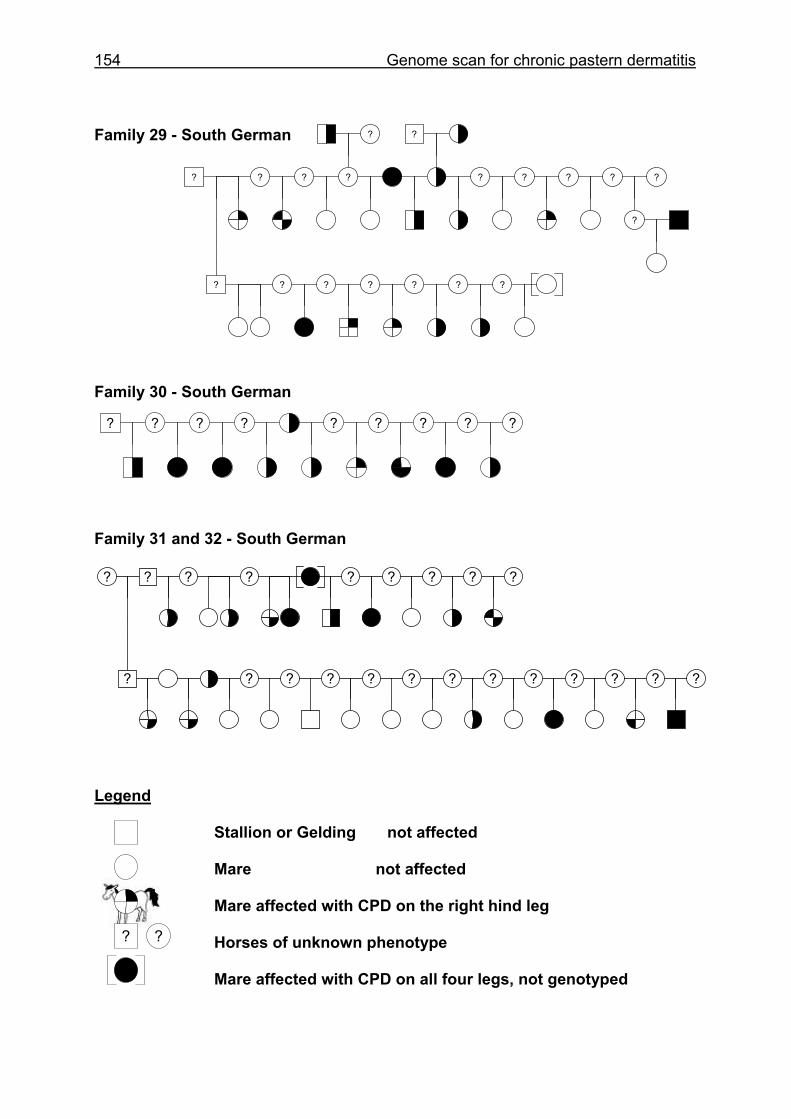
154 Genome scan for chronic pastern dermatitis
Family 29 - South German ? ?
? ? ? ? ? ? ? ? ?
?
? ? ? ? ? ? ?
Family 30 - South German
? ? ? ? ? ? ? ? ? Family 31 and 32 - South German
? ? ? ? ? ? ? ? ?
? ? ? ? ? ? ? ? ? ? ? ? ?
Legend Stallion or Gelding not affected Mare not affected Mare affected with CPD on the right hind leg Horses of unknown phenotype Mare affected with CPD on all four legs, not genotyped
? ?

CHAPTER 5
General discussion
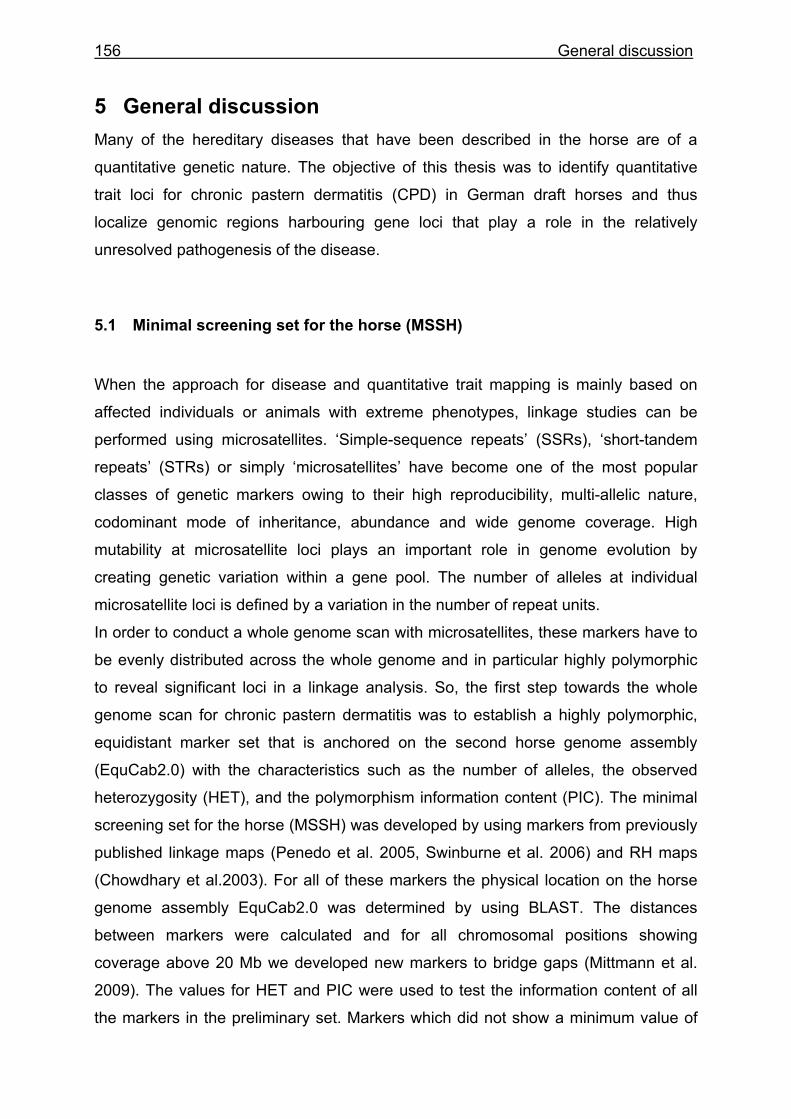
156 General discussion
5 General discussion Many of the hereditary diseases that have been described in the horse are of a
quantitative genetic nature. The objective of this thesis was to identify quantitative
trait loci for chronic pastern dermatitis (CPD) in German draft horses and thus
localize genomic regions harbouring gene loci that play a role in the relatively
unresolved pathogenesis of the disease.
5.1 Minimal screening set for the horse (MSSH)
When the approach for disease and quantitative trait mapping is mainly based on
affected individuals or animals with extreme phenotypes, linkage studies can be
performed using microsatellites. ‘Simple-sequence repeats’ (SSRs), ‘short-tandem
repeats’ (STRs) or simply ‘microsatellites’ have become one of the most popular
classes of genetic markers owing to their high reproducibility, multi-allelic nature,
codominant mode of inheritance, abundance and wide genome coverage. High
mutability at microsatellite loci plays an important role in genome evolution by
creating genetic variation within a gene pool. The number of alleles at individual
microsatellite loci is defined by a variation in the number of repeat units.
In order to conduct a whole genome scan with microsatellites, these markers have to
be evenly distributed across the whole genome and in particular highly polymorphic
to reveal significant loci in a linkage analysis. So, the first step towards the whole
genome scan for chronic pastern dermatitis was to establish a highly polymorphic,
equidistant marker set that is anchored on the second horse genome assembly
(EquCab2.0) with the characteristics such as the number of alleles, the observed
heterozygosity (HET), and the polymorphism information content (PIC). The minimal
screening set for the horse (MSSH) was developed by using markers from previously
published linkage maps (Penedo et al. 2005, Swinburne et al. 2006) and RH maps
(Chowdhary et al.2003). For all of these markers the physical location on the horse
genome assembly EquCab2.0 was determined by using BLAST. The distances
between markers were calculated and for all chromosomal positions showing
coverage above 20 Mb we developed new markers to bridge gaps (Mittmann et al.
2009). The values for HET and PIC were used to test the information content of all
the markers in the preliminary set. Markers which did not show a minimum value of
General discussion 157
four alleles and a HET and PIC greater than 50% were removed and replaced by
more polymorphic markers as far as possible. The markers were genotyped on an
average number of 362 Hanoverian warmblood horses and 299 German draft
horses. The reason for testing the degree of polymorphisms of the microsatellites in
several breeds was that HET and PIC vary among breeds and through genotyping
horses from several breeds, markers with a breed specific abundance of
polymorphisms could be excluded. The large number of horses that were used to
calculate the HET and PIC within one breed provides an exceptionally assured
prediction towards the utility of a specific microsatellite. Because HET and PIC have
often been calculated based on a low number of horses from different breeds, the
values tended to be artificially elevated. This resulted in low allele numbers when the
microsatellites were genotyped using only one horse breed. This marker set was
specifically designed to be highly informative in any horse breed.
The marker set covers all autosomes and the X chromosome with 322 evenly spaced
microsatellite markers. The average chromosomal distance among markers
amounted to 7.44 Mb. The average number of alleles was 7.3 and 8.0 in
Hanoverians and German draft horses, respectively. HET was at 71% for
Hanoverians and German draft horses, PIC at 65% and 67%. This minimal
microsatellite set allows scanning of the whole horse genome at close to 7-10 Mb
resolution.
For a whole genome scan using pure bred draft horse breeds like the one we
conducted for chronic pastern dermatitis, the highly polymorphic marker set is
particularly necessary as there has often been a notable reduction of allele numbers
in known microsatellite markers for the draft horses. This is easily explained by the
relatively small population size in some of the draft horse breeds and the
consecutively high degree of inbreeding (Aberle et al. 2004).
5.2 Identification of new microsatellites
In the course of developing the minimal equine marker set, the search for highly
polymorphic markers in a specific genome region did not always yield satisfying
results. With the first and then the second horse genome sequence (EquCab2.0) that
was made available by the Broad Institute, new possibilities arose for the localization
158 General discussion
of microsatellites using a bioinformatics approach. The conventional method of
generating microsatellites from genomic libraries is costly and takes up a lot of time.
Since it cannot be restricted to a single region, microsatellite density varied greatly
across the equine genome.
Before we started our search for new markers, the number of equine microsatellites
accessible in the Horsemap database amounted to 1803, the NCBI nucleotide
database provided information on 4582 microsatellites, and the latest equine linkage
maps spanned 2772 cM and 3740 cM including 734 microsatellites at 3.7 cM
intervals (Swinburne et al. 2006) and 776 microsatellites at 6.3 cM intervals (Penedo
et al. 2005).
With this study we achieved the largest release of horse microsatellites to date with
19,541 newly submitted markers. The resulting five-fold increase of mapped
microsatellites has provided an as yet unknown marker density for the horse close
enough for very successful fine mapping of quantitative trait loci.
The search for new microsatellites was performed with permutation sequences
including all repeat motifs of two to five bases with at least 15 up to 30 repeats.
Repeat motifs with less than 15 repeats were omitted as a result of their expected
lower content of polymorphisms. These microsatellites cover the horse genome with
an average distance of 112 kb and a median distance of 75 kb. Most of the repeat
motifs (72 %) were dinucleotide repeats of AC, GT and AT with frequencies of
26.4%, 26.0% and 19.4%. Trinucleotide repeats represented 3.8%, tetranucleotide
repeats 17.6% and pentanucleotide repeats 1.6% of all simple sequence repeats
(SSR).We identified adjacent SINE and LINE elements as well as 5549 (25.5%)
intragenic microsatellites. Primer pairs were designed for 12,246 microsatellites after
masking repetitive elements.
Information on microsatellite distribution is a prerequisite for an in-depth
understanding of processes determining the formation of microsatellite regions. More
importantly, the high density of mapped markers now enables a fine mapping of QTL
regions with less than 1 Mb marker distance, which will support genetic research for
a lot of multigenic traits in horses such as chronic pastern dermatitis.
General discussion 159
5.3 Whole genome scan for chronic pastern dermatitis
The aetiology of chronic pastern dermatitis (CPD) in draft horses is still relatively
unknown. Our approach was focused on the hereditary predisposition for CPD that
has been estimated to vary between 20% up to 90% in the different German draft
horse breeds (Wallraf et al. 2004). CPD has been described in draft horses across
Europe for centuries and by choosing more than one draft horse breed we tried to
encompass the wide distribution and high prevalences. The prevalences of CPD
differ between the horses of the four draft horse breeds included in the genome scan.
In the South German draft horses the prevalence of CPD was 70.6%. Prevalences in
the other horse breeds were higher, ranging from 82.3% (Saxon-Thuringian), 84.1%
(Schleswig) to 90.9% (Rhenish German).
A whole genome scan with 318 microsatellite markers was performed by using 378
German draft horses which could be grouped into 31 paternal half-sib families that
segregated for CPD. The Rhenish German draft horses were represented by 2
families and 11 affected horses, the Schleswig by 5 families and 56 affected horses,
the Saxon-Thuringian by 9 families and 87 affected horses and the South German by
15 families and 146 affected horses. The maximum achievable Zmean of the
different draft horse breeds were lowest for Rhenish German 4.42 and highest for
South German 186.77 indicating the high power of the data set used for linkage
analyses. The across-breed linkage analysis including the 378 German draft horses
could identify chromosome-wide significant QTL on ECA1, 9, 16 and 17. Their
locations were at 102.6-117.8 Mb on ECA1, at 46.1-71.7 Mb on ECA9, at 2.7-38.4
Mb on ECA16 and at 0.0-23.8 Mb on ECA17. Analyses within single breeds
confirmed all the QTL, on ECA1 the South German draft horses showed genome-
wide significant linkage, the QTL on ECA9, 16 and 17 had chromosome-wide
significant LOD scores for the Saxon-Thuringian draft horses. Additional
chromosome-wide significant QTL could be identified for single breeds on ECA7, 10
and 11. The QTL on ECA7 at 29.0-33.8 Mb is chromosome-wide significant for South
German draft horses, for the Schleswig draft horses QTL could be seen on ECA10 at
19.8-38.5 Mb and on ECA11 at 41.5-61.3 Mb. Genome-wide significance was
reached for the QTL on ECA1, 10 and 16 when families with Zmean > 1 were
selected across the different breeds. The increase in significance implies that a QTL
which might be predominant in one breed due to the family material could be an all-
German draft horse QTL for CPD.
160 General discussion
There have been two previous candidate gene approaches, for ATP2A2 on ECA8
(Mömke and Distl 2007) and for FOXC2 on ECA3 (Young et al. 2007) that were
initiated because of similarities of the associated diseases in man but could not
identify significant association or linkage with CPD. None of the genotyped
microsatellites in the respective regions showed any linkage with CPD. Therefore it is
unlikely that the genes are involved in the pathogenesis of CPD. Interestingly
enough, the FOXC2 candidate gene approach has resulted in the new term ‘chronic
progressive lymphedema’ for CPD in draft horses and has thus created a name
distinction between the pastern dermatitis in warmbloods that often is easily treated
and the chronic pastern dermatitis that inflicts draft horses. The term ‘chronic
progressive lymphedema’ has not been used for this thesis since the associated
edema is usually a secondary change so that the term ‘chronic pastern dermatitis‘ or
‘verrucous pastern dermatitis’ is a more accurate description.
Potential positional candidate genes may be chosen by means of comparative
human-equine maps where the QTL positions can then be compared with the
conserved regions between horses and humans. The four genomic regions with the
genome-wide significant QTL that were identified should provide a closer margin for
the next positional candidate gene approach. Since some of these regions are more
than 10 Mb wide, a fine mapping with additional microsatellites could help to further
narrow the focus for the search of positional candidate genes. To conduct a search
for suitable candidate genes, it is essential to understand the pathogenesis of the
specific disease. As so little information about the aetiology of chronic pastern
dermatitis has been ascertained by more than one author, it is a bold approach to try
and find potential candidate genes responsible for CPD. If we assume an
overregulated inflammatory autoimmune response to an initial vector as the cause for
CPD, the ubiquitin protein ligase E3A, CD109 molecule and the myotubularin related
protein 6 may all be considered candidate genes because they are located in the
genome-wide significant QTL regions on ECA1, 10 and 17. A recently published
study on the interaction of E6AP with Annexin A1 (Shimoji et al. 2009) could
demonstrate that degradation of Annexin A1 is mediated by E6AP (UBE3A or E6AP,
110.75-110.79 Mb). The degradation of Annexin A1 would result in a highly active
neutrophil extravasation and an overshooting inflammatory response in damaged or
infected tissues like the progressing skin inflammation seen in CPD. The candidate
gene on ECA10 (CD109, 28.58-28.72 Mb), activated T-cell marker CD109 binds and
General discussion 161
downregulates the transformimg growth factor-β (TGF-β) in human keratinocytes
(Finnson et al. 2006). TGF-β plays a critical role in skin development, homeostasis
and wound healing. Myotubularin related protein 6 (MTMR6, 5.09-5.12 Mb on
ECA17) is located in the QTL region on ECA17 and plays a critical role in setting a
minimum threshold for a stimulus to activate T-cells (Srivastava et al. 2006). The
histo-pathological study (Geburek et al. 2005) showed a perivascular dermatitis
which was dominated by T lymphocytes was found in all animals affected with CPD,
so MTMR6 could be functionally involved.
Although the speed of whole genome mapping has been significantly increased by
tools like the equine 50K Illumina Beadchip, the often notable reduction of allele
numbers of known microsatellites in the purebred draft horse breeds in comparison to
warmblood horse breeds suggests an even lower degree of polymorphic single
nucleotide polymorphisms (SNPs). The first tests with the equine 50K Illumina
Beadchip for genome-wide association in draft horse breeds have indicated such a
low number of polymorph SNPs (McCue et al. 2009), that it might be an alternative to
make use of the latest significant increase in mapped microsatellite markers. These
have been made available recently (Mittmann et al. 2009), and will be of great value
for future fine mapping of the QTL regions.
This thesis presents the very first genome wide analysis of chronic pastern dermatitis
in four German draft horse breeds. We were able to identify across-breed genome-
wide significant QTL on four chromosomes that could well be the focus of the next
candidate gene approach.
References Aberle K, Wrede J, Distl O (2004) Analysis of relationships between German heavy
horse breeds based on pedigree information. Berl Münch Tierärztl Wochenschr
117, 72–75
Chowdhary BP, Raudsepp T, Kata SR, Goh G, Millon LV, Allan V, Piumi F, Guérin G,
Swinburne J, Binns M, Lear TL, Mickelson J, Murray J, Antczak DF, Womack JE,
Skow LC, 2003. The first-generation whole-genome radiation hybrid map in the
horse identifies conserved segments in human and mouse genomes. Genome
Res 13:742-751
Geburek F, Ohnesorge B, Deegen E, Doeleke R, Hewicker-Trautwein M (2005)
Alterations of epidermal proliferation and cytokeratin expression in skin biopsies
162 General discussion
from heavy draught horses with chronic pastern dermatitis. Vet Dermatol 16, 373-
84
Finnson KW, Tam BY, Liu K, Marcoux A, Lepage P, Roy S, Bizet AA, Philip A (2006)
Identification of CD109 as part of the TGF-beta receptor system in human
keratinocytes. Faseb J 20, 1525-1527
McCue M, Mickelson J, Bannasch D, Penedo C, Bailey E, Binns M, Distl O, Guerin
G, Hasegawa T, Hill E, Leeb T, Lindgren G, Rǿed K, Swinburne J, Tozaki T,
Vaudin V, Wade C (2009) The horse gentrain project: initial evaluation of the
EquineSNP50 BeadChips 8th Dorothy Russell Havemeyer Foundation
International Equine Genome Mapping Workshop
Mömke S, Distl O (2007) Molecular analysis of the ATP2A2 gene as candidate for
chronic pastern dermatitis in German draft horses. J Hered 98, 267-271
Penedo MCT, Millon LV, Bernoco D, Bailey E, Binns M, Cholewinski G, Ellis N, Flynn
J, Gralak B, Guthrie A, Hasegaw T, Lindgren G, Lyons LA, Røed KH, Swinburne
JE, Tozaki T (2005) International equine gene mapping workshop report: a
comprehensive linkage map constructed with data from new markers and by
merging four mapping resources. Cytogenet Genome Res 111, 5–15
Shimoji T, Murakami K, Sugiyama Y, Matsuda M, Inubushi S, Nasu J, Shirakura M,
Suzuki T, Wakita T, Kishino T, Hotta H, Miyamura T, Shoji I (2009) Identification
of annexin A1 as a novel substrate for E6AP-mediated ubiquitylation. J Cell
Biochem 106, 1123-1135
Srivastava S, Ko K, Choudhury P, Li Z, Johnson AK, Nadkarni V, Unutmaz D,
Coetzee WA, Skolnik EY (2006) Phosphatidylinositol-3 phosphatase
myotubularin-related protein 6 negatively regulates CD4 T cells. Mol Cell Biol 26,
5595-5602
Swinburne JE, Boursnell M, Hill G, Pettitt L, Allen T, Chowdhary B, Hasegawa T,
Kurosawa M, Leeb T, Mashima S, Mickelson JR, Raudsepp T, Tozaki T, Binns M
(2006) Single linkage group per chromosome genetic linkage map for the horse,
based on two three-generation, full-sibling, crossbred horse reference families.
Genomics 87, 1–29
Wallraf A, Hamann H, Deegen E, Ohnesorge B, Distl O (2004) Analysis of the
prevalence of pastern dermatitis in German Coldblood horse breeds. Berl Münch
Tierärztl Wochenschr, 117, 148-152

General discussion 163
Young AE, Bower LP, Affolter VK, De Cock HE, Ferraro GL, Bannasch DL (2007)
Evaluation of FOXC2 as a candidate gene for chronic progressive lymphedema in
draft horses. Vet J 174, 397-399

164

CHAPTER 6
Summary
166 Summary
6 Summary Evelyn Henrike Mittmann (2009)
Application of horse genomics to identify quantitative trait loci (QTL) for chronic pastern dermatitis in German draft horses The availability of a high-quality draft sequence of the horse makes known the
physical location of microsatellites. The objective of the first part of this thesis was to
establish a highly polymorphic minimal screening set of microsatellite markers for
horses (MSSH) annotated on the horse genome assembly EquCab2.0. We have
used the previously reported linkage and RH maps and have extended these marker
sets by filling in gaps as noted from annotation on the horse sequence. This MSSH
covers all autosomes and the X chromosome with 322 evenly spaced microsatellites
whose positions were determined on the horse genome assembly (EquCab2.0). The
average chromosomal distance among markers amounts to 7.44 Mb. The
characteristics established for this microsatellite set were the number of alleles, the
observed heterozygosity (HET), and the polymorphism information content (PIC) for
Hanoverian warmblood (HW) and several German coldblood horse breeds (CB). The
average number of alleles was 7.3 and 8.0 in HW and CB, respectively. HET was at
71% for HW and CB, PIC at 65% (HW) and 67% (CB). This MSSH allows scanning
of the whole horse genome at close to 7-10 Mb resolution. Furthermore, we
identified a total of 21,781 equine microsatellites on the second horse genome
assembly EquCab2.0 which can be accessed at http://www.tiho-
hannover.de/einricht/zucht/mol_gen/ms_horse/horse_ms.htm. These microsatellites
cover the horse genome with a mean distance of 112 kb and a median distance of 75
kb. Most of the repeat motifs (72 %) were dinucleotide repeats of AC, GT and AT with
frequencies of 26.4%, 26.0% and 19.4%. Trinucleotide repeats represented 3.8%,
tetranucleotide repeats 17.6% and pentanucleotide repeats 1.6% of all simple
sequence repeats (SSR). We identified adjacent SINE and LINE elements and the
corresponding gene ID for 5549 (25.5%) intragenic microsatellites. Primer pairs were
designed for 12,246 microsatellites after masking repetitive elements.
Summary 167
The effort of developing a suitable markerset was made because the main objective
of this thesis was to perform a whole genome scan for chronic pastern dermatitis in
draft horses. Chronic pastern dermatitis (CPD), also known as chronic progressive
lymphedema (CPL), is a skin disease that affects draft horses. This disease causes
painful lower leg swelling, nodule formation and skin ulceration interfering with
movement. The aim of this whole genome scan was to identify quantitative trait loci
(QTL) for CPD in German draft horses. We recorded clinical data in 917 German
draft horses for CPD and collected blood samples from these horses. Out of these
917 horses, 31 paternal half-sib families with 378 horses from the breeds Rhenish
German, Schleswig, Saxon-Thuringian and South German were chosen for
genotyping. Genotyping was done for 318 polymorphic microsatellites evenly
distributed on all equine autosomes and the X chromosome with a mean distance of
7.44 Mb. An across-breed multipoint linkage analysis revealed chromosome-wide
significant QTL on horse chromosomes (ECA) 1, 9, 16 and 17. Analyses by breed
confirmed the QTL on ECA1 in South German and the QTL on ECA 9, 16 and 17 in
Saxon-Thuringian draft horses. For the Rhenish German and Schleswig draft horses,
further QTL on ECA4 and 10 and for the South German draft horses an additional
QTL on ECA7 were found. This is the first whole genome scan for CPD in draft
horses and it is an important step towards the identification of candidate genes.

168

CHAPTER 7
Zusammenfassung
170 Erweiterte Zusammenfassung
7 Erweiterte Zusammenfassung Anwendung molekulargenetischer Methoden zur Identifizierung von quantitativen Merkmalsgenorten (QTL) für chronische Mauke bei Deutschen Kaltblütern Evelyn Henrike Mittmann (2009)
Einleitung Mauke ist eine entzündliche, im Fesselbereich beginnende und in chronischen Fällen
bis zu den Karpal- und Tarsalgelenken ziehende Hauterkrankung. Schon im 17.
Jahrhundert wurde Mauke als eine sich kontinuierlich verschlimmernde, chronische
Erkrankung bei Kaltblütern beschrieben. Trotz zahlreicher Therapieansätze und
neuer topisch wie systemisch wirkender Pharmaka wurde seit dieser Zeit für die
Behandlung der Mauke kein wirksames Medikament gefunden. Die palliative
Behandlung ist mühsam und langwierig und nur selten kann eine dauerhafte
Linderung der Symptomatik erzielt werden
Betroffene Kaltblüter erkranken meist relativ früh im Alter von 2-4 Jahren und zeigen
einen progressiven Krankheitsverlauf. Die zu Beginn noch kleinen Hautläsionen
werden oft durch den bei vielen Kaltblutpferden stark ausgeprägten Kötenbehang
verdeckt. Im Frühstadium der Erkrankung sind nur die obersten Hautschichten in der
Fesselbeuge betroffen. Die Haut ist gerötet und schmerzhaft (Dermatitis
erythematosa). Die sich nach einigen Tagen bildenden kleinen Bläschen platzen und
das entstandene gelbliche Exsudat verklebt die Haare (Dermatitis madidans). Dieses
nässende Ekzem entsteht durch den Verlust der oberen Epidermisschichten. Die mit
teils eitrigem Sekret verklebten Haare und eine starke Schuppenbildung der
betroffenen Haut verschlimmern die Symptomatik (Dermatitis squamosa). Es
entstehen Krusten, die je nach Entzündungsgrad und Ausbreitung zur Lahmheit der
Pferde führen können (Dermatitis crustosa).
Im Anschluss kommt es oft zu einer überschießenden Verhornung der Haut
(Dermatitis hyperkeratotika-hyperplastica). Dieses Stadium stellt zusammen mit der
Dermatitis crustosa die über alle Altersklassen hinweg häufigste Maukeform dar.
Nach einiger Zeit kann es zur Bildung von Knoten in den betroffenen Hautbereichen
kommen (Dermatitis tuberosa). Alle diese charakteristischen, aufeinander folgenden
Erweiterte Zusammenfassung 171
Stadien der Entzündung werden unter dem Begriff der ekzematösen Mauke
zusammengefasst (Dermatitis eccematosa). Wegen der vorgeschädigten Haut kann
es im Verlauf einer Maukeerkrankungen zu verschiedensten Sekundärinfektionen
durch Bakterien, Pilze und Chorioptes Milben kommen, die aber nicht ursächlich an
der Entstehung der Erkrankung beteiligt sein müssen.
Die chronische Form der Mauke wird gemeinhin als Warzenmauke (Dermatitis
verrucosa) bezeichnet und kann sich sowohl aus der akuten, ekzematösen Mauke
als auch eigenständig entwickeln. Die klinische Symptomatik der Warzenmauke stellt
sich mit schmierigem, eitrigem und übelriechendem Exsudat dar, welches durch die
ständige Reizung der Haut zu geschwürartigen Substanzverlusten der
Hautoberfläche und zur Bildung von multiplen warzenartigen Granulomen führt.
Zusätzlich ist diese Form der Mauke durch schwielenförmige, umschriebene
Hautveränderungen, diffuse Sklerose der Haut und Unterhaut sowie borstenartiges
Aufrichten der Haare gekennzeichnet. In den Fällen, bei denen sich die Mauke bis
über die Karpal- oder Tarsalgelenke ausgebreitet hat, kommt es durch die
Beinmotorik zu Querrissen der Haut (Rhagaden), die mit starker Schuppen- und
Borkenbildung einher gehen können (Raspe). Im Verlauf einer Maukeerkrankung
kann es zu hochgradig gestörtem Allgemeinbefinden mit starker Lahmheit und
Behinderung der Bewegungsfreiheit kommen, so dass die Pferde letztendlich
euthanasiert werden müssen.
Die Ätiologie der Mauke konnte bis heute nicht abschließend geklärt werden,
allerdings können differentialdiagnostisch einige Hauterkrankungen von der
‚idiopathischen Mauke’ unterschieden werden. Eine Infektion mit Chorioptes equi
Milben kann zu Mauke-ähnlichen Symptomen führen. Allerdings wird Mauke nicht
ursächlich durch Chorioptes Milben ausgelöst, obgleich diese eine bereits
vorhandene Maukeerkrankung erheblich verschlimmern können. Außerdem sollten
Autoimmunerkrankungen wie Pemphigus foliaceus und durch Photosensibilität
hervorgerufene Hautveränderungen im Fesselbereich von Mauke eindeutig
differenziert werden. Durch die ungeklärte Pathogenese von Mauke haben sich im
Laufe der Zeit unterschiedliche, deskriptive Begriffe ergeben. So ist die Definition
‚Leukozytoclastische Vaskulitis der Fessel’ einer der Versuche, die histo-
pathologisch feststellbaren Veränderungen der Mauke zu beschreiben, jedoch nicht
die Bezeichnung für eine eigenständige Erkrankung. In der letzten Zeit hat sich in der
amerikanischen Literatur der Begriff des chronischen, progressiven Lymphödems bei
172 Erweiterte Zusammenfassung
Kaltblutpferden durchgesetzt. Diese Beschreibung ist nach Meinung von
europäischen Dermatologen und Pathologen nicht korrekt, da das mit Mauke
einhergehende Lymphödem eher sekundärer Genese ist. Trotz allem hat diese neue
Definition dazu beigetragen, dass die chronische Mauke beim Kaltblut als eigene
Erkrankung wahrgenommen wird.
Es gibt eine starke genetische Prädisposition für das Auftreten von Mauke bei
Kaltblutpferden, dennoch spielen Umweltfaktoren bei der klinischen Ausprägung eine
wichtige Rolle. So können das Stallklima einschließlich der Sauberkeit der Einstreu,
matschige, feuchte Paddocks (vor allem im Winter) als auch die Art der Fütterung zu
einer erheblichen Verschlimmerung von Krankheitssymptomen beitragen.
Da die Mauke beim Kaltblut weder durch gutes Management noch durch
medikamentöse Therapie geheilt werden kann, ist das Ziel dieser Doktorarbeit zur
Aufklärung der genetischen Prädisposition von Kaltblutpferden zugrundeliegenden
Faktoren beizutragen. Der Vererbungsmodus von Mauke ist noch nicht bekannt, es
ist aber davon auszugehen, dass für die Entstehung von Mauke mehrere Gene
verantwortlich sind. Da die Mauke oft erst nach den ersten Zuchteinsätzen auftritt
und damit weiterhin großflächig weitervererbt wird, besteht auf lange Sicht die
Hoffnung, dass ein Gentest entwickelt werden kann. Damit könnten betroffene Tiere
bereits vor dem Auftreten von ersten Maukesymptomen von der Zucht
ausgeschlossen werden.
Die Suche nach signifikant mit Mauke gekoppelten Genombereichen, in denen die
für die Entwicklung von Mauke verantwortlichen Gene lokalisiert sind, wurde mit Hilfe
molekulargenetischen Untersuchungsmethoden durchgeführt. Für Kopplungsstudien
werden genetische Marker (Mikrosatelliten) untersucht, die gleichmäßig übers
gesamte Genom verteilt sind, daher auch der Begriff ‚Genomscan’. Die entsprechend
mit der Erkrankung gekoppelten Bereiche werden als ‚Merkmalsgenorte’, im
Englischen auch ‚quantitative trait loci’ (QTL), bezeichnet. QTL definieren eine
Region, die wahrscheinlich ein für die Entstehung der untersuchten Krankheit
relevantes Gen aufweisen. Die Voraussetzungen, um eine derartige Studie
durchführen zu können sind ein gutes, informatives Markerset und eine große Anzahl
miteinander verwandter, betroffener Tiere. Im Verlauf dieser Doktorarbeit wurde
daher mit neuer Methodik ein hoch polymorphes Mikrosatelliten Markerset für
Erweiterte Zusammenfassung 173
Genomscans beim Pferd entwickelt, was die guten, genomweit signifikanten
Ergebnisse der nachfolgenden Kopplungsanalyse erst ermöglicht hat.
Entwicklung eines für Warmblut- und Kaltblutpferde informativen minimalen Mikrosatelliten Markersets zur Durchführung von Genomscans Einführung Aussagekräftige Kopplungsstudien können mit Merkmalen wie Mauke durchgeführt
werden, die auf extremen Phänotypen oder auf vielen betroffenen Individuen
beruhen, wenn entsprechend polymorphe Mikrosatelliten Marker zur Verfügung
stehen. Mikrosatelliten sind einfache, relativ kurze repetitive Sequenzmuster, die
durch ihre hohe Mutationsrate eine Vielzahl von verschiedenen Allelen aufweisen.
Die Anzahl von Allelen an einem spezifischen Microsatellitenlocus wird durch die
Variation an unterschiedlich vielen repetitiven Sequenzmustern definiert. Mit ihrer
einfachen Reproduzierbarkeit, ihrer ko-dominanten Vererbung, ihrer großen Anzahl
und der gleichmäßigen Verteilung über das gesamte Genom sind sie die
wahrscheinlich am meisten genutzten genetischen Marker.
Um einen Genomscan mit Mikrosatelliten durchzuführen, müssen sie gleichmäßig
über das gesamte Genom verteilt sein und außerdem einen hohen Polymorphiegrad
aufweisen, damit in einer Kopplungsstudie signifikante Regionen entdeckt werden
können.
Material und Methoden
Der erste Schritt zur erfolgreichen Durchführung einer Kopplungsstudie für Mauke
beim Deutschen Kaltblut war daher die Entwicklung eines entsprechend
polymorphen Markersets, welches anhand der zweiten Pferdegenomsequenz
(EquCab2.0) angeordnet wurde. Diese Anordnung läuft über einen Sequenzabgleich,
die Anwendung heißt BLAST (basic local alignment search tool) und ist auf der NCBI
Datenbank unter http://www.ncbi.nlm.nih.gov/ zu finden. Die Abstände zwischen den
Mikrosatelliten wurden berechnet, und alle chromosomalen Distanzen größer als 20
Megabasen (Mb) mit neu entwickelten Markern aufgefüllt (Methode im nächsten
Abschnitt erklärt). Marker für das minimale Mikrosatelliten Markerset wurden unter
anderem aus den schon veröffentlichen Kopplungs- und RH-Karten ausgewählt. Die
Mikrosatelliten wurden mit Hilfe von der im Labor ermittelten Anzahl Allele, der
174 Erweiterte Zusammenfassung
Heterozygotie (HET) und dem Polymorphie Informationsgehalt (PIC) bewertet und
dann entsprechend selektiert. Mikrosatelliten, deren Anzahl von Allelen kleiner als 4,
und deren HET und PIC Werte unter 50% lagen, wurden ausgetauscht solang
bessere Marker zur Verfügung standen. Die Mikrosatelliten des Markersets wurden
an durchschnittlich 362 Hannoveranern und 299 Deutschen Kaltblütern genotypisiert.
Um die nur in einer Pferderasse hoch polymorphen Mikrosatelliten eliminieren zu
können, wurde der Polymorphiegrad der Marker an zwei unterschiedlichen
Pferderassen getestet. Durch die große Anzahl an Pferden, an denen die Marker
innerhalb der beiden Pferderassen getestet wurden, sind die HET und PIC Werte
sehr zuverlässig und so sind die Marker auch innerhalb einer Pferderasse informativ.
Ergebnisse Die 322 Mikrosatelliten des Markersets sind gleichmäßig auf allen Pferde Autosomen
und dem X-Chromosom verteilt. Der durchschnittliche chromosomale Abstand
zwischen Markern betrug 7,44 Mb, die durchschnittliche Anzahl der Allele bei den
Hannoveranern war 7,3 und bei den Deutschen Kaltblütern 8,0. Die Heterozygotie
war in beiden Pferderassen gleich hoch mit HET 71%, PIC lag bei den
Hannoveranern bei 65% und bei den Kaltblütern bei 67%. Mit diesem minimalen
Markerset können Genomscans in unterschiedlichsten Pferderassen mit einer
genomweiten Abdeckung von 7-10 Mb durchgeführt werden.
Diskussion Dieses neu entwickelte Mikrosatelliten Markerset für das Pferd ist das erste Set, das
an zwei unterschiedlichen Pferderassen, beziehungsweise Pferdetypen getestet
wurde. Die Selektion auf hoch polymorphe Mikrosatelliten ist der andere, große
Vorteil dieses Markersets, wodurch es sich für alle Pferderassen mit Warmblut-,
Vollblut- oder Kaltblutanteil sehr informativ erweisen wird.
Die zuletzt veröffentlichten Kopplungskarten für das Pferd umfassten 2772
centiMorgan (cM) und 3740 cM mit jeweils 743 und 776 Mikrosatelliten. Beide Karten
beinhalten deutlich mehr Mikrosatelliten als unser Markerset, aber da keine HET, PIC
und Allele für die Mikrosatelliten angegeben werden ist in Frage zu stellen, ob all die
zusätzlichen Marker auch einen höheren Informationsgehalt in einer Kopplungsstudie
zeigen würden. Außerdem sind die Positionen der Mikrosatelliten in dem neu
entwickelten Markerset anhand der physikalischen Karte des Pferdes (EquCab2.0)
Erweiterte Zusammenfassung 175
von uns verifiziert worden, und daher viel genauer, als das mit Kopplungskarten und
der alten Einheit centiMorgan möglich ist.
Für einen Genomscan, in dem das Probenmaterial reinrassig gezüchtete
Kaltblutpferderassen enthält, ist dieses hoch polymorphe Markerset besonders
wichtig. Es wurde während des Selektionsprozesses der Mikrosatelliten für dieses
Markerset oft eine deutlich geringere Allelanzahl, kombiniert mit geringeren HET und
PIC Werten innerhalb einzelner Kaltblutrassen beobachtet. Dieser Effekt beruht auf
der relativ kleinen Anzahl an zugelassenen Zuchtpferden und dem dadurch
entsprechend hohen Inzuchtgrad in bestimmten Kaltblutpferderassen.
Identifikation von 21.781 neuen Pferde Mikrosatelliten auf der 2. Pferdegenomsequenz
Einleitung Im Zuge der Entwicklung des minimalen Mikrosatelliten Markersets war die Suche
nach polymorphen Mikrosatelliten in einer bestimmten Genomregion nicht immer von
Erfolg gekrönt. Mit der Veröffentlichung der ersten und im folgenden Jahr der zweiten
Pferdegenomsequenz (EquCab2.0) durch das Broad Institute ergaben sich neue
Möglichkeiten zur Identifikation von bis dahin unbekannten Mikrosatelliten mit Hilfe
der Bioinformatik.
Da die konventionelle Methode, Mikrosatelliten im Labor zu lokalisieren sehr
zeitaufwändig und kostspielig ist und nicht auf eine spezifische Region beschränkt
werden kann, gab es große Schwankungen in der chromosomalen Abdeckung mit
Markern. Die Anzahl der in der HORSEMAP Datenbank enthaltenen Mikrosatelliten
belief sich auf 1803, die NCBI Datenbank enthielt Informationen zu 4582
Mikrosatelliten, und die zuletzt veröffentlichten Kopplungskarten für das Pferd
umfassten 2772 centiMorgan (cM) und 3740 cM mit jeweils 743 und 776
Mikrosatelliten.
Methoden Die Suche nach neuen Mikrosatelliten wurde mit permutierten repetitiven
Sequenzmustern aller möglichen zweier bis fünfer Basenkombinationen mit
mindestens 15 und maximal 30 Wiederholungen durchgeführt. Wir haben die BLAST
176 Erweiterte Zusammenfassung
Funktion (basic local alignment search tool) mit BLASTn Modus benutzt, welcher
unter (ftp://ftp.ncbi.nih.gov/blast/executable) zu finden ist. Die Selektion von Markern
mit Sequenzmustern von mehr als 15 Wiederholungen ist von großer Bedeutung für
den voraussichtlichen Polymorphiegrad, der bei kürzeren Sequenzen deutlich
erniedrigt ist.
Ergebnisse Unsere Suche hat mit 19.541 neuen Mikrosatelliten zu einem 400%igen Anstieg von
auf der 2. Pferdegenomsequenz angeordneten Markern geführt. Außerdem
entsprachen 2240 von den 4582 auf NCBI Homepage veröffentlichten Mikrosatelliten
Positionen von unseren Treffern, von denen allerdings 97 keiner chromosomalen
Position auf EquCab2.0 zugeordnet werden konnten. Die Übereinstimmung der
Treffer war deshalb bei etwa 50%, weil zusammengesetzte Sequenzmotive unter
einer Länge von 15 Wiederholungen nicht vom Suchlogarithmus entdeckt werden
sollten aufgrund der zu erwartenden geringeren Polymorphie. Es wurden 462
zusammengesetzte Mikrosatelliten neu identifiziert, deren Einzellängen jeweils
länger als 30 bp waren, und damit höchstwahrscheinlich einen sehr hohen
Polymorphiegrad aufweisen.
Die neu identifizierten Mikrosatelliten sind im durchschnittlichen Abstand von 112
Kilobasen (kb) über das gesamte Pferdegenom verteilt. Die meisten der repetitiven
Sequenzmuster mit 72% waren Muster mit zwei Basen, Dinukleotide; AC (26,4%),
GT (26,0%) und AT (19,4%). Trinukleotide waren zu 3,8%, Tetranukleotide zu
17,6%, und Pentanukleotide zu 1,6% aller identifizierten Mikrosatelliten enthalten.
Um den einzelnen Mikrosatelliten herum wurden ca. 800 bp der Sequenz
ausgeschnitten, und dieses Stück wurde zusätzlich noch auf eventuell vorhandene
SINE- oder LINE - Elemente untersucht. Der Positionsabgleich dieser Sequenz mit
bekannten Genen ergab, dass 25,5% der neuen Marker in einem intragenischen
Bereich lagen. Nach der Maskierung repetitiver Sequenzbereiche mit Hilfe des
REPEATMASKER konnten für insgesamt 12.246 Mikrosatelliten Primer mit
PRIMER3 designed werden. Es wurde die Gesamtdatei mit allen Ergebnissen auf
http://www.tiho-hannover.de/einricht/zucht/mol_gen/ms_horse/horse_ms.htm
zugänglich gemacht. Die Gesamtdatei kann in einer komprimierten Exeldatei
heruntergeladen werden, zusätzlich kann nach einzelnen Markernamen, oder nach
Markern in einer bestimmten Region gesucht werden.
Erweiterte Zusammenfassung 177
In der Tabelle enthalten sind die folgenden Daten; die 800bp Sequenz einschließlich
des Mikrosatelliten, das Chromosom, der Markername, die „Accession number“ mit
dem entsprechenden Link zur „NCBI Nukleotide Datenbank“, das Sequenzmotiv und
die Markerlänge in Basenpaaren für einfache und zusammengesetzte
Mikrosatelliten, die BLAST Position des Mikrosatelliten auf EquCab2.0, die
„Annealing“ Temperatur (Ta) und der GC Gehalt des entsprechenden Vorwärts und
Rückwärts Primers, die PCR Produktgröße in Basenpaaren mit der entsprechenden
Sequenz, die Position des Mikrosatelliten innerhalb dieser Sequenz in Basenpaaren,
die Information ob sich SINE oder LINE Elemente in der 800bp Sequenz befinden,
die ENSEMBL Gen ID mit dem Link zur ENSEMBL Datenbank und/oder der
Genname, und falls bekannt auch die Anzahl Allele, HET, PIC, Anzahl der Pferde an
denen diese Werte erhoben wurden, und die Pferderasse.
Diskussion Die Gesamtdatei kann in einer komprimierten Exeldatei heruntergeladen werden,
zusätzlich kann nach einzelnen Markernamen, oder nach Markern in einer
bestimmten Region gesucht werden. Dies ist die erste Datenbank für Mikrosatelliten,
die die physikalische Position eines Markers direkt (in Mb) angibt. Das ist sehr
hilfreich für diejenigen, die nach neuen Markern in einem speziellen Bereich suchen.
Das Wissen über Verteilungsmuster von Mikrosatelliten im Genom ist eine der
Voraussetzungen, um Vorgänge wie die Bildung von Mikrosatellitenregionen besser
verstehen zu können. Für die nähere Charakterisierung von quantitativen
Merkmalsgenorten aber ist noch viel wichtiger, dass die durch diese Veröffentlichung
stark erhöhte Dichte von Mikrosatelliten auf dem Pferdegenom eine Feinkartierung
mit Markerabständen von unter einer Megabase möglich macht.
Genomscan zur Identifizierung von quantitativen Merkmalsgenorten (QTL) für chronische Mauke bei Deutschen Kaltblütern Einleitung Im Fokus dieser Doktorarbeit stand die genetische Prädisposition für Mauke, die für
die unterschiedlichen Deutschen Kaltblutpferderassen auf 20% bis zu 90% geschätzt
wurde.
178 Erweiterte Zusammenfassung
Durch die vorangehende Doktorarbeit ist diese molekulargenetische Studie
ermöglicht worden, denn aussagekräftige Kopplungsstudien sollten auf möglichst
vielen betroffenen Individuen und präzisen Untersuchungsergebnissen beruhen.
Grundlage für den molekulargenetischen Ansatz zur Aufklärung der chronischen
Mauke sind klinische Daten und Informationen wie zum Beispiel zu den
Stallbedingungen, der Verwendung der Pferde und der Fütterung, die im Rahmen
der vorangegangenen Doktorarbeit in den Jahren 2001-2002 von Züchtern in ganz
Deutschland bei 917 Deutschen Kaltblütern erhoben wurden. Für jedes Pferd wurden
außerdem das Geburtsdatum, die Pferderasse und der beobachtete
Krankheitsverlauf der Mauke erfragt. Die Untersuchung beinhaltete eine klinische
Allgemeinuntersuchung und eine spezielle klinische Untersuchung der Haut von allen
vier Beinen. Die Ausbreitung der Hautläsionen wurde mit Hilfe von schematischen
Zeichnungen dokumentiert und anhand einer Bewertungsscala von 1 bis 5 klinisch
bewertet.
Material und Methoden Pedigreematerial
Aus den Blutproben von 917 Kaltblütern wurden 378 Pferde aus den Zuchtverbänden
des Rheinisch Deutschen Kaltbluts, des Schleswiger Kaltbluts, des Sächsisch-
Thüringischen Kaltbluts und des Süddeutschen Kaltbluts ausgewählt. Diese
Kaltblüter wurden in 31 Halbgeschwister Familien zusammengefasst, welche für das
Merkmal ‚Mauke’ segregierten. Die Anzahl von genotypisierten Kaltblütern pro
Familie variierte zwischen 5 und 24. Die Rheinisch Deutschen wurden repräsentiert
durch 2 Familien mit 11 betroffenen Pferden, die Schleswiger durch 5 Familien mit 56
betroffenen Pferden, die Sächsisch-Thüringischen durch 9 Familien mit 87
betroffenen Pferden, und die Süddeutschen durch 15 Familien mit 146 betroffenen
Pferden.
Die Maukeprävalenz im Familienmaterial des Genomscans war bei den einzelnen
Kaltblutrassen unterschiedlich, wobei die Süddeutschen mit 70,6%, die Sächsisch-
Thüringischen mit 82,3%, die Schleswiger mit 84,1% und die Rheinisch-Deutschen
sogar mit 90,9% von Mauke betroffen waren.
Die ausgewählten Kaltblüter wurden in den Jahren 1982-2000 geboren, das
Durchschnittsalter der klinisch gesunden Pferde lag zwischen 4 Jahren (Rheinisch
Erweiterte Zusammenfassung 179
Deutsche), 4,7 Jahren (Schleswiger), 7 Jahren (Sächsisch-Thüringische) und 8,8
Jahren (Süddeutsche). Die erkrankten Pferde waren durchschnittlich älter mit 7
Jahren (Rheinisch Deutsche), 8,7 Jahren (Süddeutsche), 9,3 Jahren (Schleswiger)
und 9,8 Jahren (Sächsisch-Thüringische).
Markerset
Für den Genomscan wurden insgesamt 318 Mikrosatelliten typisiert. Dies erfolgte als
Zweistufenanalyse, wobei zuerst 178 gleichmäßig über alle Autosomen und das X-
Chromosom verteilte Mikrosatelliten an 8 Familien mit 68 Süddeutschen Kaltblütern
genotypisiert wurden. Die Zahl der Kaltblutpferde wurde anschließend erhöht und die
zusätzlichen Proben von weiteren Deutschen Kaltblutrassen sind auch an den 178
Mikrosatelliten genotypisiert worden. Im zweiten Schritt wurde die Markerdichte auf
den Chromosomen (ECA) mit mutmaßlichen Merkmalsgenorten (QTL) erhöht. Der
durchschnittliche Abstand zwischen den 318 Markern auf der Pferdegenomsequenz
war 7,5 ± 8,2 Mb groß, die durchschnittliche Anzahl Allele betrug 7,1, die Mittelwerte
von HET lagen bei 65,7% und von PIC bei 63,8%.
Genotypisierung der Mikrosatelliten
Von den ausgewählten Kaltblütern wurde DNA aus EDTA-Blutproben unter
Verwendung des QIAamp® 96 DNA Blood Kit (QIAGEN, Hilden, Deutschland)
isoliert. Die verwendeten Mikrosatelliten wurden unter identischen PCR Bedingungen
(Denaturierung bei 94°C für 4 min, 36 Zyklen mit jeweils 30 sec bei 94°C, 60 sec Ta,
30 sec bei 72°C und 10 min bei 4°C), die sich lediglich in den verschiedenen
Annealing Temperaturen (Ta ) unterschieden, in Anwesenheit von Taq Polymerase
und spezifischer, Fluoreszenzfarbstoff markierter Primer (IRD700 und IRD800)
amplifiziert. Zur Steigerung der Effizienz konnten Multiplex-PCR Ansätze von bis zu 8
Primer-Paaren erfolgreich durchgeführt werden. Die PCR-Produkte wurden
anschließend mit Formamid-Ladepuffer in variierendem Verhältnis von 1:3 bis 1:20
verdünnt. Die einzelnen Allele wurden mit Hilfe von 4 und 6%-igen
Polyacrylamidgelen durch Gelelektrophorese auf den automatischen
Sequenziergeräten LI-COR 4200/S2 und LICOR 4300 (LI-COR, Lincoln, USA)
aufgetrennt. Die Allelgrößen wurden in Basenpaaren ausgewertet. Anhand von
zusätzlich aufgetragenen, fluoreszierenden (IRD700/800) Längenstandards und
180 Erweiterte Zusammenfassung
einem schon typisierten Referenztier (RT-1) konnten auf Ausdrucken der Genotyp
der Marker makroskopisch bestimmt werden.
Statistik
Es wurde eine nicht-parametrische Kopplungsanalyse unter der Verwendung der
Software MERLIN auf der Grundlage von abstammungsidentischen Markerallelen
(IBD) zwischen den verwandten Tieren durchgeführt. Dabei wurden die Markerallele
auf Kosegregation mit der phänotypischen Ausprägung von Mauke getestet.
Anschließend wurde die einer Normalverteilung folgende Teststatistik für den Anteil
an IBD-Markerallelen (Zmean) und ein daraus abgeleiteter LOD Score berechnet. Als
signifikant für die Kosegregation eines Markerallels mit dem Phänotyp der Mauke
gelten Irrtumswahrscheinlichkeiten (p) von 0,05 oder kleiner. Es wurden
verschiedene Kopplungsanalysen durchgeführt, für alle Deutschen Kaltblutpferde
gemeinsam, innerhalb jeder der vier Rassen und für Familienkombinationen über alle
Rassen hinweg, deren Zmean > 1 war.
Ergebnisse Durch den Genomscan an 378 Deutschen Kaltblütern ergab sich eine signifikante
Kopplung für das Auftreten der chronischen Mauke zu insgesamt 4
Chromosomregionen auf ECA1, 9, 16 und 17. Die Position der QTL liegt zwischen
102,6–117,8 Mb auf Chromosom 1, zwischen 46,1-71,7 Mb auf Chromosom 9,
zwischen 2,7-38,4 Mb auf Chromosom 16 und zwischen 0-23,8 auf Chromosom 17.
Die Kopplungsanalysen innerhalb der einzelnen Rassen konnten alle
Merkmalsgenorte (QTL) bestätigen, der QTL auf Chromosom 1 war besonders für
das Süddeutsche Kaltblut signifikant, und die QTL auf Chromosom 9, 16 und 17
zeigten signifikante LOD Scores beim Sächsisch-Thüringischen Kaltblut. Zusätzlich
konnten noch chromosomweit signifikante QTL für die Süddeutschen Kaltblüter auf
Chromosom 7 zwischen 29-33,8 Mb, und für die Schleswiger auf Chromosom 10
zwischen 19,8-38,5 Mb und auf Chromosom 11 zwischen 41,5-61,3 nachgewiesen
werden. Genomweite Signifikanz der Kopplung wurde für die QTL auf Chromosomen
1, 10 und 16 durch die Einbeziehung aller Familien mit Zmeans > 1 erreicht.
Erweiterte Zusammenfassung 181
Diskussion Diese Kopplungsstudie ist die erste genomweite Untersuchung an von chronischer
Mauke betroffenen Kaltblütern. Da die Pferde aller untersuchten Kaltblutrassen die
gleiche Krankheitssymptomatik einschließlich der Schwere der Erkrankung
aufweisen und dem gleichen Altersprofil entsprechen, wurde der Ansatz einer
Kopplungsanalyse mit mehreren Pferderassen gut begründet. Außerdem gibt es
genetische Verwandschaftsverhältnisse zwischen den untersuchten Kaltblutrassen
und auch zum Belgischen Kaltblut. Durch das Einkreuzen von Belgischem Kaltblut in
einige Deutsche Kaltblutrassen zu Anfang des 20. Jahrhunderts wurde eine
signifikante Steigerung von an Mauke erkrankten Pferden bedingt. Den Belgiern wird
ein hoher Anteil an der genetischen Prädisposition für Mauke nachgesagt.
Im Rahmen unserer Studie wurden vier genomweit signifikante Chromosomregionen
auf ECA1, 10, 16 und 17 identifiziert. Es ist sehr wahrscheinlich, dass die
Entwicklung von Mauke von mehreren Genen beeinflusst wird. Diese QTL
ermöglichen eine Suche nach neuen positionellen Kandidatengenen.
Die zwei vorangegangenen Kandidatengenstudien für Mauke haben das auf
Chromosom 8 liegende Gen ATP2A2 und das auf Chromosom 3 liegende Gen
FOXC2 auf Grund von ähnlichen, beim Menschen nachgewiesenen Erkrankungen
untersucht. In beiden Studien konnte keine Kopplung bzw Assoziation von mit Mauke
gekoppelten Markern gefunden werden, und auch im Genomscan wurden keine
signifikant gekoppelten Mikrosatelliten in den entsprechenden Chromosombereichen
gefunden.
Um eine Suche nach Kandidatengenen erfolgreich durchführen zu können sollte die
Pathogenese der entsprechenden Krankheit berücksichtigt werden. Da die Ätiologie
der Mauke bisher nicht abschließend geklärt werden konnte, haben wir uns für die
Suche von Kandidatengenen auf die Ergebnisse der histopathologischen Studien
bezogen. Diese beschreiben eine epidermale Hyperplasie und Hyperkeratose in
allen betroffenen Kaltblütern, kombiniert mit einer von T-Lymphozyten dominierten
perivaskulären Dermatitis. Außerdem konnte eine abnormale Differenzierung von
Keratinozyten nachgewiesen werden.
Es konnten für die Entstehung der Mauke potentiell wichtige Kandidatengene auf den
Chromosomen 1, 10 und 17 gefunden werden, welche in den genomweit
signifikanten QTL angeordnet sind. Im Einzelnen sind dies die ubiquitin protein ligase
E3A UBE3A auf ECA1 (110,7 Mb), der aktivierte T Zell Marker CD109 auf ECA10

182 Erweiterte Zusammenfassung
(28,6-28,7 Mb) und das Myotubularin verwandte Protein 6 MTMR6 auf Chromosom
17, welche alle eine immunmodulatorische Wirkung besitzen.
In dieser ersten genomweiten Studie zur chronischen Mauke bei Deutschen
Kaltblutpferden konnten vier genomweit signifikante QTL auf vier Chromosomen
entdeckt werden.

CHAPTER 8
Appendix
184 Appendix
8 Appendix Laboratory paraphernalia Equipment Thermocycler
PTC-100™ Programmable Thermal Controller (MJ Research, Watertown, USA)
PTC-100™ Peltier Thermal Cycler (MJ Research, Watertown, USA)
PTC-200™ Peltier Thermal Cycler (MJ Research, Watertown, USA)
Biometra TProfessional Thermocycler (Biometra, Göttingen, Germany)
Automated sequencers
LI-COR Gene Read IR 4200 DNA Analyzer (LI-COR, Inc., Lincoln, NE, USA)
LI-COR Gene Read IR 4300 DNA Analyzer (LI-COR, Inc., Lincoln, NE, USA)
Centrifuges
Sigma centrifuge 4-15 (Sigma Laborzentrifugen GmbH, Osterode)
Desk-centrifuge 5415D (Eppendorf, Hamburg)
Biofuge stratos (Heraeus, Osterode)
Megafuge 1. OR (Heraeus, Osterode)
Speed Vac® Plus (Savant Instruments, Farmingdale, NY, USA)
Pipettes
Multipette® plus (Eppendorf AG, Hamburg, Germany)
Pipetus®-akku (Hirschmann® Laborgeräte GmbH & Co.KG, Eberstadt, Germany)
Pipetman® (P2, P10, P20, P100, P200, P1000) (Gilson Medical Electronics S.A.,
Villiers-le-bel, France)
Pipettor, Multi 12 Channel (0.1 – 10 µl) (Micronic® systems, Lelystad, The
Netherlands)
12 Channel Manual Pipettor (0.5 – 10 µL) (Matrix Technologies Corporation, Cheshire
UK)
12 Channel Manual Pipettor (25 – 200 µL) (Matrix Technologies Corporation,
Cheshire UK)
8-Channel, gel loading syringe (Hamilton Bonaduz AG, Bonaduz, Switzerland)
Appendix 185
Others
Milli-Q® biocel water purification system (Millipore GmbH, Eschborn, Germany)
Kits Isolation of DNA
QIAamp 96 DNA Blood Kit (QIAGEN, Hilden, Germany)
Size standards IRDye™ 700 or 800 (LI-COR, Inc., Lincoln, NE, USA)
Primers Primers were produced by MWG-Biotech AG, Ebersberg, Germany
Reagents and buffers APS solution (10 %)
1 g APS
10 ml H2O
dNTP solution
100 µl dATP [100 mM]
100 µl dCTP [100 mM]
100 µl dGTP [100 mM]
100 µl dTTP [100 mM]
1600 µl H2O
The concentration of each dNTP in the ready-to-use solution is 5 mM
Gel solution (6%)
12.75 ml Urea/TBE solution (6%)
2.25 ml Rotiphorese® Gel 40 (38% acrylamide and 2% bisacrylamide)
95 µl APS solution (10%)
9.5 µl TEMED
186 Appendix
TBE-buffer (1x)
100 ml TBE-buffer (10x)
900 ml H2O
Urea/TBE solution (6 %)
425 g urea [60.06 M]
250 ml H2O
100 ml TBE-buffer (10x)
Solubilise in a water bath at 65°C
H2O ad 850 ml
Chemicals Ammonium persulfate (APS) ≥ 98 % (Sigma-Aldrich Chemie GmbH, Taufkirchen)
Boric acid ≥ 99.8 %, p.a. (Carl Roth GmbH & Co, Karlsruhe)
dATP, dCTP, dGTP, dTTP > 98% (Carl Roth GmbH & Co. KG, Karlsruhe)
DMSO ≥ 99.5 %, p.a. (Carl Roth GmbH & Co, Karlsruhe)
dNTP-Mix (Qbiogene GmbH, Heidelberg)
Enhancer solution P 5x (peqlab Biotechnologie GmbH, Erlangen))
Formamide ≥ 99.5 %, p.a. (Carl Roth GmbH & Co, Karlsruhe)
Natriumdihydrogenphosphat (Biochrom AG, Berlin)
Paraffin (Merck KgaA, Darmstadt)
Rotiphorese®Gel40 (Carl Roth GmbH & Co, Karlsruhe)
TEMED 99 %, p.a. (Carl Roth GmbH & Co, Karlsruhe)
Tris PUFFERAN® ≥ 99.9 %, p.a. (Carl Roth GmbH & Co, Karlsruhe)
Urea ≥ 99.5 %, p.a. (Carl Roth GmbH & Co, Karlsruhe)
Water was taken from the water purification system Milli-Q®
Enzymes PCR
Taq-DNA-Polymerase 5 U/µl (Qbiogene GmbH, Heidelberg)
Incubation Mix (10x) T.Pol with MgCl2 [1.5mM] (Qbiogene, Heidelberg)
The polymerase was always used in the presence of Incubation Mix T. Pol 10x buffer
Appendix 187
Consumables PCR-Plate PP, nature, 96x0.2ml, skirted, RNase-, DNA- und pyrogenfree (nerbe plus)
Combitips® plus (Eppendorf AG, Hamburg, Germany)
Pipette tips 0.1 – 10 µl (K138.1), 0.1 – 10 µl (A407.1), 5 – 200 µl (7058.1) (Carl Roth
GmbH & Co, Karlsruhe, Germany)
Pipette tips 0.1 – 10 µl (7600) (Matrix Technologies Corporation, Lowell, USA)
Reaction tubes 1.5 ml and 2.0 ml (nerbe plus GmbH, Winsen/Luhe, Germany)
Reaction tubes 10 and 50 ml (Falcon) (Renner, Darmstadt, Germany)
Software BLASTN, trace archive http://www.ncbi.nlm.nih.gov
BLAT Search Genome http://genome.ucsc.edu/cgi-bin/hgBlat
ENSEMBL Genome browser http://www.ensembl.org/index.html
HORSEMAPdatabase http://dga.jouy.inra.fr/cgibin/lgbc/loci_
micro.operl?BASE=horse
MERLIN software
package version 1.0.1 http://www.sph.umich.edu/csg/abecasis/Merlin
Order of primers MWG Biotech-AG, Ebersberg
(https://ecom. mwgdna.com/register/index.tcl)
PED5.0 Dr. H. Plendl et al. (2005) Institute for Human
Genetics, Kiel/
Primer design (Primer3) http://frodo.wi.mit.edu/cgi-bin/primer3/primer3_
www.cgi
Repeat Masker http://www.repeatmasker.genome. washington.edu/
SUN Ultra Enterprise 450 Sun microsystems GmbH, Kirchheim-Heimstetten
SUN FIRE V490 Sun microsystems GmbH, Kirchheim-Heimstetten

188

CHAPTER 9
List of publications
190 List of publications
9 List of publications Journal articles Evelyn H. Mittmann, Virginie Lampe, Stefanie Mömke, Alexandra Zeitz and Ottmar
Distl (2009). Characterisation of a minimal microsatellite set for whole genome
scans informative in warmblood and coldblood horse breeds. Journal of
Heredity, DOI 10.1093/jhered/esp091
Mittmann E H, Wrede J, Pook J, Distl O (2009). Identification of 21 781 equine
microsatellites on the horse genome assembly 2.0. Animal Genetics, DOI
10.1111/j.1365-2052.2009.01979.x
Oral presentation E. H. Mittmann, S. Mömke, O. Distl. Identifizierung von mit Mauke gekoppelten QTL
bei Deutschen Kaltblütern anhand eines Genomscans. Vortragstagung der
Deutschen Gesellschaft für Züchtungskunde e.V. und der Gesellschaft für
Tierzuchtwissenschaft, 17. und 18. September 2008, Bonn

CHAPTER 10
Acknowledgements

192 Acknowledgements
10 Acknowledgements
First of all I wish to thank Prof. Dr. Dr. habil. Ottmar Distl, the supervisor of my
doctoral thesis, for offering me the opportunity to work on an interesting dissertation.
His academic guidance, constructive criticism and support in the course of this work
were invaluable.
I want to express my heartfelt thanks to Jörn Wrede for his help with the statistical
analyses; but even more so for the never ending patience and perseverance with the
new microsatellites. Without him this would not have been possible.
I wish to thank Dr. Virginie Lampe for her support, particularly in the laboratory and
the first steps of microsatellite analysis. Her soothing presence and readiness to help
pulled me through the tough times.
I am very grateful to Heike Klippert-Hasberg and Stefan Neander for teaching me the
laboratory techniques and for their help during the work in the laboratory.
I want to thank C. Mrusek and D. Böhm for their support concerning administrative
questions.
I wish to thank R. I. Schwan for the graphical assistance. My special thanks go to all colleagues and friends of the Institute for Animal Breeding
and Genetics of the University of Veterinary Medicine Hannover for their support,
humour and the friendly atmosphere. You all made me feel at home at work.
Very special thanks go to my mother. Thank you for your tireless encouragement and
support in every way throughout all the years. I couldn’t have done it without you.
My special gratitude for your understanding, undemanding love and support in my life
goes to Jupp, Maren, Johannes and Lisa Knepper.

Acknowledgements
193
I want to thank all of my family for their support and help during the tough times. My
father will always remain my exemplar in doing what is right and staying true to
myself.