
Three-dimensional laboratory modelling of rifting ...jacdev/pdf/chemenda02.pdf · Three-dimensional...
21
Three-dimensional laboratory modelling of rifting: application to the Baikal Rift, Russia A. Chemenda a, * , J. De ´verche `re b , E. Calais c a Ge ´osciences Azur, UMR 6526, Universite ´ de Nice-Sophia Antipolis, 250 Rue Albert Einstein-Sophia Antipolis, 06560 Valbonne, France b Ge ´osciences Azur, UMR 6526, Universite ´ Pierre et Marie Curie, Quai de la Darse-BP 48, 06235 Villefranche-sur-Mer, France c Department of Earth and Atmospheric Sciences, Purdue University, West Lafayette, IN 47907-1397, USA Received 6 September 2001; accepted 5 July 2002 Abstract Continental rifting is treated as a mechanical instability developing under horizontal tectonic tension. The instability results in strain localization and the formation of a neck, which is interpreted as a rift zone. At the scale of the whole lithospheric plate, this process occurs in plane-stress conditions and can therefore be modelled to a first approximation by a one-layer plate whose properties represent integral (over thickness) properties of the real lithosphere. We have designed a scaled experimental single- layer lithosphere model having elasto-plastic rheology and lying upon a liquid substratum to study its behaviour under axial horizontal tension. In a homogeneous plate, the instability develops along a linear zone oriented at an angle of f 60j to the tension axis. This orientation is preserved even when the divergent displacement of the plate boundaries is not plain-parallel but rotational. In the latter case, the strain localization zone is rapidly propagating. When the plate length to width ratio is less than f 2.5, the necking develops along two branches conjugated at an angle of about 120j, which is frequently observed in actual rift systems. If the model contains a local weak zone (hot spot or fault zone), the rift junction is located at this zone. In the lithospheric models comprising strong (cratonic) and weak segments, strain localization depends on the configuration of the boundary between different lithospheres. The necking starts to form within the weak segment in the vicinity of the cratonic promontories and propagates in opposite directions again at an angle of ca. 60j to the tension axis. In the models containing both a strong lithosphere and local weak zones, the rift configuration depends on their shape and relative positions, with necking always going through the weak zones. In a set of models, we have reproduced the geometry of the boundary between the Siberian craton and the thermally much younger ( f 100 Ma) Sayan – Baikal lithosphere in the Baikal rift area. In these models, we were able to obtain the well-known three-branch configuration of the Baikal rift system only by introducing a weak zone in the area of Lake Baikal. Such a zone simulates the Paleozoic suture existing in this area. As in nature, two wide outer branches (eastern and western) are oblique to the regional tension axis, whereas the central one is narrow and orthogonal to the tension direction. In nature and in the model, rifting starts in the central branch corresponding to Lake Baikal. The modelling also predicts the formation of a fourth oblique f NS-trending branch to the south of Baikal. Although poorly expressed in the field, this branch has some seismotectonic and magmatic manifestations. The orientations of all four branches with respect to each other and with respect to the regional tension direction are remarkably similar in nature and in the model. D 2002 Elsevier Science B.V. All rights reserved. Keywords: Rifting; Geodynamics; Physical modelling; Mechanics of the lithosphere; Baikal; Strain localisation 0040-1951/02/$ - see front matter D 2002 Elsevier Science B.V. All rights reserved. PII:S0040-1951(02)00389-X * Corresponding author. Tel.: +33-4-92-94-26-61; fax: +33-4-92-64-26-10. E-mail address: [email protected] (A. Chemenda). www.elsevier.com/locate/tecto Tectonophysics 356 (2002) 253– 273
Transcript of Three-dimensional laboratory modelling of rifting ...jacdev/pdf/chemenda02.pdf · Three-dimensional...
Three-dimensional laboratory modelling of rifting:
application to the Baikal Rift, Russia
A. Chemenda a,*, J. Deverchere b, E. Calais c
aGeosciences Azur, UMR 6526, Universite de Nice-Sophia Antipolis, 250 Rue Albert Einstein-Sophia Antipolis, 06560 Valbonne, FrancebGeosciences Azur, UMR 6526, Universite Pierre et Marie Curie, Quai de la Darse-BP 48, 06235 Villefranche-sur-Mer, France
cDepartment of Earth and Atmospheric Sciences, Purdue University, West Lafayette, IN 47907-1397, USA
Received 6 September 2001; accepted 5 July 2002
Abstract
Continental rifting is treated as a mechanical instability developing under horizontal tectonic tension. The instability results
in strain localization and the formation of a neck, which is interpreted as a rift zone. At the scale of the whole lithospheric plate,
this process occurs in plane-stress conditions and can therefore be modelled to a first approximation by a one-layer plate whose
properties represent integral (over thickness) properties of the real lithosphere. We have designed a scaled experimental single-
layer lithosphere model having elasto-plastic rheology and lying upon a liquid substratum to study its behaviour under axial
horizontal tension. In a homogeneous plate, the instability develops along a linear zone oriented at an angle of f 60j to the
tension axis. This orientation is preserved even when the divergent displacement of the plate boundaries is not plain-parallel but
rotational. In the latter case, the strain localization zone is rapidly propagating. When the plate length to width ratio is less than
f 2.5, the necking develops along two branches conjugated at an angle of about 120j, which is frequently observed in actual
rift systems. If the model contains a local weak zone (hot spot or fault zone), the rift junction is located at this zone. In the
lithospheric models comprising strong (cratonic) and weak segments, strain localization depends on the configuration of the
boundary between different lithospheres. The necking starts to form within the weak segment in the vicinity of the cratonic
promontories and propagates in opposite directions again at an angle of ca. 60j to the tension axis. In the models containing
both a strong lithosphere and local weak zones, the rift configuration depends on their shape and relative positions, with necking
always going through the weak zones. In a set of models, we have reproduced the geometry of the boundary between the
Siberian craton and the thermally much younger (f 100 Ma) Sayan–Baikal lithosphere in the Baikal rift area. In these models,
we were able to obtain the well-known three-branch configuration of the Baikal rift system only by introducing a weak zone in
the area of Lake Baikal. Such a zone simulates the Paleozoic suture existing in this area. As in nature, two wide outer branches
(eastern and western) are oblique to the regional tension axis, whereas the central one is narrow and orthogonal to the tension
direction. In nature and in the model, rifting starts in the central branch corresponding to Lake Baikal. The modelling also
predicts the formation of a fourth oblique fNS-trending branch to the south of Baikal. Although poorly expressed in the field,
this branch has some seismotectonic and magmatic manifestations. The orientations of all four branches with respect to each
other and with respect to the regional tension direction are remarkably similar in nature and in the model.
D 2002 Elsevier Science B.V. All rights reserved.
Keywords: Rifting; Geodynamics; Physical modelling; Mechanics of the lithosphere; Baikal; Strain localisation
0040-1951/02/$ - see front matter D 2002 Elsevier Science B.V. All rights reserved.
PII: S0040 -1951 (02 )00389 -X
* Corresponding author. Tel.: +33-4-92-94-26-61; fax: +33-4-92-64-26-10.
E-mail address: [email protected] (A. Chemenda).
www.elsevier.com/locate/tecto
Tectonophysics 356 (2002) 253–273

1. Introduction
Continental rifts occur under tectonic extension of
the lithosphere. The numerous discussions about
active versus passive rifting mechanisms generally
lead to the conclusion that both processes exist and
probably work simultaneously in a rift zone, with one
or another mechanism dominating (Forsyth and
Uyeda, 1975; Morgan and Baker, 1983; Ziegler,
1992; Olsen, 1995; Ruppel, 1995). There is a general
agreement that rifts basically represent zones of exten-
sional strain localization, although the role of non-
mechanical processes (such as mineralogical trans-
formations, e.g., Artyushkov, 1981) in the crustal
thinning and formation of the rift valleys remains
unclear. Strain localization within the lithosphere
depends on its rheology, boundary and initial con-
ditions. This process has been widely modelled using
both experimental (e.g., Faugeres et al., 1986; Alle-
mand et al., 1989; Shemenda, 1984; Tron and Brun,
1991; McClay and White, 1995; Brun and Beslier,
1996; Benes and Davy, 1996; Bonini et al., 1997) and
numerical (e.g., Buck, 1991; Martinod and Davy,
1992; Hassani and Chery, 1996; Hopper and Buck,
1996, 1998; Houseman and Molnar, 1997; Burov and
Poliakov, 2001) techniques. These studies show that
strain localization results in lithospheric necking,
either symmetrical with respect to a vertical plane
(Buck, 1991; Brun and Beslier, 1996) or asymmetrical
in the models where the lithospheric material is
allowed to fail (or is prefailed) along an inclined
normal (detachment) fault (Faugeres et al., 1986;
Dunbar and Sawyer, 1989; Allemand et al., 1989;
Malkin and Shemenda, 1991; Lesne et al., 2000). The
details of the deformation pattern depend on the
rheological structure of the lithosphere that can con-
tain one, two or more weak layers, following adopted
petrological models, geotherm and wet or dry rheol-
ogy (Ranalli and Murphy, 1987; Tommasi et al.,
1995). Geological heritage such as preexisting faults,
weak (hot) and/or strong (cold) zones in the litho-
sphere, and its mechanical anisotropy also appear to
play a major role (Dunbar and Sawyer, 1989; Malkin
and Shemenda, 1991; Vauchez et al., 1997, 1998;
Lesne et al., 2000).
Both rheological and mechanical structures of the
lithosphere are poorly constrained, while 2-D numer-
ical models show that the deformation of the litho-
sphere in cross-section is extremely sensitive to its
rheological stratification (e.g., Burov and Poliakov,
2001, and references therein) There is therefore a
large freedom in ‘‘adjusting’’ complex models to fit
one or another set of observations. On the other hand,
3-D aspects of the lithospheric strain localization are
almost unexplored, whereas the majority of the rifts
(Baikal in particular) represent essentially 3-D struc-
tures. Stresses generated within the rigid (elastic)
lithospheric envelope in the presence of various types
of heterogeneities (faults, strong and week zones) may
result in a strain localization (plastic failure) pattern
that cannot be predicted by 2-D models. The cross-
section deformation will be defined by this 3-D
pattern and thus cannot be thoroughly understood
through 2-D models.
In this paper, we present results from 3-D exper-
imental modelling of uniaxial horizontal extension of
a simple one-layer plastic lithosphere designed to
understand a first-order lithospheric-scale mechanics
of rifting. We study strain localization within a heter-
ogeneous plate consisting of both strong and thick
(cratonic) and thermally younger lithospheres. The
experiments show that strain localization always
occurs within the weak lithosphere. The localization
is initiated near the cratonic promontories and then
propagates away. The geometry of the final ‘‘rift
system’’ depends on the configuration of the boundary
between strong and weak lithospheres, thus showing
the importance of a 3-D lithosphere structure. Local
weak lithospheric zones also strongly affect the strain
localization process by ‘‘attracting’’ the rifts. We
simulated two types of weak zones corresponding to
the fault zones and to the hot spots and showed that
the rifts always go through the hot spots and generally
initiate on the fault zones. By introducing both strong
and weak zones into the model, we attempt to
approach the actual situation in the Baikal rift system.
2. Modelling set up
The experimental technique, analogue materials
and similarity criteria are similar to those described
by Shemenda (1984) and Malkin and Shemenda
(1991) and are briefly presented below. The modelling
scheme is shown in Fig. 1. The lithosphere is mod-
elled by elasto-plastic material with strain weakening
A. Chemenda et al. / Tectonophysics 356 (2002) 253–273254
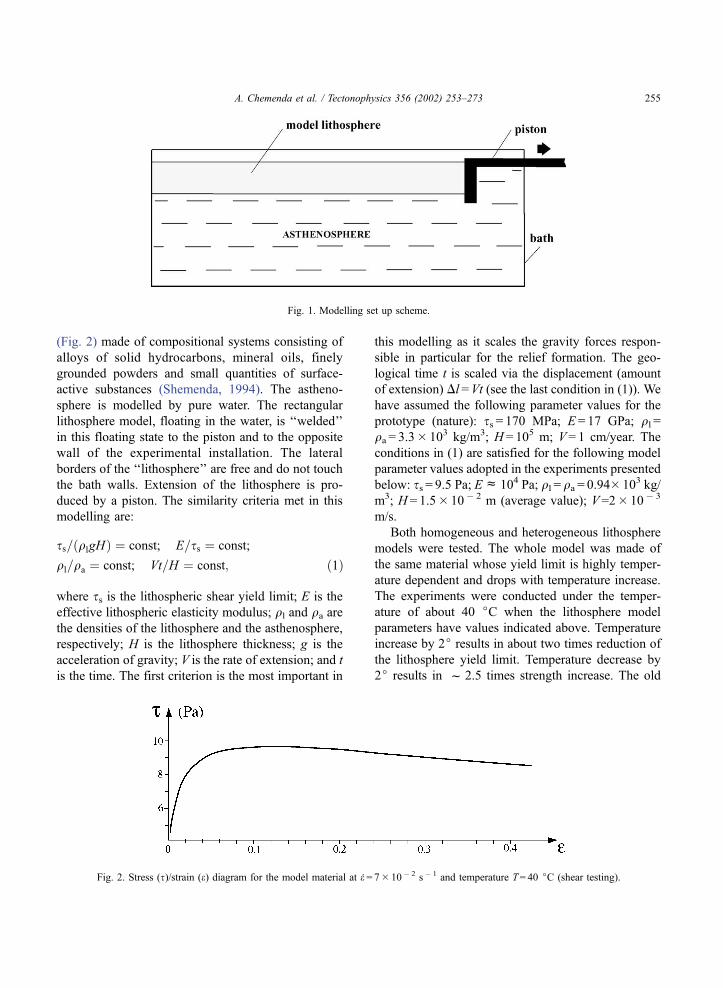
(Fig. 2) made of compositional systems consisting of
alloys of solid hydrocarbons, mineral oils, finely
grounded powders and small quantities of surface-
active substances (Shemenda, 1994). The astheno-
sphere is modelled by pure water. The rectangular
lithosphere model, floating in the water, is ‘‘welded’’
in this floating state to the piston and to the opposite
wall of the experimental installation. The lateral
borders of the ‘‘lithosphere’’ are free and do not touch
the bath walls. Extension of the lithosphere is pro-
duced by a piston. The similarity criteria met in this
modelling are:
ss=ðqlgHÞ ¼ const; E=ss ¼ const;
ql=qa ¼ const; Vt=H ¼ const; ð1Þ
where ss is the lithospheric shear yield limit; E is the
effective lithospheric elasticity modulus; ql and qa are
the densities of the lithosphere and the asthenosphere,
respectively; H is the lithosphere thickness; g is the
acceleration of gravity; V is the rate of extension; and t
is the time. The first criterion is the most important in
this modelling as it scales the gravity forces respon-
sible in particular for the relief formation. The geo-
logical time t is scaled via the displacement (amount
of extension) Dl =Vt (see the last condition in (1)). We
have assumed the following parameter values for the
prototype (nature): ss = 170 MPa; E = 17 GPa; ql =
qa = 3.3� 103 kg/m3; H = 105 m; V= 1 cm/year. The
conditions in (1) are satisfied for the following model
parameter values adopted in the experiments presented
below: ss = 9.5 Pa; Ec 104 Pa; ql = qa = 0.94� 103 kg/
m3; H = 1.5� 10� 2 m (average value); V=2� 10� 3
m/s.
Both homogeneous and heterogeneous lithosphere
models were tested. The whole model was made of
the same material whose yield limit is highly temper-
ature dependent and drops with temperature increase.
The experiments were conducted under the temper-
ature of about 40 jC when the lithosphere model
parameters have values indicated above. Temperature
increase by 2j results in about two times reduction of
the lithosphere yield limit. Temperature decrease by
2j results in f 2.5 times strength increase. The old
Fig. 2. Stress (s)/strain (e) diagram for the model material at e: = 7� 10� 2 s� 1 and temperature T= 40 jC (shear testing).
Fig. 1. Modelling set up scheme.
A. Chemenda et al. / Tectonophysics 356 (2002) 253–273 255
(cratonic) lithosphere was modelled by a thicker plate.
A thicker plate has higher effective strength. To
further increase the strength contrast between ‘‘nor-
mal’’ and ‘‘cratonic’’ lithospheres, we maintained the
surface of the latter at a lower temperature of f 38
jC. In fact, it was found that if the plate thickness
contrast is greater than f 20%, the temperature
decrease (yield limit increase) of the thicker litho-
sphere does not affect the model deformation: The
‘‘cratonic lithosphere’’ remains undeformed, and the
thinner model segment deforms independently on the
strength contrast value.
The weak zones were introduced in the litho-
sphere model in three different ways: In a chosen
area we: (a) pierced with a needle many times or cut
the ‘‘lithosphere’’ through its whole thickness; (b)
scraped the material from the plate surface and/or
bottom to locally reduce its thickness and hence
effective strength; and (c) produced local additional
heating of the model surface. In the latter case, an
electric heater of a given (circular or elongated)
shape was fixed at about 2 mm from the model
surface. It was regulated to maintain the model sur-
face temperature (controlled by a microthermocou-
ple) at 42–43 jC. The local heating lasted about 10–
15 min and was produced just before the model
deformation. If the model weakening was sufficient,
the all weakening techniques led to basically the
same result: The deformation was always localised
at a weak zone and then propagated away independ-
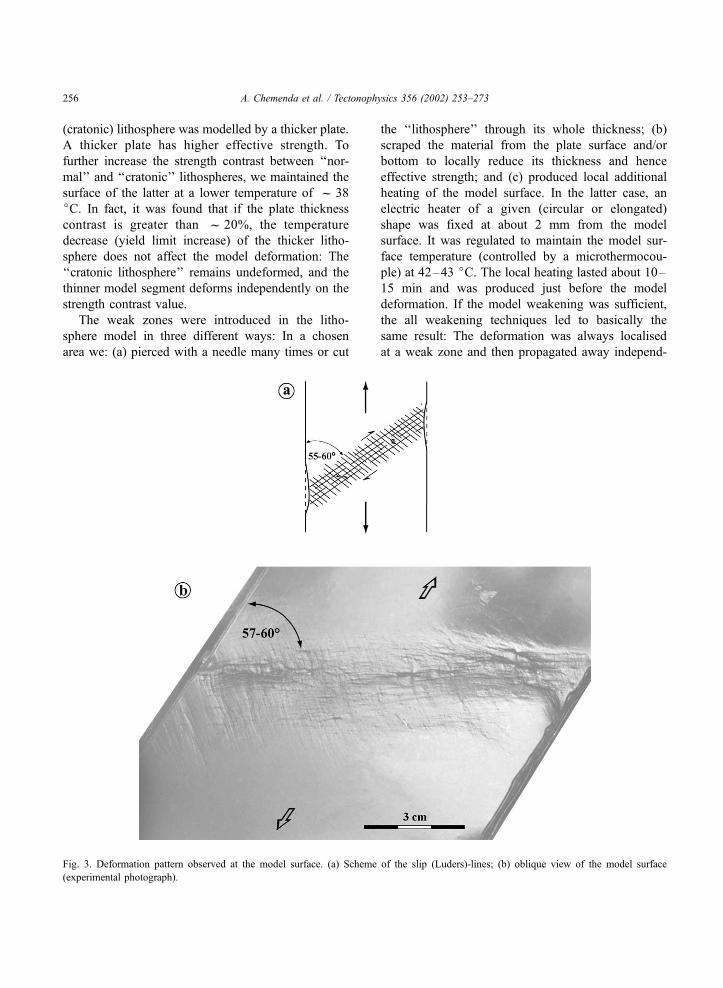
Fig. 3. Deformation pattern observed at the model surface. (a) Scheme of the slip (Luders)-lines; (b) oblique view of the model surface
(experimental photograph).
A. Chemenda et al. / Tectonophysics 356 (2002) 253–273256
ently on the way the plate is weakening. When the
weakening was very small, it did not affect the
deformation; the model deformed as if it were
homogeneous. We did not aim to determine exactly
the threshold weakening value but found that about
20% plate thinning is already sufficient for the
deformation to be localised on a weak zone. About
10–15 min of local heating also was sufficient to
change the model deformation pattern. We conclude
therefore that f 10 min heating produces about 20%
plate weakening.
3. Summary of previous experiments
We first summarize the main experimental results
reported by Shemenda (1984) and Malkin and She-
menda (1991) by completing them with new similar
experimental tests.
3.1. Strain localization within a homogeneous plate
An initially homogeneous experimental lithosphere
model subjected to an axial tension first undergoes
uniform lengthening. Then the deformation localizes
along a linear zone with a width comparable to the
plate thickness (Figs. 3 and 4). At the surface, the
strain localization zone (the rift) is manifested by two
slip-line (Luders line) families oriented at the angle of
about w =Ff 60j to the tension axis and by the
forming valley. The orientation of the strain local-
ization zone coincides with one slip-line family, with
another family being died just after the formation. The
localization can occur along either direction at + 60jor � 60j to the tension axis with equal probability
(this angle varies from f 55j to more than 62j from
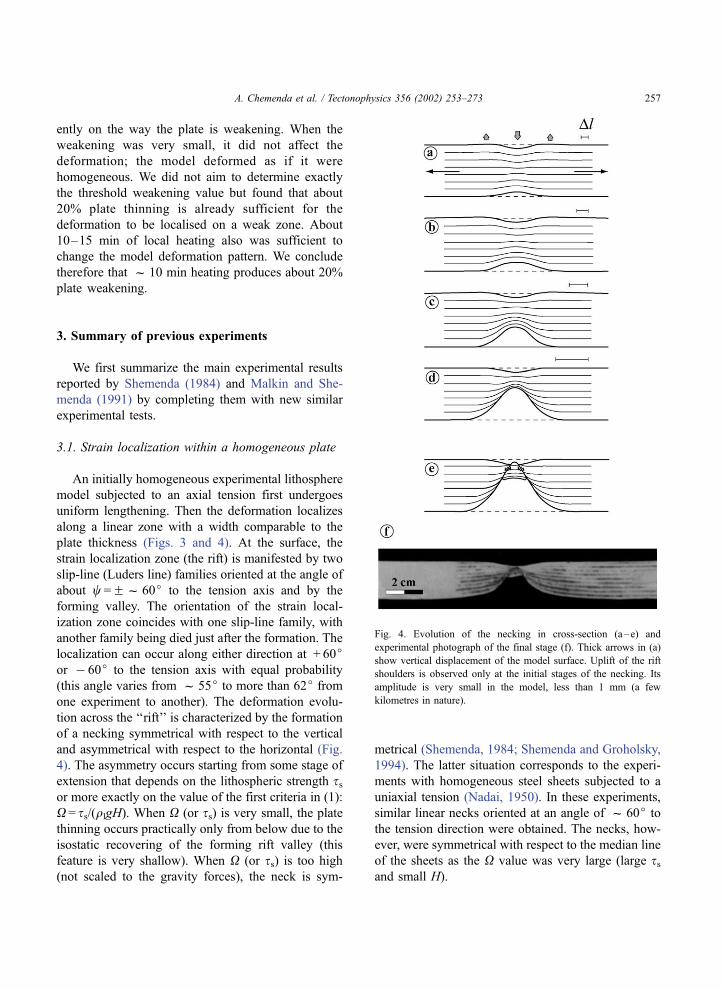
one experiment to another). The deformation evolu-
tion across the ‘‘rift’’ is characterized by the formation
of a necking symmetrical with respect to the vertical
and asymmetrical with respect to the horizontal (Fig.
4). The asymmetry occurs starting from some stage of
extension that depends on the lithospheric strength ssor more exactly on the value of the first criteria in (1):
X = ss/(qlgH). When X (or ss) is very small, the plate
thinning occurs practically only from below due to the
isostatic recovering of the forming rift valley (this
feature is very shallow). When X (or ss) is too high
(not scaled to the gravity forces), the neck is sym-
metrical (Shemenda, 1984; Shemenda and Groholsky,
1994). The latter situation corresponds to the experi-
ments with homogeneous steel sheets subjected to a
uniaxial tension (Nadai, 1950). In these experiments,
similar linear necks oriented at an angle of f 60j to
the tension direction were obtained. The necks, how-
ever, were symmetrical with respect to the median line
of the sheets as the X value was very large (large ssand small H).
Fig. 4. Evolution of the necking in cross-section (a–e) and
experimental photograph of the final stage (f). Thick arrows in (a)
show vertical displacement of the model surface. Uplift of the rift
shoulders is observed only at the initial stages of the necking. Its
amplitude is very small in the model, less than 1 mm (a few
kilometres in nature).
A. Chemenda et al. / Tectonophysics 356 (2002) 253–273 257

3.2. Effect of preexisting faults
In this set of experiments, the initially homoge-
neous plate was cut vertically in its upper part before
extension (Fig. 5a). The minimal cut depth was 1–2
mm, which corresponds in nature to a few to several
kilometres. When the cut is parallel to the stretching
direction, the plate deformation occurs as if no cut
exists, i.e., in the same way as shown in Fig. 3 even
when the cut is made throughout the whole plate
thickness. When the cut shown in Fig. 5 is oblique to
the tension axis, the deformation occurs as follows:
The plate first undergoes some thinning at the base
under the cut with opening and slight downward
propagation of the cut in the upper part of the model
(Fig. 5b). Simultaneously, a shear displacement is
observed at the surface along the cut. In the cross-
section perpendicular to the cut, two conjugated
narrow shear zones are forming, which separate a
rising wedge (Fig. 5b). Failure of the material along
one of these zones makes the deformation asymmet-
rical and results in the formation of a lithospheric
Fig. 5. Strain localization in the model with shallow vertical cut oriented at an angle of < 90j to the stretching direction: (a–d) successive stagesof deformation in cross-section orthogonal to the cut; (e) experimental photograph of the final stage.
A. Chemenda et al. / Tectonophysics 356 (2002) 253–273258
detachment fault, with slip along the other zone being
stopped (Fig. 5c and e). When the initial cut is
inclined, the deformation is simpler: The cut propa-
gates through the whole plate thickness at a dip angle
close to 45j, resulting straightaway in the formation
of a detachment fault. Such a process occurs even
when the surface trace of the cut is perpendicular to
the tension axis.
When instead of a single cut a fault zone is created
by making a number of closely located cuts, the strain
localizes along such a zone even when the individual
cuts are vertical and perpendicular to the tension axis.
The deformation pattern depends on the width and dip
of the fault zone as well as on the density of the cuts,
but it basically corresponds to a plate thinning within
the fault zone.
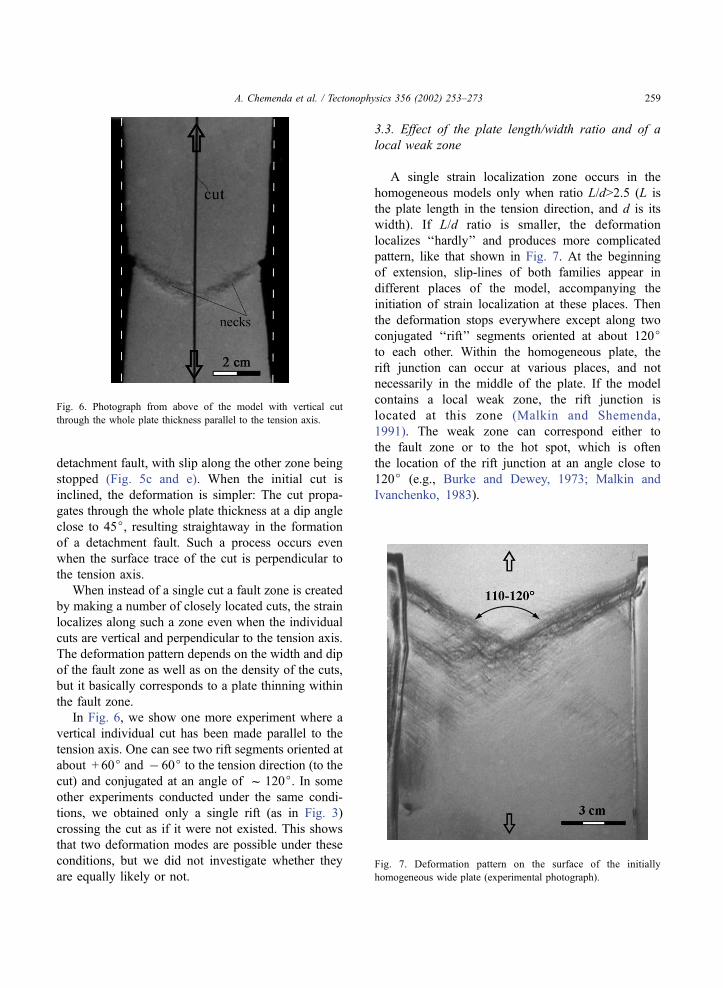
In Fig. 6, we show one more experiment where a
vertical individual cut has been made parallel to the
tension axis. One can see two rift segments oriented at
about + 60j and � 60j to the tension direction (to the
cut) and conjugated at an angle of f 120j. In some
other experiments conducted under the same condi-
tions, we obtained only a single rift (as in Fig. 3)
crossing the cut as if it were not existed. This shows
that two deformation modes are possible under these
conditions, but we did not investigate whether they
are equally likely or not.
3.3. Effect of the plate length/width ratio and of a
local weak zone
A single strain localization zone occurs in the
homogeneous models only when ratio L/d>2.5 (L is
the plate length in the tension direction, and d is its
width). If L/d ratio is smaller, the deformation
localizes ‘‘hardly’’ and produces more complicated
pattern, like that shown in Fig. 7. At the beginning
of extension, slip-lines of both families appear in
different places of the model, accompanying the
initiation of strain localization at these places. Then
the deformation stops everywhere except along two
conjugated ‘‘rift’’ segments oriented at about 120jto each other. Within the homogeneous plate, the
rift junction can occur at various places, and not
necessarily in the middle of the plate. If the model
contains a local weak zone, the rift junction is
located at this zone (Malkin and Shemenda,
1991). The weak zone can correspond either to
the fault zone or to the hot spot, which is often
the location of the rift junction at an angle close to
120j (e.g., Burke and Dewey, 1973; Malkin and
Ivanchenko, 1983).
Fig. 6. Photograph from above of the model with vertical cut
through the whole plate thickness parallel to the tension axis.
Fig. 7. Deformation pattern on the surface of the initially
homogeneous wide plate (experimental photograph).
A. Chemenda et al. / Tectonophysics 356 (2002) 253–273 259
4. New experiments
In this section, we report results from four more
experiments carried out using the same technique. The
first experiment shows strain localization under ‘‘flex-
ible’’ extensional boundary conditions considering the
fact that the relative plate motion actually represents a
rotation. The next three experiments are designed to
gain insights into the strain localization pattern within
the heterogeneous lithosphere model containing weak
and strong zones.
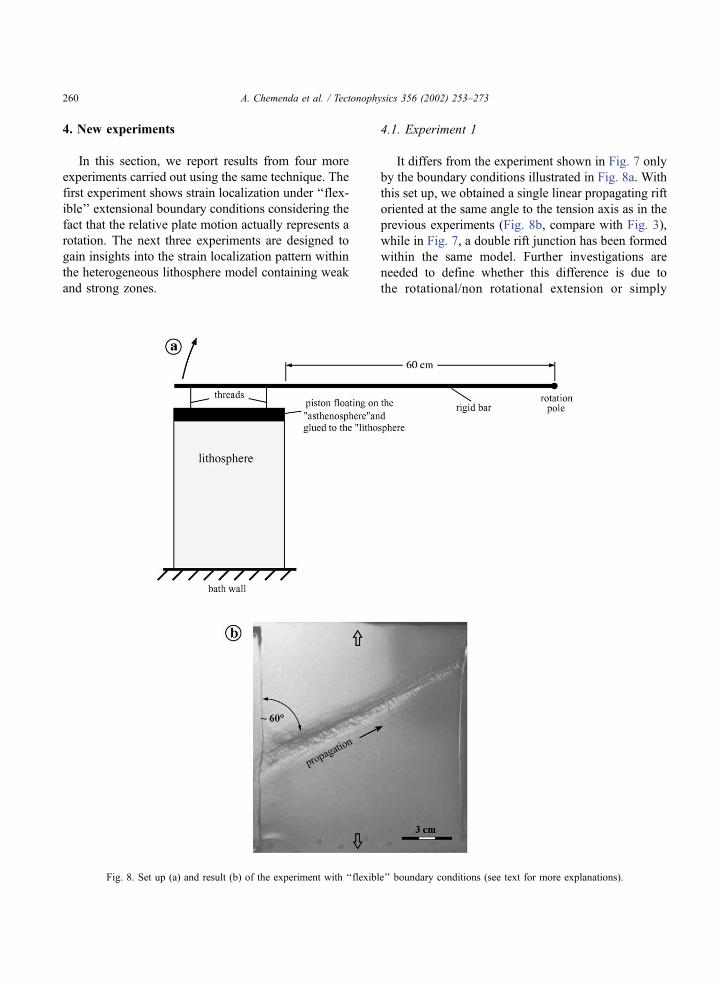
4.1. Experiment 1
It differs from the experiment shown in Fig. 7 only
by the boundary conditions illustrated in Fig. 8a. With
this set up, we obtained a single linear propagating rift
oriented at the same angle to the tension axis as in the
previous experiments (Fig. 8b, compare with Fig. 3),
while in Fig. 7, a double rift junction has been formed
within the same model. Further investigations are
needed to define whether this difference is due to
the rotational/non rotational extension or simply
Fig. 8. Set up (a) and result (b) of the experiment with ‘‘flexible’’ boundary conditions (see text for more explanations).
A. Chemenda et al. / Tectonophysics 356 (2002) 253–273260
because the boundary conditions in Experiment 1
(Fig. 8) are ‘‘flexible’’: The piston and the ‘‘litho-
sphere’’ glued to it are allowed to move in the
direction perpendicular to the tension axis compatible
with the strike–slip displacement along a single
‘‘rift’’. In Fig. 7, such a motion of the piston is
‘‘inhibited’’, and a stain localization within a wide
plate should occur along two zones symmetrical with
respect to the tension axis.
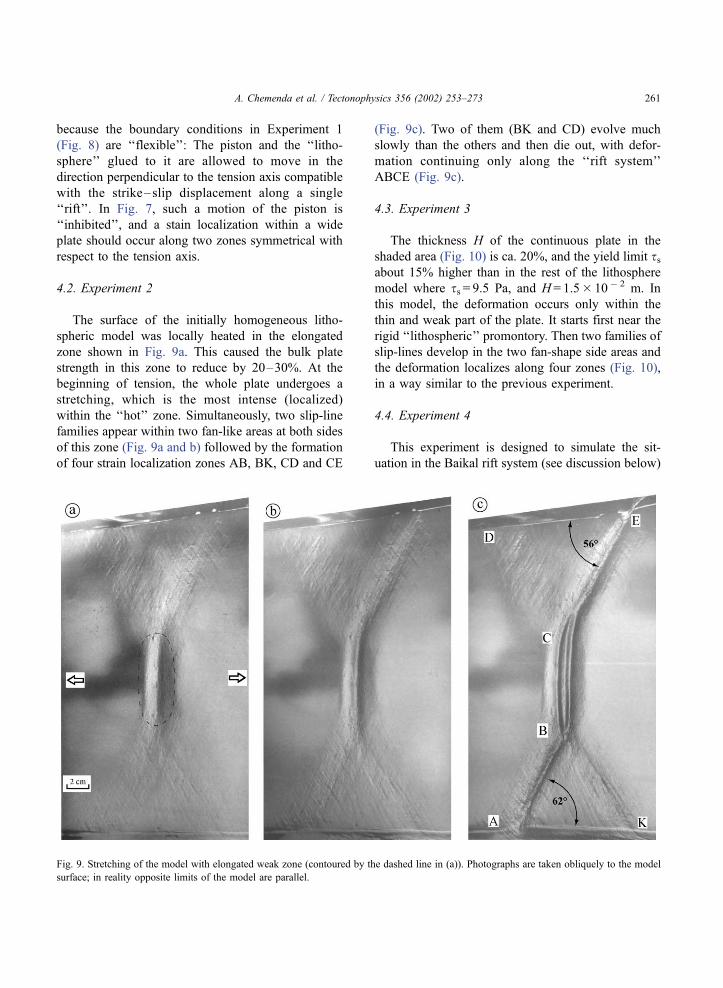
4.2. Experiment 2
The surface of the initially homogeneous litho-
spheric model was locally heated in the elongated
zone shown in Fig. 9a. This caused the bulk plate
strength in this zone to reduce by 20–30%. At the
beginning of tension, the whole plate undergoes a
stretching, which is the most intense (localized)
within the ‘‘hot’’ zone. Simultaneously, two slip-line
families appear within two fan-like areas at both sides
of this zone (Fig. 9a and b) followed by the formation
of four strain localization zones AB, BK, CD and CE
(Fig. 9c). Two of them (BK and CD) evolve much
slowly than the others and then die out, with defor-
mation continuing only along the ‘‘rift system’’
ABCE (Fig. 9c).
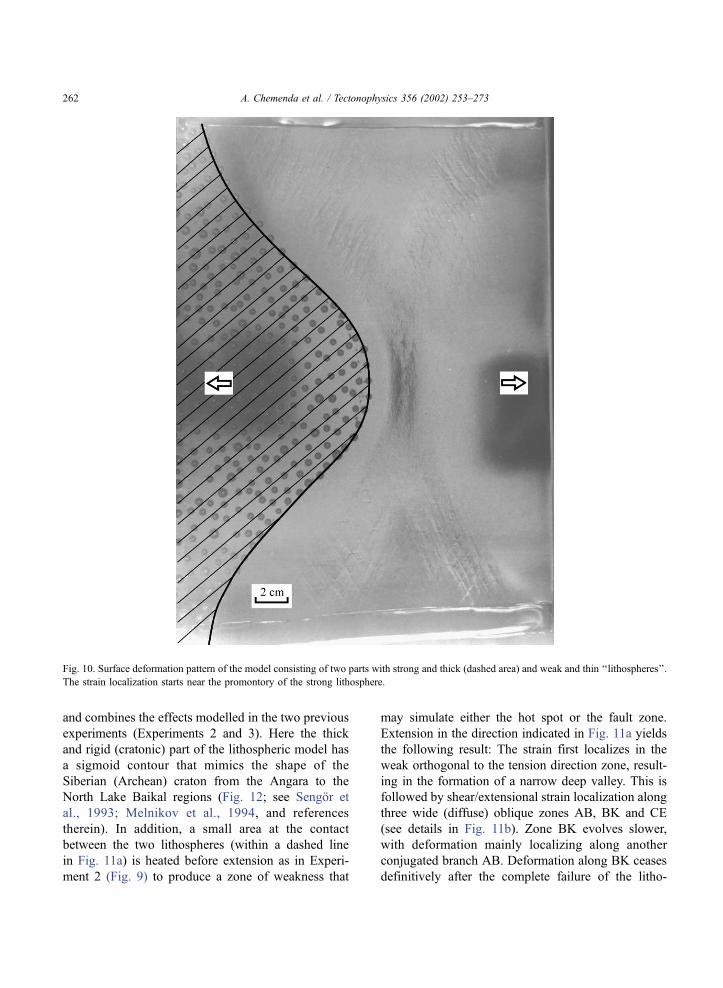
4.3. Experiment 3
The thickness H of the continuous plate in the
shaded area (Fig. 10) is ca. 20%, and the yield limit ssabout 15% higher than in the rest of the lithosphere
model where ss = 9.5 Pa, and H = 1.5� 10� 2 m. In
this model, the deformation occurs only within the
thin and weak part of the plate. It starts first near the
rigid ‘‘lithospheric’’ promontory. Then two families of
slip-lines develop in the two fan-shape side areas and
the deformation localizes along four zones (Fig. 10),
in a way similar to the previous experiment.
4.4. Experiment 4
This experiment is designed to simulate the sit-
uation in the Baikal rift system (see discussion below)
Fig. 9. Stretching of the model with elongated weak zone (contoured by the dashed line in (a)). Photographs are taken obliquely to the model
surface; in reality opposite limits of the model are parallel.
A. Chemenda et al. / Tectonophysics 356 (2002) 253–273 261
and combines the effects modelled in the two previous
experiments (Experiments 2 and 3). Here the thick
and rigid (cratonic) part of the lithospheric model has
a sigmoid contour that mimics the shape of the
Siberian (Archean) craton from the Angara to the
North Lake Baikal regions (Fig. 12; see Sengor et
al., 1993; Melnikov et al., 1994, and references
therein). In addition, a small area at the contact
between the two lithospheres (within a dashed line
in Fig. 11a) is heated before extension as in Experi-
ment 2 (Fig. 9) to produce a zone of weakness that
may simulate either the hot spot or the fault zone.
Extension in the direction indicated in Fig. 11a yields
the following result: The strain first localizes in the
weak orthogonal to the tension direction zone, result-
ing in the formation of a narrow deep valley. This is
followed by shear/extensional strain localization along
three wide (diffuse) oblique zones AB, BK and CE
(see details in Fig. 11b). Zone BK evolves slower,
with deformation mainly localizing along another
conjugated branch AB. Deformation along BK ceases
definitively after the complete failure of the litho-
Fig. 10. Surface deformation pattern of the model consisting of two parts with strong and thick (dashed area) and weak and thin ‘‘lithospheres’’.
The strain localization starts near the promontory of the strong lithosphere.
A. Chemenda et al. / Tectonophysics 356 (2002) 253–273262

Fig. 11. Oblique top view of the deformed model with a strong lithosphere part (dashed) and a local weak zone, contoured by the dashed line. (a)
Whole surface view; (b) close view of the deformation zone.
A. Chemenda et al. / Tectonophysics 356 (2002) 253–273 263

sphere (transition to spreading), which occurs along
system ABCE (Fig. 11a). The result of this experi-
ment is similar to Experiment 2 (Fig. 9), except that
the oblique branch CD obtained in Experiment 2 does
not form in Fig. 11 due to the presence at this place of
a strong ‘‘cratonic’’ lithosphere.
We have conducted similar experiments but with-
out preliminary weakening of the model near the
cratonic promontory in the central part of the model
(along the segment CB; Fig. 11a) but did not obtain a
clear result. A strain localisation started in this case
near the Points E and A and evolved to connect these
points along a wide zone of strain localisation. The
deformation along this zone then has been stopped as
the localisation occurred along the piston (boundary
effect) which is to the right in Fig. 11. These experi-
ments show that the strain localisation does not follow
the craton boundary (does not go through the segment
CB). In other words, ‘‘rifting’’ along the segment CB
is impossible if the lithosphere is not weakened at this
place.
5. Discussion of the experimental results
The described experiments correspond to a passive
rifting mechanism. Model rifts represent zones of
strain localization with the following properties: First,
these zones are generally not orthogonal to the
tension axis (or stretching direction) and are oriented
at an angle of 55j–60j to it in the homogeneous
model. This angle persists even when the rate of
divergence between the opposite plate boundaries is
not constant and varies laterally proportionally to the
distance to the pole of relative rotation of these
boundaries. In this case, the zone of strain localization
propagates rapidly approaching the pole of rotation.
Such a propagation is documented in many old and
active rifts (Courtillot, 1982; Bossworth, 1985;
McKenzie, 1986). The obtained characteristic angles
of 110j–120j (and not f 90j as in the case of
plastic deformation/failure under plane-strain condi-
tions) between the two families of the Luders lines
and the zones of deformation localization follow from
the theory of plasticity. The plastic lithospheric plate
in our experiments deform under the plane-stress
conditions and can be described by an hyperbolic
system of equilibrium equations that has two con-
jugated families of characteristics (Kachanov, 1971).
It can be shown that for the boundary conditions
applied in the experiments (uniform uniaxial tension),
the families are linear, intersected at an angle 2w of
about 110j (more exactly 109.46j) and make an
angle w with the tension direction (Kachanov,
1971): These angles are very close to those observed
in the experiments.
The characteristic lines have interesting properties:
In particular, the normal deformation along them is
zero. They can represent also the lines of the velocity
discontinuity and the localization deformation (as is
observed in our experiments). The deformation local-
ization (plastic failure) along these (characteristic)
directions corresponds also to a minimal ‘‘driving’’
tensional stress r1 (Nadai, 1950). Indeed, in the case
of the discontinuous solution (necking formation), this
stress can be related to w as follows (Kachanov,
1971):
r1 ¼ ss1� 3cos2wffiffiffiffiffiffiffiffiffiffiffiffiffiffiffiffiffiffiffiffiffiffiffiffiffi1þ 3cos22w
p ð2Þ
where ss is the shear yield limit. r1 takes a minimal
value equal to M3ss when dr1/dw = 0, i.e., at w =
54.73jc 55j. For w = 90j (necking orthogonal to the
tension axis), r1 = 2ss. As the work on a plastic de-
formation of the plate is proportional to r1�Dl (Dl is
the amount of extension), the angle wc 55j has an
energetic meaning and corresponds to a minimal
energy dissipation during plastic strain localization.
Plate failure in the direction perpendicular to
tension can thus occur only if the lithosphere is
weakened enough (by >100%� (2ss�M3ss)/M3ss =15.5%) along this direction, as it was the case in
Experiments 2 and 4 (Figs. 9 and 11). In the experi-
ments with a vertical cut (Fig. 5), the lithospheric
material was not weakened; we just created an inter-
face (cut) between the two rigid plate parts (blocks).
Separation of these blocks under tension is impossible
because of the hydrostatic suction between the blocks
(Malkin and Shemenda, 1991). The separation in this
situation can occur along an inclined surface that
must be formed. In other words, the lithosphere
should be broken again as it has occurred in the
experiment shown in Fig. 5. However, before reach-
ing the failure condition for wc 90j (r1 = 2ss, cutperpendicular to the tension axis), the deformation
A. Chemenda et al. / Tectonophysics 356 (2002) 253–273264
localization (failure) will start at a lower stress of
M3ss but along a direction at wc 55j. This is exactlywhat has been observed in the described experiments.
Failure at wc 90j has been obtained only when we
created a fault zone with many cuts (or an inclined
cut). Such a zone can be considered as a zone with
reduced effective strength of the lithospheric material
and behaves similarly to the ‘‘hot spots’’ where
material weakening was achieved by heating. The
important conclusion following from the above anal-
ysis and conducted experiments is that the lithosphere
does not ‘‘feel’’ the presence of a weak zone oriented
perpendicular to the tension axis if the effective
strength reduction in this zone is less than f 15%.
In plane-stress approximation, the vertical nonhy-
drostatic stress is zero and the two other principal
stresses r1 and r2 (r1>r2) are horizontal. One stress inthe lithosphere (in our case, the extensional stress r1)
is always dominant, but in nature, the other one, r2, is
not necessarily zero. Let us see whether angle w is
highly sensitive to the r2 value. This angle is related
to the principal stresses by:
cosð2wÞ ¼ � r1 þ r2
3ðr1 � r2Þð3Þ
where stresses in a plastic state cannot be arbitrary and
must satisfy the Mises’ criterion (Kachanov, 1971):
r21 � r1r2 þ r2
2 ¼ 3s2s ð4Þ
From (3) and (4), it follows that if r2 is also tensional,
the w value increases with reducing r1/r2 ratio but not
strongly. For example, for r1/r2 =l (r2 = 0),
w = 54,73j as was obtained previously, while for r1/r2 = 3.7, it increases only to 62.6j. When r2 is
compressional (negative), w decreases with jr1/r2jreduction such that for r1/r2 =� 4.4, w = 51j. Theseestimates thus show that 50j–60j represents a rea-
sonable range for the w value that one might expect to
find in natural rift systems where r2 is unlikely to be
equal to zero.
The necking width in the experiments is compa-
rable to the plate thickness, i.e., several tens of
kilometres (mechanical lithosphere thickness) in
nature, which corresponds to the average observed
rifts width (Allemand and Brun, 1991; Ruppel, 1995;
Olsen, 1995). On the other hand, numerous experi-
ments (e.g., Shemenda and Grokholsky, 1991) show
that the failure of a brittle plate subjected to the same
boundary conditions occurs along very narrow verti-
cal or inclined brittle cracks forming perpendicular to
the tension axis. The fact that most rifts do not
generally strike orthogonal to the stretching direction
(see, e.g., Bonini et al., 1997; Malkin and Ivan-
chenko, 1983, and references therein) suggests that
the bulk behaviour of the lithosphere corresponds to
a plastic model rather than to a brittle one. A similar
conclusion follows from rock mechanics experiments
showing that the thickest and strongest part of the
lithosphere has plastic properties (Kohlstedt et al.,
1995). The neck (rift) junctions at an angle of 110j–120j obtained in the experiments and often observed
in nature (Burke and Dewey, 1973; Malkin and
Ivanchenko, 1983) yield additional strength to this
conclusion.
The experiments show that faulting in the upper
lithospheric layers does not influence considerably
the large (lithospheric)-scale configuration of the rift
zones. As shown in Fig. 5, such a faulting can
affect the lithosphere deformation in cross-section,
making it asymmetrical (if the downward propaga-
tion of these faults is not limited in nature by the
weak, ductile lower crust). In any case, the super-
ficial brittle faulting seems to not affect the rift
geometry in a map view. On the other hand, the
lithospheric-scale faults (fault zones) as well as
other lithospheric-scale heterogeneities (weak and
strong zones) have a major impact on the rifting
process as shown by the presented experiments (see
also Tron and Brun, 1991; Bonini et al., 1997). The
initiation of strain localization can occur not only in
a weak zone but also near the promontory of a rigid
zone as seen in Fig. 10. It is interesting to note that
the cratonic stiff promontories cause strain to local-
ize within the adjacent weaker lithosphere not only
under extension (as in Fig. 10), but also under
compressional and shear stresses, as shown by 3-
D modelling of intraplate deformation south of
India (Shemenda, 1994) or in Brazil (Tommasi et
al., 1995). In the last experiment (Fig. 11), we
introduced into the model both weak (hot) and
strong (cold) zones in order to simulate the situation
in the Baikal rift system that we consider in detail
below.
A. Chemenda et al. / Tectonophysics 356 (2002) 253–273 265

6. Baikal rift system
6.1. Geometry and kinematics
The Baikal rift system is located close to the S-
shaped Paleozoic suture that separates the Siberian
craton from the so-called Sayan–Baikal folded belt
(Fig. 12; Logatchev and Zorin, 1992; Sengor et al.,
1993; Melnikov et al., 1994; Zorin, 1999). The
present-day stress field is characterized by a roughly
constant (over the whole area) orientation of the
extensional axis N(120j–135j)E (Fig. 12a; Petit et
al., 1996; San’kov et al., 2000). Fault scarps (San’kov
et al., 2000) and GPS measurements (Calais et al.,
1998) yield horizontal extension rates of a few milli-
metres per year for at least Plio-Quaternary times. The
rift can be schematically divided into three major
segments or branches (Fig. 12; Logatchev and Flor-
ensov, 1978; Tapponnier and Molnar, 1979).
6.1.1. The western rift branch
The western rift branch (AB, Fig. 12) is afN75E-
trending, 400-km-long and up to 150-km-wide zone of
deformation that includes the active NS-striking
basins of Busingol, Darkhat, Hovsgol and the EW-
trending Tunka basin. This zone is dominated by
wrench faulting with E–W and N–S average faults
orientations (San’kov et al., 1997; Larroque et al.,
2001). Focal mechanism solutions show that both
normal and reverse faulting occurring on NW–SE
and/or NE–SW planes are present as well (Fig. 12b;
Petit et al., 1996). About 200 km south of this branch,
the large Bolnai–Tsetserleg fault system (Fig. 12a),
with similar trends (W–E and NE–SW) and kine-
matics, was the place of one of the largest intra-
continental earthquake sequence ever felt (M = 8.0,
Tsetserleg, and M = 8.4, Bolnai, 1905 earthquakes;
see, e.g., Baljinnyam et al., 1993; Schlupp, 1996).
The contact of the western rift branch with the craton
is located near the main Sayan fault zone (Fig. 12a).
The angle between this branch and the mean regional
direction of extension is ca. 50j (see inset in Fig. 12b).
6.1.2. The central rift branch
The central rift branch (BC, Fig. 12) runs in the
N40Ejmean direction over 650 km and coincides with
Lake Baikal. It is relatively narrow (f 80 km) and is
settled just close and parallel to the marginal suture
between the craton and the Sayan–Baikal belt. At the
surface, the rift opening is controlled by the Primorsky
fault zone, an old inherited structure which probably
merges with the suture zone at depth (Logatchev and
Florensov, 1978; Delvaux et al., 1995). Since at least 4
Ma extension here is nearly orthogonal to the rift axis
and generates normal faulting (Sherman, 1992; Petit et
al., 1996; Delvaux et al., 1997).
6.1.3. The eastern rift branch
The eastern rift branch (CE, Fig. 12), also called
the North Baikal Rift, has fN70j strike, extends
over f 800 km and is up to 300 km wide. This
branch is entirely settled within the Sayan–Baikal
belt. The extensional features (Fig. 12a) as well as the
tensional seismicity vanish toward the Aldan shield
promontory (Melnikov et al., 1994). The dominant
fault orientation N60jE (Sherman and Gladkov, 1999;
San’kov et al., 2000) is in a good agreement with the
statistically representative strike of the nodal planes.
This branch makes an angle of about 50j with the
mean regional extension direction.
6.2. Deep rift structure and time–space evolution of
rifting
Deep structure of the rift has been long a subject of
much debate that largely concentrated around passive
versus active rift origin (e.g., Zorin, 1981; Logatchev
et al., 1983; Kiselev and Popov, 1992; Gao et al., 1994;
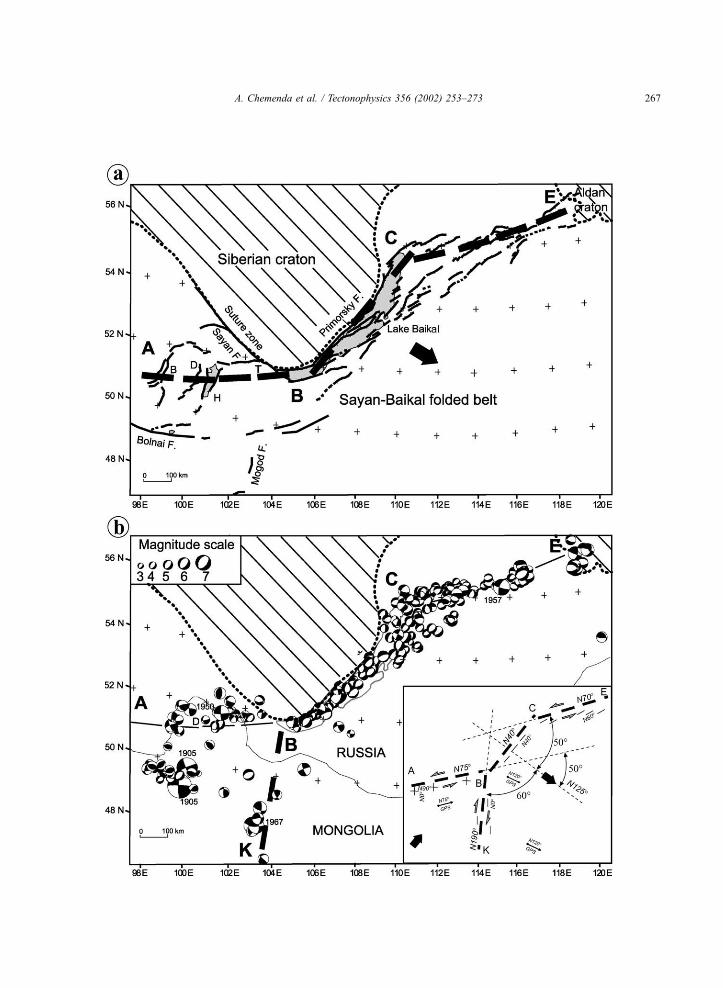
Fig. 12. Geodynamic setting (a) and seismicity (321 fault plane earthquake solutions) (b) of the Baikal rift. Thick dotted line is the limit between
the stiff cratons and the softer Sayan–Baikal belt. Thick dashed lines show the mean directions of the rift branches deduced from the active fault
traces and seismicity. Sketch in the inset in (b) summarizes the main orientations of the rift branches (corresponding to the thick dashed lines in
(a) and (b)), GPS vectors (thin arrows), and mean fault strikes and stress directions from tectonic and seismological studies (thin lines and large
black arrows, respectively). Main faults are from Tapponnier and Molnar (1979), Deverchere et al. (1993) and Bayasgalan et al. (1999). Focal
mechanisms are from Petit et al. (1996), Schlupp (1996) and Larroque et al. (2001). GPS strikes are from Calais et al. (1998, 2000) and Calais
and Amarjargal (2000). Abbreviations of basin names are as follows: B, Busingol, D, Darkhat, H, Hovsgol, T, Tunka. The names of main faults
(F) are shown in (a) and the years ofM>7 events since 1900 are indicated in (b). Lambert conic projection is used (crosses show N–S and E–W
directions) in maps (a) and (b), whereas plane projection (constant direction) is used in the inset of (b).
A. Chemenda et al. / Tectonophysics 356 (2002) 253–273266
A. Chemenda et al. / Tectonophysics 356 (2002) 253–273 267

Popov, 1990; Lysak, 1995; Petit et al., 1998). From
numerous recent tomographic studies at various scales
(Petit et al., 1998; Ritzwoller and Levshin, 1998;
Curtis et al., 1998; ten Brink and Taylor, 2002;
Villasenor et al., 2001), it appears that there is no large
thermal ‘‘disturbance’’ of the asthenosphere below the
lake that would advocate either for a large-scale mantle
upwelling or lithospheric thinning. On the other hand,
it became clear that the Paleozoic suture zone between
the Siberian craton and Sayan–Baikal belt is a major
factor controlling the structuring and lithospheric-scale
asymmetry of the rift (Lesne et al., 2000). According to
these authors, the rifting resulted from passive simple
shear extension localized on this inherited lithospheric
discontinuity, although no low-angle detachment fault
zone at depth has been directly evidenced. Such a fault
has been suggested based on experimental seismology
(Puzyrev et al., 1978; Popov, 1990; Logatchev and
Zorin, 1992), structural geology data (Houdry, 1994;
San’kov et al., 2000) and off-rift volcanic activity
(Kazmin, 1991) started during Paleogene (Rasskazov,
1994), i.e., approximately at the onset of rifting.
It is believed that the evolution of the Baikal rift
comprises two phases corresponding to ‘‘slow’’ and
‘‘fast’’ rifting, which have approximately occurred at
30 to 3 Ma and 3 Ma to present, respectively
(Logatchev and Zorin, 1987, 1992; Delvaux et al.,
1997; San’kov et al., 1997; Kuzmin et al., 2000, and
references therein), although this two-step evolution is
still debated (e.g., ten Brink and Taylor, 2002). The
orientation of the stress field remained more or less
constant since f 10–7 Ma (San’kov et al., 1997,
2000). Finally, although the spatial and time evolution
(propagation in particular) of the rift are not reliably
constrained (San’kov et al., 2000; Kuzmin et al.,
2000), most authors agree that the rifting was initiated
in the southern and central Lake Baikal and then
propagated to its present limits (Logatchev and Zorin,
1992; San’kov et al., 1997, 2000).
6.3. Comparison with the modelling results and
discussion
6.3.1. Overall configuration of the rift system
The first-order three-branch structure of the Baikal
rift system has been reproduced in various experimen-
tal configurations. For example, in Experiment 2 (Fig.
9), such a structure was obtained in a homogeneous
lithospheric model containing only one linear weak
zone (fault zone, for example). The deformation local-
ization (necking), hence, formation of the valley
(basin), first occurs in this central orthogonal to
extension weak zone. Then four other oblique and
wider (diffused) zones of deformation appear. Two of
them BK and CD develop slowly and are entirely
abandoned after the complete failure of the lithosphere
model along a three-branch system ABCE (Fig. 9c).
The Baikal system also contains one central ‘‘normal’’
and narrow branch where rifting was initiated first and
the two oblique wide branches (Fig. 12). The eastern
branch CE in Experiment 2 (Fig. 9) is oriented to the
central segment BC (corresponding to Lake Baikal) at
approximately the same angle as in nature (f 50j to
the extension direction, see inset in Fig. 12b). The
orientation of the western branch AB is also close in
the experiment and nature. Thus, it appears that the
sharp rheological contrast between the Siberian craton
and the Sayan–Baikal belt is not necessary to generate
the Baikal rift system: The weak (suture) zone that
certainly exists between these two geologically distinct
units is sufficient. If this were the case, we should see
in nature the traces of the two aborted diffuse oblique
branches KB and CD obtained in the experiment (Fig.
9). There is, however, no indication of the past (since
the rifting onset) or present activity NWof Lake Baikal
in the area corresponding to the northern branch CD in
Fig. 9. This zone thus did not form in nature. The
simplest way of prohibiting formation of this zone in
experiments is to increase the effective lithospheric
strength in this area. It has been done in Experiment 4
(Fig. 11) where the northern branch has not been
formed. The rheological contrast between the craton
and the Sayan–Baikal belt is thus necessary to better
approach the actual rift structure. On the other hand,
the southern diffuse oblique branch BK occurs always
in the experiments with or without the rheological
contrast, since this branch is entirely located within the
weak lithosphere. Does this zone (the ‘‘fourth rift
branch’’) exist in nature?
6.3.2. The fourth rift branch?
A simple look at the seismicity map (Fig. 12b) is
enough to reveal a significant activity in the area
corresponding to the fourth branch BK predicted by
the experiment. A diffuse plate boundary in this area
has been already proposed from kinematic constraints
A. Chemenda et al. / Tectonophysics 356 (2002) 253–273268

(Zonenshain and Savostin, 1981; Lesne et al., 1998)
and is documented by some tectonic observations
(Baljinnyam et al., 1993; Bayasgalan et al., 1999).
The shear displacement along this boundary following
from the experiment is consistent with the preliminary
GPS data (Fig. 12b, inset; Calais et al., 1998, 2000;
Calais and Amarjargal, 2000) and with the strike of the
nodal planes from focal mechanisms (Fig. 12b): Both
attest for the right-lateral shear in the area correspond-
ing to the hypothetic branch BK. The large (M = 7.1)
Mogod earthquake in 1967, for instance, was associ-
ated with a displacement along an f 20-km-long,
right-lateral, N–S strike–slip fault (Fig. 12; Baljin-
nyam et al., 1993; Bayasgalan et al., 1999). There are
also a few active fault segments striking from W–E to
N60jE (Fig. 12a) that may correspond to the second
family of fractures (slip-lines) obtained in the experi-
ments (see Fig. 13). It thus seems that the fourth
branch BK, although weakly expressed, does exist, is
presently active and is oriented to the regional exten-
sion direction at an angle of 50j–60j (Fig. 12b, inset)
consistent with the modelling results. Notice that the
overall configuration of the four-branch Baikal rift
system on the inset in Fig. 12 is remarkably similar
to the experiment model in Fig. 11 (see also Fig. 13).
There are evidences that the fourth branch was
active in the past. Close to (and just west of) line BK
in Fig. 12b various types of ‘‘anomalies’’ have been
documented: the elevated topography (Hangai dome;
Windley and Allen, 1993; Cunningham, 1998), low P-
and S-wave velocities at 100–400 km depth (Curtis et
al., 1998; Petit et al., 1998; Villasenor et al., 2001) and
moderate thermal disturbance at the uppermost mantle
evidenced by xenoliths (Ionov et al., 1998). Most
importantly, the area near line BK is characterized by
concentration of Cenozoic volcanism (Kiselev, 1987)
that first occurred near the Tunka basin during Paleo-
gene and was active mostly from Oligocene until
Fig. 13. First-order surface deformation pattern in the Baikal area at the onset of the rifting (based on the Experiment 4 in Fig. 11). (1) Regional
tension vector; (2) contour of the deepest part of the depression formed in the experiment (corresponds to Lake Baikal); (3) lithospheric-scale
normal faults in the lake area; (4) Luders lines in the ‘‘plastic core’’ of the lithosphere that may propagate to the surface trough the brittle part of
the lithosphere; (5) normal faults and cracks that should form in the upper brittle crustal layer perpendicular to the tension direction in the whole
area.
A. Chemenda et al. / Tectonophysics 356 (2002) 253–273 269
Quaternary (Rasskazov, 1994). This volcanic ‘‘belt’’
extends over f 1000 km from the southern Lake
Baikal to the south, crossing central Mongolia (Kise-
lev, 1987). Thus, the southern branch BK was active
since initial rifting but remains underdeveloped and
does not have clear tectonic manifestation, which
means that the displacement along this branch was
much smaller than along the others. Was this displace-
ment continuous since the rifting onset or interrupted
and recently reactivated? The two options seem pos-
sible. In the conducted experiments, the branch BK
dies after a few millimetres of stretching (Dl) that
corresponds to a few tens of kilometres in nature (Dl
depends largely upon the strain weakening of the
model material and also upon the model width/length
ratio and boundary conditions (their tightness)). Since
the Baikal rifting is slow and the stretching amount is
small (Dl< 10 km, San’kov et al., 2000), this process
can be still at the stage when branch BK keeps dying
activity. Another possibility is that this branch has died
and recently has been reactivating, owing to the
compressional front arriving from the Himalayas due
to the India–Eurasia collision. Indeed, the collision
has started 50–60 Ma ago (Qayyum et al., 1997;
DeSigoyer et al., 2000) and was continuously prop-
agating toward the north. It reached the Tarim basin
around 20 Ma (Mattauer et al., 1999), northern Mon-
golia ca. 8 Ma (Baljinnyam et al., 1993; Schlupp,
1996; Cunningham et al., 1996; Cunningham, 1998)
and affected the western branch AB of the Baikal
system only in Quaternary (Larroque et al., 2001).
Therefore, it seems that the Baikal rifting, initiated in
Paleogene (Oligocene) times (Logatchev and Zorin,
1992), was not generated by the India–Asia collision
and has been developing since the beginning under
f SE extension whose origin, however, remains
unclear. The compressional front recently arrived from
the south (Larroque et al., 2001) may have suppressed
extension along the western rift branch AB and, as a
consequence, it may have caused the reactivation of
the southern branch BK accommodating a left-lateral
shear and extension (see inset in Fig. 12b).
7. Conclusion
The rheological structure of the continental litho-
sphere is poorly known and, certainly, is complex.
Traditionally, the lithosphere is represented by a three
(or more)-layer model with a strong upper crust and
lithospheric mantle, and a weak lower crust. Among
other factors, the rheological structure is very sensi-
tive to the composition of the crust which by its nature
is laterally and vertically very heterogeneous. There-
fore, its mechanical structure is rather spotty than
layered: In some zones, a weak lower crust exists
and in others not (Ranalli, 2000). Numerous data
argue, for example, that in the Baikal region, the
whole crust is relatively strong (Deverchere et al.,
2001, and references therein). Ideally, we had to create
such a spotty lithosphere model consisting of one- and
three (or more)-layer segments. In this paper, how-
ever, we limited ourselves to a simple, first-order
approximation, using a one-layer lithosphere model,
but varying laterally its effective strength. This varia-
tion can correspond to the variation of the plate
thickness and geotherm, but also to the variation of
the weak crustal layers thickness (these layers reduce
the effective lithosphere strength). It is clear that such
a model cannot reproduce details of lithosphere defor-
mation in cross-section, but it seems that it can
satisfactorily represent large-scale deformation of the
lithosphere in plane. On this scale, the lithosphere is in
a plane-stress state and its behaviour is controlled by
the integral (over the thickness) properties, with the
details of vertical lithosphere structure being less
important. The lithospheric deformation in cross-sec-
tion (necking) largely depends, as mentioned, on its
rheological stratification, but it also depends on the
configuration of a rift zone in map view. Our model-
ling shows that this configuration is controlled by the
lateral mechanical (e.g., rheological) heterogeneities.
Zones of strain localization avoid strong (cold) litho-
spheric areas and cross weak areas such as hot spots
and lithospheric-scale fault zones. This is an intui-
tively understandable conclusion. What is less obvious
is that the promontories of a strong (cratonic) litho-
sphere have been proven to ‘‘attract’’ zones of strain
localization that can be initiated in their vicinity. The
configuration (hence, dynamics) of a rift zone is
therefore defined by the spatial distribution of strong
and weak lithospheric areas. The strain localization
zones thus represent essentially 3-D structures even
within a homogeneous lithosphere subjected to a
uniaxial tension, since they normally form obliquely
to the tension direction. This obliquity is due to the
A. Chemenda et al. / Tectonophysics 356 (2002) 253–273270
plastic bulk properties of the lithosphere deforming
under plane-stress conditions. In a homogeneous
plate, zones of strain localization are oriented at
F 50j–60j to the extension axis even when the
divergent displacement of the plates is not transla-
tional but rotational. In the latter case, the strain
localization zone is propagating in a direction of
50j–60j with respect to the tension axis. In many
experimental configurations, strain localization occurs
along double ‘‘rifts’’ conjugated at an angle of
2� (50j–60j)c 110j frequently observed in nature.
The configuration of a particular rift system should be
defined thus by the interplay of all these factors:
presence and geometry of weak and strong zones as
well as the tendency of strain to localize in a direction
oblique to the tension axis.
The modelling of the Baikal rift system has con-
firmed the major role of a weak zone (suture) known
in the area of Lake Baikal and of a sharp rheological
contrast between the Siberian craton and the Sayan–
Baikal warmer lithosphere in structuring this system.
By introducing these heterogeneities into the exper-
imental model, we were able to obtain a well-known
three-branch structure of the Baikal rift system with
one orthogonal (central) narrow branch (correspond-
ing to Lake Baikal) and two oblique branches. The
modelling predicts also the formation of a fourth
southern fNS-trending branch (oblique strain local-
ization zone). There are field data corroborating the
existence of this poorly expressed feature. Orientation
of all four branches with respect to each other and to
the regional tension direction is in a good correspond-
ence with the experimental model (compare inset in
Fig. 12b with Fig. 11 or Fig. 13).
Acknowledgements
We thank J.-P. Brun and P. van der Beek for helpful
reviews.
References
Allemand, P., Brun, J.P., 1991. Width of continental rifts and
rheological layering of the lithosphere. Tectonophysics 188,
63–69.
Allemand, P., Brun, J.P., Davy, Ph., van der Driessche, J., 1989.
Symetrie et asymetrie des rifts et mecanismes d’amincissement
de la lithosphere. Bull. Soc. Geol. France 8 (3), 445–451.
Artyushkov, E.V., 1981. Mechanisms of continental riftogenesis.
Tectonophysics 73, 9–14.
Baljinnyam, I., Bayasgalan, A., Borisov, B.A., Cisternas, A.,
Dem’yanovich, M.G., Ganbaatar, L., Kochetkov, V.M., Kurush-
in, R.A., Molnar, P., Philip, H., Vashchilov, Y.Y., 1993. Ruptures
of major earthquakes and active deformation in Mongolia and
its surroundings. Geol. Soc. Amer. Mem. 181, 62 pp.
Bayasgalan, A., Jackson, J., Ritz, J.F., Carretier, S., 1999. Field
examples of strike–slip fault termination in Mongolia and their
tectonic significance. Tectonics 18, 394–411.
Benes, V., Davy, P., 1996. Modes of continental lithospheric exten-
sion: experimental verification of strain localization processes.
Tectonophysics 254, 69–87.
Bonini, M., Souriot, Th., Boccaletti, M., Brun, J.P., 1997. Succes-
sive orthogonal and oblique extension episodes in a rift zone:
laboratory experiments with application to the Ethiopian rift.
Tectonics 16 (2), 347–362.
Bossworth, W., 1985. Geometry of propagating continental rifts.
Nature 316, 625–627.
Brun, J.P., Beslier, M.O., 1996. Mantle exhumation at passive mar-
gins. Earth Planet. Sci. Lett. 142, 161–173.
Buck, W.R., 1991. Modes of continental lithospheric extension. J.
Geophys. Res. 96, 20161–20178.
Burke, K., Dewey, J.F., 1973. Plume generated triple junctions: key
indications in applying plate tectonics to old rocks. J. Geol. 81,
406–433.
Burov, E., Poliakov, A., 2001. Erosion and rheology controls
on synrift and postrift evolution: verifying old and new ideas
using a fully coupled numerical model. J. Geophys. Res. 106,
16461–16481.
Calais, E., Amarjargal, S., 2000. New constraints on current defor-
mation in Asia from continuous GPS measurements at Ulan
Baatar, Mongolia. Geophys. Res. Lett. 27 (10), 1527–1530.
Calais, E., Lesne, O., Deverchere, J., Sankov, V.A., Lukhnev, A.V.,
Miroshnichenko, A.I., Levi, K.G., 1998. Crustal deformation in
the Baikal rift from GPS measurements. Geophys. Res. Lett. 25
(21), 4003–4006.
Calais, E., Vergnolle, M., Lesne, O., Deverchere, J., Sankov, V.A.,
Lukhnev, A.V., Miroshnichenko, A.I., Bashkuev, Y., Zalutzky,
V., Amarjargal, B., 2000. Crustal Deformation in Asia: New
Constraints from GPS Measurements in the Mongolia–Baikal
Area. Am. Geophys. Union, San Francisco (Abstract).
Courtillot, V., 1982. Propagating rifts and continental breakup. Tec-
tonics 1, 239–250.
Cunningham, W.D., 1998. Lithospheric controls on late Cenozoic
construction of the Mongolian Altai. Tectonics 17, 891–902.
Cunningham, W.D., Windley, B.F., Dorjnamjaa, D., Badamgarov,
J., Saandar, M., 1996. Late Cenozoic transpression in south-
western Mongolia and the Gobi-Altaı Tien Shan connection.
Earth Planet. Sci. Lett. 140, 67–81.
Curtis, A., Trampert, J., Snieder, R., Dost, B., 1998. Eurasian fun-
damental mode surface wave phase velocities and their relation-
ship with tectonic structures. J. Geophys. Res. 103, 26919–
26947.
Delvaux, D., Moeys, R., Stapel, G., Melnikov, A., Ermikov, V.,
A. Chemenda et al. / Tectonophysics 356 (2002) 253–273 271

1995. Paleostress reconstruction and geodynamics of the Baikal
region, Central Asia: I. Paleozoic and Mesozoic pre-rift evolu-
tion. Tectonophysics 252, 61–101.
Delvaux, D., Moeys, R., Stapel, G., Petit, C., Levi, K.G., Mirosh-
nichenko, A.I., Ruzhich, V.V., San’kov, V.A., 1997. Paleostress
reconstructions and geodynamics of the Baikal region, Central
Asia: Part II. Cenozoic rifting. Tectonophysics 282, 1–38.
DeSigoyer, J., Chavagnac, V., Blichert-Toft, J., Cosca, M., Guillot,
S., Luais, B., Mascle, G., Villa, I., 2000. Dating the Indian
continental subduction and collisional thickening in NW Hima-
layas: multichronometry of the Tso Morari eclogites. Geology
28, 487–490.
Deverchere, J., Houdry, F., Solonenko, N.V., Solonenko, A.V.,
Sankov, V.A., 1993. Seismicity, active faults and stress field
of the North Muya region, Baikal rift: new insights on the
rheology of extended continental lithosphere. J. Geophys. Res.
98, 19895–19912.
Deverchere, J., Petit, C., Gileva, N., Radziminovitch, N.A., Melni-
kova, V.I., San’kov, V.A., 2001. Depth distribution of earth-
quakes in the Baikal rift system and its implications for the
rheology of the lithosphere. Geophys. J. Int. 146, 714–730.
Dunbar, J.A., Sawyer, D.S., 1989. How preexisting weaknesses
control the style of continental breakup. J. Geophys. Res. 94,
7278–7292.
Faugeres, E., Brun, J.P., Van den Driessche, J., 1986. Bassins asy-
metriques en extension pure et en decrochement: modeles ex-
perimentaux. Bull. Soc. Nat. Elf-Aquitaine Prod. 10, 13–21.
Forsyth, D.W., Uyeda, S., 1975. On the relative importance of the
driving forces of plate motion. Geophys. J. R. Astron. Soc. 43,
163–200.
Gao, S., Davis, P.M., Liu, H., Slack, P.D., Zorin, Y.A., Mordvinova,
V.V., Kozhevnikov, V.M., Logatchev, N.A., 1994. Seismic ani-
sotropy and mantle flow beneath the Baikal rift zone. Nature
371, 149–151.
Hassani, R., Chery, J., 1996. Anelasticity explains topography as-
sociated with Basin and Range normal faulting. Geology 24,
1095–1098.
Hopper, J.R., Buck, W.R., 1996. The effect of lower crustal flow on
continental extension and passive margin formation. J. Geophys.
Res. 101, 20175–20194.
Hopper, J.R., Buck, W.R., 1998. Styles of extensional decoupling.
Geology 26 (8), 699–702.
Houdry, F., 1994. Mecanismes de l’extension continentale dans le
rift nord-Baıkal, Siberie: contraintes des donnees d’imagerie
SPOT, de terrain, de sismologie et de gravimetrie, These de
Doctorat, Universite Pierre et Marie Curie, Paris VI, 356 pp.
Houseman, G., Molnar, P., 1997. Gravitational (Rayleigh–Taylor)
instability of a layer with non-linear viscosity and convective
thinning of the lithosphere. Geophys. J. Int. 128, 125–150.
Ionov, D., O’Reilly, S.Y., Griffin, W.L., 1998. A geotherm and
lithospheric section for central Mongolia (Tariat region). Am.
Geophys. Union Geodyn. Ser. 27, 127–153.
Kachanov, L.M., 1971. Foundations of the Theory of Plasticity.
North-Holland, Amsterdam, 252 pp.
Kazmin, V.G., 1991. The position of continental flood basalts in rift
zones and its bearing on models of rifting. Tectonophysics 199,
375–387.
Kiselev, A.I., 1987. Volcanism of the Baikal rift zone. Tectonophy-
sics 143, 235–244.
Kiselev, A.I., Popov, A.M., 1992. Asthenospheric diapir beneath
the Baikal rift: petrological constraints. Tectonophysics 208,
287–295.
Kohlstedt, D.L., Evans, B., Mackwell, S.J., 1995. Strength of the
lithosphere: constraints imposed by laboratory experiments. J.
Geophys. Res. 100, 17587–17602.
Kuzmin, M.I., Karabanov, E.B., Prokopenko, A.A., Gelety, V.F.,
Antipin, V.S., Williams, D.F., Gvozdkov, A.N., 2000. Sedimen-
tation processes and new age constraints on rifting stages in
Lake Baikal: results of deep-water drilling. Int. J. Earth Sci.
89 (2), 183–192.
Larroque, C., Ritz, J.-F., Stephan, J.-F., San’kov, V., Arjannikova,
A., Calais, E., Deverchere, J., Loncke, L., 2001. Interaction
compression-extension a la limite Mongolie –Siberie: analyse
preliminaire des deformations recentes et actuelles dans le bas-
sin de Tunka. C. R. Acad. Sci., Paris 332, 177–184.
Lesne, O., Calais, E., Deverchere, J., 1998. Finite element model-
ling of crustal deformation in the Baikal rift zone: new insights
into the active–passive debate. Tectonophysics 289, 327–430.
Lesne, O., Calais, E., Deverchere, J., Chery, J., Hassani, R., 2000.
Dynamics of intracontinental extension in the North Baikal Rift
from two-dimensional numerical deformation modelling. J.
Geophys. Res. 105, 21727–21744.
Logatchev, N.A., Florensov, N.A., 1978. The Baikal system of rift
valleys. Tectonophysics 45, 1–13.
Logatchev, N.A., Zorin, Yu.A., 1987. Evidence and causes of the
two-stage development of the Baikal rift. Tectonophysics 143,
225–234.
Logatchev, N.A., Zorin, Yu.A., 1992. Baikal rift zone: structure and
geodynamics. Tectonophysics 208, 273–286.
Logatchev, N.A., Zorin, Yu.A., Rogozhina, V.A., 1983. Baikal rift:
active or passive? Comparison of the Baikal and Kenya rift
zones. Tectonophysics 94, 223–240.
Lysak, S.V., 1995. Terrestrial heat and temperatures in the upper
crust in South-East Siberia. Bull. Cent. Rech. Explor. Prod. Elf-
Aquitaine 19, 39–57.
Malkin, B.V., Ivanchenko, G.M., 1983. On possibility of plastic
failure theory: implications in analyses of the structure and seis-
micity of Mid-Oceanic ridges. Okeanologiya 23, 990–996 (in
Russian).
Malkin, B.V., Shemenda, A.I., 1991. Mechanism of rifting: consid-
erations based on results of physical modelling and on geolog-
ical and geophysical data. Tectonophysics 199, 193–210.
Martinod, J., Davy, Ph., 1992. Periodic instabilities during com-
pression or extension of the lithosphere: 1. Deformation modes
from an analytical perturbation method. J. Geophys. Res. 97,
1999–2024.
Mattauer, M., Matte, Ph., Olivet, J.-L., 1999. A 3D model of In-
dia–Asia collision at plate scale. C. R. Acad. Sci., Paris 328,
499–508.
McClay, K.R., White, M.J., 1995. Analogue modelling of orthogo-
nal and oblique rifting. Mar. Petrol. Geol. 12, 137–151.
McKenzie, D., 1986. The geometry of propagating rifts. Earth Plan-
et. Sci. Lett. 77, 176–186.
Melnikov, A.I., Mazukabzov, A.M., Sklyarov, E.V., Vasiljev, E.P.,
A. Chemenda et al. / Tectonophysics 356 (2002) 253–273272
1994. Baikal rift basement: structure and tectonic evolution.
Bull. Cent. Rech. Explor. Prod. Elf-Aquitaine 18, 99–122.
Morgan, P., Baker, B.H., 1983. Introduction—processes of conti-
nental rifting. Tectonophysics 94, 1–10.
Nadai, A., 1950. Theory of Flow and Fracture of Solids, vol. 1, 2nd
ed. McGraw-Hill, New York.
Olsen, K.H., 1995. Continental Rifts: Evolution, Structure, Tecton-
ics. Elsevier, Amsterdam ILP Programme Publ. 264, 466 pp.
Petit, C., Deverchere, J., Houdry, F., Sankov, V.A., Melnikova, V.I.,
Delvaux, D., 1996. Present-day stress field changes along the
Baikal rift and tectonic implications. Tectonics, 1171–1191.
Petit, C., Koulakov, I.Yu., Deverchere, J., 1998. Velocity structure
around the Baikal rift zone from teleseismic and local earth-
quake traveltimes and geodynamic implications. Tectonophysics
296, 125–144.
Popov, A.M., 1990. A deep geophysical study in the Baikal region.
Pure Appl. Geophys. 134 (4), 575–587.
Puzyrev, N.N., Mandelbaum, M.M., Krylov, S.V., Mishenkin, B.P.,
Petrik, G.V., Krupskaya, G.V., 1978. Deep structure of the Bai-
kal and other continental rift zones from seismic data. Tectono-
physics 45, 15–22.
Qayyum, M., Lawrence, R.D., Niem, A.R., 1997. Discovery of the
Paleo-Indus delta – fan complex. J. Geol. Soc. London 154,
753–756.
Ranalli, G., 2000. Rheology of the crust and its role in tectonic
reactivation. J. Geodynamics 30, 3–15.
Ranalli, G., Murphy, D.C., 1987. Rheological stratification of the
lithosphere. Tectonophysics 132, 281–295.
Rasskazov, S.V., 1994. Magmatism related to the Eastern Siberia
Rift System and the geodynamics. Bull. Cent. Rech. Explor.
Prod. Elf-Aquitaine 18, 437–452.
Ritzwoller, M.H., Levshin, A.L., 1998. Eurasian surface wave to-
mography: group velocities. J. Geophys. Res. 103, 4839–4878.
Ruppel, C., 1995. Extensional processes in continental lithosphere.
J. Geophys. Res. 100, 24187–24215.
San’kov, V.A., Miroshnichenko, A.I., Levi, K.G., Lukhnev, A.V.,
Melnikov, A.I., Delvaux, D., 1997. Cenozoic stress field evolu-
tion in the Baikal rift zone. Bull. Cent. Rech. Explor. Prod. Elf-
Aquitaine 21, 435–455.
San’kov, V.A., Deverchere, J., Gaudemer, Y., Houdry, F., Filippov,
A., 2000. Geometry and rate of faulting in the North Baikal rift,
Siberia. Tectonics 19 (4), 707–722.
Schlupp, A., 1996. Neotectonic of western Mongolia using field,
seismological and remote sensing data. PhD thesis, 270 pp. (in
French).
Sengor, A.M.C., Nattal’in, B.A., Burtman, V.S., 1993. Evolution of
the Altaid tectonic collage and Palaeozoic crustal growth in
Eurasia. Nature 364, 299–307.
Shemenda, A.I., 1984. Some regularities of lithosphere deformation
under tension (based on the physical modelling). USSR Acad.
Sci. Rep. 275 (2), 346–350 (in Russian).
Shemenda, A.I., 1994. Subduction: Insights from Physical Model-
ling. Kluwer Academic Publishers, Netherlands. Ser. Modern
Approaches in Geophysics, 215 pp.
Shemenda, A.I., Grokholsky, A.L., 1991. A formation and evolution
of overlapping spreading centres (constrained on the basis of
physical modelling). Tectonophysics 199, 398–404.
Shemenda, A.I., Groholsky, A.L., 1994. Physical modeling of slow
spreading. J. Geophys. Res. 99, 9137–9153.
Sherman, S.I., 1992. Fault and tectonic stresses of the Baikal rift
zone. Tectonophysics 208, 297–307.
Sherman, S.I., Gladkov, A.S., 1999. Fractals in studies of faulting
and seismicity in the Baikal rift zone. Tectonophysics 308,
133–142.
Tapponnier, P., Molnar, P., 1979. Active faulting and Cenozoic
tectonics of the Tien Shan, Mongolia and Baykal regions. J.
Geophys. Res. 84, 3425–3459.
ten Brink, U.S., Taylor, M.H., 2002. Crustal structure of central
Lake Baikal: insights into intracontinental rifting. J. Geophys.
Res. 107, 10.1029/2001 JB000300.
Tommasi, A., Vauchez, A., Daudre, B., 1995. Initiation and prop-
agation of shear zones in a heterogeneous continental litho-
sphere. J. Geophys. Res. 100, 22083–22101.
Tron, V., Brun, J.P., 1991. Experiments on oblique rifting in brittle –
ductile systems. Tectonophysics 188, 71–84.
Vauchez, A., Barruol, G., Tommasi, A., 1997. Why do continents
break up parallel to ancient orogenic belts? Terra Nova 9,
62–66.
Vauchez, A., Tommasi, A., Barruol, G., 1998. Rheological hetero-
geneity, mechanical anisotropy and deformation of the continen-
tal lithosphere. Tectonophysics 296, 61–86.
Villasenor, A., Ritzwoller, M.H., Levshin, A.L., Barmin, M.P., Eng-
dahl, E.R., Spakman, W., Trampert, J., 2001. Shear velocity
structure of central Eurasia from inversion of surface wave ve-
locities. Phys. Earth Planet. Int. 123, 169–184.
Windley, B.F., Allen, M.B., 1993. Mongolian Plateau: evidence for
a late Cenozoic mantle plume under central Asia. Geology 21,
295–298.
Ziegler, P.A., 1992. Plate tectonics, plate moving mechanisms and
rifting. Tectonophysics 215, 9–34.
Zonenshain, L.P., Savostin, L.A., 1981. Geodynamics of the Baikal
rift zone and plate tectonics of Asia. Tectonophysics 76, 1–45.
Zorin, Y.A., 1981. The Baikal rift: an example of the intrusion of
asthenospheric material into the lithosphere as the cause of dis-
ruption of the lithosphere plates. Tectonophysics 73, 91–104.
Zorin, Y.A., 1999. Geodynamics of the western part of the Mongo-
lia–Okhotsk collisional belt, Trans-Baikal region (Russia) and
Mongolia. Tectonophysics 306, 33–56.
A. Chemenda et al. / Tectonophysics 356 (2002) 253–273 273