This "What is a Survey" booklet is written primarily for non-specialists ...
56
What is a survey? Fritz Scheuren
Transcript of This "What is a Survey" booklet is written primarily for non-specialists ...

What is a survey?
Fritz Scheuren
What is a survey? 2
INDEX
1. What is a Survey ……………………………………………………3
2. How to Plan a Survey ………………………………………………9
3. How to Collect Survey Data ……………………………………….15
4. Judging the Quality of a Survey …………………………………..20
5. What Are Focus Groups ……………………………………………25
6. Designing a Questionnaire ………………………………………..30
7. How to Conduct Pretesting ………………………………………..35
8. More About Mail Surveys ………………………………………….40
9. More About Telephone Surveys ………………………………….46
10. What is a Margin of Error ………………………………………….52
Market Intelligence Group – survey research, survey analysis www.migindia.biz

What is a survey? 3
1. What is a Survey?
It has been said the United States is no longer an "industrial society" but an "information society." That is, our major problems and tasks no longer mainly center on the production of the goods and services necessary for survival and comfort. Our "society," thus, requires a prompt and accurate flow of information on preferences, needs, and behavior. It is in response to this critical need for information on the part of the government, business, and social institutions that so much reliance is placed on surveys. Then, What Is a Survey Today the word "survey" is used most often to describe a method of gathering information from a sample of individuals. This "sample" is usually just a fraction of the population being studied. For example, a sample of voters is questioned in advance of an election to determine how the public perceives the candidates and the issues ... a manufacturer does a survey of the potential market before introducing a new product ... a government entity commissions a survey to gather the factual information it needs to evaluate existing legislation or to draft proposed new legislation. Not only do surveys have a wide variety of purposes, they also can be conducted in many ways-including over the telephone, by mail, or in person. Nonetheless, all surveys do have certain characteristics in common. Unlike a census, where all members of the population are studied, surveys gather information from only a portion of a population of interest-the size of the sample depending on the purpose of the study. In a bona fide survey, the sample is not selected haphazardly or only from persons who volunteer to participate. It is scientifically chosen so that each person in the population will have a measurable chance of selection. This way, the results can be reliably projected from the sample to the larger population. Information is collected by means of standardized procedures so that every individual is asked the same questions in more or less the same way. The survey's intent is not to describe the particular individuals who, by chance, are part of the sample but to obtain a composite profile of the population. The industry standard for all reputable survey organizations is that individual respondents should never be identified in reporting survey findings. All of the survey's results should be presented in completely anonymous summaries, such as statistical tables and charts. How Large Must The Sample Size Be The sample size required for a survey partly depends on the statistical quality needed for survey findings; this, in turn, relates to how the results will be used.
Market Intelligence Group – survey research, survey analysis www.migindia.biz
Even so, there is no simple rule for sample size that can be used for all surveys. Much depends on the professional and financial resources available. Analysts, though, often find that a moderate sample size is sufficient statistically and operationally. For example, the well-known national polls frequently use samples of

What is a survey? 4
about 1,000 persons to get reasonable information about national attitudes and opinions. When it is realized that a properly selected sample of only 1,000 individuals can reflect various characteristics of the total population, it is easy to appreciate the value of using surveys to make informed decisions in a complex society such as ours. Surveys provide a speedy and economical means of determining facts about our economy and about people's knowledge, attitudes, beliefs, expectations, and behaviors. Who Conducts Surveys We all know about the public opinion surveys or "polls" that are reported by the press and broadcast media. For example, the Gallup Poll and the Harris Survey issue reports periodically describing national public opinion on a wide range of current issues. State polls and metropolitan area polls, often supported by a local newspaper or TV station, are reported regularly in many localities. The major broadcasting networks and national news magazines also conduct polls and report their findings. The great majority of surveys, though, are not public opinion polls. Most are directed to a specific administrative, commercial, or scientific purpose. The wide variety of issues with which surveys deal is illustrated by the following listing of actual uses
• Major TV networks rely on surveys to tell them how many and what types of people are watching their programs
• Statistics Canada conducts continuing panel surveys of children (and their families) to study educational and other needs
• Auto manufacturers use surveys to find out how satisfied people are with their cars
• The U.S. Bureau of the Census conducts a survey each month to obtain information on employment and unemployment in the nation
• The U.S. Agency for Health Care Policy and Research sponsors a periodic survey to determine how much money people are spending for different types of medical care
• Local transportation authorities conduct surveys to acquire information on commuting and travel habits
• Magazine and trade journals use surveys to find out what their subscribers are reading
• Surveys are conducted to ascertain who uses our national parks and other recreation facilities.
Surveys provide an important source of basic scientific knowledge. Economists, psychologists, health professionals, political scientists, and sociologists conduct surveys to study such matters as income and expenditure patterns among households, the roots of ethnic or racial prejudice, the implications of health problems on people's lives, comparative voting behavior, and the effects on family life of women working outside the home.
Market Intelligence Group – survey research, survey analysis www.migindia.biz

What is a survey? 5
What Are Some Common Survey Methods Surveys can be classified in many ways. One dimension is by size and type of sample. Surveys also can be used to study either human or non-human populations (e.g., animate or inanimate objects -- animals, soils, housing, etc.). While many of the principles are the same for all surveys, the focus here will be on methods for surveying individuals. Many surveys study all persons living in a defined area, but others might focus on special population groups-children, physicians, community leaders, the unemployed, or users of a particular product or service. Surveys may also be conducted with national, state, or local samples. Surveys can be classified by their method of data collection. Mail, telephone interview, and in-person interview surveys are the most common. Extracting data from samples of medical and other records is also frequently done. In newer methods of data collection, information is entered directly into computers either by a trained interviewer or, increasingly, by the respondent. One well-known example is the measurement of TV audiences carried out by devices attached to a sample of TV sets that automatically record the channels being watched. Mail surveys can be relatively low in cost. As with any other survey, problems exist in their use when insufficient attention is given to getting high levels of cooperation. Mail surveys can be most effective when directed at particular groups, such as subscribers to a specialized magazine or members of a professional association.
• Telephone interviews are an efficient method of collecting some types of data and are being increasingly used. They lend themselves particularly well to situations where timeliness is a factor and the length of the survey is limited.
• In-person interviews in a respondent's home or office are much more expensive than mail or telephone surveys. They may be necessary, however, especially when complex information is to be collected.
• Some surveys combine various methods. For instance, a survey worker may use the telephone to "screen" or locate eligible respondents (e.g., to locate older individuals eligible for Medicare) and then make appointments for an in-person interview.
What Survey Questions Do You Ask You can further classify surveys by their content. Some surveys focus on opinions and attitudes (such as a pre-election survey of voters), while others are concerned with factual characteristics or behaviors (such as people's health, housing, consumer spending, or transportation habits). Many surveys combine questions of both types. Respondents may be asked if they have heard or read about an issue ... what they know about it ... their opinion ... how strongly they feel and why... their interest in the issue ... past experience with it ... and certain factual information that will help the survey analyst classify their responses (such as age, gender, marital status, occupation, and place of residence).
Market Intelligence Group – survey research, survey analysis www.migindia.biz
Questions may be open-ended ("Why do you feel that way?") or closed ("Do you approve or disapprove?"). Survey takers may ask respondents to rate a political

What is a survey? 6
candidate or a product on some type of scale, or they may ask for a ranking of various alternatives. The manner in which a question is asked can greatly affect the results of a survey. For example, a recent NBC/Wall Street Journal poll asked two very similar questions with very different results: (1) Do you favor cutting programs such as social security, Medicare, Medicaid, and farm subsidies to reduce the budget deficit? The results: 23% favor; 66% oppose; 11% no opinion. (2) Do you favor cutting government entitlements to reduce the budget deficit? The results: 61% favor; 25% oppose; 14% no opinion. The questionnaire may be very brief -- a few questions, taking five minutes or less -- or it can be quite long -- requiring an hour or more of the respondent's time. Since it is inefficient to identify and approach a large national sample for only a few items of information, there are "omnibus" surveys that combine the interests of several clients into a single interview. In these surveys, respondents will be asked a dozen questions on one subject, a half dozen more on another subject, and so on. Because changes in attitudes or behavior cannot be reliably ascertained from a single interview, some surveys employ a "panel design," in which the same respondents are interviewed on two or more occasions. Such surveys are often used during an election campaign or to chart a family's health or purchasing pattern over a period of time. Who Works on Surveys The survey worker best known to the public is the interviewer who calls on the telephone, appears at the door, or stops people at a shopping mall. Traditionally, survey interviewing, although occasionally requiring long days in the field, was mainly part-time work and, thus, well suited for individuals not wanting full-time employment or just wishing to supplement their regular income. Changes in the labor market and in the level of survey automation have begun to alter this pattern-with more and more survey takers seeking to work full time. Experience is not usually required for an interviewing job, although basic computer skills have become increasingly important for applicants. Most research organizations provide their own training for the interview task. The main requirements for interviewing are an ability to approach strangers (in person or on the phone), to persuade them to participate in the survey, and to collect the data needed in exact accordance with instructions. Less visible, but equally important are the in-house research staffs, who among other things-plan the survey, choose the sample, develop the questionnaire, supervise the interviews, process the data collected, analyze the data, and report the survey's findings. In most survey research organizations, the senior staff will have taken courses in survey methods at the graduate level and will hold advanced degrees in sociology, statistics, marketing, or psychology, or they will have the equivalent in experience.
Market Intelligence Group – survey research, survey analysis www.migindia.biz
Middle-level supervisors and research associates frequently have similar academic backgrounds to the senior staff or they have advanced out of the ranks

What is a survey? 7
of clerks, interviewers, or coders on the basis of their competence and experience. What About Confidentiality and Integrity The confidentiality of the data supplied by respondents is of prime concern to all reputable survey organizations. At the U.S. Bureau of the Census, for example, the data collected are protected by law (Title 13 of the U.S. Code). In Canada, the Statistics Act guarantees the confidentiality of data collected by Statistics Canada, and other countries have similar safeguards. Several professional organizations dealing with survey methods have codes of ethics (including the American Statistical Association) that prescribe rules for keeping survey responses confidential. The recommended policy for survey organizations to safeguard such confidentiality includes
• Using only number codes to link the respondent to a questionnaire and storing the name-to-code linkage information separately from the questionnaires
• Refusing to give the names and addresses of survey respondents to anyone outside the survey organization, including clients
• Destroying questionnaires and identifying information about respondents after the responses have been entered into the computer
• Omitting the names and addresses of survey respondents from computer files used for analysis
• Presenting statistical tabulations by broad enough categories so that individual respondents cannot be singled out.
What Are Other Potential Concerns The quality of a survey is largely determined by its purpose and the way it is conducted. Most call-in TV inquiries (e.g., 900 "polls") or magazine write-in "polls," for example, are highly suspect. These and other "self-selected opinion polls (SLOPS)" may be misleading since participants have not been scientifically selected. Typically, in SLOPS, persons with strong opinions (often negative) are more likely to respond. Surveys should be carried out solely to develop statistical information about a subject. They should not be designed to produce predetermined results or as a ruse for marketing and similar activities. Anyone asked to respond to a public opinion poll or concerned about the results should first decide whether the questions are fair. Another important violation of integrity occurs when what appears to be a survey is actually a vehicle for stimulating donations to a cause or for creating a mailing list to do direct marketing. Where Can I Get More Information
Market Intelligence Group – survey research, survey analysis www.migindia.biz
In the preface to this booklet provided many general suggestions are made that might be pursued for more information. There seems to be no need to repeat these

What is a survey? 8
here. One point of information that might be of interest is that the clever acronym, SLOPS was coined by Norman Bradburn who used to head up NORC.
Market Intelligence Group – survey research, survey analysis www.migindia.biz
What is a survey? 9
2. How to Plan a Survey
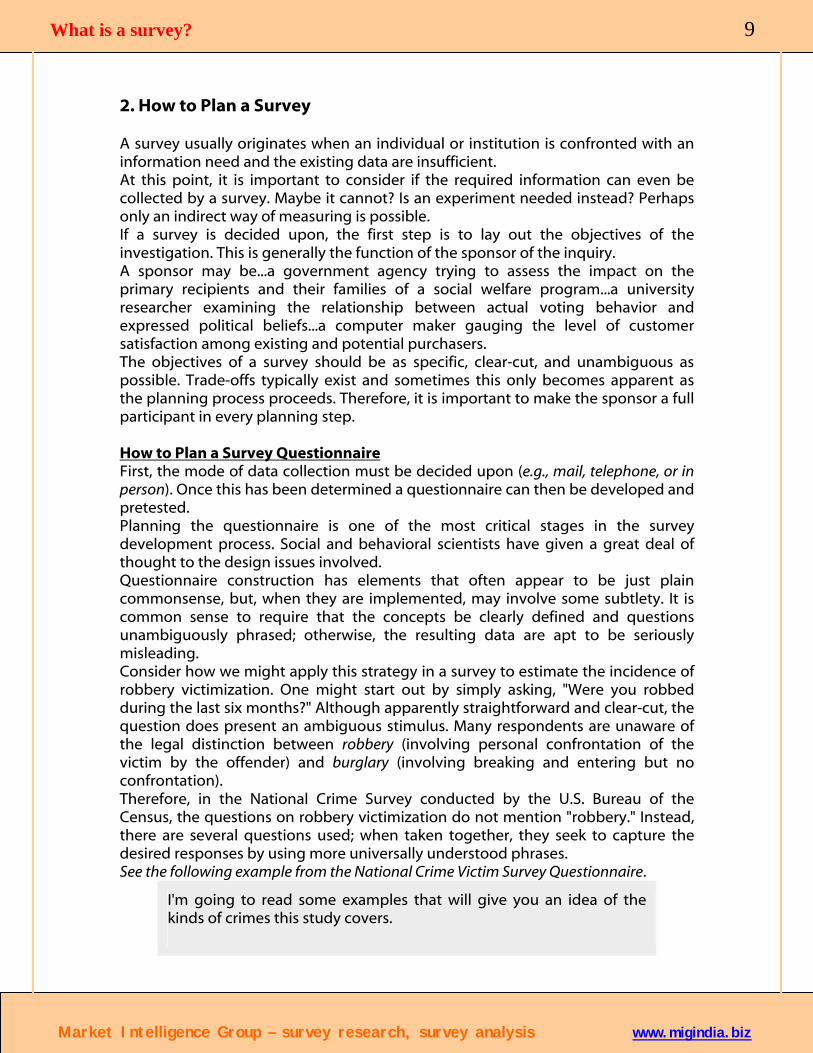
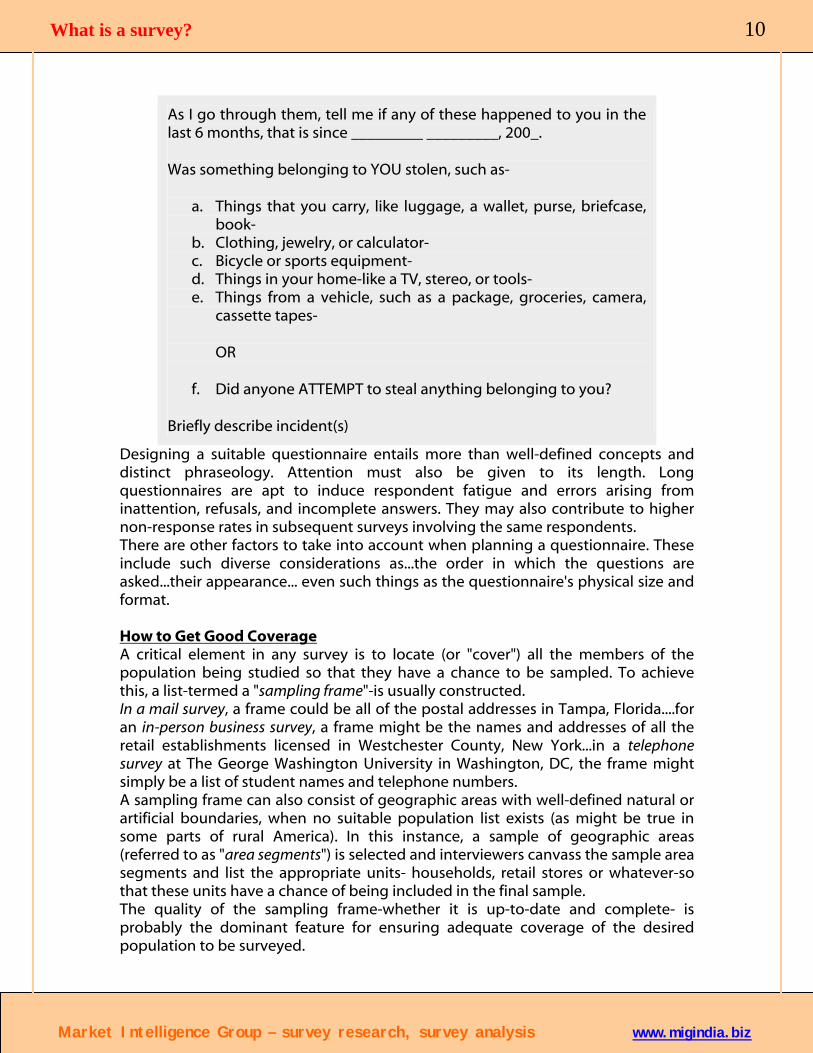
A survey usually originates when an individual or institution is confronted with an information need and the existing data are insufficient. At this point, it is important to consider if the required information can even be collected by a survey. Maybe it cannot? Is an experiment needed instead? Perhaps only an indirect way of measuring is possible. If a survey is decided upon, the first step is to lay out the objectives of the investigation. This is generally the function of the sponsor of the inquiry. A sponsor may be...a government agency trying to assess the impact on the primary recipients and their families of a social welfare program...a university researcher examining the relationship between actual voting behavior and expressed political beliefs...a computer maker gauging the level of customer satisfaction among existing and potential purchasers. The objectives of a survey should be as specific, clear-cut, and unambiguous as possible. Trade-offs typically exist and sometimes this only becomes apparent as the planning process proceeds. Therefore, it is important to make the sponsor a full participant in every planning step. How to Plan a Survey Questionnaire First, the mode of data collection must be decided upon (e.g., mail, telephone, or in person). Once this has been determined a questionnaire can then be developed and pretested. Planning the questionnaire is one of the most critical stages in the survey development process. Social and behavioral scientists have given a great deal of thought to the design issues involved. Questionnaire construction has elements that often appear to be just plain commonsense, but, when they are implemented, may involve some subtlety. It is common sense to require that the concepts be clearly defined and questions unambiguously phrased; otherwise, the resulting data are apt to be seriously misleading. Consider how we might apply this strategy in a survey to estimate the incidence of robbery victimization. One might start out by simply asking, "Were you robbed during the last six months?" Although apparently straightforward and clear-cut, the question does present an ambiguous stimulus. Many respondents are unaware of the legal distinction between robbery (involving personal confrontation of the victim by the offender) and burglary (involving breaking and entering but no confrontation). Therefore, in the National Crime Survey conducted by the U.S. Bureau of the Census, the questions on robbery victimization do not mention "robbery." Instead, there are several questions used; when taken together, they seek to capture the desired responses by using more universally understood phrases. See the following example from the National Crime Victim Survey Questionnaire.
Market Intelligence Group – survey research, survey analysis www.migindia.biz
I'm going to read some examples that will give you an idea of the kinds of crimes this study covers.
What is a survey? 10
As I go through them, tell me if any of these happened to you in the last 6 months, that is since _________ _________, 200_.
Was something belonging to YOU stolen, such as-
a. Things that you carry, like luggage, a wallet, purse, briefcase, book-
b. Clothing, jewelry, or calculator- c. Bicycle or sports equipment- d. Things in your home-like a TV, stereo, or tools- e. Things from a vehicle, such as a package, groceries, camera,
cassette tapes-
OR
f. Did anyone ATTEMPT to steal anything belonging to you?
Briefly describe incident(s)
Designing a suitable questionnaire entails more than well-defined concepts and distinct phraseology. Attention must also be given to its length. Long questionnaires are apt to induce respondent fatigue and errors arising from inattention, refusals, and incomplete answers. They may also contribute to higher non-response rates in subsequent surveys involving the same respondents. There are other factors to take into account when planning a questionnaire. These include such diverse considerations as...the order in which the questions are asked...their appearance... even such things as the questionnaire's physical size and format. How to Get Good Coverage A critical element in any survey is to locate (or "cover") all the members of the population being studied so that they have a chance to be sampled. To achieve this, a list-termed a "sampling frame"-is usually constructed. In a mail survey, a frame could be all of the postal addresses in Tampa, Florida....for an in-person business survey, a frame might be the names and addresses of all the retail establishments licensed in Westchester County, New York...in a telephone survey at The George Washington University in Washington, DC, the frame might simply be a list of student names and telephone numbers. A sampling frame can also consist of geographic areas with well-defined natural or artificial boundaries, when no suitable population list exists (as might be true in some parts of rural America). In this instance, a sample of geographic areas (referred to as "area segments") is selected and interviewers canvass the sample area segments and list the appropriate units- households, retail stores or whatever-so that these units have a chance of being included in the final sample.
Market Intelligence Group – survey research, survey analysis www.migindia.biz
The quality of the sampling frame-whether it is up-to-date and complete- is probably the dominant feature for ensuring adequate coverage of the desired population to be surveyed.
What is a survey? 11
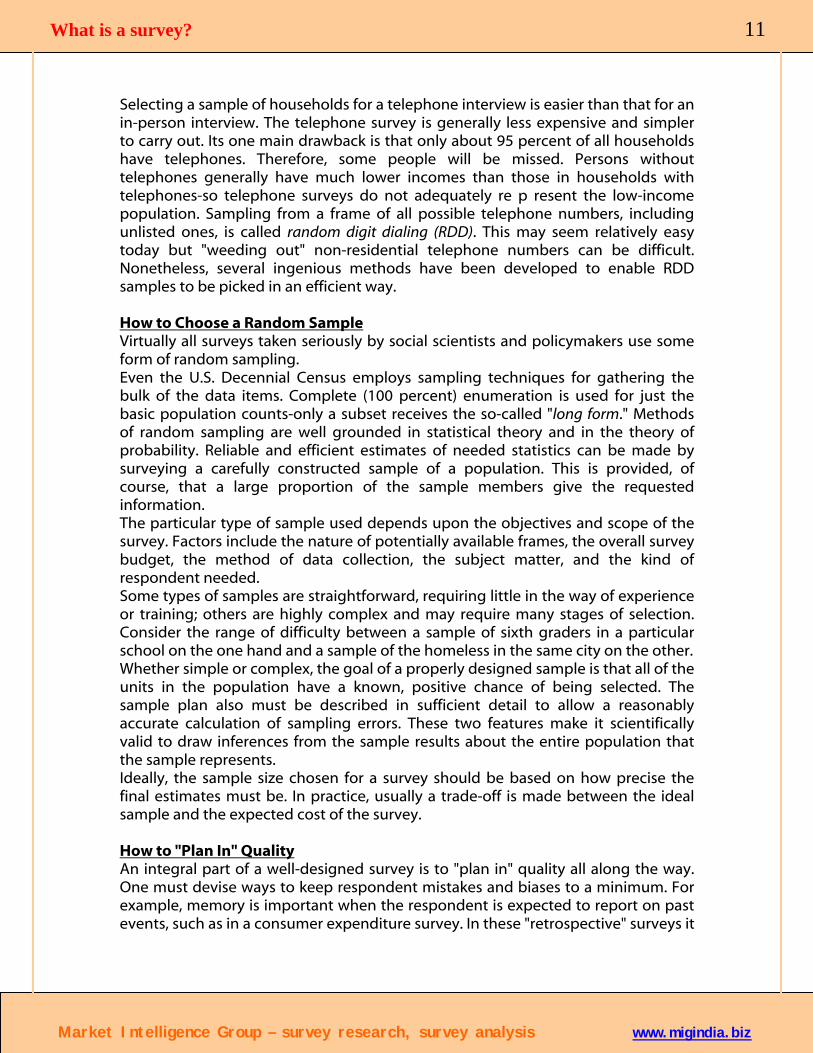
Selecting a sample of households for a telephone interview is easier than that for an in-person interview. The telephone survey is generally less expensive and simpler to carry out. Its one main drawback is that only about 95 percent of all households have telephones. Therefore, some people will be missed. Persons without telephones generally have much lower incomes than those in households with telephones-so telephone surveys do not adequately re p resent the low-income population. Sampling from a frame of all possible telephone numbers, including unlisted ones, is called random digit dialing (RDD). This may seem relatively easy today but "weeding out" non-residential telephone numbers can be difficult. Nonetheless, several ingenious methods have been developed to enable RDD samples to be picked in an efficient way. How to Choose a Random Sample Virtually all surveys taken seriously by social scientists and policymakers use some form of random sampling. Even the U.S. Decennial Census employs sampling techniques for gathering the bulk of the data items. Complete (100 percent) enumeration is used for just the basic population counts-only a subset receives the so-called "long form." Methods of random sampling are well grounded in statistical theory and in the theory of probability. Reliable and efficient estimates of needed statistics can be made by surveying a carefully constructed sample of a population. This is provided, of course, that a large proportion of the sample members give the requested information. The particular type of sample used depends upon the objectives and scope of the survey. Factors include the nature of potentially available frames, the overall survey budget, the method of data collection, the subject matter, and the kind of respondent needed. Some types of samples are straightforward, requiring little in the way of experience or training; others are highly complex and may require many stages of selection. Consider the range of difficulty between a sample of sixth graders in a particular school on the one hand and a sample of the homeless in the same city on the other. Whether simple or complex, the goal of a properly designed sample is that all of the units in the population have a known, positive chance of being selected. The sample plan also must be described in sufficient detail to allow a reasonably accurate calculation of sampling errors. These two features make it scientifically valid to draw inferences from the sample results about the entire population that the sample represents. Ideally, the sample size chosen for a survey should be based on how precise the final estimates must be. In practice, usually a trade-off is made between the ideal sample and the expected cost of the survey. How to "Plan In" Quality
Market Intelligence Group – survey research, survey analysis www.migindia.biz
An integral part of a well-designed survey is to "plan in" quality all along the way. One must devise ways to keep respondent mistakes and biases to a minimum. For example, memory is important when the respondent is expected to report on past events, such as in a consumer expenditure survey. In these "retrospective" surveys it
What is a survey? 12
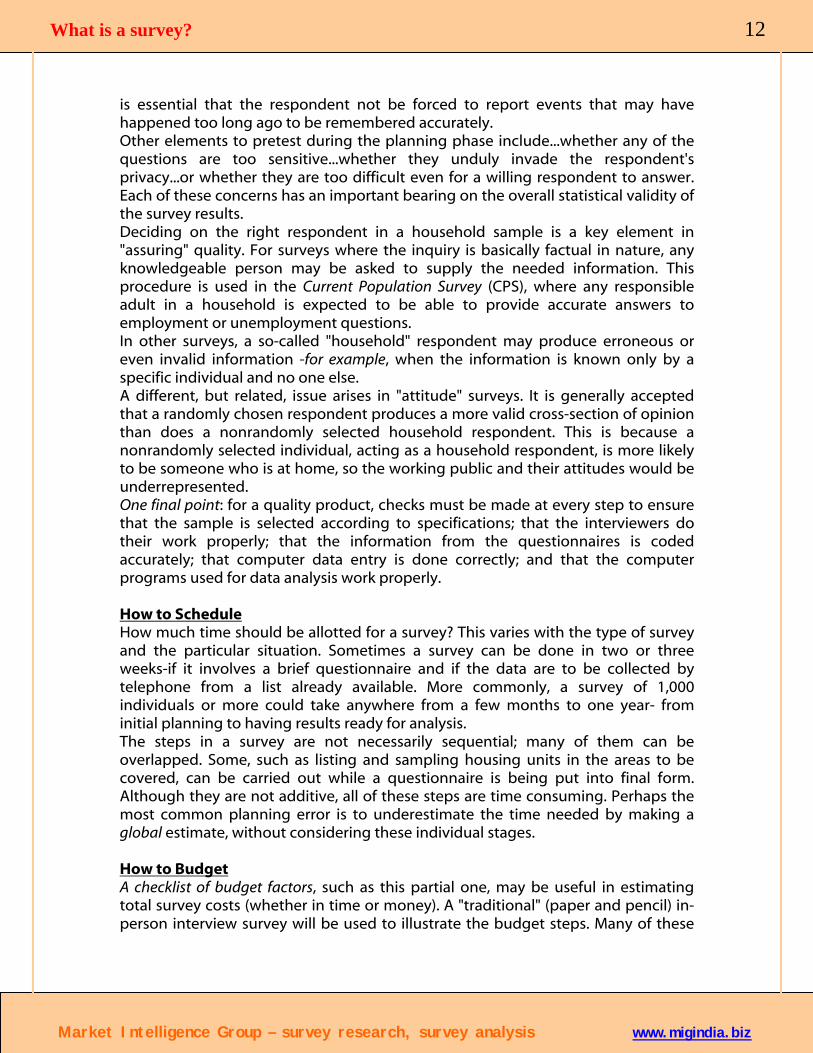
is essential that the respondent not be forced to report events that may have happened too long ago to be remembered accurately. Other elements to pretest during the planning phase include...whether any of the questions are too sensitive...whether they unduly invade the respondent's privacy...or whether they are too difficult even for a willing respondent to answer. Each of these concerns has an important bearing on the overall statistical validity of the survey results. Deciding on the right respondent in a household sample is a key element in "assuring" quality. For surveys where the inquiry is basically factual in nature, any knowledgeable person may be asked to supply the needed information. This procedure is used in the Current Population Survey (CPS), where any responsible adult in a household is expected to be able to provide accurate answers to employment or unemployment questions. In other surveys, a so-called "household" respondent may produce erroneous or even invalid information -for example, when the information is known only by a specific individual and no one else. A different, but related, issue arises in "attitude" surveys. It is generally accepted that a randomly chosen respondent produces a more valid cross-section of opinion than does a nonrandomly selected household respondent. This is because a nonrandomly selected individual, acting as a household respondent, is more likely to be someone who is at home, so the working public and their attitudes would be underrepresented. One final point: for a quality product, checks must be made at every step to ensure that the sample is selected according to specifications; that the interviewers do their work properly; that the information from the questionnaires is coded accurately; that computer data entry is done correctly; and that the computer programs used for data analysis work properly. How to Schedule How much time should be allotted for a survey? This varies with the type of survey and the particular situation. Sometimes a survey can be done in two or three weeks-if it involves a brief questionnaire and if the data are to be collected by telephone from a list already available. More commonly, a survey of 1,000 individuals or more could take anywhere from a few months to one year- from initial planning to having results ready for analysis. The steps in a survey are not necessarily sequential; many of them can be overlapped. Some, such as listing and sampling housing units in the areas to be covered, can be carried out while a questionnaire is being put into final form. Although they are not additive, all of these steps are time consuming. Perhaps the most common planning error is to underestimate the time needed by making a global estimate, without considering these individual stages. How to Budget
Market Intelligence Group – survey research, survey analysis www.migindia.biz
A checklist of budget factors, such as this partial one, may be useful in estimating total survey costs (whether in time or money). A "traditional" (paper and pencil) in-person interview survey will be used to illustrate the budget steps. Many of these

What is a survey? 13
are general; however, increasing use of survey automation is altering costs- reducing some and adding others.
• Staff time for planning the study and steering it through the various stages, including time spent with the sponsor in refining data needs
• Sample selection costs, including central office staff labor and computing costs
• For "area segments" samples, substantial field staff (interviewer) labor costs and travel expenses for listing sample units within the segments
• Labor and material costs for pretesting the questionnaire and field procedures; the pretesting step may need to be done more than once and money and time should be set aside for this (especially when studying something new)
• Supervisory costs for interviewer hiring, training, and monitoring • Interviewer labor costs and travel expenses (including meals and lodging, if
out of town) • Labor and expense costs of redoing a certain percentage of the interviews
(as a quality assurance step) and for follow-up on non-respondents • Labor and material costs for getting the information from the questionnaire
onto a computer file • Cost of spot-checking the quality of the process of computerizing the paper
questionnaires • Cost of "cleaning" the final data-that is, checking the computer files for
inconsistent or impossible answers; this may also include the costs of "filling in" or imputing any missing information
• Analyst costs for preparing tabulations and special analyses of the data; computer time for the various tabulations and analyses
• Labor time and material costs for substantive analyses of the data and report preparation
• Potentially important are incidental telephone charges, postage, reproduction and printing costs for all stages of the survey- from planning activities to the distribution of results
A good survey does not come "cheap," although some are more economical than others. As a rule, surveys made by an in-person interviewer are more expensive than those made by mail or by telephone. Costs will increase with the complexity of the questionnaire and the amount of data analysis to be carried out. Surveys that involve a large number of interviews tend to be cheaper on a per-interview basis than surveys with fewer interviews. This is particularly so when the sample size is less than 1,000 respondents, because "tooling up" is involved for just about any survey-except one that is to be repeated on the same group. Where Can I Get More Information
Market Intelligence Group – survey research, survey analysis www.migindia.biz
The quality of survey efforts can suffer because there is too little time set aside to do planning. Two important general sources to examine on planning in quality are Juran (1989) Quality Planning and Deming (1986) Out of the Crisis. The publications

What is a survey? 14
of the American Society for Quality are also worth looking for and can be searched for on the Internet. Software tools like MS Project are also useful in making planning more systematic and in increasing the efficiency of lessons learned, as Juran calls them from one survey to the next.
Market Intelligence Group – survey research, survey analysis www.migindia.biz

What is a survey? 15
3. How to Collect Survey Data
Survey data can be collected, as we have seen, in several modes: In person, by mail, telephone or through the Internet. Currently, mail surveys are the most common example of self reported data collection. One reason is that these surveys can be relatively low in cost. This does not mean, however, they are necessarily easy to carry out. Planning the questionnaires for mail surveys is often more difficult than for surveys that use interviewers. For example, care is needed to anticipate issues that respondents may have and to deal with them ahead of time. Using the mail can be particularly effective in business surveys-such as those conducted by the U.S. Bureau of the Census or the U.S. Bureau of Labor Statistics. Mail surveys also work well when they are directed toward specific groups- such as, subscribers to a specialized magazine or members of a professional organization. The manner in which self-reported data are obtained has begun to move away from the traditional mail-out/mail-back approach. The use of fax machines-and now the Internet-is on the rise. Fax numbers and Internet addresses are being added to specialized membership and other lists. As a by-product, they can be used, along with more conventional items like names and mailing addresses, in building potential sampling frames. There are still other methods of obtaining self-reported data. For example, the U. S. Bureau of Labor Statistics has a panel of business establishments, in which the respondents supply monthly data via touch-tone telephone entries that are directly connected to the agency's computers. For the immediate future, this type of automation will probably be restricted largely to business or institutional surveys in which the same information is collected at periodic intervals- monthly, quarterly, etc. As computers and telecommunications become more widespread, touch-tone applications or those involving respondents' computers "talking" directly to the survey organizations' computers will increase significantly. This increase is already well underway in health surveys, where samples of patient records are often supplied electronically. How to Conduct a Survey Interview Interview surveys-whether face-to-face or by telephone-offer distinct advantages over self-reported data collection. The "presence" of an interviewer can increase cooperation rates and make it possible for respondents to get immediate clarifications. The main requirement for good interviewers is an ability to approach strangers in person or on the telephone and persuade them to participate in the survey. Once a respondent's cooperation is acquired, the interviewers must maintain it, while collecting the needed data- data that must be obtained in exact accordance with instructions.
Market Intelligence Group – survey research, survey analysis www.migindia.biz
For high-quality data to be collected, interviewers must be carefully trained through classroom instruction, self-study, or both. Good interviewer techniques are stressed, such as...how to make initial contacts... how to conduct interviews in a professional manner...and how to avoid influencing or biasing responses. Training

What is a survey? 16
generally involves practice interviews to familiarize the interviewers with the variety of situations they are likely to encounter. Time must be spent going over survey concepts, definitions, and procedures. A question-by-question approach is needed to be sure the interviewers can deal with any misunderstandings that may arise. In most reputable survey organizations, the interviewers are also required to take a strict oath of confidentiality before beginning work. Survey materials must be prepared and issued to the interviewers. For traditional paper-and-pencil, in-person interviews, ample copies of the questionnaire, plus a reference manual, information about the identification and location of the households, and any cards or pictures to be shown to the respondents must be given to the interviewers. Before conducting in-person interviews, survey organizations frequently send an advance letter to the sample respondents, explaining the purpose of the survey and that an interviewer will be calling soon. In many surveys, especially those sponsored by the federal government, information must be given to the respondents regarding the voluntary or mandatory nature of the survey and how the answers are to be used. Visits to sample units are scheduled with attention to such considerations as the best time of day to call or visit, and allowance is made for repeated attempts (i.e., callbacks) in not-at-home situations. What Is CATI The use of computers in survey interviewing is becoming quite common. In the United States, most of the large-scale telephone surveys are now conducted via CATI (Computer-Assisted Telephone Interviews). With CATI, the interviewers use a computer terminal. The questions to be asked appear on the computer screen, and the interviewers use the keyboard to directly enter the respondents' replies as they are given. CATI's important advantages are in quality and speed, not in cost savings. CATI can cost more for small, non-repeated surveys, due to programming the questionnaire. CATI's cost per interview decreases as sample size increases- so in large and/or repeated surveys, it is cost competitive with conventional telephone methods. The CATI interviewer's screen is programmed to show questions in a planned order, so that interviewers cannot inadvertently omit questions or ask them out of sequence. For example, the answers to some questions require "branching" (i.e., answers to prior questions determine which other questions are asked). CATI can be programmed to do the correct branching automatically. In non-computer-assisted telephone interviewing, incorrect branching has sometimes been an important source of errors, especially omissions. In the CATI setting, the computer can be programmed to edit replies. The computer can check whether the reply to a particular question is consistent with other information reported. If the editing indicates that a problem may exist, the respondents are asked to confirm or correct earlier answers.
Market Intelligence Group – survey research, survey analysis www.migindia.biz
CATI can produce statistical results quicker than traditional methods of data collection. For example, it eliminates the need for a separate computer data-entry

What is a survey? 17
step. Furthermore, with CATI, some organizations are able to provide summaries of results as each questionnaire is completed or at the end of each day. What About CAPI In recent years, there has been a trend toward the use of portable laptop computers for in-person interview surveys. Portable computers can be taken into the field, and either the interviewer or the respondent can directly enter data in response to questions. Data collection carried out in this way is referred to as CAPI (Computer-Assisted Personal Interviews). The CAPI laptops are not directly connected with a centralized computer. Nonetheless, most CATI quality and speed advantages also occur with CAPI. Although only a few organizations currently employ CAPI methods, their use is expected to expand in the next few years, For example, the very large monthly Current Population Survey, which measures unemployment, has recently been converted from conventional in-person and telephone interviews to a combination of CAPI and CATI. Clearly, as electronic technology becomes more widely used traditional paper and pencil methods may eventually disappear- at least in surveys conducted by the federal government. What Is Done After Data Collection No matter what type of data collection is used, there are a number of "back-end" processes that may be needed to get the data in a form so that aggregated totals, averages, or other statistics can be computed. For mail surveys and conventional paper and pencil interviews, this may involve coding after the questionnaires have been completed. Coded paper questionnaires are entered into a computer (e.g., being keyed onto a disk) so that a computer file can be created. At this point, most of the remaining back-end steps are common to all surveys, whether or not a computer was used initially for data collection. Once a computer file has been generated, additional computer editing, separate from clerical editing, can be accomplished to alter inconsistent or impossible entries. Decisions are usually needed on how to handle missing items- cases in which the respondent did not know the answer... refused to provide one...or in which the question was simply not asked. Preferred practice for missing items is to provide special codes indicating why the data are not included. When resources are available, the "filling in" or imputation of these missing data items should be undertaken to reduce any biases arising from their absence. When there is a "clean" file the survey data are ready for analysts to begin summarizing what has been learned. It is a good idea to use commercially available software packages to carry out this step rather than using your own specially written computer programs.
Market Intelligence Group – survey research, survey analysis www.migindia.biz
Often the best way to start the analysis is with simple counts and related percentages for each question. Next, it is common to produce tables of growing complexity. Eventually, there may be a need for even more sophisticated forms of
What is a survey? 18
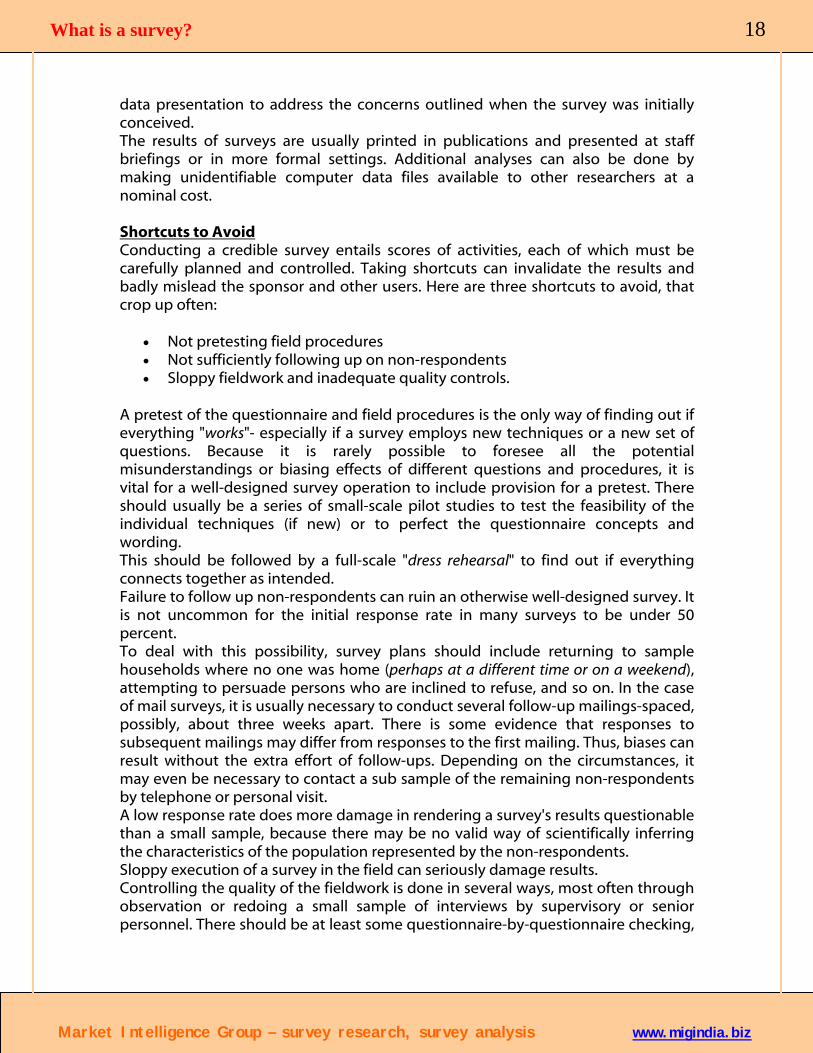
data presentation to address the concerns outlined when the survey was initially conceived. The results of surveys are usually printed in publications and presented at staff briefings or in more formal settings. Additional analyses can also be done by making unidentifiable computer data files available to other researchers at a nominal cost. Shortcuts to Avoid Conducting a credible survey entails scores of activities, each of which must be carefully planned and controlled. Taking shortcuts can invalidate the results and badly mislead the sponsor and other users. Here are three shortcuts to avoid, that crop up often:
• Not pretesting field procedures • Not sufficiently following up on non-respondents • Sloppy fieldwork and inadequate quality controls.
A pretest of the questionnaire and field procedures is the only way of finding out if everything "works"- especially if a survey employs new techniques or a new set of questions. Because it is rarely possible to foresee all the potential misunderstandings or biasing effects of different questions and procedures, it is vital for a well-designed survey operation to include provision for a pretest. There should usually be a series of small-scale pilot studies to test the feasibility of the individual techniques (if new) or to perfect the questionnaire concepts and wording. This should be followed by a full-scale "dress rehearsal" to find out if everything connects together as intended. Failure to follow up non-respondents can ruin an otherwise well-designed survey. It is not uncommon for the initial response rate in many surveys to be under 50 percent. To deal with this possibility, survey plans should include returning to sample households where no one was home (perhaps at a different time or on a weekend), attempting to persuade persons who are inclined to refuse, and so on. In the case of mail surveys, it is usually necessary to conduct several follow-up mailings-spaced, possibly, about three weeks apart. There is some evidence that responses to subsequent mailings may differ from responses to the first mailing. Thus, biases can result without the extra effort of follow-ups. Depending on the circumstances, it may even be necessary to contact a sub sample of the remaining non-respondents by telephone or personal visit. A low response rate does more damage in rendering a survey's results questionable than a small sample, because there may be no valid way of scientifically inferring the characteristics of the population represented by the non-respondents. Sloppy execution of a survey in the field can seriously damage results.
Market Intelligence Group – survey research, survey analysis www.migindia.biz
Controlling the quality of the fieldwork is done in several ways, most often through observation or redoing a small sample of interviews by supervisory or senior personnel. There should be at least some questionnaire-by-questionnaire checking,

What is a survey? 19
while the survey is being carried out; this is essential if omissions or other obvious mistakes in the data are to be uncovered before it is too late to fix them. In other words, to assure that the proper execution of a survey corresponds to its design, every facet of a survey must be looked at during implementation. For example... re-examining the sample selection … re-do some of the interviews... assessing the editing and coding of the responses. Without proper checking, errors may go undetected. With good procedures, on the other hand, they might even have been prevented. Insisting on high standards in recruiting and training of interviewers is crucial to conducting a quality survey. Just looking at each step by itself is still not enough. As W. Edwards Deming recommends, a complete systems approach should be developed to be sure each step fits into the previous and subsequent steps. Murphy's Law applies here, as elsewhere in life. The corollary to keep in mind is that not only is it true that "If anything can go wrong it will… but, "If you didn't check on it, it did." Where Can I Get More Information The specific data collection steps taken, naturally, depend heavily on the survey mode in use. Some modes, like telephone and Internet, are imbedded in fast changing technologies and there is a compelling need to keep up with the industry. Other modes, like mail surveys require active contact with improving Postal Service Operations. Face-to-face surveys continue to be encountering steep cost increases and a search for best practices, especially cost containment efforts are going to be needed. Membership in the American Association for Public Opinion Polling and the Section on Survey Research Methods of the American Statistical Association are ways to address the need to keep up here.
Market Intelligence Group – survey research, survey analysis www.migindia.biz

What is a survey? 20
4. Judging the Quality of a Survey
One of the most famous examples of a poorly conceived survey is the 1948 poll that predicted Harry Truman would lose the presidential election to Thomas Dewey. The survey's main flaw was its sample, which failed to fairly represent all segments of the American electorate-particularly those who eventually voted for Truman. Survey Non-response and Measurement Problems with the sample are not the only source of uncertainty in survey findings. Non-response occurs when members of the sample cannot-or will not- participate in the survey. Measurement difficulties are linked to problems in gathering the data used to generate survey results. Although some problems with inferior surveys can be attributed to negligence or mistakes, many problems are unavoidable and can only be minimized rather than eliminated altogether. For example, non-response is nearly inevitable for most surveys because some members of the sample will refuse to participate- despite every reasonable effort made by the survey taker. This pamphlet examines a few of the more common problems arising in surveys and how competent survey takers may handle them. How Do Problems Affect Survey Results? Survey problems lead to either of two effects on survey results. Bias is the tendency for findings to be off the mark in projecting from the sample to what is happening in the population as a whole. Variance, on the other hand, is a less predictable effect that may cause projections to be higher one time but lower the next. Where Do Problems Arise in Surveys? Difficulties may arise at any point during these basic steps of the survey process:
• Organization-The survey taker determines who is to be sampled and what is to be learned about the sample.
• Questionnaire Design-Based on the goal of the survey, questions for survey respondents are prepared and arranged in a logical order to create the survey questionnaire.
• Sampling-A repeatable plan is developed to randomly choose a sample capable of meeting the survey's goals. Then a sample is selected.
• Data Collection-A plan for contacting the sample and collecting information from participants is developed and carried out.
• Data Processing-Collected data are entered into the computer and checked for accuracy.
• Analysis-The results of the survey are compiled and disseminated.
Strategies To Deal With Survey Problems There are many and varied strategies for dealing with survey problems, although most can be described as an effort to:
• Prevent the problem
Market Intelligence Group – survey research, survey analysis www.migindia.biz
• Adjust the survey data to compensate

What is a survey? 21
• Measure any remaining effect of the problem
To the extent resources will allow, all three types of remedies are at least considered in planning the best surveys. Three examples of real surveys will help to illustrate how the types of remedies are used to deal with some common survey problems:
1. A state-wide mail survey of high school football coaches to profile the use of athletic trainers for varsity football teams
2. A county-wide telephone interview survey to poll adults' views on an upcoming school bond referendum
3. A national in-person Interview survey to find out how often, on average, people visited a doctor in the last year.
Sampling: Specific Problems and Remedies Sampling problems are tied to how the sample is chosen and to how the collected survey data are used to produce findings. Sampling problems can cause either bias or variance effects in survey results. SPECIFIC SAMPLING PROBLEMS
• Imprecise Findings-One common source of error in all three survey examples arises because the findings are extrapolated from a sample rather than obtained directly from the entire population.
Some Remedies Increase the sample size, particularly for the most important and heterogeneous segments of the population. Choose a stratified sample. This might be done in the mail survey by selecting separate samples for a number of school categories defined by student enrollment. This stratified sampling of schools by size would improve findings for the state, if those in larger schools are different (e.g., more likely to hire trainers) than those in smaller schools.
• Findings that Disregard the Sample Design-The plan for selecting football coaches in the mail survey might call for those at private schools to be sampled at a relatively higher rate to assure that the number of respondents from this type of school is large enough. Failure to account for the relative oversupply of private schools in the sample during data analysis would cause a biased underestimate in the projected percentage of the state's high school football teams that have a trainer, if private schools are less likely to have them.
A Remedy
Market Intelligence Group – survey research, survey analysis www.migindia.biz
Give survey data from private schools relatively less influence in shaping the final results projected for the state.
What is a survey? 22
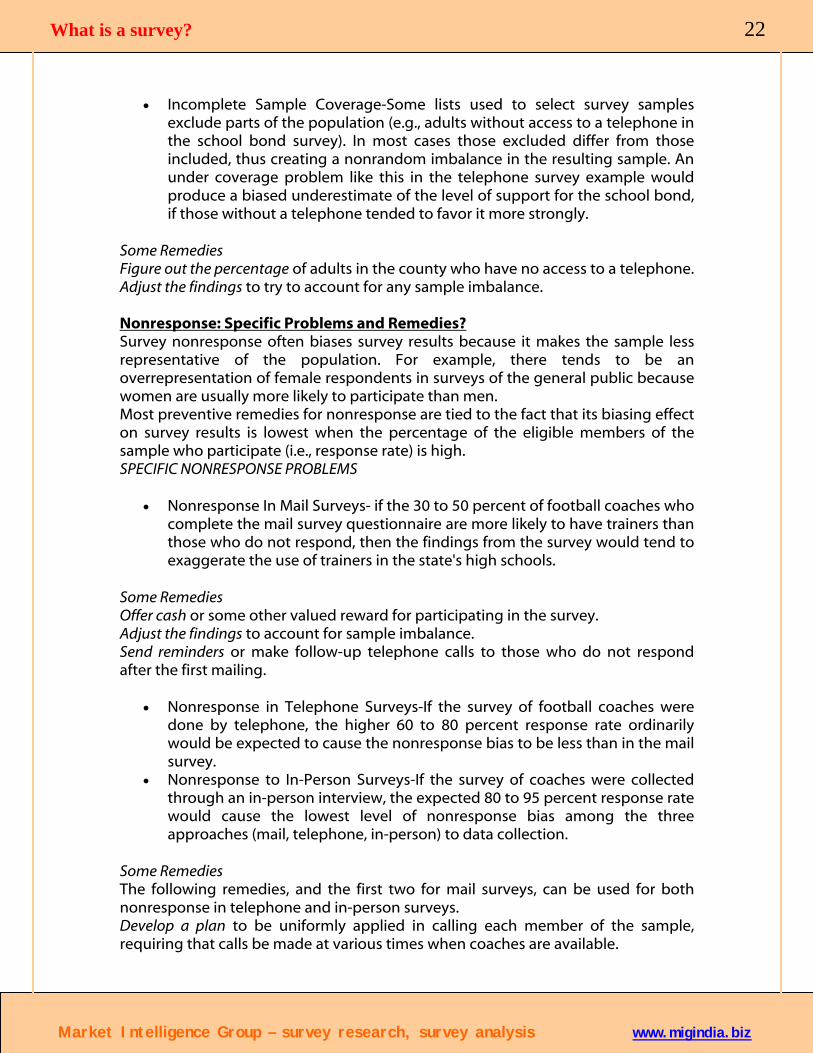
• Incomplete Sample Coverage-Some lists used to select survey samples exclude parts of the population (e.g., adults without access to a telephone in the school bond survey). In most cases those excluded differ from those included, thus creating a nonrandom imbalance in the resulting sample. An under coverage problem like this in the telephone survey example would produce a biased underestimate of the level of support for the school bond, if those without a telephone tended to favor it more strongly.
Some Remedies Figure out the percentage of adults in the county who have no access to a telephone. Adjust the findings to try to account for any sample imbalance. Nonresponse: Specific Problems and Remedies? Survey nonresponse often biases survey results because it makes the sample less representative of the population. For example, there tends to be an overrepresentation of female respondents in surveys of the general public because women are usually more likely to participate than men. Most preventive remedies for nonresponse are tied to the fact that its biasing effect on survey results is lowest when the percentage of the eligible members of the sample who participate (i.e., response rate) is high. SPECIFIC NONRESPONSE PROBLEMS
• Nonresponse In Mail Surveys- if the 30 to 50 percent of football coaches who complete the mail survey questionnaire are more likely to have trainers than those who do not respond, then the findings from the survey would tend to exaggerate the use of trainers in the state's high schools.
Some Remedies Offer cash or some other valued reward for participating in the survey. Adjust the findings to account for sample imbalance. Send reminders or make follow-up telephone calls to those who do not respond after the first mailing.
• Nonresponse in Telephone Surveys-If the survey of football coaches were done by telephone, the higher 60 to 80 percent response rate ordinarily would be expected to cause the nonresponse bias to be less than in the mail survey.
• Nonresponse to In-Person Surveys-If the survey of coaches were collected through an in-person interview, the expected 80 to 95 percent response rate would cause the lowest level of nonresponse bias among the three approaches (mail, telephone, in-person) to data collection.
Some Remedies The following remedies, and the first two for mail surveys, can be used for both nonresponse in telephone and in-person surveys.
Market Intelligence Group – survey research, survey analysis www.migindia.biz
Develop a plan to be uniformly applied in calling each member of the sample, requiring that calls be made at various times when coaches are available.

What is a survey? 23
Allow as many attempts to interview each selected football coach as resources permit. Prepare the interviewers with effective responses to concerns about the survey that reluctant coaches might express.
• Nonresponse to Certain Questions- A selected adult in the school bond survey may agree to participate in the interview but rightfully decline to answer some of the questions. This type of nonresponse is more common for questions on sensitive or invasive topics (e.g., sexual behavior or family income).
A Potential Partial Remedy Replace the missing answer with a substitute one that is chosen at random from other similar participants who answered the question. Measurement: What Are Some Specific Problems and Remedies? A measurement problem occurs when the answers provided by the respondent do not match the data actually needed. This discrepancy is usually tied to
• Questionnaire content • How well the respondent answers the survey questions • (In interview surveys) How appropriately the interviewer asks the survey
questions.
SPECIFIC MEASUREMENT PROBLEMS
• Inability to Recall Answers-Asking a respondent to remember the number of doctor visits during the last year is likely to contribute to a biased underestimate of the average number of visits per person. This happens because people tend to underreport less prominent or more distant past events.
Some Remedies Encourage respondents to use personal schedules, insurance records, and other sources to help them remember. If possible, shorten the length of the period for which doctor visits are to be counted (e.g., to the last two weeks rather than the last calendar year).
Market Intelligence Group – survey research, survey analysis www.migindia.biz
• Leading Questions- Using the following question to obtain adults' views in the telephone survey might bias the results in favor of the referendum: "Wouldn't you say it's about time for our county to pass the school bond referendum?" Phrasing an opinion question this way leads the respondent to a "yes" answer and a distorted perspective of the public's views on the issue.
What is a survey? 24
A Remedy Ask the question more objectively (e.g., by using: "Do you favor or oppose the school bond referendum?").
• Unclear Question Wording-The lack of a clear working definition for "doctor visit" would lead to a troublesome measurement problem in the in-person interview survey. For instance, some might consider an optometrist, chiropractor, or osteopath to be a "doctor," but others might not. To some a "visit" would happen only if the patient traveled to the doctor, but to others it would include house calls. The effect of allowing variable interpretations of key words and phrases in survey questions is to reduce the precision of survey results.
Some Remedies Try out the question on a small but broad cross-section of likely respondents before interviewing starts. Find out what is confusing about the phrase, and then clarify the interviewer or respondent instructions as needed. Check the interviewer carefully throughout the data-collection phase (especially early on), to make sure that definitions of these terms are correctly interpreted for respondents. How Good IS a Particular Survey? The potential for problems is a reality in all surveys today. The good news is, however, that researchers have found at least partially effective ways to deal with most problems that occur. The main issue for the discriminating user of results from any survey is to determine whether Problems like those described previously were recognized. Steps were thoughtfully taken to deal with them. Indeed, the quality of a survey is best judged not by its size, scope, or prominence, but by how much attention is given to dealing with all the many important problems that can arise. Where Can I Get More Information The Section for Research on Survey Methods of ASA periodically publishes best practice volumes and these should be examined since the measurement of survey quality continues to improve, both by applying the common sense methods highlighted in this Chapter and through other more technical advances of the many capable practitioners in this field. The work of Deming and Juran have been cited earlier (in Chapter 2) and their general advise can always be valuable. Closer to home and an important resource is the Kalsbeek and Lessler (1991) book entitled Nonsampling Errors.
Market Intelligence Group – survey research, survey analysis www.migindia.biz

What is a survey? 25
5. What Are Focus Groups
Qualitative data derived from focus groups are extremely valuable when vivid and rich descriptions are needed. In fact, focus groups are an increasingly popular way to learn about opinions and attitudes. According to the late political consultant Lee Atwater, the conversations in focus groups "give you a sense of what makes people tick and a sense of what is going on with people's minds and lives that you simply can't get with survey data." Focus groups are not polls but in-depth, qualitative interviews with a small number of carefully selected people brought together to discuss a host of topics ranging from pizza to safe sex. Unlike the one-way flow of information in a one-on-one interview, focus groups generate data through the give and take of group discussion. Listening as people share and compare their different points of view provides a wealth of information-not just about what they think, but why they think the way they do. Who Uses Focus Groups?
• Political pollsters use focus groups to ask potential voters about their views of political candidates or issues
• Organizational researchers use focus groups to learn how employees and managers feel about the issues confronting them in the workplace.
• Marketing firms use focus groups to determine how customers respond to new products.
• Public agencies find focus groups an important tool in improving customer service.
• Survey designers use focus groups to pretest their ideas and to interpret the quantitative information obtained from interviewing.
How Are People in Focus Groups Selected Unlike surveys in which a representative sample of the population is selected to study, a planned sample is chosen for focus groups. The composition of a focus group is usually based on the homogeneity or similarity of the group members. Bringing people with common interests or experiences together makes it easier for them to carry on a productive discussion. Often a research project will use different groups to get differing views. For example, an organization is planning a major restructuring. It would be desirable to have three separate focus groups-union members, nonunion employees, and managers. Each of these groups would represent a potentially different perspective on the changes facing the organization. Imagine the potential problems in bringing together union members and management. Neither would feel free to speak spontaneously and, depending on the anxiety level, the discussion might possibly spiral out of control.
Market Intelligence Group – survey research, survey analysis www.migindia.biz
Demographic characteristics are another way to determine focus group composition:

What is a survey? 26
• A political candidate might consider holding separate focus groups with both men and women or younger and older voters.
• A company testing a new product might conduct focus groups in different geographical regions.
• Organizational decision makers might find it useful to have separate focus groups for those who favor and those who oppose a particular issue.
One caution-remember that with a focus group, it is not possible to compare the results from different groups in a strict quantitative sense, because they lack representativeness. Each group may be characterized as augmenting the information of the others, in an effort to look for as many different explanations or interpretations as possible. Who Conducts Focus Groups Generally, focus groups are conducted by trained "moderators," who are skilled in maintaining good group dynamics. Depending on the purpose of the focus group, the moderator may also be an expert in a given topic area. The moderator's basic job is to keep the group "focused." He or she has the goal of helping the group generate a lively and productive discussion of the topic at hand. It is imperative that a moderator understand the underlying objectives of the study. Much of the data quality in focus groups depends on how effectively the moderator asks the questions and how well this person keeps the discussion targeted on the research objectives. Making this work requires the ability to tailor one's moderating style to different types of groups. Going back to the previous example, there may need to be differences in both the questions and the approach to moderating for the three groups of union members, nonunion members, and managers. What Types of Questions Should Be Asked in a Focus Group Questions should be open-ended so that there are many possible replies. Short-answer questions, such as those that can be answered "Yes" or "No" should be avoided. It is also important to avoid leading questions that suggest the moderator's opinion or the answer that he or she hopes to receive. Questions also should be:
• clearly formulated and easily understood • neutral so that the formulation does not influence the answer • carefully sequenced with easier, general questions preceding more difficult
ones • ordered so that less intimate topics precede the more personal questions.
Focus-group questions are not a form of group interviewing (i.e., scooping up 10 interviews at one time). "Serial Interviewing" is not being done either- in which the moderator asks a question and just passes from person to person getting an answer.
Market Intelligence Group – survey research, survey analysis www.migindia.biz
Ideally, the moderator places the question (or issue or topic) before the group. They then discuss it among themselves- talking to each other, asking each other

What is a survey? 27
questions about what they hear, and generally reacting to each other. It is a totally different dynamic from an interview. What Is the Ideal Size of a Focus Group The ideal size for a focus group is generally between six and twelve people. This size group encourages participants to contribute their ideas. Too-small groups are easily dominated by one or two members, or they may fall flat if too few people have anything to contribute. (Another problem is that the session may lapse into serial interviewing and lack energy.) Too large a group lacks cohesion and may break up into side conversations, or people may become frustrated if they have to wait their turn to respond or to get involved. If people are brought together because they have common experiences to discuss, you run the risk of not getting much new information when there too few people in the group. You bring numerous people together in the hope that they will bounce ideas off each other so that a "bigger, more expansive" answer or explanation emerges. However, there is a point of diminishing returns where too many participants add nothing new. What Is a Typical Focus Group Like Prior to the focus group, participants are usually recruited by telephone. Care needs to be taken to ensure that people who know each other are not recruited into the same sessions. People are generally more open and less guarded with people they don't know and don't have to worry about ever seeing again. Absolutely never put people together who are in some chain of command (e.g., supervisors with employees, teachers with students, etc.). When being recruited, potential participants receive a brief description of what the group will be about, as well as assurances that their participation is entirely voluntary and that their confidentiality will be protected. Focus group participants are often paid $25 to $50 for reimbursement of their time and travel expenses. In addition, a comfortable, relaxed atmosphere is often created by providing light refreshments or even a meal. At the focus group itself, the moderator begins with an introduction that should include the following:
• explaining the purposes of the focus group • laying down some basic ground rules to encourage everyone to participate
in the discussion • reassuring the participants about the voluntary and confidential nature of
their participation • introducing the moderator and any co-moderators and explaining how and
why these group members were invited to participate (e.g., what they may have in common)
• stating the purpose of note taking and recording.
Market Intelligence Group – survey research, survey analysis www.migindia.biz
The moderator typically begins the discussion with an ice-breaker, giving participants the chance to introduce themselves to the group. Once introductions
What is a survey? 28
are complete, the moderator guides the discussion, using an outline of questions, to explore various aspects of the research topic. As the group responds to each question, the moderator can probe for more information and ask follow-up questions to elicit more discussion. Focus-group sessions are frequently scheduled to last two hours, with the discussion taking 90 minutes. Once all of the questions have been asked, the moderator may conclude by giving a summary of the major points in the discussion and asking the group for feedback. Or, the moderator may have each participant think back over what was discussed and then have each one choose what he or she felt was the most important point. Another good way of concluding is to ask participants if there are any questions about a particular topic that were not asked but should have been. How Do You Keep Track of What Is Said During a Focus Group The most popular techniques for capturing data from focus groups include the following:
• Video recording: This technique captures both verbal and nonverbal information. One drawback is that it can be intrusive and can inhibit some participants.
• Audio recording: With this method you can obtain verbal information verbatim. A possible disadvantage is that nonverbal information and observational data are lost.
• Manual note taking: This procedure involves hand writing the discussion verbatim. It is not recommended, however, given the speed limitations of writing by hand. With this method, you run the risk of severely altering the analysis by selectively recording things that were said loudly or repeatedly and missing the more subtle information that emerged from the discussion.
• Multiple methods of recording: Note taking, in conjunction with audio or video recording, definitely can be worthwhile. To take notes there should be a co-moderator, either in the room or-better-behind one-way glass. There is no way on earth a single moderator can follow the discussion and take notes. It is just not physically possible, considering all the other jobs moderators have to do.
How Do Focus Groups Compare to Surveys There are advantages and disadvantages to using any technique. Focus groups are no different in this respect. The method of choice is constrained by your budget, your time, and availability of resources.
Market Intelligence Group – survey research, survey analysis www.migindia.biz
Focus groups and surveys have very different strengths. Focus groups excel at providing in-depth qualitative insights gleaned from a relatively small number of people. Surveys provide quantitative data that can be generalized to larger populations. Surveys measure things-frequencies of behavior, differences in attitudes, intensity of feelings, and so forth. Focus groups do not measure. They collect a breadth or range of information so that a "story" can be told.
What is a survey? 29
The best information can often be gathered by using the focus groups and surveys together. Surveys can provide precise quantitative information; focus groups can provide qualitative data that penetrates more deeply. Advantages of Focus Groups Among the advantages of focus groups are the following:
• A wide range of information can be gathered in a relatively short time span. • The moderator can explore related but unanticipated topics as they arise in
the discussion. • Focus groups do not require complex sampling techniques.
Disadvantages of Focus Groups There is also a set of accompanying disadvantages:
• The sample is neither randomly selected nor representative of a target population, so the results cannot be generalized or treated statistically.
• The quality of the data is influenced by the skills and motivation of the moderator.
• Focus groups lend themselves to a different kind of analysis than would be carried out with survey results. In surveys, the emphasis is on counting and measuring versus coding/classifying/sorting in a focus group.
A focus group analysis is truly qualitative. You use the actual words and behaviors of the participants to answer your questions, rather than counting response options. Where Can I Get More Information Focus groups are the best known example of a whole set of methods for collecting qualitative data, either in their own right or to aid the development or interpretation of a quantitative effort like a survey. The Joint Program in Survey Methods at the University of Maryland offers short courses on this topic for those who want to gain more depth here or who just want to keep up.
Market Intelligence Group – survey research, survey analysis www.migindia.biz

What is a survey? 30
6. Designing a Questionnaire
In survey taking it is clear that special training and expertise are required to draw the sample, or to create any necessary computer programs. But what about writing the questions for the survey questionnaire? We've all been asking questions and obtaining answers from those around us throughout our lives. Aren't we already "question-asking experts"? May be, Maybe not! Where to Start The place to start in designing a questionnaire is with your data collection goals-What information do you need and from whom? Once these objectives have been clearly identified, the next step is to decide what pieces of specific information are needed to satisfy these objectives. Many experienced questionnaire designers actually draft an outline of the final report, detailing how they will answer their fundamental data analysis concerns. This pinpoints exactly which pieces of information will be required and leads to the construction of a "data analysis plan"-which connects every data collection objective to each of the specific questions and how they should be asked. For example, consider answering an inquiry, such as How do people differ in their eating habits? Visualize a questionnaire that captures:
• attitudes about food preferences and likely food choices in different circumstances
• self-reports of quantities, frequencies, and type of food intake • age, income, and gender information to distinguish different groups
It may also be good to have a question in which people use their own words to describe their eating habits. Sometimes this approach can reveal whether the other questions were really understood. The data analysis plan may be quite informal- a table or flowchart linking everything together at a high level. Whatever the formality, each broad goal should be clearly set and linked to each of the specific questions on the questionnaire as they are constructed. The use of an analysis plan at this early stage may seem extravagant; however, it is one of the easiest ways, if kept updated, to ensure that the questionnaire contains everything that is needed and nothing extraneous. The larger and more complex the inquiry, the more emphasis should be placed on an analysis plan. Otherwise, it becomes virtually impossible to keep all of the details in mind through the constant revisions a questionnaire undergoes. No one wants to come to the end of a $50,000 (or $500,000) survey project and discover that a critical variable was missing or was collected in the wrong way. Question Context
Market Intelligence Group – survey research, survey analysis www.migindia.biz
As the survey team approaches the point of constructing specific questions, they must decide whether the questionnaire will be self-administered or interviewer-administered. The team also must decide how to deliver the questionnaire-by mail

What is a survey? 31
or email, by fax, by telephone, or in person. Because the mode of data collection determines how questions and response options are constructed, this decision must be made early in the design process. In many cases decisions about the collection mode will be driven by financial constraints or other resource limitations. Still, considerations such as overall questionnaire length, question complexity, and question sensitivity must be weighed in determining the mode of collection. For example, long questionnaires may not work well on the telephone, complex questions may require an interviewer to be sure that they are understood, and sensitive questions may be best done in a self-administered format. After the mode of collection is determined-but before the designer can draft the first question-the data collection team has to "operationalize" all the variables. For example, continuing our earlier illustration, we must define what we mean by an "eating habit" and which behaviors will identify it. We might choose to define an eating habit as any of the following:
• food and drink actually consumed within the past 24 hours, whether typical or not
• most frequently consumed food items during a certain time period, such as last month
• food and beverages preferred when one is given a choice • typical patterns of consumption, even if these patterns may not currently be
in place.
We also have to decide whether the information is to reflect the patterns of food and beverage consumption for the individual respondent or whether we want the respondent to report for the entire household. These decisions should take into consideration what needs to be included in the final report. The essential task is to convey the same information to all respondents about what is wanted. Questions can be formatted for open-ended or close-ended responses. For example:
"How many cups of coffee did you drink yesterday?"
Open-ended Response (specify number) ______ (enter answer)
Close-ended Response (circle one) None 1 2 3 4 5 6 or more
Close-ended response choices must exhaust the entire range of answers. These choices must be mutually exclusive so that a single answer cannot fall into more than one category. The differences between the response choices should also be clear, so that respondents find it easy to select the response that best represents their answer.
Market Intelligence Group – survey research, survey analysis www.migindia.biz
In summary, questions and response choices need to be constructed so that respondents can be successful in giving answers that meet the analytic needs of the inquiry.

What is a survey? 32
Good Question Structure To design a good question, it is crucial that all the concepts be clear and simply expressed. The designer must think about how the answer to the question will be processed and prepared for analysis. If there are terms with precise or technical meanings that everyone should use, these definitions must be included in the questionnaire and respondents should be instructed in them. It is essential to provide respondents with the tools necessary to translate their varied experiences accurately into a common, relevant set of response options. One of the first points to think about (and one that will emerge quickly if an analysis plan is used) is whether a particular question is included primarily to make comparisons over time or comparisons across groups. Question consistency becomes paramount, for example, if the new data are to be compared with previous versions of the same questionnaire or with previous studies that collected some of the same information. It is often easier to ensure consistency by repeating word for word the earlier question. A dilemma may arise if it appears that the previous question is flawed (when retested, as it should be in the new context). Social changes since the previous survey also may have altered the meaning of terms or the frequency of behaviors. Consider the question: "About how many times did you speak with someone on the telephone today?" How would the range of response options have to change if the goal is to compare an office worker's answer in the 1920s to what an office worker might say now? In the 1920s, the response options might have been: None 1 2 3 4 5+ These options seem unreasonable in the current business world. Today, we might have: None 1-5 6-10 11-15 16-20 21+ For a comparison over time, it would be better if the response options were: None 1-4 5-8 9-12 13-16 17-20 21+ This way, with an extra category, there would be a better contrast between today's office world and that of the 1920s. Another factor to consider is that the range of response categories affects how people think about a question. Pretesting should be conducted to tell if this is occurring. (See the How to Conduct Pretesting Chapter in this booklet for more information.) Conveying Required Precision When a question is being created- particularly one requesting information about the frequency of a behavior-it is important for researchers to agree in advance on the level of precision being asked from the respondent. If respondents are asked to estimate the frequency of their behavior, the questions may be prefaced by such phrases as "roughly how often?" or "about how many?"
Market Intelligence Group – survey research, survey analysis www.migindia.biz
It may be necessary to ask the respondents to count the exact frequency of events within a set period of time or to otherwise request that they be as precise as possible. You may ask them to consult records (assuming these are handy and do not

What is a survey? 33
overly delay the data collection or raise the chance of the interview breaking off before completion). If precision needs are not conveyed clearly to all respondents, one person may choose to estimate within very broad ranges and another may make an effort to closely count the episodes or behaviors. The result would be that these various respondents would be answering different questions and their data would not be comparable. Remember, respondents are not mind readers; they cannot be expected to guess what is desired by the researcher or questionnaire designer. Many concepts we ask people to report on in surveys do not have universally agreed-upon definitions. Surprisingly, there is little social consensus about the definitions of some commonplace everyday terms. Straightforward words, such as job, work, or income, can have many nuances and different meanings for different people. There are many things that may make a question difficult to answer and should be avoided. For instance,
• questions that tax the respondent's memory, • questions that ask for details that may never have been committed to
memory.
Pretesting such questions will quickly reveal the problem. Likewise, questions that ask for sensitive or self-incriminating information (e.g., on illegal drug use or cheating on taxes) are ones respondents may not want to answer. For the most sensitive types of information, questionnaires may need to be self administered with an unbreakable guarantee of respondent anonymity. Use extra caution when developing new questions-a great deal of preliminary effort is needed. Questionnaire designers budget a good deal of time for this. The Questionnaire as a Whole Respondents are more likely to cooperate if the questions are simple, clear, easy to answer, and personally relevant to them. It is recommended that questionnaires be written at the 5th-grade reading level. When you think you've finished the individual questions, step back and look at the questionnaire as a whole. Remember, the questionnaire is a total package and needs to be considered as such.
• It needs a strong introduction conveying to the respondent what the survey is about.
• It should indicate why the questions are being asked. • It needs interesting and readily answerable questions at the beginning to
gain respondent attention and build rapport. • The conclusion should be gentle and friendly, expressing gratitude for the
respondent's time and effort.
Market Intelligence Group – survey research, survey analysis www.migindia.biz
The questions need to flow well from one to the next, and designers should be aware that earlier questions provide information and context to the respondents that they may use in later answers. Often the answer to one question may influence
What is a survey? 34
the answer to a later question. For instance, suppose respondents are asked first How do you feel about your job? and later on How do you feel about life in general? Answers to the second question may be tempered by the first question. Because respondents have already reported their feelings about their job, including those feelings in the second answer may be redundant. On the other hand, if their job is very important to them (or salient for some other reason), then the answer to the first question may be used when constructing the second answer. These so-called "order effects" are difficult to predict and often become apparent only through field tests of the questionnaire, in which different orderings of the questions are compared. KISS Principle- Keep It Simple, Statistician The three most important things for any questionnaire designer to remember are simplicity, simplicity, and simplicity. Ideas need to be conveyed clearly and questions should be easy to comprehend. There must be no guesswork for the respondent when it comes to understanding exactly what information is being requested. Most questionnaires are not about trivial matters. It is the questionnaire designer's greatest challenge to take important topics and translate them into simple concepts, simple behaviors, and simple words. The style of the questionnaire must not get in the way of respondents' providing their information; otherwise the result could be incomplete or misleading data, item refusals, respondent fatigue effects-even the respondent's refusal to complete the questionnaire. It is a good idea to try out the questions on many different people-even as the questions are evolving. At different stages of development, the entire questionnaire should be tested to identify weaknesses and potential difficulties. Think about which respondents might have the most problems answering the questions, and deliberately seek out those respondents for pretests. Another good method for identifying difficulties is for the questionnaire designers to actually serve as respondents and answer the questions themselves. It is amazing what insight may be gained by turning the tables in this way. The questionnaire designer must understand the need to pretest, pretest, and then pretest some more. Where Can I Get More Information Cognitive psychology is making major inroads into survey practice, not only in questionnaire design but also improving methods for eliciting informed consent on questions of privacy and the effective use of incentives. For more information on these changes as they affect questionnaire design, see Cognition and Survey Research, Sirken, et al (1999), Wiley.
Market Intelligence Group – survey research, survey analysis www.migindia.biz

What is a survey? 35
7. How to Conduct Pretesting
The systematic checking or pretesting of a questionnaire is central to planning a good survey. As mentioned earlier in this series, the survey sponsors should play a major role in developing the data-collection instruments being proposed-including any testing being done. Much of the accuracy and interpretability of the survey results hinge on this pretesting step-which should never be omitted. Pretesting is critical for identifying questionnaire problems. These can occur for both respondents and interviewers regarding question content, "skip patterns," or formatting. Problems with question content include confusion with the overall meaning of the question, as well as misinterpretation of individual terms or concepts. Problems with how to skip or navigate from question to question may result in missing data and frustration for both interviewers and respondents. Questionnaire formatting concerns are particularly relevant to self-administered questionnaires, and if unaddressed, may lead to loss of vital information. Pretesting is a broad term that incorporates many different methods or combinations of methods. This pamphlet briefly describes eight suggested techniques that can be used to pretest questionnaires. These techniques have different strengths and weaknesses. They can be invaluable for identifying problems with draft questionnaires and also for evaluating surveys in the field. Types of Pretesting Pretesting techniques are divided into two major categories-pre-field and field. Pre-field techniques are generally used during the preliminary stages of questionnaire development. They include respondent focus groups and cognitive laboratory interviews. Six field techniques that test questionnaires under operational conditions are also covered. These include behavior coding of interviewer/respondent interactions, interviewer debriefings, respondent debriefings, split-sample tests, and the analysis of item nonresponse rates and response distributions. 1. Respondent Focus Groups Focus groups-a form of in-depth group interviewing- are conducted early in the questionnaire development cycle and can be used in a variety of ways to assess the question-answering process. Such groups may gather information about a topic before questionnaire construction begins (for example, to learn how people structure their thoughts about a topic, their understanding of general concepts or specific terminology, or their opinions about the sensitivity or difficulty of the questions). Focus groups help identify variations in language, terminology, or interpretation of questions and response options. Self-administered questionnaires can be pretested in a focus group, to learn about the appearance and formatting of the questionnaire. In addition, knowledge of content problems is gained. One of the main advantages of focus groups is the opportunity to observe a great deal of interaction on a topic in a limited period of time.
Market Intelligence Group – survey research, survey analysis www.migindia.biz
They also produce information and insights that may be less accessible without the give and take found in a group. Because of their interactive nature, however, focus

What is a survey? 36
groups do not permit a good test of the "normal" interviewing process. Researchers also do not have as much control over the process as with other pretesting methods. (For example, one or two people in the group may dominate the discussion and restrict input from other focus group members.) 2. Cognitive Laboratory Interviews Cognitive laboratory interviews are also generally used early in the questionnaire development cycle. They consist of one-on-one interviews using a structured questionnaire in which respondents describe their thoughts while answering the survey questions. "Think aloud" interviews, as this technique is called, can be conducted either concurrently or retrospectively (i.e. the respondents' verbalizations of their thought processes can occur either during or after the completion of the questionnaire). Laboratory interviews provide an important means of finding out directly from respondents what their problems are with the questionnaire. In addition, small numbers of interviews (as few as 15) can yield information about major problems-such as respondents repeatedly identifying the same questions and concepts as sources of confusion. Because sample sizes are not large, repeated pretesting of an instrument is often possible. After one round of lab interviews is completed, researchers can diagnose problems, revise question wording to resolve these problems, and conduct additional interviews to see if the new questions are better. Cognitive interviews can incorporate follow-up questions by the interviewer-in addition to respondents' statements of their thoughts. Different types of follow-up questions are used. Probing questions are used when the researcher wants to focus the respondent on particular aspects of the question-response task. (For example, the interviewer may ask how respondents chose their answers, how they interpreted reference periods, or what they thought a particular term meant.) Paraphrasing (i.e., asking the respondents to repeat the question in their own words) permits the researcher to learn whether the respondent understands the question and interprets it in the manner intended. It may also reveal better wordings for questions. 3. Behavior Coding Behavior coding of respondent-interviewer interactions involves systematic coding of the interaction between interviewers and respondents from live or taped interviews. The emphasis is on specific aspects of how the interviewer asked the question and how the respondent reacted. When used for questionnaire assessment, the coding highlights interviewer or respondent behaviors indicative of a problem with the question, the response categories, or the respondent's ability to form an adequate response. For example, if a respondent asks for clarification after hearing the question, it is likely that some aspect of the question caused confusion. Likewise, if a respondent interrupts before the interviewer finishes reading the question, then the respondent may miss information that might be important to giving a correct answer.
Market Intelligence Group – survey research, survey analysis www.migindia.biz
In contrast to pre-field techniques, behavior coding requires a sample size sufficient to address analytic requirements. For example, if the questionnaire contains many skip patterns, it is necessary to select a large enough sample to permit observation of
What is a survey? 37
various movements through the questionnaire. The determining sample sizes for behavior coding should take into account the relevant population groups for which separate analyses are desired. The value of behavior coding is that it allows systematic detection of questions that have large numbers of behaviors that reflect problems. It is not usually designed to provide answers about the source of the problems. It also may not distinguish which of several similar versions of a question is better. 4. Respondent Debriefings Respondent debriefings involve incorporating structured follow-up questions at the end of a field test interview to elicit quantitative and qualitative information about respondents' interpretations of survey questions. For pretesting purposes, the primary objective is to determine whether concepts and questions are understood by respondents in the same way that the survey sponsors intended. Respondent debriefings can also be used to evaluate other aspects of respondents' tasks, such as their use of records to answer survey questions or their understanding of the purpose of the interview. In addition, respondent debriefings can be useful in determining the reason for respondent misunderstandings. Sometimes results of respondent debriefings show a question is superfluous and can be eliminated. Alternatively, additional questions may need to be included in the final questionnaire. Finally, the debriefings may show that concepts or questions cause confusion or misunderstanding as far as the intended meaning is concerned. Some survey goals may need to be greatly modified or even dropped. A critical aspect of a successful respondent debriefing is that question designers and researchers must have a clear idea of potential problems so that good debriefing questions can be developed. Ideas about potential problems can come from pre-field techniques conducted prior to the field test, from analysis of data from a previous survey, from careful review of questionnaires, or from observation of actual interviews. Respondent debriefings have the potential to supplement information obtained from behavior coding. As previously discussed, behavior coding can demonstrate the existence of problems but does not always indicate the source of the problem. When designed properly, the results of respondent debriefings can provide information about the problem sources and may reveal problems not evident from the response behavior. 5. Interviewer Debriefings Interviewer debriefings traditionally have been the primary method to evaluate field tests. The interviewers who conduct the survey field tests are queried to use their direct contact with respondents to enrich the questionnaire designer's understanding of questionnaire problems. Although important, interviewer debriefings are not adequate as the sole evaluation method. Interviewers may not always be accurate reporters of certain types of questionnaire problems for several reasons:
• When interviewers report a problem it is not known whether it was troublesome for one respondent or for many.
Market Intelligence Group – survey research, survey analysis www.migindia.biz
• Interviewer reports of problem questions may reflect their own preference for a question rather than respondent confusion.

What is a survey? 38
• Experienced interviewers sometimes change the wording of problem questions as a matter of course to make them work and may not even realize they have done so.
Interviewer debriefings can be conducted in several different ways:
• Group-setting debriefings are the most common method, involving a focus group with the field test interviewers.
• Rating forms obtain more quantitative information by asking interviewers to rate each question in the pretest questionnaire on selected characteristics of interest to the researchers (whether the interviewer had trouble reading the question as written and whether the respondent understood the words or ideas in the question, among others).
• Standardized interviewer debriefing questionnaires collect information about the interviewers' perceptions of the problem, prevalence of a problem, reasons for the problem, and proposed solutions to a problem. They can also be used to ask about the magnitude of specific types of problems and to test an interviewer's knowledge of subject-matter concepts.
6. Split-Panel Tests Split-panel tests refer to controlled experimental testing among questionnaire variants or interviewing modes to determine which is "better" or to measure differences between them. For pretesting multiple versions of a questionnaire there needs to be a previously determined standard by which to judge the differences. Split-panel tests are also used to calibrate the effect of changing questions- particularly important in the redesign and testing of surveys where the comparability of the data collected over time is an issue. Split-panel tests can incorporate changes in a single question, a set of questions, or an entire questionnaire. It is important to provide for adequate sample sizes in a split-panel test so that differences of substantive interest can be measured well. It is also imperative that these tests involve the use of randomized assignment so differences can be attributed to the question or questionnaire, and not to something else. 7. Analysis of Item Nonresponse Rates Analysis of item nonresponse rates from the data collected during a field test (involving one or multiple panels) can provide useful information about how well the questionnaire works. This can be done by looking at how often items are missing (item nonresponse rates). These rates can be informative in two ways:
• "Don't know" rates can determine how difficult a task is for respondents to do.
Market Intelligence Group – survey research, survey analysis www.migindia.biz
• Refusal rates can determine how often respondents find certain questions or versions of a question too sensitive to be answered.
What is a survey? 39
8. Analysis of Response Distributions Analysis of response distributions for an item can be used to determine whether different question wordings or question sequences produce different response patterns. This kind of analysis is most useful when pretesting more than one version of a questionnaire or a single questionnaire in which some known distribution of characteristics exists for comparative purposes. When looking at response distributions in split-panel tests, the results do not necessarily reveal whether one version of a question produces a better understanding of what is being asked than another. Knowledge of differences in response patterns alone is not sufficient to decide which question best conveys the concept of interest. At times response distribution analysis demonstrates that revised question wording has no effect on estimates. Response distribution analyses should not be used alone to evaluate modifications in question wording or sequencing. It is useful only in conjunction with other question evaluation methods- such as respondent debriefings, interviewer debriefings, and behavior coding. Combining Methods Both pre-field and field testing should be done when time and funds permit; but, there are some situations in which it is not feasible to use all methods. Still, it is particularly desirable to meld the objective with the subjective methods- the respondent centered with the interviewer-centered. This complementarity allows for both good problem identification and problem resolution and provides an evaluation of broad scope. Where Can I Get More Information Information on cost and suggestions on the timing of pretesting can be found in the Census report from which this Chapter was excerpted. The March 2004 issue of Public Opinion Quarterly has an important review article, entitled "Methods for Testing and Evaluating Survey Questions," that could greatly help the reader who wished to learn more.
Market Intelligence Group – survey research, survey analysis www.migindia.biz

What is a survey? 40
8. More About Mail Surveys
So, how could I possibly run a survey? My budget is tight. I have no staff and limited facilities. It's 10 degrees below 0 outside, and I'm not going to stand on a corner intercepting angry commuters all day. The thought of sitting on the phone repeating, "Do you strongly agree, agree, neither agree nor disagree, disagree, or strongly disagree" to two hundred people is not exactly glamorous either. Are the prospects of conducting a survey completely impossible? Certainly not. Mail surveys are a powerful, effective, and efficient alternative to their more expensive relatives- the telephone survey and the personal interview. A quality, medium-scale mail survey can be conducted with minimal cost, little staff, and no complex equipment. And a well-conducted mail survey can be just as effective and meaningful as other more resource-intensive surveys. Our nation's postal workers don't need to tell you about the volume of mail that ends up in your mailbox each day. Encouraging participation in mail surveys is not a simple task under these circumstances. A survey that is lost in a sea of magazines, bills, and personal, business, and advertising mail may never be found. Although there are some drawbacks to mail surveys, it is possible to obtain valid results with the right kind of questionnaire and distribution technique. Well-prepared surveys can be executed successfully when the conditions are right. This pamphlet provides an overview of some of the strengths and weaknesses of mail surveys, a basic understanding of what is needed to conduct a successful mail survey, and ways to determine if this type of survey is appropriate for your situation. The Advantages of Mail Surveys Cost Effectiveness The use of mail surveys has increased dramatically recently-and for good reason. In terms of time and money, they are very economical. One way to demonstrate this is to compare and contrast mail surveys with telephone and face-to-face surveys-the other two very common ways in which to conduct a survey. With regard to human resources, mail surveys require very little manpower. It is possible for only one person to conduct a mail survey, where as the time needed to conduct the same number of telephone or face-to-face interviews is usually much too great for a single person. Mail surveys are also significantly cheaper than telephone and face-to-face interviews. The cost of a medium-scale mail survey in a single metropolitan area might run from $5,000 to $10,000. The costs of equal-sized telephone and face-to-face surveys are estimated at 50% and 150% more, respectively. If a national (or worldwide) survey is considered, these cost differentials would be even greater. This is primarily because postage costs are relatively low and uniform, regardless of the geographic area being covered, but telephone rates and, especially, personal interviewer expenses are higher and may also differ from one area to the next. Moreover, the total cost of sending a three-question survey is the same as for one with 100 questions, assuming that you can mail both out for the same amount of postage. So, the surveyor gets more for the dollar.
Market Intelligence Group – survey research, survey analysis www.migindia.biz

What is a survey? 41
Geographical Stratification Mail surveys also enable specific segments of the population to be easily targeted. For example, if you are surveying a city on the newest location for a garbage dump, you can compare the different areas of the town and the reaction to the garbage dump through mail surveys directed at certain neighborhoods. Honesty Finally, some studies show that people provide more honest answers to mail surveys than they do to other interviewing methods. Privacy-especially if your survey is about a delicate issue-may be important to the respondent, and mail surveys may increase the credibility of the answers. The bottom line is, that given enough time, you may want to use a mail survey, especially if you are subject to severe money constraints. But in doing so, you must also be aware of their disadvantages. Potential Disadvantages of Mail Surveys Coverage Errors Many people assume that the biggest disadvantage to mail surveys is a low response rate. This is not necessarily true. Good planning can lead to response rates as high as those obtained in telephone or face-to-face interviews. The main problem with mail surveys is procuring an accurate list of people in the population from which to draw the sample for your survey. Failure to do so can lead to coverage error. One important form of coverage error occurs when mailing lists are incomplete (for example, not including college students living away from home). Mailing lists may also be biased (a list of licensed drivers may under represent poor people, the very young, and the very old). Other lists may be inaccurate (containing duplicates or names that do not belong on the list) or out of date (omit people who have recently moved into the survey area or including people who have moved away). Wording of Questions Another area of critical importance to mail surveys is questionnaire design-poorly worded questions are a survey breaker. Questions must be simple, short, and precise. Unlike telephone and face-to-face interviews, there is no opportunity for explanation or follow-up questions like "Do you have something specific in mind?" Questions left open to interpretation will produce unusable results. Other Concerns Other factors can be of particular concern in mail surveys. For example, did you ask questions that are too personal? Is the questionnaire too long? Is the questionnaire legible and easy to follow? Can the person to be surveyed read? If, for instance, you are conducting a survey in a southern border town in Texas and neglect to include a copy of the questionnaire in both Spanish and English, the chances for success are greatly reduced. The disadvantages of mail surveys leave room for large errors. But many of these errors can be reduced significantly with overall awareness, good planning, careful wording of questions, thorough preparation, and pretesting.
Market Intelligence Group – survey research, survey analysis www.migindia.biz

What is a survey? 42
Design and Format of Mail Surveys The appearance of mail surveys can have a large impact on the percentage of responses received. A surveyor is usually asking the respondents to volunteer their time to fill out a questionnaire for which they will receive no instant response, benefit, or gratification. If the survey makes the task difficult by providing an unattractive design or format, giving poor directions, or including confusing questions, the respondent is more likely to choose not to donate their time "to the cause." Extreme care must be taken to ensure a design and form at that emphasize professionalism, quality, and attractiveness. Even factors such as poor re production, inadequate stapling (which might allow the survey to fall to pieces), or the lack of a sponsor's name will detract from your final response count. A great deal of care must go into selecting and designing the questions for your mail survey. First, be sure the questions will yield the kind of information you are looking for. If you are conducting a customer satisfaction survey for a magazine, simply asking people if they are satisfied with the magazine is not very useful. A follow-up question on why they are dissatisfied will help to improve your publication in the future. Second, although there are a number of different formats that can be used in soliciting responses (e.g., agree/disagree; rank your answers from 1 to 5; or open-ended replies) it is best not to jump from one type of question to another. The respondent is likely to find such a survey frustrating or, worse, more trouble than it is worth. Questions must also be examined closely for bias and fairness. Be aware of leading questions with wording that may influence your results. Writing appropriate and balanced questions is a very complicated topic in itself and requires research beyond the scope of this pamphlet, so proceed with caution. Questions should also be designed to take into account the amount of effort or burden they place on the respondent. For instance, if questions require detailed calculations, research sensitive personal information, or long-term memory recall, they are likely to go unanswered and may even discourage the respondent from replying to the survey at all. Finally, the design of the questions must be straightforward, unambiguous, and logical. It is important that the flow and format of the survey be intuitive-the more difficult it is to follow the survey pattern, the less likely the respondent will successfully complete the questionnaire. If complex directions cannot be avoided, use formatting, indenting, and shading to assist the respondent. In the following examples, one answer to a question requires further detail. Example 1: This example causes confusion about how to answer the question if you don't own your own business.
Market Intelligence Group – survey research, survey analysis www.migindia.biz
8. Do you own your own business?
Yes No
9. How many workers do you employ fulltime?

What is a survey? 43
Under 20 20-49 50-100 Over 100
10. Does your spouse work full-time?
Example 2:
8. Do you own your own business?
Yes No
IF YES,
8a. How many workers do you employ full-time?
Under 20 20-49 50-100 Over 100
10. Does your spouse work full-time?
In this example, shading and indentation guide the respondent and do not detract from the flow of the survey. Overall, strive for a survey that is uncluttered, legible, easy to follow, and uncomplicated to answer. The publishing production of the survey is also a key factor in having the questionnaire opened by the respondent. Mail surveys should be printed on high-quality paper. Be sure all materials are reproduced clearly and cleanly. A personalized cover letter should be included with the survey itself. The cover letter should explain the reasons for the survey, express assurances of confidentiality, and identify the survey sponsors. Preparatory and follow-up materials should use the same fonts, graphics, and formatting styles as the survey itself, in order to convey professionalism. Also, a familiar logo appearing on each document you send increases the likelihood that the recipient will associate the original survey mailing with reminders that come later on. Mail Survey Logistics It is important to remember that there is more to a successful mail survey than simply sending out one bulk mailing of questionnaires- no matter how carefully you have selected your sample or designed your questionnaire and printed your materials. In order to get the high response rates that mail surveys are capable of achieving, the following implementation steps are strongly suggested:
• Use multiple contacts, including o Send a preliminary mailing announcing the survey.
Market Intelligence Group – survey research, survey analysis www.migindia.biz
o Mail the survey to all respondents at the same time, with an accompanying cover letter.

What is a survey? 44
o Send a reminder, with contact information, to request a replacement questionnaire or answer general questions about the survey.
o Send replacement questionnaires by First-Class Mail. o Send the last replacement questionnaire by two-day Priority Mail. o Send an acknowledgment card, thanking respondents for their
cooperation. • Use printed stationery and personalized letters with logo and contact
information. • Include a stamped, pre-addressed return envelope. • Include a token of thanks-$1 to $5- with your initial or replacement mailing
of the questionnaire, as an incentive and sign of respect.
Common Pitfalls of Mail Surveys
• Pitfall #1: "I can use the white pages in the city phone book to draw my sample of people who live here."
Always examine a list before assuming that it answers all of your problems. In this example, a telephone book may seem to be comprehensive, but it contains many natural flaws. Poorer families may not be able to afford their own telephone. Wealthier or larger families may have multiple phone lines and, therefore, multiple phone book listings. Certain professionals tend to have unlisted phone numbers and would be excluded from the list outright. A phone book may also be more out of date than other available lists due to deaths and families that moved. Examine your list for inherent biases, check and recheck its accuracy, and look for ways to make any list more complete and more comprehensive.
• Pitfall #2: "I don't have the money to spend on these fancy booklets. Just stick the photocopy in an envelope and send it off. That way we can spend more money on the analysis."
A bad-looking mail survey will guarantee a poor response rate. With the high volume of mail that flows into the average American home on a daily basis, your survey must be professional and eye-catching in appearance; otherwise, it could simply end up in the trash unread. Investing in an attractive survey will save you money in the long run by delivering a high initial response rate and increasing your chances for accurate and meaningful results.
• Pitfall #3: "I'll just send out this stack of surveys, and when they all come back, we'll tally the results."
Market Intelligence Group – survey research, survey analysis www.migindia.biz
Simply sending out a straight mail survey may result in a return rate so small that the results are meaningless. The key to success is follow-up. A reminder postcard, a return incentive, a second copy of the survey sent to anyone who didn't return the first copy, or a follow-up note outlining the value of the completed survey to the recipient-these seemingly small follow-up steps can significantly increase the percentage of surveys which eventually return to you. Preparatory steps, such as
What is a survey? 45
teaser postcards alerting the recipient that the survey is en route, also increase response. Overall Summary These guidelines will help you achieve very good response rates from your mail survey- perhaps even better than the results you could obtain by telephone. The key is to show you care about getting a response- personalized surveys that include incentives, sent by First-Class Mail or Priority Mail, and with several follow-ups, send that message to the respondent far better than a one-time, photocopied, bulk mailing with no return envelope. Where Can I Get More Information Don Dillman has written extensively on self-administered surveys, notable mail surveys but also their logical extension Internet surveys.. A good recent source for more information from him is Dillman (2000), Mail and Internet Surveys: The Tailored Design Method.
Market Intelligence Group – survey research, survey analysis www.migindia.biz

What is a survey? 46
9. More About Telephone Surveys
It's dinner time. The telephone rings. Another telemarketer?
No, a survey interviewer this time. Your initial reaction is not to cooperate.
The interviewer explains that your household was carefully selected and that obtaining information from you is important to the success of the survey. How would you respond? Certainly, many questions are raised by calls like this, including the following:
• How did the interviewer get your unlisted telephone number? • Why won't the interviewer take a polite refusal as final?
So how did the interviewer get your number? And why did the interviewer say it was so important that your household be in the survey? If you have been reading the other chapters in this What Is a Survey booklet you know the answer to the second question, but what about the first? Telephone Households Generally, it is estimated that 96 percent, or even more, of all U.S. households have at least one telephone. For many topics studied in market research or opinion polling the differences between telephone and non-telephone households are relatively small. When exactly are telephone households "representative" of all households? Households without a telephone are more common in the South, in rural areas, and on Indian reservations. Somewhat more often they have African-American members, low incomes, and either only one person or six or more persons. Children under age 14 and unemployed adults are also slightly more likely to live in households without telephones. If the survey topic is related to these characteristics, omitting households without telephones will lead to a bias in the survey results. An example where this bias could be important is in studying crime victimization. The decision to use a survey of telephone households to obtain data on a specific topic is not based entirely on the expected level of bias or error that may occur when non-telephone households are not included in the sample. The cost, timeliness, and overall quality of findings are also major considerations. Telephone surveys are timelier and less expensive than those done face to face. Interviewer effects can be better controlled in telephone surveying. Self-administered mail surveys are less costly to conduct than telephone surveys but generally take more calendar time. See the chapter, More About Mail Surveys, for additional comparisons. The U.S. Telephone System
Market Intelligence Group – survey research, survey analysis www.migindia.biz
Once you decide to conduct a telephone survey, an important issue is where to obtain a sample of telephone households. All are familiar with the 10-digit system
What is a survey? 47
of telephone numbers (a 3-digit area code, a 3-digit prefix, and a 4-digit suffix). Lately there have been many changes, such as the increase in area codes from splitting existing ones. Until recently, area codes have not crossed state lines. The introduction of number portability across geographic areas is causing some disruption to this system. For the most part, knowing the area code for a number still tells you in what state the number is located and sometimes in what part of the state. Prefixes are assigned within area codes to an "exchange." Exchanges are geographic areas set by public service commissions within each state. Exchange boundaries seldom correspond to political boundaries. Metropolitan areas usually have more than one prefix, rural exchanges often just one. Rural exchanges are typically the same size geographically as urban exchanges, even though they have much smaller populations and lower service needs. A single prefix of 10,000 numbers is more than adequate to meet rural requirements. For most such exchanges only a small share of the 10,000 available numbers are being used for residential or commercial service. Because most of the geographic area of the United States is rural, most exchanges have only a single prefix; on the average, those rural exchange prefixes have a very low density of numbers currently in use. Using Telephone Directories An obvious source for sampling residential numbers would seem to be telephone directories. Approximately 5,000 are published in the United States each year. Not all working residential numbers appear in directories. Excluded are new numbers that were added since the directories were published, plus households choosing not to appear in telephone directories. As a result, roughly 30 percent or more of all telephone households are not found in directories, although this varies quite a bit across states. What really matters is that unlisted telephone households are different. They are more likely to have lower (not higher!) incomes, to be single-person households, and to be concentrated in metropolitan locations, particularly central cities. Using Completely Random Telephoning If directories will not work, then why not simply generate telephone numbers randomly and call them? After all, for each 6-digit area code/prefix combination, one can create a full "telephone number" by appending a randomly generated 4-digit number. This approach avoids bias but it requires you to call many, many nonworking telephone numbers to obtain the sample you want. The extra numbers called make completely random telephone surveys quite expensive to run, especially in rural areas.
Market Intelligence Group – survey research, survey analysis www.migindia.biz
In urban locations, a telephone number that is not in service is often (but not always) attached to a system that alerts the caller by a "tri-tone" followed by a message that the number is not in service. Many rural systems do not have such a recording but instead are attached to a recording of a ringing telephone. Screening randomly generated rural telephone numbers is very expensive because of this feature.
What is a survey? 48
Exactly how bad is this problem of "ring no answers"? If only a small percentage of telephone numbers did not have tri-tones but were connected to ringing recordings, the cost of screening would be low enough so that randomly generated numbers could be used in a survey. Unfortunately, the presence of so many rural exchanges with a single prefix, only partially used, leads to perhaps 75 to 80 percent of the randomly generated numbers being unusable-a rate that makes it simply too expensive to randomly generate numbers and then just call them. Clustering If we could determine the location of working residential telephone numbers within a given area code/prefix, telephone sampling would be straightforward. Working residential numbers are known to be clustered, but the location of these clusters is not known. Calling a local telephone company would be time consuming and costly; moreover, they usually will not give out this information. A Clever Idea A statistician then working for CBS News, Warren Mitofsky, developed a method based on the clustering of telephone numbers. His method greatly improved telephone surveying, making it economically feasible on a large scale. The approach was two-phased. In phase one, he generated a relatively small sample of completely random telephone numbers by appending random 4-digit suffixes to known area code/prefix combinations and had interviewers call those numbers. Only 25 percent turned out to be working residential numbers. In phase two, he had interviewers call additional numbers "close" to those that turned out to be working residential. He defined "close" to be numbers that were in the same "100-bank"-a set of numbers that have the same first two digits of the suffix. For example, suppose that the randomly generated telephone number 734-555-6789 was a working residential telephone number. Mitofsky would have interviewers dial other numbers selected at random in the sequence from 734-555-6700 to 734-555-6799. When he did this, 65 percent of the numbers dialed within those 100-banks were working residential-a big improvement over the 25 percent working residential in the first stage of the sampling. This two-stage design greatly increases the "hit rate" of working residential numbers in the second stage and considerably improves the efficiency of telephone sampling operations. Mitofsky was unsure of some of the statistical properties of his approach, so he asked a colleague at Westat, Joseph Waksberg, to optimize it. Waksberg found several useful properties of the design. The design became known as the two-stage Mitofsky-Waksberg method. Their method rapidly became standard for selecting telephone samples of households (and, in a few instances, even of business firms). It was inexpensive to obtain a list of all area codes and prefixes, generate numbers randomly for the first stage, and then call them to find out which were working and residential. In the second stage, within a "working residential 100-bank,"the higher hit rate reduced the amount of dialing that had to be done by interviewers.
Market Intelligence Group – survey research, survey analysis www.migindia.biz

What is a survey? 49
Another Clever Idea The Mitofsky-Waksberg method was not without a few problems, and researchers continued to look for other ways to select samples more efficiently. They eventually went back to the telephone directories and augmented them in a way that incorporated Mitofsky's essential insight and reduced costs still further. This method, known as "list-assisted," employs a commercial list as the starting point for sampling. Commercial firms that mail advertisements to households need lists of households with complete addresses, including zip codes. There is no master list of households in the United States available from public sources, so a commercial firm, MetroMail, Inc., developed such a list from telephone directories. Their list is updated continuously as telephone directories are published throughout the year. Approximately 65 million U.S. telephone households are maintained on the file. The list is supplemented with lists of automobile registrations from more than 30 states that sell these lists. The resulting file contains more than 75 million households. A second firm, R.H. Donnelley, Inc., utilizes a computer program that matches addresses to zip codes and assigns a zip code to each entry on the MetroMail file. They also assign data from the most recent Census of Population and Housing to each household. However, the census data is limited to information about the block or the census tract where the household is located. Even after supplementation, the combined commercial list is almost entirely made up of listed telephone numbers. A sample from it would yield selections subject to the same kinds of concerns that are raised for directory-based samples. The commercial list does contain valuable information about the location of telephone numbers within area code/prefix combinations and a mailing address that can be used to do follow-up mailings to nonrespondents. If sorted by telephone number, the commercial list provides a way to screen out 100-banks that did not have any listed numbers without having to do a first stage of sample selection. This allows telephone survey organizations to drop 100-banks that did not have any listed numbers and draw samples at random from within the remaining 100-banks. This design became known as "list-assisted" because the random selections were "assisted" by preliminary screening based on listed working residential numbers. The list-assisted method has become a popular alternative to the Mitofsky-Waksberg design. "Hit rates" among randomly generated numbers drawn from 100-banks with one or more listed numbers were initially around 55 percent, a drop from the 65 percent of the second stage of the Mitofsky-Waksberg method. But, the list-assisted method proved to be easier to administer and had slightly better properties in terms of the reliability of estimates derived from its samples. Several commercial firms began to purchase the counts of listed numbers by 100-bank from Donnelley. These firms selected samples from those 100-banks with one (or sometimes two) or more listed numbers and sold the samples to various market research and public opinion survey organizations. Now, a survey organization no longer had to generate its own sample. It could simply buy it!
Market Intelligence Group – survey research, survey analysis www.migindia.biz
Over time, samples have become increasingly sophisticated. Sampling firms link information about the geography of the exchange, or even the prefix, or 100-bank

What is a survey? 50
to each sample number and sell "targeted" samples that would have higher proportions of households with specific characteristics. For example, a researcher may want a sample that would have a higher yield of households with annual incomes above a certain level. Telephone samples based on income information linked to the bank, or prefix, for the number are readily available. The Future The telephone system continues to change as new services and, with deregulation, new providers enter the market. Consider three challenges: Cell Phones Currently, there are nearly 70 million cell-phone subscribers in the United States. Most can still be contacted via a traditional (land line) telephone in a household. Because of this, cell phone numbers can, and typically are now, excluded from sampling to begin with since they are classified by NXX codes. Conceivably, cell-phone subscribers may begin using their cell telephones for residential purposes, requiring that samples of such numbers be taken. Therefore, households with both traditional and cell phones would get a higher chance of being selected than households without cell phones. To deal with this "overrepresentation," we could correct the probabilities of selection, just as is now being done for households with multiple line-telephone numbers. Answering Machines and caller ID's Answering machines and caller-ID services pose a growing challenge to telephone survey organizations. Recent data show that as many as 55 percent of all telephone households report that they use an answering machine to screen calls most of the time, or always. Organizations conducting telephone surveys often leave messages on answering machines with toll-free numbers for households to call. A surprising number of households using an answering machine to screen calls can eventually be reached through toll-free numbers or repeated attempts to reach the household when the answering machine or caller ID is not being used for screening. Falling Response Rates As survey researchers learn more and more about features of the telephone system, they continue to modify telephone sampling procedures to make them more efficient. One challenge that they have not yet fully addressed is the near-saturation calling conducted by telemarketers and the effect this has had on lowering survey cooperation rates. Survey researchers must work to reverse this trend in order to maintain the scientific validity of telephone surveys. Otherwise, telephone surveys, as we know them, could disappear within the next five years. Where Can I Get More Information
Market Intelligence Group – survey research, survey analysis www.migindia.biz
Since this Chapter was written response rates have continued to fall in virtually all surveys, but especially telephone surveys. Even so, fortunately, the statement that "telephone surveys, as we know them, could disappear within the next five years" has proved premature.

What is a survey? 51
Efforts to improve the modeling and measurement of nonresponse biases have gone hand-in-hand with more use of mixed mode surveys that mix together mail surveys, which remain relatively cheap with Internet surveys which can be cheaper still but have their own nonresponse problems. The explosion of cell phone use bears watching, as does the use of the "No Call" list which while it is aimed at telemarketers also affects telephone survey response rates in ways that are yet to be determined. Two list serves where news on changes in this data collection mode regularly appears are SRMSNET and AAPORNET, sponsored respectively by the ASA Section on Survey Research Methods an the American Association of Public Opinion Research.
Market Intelligence Group – survey research, survey analysis www.migindia.biz

What is a survey? 52
10. What is a Margin of Error
When results of surveys are reported in the media, they often include a statement like- "55 percent of respondents favor Ms. Smith in the upcoming mayoral election. There is a margin of error of 3 percentage points." What does a statement like this mean? This pamphlet attempts to answer this question and to provide some cautions on the use of the "margin of error" as the sole measure of a survey's uncertainty. Surveys are typically designed to provide an estimate of the true value of one or more characteristics of a population at a given time. The target of a survey might be
• the average value of a measurable quantity, such as annual 1998 income or SAT scores for a particular group.
• a proportion, such as the proportion of likely voters having a certain viewpoint in a mayoral election
• the percentage of children under three years of age immunized for polio in 1997
An estimate from a survey is unlikely to exactly equal the true population quantity of interest for a variety of reasons. For one thing, the questions maybe badly worded. For another, some people who are supposed to be in the sample may not be at home, or even if they are, they may refuse to participate or may not tell the truth. These are sources of "nonsampling error." But the estimate will probably still differ from the true value, even if all nonsampling errors could be eliminated. This is because data in a survey are collected from only some-but not all-members of the population to make data collection cheaper or faster, usually both. Suppose, in the mayoral election poll mentioned earlier, we sample 100 people who intend to vote and that 55 support Ms. Smith while 45 support Mr. Jones. This would seem to suggest that a majority of the town's voters, including people not sampled but who will vote in the election, would support Ms. Smith. Of course, just by chance, a majority in a particular sample might support Ms. Smith even if the majority in the population supports Mr. Jones. Such an occurrence might arise due to "sampling error," meaning that results in the sample differ from a target population quantity, simply due to the "luck of the draw"-i.e., by which set of 100 people were chosen to be in the sample. Does sampling error render surveys useless? Fortunately, the answer to this question is "No." But how should we summarize the strength of the information in a survey? That is a role for the margin of error. Margin of Error Defined
Market Intelligence Group – survey research, survey analysis www.migindia.biz
The "margin of error" is a common summary of sampling error, referred to regularly in the media, which quantifies uncertainty about a survey result. The margin of error can be interpreted by making use of ideas from the laws of probability or the "laws of chance," as they are sometimes called.

What is a survey? 53
Surveys are often conducted by starting out with a list (known as the "sampling frame") of all units in the population and choosing a sample. In opinion polls, this list often consists of all possible phone numbers in a certain geographic area (both listed and unlisted numbers). In a scientific survey every unit in the population has some known positive probability of being selected for the sample, and the probability of any particular sample being chosen can be calculated. The beauty of a probability sample is twofold. Not only does it avoid biases that might arise if samples were selected based on the whims of the interviewer, but it also provides a basis for estimating the extent of sampling error. This latter property is what enables investigators to calculate a "margin of error." To be precise, the laws of probability make it possible for us to calculate intervals of the form estimate +/- margin of error. Such intervals are sometimes called 95 percent confidence intervals and would be expected to contain the true value of the target quantity (in the absence of nonsampling errors) at least 95 percent of the time. An important factor in determining the margin of error is the size of the sample. Larger samples are more likely to yield results close to the target population quantity and thus have smaller margins of error than more modest-sized samples. In the case of the mayoral poll in which 55 of 100 sampled individuals support Ms. Smith, the sample estimate would be that 55 percent support Ms. Smith-however, there is a margin of error of 10 percent. There f o re, a 95 percent confidence interval for the percentage supporting Ms. Smith would be (55%-10%) to (55%+10%) or (45 percent, 65 percent), suggesting that in the broader community the support for Ms. Smith could plausibly range from 45 percent to 65 percent. This implies-because of the small sample size-considerable uncertainty about whether a majority of townspeople actually support Ms. Smith. Instead, if there had been a survey of 1,000 people, 550 of whom support Ms. Smith, the sample estimate would again be 55 percent, but now the margin of error for Ms. Smith's support would only be about 3 percent. A 95 percent confidence interval for the proportion supporting Ms. Smith would thus be (55%-3%) to (55%+3%) or (52 percent, 58 percent), which provides much greater assurance that a majority of the town's voters support Ms. Smith. What Affects the Margin of Error Three things that seem to affect the margin of error are sample size, the type of sampling done, and the size of the population.
Market Intelligence Group – survey research, survey analysis www.migindia.biz
Sample Size-As noted earlier, the size of a sample is a crucial actor affecting the margin of error. In sampling, to try an estimate a population proportion-such as in telephone polls- a sample of 100 will produce a margin of error of no more than about 10 percent, a sample of error of 500 will produce a margin of error of no more than about 4.5 percent, and a sample of size 1,000 will produce a margin of error of no more than about 3 percent. This illustrates that there are diminishing returns when trying to reduce the margin of error by increasing the sample size. For example, to reduce the margin of error to 1.5% would require a sample size of well over 4,000.

What is a survey? 54
Probability Sampling Designs-The survey researcher also has control over the design of the sample, which can affect the margin of error. Three common types are simple random sampling, random digit dialing, and stratified sampling.
• A simple random sampling design is one in which every sample of a given size is equally likely to be chosen. In this case, individuals might be selected into such a sample based on a randomizing device that gives each individual a chance of selection. Computers are often used to simulate a random stream of numbers to support his effort.
• Telephone surveys that attempt to reach not only people with listed phone numbers but also people with unlisted numbers often rely on the technique of random digit dialing.
• Stratified sampling designs involve defining groups, or strata, based on characteristics known for everyone in the population, and then taking independent samples within each stratum. Such a design offers flexibility, and, depending on the nature of the strata, they can also improve the precision of estimates of target quantities (or equivalently, reduce their margins of error).
Of the three types of probability sampling, stratified samples are especially advantageous when the target of the survey is not necessarily to estimate the proportion of an entire population with a particular viewpoint but instead is to estimate differences in viewpoints between different groups. For example, if there was a desire to compare attitudes between individuals of Inuit (Alaskan native) origin versus other Americans on their opinion about drilling for oil on federal land, it would not make sense to take a simple random sample of all Americans to answer this question because very few Inuit would likely fall into such a sample. Instead, one might prefer to take a stratified sample in which Alaskan Native Americans compose one half of the sample and non-Inuit compose the other one half. Sometimes samples are drawn in clusters in which only a few counties or cities are sampled or only the interviewer visits a few blocks. This tends to increase the margin of error and should be taken into account by whoever calculates sampling error. Size of Population-Perhaps surprising to some, one factor that generally has little influence on the margin of error is the size of the population. That is, a sample size of 100 in a population of 10,000 will have almost the same margin of error as a sample size of 100 in a population of 10 million. Interpreting the Margin of Error In practice, nonsampling errors occur that can make the margin of error reported for a poll smaller than it should be if it reflected all sources of uncertainty. For example, some respondents to the mayoral survey may not have been eligible to vote but may have answered anyway, while others may have misled the interviewer about their preferences.
Market Intelligence Group – survey research, survey analysis www.migindia.biz
Why isn't the margin of error adjusted to reflect both sampling and nonsampling uncertainties? The answer is that, unlike sampling error, the extent of nonsampling

What is a survey? 55
error cannot usually be assessed from the sample itself, even if the sample is a probability sample. Some things that help assess nonsampling uncertainties, when available, include the percentage of respondents who answer "don't know" or "undecided." Be wary when these quantities are not given. Almost always there are people who have not made up their mind. How these cases are handled can make a big difference. Simply splitting them in proportion to the views of those who gave an opinion can be misleading in some settings. It is important to learn if the survey results are actually from a probability sample at all. Many media surveys are based on what are called quota samples, and, although margins of error are reported from them, they do not strictly apply. Overall, nonresponse in surveys has been growing in recent years and is increasingly a consideration in the interpretation of reported results. Media stories typically do not provide the response rate, even though these can be well under 50 percent. When the results are important to you, always try to learn what the nonresponse rate is and what has been done about it. Keep Your Eye on What is Being Estimated It is common for political polls to quote a margin of error of plus or minus 3 percent. It might happen, however, that in two separate polls between Jones and Smith in the same week one might have Jones ahead by 2 percent in one poll while the other poll might have Jones ahead by 10 percent. How can this be? A misleading feature of most current media stories on political polls is that they report the margin of error associated with the proportion favoring one candidate, not the margin of error of the lead of one candidate over another. To illustrate the problem, suppose one poll finds that Mr. Jones has 45 percent support, Ms. Smith has 41 percent support, 14 percent are undecided, and there is a 3 percent margin of error for each category. If we note that Mr. Jones might have anywhere from 42 percent to 48 percent support in the voting population and Ms. Smith might have anywhere from 38 percent to 44 percent support, then it would not be terribly surprising for another poll to report anything from a 10-point lead for Mr. Jones (such as 48 percent to 38 percent) to a 2-point lead for Ms. Smith (such as 44 percent to 42 percent). In more technical terms, a law of probability dictates that the difference between two uncertain proportions (e.g., the lead of one candidate over another in a political poll in which both are estimated) has more uncertainty associated with it than either proportion alone. Accordingly, the margin of error associated with the lead of one candidate over another should be larger than the margin of error associated with a single proportion, which is what media reports typically mention (thus the need to keep your eye on what's being estimated!).
Market Intelligence Group – survey research, survey analysis www.migindia.biz
Until media organizations get their reporting practices in line with actual variation in results across political polls, a rule of thumb is to multiply the currently reported margin of error by 1.7 to obtain a more accurate estimate of the margin of error for the lead of one candidate over another. Thus, a reported 3 percent margin of error becomes about 5 percent and a reported 4 percent margin of error becomes about 7 percent when the size of the lead is being considered.

What is a survey? 56
Where Can I Get More Information There is a lot more to be said about the use of the term "margin of error." Surprisingly, there is even some controversy about its meaning. For those interested in reading more about this controversy, a Sunday, June 14, 1998, "Unconventional Wisdom" column by Richard Morin in The Washington Post may be a good start. With most polls still by telephone, there are many nonsampling error issues that could arise and overwhelm sampling error considerations like those embodied in the margin of error. Chapter 4 has more to say on these.
Market Intelligence Group – survey research, survey analysis www.migindia.biz