THESE - GMTGS · multiple regression models……………………………………… ......
84
UNIVERSITE DE SOUSSE FACULTE DE MEDECINE “Ibn El Jazzar” SOUSSE (TUNISIE) ANNEE UNIVERSITAIRE: 2012/2013 N :……. T T H H E E S S E E Pour le DIPLOME NATIONAL DE DOCTEUR EN MEDECINE Présentée et soutenue publiquement le: / /2013 Par Hél a a SELMI Née le 25 Mars 1982 à Tunis Title Spirometric “Lung Age” Estimation for North African Population Key-Words Physiology; Lung age ; Spirometry ; Reference value ; Normal limits ; Tunisia ; North Africa Jury : Directeurs de thèse : Présidente Pr. Ag. Sonia ROUATBI Pr. Ag. Helmi BEN SAAD Membres Pr. Ag. Amal NOUIRA Pr. Ag. Souhail CHATTI Dr. Houyem SAID LAATIRI Dr. Khaoula HADJ MABROUK Dr. Imen GARGOURI Invité Dr. Hmida BOUSLAH
Transcript of THESE - GMTGS · multiple regression models……………………………………… ......
UUNNIIVVEERRSSIITTEE DDEE SSOOUUSSSSEE FFAACCUULLTTEE DDEE MMEEDDEECCIINNEE ““ IIbbnn EEll JJaazzzzaarr””
SSOOUUSSSSEE ((TTUUNNIISSIIEE))
AANNNNEEEE UUNNIIVVEERRSSIITTAAIIRREE:: 22001122//22001133
NN ::…………..
TTHHEESSEE
PPoouurr llee
DDIIPPLLOOMMEE NNAATTIIOONNAALL DDEE DDOOCCTTEEUURR EENN MMEEDDEECCIINNEE
PPrréésseennttééee eett ssoouutteennuuee ppuubbll iiqquueemmeenntt llee:: // //22001133
PPaarr
HHééllaa SSEELLMMII
NNééee llee 2255 MMaarrss 11998822 àà TTuunniiss
TTiitt llee Spirometric “Lung Age” Estimation for North African
Population
KKeeyy--WWoorrddss Physiology; Lung age ; Spirometry ; Reference
value ; Normal limits ; Tunisia ; North Africa
JJuurryy:: DDiirreecctteeuurrss ddee tthhèèssee::
PPrrééssiiddeennttee PPrr.. AAgg.. SSoonniiaa RROOUUAATTBBII PPrr.. AAgg.. HHeellmmii BBEENN SSAAAADD
MMeemmbbrreess PPrr.. AAgg.. AAmmaall NNOOUUIIRRAA
PPrr.. AAgg.. SSoouuhhaaiill CCHHAATTTTII
DDrr.. HHoouuyyeemm SSAAIIDD LLAAAATTIIRRII DDrr.. KKhhaaoouullaa HHAADDJJ MMAABBRROOUUKK
DDrr.. IImmeenn GGAARRGGOOUURRII
IInnvviittéé DDrr.. HHmmiiddaa BBOOUUSSLLAAHH

AAAAbbreviationsbbreviationsbbreviationsbbreviations List of tables List of tables List of tables List of tables List ofList ofList ofList of figuresfiguresfiguresfigures
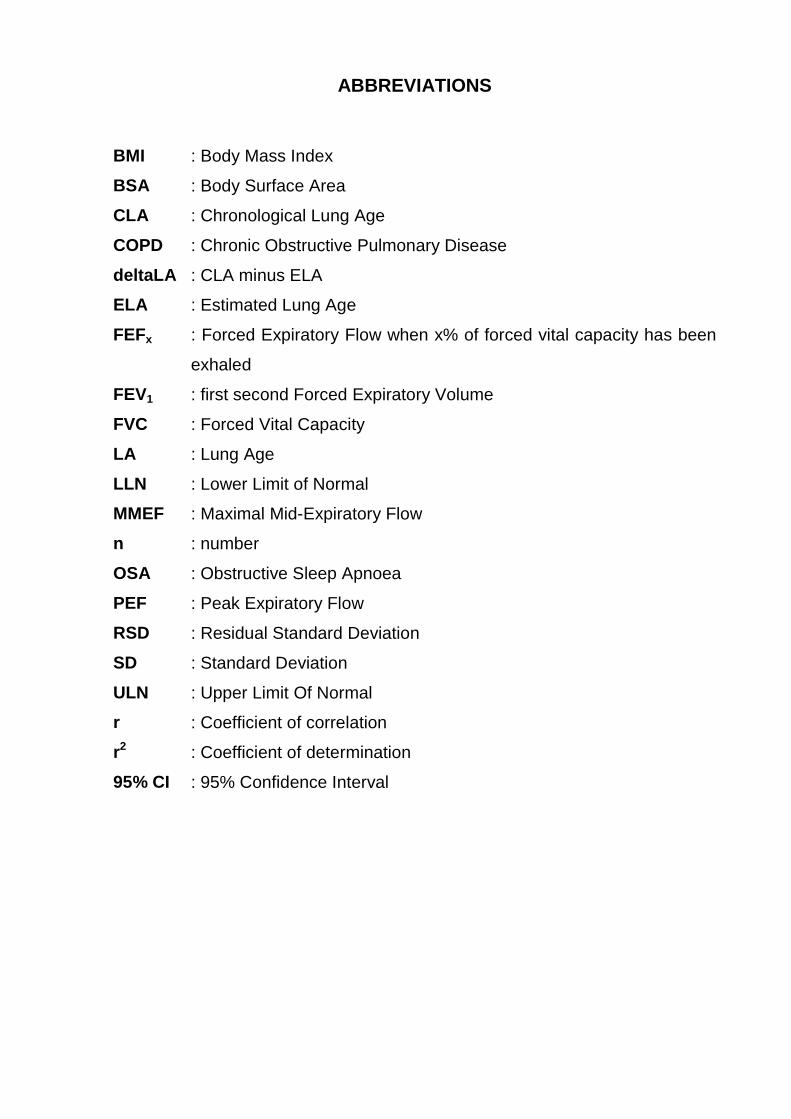
ABBREVIATIONS
BMI : Body Mass Index
BSA : Body Surface Area
CLA : Chronological Lung Age
COPD : Chronic Obstructive Pulmonary Disease
deltaLA : CLA minus ELA
ELA : Estimated Lung Age
FEFx : Forced Expiratory Flow when x% of forced vital capacity has been
exhaled
FEV1 : first second Forced Expiratory Volume
FVC : Forced Vital Capacity
LA : Lung Age
LLN : Lower Limit of Normal
MMEF : Maximal Mid-Expiratory Flow
n : number
OSA : Obstructive Sleep Apnoea
PEF : Peak Expiratory Flow
RSD : Residual Standard Deviation
SD : Standard Deviation
ULN : Upper Limit Of Normal
r : Coefficient of correlation
r2 : Coefficient of determination
95% CI : 95% Confidence Interval

LIST OF TABLES
Table n° Title Page I Anthropometric and spirometric data of groups I and II: healthy
never-smokers with normal spirometric measurements……………………………………………...………
13 II Influencing factors of the estimated lung age: linear stepwise
multiple regression models…………………………………………
15 III Univariate correlation coefficients between the estimated lung age
and subject data of group I (healthy never-smokers with normal spirometric measurements)………………………….
17 IV Influencing factors of the estimated lung age: linear stepwise
multiple regression models…………….………….………………..
19 V Simplified reference equation for the estimated lung age (ELA)……... 21
LIST OF FIGURES
Figure n° Title Page 1 The Bland and Altman representation for the group I, of
chronological lung age with estimated lung age determined from retained Tunisian reference equations in men and in women…...….
22 2 Comparison of estimated lung age determined from retained
Tunisian reference equations with chronological lung age in group II………………………………………………………………
24 3 The Bland and Altman representation for the group II, of
chronological lung age with estimated lung age determined from retained Mediterranean reference equations in men and in women………………………………………………………..…..
25 4 Difference between estimated lung age and chronological lung
age in group III with COPD………………………………….
26 5 Comparison of estimated lung age determined from Japanese
reference equations with chronological lung age in group II….
28 6 Three-step procedure for judging the abnormality of estimated
lung age in Tunisian population…………………………………..
29 7 Estimation of lung age (X) from spirometric parameter (Y)
under fixed condition of sex and height……………..…………..
34 8 Concept of novel method and formulae for estimating lung age
from measured FEV1…………………………………………
36

Plan Plan Plan Plan
Page
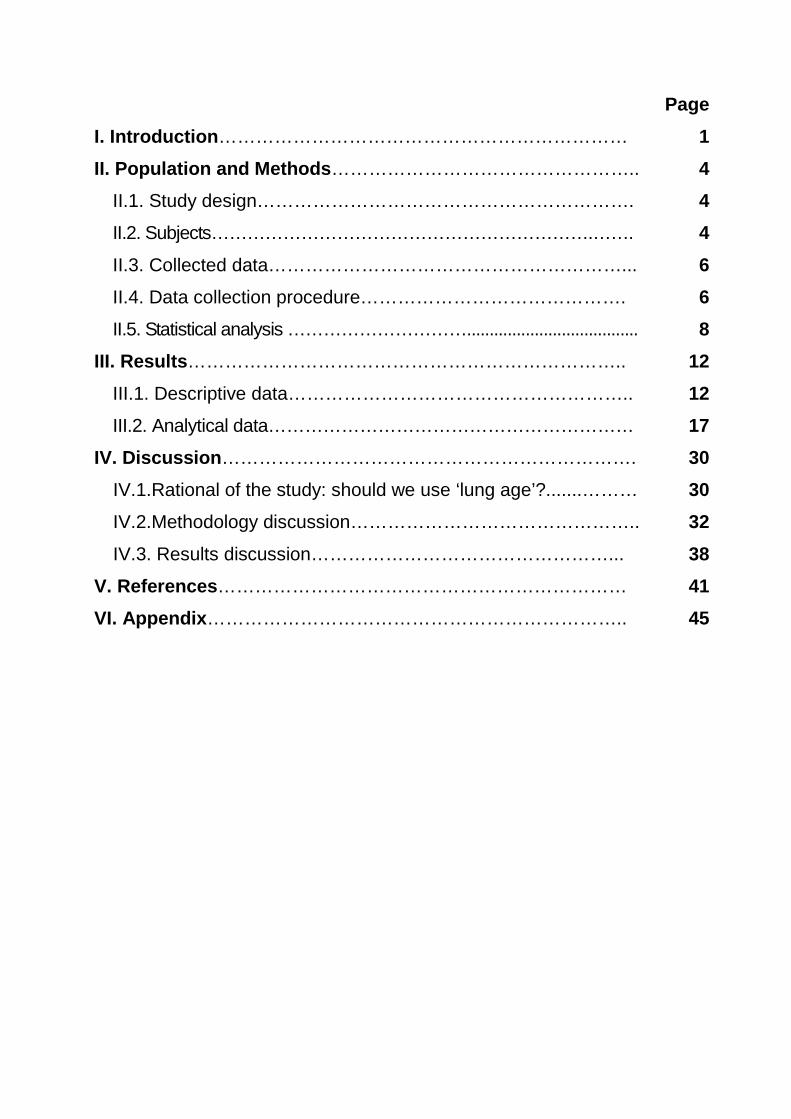
I. Introduction………………………………………………………… 1
II. Population and Methods………………………………………….. 4
II.1. Study design……………………………………………………. 4
II.2. Subjects……………………………………………………….……. 4
II.3. Collected data…………………………………………………... 6
II.4. Data collection procedure……………………………………. 6
II.5. Statistical analysis …………………………...................................... 8
III. Results…………………………………………………………….. 12
III.1. Descriptive data……………………………………………….. 12
III.2. Analytical data…………………………………………………… 17
IV. Discussion…………………………………………………………. 30
IV.1.Rational of the study: should we use ‘lung age’?.......……… 30
IV.2.Methodology discussion……………………………………….. 32
IV.3. Results discussion…………………………………………... 38
V. References………………………………………………………… 41
VI. Appendix………………………………………………………….. 45

IntroductionIntroductionIntroductionIntroduction
1
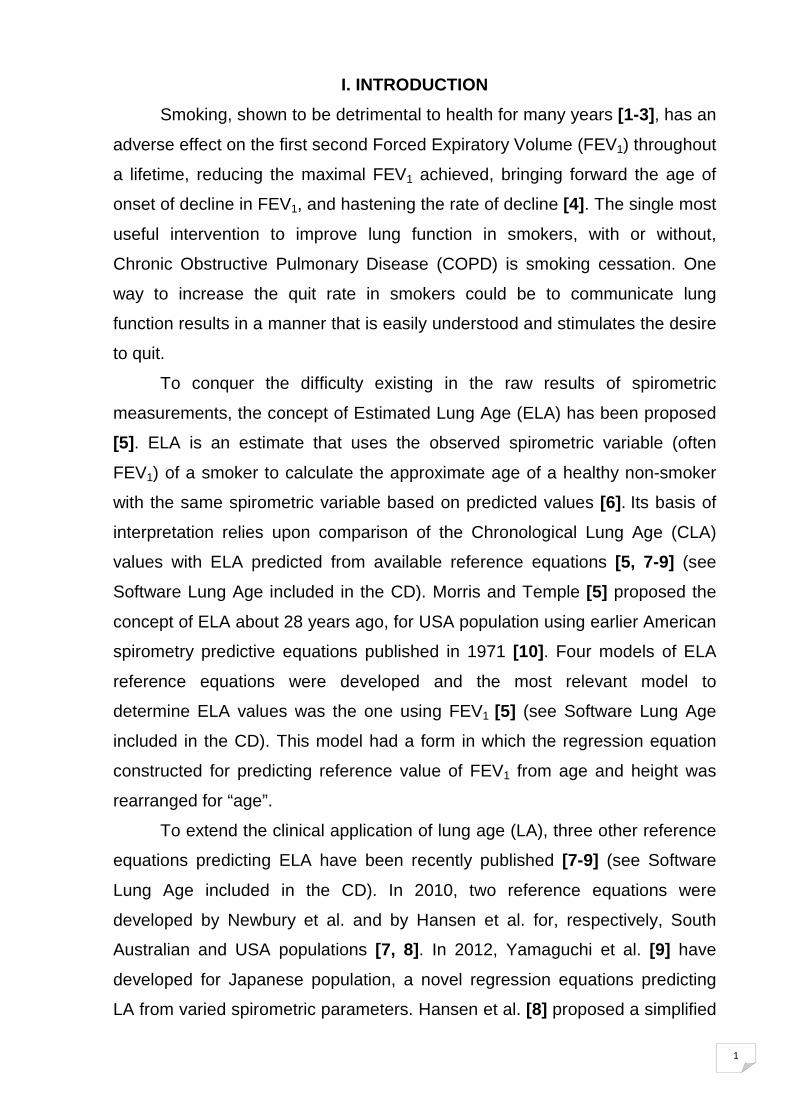
I. INTRODUCTION
Smoking, shown to be detrimental to health for many years [1-3], has an
adverse effect on the first second Forced Expiratory Volume (FEV1) throughout
a lifetime, reducing the maximal FEV1 achieved, bringing forward the age of
onset of decline in FEV1, and hastening the rate of decline [4]. The single most
useful intervention to improve lung function in smokers, with or without,
Chronic Obstructive Pulmonary Disease (COPD) is smoking cessation. One
way to increase the quit rate in smokers could be to communicate lung
function results in a manner that is easily understood and stimulates the desire
to quit.
To conquer the difficulty existing in the raw results of spirometric
measurements, the concept of Estimated Lung Age (ELA) has been proposed
[5]. ELA is an estimate that uses the observed spirometric variable (often
FEV1) of a smoker to calculate the approximate age of a healthy non-smoker
with the same spirometric variable based on predicted values [6]. Its basis of
interpretation relies upon comparison of the Chronological Lung Age (CLA)
values with ELA predicted from available reference equations [5, 7-9] (see
Software Lung Age included in the CD). Morris and Temple [5] proposed the
concept of ELA about 28 years ago, for USA population using earlier American
spirometry predictive equations published in 1971 [10]. Four models of ELA
reference equations were developed and the most relevant model to
determine ELA values was the one using FEV1 [5] (see Software Lung Age
included in the CD). This model had a form in which the regression equation
constructed for predicting reference value of FEV1 from age and height was
rearranged for “age”.
To extend the clinical application of lung age (LA), three other reference
equations predicting ELA have been recently published [7-9] (see Software
Lung Age included in the CD). In 2010, two reference equations were
developed by Newbury et al. and by Hansen et al. for, respectively, South
Australian and USA populations [7, 8]. In 2012, Yamaguchi et al. [9] have
developed for Japanese population, a novel regression equations predicting
LA from varied spirometric parameters. Hansen et al. [8] proposed a simplified
2
equation allowing its estimation from the ratio between FEV1 and Forced Vital
Capacity (FVC), the method qualitatively differing from that of Morris and
Temple [5]. Newbury et al. [7] applied the same methods described by Morris
and Temple [5] with the equations being solved for age. Yamaguchi et al. [9]
have presented a novel regression equations including various spirometric
parameters such as FVC, FEV1, FEV1/FVC ratio, Peak Expiratory Flow (PEF),
Forced Expiratory Flow when x% of FVC has been exhaled (FEFx, FEF50 and
FEF25) and Maximal Mid-Expiratory Flow (MMEF). Only two authors [5, 9]
have proposed an algorithm for judging the abnormality from spirometry ELA
with presentation of a recommended sequence to interpret ELA [5] or a
recommendation to use the Upper Limit of Normal and Lower Limit of Normal
(ULN, LLN, respectively) [9], as recommended for spirometry [11]. These four
published studies [5, 7-9] presented several limitations, previously described
in a recent work [12] (appendix): low sample size [7], sample may not be
representative of a normal population [5, 7], use of old data [5, 8], skewed age
distribution [5], use of old equipment [5, 8] and application of old spirometric
methods [7], mathematical and statistical flaws [5, 7, 8], wide variation in ELA
[7]. These methodological shortcomings explain some discrepancies in the
findings. In a previous study [12] (appendix), our team has demonstrated that
these ELA spirometric reference equations didn’t reliably predict CLA data in
540 adult’s healthy subjects representing a sample of a North African
population. We have strongly suggested that existing LA equations [5, 7-9] are
in need of review [12] (appendix).
How to evaluate "spirometric" ELA and what method is approvable? This
question was asked by some authors in 2011 [13], in order to promote the
development of ethnic-specific ELA regression equations in various races. The
need for normal values specific to North African populations has been
demonstrated for several physiological parameters [14-20]. So, the
applicability and the reliability of published ELA reference equations [5, 7-9]
should be assessed with regards to North African adult’s population, in order
to avoid erroneous clinical interpretation of ELA data in this population. In a
previous study [12] (appendix), between the four published reference
3
equations [5, 7-9], we have recommended to use, for North African population,
these presented by Yamaguchi et al. [9] for healthy Japanese subjects aged
25-87 years. Our recommendation was justified by several reasons, previously
described [12] (appendix).
Based on these backgrounds, the aims of the present study are
i) To establish the novel regression equations allowing prediction of the
reference value of ELA and its normal limits using the data harvested from a
large number of healthy Tunisian never-smokers with normal spirometric
measurements;
ii) To validate the developed equations using the data obtained from the other
group of healthy never-smokers with normal spirometry and two groups of
subjects with deteriorating pulmonary function;
iii) To compare our local ELA reference equations with those of Yamaguchi et
al. [9]; and
iv) To propose an algorithm for judging the abnormality of the ELA.
Population and Population and Population and Population and
MethodsMethodsMethodsMethods
4
II. POPULATION AND METHODS
II.1. Study design
The design and methods were previously described [12] (appendix).
We performed this cross-sectional study over one year period in two
Functional Exploration Laboratories at the Occupational Medicine Group and
at the Farhat HACHED Hospital of Sousse (altitude < 100 m), Tunisia.
Approval for the study was obtained from the Hospital Ethics Committee, and
written informed consent was obtained from all study participants.
II.2. Subjects
Four groups were recruited: group I (equation group), group II (validation
group), groups III and IV (patients’ validation groups).
Group I (equation group): healthy never-smokers with normal spirometric
measurements
Target population consists of a sample of subjects aged 19 years and
more, living in Sousse, Tunisia. Subjects were recruited from local workers
visiting the Functional Exploration Laboratory at the Occupational Medicine
Group of Sousse, or from the staff of the Faculty of Medicine and the Farhat
HACHED Hospital in Sousse, as well as acquaintances of people involved in
the study.
Subjects who declared, in the questionnaire, that they never smoked
(cigarettes and/or narghile) or having no more than incidental smoking
experience before the visit examination were selected and defined as “never-
smokers”.
Subjects were defined as “healthy” [21, 22] if they reported to have:
i) no presence of acute and no past chronic disease of the respiratory system;
ii) no major respiratory disease, such as congenital anomalies, destructive
type of pneumonia or thoracic surgery in past medical history;
iii) no systemic disease which may directly or indirectly influence the
respiratory system and general state of health (e.g. cardiovascular,
neuromuscular, skeletal or renal disease);
iv) no history of upper respiratory tract infection during three weeks prior to
investigation.
5
In addition, underweight, severe or massive obesity were applied as non
inclusion-criteria [21, 22].
“Healthy never-smokers” in whom spirometric measurements were
within normal ranges were defined as “healthy never-smokers with normal
spirometric measurements”. The spirometric normality was judged by
consulting the following criteria; FEV1, FVC, and FEV1/FVC > LLN of each
parameter.
Thus, the total of 540 participants (176 males) with age distribution
ranging between 19 and 90 years-old, who visited the two laboratories from
February 2011 to January 2012, met the criteria of “healthy never-smokers
with normal spirometric measurements”. These participants were categorized
as group I. The diverse parameters of group I were used for constructing the
novel prediction equations of LA in both sexes.
Group II (healthy subject’s validation group): healthy never-smokers with
normal spirometric measurements
Similarly, 41 participants (20 males) with age distribution in a range from
22 to 89 years-old, whom visited the two laboratories from February 2012 to
April 2012, satisfied the criteria of “healthy never-smokers with normal
spirometric measurements”, and were assigned to group II. Members of group
II, who did not overlap those of group I, were devoted to validation of the novel
prediction equations of LA in both sexes.
Group III (patients’ validation group): COPD patients
Ninety one smokers subjects’ (65 males) with age ranging from 19 to 80
years-old, visiting the Functional Exploration Laboratory at the Farhat
HACHED Hospital from February 2012 to April 2012, showing an after
bronchodilator FEV1/FVC less than 0.70, satisfied the criteria of COPD [23].
These participants were allocated to group III and used for certifying
whether the newly developed equations would reliably detect the abnormal LA
in subjects with COPD.
6
Group IV (patient’s validation group): obstructive sleep apnoea (OSA)
patients
Sixty severe OSA patients’ (42 males; apnoea hypopnoea index >
30/hour) with age ranging from 26 to 70 years-old, were addressed to the
Functional Exploration Laboratory at the Farhat HACHED Hospital from
February 2012 to April 2012, for spirometry and 6-minute walk test.
These participants were allocated to group IV and used for certifying
whether the newly developed equations would reliably detect the abnormal LA
in subjects with severe OSA.
II.3. Collected data
The dependent variable was CLA, and the independent variables were:
sex (male, female), anthropometric data (age, weight, height, Body Mass
Index (BMI), Body Surface Area (BSA)), parity, spirometric data (FVC, FEV1,
PEF, MMEF, FEFx, FEV1/FVC ratio), ELAs from the published studies [5, 7-9].
The study protocol was as following: welcome and provision of an
information sheet; completion of a medical questionnaire, and anthropometric
and spirometric measurements.
II.4. Data collection procedure
II.4.1. Medical questionnaire, tobacco use evaluation
Data were collected using a simplified non-validated version of a
medical questionnaire recommended for epidemiological research [24]. It was
composed of questions (mainly closed questions, usually dichotomous) put to
the subjects in local Arabic dialect. It was used to assess subject
characteristics (cigarettes smoking and narghile use [25-27], medical, surgical,
and gynecologic-obstetric histories and medication use).
II.4.2. Measurement technique and applied definition
II.4.2.1. Anthropometric measurements and parity
The decimal age (accuracy to 0.1 years) was calculated from the date of
measurement and the date of birth [28]. Due to the failure of software to
compute decimal age as the difference between test date and birth date, age
was taken as the number of complete years from birth to the date of the study.
7
Standing height and weight were measured using a stadiometer and
expressed to the nearest centimeter and kilogram, respectively.
Depending on calculated BMI (kg/m2), we distinguished between [29]:
underweight (BMI < 18.5), normal weight (18.5 ≤ BMI <25), overweight (25 ≤
BMI < 30) and obesity (BMI ≥ 30). The latter was either moderate (30 < BMI
<35), or severe (35 ≤ BMI <40), or massive (BMI ≥ 40).
BSA was calculated [30].
Parity referred to the number of offspring [19].
II.4.2.2. Spirometry measurements
Spirometry was carried out in the sitting position, and a nose clip was
applied. To avoid the problem of variability due to different technicians and
devices [31], all tests were performed, between 9.00 am and 1.00 pm, by only
two qualified persons (one person at each laboratory).
All subjects performed spirometry on a modern equipment [gold
standard uni-directional digital volume transducer (Micro Medical Limited. PO
Box 6, Rochester. Kent ME1 2AZ England)]. The Spida 5 software was used.
The flow sensor of the spirometer was calibrated daily with a 3-liter syringe, to
ensure performance. Spirometric data were expressed at “body temperature,
barometric pressure saturated with water vapor” [31-33].
Spirometry was performed according to the international
recommendations [31]. The subject was seated comfortably and he/she was
instructed to take a full breath in, he/she could close the lips around the mouth
piece and blow out as hard and fast as possible. Inspiration should be full and
unhurried, and expiration tested should be continued without pause. In order to
obtain maximal FVC, subject was verbally encouraged to exhale as longer as
possible. The FVC maneuver was considered well done if there was transient,
maximal respiratory effort with no artefacts during the first second of the forced
expiration, and if there was no premature termination (sharp decrease of
expiratory flow). The objectives end of test criteria used to identify a
reasonable FVC effort were [31]:
i) The subject cannot continue further exhalation.
8
ii) The volume-time curve shows no change in volume (<0.025 L) for ≥1 s, and
the subject has tried to exhale for ≥ 6 seconds. The spirometric data (FVC (l);
FEV1 (l); FEFx (l/s), PEF (l/s), FEV1/FVC ratio (absolute value)) were
expressed at “body temperature, barometric pressure saturated with water
vapor” [31-33]. A minimum of three reproducible FVC measurements were
obtained [31]. FVC and FEV1 of the best 2 of the 3 selected measurements
should not vary by more than 150 ml. The highest FVC and the highest FEV1
were computed, even if the 2 values did not come from the same curve [31].
LLN for spirometric data were calculated from the local spirometric norms [17-
19]. Any observed value for FEV1, FVC and FEV1/FVC ratio lower than its
corresponding LLN was considered abnormal.
The reversibility test was applied only to group III comprising COPD
patient. It comprises the following steps [23, 34, 35]:
i) Patients first completed three acceptable FVC maneuvers and
ii) After gentle and incomplete expiration, a dose of 100 µg of short-acting β2-
agonists (Salbutamol®) was then inhaled in one breath to total lung capacity
with a valve spacer device. The breath was held for 5-10 s before the subjects
could exhale. Four separate doses (total dose 400 µg) were delivered at 30-s
intervals.
iii) Spirometric measurements were recorded ≥ 15 min and up to 20 minutes
later, using the same procedures, number of maneuvers, and repeatability and
end of testing criteria as for before the use of Salbutamol®.
The recent international classification of severity of airflow obstruction in
COPD, based on post-bronchodilator FEV1% (measured post-bronchodilator
FEV1/predicted FEV1), was applied [23]: grade I (mild): FEV1 > 80%; grade II
(moderate): 50% ≤ FEV1 < 80%; grade III (severe): 30% ≤ FEV1 < 50%; grade
IV (very severe): FEV1 < 30%.
II.5. Statistical analysis
II.5.1. Expression modes of results
The Kolmogorov-Smirnov test was used to analyze distribution of
variables [36]. When the distribution was normal and the variances were
equal, the results were expressed by their mean±Standard Deviation (SD) and

9
95% Confidence Interval (95% CI). If the distribution wasn’t normal, the results
were expressed by their median (1st-3rd quartiles). The chi-2 test was used to
compare percentages.
Preliminary descriptive analysis included frequencies for categorical
variables (sex) and mean±SD or median (1st-3rd quartiles) for continuous ones
(anthropometric and spirometric data).
II.5.2. Univariate and multiple regression analysis: influencing factors of
ELA
The dependent variable (CLA) was normally distributed.
T-tests were used to evaluate the associations between CLA and
categorical variables (sex) and the Pearson product-moment correlation
coefficients (r) and determination coefficient (r2) evaluated the associations
between CLA and continuous measures [height, age, weight, BMI, BSA,
spirometric data expressed in absolute values].
The linearity of the association between the CLA and the continuous
measures was checked graphically (scatterplots) by plotting each regressor
against CLA.
Only significantly and linearly associated variables were entered into the
model. A linear regression model was used to evaluate the independent
variables explaining the variance in CLA. Candidate variables were stepped
into the model with a stepwise selection method. To determine entry and
removal from the model, significance levels of 0.15 and 0.05 were used,
respectively. No colinearity between predictors was detected with variance
inflation factors.
The method was well exposed by Yamaguchi et al. [9]. The implicit
assumption in the original method of Morris and Temple [5] is that LA is
expressed by a linear function of FEV1 and height, the latter of which works as
the factor supplementing the influence of anthropometric difference on FEV1.
However, other anthropometric data (such as sex, weight, BSA, BMI, parity)
and spirometric parameters may provide the useful information on ELA, as
well). We, therefore, hypothesized that CLA (dependent variable) would be
predicted from a function including anthropometric data (sex (0. Male; 1.
10
Female), height (m), weight (kg), BMI (kg/m2), BSA (m2), parity (numerical))
and various spirometric parameters as independent variables and defined it as
ELA (box 1).
Box 1. Equation (1)
ELA (years) = a0 + a1 x Sex + a2 x Height + a3 x Weight + a4 x BMI + a5 x BSA + a6 x FVC + a7 x
FEV1 + a8 x FEV1/FVC ratio + a9 x PEF + a10 x MMEF + a11 x FEF25 + a12 x FEF50 + a13 x FEF75
In the Equation (1), ai (i = 1-13) is the partial regression coefficient for a
particular explanatory variable, while a0 is the invariable constant.
II.5.3. ELA simplified reference equations
Due to the inadequacy of the published equations [12] (appendix) and for
practical reasons, daily interpretation especially in patients screening, a
reference equation should include only data which can be easily measured
and are significantly associated with ELA. Therefore, we established using
FEV1 and previously significant anthropometric data as predictors of ELA in
another stepwise linear regression model (box 2).
Box 1. Equation (2)
ELA (years) = a0 + a1 x Sex + a2 x Height + a3 x Weight + a4 x BMI + a5 x BSA + a6 x FEV1
In the Equation (2), ai (i = 1-6) is the partial regression coefficient for a
particular explanatory variable, while a0 is the invariable constant.
The normal limits, i.e., ULN and LLN for the disparity between ELA and
CLA, defined as deltaLA (CLA minus ELA), was evaluated with the
standardized residual called Z-score [36, 37]. The ULN and LLN were
assumed to be equal to 95th and 5th percentiles of Z distribution, corresponding
to Z-scores of ±1.64, respectively [95% CI = 1.64 x Residual Standard
Deviation (RSD)).
II.5.4. Validation of prediction equations
Since the concept of LA is lacking in the physiological basis, the equation
(2) should be taken as the empirical one and needs the validation concerning
its applicability to prediction of ELA. We, therefore, calculated ELA of groups I
and II subjects with normal spirometric measurements and that of groups III
and IV subjects with COPD and severe OSA by applying the regression
equations constructed on the ground of equation (2).
11
CLAs were compared with ELAs calculated from the retained reference
equation (equation (2)) in many ways:
i) A non parametric test (Wilcoxon matched pairs test) was used to compare
ELA vs. CLA for males, females and the total sample of groups I-IV
ii) As proposed by Bland and Altman [38], comparisons between CLA and
ELA, of groups I and II, were performed by means of the limits of agreement,
where deltaLA were plotted against the corresponding mean value. From
these data, limits of agreement were then calculated (mean deltaLA ± 1.96
SD) [38].
iii) CLA values of group II were compared with ELA using scatterplots and
paired T-tests,
iv) Determination of the number (relative frequency) of subjects of groups II-IV,
in whom the ELA exceeded its ULN.
v) The difference between the four COPD grades was judged in terms of the
one-way ANOVA followed by the multiple comparison of the Turkey test.
II.5.5. Comparison of the ELA reference equations of Japanese
population
Yamaguchi et al. [9] have developed two reference equation models (box
3) for the Japanese population aged 25-87 years (see Software Lung Age
included in the CD).
Box 3. Reference equations models developed by Yamaguchi et al. [9]
For males, ELA (year) = 209.195 - 0.455 x Height (cm) - 11.521 x FEV1 (l) - 0.602 x FEV1/FVC (%) +
1.956 x FEF50 (l/s). ULN and LLN: ±13.4 years.
For females, ELA (years) = 234.441 - 0.792 x Height (cm) - 7.295 x FEV1 (l) - 0.610 x·FEV1/FVC (%)
+ 0.301 x PEF (l/s) + 2.647 x FEF50 (l/s). ULN and LLN: ±15.0 Yrs
CLAs of the group II were compared with ELAs calculated from the
Japanese reference equation [9] in two ways:
i) CLA values, for males and females, were compared with ELA using
scatterplots and paired T-tests,
ii) Determination of the number of subjects in whom the ELA exceeded its
ULN.
Analyses were carried out using Statistica software (Statistica Kernel
version 6; StatSoft, Paris, France). Significance was set at the 0.05 level.

RRRResultesultesultesultssss
12
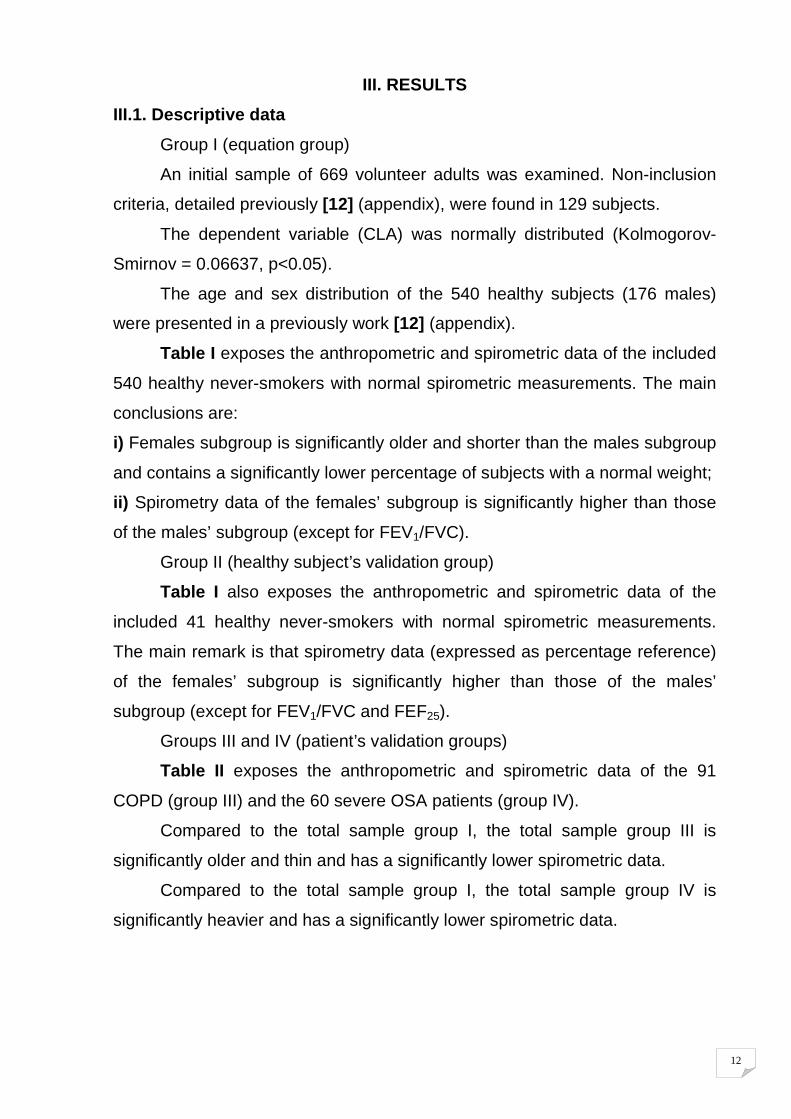
III. RESULTS
III.1. Descriptive data
Group I (equation group)
An initial sample of 669 volunteer adults was examined. Non-inclusion
criteria, detailed previously [12] (appendix), were found in 129 subjects.
The dependent variable (CLA) was normally distributed (Kolmogorov-
Smirnov = 0.06637, p<0.05).
The age and sex distribution of the 540 healthy subjects (176 males)
were presented in a previously work [12] (appendix).
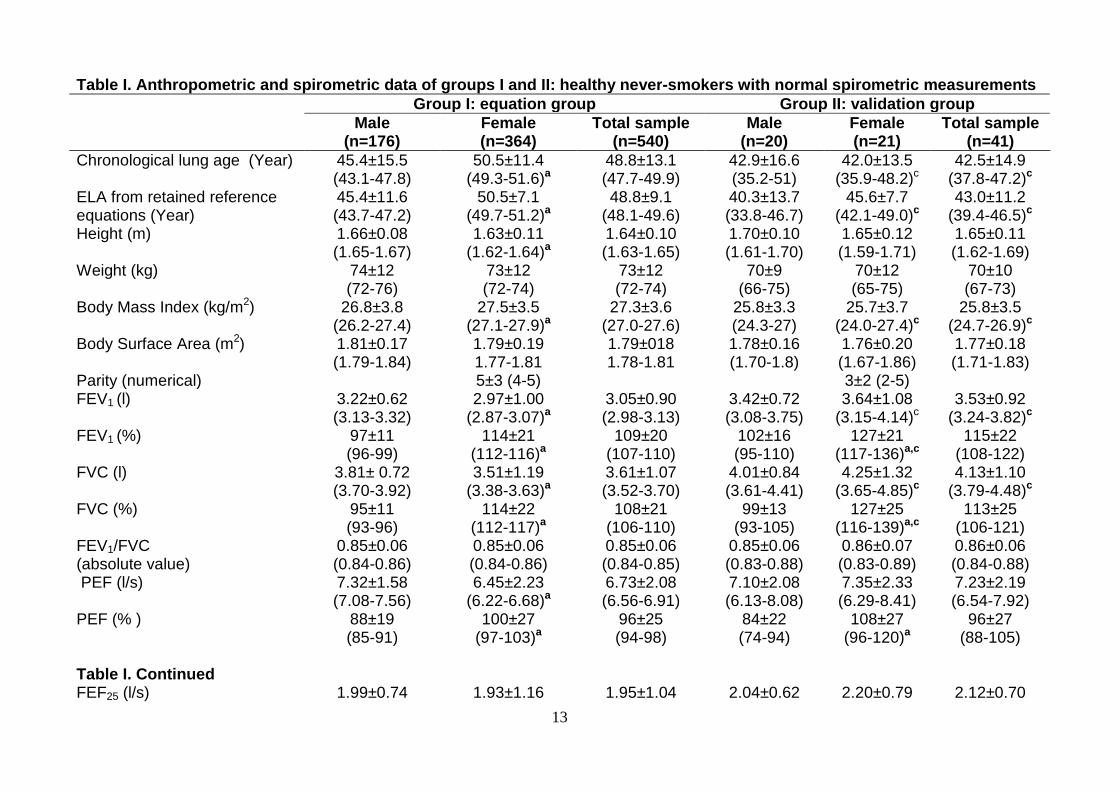
Table I exposes the anthropometric and spirometric data of the included
540 healthy never-smokers with normal spirometric measurements. The main
conclusions are:
i) Females subgroup is significantly older and shorter than the males subgroup
and contains a significantly lower percentage of subjects with a normal weight;
ii) Spirometry data of the females’ subgroup is significantly higher than those
of the males’ subgroup (except for FEV1/FVC).
Group II (healthy subject’s validation group)
Table I also exposes the anthropometric and spirometric data of the
included 41 healthy never-smokers with normal spirometric measurements.
The main remark is that spirometry data (expressed as percentage reference)
of the females’ subgroup is significantly higher than those of the males’
subgroup (except for FEV1/FVC and FEF25).
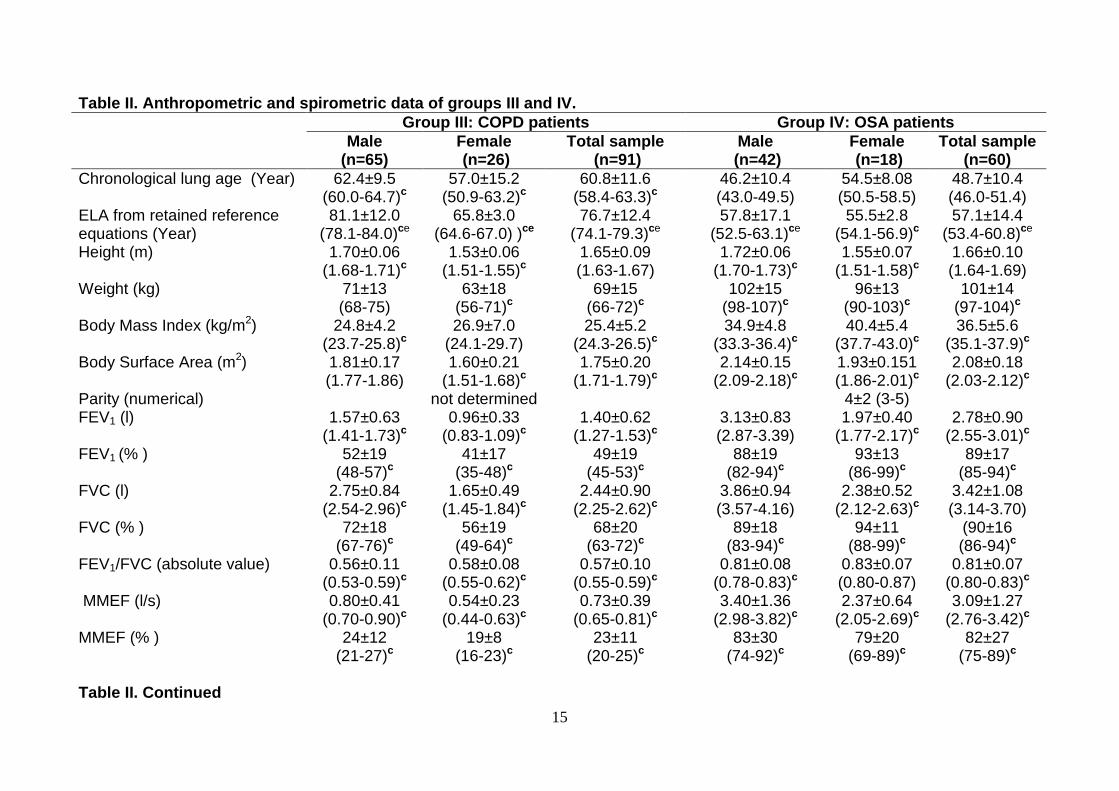
Groups III and IV (patient’s validation groups)
Table II exposes the anthropometric and spirometric data of the 91
COPD (group III) and the 60 severe OSA patients (group IV).
Compared to the total sample group I, the total sample group III is
significantly older and thin and has a significantly lower spirometric data.
Compared to the total sample group I, the total sample group IV is
significantly heavier and has a significantly lower spirometric data.
13
Table I. Anthropometric and spirometric data of groups I and II: healthy never-smokers with normal spirometric measurements Group I: equation group Group II: validation group
Male (n=176)
Female (n=364)
Total sample (n=540)
Male (n=20)
Female (n=21)
Total sample (n=41)
Chronological lung age (Year) 45.4±15.5 (43.1-47.8)
50.5±11.4 (49.3-51.6)a
48.8±13.1 (47.7-49.9)
42.9±16.6 (35.2-51)
42.0±13.5 (35.9-48.2)c
42.5±14.9 (37.8-47.2)c
ELA from retained reference equations (Year)
45.4±11.6 (43.7-47.2)
50.5±7.1 (49.7-51.2)a
48.8±9.1 (48.1-49.6)
40.3±13.7 (33.8-46.7)
45.6±7.7 (42.1-49.0)c
43.0±11.2 (39.4-46.5)c
Height (m) 1.66±0.08 (1.65-1.67)
1.63±0.11 (1.62-1.64)a
1.64±0.10 (1.63-1.65)
1.70±0.10 (1.61-1.70)
1.65±0.12 (1.59-1.71)
1.65±0.11 (1.62-1.69)
Weight (kg) 74±12 (72-76)
73±12 (72-74)
73±12 (72-74)
70±9 (66-75)
70±12 (65-75)
70±10 (67-73)
Body Mass Index (kg/m2) 26.8±3.8 (26.2-27.4)
27.5±3.5 (27.1-27.9)a
27.3±3.6 (27.0-27.6)
25.8±3.3 (24.3-27)
25.7±3.7 (24.0-27.4)c
25.8±3.5 (24.7-26.9)c
Body Surface Area (m2) 1.81±0.17 (1.79-1.84)
1.79±0.19 1.77-1.81
1.79±018 1.78-1.81
1.78±0.16 (1.70-1.8)
1.76±0.20 (1.67-1.86)
1.77±0.18 (1.71-1.83)
Parity (numerical) 5±3 (4-5) 3±2 (2-5) FEV1 (l) 3.22±0.62
(3.13-3.32) 2.97±1.00
(2.87-3.07)a 3.05±0.90 (2.98-3.13)
3.42±0.72 (3.08-3.75)
3.64±1.08 (3.15-4.14)c
3.53±0.92 (3.24-3.82)c
FEV1 (%) 97±11 (96-99)
114±21 (112-116)a
109±20 (107-110)
102±16 (95-110)
127±21 (117-136)a,c
115±22 (108-122)
FVC (l) 3.81± 0.72 (3.70-3.92)
3.51±1.19 (3.38-3.63)a
3.61±1.07 (3.52-3.70)
4.01±0.84 (3.61-4.41)
4.25±1.32 (3.65-4.85)c
4.13±1.10 (3.79-4.48)c
FVC (%) 95±11 (93-96)
114±22 (112-117)a
108±21 (106-110)
99±13 (93-105)
127±25 (116-139)a,c
113±25 (106-121)
FEV1/FVC (absolute value)
0.85±0.06 (0.84-0.86)
0.85±0.06 (0.84-0.86)
0.85±0.06 (0.84-0.85)
0.85±0.06 (0.83-0.88)
0.86±0.07 (0.83-0.89)
0.86±0.06 (0.84-0.88)
PEF (l/s) 7.32±1.58 (7.08-7.56)
6.45±2.23 (6.22-6.68)a
6.73±2.08 (6.56-6.91)
7.10±2.08 (6.13-8.08)
7.35±2.33 (6.29-8.41)
7.23±2.19 (6.54-7.92)
PEF (% ) 88±19 (85-91)
100±27 (97-103)a
96±25 (94-98)
84±22 (74-94)
108±27 (96-120)a
96±27 (88-105)
Table I. Continued
FEF25 (l/s) 1.99±0.74 1.93±1.16 1.95±1.04 2.04±0.62 2.20 ±0.79 2.12±0.70
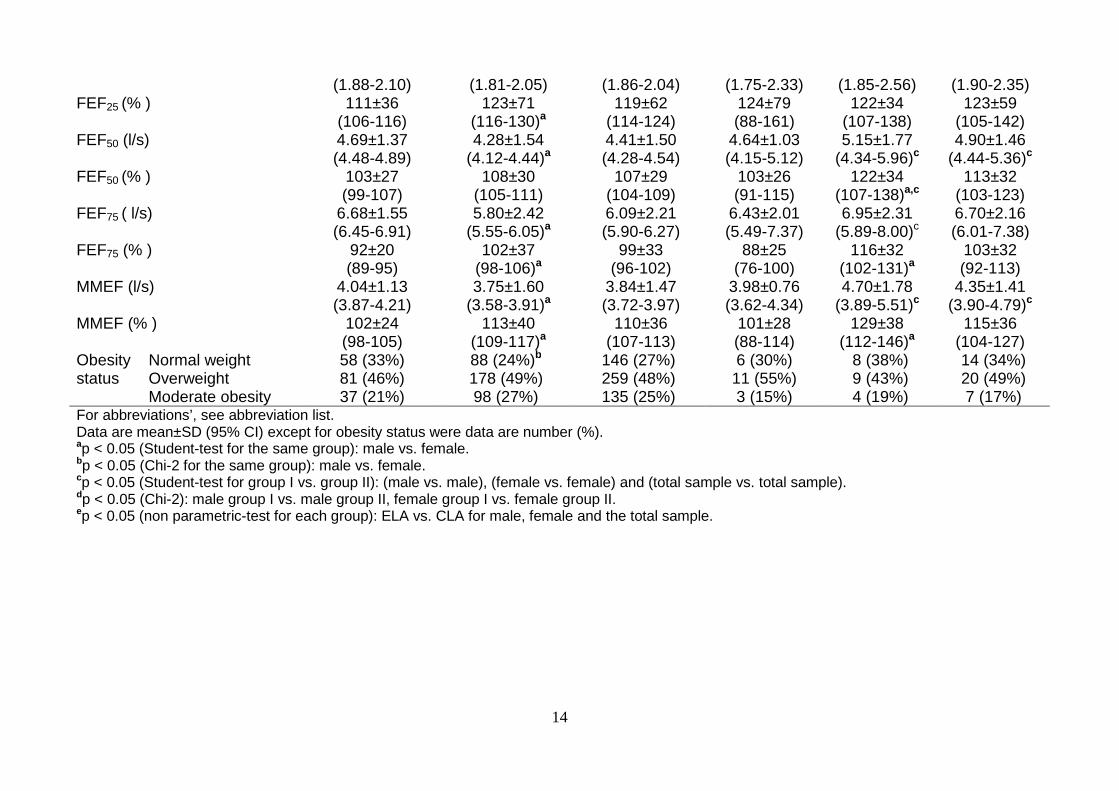
14
(1.88-2.10) (1.81-2.05) (1.86-2.04) (1.75-2.33) (1.85-2.56) (1.90-2.35) FEF25 (% ) 111±36
(106-116) 123±71
(116-130)a 119±62
(114-124) 124±79 (88-161)
122±34 (107-138)
123±59 (105-142)
FEF50 (l/s) 4.69±1.37 (4.48-4.89)
4.28±1.54 (4.12-4.44)a
4.41±1.50 (4.28-4.54)
4.64±1.03 (4.15-5.12)
5.15±1.77 (4.34-5.96)c
4.90±1.46 (4.44-5.36)c
FEF50 (% ) 103±27 (99-107)
108±30 (105-111)
107±29 (104-109)
103±26 (91-115)
122±34 (107-138)a,c
113±32 (103-123)
FEF75 ( l/s) 6.68±1.55 (6.45-6.91)
5.80±2.42 (5.55-6.05)a
6.09±2.21 (5.90-6.27)
6.43±2.01 (5.49-7.37)
6.95±2.31 (5.89-8.00)c
6.70±2.16 (6.01-7.38)
FEF75 (% ) 92±20 (89-95)
102±37 (98-106)a
99±33 (96-102)
88±25 (76-100)
116±32 (102-131)a
103±32 (92-113)
MMEF (l/s) 4.04±1.13 (3.87-4.21)
3.75±1.60 (3.58-3.91)a
3.84±1.47 (3.72-3.97)
3.98±0.76 (3.62-4.34)
4.70±1.78 (3.89-5.51)c
4.35±1.41 (3.90-4.79)c
MMEF (% ) 102±24 (98-105)
113±40 (109-117)a
110±36 (107-113)
101±28 (88-114)
129±38 (112-146)a
115±36 (104-127)
Obesity status
Normal weight 58 (33%) 88 (24%)b 146 (27%) 6 (30%) 8 (38%) 14 (34%) Overweight 81 (46%) 178 (49%) 259 (48%) 11 (55%) 9 (43%) 20 (49%) Moderate obesity 37 (21%) 98 (27%) 135 (25%) 3 (15%) 4 (19%) 7 (17%)
For abbreviations’, see abbreviation list. Data are mean±SD (95% CI) except for obesity status were data are number (%). ap < 0.05 (Student-test for the same group): male vs. female. bp < 0.05 (Chi-2 for the same group): male vs. female. cp < 0.05 (Student-test for group I vs. group II): (male vs. male), (female vs. female) and (total sample vs. total sample). dp < 0.05 (Chi-2): male group I vs. male group II, female group I vs. female group II. ep < 0.05 (non parametric-test for each group): ELA vs. CLA for male, female and the total sample.
15
Table II. Anthropometric and spirometric data of groups III and IV. Group III: COPD patients Group IV: OSA patients
Male (n=65)
Female (n=26)
Total sample (n=91)
Male (n=42)
Female (n=18)
Total sample (n=60)
Chronological lung age (Year) 62.4±9.5 (60.0-64.7)c
57.0±15.2 (50.9-63.2)c
60.8±11.6 (58.4-63.3)c
46.2±10.4 (43.0-49.5)
54.5±8.08 (50.5-58.5)
48.7±10.4 (46.0-51.4)
ELA from retained reference equations (Year)
81.1±12.0 (78.1-84.0)ce
65.8±3.0 (64.6-67.0) )ce
76.7±12.4 (74.1-79.3)ce
57.8±17.1 (52.5-63.1)ce
55.5±2.8 (54.1-56.9)c
57.1±14.4 (53.4-60.8)ce
Height (m) 1.70±0.06 (1.68-1.71)c
1.53±0.06 (1.51-1.55)c
1.65±0.09 (1.63-1.67)
1.72±0.06 (1.70-1.73)c
1.55±0.07 (1.51-1.58)c
1.66±0.10 (1.64-1.69)
Weight (kg) 71±13 (68-75)
63±18 (56-71)c
69±15 (66-72)c
102±15 (98-107)c
96±13 (90-103)c
101±14 (97-104)c
Body Mass Index (kg/m2) 24.8±4.2 (23.7-25.8)c
26.9±7.0 (24.1-29.7)
25.4±5.2 (24.3-26.5)c
34.9±4.8 (33.3-36.4)c
40.4±5.4 (37.7-43.0)c
36.5±5.6 (35.1-37.9)c
Body Surface Area (m2) 1.81±0.17 (1.77-1.86)
1.60±0.21 (1.51-1.68)c
1.75±0.20 (1.71-1.79)c
2.14±0.15 (2.09-2.18)c
1.93±0.151 (1.86-2.01)c
2.08±0.18 (2.03-2.12)c
Parity (numerical) not determined 4±2 (3-5) FEV1 (l) 1.57±0.63
(1.41-1.73)c 0.96±0.33
(0.83-1.09)c 1.40±0.62
(1.27-1.53)c 3.13±0.83 (2.87-3.39)
1.97±0.40 (1.77-2.17)c
2.78±0.90 (2.55-3.01)c
FEV1 (% ) 52±19 (48-57)c
41±17 (35-48)c
49±19 (45-53)c
88±19 (82-94)c
93±13 (86-99)c
89±17 (85-94)c
FVC (l) 2.75±0.84 (2.54-2.96)c
1.65±0.49 (1.45-1.84)c
2.44±0.90 (2.25-2.62)c
3.86±0.94 (3.57-4.16)
2.38±0.52 (2.12-2.63)c
3.42±1.08 (3.14-3.70)
FVC (% ) 72±18 (67-76)c
56±19 (49-64)c
68±20 (63-72)c
89±18 (83-94)c
94±11 (88-99)c
(90±16 (86-94)c
FEV1/FVC (absolute value) 0.56±0.11 (0.53-0.59)c
0.58±0.08 (0.55-0.62)c
0.57±0.10 (0.55-0.59)c
0.81±0.08 (0.78-0.83)c
0.83±0.07 (0.80-0.87)
0.81±0.07 (0.80-0.83)c
MMEF (l/s) 0.80±0.41 (0.70-0.90)c
0.54±0.23 (0.44-0.63)c
0.73±0.39 (0.65-0.81)c
3.40±1.36 (2.98-3.82)c
2.37±0.64 (2.05-2.69)c
3.09±1.27 (2.76-3.42)c
MMEF (% ) 24±12 (21-27)c
19±8 (16-23)c
23±11 (20-25)c
83±30 (74-92)c
79±20 (69-89)c
82±27 (75-89)c
Table II. Continued
16
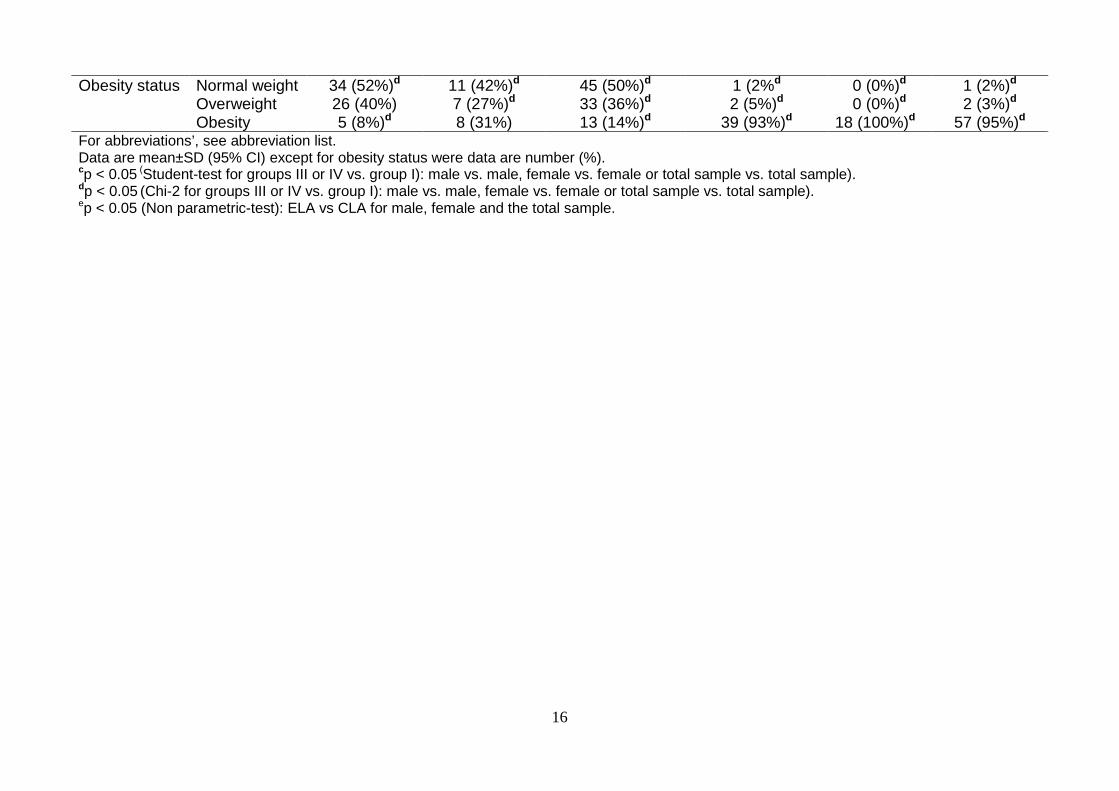
Obesity status Normal weight 34 (52%)d 11 (42%)d 45 (50%)d 1 (2%d 0 (0%)d 1 (2%)d Overweight 26 (40%) 7 (27%)d 33 (36%)d 2 (5%)d 0 (0%)d 2 (3%)d Obesity 5 (8%)d 8 (31%) 13 (14%)d 39 (93%)d 18 (100%)d 57 (95%)d
For abbreviations’, see abbreviation list. Data are mean±SD (95% CI) except for obesity status were data are number (%). cp < 0.05 (Student-test for groups III or IV vs. group I): male vs. male, female vs. female or total sample vs. total sample). dp < 0.05 (Chi-2 for groups III or IV vs. group I): male vs. male, female vs. female or total sample vs. total sample). ep < 0.05 (Non parametric-test): ELA vs CLA for male, female and the total sample.
17
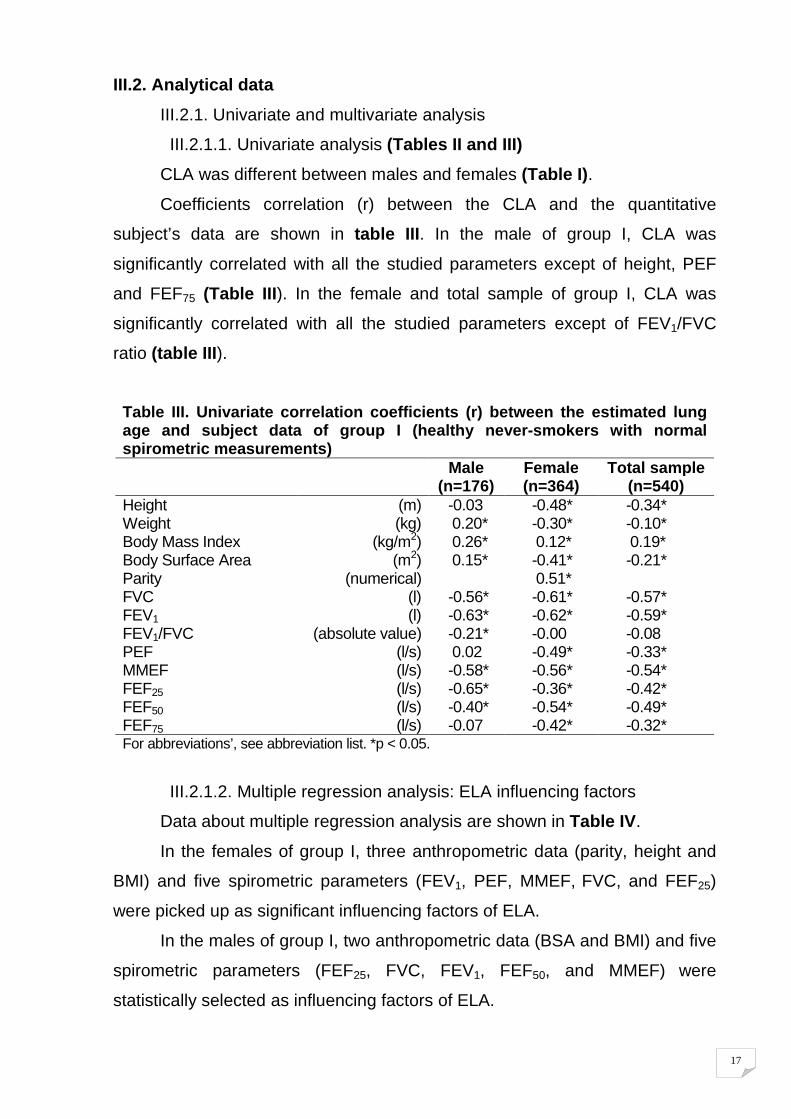
III.2. Analytical data
III.2.1. Univariate and multivariate analysis
III.2.1.1. Univariate analysis (Tables II and III)
CLA was different between males and females (Table I).
Coefficients correlation (r) between the CLA and the quantitative
subject’s data are shown in table III. In the male of group I, CLA was
significantly correlated with all the studied parameters except of height, PEF
and FEF75 (Table III). In the female and total sample of group I, CLA was
significantly correlated with all the studied parameters except of FEV1/FVC
ratio (table III).
Table III. Univariate correlation coefficients (r) between the estimated lung age and subject data of group I (healthy never-smokers with normal spirometric measurements) Male
(n=176) Female (n=364)
Total sample (n=540)
Height (m) -0.03 -0.48* -0.34* Weight (kg) 0.20* -0.30* -0.10* Body Mass Index (kg/m2) 0.26* 0.12* 0.19* Body Surface Area (m2) 0.15* -0.41* -0.21* Parity (numerical) 0.51* FVC (l) -0.56* -0.61* -0.57* FEV1 (l) -0.63* -0.62* -0.59* FEV1/FVC (absolute value) -0.21* -0.00 -0.08 PEF (l/s) 0.02 -0.49* -0.33* MMEF (l/s) -0.58* -0.56* -0.54* FEF25 (l/s) -0.65* -0.36* -0.42* FEF50 (l/s) -0.40* -0.54* -0.49* FEF75 (l/s) -0.07 -0.42* -0.32* For abbreviations’, see abbreviation list. *p < 0.05.
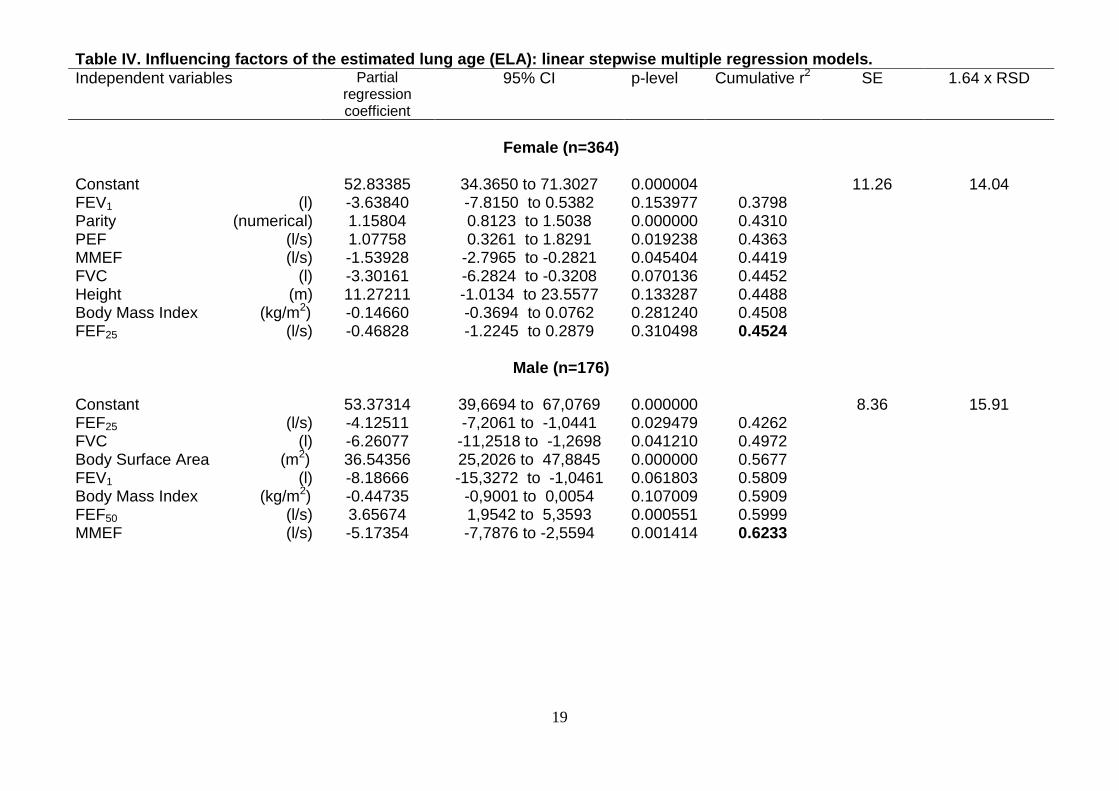
III.2.1.2. Multiple regression analysis: ELA influencing factors
Data about multiple regression analysis are shown in Table IV.
In the females of group I, three anthropometric data (parity, height and
BMI) and five spirometric parameters (FEV1, PEF, MMEF, FVC, and FEF25)
were picked up as significant influencing factors of ELA.
In the males of group I, two anthropometric data (BSA and BMI) and five
spirometric parameters (FEF25, FVC, FEV1, FEF50, and MMEF) were
statistically selected as influencing factors of ELA.
18
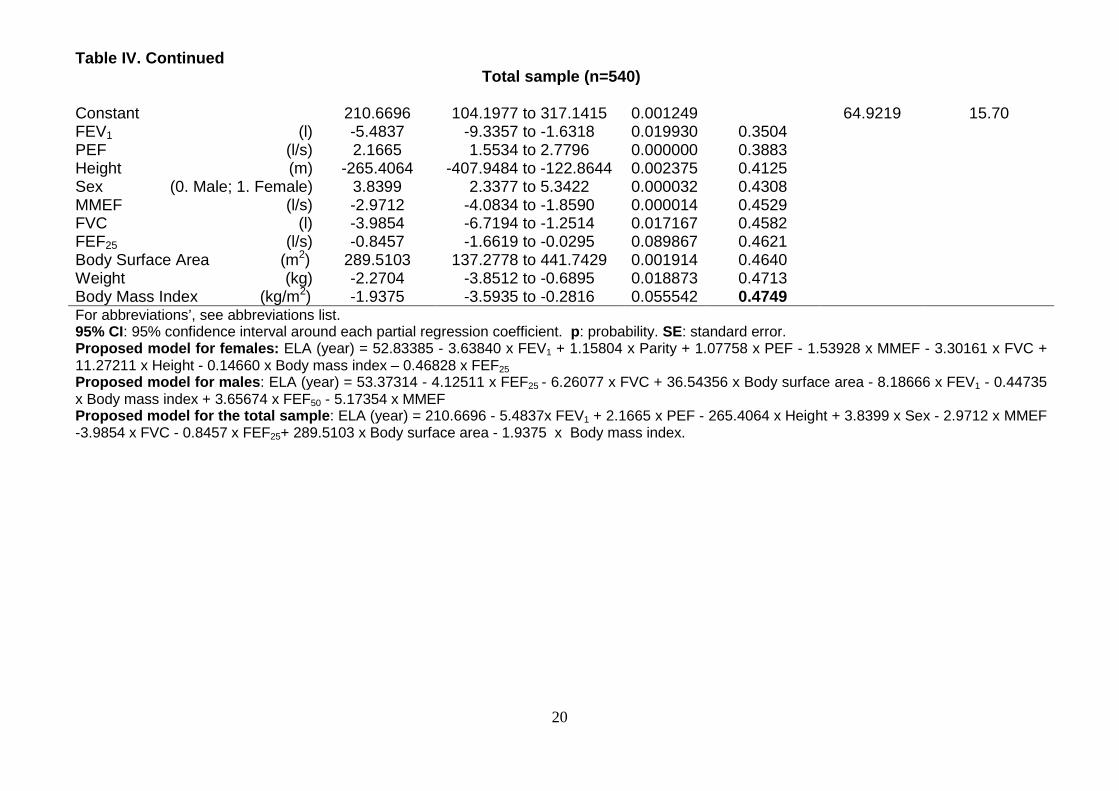
In the total sample of group I, five anthropometric data (height, sex,
BSA, weight and BMI) and five spirometric parameters (FEV1, PEF, MMEF,
FVC and FEF25) were statistically selected as influencing factors of ELA.
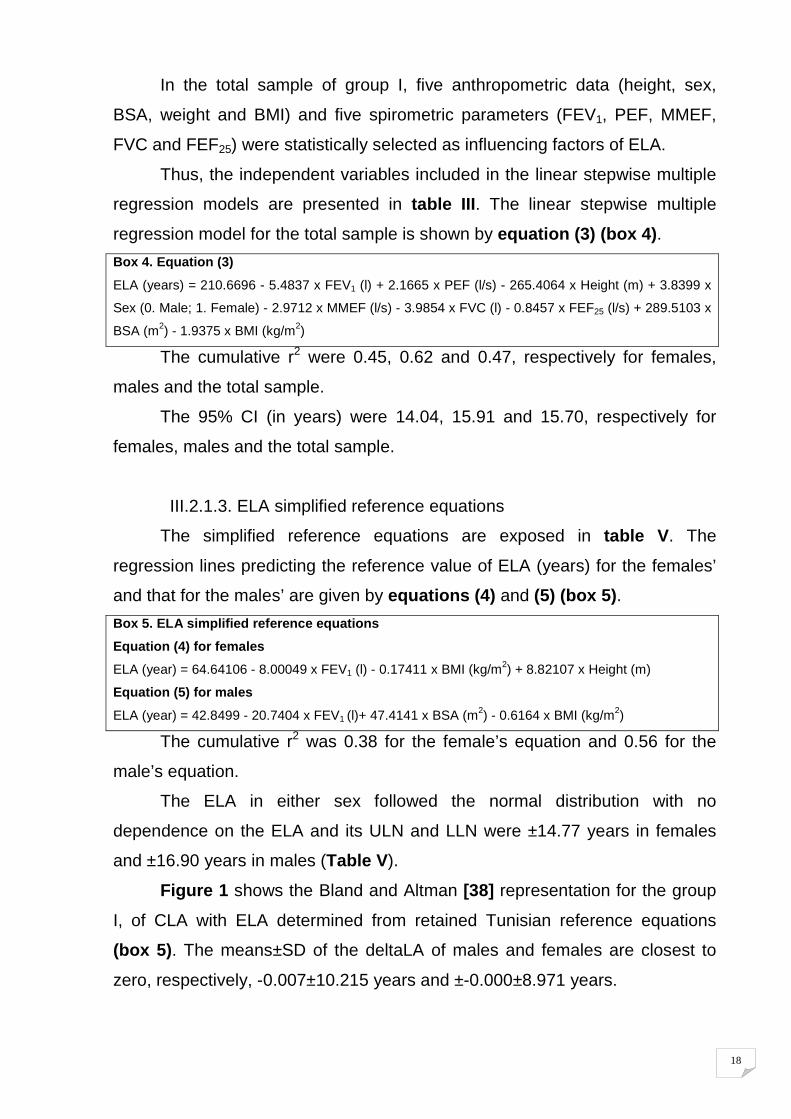
Thus, the independent variables included in the linear stepwise multiple
regression models are presented in table III. The linear stepwise multiple
regression model for the total sample is shown by equation (3) (box 4).
Box 4. Equation (3)
ELA (years) = 210.6696 - 5.4837 x FEV1 (l) + 2.1665 x PEF (l/s) - 265.4064 x Height (m) + 3.8399 x
Sex (0. Male; 1. Female) - 2.9712 x MMEF (l/s) - 3.9854 x FVC (l) - 0.8457 x FEF25 (l/s) + 289.5103 x
BSA (m2) - 1.9375 x BMI (kg/m2)
The cumulative r2 were 0.45, 0.62 and 0.47, respectively for females,
males and the total sample.
The 95% CI (in years) were 14.04, 15.91 and 15.70, respectively for
females, males and the total sample.
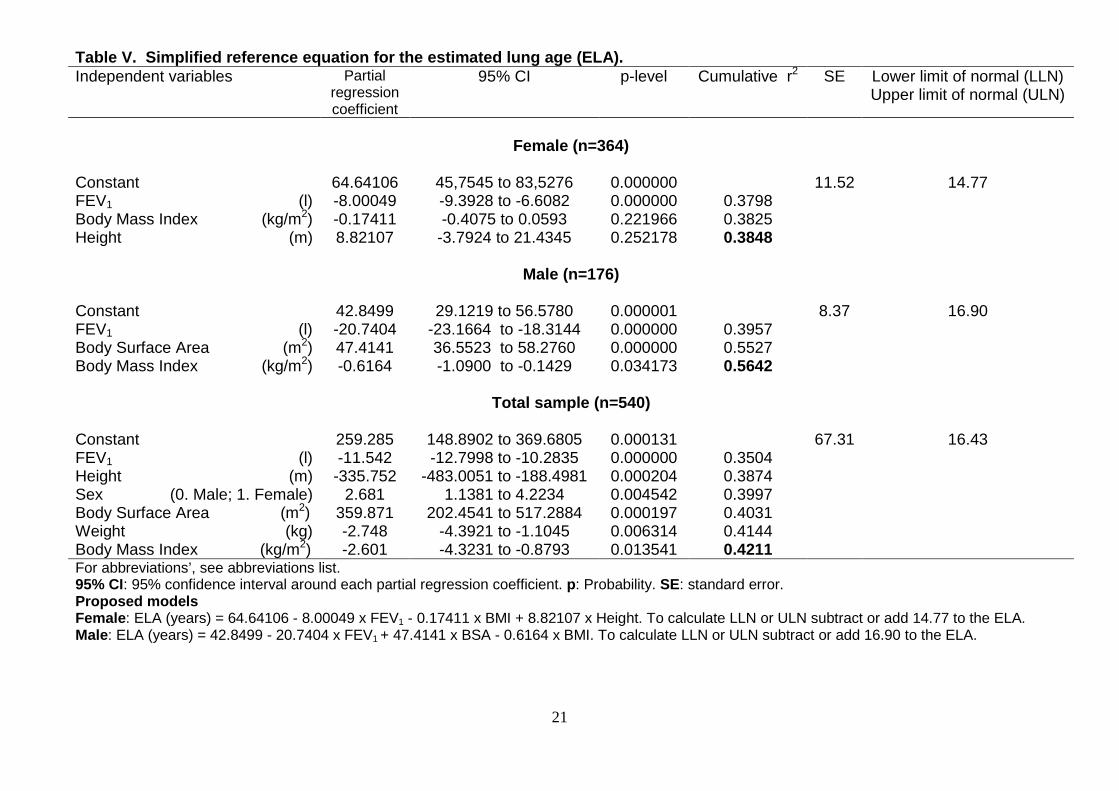
III.2.1.3. ELA simplified reference equations
The simplified reference equations are exposed in table V. The
regression lines predicting the reference value of ELA (years) for the females’
and that for the males’ are given by equations (4) and (5) (box 5).
Box 5. ELA simplified reference equations
Equation (4) for females
ELA (year) = 64.64106 - 8.00049 x FEV1 (l) - 0.17411 x BMI (kg/m2) + 8.82107 x Height (m)
Equation (5) for males
ELA (year) = 42.8499 - 20.7404 x FEV1 (l)+ 47.4141 x BSA (m2) - 0.6164 x BMI (kg/m2)
The cumulative r2 was 0.38 for the female’s equation and 0.56 for the
male’s equation.
The ELA in either sex followed the normal distribution with no
dependence on the ELA and its ULN and LLN were ±14.77 years in females
and ±16.90 years in males (Table V).
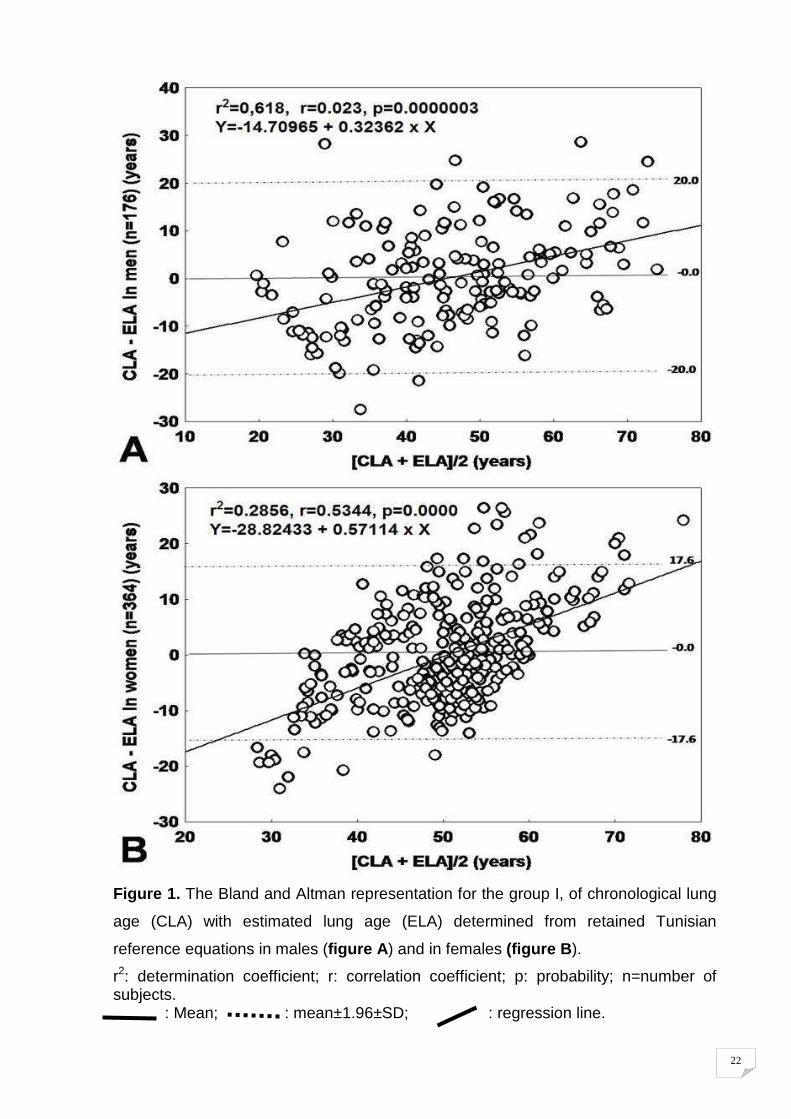
Figure 1 shows the Bland and Altman [38] representation for the group
I, of CLA with ELA determined from retained Tunisian reference equations
(box 5). The means±SD of the deltaLA of males and females are closest to
zero, respectively, -0.007±10.215 years and ±-0.000±8.971 years.
19
Table IV. Influencing factors of the estimated lung age (ELA): linear stepwise multiple regression models. Independent variables Partial
regression coefficient
95% CI p-level Cumulative r2 SE 1.64 x RSD
Female (n=364)
Constant 52.83385 34.3650 to 71.3027 0.000004 11.26 14.04 FEV1 (l) -3.63840 -7.8150 to 0.5382 0.153977 0.3798 Parity (numerical) 1.15804 0.8123 to 1.5038 0.000000 0.4310 PEF (l/s) 1.07758 0.3261 to 1.8291 0.019238 0.4363 MMEF (l/s) -1.53928 -2.7965 to -0.2821 0.045404 0.4419 FVC (l) -3.30161 -6.2824 to -0.3208 0.070136 0.4452 Height (m) 11.27211 -1.0134 to 23.5577 0.133287 0.4488 Body Mass Index (kg/m2) -0.14660 -0.3694 to 0.0762 0.281240 0.4508 FEF25 (l/s) -0.46828 -1.2245 to 0.2879 0.310498 0.4524
Male (n=176)
Constant 53.37314 39,6694 to 67,0769 0.000000 8.36 15.91 FEF25 (l/s) -4.12511 -7,2061 to -1,0441 0.029479 0.4262 FVC (l) -6.26077 -11,2518 to -1,2698 0.041210 0.4972 Body Surface Area (m2) 36.54356 25,2026 to 47,8845 0.000000 0.5677 FEV1 (l) -8.18666 -15,3272 to -1,0461 0.061803 0.5809 Body Mass Index (kg/m2) -0.44735 -0,9001 to 0,0054 0.107009 0.5909 FEF50 (l/s) 3.65674 1,9542 to 5,3593 0.000551 0.5999 MMEF (l/s) -5.17354 -7,7876 to -2,5594 0.001414 0.6233
20
Table IV. Continued Total sample (n=540)
Constant 210.6696 104.1977 to 317.1415 0.001249 64.9219 15.70 FEV1 (l) -5.4837 -9.3357 to -1.6318 0.019930 0.3504 PEF (l/s) 2.1665 1.5534 to 2.7796 0.000000 0.3883 Height (m) -265.4064 -407.9484 to -122.8644 0.002375 0.4125 Sex (0. Male; 1. Female) 3.8399 2.3377 to 5.3422 0.000032 0.4308 MMEF (l/s) -2.9712 -4.0834 to -1.8590 0.000014 0.4529 FVC (l) -3.9854 -6.7194 to -1.2514 0.017167 0.4582 FEF25 (l/s) -0.8457 -1.6619 to -0.0295 0.089867 0.4621 Body Surface Area (m2) 289.5103 137.2778 to 441.7429 0.001914 0.4640 Weight (kg) -2.2704 -3.8512 to -0.6895 0.018873 0.4713 Body Mass Index (kg/m2) -1.9375 -3.5935 to -0.2816 0.055542 0.4749 For abbreviations’, see abbreviations list. 95% CI: 95% confidence interval around each partial regression coefficient. p: probability. SE: standard error. Proposed model for females: ELA (year) = 52.83385 - 3.63840 x FEV1 + 1.15804 x Parity + 1.07758 x PEF - 1.53928 x MMEF - 3.30161 x FVC + 11.27211 x Height - 0.14660 x Body mass index – 0.46828 x FEF25 Proposed model for males: ELA (year) = 53.37314 - 4.12511 x FEF25 - 6.26077 x FVC + 36.54356 x Body surface area - 8.18666 x FEV1 - 0.44735 x Body mass index + 3.65674 x FEF50 - 5.17354 x MMEF Proposed model for the total sample: ELA (year) = 210.6696 - 5.4837x FEV1 + 2.1665 x PEF - 265.4064 x Height + 3.8399 x Sex - 2.9712 x MMEF
-3.9854 x FVC - 0.8457 x FEF25+ 289.5103 x Body surface area - 1.9375 x Body mass index.
21
Table V. Simplified reference equation for the estimated lung age (ELA). Independent variables Partial
regression coefficient
95% CI p-level Cumulative r2 SE Lower limit of normal (LLN) Upper limit of normal (ULN)
Female (n=364)
Constant 64.64106 45,7545 to 83,5276 0.000000 11.52 14.77 FEV1 (l) -8.00049 -9.3928 to -6.6082 0.000000 0.3798 Body Mass Index (kg/m2) -0.17411 -0.4075 to 0.0593 0.221966 0.3825 Height (m) 8.82107 -3.7924 to 21.4345 0.252178 0.3848
Male (n=176)
Constant 42.8499 29.1219 to 56.5780 0.000001 8.37 16.90 FEV1 (l) -20.7404 -23.1664 to -18.3144 0.000000 0.3957 Body Surface Area (m2) 47.4141 36.5523 to 58.2760 0.000000 0.5527 Body Mass Index (kg/m2) -0.6164 -1.0900 to -0.1429 0.034173 0.5642
Total sample (n=540)
Constant 259.285 148.8902 to 369.6805 0.000131 67.31 16.43 FEV1 (l) -11.542 -12.7998 to -10.2835 0.000000 0.3504 Height (m) -335.752 -483.0051 to -188.4981 0.000204 0.3874 Sex (0. Male; 1. Female) 2.681 1.1381 to 4.2234 0.004542 0.3997 Body Surface Area (m2) 359.871 202.4541 to 517.2884 0.000197 0.4031 Weight (kg) -2.748 -4.3921 to -1.1045 0.006314 0.4144 Body Mass Index (kg/m2) -2.601 -4.3231 to -0.8793 0.013541 0.4211 For abbreviations’, see abbreviations list. 95% CI: 95% confidence interval around each partial regression coefficient. p: Probability. SE: standard error. Proposed models Female: ELA (years) = 64.64106 - 8.00049 x FEV1 - 0.17411 x BMI + 8.82107 x Height. To calculate LLN or ULN subtract or add 14.77 to the ELA. Male: ELA (years) = 42.8499 - 20.7404 x FEV1 + 47.4141 x BSA - 0.6164 x BMI. To calculate LLN or ULN subtract or add 16.90 to the ELA.
22
Figure 1. The Bland and Altman representation for the group I, of chronological lung
age (CLA) with estimated lung age (ELA) determined from retained Tunisian
reference equations in males (figure A) and in females (figure B).
r2: determination coefficient; r: correlation coefficient; p: probability; n=number of subjects.
: Mean; : mean±1.96±SD; : regression line.
23
III.2.2. Validation of the retained reference equations
III.2.2.1. ELA in group II (healthy never-smokers with normal
spirometric measurements (validation-1))
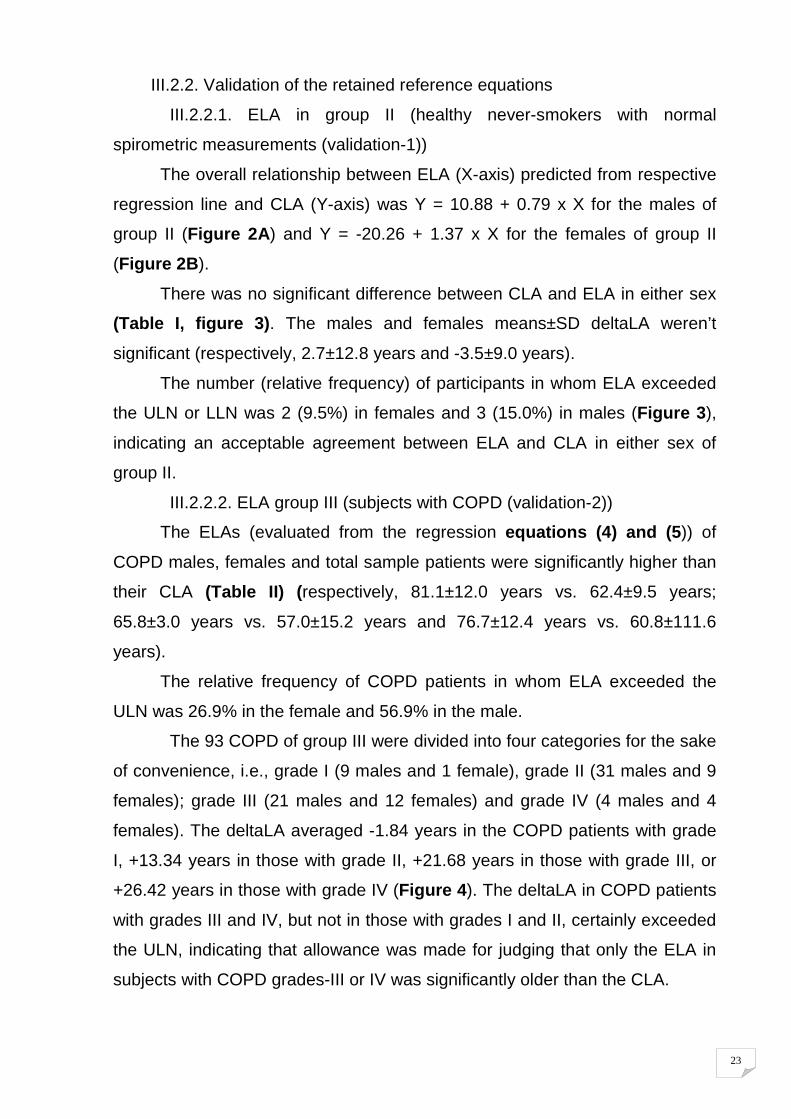
The overall relationship between ELA (X-axis) predicted from respective
regression line and CLA (Y-axis) was Y = 10.88 + 0.79 x X for the males of
group II (Figure 2A) and Y = -20.26 + 1.37 x X for the females of group II
(Figure 2B).
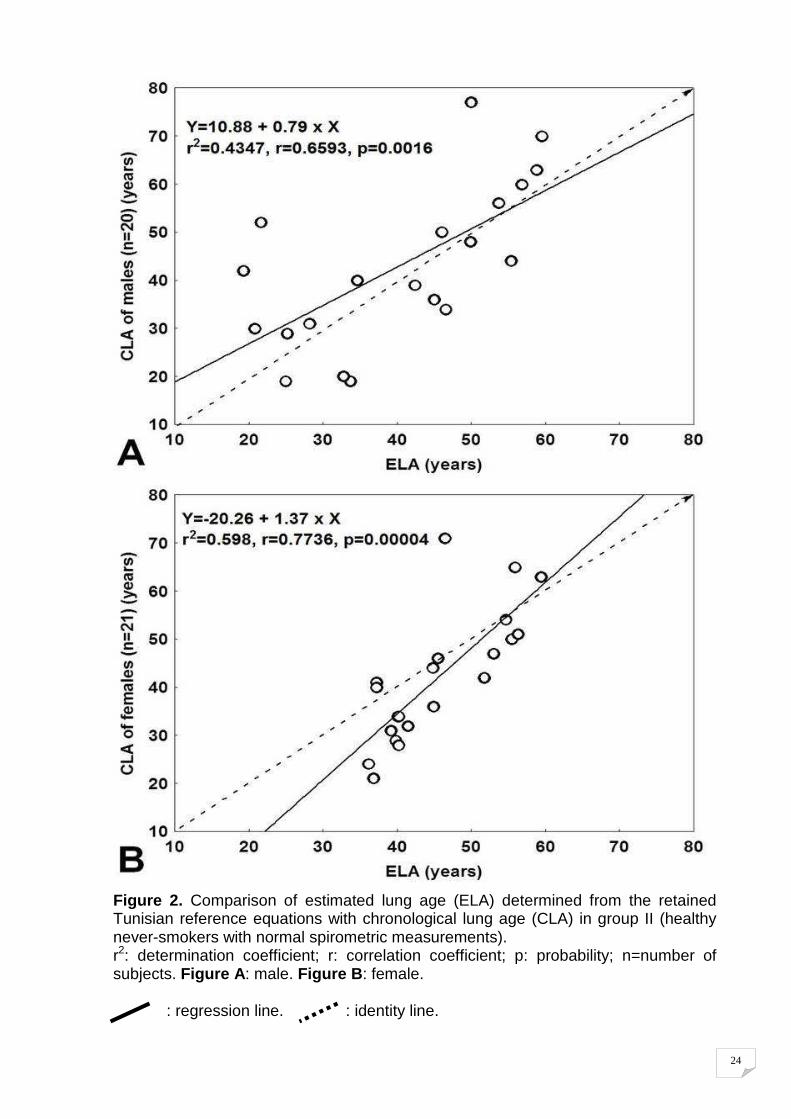
There was no significant difference between CLA and ELA in either sex
(Table I, figure 3). The males and females means±SD deltaLA weren’t
significant (respectively, 2.7±12.8 years and -3.5±9.0 years).
The number (relative frequency) of participants in whom ELA exceeded
the ULN or LLN was 2 (9.5%) in females and 3 (15.0%) in males (Figure 3),
indicating an acceptable agreement between ELA and CLA in either sex of
group II.
III.2.2.2. ELA group III (subjects with COPD (validation-2))
The ELAs (evaluated from the regression equations (4) and (5)) of
COPD males, females and total sample patients were significantly higher than
their CLA (Table II) (respectively, 81.1±12.0 years vs. 62.4±9.5 years;
65.8±3.0 years vs. 57.0±15.2 years and 76.7±12.4 years vs. 60.8±111.6
years).
The relative frequency of COPD patients in whom ELA exceeded the
ULN was 26.9% in the female and 56.9% in the male.
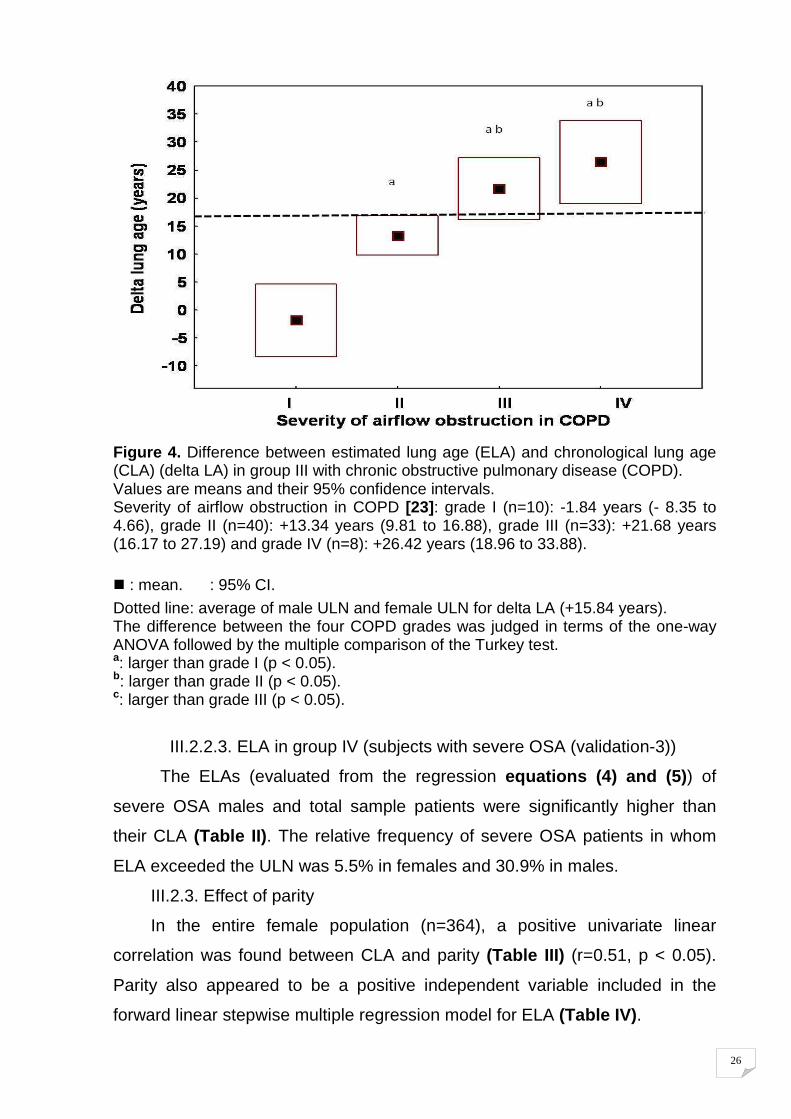
The 93 COPD of group III were divided into four categories for the sake
of convenience, i.e., grade I (9 males and 1 female), grade II (31 males and 9
females); grade III (21 males and 12 females) and grade IV (4 males and 4
females). The deltaLA averaged -1.84 years in the COPD patients with grade
I, +13.34 years in those with grade II, +21.68 years in those with grade III, or
+26.42 years in those with grade IV (Figure 4). The deltaLA in COPD patients
with grades III and IV, but not in those with grades I and II, certainly exceeded
the ULN, indicating that allowance was made for judging that only the ELA in
subjects with COPD grades-III or IV was significantly older than the CLA.
24
Figure 2. Comparison of estimated lung age (ELA) determined from the retained Tunisian reference equations with chronological lung age (CLA) in group II (healthy never-smokers with normal spirometric measurements). r2: determination coefficient; r: correlation coefficient; p: probability; n=number of subjects. Figure A: male. Figure B: female. : regression line. : identity line.
25
Figure 3. The Bland and Altman representation for the group II (healthy never-smokers with normal spirometric measurements), of chronological lung age (CLA) with estimated lung age (ELA) determined from retained Tunisian reference equations in male (figure A) and in female (figure B). r2: determination coefficient; r: correlation coefficient; p: probability; n=number of subjects.
: Mean; : mean ± 1.96±SD; : regression line.
26
Figure 4. Difference between estimated lung age (ELA) and chronological lung age (CLA) (delta LA) in group III with chronic obstructive pulmonary disease (COPD). Values are means and their 95% confidence intervals. Severity of airflow obstruction in COPD [23]: grade I (n=10): -1.84 years (- 8.35 to 4.66), grade II (n=40): +13.34 years (9.81 to 16.88), grade III (n=33): +21.68 years (16.17 to 27.19) and grade IV (n=8): +26.42 years (18.96 to 33.88).
� : mean. �: 95% CI. Dotted line: average of male ULN and female ULN for delta LA (+15.84 years). The difference between the four COPD grades was judged in terms of the one-way ANOVA followed by the multiple comparison of the Turkey test. a: larger than grade I (p < 0.05). b: larger than grade II (p < 0.05). c: larger than grade III (p < 0.05).
III.2.2.3. ELA in group IV (subjects with severe OSA (validation-3))
The ELAs (evaluated from the regression equations (4) and (5)) of
severe OSA males and total sample patients were significantly higher than
their CLA (Table II). The relative frequency of severe OSA patients in whom
ELA exceeded the ULN was 5.5% in females and 30.9% in males.
III.2.3. Effect of parity
In the entire female population (n=364), a positive univariate linear
correlation was found between CLA and parity (Table III) (r=0.51, p < 0.05).
Parity also appeared to be a positive independent variable included in the
forward linear stepwise multiple regression model for ELA (Table IV).
27
We found no correlation between parity and BMI (p=0.90). there exist
significant correlations between parity and weight, height and FEV1 in this
female population (r=-0.43, p < 0.05; r=-0.28, p < 0.05; r=0.16, p < 0.05,
respectively).
III.2.4. ELA from the Japanese reference equations
According to the reference equations of Yamaguchi et al., the ELA in
participants of group II was calculated.
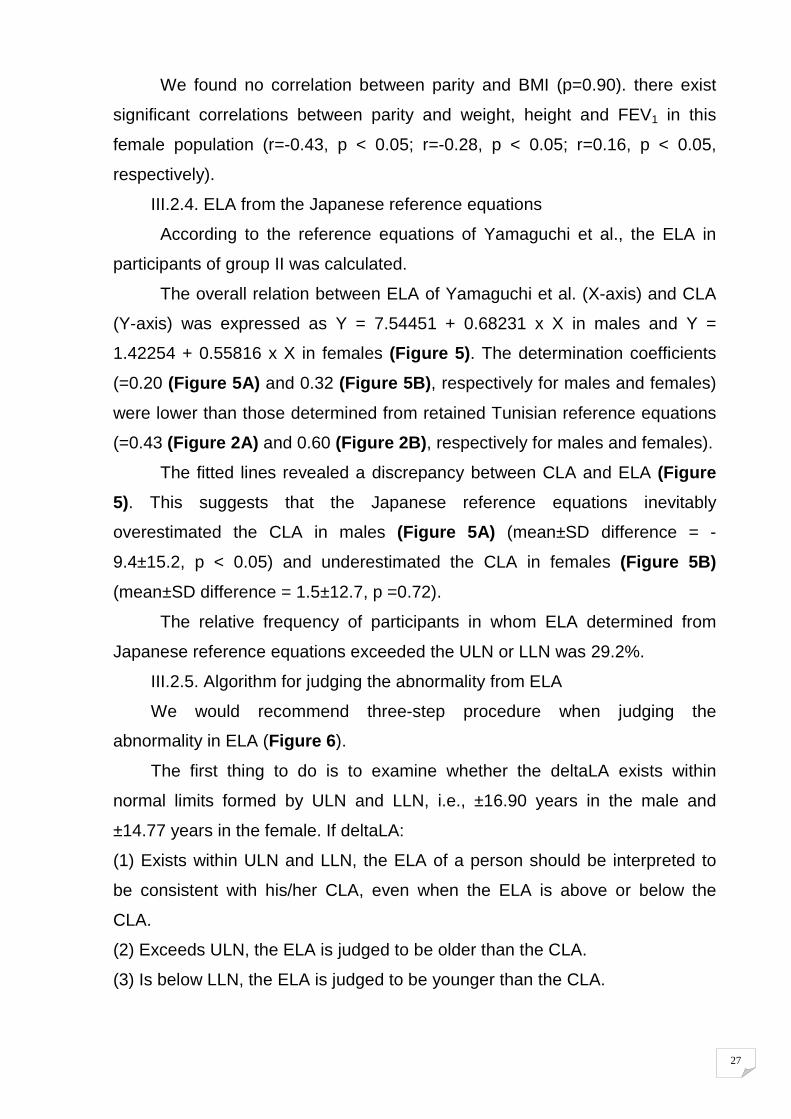
The overall relation between ELA of Yamaguchi et al. (X-axis) and CLA
(Y-axis) was expressed as Y = 7.54451 + 0.68231 x X in males and Y =
1.42254 + 0.55816 x X in females (Figure 5). The determination coefficients
(=0.20 (Figure 5A) and 0.32 (Figure 5B), respectively for males and females)
were lower than those determined from retained Tunisian reference equations
(=0.43 (Figure 2A) and 0.60 (Figure 2B), respectively for males and females).
The fitted lines revealed a discrepancy between CLA and ELA (Figure
5). This suggests that the Japanese reference equations inevitably
overestimated the CLA in males (Figure 5A) (mean±SD difference = -
9.4±15.2, p < 0.05) and underestimated the CLA in females (Figure 5B)
(mean±SD difference = 1.5±12.7, p =0.72).
The relative frequency of participants in whom ELA determined from
Japanese reference equations exceeded the ULN or LLN was 29.2%.
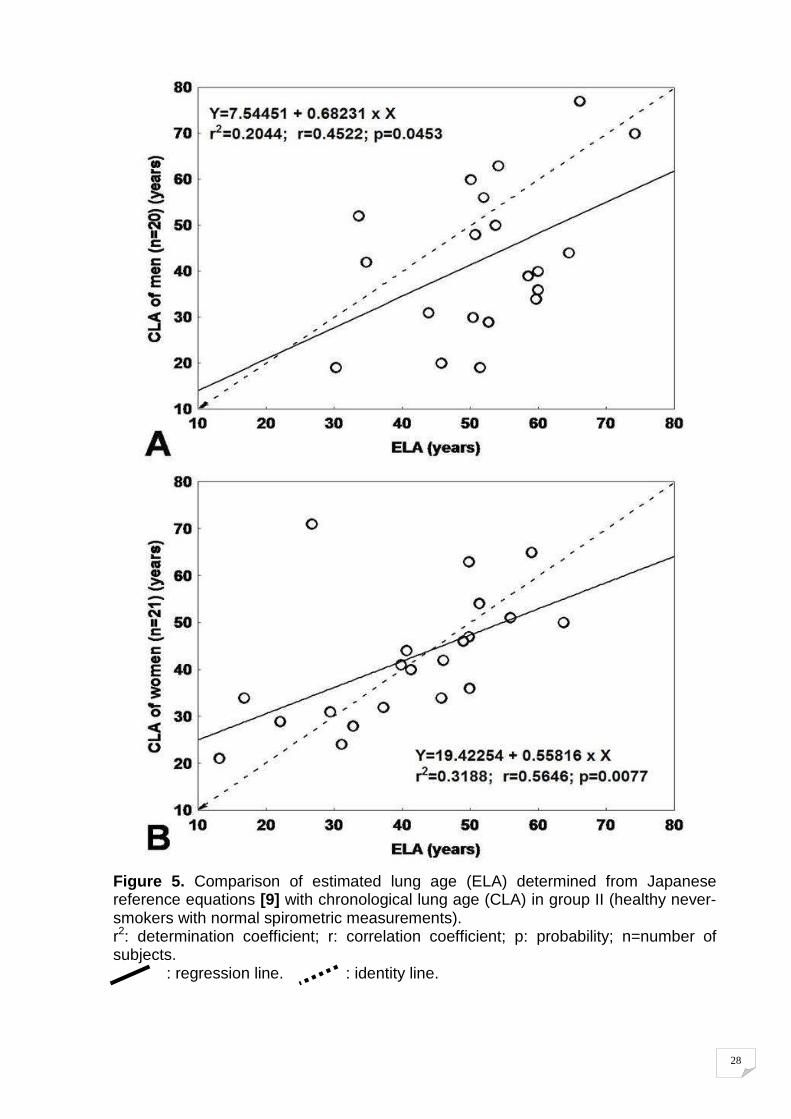
III.2.5. Algorithm for judging the abnormality from ELA
We would recommend three-step procedure when judging the
abnormality in ELA (Figure 6).
The first thing to do is to examine whether the deltaLA exists within
normal limits formed by ULN and LLN, i.e., ±16.90 years in the male and
±14.77 years in the female. If deltaLA:
(1) Exists within ULN and LLN, the ELA of a person should be interpreted to
be consistent with his/her CLA, even when the ELA is above or below the
CLA.
(2) Exceeds ULN, the ELA is judged to be older than the CLA.
(3) Is below LLN, the ELA is judged to be younger than the CLA.
28
Figure 5. Comparison of estimated lung age (ELA) determined from Japanese reference equations [9] with chronological lung age (CLA) in group II (healthy never-smokers with normal spirometric measurements). r2: determination coefficient; r: correlation coefficient; p: probability; n=number of subjects. : regression line. : identity line.
29
Figure 6. Three-step procedure for judging the abnormality of estimated lung age
(ELA) in Tunisian population. For abbreviations’, see abbreviations list.

DiscussionDiscussionDiscussionDiscussion
30
IV. DISCUSSION
Novel regression equations allowing prediction of reference value of
estimated lung age and normal limits of difference between estimated lung age
and chronological lung age were elaborated in both sexes for Tunisian adult’s
population.
In additional groups of healthy or adult-patients prospectively assessed,
our reference equations yielded satisfactory predictions.
IV.1. Rational of the study: should we use ‘lung ag e’?
The physician can play a crucial role in motivating a patient to cease
cigarette smoking [39-41]. Smoking cessation programs vary in content but
frequently include an educational session; expression of optimism as to the
chances of individual success; a self-administered kit; and reinforcement by
follow-up contact [42, 43]. An additional dimension can be added by
performing spirometric measurement of expiratory air flow. Once the physician
identifies a person with diminished pulmonary function, there is an imperative
need to impress upon the individual the necessity of smoking cessation.
Spirometry deserves wider use by physicians to quantitate the degree of
obstructive ventilatory defect. Reduction of the FEV1, is generally accepted as
both a sensitive and a specific measurement for clinically significant
obstructive pulmonary disease. In addition to informing patients of their
percentage of predicted normal values, the estimation of LA, may provide
additional incentives to abstain from cigarette smoking and avoid further
damage. Caution should be exercised not to translate LA into life expectancy.
The functional age or rate of aging of one organ such as the lung cannot be
used to predict that of another organ system or the individual [44].
Smokers are the natural target of efforts to prevent the development of
clinically important COPD. The underlying assumption of preventive
counselling is that confronting the smoker with evidence of potential lung
damage will increase quit rates. However, the majority of smokers who are
found to have normal lung function during COPD screening programs may
subconsciously use that information as an excuse to continue smoking. The
effects of smoking mimic premature lung ageing; hence LA as an index of
31
potential lung damage was introduced in 1985 as a tool for motivating
cessation of cigarette smoking [5]. LA is commonly estimated from regression
equations for the FEV1 and constitutes the age at which the FEV1 measured in
an individual equals the predicted value of FEV1, taking into account age,
height, sex and ethnicity [45, 46].
After developing equations that fit the Australian population, Newbury et
al. [7] found that in current smokers, ELA exceeded CLA by 18 years. This
confirms that prolonged smoking damages the lung.
Many authors speculate that confronting smokers with their ELA will
persuade them to quit smoking [5, 8, 45-47]. Regrettably, in practice these
expectations have not been fulfilled. In a retrospective analysis, Bednarek et
al. [48] reported that the smoking cessation rate in those with airway
obstruction was 16.3% compared with 12.0% in those with normal spirometry;
however, they did not randomise their study participants to spirometry or no
spirometry [49]. In one positive study using LA, Parkes et al. [50] reported that
providing patients with their LA was associated with higher quit rates at 12
months in the intervention group (13.6%) when compared to the control group
(6.4%). However, those with higher LA (i.e., worse lung function for their age)
were no more likely to quit than those with normal LA. Lin [51] rejected Parkes’
conclusions because “the study does not establish the independent
motivational effectiveness of doing spirometry screening versus not doing it,
which would require a randomised trial in which the control arm did not receive
spirometry.” Prior to publication of the Parkes study, three reviews [52-54] and
one study targeted at college students [55] concluded that the evidence was
very weak that confronting smoker with their pulmonary function improves quit
rates. In a local study [56], done on 35 smokers and aiming to evaluate the
impact of the announcement of the ELA on the smoking behavior one year
after, it was found that 23% and 20% of them have, respectively, stopped
smoking and reduced their tobacco consumption.
Apart from the above, and as shown by Newbury et al. [7], calculated LA
varies widely according to the prediction equations used. So what is this
person’s LA? In addition, there is considerable scatter around the predicted
32
value for FEV1 in healthy nonsmokers, indicating that published prediction
equations cannot satisfactorily take into account differences between
individuals due to differences in body build, properties of lungs and airways,
the level of physical training, and other factors. Pulmonary function tracks in
healthy subjects [57-59], so that people who start with a relatively high or low
level of FEV1 (i.e. LA younger or older than calendar age, respectively) will
usually retain that position as they grow older. Unless we have good quality
spirometry results from several years previously for an individual (and can
perform trend analysis), we should not attribute a FEV1 in the low normal
range to accelerated ageing [60].
Quanjer and Enright [61] calculated LA for a healthy non-smoking
subset of English participants from the Health Survey for England [62] which
included 3107 males. Subjects whose FEV1 is higher than average have a
younger lung than calendar age. Should we tell these people that they can
happily continue smoking? Definitely not. But should we tell people whose
FEV1 is below 100% predicted but above the LLN that their LA indicates lung
damage due to smoking? In fact, most of them will have had an older LA even
before they started smoking. Obesity reduces both FEV1 and the FVC, but
does not accelerate ageing of the lung, since subsequent weight loss
increases lung function. There is often a rapid improvement in FEV1 after the
inhalation of salbutamol, both in patients with asthma and in some patients
with COPD [63] but it makes no sense that the age of the lung would improve
within ten minutes. So it is back to basics. Only if both the FEV1/FVC ratio and
the FEV1 value are below the LLN after effective therapy for airway disease –
and only in patients who have smoked for more than 20 years – is it plausible
to associate smoking with harm done to the lung [64].
IV.2. Methodology discussion
The study design, the population source, the sample size and
characteristics of group I subjects, the applied inclusion and non-inclusion
criteria, the spirometry measurements were previously discussed [12]
(appendix).
33
The ELA published reference equation were described in a previous
paper [12] (appendix). The methodology discussion will be focalized on the
statistical analysis, very well described by Yamaguchi et al. [13].
IV.2.1. Statistical analysis
The regression equation predicting the normal value of a given
pulmonary functional parameter for non-smoking healthy adults is generally
constructed by taking spirometric parameter as dependent variable, while sex,
age, and height as independent variables, in terms of least-squares
minimization. In the original method of Morris and Temple [5] (appendix),
calculation of LA (X) was made by counting back the regression equation
predicting the normal value of a given spirometric parameter expressed by Y =
a + bX in a fixed condition of sex and height, i.e., X = −a/b + Y/b. This may not
be approvable in a statistical sense and, for estimating LA with statistical
validity, it is necessary to establish the new regression equation by taking age
as dependent variable but spirometric parameter as independent variable
using the same data set, i.e., X = d + eY (Figure 7).
Generally, coefficients of d and e are, respectively, not equal to −a/b and
1/b excepting an ideal situation where the correlation coefficient between age
and spirometric parameter is close to 1.0.
The equation Y = a + bX is defined as the straight line intersecting two
tangents of the confidence ellipse constructed from data set of X and Y in the
vertical direction. In this case, coefficients of a and b are obtained by
minimizing the difference between regression line and measured values of Y in
the Y-axis direction. On the other hand, the equation X = d + eY is expressed
by the line tangentially crossing the ellipse toward the horizontal axis, in which
d and e are obtained by minimizing the difference between regression line and
X along the X axis [37].
34
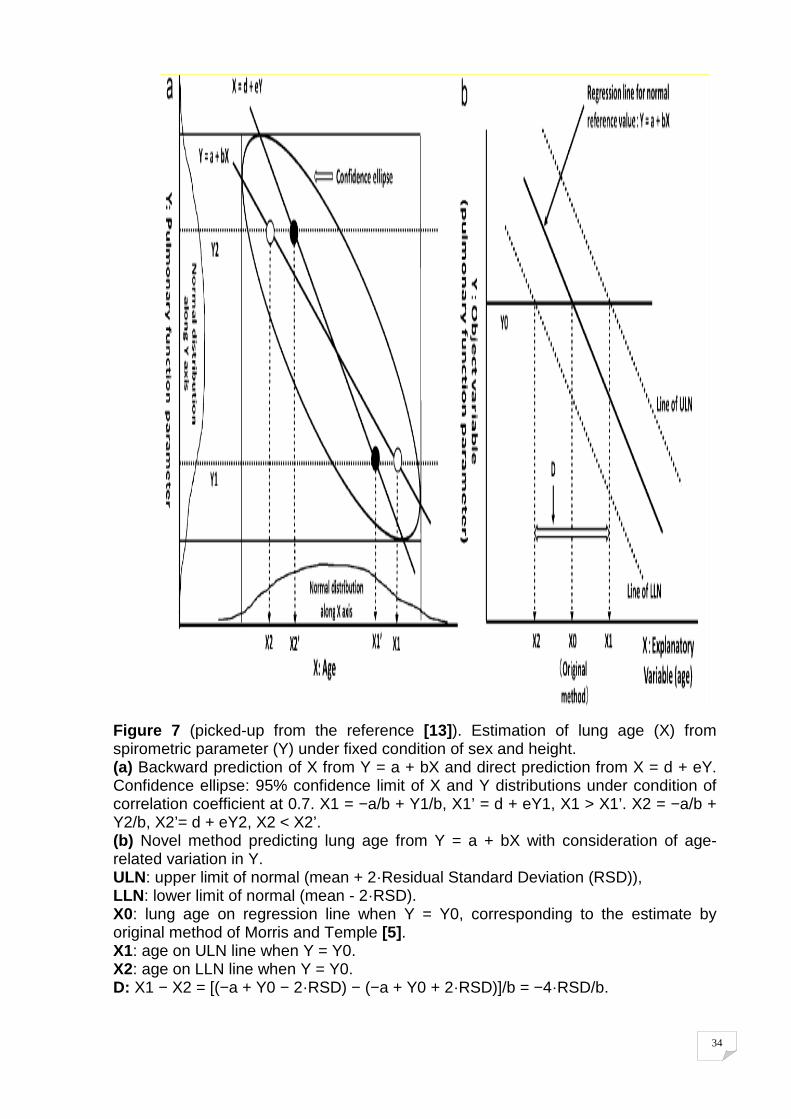
Figure 7 (picked-up from the reference [13]). Estimation of lung age (X) from spirometric parameter (Y) under fixed condition of sex and height. (a) Backward prediction of X from Y = a + bX and direct prediction from X = d + eY. Confidence ellipse: 95% confidence limit of X and Y distributions under condition of correlation coefficient at 0.7. X1 = −a/b + Y1/b, X1’ = d + eY1, X1 > X1’. X2 = −a/b + Y2/b, X2’= d + eY2, X2 < X2’. (b) Novel method predicting lung age from Y = a + bX with consideration of age-related variation in Y. ULN: upper limit of normal (mean + 2·Residual Standard Deviation (RSD)), LLN: lower limit of normal (mean - 2·RSD). X0: lung age on regression line when Y = Y0, corresponding to the estimate by original method of Morris and Temple [5]. X1: age on ULN line when Y = Y0. X2: age on LLN line when Y = Y0. D: X1 − X2 = [(−a + Y0 − 2·RSD) − (−a + Y0 + 2·RSD)]/b = −4·RSD/b.
35
The discrepancy between the backward value of age calculated from Y
= a + bX and the age directly predicted from X = d + eY becomes larger as the
Y is apart from the center of the ellipse. The above consideration indicates
that, when assessing LA from spirometric measurements, the statistically
correct method is to predict it from the regression equation in the form of X = d
+ eY. However, the estimation of age from this equation has a radical problem,
because age is not the measured variable but the attributable variable of a
given individual, suggesting that the regression equation X = d + eY is
mathematically valid but its significance is indistinct in a physiological sense.
Based on these facts, Yamaguchi et al. [13] have developed the method
allowing estimation of LA by modifying the regression equation Y = a + bX with
strict consideration of inevitable variation existing in measured spirometric
parameter (Y) related to age (X) (novel method) (Figure 7 b). The novel
method is mathematically approximate but physiologically approvable [9, 13].
Normal value of a spirometric parameter at a given age exists within a
certain range between ULN and LLN, corresponding to maximum and
minimum ends of 95% CI, which are defined as mean±2·RSD. When the
measured value of a certain spirometric parameter of an individual is known
(Y0), his/her LA can be considered to exist within the interval (D) defined by
the difference between the two points (X1, X2) at which the horizontal line of
Y0 intersects the lines representing ULN and LLN, respectively.
The final question is which spirometric parameter is the best for
estimating LA. To answer this question, Yamaguchi et al. [13] have examined
the D in regression equations predicting normal reference values of various
spirometric parameters (ie. FVC, FEV1, FEV1/FVC) from sex, chronological
age and height. For this examination, they have applied the regression
equations developed by the Japanese respiratory society [65]. Among
spirometric parameters examined, the D, i.e., the possible range of age in
which a given spirometric value is surely included within the 95% CI, is found
to be the smallest in FEV1 (67 years in male and 58 years in female). The D
estimates of other spirometric parameters, however, exceed 90 years in male
and 80 years in female, leading to the conclusion that the regression equation
36
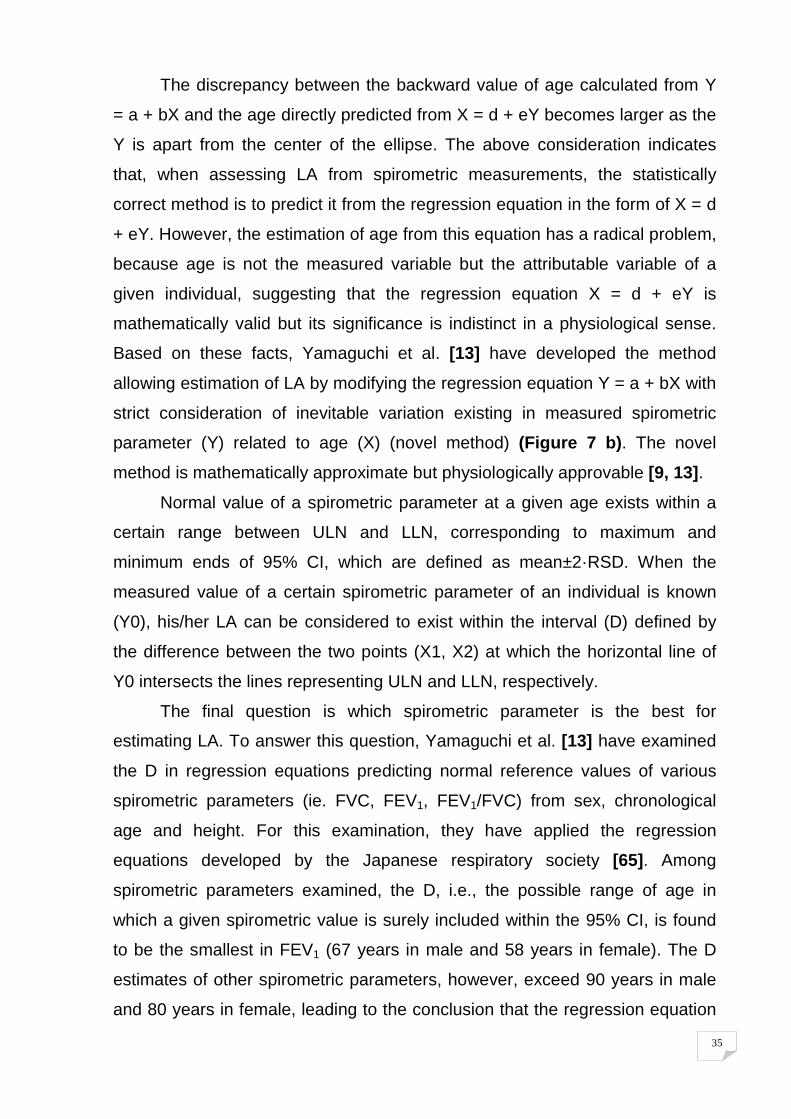
for FEV1 is the most appropriate when attempting to evaluate LA. Using the
regression equation for FEV1 (Y = a + bX + cH, where Y = FEV1, X = age, and
H = height), Yamaguchi et al. [13] have recommend the following three-step
procedure as a practical application of the novel method when estimating LA
(Figure 8).
Figure 8 (picked-up from the reference [13]). Concept of novel method and formulae for estimating lung age from measured FEV1. Example: Japanese males with 170 cm in height (H), in whom normal FEV1 (Y) is given by Y = −1.178 − 0.028·X + 0.036·H with Residual Standard Deviation (RSD) of 0.47. � A man aged 53 year-old and measured Y of 3.1 L. Y is within 95% confidence limit of his age. Therefore, novel method predicts lung age as being equivalent to his chronological age (�(novel)), while original method of Morris and Temple [5] estimates it as 69 years-old (�(original)). � A 63-years-old man with measured Y of 4.6 L exceeding Upper Limit of Normal (ULN) of his age. Lung age by novel method is judged to be younger than 44 years-old (�(novel)) but lung age by original method of Morris and Temple [5] is 10 years-old (�(original)). � A 30 years-old man with measured Y of 2.7 L, being lower than Lower Limit of Normal (LLN) of his age. Lung age by novel method is judged to be older than 60 years-old (�(novel)), while lung age by original method of Morris and Temple [5] is 92 years-old (�(original)).
37
The first thing to do is to examine whether measured FEV1 (Y) of a
person in question exists within 95% confidence limit of ULN and LLN.
If Y exists within ULN and LLN, ELA of a person should be considered to
be consistent with his/her CLA (X), even in the case that the Y is above or
below the reference normal value.
If Y exceeds ULN, search is made for the oldest age at which the
horizontal line of Y crossing the ULN line. Then, ELA of a person is judged to
be younger than the oldest age thus determined.
If Y is below LLN, inquiry is made about the youngest age at which the
horizontal line of Y intersecting the LLN line. Then, ELA of a person is
considered to be older than the youngest age thus determined.
The formulae presented in figure 8 were written in a general form. This
is due to the fact that coefficients of intercept (a), age (b), and height (c)
significantly differ between the races [13]. Therefore, it is advisable to use
specific coefficients determined for respective ethnic groups [13]. Applying the
three-step procedure to the Japanese regression equation for FEV1 [13],
Yamaguchi et al. [13] have compared the ELA from the original method of
Morris and Temple [5] and that from the novel method developed by
Yamaguchi et al. [13]. The original method appraises ELA to be remarkably
younger than CLA when measured FEV1 is above ULN (sometimes, LA was
below zero). On the one hand, ELA from the original method [5] was strikingly
older than CLA when measured FEV1 is below LLN (sometimes, LA is over
100). On the other hand, the novel method, in which ULN and LLN of the
regression equation were deliberated, allows estimation of LA in a wide range
of conditions where measured FEV1 is above ULN or below LLN.
IV.2.2. Limitations of the study
As for the Japanese study’s [9], one of the crucial issues acknowledged
is that we have no reliable grounds for supporting the idea that the relationship
between lung ageing and various spirometric parameters can be approximated
by the linear function. Concerning this issue, however, Kohansal et al. [3]
demonstrated that, in the male, peak of FEV1 or FVC would be attained at an
age between 20 and 25 years-old and then declined with age, but, in the
38
female, full lung growth would be achieved earlier than the male. These
findings suggest that the relation between CLA and most of the spirometric
parameters is approximated by a linear function as far as the subjects studied
are over 20 years-old and their spirometry is normal. However, it may be
difficult to say that these findings sufficiently provide the physiologically
relevant grounds for the linear assumption between ELA and various
spirometric parameters. Therefore, as in the Japanese study’s [9], we
validated their applicability by calculating the ELAs of subjects with normal
spirometry (group II) and those with deteriorating pulmonary function (groups
III and IV).
IV.3. Results discussion
IV.3.1. How to evaluate “spirometric” ELA for Tunisian and North
African populations? What method is approvable?
The spirometric ELA is offered as a tool to impress upon the cigarette
smoker the degree of ventilatory defect caused by tobacco smoke inhalation.
As part of an educational program used by a physician or health professional,
it can provide additional incentive to prevent further loss of pulmonary function
and the potential for improved function and LA reduction.
Morris and Temple [5] deserve credit for introducing the concept of LA
to assess airflow obstruction. Parkes et al. [50] found their ELAs useful, but
they are not routinely calculated. Using the new formulas (equations (4) and
(5)) presented in our thesis, anyone can easily manually calculate and inform
patients of their LAs from any spirometric report. This should elicit a response
and open discussion regarding the dangers of continuing cigarette smoking.
Referral to support groups, educational and counselling sessions, and the use
of newer pharmaceuticals all offer avenues for success [50, 66]. The
recommended sequence (Figure 6) is to identify a cigarette smoker, perform
spirometry, and, if the FEV1, is less than the LLN, estimate the LA.
The variability of spirometry results of normal healthy subjects is itself
quite wide, being approximately 80-120% predicted, and consequently wide
variation in ELA exists. There continues to be considerable debate about use
of LLN or percent predicted, with the definitions of stages of disease easily
39
described by percent predicted. Instead of a single LA value it may be possible
to communicate LA as being “between x and y”, based on 95% CI. LA’s
relationship to smoking may also be controversial as there is also a decline in
lung function with increasing age as well as with diseases such as COPD.
However, there is continued support in the literature for the more rapid decline
in FEV1 in smokers than in non-smokers [67-71].
It should be noted that the Equations (4) and (5) are only applicable to
the North African population. However, we anticipate that the findings obtained
in the present study will promote the development of ethnic-specific regression
equations allowing prediction of ELA in various races.
Since the prediction equations (4) and (5) include FEV1 as explanatory
variable, they are expected to be sensitive to the functional abnormality
caused by the interstitial lung pathology, as well. However, a further study is
absolutely needed to elucidate the applicability of these equations to the
patients with a variety of interstitial lung diseases.
Other factors that also influence lung function throughout life include
gestational age at birth, genetics, childhood infections, and environmental
factors such as air quality and workplace exposures.
IV.3.2. Effect of parity
Parity was positively correlated with CLA of the group I female (Table III)
and appeared as a positive independent variable included in the multiple
regression model for ELA (Table IV). This result may be clinically relevant
when interpreting ELA in females from North Africa. A simple way to solve this
problem would be to substract, from the theoretical value of their ELA, some
years equal to the number of parity multiplied by 1.16.
This phenomenon may reflect the general findings about aging and
parity effects on health [72]. In fact, repeated gestations have been found to
have potentially noxious effects on health, and several hypotheses, discussed
in some previous paper [15, 17, 19, 73] have been advanced. Biochemical
modifications are suggested, since increased oxidative stress has been found
during pregnancy [74]. With repeated gestations, the repeated oxidative stress
could have negative effects on respiratory muscle function with high parity. In
40
addition, impaired respiratory muscle function is associated with high parity
[19] which may have influenced the ventilatory response in our females during
the spirometry manouvres.
Medical studies provide very little information on the influence of parity
on lung age, however, this may be a promising new direction for physiological
and pathophysiological research, particularly for developing countries.
IV.3.3. Validity of the North African ELA reference equations
We found that our newly developed equations could predict not only the
equality between ELA and CLA in group II (Table I) within an allowable margin
of error but also the incremental disparity between ELA and CLA in groups III
and IV with COPD or severe OAS (Table II). Thus, we concluded that the
Equations (4) and (5) would be practically useful in a clinical setting in North
African population. In the group IV with COPD, the North African ELA
equations produced an ELA greater than CLA (Table II) suggesting that
smoking causes lungs to deteriorate more quickly than the expected age-
related decline, as predicted by Fletcher and Peto [67].
ConclusionConclusionConclusionConclusion
Hela SELMI. Spirometric “Lung Age” Estimation for North African Population
1
CONCLUSION
The single most useful intervention to improve lung function in smokers,
with or without, Chronic Obstructive Pulmonary Disease (COPD) is smoking
cessation. One way to increase the quit rate in smokers could be to
communicate lung function results in a manner that is easily understood and
stimulates the desire to quit.
To conquer the difficulty existing in the raw results of spirometric
measurements, the concept of Estimated Lung Age (ELA) have been
proposed. ELA is an estimate that uses the observed spirometric variable of a
smoker to calculate the approximate age of a healthy non-smoker with the
same spirometric variable based on predicted values. Its basis of interpretation
relies upon comparison of the Chronological Lung Age (CLA) values with ELA
predicted from available reference equations. At the best of our Knowledge,
only four reference equations were developed: Morris and Temple1985,
Newbury2010; Hansen2010 and Yamaguchi2012, respectively, for USA, South
Australian, USA and Japanese populations. Among these four studies, only
two have proposed an algorithm for judging the abnormality from spirometry
ELA. These four published studies presented several limitations: low sample
size, sample may not be representative of a normal population, use of old
data, skewed age distribution, use of old equipment and application of old
spirometric methods, mathematical and statistical flaws, wide variation in ELA.
These methodological shortcomings explain some discrepancies in the
findings. In a previous study, our team has demonstrated that these ELA
spirometric reference equations didn’t reliably predict CLA data in 540 adult’s
healthy subjects representing a sample of a North African population and we
have strongly suggested that the existing four LA equations are in need of
review.
Based on these backgrounds, the aims of the present study are 1) to
establish the novel regression equations allowing prediction of the reference
Hela SELMI. Spirometric “Lung Age” Estimation for North African Population
2
value of ELA and its normal limits using the data harvested from a large
number of healthy Tunisian never-smokers with normal spirometric
measurements; 2) to validate the developed equations using the data obtained
from the other group of healthy never-smokers with normal spirometry and two
groups of subjects with deteriorating pulmonary function; and 3) to propose an
algorithm for judging the abnormality of the ELA.
We performed this cross-sectional study over one year period in the two
Functional Exploration Laboratories at the Occupational Medicine Group and
at the Farhat HACHED Hospital of Sousse, Tunisia. Approval for the study
was obtained from the Hospital Ethics Committee, and written informed
consent was obtained from all study participants.
Four groups were recruited:
Group I (equation group; healthy never-smokers with normal spirometric
measurements): a total of 540 participants (176 males) with age distribution
ranging between 19 and 90 years-old, met the criteria of “healthy never-
smokers with normal spirometric measurements”. The diverse parameters of
group I were used for constructing the novel prediction equations of LA in both
sexes.
Group II (healthy subject’s validation group; healthy never-smokers with
normal spirometric measurements): 41 participants (20 males) with age
distribution in a range from 22 to 89 years-old, satisfied the criteria of “healthy
never-smokers with normal spirometric measurements”. Members of group II
were devoted to validation of the novel prediction equations of LA in both
sexes.
Group III (patients’ validation group; COPD patients): 91 smokers
subjects’ (65 males) with age ranging from 19 to 80 years-old, satisfied the
criteria of COPD.
Group IV (patient’s validation group; obstructive sleep apnoea (OSA)
patients): 60 severe OSA patients’ (42 males; apnoea hypopnoea index >
30/hour) with age ranging from 26 to 70 years-old, were included.
Hela SELMI. Spirometric “Lung Age” Estimation for North African Population
3
Participants of groups III and IV were used for certifying whether the
newly developed equations would reliably detect the abnormal LA in subjects
with COPD or severe OSA.
Data were collected using a simplified non-validated version of a
medical questionnaire recommended for epidemiological research.
Age, standing height, weight, Body Mass Index (BMI) and Body Surface
Area (BSA) were measured and/or calculated. Parity referred to the number of
offspring.
Spirometry was performed according to the international
recommendations. All subjects performed spirometry on a modern equipment
[gold standard uni-directional digital volume transducer (Micro Medical Limited.
PO Box 6, Rochester. Kent ME1 2AZ England)]. The Spida 5 software was
used. The flow sensor of the spirometer was calibrated daily with a 3-liter
syringe, to ensure performance. The reversibility test was applied only to
group III comprising COPD patient. The recent international classification of
severity of airflow obstruction in COPD was applied.
The Kolmogorov-Smirnov test was used to analyze distribution of
variables. Preliminary descriptive analysis included frequencies for categorical
variables (sex) and mean±SD or median (1st-3rd quartiles) for continuous ones
(anthropometric and spirometric data). The dependent variable (CLA) was
normally distributed. T-tests were used to evaluate the associations
between CLA and categorical variables (sex) and the Pearson product-
moment correlation coefficients (r) and determination coefficient (r2) evaluated
the associations between CLA and continuous measures [height, age, weight,
BMI, BSA, spirometric data expressed in absolute values]. The linearity of the
association between the CLA and the continuous measures was checked
graphically (scatterplots) by plotting each regressor against CLA. Only
significantly and linearly associated variables were entered into the model. A
linear regression model was used to evaluate the independent variables
explaining the variance in CLA.
Hela SELMI. Spirometric “Lung Age” Estimation for North African Population
4
Due to the inadequacy of the published equations and for practical
reasons, daily interpretation especially in patients screening, a reference
equation should include only data which can be easily measured and are
significantly associated with ELA. Therefore, we established using FEV1 and
previously significant anthropometric data as predictors of ELA in another
stepwise linear regression model.
ELA (years) = a0 + a1 x Sex + a2 x Height + a3 x Weight + a4 x BMI + a5 x
BSA + a6 x FEV1
The normal limits, i.e., ULN and LLN for the disparity between ELA and
CLA, defined as deltaLA (CLA minus ELA), was evaluated with the
standardized residual called Z-score. The ULN and LLN were assumed to be
equal to 95th and 5th percentiles of Z distribution, corresponding to Z-scores of
±1.64, respectively [95% CI = 1.64 x Residual Standard Deviation (RSD)).
We calculated ELA of groups I and II subjects with normal spirometric
measurements and that of groups III and IV subjects with COPD and severe
OSA by applying the regression equations constructed. CLAs were compared
with ELAs calculated from the retained reference equation in many ways: i) A
non parametric test (Wilcoxon matched pairs test) was used to compare ELA
vs. CLA for males, females and the total sample of groups I-IV; ii) As proposed
by Bland and Altman, comparisons between CLA and ELA, of groups I and II,
were performed by means of the Limits Of Agreement (LOA); iii) CLA values of
group II were compared with ELA using scatterplots and paired T-tests; iv)
Determination of the number (relative frequency) of subjects of groups II-IV, in
whom the ELA exceeded its ULN and iv) The difference between the four
COPD grades was judged in terms of the one-way ANOVA followed by the
multiple comparison of the Turkey test. Analyses were carried out using
Statistica software (Statistica Kernel version 6; StatSoft, Paris, France).
Significance was set at the 0.05 level.
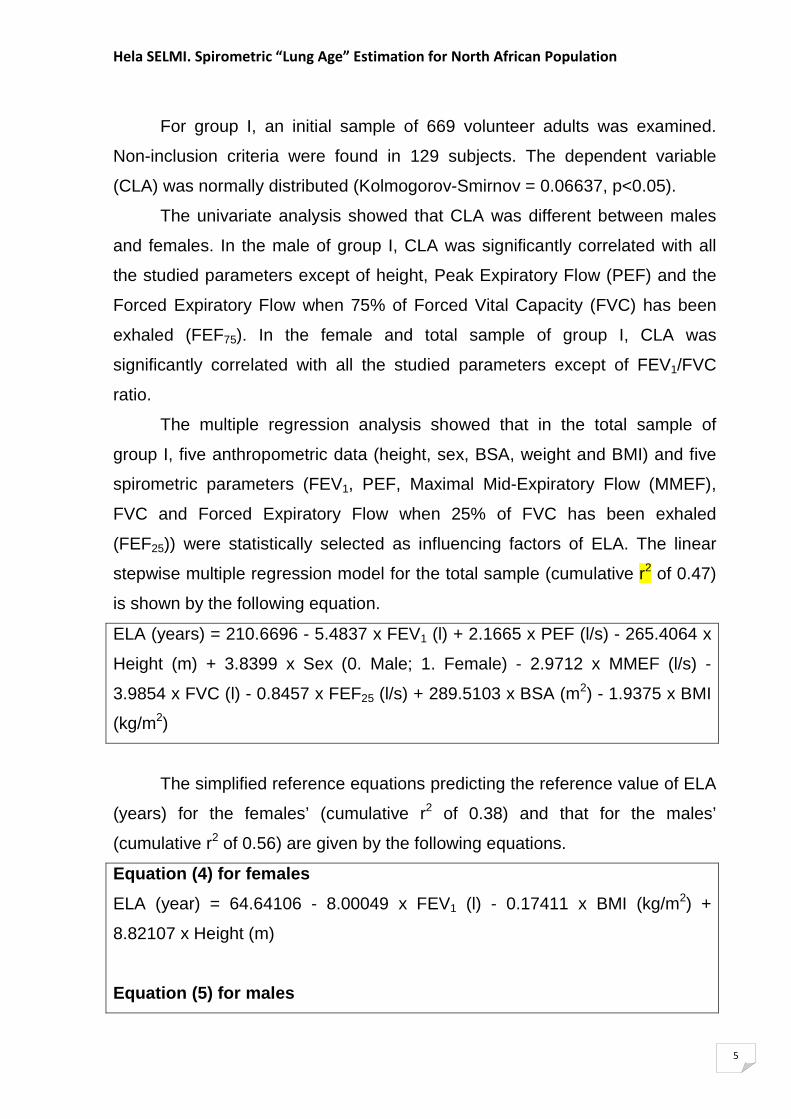
Hela SELMI. Spirometric “Lung Age” Estimation for North African Population
5
For group I, an initial sample of 669 volunteer adults was examined.
Non-inclusion criteria were found in 129 subjects. The dependent variable
(CLA) was normally distributed (Kolmogorov-Smirnov = 0.06637, p<0.05).
The univariate analysis showed that CLA was different between males
and females. In the male of group I, CLA was significantly correlated with all
the studied parameters except of height, Peak Expiratory Flow (PEF) and the
Forced Expiratory Flow when 75% of Forced Vital Capacity (FVC) has been
exhaled (FEF75). In the female and total sample of group I, CLA was
significantly correlated with all the studied parameters except of FEV1/FVC
ratio.
The multiple regression analysis showed that in the total sample of
group I, five anthropometric data (height, sex, BSA, weight and BMI) and five
spirometric parameters (FEV1, PEF, Maximal Mid-Expiratory Flow (MMEF),
FVC and Forced Expiratory Flow when 25% of FVC has been exhaled
(FEF25)) were statistically selected as influencing factors of ELA. The linear
stepwise multiple regression model for the total sample (cumulative r2 of 0.47)
is shown by the following equation.
ELA (years) = 210.6696 - 5.4837 x FEV1 (l) + 2.1665 x PEF (l/s) - 265.4064 x
Height (m) + 3.8399 x Sex (0. Male; 1. Female) - 2.9712 x MMEF (l/s) -
3.9854 x FVC (l) - 0.8457 x FEF25 (l/s) + 289.5103 x BSA (m2) - 1.9375 x BMI
(kg/m2)
The simplified reference equations predicting the reference value of ELA
(years) for the females’ (cumulative r2 of 0.38) and that for the males’
(cumulative r2 of 0.56) are given by the following equations.
Equation (4) for females
ELA (year) = 64.64106 - 8.00049 x FEV1 (l) - 0.17411 x BMI (kg/m2) +
8.82107 x Height (m)
Equation (5) for males
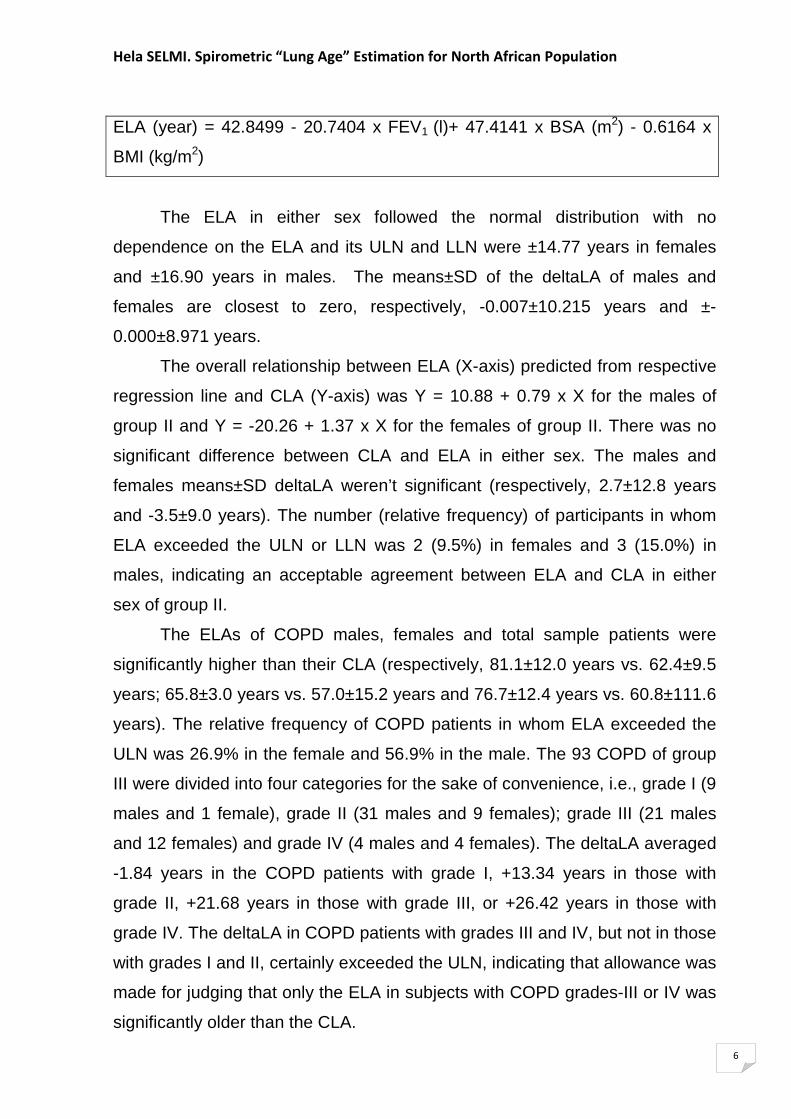
Hela SELMI. Spirometric “Lung Age” Estimation for North African Population
6
ELA (year) = 42.8499 - 20.7404 x FEV1 (l)+ 47.4141 x BSA (m2) - 0.6164 x
BMI (kg/m2)
The ELA in either sex followed the normal distribution with no
dependence on the ELA and its ULN and LLN were ±14.77 years in females
and ±16.90 years in males. The means±SD of the deltaLA of males and
females are closest to zero, respectively, -0.007±10.215 years and ±-
0.000±8.971 years.
The overall relationship between ELA (X-axis) predicted from respective
regression line and CLA (Y-axis) was Y = 10.88 + 0.79 x X for the males of
group II and Y = -20.26 + 1.37 x X for the females of group II. There was no
significant difference between CLA and ELA in either sex. The males and
females means±SD deltaLA weren’t significant (respectively, 2.7±12.8 years
and -3.5±9.0 years). The number (relative frequency) of participants in whom
ELA exceeded the ULN or LLN was 2 (9.5%) in females and 3 (15.0%) in
males, indicating an acceptable agreement between ELA and CLA in either
sex of group II.
The ELAs of COPD males, females and total sample patients were
significantly higher than their CLA (respectively, 81.1±12.0 years vs. 62.4±9.5
years; 65.8±3.0 years vs. 57.0±15.2 years and 76.7±12.4 years vs. 60.8±111.6
years). The relative frequency of COPD patients in whom ELA exceeded the
ULN was 26.9% in the female and 56.9% in the male. The 93 COPD of group
III were divided into four categories for the sake of convenience, i.e., grade I (9
males and 1 female), grade II (31 males and 9 females); grade III (21 males
and 12 females) and grade IV (4 males and 4 females). The deltaLA averaged
-1.84 years in the COPD patients with grade I, +13.34 years in those with
grade II, +21.68 years in those with grade III, or +26.42 years in those with
grade IV. The deltaLA in COPD patients with grades III and IV, but not in those
with grades I and II, certainly exceeded the ULN, indicating that allowance was
made for judging that only the ELA in subjects with COPD grades-III or IV was
significantly older than the CLA.
Hela SELMI. Spirometric “Lung Age” Estimation for North African Population
7
The ELAs of severe OSA males and total sample patients were
significantly higher than their CLA. The relative frequency of severe OSA
patients in whom ELA exceeded the ULN was 5.5% in females and 30.9% in
males.
We would recommend three-step procedure when judging the
abnormality in ELA.
The first thing to do is to examine whether the deltaLA exists within
normal limits formed by ULN and LLN, i.e., ±16.90 years in the male and
±14.77 years in the female. If deltaLA:
(1) Exists within ULN and LLN, the ELA of a person should be interpreted to
be consistent with his/her CLA, even when the ELA is above or below the
CLA.
(2) Exceeds ULN, the ELA is judged to be older than the CLA.
(3) Is below LLN, the ELA is judged to be younger than the CLA.
In conclusion, we found that our newly developed equations could
predict not only the equality between ELA and CLA in group II within an
allowable margin of error but also the incremental disparity between ELA and
CLA in groups III and IV with COPD or severe OAS. Thus, we concluded that
the presented reference equations would be practically useful in a clinical
setting in North African population.

RRRReferenceeferenceeferenceeferencessss
41
1. Doll R., Peto R., Boreham J et al. Mortality in relation to smoking: 50 years’ observations on male British doctors. BMJ 2004;328:1519-28
2. James AL., Palmer LJ., Kicic E et al. Decline in lung function in the Busselton health study: the effects of asthma and cigarette smoking. Am J Respir Crit Care Med 2005;171:109-14
3. Kohansal R., Martinez-Camblor P., Agustí A et al. The natural history of chronic airflow obstruction revisited: an analysis of the Framingham offspring cohort. Am J Respir Crit Care Med 2009;180:3-10
4. Kerstjens H., Rijcken B., Schouten J et al. Decline of FEV1 by age and smoking status: facts, figures, and fallacies. Thorax 1997;52:820-7
5. Morris J., Temple W. Spirometric «lung age» estimation for motivating smoking cessation. Prev Med 1985;14:655-62
6. Petty T. Simple office spirometry. Clin Chest Med 2001;22:845-59 7. Newbury W., Newbury J., Briggs N et al. Exploring the need to update
lung age equations. Prim Care Respir J 2010;19:242-7 8. Hansen JE., Sun XG., Wasserman K. Calculating gambling odds and
lung ages for smokers. Eur Respir J 2010;35:776-80 9. Yamaguchi K., Omori H., Onoue A et al. Novel regression equations
predicting lung age from varied spirometric parameters. Respir Physiol Neurobiol 2012;183:108-14
10. Morris J., Koski A., Johnson L. Spirometric standards for healthy non-smoking adults. Am Rev Resp Dis 1971;103:57-67
11. Miller A., Thornton J. The interpretation of spirometric measurements in epidemiologic surveys. Environ Res 1980;23:444-68
12. Elhraiech A. Estimated lung age in healthy Mediterranean adults cannot be predicted using reference equations derived from other populations. Faculty of Medicine of Sousse (Tunisia). 2012, Number not yet attributed.
13. Yamaguchi K., Onizawa S., Tsuji T et al. How to evaluate “spirometric” lung age-what method is approvable? Respir Physiol Neurobiol 2011;178:349-51
14. Bougrida M., Ben Saad H., Kheireddinne Bourahli M et al. Spirometric reference equations for Algerians aged 19 to 73 years. Rev Mal Respir 2008;25:577-90
15. Ben Saad H., Prefaut C., Tabka Z et al. 6-minute walk distance in healthy North Africans older than 40 years: influence of parity. Respir Med 2009;103:74-84
16. Rouatbi S., Ben Saad H., Latiri I et al. North African references of alveolar membrane diffusion capacity and pulmonary capillary blood volume. Respiration 2010;80:301-12
17. Ben Saad H., Rouatbi S., Raoudha S et al. Vital capacity and peak expiratory flow rates in a North-African population aged 60 years and over: influence of anthropometric data and parity. Rev Mal Respir 2003;20:521-30
18. Bouzgarou M., Ben Saad H., Chouchane A et al. North African reference equation for peak nasal inspiratory flow. J Laryngol Otol 2011;28:1-8
19. Ben Saad H., Tfifha M., Harrabi I et al. Factors influencing spirometric variables of Tunisian women aged 45 years and more. Rev Mal Respir 2006;23:324-38
42
20. Tabka Z., Hassayoune H., Guenard H et al. Spirometric reference values in a Tunisian population. Tunis Med 1995;73:125-31
21. American thoracic society. Lung function testing: selection of reference values and interpretative strategies. Am Rev Resp Dis 1991;144:1202-18
22. Quanjer PH., Tammeling GJ., Cotes JE et al. Lung volumes and forced spirometric flows: report working party standardization of lung function tests, European community for steel and coal. Official statement of the European respiratory society. Eur Respir J 1993;6 (suppl 16):5-40
23. Vestbo J., Hurd SS., Agusti AG et al. Global strategy for the diagnosis, management and prevention of chronic obstructive pulmonary disease, GOLD executive summary. Am J Respir Crit Care Med 2012. doi: 10.1164/rccm.201204-0596PP
24. Ferris BG. Epidemiology standardization project II: recommended respiratory disease questionnaires for use with adults and children in epidemiological research. Am Rev Respir Dis 1978;118:7-52.
25. Tockman MS., Pearson JD., Fleg JL et al. Rapid decline in FEV1: a new risk factor for coronary heart disease mortality. Am J Respir Crit Care Med 1995;151:390-8
26. Ben Saad H. The narghile and its effects on health. Part I: the narghile, general description and properties. Rev Pneumol Clin 2009;65:369-75
27. Ben Saad H. The narghile and its effects on health. Part II: the effects of the narghile on health. Rev Pneumol Clin 2010;66:132-44
28. Quanjer PH., Hall GL., Stanojevic S et al. Age- and height-based prediction bias in spirometry reference equations. Eur Respir J 2012;40:190-7
29. World health organization. Obesity: preventing and managing the global epidemic. Report of a WHO consultation on obesity. Geneva, 3-5 june 1997;1998.
30. Dubois D., Dubois EF. A formula to estimate the appropriate surface area if height and weight be known. Arch Intern Med 1916;17:863-71
31. Miller MR., Hankinson J., Brusasco V et al. Standardization of spirometry. Eur Respir J 2005;26:319-38
32. Pellegrino R., Viegi G., Brusasco V et al. Interpretative strategies for lung function tests. Eur Respir J 2005;26:948-68
33. Miller MR., Crapo R., Hankinson J et al. General considerations for lung function testing. Eur Respir J 2005;26:153-61
34. Ben Saad H., Préfaut C., Tabka Z et al. The forgotten message from gold: FVC is a primary clinical outcome measure of bronchodilator reversibility in COPD. Pulm Pharmacol Ther 2008;21:767-73
35. Ben Saad H., Ben Attia Saafi R., Rouatbi S et al. Which definition to use when defining reversibility of airway obstruction? Rev Mal Respir 2007;24:1107-15
36. Jenicek M., Cleroux R. Clinical epidemiology: its evolution and role in clinical practice and research. Union Med Can 1985;114:625-32
37. Sall J., Creighton L., Lehman A. Regression and correlation analysis. In: Sall J., Creighton L., Lehman A. (eds.), JMP Start Statistics.3rd ed. SAS Institute Inc., Cary, NC, 2004, pp:219-46.
43
38. Bland JM., Altman DG. Statistical methods for assessing agreement between two methods of clinical measurement. Lancet 1986;1:307-10.
39. Cummings SR. Kicking the habit: Benefits and methods of quitting cigarette smoking. West J Med 1982;137:443-7.
40. Pederson LL., Baskerville JC. Multivariate prediction of smoking cessation following physician advice to quit smoking: a validation study. Prev Med 1983;12:430-6
41. Sherin K. Smoking cessation: the physician’s role. Postgrad Med 1982;72:100-6
42. Davis AL., Faust R., Ordentlich M. Self-help smoking cessation and maintenance programs: a comparative study with 12-month follow-up by the American lung association. Amer J Public Health 1984 ;74:1212-7.
43. Streicher VJ. A minimal-contact smoking cessation program in a health care setting. Public Health Rep 1983; 98:497-502
44. Costa PT., McRae RR. Functional age: a concept and empirical critique, in “proceedings of the research conference on epidemiology of aging, Bethesda, Maryland, 1977.”
45. Toda R., Hoshino T., Kawayana T et al. Validation of lung age measured by spirometry and handy electronic FEV1/FEV6 meter in pulmonary diseases. Intern Med 2009;48:513-21
46. Mitsumune T., Senoh E., Nishikawa H et al. The effect of obesity and smoking status on lung age in Japanese men. Respirology 2009;14:757-60
47. Parker DR., Goldman RE., Eaton CB. A qualitative study of individuals at risk for or who have chronic obstructive pulmonary disease: what do they understand about their disease? Lung 2008;186:313-6.
48. Bednarek M., Gorecka D., Wielgomas J et al. Smokers with airway obstruction are more likely to quit smoking. Thorax 2006;61:869-73
49. White P. Spirometric screening for COPD: wishful thinking, not evidence. Thorax 2007;62:742-3.
50. Parkes G., Greenhalgh T., Griffin M et al. Effect on smoking quit rate of telling patients their lung age: the step2quit randomized controlled trial. BMJ 2008;336:598-600.
51. Lin KW. Study’s conclusion about screening is unwarranted. BMJ 2008;336:1034.
52. Bize R., Burnand B., Muller Y et al. Biomedical risk assessment as an aid for smoking cessation. Cochrane Database Syst Rev 2009;2: CD004705.
53. van der Meer RM., Wagena EJ., Ostelo RW et al. Smoking cessation for chronic obstructive pulmonary disease. Cochrane Database Syst Rev 2003; 2:CD00299.
54. Stead LF., Bergson G., Lancaster T. Physician advice for smoking cessation. Cochrane Database Syst Rev 2008;2:CD000165.
55. Lipkus IM., Prokhorov AV. The effects of providing lung age and respiratory symptoms feedback on community college smokers’ perceived smoking-related health risks, worries and desire to quit. Addictive Behaviors 2007;32:516-32
56. Ben Mdalla S., Rouatbi B., Ben Saad H et al. L’annonce de l’âge pulmonaire aux fumeurs est-elle une motivation au sevrage tabagique?
44
Tunis Med. In press. 57. Schrader PC., Quanjer PH., Borsboom G et al. Evaluating lung function
and anthropometric growth data in a longitudinal study on adolescents. Human Biology 1984;56:365-81
58. Hibbert ME., Hudson IL., Lanigan A et al. Tracking of lung function in healthy children and adolescents. Pediatr Pulmonol 1990;8:172-7
59. Twisk JW., Staal BJ., Brinkman MN et al. Tracking of lung function parameters and the longitudinal relationship with lifestyle. Eur Resp J 1998;12:627-34
60. Weiss ST. Lung function and airway diseases. Nat Genet 2010;42:14-6. 61. Quanjer PH., Enright PL. Should we use lung age? Prim Care Respir J
2010;19:197-9. 62. Falaschetti E., Laiho J., Primatesta P et al. Prediction equations for
normal and low lung function from the Health Survey for England. Eur Respir J 2004;23:456-63
63. Tashkin DP., Celli B., Senn S et al. A 4-year trial of tiotropium in chronic obstructive pulmonary disease. N Engl J Med 2008;359:154-54
64. US preventive services task force. Screening for chronic obstructive pulmonary disease using spirometry: US preventive task force recommendation statement. Ann Intern Med 2008;148:529-34.
65. The report of the special committee of pulmonary physiology of the Japanese respiratory society (JRS). Reference values for spirogram and blood gas analysis in non-smoking healthy adults in Japan. J Jpn Respir Soc 2001; 39:1-17.
66. Tashkin DP., Murray RP. Smoking cessation in chronic obstructive pulmonary disease. Respir Med 2009;103:963-74
67. Fletcher C., Peto R. The natural history of chronic airflow obstruction. BMJ 1977;1:1645-48
68. Bernhard D., Moser C., Backovic A et al. Cigarette smoke - an aging accelator? Exp Gerontol 2007;42:160-5
69. Knuiman M., James A., Divitini M et al. Lung function, respiratory symptoms, and mortality: results from the Busselton health study. Ann Epidemiol 1999;9:297-306
70. MacNee W. Accelerated lung aging: a novel pathogenic mechanism of chronic obstructive pulmonary disease (COPD). Biochem Soc Trans 2009;37:819-23
71. Gore C., Crockett A., Pederson et al. Spirometric standards for healthy adult nonsmokers in Australia. Eur Resp J 1995;5:773-82
72. Hart DA, Reno C. Pregnancy alters gene expression in normal synovium: influence of age and parity. J Rheumatol 1999;26:1775-84
73. Latiri I, Elbey R, Hcini K et al. Six-minute walk test in non-insulin-dependent diabetes mellitus patients living in Northwest Africa. Diabetes Metab Syndr Obes 2012;5:227-45
74. Jauniaux E, Poston L, Burton GJ. Placental-related diseases of pregnancy: involvement of oxidative stress and implications in human evolution. Hum Reprod Update. 2006;12:747-55
AppendixAppendixAppendixAppendix (Copy of the manuscript (Copy of the manuscript (Copy of the manuscript (Copy of the manuscript addressed to “addressed to “addressed to “addressed to “Medical Medical Medical Medical
HypothesesHypothesesHypothesesHypotheses””””)))) Manuscript number: Manuscript number: Manuscript number: Manuscript number: YMEHYYMEHYYMEHYYMEHY----SSSS----13131313----00853008530085300853
45
TITLE PAGE
Title. Estimated lung age in healthy North African adults cannot be predicted using reference equations derived from other populations. Running title. Estimated lung age in North African adults. Authors. Helmi BEN SAAD1-4, Aymen ELHRAIECH3, Khaoula HADJ MABROUK3, Samia BEN MDALLA1, Majda ESSGHAIER1, Chiraz MAATOUG3, Ahmed ABDELGHANI4,5, Hmida BOUSLAH3, Ameur CHARRADA3, Sonia ROUATBI1,2.
ABSTRACT Background. Interpretation of “lung age, LA” data relies upon comparison of the chronological LA (CLA) with the estimated LA (ELA) predicted from published reference equations (Morris and Temple1985, Newbury2010, Hansen2010, Yamaguchi2012). Aims. To test the applicability of the published reference equations in healthy non-smoker Tunisian aged 19-90 years and to choose which one is most appropriate for our population. Methods . Published reference equations were applied to the spirometry results of 540 adults (364 women) (mean±SD of age and height are 48.8±13.1 years and 164±10 cm). Two methods of comparison were applied: i) Determination, according each equation, of the percentages of subjects having a delta LA (=ELA minus CLA) > upper limit of normal (ULN). ii) Bland and Altman comparison, for the same age range as in the corresponding study, between CLA and ELA. The reference equation that provides the limits of agreement closest to zero will be the most appropriate for our population. Results. i) The percentages of healthy subjects with a delta LA > ULN varied from 1% (Newbury) to 64% (Hansen) in men, and from 20% (Yamaguchi) to 51% (Hansen, Morris and Temple) for women. ii) Mean±SD ELA was significantly underestimated by 17±19 years (Hansen), by 12±23 years (Morris and Temple) and was significantly overestimated by 4±19 years (Newbury). However, mean±SD ELA from Yamaguchi2012 wasn’t statistical different from the CLA (1±14 years). Conclusion. Published spirometric ELA reference equations didn’t reliably predict CLA data in Tunisian population. Waiting the establishment of reliable equation proper to North African population, we recommend the use of the Yamaguchi reference equations. Keywords. Lung age; Spirometry; Reference value; Normal limits; Tunisa, North Africa. BACKGROUND
Smoking, shown to be detrimental to health for many years [1-4] , has an adverse effect on the first second Forced Expiratory Volume (FEV1) throughout a lifetime, reducing the maximal FEV1 achieved, bringing forward the age of onset of decline in FEV1, and hastening the rate of decline [5] . The single most useful intervention to improve lung function in smokers, with or without, chronic obstructive pulmonary disease is smoking cessation. One way to increase the quit rate in smokers could be to communicate lung function results in a manner that is easily understood and stimulates the desire to quit.
Estimated Lung Age (ELA) is an estimate that uses the observed spirometric variable (often FEV1) of a smoker to calculate the approximate age of a healthy non-smoker with the same spirometric variable based on predicted values [6] . ELA reference equations were developed as an aid for smoking cessation counselling and the concept has been explored in several recent publications [7-11] . Interpretation of “lung age” data relies upon comparison of the Chronological Lung Age (CLA) values with ELA predicted from available reference equations [7-10] . At our knowledge, only four
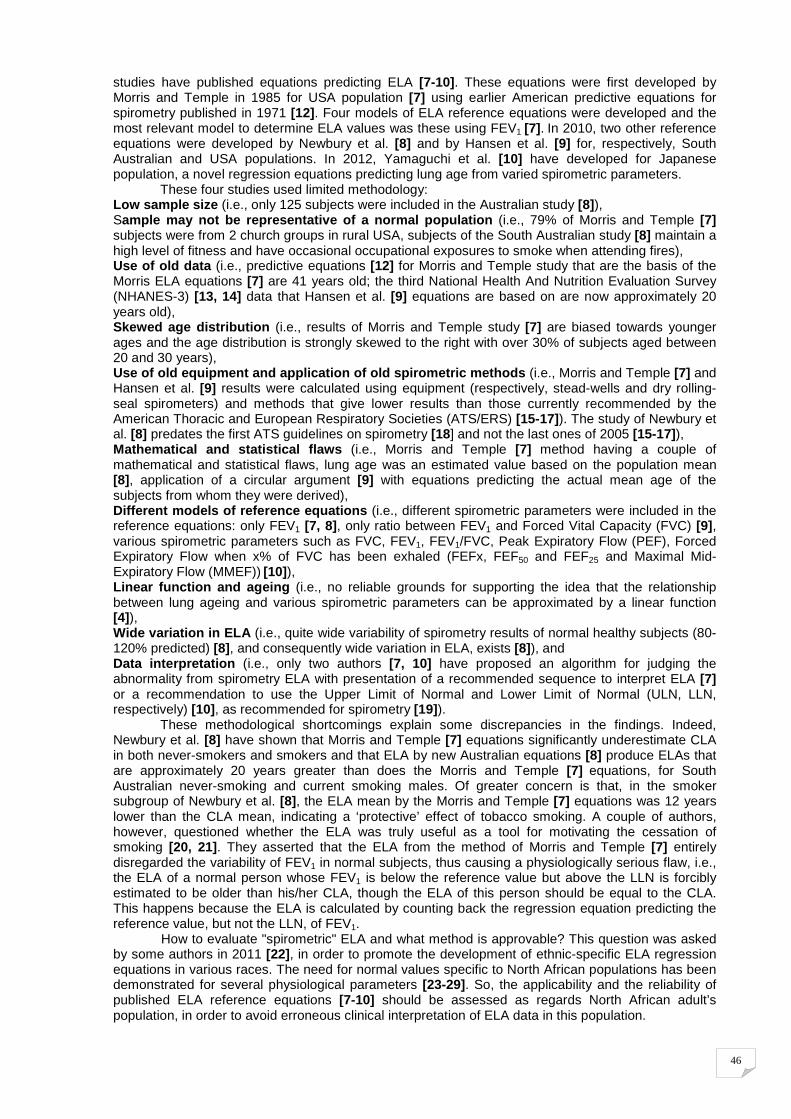
46
studies have published equations predicting ELA [7-10] . These equations were first developed by Morris and Temple in 1985 for USA population [7] using earlier American predictive equations for spirometry published in 1971 [12] . Four models of ELA reference equations were developed and the most relevant model to determine ELA values was these using FEV1 [7] . In 2010, two other reference equations were developed by Newbury et al. [8] and by Hansen et al. [9] for, respectively, South Australian and USA populations. In 2012, Yamaguchi et al. [10] have developed for Japanese population, a novel regression equations predicting lung age from varied spirometric parameters.
These four studies used limited methodology: Low sample size (i.e., only 125 subjects were included in the Australian study [8] ), Sample may not be representative of a normal populat ion (i.e., 79% of Morris and Temple [7] subjects were from 2 church groups in rural USA, subjects of the South Australian study [8] maintain a high level of fitness and have occasional occupational exposures to smoke when attending fires), Use of old data (i.e., predictive equations [12] for Morris and Temple study that are the basis of the Morris ELA equations [7] are 41 years old; the third National Health And Nutrition Evaluation Survey (NHANES-3) [13, 14] data that Hansen et al. [9] equations are based on are now approximately 20 years old), Skewed age distribution (i.e., results of Morris and Temple study [7] are biased towards younger ages and the age distribution is strongly skewed to the right with over 30% of subjects aged between 20 and 30 years), Use of old equipment and application of old spirome tric methods (i.e., Morris and Temple [7] and Hansen et al. [9] results were calculated using equipment (respectively, stead-wells and dry rolling-seal spirometers) and methods that give lower results than those currently recommended by the American Thoracic and European Respiratory Societies (ATS/ERS) [15-17] ). The study of Newbury et al. [8] predates the first ATS guidelines on spirometry [18] and not the last ones of 2005 [15-17] ), Mathematical and statistical flaws (i.e., Morris and Temple [7] method having a couple of mathematical and statistical flaws, lung age was an estimated value based on the population mean [8] , application of a circular argument [9] with equations predicting the actual mean age of the subjects from whom they were derived), Different models of reference equations (i.e., different spirometric parameters were included in the reference equations: only FEV1 [7, 8] , only ratio between FEV1 and Forced Vital Capacity (FVC) [9] , various spirometric parameters such as FVC, FEV1, FEV1/FVC, Peak Expiratory Flow (PEF), Forced Expiratory Flow when x% of FVC has been exhaled (FEFx, FEF50 and FEF25 and Maximal Mid-Expiratory Flow (MMEF)) [10] ), Linear function and ageing (i.e., no reliable grounds for supporting the idea that the relationship between lung ageing and various spirometric parameters can be approximated by a linear function [4] ), Wide variation in ELA (i.e., quite wide variability of spirometry results of normal healthy subjects (80-120% predicted) [8] , and consequently wide variation in ELA, exists [8] ), and Data interpretation (i.e., only two authors [7, 10] have proposed an algorithm for judging the abnormality from spirometry ELA with presentation of a recommended sequence to interpret ELA [7] or a recommendation to use the Upper Limit of Normal and Lower Limit of Normal (ULN, LLN, respectively) [10] , as recommended for spirometry [19] ). These methodological shortcomings explain some discrepancies in the findings. Indeed, Newbury et al. [8] have shown that Morris and Temple [7] equations significantly underestimate CLA in both never-smokers and smokers and that ELA by new Australian equations [8] produce ELAs that are approximately 20 years greater than does the Morris and Temple [7] equations, for South Australian never-smoking and current smoking males. Of greater concern is that, in the smoker subgroup of Newbury et al. [8] , the ELA mean by the Morris and Temple [7] equations was 12 years lower than the CLA mean, indicating a ‘protective’ effect of tobacco smoking. A couple of authors, however, questioned whether the ELA was truly useful as a tool for motivating the cessation of smoking [20, 21] . They asserted that the ELA from the method of Morris and Temple [7] entirely disregarded the variability of FEV1 in normal subjects, thus causing a physiologically serious flaw, i.e., the ELA of a normal person whose FEV1 is below the reference value but above the LLN is forcibly estimated to be older than his/her CLA, though the ELA of this person should be equal to the CLA. This happens because the ELA is calculated by counting back the regression equation predicting the reference value, but not the LLN, of FEV1.
How to evaluate "spirometric" ELA and what method is approvable? This question was asked by some authors in 2011 [22] , in order to promote the development of ethnic-specific ELA regression equations in various races. The need for normal values specific to North African populations has been demonstrated for several physiological parameters [23-29] . So, the applicability and the reliability of published ELA reference equations [7-10] should be assessed as regards North African adult’s population, in order to avoid erroneous clinical interpretation of ELA data in this population.
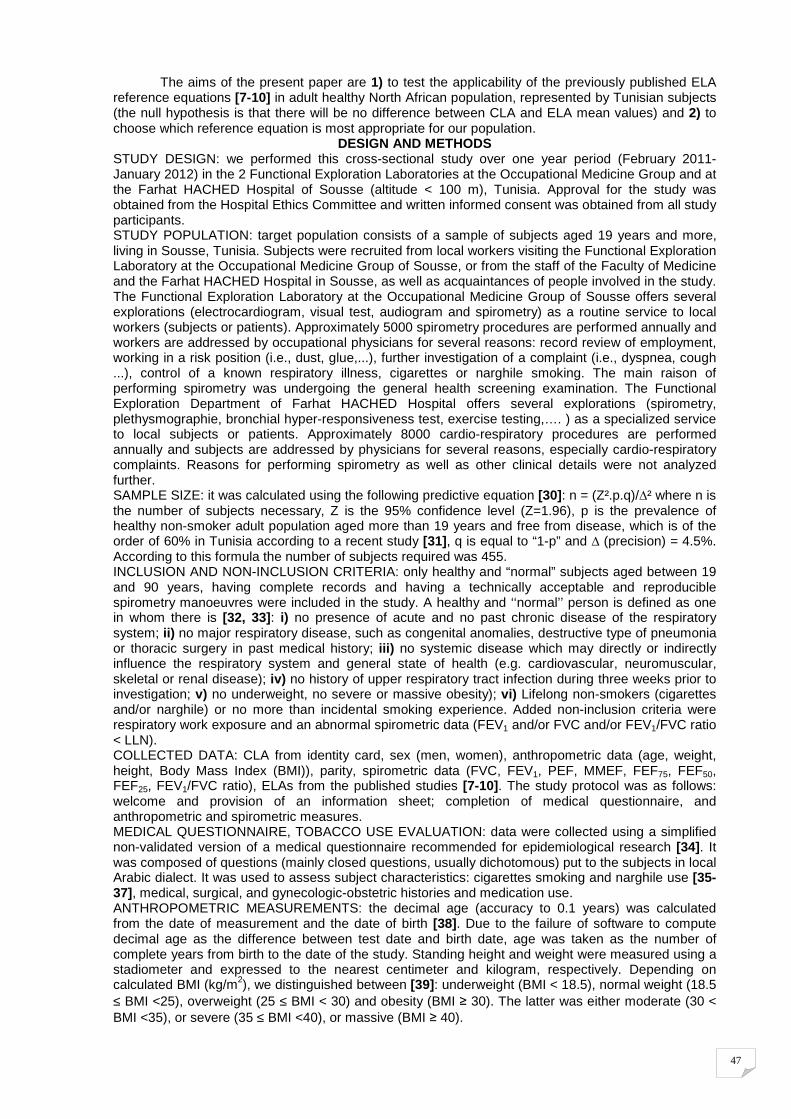
47
The aims of the present paper are 1) to test the applicability of the previously published ELA reference equations [7-10] in adult healthy North African population, represented by Tunisian subjects (the null hypothesis is that there will be no difference between CLA and ELA mean values) and 2) to choose which reference equation is most appropriate for our population.
DESIGN AND METHODS STUDY DESIGN: we performed this cross-sectional study over one year period (February 2011-January 2012) in the 2 Functional Exploration Laboratories at the Occupational Medicine Group and at the Farhat HACHED Hospital of Sousse (altitude < 100 m), Tunisia. Approval for the study was obtained from the Hospital Ethics Committee and written informed consent was obtained from all study participants. STUDY POPULATION: target population consists of a sample of subjects aged 19 years and more, living in Sousse, Tunisia. Subjects were recruited from local workers visiting the Functional Exploration Laboratory at the Occupational Medicine Group of Sousse, or from the staff of the Faculty of Medicine and the Farhat HACHED Hospital in Sousse, as well as acquaintances of people involved in the study. The Functional Exploration Laboratory at the Occupational Medicine Group of Sousse offers several explorations (electrocardiogram, visual test, audiogram and spirometry) as a routine service to local workers (subjects or patients). Approximately 5000 spirometry procedures are performed annually and workers are addressed by occupational physicians for several reasons: record review of employment, working in a risk position (i.e., dust, glue,...), further investigation of a complaint (i.e., dyspnea, cough ...), control of a known respiratory illness, cigarettes or narghile smoking. The main raison of performing spirometry was undergoing the general health screening examination. The Functional Exploration Department of Farhat HACHED Hospital offers several explorations (spirometry, plethysmographie, bronchial hyper-responsiveness test, exercise testing,…. ) as a specialized service to local subjects or patients. Approximately 8000 cardio-respiratory procedures are performed annually and subjects are addressed by physicians for several reasons, especially cardio-respiratory complaints. Reasons for performing spirometry as well as other clinical details were not analyzed further. SAMPLE SIZE: it was calculated using the following predictive equation [30] : n = (Z².p.q)/∆² where n is the number of subjects necessary, Z is the 95% confidence level (Z=1.96), p is the prevalence of healthy non-smoker adult population aged more than 19 years and free from disease, which is of the order of 60% in Tunisia according to a recent study [31] , q is equal to “1-p” and ∆ (precision) = 4.5%. According to this formula the number of subjects required was 455. INCLUSION AND NON-INCLUSION CRITERIA: only healthy and “normal” subjects aged between 19 and 90 years, having complete records and having a technically acceptable and reproducible spirometry manoeuvres were included in the study. A healthy and ‘‘normal’’ person is defined as one in whom there is [32, 33] : i) no presence of acute and no past chronic disease of the respiratory system; ii) no major respiratory disease, such as congenital anomalies, destructive type of pneumonia or thoracic surgery in past medical history; iii) no systemic disease which may directly or indirectly influence the respiratory system and general state of health (e.g. cardiovascular, neuromuscular, skeletal or renal disease); iv) no history of upper respiratory tract infection during three weeks prior to investigation; v) no underweight, no severe or massive obesity); vi) Lifelong non-smokers (cigarettes and/or narghile) or no more than incidental smoking experience. Added non-inclusion criteria were respiratory work exposure and an abnormal spirometric data (FEV1 and/or FVC and/or FEV1/FVC ratio < LLN). COLLECTED DATA: CLA from identity card, sex (men, women), anthropometric data (age, weight, height, Body Mass Index (BMI)), parity, spirometric data (FVC, FEV1, PEF, MMEF, FEF75, FEF50, FEF25, FEV1/FVC ratio), ELAs from the published studies [7-10] . The study protocol was as follows: welcome and provision of an information sheet; completion of medical questionnaire, and anthropometric and spirometric measures. MEDICAL QUESTIONNAIRE, TOBACCO USE EVALUATION: data were collected using a simplified non-validated version of a medical questionnaire recommended for epidemiological research [34] . It was composed of questions (mainly closed questions, usually dichotomous) put to the subjects in local Arabic dialect. It was used to assess subject characteristics: cigarettes smoking and narghile use [35-37], medical, surgical, and gynecologic-obstetric histories and medication use. ANTHROPOMETRIC MEASUREMENTS: the decimal age (accuracy to 0.1 years) was calculated from the date of measurement and the date of birth [38] . Due to the failure of software to compute decimal age as the difference between test date and birth date, age was taken as the number of complete years from birth to the date of the study. Standing height and weight were measured using a stadiometer and expressed to the nearest centimeter and kilogram, respectively. Depending on calculated BMI (kg/m2), we distinguished between [39] : underweight (BMI < 18.5), normal weight (18.5 ≤ BMI <25), overweight (25 ≤ BMI < 30) and obesity (BMI ≥ 30). The latter was either moderate (30 < BMI <35), or severe (35 ≤ BMI <40), or massive (BMI ≥ 40).
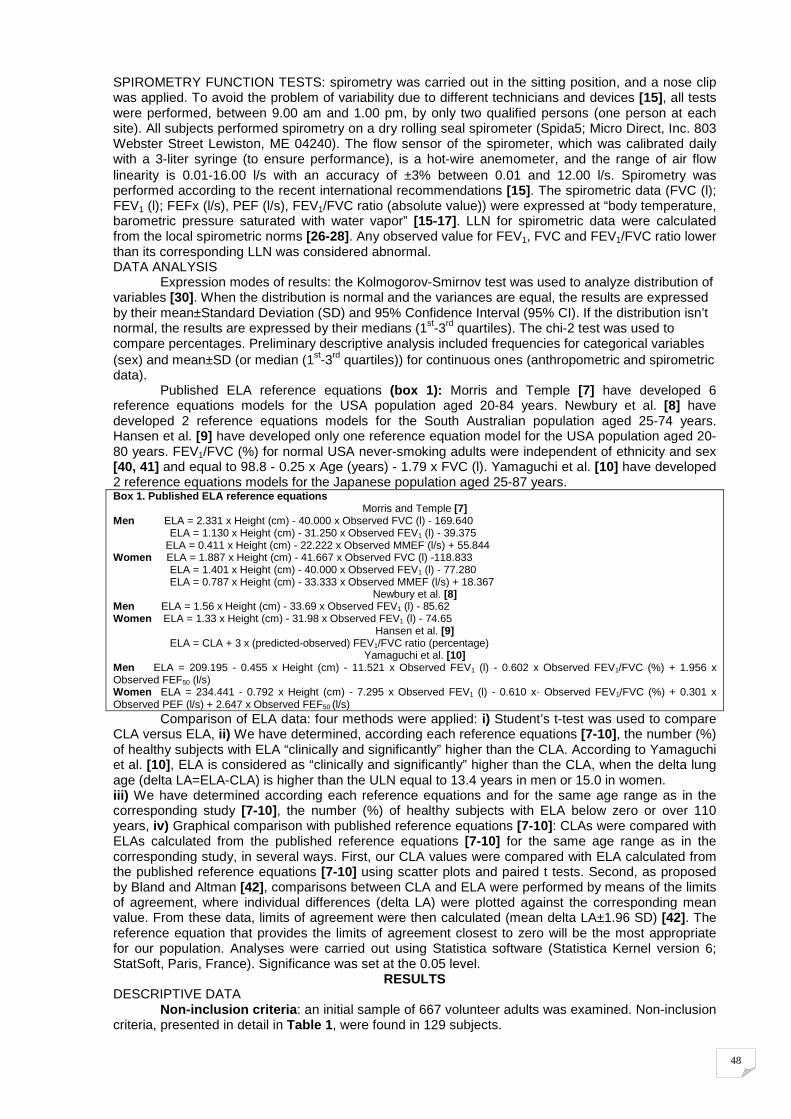
48
SPIROMETRY FUNCTION TESTS: spirometry was carried out in the sitting position, and a nose clip was applied. To avoid the problem of variability due to different technicians and devices [15] , all tests were performed, between 9.00 am and 1.00 pm, by only two qualified persons (one person at each site). All subjects performed spirometry on a dry rolling seal spirometer (Spida5; Micro Direct, Inc. 803 Webster Street Lewiston, ME 04240). The flow sensor of the spirometer, which was calibrated daily with a 3-liter syringe (to ensure performance), is a hot-wire anemometer, and the range of air flow linearity is 0.01-16.00 l/s with an accuracy of ±3% between 0.01 and 12.00 l/s. Spirometry was performed according to the recent international recommendations [15] . The spirometric data (FVC (l); FEV1 (l); FEFx (l/s), PEF (l/s), FEV1/FVC ratio (absolute value)) were expressed at “body temperature, barometric pressure saturated with water vapor” [15-17] . LLN for spirometric data were calculated from the local spirometric norms [26-28] . Any observed value for FEV1, FVC and FEV1/FVC ratio lower than its corresponding LLN was considered abnormal. DATA ANALYSIS
Expression modes of results: the Kolmogorov-Smirnov test was used to analyze distribution of variables [30] . When the distribution is normal and the variances are equal, the results are expressed by their mean±Standard Deviation (SD) and 95% Confidence Interval (95% CI). If the distribution isn’t normal, the results are expressed by their medians (1st-3rd quartiles). The chi-2 test was used to compare percentages. Preliminary descriptive analysis included frequencies for categorical variables (sex) and mean±SD (or median (1st-3rd quartiles)) for continuous ones (anthropometric and spirometric data).
Published ELA reference equations (box 1): Morris and Temple [7] have developed 6 reference equations models for the USA population aged 20-84 years. Newbury et al. [8] have developed 2 reference equations models for the South Australian population aged 25-74 years. Hansen et al. [9] have developed only one reference equation model for the USA population aged 20-80 years. FEV1/FVC (%) for normal USA never-smoking adults were independent of ethnicity and sex [40, 41] and equal to 98.8 - 0.25 x Age (years) - 1.79 x FVC (l). Yamaguchi et al. [10] have developed 2 reference equations models for the Japanese population aged 25-87 years. Box 1. Published ELA reference equations
Morris and Temple [7] Men ELA = 2.331 x Height (cm) - 40.000 x Observed FVC (l) - 169.640
ELA = 1.130 x Height (cm) - 31.250 x Observed FEV1 (l) - 39.375 ELA = 0.411 x Height (cm) - 22.222 x Observed MMEF (l/s) + 55.844
Women ELA = 1.887 x Height (cm) - 41.667 x Observed FVC (l) -118.833 ELA = 1.401 x Height (cm) - 40.000 x Observed FEV1 (l) - 77.280 ELA = 0.787 x Height (cm) - 33.333 x Observed MMEF (l/s) + 18.367
Newbury et al. [8] Men ELA = 1.56 x Height (cm) - 33.69 x Observed FEV1 (l) - 85.62 Women ELA = 1.33 x Height (cm) - 31.98 x Observed FEV1 (l) - 74.65
Hansen et al. [9] ELA = CLA + 3 x (predicted-observed) FEV1/FVC ratio (percentage)
Yamaguchi et al. [10] Men ELA = 209.195 - 0.455 x Height (cm) - 11.521 x Observed FEV1 (l) - 0.602 x Observed FEV1/FVC (%) + 1.956 x Observed FEF50 (l/s) Women ELA = 234.441 - 0.792 x Height (cm) - 7.295 x Observed FEV1 (l) - 0.610 x· Observed FEV1/FVC (%) + 0.301 x Observed PEF (l/s) + 2.647 x Observed FEF50 (l/s)
Comparison of ELA data: four methods were applied: i) Student’s t-test was used to compare CLA versus ELA, ii) We have determined, according each reference equations [7-10] , the number (%) of healthy subjects with ELA “clinically and significantly” higher than the CLA. According to Yamaguchi et al. [10] , ELA is considered as “clinically and significantly” higher than the CLA, when the delta lung age (delta LA=ELA-CLA) is higher than the ULN equal to 13.4 years in men or 15.0 in women. iii) We have determined according each reference equations and for the same age range as in the corresponding study [7-10] , the number (%) of healthy subjects with ELA below zero or over 110 years, iv) Graphical comparison with published reference equations [7-10] : CLAs were compared with ELAs calculated from the published reference equations [7-10] for the same age range as in the corresponding study, in several ways. First, our CLA values were compared with ELA calculated from the published reference equations [7-10] using scatter plots and paired t tests. Second, as proposed by Bland and Altman [42] , comparisons between CLA and ELA were performed by means of the limits of agreement, where individual differences (delta LA) were plotted against the corresponding mean value. From these data, limits of agreement were then calculated (mean delta LA±1.96 SD) [42] . The reference equation that provides the limits of agreement closest to zero will be the most appropriate for our population. Analyses were carried out using Statistica software (Statistica Kernel version 6; StatSoft, Paris, France). Significance was set at the 0.05 level.
RESULTS DESCRIPTIVE DATA Non-inclusion criteria: an initial sample of 667 volunteer adults was examined. Non-inclusion criteria, presented in detail in Table 1, were found in 129 subjects.
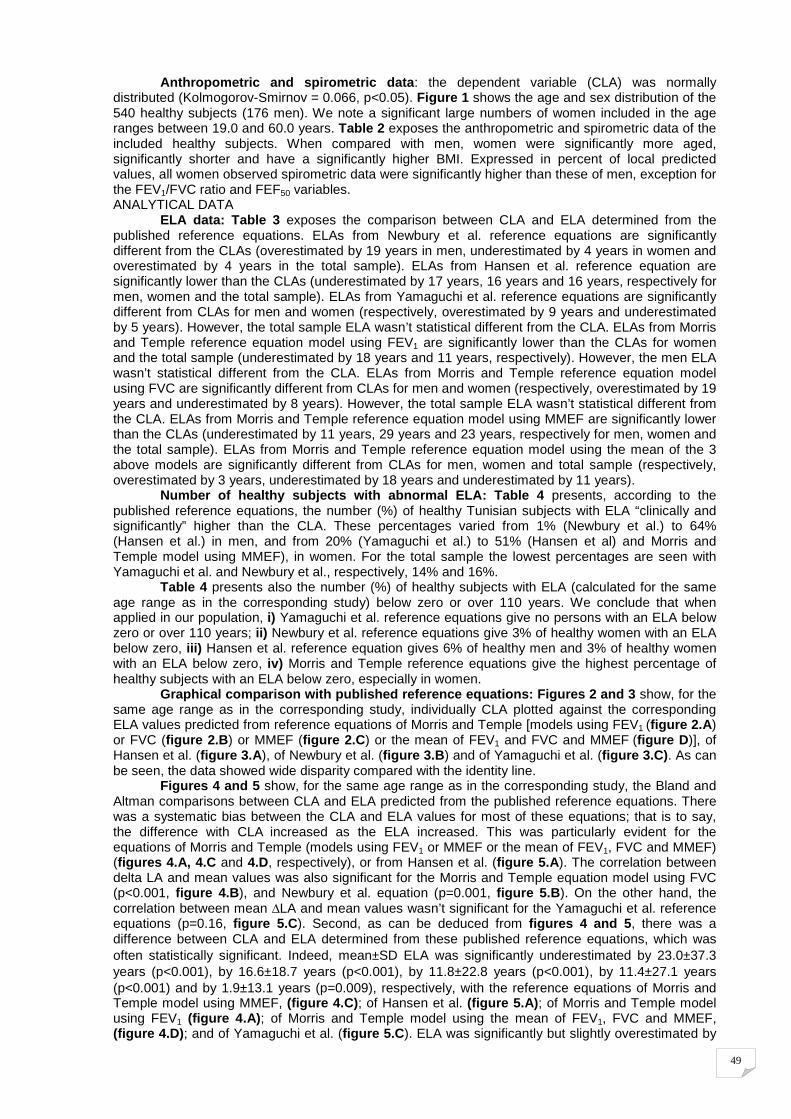
49
Anthropometric and spirometric data: the dependent variable (CLA) was normally distributed (Kolmogorov-Smirnov = 0.066, p<0.05). Figure 1 shows the age and sex distribution of the 540 healthy subjects (176 men). We note a significant large numbers of women included in the age ranges between 19.0 and 60.0 years. Table 2 exposes the anthropometric and spirometric data of the included healthy subjects. When compared with men, women were significantly more aged, significantly shorter and have a significantly higher BMI. Expressed in percent of local predicted values, all women observed spirometric data were significantly higher than these of men, exception for the FEV1/FVC ratio and FEF50 variables. ANALYTICAL DATA
ELA data: Table 3 exposes the comparison between CLA and ELA determined from the published reference equations. ELAs from Newbury et al. reference equations are significantly different from the CLAs (overestimated by 19 years in men, underestimated by 4 years in women and overestimated by 4 years in the total sample). ELAs from Hansen et al. reference equation are significantly lower than the CLAs (underestimated by 17 years, 16 years and 16 years, respectively for men, women and the total sample). ELAs from Yamaguchi et al. reference equations are significantly different from CLAs for men and women (respectively, overestimated by 9 years and underestimated by 5 years). However, the total sample ELA wasn’t statistical different from the CLA. ELAs from Morris and Temple reference equation model using FEV1 are significantly lower than the CLAs for women and the total sample (underestimated by 18 years and 11 years, respectively). However, the men ELA wasn’t statistical different from the CLA. ELAs from Morris and Temple reference equation model using FVC are significantly different from CLAs for men and women (respectively, overestimated by 19 years and underestimated by 8 years). However, the total sample ELA wasn’t statistical different from the CLA. ELAs from Morris and Temple reference equation model using MMEF are significantly lower than the CLAs (underestimated by 11 years, 29 years and 23 years, respectively for men, women and the total sample). ELAs from Morris and Temple reference equation model using the mean of the 3 above models are significantly different from CLAs for men, women and total sample (respectively, overestimated by 3 years, underestimated by 18 years and underestimated by 11 years).
Number of healthy subjects with abnormal ELA: Table 4 presents, according to the published reference equations, the number (%) of healthy Tunisian subjects with ELA “clinically and significantly” higher than the CLA. These percentages varied from 1% (Newbury et al.) to 64% (Hansen et al.) in men, and from 20% (Yamaguchi et al.) to 51% (Hansen et al) and Morris and Temple model using MMEF), in women. For the total sample the lowest percentages are seen with Yamaguchi et al. and Newbury et al., respectively, 14% and 16%.
Table 4 presents also the number (%) of healthy subjects with ELA (calculated for the same age range as in the corresponding study) below zero or over 110 years. We conclude that when applied in our population, i) Yamaguchi et al. reference equations give no persons with an ELA below zero or over 110 years; ii) Newbury et al. reference equations give 3% of healthy women with an ELA below zero, iii) Hansen et al. reference equation gives 6% of healthy men and 3% of healthy women with an ELA below zero, iv) Morris and Temple reference equations give the highest percentage of healthy subjects with an ELA below zero, especially in women.
Graphical comparison with published reference equations: Figures 2 and 3 show, for the same age range as in the corresponding study, individually CLA plotted against the corresponding ELA values predicted from reference equations of Morris and Temple [models using FEV1 (figure 2.A ) or FVC (figure 2.B ) or MMEF (figure 2.C ) or the mean of FEV1 and FVC and MMEF (figure D )], of Hansen et al. (figure 3.A ), of Newbury et al. (figure 3.B ) and of Yamaguchi et al. (figure 3.C) . As can be seen, the data showed wide disparity compared with the identity line.
Figures 4 and 5 show, for the same age range as in the corresponding study, the Bland and Altman comparisons between CLA and ELA predicted from the published reference equations. There was a systematic bias between the CLA and ELA values for most of these equations; that is to say, the difference with CLA increased as the ELA increased. This was particularly evident for the equations of Morris and Temple (models using FEV1 or MMEF or the mean of FEV1, FVC and MMEF) (figures 4.A, 4.C and 4.D, respectively), or from Hansen et al. (figure 5.A ). The correlation between delta LA and mean values was also significant for the Morris and Temple equation model using FVC (p<0.001, figure 4.B ), and Newbury et al. equation (p=0.001, figure 5.B ). On the other hand, the correlation between mean ∆LA and mean values wasn’t significant for the Yamaguchi et al. reference equations (p=0.16, figure 5.C ). Second, as can be deduced from figures 4 and 5 , there was a difference between CLA and ELA determined from these published reference equations, which was often statistically significant. Indeed, mean±SD ELA was significantly underestimated by 23.0±37.3 years (p<0.001), by 16.6±18.7 years (p<0.001), by 11.8±22.8 years (p<0.001), by 11.4±27.1 years (p<0.001) and by 1.9±13.1 years (p=0.009), respectively, with the reference equations of Morris and Temple model using MMEF, (figure 4.C) ; of Hansen et al. (figure 5.A) ; of Morris and Temple model using FEV1 (figure 4.A) ; of Morris and Temple model using the mean of FEV1, FVC and MMEF, (figure 4.D) ; and of Yamaguchi et al. (figure 5.C ). ELA was significantly but slightly overestimated by
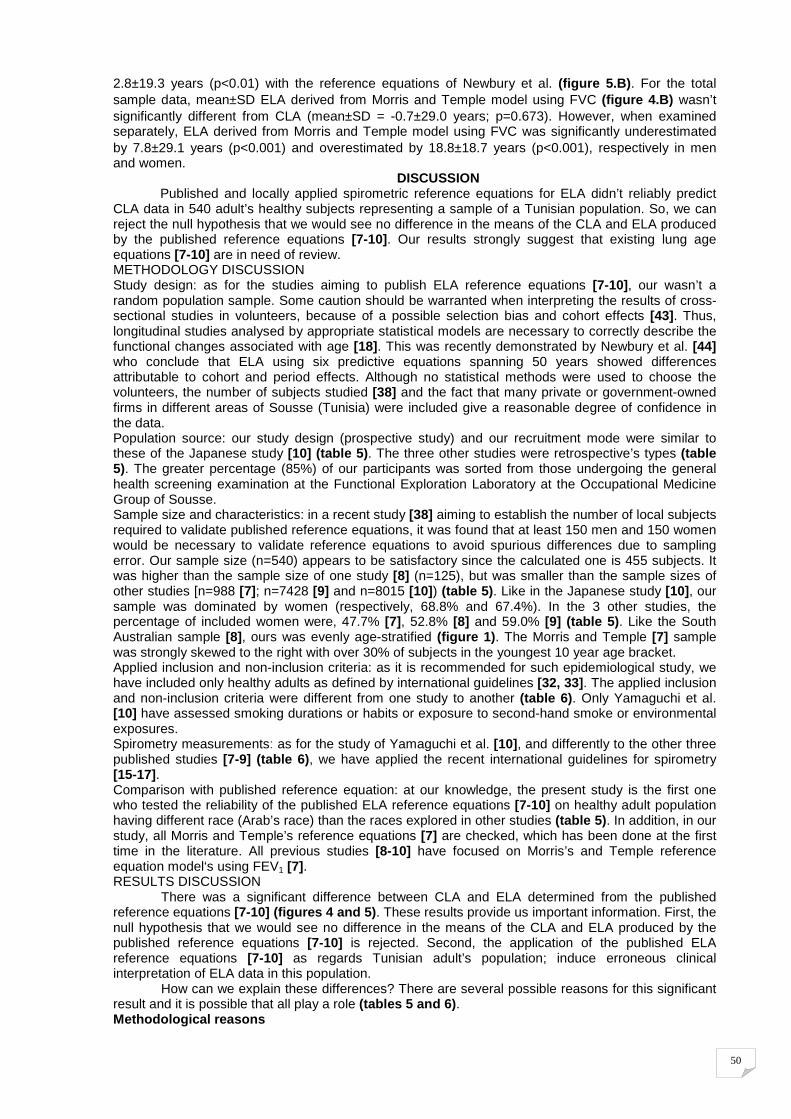
50
2.8±19.3 years (p<0.01) with the reference equations of Newbury et al. (figure 5.B) . For the total sample data, mean±SD ELA derived from Morris and Temple model using FVC (figure 4.B) wasn’t significantly different from CLA (mean±SD = -0.7±29.0 years; p=0.673). However, when examined separately, ELA derived from Morris and Temple model using FVC was significantly underestimated by 7.8±29.1 years (p<0.001) and overestimated by 18.8±18.7 years (p<0.001), respectively in men and women.
DISCUSSION Published and locally applied spirometric reference equations for ELA didn’t reliably predict
CLA data in 540 adult’s healthy subjects representing a sample of a Tunisian population. So, we can reject the null hypothesis that we would see no difference in the means of the CLA and ELA produced by the published reference equations [7-10] . Our results strongly suggest that existing lung age equations [7-10] are in need of review. METHODOLOGY DISCUSSION Study design: as for the studies aiming to publish ELA reference equations [7-10] , our wasn’t a random population sample. Some caution should be warranted when interpreting the results of cross-sectional studies in volunteers, because of a possible selection bias and cohort effects [43] . Thus, longitudinal studies analysed by appropriate statistical models are necessary to correctly describe the functional changes associated with age [18] . This was recently demonstrated by Newbury et al. [44] who conclude that ELA using six predictive equations spanning 50 years showed differences attributable to cohort and period effects. Although no statistical methods were used to choose the volunteers, the number of subjects studied [38] and the fact that many private or government-owned firms in different areas of Sousse (Tunisia) were included give a reasonable degree of confidence in the data. Population source: our study design (prospective study) and our recruitment mode were similar to these of the Japanese study [10] (table 5) . The three other studies were retrospective’s types (table 5). The greater percentage (85%) of our participants was sorted from those undergoing the general health screening examination at the Functional Exploration Laboratory at the Occupational Medicine Group of Sousse. Sample size and characteristics: in a recent study [38] aiming to establish the number of local subjects required to validate published reference equations, it was found that at least 150 men and 150 women would be necessary to validate reference equations to avoid spurious differences due to sampling error. Our sample size (n=540) appears to be satisfactory since the calculated one is 455 subjects. It was higher than the sample size of one study [8] (n=125), but was smaller than the sample sizes of other studies [n=988 [7] ; n=7428 [9] and n=8015 [10] ) (table 5) . Like in the Japanese study [10] , our sample was dominated by women (respectively, 68.8% and 67.4%). In the 3 other studies, the percentage of included women were, 47.7% [7] , 52.8% [8] and 59.0% [9] (table 5) . Like the South Australian sample [8] , ours was evenly age-stratified (figure 1) . The Morris and Temple [7] sample was strongly skewed to the right with over 30% of subjects in the youngest 10 year age bracket. Applied inclusion and non-inclusion criteria: as it is recommended for such epidemiological study, we have included only healthy adults as defined by international guidelines [32, 33] . The applied inclusion and non-inclusion criteria were different from one study to another (table 6) . Only Yamaguchi et al. [10] have assessed smoking durations or habits or exposure to second-hand smoke or environmental exposures. Spirometry measurements: as for the study of Yamaguchi et al. [10] , and differently to the other three published studies [7-9] (table 6) , we have applied the recent international guidelines for spirometry [15-17] . Comparison with published reference equation: at our knowledge, the present study is the first one who tested the reliability of the published ELA reference equations [7-10] on healthy adult population having different race (Arab’s race) than the races explored in other studies (table 5) . In addition, in our study, all Morris and Temple’s reference equations [7] are checked, which has been done at the first time in the literature. All previous studies [8-10] have focused on Morris’s and Temple reference equation model‘s using FEV1 [7] . RESULTS DISCUSSION
There was a significant difference between CLA and ELA determined from the published reference equations [7-10] (figures 4 and 5) . These results provide us important information. First, the null hypothesis that we would see no difference in the means of the CLA and ELA produced by the published reference equations [7-10] is rejected. Second, the application of the published ELA reference equations [7-10] as regards Tunisian adult’s population; induce erroneous clinical interpretation of ELA data in this population.
How can we explain these differences? There are several possible reasons for this significant result and it is possible that all play a role (tables 5 and 6) . Methodological reasons
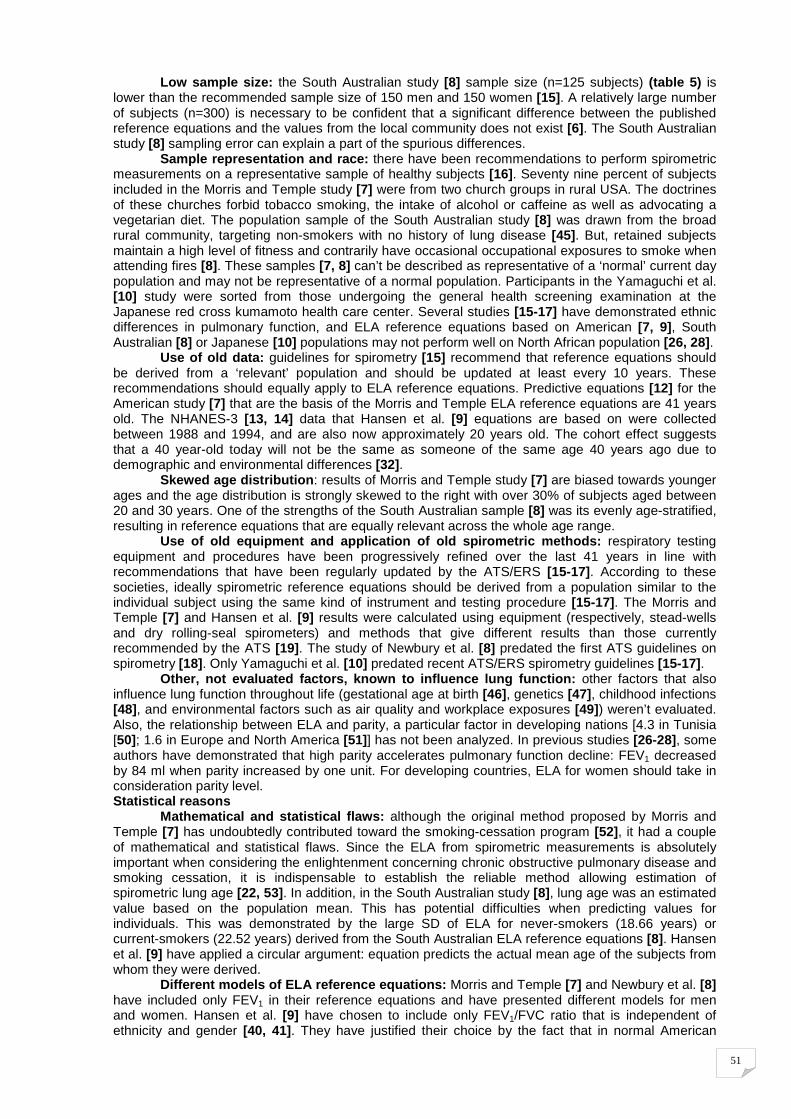
51
Low sample size: the South Australian study [8] sample size (n=125 subjects) (table 5) is lower than the recommended sample size of 150 men and 150 women [15] . A relatively large number of subjects (n=300) is necessary to be confident that a significant difference between the published reference equations and the values from the local community does not exist [6] . The South Australian study [8] sampling error can explain a part of the spurious differences.
Sample representation and race: there have been recommendations to perform spirometric measurements on a representative sample of healthy subjects [16] . Seventy nine percent of subjects included in the Morris and Temple study [7] were from two church groups in rural USA. The doctrines of these churches forbid tobacco smoking, the intake of alcohol or caffeine as well as advocating a vegetarian diet. The population sample of the South Australian study [8] was drawn from the broad rural community, targeting non-smokers with no history of lung disease [45] . But, retained subjects maintain a high level of fitness and contrarily have occasional occupational exposures to smoke when attending fires [8] . These samples [7, 8] can’t be described as representative of a ‘normal’ current day population and may not be representative of a normal population. Participants in the Yamaguchi et al. [10] study were sorted from those undergoing the general health screening examination at the Japanese red cross kumamoto health care center. Several studies [15-17] have demonstrated ethnic differences in pulmonary function, and ELA reference equations based on American [7, 9] , South Australian [8] or Japanese [10] populations may not perform well on North African population [26, 28] .
Use of old data: guidelines for spirometry [15] recommend that reference equations should be derived from a ‘relevant’ population and should be updated at least every 10 years. These recommendations should equally apply to ELA reference equations. Predictive equations [12] for the American study [7] that are the basis of the Morris and Temple ELA reference equations are 41 years old. The NHANES-3 [13, 14] data that Hansen et al. [9] equations are based on were collected between 1988 and 1994, and are also now approximately 20 years old. The cohort effect suggests that a 40 year-old today will not be the same as someone of the same age 40 years ago due to demographic and environmental differences [32] .
Skewed age distribution : results of Morris and Temple study [7] are biased towards younger ages and the age distribution is strongly skewed to the right with over 30% of subjects aged between 20 and 30 years. One of the strengths of the South Australian sample [8] was its evenly age-stratified, resulting in reference equations that are equally relevant across the whole age range.
Use of old equipment and application of old spirome tric methods: respiratory testing equipment and procedures have been progressively refined over the last 41 years in line with recommendations that have been regularly updated by the ATS/ERS [15-17] . According to these societies, ideally spirometric reference equations should be derived from a population similar to the individual subject using the same kind of instrument and testing procedure [15-17] . The Morris and Temple [7] and Hansen et al. [9] results were calculated using equipment (respectively, stead-wells and dry rolling-seal spirometers) and methods that give different results than those currently recommended by the ATS [19] . The study of Newbury et al. [8] predated the first ATS guidelines on spirometry [18] . Only Yamaguchi et al. [10] predated recent ATS/ERS spirometry guidelines [15-17] .
Other, not evaluated factors, known to influence lu ng function: other factors that also influence lung function throughout life (gestational age at birth [46] , genetics [47] , childhood infections [48] , and environmental factors such as air quality and workplace exposures [49] ) weren’t evaluated. Also, the relationship between ELA and parity, a particular factor in developing nations [4.3 in Tunisia [50]; 1.6 in Europe and North America [51] ] has not been analyzed. In previous studies [26-28] , some authors have demonstrated that high parity accelerates pulmonary function decline: FEV1 decreased by 84 ml when parity increased by one unit. For developing countries, ELA for women should take in consideration parity level. Statistical reasons
Mathematical and statistical flaws: although the original method proposed by Morris and Temple [7] has undoubtedly contributed toward the smoking-cessation program [52] , it had a couple of mathematical and statistical flaws. Since the ELA from spirometric measurements is absolutely important when considering the enlightenment concerning chronic obstructive pulmonary disease and smoking cessation, it is indispensable to establish the reliable method allowing estimation of spirometric lung age [22, 53] . In addition, in the South Australian study [8] , lung age was an estimated value based on the population mean. This has potential difficulties when predicting values for individuals. This was demonstrated by the large SD of ELA for never-smokers (18.66 years) or current-smokers (22.52 years) derived from the South Australian ELA reference equations [8] . Hansen et al. [9] have applied a circular argument: equation predicts the actual mean age of the subjects from whom they were derived.
Different models of ELA reference equations: Morris and Temple [7] and Newbury et al. [8] have included only FEV1 in their reference equations and have presented different models for men and women. Hansen et al. [9] have chosen to include only FEV1/FVC ratio that is independent of ethnicity and gender [40, 41] . They have justified their choice by the fact that in normal American
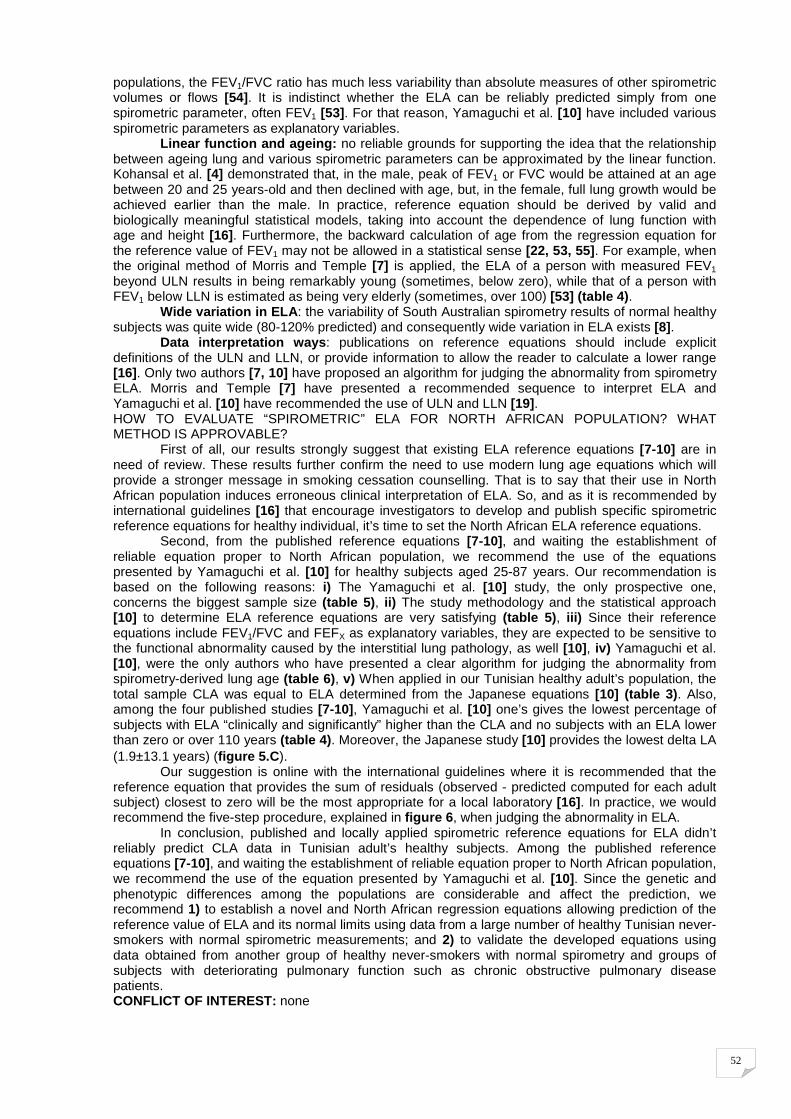
52
populations, the FEV1/FVC ratio has much less variability than absolute measures of other spirometric volumes or flows [54] . It is indistinct whether the ELA can be reliably predicted simply from one spirometric parameter, often FEV1 [53] . For that reason, Yamaguchi et al. [10] have included various spirometric parameters as explanatory variables.
Linear function and ageing: no reliable grounds for supporting the idea that the relationship between ageing lung and various spirometric parameters can be approximated by the linear function. Kohansal et al. [4] demonstrated that, in the male, peak of FEV1 or FVC would be attained at an age between 20 and 25 years-old and then declined with age, but, in the female, full lung growth would be achieved earlier than the male. In practice, reference equation should be derived by valid and biologically meaningful statistical models, taking into account the dependence of lung function with age and height [16] . Furthermore, the backward calculation of age from the regression equation for the reference value of FEV1 may not be allowed in a statistical sense [22, 53, 55] . For example, when the original method of Morris and Temple [7] is applied, the ELA of a person with measured FEV1 beyond ULN results in being remarkably young (sometimes, below zero), while that of a person with FEV1 below LLN is estimated as being very elderly (sometimes, over 100) [53] (table 4) .
Wide variation in ELA : the variability of South Australian spirometry results of normal healthy subjects was quite wide (80-120% predicted) and consequently wide variation in ELA exists [8] .
Data interpretation ways : publications on reference equations should include explicit definitions of the ULN and LLN, or provide information to allow the reader to calculate a lower range [16] . Only two authors [7, 10] have proposed an algorithm for judging the abnormality from spirometry ELA. Morris and Temple [7] have presented a recommended sequence to interpret ELA and Yamaguchi et al. [10] have recommended the use of ULN and LLN [19] . HOW TO EVALUATE “SPIROMETRIC” ELA FOR NORTH AFRICAN POPULATION? WHAT METHOD IS APPROVABLE?
First of all, our results strongly suggest that existing ELA reference equations [7-10] are in need of review. These results further confirm the need to use modern lung age equations which will provide a stronger message in smoking cessation counselling. That is to say that their use in North African population induces erroneous clinical interpretation of ELA. So, and as it is recommended by international guidelines [16] that encourage investigators to develop and publish specific spirometric reference equations for healthy individual, it’s time to set the North African ELA reference equations.
Second, from the published reference equations [7-10] , and waiting the establishment of reliable equation proper to North African population, we recommend the use of the equations presented by Yamaguchi et al. [10] for healthy subjects aged 25-87 years. Our recommendation is based on the following reasons: i) The Yamaguchi et al. [10] study, the only prospective one, concerns the biggest sample size (table 5) , ii) The study methodology and the statistical approach [10] to determine ELA reference equations are very satisfying (table 5) , iii) Since their reference equations include FEV1/FVC and FEFX as explanatory variables, they are expected to be sensitive to the functional abnormality caused by the interstitial lung pathology, as well [10] , iv) Yamaguchi et al. [10] , were the only authors who have presented a clear algorithm for judging the abnormality from spirometry-derived lung age (table 6) , v) When applied in our Tunisian healthy adult’s population, the total sample CLA was equal to ELA determined from the Japanese equations [10] (table 3) . Also, among the four published studies [7-10] , Yamaguchi et al. [10] one’s gives the lowest percentage of subjects with ELA “clinically and significantly” higher than the CLA and no subjects with an ELA lower than zero or over 110 years (table 4) . Moreover, the Japanese study [10] provides the lowest delta LA (1.9±13.1 years) (figure 5.C ).
Our suggestion is online with the international guidelines where it is recommended that the reference equation that provides the sum of residuals (observed - predicted computed for each adult subject) closest to zero will be the most appropriate for a local laboratory [16] . In practice, we would recommend the five-step procedure, explained in figure 6 , when judging the abnormality in ELA.
In conclusion, published and locally applied spirometric reference equations for ELA didn’t reliably predict CLA data in Tunisian adult’s healthy subjects. Among the published reference equations [7-10] , and waiting the establishment of reliable equation proper to North African population, we recommend the use of the equation presented by Yamaguchi et al. [10] . Since the genetic and phenotypic differences among the populations are considerable and affect the prediction, we recommend 1) to establish a novel and North African regression equations allowing prediction of the reference value of ELA and its normal limits using data from a large number of healthy Tunisian never-smokers with normal spirometric measurements; and 2) to validate the developed equations using data obtained from another group of healthy never-smokers with normal spirometry and groups of subjects with deteriorating pulmonary function such as chronic obstructive pulmonary disease patients. CONFLICT OF INTEREST: none
53
REFERENCES
1. Doll R, Peto R, Boreham J et al. Mortality in relation to smoking: 50 years’ observations on male British doctors. BMJ 2004;328:1519-28.
2. Fletcher C, Peto R. The natural history of chronic airflow obstruction. BMJ 1977;1:1645-48. 3. James AL, Palmer LJ, Kicic E et al. Decline in lung function in the Busselton Health Study. The effects of asthma and
cigarette smoking. Am J Respir Crit Care Med 2005;171:109-14. 4. Kohansal R, Martinez-Camblor P, Agustí A et al. The natural history of chronic airflow obstruction revisited: an analysis of
the Framingham offspring cohort. Am J Respir Crit Care Med. 2009;180:3-10. 5. Kerstjens H, Rijcken B, Schouten J et al. Decline of FEV1 by age and smoking status: facts, figures, and fallacies. Thorax
1997;52:820-27. 6. Petty T. Simple office spirometry. Clin Chest Med 2001;22:845-59. 7. Morris J, Temple W. Spirometric “«lung age»” estimation for motivating smoking cessation. Prev Med 1985;14:655-62. 8. Newbury W, Newbury J, Briggs N et al. Exploring the need to update lung age equations. Prim Care Respir J
2010;19:242-7. 9. Hansen JE, Sun XG, Wasserman K. Calculating gambling odds and lung ages for smokers. Eur Respir J 2010;35:776-80. 10. Yamaguchi K, Omori H, Onoue A et al. Novel regression equations predicting lung age from varied spirometric
parameters. Respir Physiol Neurobiol 2012;183:108-14. 11. Parker D, Goldman R, Eaton C. A qualitative study of individuals at risk for or who have chronic obstructive pulmonary
disease: What do they understand about their disease? Lung 2008;186:313-16. 12. Morris J, Koski A, Johnson L. Spirometric standards for healthy non-smoking adults. Am Rev Resp Dis 1971;103:57-67. 13. Quanjer PH, Stocks J, Cole TJ et al. Influence of secular trends and sample size on reference equations for lung function
tests. Eur Respir J 2011;37:658-64. 14. US department of health and human services (DHHS) national center for health statistics. Third national health and
nutrition examination survey, 1998-1994: NHANES III raw spirometry data file. Hyattsville, MD: centers for disease control and prevention, 2001. www.cdc.gov/nchs/nhanes/nh3data.htm. Date last updated: August 22, 2012.
15. Miller MR, Hankinson J, Brusasco V et al. Standardisation of spirometry. Eur Respir J 2005;26:319-38. 16. Pellegrino R, Viegi G, Brusasco V et al. Interpretative strategies for lung function tests. Eur Respir J 2005;26:948-68. 17. Miller MR, Crapo R, Hankinson J et al. General considerations for lung function testing. Eur Respir J 2005;26:153-61. 18. American Thoracic Society. ATS Statement – Snowbird workshop on standardization of spirometry. Am Rev Resp Dis
1979;119:831-8. 19. Miller A, Thornton J. The interpretation of spirometric measurements in epidemiologic surveys. Environ Res 1980;23:444-
68. 20. Lin KW. Study’s conclusion about screening is unwarranted. BMJ 2008; 306:1034. 21. Quanjer PH, Enright PL. Should we use lung age? Prim Care Respir J 2010; 19:197-9. 22. Yamaguchi K, Onizawa S, Tsuji T, Aoshiba K, Nagai A. How to evaluate “spirometric” lung age-what method is
approvable? Respir Physiol Neurobiol 2011;178 :349-51. 23. Bougrida M, Ben Saad H, Kheireddinne Bourahli M et al. Spirometric reference equations for Algerians aged 19 to 73
years. Rev Mal Respir 2008;25:577-90. 24. Ben Saad H, Prefaut C, Tabka Z et al. 6-minute walk distance in healthy North Africans older than 40 years: influence of
parity. Respir Med 2009;103:74-84. 25. Rouatbi S, Ben Saad H, Latiri I et al. Tabka Z, Guenard H. North African references of alveolar membrane diffusion
capacity and pulmonary capillary blood volume. Respiration 2010;80:301-12. 26. Ben Saad H, Rouatbi S, Raoudha S et al. Vital capacity and peak expiratory flow rates in a North-African population aged
60 years and over: influence of anthropometric data and parity. Rev Mal Respir 2003;20:521-30. 27. Bouzgarou M, Ben Saad H, Chouchane A et al. North African reference equation for peak nasal inspiratory flow. J
Laryngol Otol 2011;28:1-8. 28. Ben Saad H, Tfifha M, Harrabi I et al. Factors influencing on-smokin variables of Tunisian women aged 45 years and
more. Rev Mal Respir 2006; 23:324-38. 29. Tabka Z, Hassayoune H, Guenard H et al. Spirometric reference values in a Tunisian population. Tunis Med 1995;73:125-
31. 30. Jenicek M, Cleroux R. Clinical epidemiology: Its evolution and role in clinical practice and research. Union Med Can
1985;114:625-32. 31. Ben Abdelaziz A, Elrafei W, Gaha K et al. Factors of cardiovascular risk for hypertensive patients followed during primary
care. Tunis Med 2008;86:643-8. 32. American Thoracic Society. Lung function testing: selection of reference values and interpretative strategies. Am Rev
Resp Dis 1991;144:1202-18. 33. Quanjer PH, Tammeling GJ, Cotes JE et al. Lung volumes and forced ventilatory flows. Report working party
standardization of lung function tests, European community for steel and coal. Official statement of the European respiratory society. Eur Respir J 1993; 6 (suppl 16):5-40.
34. Ferris BG. Epidemiology standardization project II: recommended respiratory disease questionnaires for use with adults and children in epidemiological research. Am Rev Respir Dis 1978;118:7-52.
35. Tockman MS, Pearson JD, Fleg JL et al. Rapid decline in FEV1. A new risk factor for coronary heart disease mortality. Am J Respir Crit Care Med 1995;151:390-8.
36. Ben Saad H. The narghile and its effects on health. Part I: the narghile, general description and properties. Rev Pneumol Clin 2009;65:369-75.
37. Ben Saad H. The narghile and its effects on health. Part II: the effects of the narghile on health. Rev Pneumol Clin 2010;66:132-44.
38. Quanjer PH, Hall GL, Stanojevic S et al. Age- and height-based prediction bias in spirometry reference equations. Eur Respir J 2012;40:190-197.
39. World health organization. Obesity: preventing and managing the global epidemic. Report of a WHO Consultation on obesity. Geneva, 3-5 june 1997; 1998.
40. Hansen JE, Sun X-G, Wasserman K. Discriminating measures and normal values for expiratory obstruction. Chest 2006;129:369-77.
41. Hansen JE, Sun X-G, Wasserman K. Ethnic- and sex-free formula for detection of airway obstruction. Am J Respir Crit Care Med 2006;174:493-8.
42. Bland JM, Altman DG. Statistical methods for assessing agreement between two methods of clinical measurement. Lancet 1986;1:307-10.
43. Ganguli M, Lytle ME, Reynolds MD et al. Random versus volunteer selection for a community based study. J Gerontol A
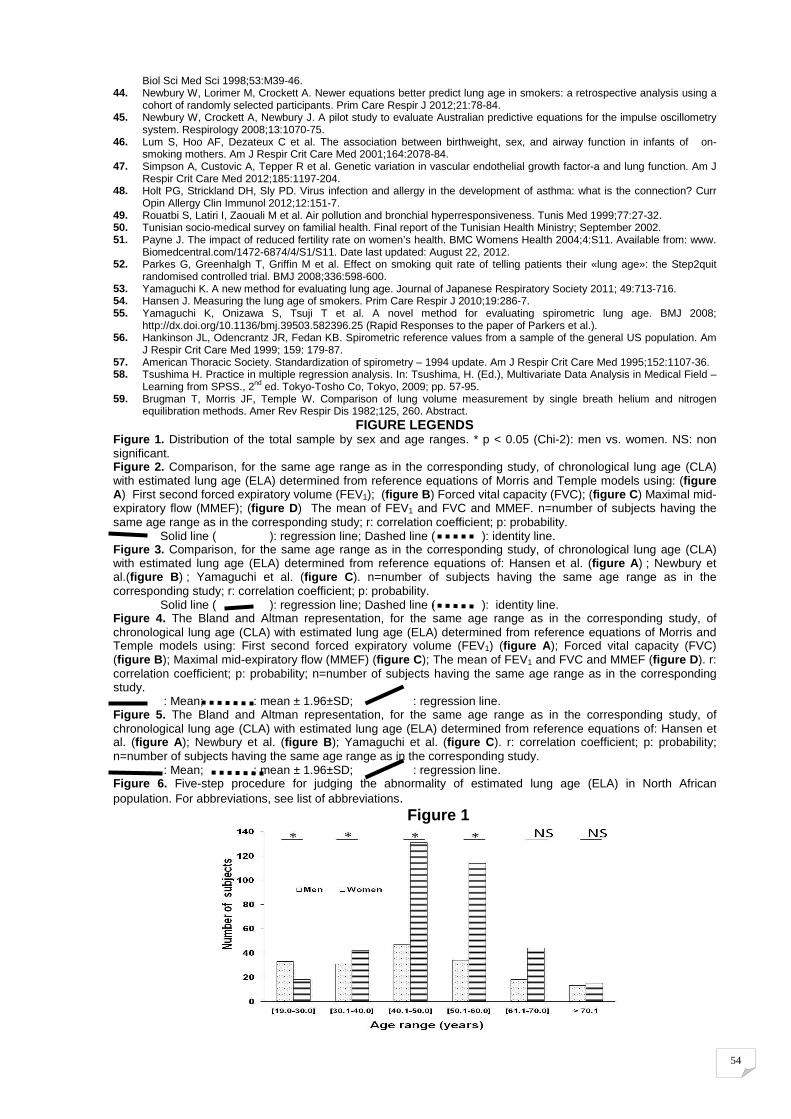
54
Biol Sci Med Sci 1998;53:M39-46. 44. Newbury W, Lorimer M, Crockett A. Newer equations better predict lung age in smokers: a retrospective analysis using a
cohort of randomly selected participants. Prim Care Respir J 2012;21:78-84. 45. Newbury W, Crockett A, Newbury J. A pilot study to evaluate Australian predictive equations for the impulse oscillometry
system. Respirology 2008;13:1070-75. 46. Lum S, Hoo AF, Dezateux C et al. The association between birthweight, sex, and airway function in infants of on-
smoking mothers. Am J Respir Crit Care Med 2001;164:2078-84. 47. Simpson A, Custovic A, Tepper R et al. Genetic variation in vascular endothelial growth factor-a and lung function. Am J
Respir Crit Care Med 2012;185:1197-204. 48. Holt PG, Strickland DH, Sly PD. Virus infection and allergy in the development of asthma: what is the connection? Curr
Opin Allergy Clin Immunol 2012;12:151-7. 49. Rouatbi S, Latiri I, Zaouali M et al. Air pollution and bronchial hyperresponsiveness. Tunis Med 1999;77:27-32. 50. Tunisian socio-medical survey on familial health. Final report of the Tunisian Health Ministry; September 2002. 51. Payne J. The impact of reduced fertility rate on women’s health. BMC Womens Health 2004;4:S11. Available from: www.
Biomedcentral.com/1472-6874/4/S1/S11. Date last updated: August 22, 2012. 52. Parkes G, Greenhalgh T, Griffin M et al. Effect on smoking quit rate of telling patients their «lung age»: the Step2quit
randomised controlled trial. BMJ 2008;336:598-600. 53. Yamaguchi K. A new method for evaluating lung age. Journal of Japanese Respiratory Society 2011; 49:713-716. 54. Hansen J. Measuring the lung age of smokers. Prim Care Respir J 2010;19:286-7. 55. Yamaguchi K, Onizawa S, Tsuji T et al. A novel method for evaluating spirometric lung age. BMJ 2008;
http://dx.doi.org/10.1136/bmj.39503.582396.25 (Rapid Responses to the paper of Parkers et al.). 56. Hankinson JL, Odencrantz JR, Fedan KB. Spirometric reference values from a sample of the general US population. Am
J Respir Crit Care Med 1999; 159: 179-87. 57. American Thoracic Society. Standardization of spirometry – 1994 update. Am J Respir Crit Care Med 1995;152:1107-36. 58. Tsushima H. Practice in multiple regression analysis. In: Tsushima, H. (Ed.), Multivariate Data Analysis in Medical Field –
Learning from SPSS., 2nd ed. Tokyo-Tosho Co, Tokyo, 2009; pp. 57-95. 59. Brugman T, Morris JF, Temple W. Comparison of lung volume measurement by single breath helium and nitrogen
equilibration methods. Amer Rev Respir Dis 1982;125, 260. Abstract. FIGURE LEGENDS
Figure 1. Distribution of the total sample by sex and age ranges. * p < 0.05 (Chi-2): men vs. women. NS: non significant. Figure 2. Comparison, for the same age range as in the corresponding study, of chronological lung age (CLA) with estimated lung age (ELA) determined from reference equations of Morris and Temple models using: (figure A) First second forced expiratory volume (FEV1); (figure B ) Forced vital capacity (FVC); (figure C ) Maximal mid-expiratory flow (MMEF); (figure D ) The mean of FEV1 and FVC and MMEF. n=number of subjects having the same age range as in the corresponding study; r: correlation coefficient; p: probability.
Solid line ( ): regression line; Dashed line ( ): identity line. Figure 3. Comparison, for the same age range as in the corresponding study, of chronological lung age (CLA) with estimated lung age (ELA) determined from reference equations of: Hansen et al. (figure A ) ; Newbury et al.(figure B ) ; Yamaguchi et al. (figure C ). n=number of subjects having the same age range as in the corresponding study; r: correlation coefficient; p: probability.
Solid line ( ): regression line; Dashed line ( ): identity line. Figure 4. The Bland and Altman representation, for the same age range as in the corresponding study, of chronological lung age (CLA) with estimated lung age (ELA) determined from reference equations of Morris and Temple models using: First second forced expiratory volume (FEV1) (figure A ); Forced vital capacity (FVC) (figure B ); Maximal mid-expiratory flow (MMEF) (figure C ); The mean of FEV1 and FVC and MMEF (figure D ). r: correlation coefficient; p: probability; n=number of subjects having the same age range as in the corresponding study.
: Mean; : mean ± 1.96±SD; : regression line. Figure 5. The Bland and Altman representation, for the same age range as in the corresponding study, of chronological lung age (CLA) with estimated lung age (ELA) determined from reference equations of: Hansen et al. (figure A ); Newbury et al. (figure B ); Yamaguchi et al. (figure C ). r: correlation coefficient; p: probability; n=number of subjects having the same age range as in the corresponding study.
: Mean; : mean ± 1.96±SD; : regression line. Figure 6. Five-step procedure for judging the abnormality of estimated lung age (ELA) in North African population. For abbreviations, see list of abbreviations.
Figure 1
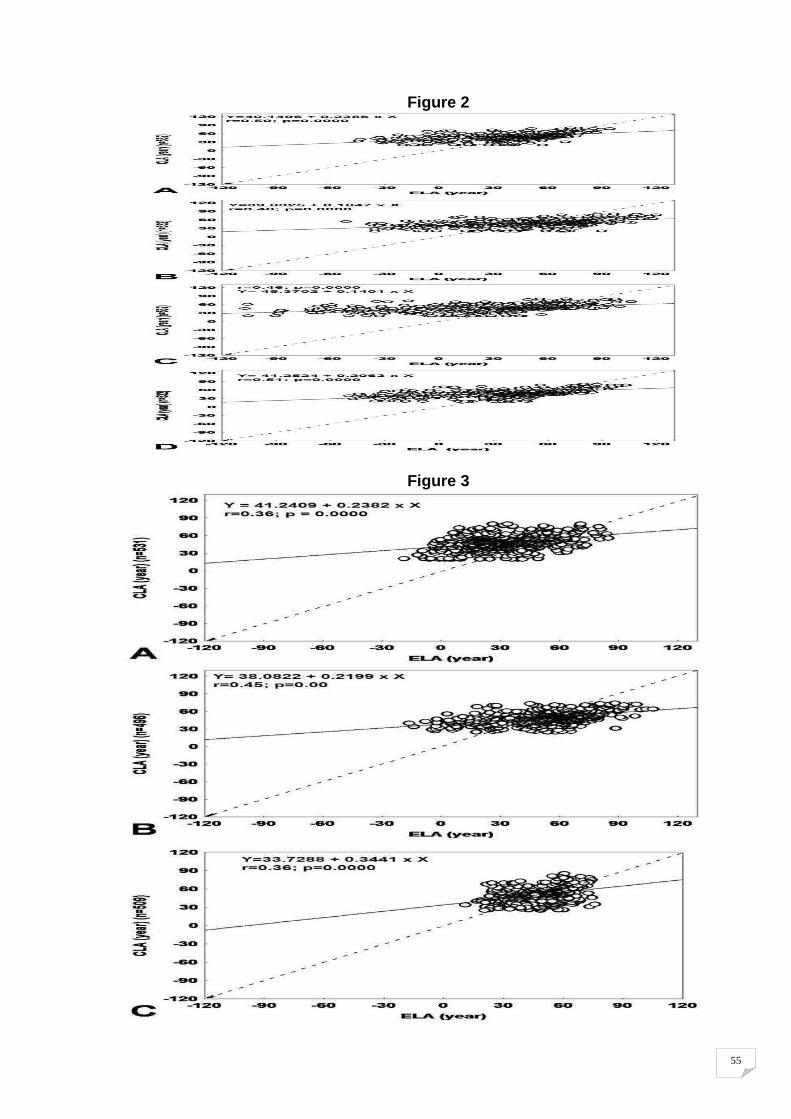
55
Figure 2
Figure 3
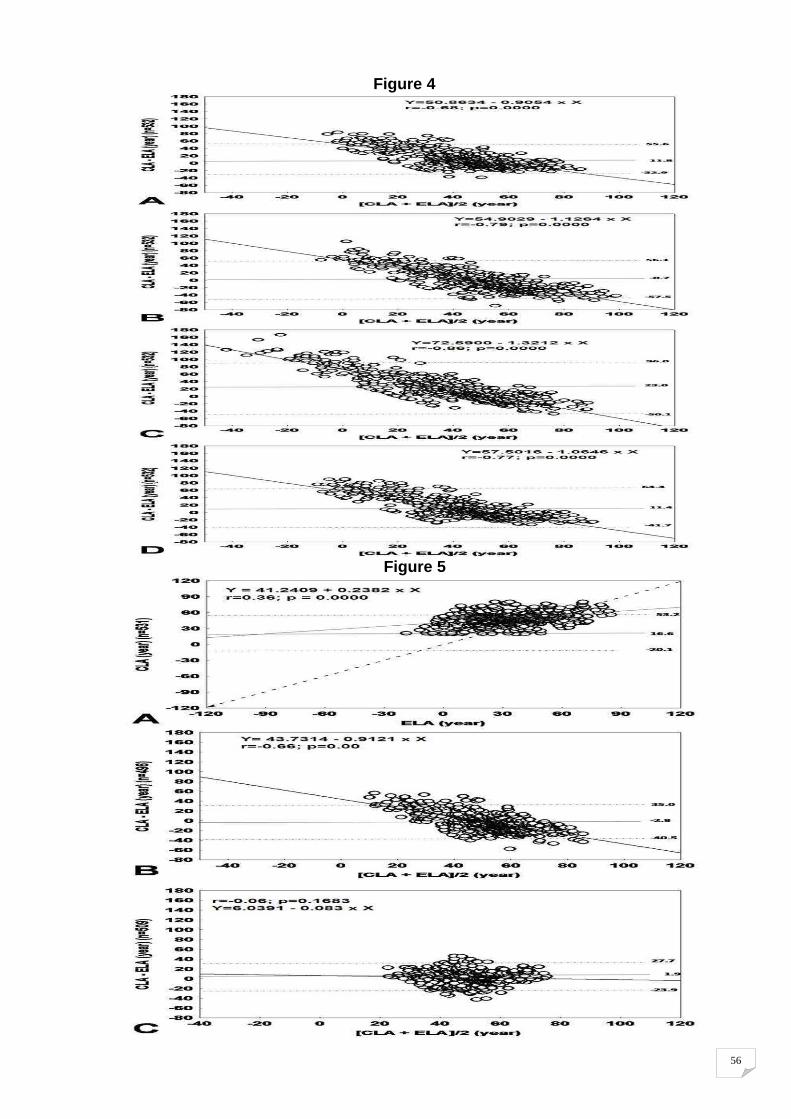
56
Figure 4
Figure 5
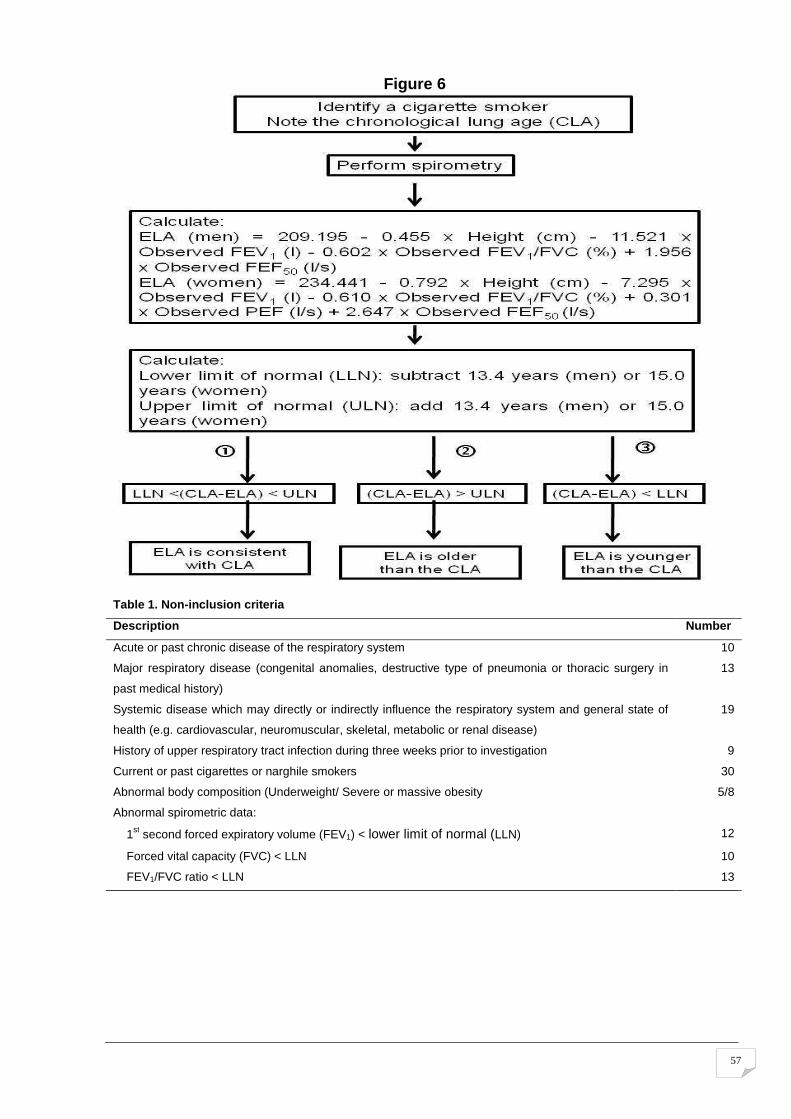
57
Figure 6
Table 1. Non-inclusion criteria
Description Number
Acute or past chronic disease of the respiratory system 10
Major respiratory disease (congenital anomalies, destructive type of pneumonia or thoracic surgery in
past medical history)
13
Systemic disease which may directly or indirectly influence the respiratory system and general state of
health (e.g. cardiovascular, neuromuscular, skeletal, metabolic or renal disease)
19
History of upper respiratory tract infection during three weeks prior to investigation 9
Current or past cigarettes or narghile smokers 30
Abnormal body composition (Underweight/ Severe or massive obesity 5/8
Abnormal spirometric data:
1st second forced expiratory volume (FEV1) < lower limit of normal (LLN) 12
Forced vital capacity (FVC) < LLN 10
FEV1/FVC ratio < LLN 13
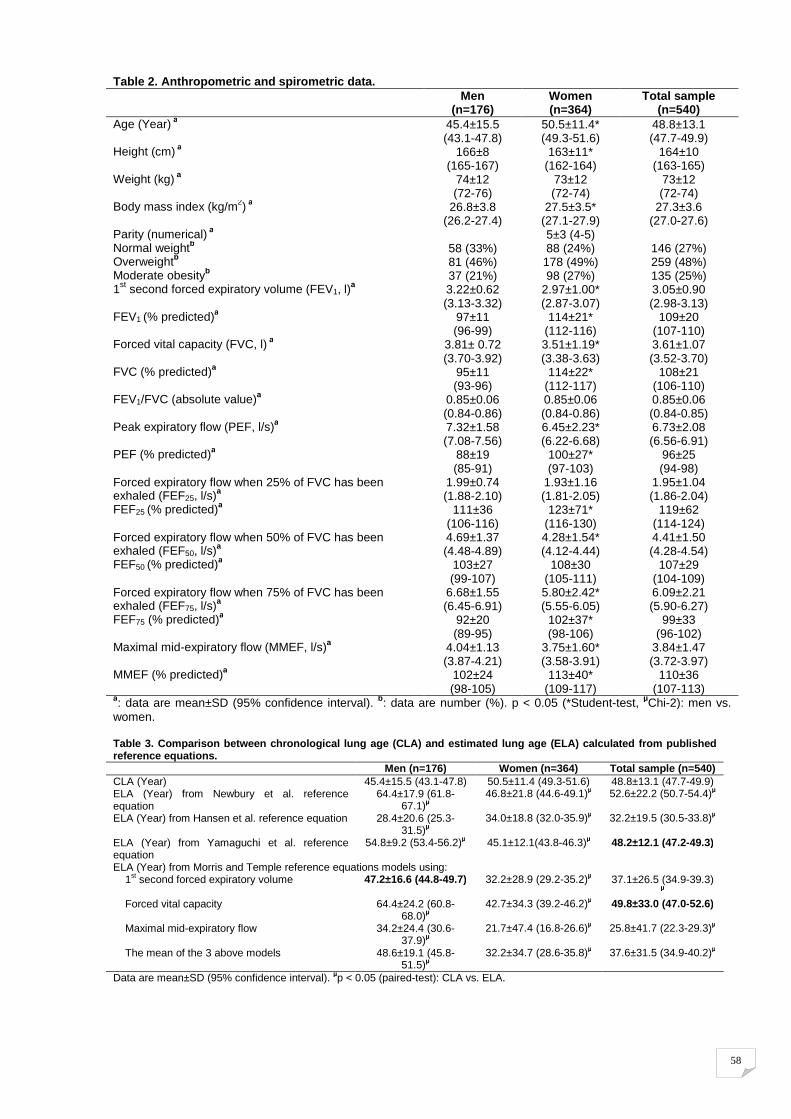
58
Table 2. Anthropometric and spirometric data. Men
(n=176) Women (n=364)
Total sample (n=540)
Age (Year) a 45.4±15.5 (43.1-47.8)
50.5±11.4* (49.3-51.6)
48.8±13.1 (47.7-49.9)
Height (cm) a 166±8 (165-167)
163±11* (162-164)
164±10 (163-165)
Weight (kg) a 74±12 (72-76)
73±12 (72-74)
73±12 (72-74)
Body mass index (kg/m2) a 26.8±3.8 (26.2-27.4)
27.5±3.5* (27.1-27.9)
27.3±3.6 (27.0-27.6)
Parity (numerical) a 5±3 (4-5) Normal weightb 58 (33%) 88 (24%) 146 (27%) Overweightb 81 (46%) 178 (49%) 259 (48%) Moderate obesityb 37 (21%) 98 (27%) 135 (25%) 1st second forced expiratory volume (FEV1, l)
a 3.22±0.62 (3.13-3.32)
2.97±1.00* (2.87-3.07)
3.05±0.90 (2.98-3.13)
FEV1 (% predicted)a 97±11 (96-99)
114±21* (112-116)
109±20 (107-110)
Forced vital capacity (FVC, l) a 3.81± 0.72 (3.70-3.92)
3.51±1.19* (3.38-3.63)
3.61±1.07 (3.52-3.70)
FVC (% predicted)a 95±11 (93-96)
114±22* (112-117)
108±21 (106-110)
FEV1/FVC (absolute value)a 0.85±0.06 (0.84-0.86)
0.85±0.06 (0.84-0.86)
0.85±0.06 (0.84-0.85)
Peak expiratory flow (PEF, l/s)a 7.32±1.58 (7.08-7.56)
6.45±2.23* (6.22-6.68)
6.73±2.08 (6.56-6.91)
PEF (% predicted)a 88±19 (85-91)
100±27* (97-103)
96±25 (94-98)
Forced expiratory flow when 25% of FVC has been exhaled (FEF25, l/s)a
1.99±0.74 (1.88-2.10)
1.93±1.16 (1.81-2.05)
1.95±1.04 (1.86-2.04)
FEF25 (% predicted)a 111±36 (106-116)
123±71* (116-130)
119±62 (114-124)
Forced expiratory flow when 50% of FVC has been exhaled (FEF50, l/s)a
4.69±1.37 (4.48-4.89)
4.28±1.54* (4.12-4.44)
4.41±1.50 (4.28-4.54)
FEF50 (% predicted)a 103±27 (99-107)
108±30 (105-111)
107±29 (104-109)
Forced expiratory flow when 75% of FVC has been exhaled (FEF75, l/s)a
6.68±1.55 (6.45-6.91)
5.80±2.42* (5.55-6.05)
6.09±2.21 (5.90-6.27)
FEF75 (% predicted)a 92±20 (89-95)
102±37* (98-106)
99±33 (96-102)
Maximal mid-expiratory flow (MMEF, l/s)a 4.04±1.13 (3.87-4.21)
3.75±1.60* (3.58-3.91)
3.84±1.47 (3.72-3.97)
MMEF (% predicted)a 102±24 (98-105)
113±40* (109-117)
110±36 (107-113)
a: data are mean±SD (95% confidence interval). b: data are number (%). p < 0.05 (*Student-test, µChi-2): men vs. women.
Table 3. Comparison between chronological lung age (CLA) and estimated lung age (ELA) calculated from published reference equations. Men (n=176) Women (n=364) Total sample (n=540) CLA (Year) 45.4±15.5 (43.1-47.8) 50.5±11.4 (49.3-51.6) 48.8±13.1 (47.7-49.9) ELA (Year) from Newbury et al. reference equation
64.4±17.9 (61.8-67.1)µ
46.8±21.8 (44.6-49.1)µ 52.6±22.2 (50.7-54.4)µ
ELA (Year) from Hansen et al. reference equation 28.4±20.6 (25.3-31.5)µ
34.0±18.8 (32.0-35.9)µ 32.2±19.5 (30.5-33.8)µ
ELA (Year) from Yamaguchi et al. reference equation
54.8±9.2 (53.4-56.2)µ 45.1±12.1(43.8-46.3)µ 48.2±12.1 (47.2-49.3)
ELA (Year) from Morris and Temple reference equations models using: 1st second forced expiratory volume 47.2±16.6 (44.8-49.7) 32.2±28.9 (29.2-35.2)µ 37.1±26.5 (34.9-39.3)
µ Forced vital capacity 64.4±24.2 (60.8-
68.0)µ 42.7±34.3 (39.2-46.2)µ 49.8±33.0 (47.0-52.6)
Maximal mid-expiratory flow 34.2±24.4 (30.6-37.9)µ
21.7±47.4 (16.8-26.6)µ 25.8±41.7 (22.3-29.3)µ
The mean of the 3 above models 48.6±19.1 (45.8-51.5)µ
32.2±34.7 (28.6-35.8)µ 37.6±31.5 (34.9-40.2)µ
Data are mean±SD (95% confidence interval). µp < 0.05 (paired-test): CLA vs. ELA.
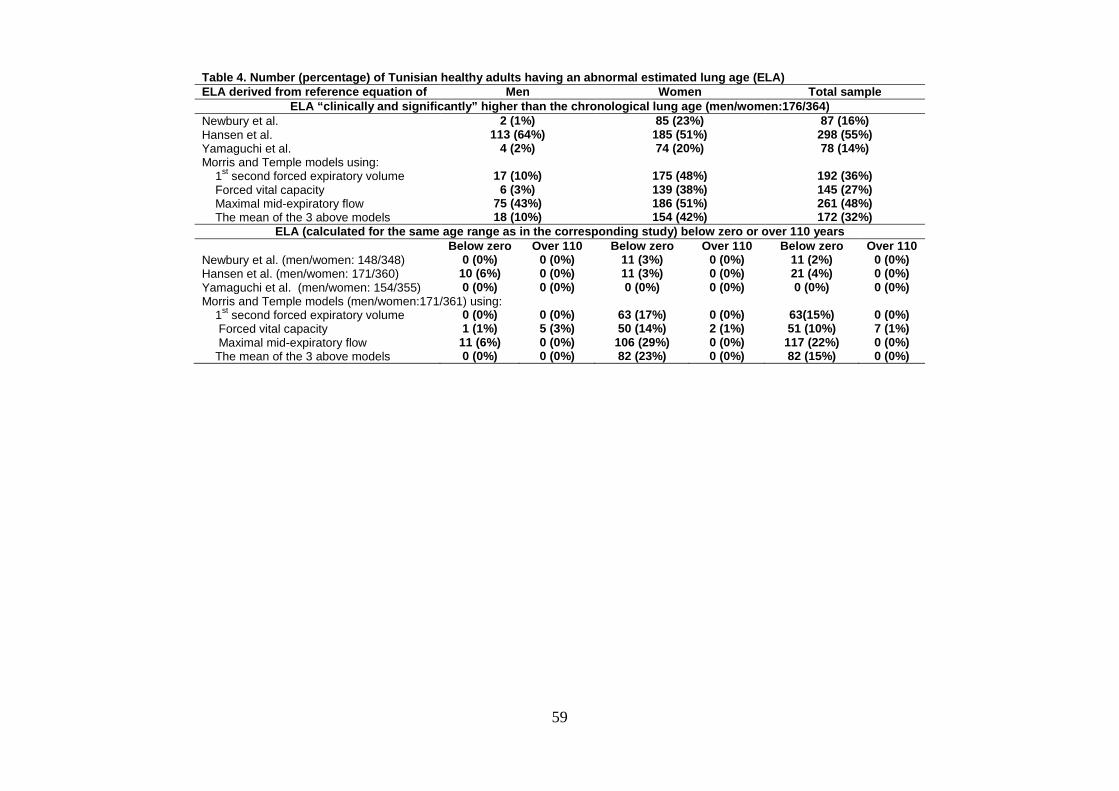
59
Table 4. Number ( percentage ) of Tunisian healthy adults having an abnormal estimated lung age (ELA) ELA derived from reference equation of Men Women Total sampl e
ELA “clinically and significantly” higher than the chronological lung age (men/women: 176/364) Newbury et al. 2 (1%) 85 (23%) 87 (16%) Hansen et al. 113 (64%) 185 (51%) 298 (55%) Yamaguchi et al. 4 (2%) 74 (20%) 78 (14%) Morris and Temple models using: 1st second forced expiratory volume 17 (10%) 175 (48%) 192 (36%) Forced vital capacity 6 (3%) 139 (38%) 145 (27%) Maximal mid-expiratory flow 75 (43%) 186 (51%) 261 (48%) The mean of the 3 above models 18 (10%) 154 (42%) 172 (32%)
ELA (calculated for the same age range as in the corresp onding study) below zero or o ver 110 years Below zero Over 110 Below zero Over 110 Below zero Over 110 Newbury et al. (men/women: 148/348) 0 (0%) 0 (0%) 11 (3%) 0 (0%) 11 (2%) 0 (0%) Hansen et al. (men/women: 171/360) 10 (6%) 0 (0%) 11 (3%) 0 (0%) 21 (4%) 0 (0%) Yamaguchi et al. (men/women: 154/355) 0 (0%) 0 (0%) 0 (0%) 0 (0%) 0 (0%) 0 (0%) Morris and Temple models (men/women:171/361) using: 1st second forced expiratory volume 0 (0%) 0 (0%) 63 (17%) 0 (0%) 63(15%) 0 (0%) Forced vital capacity 1 (1%) 5 (3%) 50 (14%) 2 (1%) 51 (10%) 7 (1%) Maximal mid-expiratory flow 11 (6%) 0 (0%) 106 (29%) 0 (0%) 117 (22%) 0 (0%) The mean of the 3 above models 0 (0%) 0 (0%) 82 (23%) 0 (0%) 82 (15%) 0 (0%)
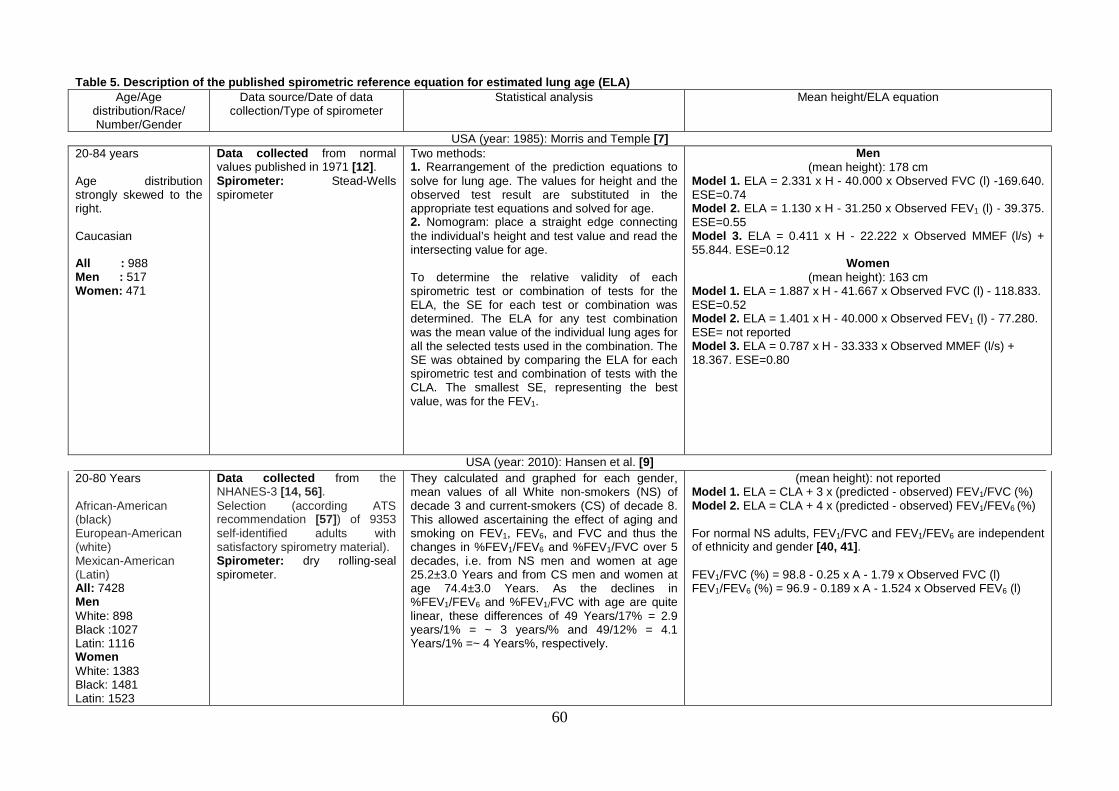
60
Table 5. Description of the p ublished spirometric reference equation for estimated lung age (ELA) Age/Age
distribution/Race/ Number/Gender
Data source/Date of data collection/Type of spirometer
Statistical analysis Mean height/ELA equation
USA (year: 1985): Morris and Temple [7] 20-84 years Age distribution strongly skewed to the right. Caucasian All : 988 Men : 517 Women: 471
Data collected from normal values published in 1971 [12] . Spirometer: Stead-Wells spirometer
Two methods: 1. Rearrangement of the prediction equations to solve for lung age. The values for height and the observed test result are substituted in the appropriate test equations and solved for age. 2. Nomogram: place a straight edge connecting the individual’s height and test value and read the intersecting value for age. To determine the relative validity of each spirometric test or combination of tests for the ELA, the SE for each test or combination was determined. The ELA for any test combination was the mean value of the individual lung ages for all the selected tests used in the combination. The SE was obtained by comparing the ELA for each spirometric test and combination of tests with the CLA. The smallest SE, representing the best value, was for the FEV1.
Men (mean height): 178 cm
Model 1. ELA = 2.331 x H - 40.000 x Observed FVC (l) -169.640. ESE=0.74 Model 2. ELA = 1.130 x H - 31.250 x Observed FEV1 (l) - 39.375. ESE=0.55 Model 3. ELA = 0.411 x H - 22.222 x Observed MMEF (l/s) + 55.844. ESE=0.12
Women (mean height): 163 cm
Model 1. ELA = 1.887 x H - 41.667 x Observed FVC (l) - 118.833. ESE=0.52 Model 2. ELA = 1.401 x H - 40.000 x Observed FEV1 (l) - 77.280. ESE= not reported Model 3. ELA = 0.787 x H - 33.333 x Observed MMEF (l/s) + 18.367. ESE=0.80
USA (year: 2010): Hansen et al. [9] 20-80 Years African-American (black) European-American (white) Mexican-American (Latin) All: 7428 Men White: 898 Black :1027 Latin: 1116 Women White: 1383 Black: 1481 Latin: 1523
Data collected from the NHANES-3 [14, 56] . Selection (according ATS recommendation [57] ) of 9353 self-identified adults with satisfactory spirometry material). Spirometer: dry rolling-seal spirometer.
They calculated and graphed for each gender, mean values of all White non-smokers (NS) of decade 3 and current-smokers (CS) of decade 8. This allowed ascertaining the effect of aging and smoking on FEV1, FEV6, and FVC and thus the changes in %FEV1/FEV6 and %FEV1/FVC over 5 decades, i.e. from NS men and women at age 25.2±3.0 Years and from CS men and women at age 74.4±3.0 Years. As the declines in %FEV1/FEV6 and %FEV1/FVC with age are quite linear, these differences of 49 Years/17% = 2.9 years/1% = ~ 3 years/% and 49/12% = 4.1 Years/1% =~ 4 Years%, respectively.
(mean height): not reported Model 1. ELA = CLA + 3 x (predicted - observed) FEV1/FVC (%) Model 2. ELA = CLA + 4 x (predicted - observed) FEV1/FEV6 (%) For normal NS adults, FEV1/FVC and FEV1/FEV6 are independent of ethnicity and gender [40, 41] . FEV1/FVC (%) = 98.8 - 0.25 x A - 1.79 x Observed FVC (l) FEV1/FEV6 (%) = 96.9 - 0.189 x A - 1.524 x Observed FEV6 (l)
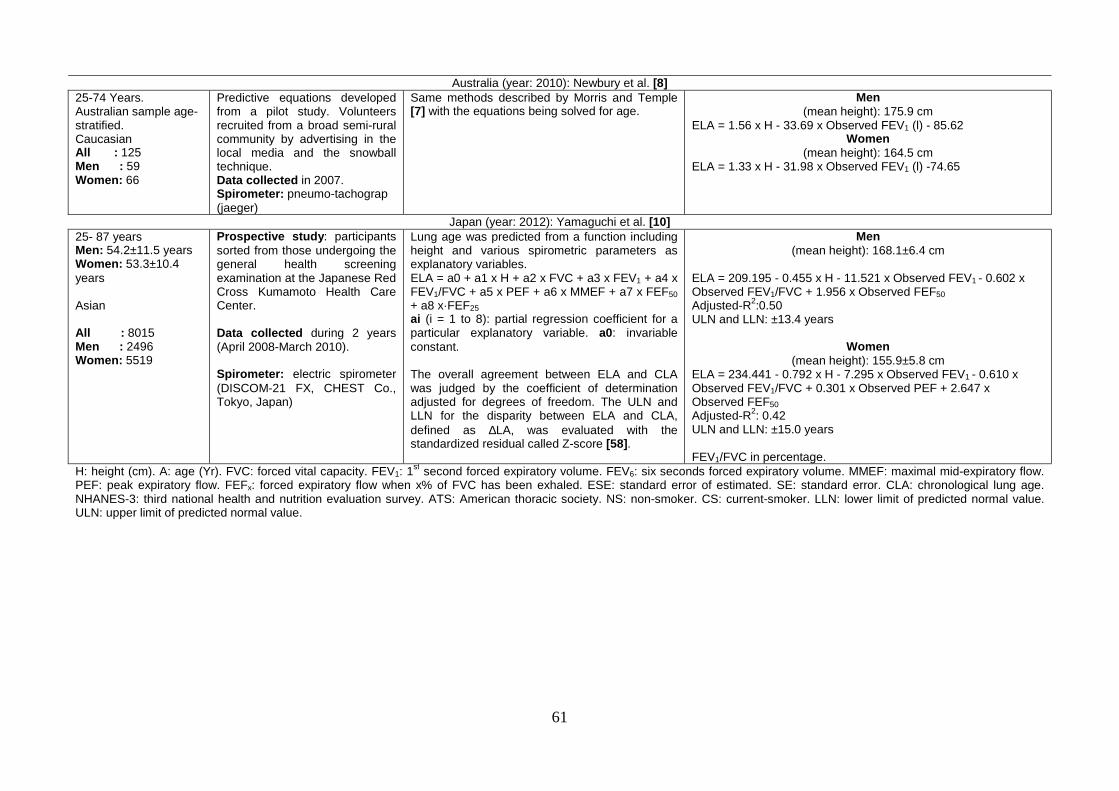
61
Australia (year: 2010): Newbury et al. [8] 25-74 Years. Australian sample age-stratified. Caucasian All : 125 Men : 59 Women: 66
Predictive equations developed from a pilot study. Volunteers recruited from a broad semi-rural community by advertising in the local media and the snowball technique. Data collected in 2007. Spirometer: pneumo-tachograp (jaeger)
Same methods described by Morris and Temple [7] with the equations being solved for age.
Men (mean height): 175.9 cm
ELA = 1.56 x H - 33.69 x Observed FEV1 (l) - 85.62 Women
(mean height): 164.5 cm ELA = 1.33 x H - 31.98 x Observed FEV1 (l) -74.65
Japan (year: 2012): Yamaguchi et al. [10] 25- 87 years Men: 54.2±11.5 years Women: 53.3±10.4 years Asian All : 8015 Men : 2496 Women: 5519
Prospective study : participants sorted from those undergoing the general health screening examination at the Japanese Red Cross Kumamoto Health Care Center. Data collected during 2 years (April 2008-March 2010). Spirometer: electric spirometer (DISCOM-21 FX, CHEST Co., Tokyo, Japan)
Lung age was predicted from a function including height and various spirometric parameters as explanatory variables. ELA = a0 + a1 x H + a2 x FVC + a3 x FEV1 + a4 x FEV1/FVC + a5 x PEF + a6 x MMEF + a7 x FEF50 + a8 x·FEF25
ai (i = 1 to 8): partial regression coefficient for a particular explanatory variable. a0: invariable constant. The overall agreement between ELA and CLA was judged by the coefficient of determination adjusted for degrees of freedom. The ULN and LLN for the disparity between ELA and CLA, defined as ∆LA, was evaluated with the standardized residual called Z-score [58] .
Men (mean height): 168.1±6.4 cm
ELA = 209.195 - 0.455 x H - 11.521 x Observed FEV1 - 0.602 x Observed FEV1/FVC + 1.956 x Observed FEF50 Adjusted-R2:0.50 ULN and LLN: ±13.4 years
Women (mean height): 155.9±5.8 cm
ELA = 234.441 - 0.792 x H - 7.295 x Observed FEV1 - 0.610 x Observed FEV1/FVC + 0.301 x Observed PEF + 2.647 x Observed FEF50
Adjusted-R2: 0.42 ULN and LLN: ±15.0 years FEV1/FVC in percentage.
H: height (cm). A: age (Yr). FVC: forced vital capacity. FEV1: 1st second forced expiratory volume. FEV6: six seconds forced expiratory volume. MMEF: maximal mid-expiratory flow.
PEF: peak expiratory flow. FEFx: forced expiratory flow when x% of FVC has been exhaled. ESE: standard error of estimated. SE: standard error. CLA: chronological lung age. NHANES-3: third national health and nutrition evaluation survey. ATS: American thoracic society. NS: non-smoker. CS: current-smoker. LLN: lower limit of predicted normal value. ULN: upper limit of predicted normal value.
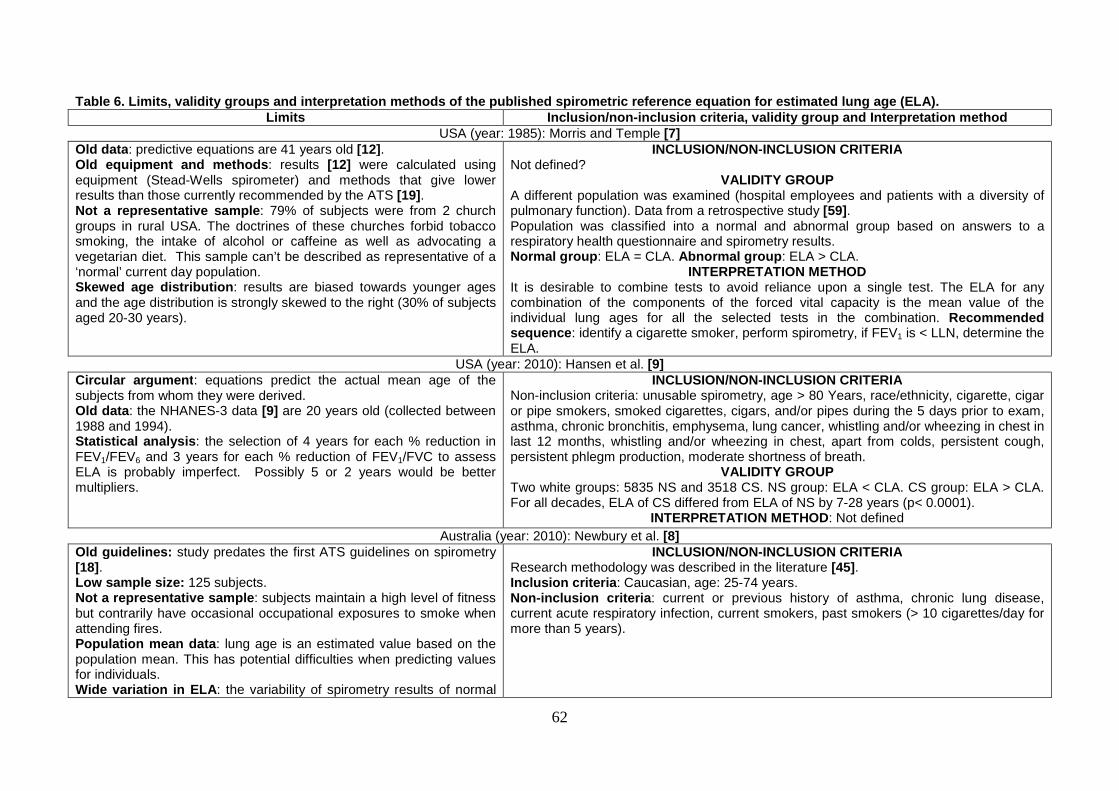
62
Table 6. Limits, validity groups and interpretation method s of the published spirometric reference equation f or estimated lung age ( ELA).
Limits Inclusion/non -inclusi on criteria, validity group and Interpretation meth od USA (year: 1985): Morris and Temple [7]
Old data : predictive equations are 41 years old [12] . Old equipment and methods : results [12] were calculated using equipment (Stead-Wells spirometer) and methods that give lower results than those currently recommended by the ATS [19] . Not a representative sample : 79% of subjects were from 2 church groups in rural USA. The doctrines of these churches forbid tobacco smoking, the intake of alcohol or caffeine as well as advocating a vegetarian diet. This sample can’t be described as representative of a ‘normal’ current day population. Skewed age distribution : results are biased towards younger ages and the age distribution is strongly skewed to the right (30% of subjects aged 20-30 years).
INCLUSION/NON-INCLUSION CRITERIA Not defined?
VALIDITY GROUP A different population was examined (hospital employees and patients with a diversity of pulmonary function). Data from a retrospective study [59] . Population was classified into a normal and abnormal group based on answers to a respiratory health questionnaire and spirometry results. Normal group : ELA = CLA. Abnormal group : ELA > CLA.
INTERPRETATION METHOD It is desirable to combine tests to avoid reliance upon a single test. The ELA for any combination of the components of the forced vital capacity is the mean value of the individual lung ages for all the selected tests in the combination. Recommended sequence : identify a cigarette smoker, perform spirometry, if FEV1 is < LLN, determine the ELA.
USA (year: 2010): Hansen et al. [9] Circular argument : equations predict the actual mean age of the subjects from whom they were derived. Old data : the NHANES-3 data [9] are 20 years old (collected between 1988 and 1994). Statistical analysis : the selection of 4 years for each % reduction in FEV1/FEV6 and 3 years for each % reduction of FEV1/FVC to assess ELA is probably imperfect. Possibly 5 or 2 years would be better multipliers.
INCLUSION/NON-INCLUSION CRITERIA Non-inclusion criteria: unusable spirometry, age > 80 Years, race/ethnicity, cigarette, cigar or pipe smokers, smoked cigarettes, cigars, and/or pipes during the 5 days prior to exam, asthma, chronic bronchitis, emphysema, lung cancer, whistling and/or wheezing in chest in last 12 months, whistling and/or wheezing in chest, apart from colds, persistent cough, persistent phlegm production, moderate shortness of breath.
VALIDITY GROUP Two white groups: 5835 NS and 3518 CS. NS group: ELA < CLA. CS group: ELA > CLA. For all decades, ELA of CS differed from ELA of NS by 7-28 years (p< 0.0001).
INTERPRETATION METHOD: Not defined Australia (year: 2010): Newbury et al. [8]
Old guidelines: study predates the first ATS guidelines on spirometry [18] . Low sample size: 125 subjects. Not a representative sample : subjects maintain a high level of fitness but contrarily have occasional occupational exposures to smoke when attending fires. Population mean data : lung age is an estimated value based on the population mean. This has potential difficulties when predicting values for individuals. Wide variation in ELA : the variability of spirometry results of normal
INCLUSION/NON-INCLUSION CRITERIA Research methodology was described in the literature [45] . Inclusion criteria: Caucasian, age: 25-74 years. Non-inclusion criteria: current or previous history of asthma, chronic lung disease, current acute respiratory infection, current smokers, past smokers (> 10 cigarettes/day for more than 5 years).
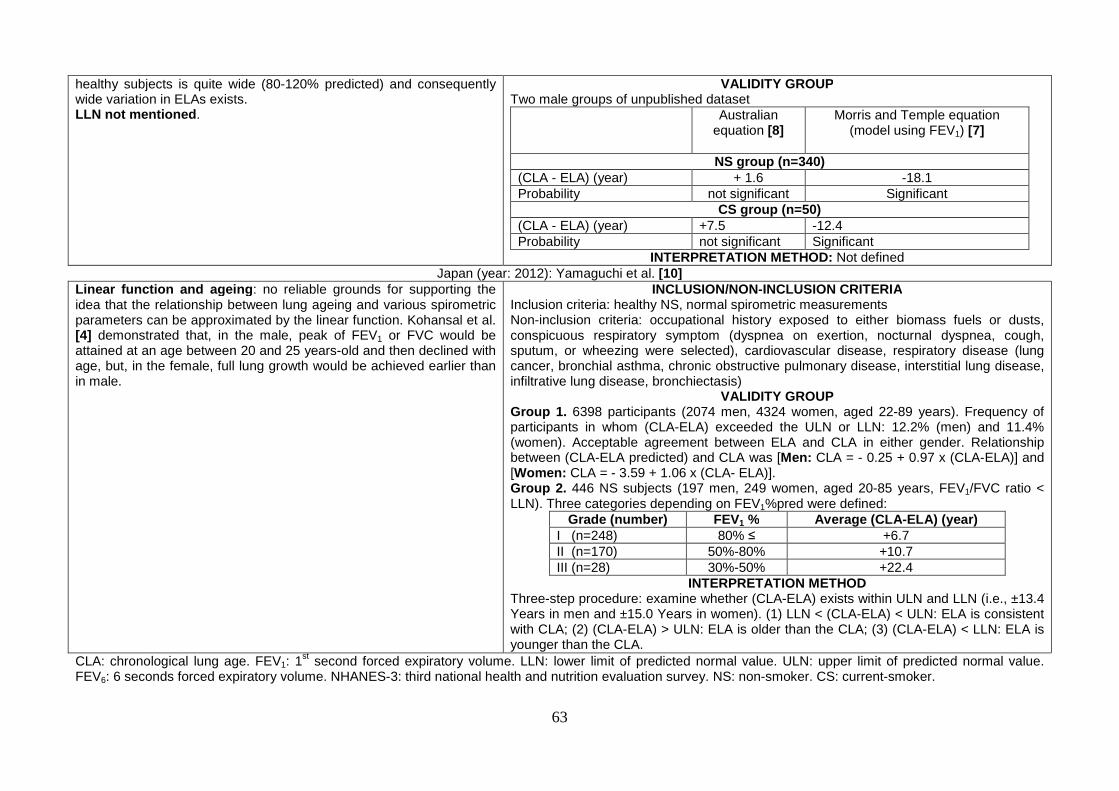
63
healthy subjects is quite wide (80-120% predicted) and consequently wide variation in ELAs exists. LLN not mentioned .
VALIDITY GROUP Two male groups of unpublished dataset
Australian equation [8]
Morris and Temple equation (model using FEV1) [7]
NS group (n=340)
(CLA - ELA) (year) + 1.6 -18.1 Probability not significant Significant
CS group (n=50) (CLA - ELA) (year) +7.5 -12.4 Probability not significant Significant
INTERPRETATION METHOD: Not defined Japan (year: 2012): Yamaguchi et al. [10]
Linear function and ageing : no reliable grounds for supporting the idea that the relationship between lung ageing and various spirometric parameters can be approximated by the linear function. Kohansal et al. [4] demonstrated that, in the male, peak of FEV1 or FVC would be attained at an age between 20 and 25 years-old and then declined with age, but, in the female, full lung growth would be achieved earlier than in male.
INCLUSION/NON-INCLUSION CRITERIA Inclusion criteria: healthy NS, normal spirometric measurements Non-inclusion criteria: occupational history exposed to either biomass fuels or dusts, conspicuous respiratory symptom (dyspnea on exertion, nocturnal dyspnea, cough, sputum, or wheezing were selected), cardiovascular disease, respiratory disease (lung cancer, bronchial asthma, chronic obstructive pulmonary disease, interstitial lung disease, infiltrative lung disease, bronchiectasis)
VALIDITY GROUP Group 1. 6398 participants (2074 men, 4324 women, aged 22-89 years). Frequency of participants in whom (CLA-ELA) exceeded the ULN or LLN: 12.2% (men) and 11.4% (women). Acceptable agreement between ELA and CLA in either gender. Relationship between (CLA-ELA predicted) and CLA was [Men: CLA = - 0.25 + 0.97 x (CLA-ELA)] and [Women: CLA = - 3.59 + 1.06 x (CLA- ELA)]. Group 2. 446 NS subjects (197 men, 249 women, aged 20-85 years, FEV1/FVC ratio < LLN). Three categories depending on FEV1%pred were defined:
Grade (number) FEV1 % Average (CLA -ELA) (year) I (n=248) 80% ≤ +6.7 II (n=170) 50%-80% +10.7 III (n=28) 30%-50% +22.4
INTERPRETATION METHOD Three-step procedure: examine whether (CLA-ELA) exists within ULN and LLN (i.e., ±13.4 Years in men and ±15.0 Years in women). (1) LLN < (CLA-ELA) < ULN: ELA is consistent with CLA; (2) (CLA-ELA) > ULN: ELA is older than the CLA; (3) (CLA-ELA) < LLN: ELA is younger than the CLA.
CLA: chronological lung age. FEV1: 1st second forced expiratory volume. LLN: lower limit of predicted normal value. ULN: upper limit of predicted normal value.
FEV6: 6 seconds forced expiratory volume. NHANES-3: third national health and nutrition evaluation survey. NS: non-smoker. CS: current-smoker.
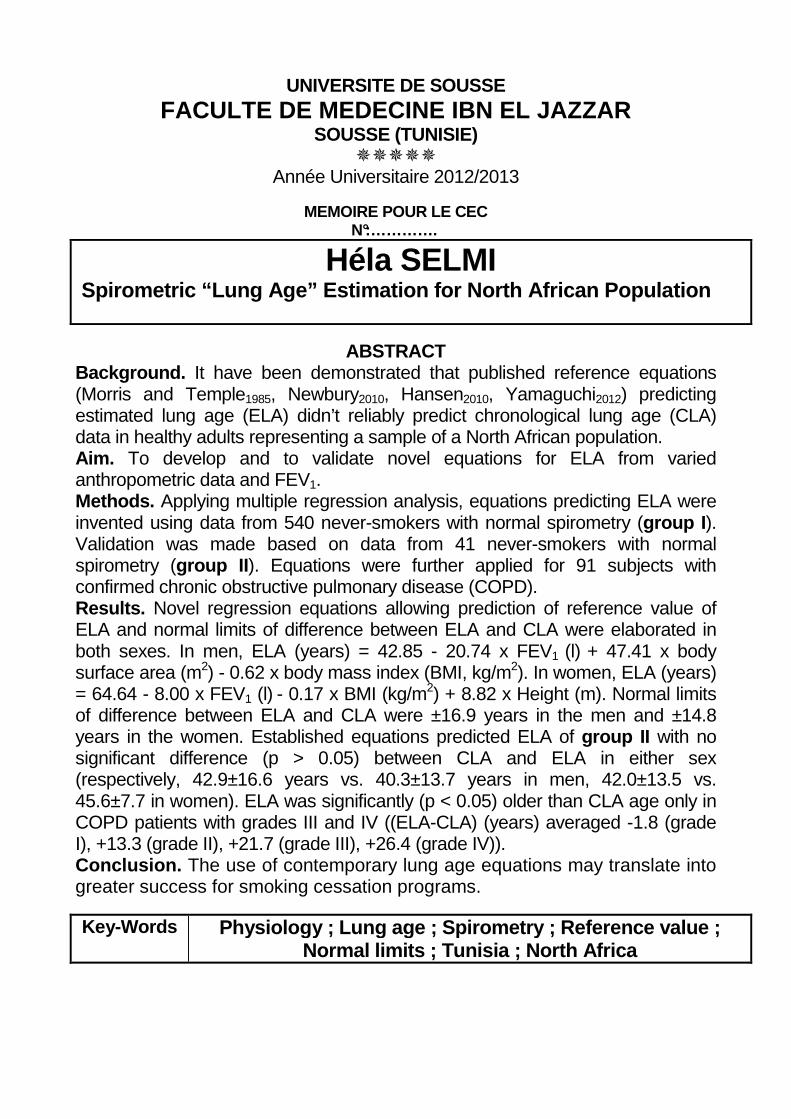
UNIVERSITE DE SOUSSE FACULTE DE MEDECINE IBN EL JAZZAR
SOUSSE (TUNISIE) �����
Année Universitaire 2012/2013
MEMOIRE POUR LE CEC N°:………….
Héla SELMI Spirometric “Lung Age” Estimation for North African Population
ABSTRACT Background. It have been demonstrated that published reference equations (Morris and Temple1985, Newbury2010, Hansen2010, Yamaguchi2012) predicting estimated lung age (ELA) didn’t reliably predict chronological lung age (CLA) data in healthy adults representing a sample of a North African population. Aim. To develop and to validate novel equations for ELA from varied anthropometric data and FEV1. Methods. Applying multiple regression analysis, equations predicting ELA were invented using data from 540 never-smokers with normal spirometry (group I ). Validation was made based on data from 41 never-smokers with normal spirometry (group II ). Equations were further applied for 91 subjects with confirmed chronic obstructive pulmonary disease (COPD). Results. Novel regression equations allowing prediction of reference value of ELA and normal limits of difference between ELA and CLA were elaborated in both sexes. In men, ELA (years) = 42.85 - 20.74 x FEV1 (l) + 47.41 x body surface area (m2) - 0.62 x body mass index (BMI, kg/m2). In women, ELA (years) = 64.64 - 8.00 x FEV1 (l) - 0.17 x BMI (kg/m2) + 8.82 x Height (m). Normal limits of difference between ELA and CLA were ±16.9 years in the men and ±14.8 years in the women. Established equations predicted ELA of group II with no significant difference (p > 0.05) between CLA and ELA in either sex (respectively, 42.9±16.6 years vs. 40.3±13.7 years in men, 42.0±13.5 vs. 45.6±7.7 in women). ELA was significantly (p < 0.05) older than CLA age only in COPD patients with grades III and IV ((ELA-CLA) (years) averaged -1.8 (grade I), +13.3 (grade II), +21.7 (grade III), +26.4 (grade IV)). Conclusion. The use of contemporary lung age equations may translate into greater success for smoking cessation programs.
Key-Words Physiology ; Lung age ; Spirometry ; Reference value ; Normal limits ; Tunisia ; North Africa