
THE VIRTUAL MANUFACTURING STATION A Framework for ...
308
THE VIRTUAL MANUFACTURING STATION A Framework for Collaborative Assessment of Manual Assembly Tasks MICHAEL OTTO aus Memmingen DISSERTATION zur Erlangung des Doktorgrades - Dr. rer. nat. - der Fakultät für Ingenieurwissenschaften, Informatik und Psychologie der Universität Ulm Institut für Medieninformatik Fakultät für Ingenieurwissenschaften, Informatik und Psychologie Universität Ulm 2020
Transcript of THE VIRTUAL MANUFACTURING STATION A Framework for ...

T H E V I RT U A L M A N U FA C T U R I N G S TAT I O NA Framework for Collaborative Assessment of Manual
Assembly Tasks
M I C H A E L O T T Oaus Memmingen
D I S S E RTAT I O N
zur Erlangung des Doktorgrades- Dr. rer. nat. -
der Fakultät für Ingenieurwissenschaften, Informatik und Psychologieder Universität Ulm
Institut für MedieninformatikFakultät für Ingenieurwissenschaften, Informatik und Psychologie
Universität Ulm
2020
acting dean:Prof. Dr.-Ing. Maurits Ortmanns
referees:Prof. Dr. Enrico Rukzio, Ulm UniversityProf. Dr.-Ing. Gabriel Zachmann, University of Bremen
day of defense:10/23/2020
Michael Otto:The Virtual Manufacturing Station: A Framework for Collaborative Assessment of Man-ual Assembly Tasks, Doctoral dissertation.©2020
This document was typeset in LATEX using the typographical look-and-feelclassicthesis developed by André Miede. classicthesis is available for bothLATEX and LYX: https://bitbucket.org/amiede/classicthesis/
This document uses graphics from flaticon.com by the author "Freepik", "GoodWare", "pixelmeetup", "monkik", "geotatah", "Vitaly Gorbachev" and "Gregor Cres-nar". Thank you.

A B S T R A C T
In the automotive industry, markets are demanding more productmodels, derivatives and extra equipment with shorter life-cycles. Dueto these effects, planning of manual assembly is becoming more com-plex and diverse. With the current mostly physical mock-up produc-tion validation methods, these changes cause considerable increasesin production planning costs, product preparation time and and putrequired quality levels at risk. The use of virtual assessment methodsduring the production validation phase is a promising countermea-sure for these effects.
As of yet, there is no holistic view on virtual production validationin the literature since related publications either offer self-contained,practical approaches or theoretical constructs without direct appli-cability. In order to bridge this gap, this doctoral thesis focuses onthe analysis, development, integration and evaluation of collabora-tive, virtual methods for assessments of manual assembly processesin the manufacturing industry.
This research focuses on the question whether collaborative virtualenvironments can support production validation workshops, so thatverification criteria can be assessed in the same quality, less time andwith lower costs compared to hardware-based workshops.
A new system is being developed and proposed, called the "VirtualManufacturing Station" (VMS). It is a framework for holistic virtualproduction validation. The VMS consists of a multi-display environ-ment, sensors and software components so that it can be used in in-teractive, collaborative, virtual production validation workshops. Inorder to provide production validation engineers with such a virtualframework, six theoretical key properties are derived for the VMS:"collaborative virtual environments", "multi-user support", "originalsize visualization", "natural user interfaces", "integration of physicaland digital mock-ups" and "asymmetric/symmetric output." This the-oretical framework is based on four research areas with each con-tributing to at least one of the theoretical key properties. These areasare "VR simulation software", "markerless, full-body motion capture","large high-resolution displays" and "spatial augmented reality."
This doctoral thesis presents advances in basic human computerinteraction research, technology, production validation methodologysubstantiated by the following studies: Two contextual inquiry stud-ies on virtual production validation, two technological evaluationsusing a markerless full-body motion capture system presented, a sys-tematic design space analysis for spatial augmented reality, a stan-dardized benchmark for VR assessments of manual assembly tasks, a
iii
size perception study, and five studies on basic research related to vir-tual production validation. The latter research studies cover a broadinvestigation scope, such as measurement of task completion times,error rates and qualitative feedback.
Overall, these studies have demonstrated that the VMS frameworkis reliable and applicable for collaborative virtual production valida-tion workshops. Although this research has been conducted for theautomotive sector, the presented VMS framework is also applicableto the manufacturing industry in general. The VMS methods andtools discussed contribute to higher workshop collaboration perfor-mance, lower task completion times, reduced preparation work anda reduced dependency on physical mock-ups. The VMS reduces theoverall costs in production validation while simultaneously maintain-ing the validation quality.
iv
P U B L I C AT I O N S
The following publications are sorted chronologically. Some ideas,texts and figures have appeared previously in the following list ofdirectly related core [C] publications:
[C1] Michael Otto, Michael Prieur, and Enrico Rukzio. “Using Scal-able, Interactive Floor Projection for Production Planning Sce-nario.” In: Proceedings of the Ninth ACM International Confer-ence on Interactive Tabletops and Surfaces, Poster. ACM ITS 2014.Reuses according to the author’s rights of ACM Digital Li-brary. Dresden, Germany: Association for Computing Machin-ery, 2014, pp. 363–368. doi: 10.1145/2669485.2669547.
[C2] Michael Otto, Philipp Agethen, Florian Geiselhart, and EnricoRukzio. “Towards Ubiquitous Tracking: Presenting a Scalable,Markerless Tracking Approach Using Multiple Depth Cam-eras.” In: Proceedings of the EuroVR 2015. EuroVR 2015. BestIndustrial Paper Award. Lecco, Italy: European Associationfor Virtual Reality and Augmented Reality, 2015. url: https://www.eurovr-association.org/wp-content/uploads/2019/
11/06112017_Proceedings-1.pdf.
[C3] Florian Geiselhart, Michael Otto, and Enrico Rukzio. “On theUse of Multi-Depth-Camera Based Motion Tracking Systemsin Production Planning Environments.” In: Proceedings of the48th CIRP Conference on Manufacturing Systems. CIRP CMS2015. Vol. 41. CIRP CMS. Licensed under CC BY-NC-ND 4.0,https://creativecommons.org/licenses/by-nc-nd/4.0/. Ischia,Italy: Elsevier, 2015, pp. 759–764. doi: 10.1016/j.procir.2015.12.088.
[C4] Michael Otto, Michael Prieur, Philipp Agethen, and EnricoRukzio. “Dual Reality for Production Verification Workshops:A Comprehensive Set of Virtual Methods.” In: Proceedings ofthe 6th CIRP Conference on Assembly Technologies and Systems.CIRP CATS 2016. Vol. 44. CIRP CATS 2016. Licensed underCC BY-NC-ND 4.0, https://creativecommons.org/licenses/by-nc-nd/4.0/. Gothenburg, Sweden, 2016, pp. 38–43. doi: 10.1016/j.procir.2016.02.140.
[C5] Michael M. Otto, Philipp Agethen, Florian Geiselhart, MichaelRietzler, Felix Gaisbauer, and Enrico Rukzio. “Presenting aHolistic Framework for Scalable, Marker-Less Motion Cap-turing: Skeletal Tracking Performance Analysis, Sensor Fu-sion Algorithms and Usage in Automotive Industry.” In: Jour-nal of Virtual Reality and Broadcasting, JVRB 3.13 (2016). Li-
v
censed under Digital Peer Publishing Lizenz (v2, de), http://www.dipp.nrw.de/lizenzen/dppl/dppl/DPPL_v2_en_06-2004.html,pp. 1–10. doi: 10.20385/1860-2037/13.2016.3.
[C6] Philipp Agethen, Felix Gaisbauer, Michael Otto, and EnricoRukzio. “Interactive Simulation for Walk Path Planning withinthe Automotive Industry.” In: Proceedings of the 51st CIRP Con-ference on Manufacturing Systems. CIRP CMS 2018. Vol. 72. Li-censed under CC BY-NC-ND 4.0, https://creativecommons.org/licenses/by-nc-nd/4.0/. Stockholm, Sweden, 2018, pp. 285–290. doi: 10.1016/j.procir.2018.03.223.
[C7] Michael Otto, Eva Lampen, Philipp Agethen, Mareike Lan-gohr, Gerald Masan, and Enrico Rukzio. “Evaluation on Per-ceived Sizes Using Large-Scale Augmented Floor Visualiza-tion Devices.” In: Proceedings of the 8th ACM International Sym-posium on Pervasive Displays. ACM PerDis 2019. Reuses accord-ing to the author’s rights of ACM Digital Library. Palermo,Italy: Association for Computing Machinery, 2019, pp. 1–7.doi: 10.1145/3321335.3324951.
[C8] Michael Otto, Eva Lampen, Felix Auris, Felix Gaisbauer, andEnrico Rukzio. “Applicability Evaluation of Kinect for EAWSErgonomic Assessments.” In: Proceedings of the 52nd CIRP Con-ference on Manufacturing Systems. CIRP CMS 2019. Vol. 81. Li-censed under CC BY-NC-ND 4.0, https://creativecommons.org/licenses/by-nc-nd/4.0/. Ljubljana, Slovenia, 2019, pp. 781–784.doi: 10.1016/j.procir.2019.03.194.
[C9] Michael Otto, Eva Lampen, Philipp Agethen, Mareike Lan-gohr, Gabriel Zachmann, and Enrico Rukzio. “A Virtual Real-ity Assembly Assessment Benchmark for Measuring VR Per-formance & Limitations.” In: Proceedings of the 52nd CIRP Con-ference on Manufacturing Systems. CIRP CMS 2019. Vol. 81. Li-censed under CC BY-NC-ND 4.0, https://creativecommons.org/licenses/by-nc-nd/4.0/. Ljubljana, Slovenia, 2019, pp. 785–790.doi: 10.1016/j.procir.2019.03.195.
[C10] Michael Otto, Eva Lampen, Philipp Agethen, Gabriel Zach-mann, and Enrico Rukzio. “Using large-scale augmented floorsurfaces for industrial applications and evaluation on perceivedsizes.” In: Personal and Ubiquitous Computing (2020). Licensedunder CC BY 4.0, https://creativecommons.org/licenses/by/4.0/,pp. 1–28. doi: 10.1007/s00779-020-01433-z.
Further [F] co-authored publications that are not directly related tothe thesis’ topic are:
vi
[F1] Philipp Agethen, Michael Otto, Felix Gaisbauer, and EnricoRukzio. “Presenting a Novel Motion Capture-Based Approachfor Walk Path Segmentation and Drift Analysis in Manual As-sembly.” In: Proceedings of the Sixth International Conference onChangeable, Agile, Reconfigurable and Virtual Production. CIRPCARV 2016. Vol. 52. CIRP CARV 2016. Licensed under CC BY-NC-ND 4.0, https://creativecommons.org/licenses/by-nc-nd/4.0/.Jan. 1, 2016, pp. 286–291. doi: 10.1016/j.procir.2016.07.048.
[F2] Philipp Agethen, Michael Otto, Stefan Mengel, and EnricoRukzio. “Using Marker-Less Motion Capture Systems for WalkPath Analysis in Paced Assembly Flow Lines.” In: Proceed-ings of the 6th CIRP Conference on Learning Factories. CIRP CLF2016. Vol. 54. Licensed under CC BY-NC-ND 4.0, https://creativecommons.org/licenses/by-nc-nd/4.0/. 2016, pp. 152–157. doi: 10.1016/j.procir.2016.04.125.
[F3] Martin Manns, Michael Otto, and Markus Mauer. “MeasuringMotion Capture Data Quality for Data Driven Human MotionSynthesis.” In: Proceedings of the 48th CIRP Conference on Manu-facturing Systems. CIRP CMS 2016. Vol. 41. Licensed under CCBY-NC-ND 4.0, https://creativecommons.org/licenses/by-nc-nd/4.0/. Jan. 1, 2016, pp. 945–950. doi: 10.1016/j.procir.2015.12.068.
[F4] Ulrich Bockholt, Thomas Bochtler, Volker Enderlein, ManuelOlbrich, Michael Otto, Michael Prieur, Richard Sauerbier, RolandStechow, Andreas Wehe, and Hans-Joachim Wirsching. “Mo-tion Capturing.” In: Web-basierte Anwendungen Virtueller Tech-niken. Ed. by Werner Schreiber, Konrad Zürl, and Peter Zim-mermann. Springer Vieweg, Berlin, Heidelberg, 2017, pp. 219–262. doi: 10.1007/978-3-662-52956-0_5.
[F5] André Antakli, Pablo Alvarado Moya, Beat Brüderlin, UlrichCanzler, Holger Dammertz, Volker Enderlein, Jürgen Grüninger,Andreas Harth, Hilko Hoffmann, Eduard Jundt, Peter Keitler,Felix Leif Keppmann, Roland Krzikalla, Sebastian Lampe, Alexan-der Löffler, Julian Meder, Michael Otto, Frieder Pankratz, Se-bastian Pfützner, Matthias Roth, Richard Sauerbier, WernerSchreiber, Roland Stechow, Johannes Tümler, Christian Vo-gelgesang, Oliver Wasenmüller, Andreas Weinmann, JochenWillneff, Hans-Joachim Wirsching, Ingo Zinnikus, and Kon-rad Zürl. “Virtuelle Techniken und Semantic-Web.” In: Web-basierte Anwendungen Virtueller Techniken. Ed. by Werner Schreiber,Konrad Zürl, and Peter Zimmermann. Springer Berlin Heidel-berg, 2017, pp. 17–116. doi: 10.1007/978-3-662-52956-0_2.
[F6] Philipp Agethen, Viswa Subramanian Sekar, Felix Gaisbauer,Thies Pfeiffer, Michael Otto, and Enrico Rukzio. “Behavior
vii
Analysis of Human Locomotion in the Real World and Vir-tual Reality for the Manufacturing Industry.” In: ACM Trans-actions on Applied Perception 15.3 (July 18, 2018), pp. 1–19. doi:10.1145/3230648.
[F7] Felix Gaisbauer, Jannes Lehwald, Philipp Agethen, MichaelOtto, and Enrico Rukzio. “A Motion Reuse Framework for Ac-celerated Simulation of Manual Assembly Processes.” In: Pro-ceedings of the 51st CIRP Conference on Manufacturing Systems.CIRP CMS 2018. Vol. 72. Licensed under CC BY-NC-ND 4.0,https://creativecommons.org/licenses/by-nc-nd/4.0/. Stock-holm, Sweden, 2018, pp. 398–403. doi: 10.1016/j.procir.2018.03.282.
[F8] Felix Gaisbauer, Philipp Agethen, Michael Otto, Thomas Bär,Julia Sues, and Enrico Rukzio. “Presenting a Modular Frame-work for a Holistic Simulation of Manual Assembly Tasks.”In: Proceedings of the 51st CIRP Conference on Manufacturing Sys-tems. CIRP CMS 2018. Vol. 72. Licensed under CC BY-NC-ND4.0, https://creativecommons.org/licenses/by-nc-nd/4.0/. Stock-holm, Sweden, 2018, pp. 768–773. doi: 10.1016/j.procir.2018.03.281.
[citation] For added clarity, literally adopted parts from own work publishedelsewhere are emphasized with markings in the page margins as ex-emplified on the left. As this document has undergone several itera-tions, markings are made generously but do not claim exhaustiveness.In addition, they may occasionally contain information not stemmingfrom the original publication that are not exempted from the marking(revisions, extensions, citations numbers, headings, etc.).
viii
A C K N O W L E D G E M E N T S
Working on this thesis has been one of the most interesting and chal-lenging tasks in my life. At times it was difficult to work on this thesiswhile having to meet the duties of a full time job. For that reason Iwould like to express my sincere thanks to the many people who pro-vided so much professional and moral support during the course ofthis undertaking.
First and foremost I would like to thank Enrico Rukzio for supervis-ing this work and for the great ideas he provided me over the years.Our inspiring discussions on new research areas and of course theclose contact with the entire research group at the "Institute of MediaInformatics" were extremely beneficial for my work. Even though Iwas an external PhD student employed at Daimler, they were alwaysthere to give me invaluable advice and emotional encouragement.Many thanks are also due to Gabriel Zachmann at the "Institute forComputer Graphics and Virtual Reality" at the university of Bremenwho supported this work with important insights, beneficial discus-sions and with co-authored publications.
While completing this doctoral thesis at "Daimler AG" in Ulm andSindelfingen, I had many helpful colleagues who contributed to theideas treated in this work. Starting in late 2013, Thomas Bär and MichaelPrieur supported this project with great advice, the necessary open-mindedness for new ideas and with a budget for implementation ofthe "Virtual Manufacturing Station." I would like to thank them forproviding an inspiring research environment since it allowed me notonly to meet great colleagues, but also good friends. I owe them mysincerest thanks for making the time at "Daimler AG, Ulm ResearchCentre" such a wonderful experience. Additionally, I’m deeply thank-ful to my dear long-term colleagues Eva Lampen, Philipp Agethen, FelixGaisbauer and Martin Manns who all supported my PhD thesis overthe course of many years - some as interns, some working on theirown bachelor’s or master’s thesis, or their own PhDs. My sincerestthanks for hundreds of inspiring discussions, the extraordinary com-mitment, our successful collaborative publications and our friendship.In addition, many interns and students supported this work with anincredible commitment and therefore deserve my gratitude. They in-clude: Mareike Langohr, Viswa Sekar Subramanian, Markus Funke andmany more. Many thanks to all of these great colleagues.
Completing a huge project such as the "Virtual Manufacturing Sta-tion" involves many partners, who also support this idea. Therefore Iam indebted to my partners at Daimler AG, Sindelfingen and Daim-ler Protics. These include the entire production validation team and es-
ix

pecially Martini Berretta, Oliver Geißel, Thomas Bochtler, Philip Lacher,Wolfgang List and Roland Pflum. I would also like to thank GeraldMasan for having been my central sparring partner for the conceptsand implementation of the "Virtual Manufacturing Station" and ourclose collaboration. I am very thankful for the great time and the in-spiring work we did together.
Finally, my deepest gratitude goes to my whole family and mywife’s family for their loving support. I would like to thank them fortheir unconditional support, care, and encouragement over the yearsand for proofreading this work.
Most of all, I owe my sincerest thanks to my wife Catharina for herpatience and moral support in stressful times. Her unconditional tol-erance of the countless hours, weekends and vacations I spent work-ing on this thesis and especially her unwavering love gave me thestrength and encouragement to finish this thesis.
Many thanks to all for their loving support!
x
C O N T E N T S
1 introduction 1
1.1 Economic impact of the global automotive industry . . 1
1.2 Technological changes in the automotive industry . . . 2
1.3 Challenges in automotive production . . . . . . . . . . 3
1.3.1 Increasing product variety . . . . . . . . . . . . . 3
1.3.2 Mass customization . . . . . . . . . . . . . . . . 3
1.3.3 Need for flexibility . . . . . . . . . . . . . . . . . 5
1.3.4 Global production networks . . . . . . . . . . . 5
1.4 Motivation for virtual production validation . . . . . . 6
1.5 Thesis outline . . . . . . . . . . . . . . . . . . . . . . . . 7
2 research agenda and thesis contributions 11
2.1 Fields of contribution . . . . . . . . . . . . . . . . . . . . 11
2.2 Research hypothesis and research questions . . . . . . 12
2.3 Research methodology . . . . . . . . . . . . . . . . . . . 14
2.4 Similarities and differences . . . . . . . . . . . . . . . . 15
3 domain analysis production planning and vali-dation 19
3.1 Domain analysis of automotive production . . . . . . . 19
3.1.1 Automotive development process . . . . . . . . 19
3.1.2 Automotive production . . . . . . . . . . . . . . 23
3.1.3 Automotive final assembly . . . . . . . . . . . . 24
3.2 Domain analysis of automotive production planning . 28
3.2.1 Assembly planning . . . . . . . . . . . . . . . . . 29
3.2.2 Tools in assembly planning . . . . . . . . . . . . 31
3.2.3 Automotive Mock-ups . . . . . . . . . . . . . . . 32
3.3 Production validation workshops . . . . . . . . . . . . . 35
3.3.1 Goals . . . . . . . . . . . . . . . . . . . . . . . . . 35
3.3.2 Verification and validation principles . . . . . . 36
3.3.3 Organization and timeline . . . . . . . . . . . . . 38
3.3.4 Participants & Stakeholders . . . . . . . . . . . . 41
3.3.5 Verification goals . . . . . . . . . . . . . . . . . . 42
4 evaluation of state-of-the-art validation meth-ods 49
4.1 Study procedure . . . . . . . . . . . . . . . . . . . . . . . 50
4.2 Participants . . . . . . . . . . . . . . . . . . . . . . . . . 50
4.3 Demographics . . . . . . . . . . . . . . . . . . . . . . . . 51
4.4 Study results . . . . . . . . . . . . . . . . . . . . . . . . . 51
4.4.1 Physical and virtual production validation process 52
4.4.2 Organizational challenges . . . . . . . . . . . . . 54
4.4.3 Technological challenges . . . . . . . . . . . . . . 57
4.5 Discussion, study limitations and summary . . . . . . . 58
5 the virtual manufacturing station framework 61
xi
xii contents
5.1 Objectives . . . . . . . . . . . . . . . . . . . . . . . . . . 62
5.1.1 Company scope objectives . . . . . . . . . . . . . 62
5.1.2 Objectives of digital simulation methods . . . . 63
5.1.3 Objectives of the VMS framework . . . . . . . . 65
5.2 Key Properties of the virtual manufacturing station . . 66
5.2.1 Integration of PMU and DMU . . . . . . . . . . 67
5.2.2 Original size visualization & co-location . . . . 69
5.2.3 Collaborative Virtual Environments . . . . . . . 70
5.2.4 Symmetric and asymmetric output for AR/VR 71
5.2.5 Multi-user support . . . . . . . . . . . . . . . . . 73
5.2.6 Natural User Interfaces . . . . . . . . . . . . . . 74
5.3 Personas . . . . . . . . . . . . . . . . . . . . . . . . . . . 75
5.4 Hardware components . . . . . . . . . . . . . . . . . . . 77
5.4.1 Room size and arrangement . . . . . . . . . . . 77
5.4.2 Output devices . . . . . . . . . . . . . . . . . . . 77
5.4.3 Input devices . . . . . . . . . . . . . . . . . . . . 77
5.5 Simulation software components . . . . . . . . . . . . . 78
5.6 Research areas related to the key properties . . . . . . . 79
6 vr/ar assembly validation 81
6.1 Simulation software objectives . . . . . . . . . . . . . . 83
6.2 State-of-the-art commercial validation tools . . . . . . . 84
6.3 Batch CVE assessment simulation environment . . . . 88
6.3.1 Authoring and data provisioning . . . . . . . . . 88
6.3.2 Rendering and visualization . . . . . . . . . . . 92
6.3.3 Assessment-related features . . . . . . . . . . . . 93
6.3.4 3D rendering features . . . . . . . . . . . . . . . 95
6.3.5 Interaction concepts . . . . . . . . . . . . . . . . 96
6.3.6 Digital human model . . . . . . . . . . . . . . . 97
6.3.7 Virtual reality implementation and user interface 99
6.3.8 VR user interface . . . . . . . . . . . . . . . . . . 99
6.3.9 Informal VR evaluation and optimizations . . . 101
6.4 Virtual reality assembly assessment benchmark . . . . 102
6.4.1 State of the art . . . . . . . . . . . . . . . . . . . . 103
6.4.2 Influence parameters on the overall VR purpose 104
6.4.3 The VR2A benchmark . . . . . . . . . . . . . . . 105
6.4.4 Setup, stimuli and design . . . . . . . . . . . . . 107
6.4.5 Participants and procedure . . . . . . . . . . . . 108
6.4.6 Results . . . . . . . . . . . . . . . . . . . . . . . . 109
6.4.7 Discussion and practical conclusions using VR2Ainsights . . . . . . . . . . . . . . . . . . . . . . . . 111
6.4.8 VR2A summary . . . . . . . . . . . . . . . . . . . 112
6.5 Co-located PMUs and DMUs in VR assessments . . . . 113
6.6 Summary . . . . . . . . . . . . . . . . . . . . . . . . . . . 114
7 markerless , scalable full-body motion capture
system 117

contents xiii
7.1 Application scenarios and requirements of skeletal track-ing . . . . . . . . . . . . . . . . . . . . . . . . . . . . . . . 119
7.2 Objective of multi-sensor arrangements . . . . . . . . . 121
7.3 State-of-the-art in full body human motion tracking . . 122
7.3.1 Inertial full body motion capture . . . . . . . . . 122
7.3.2 Optical full body motion capture . . . . . . . . . 123
7.3.3 Microsoft Kinect v2 depth-camera sensor . . . . 125
7.3.4 Microsoft Kinect v2 skeletal tracking . . . . . . 126
7.4 State of the art in multi-depth camera systems . . . . . 127
7.4.1 System architecture . . . . . . . . . . . . . . . . . 128
7.4.2 Interference handling . . . . . . . . . . . . . . . 128
7.4.3 Registration . . . . . . . . . . . . . . . . . . . . . 129
7.4.4 Fusion . . . . . . . . . . . . . . . . . . . . . . . . 129
7.5 Skeletal tracking performance measurements . . . . . . 130
7.5.1 Experimental setup . . . . . . . . . . . . . . . . . 131
7.5.2 Evaluation 360° experiment . . . . . . . . . . . . 132
7.5.3 Evaluation 85° experiment . . . . . . . . . . . . 135
7.6 Implementation of multi-depth sensor system . . . . . 136
7.6.1 Service-oriented tracking service . . . . . . . . . 137
7.6.2 Fusion service . . . . . . . . . . . . . . . . . . . . 137
7.7 Evaluation of registration accuracy . . . . . . . . . . . . 143
7.7.1 Experimental setup . . . . . . . . . . . . . . . . . 143
7.7.2 Design of experiment . . . . . . . . . . . . . . . 144
7.7.3 Results . . . . . . . . . . . . . . . . . . . . . . . . 144
7.8 Practical motion capture in PV workshops . . . . . . . 145
7.9 Working postures evaluation in ergonomic assessments 147
7.9.1 Related work on standardized ergonomic assess-ments . . . . . . . . . . . . . . . . . . . . . . . . . 147
7.9.2 Study goal, setup and evaluation method . . . . 148
7.9.3 Procedure and participants . . . . . . . . . . . . 149
7.9.4 Results of working posture analysis . . . . . . . 150
7.9.5 Discussion . . . . . . . . . . . . . . . . . . . . . . 152
7.10 Flexible, visually low-occluding PMUs . . . . . . . . . . 153
7.11 Conclusion . . . . . . . . . . . . . . . . . . . . . . . . . . 154
7.11.1 Limitations . . . . . . . . . . . . . . . . . . . . . 156
7.11.2 Fulfilled requirements . . . . . . . . . . . . . . . 157
8 wall-sized, high resolution visualization hard-ware systems 159
8.1 State of the art in LHRD visualization systems . . . . . 161
8.1.1 Content representation with LHRDs . . . . . . . 162
8.1.2 Interaction with LHRDs . . . . . . . . . . . . . . 164
8.1.3 LHRD augmented floor surfaces . . . . . . . . . 164
8.1.4 Application scenarios for augmented floor sur-faces . . . . . . . . . . . . . . . . . . . . . . . . . 165
8.2 Industrial application scenarios using augmented floorsurfaces . . . . . . . . . . . . . . . . . . . . . . . . . . . . 166
xiv contents
8.2.1 Interactive walk path optimization . . . . . . . . 166
8.2.2 Layout assessments . . . . . . . . . . . . . . . . . 168
8.2.3 Virtual original size stencil . . . . . . . . . . . . 169
8.2.4 Size perception and engagement . . . . . . . . . 170
8.2.5 Self-navigation in virtual space . . . . . . . . . . 170
8.2.6 Virtual travels with interactive maps . . . . . . . 170
8.3 Implementation and evaluation of a scalable floor pro-jection system . . . . . . . . . . . . . . . . . . . . . . . . 171
8.3.1 Hardware implementation . . . . . . . . . . . . 172
8.3.2 Image distribution in the system architecture . 172
8.3.3 Implementation of projection units . . . . . . . . 173
8.3.4 User study . . . . . . . . . . . . . . . . . . . . . . 175
8.3.5 Discussion and conclusion . . . . . . . . . . . . 177
8.4 Implementation and evaluation of a LED visualizationsystem . . . . . . . . . . . . . . . . . . . . . . . . . . . . 178
8.4.1 Multi LED display environment arrangement . 178
8.4.2 System architecture . . . . . . . . . . . . . . . . . 180
8.4.3 Graphical user interface for image distribution . 181
8.5 Original size size perception study . . . . . . . . . . . . 183
8.5.1 Study goal and predictions . . . . . . . . . . . . 184
8.5.2 Participants . . . . . . . . . . . . . . . . . . . . . 185
8.5.3 Setup, stimuli and design . . . . . . . . . . . . . 185
8.5.4 Procedure . . . . . . . . . . . . . . . . . . . . . . 186
8.5.5 Results . . . . . . . . . . . . . . . . . . . . . . . . 187
8.5.6 Questionnaire results . . . . . . . . . . . . . . . . 192
8.5.7 Discussion . . . . . . . . . . . . . . . . . . . . . . 193
8.5.8 Conclusion of size perception study . . . . . . . 194
8.6 Virtual stencil study using augmented floor surfaces . 194
8.6.1 Study goal and predictions . . . . . . . . . . . . 195
8.6.2 Participants . . . . . . . . . . . . . . . . . . . . . 195
8.6.3 Setup, stimuli and design . . . . . . . . . . . . . 195
8.6.4 Procedure . . . . . . . . . . . . . . . . . . . . . . 197
8.6.5 Results . . . . . . . . . . . . . . . . . . . . . . . . 199
8.6.6 Discussion . . . . . . . . . . . . . . . . . . . . . . 201
8.7 Overall conclusion and outlook . . . . . . . . . . . . . . 202
9 projective spatial augmented reality 205
9.1 Requirements for PMU-based PV workshops . . . . . . 206
9.2 Properties of spatial augmented reality . . . . . . . . . 208
9.3 Related work on spatial augmented reality in manufac-turing . . . . . . . . . . . . . . . . . . . . . . . . . . . . . 210
9.4 SAR system architecture . . . . . . . . . . . . . . . . . . 213
9.5 Comparison of OST-HMD vs. projective SAR . . . . . . 214
9.6 Design space exploration of spatial augmented reality 217
9.6.1 Setup, stimuli and design . . . . . . . . . . . . . 218
9.6.2 Results . . . . . . . . . . . . . . . . . . . . . . . . 219
9.6.3 Discussion . . . . . . . . . . . . . . . . . . . . . . 222
contents xv
9.6.4 Summary . . . . . . . . . . . . . . . . . . . . . . 224
9.7 Evaluation collaborative task performance using SAR . 224
9.7.1 Study goal . . . . . . . . . . . . . . . . . . . . . . 225
9.7.2 Methodology . . . . . . . . . . . . . . . . . . . . 226
9.7.3 Experimental setup . . . . . . . . . . . . . . . . . 226
9.7.4 Procedure and participants . . . . . . . . . . . . 227
9.7.5 Results . . . . . . . . . . . . . . . . . . . . . . . . 229
9.7.6 Discussion . . . . . . . . . . . . . . . . . . . . . . 230
9.8 Conclusion . . . . . . . . . . . . . . . . . . . . . . . . . . 230
10 overall evaluation of the vms framework 233
10.1 Participants and interview procedure . . . . . . . . . . 233
10.2 Results . . . . . . . . . . . . . . . . . . . . . . . . . . . . 234
10.3 Discussion and summary . . . . . . . . . . . . . . . . . 238
11 conclusion & outlook 239
11.1 Practical exploitation of the VMS framework . . . . . . 239
11.2 Research questions and results . . . . . . . . . . . . . . 240
11.3 Outlook . . . . . . . . . . . . . . . . . . . . . . . . . . . . 247
bibliography 249
L I S T O F F I G U R E S
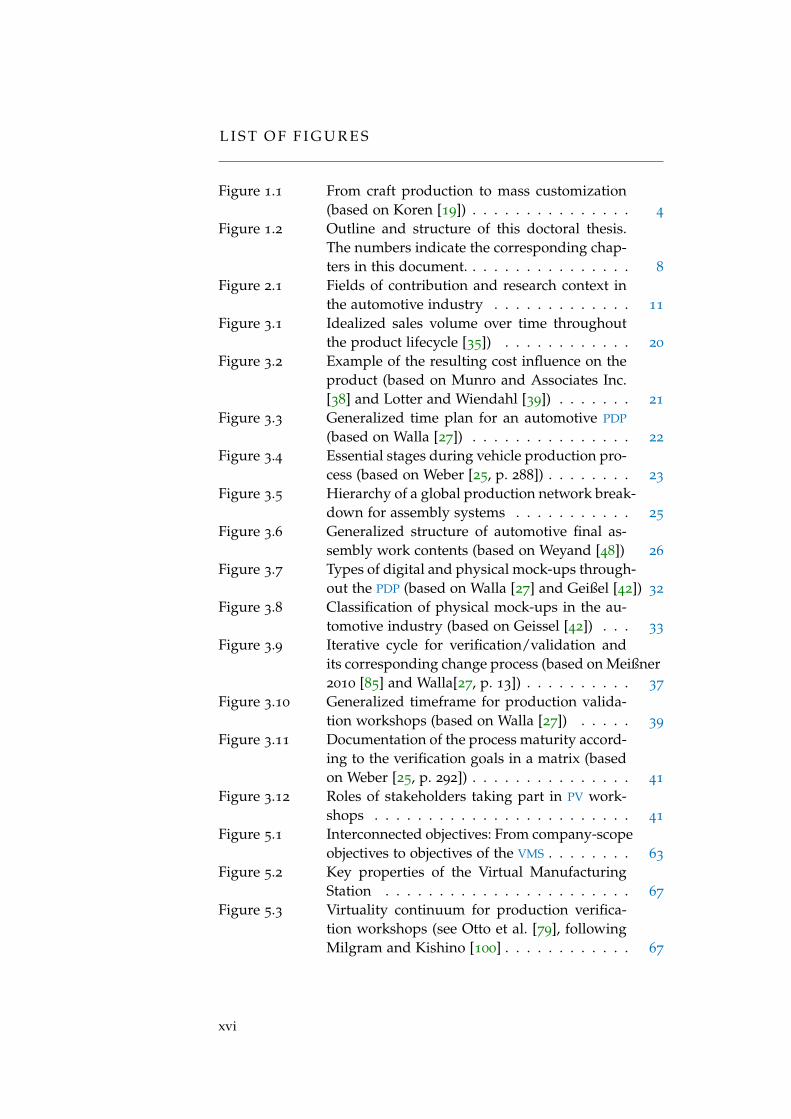
Figure 1.1 From craft production to mass customization(based on Koren [19]) . . . . . . . . . . . . . . . 4
Figure 1.2 Outline and structure of this doctoral thesis.The numbers indicate the corresponding chap-ters in this document. . . . . . . . . . . . . . . . 8
Figure 2.1 Fields of contribution and research context inthe automotive industry . . . . . . . . . . . . . 11
Figure 3.1 Idealized sales volume over time throughoutthe product lifecycle [35]) . . . . . . . . . . . . 20
Figure 3.2 Example of the resulting cost influence on theproduct (based on Munro and Associates Inc.[38] and Lotter and Wiendahl [39]) . . . . . . . 21
Figure 3.3 Generalized time plan for an automotive PDP
(based on Walla [27]) . . . . . . . . . . . . . . . 22
Figure 3.4 Essential stages during vehicle production pro-cess (based on Weber [25, p. 288]) . . . . . . . . 23
Figure 3.5 Hierarchy of a global production network break-down for assembly systems . . . . . . . . . . . 25
Figure 3.6 Generalized structure of automotive final as-sembly work contents (based on Weyand [48]) 26
Figure 3.7 Types of digital and physical mock-ups through-out the PDP (based on Walla [27] and Geißel [42]) 32
Figure 3.8 Classification of physical mock-ups in the au-tomotive industry (based on Geissel [42]) . . . 33
Figure 3.9 Iterative cycle for verification/validation andits corresponding change process (based on Meißner2010 [85] and Walla[27, p. 13]) . . . . . . . . . . 37
Figure 3.10 Generalized timeframe for production valida-tion workshops (based on Walla [27]) . . . . . 39
Figure 3.11 Documentation of the process maturity accord-ing to the verification goals in a matrix (basedon Weber [25, p. 292]) . . . . . . . . . . . . . . . 41
Figure 3.12 Roles of stakeholders taking part in PV work-shops . . . . . . . . . . . . . . . . . . . . . . . . 41
Figure 5.1 Interconnected objectives: From company-scopeobjectives to objectives of the VMS . . . . . . . . 63
Figure 5.2 Key properties of the Virtual ManufacturingStation . . . . . . . . . . . . . . . . . . . . . . . 67
Figure 5.3 Virtuality continuum for production verifica-tion workshops (see Otto et al. [79], followingMilgram and Kishino [100] . . . . . . . . . . . . 67
xvi

List of Figures xvii
Figure 5.4 Four types of personas are involved in virtualPV workshops: Authoring experts, technical op-erators, PV workshop leaders and participants 75
Figure 5.5 Rendering of the vision for an integrated vir-tual manufacturing station environment as acollaborative workshop environment for inter-active assessments of manual assembly tasks[94] . . . . . . . . . . . . . . . . . . . . . . . . . 78
Figure 5.6 Rendering of large multiple wall-sized largehigh-resolution visualization devices with a LEDfloor. . . . . . . . . . . . . . . . . . . . . . . . . . 78
Figure 5.7 Research matrix of the studies related to thekey properties of the VMS . . . . . . . . . . . . 79
Figure 6.1 User interface of the assembly simulation soft-ware veo. (Left) Product variants, manufactur-ing sequence and eBOM can be switched. (right)3D visualization of the virtual scene and bird’seye view of the parametric cell layout. (upperright) Manipulating the interactive assemblysimulation. (top) Active single part visualiza-tion . . . . . . . . . . . . . . . . . . . . . . . . . 88
Figure 6.2 Need for low authoring and preparation effortof virtual environments in process validation . 89
Figure 6.3 Example for a multilevel product structure ofa car eBOM. (Right) Multiple levels "main as-sembly", "assembly", "sub assembly", "Position"and "Sub-Position" is depicted for the example"Heads Up Display System" (product structureaccording to a2mac1.com [137]) . . . . . . . . . 90
Figure 6.4 Interconnection between product BOM, man-ufacturing sequence hierarchy and work taskdescriptions . . . . . . . . . . . . . . . . . . . . 91
Figure 6.5 Schematic import and data fusion process tocrate a scene for the virtual assessment software 91
Figure 6.6 Blue floor plane represents the coupling / reg-istration between floor visualization hardwareand the Virtual Environment (VE). (left) Inte-grated assessment scene, (right) bird’s eye view 96
Figure 6.7 Interaction cycle for an isometrically registeredaugmented floor surface and DHM animation . 97
Figure 6.8 veo VR user interface components: (left) VR pro-cess menu, (center) VR reposition mode, (right)enhanced virtual controller representation . . . 100
xviii List of Figures
Figure 6.9 Optimization of veo VR user interface compo-nents: (left) visual part indication cue, (center)VR controller help, (right) assembly part ap-proach cue . . . . . . . . . . . . . . . . . . . . . 101
Figure 6.10 Block diagram of VR interaction cycle includ-ing error influence factors (based on [124]) . . 104
Figure 6.11 Overview on the standard experiment designof VR2A and the two independent variables:Size and clearance (based on [124]) . . . . . . . 106
Figure 6.12 (Left) Rendering of the open virtual environ-ment with six differently sized cubes. (Middle)Explanation of disc cavities relative to the cor-responding cube sizes, which are not visible tothe user. (Right) Controller with sharp grasp-ing point (based on [124]) . . . . . . . . . . . . 108
Figure 6.13 Relative frequencies of the participants’ answersin VR2A benchmark over the different scenar-ios [124] . . . . . . . . . . . . . . . . . . . . . . . 109
Figure 6.14 Results of the VR assembly assessment score.Low values indicate high uncertainty or inho-mogeneity of answers [124] . . . . . . . . . . . 110
Figure 6.15 Mean VR2A score over size scenarios with therespective 2nd polynomial regression [124] . . 110
Figure 6.16 Mean VR2A score over clearance scenarios withthe respective 2nd polynomial regression [124] 111
Figure 6.17 Evaluation of a co-located VR experience com-bining a tracked PMU, markerless full body mo-tion capture and an immersive HMD view with3D interaction devices referenced relatively tothe digital human . . . . . . . . . . . . . . . . . 114
Figure 7.1 Workshop area in automotive car assembly withfull body skeletal tracking, typically sized 6m x4m. This also represents the required trackingarea [94, 174] . . . . . . . . . . . . . . . . . . . . 119
Figure 7.2 Relevant joints nomenclature of SDK body track-ing [174] . . . . . . . . . . . . . . . . . . . . . . 130
Figure 7.3 Experimental setups: A) 360° rotational test:Mannequin hanging on robot, B) Mannequin’sspine mounted on robot [174] . . . . . . . . . . 131
Figure 7.4 Drawing of coordinate system and two experi-mental setups: A) 360° rotation, B) 85° rotation[174] . . . . . . . . . . . . . . . . . . . . . . . . . 132
Figure 7.5 360° rotational experiment: Front/back ambi-guity during rotation for the non-center axisjoints ShoulderLeft and ShoulderRight. Colorchange indicates the front/back ambiguity [174] 133
List of Figures xix
Figure 7.6 360° rotational experiment: Expected SDK be-havior vs. estimated shoulder and hip orienta-tion [174] . . . . . . . . . . . . . . . . . . . . . . 134
Figure 7.7 360° experiment: Mean inter-frame jitter for allcenter-axis joints [174] . . . . . . . . . . . . . . 135
Figure 7.8 Evaluation of 85° experiment: top view of center-axis joints in relation to ground truth real tra-jectory [174] . . . . . . . . . . . . . . . . . . . . 136
Figure 7.9 Hardware setup for the tracking system withservice-oriented, distributed sensor services (basedon [174, 175]) . . . . . . . . . . . . . . . . . . . . 136
Figure 7.10 Block diagram of fusion service [174, 175] . . . 137
Figure 7.11 Concatenated transformation chains for a foursensor arrangement [174] . . . . . . . . . . . . . 139
Figure 7.12 Point cloud fusion with two Kinect v2 cam-eras. Human depth information becomes moredense and concealed structures can be capturedusing multi-sensor arrangements . . . . . . . . 143
Figure 7.13 Experimental setup for evaluation of Multi-Kinecttracking accuracy . . . . . . . . . . . . . . . . . 144
Figure 7.14 Top view of the registration results: Master sen-sor at [0,0], 5 scenarios with 20 registrationseach, circles indicate the ground truth of theOptiTrack measurements [174, 175] . . . . . . . 145
Figure 7.15 Block diagram of data pipeline for digital hu-man simulation in Delmia V5 . . . . . . . . . . 146
Figure 7.16 Delmia V5 DHM directly manipulated by marker-less motion capture approach. All assessmentscan be carried out in real time [174, 175] . . . . 147
Figure 7.17 Block diagram of the EAWS applicability evalu-ation pipeline . . . . . . . . . . . . . . . . . . . 149
Figure 7.18 Practical usage of marker-less motion capturein PV workshops in comparison with PMU as-sessments . . . . . . . . . . . . . . . . . . . . . . 155
Figure 8.1 Walk path optimizations on the augmented floorsurface. A combination of automatically sim-ulated walk paths and interactively recordedwalk paths are shown in original size (basedon [239]) . . . . . . . . . . . . . . . . . . . . . . 167
Figure 8.2 Optical sensors of the augmented floor sur-face are able to detect objects e.g. foot steps.Walk path trajectories can be reconstructed us-ing this sensor information (based on [239]) . . 168
xx List of Figures
Figure 8.3 Bird’s eye view of a virtual assembly worksta-tion layout (left). The content is displayed onthe augmented floor surface and presented inoriginal size to multiple people (right). Whiteand blue boxes represent outlines of carriersand racks (based on [239]) . . . . . . . . . . . . 169
Figure 8.4 Block diagram for the use case cell layout plan-ning. Both the physical and virtual domain bidi-rectionally influence each other. (left) physicalcardboard workshops make use of haptic ma-terials and real-life forces. (right) In the virtualdomain, cell layouts can be quickly altered andsimulated (based on [239]) . . . . . . . . . . . . 169
Figure 8.5 Usage of the augmented floor surface for vir-tual travels. (Left) The schematic shows the in-formation architecture on both walls and thefloor. (Right) The walls allow an immersive deep-dive in 360◦ photospheres, each virtual cam-era having a 90◦ offset around the vertical axis.The floor map orientation changes accordinglyto the wall viewport (based on [239]) . . . . . . 171
Figure 8.6 Hardware arrangement of floor projection withlight paths and projection cones . . . . . . . . . 172
Figure 8.7 System architecture of floor projection system(based on Otto et al. [93]) . . . . . . . . . . . . 173
Figure 8.8 Implementation of the floor projection system.(left) Two projectors on trussing (right) closeview of projectors with front-facing mirror . . 174
Figure 8.9 Survey results on: height of projectors (upper-left), color differences (upper-right), hard-edgingimage cascade (lower-left) and resolution (lower-right) . . . . . . . . . . . . . . . . . . . . . . . . 176
Figure 8.10 Survey results on: brightness (left), dazzled withlight (middle) and shadows (right) (based onOtto et al. [93]) . . . . . . . . . . . . . . . . . . . 176
Figure 8.11 Survey results on: original size visualization(left), efficiency improvements (middle) and ver-ification of walking paths (right) (compare Ottoet al. [93]) . . . . . . . . . . . . . . . . . . . . . . 177
Figure 8.12 The VMS apparatus consists of two 16 sqm, L-arranged LED walls next to a 54 sqm large-scale LED floor [239, 245] . . . . . . . . . . . . 179
Figure 8.13 System architecture of the VMS image distribu-tion and controllers to the devices . . . . . . . 180
Figure 8.14 Block diagram of Crestron UI image distribution 182
List of Figures xxi
Figure 8.15 Three evaluation scenarios: Tablet(T), Floor(F)and Floor Interaction(FI). Left: The user carriesout the size estimations using a tablet com-puter. Center: The user utilizes the augmentedfloor surface, standing on the outside. Right:The user moves on the floor while performingthe size estimations [239, 245] . . . . . . . . . . 185
Figure 8.16 In all three scenarios a square is shown. It israndomly scaled, positioned and rotated. Ad-ditionally a 1 meter ruler is given as an addi-tional visual cue [239, 245] . . . . . . . . . . . . 186
Figure 8.17 Scatter plots of all three scenarios show thespatial deviations. Each plot follows Bland-Altmanplot [282] style, additionally showing the meanvalues, standard deviations and a linear regres-sions over the actual visualized cube sizes. Onecan see that variance of spatial deviations overthe true sizes tends to increase in all scenarios[239, 245] . . . . . . . . . . . . . . . . . . . . . . 189
Figure 8.18 Box plot for MAPE of scenarios (T), (F) and (FI)[239, 245] . . . . . . . . . . . . . . . . . . . . . . 190
Figure 8.19 Box plot for SD of unsigned percentage errorsin scenarios (T), (F) and (FI) [239, 245] . . . . . 190
Figure 8.20 Median task completion time of all participants(N=22) for all 3 scenarios throughout the 20
runs [239] . . . . . . . . . . . . . . . . . . . . . . 191
Figure 8.21 Comparison between perceived (subjective) ab-solute spatial deviation and objective absolutespatial deviation. N=22 for each scenario [239] 192
Figure 8.22 Example of both scenarios during each run.Blue squares indicate the physical object’s des-tinations . . . . . . . . . . . . . . . . . . . . . . 196
Figure 8.23 Set of six physical objects each having differentsizes. Four out of six objects are used duringeach run to replicate the virtual cell layouts . . 197
Figure 8.24 Typical sequence of tasks during each run forscenario A and B . . . . . . . . . . . . . . . . . 198
Figure 8.25 Comparison of the two different scenarios in abox plot . . . . . . . . . . . . . . . . . . . . . . . 199
Figure 8.26 Comparison of mean task completion time val-ues over the different runs . . . . . . . . . . . . 200
Figure 8.27 Evaluation of potential application areas of theLED floor visualization and interaction . . . . 201
Figure 9.1 Visual display techniques and positioning (basedon Bimber and Raskar [287] . . . . . . . . . . . 208
xxii List of Figures
Figure 9.2 Left: Block diagram of SAR system applied inVMS; Right: Two different types of projectiveSAR: laser-based and video-based projective SAR
systems . . . . . . . . . . . . . . . . . . . . . . . 213
Figure 9.3 Application related comparison of SAR vs. OST-HMD (Reprinted with friendly permission byEXTEND3D [314]) . . . . . . . . . . . . . . . . . 215
Figure 9.4 Schematic setup for design space explorationfor SAR applications . . . . . . . . . . . . . . . . 218
Figure 9.5 PMU quality inspection check by laser-basedprojective SAR to display potential offsets be-tween DMU and PMU . . . . . . . . . . . . . . . 219
Figure 9.6 PMU alignment tasks using video-based projec-tive SAR to display bolt positions on a body-in-white . . . . . . . . . . . . . . . . . . . . . . . . 220
Figure 9.7 Visual assembly support using video-based pro-jective SAR to display assembly parts on a door 220
Figure 9.8 Visual assembly support with parallax effext(left), little parallax effect (middle) and low pro-jection intensity (right) using video-based pro-jective SAR. Projection a middle console onto abody-in-white . . . . . . . . . . . . . . . . . . . 221
Figure 9.9 Alphanumeric assembly task information ongeneric PMUs using video-based projective SAR 221
Figure 9.10 Alphanumeric assembly task information ongeneric PMUs using laser-based projective SAR 222
Figure 9.11 Study setup: A process expert (PE) explainsspatial relations to the technical operator (TO)using three different methods: verbal descrip-tion, support of display and SAR [79] . . . . . . 226
Figure 9.12 Physical evaluation setup without participantsbeing present . . . . . . . . . . . . . . . . . . . . 227
Figure 9.13 Evaluation on mean times and standard devia-tions (sorted by descending verbal descriptionresults) [79] . . . . . . . . . . . . . . . . . . . . . 229
Figure 10.1 Demoed contents in advance of the expert in-terviews . . . . . . . . . . . . . . . . . . . . . . . 234
L I S T O F TA B L E S
Table 3.1 Product-related verification criteria . . . . . . . 44
Table 3.2 Human-related verification criteria . . . . . . . 45
Table 3.3 Process-related verification criteria . . . . . . . 46
Table 3.4 Resource-related verification criteria . . . . . . 47
Table 3.5 Logistics-related verification criteria . . . . . . 47
Table 4.1 Interview participants and their respective back-ground, characteristics and technology affinity 51
Table 5.1 Analysis of utility categories (based on Kunst[95, p. 11]) . . . . . . . . . . . . . . . . . . . . . 62
Table 5.2 Example for mixture possibilities in virtual as-sessments. The operator can choose from amongvarious purely physical, virtual and augmentedreality assessments . . . . . . . . . . . . . . . . 68
Table 6.1 Description of cubes in VR2A benchmark . . . 106
Table 7.1 Classification of optical full body motion cap-ture systems . . . . . . . . . . . . . . . . . . . . 124
Table 7.2 Reproducibility and deviation of registrationresults for the 5 scenarios (N=100) . . . . . . . 145
Table 7.3 Evaluation results for EAWS working postures"standing" [177] . . . . . . . . . . . . . . . . . . 150
Table 7.4 Evaluation results for EAWS working postures"sitting" [177] . . . . . . . . . . . . . . . . . . . . 151
Table 7.5 Evaluation results for EAWS working postures"Kneeling & crouching" [177] . . . . . . . . . . 151
Table 7.6 Evaluation results for EAWS working postures"lying" [177] . . . . . . . . . . . . . . . . . . . . 152
Table 7.7 Evaluation results for working postures "dy-namic postures." 360° rotation only applies formulti-depth camera setups [177] . . . . . . . . 152
Table 7.8 Visual light-weight physical mock-ups for oc-clusion reduction . . . . . . . . . . . . . . . . . 154
Table 7.9 Realization analysis of requirements of the pre-sented motion capture system . . . . . . . . . . 158
Table 8.1 Specifications of VMS output apparatus [239] . 179
Table 8.2 Comparison of median task completion times[239] . . . . . . . . . . . . . . . . . . . . . . . . . 191
Table 8.3 Sequence of runs in the 2 groups for each par-ticipant. Counter-balanced scenarios A and Bfor group 1 and 2 . . . . . . . . . . . . . . . . . 197
Table 8.4 Results on task completion time and absolutenumber of errors for each scenario . . . . . . . 199
xxiii

xxiv List of Tables
Table 9.1 Classes of AR supportable activities in manu-facturing tasks following Neumann and Ma-joros [290] . . . . . . . . . . . . . . . . . . . . . 207
Table 9.2 Comparison of OST-HMD Hololens vs. Werk-licht Pro vs. Werklicht Video . . . . . . . . . . . 216
Table 10.1 Detailed data of the expert interview on theinterview partners . . . . . . . . . . . . . . . . . 234

A C R O N Y M S
AR Augmented Reality
CAD Computer-aided Design
CAM Computer-aided Manufacturing
CAPP Computer-aided Production Planning
CSCW Computer-Supported Cooperative Work
CVE Collaborative Virtual Environment
DFA Design for Assembly
DFMA Design for Manufacturing and Assembly
DHM Digital Human Model
DMU Digital mock-up
DoF Degrees of Freedom
EAWS Ergonomic Assessment Worksheet
HID Human Interface Device
HMD Head-Mounted Display
HCI Human Computer Interaction
ICP Iterative Closest Point
JT Jupiter Tesselation
KVM Keyboard, Video and Mouse
LHRD Large High-Resolution Displays
MDE Multi-Display Environment
MoCap Motion Capture
MTM Methods-Time Measurement
OEM Original Equipment Manufacturer
OST Optical See-Through
PDM Product Data Management
PDP Product Development Process
xxv
xxvi acronyms
PLM Product Lifecycle Management
PMU Physical Mock-up
PMTS Predetermined Motion Time System
PPR Product, Process and Resource
PV Production Validation
REST Representational State Transfer
SAR Spatial Augmented Reality
SDK Software Development Kit
SOP Start of Production
ToF Time of Flight
UI User Interface
VE Virtual Environment
VMS Virtual Manufacturing Station
VR Virtual Reality
VRPN Virtual-Reality Peripheral Network
VT Virtual Technology
1I N T R O D U C T I O N
The success of automotive Original Equipment Manufacturers (OEMs)depends on their ability to create customer-oriented products andservices that can be delivered faster to customers than by their com-petitors. In the context of saturated markets, customer demands arecontinuously changing and increasing. Demand for electrified vehi-cles, mobility services and highly customizable products is increasingcompared to the purchase of pre-defined products. Therefore, auto-motive manufacturers have to face these market demands and haveto react faster to changes than the competition. Faced with disruptivechanges in customer demands and digital transformation, productionsystems must have the flexibility to produce a wide range of products[1] such as diversified models, derivatives, extra equipment and fea-tures.
1.1 economic impact of the global automotive indus-try
The automotive industry is a key driver of GDP growth and employ-ment [2] in developed countries. Following OICA, the internationalorganization of motor vehicle manufacturers, in 2019 67.14 millionpassenger cars and 24.63 million commercial vehicles were producedworldwide [3] compared to 39.76 million cars and 16.50 million com-mercial vehicles in 1999 [4]. In 2019, the top three passenger car pro-ducing countries were China (21.36 million), followed by Japan (8.32
million) and Germany (4.66 million) [3]. The average annual revenueof the "world automobile industry is more than 2.75 trillion Euros,which corresponds to 3.65% of the world GDP" [2]. Therefore, in thesecountries, the automotive industry has a huge share of the local GDP.For example, in Germany, the automotive industry has a share of 14%of the GDP and therefore holds a share of 6% of world production.In Germany, this industry has 807,000 direct employees and 1,800,000
indirect employees [2]. The automotive industry is a globalized mar-ket with significant value for the producing countries. For developedcountries, they generate a substantial taxable base and revenues forstate budgets. In a globalized world, all OEMs see themselves in anincreasingly competitive market environment.
1
2 introduction
1.2 technological changes in the automotive industry
The digital transformation in the automotive industry leads to dis-ruptive changes for both the products and their manufacturing pro-cesses. Wedeniwski describes "The Mobility Revolution in Automo-tive Industry" [5] and "how not to miss the digital turnpike." One ofthe key drivers is the ongoing "revolution in digitalization" and infor-mation technology. Not only is the product itself changing with theseenabling technologies, but novel mobility concepts are also emerg-ing. Faced with radical changes, large shares of the OEM’s revenueare spent on the research and development of future products as de-scribed in the whitepaper entitled “Five trends transforming the Au-tomotive Industry“ by PWC. They summarize five main changes inthe automotive industry: “electrified, autonomous, shared, connectedand yearly updated” [6]. Almost all OEMs have started initiatives forthese major disruptive changes, including Daimler AG’s "CASE (con-nected, autonomous, shared, electric) strategy" [7]. These five disrup-tive changes are explained below:
Automakers are preparing to shift from building cars solely pow-ered by internal combustion engines to electric vehicles, such as hy-brid electric vehicles and battery electric vehicles. By 2025 this shareis estimated to be 30% of all vehicle sales, compared to 1% in 2016
[8].Autonomous driving is clustered in six levels ranging from Level
0 "driver support" to Level 5 "vehicle on demand." This taxonomy fordriving automation systems is standardized by "SAE InternationalMobilus" in the document J3016B [9]. New application scenarios areenabled, such as completely driverless cars. Overall, autonomous driv-ing requires multiple new components within the products, such assensors, computing power and novel user interfaces [6, p. 20].
For shared vehicles, McKinsey has proposed to produce solutionspecific vehicles for each purpose, rather than offering a one-fits-allpurpose vehicle. "The shift to shared mobility, enabling consumers touse the optimal solution for each purpose, will lead to new segmentsof specialized vehicles designed for very specific needs" [10], such asvacation, commuting, shopping, leisure and business vehicles.
Connected and yearly updated products also have implications ontheir production. Currently, in the automotive industry, the averageexpected life cycle of a product is seven years. Shorter time-to-marketperiods and yearly product updates are major change factors. Thisholds true for both the hardware and software of the products. Con-nectedness makes new business models feasible, such as over-the-airenabled features: Hardware parts are pre-installed in the products,even though the software feature is not enabled at the time of sale.The feature can be purchased after sales via an over-the-air update.For example, DAB+ radio is pre-installed in all cars, even though the

1.3 challenges in automotive production 3
feature is not enabled by default and can be activated via a remotesoftware update.
1.3 challenges in automotive production
All of these product change factors also directly influence automotivemanufacturing. In order to stay competitive in market environmentswith saturation effects for automotive products, manufacturers haveto "align their products and production with market demands" [11].Diversification such as additional assembly parts, novel powertrainsand extra equipment have to be integrated into the manufacturingsystem to produce these novel products with the aforementionedproperties. As customers demand these novel features, more func-tions and regional adaptations, product variety increases [12]. Addi-tionally, customers demand shorter product life cycles [11].
1.3.1 Increasing product variety
An ongoing trend to shorter life cycles and more highly individual-ized products can be observed [13]. Therefore, OEMs are continuouslyoffering more car models, derivatives and variants. In the automotiveindustry, a model family consists of several models, such as sedan,wagon or convertible. Göpfert shows that the number of model vari-ants has increased continuously over the past few years [14, p. 248].For instance, in 1993, Mercedes-Benz offered nine main product vari-ants, whereas in 2012 there were already 22 [15]. Overall, the numberof car models in Germany has risen from 101 in 1990 to 453 in 2014
[16]. Along with the rising number of models, optional extra equip-ment for any given model has increased in a similar manner. A typicalC-Class sedan offered 66 options in 1992, whereas in 2015 there were211 options [17].
This growing product variety has a direct impact on all businessunits of an OEM such as research and development, production, lo-gistics, brand, marketing, sales and after-sales [16]. Maropoulos &Ceglarek describe the increased efforts regarding the verification andvalidation of products in complex manufacturing systems [18]. Theimpact on the production system is one of the main reasons for car-rying out the research in this doctoral thesis, since this impact resultsin a higher complexity in the production systems as well as increasesin time and costs, which, in turn, has similar adverse effects on pro-duction planning departments.
1.3.2 Mass customization
This variety is the consequence of production for a diversified cus-tomer base, which demands low cost and high quality goods with
4 introduction
highly customized features. In contrast to mass production, mass cus-tomization is one promising approach to achieve this objective. In pro-duction systems, there is a continuous trade-off between productivity,quality, efficiency and costs [14, p. 249]. In enhancing the consumer’svalue through variety, the manufacturing industry in general mustdeal with increased product variety. It aims to achieve the overall ef-ficiency of mass production while producing small batches of highlycustomized products.
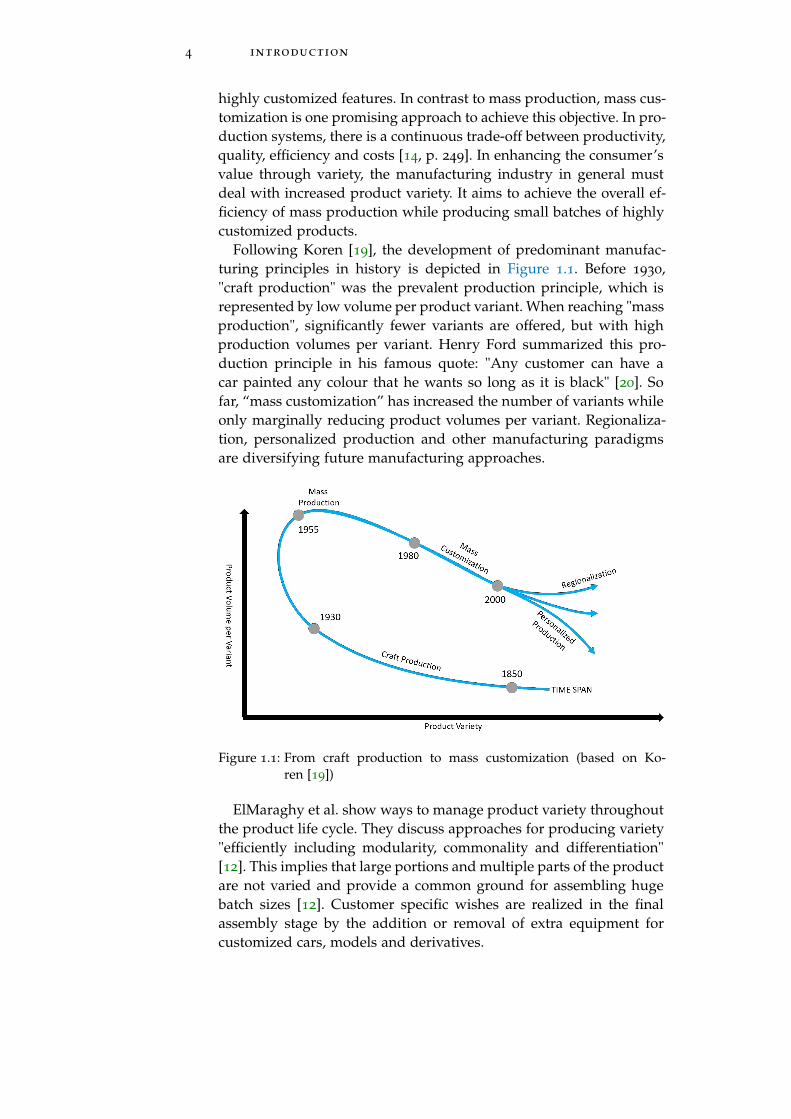
Following Koren [19], the development of predominant manufac-turing principles in history is depicted in Figure 1.1. Before 1930,"craft production" was the prevalent production principle, which isrepresented by low volume per product variant. When reaching "massproduction", significantly fewer variants are offered, but with highproduction volumes per variant. Henry Ford summarized this pro-duction principle in his famous quote: "Any customer can have acar painted any colour that he wants so long as it is black" [20]. Sofar, “mass customization” has increased the number of variants whileonly marginally reducing product volumes per variant. Regionaliza-tion, personalized production and other manufacturing paradigmsare diversifying future manufacturing approaches.
Figure 1.1: From craft production to mass customization (based on Ko-ren [19])
ElMaraghy et al. show ways to manage product variety throughoutthe product life cycle. They discuss approaches for producing variety"efficiently including modularity, commonality and differentiation"[12]. This implies that large portions and multiple parts of the productare not varied and provide a common ground for assembling hugebatch sizes [12]. Customer specific wishes are realized in the finalassembly stage by the addition or removal of extra equipment forcustomized cars, models and derivatives.
1.3 challenges in automotive production 5
1.3.3 Need for flexibility
As product features change, production systems must also be adaptedso that they can produce these complex goods. Therefore, in additionto mass customization initiatives, assembly systems must becomemore flexible. Chryssolouris [21] names multiple aspects of flexibil-ity: Machine, process, product, routing, volume, expansion, operationand production flexibility. The most important clusters for automak-ers are described below:
1. Product flexibility: "The ability to change over to produce newproducts economically and quickly."
2. Operational flexibility: "The ability to interchange ordering ofseveral operations for each part type."
3. Volume flexibility: "The ability to operate profitably at differentproduction volumes."
4. Expansion flexibility: " The ability to expand the system easilyand in a modular fashion."
In general, a potential drop in demand is costly, time intensive anddifficult. This is why flexibility strategies in production must be pur-sued: "Examples from automotive industry are proving that compa-nies leveraging flexibility effects in their plants and an optimal ca-pacity utilization are having a decisive competitive advantage" [14,p. 249].
1.3.4 Global production networks
Production facilities are spread all over the world so that they canproduce different models in all of their plants anywhere in the worldat the same time (compare Shimokawa et al. [22]). In a globalizedproduction network, physically dispersed and geographically spreadproduct ramp-ups must be dealt with. For example, automakers in-tegrate a sedan variant of a new model family in a production linewhile still producing convertibles from the previous model familygeneration on the same production line. Such model-mix productionsystems allow flexible production but also require complex produc-tion planning methods. "UGS Corporation" describes the large "po-tential of assembling any product in their portfolio at any plant any-where in the world, and to be able to change the production mixquickly while still maintaining high quality" [23].
All these partly disruptive, partly incremental changes put pressureon production planning departments to achieve these requirements,such as reduced time-to-market periods, more frequent production
6 introduction
ramp-ups, highly flexible production systems for mass-customizedproducts and mixed-model production lines.
In their "Global Auto Executive Summary 2009" [24] KPMG foundthat the biggest (68% accordance) cost saving opportunity for OEMs
lies in the domain of "manufacturing process and technology inno-vations." Overall, to ensure efficient and high quality production ofproducts while having the same resources for planning, novel tech-nologies and methods are required.
1.4 motivation for virtual production validation
Physical assembly assessments are cost intensive and as such are amain cost driver. Therefore, while planning more products, modelsand options, costs rise accordingly. Nevertheless, products and pro-cesses still must be validated. Virtual assessments using digital mock-ups must fill this gap.
Virtual technologies and simulation approaches already partly sup-port production validation processes for the manual final assemblystage. Since there are continuously fewer or even no physical proto-types available throughout the Product Development Process (PDP)(see Weber [25]), virtual assembly aims to offer similar capabilitiesfor the assessment of verification tasks - just like in the physical do-main. Even though virtual assembly has a long history in the litera-ture on "digital factory" (see Gomes de Sa and Zachmann [26]), thereare drawbacks. The shortcomings below are in accordance with thewhitepaper presented by "UGS Corporation" [23] and Walla’s doc-toral thesis [27]:
• Virtual validation still lacks a systematic process for the valida-tion of all options. Due to the high number of permutations inproduct variance, not all variants can currently be assessed byproduction planning.
• Virtual prototyping and assessments are also cost intensive,since authoring of the virtual environments requires a lot ofmanual effort. Therefore, only critical work tasks are validatedin the virtual domain. Much previous knowledge is required inorder to know which tasks could be critical. Batch assessmentmethods for assessing entire production lines are not available.
• Virtual assessments lack interactivity as there is no holisticframework for virtual validation of manual assembly tasks in ei-ther the literature or real-life applications. Advances in virtualtechnology are not immediately adopted by production plan-ning.
• Production engineers cannot carry out holistic virtual assess-ments on their own due to the complexity of authoring and
1.5 thesis outline 7
simulation software handling. Virtual assessments can only becarried out by digital factory experts with special knowledge.
• For efficient data provisioning, standardized data formats arestill missing. Therefore, the interoperability between assessmenttools is limited. Similarly, heterogeneous simulation environ-ments are required for certain assessment aspects as they arehighly focused on singular assessment scopes, i.e. ergonomicassessments. This requires additional training for virtual envi-ronment specialists.
• Interactive assessments often require cumbersome preparationefforts.
• Virtual assessment environments are not optimized for collab-orative assessments.
• Required information is oftentimes either entirely unavailablein the virtual domain or is already out-dated. Some models lackrealism and are too static.
• Lack of access to information due to restrictive data access pol-icy or high costs for Product Data Management (PDM) systems.
• Lack of simulation capabilities, such as the simulation of flex-ible parts, holistic workstation visualization, rendering speedsfor mass data visualization, interactivity, etc.
"UGS Corporation" summarizes the optimal scenario for produc-tion validation, having overcome all aforementioned limitations: "Op-timize the design configurations of the building, tooling, carriers, ma-terial handling devices, operator walk path and more. Manufacturerscan actually run a plant before they ever put a shovel in the groundto build it." [23]. All of the aforementioned deficiencies directly andindirectly have negative impacts on costs, time and product quality.
1.5 thesis outline
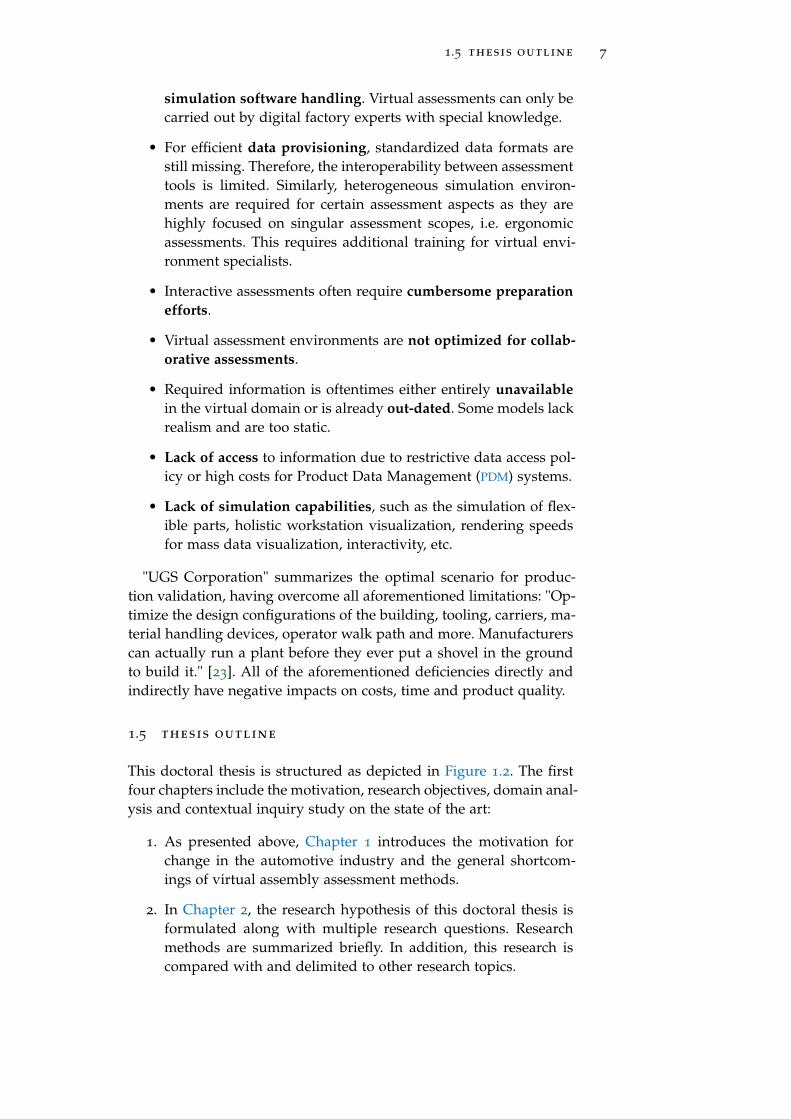
This doctoral thesis is structured as depicted in Figure 1.2. The firstfour chapters include the motivation, research objectives, domain anal-ysis and contextual inquiry study on the state of the art:
1. As presented above, Chapter 1 introduces the motivation forchange in the automotive industry and the general shortcom-ings of virtual assembly assessment methods.
2. In Chapter 2, the research hypothesis of this doctoral thesis isformulated along with multiple research questions. Researchmethods are summarized briefly. In addition, this research iscompared with and delimited to other research topics.
8 introduction
Figure 1.2: Outline and structure of this doctoral thesis. The numbers indi-cate the corresponding chapters in this document.
3. Chapter 3 describes an in-depth domain analysis of productionplanning and validation. In order to elucidate virtual assemblyassessments, the following topics are presented: Manufacturingprinciples of automotive production, final assembly characteris-tics, digital factory for manual final assembly and productionvalidation workshops.
4. Chapter 4 presents a contextual inquiry study with subsequentexpert interviews. The generated qualitative results underlinethe deficiencies of state-of-the-art production validation work-shops.
Chapter 5 to Chapter 9 describe the implementations and researchstudies of the "Virtual Manufacturing Station":
5. The theoretical concepts of the "Virtual Manufacturing Station"framework are presented in Chapter 5. Objectives and key prop-erties of the framework are described in the context of a litera-ture review.
1.5 thesis outline 9
6. Chapter 6 shows the necessities of virtual batch production val-idation in simulation systems. An implementation of such asystem is introduced. A subsequent research study focuses onthe applicability of Virtual Reality (VR) assembly assessments. Anovel research benchmark is proposed to determine the overallVR system’s performance and limitations for assembly assess-ments.
7. Chapter 7 presents an implementation and evaluation of a mark-erless, scalable full-body motion capture system. An upstreamevaluation provides insights into full-body tracking performanceusing Microsoft Kinect. The description of the implementationis followed by two studies on tracking performance and the ap-plicability of the presented system for standardized ergonomicassessments.
8. Chapter 8 analyzes research on large-scale high-resolution dis-plays and multi-display environments. Application scenarios, aprototype implementation, a large-scale LED implementationand two studies are presented subsequently. Furthermore, a ba-sic research study presents generalized insights into size per-ception using augmented floor displays. A second evaluationdescribes an application-driven evaluation using large floor vi-sualizations as a virtual stencil in cardboard workshops.
9. Chapter 9 presents research on projection-based Spatial Aug-mented Reality (SAR) in production validation using physicalmock-ups. A literature review reveals gaps in industrial applica-tion scenarios for projection-based augmented reality, and a de-sign space evaluation shows the practical limitations of this in-terface and compares it with optical see-through head-mountedAugmented Reality (AR) devices. A concluding research studyquantifies the benefits using different types of computer-mediatedcommunication in abstract collaboration tasks.
Having presented all implementations and research studies in thecontext of the Virtual Manufacturing Station (VMS), the final chapterssummarize these works:
10. Chapter 10 also presents a contextual inquiry study. ProductionValidation (PV) workshops using the final VMS framework andimplementation are attended, evaluated and expert interviewscarried out. This study qualitatively evaluates the overall per-formance of PV workshops with respect to the planning results’quality, task completion time and overall costs.
11. Chapter 11 summarizes the outcomes of the VMS and picks upthe research questions presented in Chapter 2. Finally, an out-look is provided on future developments in the interactive vali-dation and automatic simulation of manual assembly tasks.

2R E S E A R C H A G E N D A A N D T H E S I SC O N T R I B U T I O N S
This chapter presents the research agenda for this doctoral thesis, in-cluding the fields of contribution, research hypothesis, research ques-tions, research methodology and a contrast and comparison withother research. This doctoral thesis is carried out in research coop-eration between the Ulm University, Institute of Media Informatics,and Daimler AG.
2.1 fields of contribution
This thesis contributes to both fundamental research domains and ap-plied sciences. Its main research area is "collaborative virtual environ-ments for validation of manual assembly processes" affecting severalresearch domains:
• Production Engineering
• Human Computer Interaction (HCI)
• Computer Supported Cooperative Work (CSCW)
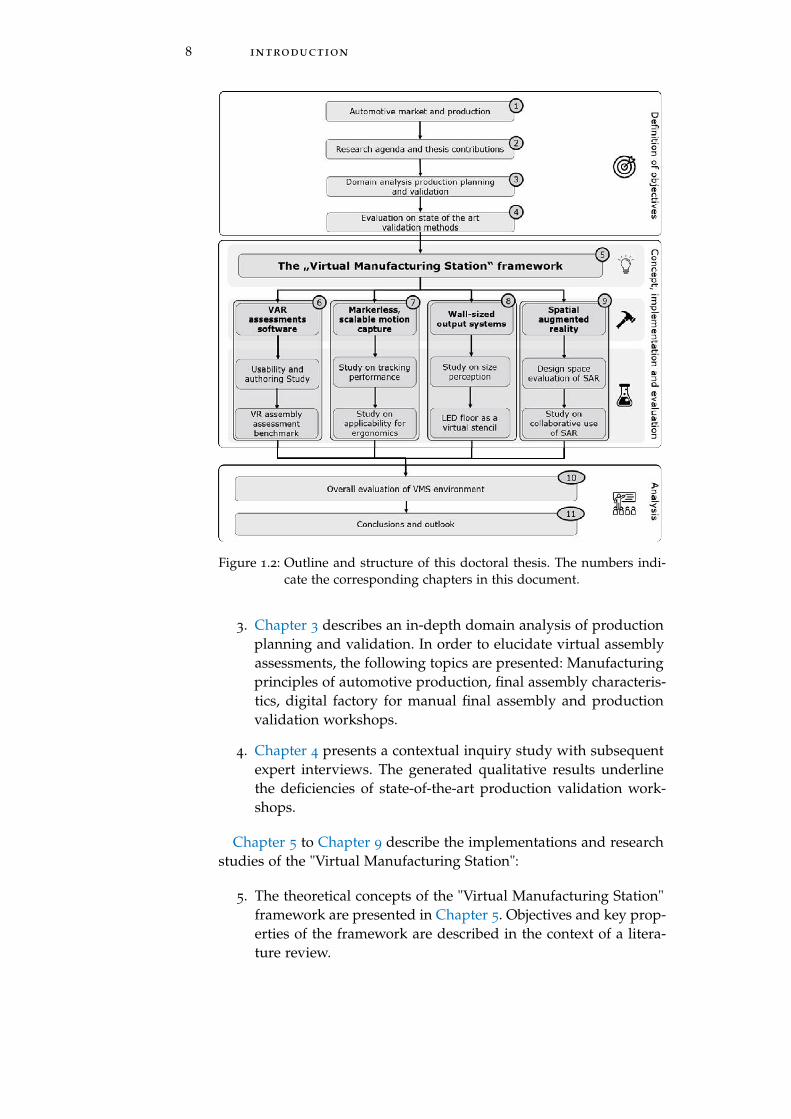
As depicted in Figure 2.1, both fundamental research domains andfields of applied sciences interact. Contemporary scientific issues andlatest research are applied to manufacturing industry use cases, andreal automotive use cases are providing authentic work-related con-text to fundamental research.
Figure 2.1: Fields of contribution and research context in the automotive in-dustry
Through the analysis of deficiencies in Human Computer Inter-action (HCI) fundamental research, this doctoral thesis closes multi-ple gaps in theoretical concepts for co-located, collaborative virtualenvironments. Key properties for collaborative virtual environments
11
12 research agenda and thesis contributions
are derived. Carrying out multiple empirical studies on size percep-tion, collaboration performance and VR research, this doctoral thesiscontributes to basic HCI research questions, utilizing state-of-the-artinteraction technologies.
In the domain of production engineering and Computer-SupportedCooperative Work (CSCW), this doctoral thesis proposes a frameworkof methods for the collaborative production validation of manual as-sembly tasks. Processes, technical optimizations, application scenar-ios and requirements are derived for the virtual validation of manualassembly tasks.
2.2 research hypothesis and research questions
This doctoral thesis aims to clarify fundamental questions in appliedvirtual production validation and to increase overall productivity inPV workshops by presenting a framework of virtual, collaborativemethods. To achieve the above-mentioned contributions and to over-come the existing deficiencies, a research hypothesis is formulated:
Research hypothesis
Utilizing collaborative virtual environments in production val-idation workshops for manual assembly tasks, verification cri-teria can be assessed in the same quality, less time and lowercosts compared to hardware-based workshops.
This research hypothesis implies that providing production engi-neers with a specific set of virtual methods will have an impact on theoverall verification task. Breaking down this hypothesis, three perfor-mance measures are analyzed, namely quality, time and costs.
The first performance measure quality can be measured directly byusing objective error metrics, such as "achievement rates", "problemrecognition rates" and "error amounts." For the second performancemeasure time, "task completion times" of individual or collective val-idations can be measured directly. Costs are analyzed as the changein efficiency on the basis of qualitative reports using "task completiontimes" and "event chains."
Besides the quantifiable performance measures, qualitative opti-mizations are sought: The goal is for each stakeholder to obtain a bet-ter understanding of the complex products, processes and resourcesby using the proposed framework. Therefore, production engineersare expected to increase their usage frequency, user experience andsatisfaction with such virtual environments.
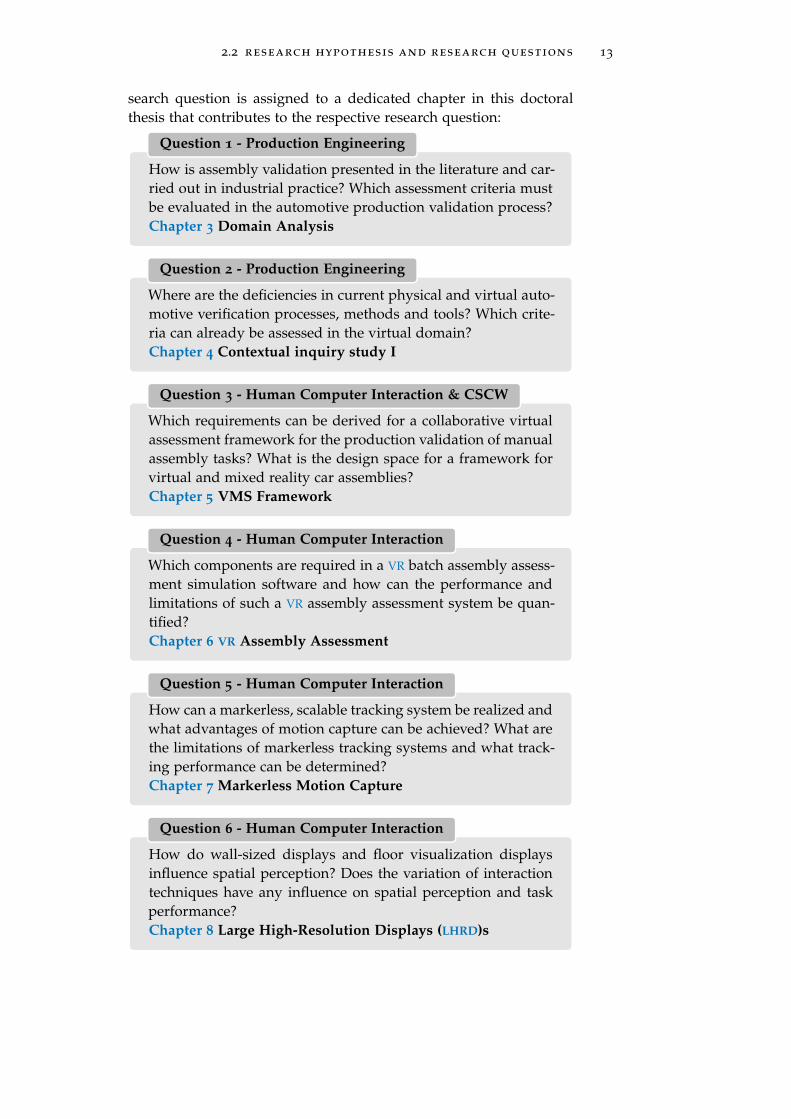
The research hypothesis is sub-divided into multiple concrete re-search questions. They are clustered with respect to correspondingresearch domains to which they contribute and the appearance se-quence presented in this thesis. In the following sections, each re-
2.2 research hypothesis and research questions 13
search question is assigned to a dedicated chapter in this doctoralthesis that contributes to the respective research question:
Question 1 - Production Engineering
How is assembly validation presented in the literature and car-ried out in industrial practice? Which assessment criteria mustbe evaluated in the automotive production validation process?Chapter 3 Domain Analysis
Question 2 - Production Engineering
Where are the deficiencies in current physical and virtual auto-motive verification processes, methods and tools? Which crite-ria can already be assessed in the virtual domain?Chapter 4 Contextual inquiry study I
Question 3 - Human Computer Interaction & CSCW
Which requirements can be derived for a collaborative virtualassessment framework for the production validation of manualassembly tasks? What is the design space for a framework forvirtual and mixed reality car assemblies?Chapter 5 VMS Framework
Question 4 - Human Computer Interaction
Which components are required in a VR batch assembly assess-ment simulation software and how can the performance andlimitations of such a VR assembly assessment system be quan-tified?Chapter 6 VR Assembly Assessment
Question 5 - Human Computer Interaction
How can a markerless, scalable tracking system be realized andwhat advantages of motion capture can be achieved? What arethe limitations of markerless tracking systems and what track-ing performance can be determined?Chapter 7 Markerless Motion Capture
Question 6 - Human Computer Interaction
How do wall-sized displays and floor visualization displaysinfluence spatial perception? Does the variation of interactiontechniques have any influence on spatial perception and taskperformance?Chapter 8 Large High-Resolution Displays (LHRD)s
14 research agenda and thesis contributions
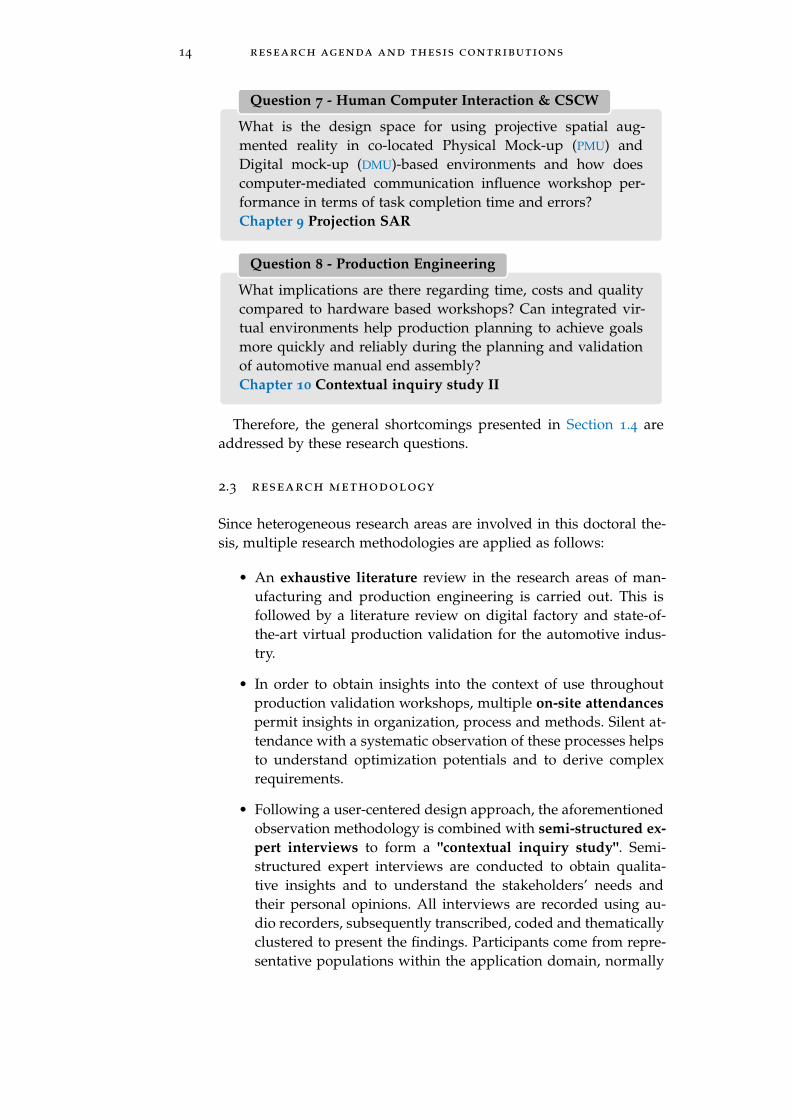
Question 7 - Human Computer Interaction & CSCW
What is the design space for using projective spatial aug-mented reality in co-located Physical Mock-up (PMU) andDigital mock-up (DMU)-based environments and how doescomputer-mediated communication influence workshop per-formance in terms of task completion time and errors?Chapter 9 Projection SAR
Question 8 - Production Engineering
What implications are there regarding time, costs and qualitycompared to hardware based workshops? Can integrated vir-tual environments help production planning to achieve goalsmore quickly and reliably during the planning and validationof automotive manual end assembly?Chapter 10 Contextual inquiry study II
Therefore, the general shortcomings presented in Section 1.4 areaddressed by these research questions.
2.3 research methodology
Since heterogeneous research areas are involved in this doctoral the-sis, multiple research methodologies are applied as follows:
• An exhaustive literature review in the research areas of man-ufacturing and production engineering is carried out. This isfollowed by a literature review on digital factory and state-of-the-art virtual production validation for the automotive indus-try.
• In order to obtain insights into the context of use throughoutproduction validation workshops, multiple on-site attendancespermit insights in organization, process and methods. Silent at-tendance with a systematic observation of these processes helpsto understand optimization potentials and to derive complexrequirements.
• Following a user-centered design approach, the aforementionedobservation methodology is combined with semi-structured ex-pert interviews to form a "contextual inquiry study". Semi-structured expert interviews are conducted to obtain qualita-tive insights and to understand the stakeholders’ needs andtheir personal opinions. All interviews are recorded using au-dio recorders, subsequently transcribed, coded and thematicallyclustered to present the findings. Participants come from repre-sentative populations within the application domain, normally
2.4 similarities and differences 15
customers for the expected system. Depending on the scope,production engineers, VR specialists and digital factory simu-lation specialists are chosen since not all production plannersinherit leading-edge knowledge on virtual environments.
• Quantitative evaluations are carried out in this doctoral thesis.Objective measures are chosen for the respective research ques-tion. The presented HCI research studies are carried out underlaboratory conditions as well as real-life environments. To gen-erate quantifiable results, experiment leaders invite representa-tive groups of people. In the studies discussed, "task completiontimes" and "error metrics" are measured to generate quantifiableresults, such as spatial deviations, accuracy, precision and fea-sibility rates. When required, special tooling is applied such asindustrial robots in Chapter 7 for highly reproducible trajecto-ries to measure spatial accuracy and precision.
• For additional quantitative results, use is made of standard-ized questionnaires. Commonly used questionnaires for usabil-ity studies are the "System Usability Scale" (SUS) [28], "ThePost-Study System Usability Questionnaire" (PSSUQ) (compare[29]) or for VR applications the "Presence Questionnaire" [30]are applied. If required and applicable, non-standardized ques-tionnaires are used in addition to standardized questionnairesincluding tools such as paper-based questionnaires, MicrosoftInfo-Path, Microsoft Sharepoint or the LimeSurvey online sur-vey tool.
2.4 similarities and differences
This work focuses on a framework for the collaborative virtual vali-dation of manual assembly tasks. As multiple research domains in-fluence this work, the focus of this doctoral thesis can be contrastedwith other works as follows:
• The value creation chain in automotive production comprisesseveral steps, such as body shop, paint shop and final assem-bly. The presented framework focuses on the application do-main of passenger car final assembly stage. Spatial dimensions,processes and validation tasks are described for passenger carproduction only. Nevertheless, these concepts can be general-ized and re-used for multiple manufacturing industries havinga final assembly stage, such as commercial vehicle production,shipyards, aerospace and other final assembly stages of originalequipment manufacturers.
• This work focuses on manual assembly processes only. Arteagaet al. state that "manual assembly processes comprise all assem-

16 research agenda and thesis contributions
bly related operations carried out by a human worker withoutthe use of automatic machines to bring assembly parts onto abase part in order to create a final product. The area where as-sembly takes place includes the space required for equipmentand workers, as well as the space required for the storage ofcomponents and finished products." [15]. Even though the fi-nal assembly stage has several dozens of automated processeswithout human labor, final assembly value creation primarilyconsists of manual human labor which is the only scope of theproposed framework. Therefore, virtual engineering and virtualcommissioning (see [31, 32]) are not considered in this doctoralthesis. Human-robot collaboration is not considered either, eventhough this is a widely researched field.
• The stakeholders of the presented framework are limited to au-tomotive production planning departments. These productionengineers aim to optimize products, processes and resources forthe final assembly stage [33]. By presenting novel virtual assess-ment methods, other departments besides production planningcan use these methods in a similar manner, such as research anddevelopment, prototype building, training and maintenance de-partments. None of these departments are considered as na-tive stakeholders in this doctoral thesis, even though the pro-posed methods could be transferred with slight changes. For in-stance, when validating virtual assembly in automotive produc-tion planning, after sales departments validate disassembly. Asthese application scenarios have large overlaps, these methodscould be transferred. A generalization of the presented methodsis discussed in the outlook in Section 11.3.
• The creation of a fully functional final assembly stage requiresauxiliary stakeholders: Logistics and factory planning. Logis-tics departments are necessary for continuous material provi-sioning as they have to plan and deliver material to the final as-sembly workstations. These so-called "material zones" and "pre-assemblies" at the continuous flow line workstations are withinthe optimization scope of this doctoral thesis. In contrast, ware-house planning, material flow, receiving and factory layout areexcluded in the proposed framework. The same holds for fac-tory planning: Only local geometric collisions within a worksta-tion are regarded.
• Nowadays, automotive products consist of both software andhardware components. Neither software validation processesnor electrical validation is described in the context of this doc-toral thesis. Additionally, no "end of line" contents are regardedin the final assembly stage, such as rain simulation, flashing allelectronic devices and filling up fluids.

2.4 similarities and differences 17
• Virtual assembly simulation techniques continue to be an on-going active research area. No deformable, flexible and fluidsimulations are included in the research focus of this doctoralthesis: Deformable and realistic material behavior is still an ac-tively researched field, so called "deviation in form and dimen-sions" during manufacturing processes, such as "plastic defor-mation, thermal expansion, tool wear, inadequate tooling" [34].
These contrasts and cooperations provide a focus on relevant re-search aspects in the context of the collaborative virtual validation ofmanual assembly tasks without failing to address related research.

3D O M A I N A N A LY S I S P R O D U C T I O N P L A N N I N GA N D VA L I D AT I O N
Manufacturing industries, especially carmakers worldwide, are fac-ing new challenges with regard to product complexity, globalizationof markets, digital transformation, connectivity, autonomous driving,alternative powertrains and stricter global environmental regulationsas well as the need for even more environmentally friendly products.Product-related requirements also have an impact on future produc-tion systems: "Today manufacturing and production engineering isundergoing an enormous innovation process worldwide" [35].
In order to contextualize the following concepts in this doctoralthesis, this chapter provides an overview of the fundamentals of theautomotive development processes with a strict focus on final assem-bly. Thus the fundamentals of the structure of automotive produc-tion, relevance of manual labor in final assembly stages, productionparadigms and factory arrangements are presented in this chapter.In addition, this chapter discusses the need for DMUs and PMUs. Anin-depth description of the industrial practice of PV workshops is pro-vided along with their corresponding verification goals.
3.1 domain analysis of automotive production
The automotive PDP is described in the following section, followed byexplanations on product life cycles, global production networks andautomotive final assembly.
3.1.1 Automotive development process
Large scale companies, such as automotive original equipment man-ufacturers, require systematic processes with clearly defined respon-sibilities to bring a product successfully to market. Following Stark etal., the literature uses multiple product life cycle definitions, depend-ing on the stakeholders, e.g. users, marketing, environmental view-points or manufacturers [36, p. 6]. In this doctoral thesis, a "lifecycle"is defined as the "period starting with a product idea and ending withdisposal at end of useful life" as defined in the CIRP "Dictionary ofProduction Engineering" [35, p.447]. In the same dictionary, the defi-nition for "product life cycle" is given as the "period of time for whicha product is in the market. The product life cycle consists of the fol-lowing five phases: Development phase, introduction phase, growth
19
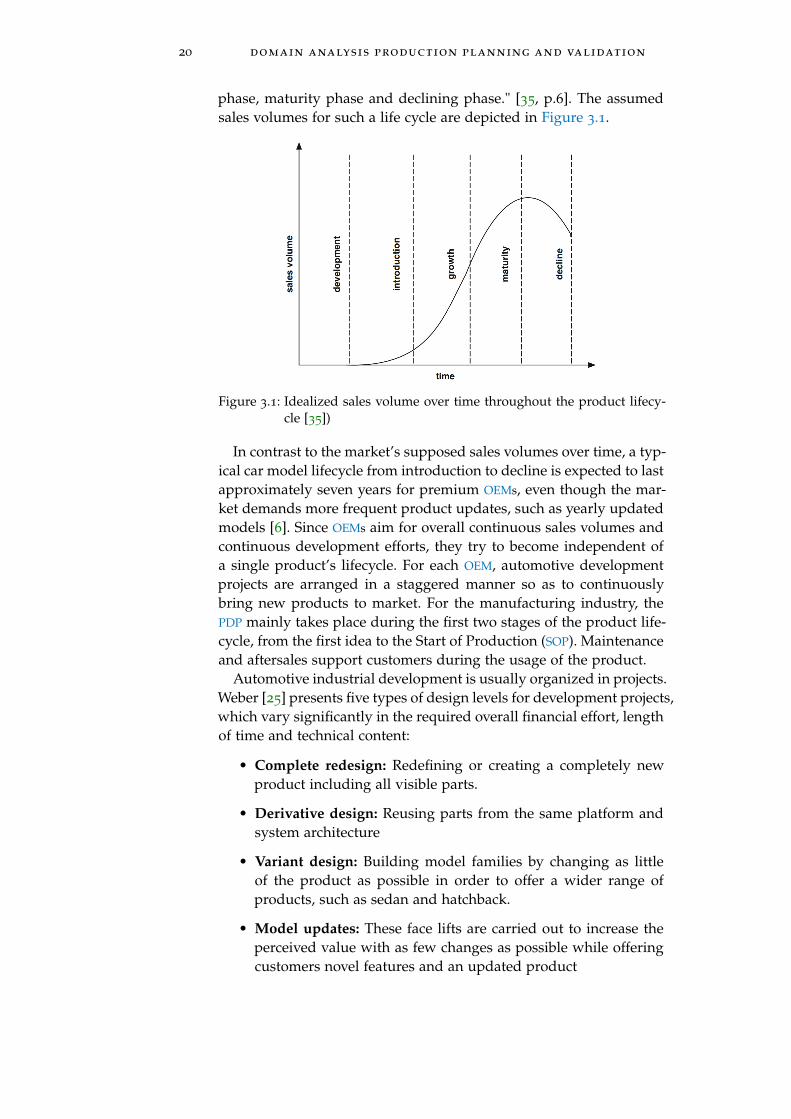
20 domain analysis production planning and validation
phase, maturity phase and declining phase." [35, p.6]. The assumedsales volumes for such a life cycle are depicted in Figure 3.1.
Figure 3.1: Idealized sales volume over time throughout the product lifecy-cle [35])
In contrast to the market’s supposed sales volumes over time, a typ-ical car model lifecycle from introduction to decline is expected to lastapproximately seven years for premium OEMs, even though the mar-ket demands more frequent product updates, such as yearly updatedmodels [6]. Since OEMs aim for overall continuous sales volumes andcontinuous development efforts, they try to become independent ofa single product’s lifecycle. For each OEM, automotive developmentprojects are arranged in a staggered manner so as to continuouslybring new products to market. For the manufacturing industry, thePDP mainly takes place during the first two stages of the product life-cycle, from the first idea to the Start of Production (SOP). Maintenanceand aftersales support customers during the usage of the product.
Automotive industrial development is usually organized in projects.Weber [25] presents five types of design levels for development projects,which vary significantly in the required overall financial effort, lengthof time and technical content:
• Complete redesign: Redefining or creating a completely newproduct including all visible parts.
• Derivative design: Reusing parts from the same platform andsystem architecture
• Variant design: Building model families by changing as littleof the product as possible in order to offer a wider range ofproducts, such as sedan and hatchback.
• Model updates: These face lifts are carried out to increase theperceived value with as few changes as possible while offeringcustomers novel features and an updated product

3.1 domain analysis of automotive production 21
• Model year: Reduction of cost and increase in product qualitythroughout the product lifecycle
An independent procedural development model is described inVDI-2221 [37]. It presents a systematic procedure for developing anddesigning technical systems. This general method consists of sevendetailed steps from "problem definition" to "realization" of a product,and each step provides input and output documents throughout thefour general phases "planning, concepts, design and development."In detail, they propose seven in-depth steps namely "clarification anddefinition of the problem" (1), "determination of functions and theirstructures" (2), "search for solution principles and their structures"(3), "dividing into realizable modules" (4), "form design of the mostimportant modules" (5), "form design of the entire product" (6) andfinally "compilation of design and utility data" (7). Overall, the VDI-2221 proposes this as an iterative process with progressions and re-gressions.
Figure 3.2: Example of the resulting cost influence on the product (based onMunro and Associates Inc. [38] and Lotter and Wiendahl [39])
In such design and development processes of automotive projects,the vast majority of costs are already determined during the earlystages. "It is now widely accepted that over 70% of the final productcosts are determined during design." [38]. Figure 3.2 illustrates thisexample. Thus manufacturing and assembly should be taken into ac-count as early as possible, even during the design cycle. Figure 3.3 un-derlines the importance of the so-called "simultaneous engineering"and "concurrent engineering" concepts. Parallelized production plan-ning and development phases enable a bilateral interaction of thesedepartments. This method reduces mistakes in advance of SOP, suchas wrong design considerations or wrong logistics concepts. The qual-ity and efficiency of the production system improve when complyingwith "concurrent engineering" principles [40]. Analogously, Designfor Manufacturing and Assembly (DFMA) is a process and a qualita-
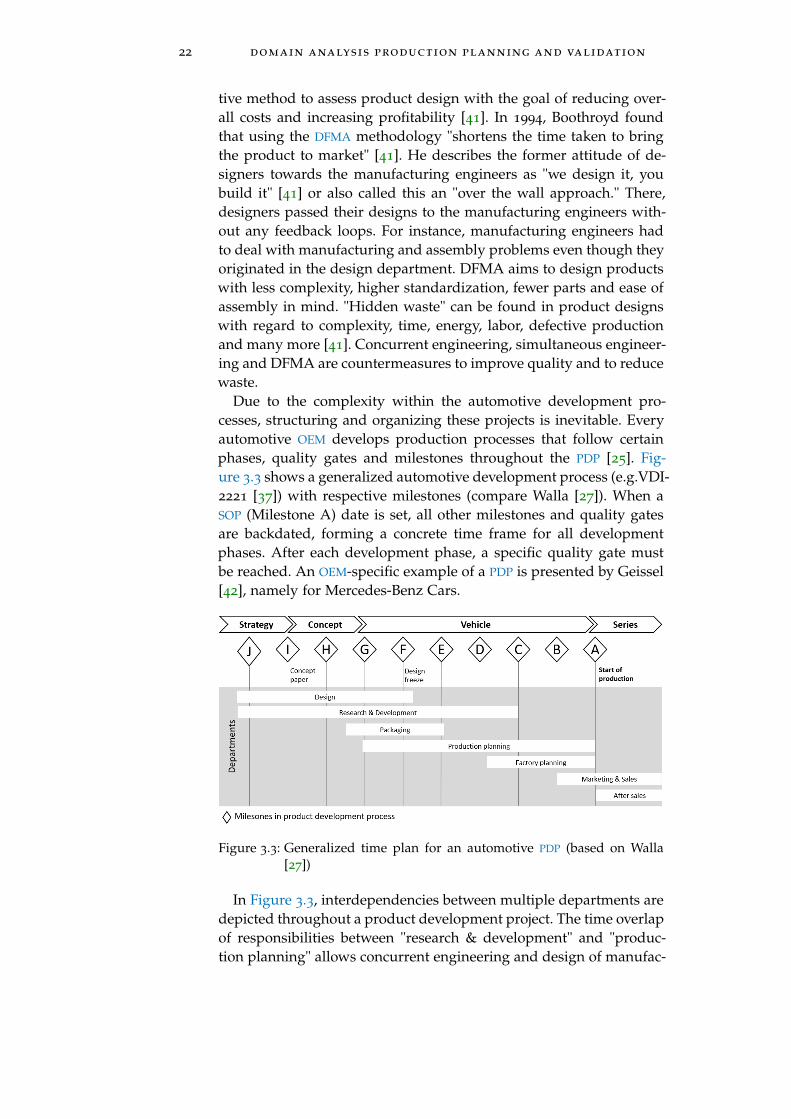
22 domain analysis production planning and validation
tive method to assess product design with the goal of reducing over-all costs and increasing profitability [41]. In 1994, Boothroyd foundthat using the DFMA methodology "shortens the time taken to bringthe product to market" [41]. He describes the former attitude of de-signers towards the manufacturing engineers as "we design it, youbuild it" [41] or also called this an "over the wall approach." There,designers passed their designs to the manufacturing engineers with-out any feedback loops. For instance, manufacturing engineers hadto deal with manufacturing and assembly problems even though theyoriginated in the design department. DFMA aims to design productswith less complexity, higher standardization, fewer parts and ease ofassembly in mind. "Hidden waste" can be found in product designswith regard to complexity, time, energy, labor, defective productionand many more [41]. Concurrent engineering, simultaneous engineer-ing and DFMA are countermeasures to improve quality and to reducewaste.
Due to the complexity within the automotive development pro-cesses, structuring and organizing these projects is inevitable. Everyautomotive OEM develops production processes that follow certainphases, quality gates and milestones throughout the PDP [25]. Fig-ure 3.3 shows a generalized automotive development process (e.g.VDI-2221 [37]) with respective milestones (compare Walla [27]). When aSOP (Milestone A) date is set, all other milestones and quality gatesare backdated, forming a concrete time frame for all developmentphases. After each development phase, a specific quality gate mustbe reached. An OEM-specific example of a PDP is presented by Geissel[42], namely for Mercedes-Benz Cars.
Figure 3.3: Generalized time plan for an automotive PDP (based on Walla[27])
In Figure 3.3, interdependencies between multiple departments aredepicted throughout a product development project. The time overlapof responsibilities between "research & development" and "produc-tion planning" allows concurrent engineering and design of manufac-
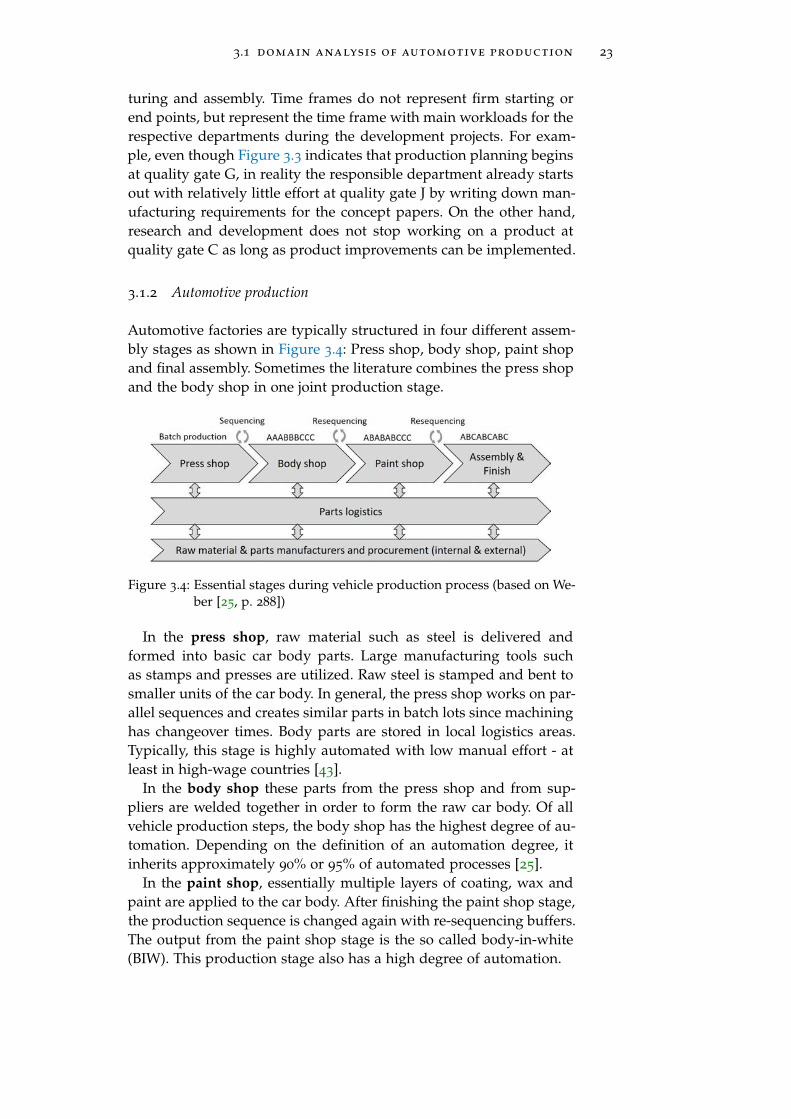
3.1 domain analysis of automotive production 23
turing and assembly. Time frames do not represent firm starting orend points, but represent the time frame with main workloads for therespective departments during the development projects. For exam-ple, even though Figure 3.3 indicates that production planning beginsat quality gate G, in reality the responsible department already startsout with relatively little effort at quality gate J by writing down man-ufacturing requirements for the concept papers. On the other hand,research and development does not stop working on a product atquality gate C as long as product improvements can be implemented.
3.1.2 Automotive production
Automotive factories are typically structured in four different assem-bly stages as shown in Figure 3.4: Press shop, body shop, paint shopand final assembly. Sometimes the literature combines the press shopand the body shop in one joint production stage.
Figure 3.4: Essential stages during vehicle production process (based on We-ber [25, p. 288])
In the press shop, raw material such as steel is delivered andformed into basic car body parts. Large manufacturing tools suchas stamps and presses are utilized. Raw steel is stamped and bent tosmaller units of the car body. In general, the press shop works on par-allel sequences and creates similar parts in batch lots since machininghas changeover times. Body parts are stored in local logistics areas.Typically, this stage is highly automated with low manual effort - atleast in high-wage countries [43].
In the body shop these parts from the press shop and from sup-pliers are welded together in order to form the raw car body. Of allvehicle production steps, the body shop has the highest degree of au-tomation. Depending on the definition of an automation degree, itinherits approximately 90% or 95% of automated processes [25].
In the paint shop, essentially multiple layers of coating, wax andpaint are applied to the car body. After finishing the paint shop stage,the production sequence is changed again with re-sequencing buffers.The output from the paint shop stage is the so called body-in-white(BIW). This production stage also has a high degree of automation.

24 domain analysis production planning and validation
In assembly and finish, the painted car body is assembled andfinished for both interior and exterior parts. To date, assembly hasa low automation degree [44]. This is why, of all four stages of thevehicle production process, manual labor is most prevalent in finalassembly and finish. The final assembly stage is the central step forenabling product variants in the vehicle production process [45].
Between each production step, there are buffers used to decoupleall stages and to permit reliable production, shift decoupling and re-sequencing between the production stages [25, 43]. The stream of carbodies is re-sequenced in logistics buffers. Flexibility within the pro-duction sequence enables efficient processes in final assembly stage.All four stages of the vehicle production process depend on the com-plex handling of parts within a plant and on-time delivery of rawmaterials by logistics departments. Throughout all production stages,logistics handles parts from internal and external suppliers, such astier 1 and tier 2 suppliers. Great product variety often does not allowa direct material supply of all variants to the place of assembly. In thiscase, parts must be delivered just-in-time or even "just-in-sequence"to reduce the need for storage capacity and thus save costs.
Overall, Weber states that during the production process, the pro-duction plant ideally creates a "constant stream of parts, componentsand eventually complete vehicles of perfect quality" [25]. This streammust be fitted into appropriate production steps. In general, automak-ers must set up production systems including assembly systems toproduce products, such as cars, trucks or vans.
These production steps are embedded in a global architecture ofproduction facilities. Together they form a global production networkwith interdisciplinary tasks and divided responsibilities: "Productsand related services are provided by production networks whereautonomous enterprises are linked by relatively stable material, in-formation, and financial flows. A production network typically in-cludes nodes of suppliers and manufacturers involved in direct value-adding activities, distribution centers and logistics service providers,as well as facilities and channels for reverse logistics." [46]
Figure 3.5 shows the organizational hierarchy and connection froma globally distributed production network to an assembly worksta-tion. In the case of automotive factories, parts and services are boughtby tier 1 and tier 2 suppliers from all over the world. They deliverthese parts to the assembly buildings and assembly lines at the OEM’sfactory.
3.1.3 Automotive final assembly
This doctoral thesis focuses on the validation of manual processesin the final assembly stage. This stage is considered to be the most
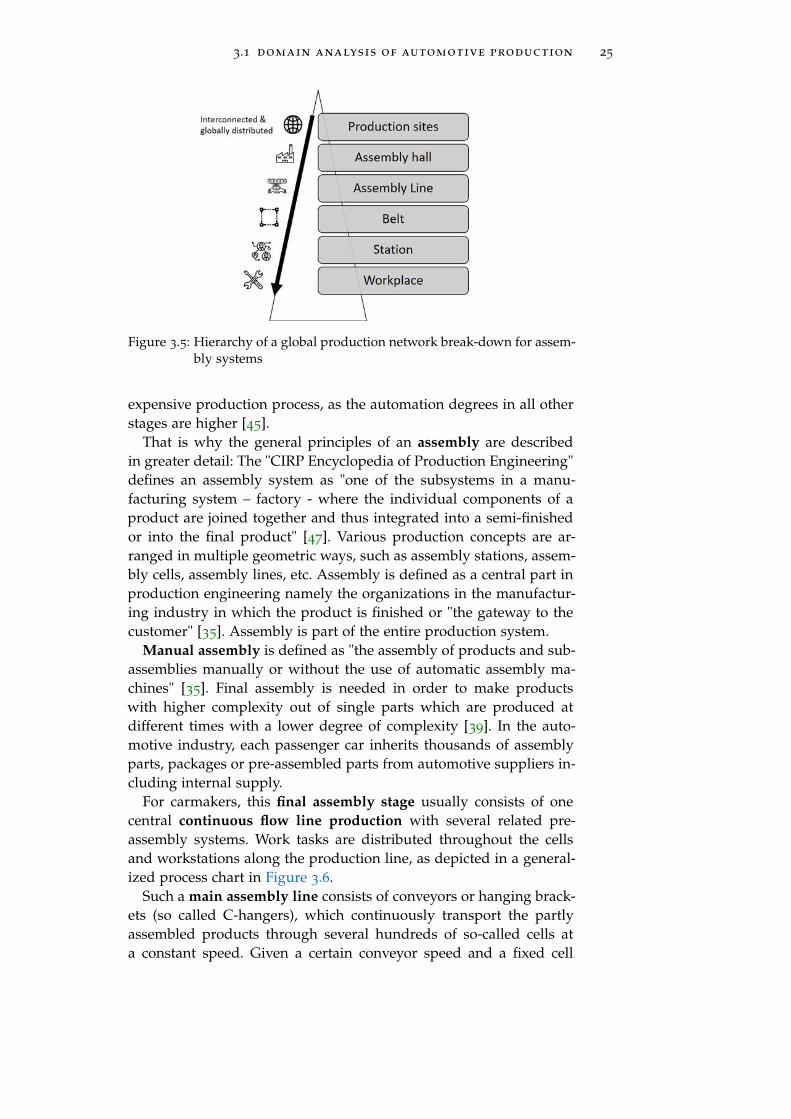
3.1 domain analysis of automotive production 25
Figure 3.5: Hierarchy of a global production network break-down for assem-bly systems
expensive production process, as the automation degrees in all otherstages are higher [45].
That is why the general principles of an assembly are describedin greater detail: The "CIRP Encyclopedia of Production Engineering"defines an assembly system as "one of the subsystems in a manu-facturing system – factory - where the individual components of aproduct are joined together and thus integrated into a semi-finishedor into the final product" [47]. Various production concepts are ar-ranged in multiple geometric ways, such as assembly stations, assem-bly cells, assembly lines, etc. Assembly is defined as a central part inproduction engineering namely the organizations in the manufactur-ing industry in which the product is finished or "the gateway to thecustomer" [35]. Assembly is part of the entire production system.
Manual assembly is defined as "the assembly of products and sub-assemblies manually or without the use of automatic assembly ma-chines" [35]. Final assembly is needed in order to make productswith higher complexity out of single parts which are produced atdifferent times with a lower degree of complexity [39]. In the auto-motive industry, each passenger car inherits thousands of assemblyparts, packages or pre-assembled parts from automotive suppliers in-cluding internal supply.
For carmakers, this final assembly stage usually consists of onecentral continuous flow line production with several related pre-assembly systems. Work tasks are distributed throughout the cellsand workstations along the production line, as depicted in a general-ized process chart in Figure 3.6.
Such a main assembly line consists of conveyors or hanging brack-ets (so called C-hangers), which continuously transport the partlyassembled products through several hundreds of so-called cells ata constant speed. Given a certain conveyor speed and a fixed cell

26 domain analysis production planning and validation
Figure 3.6: Generalized structure of automotive final assembly work con-tents (based on Weyand [48])
length, the predefined cycle time can be deduced, which typicallyranges from several seconds to several minutes. This production sys-tem’s pace influences the overall throughput also measured in "jobsper hour." In 1913, Ford implemented the first paced automotive as-sembly line, reducing production time from more than 12 hours toapproximately 90 minutes [49]. Today, an Audi A3 model productionin Györ still follows continuous flow line principles, where final as-sembly consists of 146 cells with "exactly two minutes" cycle time [50].Due to limited space and practicability, one cell typically inherits upto six workstations where people work together on their assignedtasks.
The products continuously arrive at the worker’s place at a con-stant speed. The worker is assigned to perform the tasks on each carwith a limited amount of responsibility during the cycle time. Thisidea of an optimized division of labor in continuous flow line pro-duction systems is the key success factor for making production pro-cesses efficient. Consecutive work tasks also cause interdependencies
3.1 domain analysis of automotive production 27
at all consecutive workstations. Changing one cell’s work content hasan impact on the overall efficiency of a production system.
Since not all components can be produced in the main consecutiveproduction line, several pre-assembly cells deliver sub-assemblies tothe main production line (see modules in Figure 3.6). Some of thesepre-assembly cells also follow the flow line production principles,such as the main assembly line for doors, the cockpit and the combi-nation of drivetrain and suspension" [50]. Bringing together multiplesub-assemblies in such a manner is referred to as the "herringboneprinciple" [50].
According to the VDI 2860 and DIN 8593-0 standards, typical man-ual work contents within automotive final assembly are handlingand joining, adjusting and inspection tasks, and complementary tasks[51, 52]. According to Lotter et al. [39], handling tasks comprise stor-ing, modifying quantities, shift arrangements and securing. Comple-mentary tasks comprise marking, changing temperature, cleaning, de-burring, printing, covering, peeling off, unpacking and sealing. Join-ing tasks are clustered in piecing together, filling, welding soldering,joining by adhesives, mechanical means, forming processes and oth-ers. One of the reasons for carrying out assembly tasks as manuallabour is to achieve greater flexibility and changeability in assemblylines.
According to Küber et al. [53], the main causes of changes can beclustered in volume changes, model mix changes and vehicle deriva-tive changes. They discuss the interdependency of economic efficiencyvs. flexibility and assembly vs. logistics processes. Therefore they in-troduce a novel decision making process for strategic planning oflogistics and assembly processes. The so-called strategic decisionsquare takes into account that for multiple time dynamic scenariosand for different optimization goals there is no overall optimum ineconomic efficiency. The decision space described there mainly con-sists of two trade-offs. The first trade-off must be made between as-sembly and logistics processes whereas the second is between flexi-bility and economic efficiency. Different scenarios must be generatedto find strategic decisions for each factory. They exemplify that a bas-ket within logistics brings a lot more flexibility into the assembly linewhereas it is much more complicated for logistics because costs in-crease as a result of additional material handling steps.
This need for flexibility in automotive final assembly is enabled bya large portion of human labour, since this continues to be the mostflexible way in final assembly production systems. The German In-dustrial Standard DIN IEC 60050-31 describes the degree of automa-tion as the "proportion of automatic functions to the entire set offunctions of a system or plant" [54]. Additionally, Fujimoto et al. pro-poses a set of definitions for "automation ratio." Since there is no sin-gle definition of automation ratios applicable for heterogeneous tasks,

28 domain analysis production planning and validation
he proposes to categorize the operational definitions of automation:machine-based definition, worker-based definition, material-based def-inition and process-step-based definition. For final assembly he pro-poses to measure the automation ratio by "the number of parts assem-bled automatically in the main line (excluding bolts and fasteners) incomparison to the total number of parts assembled" and "the ratiobetween workers or person-hour saved by automation and those nec-essary for a totally non-automated process." [55] While they founda high automation ratio (average around 90%) in stamping, welding,engine machining and engine forging, in final assembly areas an av-erage automation ratio of 10% has been found. Typically in Europeanautomotive factories, press shops as well as body shops and coat-ing production stages have a large percentage of the value creationautomatized, while in the final assembly stage, the automation de-gree is still low [56], even when producing large volume models. Layand Schirrmeister discuss whether nowadays the automation degreein the final assembly stage is even too high [44]. Reduced lot sizes,capacity flexibility, lower invests and higher product flexibility arethe most relevant reasons for reduced automation degrees [44]. Thisunderlines that human labor is still a major variety enabler in finalassembly stage.
Lotter summarizes the optimization goals in automotive final as-sembly as the minimization of assembly and training time, efficientquality assurance and simplification of the assembly tools and tasks[45]. He concludes that this is only achievable through the use of sim-ulation tools.
3.2 domain analysis of automotive production planning
Production planning is an interdisciplinary task in economics, me-chanical engineering, production engineering, data analytics and com-puter science. It deals with strategic planning, structural planning,systems planning and operations planning of all processes in the up-coming factory [57]. Holistic production planning thus affects all do-mains of "product, technology, organization, tooling, personnel and fi-nances" [57, p. 18] which are required to produce products and goods.
Production planning comprises all measures in designing a manu-facturing system and production processes. In the Dictionary of Pro-duction Engineering it is defined as "a function that defines the to-tality of activities to put into place in order to meet the objectivesof the production program, broken down into primary needs plan-ning, material management and time management" [35]. Stecca de-fines production planning as "the process of translating customer or-ders to jobs for the manufacturing plant with attached due dates"[58]. In detail, "manufacturing process planning" specifies all requiredwork steps to execute the customer’s product demands while opti-
3.2 domain analysis of automotive production planning 29
mizing the production system with respect to multiple criteria withinthe given constraints. Therefore production planning is a systematic,goal-oriented process in consecutive phases using specific tools andmethods in order to plan a factory from the first idea to SOP (Walla[27, p. 15] based on Grundig [59]). For example, production planningsets up manufacturing or assembly systems, e.g. stamping, mulling,turning, assembly and many more. "Process planning can be definedas the task which determines how a part should be manufacturedaccording to the design specifications" [60].
The production planning process follows a top-down approach,from high-level planning to an in-depth process specification [61]. El-Maraghy et al. specify four steps: First generic planning is carriedout, where conceptual plans specify the required technologies, suchas the overall throughput of the production system. This is followedby macro-level planning for product sequencing and multi-domainoptimizations. Subsequently, detailed planning focuses on single op-timization domains with detailed plans, e.g. tools and resources in as-sembly. Finally, micro-level planning is carried out, optimizing certainparameters of the production process for optimal conditions, such asMethods-Time Measurement (MTM) analyses, work task sheets andalphanumeric work task descriptions [61].
When executing a new projects, production planning can have dif-fering starting conditions. Sometimes no factory exists and a com-pletely new production system can be designed. All production tools,locations, structures and personnel must be planned from scratch.This case is called "green-field" production planning. By contrast,"brown-field" production planning implies that only parts of exist-ing production systems are redesigned and others must be reused.Depending on the strategy, existing factories must be extended, re-duced, renewed, restructured, relocated or outsourced in order tointegrate novel products, change production quantities, change theorganization or update the production structure [27].
3.2.1 Assembly planning
As this doctoral thesis specifically focuses on automotive assembly,assembly process planning is described in detail. In the "CIRP Ency-clopedia of Production Engineering" [62, p. 827], Riggs distinguishestwo levels of "planning assembly operations": process level planningand operation level planning:
• Process level planning considers transport routes and handlingtasks between assembly operations. The work content and timerequired for a standard execution of each assembly operation isplanned to enable line balancing to achieve the highest possibleutilization for each work cell. The distance of movement and
30 domain analysis production planning and validation
mass of transported parts between operations is also recorded.Maximum efficiency assembly processes must be found.
• Operation level planning is carried out for each workstation.Manual assembly sub-tasks are analyzed by operation methodstudies, namely motion studies and time studies. In these stud-ies, the layouts of the workstations are analyzed and the place-ment of the components to be assembled is described. Motionstudies concentrate on recording and analyzing the motion el-ements’ types and respective magnitudes of motions. The opti-mization goal is to minimize movement. Time studies are usedto determine the average time required for optimized move-ments.
For maximum assembly efficiency, all operations in the assemblyprocess must be well planned to avoid unnecessary movements andamount of time spent on tasks [62].
Another generalized procedure for the systematic planning of as-sembly systems is described by Lotter [63]. Due to its generalizabil-ity and broad acceptance in many manufacturing industries, this hasbecome a reference work. Lotter originally presented 11 steps for sys-tematic production planning and Hartel and Lotter extend and re-vise this systematic planning in their book "Montage in der indus-triellen Produktion" [64]: First system requirements (1) with productamounts, amount flexibility, maximum usage time, designated shiftmodel, overall throughput and amortization times must be calculated.Next, a product analysis (2) counts the amount of required parts,assesses joining tools and quality requirements. Then, the assemblysequence (3) is defined, followed by a functional analysis (4) wherelarger work contents are decomposed in singular consecutive basictask components. Determining cycle times (5), creating workstationlayouts (6) and calculating personnel requirements (7) for assemblyare additional tasks. After that, availability checks (8) of the latterpoints are carried out to determine whether parts quality, worksta-tion count, structure of tooling and personnel training are sufficient.The final steps are the creation of technical specifications (9), the in-vest calculus (10) of the assembly system and the assessment andcomparison of costs (11). This generalized procedure represents theprocess steps in automotive assembly planning.
Overall, once a proper plan of the detailed assembly processes is inplace, line balancing of mixed-model lines is enabled by this in-depthknowledge (see lean production approaches [38]) for efficient produc-tion. The continuous re-planning of detailed processes throughoutthe PDP can incrementally reduce planning vagueness [65].

3.2 domain analysis of automotive production planning 31
3.2.2 Tools in assembly planning
In the early years of mass production - before having systematic plan-ning of assembly tasks - a great deal relied on previous experienceand incremental adjustments of detailed processes. Planning qualitydepended heavily on the skills and knowledge of the planner himself.Such planning methods are not reproducible, can be time consuming,error prone and do not guarantee high quality results for model-mixproduction lines due to overall complexity [60].
Industrial practice shows that non-digital tools are still state of theart in many different application areas of assembly process planning.For example, pen and paper based tools can be found in the creationof process charts, walk path studies, ergonomics studies, and timestudies for operation level planning and documentation. Ergonomicsassessments are still carried out using standardized assessment work-sheets for each workstation [66]. Walk path studies use pen and pa-per methods to draw so called "spaghetti diagrams" on a piece ofpaper [67]. Another way of simulating production processes in a non-digital manner is to use physical mock-ups or physical prototypes.For factory resources, cardboard mock-ups of material zones are typ-ical tools for spatial understanding. For the physical assembly of theproduct, physical mock-ups are used.
Therefore, the literature presents multiple tools to compensate theabove mentioned disadvantages of manual approaches and pen andpaper based methods. Computer-aided Production Planning (CAPP)is an algorithmic approach that partly automates the task of generat-ing the best process plans (see [61]). It supports planners by bridgingthe gap between Computer-aided Design (CAD) and Computer-aidedManufacturing (CAM) [60]. Gülesjn distinguishes variant approachesand generative approaches in CAPP. Whereas variant process plan-ning is an assisted extension of manual process planning, generativeprocess planning uses artificial intelligence to automatically deriveand produce process plans [60]. Today, for CAPP there are multiplecommercial tools, such as Delmia by Dassault, IPO.Log by IPO.Plan,Process Simulate by Siemens and many more. Depending on thescope of the CAPP tool, multiple optimization scopes can be followed.Typical goals are to optimize the production sequence of variants,achieve line balancing by changing the assembly sequence, and to de-scribe the holistic production process by combining the relationshipsbetween Product, Process and Resource (PPR). Other generative toolstry to automatically derive process relevant information out of CAD
data [68], such as fixture concepts or work task descriptions and auto-matically assess assemblability using CAD product information [69].

32 domain analysis production planning and validation
3.2.3 Automotive Mock-ups
Automotive mock-ups are a central element for the collaborative dis-cussion, testing and validation of the product’s features and proper-ties. Design departments build clay models to validate a product’soverall appeal and to gather user feedback on novel designs. Re-search and development utilizes automotive mock-ups for crash sim-ulations, weather resistance, driving properties, sound design andmany more. Similarly, production planning uses mock-ups for assem-bly validation, disassembly validation and training. "While virtual ve-hicle mock-ups represent a geometrically ideal world of rigid compo-nents, physical mock-ups allow investigations that include real-worldphysical effects such as plastic or elastic material deformation or pro-duction tolerances." [25, p.290].
In the following, different types of mock-ups are described in detail,from partial build-ups to full physical mock-ups up as well as digitalrepresentations, known as digital mock-ups. Figure 3.7 shows the us-age of both digital and physical mock-ups throughout the generalizedPDP. All types share the common goal of simulation and validation.
Figure 3.7: Types of digital and physical mock-ups throughout the PDP
(based on Walla [27] and Geißel [42])
Physical Mock-Up (PMU) In the context of automotive productdevelopment, the term physical mock-up is used for a wide varietyof hardware dummies, such as total vehicle mock-ups, componentmock-ups or conceptual mock-ups [42].
Physical mock-ups are hardware-based representations of the up-coming product. They are typically built in true-to-scale and undis-torted resemblance for the analysis, testing and visualization of theproduct’s properties [70]. "At the beginning of each prototype buildphase, laminated bodies and other rapid-prototyping techniques are
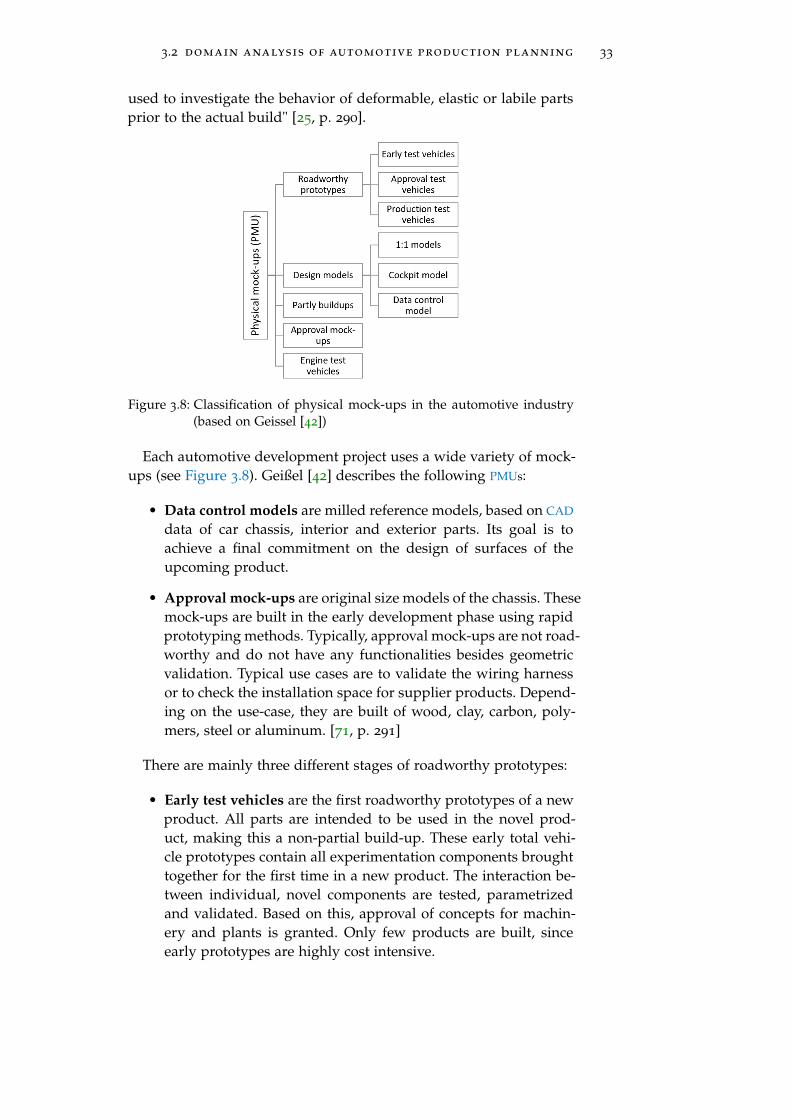
3.2 domain analysis of automotive production planning 33
used to investigate the behavior of deformable, elastic or labile partsprior to the actual build" [25, p. 290].
Figure 3.8: Classification of physical mock-ups in the automotive industry(based on Geissel [42])
Each automotive development project uses a wide variety of mock-ups (see Figure 3.8). Geißel [42] describes the following PMUs:
• Data control models are milled reference models, based on CAD
data of car chassis, interior and exterior parts. Its goal is toachieve a final commitment on the design of surfaces of theupcoming product.
• Approval mock-ups are original size models of the chassis. Thesemock-ups are built in the early development phase using rapidprototyping methods. Typically, approval mock-ups are not road-worthy and do not have any functionalities besides geometricvalidation. Typical use cases are to validate the wiring harnessor to check the installation space for supplier products. Depend-ing on the use-case, they are built of wood, clay, carbon, poly-mers, steel or aluminum. [71, p. 291]
There are mainly three different stages of roadworthy prototypes:
• Early test vehicles are the first roadworthy prototypes of a newproduct. All parts are intended to be used in the novel prod-uct, making this a non-partial build-up. These early total vehi-cle prototypes contain all experimentation components broughttogether for the first time in a new product. The interaction be-tween individual, novel components are tested, parametrizedand validated. Based on this, approval of concepts for machin-ery and plants is granted. Only few products are built, sinceearly prototypes are highly cost intensive.
34 domain analysis production planning and validation
• Approval test vehicles are more mature test vehicles. Designmust be finished and these prototypes are built using final pro-duction tools and instruments. This prototype is built in orderto verify the product specification sheet of functionalities andgoals. Compared to early prototypes, larger quantities are built.
• Production test vehicles are already built in the designatedplant and on the designated production line. They are used todemonstrate process compatibility and the overall manufactura-bility of the car under real cycle time conditions. With theseprototypes, a smooth ramp-up during SOP is achieved. Addi-tionally, production test vehicles are used to train the workerson the upcoming product to prepare them for SOP.
Digital Mock-Up (DMU) In contrast to PMUs, digital mock-ups(DMUs) are defined as realistic computer-generated digital modelsor as-well simulations, which in terms of appearance and functional-ities resemble the original product under development as closely aspossible [72, p. 67]. DMUs are also referred to as virtual and digitalprototypes.
The use of DMUs allows "designers, manufacturing planners andmanagement" to work on virtual products in order to make decisionsrelated to the "concept, design and all downsteam processes" [73]. Forexample, research and development simulates drive trains, "noise, vi-bration and harshness" of car chassis, crash simulations, stiffness ofsingle parts, aerodynamics, thermal design and ride handling (see[42]). In production planning, DMUs allow engineers to design, con-figurate and validate products without the need to build a physicalmodel. "A Digital Mock-Up (DMU) is used for simulating assem-bly and dismantling, in addition to testing for collisions and build-ability. For this purpose, all geometry data of all vehicle parts arebrought together in their planned installation positions" [5]. "Becauseof their flexibility and cost-efficiency, virtual mock-ups are the pre-ferred means for assessing assembly processes, not only during con-cept phase." [25, p. 289].
With the broad availability of advanced 3D computer graphics tech-niques, light-weight, standardized data structures, direct PDM inter-faces and real-time rendering, DMUs are becoming more importantthan PMUs. They offer the ability to load models, measure, analyze,simulate, and redesign instantaneously. "Virtual cars have become thecentral communication platform for the co-operative vehicle develop-ment process. They are the substitute for hardware prototypes to anever growing extent" [25]. The continuously growing possibilities ofdigital methods in Product Lifecycle Management (PLM) systems inproduct development leads to a higher penetration of DMUs insteadof physical ones.
3.3 production validation workshops 35
Building PMUs is costly and time-consuming [74]. By using of DMUs
in the PDP, costs can be significantly reduced compared to PMUs [75,p. 43]. Moreover, qualitative aspects such as earlier and interdisci-plinary usage of digital mock-ups are an even bigger benefit [72,p. 68], e.g. crash simulations or assembly simulations can be carriedout without hardware models. The long-term goal is to be able toassess all validation tasks using DMUs with virtual assembly and sim-ulation of 3D geometry. Therefore, products would be of higher qual-ity [76] and have a higher degree of maturity in shorter developmenttimes and with reduced overall costs (see [75, pp. 42-43]).
3.3 production validation workshops
PV workshops are held to validate planning results with respect tomulti-objective optimizations. Such PV workshops are common in in-dustrial practice and are held in various manufacturing companies,especially in the automotive sector. Examples of published PV work-shop processes and experiences can be found at Ford [41], Daimler[77], BMW [25] and Volkswagen [78]. Even though they have slightlydifferent names, they share the same assessment scopes. Such multi-objective optimizations processes involve the validation and verifica-tion of upcoming production processes. PV processes are interdisci-plinary and require various expertise, background and roles of theparticipants.
PV workshop stakeholders resemble the main customers of the frame-work presented in this doctoral thesis. Therefore in-depth insights ofvalidation and verification processes are given in the following sec-tion. This section presents the validation principles, required inputs,organizational aspects, participants, roles, goals and assessment crite-ria in the following.
Publication
Parts of this section were published in the conference pa-per CIRP CATS 2016 "Dual Reality for Production VerificationWorkshops" by Otto et al. [79]. This section has been extendedand revised for this doctoral thesis.
3.3.1 Goals
The overall goal in production is to generate products and servicesof perfect quality with optimized costs and maximum flexibility [53]while ensuring profitability even when unexpected changes occur, e.g.a drop in production volume. This holds for planned and unplannedchanges of the production system [25, p. 288]. Therefore, the produc-tion system must be optimized to react to production process "distur-bances", such as design changes, model year measures, the launch of
36 domain analysis production planning and validation
a new model, variants and options, but also unplanned events suchas parts quality issues or failures in production equipment. Qualityimprovements, customer satisfaction, reducing manufacturing costs,and lead time reductions to bring new products to market are all inthe scope of PV workshops.
Once all relevant aspects of the upcoming production system andits detailed work contents (see Hartel and Lotter [64] and Section 3.2.1)have been pre-planned, PV workshops aim to improve the pre-generatedplanning quality of the various planning departments in order toreach a bullet-proof, mistake-free production ramp-up in the actualplant by iteratively simulating and optimizing future production plans.Consequently, the overall goal of PV is to ensure such smooth ramp-ups and to reach the maximum throughput capacity of the produc-tion system.
In practice, PV assesses all aspects of the upcoming factory pro-cesses, such as work plans, product precedence graphs, availabilityof tooling, ergonomics, cell layouts and many more. PV workshops fo-cus on manual labor in final assembly in automotive flow line produc-tion, but not on fully automated processes. Hence, such an interdis-ciplinary task in production planning consists of collaborative workand must find trade-off solutions for potentially conflicting objectives.For some optimization goals, no optimal solution can be determined,which means a trade-off has to be found (compare [15, 53, 80, 81]).
The Kaizen philosophy is a theoretical basis for reaching goals inPV workshops [82]. It proposes a constant optimization of productionand translates from Japanese as "change towards the better." It aimsfor continuous, step-by-step improvement of all internal processesin an enterprise through involvement of all affected employees. Itsobjectives are to eliminate all sorts of redundancy, to concentrate at-tention on the place where value adding happens and to create newstandards of productivity and quality [35].
3.3.2 Verification and validation principles
The automotive development process (see also Section 3.1.1) is an iter-ative process with steps back and forth and recursive loops. Changesthroughout the PDP can be induced by stakeholders, market demand,sales, logistics or production itself.
The "International Standardization Organization" differentiates ver-ification and validation in ISO 9000:2015 [83]. Verification is definedas the "confirmation, through the provision of objective evidence, thatspecified requirements have been fulfilled" whereas validation is the"confirmation, through the provision of objective evidence, that therequirements for a specific intended use or application have been ful-filled" [83, p. 3.8.13]. This subtle difference can be explained as fol-lows: In verification the question is addressed whether "we are build-
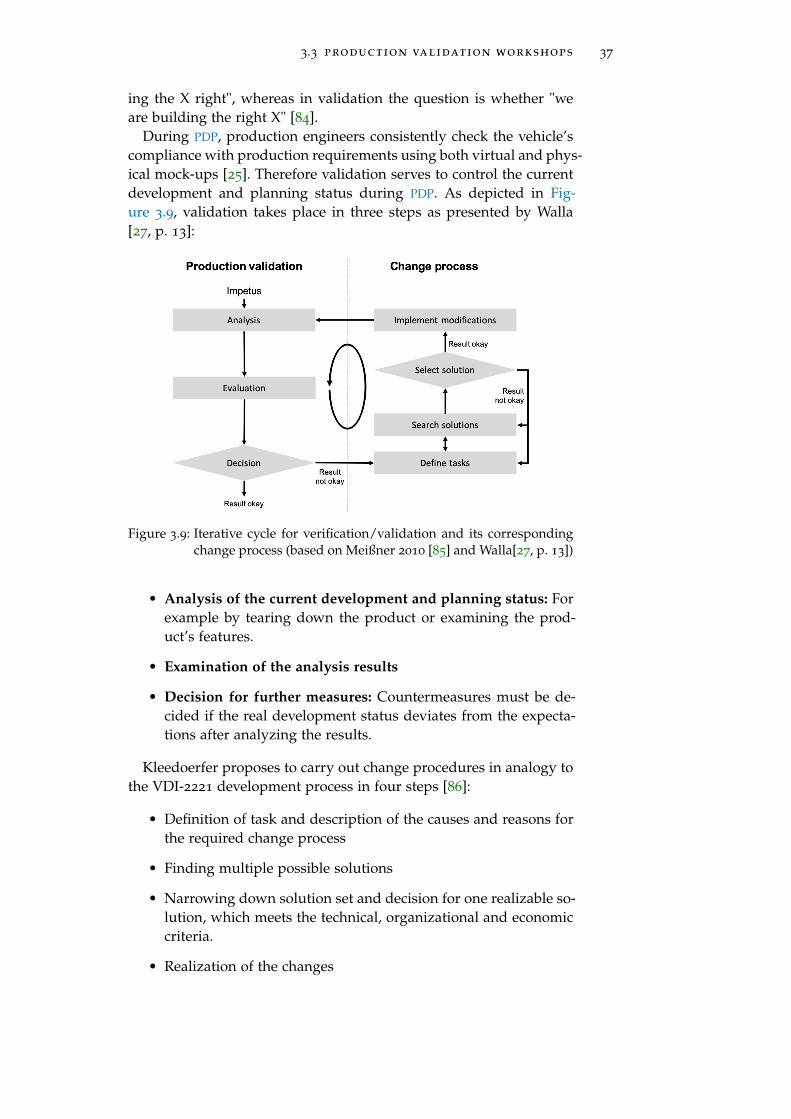
3.3 production validation workshops 37
ing the X right", whereas in validation the question is whether "weare building the right X" [84].
During PDP, production engineers consistently check the vehicle’scompliance with production requirements using both virtual and phys-ical mock-ups [25]. Therefore validation serves to control the currentdevelopment and planning status during PDP. As depicted in Fig-ure 3.9, validation takes place in three steps as presented by Walla[27, p. 13]:
Figure 3.9: Iterative cycle for verification/validation and its correspondingchange process (based on Meißner 2010 [85] and Walla[27, p. 13])
• Analysis of the current development and planning status: Forexample by tearing down the product or examining the prod-uct’s features.
• Examination of the analysis results
• Decision for further measures: Countermeasures must be de-cided if the real development status deviates from the expecta-tions after analyzing the results.
Kleedoerfer proposes to carry out change procedures in analogy tothe VDI-2221 development process in four steps [86]:
• Definition of task and description of the causes and reasons forthe required change process
• Finding multiple possible solutions
• Narrowing down solution set and decision for one realizable so-lution, which meets the technical, organizational and economiccriteria.
• Realization of the changes
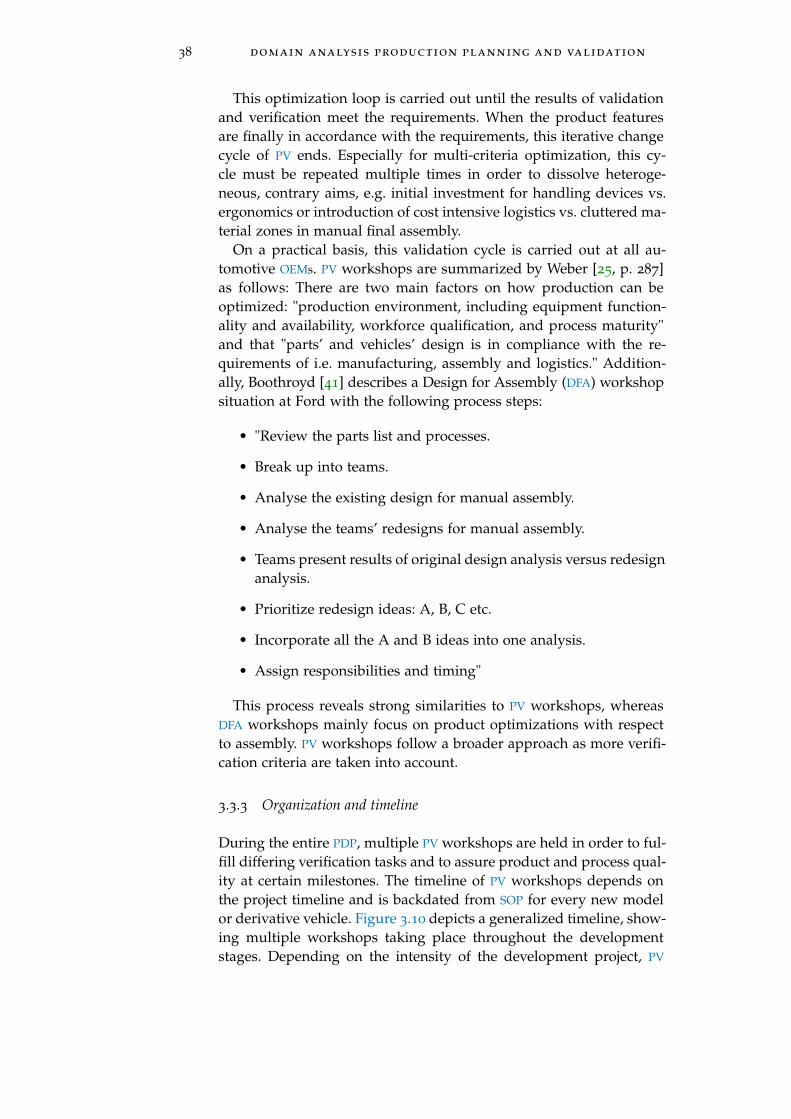
38 domain analysis production planning and validation
This optimization loop is carried out until the results of validationand verification meet the requirements. When the product featuresare finally in accordance with the requirements, this iterative changecycle of PV ends. Especially for multi-criteria optimization, this cy-cle must be repeated multiple times in order to dissolve heteroge-neous, contrary aims, e.g. initial investment for handling devices vs.ergonomics or introduction of cost intensive logistics vs. cluttered ma-terial zones in manual final assembly.
On a practical basis, this validation cycle is carried out at all au-tomotive OEMs. PV workshops are summarized by Weber [25, p. 287]as follows: There are two main factors on how production can beoptimized: "production environment, including equipment function-ality and availability, workforce qualification, and process maturity"and that "parts’ and vehicles’ design is in compliance with the re-quirements of i.e. manufacturing, assembly and logistics." Addition-ally, Boothroyd [41] describes a Design for Assembly (DFA) workshopsituation at Ford with the following process steps:
• "Review the parts list and processes.
• Break up into teams.
• Analyse the existing design for manual assembly.
• Analyse the teams’ redesigns for manual assembly.
• Teams present results of original design analysis versus redesignanalysis.
• Prioritize redesign ideas: A, B, C etc.
• Incorporate all the A and B ideas into one analysis.
• Assign responsibilities and timing"
This process reveals strong similarities to PV workshops, whereasDFA workshops mainly focus on product optimizations with respectto assembly. PV workshops follow a broader approach as more verifi-cation criteria are taken into account.
3.3.3 Organization and timeline
During the entire PDP, multiple PV workshops are held in order to ful-fill differing verification tasks and to assure product and process qual-ity at certain milestones. The timeline of PV workshops depends onthe project timeline and is backdated from SOP for every new modelor derivative vehicle. Figure 3.10 depicts a generalized timeline, show-ing multiple workshops taking place throughout the developmentstages. Depending on the intensity of the development project, PV
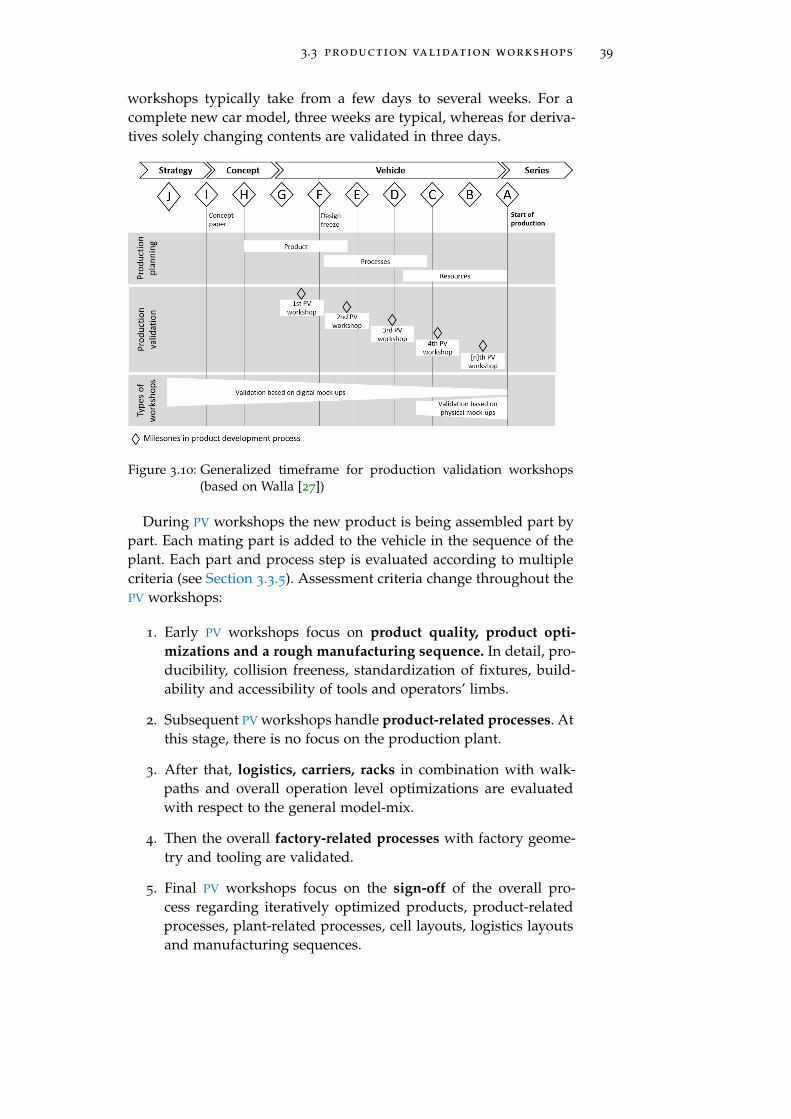
3.3 production validation workshops 39
workshops typically take from a few days to several weeks. For acomplete new car model, three weeks are typical, whereas for deriva-tives solely changing contents are validated in three days.
Figure 3.10: Generalized timeframe for production validation workshops(based on Walla [27])
During PV workshops the new product is being assembled part bypart. Each mating part is added to the vehicle in the sequence of theplant. Each part and process step is evaluated according to multiplecriteria (see Section 3.3.5). Assessment criteria change throughout thePV workshops:
1. Early PV workshops focus on product quality, product opti-mizations and a rough manufacturing sequence. In detail, pro-ducibility, collision freeness, standardization of fixtures, build-ability and accessibility of tools and operators’ limbs.
2. Subsequent PV workshops handle product-related processes. Atthis stage, there is no focus on the production plant.
3. After that, logistics, carriers, racks in combination with walk-paths and overall operation level optimizations are evaluatedwith respect to the general model-mix.
4. Then the overall factory-related processes with factory geome-try and tooling are validated.
5. Final PV workshops focus on the sign-off of the overall pro-cess regarding iteratively optimized products, product-relatedprocesses, plant-related processes, cell layouts, logistics layoutsand manufacturing sequences.
40 domain analysis production planning and validation
[79] In practice, there are two types of PV workshops: Purely digital PV
workshops and purely PMU-based PV workshops. In purely hardware-based PMU workshop situations, all assembly parts and resourceshave to be physically present. No mixed reality build-ups are cur-rently used in industrial practice, as proposed in the literature byArteaga et al. [15].
Both PMU and DMU-based workshops share the same verificationcriteria. Which kind of PV workshop is held depends on the currentstate of the PDP, and whether or not PMUs are already available. Ingeneral, DMU-based workshops are held in the early phases, whereasPMU based workshops are held closer to SOP (see Figure 3.10). In PMU-based hardware setups, only one specific car is built step by step. Dueto the large variance of options and extra equipment, not all variantsof options can be evaluated during PV workshops. This PMU refer-ence product typically includes as much extra equipment as possible,in order to check as many details as possible. Nevertheless, only oneconfiguration can be validated, but not all possible combinations. Nei-ther can the effects of mixed-model assembly lines [87] be simulatedin PMU based workshops, due to missing flow line production. Over-all, the number of traditional PMU-based scenarios is decreasing. Inpurely hardware-based workshop situations, all assembly parts andresources are physically present. However, both for hardware and vir-tual assessments, the assessment tasks remain the same.
Hence, PV workshops are not run for planning purposes. The in-put variables such as well documented process descriptions, cell lay-outs, manufacturing sequence, etc. have to be prepared prior to theworkshop. Planning itself cannot be carried out during PV workshops.Some small, local optimizations can be carried out on-the-fly, whilemost optimization changes are only identified within PV workshopsand implemented afterwards.
In the literature, PV workshops are closely related to the continuousimprovement process [80]. Both share similar verification, validationand optimization goals, but whereas the continuous improvementprocess takes place after SOP, PV workshops take place before SOP. Theduration of continuous improvement workshops are individually de-termined based on actual optimization needs. For example, they arecarried out for planned and unplanned impacts during production,such as rapid changes in demand or for planned model updates.
For each build-up step all criteria have to be assessed and docu-mented. This leads to three main outcomes of PV workshops:
• On-the-fly optimizations are carried out in the planning systemsif limited time allows for online documentation. Problems andderived countermeasures are collected in a list and assigned toa person who is in charge of resolving the issue. This systematicdocumentation is filled out using Excel spreadsheets or propri-etary systematic documentation tools.

3.3 production validation workshops 41
Figure 3.11: Documentation of the process maturity according to the verifi-cation goals in a matrix (based on Weber [25, p. 292])
• Problems and derived countermeasures are collected in a to-do list and each one is assigned to a specific person who is incharge of resolving the issue. This systematic documentationis filled out using Sharepoint sheets or proprietary systematicdocumentation tools.
• Management dashboard documentation is filled out to track theoverall product and process maturity on a quantitative basis, asshown in Figure 3.11.
3.3.4 Participants & Stakeholders
PV workshops consist of 10 to 30 interdisciplinary participants. Eachperson is assigned to a certain role, according to their expertise. SincePV workshops have to find trade-offs for multi-objective optimiza-tions, there cannot be an optimal solution for all goals such as effi-ciency, throughput and flexibility [53]. These moderated workshopsbring together all stakeholders of automotive manual final assembly.As the focus changes throughout PV workshops, participating roleschange accordingly. Figure 3.12 depicts all roles joining PV work-shops.
Figure 3.12: Roles of stakeholders taking part in PV workshops
42 domain analysis production planning and validation
During all workshops, PV workshop managers act as moderators.Process and product engineers also always take part. Domain-specificexperts, such as ergonomic specialists or MTM specialists, are invitedwhenever the development project reaches a certain milestone andthese verification criteria are discussed. In DMU-based PV workshops,a technical operator is present to provide support so that productionengineers do not have to manipulate the virtual scene interactivelywhile discussing the verification criteria.
The roles of the stakeholders benefiting from the framework andmethods are shown in Figure 3.12.
3.3.5 Verification goals
In this section, the verification goals of PV workshops are presentedand clustered. PV workshops follow the verification goals presentedby UGS: "maintain alignment between evolving product and manu-facturing process definitions," "accurately defining and documentingmanufacturing processes for all product variants," "validating assem-bly processes" and "validating manufacturing facilities" [23]. For eachverification criterion a success criterion is defined [25, p. 292] to en-able transparent status tracking. In industrial practice, findings in PV
workshops are manifold, as the following practical examples show:
• Process flaws: Alphanumeric work task descriptions tell theworker to clip in 5 times a part, whereas CAD data of the con-nected part has 7 clips points. The process or product has to beadapted.
• Product flaws: CAD data quality is not sufficient for the assess-ment of assemblability. CAD product documentation requires ahigher degree of maturity.
• Sequence flaws: Mounting an assembly part in the specifiedsequence is not possible due to overlapping edges of previouslyinstalled parts. Manufacturing sequence must be adapted.
• Tool accessibility: The assembly part cannot be installed sincethe screws cannot be reached with a screwdriver. Manufactur-ing sequence or product mounting concept must be adapted.
• Assembly part trajectory: Assembly part cannot be installeddue to limited and restricted clearance situations in the respec-tive assembly state of the product. Manufacturing sequence orassembly part accessibility must be adapted.
• Ergonomics issues: Parts are too heavy for manual labor, mount-ing points are not visible or too much lateral bending needed.A handling device must be added to support the worker.

3.3 production validation workshops 43
The following assessment criteria lists have been deduced from lit-erature review and during on-site attendances. They are clusteredinto five categories and their success criteria are formulated for eachentry: product (Table 3.1), human (Table 3.2), process (Table 3.3), re-source (Table 3.4) and logistics-related (Table 3.5) assessment criteria.Each cluster shows the geometric representations that are requiredto achieve the assessment goal. This geometry may contain productinformation, human information, factory information, station layoutinformation, resource information and logistics information. Geomet-ric information can be represented either physically or virtually. Inearly stages, fitness "for assembly of separate parts can be evaluatedas part of the design process, the complete vehicle production sign-off requires a comprehensive assessment of all production steps inthe correct order and according to different criteria" [25, p. 291].
3.3.5.1 Product-related verification criteria
In the literature, product-related verification criteria are also called"design review process" [34]. Weber proposes multiple product-relatedverification criteria:
• "Fitting: Provision of obvious and unambiguous fitting paths
• Fixing: Tool accessibility, direct visual or acoustic feedback con-firming correct fitment etc.
• Joining: Facilitate joints (bolts, clips, rivets, welding, adhesivesetc.) by provision of the respective part geometries" [25, p. 289].
In accordance with the concepts of concurrent engineering (see Sec-tion 3.1.1), manufacturing planning departments simultaneously re-veal optimization potentials within the product itself (see Table 3.1).For virtual assessments, the product geometry is required, DMUs ofauxiliary material are helpful.
3.3.5.2 Human-related verification criteria
Falck et al. state that early identification of ergonomically poor work-stations can result in enormous cost benefits in the automotive indus-try [88]. Weber describes the human-related verification criteria as the"Alignment of a parts weight and shape with manual handling re-quirements; prevention of possible injury, prevention of contact withtoxic or noxious substances etc." [25, p. 289]. Additionally, besidesthe intrinsic motivation of ensuring employee health and well-being,legal requirements must be met in order to provide a safe and er-gonomically proper workstation. Table 3.2 lists human-related verifi-cation criteria assessed in PV workshops. For virtual human-relatedassessments, the product geometry and an animated Digital HumanModel (DHM) is required, DMUs of auxiliary material and cell layoutsare helpful.
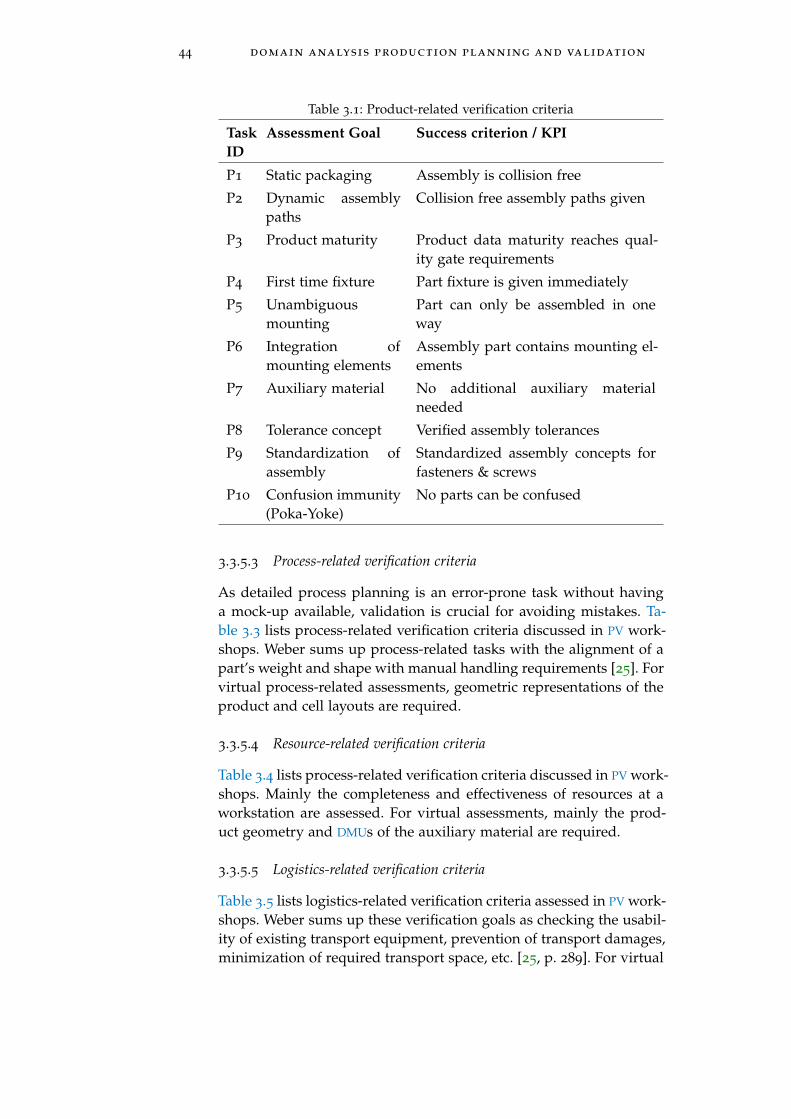
44 domain analysis production planning and validation
Table 3.1: Product-related verification criteria
TaskID
Assessment Goal Success criterion / KPI
P1 Static packaging Assembly is collision free
P2 Dynamic assemblypaths
Collision free assembly paths given
P3 Product maturity Product data maturity reaches qual-ity gate requirements
P4 First time fixture Part fixture is given immediately
P5 Unambiguousmounting
Part can only be assembled in oneway
P6 Integration ofmounting elements
Assembly part contains mounting el-ements
P7 Auxiliary material No additional auxiliary materialneeded
P8 Tolerance concept Verified assembly tolerances
P9 Standardization ofassembly
Standardized assembly concepts forfasteners & screws
P10 Confusion immunity(Poka-Yoke)
No parts can be confused
3.3.5.3 Process-related verification criteria
As detailed process planning is an error-prone task without havinga mock-up available, validation is crucial for avoiding mistakes. Ta-ble 3.3 lists process-related verification criteria discussed in PV work-shops. Weber sums up process-related tasks with the alignment of apart’s weight and shape with manual handling requirements [25]. Forvirtual process-related assessments, geometric representations of theproduct and cell layouts are required.
3.3.5.4 Resource-related verification criteria
Table 3.4 lists process-related verification criteria discussed in PV work-shops. Mainly the completeness and effectiveness of resources at aworkstation are assessed. For virtual assessments, mainly the prod-uct geometry and DMUs of the auxiliary material are required.
3.3.5.5 Logistics-related verification criteria
Table 3.5 lists logistics-related verification criteria assessed in PV work-shops. Weber sums up these verification goals as checking the usabil-ity of existing transport equipment, prevention of transport damages,minimization of required transport space, etc. [25, p. 289]. For virtual
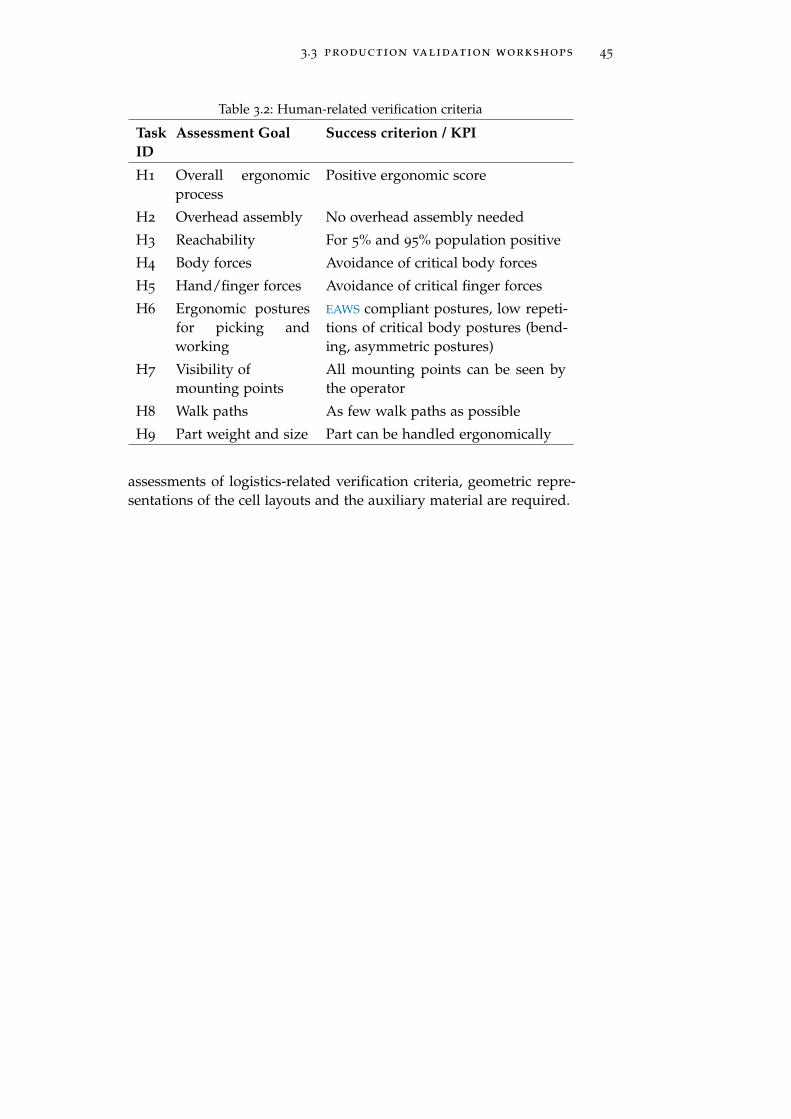
3.3 production validation workshops 45
Table 3.2: Human-related verification criteria
TaskID
Assessment Goal Success criterion / KPI
H1 Overall ergonomicprocess
Positive ergonomic score
H2 Overhead assembly No overhead assembly needed
H3 Reachability For 5% and 95% population positive
H4 Body forces Avoidance of critical body forces
H5 Hand/finger forces Avoidance of critical finger forces
H6 Ergonomic posturesfor picking andworking
EAWS compliant postures, low repeti-tions of critical body postures (bend-ing, asymmetric postures)
H7 Visibility ofmounting points
All mounting points can be seen bythe operator
H8 Walk paths As few walk paths as possible
H9 Part weight and size Part can be handled ergonomically
assessments of logistics-related verification criteria, geometric repre-sentations of the cell layouts and the auxiliary material are required.
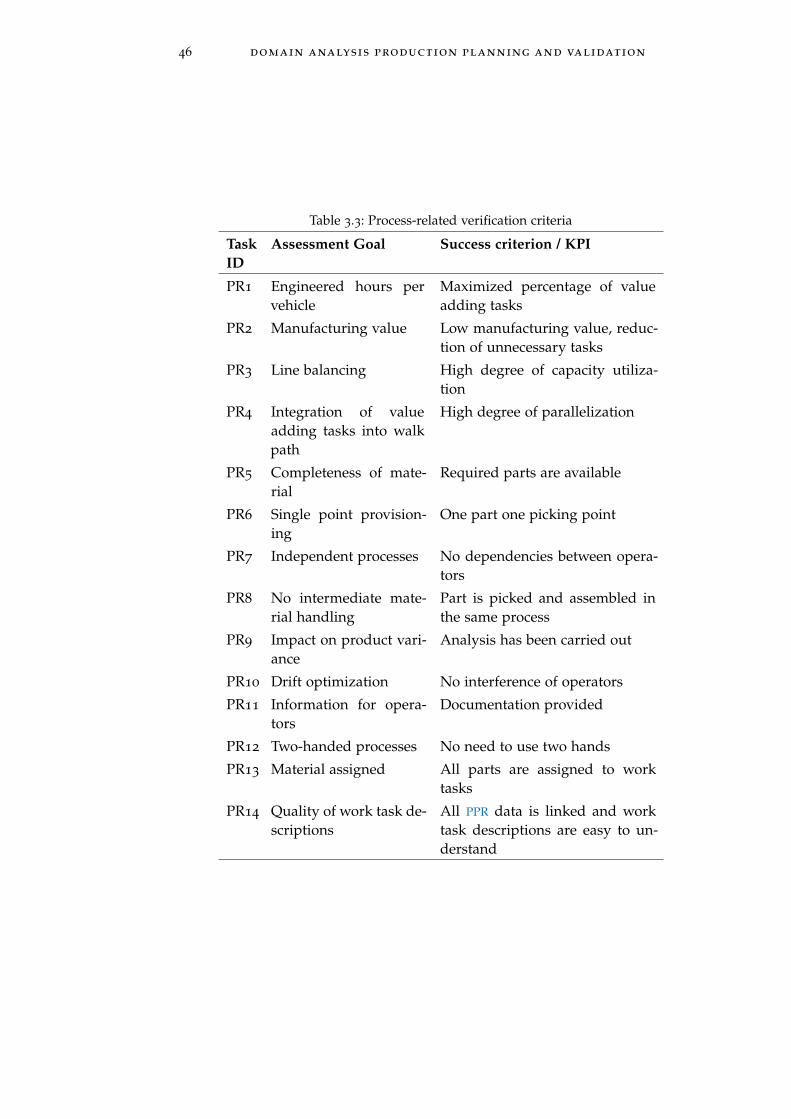
46 domain analysis production planning and validation
Table 3.3: Process-related verification criteria
TaskID
Assessment Goal Success criterion / KPI
PR1 Engineered hours pervehicle
Maximized percentage of valueadding tasks
PR2 Manufacturing value Low manufacturing value, reduc-tion of unnecessary tasks
PR3 Line balancing High degree of capacity utiliza-tion
PR4 Integration of valueadding tasks into walkpath
High degree of parallelization
PR5 Completeness of mate-rial
Required parts are available
PR6 Single point provision-ing
One part one picking point
PR7 Independent processes No dependencies between opera-tors
PR8 No intermediate mate-rial handling
Part is picked and assembled inthe same process
PR9 Impact on product vari-ance
Analysis has been carried out
PR10 Drift optimization No interference of operators
PR11 Information for opera-tors
Documentation provided
PR12 Two-handed processes No need to use two hands
PR13 Material assigned All parts are assigned to worktasks
PR14 Quality of work task de-scriptions
All PPR data is linked and worktask descriptions are easy to un-derstand
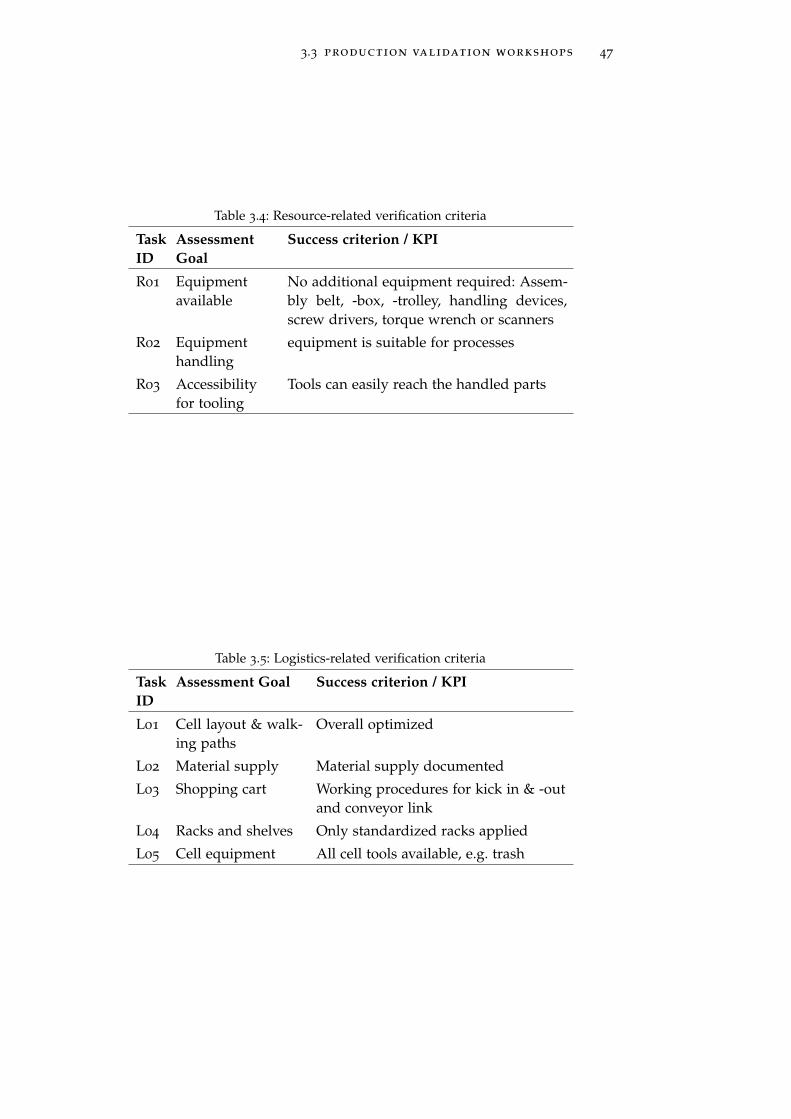
3.3 production validation workshops 47
Table 3.4: Resource-related verification criteria
TaskID
AssessmentGoal
Success criterion / KPI
R01 Equipmentavailable
No additional equipment required: Assem-bly belt, -box, -trolley, handling devices,screw drivers, torque wrench or scanners
R02 Equipmenthandling
equipment is suitable for processes
R03 Accessibilityfor tooling
Tools can easily reach the handled parts
Table 3.5: Logistics-related verification criteria
TaskID
Assessment Goal Success criterion / KPI
L01 Cell layout & walk-ing paths
Overall optimized
L02 Material supply Material supply documented
L03 Shopping cart Working procedures for kick in & -outand conveyor link
L04 Racks and shelves Only standardized racks applied
L05 Cell equipment All cell tools available, e.g. trash

4E VA L U AT I O N O F S TAT E - O F - T H E - A RTVA L I D AT I O N M E T H O D S
This chapter reviews state-of-the-art collaborative validation methodsfor manual assembly processes in the automotive industry. As de-scribed in the domain analysis in Chapter 3, validation methods andtools have limitations as they are not fully suitable for virtual produc-tion validation. Several approaches for efficient production validationcan be found in the literature [27, 89], material provisioning in finalassembly lines [77] and varying degrees of physical and DHM [15].Only few papers mention drawbacks in current state-of-the-art PV
workshops. The whitepaper "general assembly manufacturing" [23]published by Siemens UGS PLM summarizes the automotive compa-nies’ barriers for effective manufacturing planning as follows:
• "Inadequate synchronization between product and manufactur-ing engineering
• Wasted time and effort due to inadequate management of man-ufacturing data
• Insufficient ability to optimize and validate critical aspects ofthe manufacturing process prior to launch
• Inability to work collaboratively and manage change within ashared context"
These deficiencies are in accordance with Walla [27] and Seiffert& Rainer [90, p. 28], who also mention multiple limitations on theusage of virtual assessments. These include a lack of simulation tech-niques, non-standardized data pipelines, high effort for simulationsand insufficient data quality.
A contextual inquiry study is described below. On-site attendanceat PV workshops are carried out to substantiate literature findingswith a focus on characteristics, drawbacks and optimization poten-tials. This also includes semi-structured expert interviews used togather qualitative data on state-of-the-art in industrial practice dur-ing PV workshops. This contextual inquiry study follows the researchquestions presented in Chapter 2. Collecting qualitative data is rele-vant for understanding whether the drawbacks presented in the liter-ature (e.g. UGS [23]) and Section 1.4 still apply in today’s assemblyplanning.
The following chapter is structured as follows: First, the contextualinquiry study procedure is presented, based on qualitative data ac-quired from on-site attendances and subsequent interviews. Then, the
49
50 evaluation of state-of-the-art validation methods
results are presented using clusters: Physical and virtual PV, method-ological challenges, technological challenges and an outlook.
4.1 study procedure
The contextual inquiry study was carried out by attending PV work-shops at Daimler AG in Sindelfingen and Böblingen, Germany. Subse-quent semi-structured one-on-one interviews were conducted in quietseparate meeting rooms.
Each participant planned enough time in advance so that the in-terviews could be conducted in a timely unrestricted manner. All in-terview partners were encouraged to talk about their observationson specific topics, and their personal notion and optimization poten-tials for PV workshops. Additionally, participants were informed thatthey could stop the interview at any time and that the interview wasrecorded, transcribed, coded, evaluated and published subsequently.
The interview started with a short introduction to this doctoral the-sis and the research context (see Chapter 2). The participants weretold to disregard organizational barriers within their personal organi-zation (Daimler AG and its departments) and to answer the questionsto the best of their knowledge about the current state of the art in man-ufacturing, but not with respect to company-specific processes. Theywere encouraged to think about novel use cases, future technologies,methods and processes in the context of PV. This contextual inquirystudy was carried out in the timespan from August 2014 to October2014.
4.2 participants
These users came from a representative population for PV workshops,as they were actual key users and managers. Their roles were virtualtechnology experts, PV workshop managers and PV experts (see Par-ticipants and Stakeholders in Section 3.3.4). They intentionally camefrom multiple departments, different ages and heterogeneous VirtualTechnology (VT) experience, but all of them had profound knowledgeabout the PV processes.
The participants were recruited via an e-mail or telephone invita-tion. They were all participants of PV workshops but with differingbackgrounds. Production engineers represented the main stakehold-ers, as they were in need of the simulation results. Virtual technologyexperts had experience in authoring and carrying out virtual simu-lations. All participants took part on a voluntary basis and did notreceive any extra reward.
At the beginning of each interview, the participants were askedto characterize themselves with respect to their self-proclaimed VT
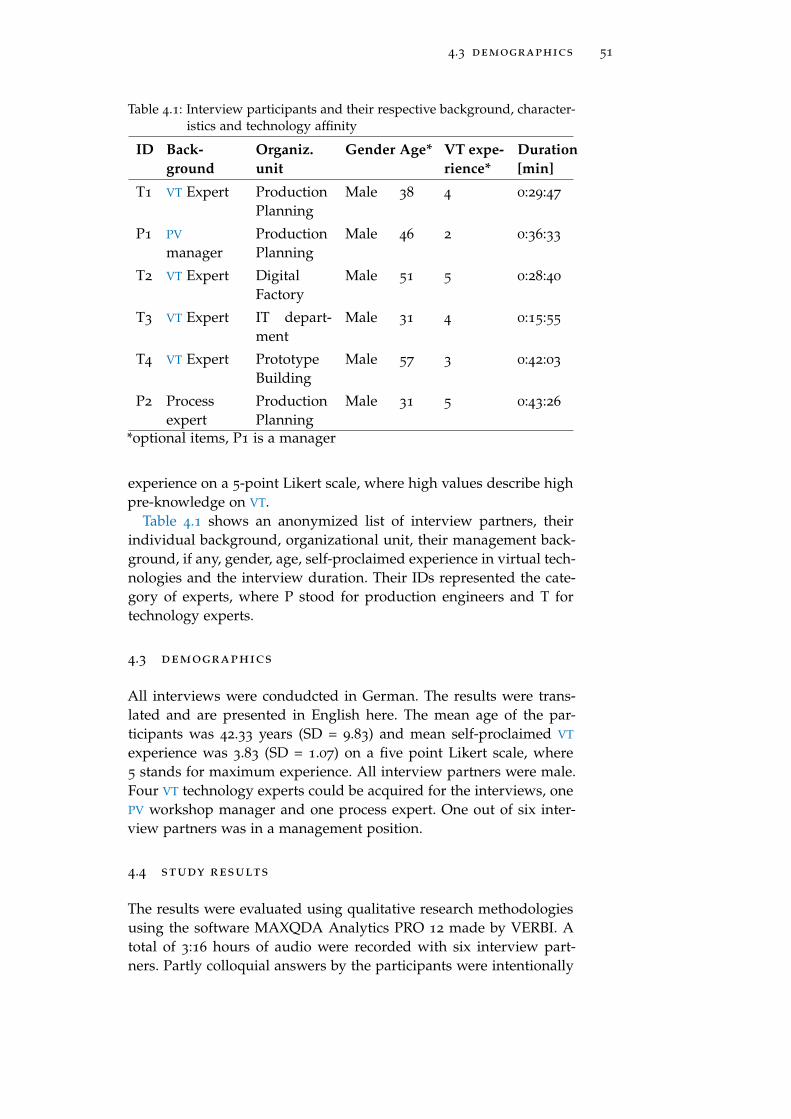
4.3 demographics 51
Table 4.1: Interview participants and their respective background, character-istics and technology affinity
ID Back-ground
Organiz.unit
Gender Age* VT expe-rience*
Duration[min]
T1 VT Expert ProductionPlanning
Male 38 4 0:29:47
P1 PV
managerProductionPlanning
Male 46 2 0:36:33
T2 VT Expert DigitalFactory
Male 51 5 0:28:40
T3 VT Expert IT depart-ment
Male 31 4 0:15:55
T4 VT Expert PrototypeBuilding
Male 57 3 0:42:03
P2 Processexpert
ProductionPlanning
Male 31 5 0:43:26
*optional items, P1 is a manager
experience on a 5-point Likert scale, where high values describe highpre-knowledge on VT.
Table 4.1 shows an anonymized list of interview partners, theirindividual background, organizational unit, their management back-ground, if any, gender, age, self-proclaimed experience in virtual tech-nologies and the interview duration. Their IDs represented the cate-gory of experts, where P stood for production engineers and T fortechnology experts.
4.3 demographics
All interviews were condudcted in German. The results were trans-lated and are presented in English here. The mean age of the par-ticipants was 42.33 years (SD = 9.83) and mean self-proclaimed VT
experience was 3.83 (SD = 1.07) on a five point Likert scale, where5 stands for maximum experience. All interview partners were male.Four VT technology experts could be acquired for the interviews, onePV workshop manager and one process expert. One out of six inter-view partners was in a management position.
4.4 study results
The results were evaluated using qualitative research methodologiesusing the software MAXQDA Analytics PRO 12 made by VERBI. Atotal of 3:16 hours of audio were recorded with six interview part-ners. Partly colloquial answers by the participants were intentionally
52 evaluation of state-of-the-art validation methods
included in the results section to properly reproduce the stated opin-ions. The coding process went through an iterative process of contin-uous optimization of the coding taxonomy. The codebook was dis-cussed with experts afterwards for iterative optimization and cluster-ing.
The coding process revealed three major topics the experts dis-cussed: Current physical and virtual production validation processes,organizational challenges and technological challenges.
4.4.1 Physical and virtual production validation process
All experts (6) commented on current state-of-the-art production val-idation processes in manufacturing as a baseline.
General process descriptions: The validation process starts approx-imately two years ahead of SOP and lasts until six months before SOP
(P1). In the early phases, DMU-based assessments are carried out asparts are altered on a daily basis and assembly concepts are highlyvolatile. Later on, mostly physical workshops are carried out (P1).PV workshops are carried out at certain milestones of different plan-ning phases during the PDP, where all data come together. For eachpart or process, only a restricted time frame is allocated (T4). A typi-cal workshop duration is limited to three weeks for assessing severalthousands of assembly parts or processes (T4). This only allows aquick validation at the end of the workshops, but does not leave timefor planning (T4). Workshop participants expect to get a general ideaof the upcoming product and processes and have to find counter-measures for product and process flaws in a collaborative manner(T2). The PV workshops are often the first time that all experts, suchas logistics experts, ergonomic experts, time experts, planners andproduct development engineers, meet (P2). The hands-on experienceof workers is highly valuable, since they detect many effects that pro-duction engineers may fail to see (T4).
(T4) requests an overall strategy for DMU and PMU-based referencecars. Reference cars maintain the same extra equipment configura-tions throughout the PDP. According to (T4), reference cars should bematched between DMU and PMU validation phases so that the sameconfigurations can be re-assessed. People get used to the configura-tion of repeatedly used reference cars, and this enhances the re-useof digital simulation contents (T4).
Product related assessments: Static DMU product geometry is as-sessed on large screens or small power-wall projections, in order tooptimize the product, manufacturing sequence and processes (T3).(T4) reports that DMU product geometry is sometimes not available,which causes misunderstandings for workshop participants. He pointsout that when people see the parts either in the physical or the vir-tual world, they have a common discussion basis. (T1) mentions that
4.4 study results 53
digital collision checks, static assembly and disassembly assessmentsare already partly assessed in the virtual domain. Standardization ofmounting and assembly concepts are assessed in buildability as well(T4). (T2) adds that DMUs have to be as new as possible to satisfy thedemands of PV participants. (P2) sees the huge advantage that theDMU simulation scenes can be altered quickly, whilst this wouldn’tbe possible using PMUs.
(T4) wants closer cooperation between manufacturing planning,packaging, prototype building, R&D and product engineers even priorto the PV workshops. This would simplify the workshops at the endof each phase in PV. (T4) regrets that within buildability assessmentworkshops, many errors are revealed that could easily be detectedearlier in the development process. He wonders if there is too littletime to create high quality DMU and if there would be a higher reli-ability character if physical prototypes would have to be built, sincethere are higher costs involved (T4). (T4) assumes that the time andcost involved tend to be underestimated for DMUs.
Process related assessments: In the early phases of DMU assess-ments, no work task descriptions are available. A rough manufactur-ing sequence is created for workshops (T4). Only when alphanumericwork task descriptions or rough sequences are available, process val-idation is feasible (P1). Even though the central purpose of PV work-shops is the collaborative validation of existing planning data, peoplesometimes start to plan during the PV workshop sessions (P2 and T4).Processes are refined on-the-fly during the assessment of the product,and additional process plans are written or changed (P2).
Human related assessments: (T3) argues that ergonomic assess-ments can be carried out in virtual space already, but with a lot ofeffort. (P1) supports this by adding that tracking systems are spo-radically used for capturing assembly and disassembly trajectories ofparts to check clearances and accessibility in the manufacturing state.Feasibility studies are carried out, such as clearance assessments be-tween product and human or between product and tools (T3). (T4)remarks that the assessment verification criterion "clearances" is im-portant for assembly, e.g. whether there is sufficient space to accessthe product by hand or with tooling. Mostly human-related move-ments are evaluated for value adding tasks (P2). An example of anreachability assessment is if a 5%-sized worker from a representativepopulation database can reach a screw point ergonomically.
For non-value adding tasks, physical validation methods are typi-cally used (P2). For example, walk paths have never been assessedwith other methods than by putting duct tape on the floor for a"spaghetti diagram" or pen and paper methods (P2). Even thoughit would be possible to determine times in virtual space, this is notcarried out at all. Predetermined Motion Time System (PMTS) mustbe used in European automotive industry for task planning (see also
54 evaluation of state-of-the-art validation methods
[91], such as MTM-1, MTM-UAS predominantly used in Europe orMODAPTS in the US), instead of time measurements (T4) (see REFA[92]).
Cell layout-related assessments: The factory layout is valuable forvisualizing the context for all workshop participants either in the dig-ital or physical domain (T4). (T4) points out that there have been"infinitely long" and controversial discussions on the work heights inrelation to the car, if there is no visual reference. This leads to the re-quirement to visualize and simulate work heights for each cell. Thiswould narrow down the discussion to an objective simulation.
Logistics related assessments: (T1) states that logistics-related top-ics are still carried out in physical space, especially when human mo-tion is involved.
4.4.2 Organizational challenges
Overall, all experts (6) mention challenges in the current methodologyand processes of production validation.
Hindrance factors for digital validation: One expert remarks thatproduction engineers have heterogeneous technological backgrounds.Some are technophile whereas others are not accustomed to virtualmethods and constantly try to avoid them (T1). He suggests makingvirtual methods look as real as possible to convince production plan-ners to lose their fear of virtual methods. (T4) sees greater technophiliafor younger colleagues, whereas older production planners tend touse more PMU-based validations (T1). Another hindrance factor canbe found in the overall costs for PDM systems. Production plannersdo not apply PDM systems widely, due to the high costs (P1). He men-tions that only 20% of production engineers have installed the nativePDM software. In addition, PDM systems require a high expertise inhandling virtual models (P1). (T4) states that production planners of-ten lack access to DMU representations of their parts. Even thoughPV workshops are intended for final assembly validation, there someproduction planners who see their parts as a DMU for the first time.This clearly shows the importance of reducing the entry barriers. (T4)adds that the general availability of 3D hardware must be ensured,besides the broad availability of software and training.
(P2) points out the advantage of DMU-based workshops in compar-ison with PMU-based workshops, which is that process variants andproduct variants can be altered instantaneously, whereas using PMUs,people always lose time retrieving some parts from the warehouse."The speed in which solutions are proposed or process variations aresimulated, is of course higher in the virtual space, but all people re-quire a common understanding of the virtual scene" (P2).
4.4 study results 55
Five experts commented on the topic of entry barriers. (T3) distin-guishes two major work steps where entry barriers apply: Authoringand live-simulation.
For the authoring of 3D scenes, all interview partners regard thiswork as an expert’s task, even with optimizations in the near future.(T1) is displeased as he sees the preparation of virtual scenes as unnec-essarily time consuming. (T2) mentions the idea of a One-Click exportfunctionality for 3D scenes, such as a 3D PDF exporter. (P2) remarkson the data provisioning process and introduces the problem thatfusing heterogeneous data out of the different planning databases orsystems into one holistic virtual scene is challenging by now. Eventhough it is obviously needed, there is no tool to view 3D layoutsintegrating all DMU parts, DMU tools, DMU handling devices and DMU
material zones.According to all experts, for live simulation in PV workshops the
entry barriers can be reduced so that technical experts are no longerrequired to use the system. (T3) wants to optimize the assessmentsoftware User Interface (UI) in a way that unskilled production plan-ners are able to utilize the software. (P1) agrees with (T3) and statesthat previously prepared live simulation during PV workshops couldbe carried out by production planners on their own. In contrast, (T2)and (T4) state that both authoring of virtual scenes and interactivesimulation during PV workshops is an additional qualification andshould not be conducted by production engineers even in the nearfuture.
(T4) remarks there are currently only a few people who can exe-cute such interactive simulations. He wants to simplify the usabilityof these PDM and production validation systems. (P2) does not wantthe planners to have to attend a "2 weeks training" in order to use thesystems. (P1) and (P2) agree that conducting live simulations shouldremain the technical operators’ job, so that the process experts canfocus on their native task, namely validating the product and pro-cesses. Similarly, (T2) argues that VT systems can be used more effi-ciently by VT-experts, and production planners should stick to theiroriginal work. (T4) and (P1) agree that even the common PDM systemhas so many functionalities that it continues to be an expert systemwhich can be used by some people but not all. (T1) remarks that theplanners have to use so many heterogeneous planning tools, issuetracking tools and simulation systems that they are often unwillingto learn and utilize an additional and even more complex VT simula-tion system.
Variance: As described in Section 1.3.1, the increasing product vari-ance and extra equipment is a potential source of errors. For purelyDMU-based assessments (T4) points out that theoretically multiplevariants can be assessed simultaneously, but this is not currently car-ried out. Supporting this, (P1) remarks that for hardware-based val-
56 evaluation of state-of-the-art validation methods
idations it is hard to simulate multiple variants. For example, in apowertrain there are hundreds of combinations as the tooling framemust be built for various axles, all-wheel-drive systems and variousdrive shafts. This process includes so many variants that even thehardware equipment and tooling cannot be validated properly.
Ergonomic assessments: (P2) remarks that the capability of full-body motion capture is there but is not utilized frequently, becauseit is too cumbersome. Typically, this marker-based tracking systemis used in combination with DELMIA V5. He sees great opportuni-ties for virtual ergonomics assessments if entry barriers are reduced.If motion capture technology is too cumbersome, many ergonomicassessments are postponed until a PMU is available (P2). (P1) alsowants to utilize motion capturing more frequently for ergonomicsassessments to obtain early validation results. But he remarks that"authoring is so work extensive, that there is only the possibility tovalidate 2-3 worker processes a day." "This is simply too few, becausein regular PV workshops 300 to 400 worker processes are validateda day." "This is why the method [marker-based motion capturing] issufficient for the validation of very few critical processes, but not gen-erally throughout the validation process for every work task" (P1).
Documentation: For documentation purposes in PV workshops,multiple tools are used. Checklists and action lists are generated intools such as Microsoft Excel, Microsoft SharePoint (P1) and propri-etary status tracking databases (P2), (T2), (T4). For additional mediacontent, clarification screenshots of the rendering are merged in Mi-crosoft PowerPoint slides. (P1) comments that images lack the abil-ity to be modified afterwards in order to re-check contours, clashes,or add tools. Videos, 3D trajectories and motions are currently notrecorded.
Collaboration between PV participants: The experts distinguishcollaboration in PMU workshops and in DMU-based workshops. (P2)explains that the "collaboration in PMU-based workshops is reallygood" as everybody is able to participate actively in the creation pro-cess because there is no technical barrier (P2). Workshop participantsstand next to the PMU and build the product collaboratively. Every-body can participate, they can talk to each other and show the others"do it like this, do it differently, look here" (P2). In DMU-based PV
workshops, where all participants sit in the same room, there is "toolittle movement," which (T2) supposes leads to passive involvementin PV workshops. Continuous bustling of people is helpful and repre-sents a key factor for workshop success. What applies to all typesof assessment workshops is that collaboration must be supportedby generating a common understanding of the current verificationcriteria (P2). (P2) points out that each workshop participant has hisown verification scope, such as logistics or assembly planner, but allshould work together on a robust and overall solution.
4.4 study results 57
4.4.3 Technological challenges
Multiple codings regarding technological challenges were mentioned:Interaction: There is no direct interaction between the DMU and
the production engineers as they have to ask the operator to moveor manipulate the virtual objects (T1). "When somebody wants to seesomething different or from a different view, they have to ask thetechnical operator to change it for them" (T1). "This might reducethe workflow a little" (T1). (T1) suggests that the planners should beable to manipulate the scene on their own to support collaborationbetween planners. "For example, when they talk about a fixture ina product, it is much harder to verbally describe it, than to showit in the actual CAD model" (T1) They should take the tracked part,manipulate it, rotate it and show the specific property on their own.
Immersive assessments: Regarding immersive visualizations, theuse of VR and AR is seen as helpful as production engineers may geta better idea of the product and it "is highly welcome and helpful"(T1). (T4) wants general availability of VR components for all produc-tion planners’ work desks, so that everybody has the possibility toimmersively visualize and interact with the DMU components (T4).(T1) remarks that immersive assessments using Head-Mounted Dis-play (HMD)s have to overcome the barriers of embarrassment and ex-pert barriers. They are afraid to use systems they are not accustomedto so as not to embarrass themselves. As production planners havea different affinity to virtual technology, he suggests visualizing 3Denvironments as close to reality as possible. In contrast, VR couldsimplify interaction with the 3D scene since interaction metaphorsare closer to reality than when using regular Human Interface De-vices (HIDs) (T1). (T4) adds the idea of extending user interfaces to in-clude gestures so that the users can manipulate the scene with handgestures. (P1) proposes the use of AR to support the validation ofmultiple product variants in hardware-based workshops. (P1) addi-tionally points out that a closer connection between PMUs and DMUs
would support PV workshops "enormously." (P2) describes a real-lifeproblem which could be solved using AR technology. PV workshopsare held even though some physical assembly parts are missing. Nev-ertheless, because of the missing parts, some processes cannot be as-sessed. With the use of AR, at least these missing parts could havebeen augmented.
Data related challenges: (P1) states that data is available for prod-uct CAD data, racks and carriers but not for cell layouts. There is stillno standardized, interoperable exchange format for material zones,factory layout data, rack layouts etc. Additionally, there is no centraldatabase for this kind of data and no tool to collect all data in oneplace (P2). Outdated or non-synchronous data maturity leads to er-rors in validation results (P2). (P1) argues that the overall goal is not
58 evaluation of state-of-the-art validation methods
only the photo-realistic rendering of 3D geometry but more emphasisshould be placed on the manufacturing context. (P1) wishes to havemeta information, which cannot be seen in the sole 3D geometry. Forexample when highlighting a screw, the torque and type could beautomatically be visualized using text.
Flexibilization and physics: All (6) interview partners mentionedthat for future assembly simulation, flexibilization and physics are im-portant topics. All experts need physics simulations, such as collisiondetection and avoidance, gliding objects and gravity. (P1) sees the ab-sence of flexibilization techniques and haptic simulations as a hugehindrance factor for broader use of virtual assessment simulations.
Visualization of CAD models: (T4) remarks that the huge prod-uct variance requires PV workshops to offer the possibility to showmultiple visualizations in parallel to compare manufacturing states.Switching CAD-data models has to work instantaneously so as to notlose the mental model of different variants. "It makes a huge dif-ference whether rendering takes half a second or three minutes forswitching the product variants. The longer switching takes, the morelikely people lose the impression of difference" (T4). This matchesthe requirements of (P1) who complains about the long initializationtimes when loading a new car model in "10 to 15 minutes", which is"no longer acceptable nowadays." The experts disagree with regardto stereoscopic visualization. While expert (T2) explicitly says that itis not helpful in workshop situations, others see it as a chance forbetter spatial understanding (T1). "The perceived depth is helpful forthe workshop participants to estimate distances of interactively ma-nipulated objects" (T1).
4.5 discussion, study limitations and summary
Regarding the results presented in the context of the literature review,large agreements can be found. The white paper on "general assem-bly manufacturing" [23] by Siemens UGS PLM and the deficienciespresented by Walla [27] match the contextual inquiry study results:
• Synchronization between product and manufacturing engineer-ing is still an issue because of missing digital simulation capabil-ities, technological restrictions, heterogeneous data sources anddiffering quality gates in PDP.
• Handling manufacturing data continues to waste time and meansmore work for manufacturing engineers.
• Optimization opportunities for the "insufficient ability to opti-mize critical aspects of manufacturing process prior to launch"
• Optimization potential for collaboration in shared contexts

4.5 discussion, study limitations and summary 59
• Optimization potential in time planning and line balancing whichoffers enormous optimization potential for reliable estimates ofmanufacturing costs.
The findings of this contextual inquiry study have to be regarded inthe context of time and cannot be generalized as they summarize thestate of the art for one company in 2014. Nevertheless, the deficien-cies found in the literature are confirmed and are used as a baselinescenario for this doctoral thesis.
In this chapter, expert interviews were presented. The results re-vealed methodological and technological limitations in PV workshops.Moreover, the experts indicated optimization potentials.
In the following chapter, these optimization potentials are imple-mented with a holistic framework for virtual assembly validation tosupport collaborative PV workshops.

5T H E V I RT U A L M A N U FA C T U R I N G S TAT I O NF R A M E W O R K
This chapter presents a framework for co-located, collaborative as-sessments of manual assembly processes. This framework integratesseveral interactive components in a methodology for professional ap-plication. In the following, this framework is referred to as the VMS.Hence, this comprehensive set of virtual, mixed and augmented re-ality methods is intended to be used for interactive, real-time assess-ments of manual assembly processes in PV workshops. Therefore, theVMS must represent a collaborative workshop environment. It unifiesbasic research interaction concepts with large scale high-resolutionoutput technologies and simulation software components from a va-riety of domains.
The research contribution of this chapter is the determination ofgaps in the literature for collaborative, co-located workshops. Publica-tions in the areas of computer supported collaborative work, produc-tion engineering and human computer interaction are systematicallyanalyzed and put into the context of real-life automotive productionvalidation. A framework for the VMS objectives as well as requiredfurther research are defined in applied and basic research domains.Based on the literature review, a holistic concept for the VMS is cre-ated. In Chapter 4, the requirement analysis revealed deficiencies incurrent virtual and physical PV workshops such as improvable collab-oration between workshop participants and missing interactive fea-tures. These issues are addressed in the VMS’s development plan inaccordance with the current literature.
Related publications
Research results presented in this chapter have been developedfor this doctoral thesis. Nevertheless, parts of this chapter wereincluded in the conference papers "Dual Reality for ProductionVerification Workshops" [79] by Otto et al. at the CIRP CATS2016 conference and in "Using Scalable, Interactive Floor Pro-jection for Production Planning Scenario" [93]. The goals andconcepts presented have been extended and revised in com-parison to the peer-reviewed publications. In addition, parts ofthis chapter were presented in "Motion Capturing" in the 2017
Springer book: "Web-basierte Anwendungen Virtueller Tech-niken" [94].
This chapter is structured as follows: First, the objectives for theVMS are defined. Since all objectives are interlinked, they are clus-
61
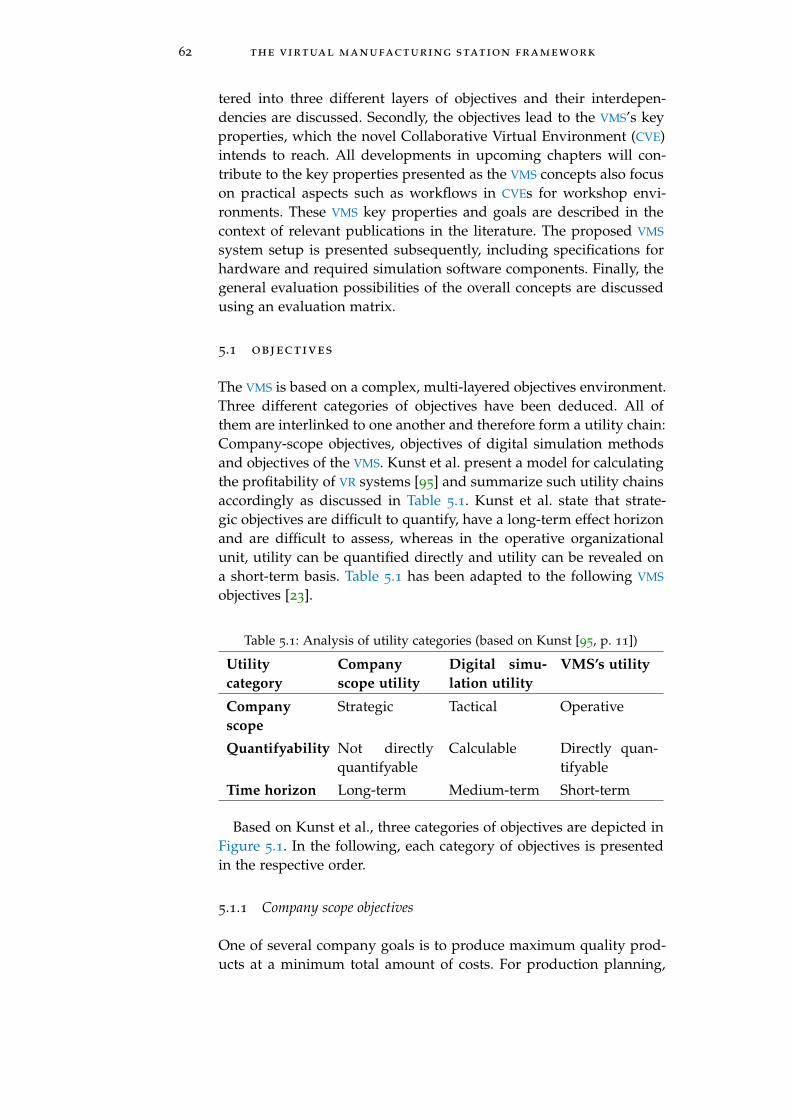
62 the virtual manufacturing station framework
tered into three different layers of objectives and their interdepen-dencies are discussed. Secondly, the objectives lead to the VMS’s keyproperties, which the novel Collaborative Virtual Environment (CVE)intends to reach. All developments in upcoming chapters will con-tribute to the key properties presented as the VMS concepts also focuson practical aspects such as workflows in CVEs for workshop envi-ronments. These VMS key properties and goals are described in thecontext of relevant publications in the literature. The proposed VMS
system setup is presented subsequently, including specifications forhardware and required simulation software components. Finally, thegeneral evaluation possibilities of the overall concepts are discussedusing an evaluation matrix.
5.1 objectives
The VMS is based on a complex, multi-layered objectives environment.Three different categories of objectives have been deduced. All ofthem are interlinked to one another and therefore form a utility chain:Company-scope objectives, objectives of digital simulation methodsand objectives of the VMS. Kunst et al. present a model for calculatingthe profitability of VR systems [95] and summarize such utility chainsaccordingly as discussed in Table 5.1. Kunst et al. state that strate-gic objectives are difficult to quantify, have a long-term effect horizonand are difficult to assess, whereas in the operative organizationalunit, utility can be quantified directly and utility can be revealed ona short-term basis. Table 5.1 has been adapted to the following VMS
objectives [23].
Table 5.1: Analysis of utility categories (based on Kunst [95, p. 11])
Utilitycategory
Companyscope utility
Digital simu-lation utility
VMS’s utility
Companyscope
Strategic Tactical Operative
Quantifyability Not directlyquantifyable
Calculable Directly quan-tifyable
Time horizon Long-term Medium-term Short-term
Based on Kunst et al., three categories of objectives are depicted inFigure 5.1. In the following, each category of objectives is presentedin the respective order.
5.1.1 Company scope objectives
One of several company goals is to produce maximum quality prod-ucts at a minimum total amount of costs. For production planning,

5.1 objectives 63
Figure 5.1: Interconnected objectives: From company-scope objectives to ob-jectives of the VMS
this means that the total amount of costs and production time mustbe reduced despite higher changeability, flexibility and quality in theproduction systems (see Figure 5.1). Production systems have to be-come more changeable (e.g. faster changes in production facility) andmore flexible (e.g. output quantity). Product related costs caused byerrors can be reduced via higher planning quality. Such company-scope objectives of automotive OEMs have been broadly discussed inthe literature (see [53, 96]).
Advanced virtual simulation methods promise to reach these goalsearlier at a higher quality and thus lower costs. With the VMS, a com-prehensive set of virtual and augmented reality methods for real-timeassessments of manual assembly tasks during interdisciplinary PV
workshops is presented.
5.1.2 Objectives of digital simulation methods
Reducing the amount of PMUs: Building and testing physical proto-types of new cars is one major cost factor in vehicle development [25,77]. Automotive OEMs thus generally try to reduce this cost-intensivedevelopment stage of building prototype cars. "Physical prototypebuilding and testing is one of the major cost factors in vehicle de-velopment. This cost increases with the number of models." [97]. En-hancing virtual simulation methods for usage in virtual assessmentswould allow for building fewer PMUs. Even though, PMUs are stillrequired in the very late stages, the overall number of physical pro-totypes can be reduced. Late prototypes can already be producedusing final production rigs, making it possible to disestablish early it-erations of development rigs. In early 2017, the automotive OEM Teslaannounced that they want to completely skip the hardware produc-tion line verification stage and only build a small amount of hardwareprototypes in order to reduce costs as well as speed up the produc-tion process by virtually simulating all production phases [98]: "Tesla,however, is skipping that preliminary step and ordering permanent,more expensive equipment as it races to launch its Model 3 sedanby a self-imposed volume production deadline of September [2017]."
64 the virtual manufacturing station framework
These virtual assessment methods are labeled "advanced analyticaltechniques" by Tesla. "Therefore, reducing the number of physicalprototypes is a key aspect of future competitiveness" [97].
Reducing the overall timespan of the PDP: Shorter developmentcycles in the automotive market are necessary to achieve greater flex-ibility and mutability in the demand context of mass-customization,quicker product updates and changing market demands (see Weber[25]). That is why it is necessary to achieve a higher quality for boththe product and production planning during the early stages of thePDP. This process is called frontloading. As a side effect of shorterdevelopment cycles, the overall development costs drop.
Higher data maturity: To obtain shorter development cycles andfewer product related errors, the DMU data quality must improve.This problem has also been widely discussed in the literature (seeManns et al. [65]). In the early stages, DMU data quality often is notsufficient for the efficient verification of production criteria. Manufac-turing information must be created from DMU data in order to get PPR
information updated synchronously. For example, DMU data alreadygeometrically models product screws properly. The correspondingprocess information often is still built manually because only littlemanufacturing information is linked to the DMU data. Ideally, changesin geometric DMU data would also cause automatic updates in processdata if this information is linked properly.
Enabling late changes: Even if the product development cycle can-not be accelerated for certain products, the use of virtual validationmethods does offer the possibility to enable late changes at lowercosts. The later physical prototypes are built, the less investment isneeded and the more flexibility a product has [25, p. 89].
Smooth ramp-up: On-time launches and smooth ramp-up processescan only be guaranteed if processes are robust from the first dayof production. The ramp-up process aims to achieve the expectedthroughput of the new production line as quickly as possible.
Mixed model line: As the market demands more and more masscustomization and diversification of products, many automotive OEMs
do offer more models, variants and derivatives with additional extraequipment. "Mercedes-Benz went from offering nine models in 1993
to expecting to offer 32 in 2015" [97]. This rising diversification placesadditional requirements on production planning in order to integratemultiple products in the same production line while also ensuringhigh profitability. The greater the time spread of a production cycletime and the more diverse work contents is located at a single work-station, the more complex planning becomes. Even when integratingthe succeeding product in an existing production line, line balancingmust be optimized since the old and new product must be producedefficiently at the same time. This means that the work contents andmaterials required can change considerably. This complexity in work

5.1 objectives 65
contents cannot be assessed without digital simulation and validationmethods.
All of these market demands, company demands and demands fordigital simulation and validation tools put pressure on productionplanning to find novel possibilities to meet these requirements. Thisis why the VMS framework is presented below to fulfill some of theaforementioned objectives.
5.1.3 Objectives of the VMS framework
The consistent implementation of virtual assessment methods andprocesses is a promising approach to fulfill the aforementioned re-quirements. The systematic use of more digital assessments and vali-dations can meet the requirements for a smoother ramp-up, efficientmixed model line planning, fewer PMUs and shorter development cy-cles. Therefore, the overall objective of the VMS is to provide a sharedvirtual environment for collaborative PV workshop situations:
Reach verification criteria using DMUs: Currently, PMU-based pro-duction validation for manual assembly processes is still state of theart with sporadic, static DMU build-ups. Therefore, one objective ofthe VMS is to integrate new technologies and methods to assess morevalidation criteria in the virtual domain.
Supporting workshop situations: Validation and verification tasksare executed in workshops. The VMS aims to efficiently present thesimulation contents to multiple workshop participants. For sharedcontent, using either PMUs or DMUs, participants have to create acommon understanding of all planning aspects: Product, processes,workstation and logistics layouts, tooling, etc. Workshop participantsshould be enabled to interact easily with the DMUs without additionallead times and without training in virtual environments. If this pre-requisite is met, collaborative decision making is possible and fewerproblem solving cycles are needed.
Integration of PPR data: PV workshops use many heterogeneousdata sources and simulation systems to achieve their workshop goals.Product data is displayed in a dedicated 3D visualization system,whereas process data is visualized in alphanumeric planning systemsand workstation layout data is displayed separately in regular officesystems. The VMS aims to integrate these data sources and simulationsystems in one tool which also comprises process models of real PDM
data.Applicability in all phases of the PDP: It must be possible to use
the VMS framework in all assembly validation relevant phases of thePDP. Due to the fact that PMUs should be built as late as possible,fewer PMUs are available during the early phases of planning, eventhough the PV assessments still have to be conducted. However, inthe late phases of the PDP, PMUs are available, which is why operators

66 the virtual manufacturing station framework
and participants must be enabled to use a flexible degree of virtualtechnologies, such as virtual reality, mixed reality and augmentedreality.
Reduction of preparation effort: A reduction in the time requiredfor preparation has two aspects: A reduction in authoring effort anda reduction in technical preparation effort during virtual workshopsituations. Due to the system complexity in authoring, PV workshopsmust be prepared by experts a long time before the workshops begin.An efficient and consistent data provisioning process for the heteroge-nous data sources helps make authoring easier as well. This lead timemust be reduced. When lead times and data freeze times can be setlater, data maturity increases.
Reduction of entry barriers: Interactive simulation currently re-quires expert knowledge. However, the VMS’s intended customers donot have vast background knowledge on virtual assessments. Thisis why complexity during the usage of virtual assessments must bereduced. By lowering technical entry barriers for interactive virtualassessments, production planners can carry out assessments on theirown. The need for a technical operator would be eliminated, reducingtotal costs.
All objectives presented aim to form a dynamic, interactive, virtualreplica of future workstations for the assessment of manual assemblytasks - a "Virtual Manufacturing Station."
5.2 key properties of the virtual manufacturing sta-tion
Multiple key properties are introduced for the implementation of theVMS framework’s objectives. For each key property, basic research ispresented and results are integrated and adapted for the VMS frame-work. The VMS framework covers integrated hardware, software anda methodology for PV workshops.
For the realization of the VMS framework as a collaborative work-shop environment, multiple key properties must be met. This appliesto the entire automotive validation process, from authoring to hold-ing PV workshops. In the context of CSCW, Szalavári et al. presentan architecture for multi-user collaborative virtual environments forAR content [99]. They discuss key properties of such a collaborativeworkshop environment and call it an "augmented laboratory" thatthey intend to use for "visualization, presentation and education." Inaccordance with the "Studierstube" approach, the VMS framework’skey properties are presented and discussed in the following chapterswith respect to the requirements of automotive production validation.
Figure 5.2 depicts the key properties of the VMS, which summarizethe attributes of the VMS framework.
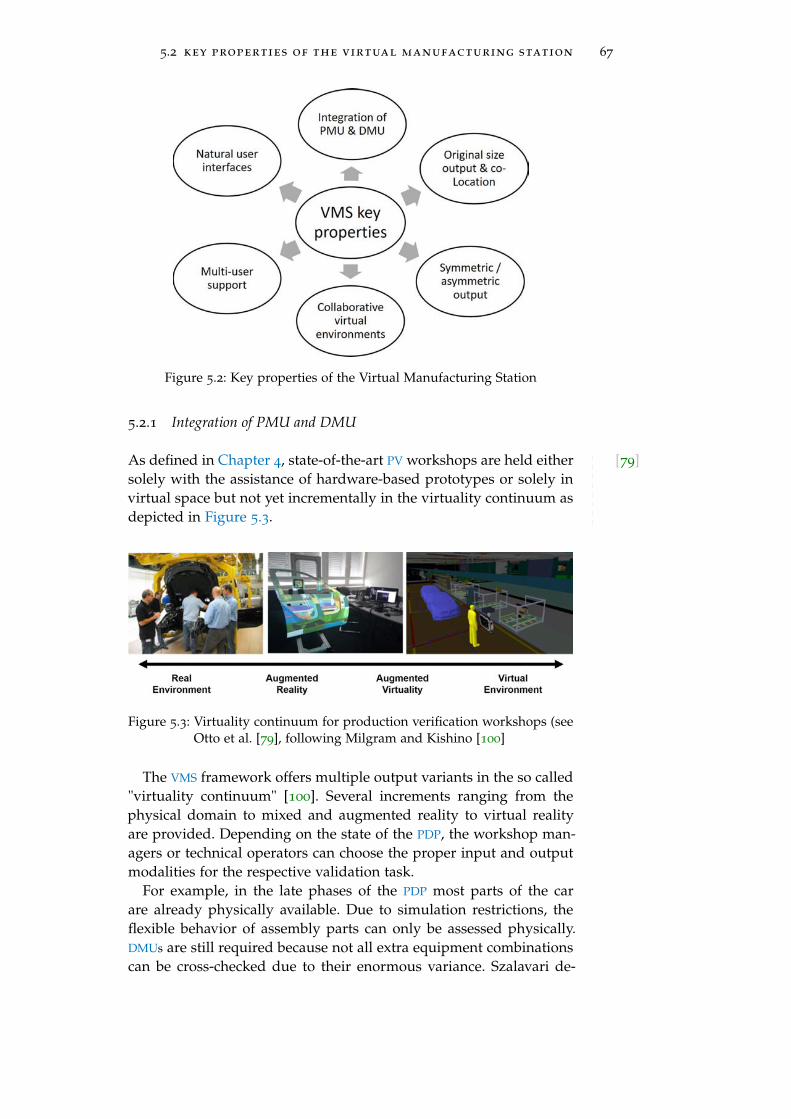
5.2 key properties of the virtual manufacturing station 67
Figure 5.2: Key properties of the Virtual Manufacturing Station
5.2.1 Integration of PMU and DMU
[79]As defined in Chapter 4, state-of-the-art PV workshops are held eithersolely with the assistance of hardware-based prototypes or solely invirtual space but not yet incrementally in the virtuality continuum asdepicted in Figure 5.3.
Figure 5.3: Virtuality continuum for production verification workshops (seeOtto et al. [79], following Milgram and Kishino [100]
The VMS framework offers multiple output variants in the so called"virtuality continuum" [100]. Several increments ranging from thephysical domain to mixed and augmented reality to virtual realityare provided. Depending on the state of the PDP, the workshop man-agers or technical operators can choose the proper input and outputmodalities for the respective validation task.
For example, in the late phases of the PDP most parts of the carare already physically available. Due to simulation restrictions, theflexible behavior of assembly parts can only be assessed physically.DMUs are still required because not all extra equipment combinationscan be cross-checked due to their enormous variance. Szalavari de-
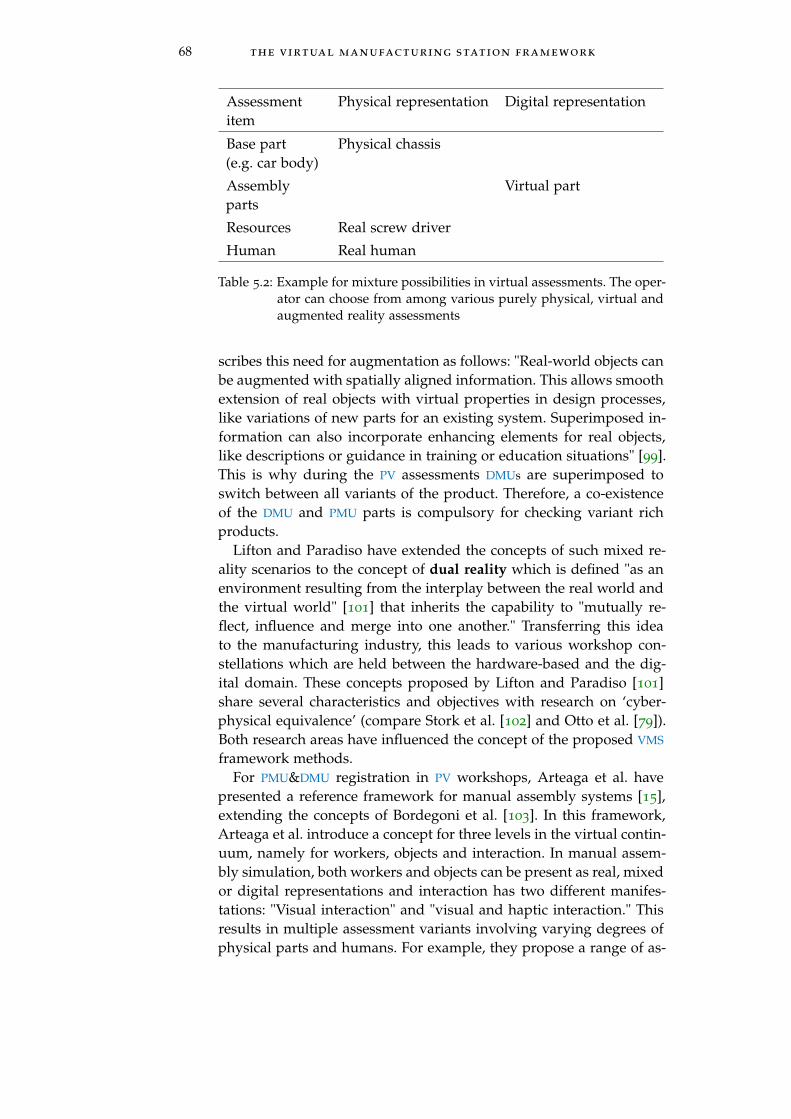
68 the virtual manufacturing station framework
Assessmentitem
Physical representation Digital representation
Base part(e.g. car body)
Physical chassis
Assemblyparts
Virtual part
Resources Real screw driver
Human Real human
Table 5.2: Example for mixture possibilities in virtual assessments. The oper-ator can choose from among various purely physical, virtual andaugmented reality assessments
scribes this need for augmentation as follows: "Real-world objects canbe augmented with spatially aligned information. This allows smoothextension of real objects with virtual properties in design processes,like variations of new parts for an existing system. Superimposed in-formation can also incorporate enhancing elements for real objects,like descriptions or guidance in training or education situations" [99].This is why during the PV assessments DMUs are superimposed toswitch between all variants of the product. Therefore, a co-existenceof the DMU and PMU parts is compulsory for checking variant richproducts.
Lifton and Paradiso have extended the concepts of such mixed re-ality scenarios to the concept of dual reality which is defined "as anenvironment resulting from the interplay between the real world andthe virtual world" [101] that inherits the capability to "mutually re-flect, influence and merge into one another." Transferring this ideato the manufacturing industry, this leads to various workshop con-stellations which are held between the hardware-based and the dig-ital domain. These concepts proposed by Lifton and Paradiso [101]share several characteristics and objectives with research on ‘cyber-physical equivalence’ (compare Stork et al. [102] and Otto et al. [79]).Both research areas have influenced the concept of the proposed VMS
framework methods.For PMU&DMU registration in PV workshops, Arteaga et al. have
presented a reference framework for manual assembly systems [15],extending the concepts of Bordegoni et al. [103]. In this framework,Arteaga et al. introduce a concept for three levels in the virtual contin-uum, namely for workers, objects and interaction. In manual assem-bly simulation, both workers and objects can be present as real, mixedor digital representations and interaction has two different manifes-tations: "Visual interaction" and "visual and haptic interaction." Thisresults in multiple assessment variants involving varying degrees ofphysical parts and humans. For example, they propose a range of as-

5.2 key properties of the virtual manufacturing station 69
sessment types such as "Motion Capture (MoCap) based simulations","AR based simulations", "purely DHM based simulations", "purelyphysical based simulations" and "enriched haptics based simulation."The VMS applies these reference framework’s concepts in its key prop-erties. Table 5.2 shows an example for choosing a mixed reality sim-ulation with a physical base part, virtual assembly part, physical re-sources and a simulated worker.
[79]In general, PMUs are increasingly available during PDP (see Section 3.3).PMUs could, for instance, be carry-over parts from predecessor mod-els, 3d printed models or other related products. Therefore, similarPMUs could resemble the planned part in terms of geometry, weightand mounting. Since the number of combinatory possibilities of as-sessment elements with digital and physical models is too high, it isnot possible to determine a priori which method will best suit the re-quirements of the specific verification task (see [15], [103]). This gapcan be bridged by using the VMS framework which enables workshopmanagers to employ all techniques instantaneously. Consequently, de-pending on the assessment scope and availability of PMUs and DMUs,there are multiple possibilities to match verification tasks in work-shop situations with physical and virtual assessment methods (seeTable 5.2).
Overall, PV workshop participants are more familiar with the useof PMUs. To maintain a familiar work setup, digital content can be su-perimposed onto PMUs in the VMS without any body-worn AR devices."Manipulation of the real world models (e.g. its orientation) is moreintuitive to support than a purely virtual environment." [99] This en-ables production engineers to walk around a physical car body, graspassembly parts and feel the weight of tools.
5.2.2 Original size visualization & co-location
Original size visualization is essential for direct user feedback. Withan an orthographic view-independent rendering of the virtual scenein the VMS, experts get a good impression of distances, sizes andspeeds. If PMU and DMU are registered to tracking systems at thesame time, a 1:1 movement of both the trackable or the human rep-resentation is visualized in the digital domain as a digital twin or"cyber-physical equivalence." [102] Stork describes the interaction andthe challenges in visual computing of advanced manufacturing [102]for cyberphysical production systems. The VMS can be seen as a real-ization of the proposed conceptual model of visual computing. Orig-inal size visualization is one aspect of ‘equivalence.’ Virtual spatialrelations match physical spatial representations, which allows for aprecise registration of PMU and DMU.
70 the virtual manufacturing station framework
[93] Human beings are able to estimate lengths, spatial relations and speedslinearly and precisely (see Chapter 8). Starting the simulation, theparticipant can easily step into the augmented workspace and verifyplanned assembly process steps with regard to planned times, posi-tion, dependencies, effective work time and the ergonomic aspects ofthe assembly cell with less effort of interpretation and mental scaling.
5.2.3 Collaborative Virtual Environments
[93] The VMS framework supports the collaboration of all participantswithin the virtual domain. Ishii states in his paper on Tangible Bitsthat "Interactive surfaces are another promising approach to supportcollaborative design and simulation that has been explored by manyresearchers in the past years to support a variety of spatial applica-tions" [104]. The VMS framework enables PV workshop participantsto collaborate with the simulation scene. The literature offers multi-ple recognized definitions of CVEs. According to the "Encyclopedia ofMultimedia," Furht defines CVEs as follows:
"A collaborative virtual environment is a shared virtual world thatallows its users to collaborate in the synthetic world, performingshared object manipulation and other collaborative tasks" [105].
Furht further describes four axiomatic enablers for "collaboration"between workshop participants [105]:
1. Connectedness: "Ensure necessary connectivity between partic-ipants" [105].
2. Awareness: "Facilitate awareness (and discovery) of other par-ticipants" [105].
3. Sharing: "Facilitate sharing and exchange of information be-tween participants" [105]. Snowdon et al. support this aspect bystating: "Information sharing is central to collaborative work"[106].
4. Communication: "Facilitate dialogue and interaction betweenparticipants (above and beyond information exchange)" [105]."Artefacts and embodiments also are an essential aspect of com-munication and this is how the representation of people andartefacts such as documents and tools within CVEs can facilitatecommunication" [106].
In order to find overall optimal solutions and trade-offs between PV
workshop participants’ areas of expertise (e.g. ergonomics vs. timeoptimizations vs. line balancing), they must share information andcommunicate about the virtual assessments being carried out. PV
workshop managers are expected to moderate the complex validation

5.2 key properties of the virtual manufacturing station 71
tasks and to guide the collaborative efforts in the VE, the same as inthe physical domain. Such typical tasks are presented in accordancewith the CVE "Studierstube" by Szalavári et al., as they intend to usethe CVE for "viewing and examining [of] objects that are not accessibledirectly or that do not exist in the real world" [99]. Multiple digitaland physical information sources must be fused in PV workshopsto obtain a holistic understanding of the workstation under assess-ment. Alphanumeric work task process descriptions, CAD datasets,task documentation lists, process plans, material zone data and mo-tion trajectories are only a few examples of data that are shared andcollaboratively interacted on in the VMS simultaneously. "Size, com-plexity, physical properties are just parameters in a simulation, nolonger are they constraints for the analysis" [99].
Whereas Furht focuses on collaboration in the digital domain only,the VMS extends the CVEs to include collaboration in the physicalworld, since both domains can be blended. Collaboration betweenworkshop participants can take place equally in the physical and vir-tual domain. For example, in a co-located workshop two users cansimultaneously interact with the virtual CAD model while discussingverbally and non-verbally (gestures and facial expressions) in thephysical domain. Similarly, Billinghurst et al. present "SharedSpace"as an augmented reality interface for co-located, collaborative com-puting [107]: "Co-located users can see each other’s facial expressions,gestures and body language thus supporting natural face-to-face com-munication cues. Thus the "SharedSpace" interface allows multipleusers in the same location to simultaneously work in both the realand virtual world."
5.2.4 Symmetric and asymmetric output for AR/VR
Sharing both the physical and virtual content in a collaborative work-shop session, participants are led to the question which output tech-nology is best in finding optimal solutions for their assessment cri-teria. In a baseline scenario, all participants look at the same out-put device. In the literature, this is called symmetric output, since allparticipants consume the same, view-independent content from onescreen. Symmetric situations are given, when "the visual informationand the possibility to interact with the virtual content are the samefor [the] collaborators" [108].
Another symmetric output arrangement uses multiple VR-HMDsfor all participants. Langbehn et al. propose a way to deal with mul-tiple people in such a setup [109] in a physically shared space. Theypropose shadow-avatars, which are virtual representations of physi-cal users, in order to show their spatial distance in VR. Users interactat a physical distance to avoid collision in physical space and thus pre-vent accidents. They propose semi-transparent silhouettes of virtual
72 the virtual manufacturing station framework
human representations. Evaluations have shown that temporarily vis-ible shadow-avatars generate significantly more collisions comparedto permanently visible humans. For this reason, the physical and vir-tual space stay permanently coupled implying that single user tele-portation in the virtual domain is prohibited. Virtual spatial relationsmatch physical spatial representations between users.
Nevertheless, the literature also provides insights into asymmet-ric output and the combination of multiple individual output de-vices, such as LHRDs, AR Optical See-Through (OST)-HMDs, windowto the world, projection spatial augmented reality and many more(see Benko et al. [110]). Depending on the desired professional goaland effect (e.g. immersion and presence), there are several possiblecombinations to display the above-mentioned contents.
Gugenheimer et al. present ShareVR as a proof of concept for anasymmetric, co-located VR environment where both HMD and Non-HMD users are engaged at the same time in a living room environ-ment [111]. They argue that different users want different experiencesand different levels of engagement while gaming. Therefore, they en-able users to interact in the same physical and virtual space usingdifferent (asymmetric) visualization hardware. This study is limitedto living room environment use cases in the private space with gam-ing as the main focus. This is why they measured engagement andenjoyment. Similarly to the VMS key properties presented by Ottoet al. [93], they use a floor projection unit, portable "window to theworld displays" and HMDs as visualization hardware, all registered toa common coordinate space by using a tracking system. In contrastto the work of Gugenheimer et al., PV workshops do not focus onenjoyment during the assessment workshops but on solving manualassembly issues. In addition, the audience of PV workshops is largerthan the typical asymmetric interaction proposed by ShareVR. WhilePV workshops typically have 10 to 20 people interacting with the sys-tem (see Section 3.3), the use cases presented by Gugenheimer et al.are limited to two persons interacting in the same physical space.
The publication RoomAlive [112] by Jones et al. uses SAR experi-ences to transform the entire living room into a gaming experienceby registering multiple projectors with multiple Kinect V2 cameras togenerate an immersive SAR environment. They investigate the designspace of such SAR environments for gaming purposes. Interaction islimited to a symmetric, co-located approach because all users in theliving room use the same projections and input channels for interac-tion.
Even if there was the technical possibility to synchronize virtualcontents throughout massive amounts of VR head-mounted-displaysin PV workshops, this would not be an efficient method of collabo-ration due to limited physical space. Therefore, the VMS frameworkoffers a way to synchronize up to three VR HMDs in the assessment en-
5.2 key properties of the virtual manufacturing station 73
vironment; meanwhile the other participants are consuming an exo-perspective on a LHRD. The VMS framework is thus mainly designedfor use as an asymmetric output for collaborative situations.
The technical operator of the PV workshop must switch the avail-able output devices according to the interactive assessment goal. Forexample, if a PMU is available, in-situ projections could be suitableto reach the assessment goal by superimposing the wireframe of anassembly part onto the physical chassis. Nevertheless, only some usecases are suitable for SAR (as discussed in Chapter 9). This means thata combination of asymmetric output devices is required as well. Mul-tiple variants of visualization, tracking, and interaction can be chosenat the same time.
5.2.5 Multi-user support
Similar to the collaborative features, multi-user support is also a keyproperty of the VMS to generate shared virtual worlds: "A situationwhere multiple users congregate to discuss, design, or perform othertypes of joint work is generally categorized as CSCW (computer sup-ported cooperate work)" [99]. As described in Section 3.3.4, PV work-shops consist of up to 20 participants. That is why the VMS’s inputand output devices must be designed for multi-user scenarios.
Output components must be able to be viewed simultaneouslyby up to 20 persons for collaboration. This is why LHRDs are mostpromising for view-independent rendering and data visualization. Incontrast, view-dependent renderings are generated by one or multi-ple VR devices. Non-VR users share simulation contents by either look-ing at public displays or using additional VR headsets. Synchronizedasymmetric visualization devices share the same simulation environ-ment. All participants must be able to consume the shared digitalcontents and perceive the same virtual space appropriately, even ifthey use different output modalities.
Input components, such as tracking devices must be able to simul-taneously track multiple people and objects for multi-user support.For instance, for ergonomic assessments in the VMS, fast switchingbetween participants is enabled and multiple persons can be trackedsimultaneously. Workers depend on and interact with each other inreality and with the simulation model. The same holds for objecttracking. Multiple tools such as screw drivers can be involved simul-taneously in work tasks, i.e. for mounting a front module of a car.
Sharing content is crucial for PV workshops. "Investigated objectsare in general shared among users, in the sense of visibility, thismeans that all participants can see the same coherent model, con-sistent in its state over time" [99]. In contrast to shared data, privatedata must remain invisible for other workshop participants. Privateoutput possibilities are available for everyone because participants
74 the virtual manufacturing station framework
bring their own notebooks to the VMS. No additional focus is set ondata security in the VMS as all participants are authorized to see alldata, however, this data is of no interest to others as each user workson their own field of expertise (see also Seifert et al. [113], Langner etal. [114] and Winkler et al. [115] for public and private data) There-fore, this VMS’s key properties focus on sharing public content.
In multi-user environments, the literature also discusses social com-munication between participants to keep communication channels asunaffected as possible. Argelaguet et al. propose a multi-user systemto "support spatial understanding" by extending the capabilities ofreality. "Users can talk to each other, gesture and point into the vir-tual scenery as if it were real. As in reality, referring to objects bypointing, results often in a situation where objects are occluded fromthe other users’ viewpoints" [116]. Argelaguet et al. propose a ren-dering technique so that the participants’ view-dependent renderingshows occluding virtual scene objects as transparent if they interferewith the other person’s line of sight. Such systems help support socialcommunication between multi-users [116].
5.2.6 Natural User Interfaces
Besides conventional HIDs, such as keyboard and mouse, interaction,exploration and manipulation of VEs can be realized using a newform of interfaces, namely Natural User Interfaces (NUI). Steve Ballmersees those interfaces as "touch, speech, gestures, handwriting and vi-sion" [117] that enable "contextual and environmental awareness, im-mersive 3D experiences and anticipatory computing"[117]. FollowingWigdor and Wixon in their book "Brave NUI world", the term "natu-ral" does not imply a mimicry of the "real world", but describes NUIas a "design philosophy and a source for metrics" [118, p. 9]. Eventhough mostly direct touch and gesture interaction is described, mul-tiple modalities can enable the construction of a natural user inter-face. NUIs must create an experience that can "feel like an extensionof their body" and feels just as natural to a novice as it does to an ex-pert user." It "does not try to mimic the real world" and considers the"context, including the rich metaphors, visual indications, feedback,and input/output methods for the context"[118, p. 13]. Other sourcesadd aspects of an invisible interface, direct interaction with content,fast learning curves of increasingly complex interactions, and usageof natural human behaviors to their definitions of NUIs. In consensuswith all sources, interfaces are not natural if they "exploit skills thatwe have acquired through a lifetime of living in the world" [119].
As early as 2001, Zachmann and Rettig described a natural user in-terface for virtual assembly simulation scenarios [120]. They proposetechniques and methods for multi-modal input techniques includingspeech input and gesture recognition for controlling the assembly
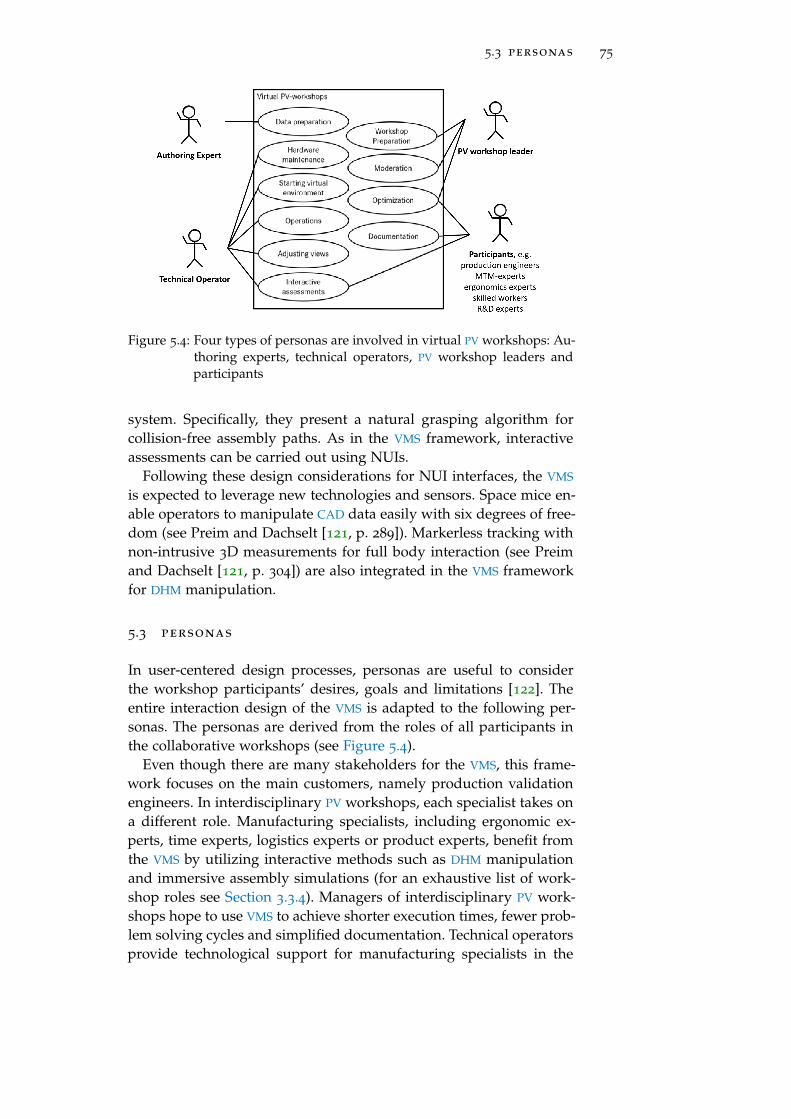
5.3 personas 75
Figure 5.4: Four types of personas are involved in virtual PV workshops: Au-thoring experts, technical operators, PV workshop leaders andparticipants
system. Specifically, they present a natural grasping algorithm forcollision-free assembly paths. As in the VMS framework, interactiveassessments can be carried out using NUIs.
Following these design considerations for NUI interfaces, the VMS
is expected to leverage new technologies and sensors. Space mice en-able operators to manipulate CAD data easily with six degrees of free-dom (see Preim and Dachselt [121, p. 289]). Markerless tracking withnon-intrusive 3D measurements for full body interaction (see Preimand Dachselt [121, p. 304]) are also integrated in the VMS frameworkfor DHM manipulation.
5.3 personas
In user-centered design processes, personas are useful to considerthe workshop participants’ desires, goals and limitations [122]. Theentire interaction design of the VMS is adapted to the following per-sonas. The personas are derived from the roles of all participants inthe collaborative workshops (see Figure 5.4).
Even though there are many stakeholders for the VMS, this frame-work focuses on the main customers, namely production validationengineers. In interdisciplinary PV workshops, each specialist takes ona different role. Manufacturing specialists, including ergonomic ex-perts, time experts, logistics experts or product experts, benefit fromthe VMS by utilizing interactive methods such as DHM manipulationand immersive assembly simulations (for an exhaustive list of work-shop roles see Section 3.3.4). Managers of interdisciplinary PV work-shops hope to use VMS to achieve shorter execution times, fewer prob-lem solving cycles and simplified documentation. Technical operatorsprovide technological support for manufacturing specialists in the
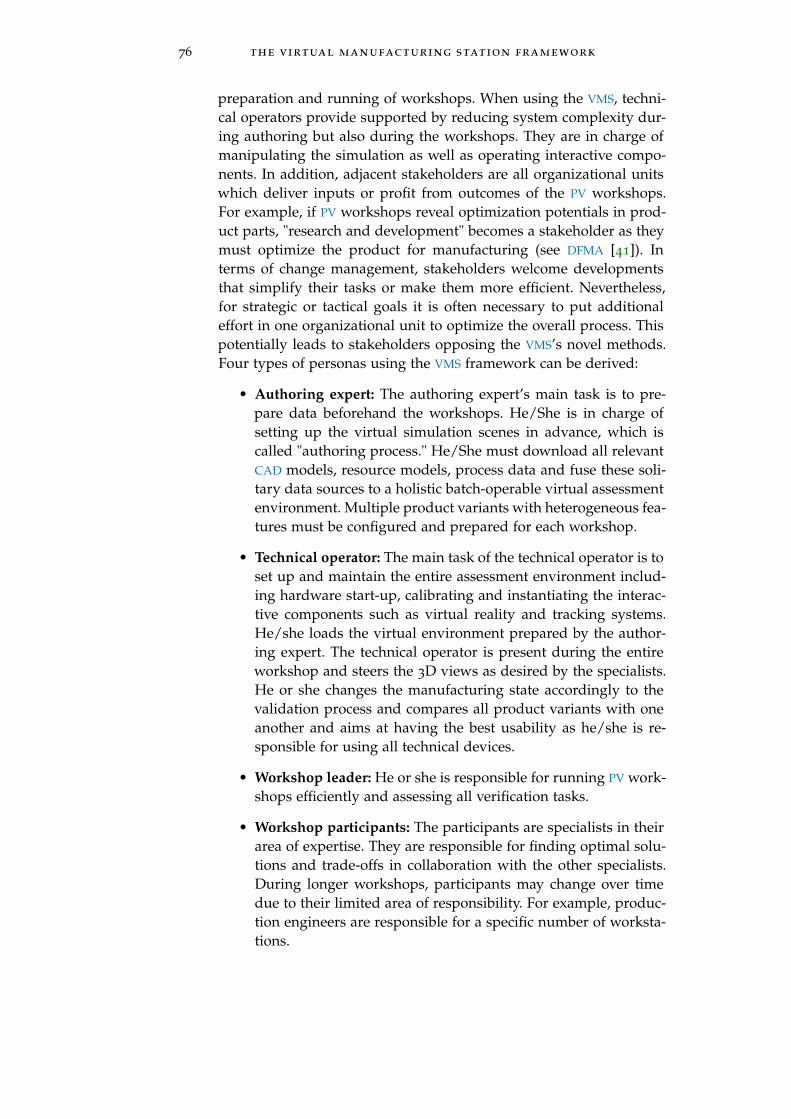
76 the virtual manufacturing station framework
preparation and running of workshops. When using the VMS, techni-cal operators provide supported by reducing system complexity dur-ing authoring but also during the workshops. They are in charge ofmanipulating the simulation as well as operating interactive compo-nents. In addition, adjacent stakeholders are all organizational unitswhich deliver inputs or profit from outcomes of the PV workshops.For example, if PV workshops reveal optimization potentials in prod-uct parts, "research and development" becomes a stakeholder as theymust optimize the product for manufacturing (see DFMA [41]). Interms of change management, stakeholders welcome developmentsthat simplify their tasks or make them more efficient. Nevertheless,for strategic or tactical goals it is often necessary to put additionaleffort in one organizational unit to optimize the overall process. Thispotentially leads to stakeholders opposing the VMS’s novel methods.Four types of personas using the VMS framework can be derived:
• Authoring expert: The authoring expert’s main task is to pre-pare data beforehand the workshops. He/She is in charge ofsetting up the virtual simulation scenes in advance, which iscalled "authoring process." He/She must download all relevantCAD models, resource models, process data and fuse these soli-tary data sources to a holistic batch-operable virtual assessmentenvironment. Multiple product variants with heterogeneous fea-tures must be configured and prepared for each workshop.
• Technical operator: The main task of the technical operator is toset up and maintain the entire assessment environment includ-ing hardware start-up, calibrating and instantiating the interac-tive components such as virtual reality and tracking systems.He/she loads the virtual environment prepared by the author-ing expert. The technical operator is present during the entireworkshop and steers the 3D views as desired by the specialists.He or she changes the manufacturing state accordingly to thevalidation process and compares all product variants with oneanother and aims at having the best usability as he/she is re-sponsible for using all technical devices.
• Workshop leader: He or she is responsible for running PV work-shops efficiently and assessing all verification tasks.
• Workshop participants: The participants are specialists in theirarea of expertise. They are responsible for finding optimal solu-tions and trade-offs in collaboration with the other specialists.During longer workshops, participants may change over timedue to their limited area of responsibility. For example, produc-tion engineers are responsible for a specific number of worksta-tions.
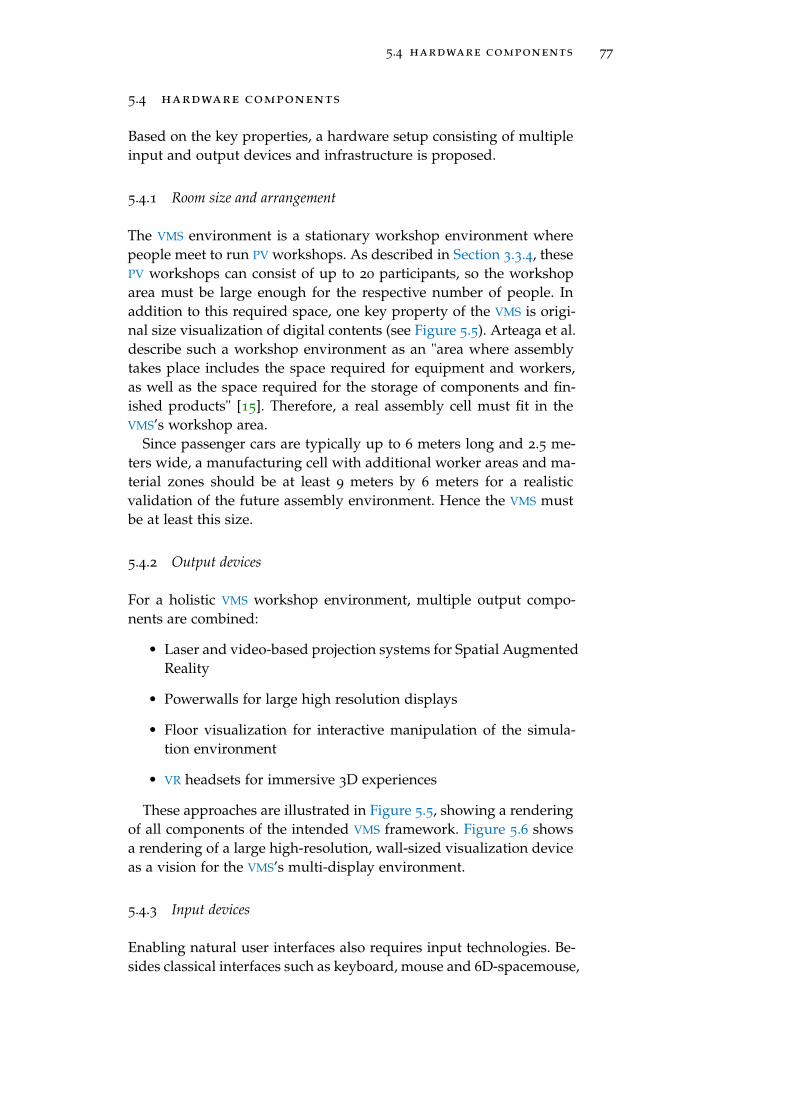
5.4 hardware components 77
5.4 hardware components
Based on the key properties, a hardware setup consisting of multipleinput and output devices and infrastructure is proposed.
5.4.1 Room size and arrangement
The VMS environment is a stationary workshop environment wherepeople meet to run PV workshops. As described in Section 3.3.4, thesePV workshops can consist of up to 20 participants, so the workshoparea must be large enough for the respective number of people. Inaddition to this required space, one key property of the VMS is origi-nal size visualization of digital contents (see Figure 5.5). Arteaga et al.describe such a workshop environment as an "area where assemblytakes place includes the space required for equipment and workers,as well as the space required for the storage of components and fin-ished products" [15]. Therefore, a real assembly cell must fit in theVMS’s workshop area.
Since passenger cars are typically up to 6 meters long and 2.5 me-ters wide, a manufacturing cell with additional worker areas and ma-terial zones should be at least 9 meters by 6 meters for a realisticvalidation of the future assembly environment. Hence the VMS mustbe at least this size.
5.4.2 Output devices
For a holistic VMS workshop environment, multiple output compo-nents are combined:
• Laser and video-based projection systems for Spatial AugmentedReality
• Powerwalls for large high resolution displays
• Floor visualization for interactive manipulation of the simula-tion environment
• VR headsets for immersive 3D experiences
These approaches are illustrated in Figure 5.5, showing a renderingof all components of the intended VMS framework. Figure 5.6 showsa rendering of a large high-resolution, wall-sized visualization deviceas a vision for the VMS’s multi-display environment.
5.4.3 Input devices
Enabling natural user interfaces also requires input technologies. Be-sides classical interfaces such as keyboard, mouse and 6D-spacemouse,
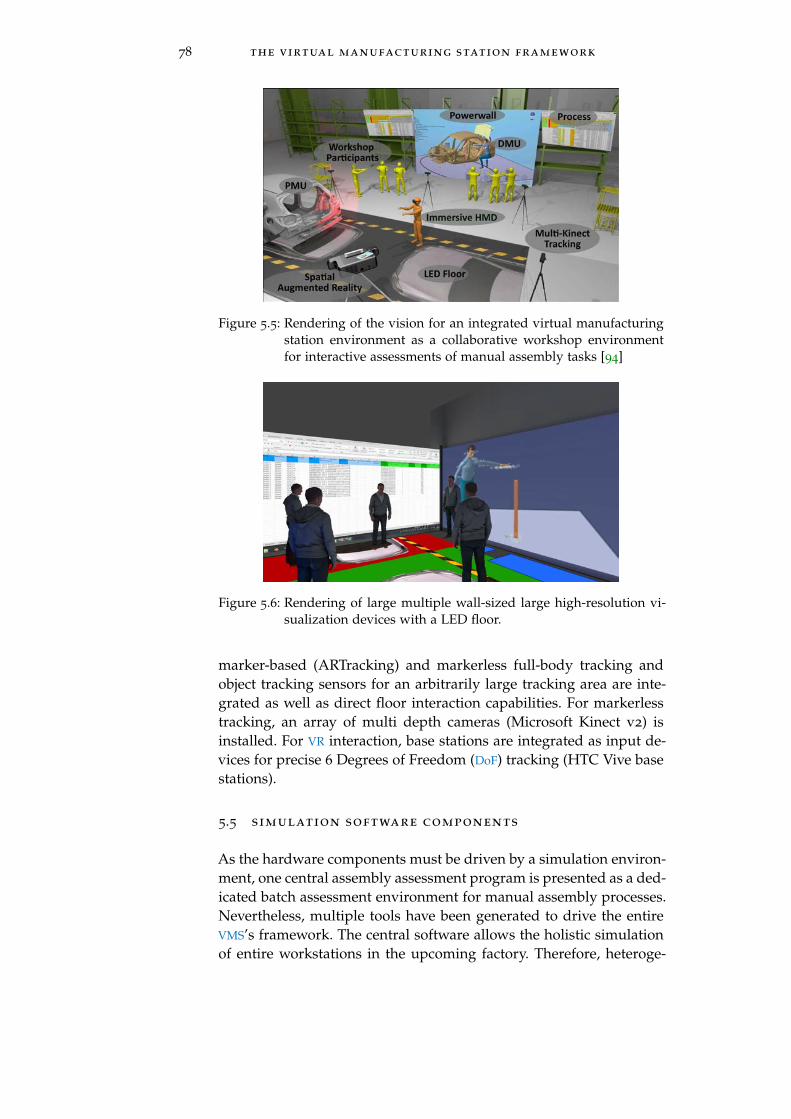
78 the virtual manufacturing station framework
Figure 5.5: Rendering of the vision for an integrated virtual manufacturingstation environment as a collaborative workshop environmentfor interactive assessments of manual assembly tasks [94]
Figure 5.6: Rendering of large multiple wall-sized large high-resolution vi-sualization devices with a LED floor.
marker-based (ARTracking) and markerless full-body tracking andobject tracking sensors for an arbitrarily large tracking area are inte-grated as well as direct floor interaction capabilities. For markerlesstracking, an array of multi depth cameras (Microsoft Kinect v2) isinstalled. For VR interaction, base stations are integrated as input de-vices for precise 6 Degrees of Freedom (DoF) tracking (HTC Vive basestations).
5.5 simulation software components
As the hardware components must be driven by a simulation environ-ment, one central assembly assessment program is presented as a ded-icated batch assessment environment for manual assembly processes.Nevertheless, multiple tools have been generated to drive the entireVMS’s framework. The central software allows the holistic simulationof entire workstations in the upcoming factory. Therefore, heteroge-
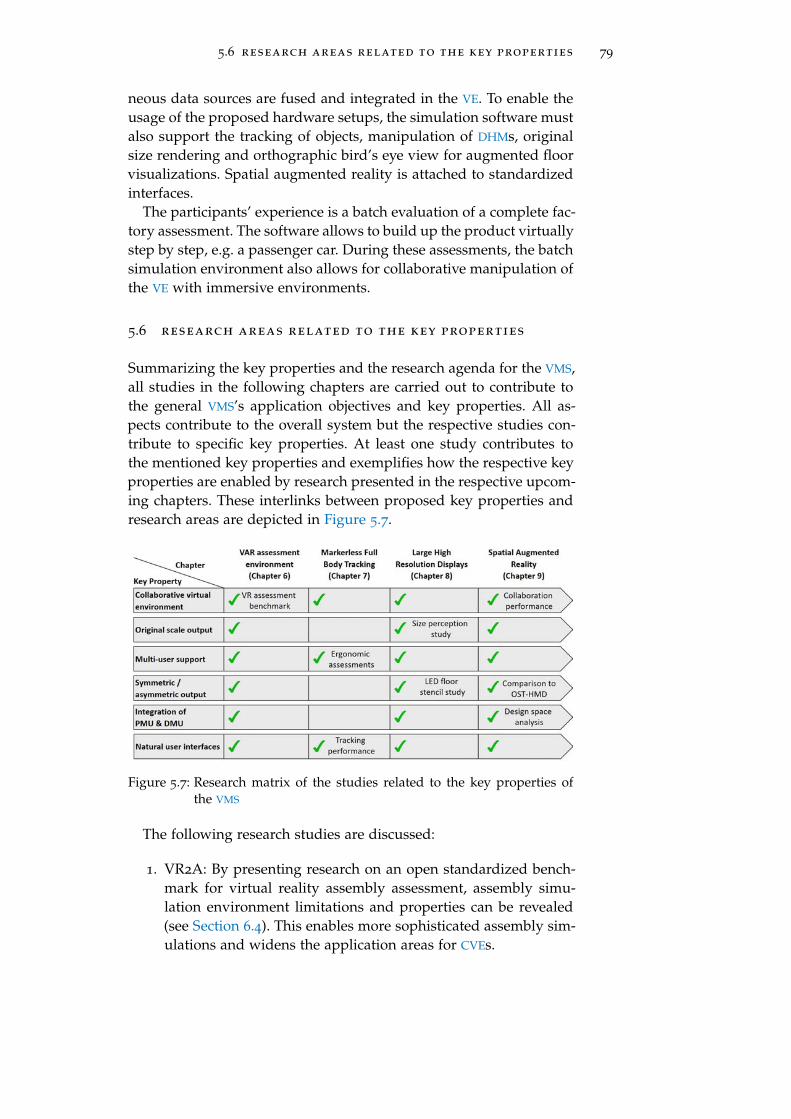
5.6 research areas related to the key properties 79
neous data sources are fused and integrated in the VE. To enable theusage of the proposed hardware setups, the simulation software mustalso support the tracking of objects, manipulation of DHMs, originalsize rendering and orthographic bird’s eye view for augmented floorvisualizations. Spatial augmented reality is attached to standardizedinterfaces.
The participants’ experience is a batch evaluation of a complete fac-tory assessment. The software allows to build up the product virtuallystep by step, e.g. a passenger car. During these assessments, the batchsimulation environment also allows for collaborative manipulation ofthe VE with immersive environments.
5.6 research areas related to the key properties
Summarizing the key properties and the research agenda for the VMS,all studies in the following chapters are carried out to contribute tothe general VMS’s application objectives and key properties. All as-pects contribute to the overall system but the respective studies con-tribute to specific key properties. At least one study contributes tothe mentioned key properties and exemplifies how the respective keyproperties are enabled by research presented in the respective upcom-ing chapters. These interlinks between proposed key properties andresearch areas are depicted in Figure 5.7.
Figure 5.7: Research matrix of the studies related to the key properties ofthe VMS
The following research studies are discussed:
1. VR2A: By presenting research on an open standardized bench-mark for virtual reality assembly assessment, assembly simu-lation environment limitations and properties can be revealed(see Section 6.4). This enables more sophisticated assembly sim-ulations and widens the application areas for CVEs.
80 the virtual manufacturing station framework
2. For spatial augmented reality, the collaboration performanceis evaluated in an abstract workshop situation with dividedknowledge (see Section 9.7). This research generates insightsinto the task completion time, using different ways of computer-mediated communication including spatial augmented reality.
3. For the original size key property, a size perception researchstudy is presented, testing the accuracy and precision perceivedsizes when using an LED floor (see Section 8.5).
4. In the context of multi-user support, ergonomic assessments arepresented using a scalable markerless tracking system (see Sec-tion 7.9.
5. For the asymmetric output key property, an augmented floorsurface is used as a virtual stencil (see Section 8.6). An evalu-ation shows that task completion times for setting up typicalcardboard layouts can be reduced by using LED floors.
6. A design space evaluation is carried out for spatial augmentedreality to demonstrate the benefits and limitations of using spa-tial augmented reality in PMU and DMU registrated setups (seeSection 9.6).
7. For the key property, natural user interfaces research is carriedout on a novel scalable, markerless full-body tracking systemis presented and analyzed with respect to its tracking perfor-mance (see Section 7.7).
Additionally, further research contributions are the state of the artanalyses and the demonstration of a VMS’s framework implementa-tion.

6V R / A R A S S E M B LY VA L I D AT I O N
Assembly validation software enables production planning depart-ments to simulate mid-level to low-level production processes in thevirtual domain. In their literature review, Cecil and Kanachanapiboon[123] distinguish between two major categories in virtual prototyp-ing, namely virtual product design and manufacturing validation.For virtual manufacturing validation, the sub-categories of factory-level simulation, lower-level machining processes and virtual proto-typing of assembly processes can be clustered. This chapter focuseson the latter sub-category, by presenting deficiencies in the literatureand an implementation of this type of software for the automotivesector.
Ideally, planning and validation software should be integrated ina way that eliminates the need for data transfer and manual prepa-ration when using the validation software components. CommercialCAD-based validation software is offered for various domains in themanufacturing industry, such as logistics simulation, line balancingsimulation and robot simulation as well as manual final assemblysimulation. This leads to a versatile environment of multiple commer-cially available validation tools, each having differing main scopeswith overlapping capabilities.
This chapter provides insights into human-computer interactionand production engineering research aspects concerning assemblyvalidation tools in the context of the VMS. The VMS framework is thecentral component for driving virtual and mixed reality virtual pro-totyping build-ups of upcoming products. The VMS framework’s keyproperties (see Section 5.2) must be enabled by the assembly valida-tion software in order to achieve the overall VMS requirements. In thischapter the following research questions are answered:
• What requirements exist for virtual validation of manual assem-bly tasks?
• What are the deficiencies of current commercial products?
• What does an assembly simulation tool look like that supportsthe key properties of the VMS?
• What data is required to generate a holistic virtual manual as-sembly line?
• How does VR support simulation capabilities and how can man-ual assembly processes be validated using VR?
81

82 vr/ar assembly validation
• How can operators determine and quantify their overall spatio-temporal limitations of their VR assembly simulation?
For this doctoral thesis, the baseline has been defined based onthe contextual inquiry study (see Chapter 4). Current automotivePV workshops are carried out in two ways: either entirely hardware-based build-ups or sporadic DMU build-ups in static virtual environ-ments. PMU-based workshops cannot have all product and part vari-ants physically available as there are too many combinatory possi-bilities of upcoming products. Physical assessments are increasinglyreplaced by virtual assessments as fewer or no PMUs are availablein production preparation phases. DMU-based assessments currentlyuse a PDM viewer only. This means that no interaction is carried outwith the virtual prototype besides changing the visibility of parts inthe manufacturing sequence. Moreover, no additional components be-sides the product itself are included, such as factory environments,tooling, interactive DHM, screwdrivers and others (compare intentionof virtual prototyping in [123]).
This chapter first describes objectives of assembly validation soft-ware in the context of the VMS with a focus on VR assembly assess-ments. Next, the deficiencies of commercial state of the art validationsoftware are discussed, followed by implementation details of a novelvalidation software program. This VR/AR assembly simulation soft-ware represents the core simulation software for the VMS. First andforemost, its purpose is to enable virtual prototyping and interac-tive production validation of manual assembly processes. In contrastto planning tools, the software limits the scope to the assessment ofmanual assembly processes that support the VMS key properties anduses all its hardware capabilities. It is thus a decision-making tool,not a planning tool for generating additional production planningcontents. Batch assessments, fast rendering capabilities, standardizedinterfaces for AR/VR and fast data preparation must be enabled. Atthe end of this chapter, a VR assembly assessment score (VR2A) isproposed and evaluated to create a standardized, open benchmarkfor VR assembly assessments. Its goal is to quantify the overall sys-tem’s performance and limitations when carrying out assembly tasksin VR.
6.1 simulation software objectives 83
Research and Development context
The validation software and simulation framework presentedwere developed as part of the publicly funded German BMBFresearch project "ARVIDA" and were then integrated into areal PV application. The virtual prototyping software discussedhere has been implemented by "Daimler Protics." Personal con-tributions to this software are requirements engineering, tech-nical concepts, technical specifications, exploitation, dissemina-tion to provide a productive simulation software program. Pas-sages of the following chapter have been already published in"A Virtual Reality Assembly Assessment Benchmark for Mea-suring VR Performance & Limitations” [124]. Texts have beenextended and revised.
6.1 simulation software objectives
For automotive PV workshops, interactive virtual prototyping soft-ware must allow production engineers to assess as many mid- andlow-level verification aspects as possible (see Section 3.3.5). Mid-levelmanufacturing virtual prototypes comprise "exploring process designissues within a work cell, [. . . ], human operators, material handlingdevices [and] conveyors" [123] in order to virtually study "the interac-tions of these various components" [123], so that "process alternativescan be compared and modified" [123]. Low-level validations compriseoptimizations related to detailed analyses, such as "design of fixtures"[123]. Therefore, four main purposes are derived as follows:
First, the simulation software must be able to perform a holisticsimulation of mid-level manual assembly workstations includingall product, process and resource relevant items. The virtual car as-sembly simulation must inherit as many details as possible, includingfactory data, resource data, human data and many more. Users in PV
workshops must be provided with all details required to assess theirown verification criteria (see Section 3.3.5), e.g. process quality, prod-uct data quality and economic aspects such as reduction of waste andtime, process efficiency at all workstations and overall assembly linebalancing. In order to reach all these aspects virtually, multiple datasources must be fused in the assembly validation scene.
Second, the key properties of the VMS’s collaborative virtual envi-ronment must be enabled by the assessment software (see Section 5.2).All hardware components proposed in the context of the VMS mustbe supported natively. Following that, collaborative assessments inworkshop situations are a central requirement for the validation soft-ware. Standardized tracking components must also be integrated inthe software as well as original size visualization capabilities on large-scale output devices.
84 vr/ar assembly validation
Third, efficient simulation model generation must be made pos-sible. State-of-the-art commercial tools require high authoring effort(e.g. see Manns and Nestor for DHM animation effort [125]) for gen-erating such simulation models, especially for the simulation of anentire assembly line. Choi et al. call for "techniques that enable han-dling the whole factory at an instance, analyze it rapidly, and pro-vide speedy feedback to the shop floor" [126]. Most commerciallyavailable simulation software components focus on the assessment ofsingle workstations with critical contents, whereas in PV workshopsbatch simulation of entire assembly lines must be made possible. Forexample, in PV workshops not only one ergonomically critical work-station must be assessed but in one PV workshop hundreds of work-stations containing all work contents must be assessed with as littledata preparation effort as possible. Even though this issue has beenthe focus of many studies (compare Graf et al. [127]), it remains to besolved.
Finally, intuitive user interfaces are required to reduce entry barri-ers for operators and attendants. Operators must currently undergorigorous training so that they can build the VEs, navigate in the vir-tual space, assemble the vehicle virtually, meet the assessment needsof the workshop participants and enable VR assessments. All theserequired skills can be simplified by means of user-centric assemblyvalidation software.
6.2 state-of-the-art commercial validation tools
This section discusses drawbacks of current, commercially availablevalidation software in accordance with the findings of the preliminaryexpert interviews (see Chapter 4). This state-of-the-art analysis hasbeen carried out in 2016.
The market offers a variety of manufacturing planning and valida-tion tools for industrial assembly tasks. They vary greatly in theirscope but have overlapping capabilities as well. Commercial CAD-based validation software is offered for various domains in the man-ufacturing industry, such as intra-logistics simulation, line balancingsimulation, path planning simulation, robot simulation, ergonomicssimulation process optimization as well as manual final assembly sim-ulation.
State-of-the-art commercial tools can be clustered in productionplanning tools and production validation tools. Often, the scope be-tween planning and validation tools is differentiated even thoughboth aspects are integrated. Typical representative planning tools are"IPO.plan" by IPO.Log, "Delmia Process Engineer" by Dassault Sys-tems, "Process Designer" by Siemens, "AssembySuite" by Taktiq andothers. They are natively generated for the initial planning of de-tailed production processes and for balancing the workload in con-
6.2 state-of-the-art commercial validation tools 85
tinuous flow line production. Dedicated assembly assessment simu-lation tools are "IC.IDO" by ESI, "Process Simulate" by Siemens and"Editor Menschlicher Arbeit" by IMK. "Delmia" by Dassault Systemscan be used for both tasks planning and validation.
However, multiple clusters of general deficiencies reveal why com-mercially available tools can hardly be applied in automotive PV work-shops and the VMS. The following clusters describe the most impor-tant challenges:
Deficiencies in visualization systems: Even though graphics cardsand computing power are continuously improving for desktop com-puting systems, real-time rendering of massive data sets continues tobe a problem for desktop validation tools. In 2015 Choi et al. statedthat the "development of 3D expression technology for manufactur-ing ‘big data’ is required" [126]. Volume independent rendering oflarge datasets is a basic requirement for instantaneous switching be-tween virtual prototypes. Since production engineers are responsiblefor manual assembly tasks, they must interact with 3D representa-tions of both the product and the resource. For this reason, huge datavolumes must be visualized at interactive frame rates. A minimum re-fresh rate of 30 Hz must be reached for powerwall visualization, andideally a 90 Hz rendering refresh rate for VR applications, for fluentrendering and reduction of cybersickness (compare [128]). Typically,the tessellated 3D geometry of a complete summary automotive prod-uct car geometry is 30 to 50 gigabytes of data with 10 to 100 millionvertices and faces. This is an area of ongoing research as documentedin the "Visualization as a Service" approach [129] by Karl and Behr in2017.
Novel techniques for the lossless rendering of arbitrarily large 3Ddata sets are visibility-guided rendering technologies (see 3DInterac-tive [130]) and other volume independent render systems (see NetAl-lied [131]). Large 3D product geometry must be visualized in realtimewhere ideally "render performance is essentially independent of datavolume". High performance renderers allow the visualization of large-scale models with over 100 gigabytes of data on standard notebooksand PCs. Interaction can be implemented for these renderers, suchas the picking of objects, position, animation or change of appear-ance. Scene-graphs can be built on engineering data structure or canbe rearranged in object tree browsers with millions of objects. Mostrecent approaches allow for efficient server-sided rendering such as"visualization as a service" by Fraunhofer IGD, also called webVis/In-stant 3D Hub [132]. These approaches are now increasingly used inthe automotive industry [129] and allow the efficient streaming ofpre-rendered, lossy models, but currently do not comprise any assess-ment features and interactive features required for PV workshops.
From a practical point of view, PV workshops require that all CAD
data of a product be shown simultaneously – the so called summary
86 vr/ar assembly validation
product – in order to assess all variants of a product at the same time.In a slightly different way, the instantaneous switch in rendering be-tween multiple product variants (e.g. Coupé to Hatchback) must bepossible without any loading times. Lossy or reduced rendering ofmodels is not acceptable for PV workshops as participants need to seethe parts exactly as they are modeled. Since DMU geometry inheritsmultiple "layers," it must be possible to switch the visibility of eachlayer on and off. Data conversion steps must be avoided or at leastbe carried out on-the-fly during the run-time of the assembly valida-tion software. This is not the case with most commercially availablesoftware tools.
Deficiencies in batch assessment features: Efficient PV workshopsmust be enabled by the assembly assessment software through the fa-cilitation of batch assessments. Commercial products focus on singleworkstation simulations not optimized for the batch assessment ofworkstations. This leads to the requirement that the build-up of theentire product can be achieved with one pre-generated VE showingthe build-up as close to reality as possible.
Deficiencies in interactive features: The overall goal is to visual-ize the entire production process in a dynamic environment. Suchdynamic product build-ups include kinematics of the product and re-sources, e.g. rotation axes of the doors, hood or translatory kinematicsfor the marriage resources, which are applied from beneath the carbody. When attaching this generic tracking information to products,DHMs or resources, many new use cases can be enabled, such as fullbody tracking, hand tracking and object tracking. With these capabil-ities, the simulation software can be used for the interactive simula-tion of screw driver insertion paths, attachment of sub-assemblies totrackers, visibility analyses using tracked views and many more. VR
support is still limited in the field of assembly simulation software,even though research has on potential solutions and their benefits hasbeen conducted for several decades [26, 74].
Deficiencies in digital human modelling: In addition to generalinteractive deficiencies in commercial validation software, digital hu-man models and their animation are sometimes either completelyunavailable or only have limited manipulation features such as pro-prietary protocols. Therefore, digital human modeling must be ad-dressed in a standardized manner to allow the integration of newtracking devices. Forward and inverse retargeting algorithms must beintegrated and the number of joints in the skeleton must be preciseenough for full body tracking, including hands tracking. Avatars andskeletal parameters must be changeable during run-time. In addition,population databases for workers would be beneficial. Both onlineand offline animation must be enabled so that the simulation can bereplayed after a workshop ends. Sometimes only parts of the DHM
must be animated. Therefore, dedicated body parts must be driven
6.2 state-of-the-art commercial validation tools 87
separately, such as lower body and upper body. For example, whilethe lower body is in a static position, the upper body moves interac-tively. Another example is setting a pre-defined hand posture, whilethe rest of the DHM is tracked online. These features are not yet com-mercially available in "out of the box" virtual prototyping tools.
Deficiencies in automotive DMU product build-up: Because as-sessment simulation software can be used generically in the man-ufacturing industry, "out of the box" they lack specific features forautomotive manual final assembly: Data integration of DMU and tex-tual manufacturing process plans, realization of pre-assembly cellsin precedence tree, showing the car manufacturing state at a givenworkstation with one click, geometric mapping of moving product ina DMU assembly line, and the matching of tasks and products on dif-ferent hierarchical levels. Additionally, for automotive manual finalassembly easy adjustments of work heights, rotation of products inC-hangers, assessment of walking paths and the usage of parametriccell layouts are usually not included in commercially available assem-bly validation software.
Deficiencies in standardized interfaces and resource databases:Research into standardized exchange formats for manual assemblytask processes, CAD data and resource data carried out by researchinstitutes and OEMs on the "AutomationML" standardization board(see [133]) is ongoing. In addition, support of open protocols is pro-vided by means of assembly paths, online tracking devices and kine-matics. OEMs have compiled comprehensiv resource databases thatthey intend to use in virtual environments. However, generic assem-bly validation tools often do not have import functionalities for thesedatabases since they do not have any previous knowledge on thisproprietary information. Using the commercial tools, all resourcesmust be imported separately as a singular resource item. Batch assess-ments must be able to import entire resource databases at once, suchas a screw-driver database, tooling database, assist devices database,point cloud scans of factories and part annotation databases, such asscrews, clips, nuts and bolt databases.
Deficiencies in the VMS key properties: None of the commercialassessment validation tools offer ways to natively drive the VMS’shardware. For enabling the VMS’s key properties, the software needsto render multiple asymmetric views (Exo & Ego perspectives, VR,AR and powerwall) as well as original size orthographic bird’s eyeviews for floor visualization, original size orthographic side viewsfor powerwall visualization and must have standardized interfacesfor augmented reality hardware.
Overall, this leads to the conclusion that a novel virtual prototypingsoftware program is required which eliminates the drawbacks of com-mercially available tools mentioned above. In 2015 Choi et al. statedin their literature review on virtual reality applications in industrial
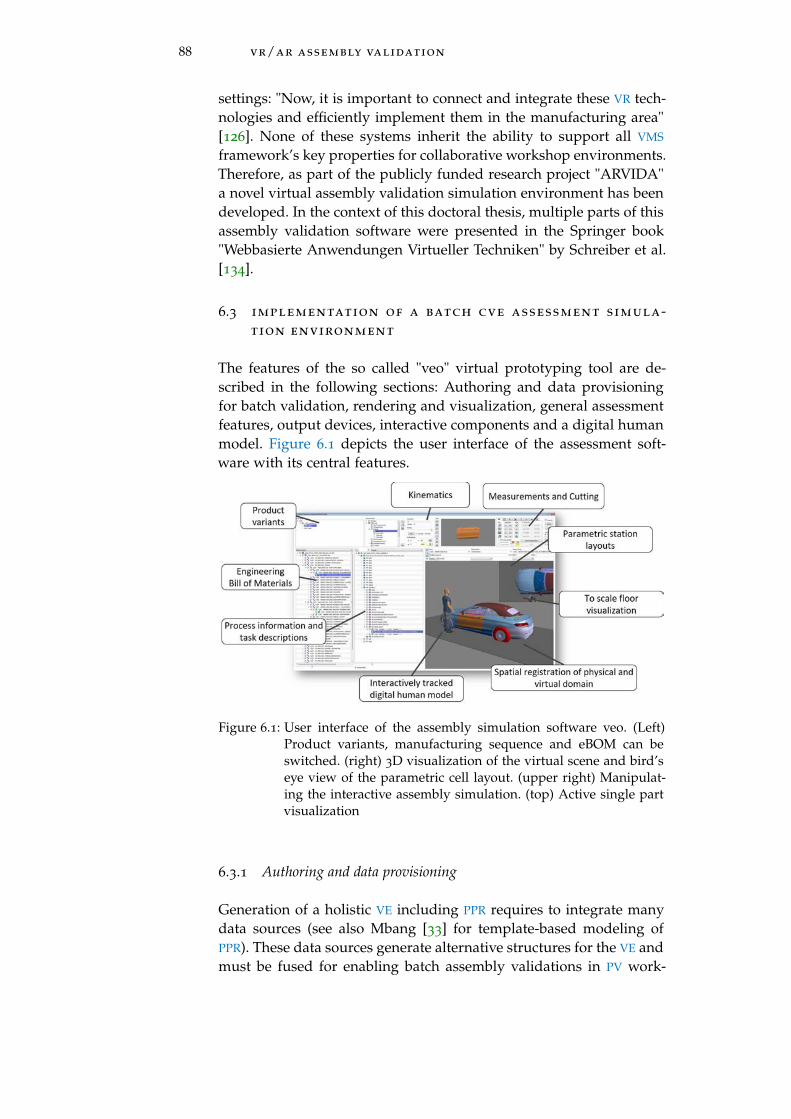
88 vr/ar assembly validation
settings: "Now, it is important to connect and integrate these VR tech-nologies and efficiently implement them in the manufacturing area"[126]. None of these systems inherit the ability to support all VMS
framework’s key properties for collaborative workshop environments.Therefore, as part of the publicly funded research project "ARVIDA"a novel virtual assembly validation simulation environment has beendeveloped. In the context of this doctoral thesis, multiple parts of thisassembly validation software were presented in the Springer book"Webbasierte Anwendungen Virtueller Techniken" by Schreiber et al.[134].
6.3 implementation of a batch cve assessment simula-tion environment
The features of the so called "veo" virtual prototyping tool are de-scribed in the following sections: Authoring and data provisioningfor batch validation, rendering and visualization, general assessmentfeatures, output devices, interactive components and a digital humanmodel. Figure 6.1 depicts the user interface of the assessment soft-ware with its central features.
Figure 6.1: User interface of the assembly simulation software veo. (Left)Product variants, manufacturing sequence and eBOM can beswitched. (right) 3D visualization of the virtual scene and bird’seye view of the parametric cell layout. (upper right) Manipulat-ing the interactive assembly simulation. (top) Active single partvisualization
6.3.1 Authoring and data provisioning
Generation of a holistic VE including PPR requires to integrate manydata sources (see also Mbang [33] for template-based modeling ofPPR). These data sources generate alternative structures for the VE andmust be fused for enabling batch assembly validations in PV work-
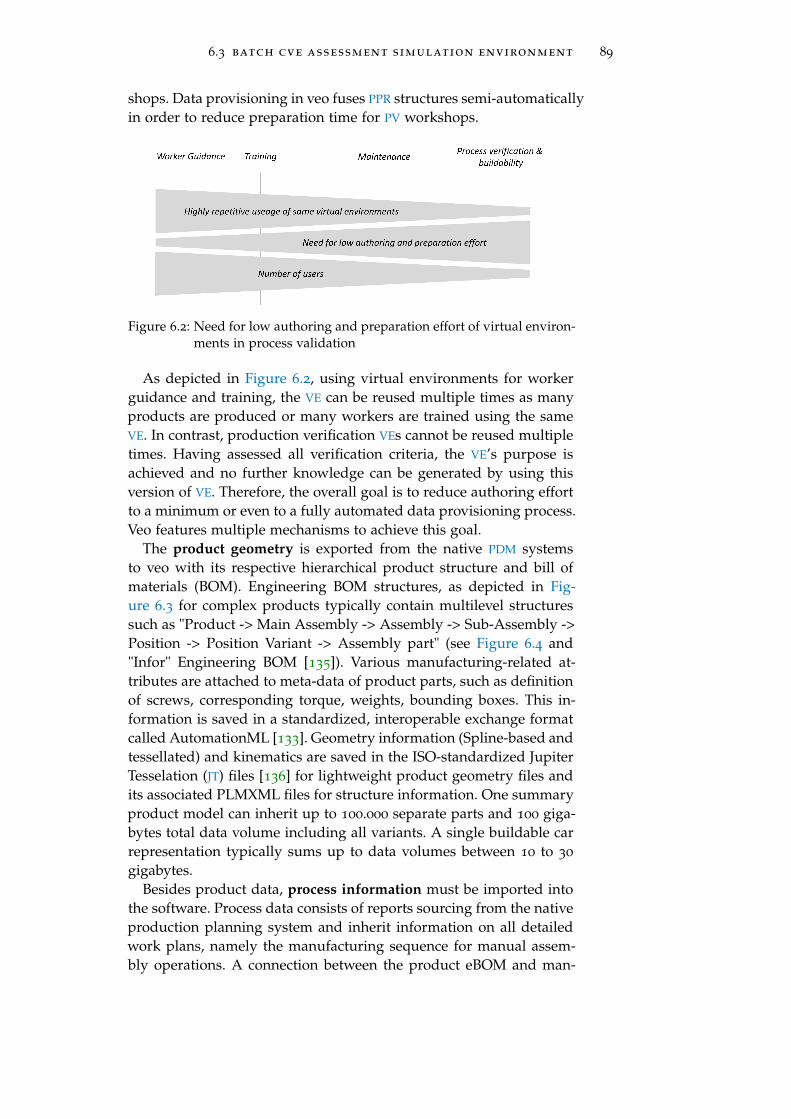
6.3 batch cve assessment simulation environment 89
shops. Data provisioning in veo fuses PPR structures semi-automaticallyin order to reduce preparation time for PV workshops.
Figure 6.2: Need for low authoring and preparation effort of virtual environ-ments in process validation
As depicted in Figure 6.2, using virtual environments for workerguidance and training, the VE can be reused multiple times as manyproducts are produced or many workers are trained using the sameVE. In contrast, production verification VEs cannot be reused multipletimes. Having assessed all verification criteria, the VE’s purpose isachieved and no further knowledge can be generated by using thisversion of VE. Therefore, the overall goal is to reduce authoring effortto a minimum or even to a fully automated data provisioning process.Veo features multiple mechanisms to achieve this goal.
The product geometry is exported from the native PDM systemsto veo with its respective hierarchical product structure and bill ofmaterials (BOM). Engineering BOM structures, as depicted in Fig-ure 6.3 for complex products typically contain multilevel structuressuch as "Product -> Main Assembly -> Assembly -> Sub-Assembly ->Position -> Position Variant -> Assembly part" (see Figure 6.4 and"Infor" Engineering BOM [135]). Various manufacturing-related at-tributes are attached to meta-data of product parts, such as definitionof screws, corresponding torque, weights, bounding boxes. This in-formation is saved in a standardized, interoperable exchange formatcalled AutomationML [133]. Geometry information (Spline-based andtessellated) and kinematics are saved in the ISO-standardized JupiterTesselation (JT) files [136] for lightweight product geometry files andits associated PLMXML files for structure information. One summaryproduct model can inherit up to 100.000 separate parts and 100 giga-bytes total data volume including all variants. A single buildable carrepresentation typically sums up to data volumes between 10 to 30
gigabytes.Besides product data, process information must be imported into
the software. Process data consists of reports sourcing from the nativeproduction planning system and inherit information on all detailedwork plans, namely the manufacturing sequence for manual assem-bly operations. A connection between the product eBOM and man-
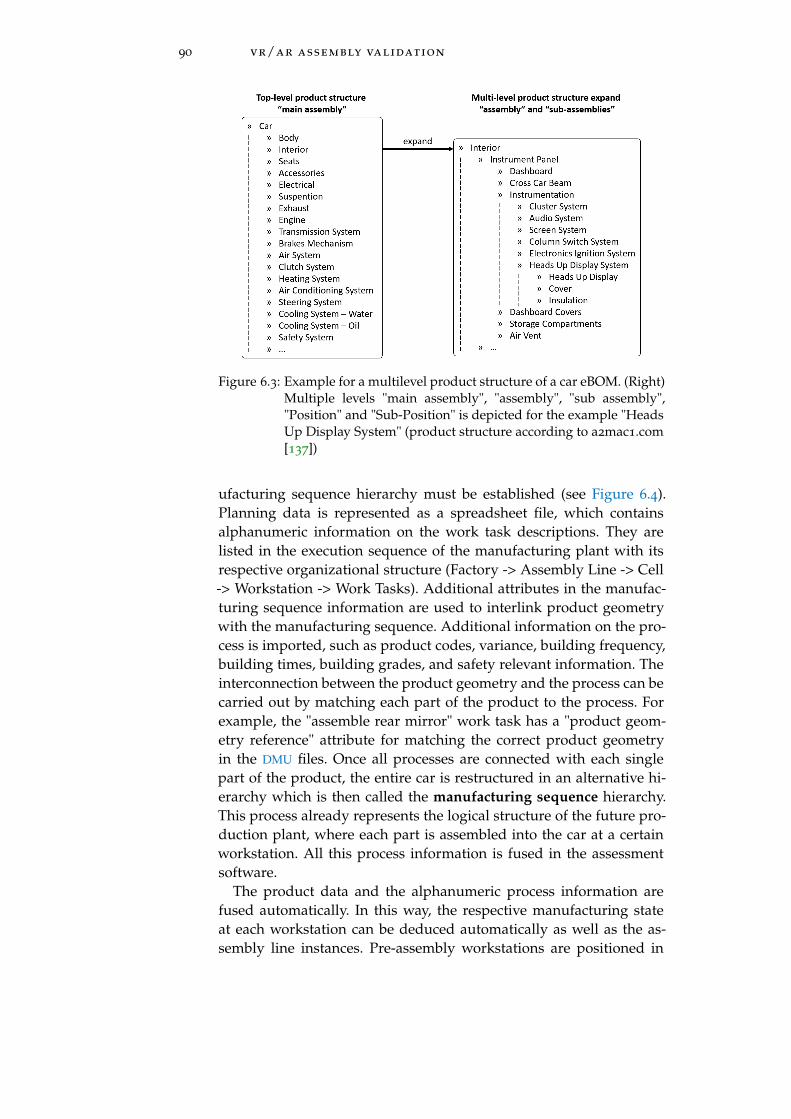
90 vr/ar assembly validation
Figure 6.3: Example for a multilevel product structure of a car eBOM. (Right)Multiple levels "main assembly", "assembly", "sub assembly","Position" and "Sub-Position" is depicted for the example "HeadsUp Display System" (product structure according to a2mac1.com[137])
ufacturing sequence hierarchy must be established (see Figure 6.4).Planning data is represented as a spreadsheet file, which containsalphanumeric information on the work task descriptions. They arelisted in the execution sequence of the manufacturing plant with itsrespective organizational structure (Factory -> Assembly Line -> Cell-> Workstation -> Work Tasks). Additional attributes in the manufac-turing sequence information are used to interlink product geometrywith the manufacturing sequence. Additional information on the pro-cess is imported, such as product codes, variance, building frequency,building times, building grades, and safety relevant information. Theinterconnection between the product geometry and the process can becarried out by matching each part of the product to the process. Forexample, the "assemble rear mirror" work task has a "product geom-etry reference" attribute for matching the correct product geometryin the DMU files. Once all processes are connected with each singlepart of the product, the entire car is restructured in an alternative hi-erarchy which is then called the manufacturing sequence hierarchy.This process already represents the logical structure of the future pro-duction plant, where each part is assembled into the car at a certainworkstation. All this process information is fused in the assessmentsoftware.
The product data and the alphanumeric process information arefused automatically. In this way, the respective manufacturing stateat each workstation can be deduced automatically as well as the as-sembly line instances. Pre-assembly workstations are positioned in

6.3 batch cve assessment simulation environment 91
Figure 6.4: Interconnection between product BOM, manufacturing sequencehierarchy and work task descriptions
the assembly tree, where the pre-assembled parts are delivered to themain assembly line according to the "herringbone principle."
Figure 6.5: Schematic import and data fusion process to crate a scene for thevirtual assessment software
To obtain a holistic view of the workstation, DMUs of additionaltools and utilities are required, such as racks, carriers, garbage boxes,screwdrivers databases, specialized tools and handling devices. Thesedatabases are imported and labeled as such, as shown in Figure 6.5.
Furthermore, if additional DMUs of the factory are available, entireplant or factory layouts can be imported. Factory 3D data can be rep-resented as point cloud scans [138] or meshed 3D factory data. Thisdata is integrated in the VE to obtain a better idea of what the work-station will look like in the future. A typical example for a validationtask using this plant data is checking restricted areas such as evac-uation routes that might collide with the future workstation. Recentresearch focuses on the integration of large-volume point cloud scansinstead of CAD models for the same kind of use cases (see Gong etal. [138], Lindskog [139], Shellshear, Berlin & Carlson [140]). In con-trast to static CAD geometry or static scans, standardized paramet-ric cell layouts can be imported as well. Parametric cell layouts areused to keep the VE more flexible so that quick changes can be made

92 vr/ar assembly validation
throughout the validation workshop. For example, racks shelves canbe modified in terms of height, angle, amount and type, whereas ina CAD geometry this is not easily possible. Such parametric layoutdata also inherit information on cell size, workstation size, walkingpaths, no-go areas, racks, carriers, cartridges, picking zones and mostimportantly the interconnection with the product structure. The posi-tion of a product in a parametric cell layout can thus be visualized in arack (beginning position) and after assembly in the car (end position).The data sources must be geometrically aligned in the virtual plantby determining the transformation. Especially for VR assessments aplausible cell layout as a background is required to generate a feelingof presence in the scene. Standardized 3D import geometry formatsare JT, OBJ or STL.
6.3.2 Rendering and visualization
Rendering speed is a crucial aspect for virtual prototyping with DMU.A minimum refresh rate of 30 Hertz is required, and for immersiveoutput visualizations a rate of at least 90 Hertz is necessary for botheyes to achieve a convincing interactive manipulation of the environ-ment (compare [128]).
DMU models with up to 100 gigabytes of data must be visualizedat those interactive speeds. In contrast to the gaming industry, whereobjects are reduced and optimized for the hardware platforms, in-dustrial applications cannot manually optimize the product to lowerpolygon counts. The applied real-time renderer [141] is called "visibil-ity guided renderer"(VGR) for large datasets made by 3Dinteractive."Typically for extremely huge CAD data (>100 million polygons) morethan 99% of data is excluded from rendering" [142]. This renderingplatform is intended "for interactive handling of massive data sets."It was initially presented to face the "data explosion" problem in CAD
data for "automotive, aerospace and construction models" [143]. Theyoffer volume independent rendering capabilities so that the entirecar with all variant geometries and all additional information can berendered with interactive speeds. Therefore the volume independentrendering offers various culling techniques, such as occlusion culling[144] (only visualize the top-most visible layers) and frustum cullingtechniques. Visibility guided rendering identifies non-visible objectsduring run-time to exclude them from the rasterization process andtherefore achieves constantly high rendering rates. When index struc-tures are applied, the time required for calculation "rises significantlyless than linearly with the data volume" and "for certain model sizesthe calculation effort is almost independent from the object data vol-ume" [142].
When the DMU is imported into the software, the material is set tonon-specular material and diffuse material color is applied from the
6.3 batch cve assessment simulation environment 93
standardized color table. For this reason, the product does not lookphoto realistic but the parts are clearly distinguishable. Veo allows forthe visualization of all product variants (summary product), enginesand gearbox variations at the same time, including the entire factoryenvironment.
Hence, in multi-user environments stakeholders want to use indi-vidual output components while sharing the same physical space andthe same virtual environment. Distributed rendering thus ensures thescalability of the collaborative virtual environment for asymmetricviews. Each output, for instance each VR output and high resolutionpowerwall, is rendered on a dedicated workstation. The scene graphis synchronized via a network between multiple veo instances.
Standard usage of veo has two high resolution rendering views.The main rendering view shows the product in its respective manu-facturing state with the complete surroundings. A second renderingview displays the currently selected, single assembly part visualiza-tion. According to the actual work tasks in the batch assessment, thedetails of this single product can be assessed. For example, this viewcan be used to cross validate whether the corresponding work taskdescription matches the geometrical fixtures.
6.3.3 Assessment-related features
Veo allows the visualization of entire summary products and code-derived buildable products. Summary products are not buildable inthe physical domain but enable planners to compare all DMU variantssimultaneously. For instance, 10 different front bumpers can be visu-alized at the same time to get an understanding of the same fixtureconcepts. So called code rules derive single buildable products froma summary DMU. Instant switching between preprocessed summaryproducts and single buildable products is an essential feature in veo.
In PV workshops, a specific product is built up in the respectivemanufacturing sequence of the upcoming factory. Veo follows thisapproach in the virtual domain as well and enables the visualizationof each product’s manufacturing state for the respective workstationswith one click. Validating such a manufacturing sequence of a singlebuildable car allows problems such as sequence issues to be resolvedby altering the process information. An example here is an alreadyinstalled part blocking the assembly of a subsequent one. In this case,the manufacturing sequence would have to be changed.
Comparing multiple buildable products can be cumbersome sincethe combinatorics of assembly parts are high. Therefore the productcomparison feature allows colors to be assigned to each product. Inthis way, production engineers can easily distinguish product differ-ences in the manufacturing sequence structure, work task descriptionlist and of course in the DMU rendering view. For example, products
94 vr/ar assembly validation
with 12V components are coded red and products with 48V compo-nents are coded green.
The product structure itself does not resemble a geometric neigh-borhood but represents a logical structure. That is why an additionalstructure element is available in veo, namely components. Compo-nents are used to create an alternative structure for geometric neigh-borhood elements. For instance, all parts belonging to the left frontdoor should be clustered logically when kinematics are defined forthe left front door. Respective parts of this left front door are spreadall across the eBOM structure. Electrical parts, chassis parts and coverparts are all added to one component called "Front door left" in thecomponent alternative hierarchy. These components are used to in-stantly switch the visibility of the whole component, to set compo-nents to semi-transparent and to define the kinematics of the compo-nent.
These kinematics are assigned to component structures. In veo sim-ple kinematics are practical approximations of what are often morecomplex kinematics. Linear and rotary translations can be attachedto each component so that the doors, motor hood, rear door and ad-ditional machinery can be animated. For example, when simulating amarriage of the drivetrain components, the mech frame can be easilyanimated by means of linear animation.
Alphanumeric work task descriptions are filtered and displayedin a list view according to the current respective manufacturing stateor eBOM selection. One summary car contains up to 50,000 work taskdescriptions, whereas a single work cell can have up to 50 alphanu-meric work tasks. In the authoring stage, product and process struc-tures become interconnected. Workshop participants can display allcorresponding work tasks that come with a selected part or a selectedworkstation. The list of work task descriptions is filtered accordingly.
Cross-highlighting between PPR structures is one of the most fre-quently applied features. Selections made in one of the PPR structureswill lead to a (multi-)selection in both other corresponding structures.For example, when selecting a work task description, the linked as-sembly parts are highlighted in the overall car manufacturing state,or when selecting a whole cell in manufacturing sequence, all assem-bly parts that belong to this cell are visualized separately and high-lighted. Meanwhile, the selected assembly part is also visualized inthe single parts rendering window. A cross-highlighting functionalityshows this specific connection. The same holds for selections in theeBOM structure and the manufacturing sequence structure.
Another essential feature is the animation of product and assem-bly part trajectories in relation to the factory environment. The heightof the product can be transformed relative to the floor and the angleof the floor in order to permit reachability and visibility studies. Dif-ferent types of skids (work height differences) can be simulated easily

6.3 batch cve assessment simulation environment 95
using this feature. Given a certain cycle time and length for each cell,the dynamic visualization of product structures is made possible. Inthe case of a parametric cell layout, start transformation (assemblypart in carrier) and end transformation (manufactured state) of an as-sembly part are defined. A linear transformation between both pointsis visualized for a better understanding of the processes. The assem-bly parts thus fly into the car "step by step" just as the manufacturingsequence describes the process. However, this animation does not in-clude collision avoidance and path planning.
Search functionalities are given for all PPR structures. With thou-sands of objects in the summary PPR structure, a full text searchmakes it possible to find items. Results are clustered by object typeand selected in the hierarchy they are found in.
For detailed assessments, DMUs can be sliced and cut. Especiallyin cluttered environments, detail assessments are important for prod-uct optimizations. The same is true for measurement possibly. Point,linear, circular and volumetric measurements are possible using veo.
Having assessed all verification criteria for each workstation, multi-ple outputs are generated such as tracking lists, verification KPIs andscreenshots of revealed issues. A screenshot functionality automat-ically fuses alphanumeric information about the selected assemblyparts with the manufacturing state rendering window.
6.3.4 3D rendering features
Three different rendering windows are integrated for the visualiza-tion of the same VE: Integrated assessment view, assembly part detailview and orthographic bird’s eye view. All render views can be ren-dered on custom screen resolutions and on distributed workstations.In the integrated assessment view, the selected assembly part can becentered using the "fly-to functionality".
The integrated assessment rendering visualizes all imported com-ponents: Product, processes, factory layouts, tooling and machines.There is global ambient illumination combined with a headlight at-tached to the virtual camera with an offset of 50cm to the top rightfor better shading. The color of product parts is determined by theproduct itself. No textures are applied to the products and randomcolors are used to distinguish the parts.
The assembly part rendering displays the selected assembly partsor multiple selected assembly parts only. This helps to identify thepart structure itself. It can be either selected by product structureparts or manufacturing sequence parts. Illumination, color and shad-ing are the same as in the rendering window mentioned above.
The bird’s-eye view rendering has been tailored for floor visual-ization devices supporting the augmented floor surface described inChapter 8. This rendering window uses an orthographic virtual cam-
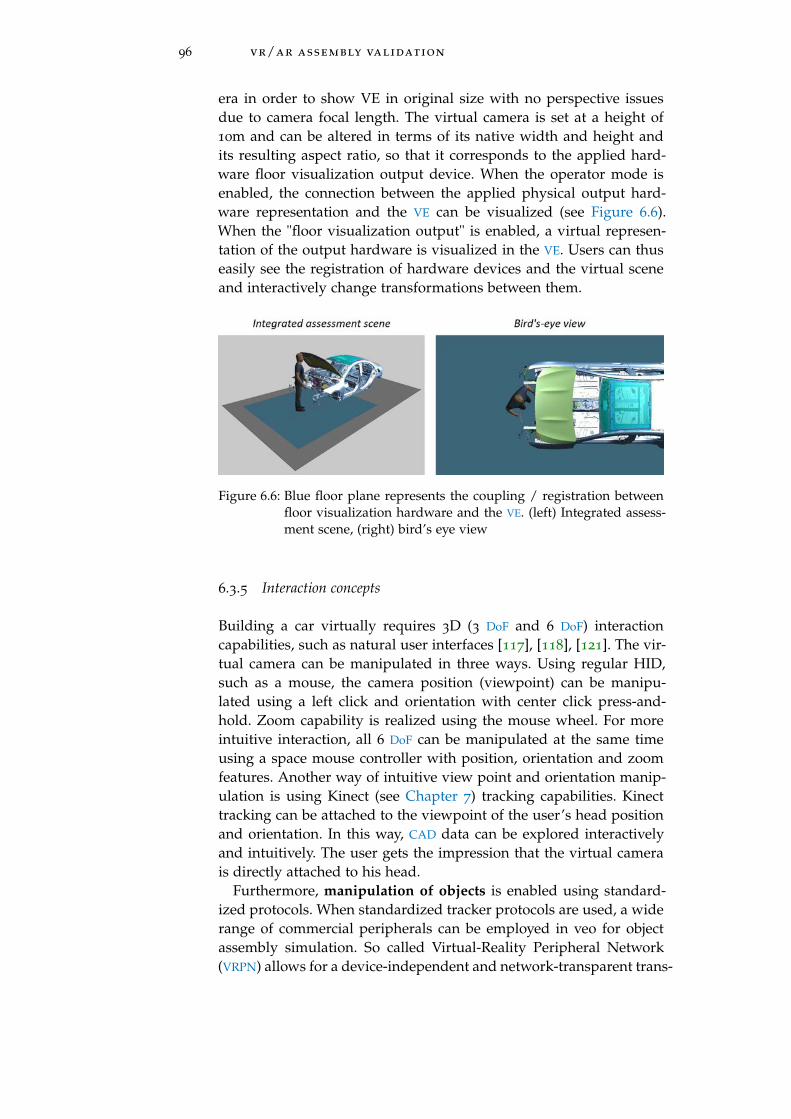
96 vr/ar assembly validation
era in order to show VE in original size with no perspective issuesdue to camera focal length. The virtual camera is set at a height of10m and can be altered in terms of its native width and height andits resulting aspect ratio, so that it corresponds to the applied hard-ware floor visualization output device. When the operator mode isenabled, the connection between the applied physical output hard-ware representation and the VE can be visualized (see Figure 6.6).When the "floor visualization output" is enabled, a virtual represen-tation of the output hardware is visualized in the VE. Users can thuseasily see the registration of hardware devices and the virtual sceneand interactively change transformations between them.
Figure 6.6: Blue floor plane represents the coupling / registration betweenfloor visualization hardware and the VE. (left) Integrated assess-ment scene, (right) bird’s eye view
6.3.5 Interaction concepts
Building a car virtually requires 3D (3 DoF and 6 DoF) interactioncapabilities, such as natural user interfaces [117], [118], [121]. The vir-tual camera can be manipulated in three ways. Using regular HID,such as a mouse, the camera position (viewpoint) can be manipu-lated using a left click and orientation with center click press-and-hold. Zoom capability is realized using the mouse wheel. For moreintuitive interaction, all 6 DoF can be manipulated at the same timeusing a space mouse controller with position, orientation and zoomfeatures. Another way of intuitive view point and orientation manip-ulation is using Kinect (see Chapter 7) tracking capabilities. Kinecttracking can be attached to the viewpoint of the user’s head positionand orientation. In this way, CAD data can be explored interactivelyand intuitively. The user gets the impression that the virtual camerais directly attached to his head.
Furthermore, manipulation of objects is enabled using standard-ized protocols. When standardized tracker protocols are used, a widerange of commercial peripherals can be employed in veo for objectassembly simulation. So called Virtual-Reality Peripheral Network(VRPN) allows for a device-independent and network-transparent trans-
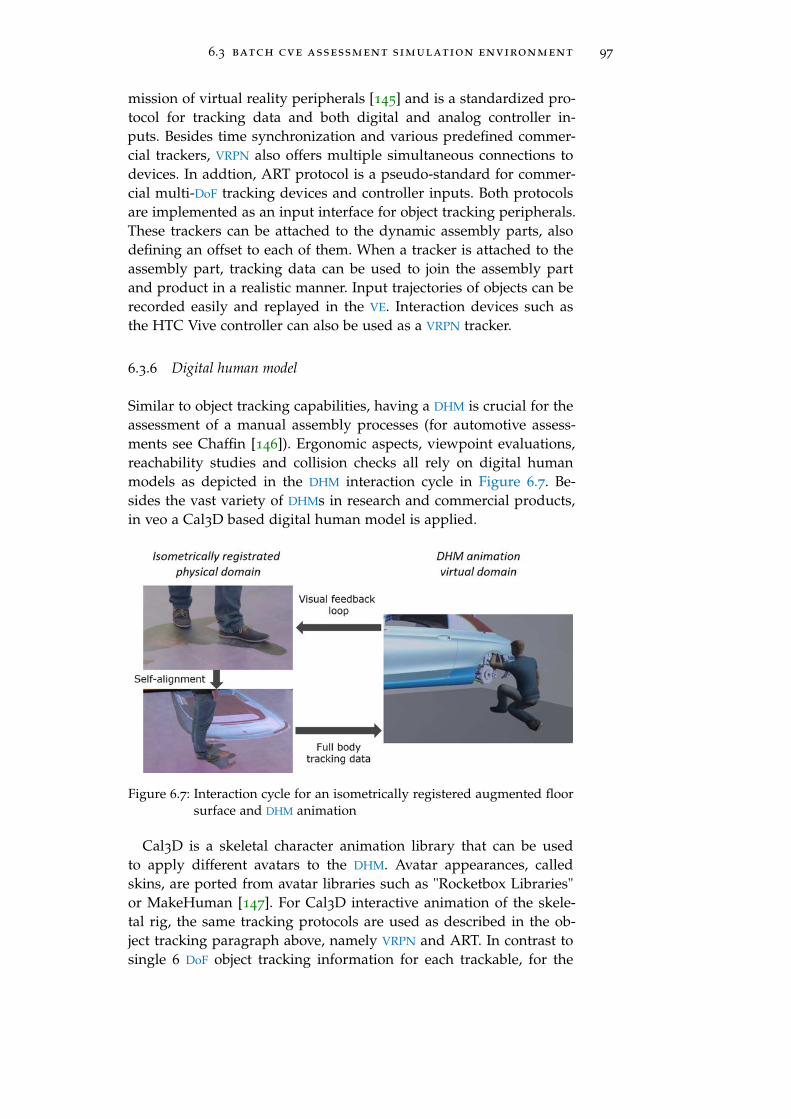
6.3 batch cve assessment simulation environment 97
mission of virtual reality peripherals [145] and is a standardized pro-tocol for tracking data and both digital and analog controller in-puts. Besides time synchronization and various predefined commer-cial trackers, VRPN also offers multiple simultaneous connections todevices. In addtion, ART protocol is a pseudo-standard for commer-cial multi-DoF tracking devices and controller inputs. Both protocolsare implemented as an input interface for object tracking peripherals.These trackers can be attached to the dynamic assembly parts, alsodefining an offset to each of them. When a tracker is attached to theassembly part, tracking data can be used to join the assembly partand product in a realistic manner. Input trajectories of objects can berecorded easily and replayed in the VE. Interaction devices such asthe HTC Vive controller can also be used as a VRPN tracker.
6.3.6 Digital human model
Similar to object tracking capabilities, having a DHM is crucial for theassessment of a manual assembly processes (for automotive assess-ments see Chaffin [146]). Ergonomic aspects, viewpoint evaluations,reachability studies and collision checks all rely on digital humanmodels as depicted in the DHM interaction cycle in Figure 6.7. Be-sides the vast variety of DHMs in research and commercial products,in veo a Cal3D based digital human model is applied.
Figure 6.7: Interaction cycle for an isometrically registered augmented floorsurface and DHM animation
Cal3D is a skeletal character animation library that can be usedto apply different avatars to the DHM. Avatar appearances, calledskins, are ported from avatar libraries such as "Rocketbox Libraries"or MakeHuman [147]. For Cal3D interactive animation of the skele-tal rig, the same tracking protocols are used as described in the ob-ject tracking paragraph above, namely VRPN and ART. In contrast tosingle 6 DoF object tracking information for each trackable, for the
98 vr/ar assembly validation
transmission of human skeletal information each VRPN channel typi-cally contains 18 to 77 data sets, each with 6 DoF tracking information.Each item of 6 DoF information contains a translation of a joint. Thisinformation is applied directly to the skeletal character. Using VRPN
to stream all of the skeletal tracking information results in a fluentskeletal DHM animation.
H-Anim 200x or "Humanoid Animation" [148] is an ISO/IEC FCD19774 standardized way of describing humanoid animation. Thisstandard describes three levels of articulation and nominal body di-mensions for a DHM skeleton. Cal3D uses "level of articulation" oneresulting in 18 joints without manipulation of fingers, whereas whenfusing finger tracking information, level two is applied with 71 artic-ulated joints. Not necessarily all joints must be set by the trackingdevice as a subset of joints may be transmitted only. For example,Kinect V2 skeletal information delivers 21 positions - most of themcontaining orientation information (see Section 7.3.4). The mappingof tracking information onto a skeleton is called targeting, whereasmapping from one skeleton to another is called retargeting. This lossyregistration process tries to reduce the overall error rate by adjustinglengths of the segments and mapping joint angles properly on theresulting skeleton.
With this DHM, two different full body motion capture systems areintegrated, namely both ART Body and Kinect V2 skeletal tracking.In addition, leap motion finger tracking can be fused onto the fullbody trackers, which extends the full body skeletal tracking data toinclude finger tracking data.
Veo DHM allows the end effector of the human to be manipulatedby selecting the hand and manipulating it using a space mouse in3D. Inverse kinematics allows stretching and bending of the upperarm and upper body according to the required position. In contrastto more sophisticated inverse kinematics, this feature can be usedfor quick reachability assessments (compare other simplified inversekinematic approaches [149].
For the assessment of different anthropometrics, the avatar can bealtered using a population library. Body height and individual seg-ment lengths of the DHM can be set, so that reachability studies withdifferent character proportions can be assessed. Additionally, multi-worker processes can be interactively simulated by inserting up to sixDHMs. Even though standardized tracking protocols allow the trans-mission of additional annotation data besides the skeletal trackingdata, no re-identification of tracked persons is implemented (com-pare markerless user identification using body lengths by Hayashi etal. [150]). Therefore, the DHM avatars are assigned to the tracking datain the order of appearance.
6.3 batch cve assessment simulation environment 99
6.3.7 Virtual reality implementation and user interface
Virtual reality using head mounted displays has been researched forseveral decades [151]. VR implementations in the manufacturing in-dustry must serve an overall purpose, such as higher quality vali-dation results [79] or shorter task completion times. In general, VR
allows users to be immersed [152] in the VE and can generate thesensation of presence in the virtual environment. Nevertheless, this isnot a sufficient reason for utilizing VR in the manufacturing industry.
Veo enables virtual reality assembly validation and is optimized forusage with the "HTC Vive Pro" HMD hardware. Using VR, the overallgoal is to achieve better planning quality, as the whole assembly pro-cess can be interactively validated. Typical examples of interactiveVR optimization aspects are packaging, visibility, assemblability, pro-duction ergonomics, process quality, process efficiency, logistics, walkpaths and many more.
In VR, the operator performs the entire assembly task accordingto the process plans, from picking the virtual assembly part out ofthe carrier, boxes and racks, carrying it to its geometric destination,assembling it in the product and, if required, using a virtual tool suchas a screw-driver. The car is rendered in its respective manufacturingstate. At the beginning of each cycle time, assembly parts of this cellare located in the racks and carriers. The car continuously movesat a constant speed on the virtual assembly line through the virtualcell. This provides operators with useful insights into the geometriccircumstances in the workstation, the overall process flow and theupcoming product. For example, situations with bad visibility, badergonomics or too narrow clearances can be revealed.
The non-VR workshop participants can observe the VR user’s ac-tivities from a third-person perspective on additional renderings. Allparticipants are able to follow the assembly procedure. This repre-sents a collaborative, co-located asymmetric output situation (also seeGugenheimer et al. with ShareVR [111]).
6.3.8 VR user interface
Just like the veo desktop UI, the entire assembly simulation operationcan be controlled inside the VR environment as well. The operatorsets VR user’s height to the corresponding body height once at thebeginning. The hands of the DHM are geometrically attached to thecontrollers to allow self embodiment of the VR users. When both DHM
"full body tracking" and VR are activated at the same time, the VR con-troller positions overwrite the left and right arm tracking information,due to the higher tracking accuracy of the controllers.
Assembly parts are defined as dynamic objects and can be grabbedby approaching the virtual object with a controller and then picking
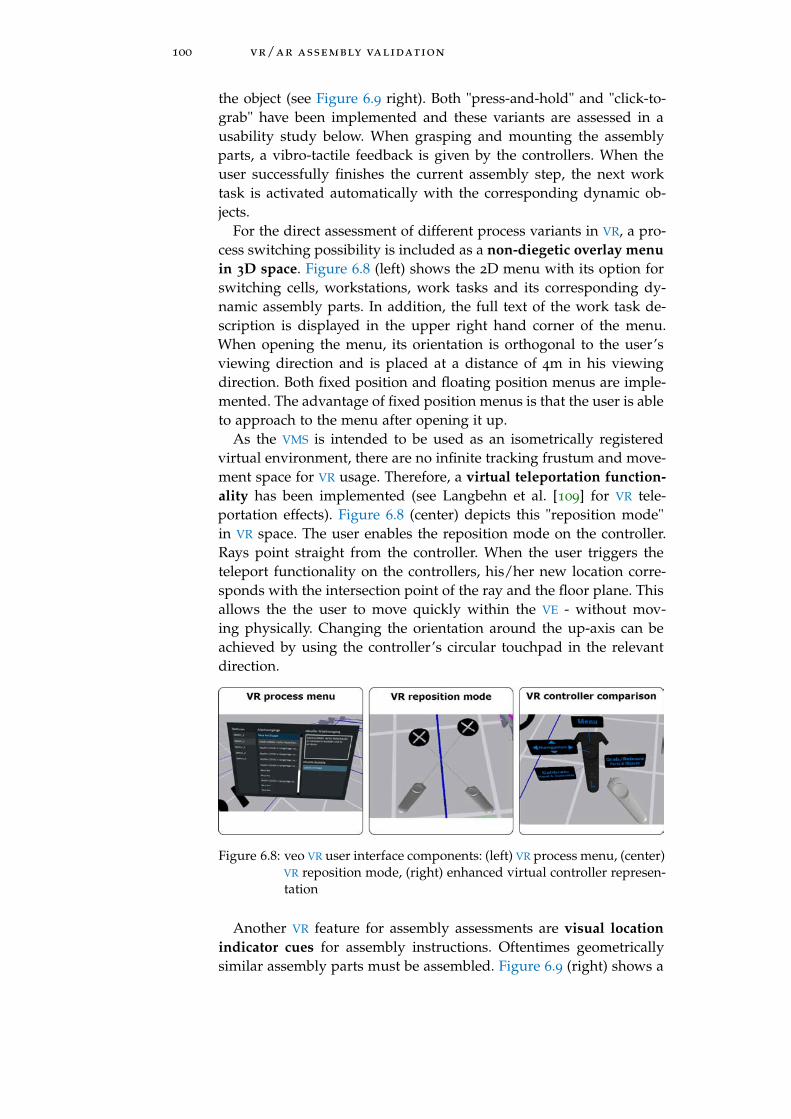
100 vr/ar assembly validation
the object (see Figure 6.9 right). Both "press-and-hold" and "click-to-grab" have been implemented and these variants are assessed in ausability study below. When grasping and mounting the assemblyparts, a vibro-tactile feedback is given by the controllers. When theuser successfully finishes the current assembly step, the next worktask is activated automatically with the corresponding dynamic ob-jects.
For the direct assessment of different process variants in VR, a pro-cess switching possibility is included as a non-diegetic overlay menuin 3D space. Figure 6.8 (left) shows the 2D menu with its option forswitching cells, workstations, work tasks and its corresponding dy-namic assembly parts. In addition, the full text of the work task de-scription is displayed in the upper right hand corner of the menu.When opening the menu, its orientation is orthogonal to the user’sviewing direction and is placed at a distance of 4m in his viewingdirection. Both fixed position and floating position menus are imple-mented. The advantage of fixed position menus is that the user is ableto approach to the menu after opening it up.
As the VMS is intended to be used as an isometrically registeredvirtual environment, there are no infinite tracking frustum and move-ment space for VR usage. Therefore, a virtual teleportation function-ality has been implemented (see Langbehn et al. [109] for VR tele-portation effects). Figure 6.8 (center) depicts this "reposition mode"in VR space. The user enables the reposition mode on the controller.Rays point straight from the controller. When the user triggers theteleport functionality on the controllers, his/her new location corre-sponds with the intersection point of the ray and the floor plane. Thisallows the the user to move quickly within the VE - without mov-ing physically. Changing the orientation around the up-axis can beachieved by using the controller’s circular touchpad in the relevantdirection.
Figure 6.8: veo VR user interface components: (left) VR process menu, (center)VR reposition mode, (right) enhanced virtual controller represen-tation
Another VR feature for assembly assessments are visual locationindicator cues for assembly instructions. Oftentimes geometricallysimilar assembly parts must be assembled. Figure 6.9 (right) shows a
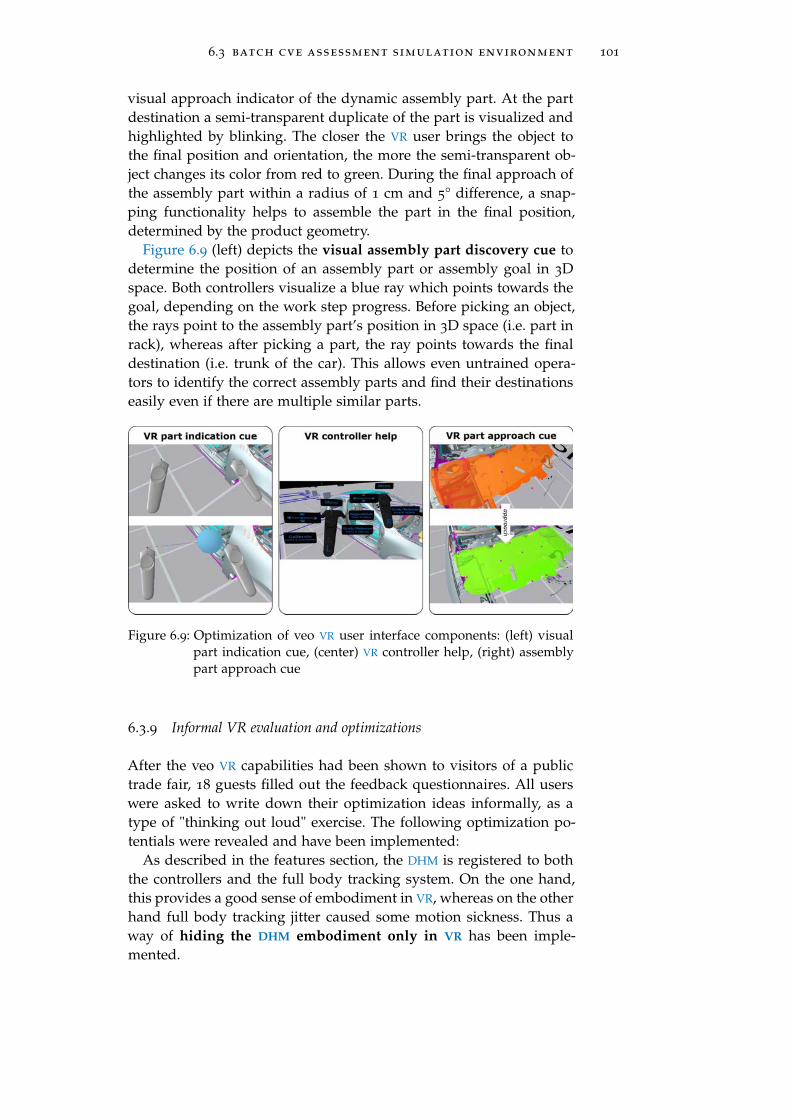
6.3 batch cve assessment simulation environment 101
visual approach indicator of the dynamic assembly part. At the partdestination a semi-transparent duplicate of the part is visualized andhighlighted by blinking. The closer the VR user brings the object tothe final position and orientation, the more the semi-transparent ob-ject changes its color from red to green. During the final approach ofthe assembly part within a radius of 1 cm and 5° difference, a snap-ping functionality helps to assemble the part in the final position,determined by the product geometry.
Figure 6.9 (left) depicts the visual assembly part discovery cue todetermine the position of an assembly part or assembly goal in 3Dspace. Both controllers visualize a blue ray which points towards thegoal, depending on the work step progress. Before picking an object,the rays point to the assembly part’s position in 3D space (i.e. part inrack), whereas after picking a part, the ray points towards the finaldestination (i.e. trunk of the car). This allows even untrained opera-tors to identify the correct assembly parts and find their destinationseasily even if there are multiple similar parts.
Figure 6.9: Optimization of veo VR user interface components: (left) visualpart indication cue, (center) VR controller help, (right) assemblypart approach cue
6.3.9 Informal VR evaluation and optimizations
After the veo VR capabilities had been shown to visitors of a publictrade fair, 18 guests filled out the feedback questionnaires. All userswere asked to write down their optimization ideas informally, as atype of "thinking out loud" exercise. The following optimization po-tentials were revealed and have been implemented:
As described in the features section, the DHM is registered to boththe controllers and the full body tracking system. On the one hand,this provides a good sense of embodiment in VR, whereas on the otherhand full body tracking jitter caused some motion sickness. Thus away of hiding the DHM embodiment only in VR has been imple-mented.
102 vr/ar assembly validation
Furthermore, an alternative representation of HTC vive controllershas been modeled. Figure 6.8 (right) shows the standard HTC viverepresentation, which corresponds to the physical controller as wellas the alternative model. This representation is helpful for a plausibleVR experience but the virtual origin is not made clear enough. Thisleads to confusion when gripping small assembly parts, with dimen-sions smaller than the controller dimensions. As a solution, the vivecontroller has been remodeled so that the lower parts still correspondto the physical geometry, whereas the upper parts clearly indicatethe virtual origin of the controller with an accurate point. The originsphere has a diameter of 1mm.
Novice VR users asked for a help functionality on the controllersas the functionalities were explained to new users once but they wereunable to remember all user interface components immediately. Thatis why virtual controller labeling has been added as a diegetic 3Dcontroller description. All button functionalities are described as 3Dlabels next to the controllers, as can be seen in Figure 6.9 (center),such as "Grab" on the trigger button, "calibrate" on the side button,"Menu" on the top button and "Navigation" on the touchpad. Texturesof the virtual controllers have been altered to help users distinguishbetween left and right controllers (see Figure 6.9 center).
Users also suggested optimizations for the VR process menu inter-face. Font size has been adapted to real data and the process menuplacement has been reduced to the fixed position variant, since thefloating position variant was opposed by all users due to limited HMD
resolution and blurriness in the edges of HMD.
6.4 virtual reality assembly assessment benchmark
[124] When VR is implemented in veo for PV use cases, immersion is notan end in itself but must be beneficial to the overall assessment goal.In the literature, immersion is described as one of the main advan-tages of VR, but for professional use of VR, users expect to achievetheir goals either with a higher quality or in a more efficient way.Multiple papers propose using VR for better immersion and betterspatio-temporal understanding of the upcoming production process(compare Bowman et al. [152]).
In this chapter the "VR assembly assessment" (VR2A) benchmarkis proposed as a unified experiment design, in order to quantify thepractical VR system’s performance without measuring the VR interac-tion cycle influence parameters. More precisely, VR2A measures theuser’s ability to visually assess the assemblability of the digital mock-up (DMU) with respect to two independent variables: Assembly partsizes and clearances. The user represents both the operator and theproduct assessor at the same time, just as in real PV workshop sit-
6.4 virtual reality assembly assessment benchmark 103
uations. VR2A measures whether production engineers can achievetheir assessment goals even with small parts and low clearances andhow small both may be.
6.4.1 State of the art
[124]Nowadays research presents many purpose driven VR applications,such as excitement in gaming [111], positive emotions for point of saleapplications [153], novel rehabilitation methods [154] in medicine,more effective learning in schools [155], [156] and of course VR in au-tomotive production. For the manufacturing industry, Zimmermannpresents a brief overview of VR use cases in his survey [157] as well asOttoson [158] throughout the product development process. Lawsonet al. discuss future directions of VR for automotive manufacturers ina survey of 11 engineers, which shows further VR development needs[159]. Berg and Vance present an overview of the application scenar-ios in product design and manufacturing [160]. Multiple academicpublications on VR in automotive production are presented in the fol-lowing topics: Production verification and maintenance (see Gomesde Sá and Zachmann [26]), training use cases [161], [162], product de-sign and packaging [160] and continuous improvement process [81].
All of these use cases share the same goal: They apply VR tech-nology for a better spatio-temporal understanding and immersive-ness for users. Basic VR research presents the effects immersion onbehavior in VEs and its effectiveness. Immersion creates a feeling ofpresence in the VE or of "being there" and is often described as "theoutcome of a good [gaming] experience" [163]. Jennett et al. have re-searched immersion experiences in games and found that immersioncan be measured both subjectively using questionnaires and objec-tively by measuring task completion time or eye movements [163].Interestingly, Ellis [164] doubts that presence might directly lead tobetter task performance, for instance when a more abstract view of anenvironment is required in flight control use cases, for achieving thegoal. Beforehand, Witmer et al. present the widely known "presencequestionnaire", which became a standard for measuring presence inVR [30] and is also applied in this study. Bowmann and McMahan ask,how much immersion is enough in VR [152] and give an overview onempirical studies which show that full immersion is not always nec-essary.
Overall, the literature does not include any uniform experiment de-sign as a benchmark for VR assembly assessments for quantifying theVR system’s limitations. Most closely, Funk et al. describe a uniformexperiment design as a benchmark for evaluating interactive instruc-tions using augmented reality for assembly tasks [165], which differsin the benchmark scope, since Funk et al. evaluate task completion
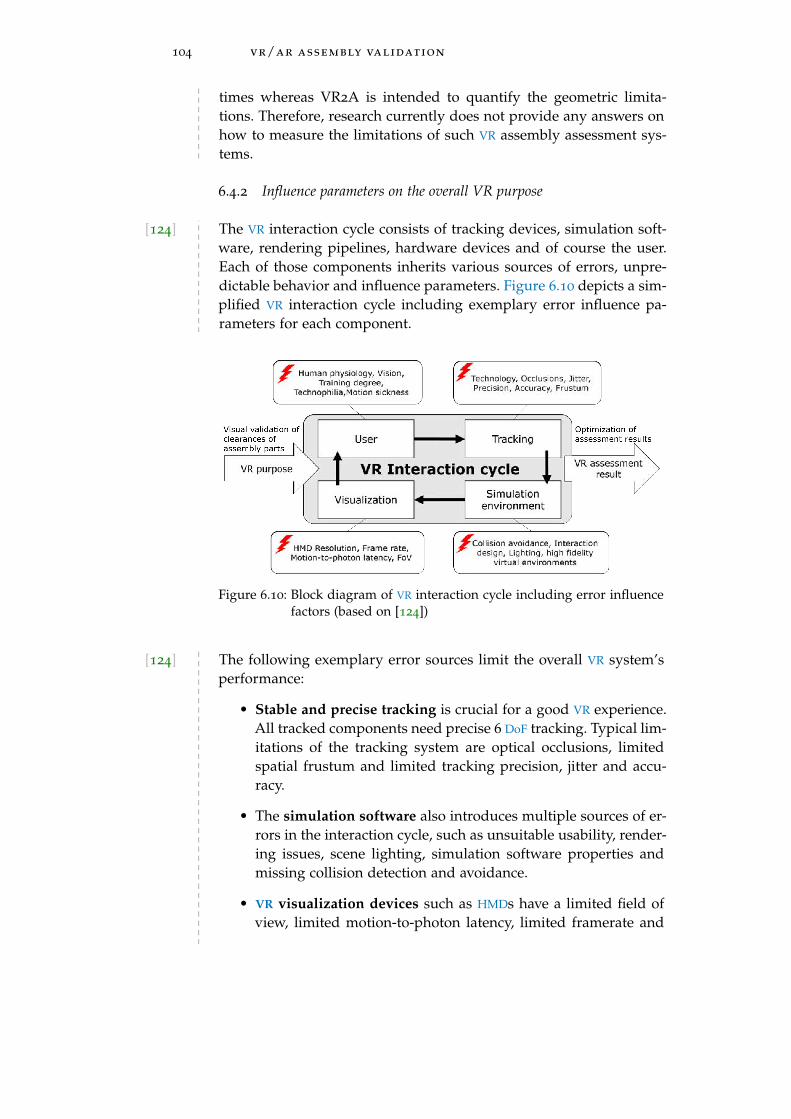
104 vr/ar assembly validation
times whereas VR2A is intended to quantify the geometric limita-tions. Therefore, research currently does not provide any answers onhow to measure the limitations of such VR assembly assessment sys-tems.
6.4.2 Influence parameters on the overall VR purpose
[124] The VR interaction cycle consists of tracking devices, simulation soft-ware, rendering pipelines, hardware devices and of course the user.Each of those components inherits various sources of errors, unpre-dictable behavior and influence parameters. Figure 6.10 depicts a sim-plified VR interaction cycle including exemplary error influence pa-rameters for each component.
Figure 6.10: Block diagram of VR interaction cycle including error influencefactors (based on [124])
[124] The following exemplary error sources limit the overall VR system’sperformance:
• Stable and precise tracking is crucial for a good VR experience.All tracked components need precise 6 DoF tracking. Typical lim-itations of the tracking system are optical occlusions, limitedspatial frustum and limited tracking precision, jitter and accu-racy.
• The simulation software also introduces multiple sources of er-rors in the interaction cycle, such as unsuitable usability, render-ing issues, scene lighting, simulation software properties andmissing collision detection and avoidance.
• VR visualization devices such as HMDs have a limited field ofview, limited motion-to-photon latency, limited framerate and
6.4 virtual reality assembly assessment benchmark 105
resolution. This is why visualization additionally induces errorsin the interaction cycle itself.
• Finally a major influencing factor on the overall system perfor-mance is the user himself/herself. For fulfilling the overall VR
simulation purpose, he/she must be able to interact with the en-tire system, which means the respective training degree can bea potential source of errors. Additionally, limitations in physiol-ogy, vision and perception in general will influence the overallVR assessment results, such as human tremble or uncorrectedvision.
As the above non-exhaustive list of errors shows, there are toomany influencing parameters to control every single one of them.Nevertheless, users are not interested in quantifying these VR sys-tem properties but want to know whether they can reach their VR as-sessment goals efficiently. That is why, from a production engineer’sperspective, each single error parameter presented in Figure 6.10 isless important than the overall VR system’s performance. The respec-tive error parameters in the interaction cycle can be regarded as ablack box with an overall limitation for reaching the assessment task.Therefore, when using a VR2A benchmark, the system is tested forits applicability towards its native purpose.
6.4.3 The VR2A benchmark
[124]VR2A is proposed as an open standardized experiment design for theevaluation of a VR system’s overall geometric limitations for assemblyassessment scenarios and is considered to be "quick and easy." TheVR2A scene is publicly accessible here: https://skfb.ly/6FQOV
Two parameters are varied in an abstract assembly task: Clearanceand assembly part sizes. By conducting the VR2A benchmark, theuser gains quantified insights into how small the assembly partsand clearances can be to still obtain reliable assembly assessment re-sults by production engineers. VR2A specifically abstracts all above-mentioned influencing and error parameters within the interactioncycle and only focuses on the assessment results relevant for assem-bly: Assessment of clearances and part size limitations.
[124]VR2A carries out an abstract assembly task, inspired by a kids’ gamecalled "shapes sorting toy" (see Figure 6.11). The virtual reality scenehas been published to set VR2A as a standard benchmark. As de-picted in Figure 6.12, within the virtual environment, there is a statictable, six static discs each with five cavities on a wall. As depicted inTable 6.1, six dynamic, graspable cubes are placed on a table.

106 vr/ar assembly validation
Figure 6.11: Overview on the standard experiment design of VR2A and thetwo independent variables: Size and clearance (based on [124])
Table 6.1: Description of cubes in VR2A benchmark
Cube Size Color
XXS 6.25 mm red
XS 12.5 mm orange
S 25 mm yellow
M 50 mm green
L 100 mm cyan
XL 200 mm blue
[124] All six discs are placed on the wall, which are rotated horizontallyand flipped at randomized angles. Each disc contains five cavitiescorresponding to the sizes of the cubes (see Figure 6.11). Each disc hasfive cavities at a size of 97%, 100%, 103%, 105% and 110% relativelyto the corresponding cube size (see Figure 6.11 bottom). For example,the XL disc’s 100% cavity exactly matches the size of the XL cube. TheL cube does not fit in the respective "97% L cavity", but the S cubedoes fit in the respective "103% S cavity."
The procedure of the benchmark has a straightforward design: Eachparticipant inserts all six cubes in each of the five corresponding cav-ities of the matching disc size. For example, the L cube must be as-sembled in all five L disc’s cavities in randomized order. Unlike theexperimenter, the user does not know the correct answer. Possibleanswers are "Fits in," "Does not fit in" and "I can’t assess it." The ex-perimenter tells the participant that the goal is not to insert the cube
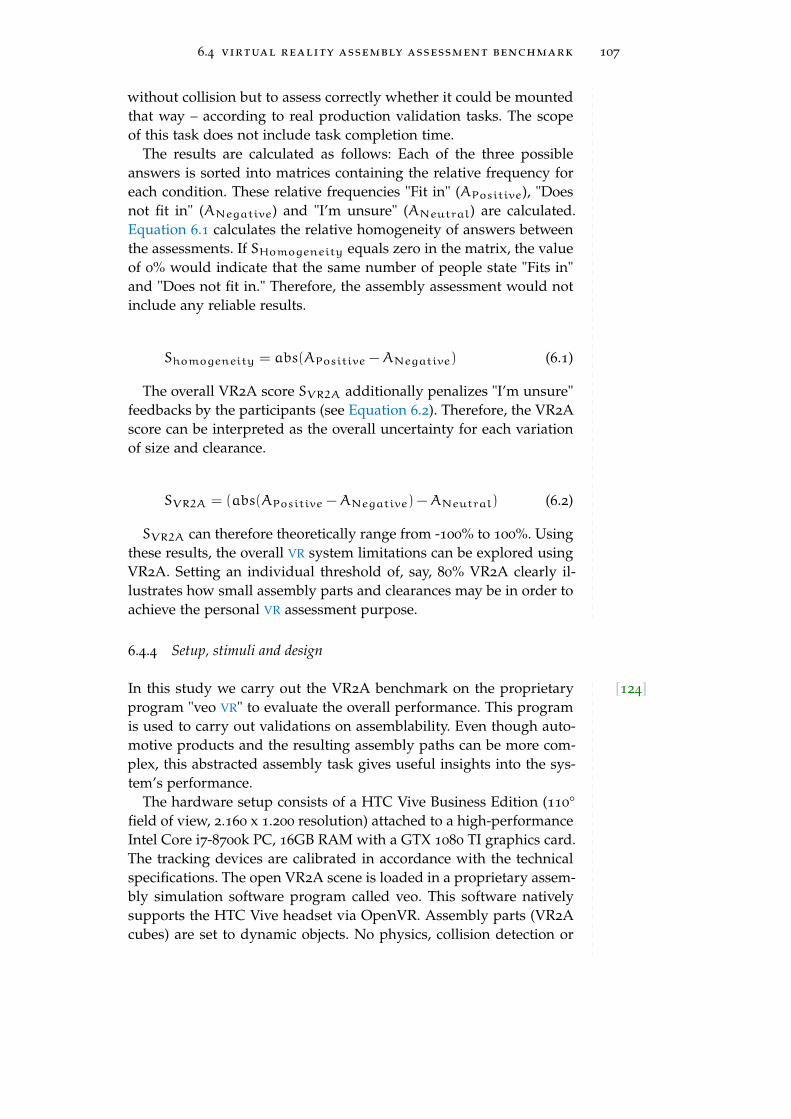
6.4 virtual reality assembly assessment benchmark 107
without collision but to assess correctly whether it could be mountedthat way – according to real production validation tasks. The scopeof this task does not include task completion time.
The results are calculated as follows: Each of the three possibleanswers is sorted into matrices containing the relative frequency foreach condition. These relative frequencies "Fit in" (APositive), "Doesnot fit in" (ANegative) and "I’m unsure" (ANeutral) are calculated.Equation 6.1 calculates the relative homogeneity of answers betweenthe assessments. If SHomogeneity equals zero in the matrix, the valueof 0% would indicate that the same number of people state "Fits in"and "Does not fit in." Therefore, the assembly assessment would notinclude any reliable results.
Shomogeneity = abs(APositive −ANegative) (6.1)
The overall VR2A score SVR2A additionally penalizes "I’m unsure"feedbacks by the participants (see Equation 6.2). Therefore, the VR2Ascore can be interpreted as the overall uncertainty for each variationof size and clearance.
SVR2A = (abs(APositive −ANegative) −ANeutral) (6.2)
SVR2A can therefore theoretically range from -100% to 100%. Usingthese results, the overall VR system limitations can be explored usingVR2A. Setting an individual threshold of, say, 80% VR2A clearly il-lustrates how small assembly parts and clearances may be in order toachieve the personal VR assessment purpose.
6.4.4 Setup, stimuli and design
[124]In this study we carry out the VR2A benchmark on the proprietaryprogram "veo VR" to evaluate the overall performance. This programis used to carry out validations on assemblability. Even though auto-motive products and the resulting assembly paths can be more com-plex, this abstracted assembly task gives useful insights into the sys-tem’s performance.
The hardware setup consists of a HTC Vive Business Edition (110°field of view, 2.160 x 1.200 resolution) attached to a high-performanceIntel Core i7-8700k PC, 16GB RAM with a GTX 1080 TI graphics card.The tracking devices are calibrated in accordance with the technicalspecifications. The open VR2A scene is loaded in a proprietary assem-bly simulation software program called veo. This software nativelysupports the HTC Vive headset via OpenVR. Assembly parts (VR2Acubes) are set to dynamic objects. No physics, collision detection or

108 vr/ar assembly validation
gravity are turned on during the evaluation. Participants use the HTCVive VR controller. Its virtual representation is visualized 1:1 but endsin a sharp cone as the root point to allow participants to performgrasping operations with the highest precision (see Figure 6.12 right).
Figure 6.12: (Left) Rendering of the open virtual environment with six differ-ently sized cubes. (Middle) Explanation of disc cavities relativeto the corresponding cube sizes, which are not visible to theuser. (Right) Controller with sharp grasping point (based on[124])
6.4.5 Participants and procedure
[124] For this study, 32 production validation workshop participants wereselected on a voluntary basis, such as research engineers, ergonomicsexperts, production engineers and students - all working for variousplanning departments in an automotive OEM company. This meansthat this study was carried out with the intended key users of thesystem. As users are an important performance factor in the VR inter-action cycle, the overall population within the study should representthe population of users, for example for PV workshops. They did notreceive any special rewards for taking part in this study. 24 male and8 female participants took participated, ranging in age from 18 to 51
years (M=28.2, SD=6.7). All participants reported normal to correctedvision.
The experiment consists of two parts, the VR2A experiment and afinal questionnaire. The experiment takes approximately 25 minutesper user, 10 minutes for the VR2A evaluation itself and 15 minutesto fill out the questionnaire. The experimenter describes the assemblytask in a standardized way. The participants are asked to familiarizethemselves with the VR environment, the controllers, the virtual sceneand the dynamic handling of the cubes by playing around with them.When the respective participant feels confident with manipulating thevirtual scene, he/she completes all 30 VR2A assembly tasks. Start-ing with the biggest cube (XL) and progressing to the the smallest(XXS), each cube must be inserted in all five corresponding cavities ofeach disc, but the experimenter randomizes the order of the cavities.
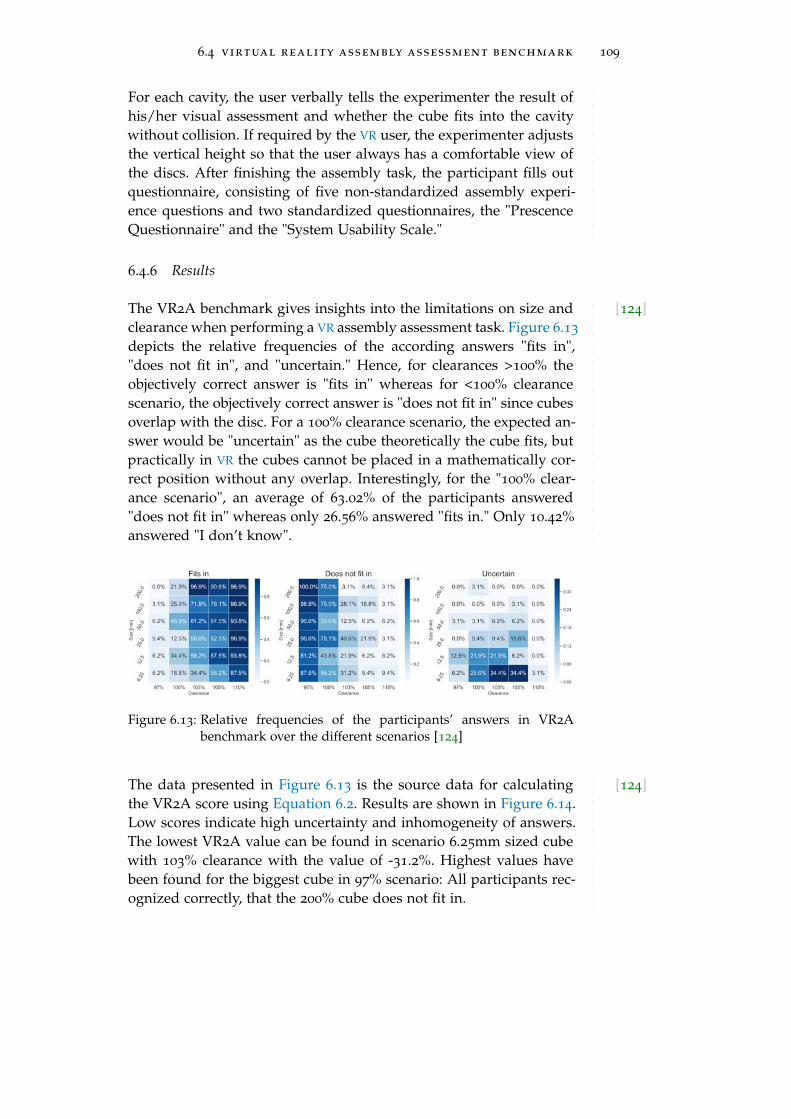
6.4 virtual reality assembly assessment benchmark 109
For each cavity, the user verbally tells the experimenter the result ofhis/her visual assessment and whether the cube fits into the cavitywithout collision. If required by the VR user, the experimenter adjuststhe vertical height so that the user always has a comfortable view ofthe discs. After finishing the assembly task, the participant fills outquestionnaire, consisting of five non-standardized assembly experi-ence questions and two standardized questionnaires, the "PrescenceQuestionnaire" and the "System Usability Scale."
6.4.6 Results
[124]The VR2A benchmark gives insights into the limitations on size andclearance when performing a VR assembly assessment task. Figure 6.13
depicts the relative frequencies of the according answers "fits in","does not fit in", and "uncertain." Hence, for clearances >100% theobjectively correct answer is "fits in" whereas for <100% clearancescenario, the objectively correct answer is "does not fit in" since cubesoverlap with the disc. For a 100% clearance scenario, the expected an-swer would be "uncertain" as the cube theoretically the cube fits, butpractically in VR the cubes cannot be placed in a mathematically cor-rect position without any overlap. Interestingly, for the "100% clear-ance scenario", an average of 63.02% of the participants answered"does not fit in" whereas only 26.56% answered "fits in." Only 10.42%answered "I don’t know".
Figure 6.13: Relative frequencies of the participants’ answers in VR2Abenchmark over the different scenarios [124]
[124]The data presented in Figure 6.13 is the source data for calculatingthe VR2A score using Equation 6.2. Results are shown in Figure 6.14.Low scores indicate high uncertainty and inhomogeneity of answers.The lowest VR2A value can be found in scenario 6.25mm sized cubewith 103% clearance with the value of -31.2%. Highest values havebeen found for the biggest cube in 97% scenario: All participants rec-ognized correctly, that the 200% cube does not fit in.

110 vr/ar assembly validation
Figure 6.14: Results of the VR assembly assessment score. Low values indi-cate high uncertainty or inhomogeneity of answers [124]
[124] Plotting the mean VR2A scores over one of the two independent vari-ables provides interesting insights into the assessment performanceof the participants. Figure 6.15 plots mean VR2A scores over the cubesizes in non-percentage values. One can clearly see that the VR2Apositively correlates with the size of the cubes, as indicated by the2nd polynomial regression. For a 6.25mm cube size the mean score isonly 28.75% whereas the 200 mm cube averages at 83.75%.
Figure 6.15: Mean VR2A score over size scenarios with the respective 2nd
polynomial regression [124]
[124] Figure 6.16 plots the mean VR2A results over the absolute clearancescenarios. Low mean VR2A scores can be found for the scenarios100% (26.04%), 103% (30.21%) and 105% (54.1%). For both the 97%
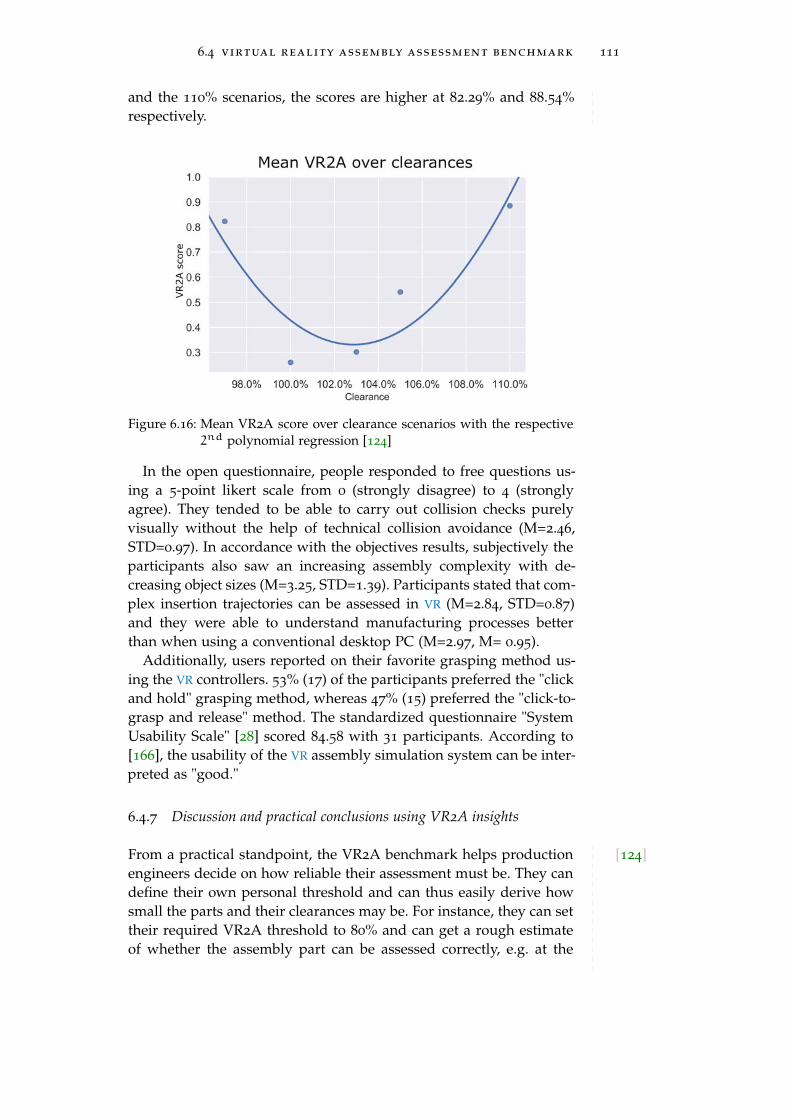
6.4 virtual reality assembly assessment benchmark 111
and the 110% scenarios, the scores are higher at 82.29% and 88.54%respectively.
Figure 6.16: Mean VR2A score over clearance scenarios with the respective2nd polynomial regression [124]
In the open questionnaire, people responded to free questions us-ing a 5-point likert scale from 0 (strongly disagree) to 4 (stronglyagree). They tended to be able to carry out collision checks purelyvisually without the help of technical collision avoidance (M=2.46,STD=0.97). In accordance with the objectives results, subjectively theparticipants also saw an increasing assembly complexity with de-creasing object sizes (M=3.25, STD=1.39). Participants stated that com-plex insertion trajectories can be assessed in VR (M=2.84, STD=0.87)and they were able to understand manufacturing processes betterthan when using a conventional desktop PC (M=2.97, M= 0.95).
Additionally, users reported on their favorite grasping method us-ing the VR controllers. 53% (17) of the participants preferred the "clickand hold" grasping method, whereas 47% (15) preferred the "click-to-grasp and release" method. The standardized questionnaire "SystemUsability Scale" [28] scored 84.58 with 31 participants. According to[166], the usability of the VR assembly simulation system can be inter-preted as "good."
6.4.7 Discussion and practical conclusions using VR2A insights
[124]From a practical standpoint, the VR2A benchmark helps productionengineers decide on how reliable their assessment must be. They candefine their own personal threshold and can thus easily derive howsmall the parts and their clearances may be. For instance, they can settheir required VR2A threshold to 80% and can get a rough estimateof whether the assembly part can be assessed correctly, e.g. at the
112 vr/ar assembly validation
150mm level or whether positive clearances should be bigger than110% (see Figure 6.15 and Figure 6.16). In contrast to robust partswith large clearances, the VR2A threshold can be set lower to 50%.
Results also indicate that the same negative clearance can be de-tected more easily compared to the same positive clearance. The meanVR assembly score for a 97% percent overlap performed a great dealbetter than the 103% clearances. Even when comparing 97% overlapto 110% clearance values, they performed almost identically in termsof mean VR assembly scores (see Figure 6.14). In general, the maxi-mum uncertainty was expected at no tolerance scenarios (100% clear-ance), whereas the 103% clearance cavity led to the overall smallestVR2A values.
Results indicate that even though participants are encouraged totell that "I can not assess it" is a valid answer, they still tend to give ajudgmental answer such as "fits in" or "does not fit in," even thoughthere is no clearance at all.
Subjective feedback from participants indicates potential reasonsfor these system limitations: Human tremble and resolution of VR
HMD: For the cube sizes XS (12.5mm) and XXS (6.25 mm), the vast ma-jority of participants started holding the VR controller in both handsto reduce human tremble. Tracking accuracy still seems to be morestable than human tremble for small cube sizes. Therefore, in thisevaluation human tremble is currently the limiting factor for improv-ing assessment performance (in comparison with HTC Vive precisionand accuracy also see Niehorster et al. [167]). Additionally, for thesmallest cube size (6.25 mm) all clearances are on a sub-millimeterscale. Even though participants could move their head as close tothe discs as necessary, the VR HMD resolution was mentioned as thesubjectively limiting factor.
On the other hand, four participants actively told the experimenterthat assessing large cubes is harder than small cubes due to the nec-essary big head movement for assessing clearances.
6.4.8 VR2A summary
In the "Virtual Reality Assembly Assessment," the (VR2A) bench-mark is a standardized open source experiment design to evaluatethe overall VR system’s assembly assessment performance and limita-tions.
[124] VR2A can be universally applied for different environments, simula-tion software and VR hardware devices. All experts are encouraged toassess their own assembly assessment system using the open sourceVR2A scene. This allows production engineers can gain practical in-sights into their next VR assembly assessment simulation. The evalu-ation showed that VR2A is a reliable benchmark for quantifying the
6.5 co-located pmus and dmus in vr assessments 113
overall assessment performance and for revealing its limitations in as-sembly. The use of VR2A in production validation in the automotiveand manufacturing industry makes validation results more reliable.
In the context of the VMS and veo as the central PV simulation soft-ware, in-depth insights can be obtained regarding how well the sys-tem performs in VR and where its limitations are.
6.5 co-located pmus and dmus in vr assessments
As presented in Section 5.2.1, the VMS’s key property "integration ofPMU and DMU" can be seen as realized by using the PV simulationsoftware "veo". Using tracking components in combination with theregistration steps of the VE and physical world, a holistic VR cell as-sessment with combined PMU and DMU can be realized. Figure 6.17
depicts a realization example of the key properties’ implementationwithin the VMS concept:
• Asymmetric visualization: PV workshop participants can choosewhether they want to use the simulation as an immersive HMD-based first person view (Figure 6.17 upper left) or as an exo-perspective of the whole scene (Figure 6.17 right).
• Markerless tracking: Via standardized, stateless protocols (seeARVIDA project report [94]) markerless object tracking informa-tion is externally polled (Figure 6.17 lower left) by FraunhoferIGD markerless object tracking. This 6 DoF tracking data is con-tinuously updated in the simulation environment. Additionally,fused full body motion capture data from the multi-kinect sys-tem (see Chapter 7) is polled via the same ARVIDA protocoland brought into the same world coordinate frame via a least-squares estimation of transformation parameters [168].
• PMU-DMU integration: For example, when registering the worldcoordinate systems of the VE, the VR tracking system and mark-erless object tracking system together, participants see the DMU
door in the HMD and can also feel haptic feedback from the PMU
door at the same time. When the PMU door is moved, the DMU
door in VR moves accordingly.
The usage of original size PMUs in VR scenes has multiple advan-tages for users:
1. Haptic and physics feedback: As physical items build a bar-rier, users cannot grasp through the PMU or through the DMU.Additionally, PMUs have a certain weight and therefore accelera-tions and velocities can be realistically transferred to the virtualdomain.

114 vr/ar assembly validation
Figure 6.17: Evaluation of a co-located VR experience combining a trackedPMU, markerless full body motion capture and an immersiveHMD view with 3D interaction devices referenced relatively tothe digital human
2. Tracking of the PMU allows for an intuitive manipulation ofthe VE. Users can simply rearrange PMUs in the physical domainand do not have to manipulate/teleport DMU components in thevirtual domain. Original size PMU representations can be seenas the ultimate tangible user interface (compare Tangible Bits byIshii [104]) for natural user interfaces.
3. Users can easily align themselves within the virtual domainsince it matches the relations in the physical domain as well.For example, when walking one step towards the door, usersexpect the virtual domain to behave in the same manner (seekey property original size in Section 5.2)
6.6 summary
In this chapter, multiple research interests have been considered. Adescription of the needs for batch assessment simulation software inPV workshops have been provided as well as a novel VR benchmark:
Insights have been presented on how the simulation of entire finalassembly lines can be realized. Multiple different data sources mustbe fused, such as CAD product data including product variants, prod-uct kinematics, manufacturing sequences, task assembly descriptions,cell layouts, factory CAD data and of course resources, tools and aux-iliaries. The outcome of the automated authoring process and the pre-sented assessment features allow the instantaneous batch simulationof hundreds of workstations.
Especially the rendering features of orthographic bird’s eye viewsgenerate the images needed for the LHRD floor visualization presentedin Chapter 8. An immersive user interfaces has been presented, so
6.6 summary 115
that an efficient overall factory simulation including all processes ismade possible in VR.
[124]Since accessible external research did not give a clear answer on theoverall limitations of VR systems to be applied in assembly assess-ment scenarios, a novel open source, standardized experiment designhas been proposed, the so called "virtual reality assembly assessment"(VR2A). This benchmark is useful for understanding the overall VR
system’s limitations for assessment scenarios. Evaluation results us-ing VR2A showed a correlation between product size and assess-ment quality. Hence, the evaluation also showed that for the sameclearances, overlaps (negative clearance) can be detected more reli-ably than positive clearances. For the VR2A benchmark, additionalresearch must be carried out on the effects of more complex assemblypart geometries, for example balls, stars, triangles or screw-shaped ge-ometries, and other parameters, such as task-completion time. Third-party researchers are encouraged to conduct the VR2A benchmarkthemselves.

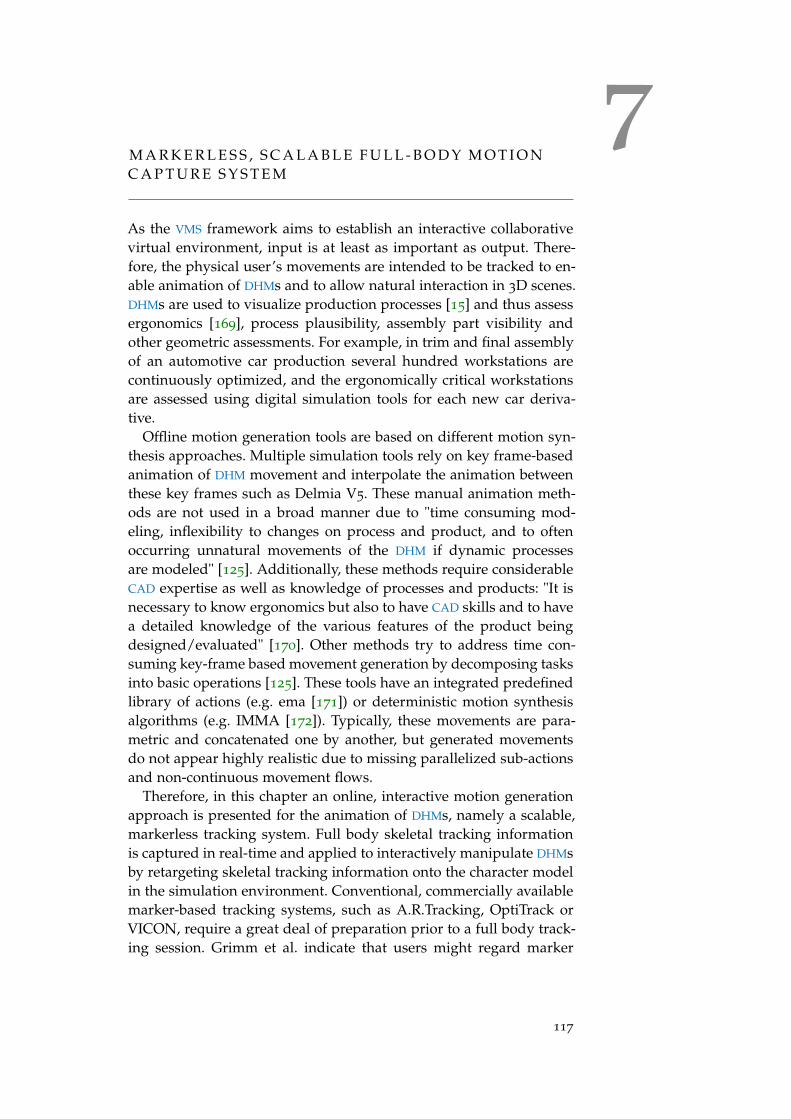
7M A R K E R L E S S , S C A L A B L E F U L L - B O D Y M O T I O NC A P T U R E S Y S T E M
As the VMS framework aims to establish an interactive collaborativevirtual environment, input is at least as important as output. There-fore, the physical user’s movements are intended to be tracked to en-able animation of DHMs and to allow natural interaction in 3D scenes.DHMs are used to visualize production processes [15] and thus assessergonomics [169], process plausibility, assembly part visibility andother geometric assessments. For example, in trim and final assemblyof an automotive car production several hundred workstations arecontinuously optimized, and the ergonomically critical workstationsare assessed using digital simulation tools for each new car deriva-tive.
Offline motion generation tools are based on different motion syn-thesis approaches. Multiple simulation tools rely on key frame-basedanimation of DHM movement and interpolate the animation betweenthese key frames such as Delmia V5. These manual animation meth-ods are not used in a broad manner due to "time consuming mod-eling, inflexibility to changes on process and product, and to oftenoccurring unnatural movements of the DHM if dynamic processesare modeled" [125]. Additionally, these methods require considerableCAD expertise as well as knowledge of processes and products: "It isnecessary to know ergonomics but also to have CAD skills and to havea detailed knowledge of the various features of the product beingdesigned/evaluated" [170]. Other methods try to address time con-suming key-frame based movement generation by decomposing tasksinto basic operations [125]. These tools have an integrated predefinedlibrary of actions (e.g. ema [171]) or deterministic motion synthesisalgorithms (e.g. IMMA [172]). Typically, these movements are para-metric and concatenated one by another, but generated movementsdo not appear highly realistic due to missing parallelized sub-actionsand non-continuous movement flows.
Therefore, in this chapter an online, interactive motion generationapproach is presented for the animation of DHMs, namely a scalable,markerless tracking system. Full body skeletal tracking informationis captured in real-time and applied to interactively manipulate DHMsby retargeting skeletal tracking information onto the character modelin the simulation environment. Conventional, commercially availablemarker-based tracking systems, such as A.R.Tracking, OptiTrack orVICON, require a great deal of preparation prior to a full body track-ing session. Grimm et al. indicate that users might regard marker
117
118 markerless , scalable full-body motion capture system
suits as obtrusive which also influences the realism degree on howthey interact with the virtual scene (see [173, p. 103-105]). As rang-ing cameras are becoming more affordable, markerless body trackinghas become a feasible option for production validation simulation. Be-ing an alternative to more expensive motion capture systems, depthcameras can also be used for gestural interaction, natural user in-terfaces and of course motion capture. Depth camera based systemshave quickly become an appealing alternative for marker-based full-body motion capture in industrial applications, when overcoming thelimitations and meeting the requirements. These markerless opticaloutside-in methods use commercial depth-camera systems, but theirperformance is limited with respect to tracking frustum size and ac-curacy.
Related publications
In the following sections, a set of methods for multiple depth-camera registration and heuristics-based sensor fusion usingskeletal tracking is described, including its applications in anindustrial environment. Parts of this chapter have already beenincluded in following publications, such as "Journal of VirtualReality and Broadcasting" (JVRB) [174], "EuroVR 2015" confer-ence [175] and in "CIRP CMS 2015" production engineeringconference [176]. Self-citation markings are set for [174] as thisjournal paper is based on the conference papers [175, 176].The development of this approach has been carried out by theauthor in cooperation with several students’ theses (PhilippAgethen, Felix Gaisbauer, Mareike Langohr) and in coopera-tion with the institute of media informatics at Ulm University.Furthermore, a publication on the real usability of the systemwas presented in the paper "Applicability Evaluation of Kinectfor Ergonomic Assessment Worksheet (EAWS) Ergonomic As-sessments" at CIRP CMS 2019 [177].
[174] The remainder of the chapter is structured as follows: The chapterstarts with the VMS’s requirements in a motion capture system forfull body skeletal tracking to be used for production validation simu-lations.
After an in-depth literature review of state-of-the-art multi-depth-camera systems, an accuracy analysis of Kinect v2 skeletal trackingis provided in which a robot moves a mannequin for accurate, re-producible motion paths. Based on the results of this evaluation, adistributed hardware consisting of multiple Kinect v2 sensors andservice-oriented software setup with a set of registration and fusiontechniques to create a ready-to-use tracking system is presented forreal-time interaction with virtual environments.
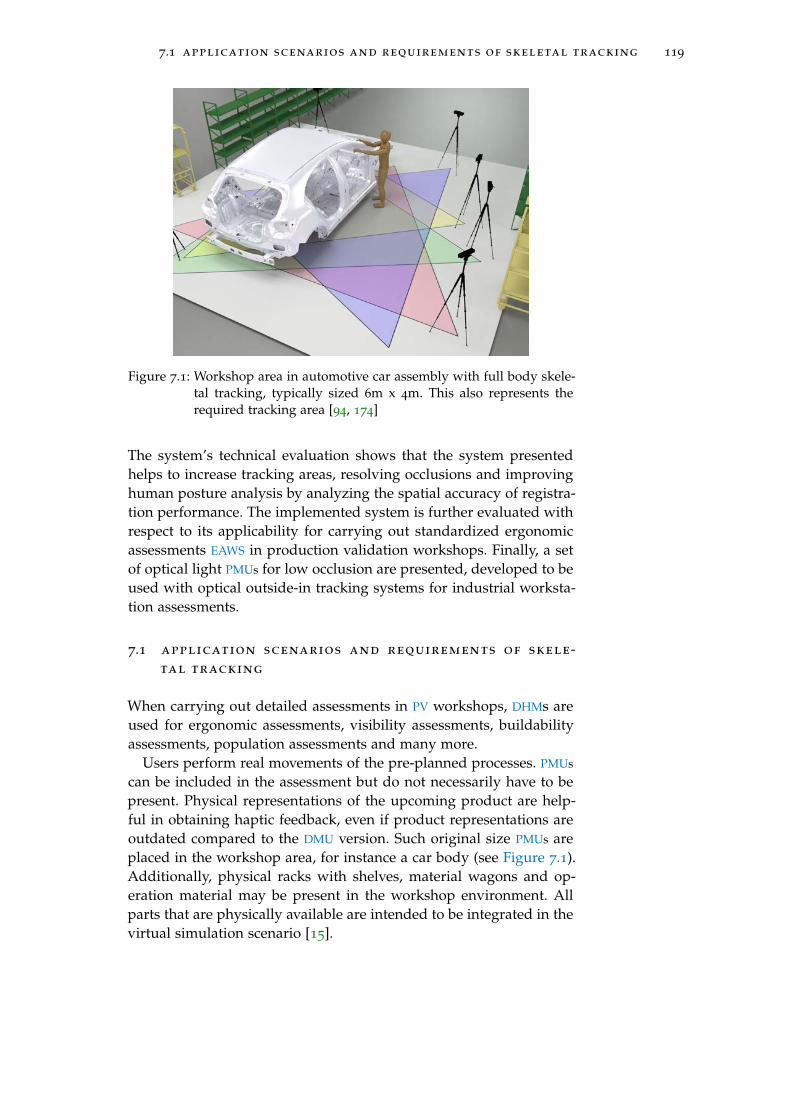
7.1 application scenarios and requirements of skeletal tracking 119
Figure 7.1: Workshop area in automotive car assembly with full body skele-tal tracking, typically sized 6m x 4m. This also represents therequired tracking area [94, 174]
The system’s technical evaluation shows that the system presentedhelps to increase tracking areas, resolving occlusions and improvinghuman posture analysis by analyzing the spatial accuracy of registra-tion performance. The implemented system is further evaluated withrespect to its applicability for carrying out standardized ergonomicassessments EAWS in production validation workshops. Finally, a setof optical light PMUs for low occlusion are presented, developed to beused with optical outside-in tracking systems for industrial worksta-tion assessments.
7.1 application scenarios and requirements of skele-tal tracking
When carrying out detailed assessments in PV workshops, DHMs areused for ergonomic assessments, visibility assessments, buildabilityassessments, population assessments and many more.
Users perform real movements of the pre-planned processes. PMUs
can be included in the assessment but do not necessarily have to bepresent. Physical representations of the upcoming product are help-ful in obtaining haptic feedback, even if product representations areoutdated compared to the DMU version. Such original size PMUs areplaced in the workshop area, for instance a car body (see Figure 7.1).Additionally, physical racks with shelves, material wagons and op-eration material may be present in the workshop environment. Allparts that are physically available are intended to be integrated in thevirtual simulation scenario [15].

120 markerless , scalable full-body motion capture system
In this environment, the tracked user must be represented as aDHM in the assessment simulation software, which robustly followshis movements throughout the process. Passive PV workshop partic-ipants, such as ergonomic experts, are not tracked at the same time,but alter simulation variables, such as work height or process variants,to optimize the process at the respective upcoming workstation. Sup-porting PV assessments with novel methods, multiple requirementsfor a suitable motion capture system can be derived:
Room-scale tracking frustum: Various applications in industry andresearch require large-scale tracking systems, e.g. for interaction withvirtual environments. Since the concepts of the VMS propose an iso-metric, registered VE, the tracked users must be able to move aroundin the entire tracking space. Therefore, the tracking system must bescalable so that the sensor arrangement can be adapted to local re-quirements: If a small workshop room must be tracked, fewer track-ing sensors are applied. If a bigger room is available, technical op-erators must be able to integrate more sensors and track the entireroom. The minimum tracked area for a standard workstation in finalassembly should be at least 6 by 4 meters.
Multiple tracked users: In virtual assessments, real workstationshave to be simulated. Workers cooperate and rely on each other forsuccessfully finishing the process, especially when mounting largeand heavy parts, such as the front module of a car. That is why thevirtual assessment and the tracking system must support multipletracked workers, at least 2 tracked workers at a time.
Instantaneous tracking: Conventional marker-based optical track-ing systems rely on marker suits. These are cumbersome, time inten-sive to put on and obtrusive [173, p. 103-105] and therefore might in-fluence the user’s movements. In practice, in order to reduce change-over times only one workshop participant used to be the tracked. Anovel motion capture system must be able to track users instanta-neously without any preparation process. Users must be able to stepinto the VE without putting on special suits.
Low-cost Tracking Components: For industrial use-cases, cost effi-ciency and short amortization periods are crucial. Tracking systemswith marker based approaches involve considerable initial investment.Cost efficient tracking systems allow a broad roll-out in productionengineering.
Interactive frame rate and latency: The motion capture systemmust deliver tracking data at interactive speeds. In virtual assemblyscenarios, interactive speeds are defined as update rates of at least 30
Hz, whereas for immersive VR assessment environments using HMD
visualization update rates of 60 - 90 Hertz are recommended [173, p.223].
Level of DHM articulation: DHM animation for PV tasks requires ac-curate full body motion capture data. The workgroup for ISO 19774

7.2 objective of multi-sensor arrangements 121
Humanoid Animation [148] proposes three levels of articulation interms of the number of bones and feature points. The maximum levelof articulation proposes 109 skeletal joints. Depending on the valida-tion task in the VMS, various levels of articulation are required. Firstand foremost, body tracking of limbs and the head is required, fingertracking is optional. Face tracking is not required.
Accuracy and precision: The required accuracy and precision ofthe tracked user’s body depends on the use cases. Reachability as-sessments must resemble size and overall body posture as accuratelyas possible whereas very small buildability checks in small and clut-tered build volumes within the product require accurate, jitter-freehand tracking.
Standardized protocols: Multiple simulation tools are used in PV
workshops. The tracking data must use standardized protocols, suchas VRPN, ART and dTrack. Besides translation and orientation, inter-action inputs must be able to transmit via the protocols, such as but-ton clicks, analog input, inertial measurement units with gyroscopes,accelerometers and magnetometers or other means of sensory infor-mation.
7.2 objective of multi-sensor arrangements
Using active ranging camera systems, such as Microsoft Kinect v2, In-tel IntelliSens, ASTRA Orbbec, is a promising way to fulfill the above-mentioned requirements for a tracking system in the VMS. However,single ranging sensors have multiple limitations:
1. Limited field of view (horizontal and vertical)
2. Depth ambiguities
3. Limited emitter intensity
4. Limited sensing range
5. Only one line of sight
6. Susceptible to reduced reflections caused by reflection parame-ters of materials
[174]Original size simulation of an entire car assembly workstation re-quires a spatially tracked area of at least 6m x 4m. This impedes theuse of a single depth camera as the tracking frustum is too small. Alimited sensing range, high susceptibility to self and external occlu-sions and a greatly varying sensing performance depending on theuser’s posture and position are some of the major drawbacks thatmust be faced if such systems are used in the VMS scenarios men-tioned.
122 markerless , scalable full-body motion capture system
In order to overcome these limitations, a novel multi-depth-camerasystem is presented consisting of multiple "Microsoft Kinect v2" sen-sors. It extends the sensing range and improves overall tracking per-formance.
Therefore, a number of technical challenges must be addressed:First of all, a common coordinate frame for the cameras must be estab-lished by registering them to each other. Afterwards, the data comingfrom different cameras must be combined in a meaningful way toactually achieve improvements in tracking performance and range.Finally, fused skeletal data must be provided to the VR/AR systemsvia standardized tracking protocols, such as VRPN, trackD, dTrack orARVIDA.
The overall system must prove whether it can be utilized for DHM
process validation and of course for standardized EAWS ergonomicscreenings, in accordance with PV verification tasks as described inSection 3.3.5.
7.3 state-of-the-art in full body human motion track-ing
"Motion capture is a technique and a process that digitally recordthe movements of a live ‘performer’, such as human motion or themovement from an animal in a specified 3D environment" [178]. Zhouand Hu present a survey of various types of human motion trackingfor rehabilitation, but focus on technical aspects of motion capturein general [179]. Motion capture systems are tracking systems whichcan be classified in multiple ways, such as precision, sensing distance,discrete or continuous events, frame rate, or more typically by theirphysical sensing medium [173, pp. 97–98]. Research has determinedmultiple ways of tracking objects and thus enabling full body motioncapture. Bishop et al. [180] classify tracking systems by their physicalmedium, whereas Zhou and Hu differentiate between "Non-Visual","Visual" and "Robot-aided" human motion tracking systems [179, p.3]. Besides more theoretic approaches, such as mechanical, magneticand acoustic measurement systems, two physical measurement meth-ods are widely used, namely inertial and visual measurement sys-tems:
7.3.1 Inertial full body motion capture
Pure inertial full body motion capture suits are based on accelerom-eters, magnetometers and gyroscopes [181] and can be used for er-gonomic assessments in industrial environments [182]. Since positionis not measured directly, fusion and filter algorithms must compen-sate drift effects with plausibilization and calibration routines. Noabsolute position can be measured without initial references.
7.3 state-of-the-art in full body human motion tracking 123
Roetenberg et al. analyze a full body motion capture system calledXSens [183]. These full body motion capture suits consist of 17 IMUs.Each IMU unit has an integrated 3 DoF accelerometer, magnetometerand gyroscopes. The calibration routines allow drift compensationand plausibilization of noisy data. This system is commercially avail-able and widely used in the manufacturing and entertainment indus-try. For industrial use cases, multiple side effects of this technologyprohibit its use in the VMS: Cumbersome change of IMU suits, calibra-tion routines and drift effects which are getting more intense whenhaving large magnetic objects such as a car body close to the IMUsensors.
Hybrid systems integrate the benefits of inertial and vision track-ing technologies [184]. Commercially available hybrid systems, suchas the AR-Tracking "hybrid suit" [185], combine optical tracking withinertial tracking. If the line of sight is blocked, hybrid trackers deliverIMU sensor data and vice versa. Due to the geometric size of theseunits, no finger tracking possibilities are currently available.
7.3.2 Optical full body motion capture
Visual full body motion capture systems attempt to recover 3D ar-ticulated poses by utilizing image sensors. These sensors reconstructthe object’s 3D position by triangulation using two or more cameras.A digital skeleton consists of concatenated tracking points fulfillingadditional constraints in a digital human model (see H-Anim [148]).
Optical tracking systems for full body motion capture are typicallyset up as outside-in arrangements. "Outside-in" sensor arrangementsconsist of fixed sensor positions facing inside the tracking frustum,while the tracked subject moves relative to the sensor array. A line ofsight between the sensor and trackable is required for optical trackingsystems. Cameras must be calibrated and extrinsically registered toeach other in order to create a common spatial reference.
As depicted in Table 7.1, two main differentiations can be madein optical full body motion capture measurement methods: The mea-surement method can either be active or passive and the users can betracked either with or without markers:
Active camera sensors in combination with markers have provento be reliable in industrial applications for a couple of decades. Thesesystems use retro-reflective balls as markers that are illuminated byIR emitters or directly active LED-based markers. All systems requirea fixed outside-in calibrated camera array to gather video streamsand fuse tracking results to reconstruct the tracked 3D position ofthe markers. To track 6 DoF bodies, at least three markers must bejoined rigidly so that both the position and orientation can be trackeduniquely. Companies such as PhaseSpace, VICON, Optitrack or ART[186] produce active camera systems which have synchronized flashes,

124 markerless , scalable full-body motion capture system
Table 7.1: Classification of optical full body motion capture systems
Measurementmethod
Prerequisites
Marker-based Marker-less
Active Sensors:Active IR-camera
Examples:VICON, Optitrack, Phas-eSpace, A.R.Tracking[186]
Sensors:RGB-D ToF SensorRGB-D Structured LightSensors
Examples:Shotton [187], [188]
Passive Sensors:Greyscale camera
Example:Sementille [189]
Sensors:RGB cameraGreyscale camera
Examples:Cao et al. [190],Hasler et al. [191], [192]
continuously updating the marker positions at high frame rates of upto 960 Hz and high accuracy. Nevertheless, marker-based systemshave a disadvantage immanent to the system, which is that usersmust put on marker suits. This process is time-consuming and mayinfluence the user’s motion.
Another hybrid optical- and IMU-based tracking technology is usedby the tracking system of the HTC Vive VR System. They use staticoutside-in anchors which emit time modulated laser beams, and ac-tive trackable devices demodulate this signal for precise positionaland orientational tracking inside the tracking frustum. The activetracking markers fuse this modulated signal with additional IMUdata.
Passive outside-in MoCap systems using markers on the body arerarely used due to their limited practical applicability. Sementille et al.[189] present an outside-in tracking system attaching fiducial markersto the tracked subject with limited impact.
Passive, markerless human motion tracking methods would be theultimate tracking solution for motion capture data if they worked re-liably. The literature shows that passive sensing without any markerscontinues to be a research topic. These systems consist of commer-cial off-the-shelf cameras. In 2009 Hasler et al. presented a systemfor the statistical tracking of human poses and for estimating bodyshape for multiple unsynchronized cameras [191], [192]. This systemis now commercially available as "TheCaptury." In 2016 Cao et al. pre-sented a system called "OpenPose" for single-camera pose estimation
7.3 state-of-the-art in full body human motion tracking 125
using "part affinity fields" [190]. This open source project by CMUUniversity gathers context information of the scene. Its real-time per-formance is invariant to the amount of people tracked in the singlevideo stream. The algorithm learns to associate body parts with in-dividuals and estimate their body posture. "Algorithms/systems stillneed to be improved to compromise robustness and efficiency" [179],and having evaluated the tracking performance, the results are not asreliable as required for PV workshops.
The following realization focuses on a MoCap system without mark-ers that uses active sensors. Most of these "commercial off-the-shelfhardware systems are ranging cameras. In comparison to the abovementioned passive or marker-based categories, ranging cameras areexpected to meet the requirements of PV workshops in the VMS. Novelmethods are developed to overcome technical limitations by concate-nating several depth cameras and thus generating a scalable sensornetwork.
7.3.3 Microsoft Kinect v2 depth-camera sensor
Markerless tracking is enabled by both hardware and software com-ponents. Optical measurement systems generate reliable image infor-mation, either grey scale, color or depth images. Whereas regularcameras generate intensity images for a certain spectral bandwidthsby accumulating light throughout a period of time per pixel, rangingcameras generate depth images, where each pixel represents the dis-tance between the sensor and the respective objects [193]. These im-ages are called 2.5D images because they transport three-dimensionalinformation in a two-dimensional matrix.
One ranging camera technology is Time of Flight (ToF) measure-ment which permits the no-contact acquisition of depth informationin a respective field of view by actively illuminating the scene with acontinuous wave intensity modulation approach [194, p. 1]. "The time-of-flight system modulates a camera light source with a [square] wave.It uses phase detection to measure the time it takes light to travel fromthe light source to the object and back to the sensor, and calculatesdistance from the results." [195, p. 49] These cameras use intensitymodulated emitters at the modulated frequency fMod and the sceneobjects reflect this light. "The phase reconstruction is performed usingmultiple phase images with different phase shifts which is equivalentto sampling the inherent correlation function at different locations"[194, p. 1]. This means that the distance d is calculated by evaluatingthe phase shift ∆∅.
d =c∆∅
4πfMod(7.1)
Since the modulation function is typically symmetric, the phaseshift is limited to a range of [0, 2π] for unambiguous results. Either am-

126 markerless , scalable full-body motion capture system
biguities must be resolved by software or the modulation frequencymust be adapted. Sell and Connor show that the overall depth reso-lution is influenced by adjusting the modulation frequency [195]. Theoverall result is a topological map of the scene, also called the depthimage, and an intensity image of the reflected light intensities.
Microsoft Kinect V2 [196] sensor was presented by Microsoft inJune 2014 and unites both RGB and depth (RGB-D) sensors in onedevice. As described in detail by Sell and O’Connor, Kinect V2 usesa square wave modulation signal. "A differential pixel distinguishesthe time of-flight sensor from a classic camera sensor" [195, p. 50],which is able to detect phase shifts between the emitted and attenu-ated received reflection in each pixel. Kinect V2 uses three differentcarrier modulation frequencies at the same time (120 Hz, 80 MHzand 16 MHz) in order to simultaneously resolve both the problemsof ambiguities in a large depth area and precision. The resolutionof the ToF sensor is 512 x 424 pixels with a 70° horizontal and 60°vertical FoV (field of view). The ToF sensor is capable providing a reli-able reconstruction of depth information at distances of 0.5m to 4.5m,whereas Sell and O’Connor see "smooth depth readings out to 16 m[. . . ] without wrapping" [195, p. 52]. The regular RGB camera sensorhas a resolution of 1920 x 1080. Both sensors have floating updaterates of approximately 30Hz. They are delivered pre-calibrated, sothat the correspondences between the depth image and color imagecan be calculated automatically. Thus intrinsic and extrinsic cameraparameters have been determined already in the production process[195].
7.3.4 Microsoft Kinect v2 skeletal tracking
Coming with this ToF hardware "Microsoft Kinect v2", "Kinect 2.0Software Development Kit (SDK)" [196] offers full body tracking algo-rithms including human body posture tracking, facial tracking andhand tracking: "Tracking as many as six people and 25 body jointsper person, the tracked positions are more anatomically correct andstable" [196] compared to Kinect v1.
This human motion tracking reconstructs fully articulated skele-tons, namely three dimensional human motion (see Figure 7.2). Zhouet al. [179] distinguish and reference model-based (stick figures mod-els, volumetric models, deformable models) or feature-based (depen-dence graph based algorithms, local feature based, global featurebased) tracking approaches [179]. Kinect v2 SDK motion tracking pri-marily relies on the publications of Shotton et al. [187], [188]. In2012, Shotton et al. [187] presented two algorithms to estimate hu-man body posture in super-real-time and independent of his clothing,body height or stature: "Body part classification" and "offset joint re-gression." Each algorithm independently outputs a list of confidence
7.4 state of the art in multi-depth camera systems 127
weighted 3D joint positions at each frame and for each skeletal joint.Both approaches use depth images as input data, and randomizeddecision forests for classification to deduce logical regions. Havingderived the silhouette of the tracked person with image segments,body regions of the tracked subjects can enrich this with additionalinformation. "Realistic, and highly varied synthetic set of training im-ages" [187] is used in order to train the classificator with many differ-ent statures and of course a large variety of possible body postures.They varied 15 base characters, poses, rotation and translation, hair &clothing, weight & height, camera position & orientation and cameranoise. For enabling a massive parallelization, per-pixel calculationsand segmentation help to perform calculations on the graphic pro-cessing unit (GPU) so that the calculation can be accelerated. Usingthis generated data, a mean-shift procedure proposes skeletal jointangle proposals also with regard to temporal continuities and otherskeletal restrictions for plausible human movements.
Using Kinect body tracking, no calibration routine is needed whenthe subject enters the tracking frustum. The complete calculation pro-cess can run per frame repeatedly at a speed of 200Hz on an Xbox 360
[197]. Kinect SDK delivers a fully articulated human skeleton with 25
joints. Each hand is only represented with three joints with a roughestimation of the thumb position. The remaining four fingers aremerged to one position. Subsequent studies in 2014 by Qian et al.[198] presented algorithms to track hand and finger motions using a26 DoF hand skeletal model from depth images. They approximate thehand posture with 48 spheres and define a fast cost function. In con-trast to full body tracking, these algorithms have not been integratedin Kinect v2 SDK.
7.4 state of the art in multi-depth camera systems
[174]As the VMS’s full body motion capture requirements cannot be met us-ing one Kinect v2 camera only, the following section presents researchin the field of multiple depth-camera systems. However, these publi-cations mainly focus either on certain applications or specific techno-logical aspects of such systems, thus leaving some of the integrationand application challenges largely unaddressed. These aspects can beclustered into the following groups:
• System architecture
• Interference handling
• Registration
• Fusion algorithms
128 markerless , scalable full-body motion capture system
Depending on the application scenarios, some publications discusstheir handling of application specific issues such user identificationor world coordinates registration.
7.4.1 System architecture
[174] Multi-camera approaches have already been proposed for the firstgeneration of Kinect sensors. Each sensor is connected to a separatecomputer, thus simplifying the interfacing of each sensor. However,studies by Schönauer [199] and Martinez-Zarzuela et al. [200] alsoimplement distributed systems, in which skeletal and depth data isgathered on camera nodes and sent to a central fusion unit. This com-ponent handles the creation of a common view of the tracking space.In addition, solutions have emerged in early states, which allow tostream Kinect data via network, e.g. by Wilson [201]. As distributedsystems, those approaches greatly improve scalability, however atthe cost of increased complexity. For Kinect v2 sensors, Rietzler etal. [202] propose a distributed tracking architecture for the so called"FusionKit." The system presented in the below also uses distributedapproaches, although different interfaces. All information can be re-quested via service-oriented Representational State Transfer (REST) in-terfaces such as those proposed by Keppmann et al. [203] in order tohandle additional complexity while maintaining scalability.
7.4.2 Interference handling
[174] As depth cameras actively illuminate the scene, interference can occuras soon as tracking frustums overlap since any camera also receiveslight emitted from other cameras. There are two main approaches tointerference handling that can be found in the literature, (1) opticalmultiplexing (e.g. presented by Butler [204] or Faion et al. [205]) and(2) post-processing algorithms e.g. hole-filling as in Maimone andFuchs [206]. Often it is also possible to simply ignore interferenceswhen using certain camera types and setups, especially in skeletaltracking applications where high frequency noise does not directly af-fect tracking performance. The system presented in the latter uses ToF
depth cameras which generate only negligible interference noise dueto their working principle and slightly different modulation, and nocountermeasures against cross-camera-interference are implemented.Direct sunlight exposure has proved to be another source of interfer-ence, presumably due to overexposure of the IR imaging system. Asthe PV workshops in the VMS take place indoors only, no countermea-sures against interferences by direct sunlight exposure are taken intoaccount.
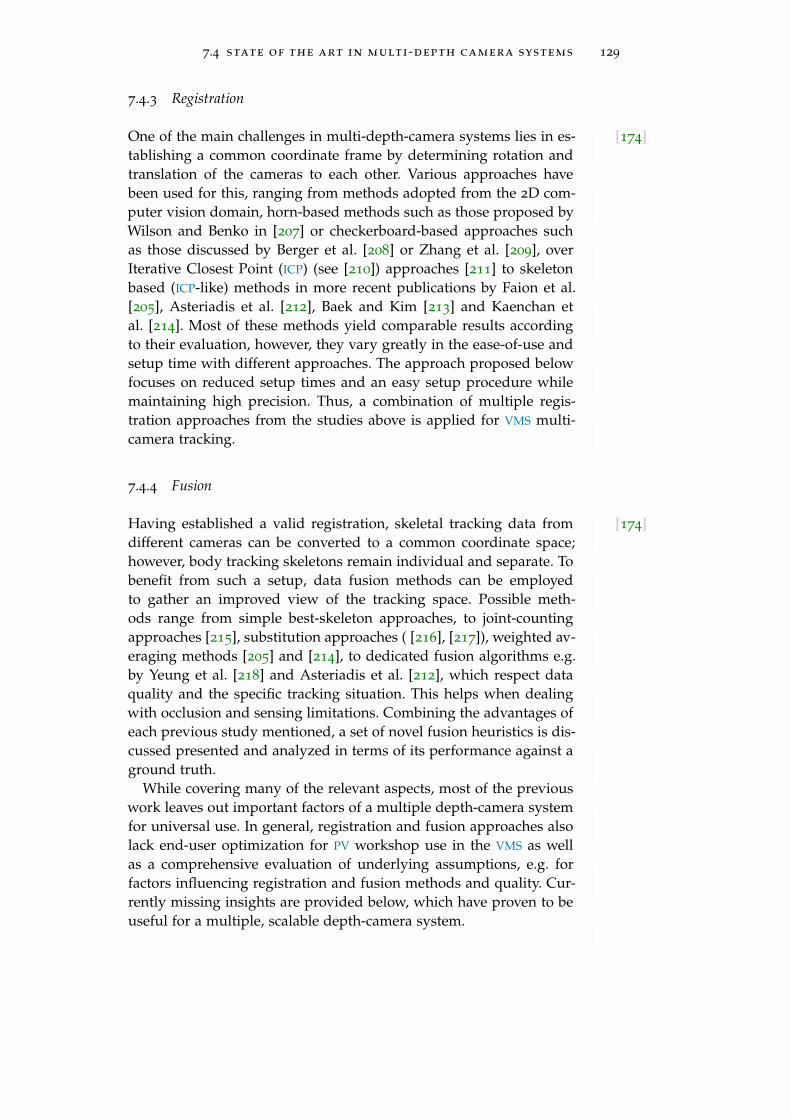
7.4 state of the art in multi-depth camera systems 129
7.4.3 Registration
[174]One of the main challenges in multi-depth-camera systems lies in es-tablishing a common coordinate frame by determining rotation andtranslation of the cameras to each other. Various approaches havebeen used for this, ranging from methods adopted from the 2D com-puter vision domain, horn-based methods such as those proposed byWilson and Benko in [207] or checkerboard-based approaches suchas those discussed by Berger et al. [208] or Zhang et al. [209], overIterative Closest Point (ICP) (see [210]) approaches [211] to skeletonbased (ICP-like) methods in more recent publications by Faion et al.[205], Asteriadis et al. [212], Baek and Kim [213] and Kaenchan etal. [214]. Most of these methods yield comparable results accordingto their evaluation, however, they vary greatly in the ease-of-use andsetup time with different approaches. The approach proposed belowfocuses on reduced setup times and an easy setup procedure whilemaintaining high precision. Thus, a combination of multiple regis-tration approaches from the studies above is applied for VMS multi-camera tracking.
7.4.4 Fusion
[174]Having established a valid registration, skeletal tracking data fromdifferent cameras can be converted to a common coordinate space;however, body tracking skeletons remain individual and separate. Tobenefit from such a setup, data fusion methods can be employedto gather an improved view of the tracking space. Possible meth-ods range from simple best-skeleton approaches, to joint-countingapproaches [215], substitution approaches ( [216], [217]), weighted av-eraging methods [205] and [214], to dedicated fusion algorithms e.g.by Yeung et al. [218] and Asteriadis et al. [212], which respect dataquality and the specific tracking situation. This helps when dealingwith occlusion and sensing limitations. Combining the advantages ofeach previous study mentioned, a set of novel fusion heuristics is dis-cussed presented and analyzed in terms of its performance against aground truth.
While covering many of the relevant aspects, most of the previouswork leaves out important factors of a multiple depth-camera systemfor universal use. In general, registration and fusion approaches alsolack end-user optimization for PV workshop use in the VMS as wellas a comprehensive evaluation of underlying assumptions, e.g. forfactors influencing registration and fusion methods and quality. Cur-rently missing insights are provided below, which have proven to beuseful for a multiple, scalable depth-camera system.
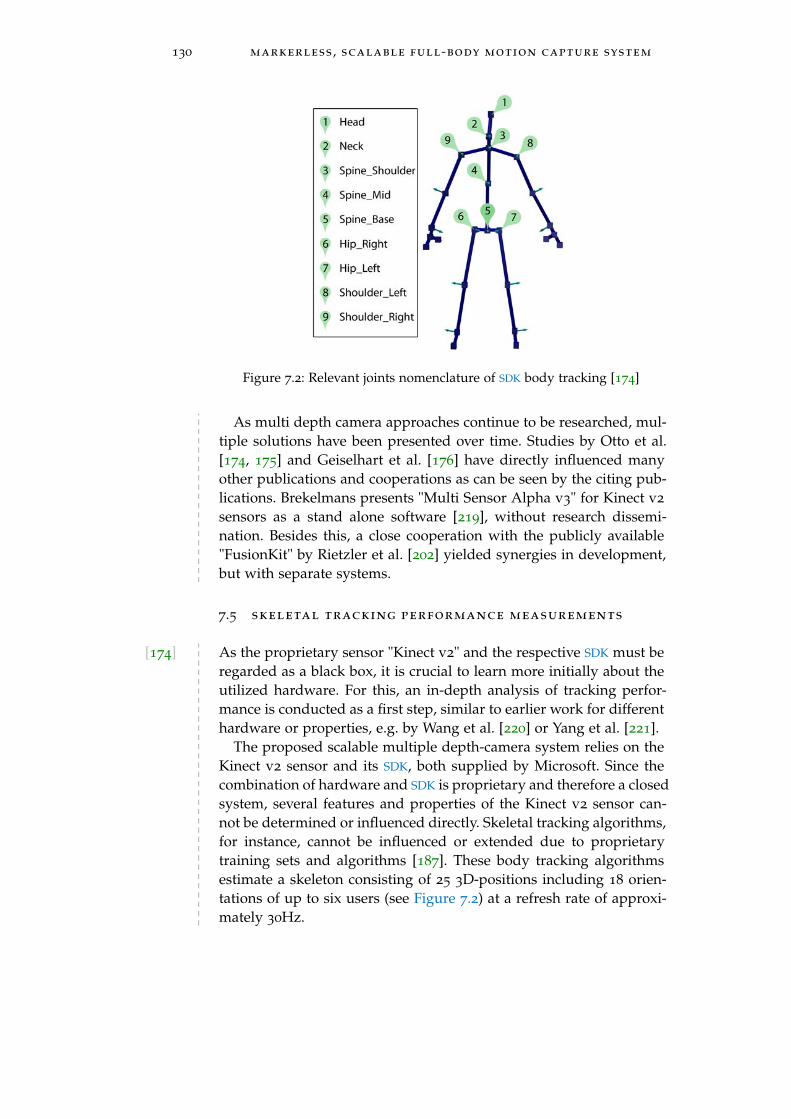
130 markerless , scalable full-body motion capture system
Figure 7.2: Relevant joints nomenclature of SDK body tracking [174]
As multi depth camera approaches continue to be researched, mul-tiple solutions have been presented over time. Studies by Otto et al.[174, 175] and Geiselhart et al. [176] have directly influenced manyother publications and cooperations as can be seen by the citing pub-lications. Brekelmans presents "Multi Sensor Alpha v3" for Kinect v2
sensors as a stand alone software [219], without research dissemi-nation. Besides this, a close cooperation with the publicly available"FusionKit" by Rietzler et al. [202] yielded synergies in development,but with separate systems.
7.5 skeletal tracking performance measurements
[174] As the proprietary sensor "Kinect v2" and the respective SDK must beregarded as a black box, it is crucial to learn more initially about theutilized hardware. For this, an in-depth analysis of tracking perfor-mance is conducted as a first step, similar to earlier work for differenthardware or properties, e.g. by Wang et al. [220] or Yang et al. [221].
The proposed scalable multiple depth-camera system relies on theKinect v2 sensor and its SDK, both supplied by Microsoft. Since thecombination of hardware and SDK is proprietary and therefore a closedsystem, several features and properties of the Kinect v2 sensor can-not be determined or influenced directly. Skeletal tracking algorithms,for instance, cannot be influenced or extended due to proprietarytraining sets and algorithms [187]. These body tracking algorithmsestimate a skeleton consisting of 25 3D-positions including 18 orien-tations of up to six users (see Figure 7.2) at a refresh rate of approxi-mately 30Hz.
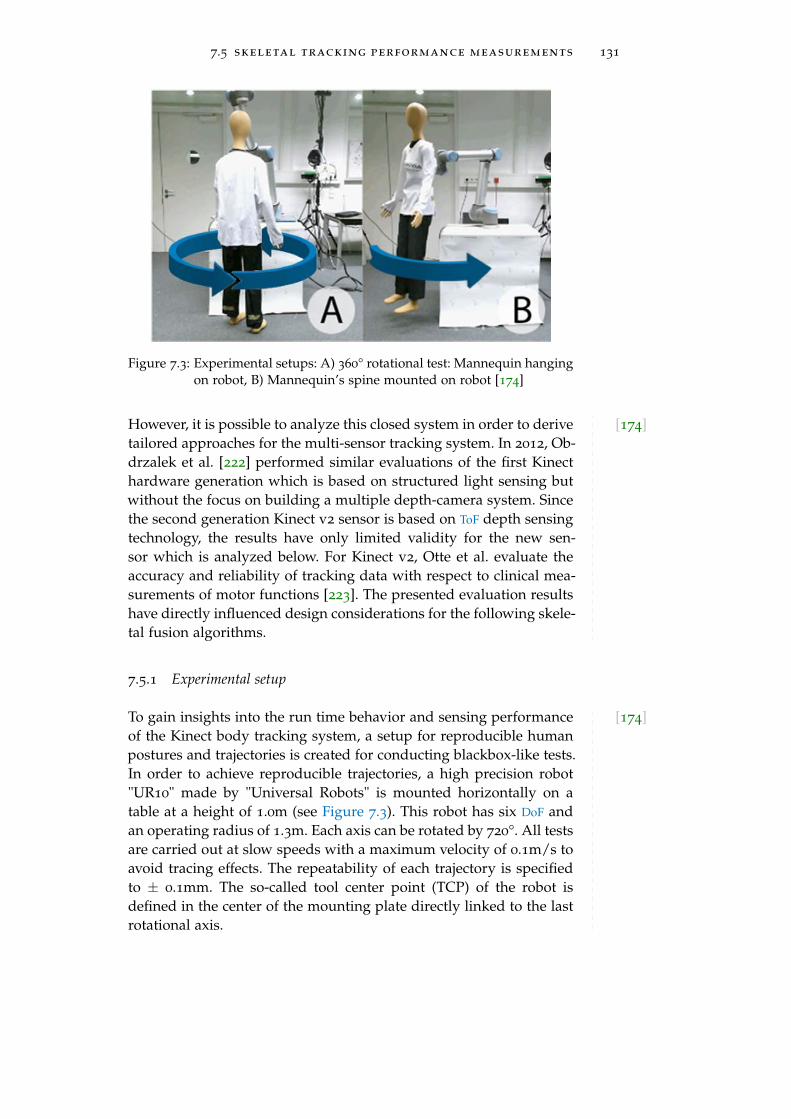
7.5 skeletal tracking performance measurements 131
Figure 7.3: Experimental setups: A) 360° rotational test: Mannequin hangingon robot, B) Mannequin’s spine mounted on robot [174]
[174]However, it is possible to analyze this closed system in order to derivetailored approaches for the multi-sensor tracking system. In 2012, Ob-drzalek et al. [222] performed similar evaluations of the first Kinecthardware generation which is based on structured light sensing butwithout the focus on building a multiple depth-camera system. Sincethe second generation Kinect v2 sensor is based on ToF depth sensingtechnology, the results have only limited validity for the new sen-sor which is analyzed below. For Kinect v2, Otte et al. evaluate theaccuracy and reliability of tracking data with respect to clinical mea-surements of motor functions [223]. The presented evaluation resultshave directly influenced design considerations for the following skele-tal fusion algorithms.
7.5.1 Experimental setup
[174]To gain insights into the run time behavior and sensing performanceof the Kinect body tracking system, a setup for reproducible humanpostures and trajectories is created for conducting blackbox-like tests.In order to achieve reproducible trajectories, a high precision robot"UR10" made by "Universal Robots" is mounted horizontally on atable at a height of 1.0m (see Figure 7.3). This robot has six DoF andan operating radius of 1.3m. Each axis can be rotated by 720°. All testsare carried out at slow speeds with a maximum velocity of 0.1m/s toavoid tracing effects. The repeatability of each trajectory is specifiedto ± 0.1mm. The so-called tool center point (TCP) of the robot isdefined in the center of the mounting plate directly linked to the lastrotational axis.

132 markerless , scalable full-body motion capture system
Figure 7.4: Drawing of coordinate system and two experimental setups: A)360° rotation, B) 85° rotation [174]
[174] Mounted to the robot arm, a 1.75m tall mannequin is used for all ex-periments. It is dressed in a regular t-shirt and jeans. As black clothescause problems with the depth image (and the body tracking results)due to low IR reflection, bright colors are chosen. In all experiments,the mannequin has a symmetric posture with open hanging arms.
In order to retrieve precise and low jitter input data of the man-nequin’s movements, two experiments with reproducible trajectoriesare carried out: The 360° and 85° experiment. The latter is carried outin order to bring the rotation axis out of the skeletal center-axis, whichis not possible in the 360° experimental setup due to axis limitationsand occlusions by the robot itself.
For the 360° experimental setup, the mannequin is mounted on theTCP at the top of its head with a 10cm long separator in between(see Figure 7.3 A and Figure 7.4 A). The robot spins the mannequinaround its vertical axis at a constant angular velocity. With this ex-perimental setup, skeletal orientation and positional stability can beassessed with regard to the user’s rotation.
[174] In the 85° experiment, the mannequin’s spine is mounted on therobot’s TCP at 1.3m height (see Figure 7.3 B and Figure 7.4 B). Themannequin’s feet are 1mm above the floor. The sensor is leveled andstands at a distance of approx. 2m at a height of 1m. The robot rotatesthe mannequin around the TCP from 0° (orthogonal) to 85° (close toside view) as depicted in Figure 7.4 B. The 85° experimental setup isused to quantify the positional precision of the center-axis joints (seeFigure 7.2) and therefore the applicability of joints for multi-cameraregistration purposes.
7.5.2 Evaluation 360° experiment
[174] In general, body tracking was originally designed for gaming usecases in which the user is facing the camera. Therefore, a quickly
7.5 skeletal tracking performance measurements 133
Figure 7.5: 360° rotational experiment: Front/back ambiguity during rota-tion for the non-center axis joints ShoulderLeft and Shoulder-Right. Color change indicates the front/back ambiguity [174]
decreasing tracking performance when slowly rotating to a lateral oreven rear view is expected.
[174]Figure 7.5 shows the course of shoulder joints in a top view over rota-tion from 0° and 180°. At 0° the mannequin is facing the camera as de-picted in Figure 7.4. In contrast to the two expected continuous semi-circles (the lower semicircle representing the right shoulder whereasthe upper semicircle is related to the left shoulder), the SDK resultsshow a discontinuous behavior. It can be observed that the positionof the right shoulder jumps in the mid section in Figure 7.5 frompoint [−0.05m,2.2m] to [−0.15m,2.4m]. This ambiguity is attributableto the SDK assuming that the user’s body is always oriented towardsthe camera. Consequently, an ambiguity appears when the user turnshis back towards the camera. The analysis shows that this effect canbe observed for all non-center-axis joints such as arms and legs. Eventhe non-centered torso joints, e.g. HipLeft, HipRight, ShoulderLeftand ShoulderRight, suffer from the same problem. However, center-axis joints like Head, Neck, SpineBase, SpineMid and SpineShoulderare invariant to the front/rear ambiguity and could therefore be usedfor registration purposes.
Having excluded non-center-axis joints, the estimated user orienta-tion is subsequently analyzed with regard to its validity. Figure 7.6depicts the expected SDK behavior (turquoise) given by the rotatingrobot axis. Moreover, this plot shows the estimated vertical orienta-tions for the center joints Neck, SpineBase, SpineMid and SpineShoul-der. Arm and leg joints are not included in Figure 7.6 since they onlyprovide valid data up to 30° due to occlusion.
[174]The SDK reliably estimates the orientation for the center joints withina range of 0° to ± 40°. Beyond this point, the user’s vertical orien-tation is increasingly underestimated until the mentioned ambiguitytakes place at approx. 130°. Between 40° and 130° SpineShoulder and
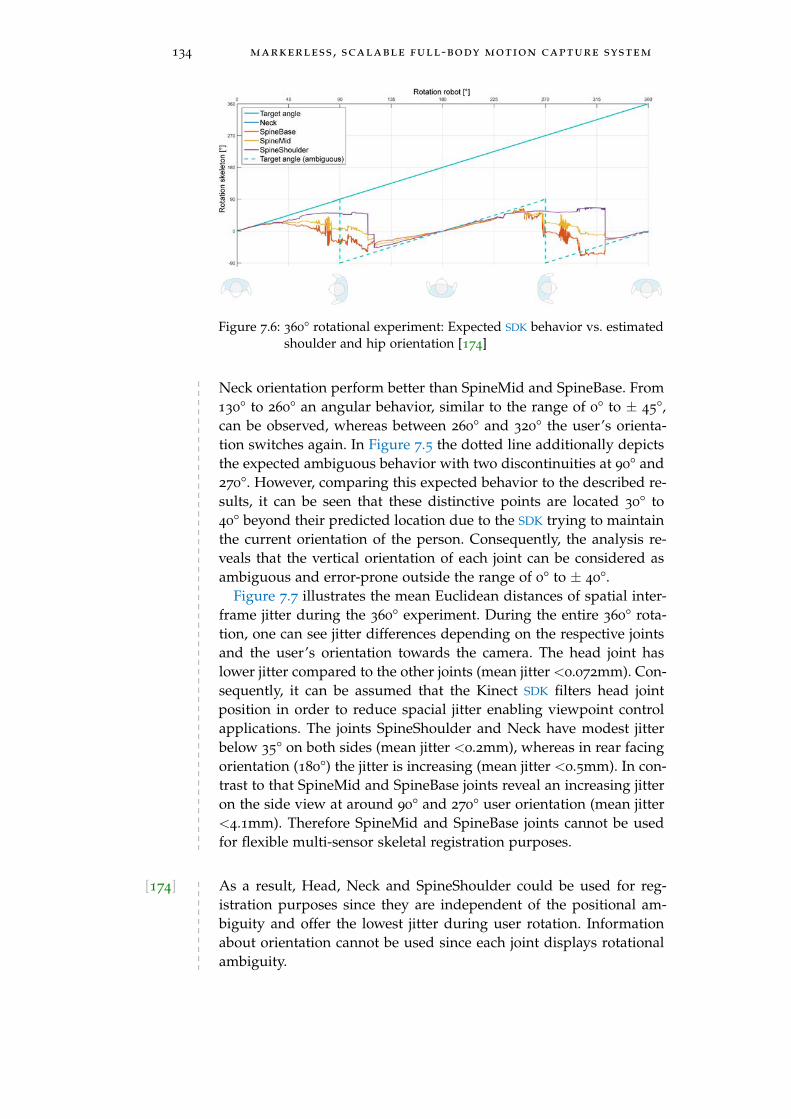
134 markerless , scalable full-body motion capture system
Figure 7.6: 360° rotational experiment: Expected SDK behavior vs. estimatedshoulder and hip orientation [174]
Neck orientation perform better than SpineMid and SpineBase. From130° to 260° an angular behavior, similar to the range of 0° to ± 45°,can be observed, whereas between 260° and 320° the user’s orienta-tion switches again. In Figure 7.5 the dotted line additionally depictsthe expected ambiguous behavior with two discontinuities at 90° and270°. However, comparing this expected behavior to the described re-sults, it can be seen that these distinctive points are located 30° to40° beyond their predicted location due to the SDK trying to maintainthe current orientation of the person. Consequently, the analysis re-veals that the vertical orientation of each joint can be considered asambiguous and error-prone outside the range of 0° to ± 40°.
Figure 7.7 illustrates the mean Euclidean distances of spatial inter-frame jitter during the 360° experiment. During the entire 360° rota-tion, one can see jitter differences depending on the respective jointsand the user’s orientation towards the camera. The head joint haslower jitter compared to the other joints (mean jitter <0.072mm). Con-sequently, it can be assumed that the Kinect SDK filters head jointposition in order to reduce spacial jitter enabling viewpoint controlapplications. The joints SpineShoulder and Neck have modest jitterbelow 35° on both sides (mean jitter <0.2mm), whereas in rear facingorientation (180°) the jitter is increasing (mean jitter <0.5mm). In con-trast to that SpineMid and SpineBase joints reveal an increasing jitteron the side view at around 90° and 270° user orientation (mean jitter<4.1mm). Therefore SpineMid and SpineBase joints cannot be usedfor flexible multi-sensor skeletal registration purposes.
[174] As a result, Head, Neck and SpineShoulder could be used for reg-istration purposes since they are independent of the positional am-biguity and offer the lowest jitter during user rotation. Informationabout orientation cannot be used since each joint displays rotationalambiguity.
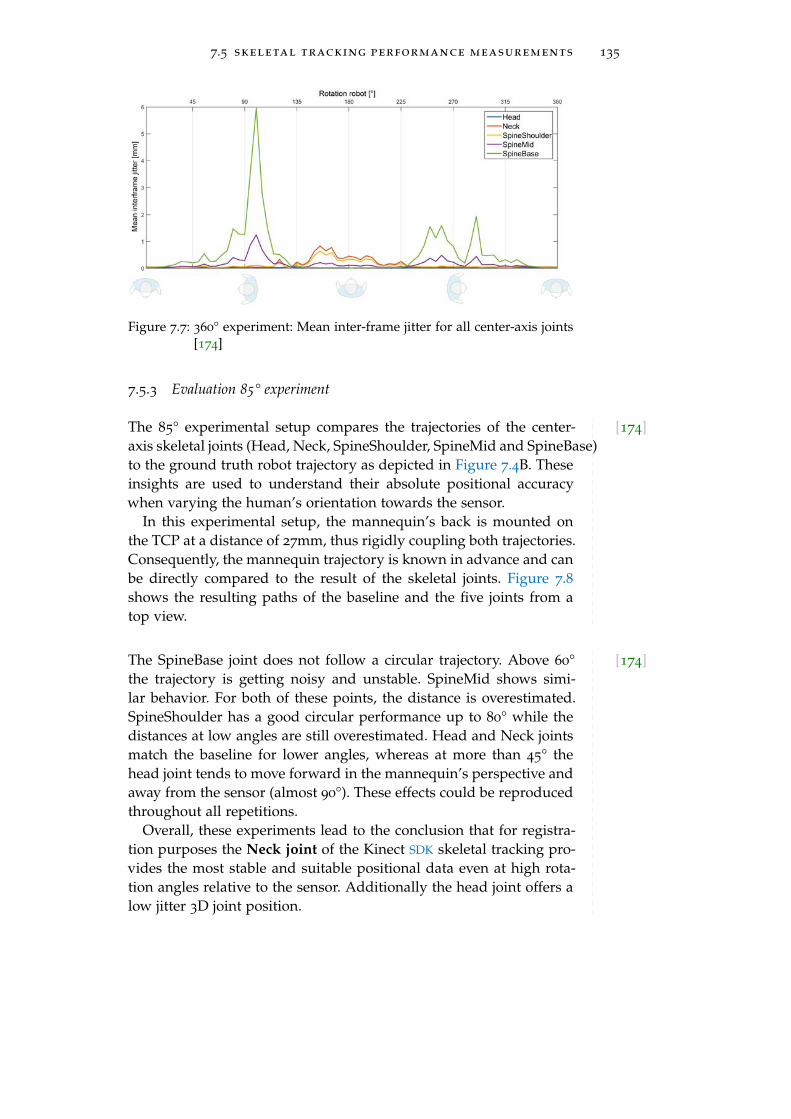
7.5 skeletal tracking performance measurements 135
Figure 7.7: 360° experiment: Mean inter-frame jitter for all center-axis joints[174]
7.5.3 Evaluation 85° experiment
[174]The 85° experimental setup compares the trajectories of the center-axis skeletal joints (Head, Neck, SpineShoulder, SpineMid and SpineBase)to the ground truth robot trajectory as depicted in Figure 7.4B. Theseinsights are used to understand their absolute positional accuracywhen varying the human’s orientation towards the sensor.
In this experimental setup, the mannequin’s back is mounted onthe TCP at a distance of 27mm, thus rigidly coupling both trajectories.Consequently, the mannequin trajectory is known in advance and canbe directly compared to the result of the skeletal joints. Figure 7.8shows the resulting paths of the baseline and the five joints from atop view.
[174]The SpineBase joint does not follow a circular trajectory. Above 60°the trajectory is getting noisy and unstable. SpineMid shows simi-lar behavior. For both of these points, the distance is overestimated.SpineShoulder has a good circular performance up to 80° while thedistances at low angles are still overestimated. Head and Neck jointsmatch the baseline for lower angles, whereas at more than 45° thehead joint tends to move forward in the mannequin’s perspective andaway from the sensor (almost 90°). These effects could be reproducedthroughout all repetitions.
Overall, these experiments lead to the conclusion that for registra-tion purposes the Neck joint of the Kinect SDK skeletal tracking pro-vides the most stable and suitable positional data even at high rota-tion angles relative to the sensor. Additionally the head joint offers alow jitter 3D joint position.
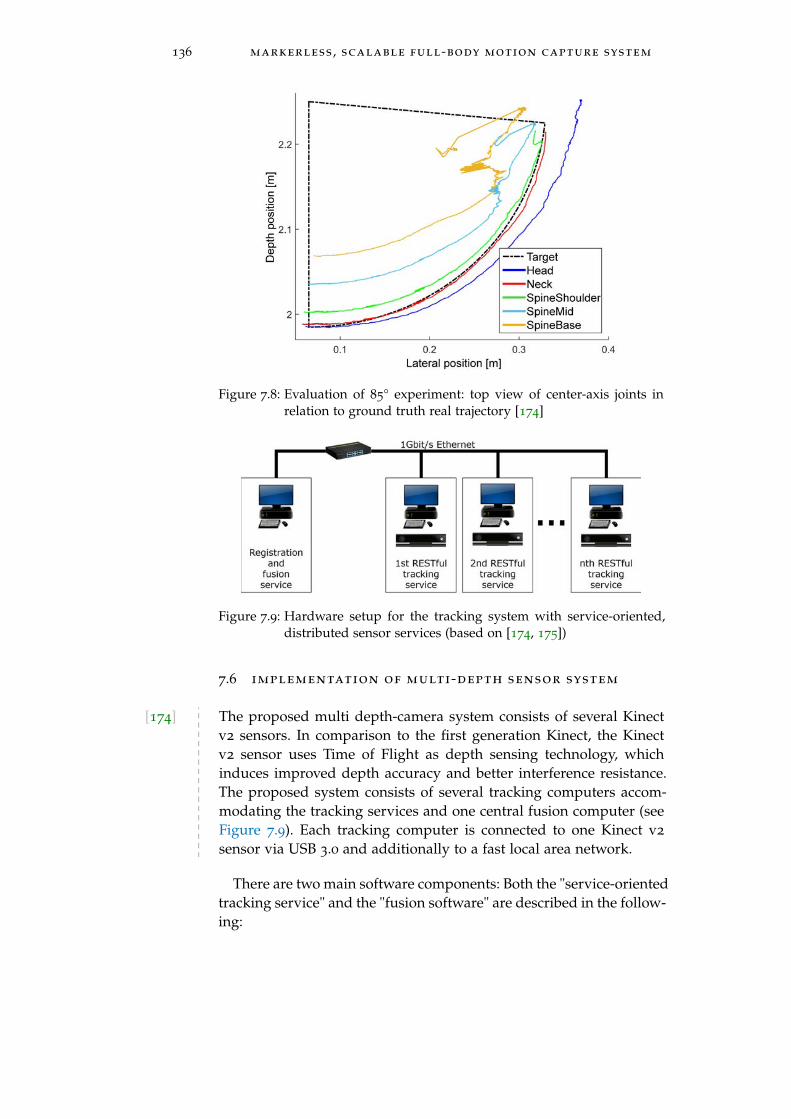
136 markerless , scalable full-body motion capture system
Figure 7.8: Evaluation of 85° experiment: top view of center-axis joints inrelation to ground truth real trajectory [174]
Figure 7.9: Hardware setup for the tracking system with service-oriented,distributed sensor services (based on [174, 175])
7.6 implementation of multi-depth sensor system
[174] The proposed multi depth-camera system consists of several Kinectv2 sensors. In comparison to the first generation Kinect, the Kinectv2 sensor uses Time of Flight as depth sensing technology, whichinduces improved depth accuracy and better interference resistance.The proposed system consists of several tracking computers accom-modating the tracking services and one central fusion computer (seeFigure 7.9). Each tracking computer is connected to one Kinect v2
sensor via USB 3.0 and additionally to a fast local area network.
There are two main software components: Both the "service-orientedtracking service" and the "fusion software" are described in the follow-ing:

7.6 implementation of multi-depth sensor system 137
Figure 7.10: Block diagram of fusion service [174, 175]
7.6.1 Service-oriented tracking service
[174]Implementing a service-oriented RESTful tracking service instead ofconventional streaming architecture has several advantages: Thirdparty integrators can easily reuse the services for implementing clients.Additionally, the use of standardized and publicly available track-ing vocabulary and Resource Description Framework (RDF) helpsachieve interoperability between tracking devices which is also thegoal of the ARVIDA project. In this context, the tracking services pre-sented use a RESTful polling-based approach with linked data whichconforms to the ARVIDA standard. Keppmann et al. [203] show thatRESTful Linked Data resources can be applied for virtual reality envi-ronments.
In the tracking service, information is gathered by the event-basedKinect SDK. The web service offers all skeletal information, the sta-tus of each skeleton, the floor plane estimation and color and depthcamera views as RESTful resources. RDF datagrams are serialized us-ing the Turtle format. Each datagram contains time stamps for subse-quent synchronization.
7.6.2 Fusion service
[174]The fusion and multi-sensor service runs as a central component andhandles registration, fusion and data input/output in the trackingenvironment. Figure 7.10 depicts the architecture of the registrationand fusion service.
The fusion service polls data of each attached tracking service.Each sensor requires a dedicated tracking service. As depicted in Fig-
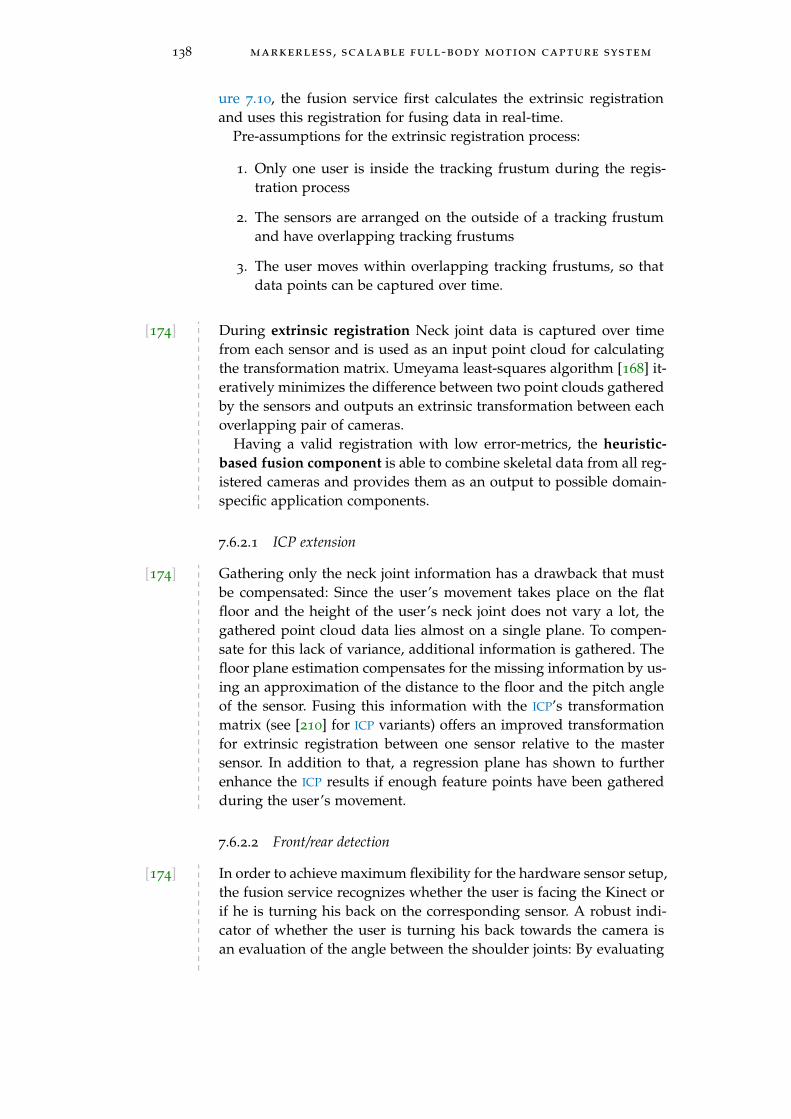
138 markerless , scalable full-body motion capture system
ure 7.10, the fusion service first calculates the extrinsic registrationand uses this registration for fusing data in real-time.
Pre-assumptions for the extrinsic registration process:
1. Only one user is inside the tracking frustum during the regis-tration process
2. The sensors are arranged on the outside of a tracking frustumand have overlapping tracking frustums
3. The user moves within overlapping tracking frustums, so thatdata points can be captured over time.
[174] During extrinsic registration Neck joint data is captured over timefrom each sensor and is used as an input point cloud for calculatingthe transformation matrix. Umeyama least-squares algorithm [168] it-eratively minimizes the difference between two point clouds gatheredby the sensors and outputs an extrinsic transformation between eachoverlapping pair of cameras.
Having a valid registration with low error-metrics, the heuristic-based fusion component is able to combine skeletal data from all reg-istered cameras and provides them as an output to possible domain-specific application components.
7.6.2.1 ICP extension
[174] Gathering only the neck joint information has a drawback that mustbe compensated: Since the user’s movement takes place on the flatfloor and the height of the user’s neck joint does not vary a lot, thegathered point cloud data lies almost on a single plane. To compen-sate for this lack of variance, additional information is gathered. Thefloor plane estimation compensates for the missing information by us-ing an approximation of the distance to the floor and the pitch angleof the sensor. Fusing this information with the ICP’s transformationmatrix (see [210] for ICP variants) offers an improved transformationfor extrinsic registration between one sensor relative to the mastersensor. In addition to that, a regression plane has shown to furtherenhance the ICP results if enough feature points have been gatheredduring the user’s movement.
7.6.2.2 Front/rear detection
[174] In order to achieve maximum flexibility for the hardware sensor setup,the fusion service recognizes whether the user is facing the Kinect orif he is turning his back on the corresponding sensor. A robust indi-cator of whether the user is turning his back towards the camera isan evaluation of the angle between the shoulder joints: By evaluating
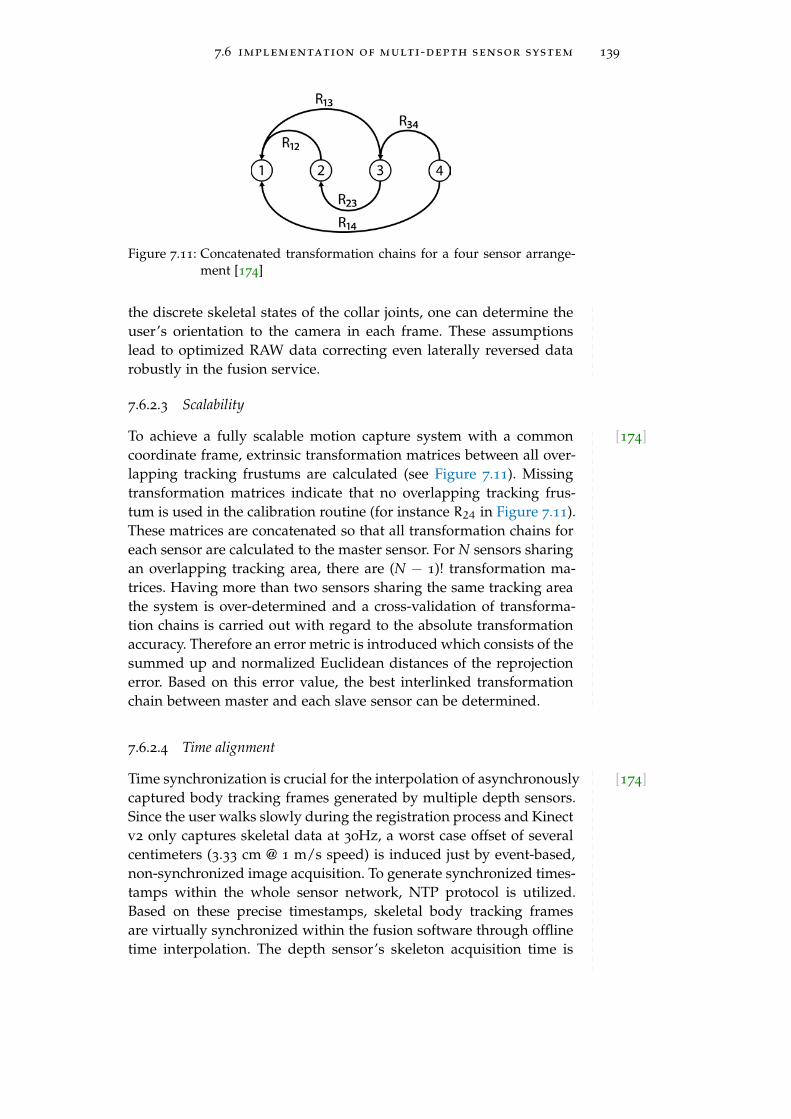
7.6 implementation of multi-depth sensor system 139
Figure 7.11: Concatenated transformation chains for a four sensor arrange-ment [174]
the discrete skeletal states of the collar joints, one can determine theuser’s orientation to the camera in each frame. These assumptionslead to optimized RAW data correcting even laterally reversed datarobustly in the fusion service.
7.6.2.3 Scalability
[174]To achieve a fully scalable motion capture system with a commoncoordinate frame, extrinsic transformation matrices between all over-lapping tracking frustums are calculated (see Figure 7.11). Missingtransformation matrices indicate that no overlapping tracking frus-tum is used in the calibration routine (for instance R24 in Figure 7.11).These matrices are concatenated so that all transformation chains foreach sensor are calculated to the master sensor. For N sensors sharingan overlapping tracking area, there are (N − 1)! transformation ma-trices. Having more than two sensors sharing the same tracking areathe system is over-determined and a cross-validation of transforma-tion chains is carried out with regard to the absolute transformationaccuracy. Therefore an error metric is introduced which consists of thesummed up and normalized Euclidean distances of the reprojectionerror. Based on this error value, the best interlinked transformationchain between master and each slave sensor can be determined.
7.6.2.4 Time alignment
[174]Time synchronization is crucial for the interpolation of asynchronouslycaptured body tracking frames generated by multiple depth sensors.Since the user walks slowly during the registration process and Kinectv2 only captures skeletal data at 30Hz, a worst case offset of severalcentimeters (3.33 cm @ 1 m/s speed) is induced just by event-based,non-synchronized image acquisition. To generate synchronized times-tamps within the whole sensor network, NTP protocol is utilized.Based on these precise timestamps, skeletal body tracking framesare virtually synchronized within the fusion software through offlinetime interpolation. The depth sensor’s skeleton acquisition time is
140 markerless , scalable full-body motion capture system
assumed to be constant for all sensors. Since the user’s body has acertain inertia and the refresh rate varies at around 30Hz, the inter-frame trajectory between two skeleton datagrams can be assumed aslinear movement.
7.6.2.5 Fusion process and quality heuristics
[174] Having registered all sensors via extrinsic transformation chains intoa common coordinate frame, the tracked body frames - generatedfrom different views - are placed in the same coordinate frame andmust be fused. For large-frustum and rotation invariant motion cap-ture for posture analysis, the following set of skeletal fusion heuris-tics is proposed. Each skeleton within each sensor is given a certainweight. The higher the weight the higher the influence of a specificsensor on the tracked subject’s fused skeleton. A set of weight penal-ties is presented in the following for real time skeletal fusion. For eachsensor and skeleton, these weight penalties are calculated as follows:
First, a distance measure penalizes unfavorable distances betweenthe user and a sensor. This quality measure weights the sensor’s skele-ton over the distance to the neck joint respectively. Evaluations haveshown that the most reliable tracking results can be achieved whenthe user is tracked at a distance of two and three meters betweenhimself and the sensor. Other distances are penalized.
w(d) =
0 for d 6 1m
1− (d− 2.0m) for 1m < d 6 2m
1 for 2m < d 6 3m
1− (d− 3.0m) for 3m < d 6 4m
0 for 4m < d
(7.2)
Second, the rotation quality measure penalizes when a user isstanding in a less frontal position to a sensor. This is helpful for rota-tion invariant human activity analysis. Full frontally captured skele-tons get high weights. Rear views are set to zero weight. The usershould stand as orthogonally to the sensor as possible and 30° hasbeen determined as the maximum vertical user orientation for reli-ably tracking limbs:
w(ϕ) =
{1−
|ϕ|30◦ for |ϕ| < 45
◦,
0 for |ϕ| > 45◦(7.3)
Kinect V2 has a horizontal field of view of 70° in the ToF sensor. Inorder to achieve a smooth transition between the multiple trackingfrustums at the horizontal edges to the tracking frustum, a lateralfrustum quality measure limits the tracking frustum to a horizontal
7.6 implementation of multi-depth sensor system 141
field of view of 50° so that the limbs are still likely to be within thetracking area of the sensor (70°). Weights are set to zero if the user’scenter axis joints exceed 50° on the horizontal axis of the local cameracoordinate frame:
w(α) =
{1−
|α|25◦ for |α| < 25
◦
0 for |α| > 45◦(7.4)
The weights are fused to a total penalty weight for the sensor’sskeleton with weights KDist (e.g. 1) and KRot (e.g. 10). Differentweight profiles can be used to optimize the fused result for specialcircumstances, e.g. laboratory settings without any objects occludingthe user or more complex settings such as automotive PV workshopswhere physical mock-ups placed in the middle of the workshop envi-ronment may weaken the tracking quality of some sensors:
wTot(d,α,ϕ) = w(α) (KDistw(d) +KRotw(ϕ)) (7.5)
These quality heuristics are used to subsequently fuse the skele-tons geometrically in a weighted manner. Skeletons are fused in aweighted manner for all joints:
−→p iFusion =
∑kj=0w
jTotal(d,α,ϕ)−→p i,j∑k
j=0wjTotal(d,α,ϕ)
(7.6)
Practical implementation has shown that for six sensor setups, typ-ically only the best three weighted skeletons can be used for weightedoverall skeletal fusion. Secondly an implementation of a linear KalmanFilter was used [224]. The gathered weights from the heuristics areintegrated in the measurement covariance matrix of the filter, increas-ing or decreasing the variance of the measurement. Since the trackingdata of the Kinect sensors are always afflicted with jitter, the KalmanFilter can improve the overall tracking quality by its probabilisticmodeling, and in case of partial or full loss of tracking data it canpredict the skeleton state.
7.6.2.6 User identification
Having fused skeletal data, skeletons are handed over between reg-istered sensors. If users move in the extended tracking frustum, thesame ID is used every time and theoutput skeleton does not jump toother tracked users. Even though Kinect SDK already provides skeletalIDs, a persistent ID of fused skeletons is generated by using dynamiclookup table with minimal Euclidean distance for the neck joint. Aslong as the user stays in the multi-sensor tracking system, the persis-tent ID does not change for smooth transmission of skeletal data viastandardized protocols.

142 markerless , scalable full-body motion capture system
7.6.2.7 Standard tracking protocols
Three different standardized protocols are implemented in the multi-kinect system for interoperability. The fusion service layer can be usedfully transparently, so that the receiving software component cannotdistinguish whether the single tracking web service or fused skele-tons are transmitted. Even though frequencies of data acquisition inthe fusion service may vary, the transmission of tracking data is car-ried out at an adjustable but fixed frame rate. For both variants thefollowing protocols are implemented:
Virtual-Reality Peripheral Network [145] is an open source andbroadly used protocol. It is implemented so that data can be trans-mitted to every compatible receiver.
dTrack is a proprietary protocol of ART company [186]. Neverthe-less, because the unidirectional protocol uses unencrypted and un-compressed messages, it has come be widely used in the trackingcommunity. That is why this protocol received a pseudo-standardfor transmission of tracking data. Many simulation environmentsnatively support AR-Tracking components. Therefore, implementingthis protocol opens the doors to use with standard assessment envi-ronments.
ARVIDA RDF protocol and vocabulary was developed in the pub-licly funded "ARVIDA" research project (see Keppmann et al. [203])This novel standard for polling spatial data using linked data RDFsis supported by the multi-kinect system.
7.6.2.8 3D Point Cloud Fusion
Besides skeletal tracking data, the tracking service also allows pollingof the latest reconstruction of the 3D scene point clouds. Due to largevolumes of 3D point cloud data, the tracking service uses protobufprotocol to compress these 3D point clouds in real-time. Even whenon the fly compression algorithms are used, sub-sampling the pointclouds 1:5 is required in order to transmit data from six sensors in a1 Gbit/s local area network.
Fusion service has determined an extrinsic transformation matrixbetween the depth cameras of each sensor. Using this common coor-dinate frame between the master sensor and the slave sensors can beutilized to generate a merged, live real time point cloud consistingof depth information of multiple sensors. Figure 7.12 illustrates thefusion of two point clouds in real time. Red and black dots indicateinformation from each camera.
Background substraction of static contents is implemented easily,since silhouette points of the tracked human are given by Kinect SDK.For instance, Shapiro et al. uses such rapid avatar captures for in-terative simulations [225] Li et al. for Kinect 3D self-portraits [226]and Zhao reconstructs human body shapes from commodity depth
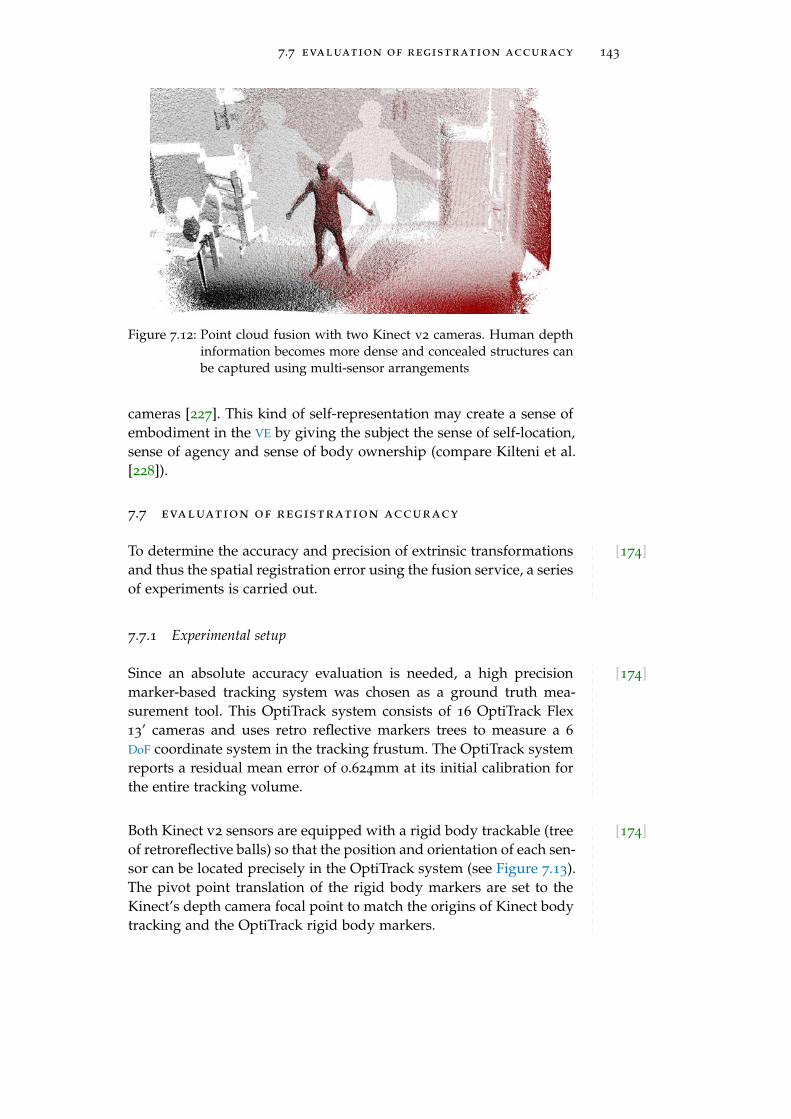
7.7 evaluation of registration accuracy 143
Figure 7.12: Point cloud fusion with two Kinect v2 cameras. Human depthinformation becomes more dense and concealed structures canbe captured using multi-sensor arrangements
cameras [227]. This kind of self-representation may create a sense ofembodiment in the VE by giving the subject the sense of self-location,sense of agency and sense of body ownership (compare Kilteni et al.[228]).
7.7 evaluation of registration accuracy
[174]To determine the accuracy and precision of extrinsic transformationsand thus the spatial registration error using the fusion service, a seriesof experiments is carried out.
7.7.1 Experimental setup
[174]Since an absolute accuracy evaluation is needed, a high precisionmarker-based tracking system was chosen as a ground truth mea-surement tool. This OptiTrack system consists of 16 OptiTrack Flex13’ cameras and uses retro reflective markers trees to measure a 6
DoF coordinate system in the tracking frustum. The OptiTrack systemreports a residual mean error of 0.624mm at its initial calibration forthe entire tracking volume.
[174]Both Kinect v2 sensors are equipped with a rigid body trackable (treeof retroreflective balls) so that the position and orientation of each sen-sor can be located precisely in the OptiTrack system (see Figure 7.13).The pivot point translation of the rigid body markers are set to theKinect’s depth camera focal point to match the origins of Kinect bodytracking and the OptiTrack rigid body markers.
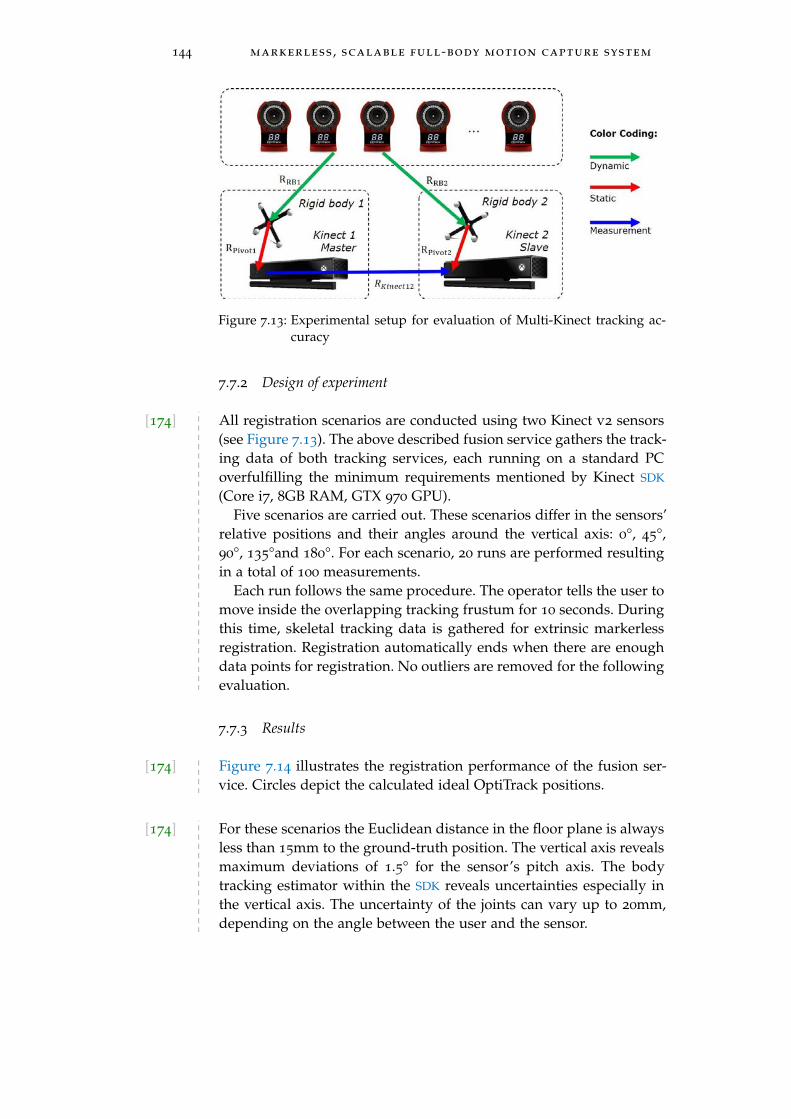
144 markerless , scalable full-body motion capture system
Figure 7.13: Experimental setup for evaluation of Multi-Kinect tracking ac-curacy
7.7.2 Design of experiment
[174] All registration scenarios are conducted using two Kinect v2 sensors(see Figure 7.13). The above described fusion service gathers the track-ing data of both tracking services, each running on a standard PCoverfulfilling the minimum requirements mentioned by Kinect SDK
(Core i7, 8GB RAM, GTX 970 GPU).Five scenarios are carried out. These scenarios differ in the sensors’
relative positions and their angles around the vertical axis: 0°, 45°,90°, 135°and 180°. For each scenario, 20 runs are performed resultingin a total of 100 measurements.
Each run follows the same procedure. The operator tells the user tomove inside the overlapping tracking frustum for 10 seconds. Duringthis time, skeletal tracking data is gathered for extrinsic markerlessregistration. Registration automatically ends when there are enoughdata points for registration. No outliers are removed for the followingevaluation.
7.7.3 Results
[174] Figure 7.14 illustrates the registration performance of the fusion ser-vice. Circles depict the calculated ideal OptiTrack positions.
[174] For these scenarios the Euclidean distance in the floor plane is alwaysless than 15mm to the ground-truth position. The vertical axis revealsmaximum deviations of 1.5° for the sensor’s pitch axis. The bodytracking estimator within the SDK reveals uncertainties especially inthe vertical axis. The uncertainty of the joints can vary up to 20mm,depending on the angle between the user and the sensor.
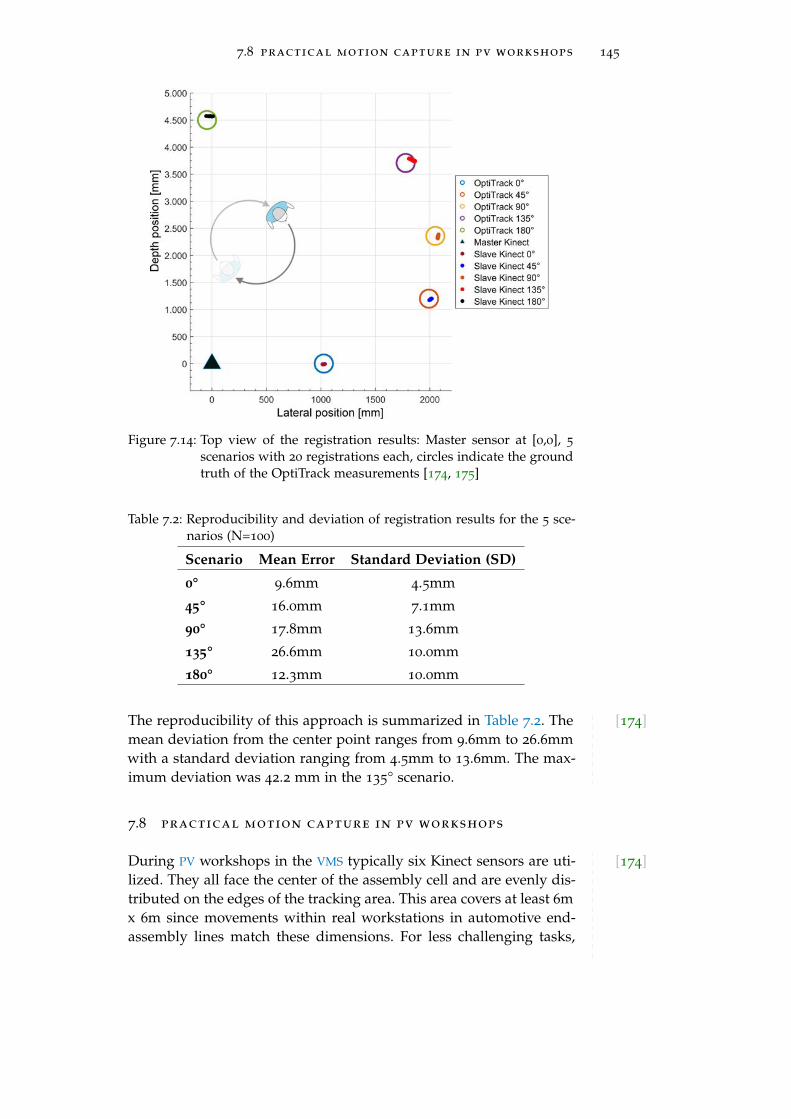
7.8 practical motion capture in pv workshops 145
Figure 7.14: Top view of the registration results: Master sensor at [0,0], 5
scenarios with 20 registrations each, circles indicate the groundtruth of the OptiTrack measurements [174, 175]
Table 7.2: Reproducibility and deviation of registration results for the 5 sce-narios (N=100)
Scenario Mean Error Standard Deviation (SD)
0° 9.6mm 4.5mm
45° 16.0mm 7.1mm
90° 17.8mm 13.6mm
135° 26.6mm 10.0mm
180° 12.3mm 10.0mm
[174]The reproducibility of this approach is summarized in Table 7.2. Themean deviation from the center point ranges from 9.6mm to 26.6mmwith a standard deviation ranging from 4.5mm to 13.6mm. The max-imum deviation was 42.2 mm in the 135° scenario.
7.8 practical motion capture in pv workshops
[174]During PV workshops in the VMS typically six Kinect sensors are uti-lized. They all face the center of the assembly cell and are evenly dis-tributed on the edges of the tracking area. This area covers at least 6mx 6m since movements within real workstations in automotive end-assembly lines match these dimensions. For less challenging tasks,

146 markerless , scalable full-body motion capture system
Figure 7.15: Block diagram of data pipeline for digital human simulation inDelmia V5
two Kinect sensors with a parallel arrangement and a distance of 1.5m proved to work reliably.
Having registered all cameras to a common world coordinate frame,the system architecture presented in combination with the fusionheuristics enable constant tracking of the worker regardless of his po-sition and his orientation within the concatenated tracking frustum.
Besides the presented "veo" tracking pipeline (see Section 6.3.5), an-other working simulation pipeline for ergonomic assessments in theVMS includes the usage of "Delmia V5-6 R23" in combination with"Haption RTID" plugin, as shown in Figure 7.15. The "fusion service"exposes all fused skeletons as 6 DoF tracking data via the A.R.TrackingdTrack protocol. Haption "Real-Time Interaction for Delmia" receivesskeleton datagrams in the integrated real-time physics engine andmaps them onto a fully flexible virtual human in Delmia V5. In thiscase, only 20 out of 25 skeletal joints are used to manipulate the DHM
interactively. RTID uses a spring-damper retargeting algorithm withdynamic weighting of skeletal joint influences. This modification isrequired as marker-based tracking systems deliver reliable orienta-tion data in contrast to Kinect skeletal tracking. Calibration betweenvirtual and physical human is carried out by executing a T-Pose inphysical space, offseting between tracking data and the virtual hu-mans is minimized.
Using this pipeline, the DHM matches the size of the physicallytracked user. Even though theoretically the DHM should be the samesize as the real user, practice has shown that the tracking results aremore stable when the DHM is 5 cm smaller than the physical user.
Figure 7.16 depicts a Delmia V5 VE having a virtual car body inthe assembly status of the respective workstation. Dynamic parts aresimulated and attached to the right hand joint. The anthropometryof the virtual human is adjusted to the real worker’s size and weight.Limitations of the pre-planned process and unfavorable ergonomicsituations can be identified using this virtual assessment pipeline.Additionally, the results gathered could be verified by subsequenttraditional hardware workshops.
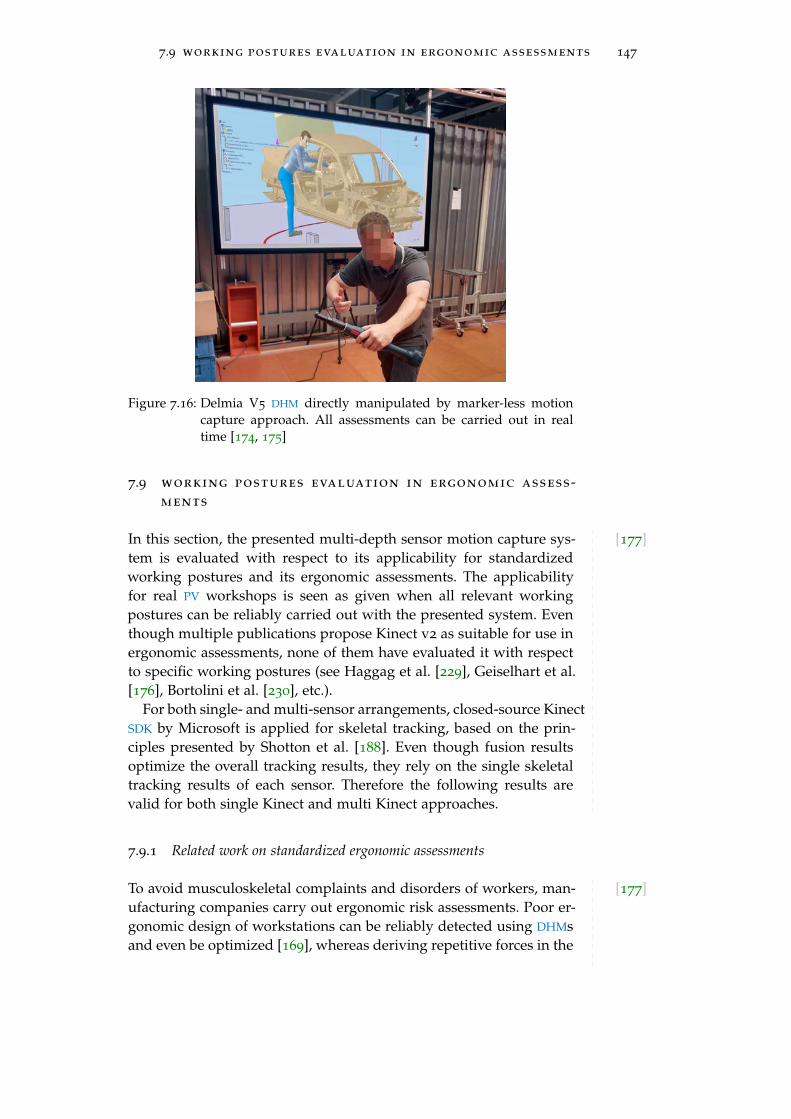
7.9 working postures evaluation in ergonomic assessments 147
Figure 7.16: Delmia V5 DHM directly manipulated by marker-less motioncapture approach. All assessments can be carried out in realtime [174, 175]
7.9 working postures evaluation in ergonomic assess-ments
[177]In this section, the presented multi-depth sensor motion capture sys-tem is evaluated with respect to its applicability for standardizedworking postures and its ergonomic assessments. The applicabilityfor real PV workshops is seen as given when all relevant workingpostures can be reliably carried out with the presented system. Eventhough multiple publications propose Kinect v2 as suitable for use inergonomic assessments, none of them have evaluated it with respectto specific working postures (see Haggag et al. [229], Geiselhart et al.[176], Bortolini et al. [230], etc.).
For both single- and multi-sensor arrangements, closed-source KinectSDK by Microsoft is applied for skeletal tracking, based on the prin-ciples presented by Shotton et al. [188]. Even though fusion resultsoptimize the overall tracking results, they rely on the single skeletaltracking results of each sensor. Therefore the following results arevalid for both single Kinect and multi Kinect approaches.
7.9.1 Related work on standardized ergonomic assessments
[177]To avoid musculoskeletal complaints and disorders of workers, man-ufacturing companies carry out ergonomic risk assessments. Poor er-gonomic design of workstations can be reliably detected using DHMsand even be optimized [169], whereas deriving repetitive forces in the
148 markerless , scalable full-body motion capture system
virtual domain is still hard to assess. Typical ergonomic assessmentmethods for tackling workstation assessments are screening tools forphysical workload.
In the automotive industry, plenty of ergonomic screening methodsare applied, such as the rapid upper limbs assessment (RULA) [231],rapid entire body assessment (REBA) [232], NIOSH [233], OCRA [234]and more regional ones, such as NPW, Design Check [235] and AAWS.Besides those screening methods, EAWS by Fraunhofer IAD [66] is pri-marily used by European automakers since the aforementioned er-gonomic assessment methods are either predecessors or compatiblewith EAWS. International standards for minimum ergonomic require-ments are presented in ISO 11226 for postures and ISO 11228 foractions [66]. These screening tools are often integrated in assemblyassessment simulation systems [236], [172]. At present, synthesizedmotions of DHMs often lack accuracy and parameterization capabil-ities which leads to vague assessment results and time-consumingauthoring [125]. Therefore pen & paper-based assessment methodsare still state of the art.
EAWS is widely used by European car manufacturers and automo-tive suppliers [230], [237]. It penalizes unfavorable physical work-loads with "load points" and deduces an overall risk assessment. "The EAWS consists of four sections for the evaluation of working pos-tures and movements with low additional physical efforts (< 30-40 Nor 3-4 kg respectively), action forces of the whole body or hand fingersystem, manual materials handling and repetitive loads of the upperlimbs." [66]. Working postures are assessed as "static working pos-tures and high frequent movements are estimated" [66]. "Symmetricworking postures for standing, sitting, kneeling & crouching and ly-ing & climbing are rated" as well as "asymmetric effects like rotation,lateral bending, and far reach" [66].
7.9.2 Study goal, setup and evaluation method
[177] An ergonomics expert using a virtual environment with an animatedDHM must be able to reliably assess the overall process and come tothe same conclusions as by assessing the physical domain. The fol-lowing evaluation aims at answering the question whether Kinect v2
as a standalone system as well as the multi-sensor system presentedby Otto et al. [174] are able to deliver assessable results for EAWS
working posture assessments. Similar to the following applicabilityanalysis, Haggag et al. evaluated Kinect v1 for rapid upper limb as-sessment (RULA) using an automated assessment approach in 2013
[229].EAWS working postures were evaluated below with regard to whether
they can be carried out by using the presented markerless motion cap-
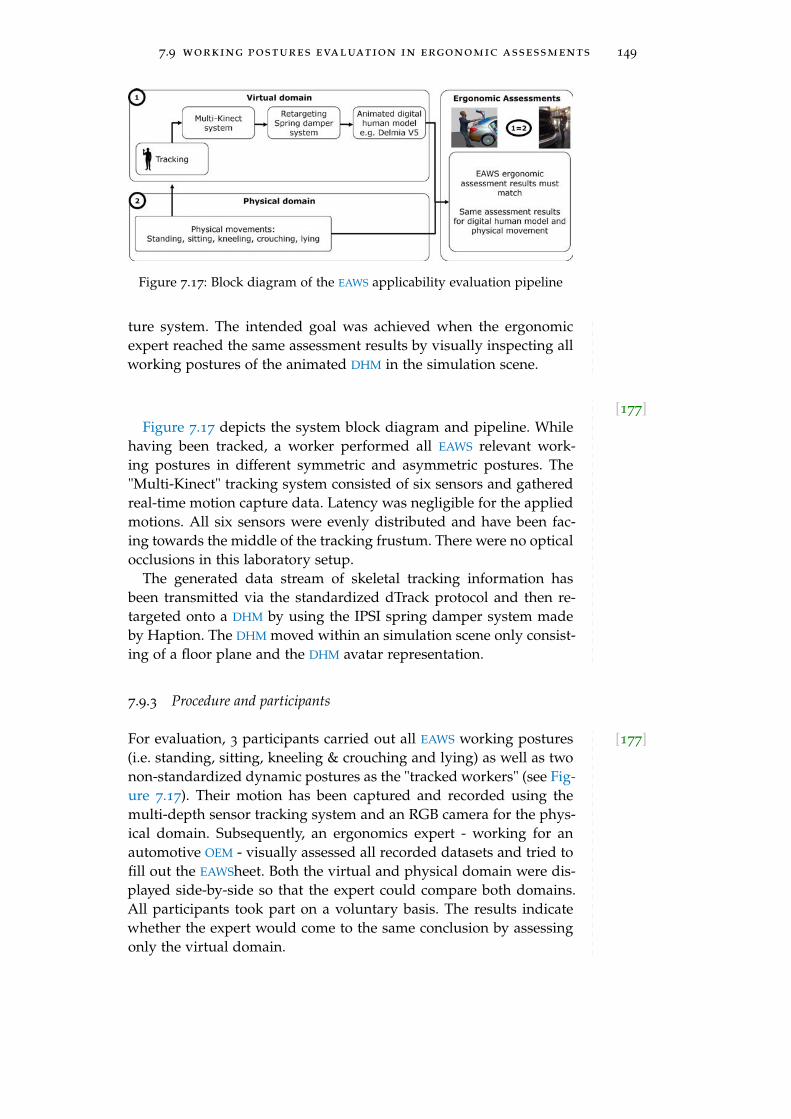
7.9 working postures evaluation in ergonomic assessments 149
Figure 7.17: Block diagram of the EAWS applicability evaluation pipeline
ture system. The intended goal was achieved when the ergonomicexpert reached the same assessment results by visually inspecting allworking postures of the animated DHM in the simulation scene.
[177]Figure 7.17 depicts the system block diagram and pipeline. While
having been tracked, a worker performed all EAWS relevant work-ing postures in different symmetric and asymmetric postures. The"Multi-Kinect" tracking system consisted of six sensors and gatheredreal-time motion capture data. Latency was negligible for the appliedmotions. All six sensors were evenly distributed and have been fac-ing towards the middle of the tracking frustum. There were no opticalocclusions in this laboratory setup.
The generated data stream of skeletal tracking information hasbeen transmitted via the standardized dTrack protocol and then re-targeted onto a DHM by using the IPSI spring damper system madeby Haption. The DHM moved within an simulation scene only consist-ing of a floor plane and the DHM avatar representation.
7.9.3 Procedure and participants
[177]For evaluation, 3 participants carried out all EAWS working postures(i.e. standing, sitting, kneeling & crouching and lying) as well as twonon-standardized dynamic postures as the "tracked workers" (see Fig-ure 7.17). Their motion has been captured and recorded using themulti-depth sensor tracking system and an RGB camera for the phys-ical domain. Subsequently, an ergonomics expert - working for anautomotive OEM - visually assessed all recorded datasets and tried tofill out the EAWSheet. Both the virtual and physical domain were dis-played side-by-side so that the expert could compare both domains.All participants took part on a voluntary basis. The results indicatewhether the expert would come to the same conclusion by assessingonly the virtual domain.
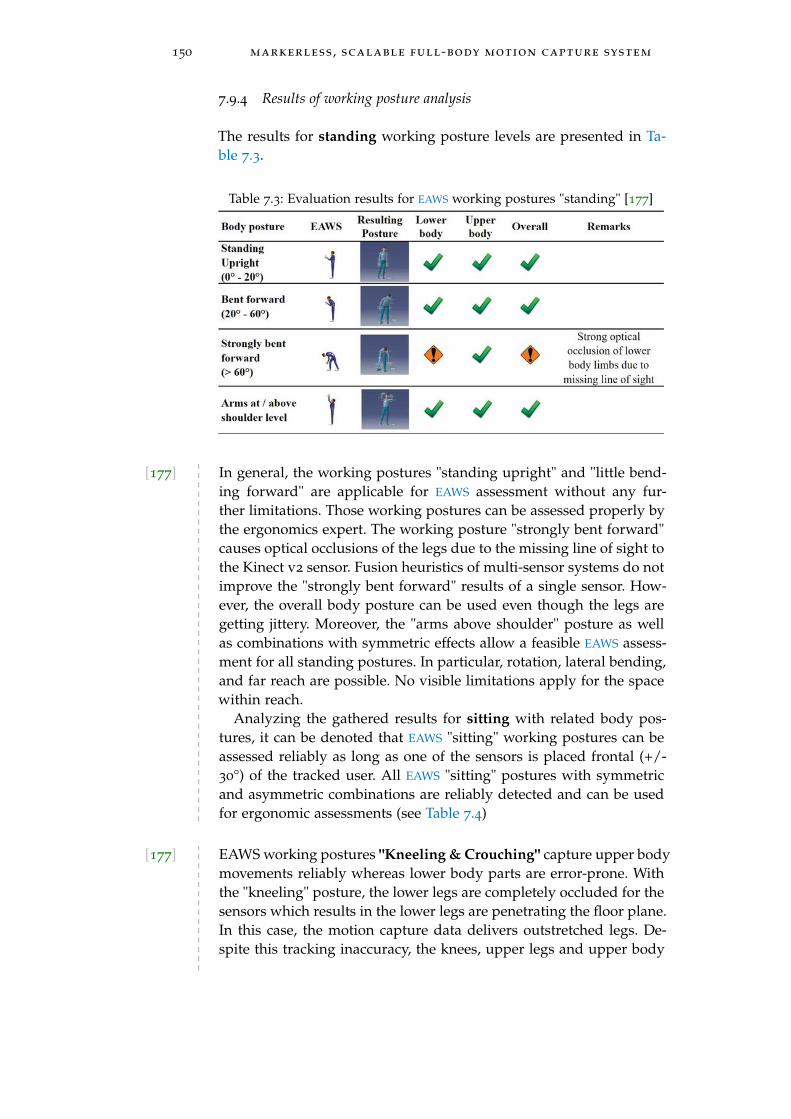
150 markerless , scalable full-body motion capture system
7.9.4 Results of working posture analysis
The results for standing working posture levels are presented in Ta-ble 7.3.
Table 7.3: Evaluation results for EAWS working postures "standing" [177]
[177] In general, the working postures "standing upright" and "little bend-ing forward" are applicable for EAWS assessment without any fur-ther limitations. Those working postures can be assessed properly bythe ergonomics expert. The working posture "strongly bent forward"causes optical occlusions of the legs due to the missing line of sight tothe Kinect v2 sensor. Fusion heuristics of multi-sensor systems do notimprove the "strongly bent forward" results of a single sensor. How-ever, the overall body posture can be used even though the legs aregetting jittery. Moreover, the "arms above shoulder" posture as wellas combinations with symmetric effects allow a feasible EAWS assess-ment for all standing postures. In particular, rotation, lateral bending,and far reach are possible. No visible limitations apply for the spacewithin reach.
Analyzing the gathered results for sitting with related body pos-tures, it can be denoted that EAWS "sitting" working postures can beassessed reliably as long as one of the sensors is placed frontal (+/-30°) of the tracked user. All EAWS "sitting" postures with symmetricand asymmetric combinations are reliably detected and can be usedfor ergonomic assessments (see Table 7.4)
[177] EAWS working postures "Kneeling & Crouching" capture upper bodymovements reliably whereas lower body parts are error-prone. Withthe "kneeling" posture, the lower legs are completely occluded for thesensors which results in the lower legs are penetrating the floor plane.In this case, the motion capture data delivers outstretched legs. De-spite this tracking inaccuracy, the knees, upper legs and upper body
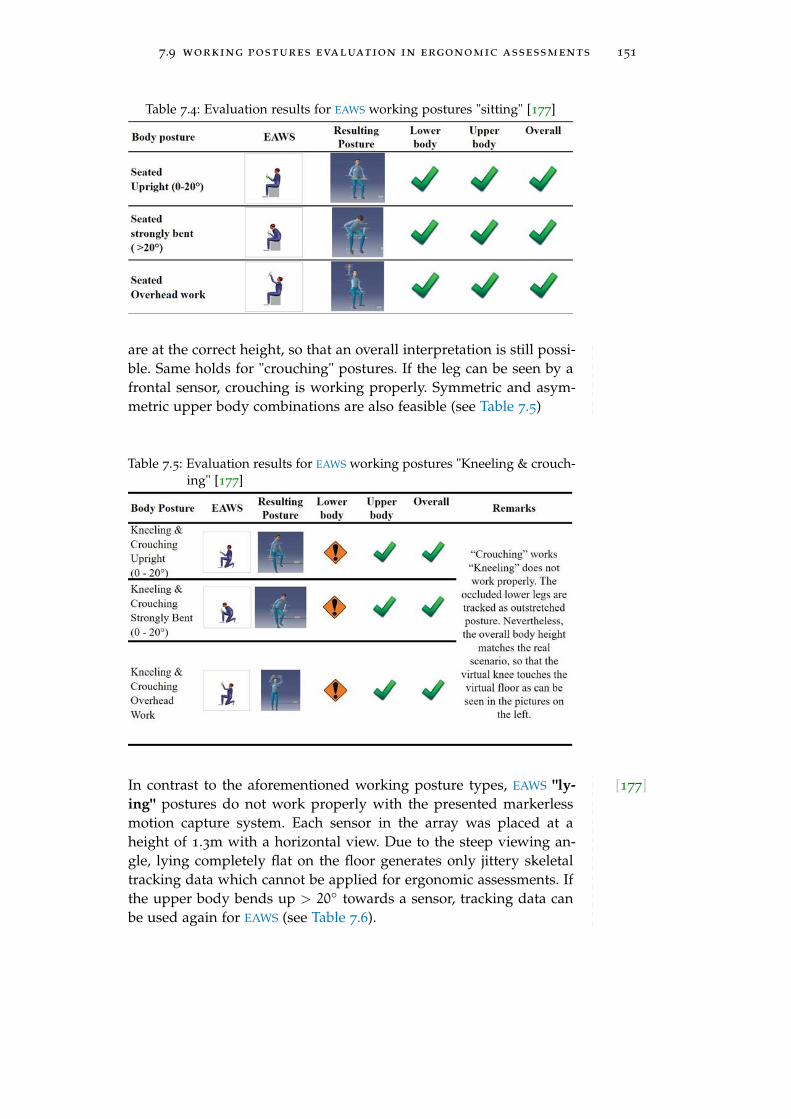
7.9 working postures evaluation in ergonomic assessments 151
Table 7.4: Evaluation results for EAWS working postures "sitting" [177]
are at the correct height, so that an overall interpretation is still possi-ble. Same holds for "crouching" postures. If the leg can be seen by afrontal sensor, crouching is working properly. Symmetric and asym-metric upper body combinations are also feasible (see Table 7.5)
Table 7.5: Evaluation results for EAWS working postures "Kneeling & crouch-ing" [177]
[177]In contrast to the aforementioned working posture types, EAWS "ly-ing" postures do not work properly with the presented markerlessmotion capture system. Each sensor in the array was placed at aheight of 1.3m with a horizontal view. Due to the steep viewing an-gle, lying completely flat on the floor generates only jittery skeletaltracking data which cannot be applied for ergonomic assessments. Ifthe upper body bends up > 20◦ towards a sensor, tracking data canbe used again for EAWS (see Table 7.6).

152 markerless , scalable full-body motion capture system
Table 7.6: Evaluation results for EAWS working postures "lying" [177]
[177] Assessing the multi-sensor system’s performance for dynamic pos-tures, two non-standardized dynamic posture evaluations are carriedout. In a 360° rotation experiment, the tracked user constantly turnsaround a pole so that skeletal hand-over between sensors can be eval-uated. Tracking data is handed over properly between all six sensors,even the hand sticks on the virtual pole and the movement is properlymapped on the DHM. Second, the entire space within reach is evalu-ated. No additional limitations compared to physical restrictions havebeen detected using skeletal tracking (see Table 7.7).
Table 7.7: Evaluation results for working postures "dynamic postures." 360°rotation only applies for multi-depth camera setups [177]
7.9.5 Discussion
[177] All in all, the Kinect v2 skeletal tracker extended with the multi-depthcamera tracking algorithms and the retargeting system proved to besuitable for use in ergonomic assessments in accordance with EAWS.Overall, 9 out of 11 full body postures can be used for ergonomicassessments. Optical occlusions cause jittery and unusable motioncapture data while strongly bending forward, lying flat on the floor

7.10 flexible , visually low-occluding pmus 153
and kneeling on the floor. These optical occlusions become more in-tense when having large-scale PMUs inside the VMS as they potentiallyocclude tracked users.
7.10 flexible , visually low-occluding pmus
As determined in the ergonomics study described above, the overallresults are heavily influenced by sensor arrangement and amount ofsensors. As ToF sensors are optical tracking devices they require a di-rect line of sight for robust skeletal tracking. Despite the developedfusion heuristics, at least one sensor needs a good, frontal view (dis-tance > 1m, low vertical rotation) of the tracked subject. A properarrangement of depth-sensors minimizes the optical occlusions fortracked users and optimizes the views for frontal user captures.
PMUs are used by the tracked users to generate a sensation of phys-ical barriers for kneeling, sitting, bending over. For instance, the userhas to bend into the trunk to mount a control unit or has to sit inthe empty interior of the PMU in order to mount car ceiling parts. Asdepicted in Figure 7.1, in PV workshops PMU are regularly integratedin the assessments, for instance a full car chassis. However, the useof PMUs in combination with skeletal tracking may result in manyocclusions in the VMS.
In order to maintain a good markerless tracking performance, inthe following abstract, flexible, optically low intrusive PMUs are pro-posed: These PMUs are constructed so as to minimize optical occlu-sions. They can be either built from wooden-based, cardboard-based,carbon fiber-based or aluminum-based materials. Four types of dum-mies are proposed. Each of them is constructed with a diameter of2 cm to have as little optical occlusion as possible and made out ofaluminum profiles to minimize the influence on the skeletal track-ing result. Nevertheless, these profiles are strong enough to providehaptic support.
The requirements of these four flexible PMUs have been deducedfrom ergonomic posture assessments (EAWS), practical motion cap-ture sessions and constraint affordances. The flexible mock-ups arepresented in Table 7.8. For ergonomic assessments, typical movementsare sitting, bending over, lying, leaning and getting lateral supportand holding on to sth. (compare with EAWS [66])
All presented flexible PMUs can be tracked with markers so that thephysical mock-up is registered in relation to the DHM in the virtualscene. This facilitates rearrangement of the PMUs and of course ori-entation of the user in the virtual scene. For example, different workheights can be validated simply by changing the height of the trackedhorizontal bar of the PMU. The virtually represented object itself, suchas the trunk door, changes its height accordingly.
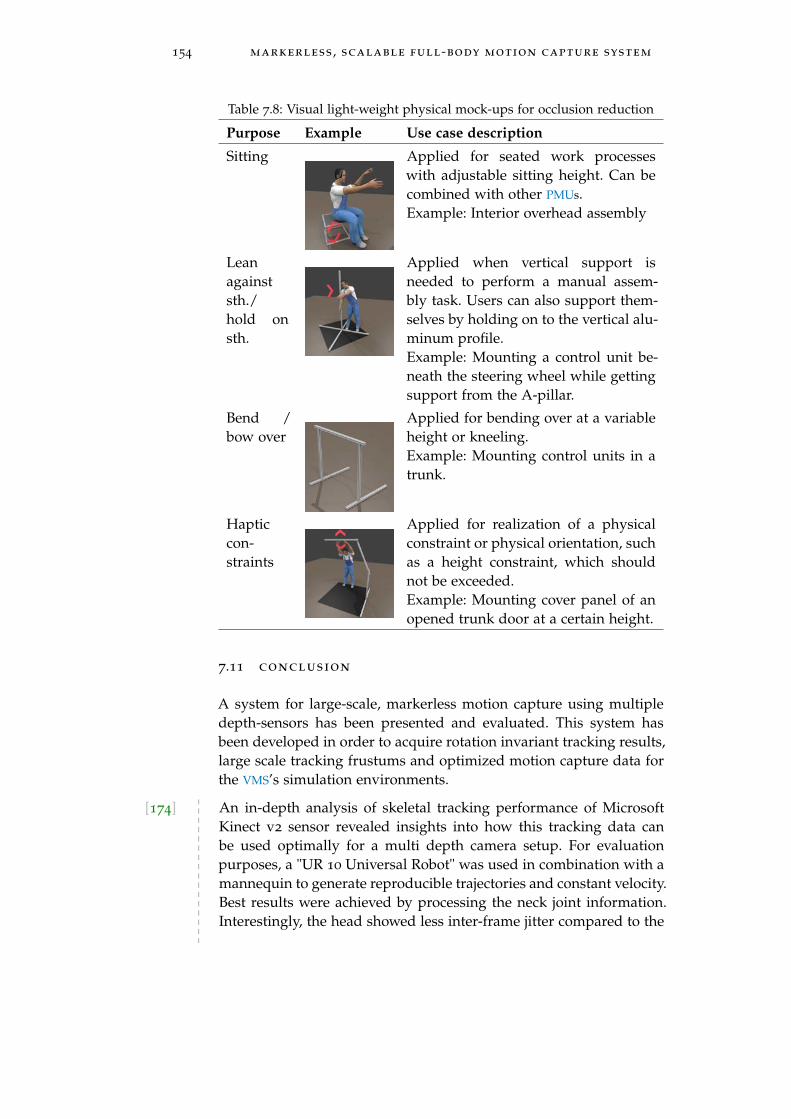
154 markerless , scalable full-body motion capture system
Table 7.8: Visual light-weight physical mock-ups for occlusion reduction
Purpose Example Use case description
Sitting Applied for seated work processeswith adjustable sitting height. Can becombined with other PMUs.Example: Interior overhead assembly
Leanagainststh./hold onsth.
Applied when vertical support isneeded to perform a manual assem-bly task. Users can also support them-selves by holding on to the vertical alu-minum profile.Example: Mounting a control unit be-neath the steering wheel while gettingsupport from the A-pillar.
Bend /bow over
Applied for bending over at a variableheight or kneeling.Example: Mounting control units in atrunk.
Hapticcon-straints
Applied for realization of a physicalconstraint or physical orientation, suchas a height constraint, which shouldnot be exceeded.Example: Mounting cover panel of anopened trunk door at a certain height.
7.11 conclusion
A system for large-scale, markerless motion capture using multipledepth-sensors has been presented and evaluated. This system hasbeen developed in order to acquire rotation invariant tracking results,large scale tracking frustums and optimized motion capture data forthe VMS’s simulation environments.
[174] An in-depth analysis of skeletal tracking performance of MicrosoftKinect v2 sensor revealed insights into how this tracking data canbe used optimally for a multi depth camera setup. For evaluationpurposes, a "UR 10 Universal Robot" was used in combination with amannequin to generate reproducible trajectories and constant velocity.Best results were achieved by processing the neck joint information.Interestingly, the head showed less inter-frame jitter compared to the
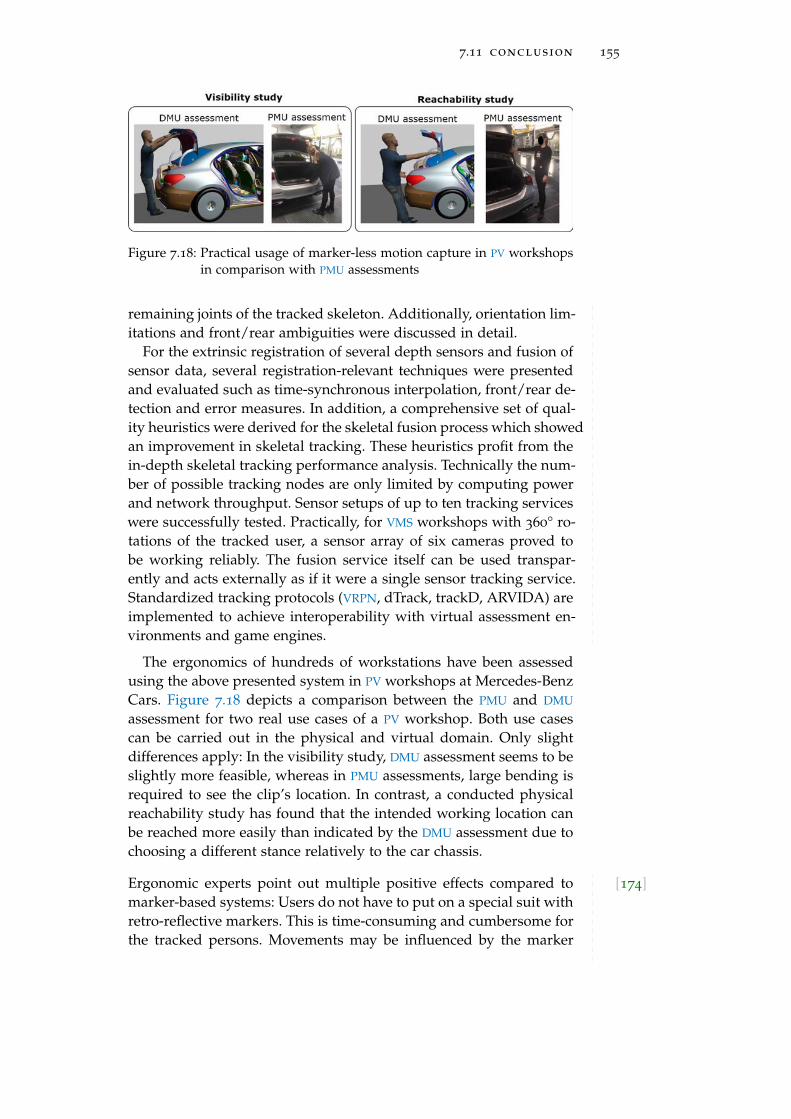
7.11 conclusion 155
Figure 7.18: Practical usage of marker-less motion capture in PV workshopsin comparison with PMU assessments
remaining joints of the tracked skeleton. Additionally, orientation lim-itations and front/rear ambiguities were discussed in detail.
For the extrinsic registration of several depth sensors and fusion ofsensor data, several registration-relevant techniques were presentedand evaluated such as time-synchronous interpolation, front/rear de-tection and error measures. In addition, a comprehensive set of qual-ity heuristics were derived for the skeletal fusion process which showedan improvement in skeletal tracking. These heuristics profit from thein-depth skeletal tracking performance analysis. Technically the num-ber of possible tracking nodes are only limited by computing powerand network throughput. Sensor setups of up to ten tracking serviceswere successfully tested. Practically, for VMS workshops with 360° ro-tations of the tracked user, a sensor array of six cameras proved tobe working reliably. The fusion service itself can be used transpar-ently and acts externally as if it were a single sensor tracking service.Standardized tracking protocols (VRPN, dTrack, trackD, ARVIDA) areimplemented to achieve interoperability with virtual assessment en-vironments and game engines.
The ergonomics of hundreds of workstations have been assessedusing the above presented system in PV workshops at Mercedes-BenzCars. Figure 7.18 depicts a comparison between the PMU and DMU
assessment for two real use cases of a PV workshop. Both use casescan be carried out in the physical and virtual domain. Only slightdifferences apply: In the visibility study, DMU assessment seems to beslightly more feasible, whereas in PMU assessments, large bending isrequired to see the clip’s location. In contrast, a conducted physicalreachability study has found that the intended working location canbe reached more easily than indicated by the DMU assessment due tochoosing a different stance relatively to the car chassis.
[174]Ergonomic experts point out multiple positive effects compared tomarker-based systems: Users do not have to put on a special suit withretro-reflective markers. This is time-consuming and cumbersome forthe tracked persons. Movements may be influenced by the marker
156 markerless , scalable full-body motion capture system
suits and seem not as natural as in regular working clothes. In ad-dition, users can swap immediately without any preparation time,so that multiple users can test the process without any prior work.Furthermore, experts appreciate the side benefits of this tracking ap-proach such as visibility checks through interactive viewpoint control.
Nevertheless, on the down side the markerless system induces morelatency and jitter to the tracking data than the marker-based trackingsystem. Ergonomic experts point out that the motion capture dataquality is still sufficient for most work tasks to identify and solvethe issues. Latency of several frames is considered to be irrelevant. Itbecomes apparent that registration as well as fusion accuracy and pre-cision are sufficient for human posture analysis, profound ergonomicsimulations and for large-scale view point control applications in vir-tual environments.
7.11.1 Limitations
Overall, by using the system some limitations have been revealed,which could not be resolved even by fusion of multiple sensors:
Dark to black clothes of tracked subjects have problems beingtracked reliably since reflection parameters for the ToF sensors deliverjittery data.
High precision tracking data (<1cm) cannot be delivered by KinectSDK. Even when fusing these data, precision does not reach sub mil-limeter precision. This impedes the use for buildability product as-sessment with narrow clearances. A marker-based optical trackingsystem can be fused for end effector tracking, such as virtual handrepresentations or tooling such as screw drivers.
Finger tracking is not possible by using standard SDK tools. For PV
workshops, eight standard hand poses can be either statically set or afusion with an external leap motion finger tracking sensor is used inorder to manipulate fingers as well (see Qian et al. for hand trackingusing depth sensors [198])
Since Kinect SDK does not calculate the orientation of head joint itis approximated using the ShoulderLeft and ShoulderRight joints. Forvisibility assessments, reconstructing a virtual view cone is possiblebut sometimes not as accurate as required.
Usage of optically heavy PMUs is generally feasible. To avoid jitter,multiple ways are proposed, namely (1) adjusting the position andorientation of the sensors in PV workshops, (2) adjusting the amountof sensors in the arrangement or (3) using optically low intrusivePMUs. The latter is presented as a method for achieving haptic feed-back in the physical domain, while maintaining good tracking resultsin the virtual domain.
7.11 conclusion 157
7.11.2 Fulfilled requirements
In accordance with the VMS key properties (see Section 5.2), Table 7.9shows a realization analysis of whether the developed multi-depthcamera tracking system meets the VMS’s tracking requirements:
The presented system is capable of practically supporting manyPV verification criteria. For example, the motion capture system canbe used as a tracking device for simulation of dynamic part assemblyand disassembly paths when attaching a tracker to the physical ob-ject. Reachability and overhead assembly simulation works well (seeFigure 7.18). Visibility assessments of mounting points work but theyare limited by bending the neck in a horizontal manner. Body forces,hand/finger forces cannot be simulated using this motion capturesystem at this time, even though the literature has proposed force es-timation using MoCap data. Motion capture data are not used for timemeasurement of physical processes due to legal aspects. All opera-tional resources, accessibility for tooling, intra-logistics and designingcell layouts can be used in combination with the proposed motioncapture system.
A requirement analysis showed that for ergonomics-related assess-ments, such as EAWS body posture analysis, the presented systemcan be applied properly. Analogously, Haggag et al. conclude thatKinect’s "motion capture capability makes it suitable for detectingthe risk of injury and recording posture in the workplace" [229]. Noforce analyses are feasible and orientation tracking is limited as well.Even though no joint forces and torque can be measured currently,Planard et al. propose a system to use skeletal Kinect data to estimatethese measures using an inverse dynamics method [238]. With thismethod, they find that forces and torques can be determined reliablyfor shoulder joints even in cluttered environments.
[174]Overall, the multi-depth sensor system has proved its applicabilityand therefore reduces preparation times compared to marker-basedsystems, reduces costs and increases ease-of-use due to fast trackedsubject change. It is shown that performance and applicability of thesystem is suitable for use in manufacturing industry and can be seenas a complementary system to conventional high-end marker-basedsystems in this domain.
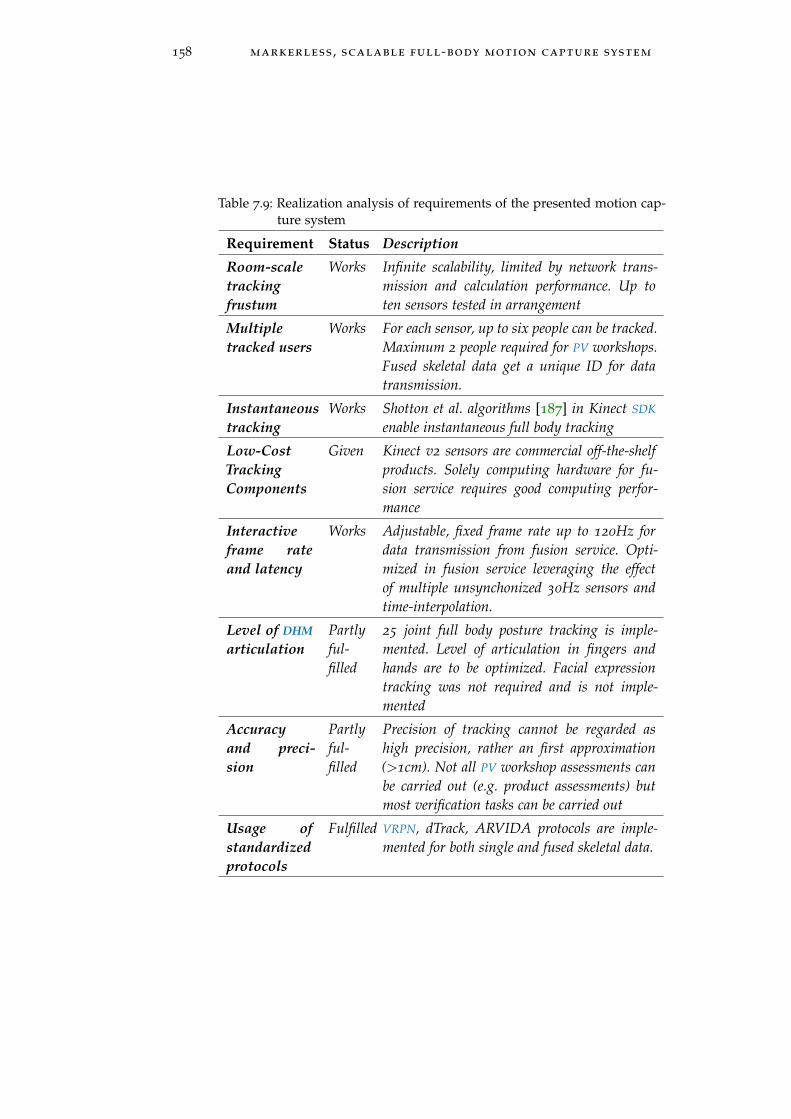
158 markerless , scalable full-body motion capture system
Table 7.9: Realization analysis of requirements of the presented motion cap-ture system
Requirement Status Description
Room-scaletrackingfrustum
Works Infinite scalability, limited by network trans-mission and calculation performance. Up toten sensors tested in arrangement
Multipletracked users
Works For each sensor, up to six people can be tracked.Maximum 2 people required for PV workshops.Fused skeletal data get a unique ID for datatransmission.
Instantaneoustracking
Works Shotton et al. algorithms [187] in Kinect SDK
enable instantaneous full body tracking
Low-CostTrackingComponents
Given Kinect v2 sensors are commercial off-the-shelfproducts. Solely computing hardware for fu-sion service requires good computing perfor-mance
Interactiveframe rateand latency
Works Adjustable, fixed frame rate up to 120Hz fordata transmission from fusion service. Opti-mized in fusion service leveraging the effectof multiple unsynchonized 30Hz sensors andtime-interpolation.
Level of DHM
articulationPartlyful-filled
25 joint full body posture tracking is imple-mented. Level of articulation in fingers andhands are to be optimized. Facial expressiontracking was not required and is not imple-mented
Accuracyand preci-sion
Partlyful-filled
Precision of tracking cannot be regarded ashigh precision, rather an first approximation(>1cm). Not all PV workshop assessments canbe carried out (e.g. product assessments) butmost verification tasks can be carried out
Usage ofstandardizedprotocols
Fulfilled VRPN, dTrack, ARVIDA protocols are imple-mented for both single and fused skeletal data.
8WA L L - S I Z E D , H I G H R E S O L U T I O NV I S U A L I Z AT I O N H A R D WA R E S Y S T E M S
[239]Large High-Resolution Displays (LHRD)s provide an enabling tech-nology to achieve immersive, isometrically registered virtual environ-ments. Wall-sized visualization hardware is becoming more and morecommon in research, entertainment, public signage - and of courseindustry. The reasons for this are that technical specifications are con-stantly increasing while prices are simultaneously decreasing.
This trend especially applies for the two most common types ofwall-sized visualization hardware: LED walls and projector systems.Both LHRD technologies are able to display large amounts of infor-mation such as alphanumeric data, 3D CAD files and immersive ex-periences. LHRDs can also be found in increasing numbers of publicsignage installations as shared interaction spaces for content whichis presented in an interesting manner, new interaction forms and col-laboration (see Peltonen et al. [240]). Even more, immersive displaytechnologies are expected to allow more accurate size judgments, im-proved collaboration performance in workshops and reduced taskcompletion time [241]. However, according to Andrews et al. [242],the advantages of additional pixels — generated by high pixel den-sities and large installations — can only be realized "through under-standing of the interaction between visualization design, perception,interaction techniques, and the display technology" [242].
The realization of such an output device follows the key proper-ties of the VMS framework (see Section 5.2) and consequently aimsto improve PV workshops. These requirements have been deduced inmultiple, iterative workshops with potential customers:
• Original size output: An entire manufacturing workplace in au-tomotive general assembly requires a original size visualizationso that the whole product and work place can be seen at once.According to VMS requirements, a floor visualization system isdefined to the minimum dimensions of 6m x 3m since that isthe size of a typical work place.
• Co-location: Workshop participants can collaborate in the sameVE at the same time without being remotely connected.
• Spatial integration of PMU and DMU: As a consequence of orig-inal size output, physical dimensions of tracked objects, partsand humans can be adjusted to match the virtual dimensions.
159

160 wall-sized, high resolution visualization hardware systems
This allows for augmentation of physical parts with virtual con-tents. No teleportation of single virtual components is intendedto be realized (in contrast to co-located teleportation approachessuch as those presented by Langbehn et al. [109])
• Multi User Support: The output devices must meet workshoprequirements for collaborative use. Collaboration performanceis a key performance indicator for properly implemented VMS
concepts.
• Asymmetric output for VR/AR: In contrast to symmetric collab-orative VR/AR concepts, where all workshop participants per-ceive individual views on the VE using the same visualizationdevice, an asymmetric visualization approach is proposed (com-pare with Gugenheimer et al. [111]). Large workshop groupsshare a common view of the virtual scene using power walls,whereas selected users choose an individual view of the sceneand interact with it simultaneously.
An iterative implementation and evaluation of two visualizationhardware systems is presented below. First, a prototype of a floorprojection system is described using scalable floor projection in orderto prove technical feasibility and demonstrate application use casesof original size floor visualization systems. Followed by this, a multi-person-display ecosystem, LED-based implementation is presented.Both the prototype implementation and productive LED-based sys-tem share the same requirements in order to fulfill the expected usecases and both are realized in accordance with the VMS’s key proper-ties and take advantage of original size visualization (see Section 5.2).
Using LHRDs, multiple research questions arise: Amongst other ben-efits, pervasive displays are said to allow more accurate size judg-ments, improved collaboration performance in workshops and lesstask completion time [241]. In this chapter, task completion time iscompared to state-of-the-art workshops and size judgement accuracyand precision is evaluated using a LED floor showing 2D content.
8.1 state of the art in lhrd visualization systems 161
Related publications
Multiple parts have already been presented in peer-reviewedconference posters, book chapters, conferences papers and jour-nal papers. In 2014, the conference poster "Using Scalable, In-teractive Floor Projection for Production Planning Scenario"by Otto et al. (see [93]) was presented at the ACM confer-ence "Interactive Tabletops and Surfaces" (ITS). Use cases andfurther algorithms were presented and described by the au-thor together with Agethen et al. [243], [244]. The author con-tributed to the overall setup, tracking system and the VMS inte-gration of the aforementioned publications. This setup is alsodescribed in the "Motion Capture" publication in the Springerbook entitled "Web-basierte Anwendungen Virtueller Technolo-gien" [134]. Analogously, the study on size perception usinglarge scale floor visualization systems was presented at theACM Pervasive Displays 2019 as a peer-reviewed conferencepaper [245]. In 2020, the paper "Using Large-Scale AugmentedFloor Surfaces for Industrial Applications and Evaluation onPerceived Sizes" was published in the Springer journal "Per-sonal and ubiquitous computing" [239]. Passages of the follow-ing texts have been already published and have been extendedand revised. Self-citation markings are set for [239] as this jour-nal paper extends the conference paper [245].
8.1 state of the art in lhrd visualization systems
[239]Large high-resolution displays displays are used to display largeamounts of data either for alphanumeric graphics (2D) or 3D data.In 1991, Mark Weiser published an article on "The Computer for the21st century" [246] and proposed three different clusters of visual-ization devices. He clustered these devices in three groups, namely"tab", "pad" and "board"-sized devices. These "boards" were definedas yard-sized (>91 cm) displays and it was proposed that they shouldbe used "in the home, video screens and bulletin boards; in the office,bulletin boards, white boards or flip charts." In 2009, Terrenghi et al.extended Weiser’s size taxonomy of displays to "Inch", "Foot", Yard","Perch" and "Chain", since all of them differ in their form of socialinteraction [247] within the multi-person-display ecosystems. Never-theless, in 2015 Lischke et al. [248] concluded that digital "boards" arestill rarely used. There was, however, a good chance that wall-sizeddisplay-"boards" would become commonplace within the next decadelike smartphones and tables did in the last decade" [248].
Production validation scenarios in the automotive industry requireinteractive collaborative spaces and large display devices. Such com-
162 wall-sized, high resolution visualization hardware systems
binations of multiple visualization devices are called Multi-DisplayEnvironment (MDE)s. Garcia-Sanjuan et al. present a general taxon-omy of MDEs, classifying their topology with respect to "homogene-ity of surfaces", "spatial form", "regularity of shape", "size", "mobility"and "scalability" [249] and also present many use cases in this liter-ature review. According to Lischke et al. [248], software is the keyenabler for a simple setup of multi-display environments and easyusability of these systems, which is still a hindrance factor for broaduse. As parallelization of workflows becomes more and more impor-tant, LHRDs allow for visualizing complex data or switching betweentasks without hiding required information at the same time. Rogersand Lindley analyzed collaboration in vertical and horizontal largedisplays [250] and found that the physical arrangement of publiclyshared displays affects the social roles of collaboration members, suchas switching roles more frequently, greater awareness of each otherand exploration of more ideas. These findings by Rogers and Lindley,Lischke et al. and Garcia-Sanjuan et al. have directly influenced theautomotive production planning application scenarios.
Additionally, industrial use cases aim for high efficiency whenusing LHRDs. In 2003, Czerwinski et al. analyzed performance us-ing large scale displays in comparison with regular sized desktopscreens [241]. They discovered that users’ task completion times andproductivity can be significantly increased for specific tasks by usinglarger visualization techniques. Analogously, in 2009 Bi and Balakr-ishnan supported these findings by using even larger LHRDs [251].In their week-long survey they supervised users working with anLHRD and found that LHRDs enhance the user’s awareness of periph-eral applications, facilitate multi-window and rich information tasksand provide an immersive experience. "The results indicate that usersunanimously prefer using a large display" [251]. Interestingly, Bi andBalakrishnan observed that "users tend to utilize the center part as thefocal region and the remaining space as the peripheral region. The re-sults also reveal that users on a large display perform more windowmoving and resizing but less minimizing and maximizing operationsas compared to a single- or dual-monitor" [251].
8.1.1 Content representation with LHRDs
[239] Having physically installed an LHRD system, users want to make thebest use of its capabilities. Therefore, adapted content representationand interaction for this type of visualization devices is crucial. An-drews et al. present design considerations, outline challenges and fu-ture opportunities for designing visualizations on LHRDs [242]. Theyanalyze physical display technologies, visual encoding, visualization

8.1 state of the art in lhrd visualization systems 163
designs and user interaction. Andrews et al. describe the benefit ofadditional pixels with the following, explicitly non-exhaustive list:
• More data entities
• Ability to show greater data dimensionality
• More data details
• Multiscale data
• More data complexity or heterogeneity
• Space for processes
• Space for sensemaking
• Enable collaboration with private and shared spaces
Complex data and large amounts of data are visualized on LHRDs.Lischke et al. conclude that using such systems enables humans toscan large areas quickly for objects and visual cues [252]. All of theseaspects are necessary in PV workshops as they bring together PPR in-formation. Many data entities are shown in parallel and representmulti-scale data and high complexity. For windowed applications,Lischke et al. explored the design space of LHRDs in 2017 by propos-ing four different graphical interfaces to be displayed in such arrange-ments [253]. They focus on windowed arrangements and admit thatit continues to be a challenging task. They propose four new align-ment techniques, namely "curved zooming, window grouping, win-dow spinning and side pane navigation" and summarize their workby exploring the design space for focus switching but keeping spatialrelations for related windows contents.
Andrews et al. examine how LHRDs support sense making and howthe increased space affects the cognitively demanding task of sensemaking [254]. They explore the idea and show that this type of spa-tial environment supports "sense making by becoming part of thedistributed cognitive process" and find "clear evidence of analysts us-ing the space both as a form of rapid access external memory andas an added semantic layer providing both external memory and asemantic layer." This flexible semantic layer adds meaning to the dis-played information such as ordering, proximity and alignment forclusters. This leads to a reduced need "for elaborate internal modelsby replacing memorization and computation with perception."
Observing the content representation and interaction with the graph-ical interfaces on LHRDs, Lischke et al. conclude that completely novelconcepts are required to present content on LHRDs. Classic ways of

164 wall-sized, high resolution visualization hardware systems
arranging and hiding windows are neither suitable nor required any-more as visualization can be parallelized thanks to the by far higherresolutions.
8.1.2 Interaction with LHRDs
[239] Lischke et al. also argue that "the success of wall-sized display in-stallations highly depends on the interaction technique used in theparticular setup" [248] and propose to get "a clear understanding ofadvantages and disadvantages of interaction techniques" used withLHRDs. All these findings are required in manufacturing, as validationscenarios typically rely on commercially available software which isnot natively built for LHRDs. Industrial applications want to leveragethe benefits of showing multi-scale data entities and massive amountsof data in parallel, such as PPR information at the same time.
For LHRDs, multiple input devices can be utilized: Classical inter-faces (e.g. mouse and keyboard), natural user interfaces such as director indirect touch (such as pointing or clicking by Vogel et al. [255]and Malik et al. [256]), 3D interaction devices (e.g. Microsoft KinectDK) and multi-device strategies (body-attached interaction devices -smartphones [257], glasses, etc.).
8.1.3 LHRD augmented floor surfaces
[239] In contrast to common vertical LHRD wall setups, LHRD floor systemsand their applications have not been widely researched. LHRD floorsare also called "augmented floor surfaces" and "floor visualizationsystems" in the literature. It is the only form factor where an infinitescalability for visualization and direct touch can be achieved due toits horizontal alignment.
Two groundbreaking studies must be mentioned in the context ofaugmented floor surfaces. In 1993, Cruz-Neira et al. presented the"Cave Automated Virtual Environment (CAVE) that also included afloor display for immersive environments. Cruz-Neira et al. used their"floor wall" projection system for the first presentation of a CAVEsetup for virtual reality (VR) applications [258]. Another importantstudy was conducted by Pinhanez in 2001. Their novel projection sys-tem utilizes a rotating mirror to augment all areas of a room includ-ing the floor surfaces [259]. These studies have inspired many furtherresearch activities.
In the literature, augmented floor surfaces are set up in variousways. The following, non-exhausive list clusters these form factors:
• Back projection systemse.g. MultiToe by Augsten et al. [260]

8.1 state of the art in lhrd visualization systems 165
• Front projection systemse.g. laser projection-based system by Müller et al. [261] and"The Everywhere Displays Projector" by Pinhanez [259]
• LED-based systemse.g. by Dalton et al. [262]
• Low-poly lumination systemse.g. hexagon arrangement by Delbrück et al. [263]
• Irregular lumination systemsCamba et al. [264]
• Peripheral halosVermeulen et al. [265]
8.1.4 Application scenarios for augmented floor surfaces
[239]Research has proposed only a few application scenarios for aug-mented floor surfaces, mostly in the domain of entertainment andgaming such as ShareVR [111], MultiToe [260], IGameFloor[266], Space-Hopper [267] or Kickables [268]. For outdoor advertisement in publicspaces Camba et al. propose a [264] tiled floor visualization systemwith irregular lumination realized with optical fiber rods. This makesthe low resolution of 6x6 LEDs look more interesting. Additionallythey give a general overview of tactile floor setups. In the domain ofhealth and sports use cases, Heller et al. [269] present a smartfloorfor motivating people to exercise more by using a floor projectionwith interactive floor cells. Interaction with the games on the floorare carried out with 50cm x 50cm force weight cells. They present 3
different games "tightrope", "smartdance" and "pong", each intendedto encourage people to work out.
Petersen et al. [270] present design considerations for floor in-teraction in architectural environments. They present three interac-tive floor concepts and use them to derive design issues for inter-active floors. They divide the design space into "plaza interaction"and "street interaction." For plaza interaction, no dominant directionis given for the content, due to the multidirectional access vectors.Street interaction on the other hand is characterized by unidirectionalaccess. Hence, more efficient interaction can be assumed.
Law et al. present a multimodal floor for immersive environments[271] in 2009. They combine auditory, tactile and visual feedback fromusers’ steps in order to create the impression of "walking over naturalground surfaces, such as snow and ice." The authors argue that byjust presenting visual and auditory feedback and leaving out tactilefeedback creates a perceptual conflict, which lacks immersion.
166 wall-sized, high resolution visualization hardware systems
Vermeulen et al. provide insights into dynamic peripheral floorvisualizations with isometrically registered tracking systems [265].They explore the design space and discuss design considerations forperipheral floor visualizations for conveying users’ information onthe tracking fidelity of a system, to show borders and interactionzones and to give cues to invite users to perform spatial movements.These kinds of design considerations are applied for the MDE in theVMS, especially the concepts for connecting and mediating interac-tions with primary interaction devices.
Schmidt et al. argue that the price of having a large-scale floor vi-sualization with direct touch induces bad ergonomics for users [272].They evaluate ergonomics while interacting with a floor visualizationsystem and derive a novel system for an interactive adaptation of thecontent to the operator’s pose in which the user interacts with thefloor. This pose-aware system enables a smooth transition betweenviews and is a countermeasure for "prolonged standing, especially incombination with looking down, quickly causes fatigue and repetitivestrain" [272].
Interaction research is presented by Schmidt et al. as they propose aset of foot-based interaction tangibles, called "Kickables" [268]. Theyare intended to be used for "very large interaction surfaces." A setof tangibles for UI controls is proposed and evaluated with the per-ceptual affordances they take, such as knobs, switches, sliders, radiobuttons. They propose them for use in walk up installations.
The literature review revealed that by now there are few publica-tions on industrial use cases utilizing large augmented floor visual-ization devices. The author’s own previous publications on originalsize visualizations for automotive production planning [93, 239] havebeen the only contributions in this domain.
8.2 industrial application scenarios using augmented
floor surfaces
As there is a huge potential of using augmented floor surfaces in themanufacturing domain for collaborative workshops, six applicationscenarios for automotive production validation are provided below.They are set into the design space context of the above mentionedpublications.
8.2.1 Interactive walk path optimization
[239] Assembly workplace layouts must be optimized with respect to prod-uct, process, worker, ergonomic aspects and the reduction of non-value adding tasks such as walk paths. As proposed by Otto et al. [93]in 2014, an augmented floor visualization system can be used for walk
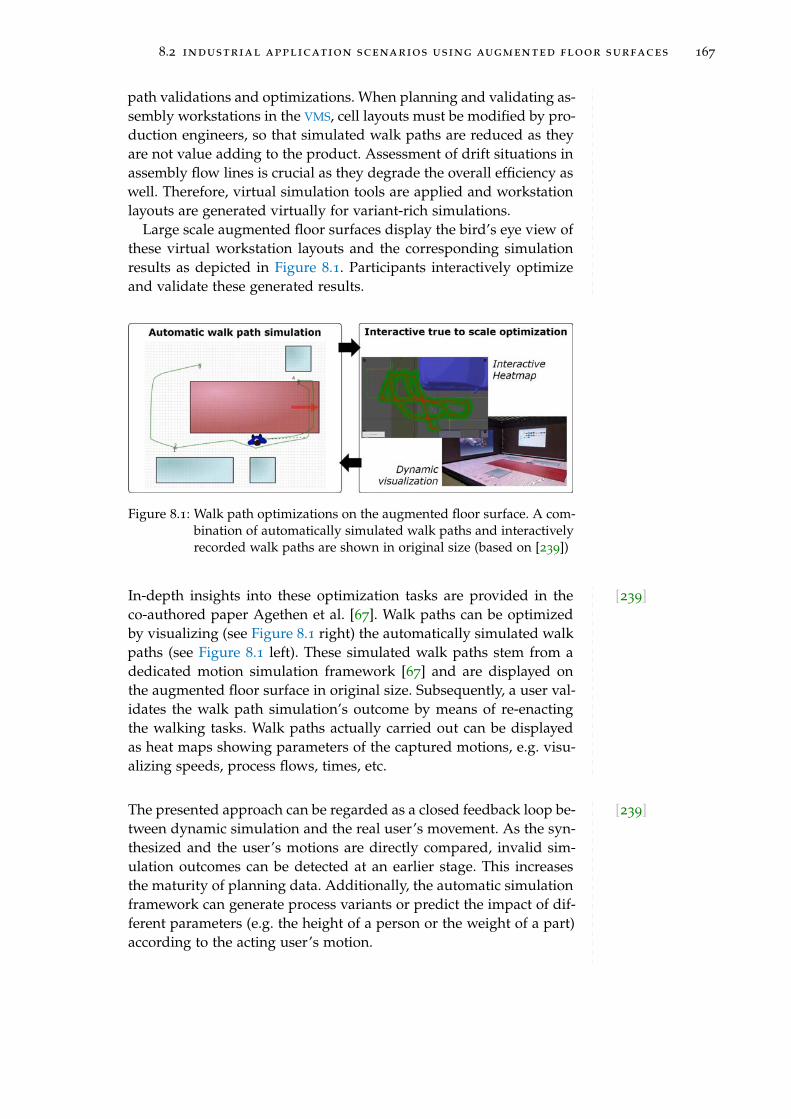
8.2 industrial application scenarios using augmented floor surfaces 167
path validations and optimizations. When planning and validating as-sembly workstations in the VMS, cell layouts must be modified by pro-duction engineers, so that simulated walk paths are reduced as theyare not value adding to the product. Assessment of drift situations inassembly flow lines is crucial as they degrade the overall efficiency aswell. Therefore, virtual simulation tools are applied and workstationlayouts are generated virtually for variant-rich simulations.
Large scale augmented floor surfaces display the bird’s eye view ofthese virtual workstation layouts and the corresponding simulationresults as depicted in Figure 8.1. Participants interactively optimizeand validate these generated results.
Figure 8.1: Walk path optimizations on the augmented floor surface. A com-bination of automatically simulated walk paths and interactivelyrecorded walk paths are shown in original size (based on [239])
[239]In-depth insights into these optimization tasks are provided in theco-authored paper Agethen et al. [67]. Walk paths can be optimizedby visualizing (see Figure 8.1 right) the automatically simulated walkpaths (see Figure 8.1 left). These simulated walk paths stem from adedicated motion simulation framework [67] and are displayed onthe augmented floor surface in original size. Subsequently, a user val-idates the walk path simulation’s outcome by means of re-enactingthe walking tasks. Walk paths actually carried out can be displayedas heat maps showing parameters of the captured motions, e.g. visu-alizing speeds, process flows, times, etc.
[239]The presented approach can be regarded as a closed feedback loop be-tween dynamic simulation and the real user’s movement. As the syn-thesized and the user’s motions are directly compared, invalid sim-ulation outcomes can be detected at an earlier stage. This increasesthe maturity of planning data. Additionally, the automatic simulationframework can generate process variants or predict the impact of dif-ferent parameters (e.g. the height of a person or the weight of a part)according to the acting user’s motion.
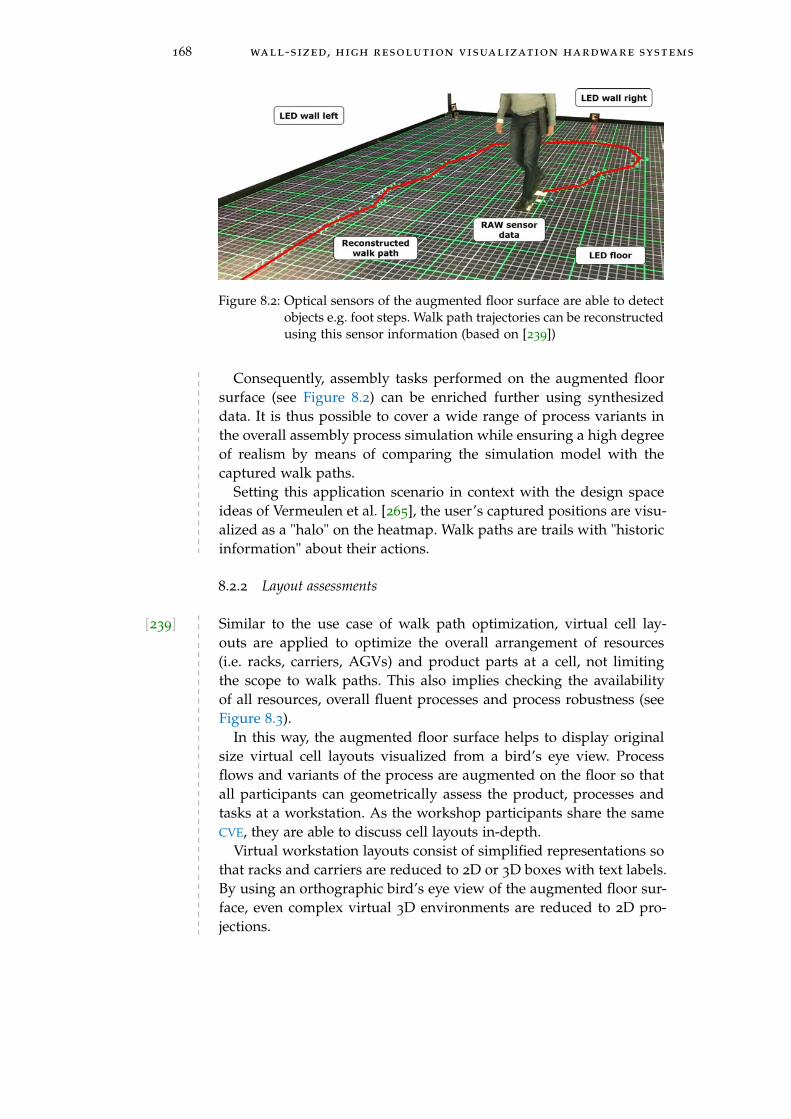
168 wall-sized, high resolution visualization hardware systems
Figure 8.2: Optical sensors of the augmented floor surface are able to detectobjects e.g. foot steps. Walk path trajectories can be reconstructedusing this sensor information (based on [239])
Consequently, assembly tasks performed on the augmented floorsurface (see Figure 8.2) can be enriched further using synthesizeddata. It is thus possible to cover a wide range of process variants inthe overall assembly process simulation while ensuring a high degreeof realism by means of comparing the simulation model with thecaptured walk paths.
Setting this application scenario in context with the design spaceideas of Vermeulen et al. [265], the user’s captured positions are visu-alized as a "halo" on the heatmap. Walk paths are trails with "historicinformation" about their actions.
8.2.2 Layout assessments
[239] Similar to the use case of walk path optimization, virtual cell lay-outs are applied to optimize the overall arrangement of resources(i.e. racks, carriers, AGVs) and product parts at a cell, not limitingthe scope to walk paths. This also implies checking the availabilityof all resources, overall fluent processes and process robustness (seeFigure 8.3).
In this way, the augmented floor surface helps to display originalsize virtual cell layouts visualized from a bird’s eye view. Processflows and variants of the process are augmented on the floor so thatall participants can geometrically assess the product, processes andtasks at a workstation. As the workshop participants share the sameCVE, they are able to discuss cell layouts in-depth.
Virtual workstation layouts consist of simplified representations sothat racks and carriers are reduced to 2D or 3D boxes with text labels.By using an orthographic bird’s eye view of the augmented floor sur-face, even complex virtual 3D environments are reduced to 2D pro-jections.
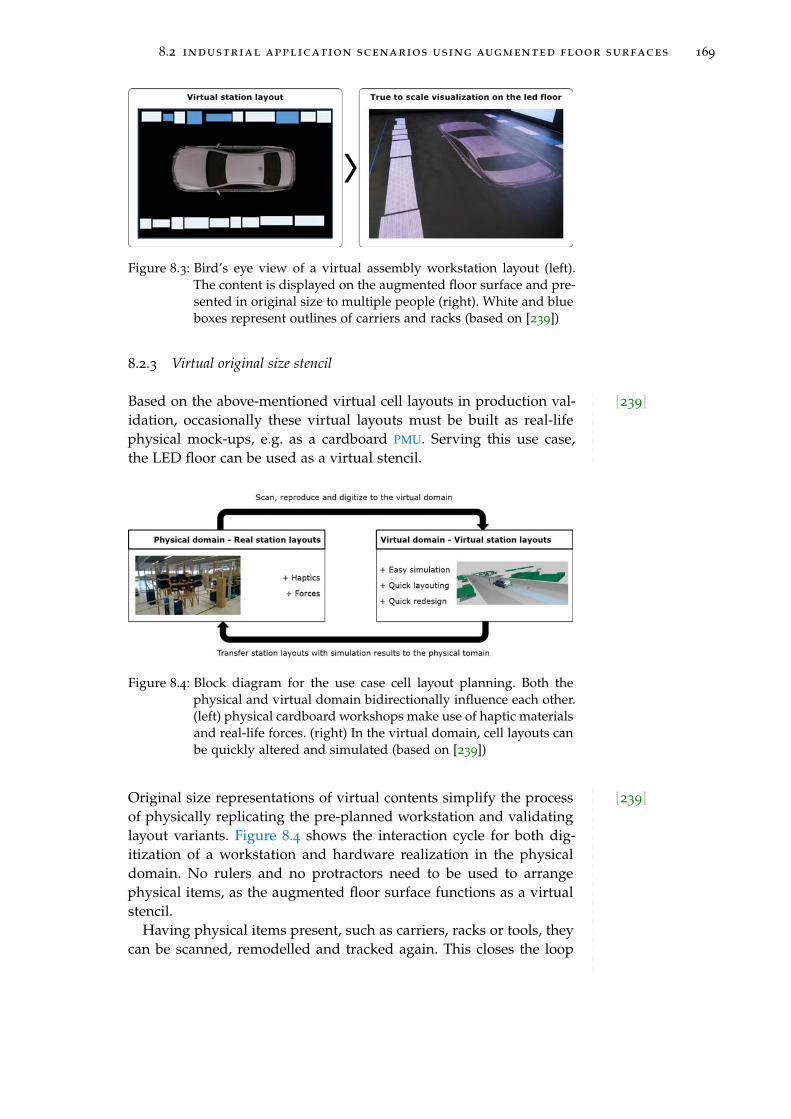
8.2 industrial application scenarios using augmented floor surfaces 169
Figure 8.3: Bird’s eye view of a virtual assembly workstation layout (left).The content is displayed on the augmented floor surface and pre-sented in original size to multiple people (right). White and blueboxes represent outlines of carriers and racks (based on [239])
8.2.3 Virtual original size stencil
[239]Based on the above-mentioned virtual cell layouts in production val-idation, occasionally these virtual layouts must be built as real-lifephysical mock-ups, e.g. as a cardboard PMU. Serving this use case,the LED floor can be used as a virtual stencil.
Figure 8.4: Block diagram for the use case cell layout planning. Both thephysical and virtual domain bidirectionally influence each other.(left) physical cardboard workshops make use of haptic materialsand real-life forces. (right) In the virtual domain, cell layouts canbe quickly altered and simulated (based on [239])
[239]Original size representations of virtual contents simplify the processof physically replicating the pre-planned workstation and validatinglayout variants. Figure 8.4 shows the interaction cycle for both dig-itization of a workstation and hardware realization in the physicaldomain. No rulers and no protractors need to be used to arrangephysical items, as the augmented floor surface functions as a virtualstencil.
Having physical items present, such as carriers, racks or tools, theycan be scanned, remodelled and tracked again. This closes the loop

170 wall-sized, high resolution visualization hardware systems
from the physical to the virtual domain. This represents the idea of adigital twin and interaction cycle using the augmented floor surfacein the VMS.
Having also tracked physical items, the augmented floor surfaceis capable of visualizing its virtual meta-information, such as con-tents of a rack, dimensions of a carrier or simulation results for walkpaths. These findings are in accordance with the concepts presentedby Müller et al. in BaseLase [261].
8.2.4 Size perception and engagement
[239] As production validation engineers make use of these application sce-narios on a daily basis, they must be able to estimate sizes properly.In contrast to relatively scaled visualizations, the augmented floorsurface helps identify problems with clearances and other geometricdetails of virtual cell layouts when showing it in original size. Rogerset al. found that the arrangement of output devices has a huge influ-ence on the process of idea generation and discussions [250]. Exactlythis effect is leveraged by using an augmented floor. In addition, thesize perception of original size contents is expected to be more preciseand more accurate.
8.2.5 Self-navigation in virtual space
[239] Similar to the concepts presented by Gugenheimer et al. [111] the aug-mented floor surface helps to opt-in and opt-out in the virtual scene.By registering all display devices isometrically to the virtual scene,production validation engineers can easily see the virtual borders oftheir region of interest. For example, when assembling the rear backlight of a car, the interactively tracked user must get a reference wherehe is located in the virtual domain. Seeing the car from the bird’s eyeview of the augmented floor surface, one can easily walk to the regionof interest and perform the assembly task there. Even when using aVR head-mounted display, the user can walk to the respective regionof interest and put on the VR goggles when he is already perfectlyaligned with the virtual domain. Vermeulen et al. propose "Halos"for self-navigation [265] and also visualize borders of the tracking en-vironment on the floor. This feature helps simplify interaction in thevirtual domain.
8.2.6 Virtual travels with interactive maps
[239] Planning new work contents and tasks for an existing work place re-quires changes in the respective work cell (brown-field adjustments).It is thus necessary to have a clear understanding of the current base-
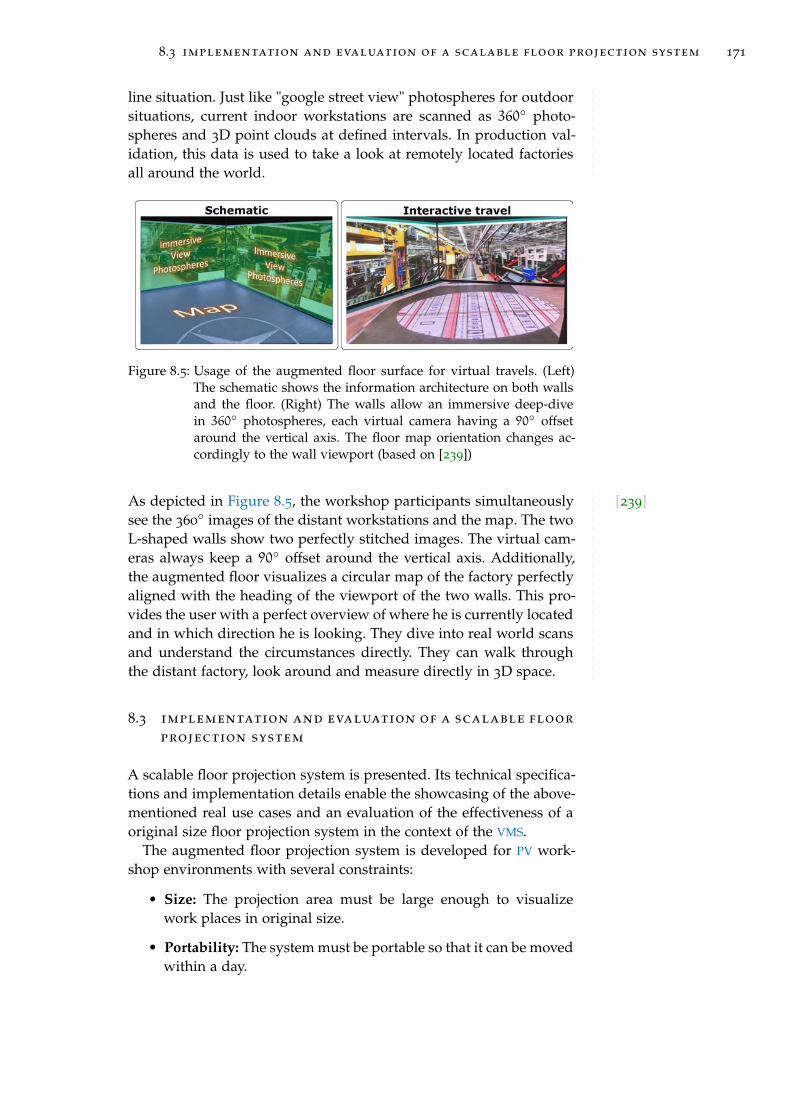
8.3 implementation and evaluation of a scalable floor projection system 171
line situation. Just like "google street view" photospheres for outdoorsituations, current indoor workstations are scanned as 360◦ photo-spheres and 3D point clouds at defined intervals. In production val-idation, this data is used to take a look at remotely located factoriesall around the world.
Figure 8.5: Usage of the augmented floor surface for virtual travels. (Left)The schematic shows the information architecture on both wallsand the floor. (Right) The walls allow an immersive deep-divein 360◦ photospheres, each virtual camera having a 90◦ offsetaround the vertical axis. The floor map orientation changes ac-cordingly to the wall viewport (based on [239])
[239]As depicted in Figure 8.5, the workshop participants simultaneouslysee the 360
◦ images of the distant workstations and the map. The twoL-shaped walls show two perfectly stitched images. The virtual cam-eras always keep a 90◦ offset around the vertical axis. Additionally,the augmented floor visualizes a circular map of the factory perfectlyaligned with the heading of the viewport of the two walls. This pro-vides the user with a perfect overview of where he is currently locatedand in which direction he is looking. They dive into real world scansand understand the circumstances directly. They can walk throughthe distant factory, look around and measure directly in 3D space.
8.3 implementation and evaluation of a scalable floor
projection system
A scalable floor projection system is presented. Its technical specifica-tions and implementation details enable the showcasing of the above-mentioned real use cases and an evaluation of the effectiveness of aoriginal size floor projection system in the context of the VMS.
The augmented floor projection system is developed for PV work-shop environments with several constraints:
• Size: The projection area must be large enough to visualizework places in original size.
• Portability: The system must be portable so that it can be movedwithin a day.

172 wall-sized, high resolution visualization hardware systems
Figure 8.6: Hardware arrangement of floor projection with light paths andprojection cones
• Height: The overall height of the system must be limited to 2.5mdue to factory restrictions.
• Light density and contrast: The projection system must be bril-liant enough, so that all workshop participants have good legi-bility with modest ambient light.
• Low-cost implementation
• Pixel pitch: Typical virtual cell layouts do not inherit high infor-mation density. So using a pixel pitch of less than 5mm is pre-sumed to be an acceptable trade-off between realization costsand visualization quality.
Taking these technical requirements into consideration, a scalablefloor projection system is developed and evaluated.
8.3.1 Hardware implementation
The system is composed of four overhead short-throw DLP projectors,four front facing mirrors, video wall controllers and several pieces ofevent trussing and profiles. Figure 8.6 depicts the 2x2 arrangementwith a car standing in the projection cones.
The implementations inherits four projectors, which allow for amaximum projection area of approx. 18 sq.m. in a medium ambientlight.
8.3.2 Image distribution in the system architecture
The floor projection system consists of multiple projectors. A multidisplay signal controller with four outputs is used, which can be
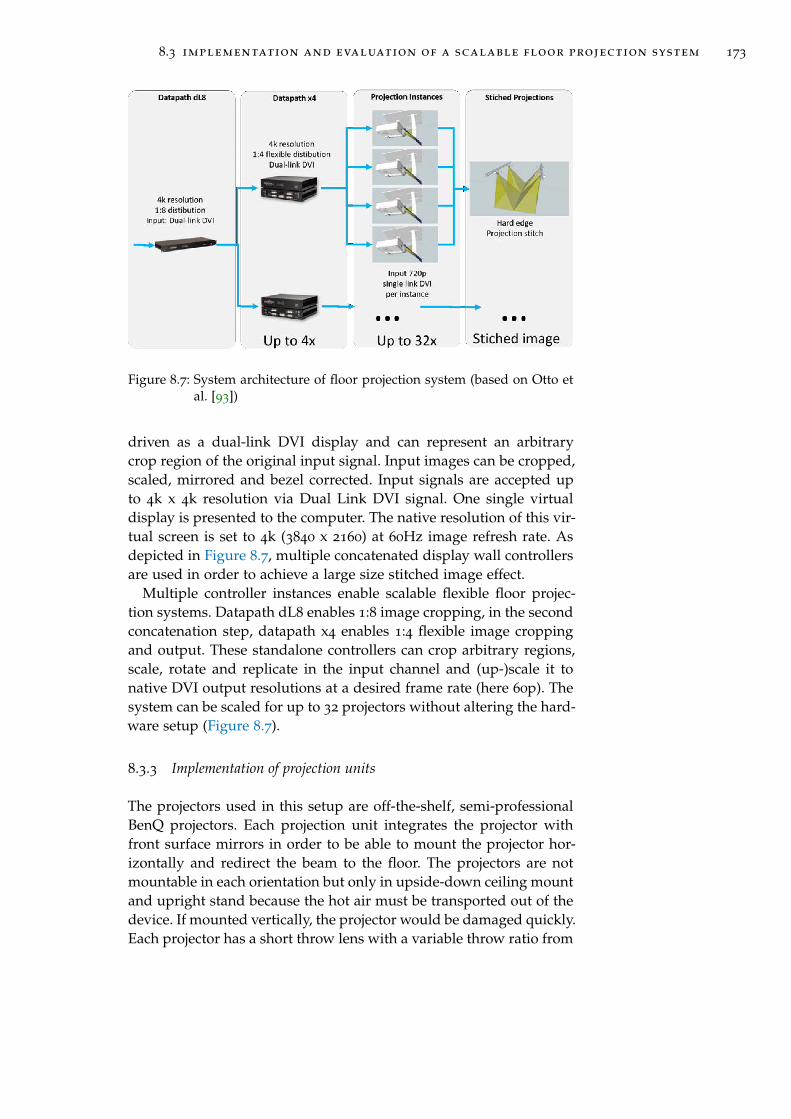
8.3 implementation and evaluation of a scalable floor projection system 173
Figure 8.7: System architecture of floor projection system (based on Otto etal. [93])
driven as a dual-link DVI display and can represent an arbitrarycrop region of the original input signal. Input images can be cropped,scaled, mirrored and bezel corrected. Input signals are accepted upto 4k x 4k resolution via Dual Link DVI signal. One single virtualdisplay is presented to the computer. The native resolution of this vir-tual screen is set to 4k (3840 x 2160) at 60Hz image refresh rate. Asdepicted in Figure 8.7, multiple concatenated display wall controllersare used in order to achieve a large size stitched image effect.
Multiple controller instances enable scalable flexible floor projec-tion systems. Datapath dL8 enables 1:8 image cropping, in the secondconcatenation step, datapath x4 enables 1:4 flexible image croppingand output. These standalone controllers can crop arbitrary regions,scale, rotate and replicate in the input channel and (up-)scale it tonative DVI output resolutions at a desired frame rate (here 60p). Thesystem can be scaled for up to 32 projectors without altering the hard-ware setup (Figure 8.7).
8.3.3 Implementation of projection units
The projectors used in this setup are off-the-shelf, semi-professionalBenQ projectors. Each projection unit integrates the projector withfront surface mirrors in order to be able to mount the projector hor-izontally and redirect the beam to the floor. The projectors are notmountable in each orientation but only in upside-down ceiling mountand upright stand because the hot air must be transported out of thedevice. If mounted vertically, the projector would be damaged quickly.Each projector has a short throw lens with a variable throw ratio from
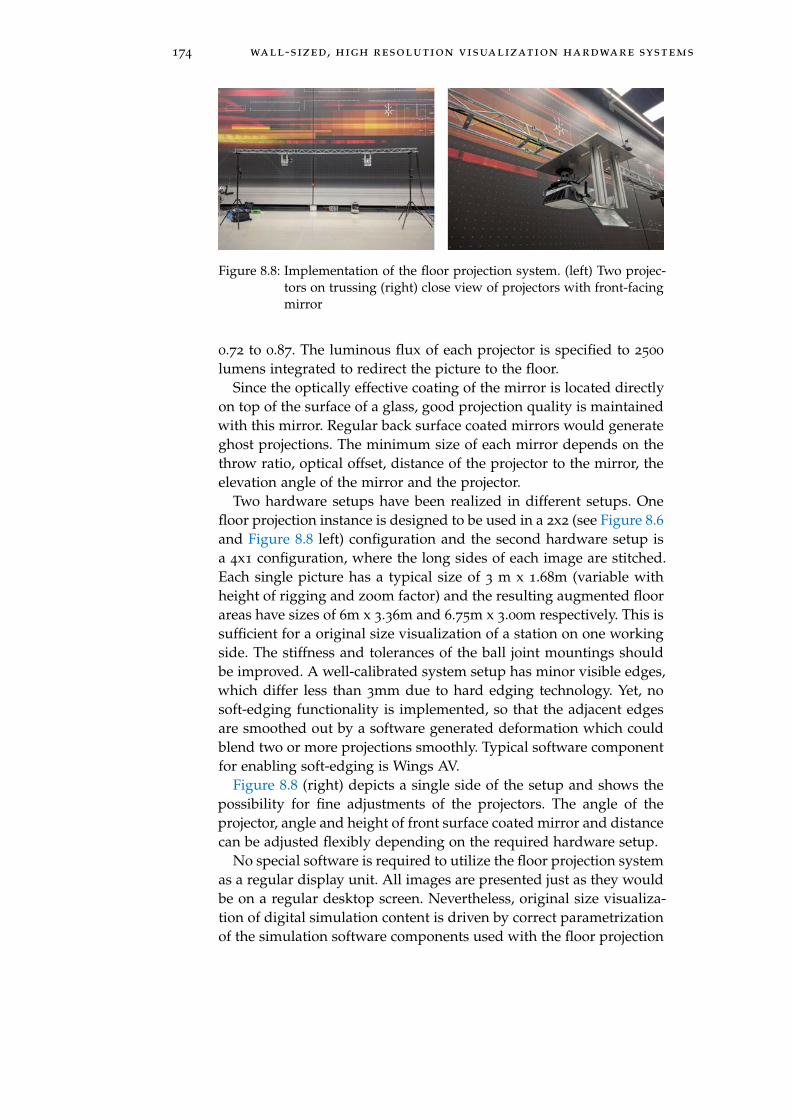
174 wall-sized, high resolution visualization hardware systems
Figure 8.8: Implementation of the floor projection system. (left) Two projec-tors on trussing (right) close view of projectors with front-facingmirror
0.72 to 0.87. The luminous flux of each projector is specified to 2500
lumens integrated to redirect the picture to the floor.Since the optically effective coating of the mirror is located directly
on top of the surface of a glass, good projection quality is maintainedwith this mirror. Regular back surface coated mirrors would generateghost projections. The minimum size of each mirror depends on thethrow ratio, optical offset, distance of the projector to the mirror, theelevation angle of the mirror and the projector.
Two hardware setups have been realized in different setups. Onefloor projection instance is designed to be used in a 2x2 (see Figure 8.6and Figure 8.8 left) configuration and the second hardware setup isa 4x1 configuration, where the long sides of each image are stitched.Each single picture has a typical size of 3 m x 1.68m (variable withheight of rigging and zoom factor) and the resulting augmented floorareas have sizes of 6m x 3.36m and 6.75m x 3.00m respectively. This issufficient for a original size visualization of a station on one workingside. The stiffness and tolerances of the ball joint mountings shouldbe improved. A well-calibrated system setup has minor visible edges,which differ less than 3mm due to hard edging technology. Yet, nosoft-edging functionality is implemented, so that the adjacent edgesare smoothed out by a software generated deformation which couldblend two or more projections smoothly. Typical software componentfor enabling soft-edging is Wings AV.
Figure 8.8 (right) depicts a single side of the setup and shows thepossibility for fine adjustments of the projectors. The angle of theprojector, angle and height of front surface coated mirror and distancecan be adjusted flexibly depending on the required hardware setup.
No special software is required to utilize the floor projection systemas a regular display unit. All images are presented just as they wouldbe on a regular desktop screen. Nevertheless, original size visualiza-tion of digital simulation content is driven by correct parametrizationof the simulation software components used with the floor projection

8.3 implementation and evaluation of a scalable floor projection system 175
system. Using original size software, the output must be parametrizedto the correct display height, width and aspect ratio.
8.3.4 User study
To obtain insights into the implementation quality and limitations ofthe presented floor projection system, a brief user study has been car-ried out. Users were observed using the system in PV workshops andqualitative feedback was collected at the end of the supervision timeframe. A non-standardized questionnaire was handed out, focusedon effectiveness in PV workshops rather than its enjoyable character.Trade-offs in system design were discussed with the users.
[93]Twelve production planning engineers took part in this expert survey.All attended one specific PV workshop. The following results do notclaim statistical significance due to the low number of participants(N=12), but show a tendency regarding how workshop participantswork with the system. All participants took part on a voluntary basis,did not receive any extra reward and reported normal to correctedvision.
The participants worked with the system for multiple days. At theend of the last workshop day, the author handed out a questionnaireto each interview partner after they had worked with the floor projec-tion system for an entire day in PV workshops. They used the systemfor the above mentioned walk path optimization tools with originalsize floor visualization. A non-formal, verbal discussion took placeafter filling out the questionnaires.
Results show that all twelve production engineers agreed that theheight of the projectors at 2.5m was absolutely sufficient (M=4.84,STD=0.37) to be unobtrusive for daily work (see Figure 8.9 upper-left). Most engineers rated the color differences as acceptable (M=4.38,STD=0.84), because they were not crucial for reaching their assess-ment goals, and items within virtual assessment scenes were oftenmodeled using random colors (see Figure 8.9 upper-right).
[93]The same feedback was provided on the resolution of the augmentedfloor surface image (M=4.62, STD=0.49) (see Figure 8.9 lower-right),even though the system had a pixel density of 4.26 px/cm. The hard-edging properties of the system were rated more diversely (M=4.16,STD=0.95) but tended to be positive. Discussions with experts pointedout that a small gap between the projection areas could be acceptedmore easily than a small overlap with double the brightness. Moreelaborated projectors offer soft-edging ability natively.
The results of the feedback regarding the system’s brightness weresurprising (see Figure 8.10 left). The experts rated the brightness as
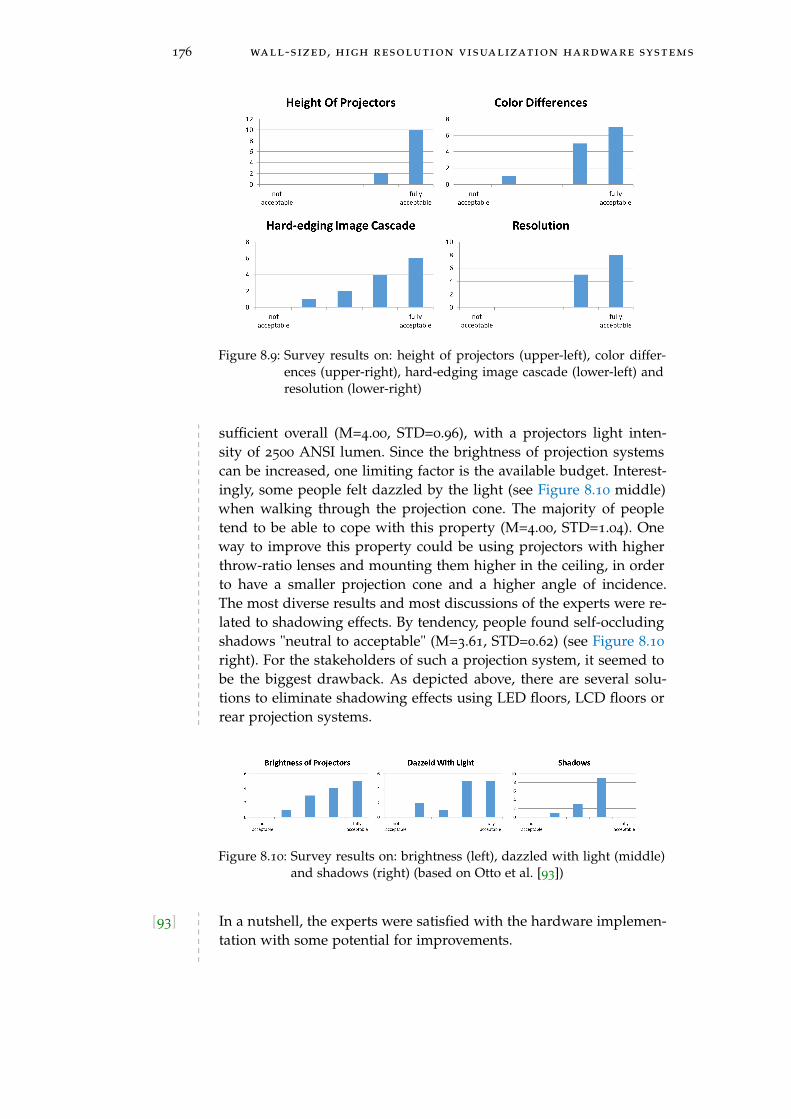
176 wall-sized, high resolution visualization hardware systems
Figure 8.9: Survey results on: height of projectors (upper-left), color differ-ences (upper-right), hard-edging image cascade (lower-left) andresolution (lower-right)
sufficient overall (M=4.00, STD=0.96), with a projectors light inten-sity of 2500 ANSI lumen. Since the brightness of projection systemscan be increased, one limiting factor is the available budget. Interest-ingly, some people felt dazzled by the light (see Figure 8.10 middle)when walking through the projection cone. The majority of peopletend to be able to cope with this property (M=4.00, STD=1.04). Oneway to improve this property could be using projectors with higherthrow-ratio lenses and mounting them higher in the ceiling, in orderto have a smaller projection cone and a higher angle of incidence.The most diverse results and most discussions of the experts were re-lated to shadowing effects. By tendency, people found self-occludingshadows "neutral to acceptable" (M=3.61, STD=0.62) (see Figure 8.10
right). For the stakeholders of such a projection system, it seemed tobe the biggest drawback. As depicted above, there are several solu-tions to eliminate shadowing effects using LED floors, LCD floors orrear projection systems.
Figure 8.10: Survey results on: brightness (left), dazzled with light (middle)and shadows (right) (based on Otto et al. [93])
[93] In a nutshell, the experts were satisfied with the hardware implemen-tation with some potential for improvements.
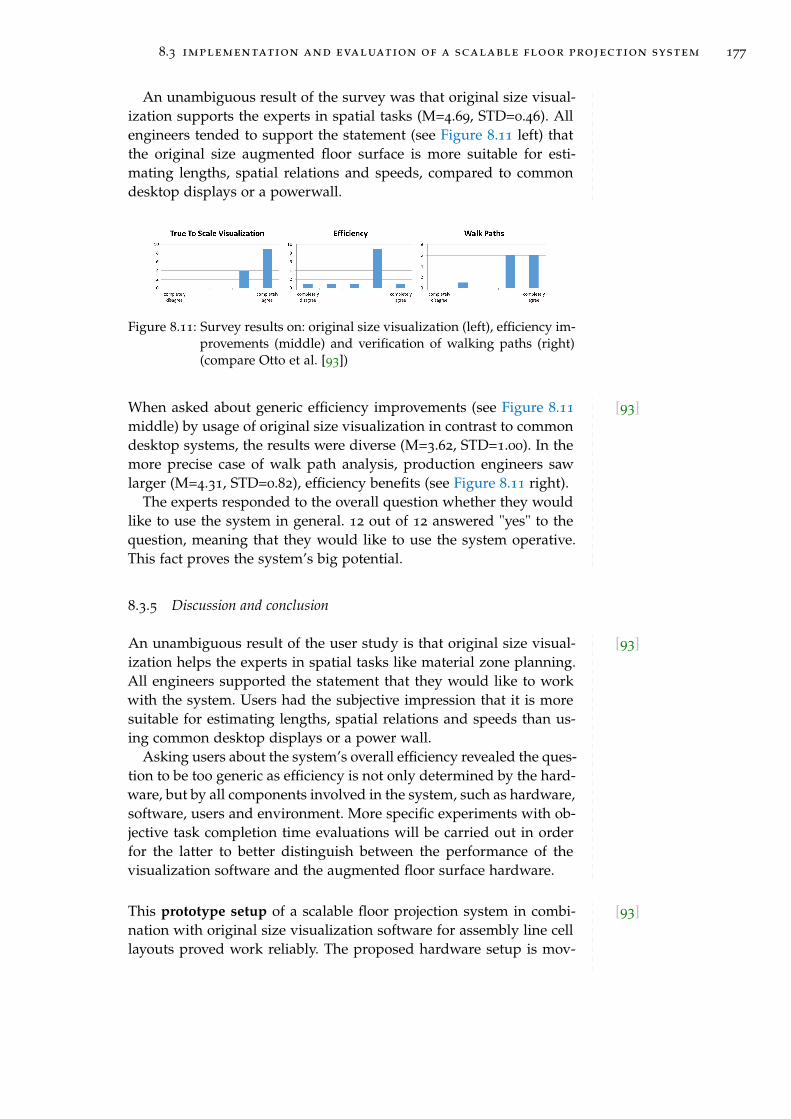
8.3 implementation and evaluation of a scalable floor projection system 177
An unambiguous result of the survey was that original size visual-ization supports the experts in spatial tasks (M=4.69, STD=0.46). Allengineers tended to support the statement (see Figure 8.11 left) thatthe original size augmented floor surface is more suitable for esti-mating lengths, spatial relations and speeds, compared to commondesktop displays or a powerwall.
Figure 8.11: Survey results on: original size visualization (left), efficiency im-provements (middle) and verification of walking paths (right)(compare Otto et al. [93])
[93]When asked about generic efficiency improvements (see Figure 8.11
middle) by usage of original size visualization in contrast to commondesktop systems, the results were diverse (M=3.62, STD=1.00). In themore precise case of walk path analysis, production engineers sawlarger (M=4.31, STD=0.82), efficiency benefits (see Figure 8.11 right).
The experts responded to the overall question whether they wouldlike to use the system in general. 12 out of 12 answered "yes" to thequestion, meaning that they would like to use the system operative.This fact proves the system’s big potential.
8.3.5 Discussion and conclusion
[93]An unambiguous result of the user study is that original size visual-ization helps the experts in spatial tasks like material zone planning.All engineers supported the statement that they would like to workwith the system. Users had the subjective impression that it is moresuitable for estimating lengths, spatial relations and speeds than us-ing common desktop displays or a power wall.
Asking users about the system’s overall efficiency revealed the ques-tion to be too generic as efficiency is not only determined by the hard-ware, but by all components involved in the system, such as hardware,software, users and environment. More specific experiments with ob-jective task completion time evaluations will be carried out in orderfor the latter to better distinguish between the performance of thevisualization software and the augmented floor surface hardware.
[93]This prototype setup of a scalable floor projection system in combi-nation with original size visualization software for assembly line celllayouts proved work reliably. The proposed hardware setup is mov-
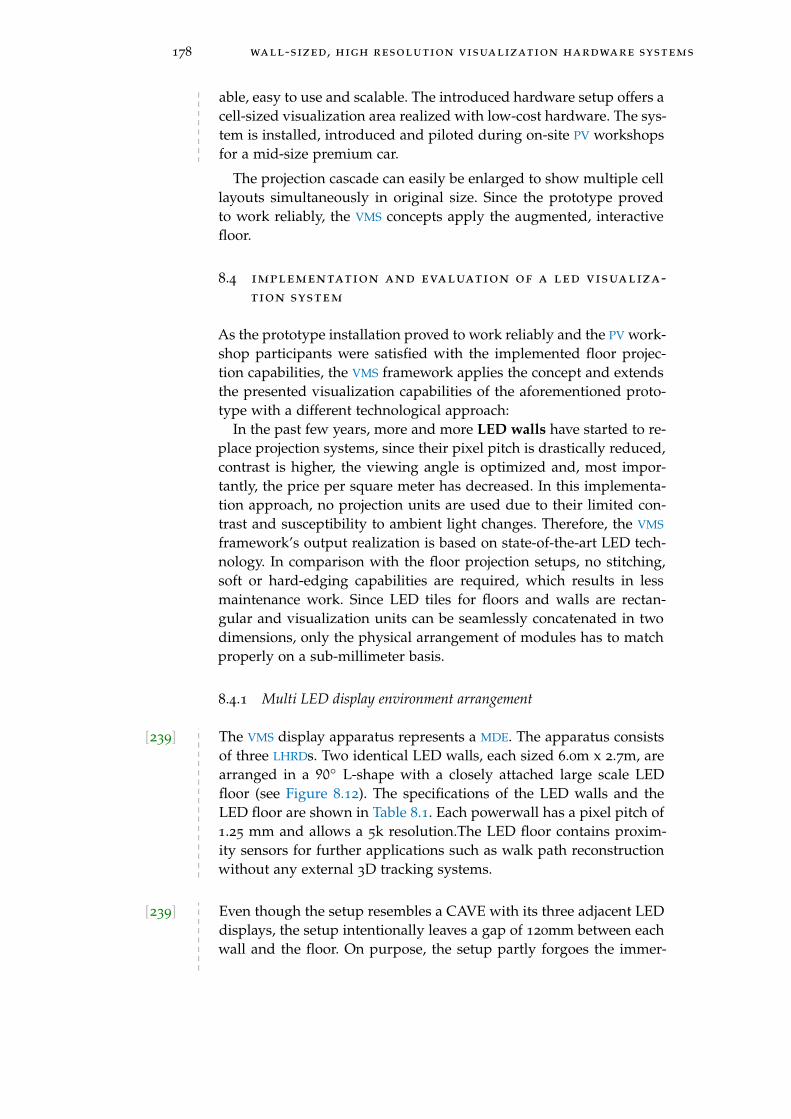
178 wall-sized, high resolution visualization hardware systems
able, easy to use and scalable. The introduced hardware setup offers acell-sized visualization area realized with low-cost hardware. The sys-tem is installed, introduced and piloted during on-site PV workshopsfor a mid-size premium car.
The projection cascade can easily be enlarged to show multiple celllayouts simultaneously in original size. Since the prototype provedto work reliably, the VMS concepts apply the augmented, interactivefloor.
8.4 implementation and evaluation of a led visualiza-tion system
As the prototype installation proved to work reliably and the PV work-shop participants were satisfied with the implemented floor projec-tion capabilities, the VMS framework applies the concept and extendsthe presented visualization capabilities of the aforementioned proto-type with a different technological approach:
In the past few years, more and more LED walls have started to re-place projection systems, since their pixel pitch is drastically reduced,contrast is higher, the viewing angle is optimized and, most impor-tantly, the price per square meter has decreased. In this implementa-tion approach, no projection units are used due to their limited con-trast and susceptibility to ambient light changes. Therefore, the VMS
framework’s output realization is based on state-of-the-art LED tech-nology. In comparison with the floor projection setups, no stitching,soft or hard-edging capabilities are required, which results in lessmaintenance work. Since LED tiles for floors and walls are rectan-gular and visualization units can be seamlessly concatenated in twodimensions, only the physical arrangement of modules has to matchproperly on a sub-millimeter basis.
8.4.1 Multi LED display environment arrangement
[239] The VMS display apparatus represents a MDE. The apparatus consistsof three LHRDs. Two identical LED walls, each sized 6.0m x 2.7m, arearranged in a 90◦ L-shape with a closely attached large scale LEDfloor (see Figure 8.12). The specifications of the LED walls and theLED floor are shown in Table 8.1. Each powerwall has a pixel pitch of1.25 mm and allows a 5k resolution.The LED floor contains proxim-ity sensors for further applications such as walk path reconstructionwithout any external 3D tracking systems.
[239] Even though the setup resembles a CAVE with its three adjacent LEDdisplays, the setup intentionally leaves a gap of 120mm between eachwall and the floor. On purpose, the setup partly forgoes the immer-

8.4 implementation and evaluation of a led visualization system 179
Figure 8.12: The VMS apparatus consists of two 16 sqm, L-arranged LEDwalls next to a 54 sqm large-scale LED floor [239, 245]
sive effect of a typical CAVE (see Cruz-Neira et al. [258]) in order toachieve maximum mechanical flexibility. At the borders of each dis-play, standardized aluminum profile structures make it possible tomount additional devices, such as sensors, haptic devices, camerasand other tracking equipment.
Table 8.1: Specifications of VMS output apparatus [239]
Property LED walls [each] LED floor
Active Area 16 sqm 54 sqm
Pixel pitch 1.25 mm 5 mm
Resolution per wall 4800 x 2160 1728 x 1152
Size 6 m x 2.7 m 9 m x 6 m
Max. power consumption 20x 440W 216x 240W
Typical power consumption 20x 100W 216x 100W
[239]On each of the two LED walls, seamless images are generated byusing 20 concatenated cabinets of LED modules summing up to a6.0m x 2.7m setup. Each LED wall consists of 5x4 54" Leyard TWAcabinets [273] with a pixel pitch of 1.25mm, resulting in an overallnative resolution of 4800x2160 pixels (see Table 8.1). The maximumbrightness is defined as 800cd/sqm with a horizontal viewing angleof 160◦. For indoor usage, brightness is set to approximately 20% in-tensity without daylight influence. Colors change when looking fromsteeper angles due to a limited horizontal field of view of the singleLEDs (160◦ horizontal viewing angle).
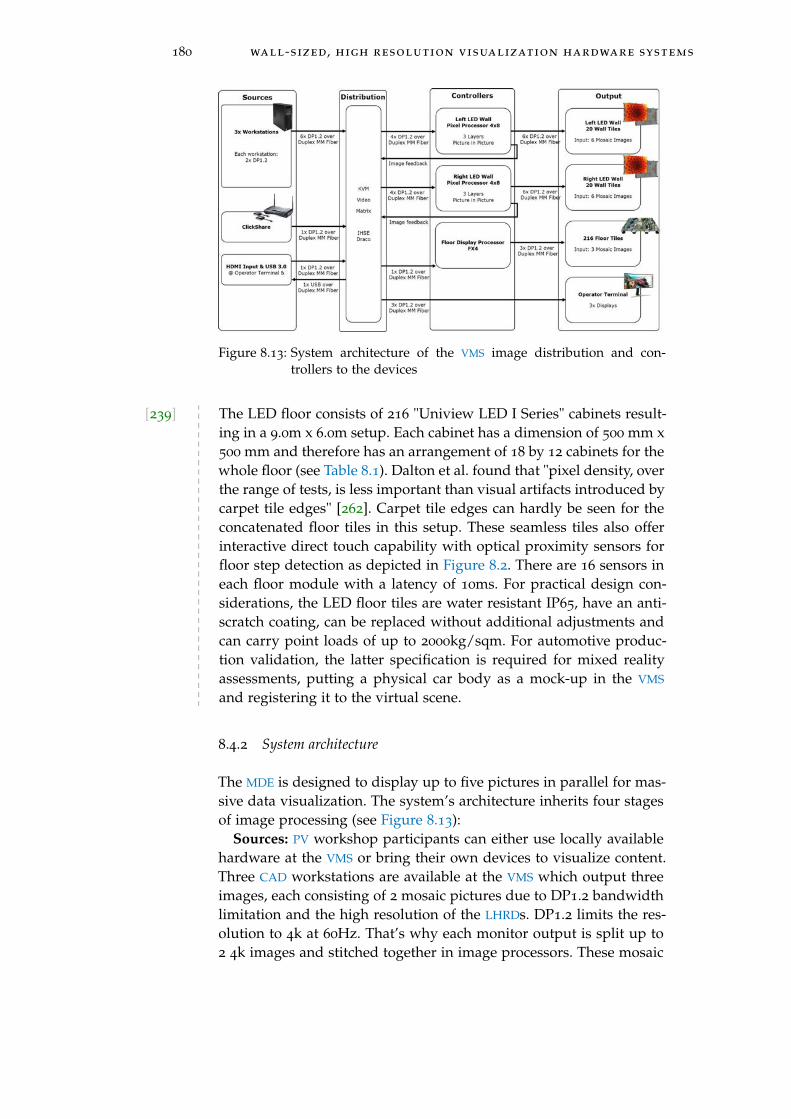
180 wall-sized, high resolution visualization hardware systems
Figure 8.13: System architecture of the VMS image distribution and con-trollers to the devices
[239] The LED floor consists of 216 "Uniview LED I Series" cabinets result-ing in a 9.0m x 6.0m setup. Each cabinet has a dimension of 500 mm x500 mm and therefore has an arrangement of 18 by 12 cabinets for thewhole floor (see Table 8.1). Dalton et al. found that "pixel density, overthe range of tests, is less important than visual artifacts introduced bycarpet tile edges" [262]. Carpet tile edges can hardly be seen for theconcatenated floor tiles in this setup. These seamless tiles also offerinteractive direct touch capability with optical proximity sensors forfloor step detection as depicted in Figure 8.2. There are 16 sensors ineach floor module with a latency of 10ms. For practical design con-siderations, the LED floor tiles are water resistant IP65, have an anti-scratch coating, can be replaced without additional adjustments andcan carry point loads of up to 2000kg/sqm. For automotive produc-tion validation, the latter specification is required for mixed realityassessments, putting a physical car body as a mock-up in the VMS
and registering it to the virtual scene.
8.4.2 System architecture
The MDE is designed to display up to five pictures in parallel for mas-sive data visualization. The system’s architecture inherits four stagesof image processing (see Figure 8.13):
Sources: PV workshop participants can either use locally availablehardware at the VMS or bring their own devices to visualize content.Three CAD workstations are available at the VMS which output threeimages, each consisting of 2 mosaic pictures due to DP1.2 bandwidthlimitation and the high resolution of the LHRDs. DP1.2 limits the res-olution to 4k at 60Hz. That’s why each monitor output is split up to2 4k images and stitched together in image processors. These mosaic
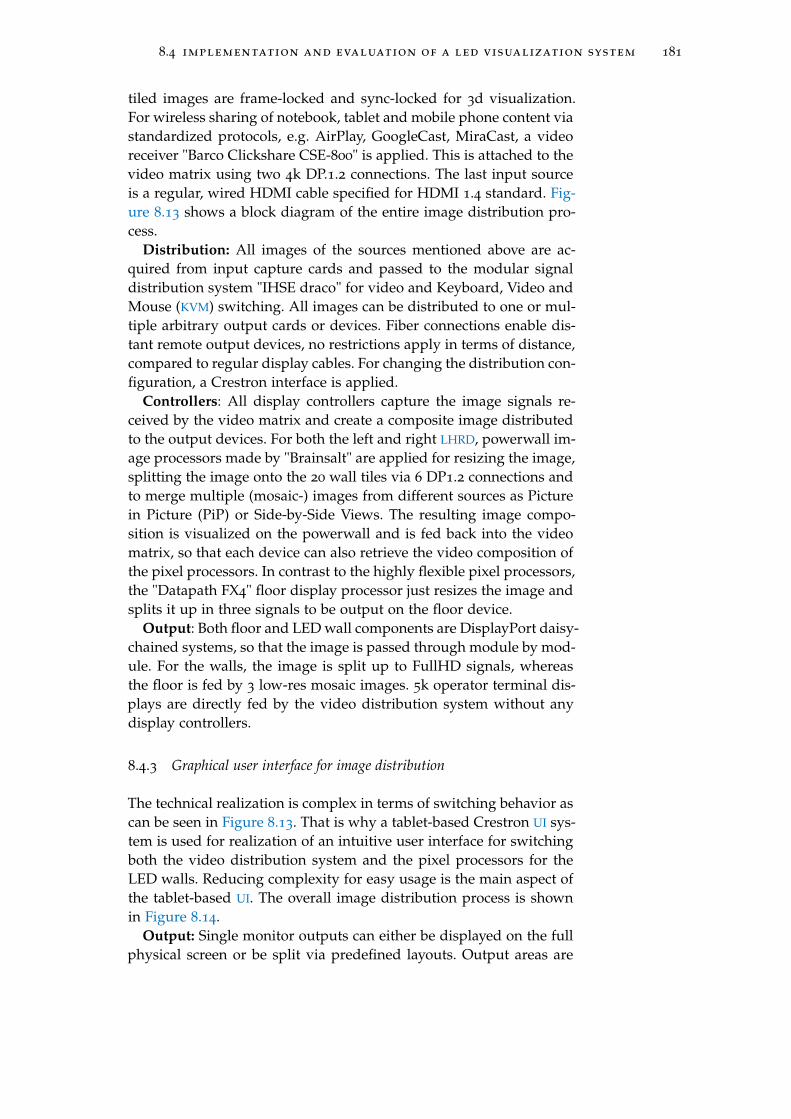
8.4 implementation and evaluation of a led visualization system 181
tiled images are frame-locked and sync-locked for 3d visualization.For wireless sharing of notebook, tablet and mobile phone content viastandardized protocols, e.g. AirPlay, GoogleCast, MiraCast, a videoreceiver "Barco Clickshare CSE-800" is applied. This is attached to thevideo matrix using two 4k DP.1.2 connections. The last input sourceis a regular, wired HDMI cable specified for HDMI 1.4 standard. Fig-ure 8.13 shows a block diagram of the entire image distribution pro-cess.
Distribution: All images of the sources mentioned above are ac-quired from input capture cards and passed to the modular signaldistribution system "IHSE draco" for video and Keyboard, Video andMouse (KVM) switching. All images can be distributed to one or mul-tiple arbitrary output cards or devices. Fiber connections enable dis-tant remote output devices, no restrictions apply in terms of distance,compared to regular display cables. For changing the distribution con-figuration, a Crestron interface is applied.
Controllers: All display controllers capture the image signals re-ceived by the video matrix and create a composite image distributedto the output devices. For both the left and right LHRD, powerwall im-age processors made by "Brainsalt" are applied for resizing the image,splitting the image onto the 20 wall tiles via 6 DP1.2 connections andto merge multiple (mosaic-) images from different sources as Picturein Picture (PiP) or Side-by-Side Views. The resulting image compo-sition is visualized on the powerwall and is fed back into the videomatrix, so that each device can also retrieve the video composition ofthe pixel processors. In contrast to the highly flexible pixel processors,the "Datapath FX4" floor display processor just resizes the image andsplits it up in three signals to be output on the floor device.
Output: Both floor and LED wall components are DisplayPort daisy-chained systems, so that the image is passed through module by mod-ule. For the walls, the image is split up to FullHD signals, whereasthe floor is fed by 3 low-res mosaic images. 5k operator terminal dis-plays are directly fed by the video distribution system without anydisplay controllers.
8.4.3 Graphical user interface for image distribution
The technical realization is complex in terms of switching behavior ascan be seen in Figure 8.13. That is why a tablet-based Crestron UI sys-tem is used for realization of an intuitive user interface for switchingboth the video distribution system and the pixel processors for theLED walls. Reducing complexity for easy usage is the main aspect ofthe tablet-based UI. The overall image distribution process is shownin Figure 8.14.
Output: Single monitor outputs can either be displayed on the fullphysical screen or be split via predefined layouts. Output areas are
182 wall-sized, high resolution visualization hardware systems
Figure 8.14: Block diagram of Crestron UI image distribution
virtual displays and - for simplicity’s sake - each output is assignedto a certain color. Sources are not directly assigned to physical walls,but on virtual displays first, respective colors in the UI. These virtualdisplays are arranged using layouts. Each assignment from sources tooutput areas can be seen as a 2D matrix routing table. For simplicity,a two-click procedure for pairing sources and outputs has been de-veloped: Choosing the desired input source in a list and afterwardsassigning it to a virtual display or the other way around.
Layouts: Arrangements of virtual displays are called layouts. Lay-outs arrange content on the floor and walls, for example in a side-by-side or picture-in-picture manner. Therefore each LHRD can be eitherused as a regular display or with multiple source contents.
Assistant: The assistant offers the users six presets which automat-ically distribute a whole setting to the complete system. With oneclick, all sources and outputs are set to the respective layout, the con-sole display outputs and the KVM HID devices. For example, all sixmosaic images generated by the CAD workstation are distributed onthe walls, on the floor and on the 3 preview monitors of the opera-tor terminal. Additionally, the HID devices of the operator terminalare automatically assigned to the correct workstation. This assistantreduces the single display assignment work of switching betweendifferent layouts drastically. Without the assistant, the whole proce-dure of routing all sources to the proper output units takes 10 clicks,whereas the assistant reduces this work to one click.
Having implemented such a LHRD MDE, one research question ishow people perform in size estimations using this technology in thecontext of PV workshops.
[239] As this LHRD setup is utilized by production engineers on a daily ba-sis for the above mentioned use cases, the question arises whetherthey really improve in their personal size estimations and whetherthey become faster using these tools provided by the VMS. For val-idation purposes, people have to estimate sizes as precisely and ac-curately as possible in order to judge the validity of planning data,even when utilizing complex 3D models in combination with an or-thographic, non-tracked virtual camera, visualization contents, suchas racks and carriers. Czerwinski et al. also indicate that LHRDs have
8.5 original size size perception study 183
an influence on productivity and satisfaction [241]. Size perceptionis thus presented, using 2D content representations, just like in theaforementioned use case "layout assessments."
8.5 original size size perception study
[239]This study focuses on how people perceive sizes of virtual contentsusing immersive display technologies with original size data visual-ization. Therefore, size judgment performance is compared betweenthree scenarios, two of them showing to-scale data representationson an LED floor and one showing relative-sized visualizations on atablet computer.
Amongst other benefits, pervasive displays are said to allow moreaccurate size judgments, improved collaboration performance in work-shops and reduced task completion times. But research does not yetprovide a definite answer on whether the usage of LHRD displaysleads to better size judgements and whether users can become fasterwhen using it. "Better size judgments" imply higher spatial accuracyand higher spatial precision in the user’s estimations. Therefore, thisstudy follows a call for research [274] and investigates size judgmentaccuracy, precision and task completion time by using the VMS’s largeled floor showing absolute scaled contents compared to tablet com-puters with relative scales.
Related publications
This study was initially created for this doctoral thesis and wasalready been published as a peer-reviewed conference paper[245] by Otto et al. at the "ACM Pervasive Displays" 2019 andas a Springer journal paper in "Personal and ubiquitous com-puting" [239]. This section is based on the papers mentioned,while texts have been extended and revised for this doctoralthesis.
[239]However, basic research on using LHRD technology has not focused onhuman perception. Bezerianos et al. present a call for research [274]on the perception of data on wall-sized displays as little research hasbeen carried out in this domain so far: "We do not yet know how theperceptual affordances of a wall, such as the wide viewing angles theycover, affect how data is perceived and comprehended" and call "formore studies on the perception of data on wall-sized displays." Usingdifferent types of display devices directly influences spatial percep-tion, visual space and the control of spatial behavior, especially whenusing display arrangements such as an LED floor. We follow this callfor research and add an additional element: Data visualization on
184 wall-sized, high resolution visualization hardware systems
large-scale augmented floor surfaces showing contents in absolutescale.
In the purely physical domain, the literature has focused on sizeand distance judgments for a long time. In 1963, Epstein [275] pre-sented their key findings, that distance and size judgments were notsystematically related and deviations of size judgments varied withdistance. Later, Epstein and Broota [276] presented another evalua-tion of the judgment of sizes and distances and the correspondingreaction times. They found a positive correlation between viewingdistance of objects and the reaction time. In Wagner’s publication"The metric of visual space" [277], he provides insights into judgingdistances, angles and areas as conducted in this study.
For virtual environments, extensive research has been carried outon perceived spaces in VR, such as distances, sizes, speeds and spaces.Loomis et al. show that egocentric distance judgments in physical en-vironments nearly match 100% of the actual distance [278], whereasin virtual environments they are frequently underestimated. Renneret al. present a literature review and conclude "mean estimation ofegocentric distances in virtual environments of about 74%" [279]. Ren-ner et al. also cluster possible influence factors for this under percep-tion of sizes in four different clusters: measurement methods, techni-cal factors, compositional factors and human factors. In contrast, cur-rent state-of-the-art head mounted displays seem to ameliorate theseeffects [280]. Kelly et al. show that when using modern HMD devicesthis effect is reduced but has not been completely resolved. In com-parison with the literature, no relative size judgment has been carriedout in VR by providing users with relative scales.
8.5.1 Study goal and predictions
[239] One of the striking benefits of a large-scale display is the possibilityto visualize original size data, contents and virtual scenes. In the con-text of the presented use case within the automotive industry, 3D con-tents with individual view points have been intentionally excluded,whereas 2D representations (see Figure 8.12) have been chosen forthis study as the aforementioned use cases are limited to data visual-ization of 2D data.
This evaluation gives insights into whether participants can as-sess sizes of 2D contents more accurately and precisely when theyare shown in original size compared to relative-scaled representa-tions. The baseline scenario represents relative-sized visualizationson a tablet computer, showing exactly the same visual cues as inthe original size scenarios. In this study, size judgment refers to theedge length estimations. To date there is no published research doc-umenting the extent to which original size floor content supports
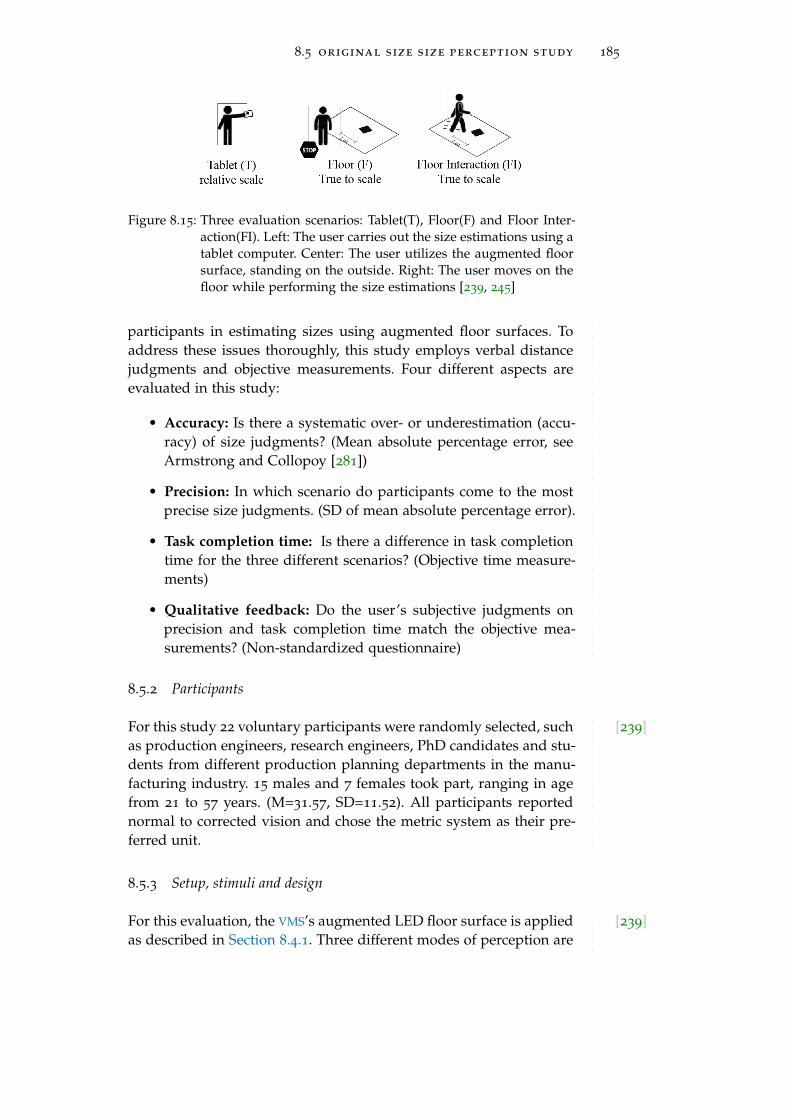
8.5 original size size perception study 185
Figure 8.15: Three evaluation scenarios: Tablet(T), Floor(F) and Floor Inter-action(FI). Left: The user carries out the size estimations using atablet computer. Center: The user utilizes the augmented floorsurface, standing on the outside. Right: The user moves on thefloor while performing the size estimations [239, 245]
participants in estimating sizes using augmented floor surfaces. Toaddress these issues thoroughly, this study employs verbal distancejudgments and objective measurements. Four different aspects areevaluated in this study:
• Accuracy: Is there a systematic over- or underestimation (accu-racy) of size judgments? (Mean absolute percentage error, seeArmstrong and Collopoy [281])
• Precision: In which scenario do participants come to the mostprecise size judgments. (SD of mean absolute percentage error).
• Task completion time: Is there a difference in task completiontime for the three different scenarios? (Objective time measure-ments)
• Qualitative feedback: Do the user’s subjective judgments onprecision and task completion time match the objective mea-surements? (Non-standardized questionnaire)
8.5.2 Participants
[239]For this study 22 voluntary participants were randomly selected, suchas production engineers, research engineers, PhD candidates and stu-dents from different production planning departments in the manu-facturing industry. 15 males and 7 females took part, ranging in agefrom 21 to 57 years. (M=31.57, SD=11.52). All participants reportednormal to corrected vision and chose the metric system as their pre-ferred unit.
8.5.3 Setup, stimuli and design
[239]For this evaluation, the VMS’s augmented LED floor surface is appliedas described in Section 8.4.1. Three different modes of perception are
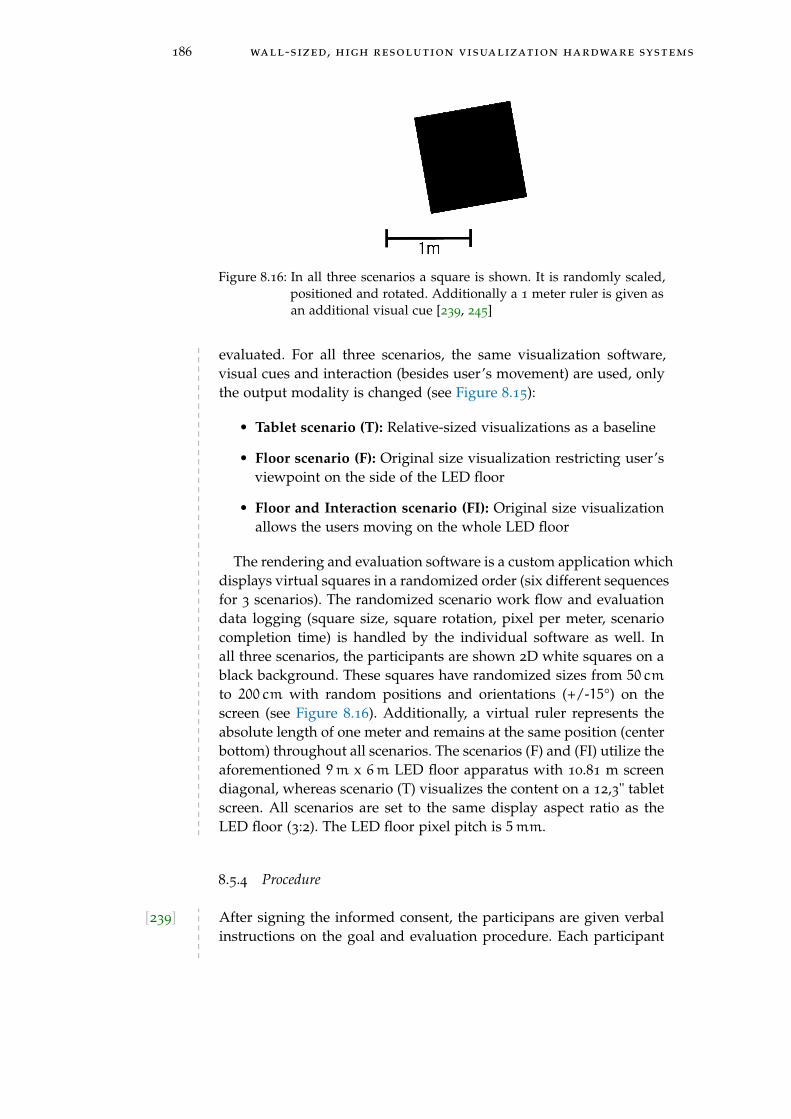
186 wall-sized, high resolution visualization hardware systems
Figure 8.16: In all three scenarios a square is shown. It is randomly scaled,positioned and rotated. Additionally a 1 meter ruler is given asan additional visual cue [239, 245]
evaluated. For all three scenarios, the same visualization software,visual cues and interaction (besides user’s movement) are used, onlythe output modality is changed (see Figure 8.15):
• Tablet scenario (T): Relative-sized visualizations as a baseline
• Floor scenario (F): Original size visualization restricting user’sviewpoint on the side of the LED floor
• Floor and Interaction scenario (FI): Original size visualizationallows the users moving on the whole LED floor
The rendering and evaluation software is a custom application whichdisplays virtual squares in a randomized order (six different sequencesfor 3 scenarios). The randomized scenario work flow and evaluationdata logging (square size, square rotation, pixel per meter, scenariocompletion time) is handled by the individual software as well. Inall three scenarios, the participants are shown 2D white squares on ablack background. These squares have randomized sizes from 50 cm
to 200 cm with random positions and orientations (+/-15°) on thescreen (see Figure 8.16). Additionally, a virtual ruler represents theabsolute length of one meter and remains at the same position (centerbottom) throughout all scenarios. The scenarios (F) and (FI) utilize theaforementioned 9m x 6m LED floor apparatus with 10.81 m screendiagonal, whereas scenario (T) visualizes the content on a 12,3" tabletscreen. All scenarios are set to the same display aspect ratio as theLED floor (3:2). The LED floor pixel pitch is 5mm.
8.5.4 Procedure
[239] After signing the informed consent, the participans are given verbalinstructions on the goal and evaluation procedure. Each participant
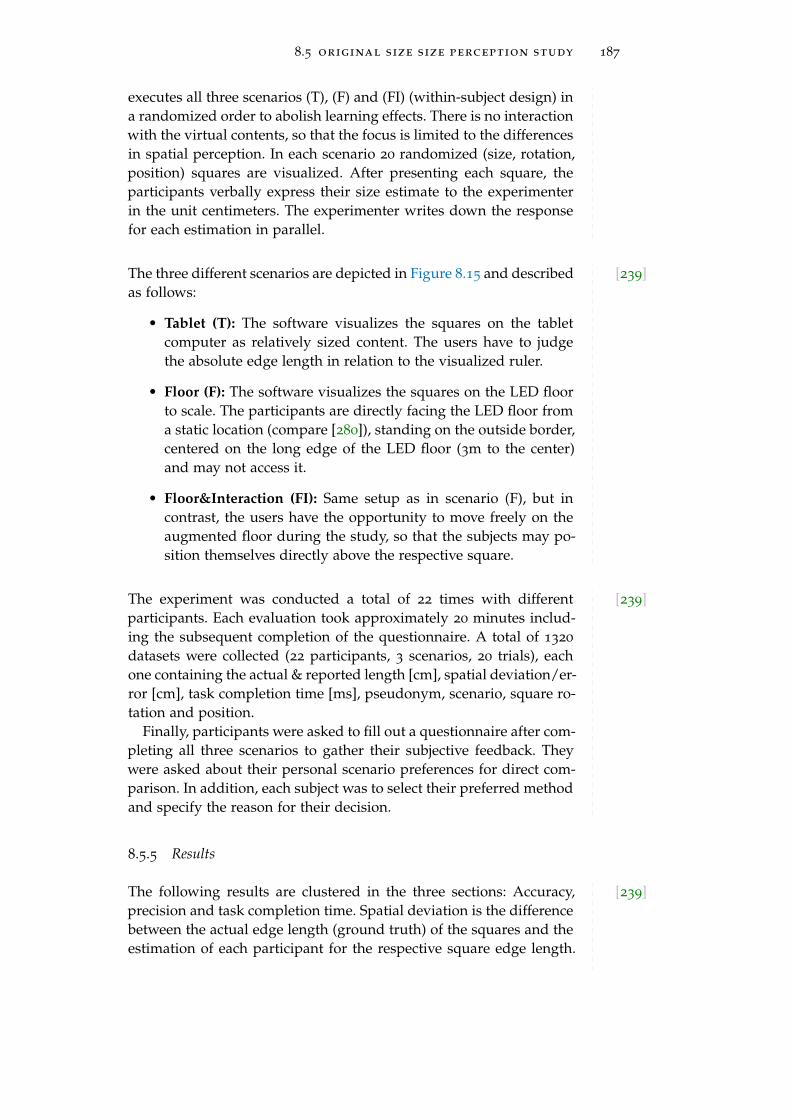
8.5 original size size perception study 187
executes all three scenarios (T), (F) and (FI) (within-subject design) ina randomized order to abolish learning effects. There is no interactionwith the virtual contents, so that the focus is limited to the differencesin spatial perception. In each scenario 20 randomized (size, rotation,position) squares are visualized. After presenting each square, theparticipants verbally express their size estimate to the experimenterin the unit centimeters. The experimenter writes down the responsefor each estimation in parallel.
[239]The three different scenarios are depicted in Figure 8.15 and describedas follows:
• Tablet (T): The software visualizes the squares on the tabletcomputer as relatively sized content. The users have to judgethe absolute edge length in relation to the visualized ruler.
• Floor (F): The software visualizes the squares on the LED floorto scale. The participants are directly facing the LED floor froma static location (compare [280]), standing on the outside border,centered on the long edge of the LED floor (3m to the center)and may not access it.
• Floor&Interaction (FI): Same setup as in scenario (F), but incontrast, the users have the opportunity to move freely on theaugmented floor during the study, so that the subjects may po-sition themselves directly above the respective square.
[239]The experiment was conducted a total of 22 times with differentparticipants. Each evaluation took approximately 20 minutes includ-ing the subsequent completion of the questionnaire. A total of 1320
datasets were collected (22 participants, 3 scenarios, 20 trials), eachone containing the actual & reported length [cm], spatial deviation/er-ror [cm], task completion time [ms], pseudonym, scenario, square ro-tation and position.
Finally, participants were asked to fill out a questionnaire after com-pleting all three scenarios to gather their subjective feedback. Theywere asked about their personal scenario preferences for direct com-parison. In addition, each subject was to select their preferred methodand specify the reason for their decision.
8.5.5 Results
[239]The following results are clustered in the three sections: Accuracy,precision and task completion time. Spatial deviation is the differencebetween the actual edge length (ground truth) of the squares and theestimation of each participant for the respective square edge length.
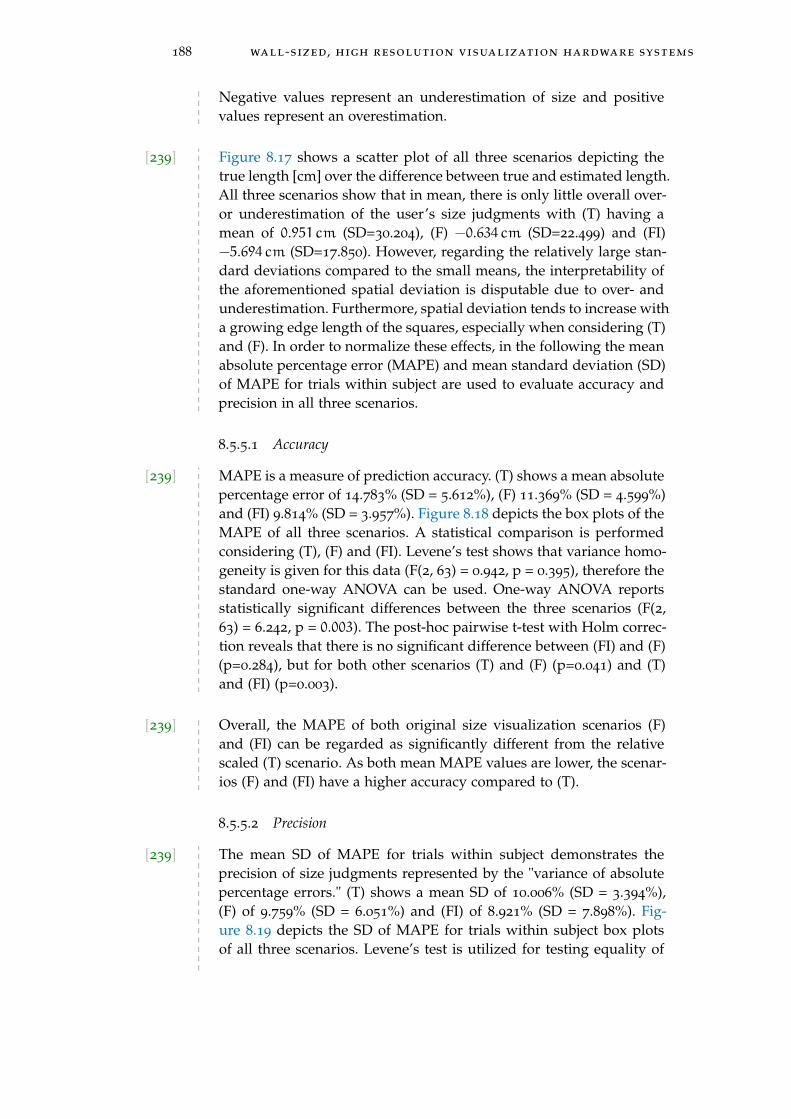
188 wall-sized, high resolution visualization hardware systems
Negative values represent an underestimation of size and positivevalues represent an overestimation.
[239] Figure 8.17 shows a scatter plot of all three scenarios depicting thetrue length [cm] over the difference between true and estimated length.All three scenarios show that in mean, there is only little overall over-or underestimation of the user’s size judgments with (T) having amean of 0.951 cm (SD=30.204), (F) −0.634 cm (SD=22.499) and (FI)−5.694 cm (SD=17.850). However, regarding the relatively large stan-dard deviations compared to the small means, the interpretability ofthe aforementioned spatial deviation is disputable due to over- andunderestimation. Furthermore, spatial deviation tends to increase witha growing edge length of the squares, especially when considering (T)and (F). In order to normalize these effects, in the following the meanabsolute percentage error (MAPE) and mean standard deviation (SD)of MAPE for trials within subject are used to evaluate accuracy andprecision in all three scenarios.
8.5.5.1 Accuracy
[239] MAPE is a measure of prediction accuracy. (T) shows a mean absolutepercentage error of 14.783% (SD = 5.612%), (F) 11.369% (SD = 4.599%)and (FI) 9.814% (SD = 3.957%). Figure 8.18 depicts the box plots of theMAPE of all three scenarios. A statistical comparison is performedconsidering (T), (F) and (FI). Levene’s test shows that variance homo-geneity is given for this data (F(2, 63) = 0.942, p = 0.395), therefore thestandard one-way ANOVA can be used. One-way ANOVA reportsstatistically significant differences between the three scenarios (F(2,63) = 6.242, p = 0.003). The post-hoc pairwise t-test with Holm correc-tion reveals that there is no significant difference between (FI) and (F)(p=0.284), but for both other scenarios (T) and (F) (p=0.041) and (T)and (FI) (p=0.003).
[239] Overall, the MAPE of both original size visualization scenarios (F)and (FI) can be regarded as significantly different from the relativescaled (T) scenario. As both mean MAPE values are lower, the scenar-ios (F) and (FI) have a higher accuracy compared to (T).
8.5.5.2 Precision
[239] The mean SD of MAPE for trials within subject demonstrates theprecision of size judgments represented by the "variance of absolutepercentage errors." (T) shows a mean SD of 10.006% (SD = 3.394%),(F) of 9.759% (SD = 6.051%) and (FI) of 8.921% (SD = 7.898%). Fig-ure 8.19 depicts the SD of MAPE for trials within subject box plotsof all three scenarios. Levene’s test is utilized for testing equality of
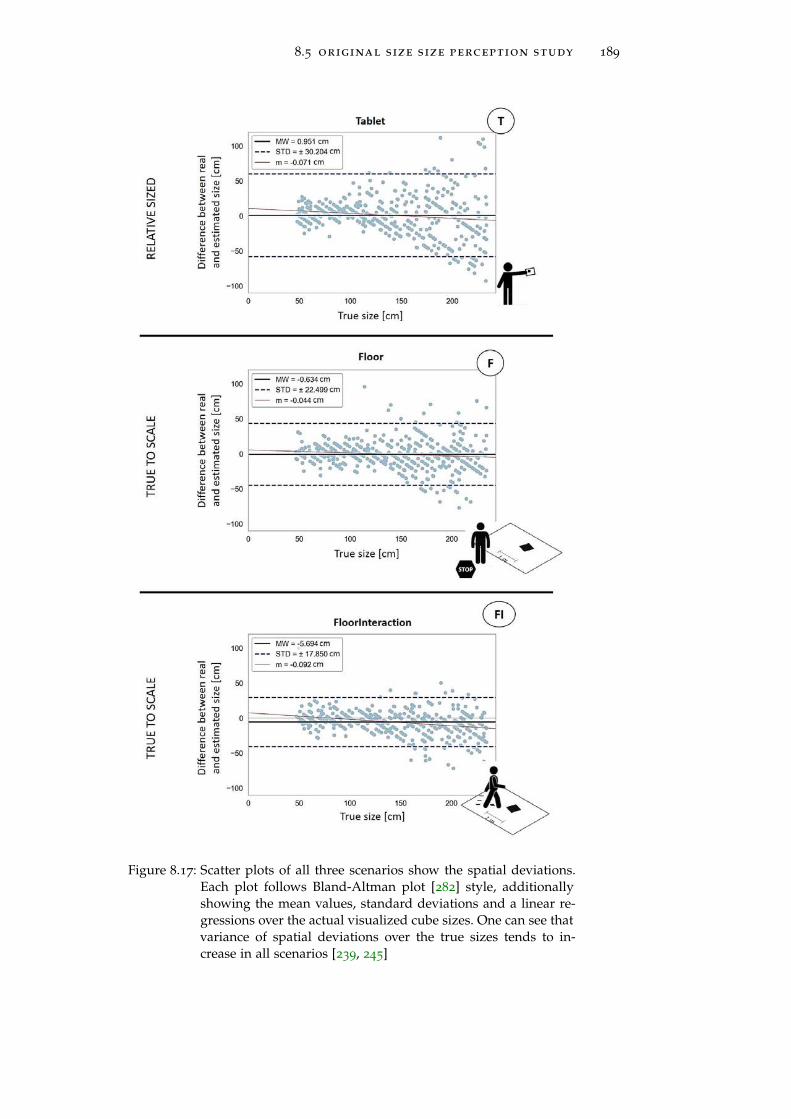
8.5 original size size perception study 189
Figure 8.17: Scatter plots of all three scenarios show the spatial deviations.Each plot follows Bland-Altman plot [282] style, additionallyshowing the mean values, standard deviations and a linear re-gressions over the actual visualized cube sizes. One can see thatvariance of spatial deviations over the true sizes tends to in-crease in all scenarios [239, 245]
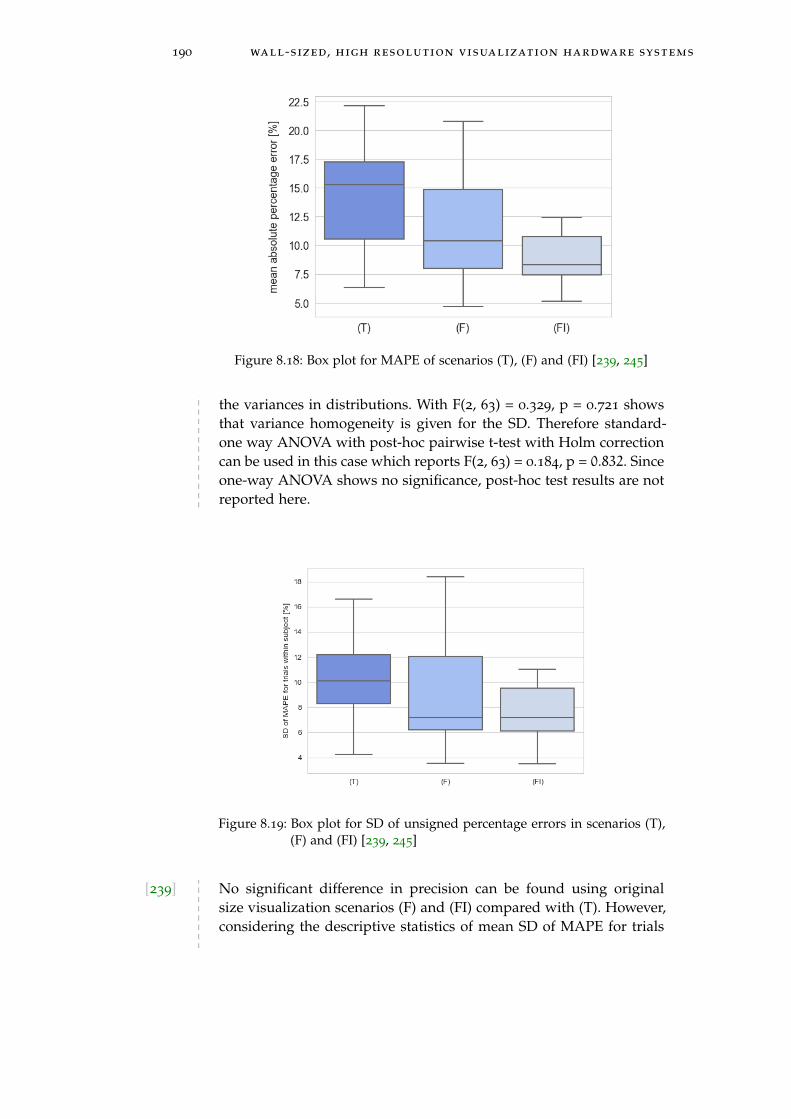
190 wall-sized, high resolution visualization hardware systems
Figure 8.18: Box plot for MAPE of scenarios (T), (F) and (FI) [239, 245]
the variances in distributions. With F(2, 63) = 0.329, p = 0.721 showsthat variance homogeneity is given for the SD. Therefore standard-one way ANOVA with post-hoc pairwise t-test with Holm correctioncan be used in this case which reports F(2, 63) = 0.184, p = 0.832. Sinceone-way ANOVA shows no significance, post-hoc test results are notreported here.
Figure 8.19: Box plot for SD of unsigned percentage errors in scenarios (T),(F) and (FI) [239, 245]
[239] No significant difference in precision can be found using originalsize visualization scenarios (F) and (FI) compared with (T). However,considering the descriptive statistics of mean SD of MAPE for trials
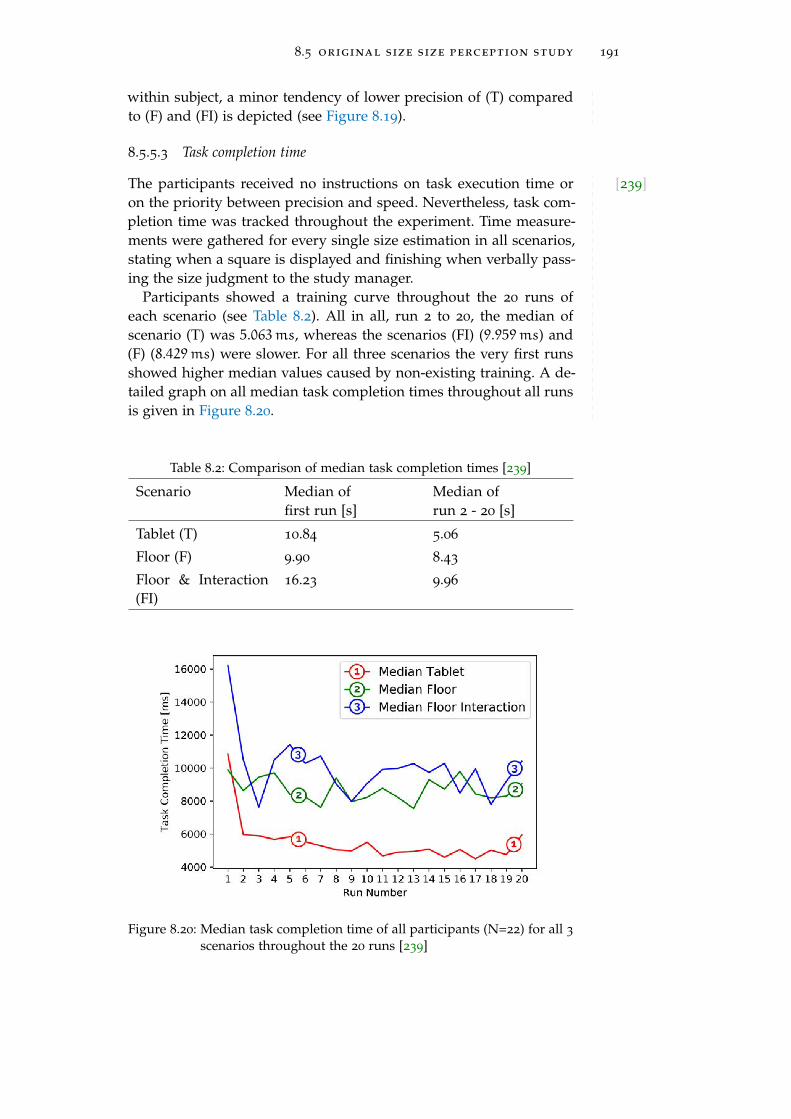
8.5 original size size perception study 191
within subject, a minor tendency of lower precision of (T) comparedto (F) and (FI) is depicted (see Figure 8.19).
8.5.5.3 Task completion time
[239]The participants received no instructions on task execution time oron the priority between precision and speed. Nevertheless, task com-pletion time was tracked throughout the experiment. Time measure-ments were gathered for every single size estimation in all scenarios,stating when a square is displayed and finishing when verbally pass-ing the size judgment to the study manager.
Participants showed a training curve throughout the 20 runs ofeach scenario (see Table 8.2). All in all, run 2 to 20, the median ofscenario (T) was 5.063ms, whereas the scenarios (FI) (9.959ms) and(F) (8.429ms) were slower. For all three scenarios the very first runsshowed higher median values caused by non-existing training. A de-tailed graph on all median task completion times throughout all runsis given in Figure 8.20.
Table 8.2: Comparison of median task completion times [239]
Scenario Median offirst run [s]
Median ofrun 2 - 20 [s]
Tablet (T) 10.84 5.06
Floor (F) 9.90 8.43
Floor & Interaction(FI)
16.23 9.96
Figure 8.20: Median task completion time of all participants (N=22) for all 3
scenarios throughout the 20 runs [239]
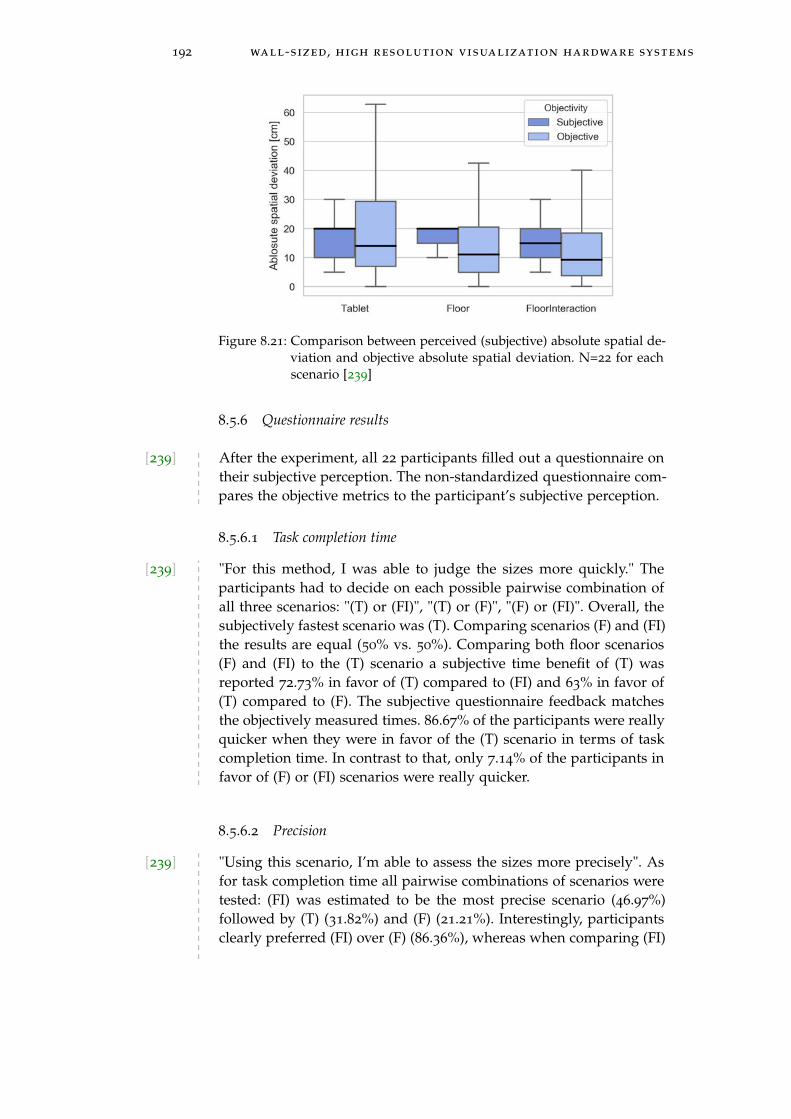
192 wall-sized, high resolution visualization hardware systems
Figure 8.21: Comparison between perceived (subjective) absolute spatial de-viation and objective absolute spatial deviation. N=22 for eachscenario [239]
8.5.6 Questionnaire results
[239] After the experiment, all 22 participants filled out a questionnaire ontheir subjective perception. The non-standardized questionnaire com-pares the objective metrics to the participant’s subjective perception.
8.5.6.1 Task completion time
[239] "For this method, I was able to judge the sizes more quickly." Theparticipants had to decide on each possible pairwise combination ofall three scenarios: "(T) or (FI)", "(T) or (F)", "(F) or (FI)". Overall, thesubjectively fastest scenario was (T). Comparing scenarios (F) and (FI)the results are equal (50% vs. 50%). Comparing both floor scenarios(F) and (FI) to the (T) scenario a subjective time benefit of (T) wasreported 72.73% in favor of (T) compared to (FI) and 63% in favor of(T) compared to (F). The subjective questionnaire feedback matchesthe objectively measured times. 86.67% of the participants were reallyquicker when they were in favor of the (T) scenario in terms of taskcompletion time. In contrast to that, only 7.14% of the participants infavor of (F) or (FI) scenarios were really quicker.
8.5.6.2 Precision
[239] "Using this scenario, I’m able to assess the sizes more precisely". Asfor task completion time all pairwise combinations of scenarios weretested: (FI) was estimated to be the most precise scenario (46.97%)followed by (T) (31.82%) and (F) (21.21%). Interestingly, participantsclearly preferred (FI) over (F) (86.36%), whereas when comparing (FI)

8.5 original size size perception study 193
to (T) and (F) to (T) there was no clear preference (50.00% and 54.55%in favor of both floor scenarios). Comparing those subjective resultswith objective error metrics, there was a false impression for the sub-ject’s error estimation capability using (T) scenario. Only 28.57% ob-jectively performed more precisely using (T) even though they wereestimating this scenario as the most precise one. In contrast, 78.26%of the participants who were in favor of either (F) or (FI) scenariosalso objectively performed better using these scenarios. Additionallyparticipants reported on their absolute subjective size judgment er-ror. In general, participants objectively performed better with a lowerabsolute median error than they subjectively expected it to be (posi-tive values only) (see Figure 8.21). For (T) scenario the perceived me-dian absolute error is 20.00 cm, whereas objective median error was14.08 cm. The same was true for (F) (perceived 20.00 cm, objective11.08 cm) and (FI) (perceived 15.00 cm, objective 9.25 cm)
8.5.6.3 Personal preference
[239]"I personally prefer the following scenario": The highest ranked sce-nario was (FI) with 59.09%, followed by (T) (31.82%) and (F) (9.09%).Even though (T) was ranked second as a preferred scenario, partici-pants who preferred this scenario never performed best (0/7) in termsof precision and most of them even performed worst (5/7).
Additionally, the questionnaire gathered free answer possibilities:Participants reported that when using (FI) they felt "more confidentestimating sizes" (3x), "used natural walking" (1x) to estimate the ab-solute lengths and to change their "viewing perspective" (2x) so thatthe squares were "right in front of them" (1x). They reported having abetter "spatial sense" (1x) and realism degree (2x). Additionally sucha original size visualization was helpful. Participants who preferredthe (T) scenario subjectively mentioned a better "overview" (3x) andbetter "comparison with ruler" (2x) due to the smaller display sizeand "higher resolution" (1x).
8.5.7 Discussion
[239]The results of this study indicate that both absolute (original size)and relative-scale visualizations have advantages:
For absolute-scale visualizations, there is a significant change insize judgment accuracy between tablet and both floor scenarios (F)and (FI). Using the LED floor with original size visualization has apositive influence on the precision of size perception. These experi-mental results are in accordance with earlier findings by the authors(see Otto et al. [93]). There, cascadable room-scale projection systemsare also used to realize industrial applications. In addition to LED-based and projection-based systems, more and more industrial appli-

194 wall-sized, high resolution visualization hardware systems
cation scenarios are realized using VR/AR interaction techniques. Us-ing these HMDs lacks two main benefits compared to augmented floorsurfaces: First, HMDs are single user devices, whereas augmentedfloor surfaces can be utilized by groups of up to 30 people. Second,perceived spaces and sizes are frequently underestimated using VR
HMDs (following Kelly et al. [280]), even though this effect becomessmaller with state-of-the-art headsets. In contrast, LED-floors do notshow effects of over or under estimation in accordance with the re-sults of this publication. Therefore, using original size visualizationenables participants to judge sizes more accurately.
For relative-scale visualizations, task completion times tend to belower. Overall, using the scenarios (F) and (FI) is slower than using(T). Even though lower task completion times could be a hindrancefactor for other use cases, in automotive production validation taskcompletion time is less important than high accuracy.
Another interesting effect in human size judgments are roundinghabits: All participants reported size judgments in a rounded form.Typical reports of size estimation granularity were 5 cm (5/22), 10 cm(16/22) and 25 cm (1/22) steps. None of the participants gave sub-centimeter precision results. Therefore, rounding effects are still smallerthan the perceived size judgment capability (compare Figure 8.21).
8.5.8 Conclusion of size perception study
[239] This study provides in-depth insights into human size judgments andtask completion times, as all of the applications mentioned above relyon accurate and precise user’s size judgments, different modes ofperception and faster task completion times.
When comparing original size (absolute) and relative scale visual-izations, size judgment accuracy is better with absolute visualizationscenarios (F) and (FI), whereas task completion time increases withthose scenarios compared to the baseline scenario (T). In compari-son with VR spatial estimations, where sizes are frequently underes-timated, for original size floor visualizations no generalizable devia-tions could be revealed. Various use cases depend on reliable spatialestimations of humans such as collaborative production validationworkshops.
8.6 virtual stencil study using augmented floor sur-faces
As presented in Section 8.2.3, one potential use case of augmentedfloor surfaces in production planning are virtual stencils. Virtual celllayouts are models of real world workstations. In production prepa-ration, virtual plannings must be physically built up in assembly orlogistics at some point, even though virtual layouts already exist. For
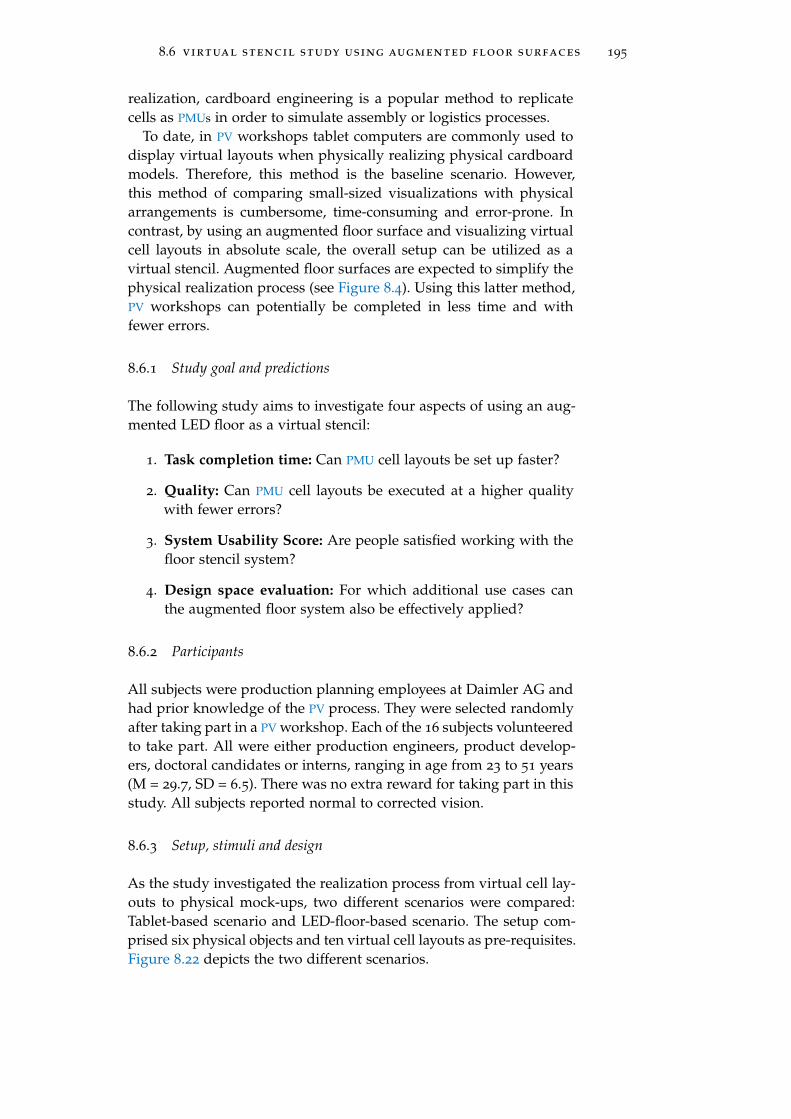
8.6 virtual stencil study using augmented floor surfaces 195
realization, cardboard engineering is a popular method to replicatecells as PMUs in order to simulate assembly or logistics processes.
To date, in PV workshops tablet computers are commonly used todisplay virtual layouts when physically realizing physical cardboardmodels. Therefore, this method is the baseline scenario. However,this method of comparing small-sized visualizations with physicalarrangements is cumbersome, time-consuming and error-prone. Incontrast, by using an augmented floor surface and visualizing virtualcell layouts in absolute scale, the overall setup can be utilized as avirtual stencil. Augmented floor surfaces are expected to simplify thephysical realization process (see Figure 8.4). Using this latter method,PV workshops can potentially be completed in less time and withfewer errors.
8.6.1 Study goal and predictions
The following study aims to investigate four aspects of using an aug-mented LED floor as a virtual stencil:
1. Task completion time: Can PMU cell layouts be set up faster?
2. Quality: Can PMU cell layouts be executed at a higher qualitywith fewer errors?
3. System Usability Score: Are people satisfied working with thefloor stencil system?
4. Design space evaluation: For which additional use cases canthe augmented floor system also be effectively applied?
8.6.2 Participants
All subjects were production planning employees at Daimler AG andhad prior knowledge of the PV process. They were selected randomlyafter taking part in a PV workshop. Each of the 16 subjects volunteeredto take part. All were either production engineers, product develop-ers, doctoral candidates or interns, ranging in age from 23 to 51 years(M = 29.7, SD = 6.5). There was no extra reward for taking part in thisstudy. All subjects reported normal to corrected vision.
8.6.3 Setup, stimuli and design
As the study investigated the realization process from virtual cell lay-outs to physical mock-ups, two different scenarios were compared:Tablet-based scenario and LED-floor-based scenario. The setup com-prised six physical objects and ten virtual cell layouts as pre-requisites.Figure 8.22 depicts the two different scenarios.

196 wall-sized, high resolution visualization hardware systems
Figure 8.22: Example of both scenarios during each run. Blue squares indi-cate the physical object’s destinations
• "Scenario A" utilized the augmented floor surface (technicalspecifications in Section 8.4.1). In this scenario, cell layouts werevisualized in original size on the 9m x 6m large LED floor.
• "Scenario B" utilized a Microsoft Surface tablet with 12.3" andshowed image representations of the virtual cell layouts.
Both scenarios utilized the XnView image visualization tool to dis-play virtual layouts. Overall, ten cell layouts were prepared using awalk path simulation tool and were converted to images for betterreproducibility. Cell layout images were saved in the correspondingaspect ratio 3:2 as this corresponds to the native resolution of the LEDfloor (1728px x 1152px).
Each cell consisted of 15 to 20 objects, such as carrier representa-tions or rack representations. These representations were visualizedas white or blue rectangles. In each of the ten layouts, exactly fourobjects were "active boxes" which were colored blue instead of whiteand had to be physically built up during each session. The studyparticipants were provided with six different objects as shown in Fig-ure 8.23 with the following base area dimensions:
• Small material wagon (50cm x 50cm)
• Big material wagon (70cm x 60cm)
• One plate (104cm x 56cm)
• Box (59cm x 39cm)
• Cardboard cube (46.5cm x 34.5 cm)
• Table on wheels (118.4cm x 35.5cm)
Each cell layout used four out of six physical objects in a random-ized manner. This is a representative mix of items in a physical cell.

8.6 virtual stencil study using augmented floor surfaces 197
Figure 8.23: Set of six physical objects each having different sizes. Four outof six objects are used during each run to replicate the virtualcell layouts
8.6.4 Procedure
In both scenarios the subjects had to physically build the virtual celllayout as quickly as possible with as few errors as possible.
The experimenter welcomed the subjects to the VMS. He providedan introduction to the goals and procedure of this experiment andclarified that the task completion time and error rate are measuredduring the experiment. Afterwards, subjective feedback was gatheredusing a standardized (SUS) and a non-standardized questionnaire.
The overall procedure took approximately 25 minutes includingthe completion of the questionnaire. Since a between-subject experi-mental setup has been chosen, each subject was randomly assignedeither to group 1 (N=8) or group 2 (N=8). The experiment was car-ried out with 16 participants (N=16) in total. Five runs in each of thetwo scenarios A and B were carried out, each with all 16 subjects (seeTable 8.3). Sequence effects were counterbalanced by alternating bothscenarios. This led to a total of 160 datasets.
Table 8.3: Sequence of runs in the 2 groups for each participant. Counter-balanced scenarios A and B for group 1 and 2
Layout L01 L02 L03 L04 L05 L06 L07 L08 L09 L10
Group 1 (N=8) A B A B A B A B A B
Group 2 (N=8) B A B A B A B A B A
For each run, the participant has been shown one out of ten differ-ent cell layouts with alternating starting scenarios. Before each run,all six physical objects were placed in the middle of the LED floor.
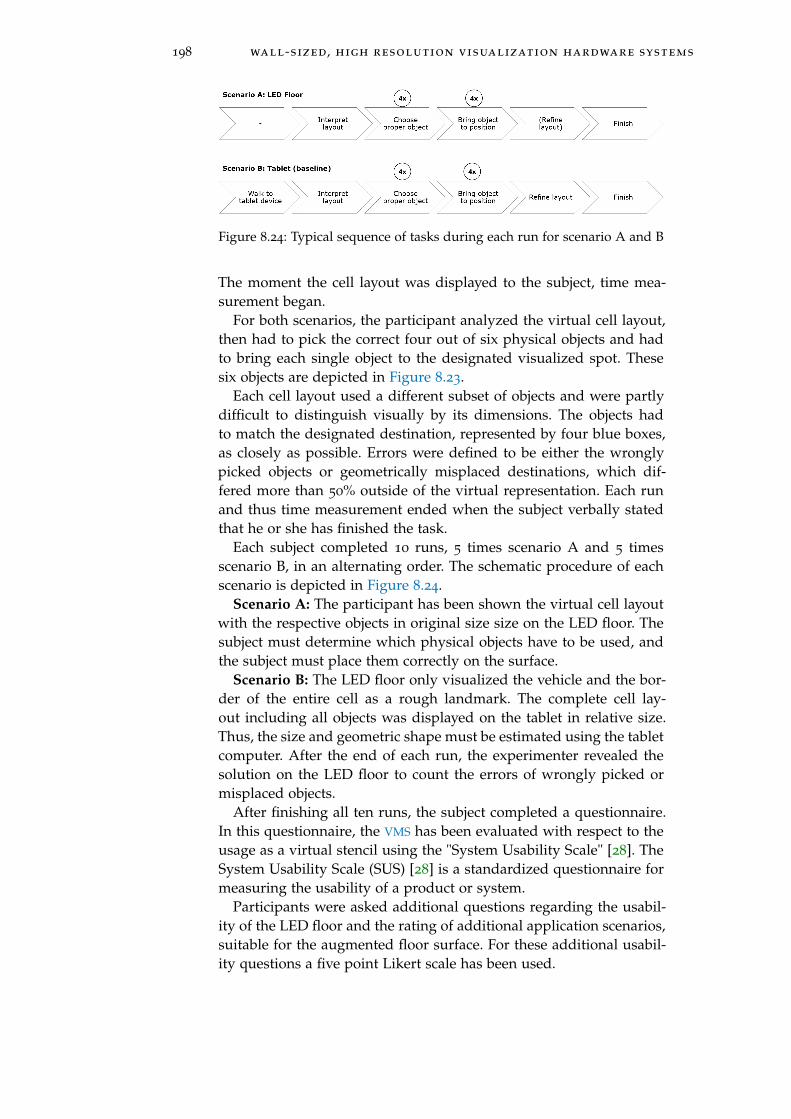
198 wall-sized, high resolution visualization hardware systems
Figure 8.24: Typical sequence of tasks during each run for scenario A and B
The moment the cell layout was displayed to the subject, time mea-surement began.
For both scenarios, the participant analyzed the virtual cell layout,then had to pick the correct four out of six physical objects and hadto bring each single object to the designated visualized spot. Thesesix objects are depicted in Figure 8.23.
Each cell layout used a different subset of objects and were partlydifficult to distinguish visually by its dimensions. The objects hadto match the designated destination, represented by four blue boxes,as closely as possible. Errors were defined to be either the wronglypicked objects or geometrically misplaced destinations, which dif-fered more than 50% outside of the virtual representation. Each runand thus time measurement ended when the subject verbally statedthat he or she has finished the task.
Each subject completed 10 runs, 5 times scenario A and 5 timesscenario B, in an alternating order. The schematic procedure of eachscenario is depicted in Figure 8.24.
Scenario A: The participant has been shown the virtual cell layoutwith the respective objects in original size size on the LED floor. Thesubject must determine which physical objects have to be used, andthe subject must place them correctly on the surface.
Scenario B: The LED floor only visualized the vehicle and the bor-der of the entire cell as a rough landmark. The complete cell lay-out including all objects was displayed on the tablet in relative size.Thus, the size and geometric shape must be estimated using the tabletcomputer. After the end of each run, the experimenter revealed thesolution on the LED floor to count the errors of wrongly picked ormisplaced objects.
After finishing all ten runs, the subject completed a questionnaire.In this questionnaire, the VMS has been evaluated with respect to theusage as a virtual stencil using the "System Usability Scale" [28]. TheSystem Usability Scale (SUS) [28] is a standardized questionnaire formeasuring the usability of a product or system.
Participants were asked additional questions regarding the usabil-ity of the LED floor and the rating of additional application scenarios,suitable for the augmented floor surface. For these additional usabil-ity questions a five point Likert scale has been used.

8.6 virtual stencil study using augmented floor surfaces 199
Figure 8.25: Comparison of the two different scenarios in a box plot
8.6.5 Results
Task completion time and number of errors for each scenario areshown in Table 8.4. This task completion time comprises a full physi-cal replication of the virtual cell layout. If the subjects select a wrongobject or if the placement of the object differs by more than 50% fromthe designated position, one error is counted per misplaced object.Table 8.4 depicts the overall mean numerical results for scenario A(M=42.95, STD=10.93) and scenario B (M=78.21, STD=23.09). Hence,scenario A using the LED floor revealed no errors (0) whereas sce-nario B counted 75 errors.
According to Table 8.4, Figure 8.25 depicts a box plot of the respec-tive data differentiated for both scenarios A and B.
Table 8.4: Results on task completion time and absolute number of errorsfor each scenario
Taks completion time Errors
M [s] STD[s] # of errors
Scenario A: LED Floor 42.95 10.93 0
Scenario B: Tablet 78.21 23.09 75
Hence, complexity is considered to be constant throughout all celllayouts. Mean complexity similarity is revealed by between-subjectevaluation groups. Group 1 (N=8) finished scenario A runs (Layouts1, 3, 5, 7 and 9) in 43.4 seconds, compared to group 2 (N=8) whofinished the complementary layouts (Layouts 2, 4, 6, 8 and 10) in42.5 seconds. Same holds for tablet scenarios. Group 1 (N=8) finishedscenario B runs (Layouts 2,4,6,8 and 10) in 76.1 seconds, comparedto group 2 (N=8), who finished the complementary layouts (Layouts1,3,5,7 and 9) in 80.4 seconds (compare Table 8.3 for group sequence
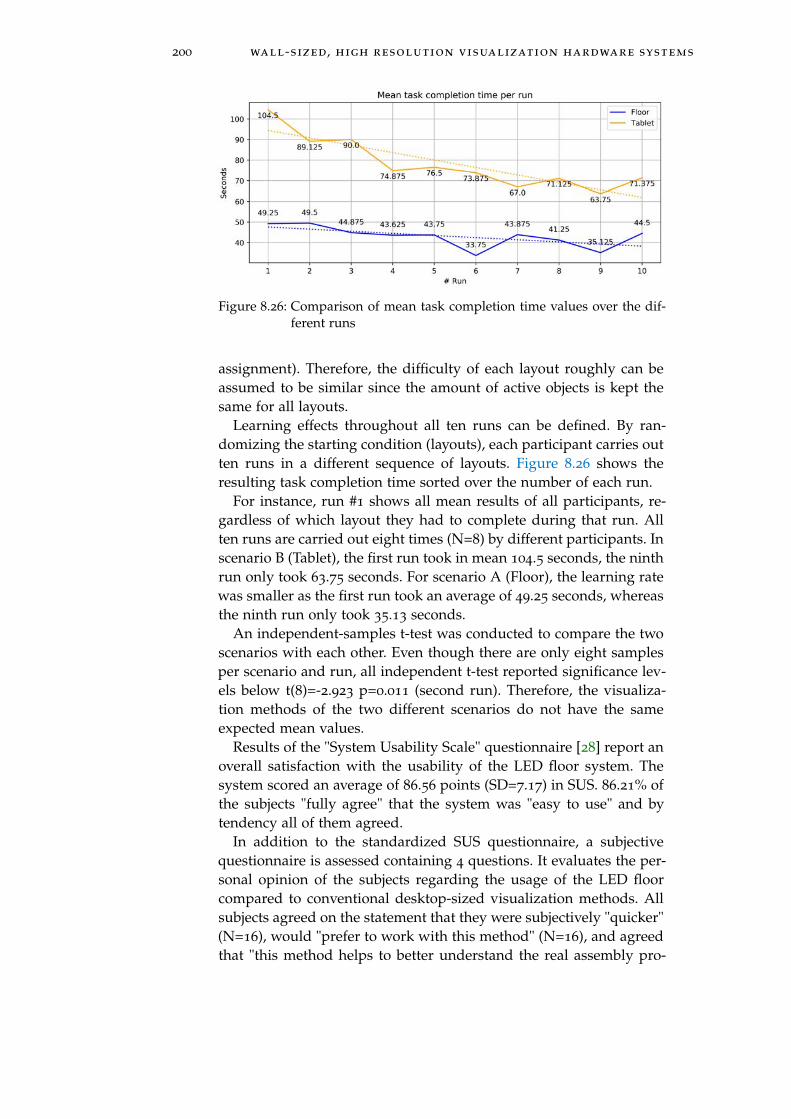
200 wall-sized, high resolution visualization hardware systems
Figure 8.26: Comparison of mean task completion time values over the dif-ferent runs
assignment). Therefore, the difficulty of each layout roughly can beassumed to be similar since the amount of active objects is kept thesame for all layouts.
Learning effects throughout all ten runs can be defined. By ran-domizing the starting condition (layouts), each participant carries outten runs in a different sequence of layouts. Figure 8.26 shows theresulting task completion time sorted over the number of each run.
For instance, run #1 shows all mean results of all participants, re-gardless of which layout they had to complete during that run. Allten runs are carried out eight times (N=8) by different participants. Inscenario B (Tablet), the first run took in mean 104.5 seconds, the ninthrun only took 63.75 seconds. For scenario A (Floor), the learning ratewas smaller as the first run took an average of 49.25 seconds, whereasthe ninth run only took 35.13 seconds.
An independent-samples t-test was conducted to compare the twoscenarios with each other. Even though there are only eight samplesper scenario and run, all independent t-test reported significance lev-els below t(8)=-2.923 p=0.011 (second run). Therefore, the visualiza-tion methods of the two different scenarios do not have the sameexpected mean values.
Results of the "System Usability Scale" questionnaire [28] report anoverall satisfaction with the usability of the LED floor system. Thesystem scored an average of 86.56 points (SD=7.17) in SUS. 86.21% ofthe subjects "fully agree" that the system was "easy to use" and bytendency all of them agreed.
In addition to the standardized SUS questionnaire, a subjectivequestionnaire is assessed containing 4 questions. It evaluates the per-sonal opinion of the subjects regarding the usage of the LED floorcompared to conventional desktop-sized visualization methods. Allsubjects agreed on the statement that they were subjectively "quicker"(N=16), would "prefer to work with this method" (N=16), and agreedthat "this method helps to better understand the real assembly pro-

8.6 virtual stencil study using augmented floor surfaces 201
cesses in workshops" (N=16) than current state-of-the-art methods.Only 1 out of 12 subjects found the "LED floor method is less suit-able in workshop situations", compared to small-sized visualizationdevices (N=12).
Figure 8.27: Evaluation of potential application areas of the LED floor visu-alization and interaction
In addition, the subjects ranked potential use cases of the LED floorwith regard to pre-suggested applications. Subjects were asked tojudge which potential application scenario would be beneficial fortheir work. The results of this ranking are shown in Figure 8.27.
8.6.6 Discussion
As already depicted in Figure 8.25, results show that there is an ef-fect on task completion time using either scenario A or B. Replicatingvirtual cell layouts using the LED floor outperformed scenario B bythe factor of almost two in terms of task completion time (42.95 sec-onds in scenario A compared to 78.21 seconds in scenario B). Dueto the counterbalanced experiment design, no difference between thegroups performances could be revealed. The linear regression in Fig-ure 8.26 shows a learning curve in task completion time over the tenruns of each subject, especially in scenario B (tablet).
Errors are induced by choosing the wrong objects or by choosingthe wrong place. Results show fewer errors are made in scenarioA compared to B. No mistakes (0) were made using the LED floormethod, whereas 75 mistakes were made using the tablet device. Ver-bal feedback by the subjects revealed that choosing the proper objectsis error-prone using the compressed visualization scale of the tabletvisualization. For example, subjects pick the box instead of the ma-terial wagon because the absolute size of the blue rectangle is mis-interpreted. Additionally, even when participants picked the correctobject, they oftentimes placed it in positions with a less than 50% over-lap of the designated place. Due to the direct spatial coupling of theaugmented floor surface, there was no room for misinterpretation ormisplacement of objects, and subjects were able to directly check their
202 wall-sized, high resolution visualization hardware systems
results and correct them, even if the objects were initially incorrectlyassigned. So overall, scenario A is less error-prone.
In addition to the quantitative results, subjects completed a ques-tionnaire for the qualitative data collection. First, the method usingan LED floor is evaluated with respect to its usability by using theSUS questionnaire. Subjects rated all ten SUS statements, predomi-nantly regarding the LED floor as positive. The evaluation of the SUStest showed a total score of 86.56 points. According to the inventor ofthe SUS score, Brooke [166], SUS scores above 85 points indicate anexcellently perceived usability [166].
Insights into further industrial application areas for the interactiveaugmented floor surfaces are provided in Figure 8.27 and applica-tions were ranked by the subjects. Most strikingly, "walk path analy-sis" was rated best with a 93.75% agreement score. Also, "original sizeproduct visualization" (87.5%) and "cell layout planning" (75%) re-ceived high interest for potential use. Average results for potential ap-plication areas were given for "logistics and material zone" (68.75%),"cell layout validation" (68.75%), process planning (62.50%) and "dy-namic tooling simulation" (62.5%). "Material provisioning" (31.25%)and "larger than life product visualization" (37.5%) were judged withthe lowest acceptance rates.
Due to the small number of participants, these figures do not claimquantitative reliability but an overall prioritized list of potential ap-plication areas for future realization for the VMS. Even though thequestionnaire calls for additional ideas of application areas, noneof the participants added to the pre-proposed list of application ar-eas. Some application scenarios were not demoed to the participants,which might influence some low agreement scores for "larger than lifeproduct visualization" or "route planning." Additionally, participantscame from assembly planning, not logistics planning departments.Therefore, "logistics route planning" is not a intrinsic use case for thispopulation, even though it potentially could be a striking use case forother subjects.
8.7 overall conclusion and outlook
[239] Multiple research question have been addressed. First, an in-depthreview of current LHRD research and augmented floor surfaces wasgiven and set into context with industrial planning and validationprocesses. Six novel application scenarios in the domain of virtualassembly validation were presented:
• Interactive optimization of walk paths
• Layout assessments
• Virtual to scale stencil
8.7 overall conclusion and outlook 203
• Size perception and engagement
• Self-navigation in virtual space
• Virtual travels with interactive mapsDerived out of this, two industrial setups with multi-display en-
vironments were developed and implemented. As a proof of con-cept, the first implementation in the context of the VMS was a scalablefloor projection system which proved to work reliably in PV work-shops, evaluated by using questionnaires. This revealed benefits oforiginal size visualization but also found some drawbacks in imple-mentation, such as lacking brightness or self-occlusion by shadow-ing effects. Overall, even this scalable, mobile implementation foundhuge acceptance during PV workshops. With the prior knowledge ofthe proof of concept implementation, the LED-based VMS implemen-tation including an augmented floor surface, was built and presentedfor usage in PV workshops. This implementation was evaluated quan-titatively and qualitatively with two experiments:
A basic research study on size perception of users showed thatsubjects were able to estimate sizes of virtual objects more accuratelyby using original size visualization compared to tablet-sized relativescale visualizations. Nevertheless, task completion time in this ab-stract experiment increased compared to tablet-based scenarios.
In a second experiment, a real-life application study of realizingphysical manufacturing cell layouts was evaluated, comparing tablet-based baseline interaction scenarios with an augmented floor surfaceinteraction scenario. Results showed that the task completion time ofreplicating virtual cell layouts declined while the quality of resultsincreased. Subjects appreciated the novel original size interaction cy-cle of physical and virtual cell layouts, so they always had a strongmental coupling by original size visualization of objects.
Overall, both experiments indicate that original size visualizationhelps estimate sizes more accurately and with fewer errors. LHRD
multi-display environments help achieve the VMS goals in PV work-shops, since large amounts of data have to be visualized in parallel.According to Andrews et al. [254], this also has an impact on thequality of work results. In accordance with the VMS’s key properties,these results on LHRDs, size judgment capabilities, task completiontime and quality multiple aspects have been achieved:
• Multi-user support is given, since the multi display environ-ment can be used with up to 30 people
• Original size is enabled by the presented system including anisometrically registered interaction cycle.
• LHRDs are an enabling technology for asymmetric output asnot all PV workshop participants are intended to have personalviews using HMDs.

204 wall-sized, high resolution visualization hardware systems
• Isometric registration of original size visualization allows geo-metrically close coupling of PMUs and DMUs.
• Entry barriers are reduced since no mental transfer must bemade when original size visualization helps showing massiveamounts of data in parallel as well as geometric information inoriginal size.
In future research, using the presented LHRD apparatus, further in-teraction research will be carried out since the LED-based augmentedfloor surface contains optical approach sensors for direct touch capa-bilities. Footstep recognition, as depicted in Figure 8.2, can thus be re-alized (see also Agethen et al. [67] and compare Schmidt et al. [268]).Such reconstruction of human walk paths can be used in some appli-cation areas to partly replace complex 3D motion capture systems.
9P R O J E C T I V E S PAT I A L A U G M E N T E D R E A L I T Y
Augmented reality for manufacturing environments has been an im-portant focus of research activities over the last decades. For instanceit has been applied to concurrent engineering [40], training [283], fac-tory planning [284] and maintenance [285]. Industrial AugmentedReality (IAR) is defined as the application of AR for the support ofindustrial processes (see Fite-Georgel [286]). In accordance with Fite-Georgel, typical IAR application domains are product design, man-ufacturing (assembly guidance, training), commissioning, inspectionand maintenance and decommissioning. However, even though Bim-ber and Raskar state in 2005 that "industrial use of augmented realityis [. . . ] on the rise" [287], in 2018 Uva et al. summarize that "Aug-mented Reality solutions are still struggling to reach the factories.This issue is mainly due to display solutions that still do not fulfillstrict industrial constraints on ergonomics, color coding, training ofoperators, and the reliability of proposed solutions" [288]. At the mo-ment, most of the solutions proposed for augmented reality use hand-held or head-worn devices, both having disadvantages in industrialenvironments and constraints in real life application.
That is why this chapter focuses on a different non-body-attachedvariant of augmented reality, namely projective SAR. "Projection Aug-mented Reality features one or more optical devices (projectors) thatproject a beam of light onto a specially designed work surface and insome cases directly at the parts a user is working on. This providesimmediate guidance for tasks and reduces the need to interrupt work-flows to obtain information elsewhere" [289].
PV is about assessing the details of the upcoming PPR. The intentionis to integrate PMUs, such as individual parts or even the entire car, inthe virtual assessment workflow. These physical objects are intendedto be superimposed with spatially aligned digital information in PV
workshops. Therefore, the objective is to integrate DMU and PMUs inthe validation process by using spatial augmented reality. This is inline with the VMS framework’s key property to achieve a closer "cou-pling between PMU & DMU" (see Section 5.2).
205
206 projective spatial augmented reality
Related publications and research project
Multiple parts of this chapter’s research have been supportedby internal and external partners within the BMBF-fundedARVIDA research project. The company EXTEND3D has sup-ported this work with their integrated projective SAR systemscalled Werklicht Pro and Werklicht Video, their proprietarySAR software, as well as Fraunhofer IGD Darmstadt with theirmarkerless CAD object tracking software and Daimler Proticswith their integration in the veo validation software environ-ment. These studies were presented in mutual publicationsin the Springer book "Web-basierte Anwendungen VirtuellerTechniken" [134]. However, the application concepts, designspace exploration, OST-HMD vs. SAR comparison and the studyon SAR-supported workshops were designed and carried outby the author for this doctoral thesis. The latter has beenpresented in the conference paper "Dual Reality for Produc-tion Verification Workshops" at "CIRP Conference on AssemblyTechnologies and Systems" by Otto et al. [79]
This chapter is structured as follows: First, the requirements forIAR in PV workshops and ways to integrate PMUs are described. Sub-sequently, a comprehesnive literature review is presented on AR andSAR with a focus on all-purpose driven manufacturing environments.The implementation of a working demonstrator is described in thecontext of employing SAR technology within the VMS framework andcombining it with the assembly simulation software discussed in Sec-tion 6.3. A brief comparison between OST-HMD with projective SAR
is given. Subsequently, insights, two studies are presented: The firststudy gives insights into the design space of SAR in comparison withusage with a head-worn augmented reality device for manual assem-bly tasks. In the second study, SAR is evaluated with respect to itsability to support collaboration performance in workshops with dis-tributer knowledge in terms of task completion time for typical local-ization tasks.
9.1 requirements for pmu-based pv workshops
The overall goal of PV workshops is to validate and optimize the entireproduction system by simulating the build-up of the product. Thiscan be conducted in either the physical or the virtual domain. Blend-ing both domains, AR represents an alternative user interface, whichallows the addition of 3D-registrated digital content to the physicalenvironment in real time [287]. By blending both domains using IAR,production engineers aim to optimize the overall workload during PV
workshops to reduce potential error sources, to increase the resulting

9.1 requirements for pmu-based pv workshops 207
quality, to save time and possibly enhance motivation (see Neumannand Majoros [290]).
In the literature, Neumann and Majoros present an overview ofcognitive, performance and system issues for AR applications in man-ufacturing [290] and cluster AR activities as a list of typical activi-ties. These clusters of manufacturing tasks also apply for PV work-shops. Therefore, Table 9.1 extends the original content of Neumannand Majoros with exemplary application scenarios in PV workshops.Two types of activities are distinguished: Informational activities andworkpiece activities. "The distinctions implied in the table are oftenblurred, but in general, document-related activities tend to be cogni-tive, workpiece activities tend to be kinesthetic and psychomotor, andboth involve visual and auditory factors" [290].
Table 9.1: Classes of AR supportable activities in manufacturing tasks follow-ing Neumann and Majoros [290]
Clusters of AR activities Exemplary use cases of AR
within PV workshops
Informational tasks
Direct attention to storagemedium
Assessment of logistics zone(Pick by Beamer)
Read, comprehend, interpret,calculate
Predetermine motion times, Pro-cess quality, Projection of manu-facturing sequence
Understand speech Ambiguities in commands of PV
workshop colleagues
Form hypotheses Reachability assumptions
Transpose information fromdocuments to workpiece
Derive actions from assemblytask descriptions
Workpiece tasks
Direct attention to workpiece localization of points (see alsoMarchi et al. [291])
Inspect, discriminate, compare,select, align
PMU/DMU quality align Bolts
Orient to sound, interpretsound
N/A
Adjust or actuate devices, detectmovement
Variant handling
Manipulate devices Assembly paths
According to these clusters proposed by Neumann and Majoros asshown in Table 9.1, they are used to evaluate the design space of PV
workshop activities with respect to the usage of SAR in the followingevaluations. The results of the subsequent design space evaluation

208 projective spatial augmented reality
Figure 9.1: Visual display techniques and positioning (based on Bimber andRaskar [287]
will give insights into applicable types of technological approachesfor specific validation tasks: projective SAR or AR.
9.2 properties of spatial augmented reality
Spatial augmented reality is a special AR approach that uses differ-ent display technologies for superimposing objects in reality and can"pave the way towards flexibility, higher efficiency, and new applica-tions" [287, p. 1]. According to Bimber et al. [287, p. 7], "spatial dis-plays detach the display technology from the user and integrate it intothe environment." Bimber et al. call spatial augmented reality "newdisplay paradigms exploit large spatially-aligned optical elements,such as mirror beam combiners, transparent screens, or holograms,as well as video projectors." It is a method of conveying digital infor-mation to workshop participants within a stationary context. "Spatial[. . . ] displays overlay the real environment with computer graphicsin such a way that the graphical images and the image of the real en-vironment are visible at the same time. In contrast to head-attachedor body-attached optical see-through displays, spatial displays gener-ate images that are aligned with the physical environment. They donot follow the users’ movements but rather support moving aroundthem" [287]. "Target objects and users can move around in the envi-ronment, but the zone in which AR experiences take place is limited tothe fields of view of both the fixed projector and supporting camerafor tracking" [289].
As depicted in Figure 9.1, Bimber and Raskar show how projec-tive SAR display techniques differ from head-attached and hand-helddevices. They project digital information onto the real objects andthus superimpose the information onto the viewer. This informationis view independent for multi-user setups when the virtual surface

9.2 properties of spatial augmented reality 209
matches the physical surface - otherwise parallax effects are gener-ated. Regarding the VMS framework hardware arrangement, an al-most stationary setup applies, as the required infrastructure is avail-able and projector positions do not have to vary heavily - in contrastto mobile SAR setups, which are discussed in the literature as well(see Kruijff [292]). The following opportunities and challenges of pro-jected SAR can be found in the literature:
Opportunities of stationary SAR:
• Bright and full contrast projection (following Kruijff [292])
• High fidelity (following Kruijff [292])
• Large FoV of projected display (following Kruijff [292])
• Potentially single disparity plane (following Kruijff [292])
• Reduces or eliminates the need for computer monitors and screens,as the instructions [289] appear directly in the task space
• Reduces users’ cognitive load when following work instructionsdue to the fact that there is no need for "attention switching"between work instructions and the task at hand
• Integrates into manual workflows by promoting a "no faultsforward" policy to ensure and confirm correct execution of thepreceding step
• Provides feedback on completed tasks for process improvement,traceability and unique digital IDs for build cycles
Challenges for stationary SAR:
• Surface-based distortions (following Kruijff [292]): "not possi-ble to display mid-air virtual objects, but only 2D objects ona physical surface. Furthermore, surface-based distortions re-main an issue, and the user could misunderstand the projectedinstructions" [288]. Surface-based distortions can lead to worselegibility
• No mid-air visualization capabilities (following Uva et al. [288])
• Shadows and clipping (following Krevelen et al. [293])
• Registration
• Ambiguities
• Multi-user support
210 projective spatial augmented reality
9.3 related work on spatial augmented reality in man-ufacturing
Research on augmented reality has received a great deal of attentionover the past two decades. As Wang et al. state in their research re-view on AR in assembly [294], between 1990 and 2015 they evaluated304 papers on this topic. This review gives a concise overview of thetechnical features, characteristics and wide range of applications forAR-based assembly systems. Wang et al. clustered the application pa-pers in three main and twelve sub-categories:
• AR assembly guidance
• AR assembly training
• AR assembly simulation, design and planning
The VMS framework’s research in the context of PV workshops con-tributes to the last category "AR assembly simulation, design andplanning." Additionally, in the past few years research has focusedon industrial augmented reality applications. Fraga-Lamas present areview on industrial AR systems for the Industry 4.0 Shipyard [295].Their holistic review is not only limited to shipyard applications butalso includes an overview on state-of-the-art AR technologies and ap-plications in manufacturing including SAR applications. More gener-ally speaking, Nee et al. present a holistic overview of general AR ap-plications in 2012 [296]. More specifically, other studies on augmentedreality application scenarios in automotive industry are conducted byGeissel [42] or Bliese [297].
With respect to spatial augmented reality, early studies refer to thisdomain as projective augmented reality. One of the early SAR exam-ples of superimposing a calculator on a regular desk was presented byWellner in 1991 [298]. Later studies by Wellner in 1994 showed a deskfor virtual interaction as an "augmented environment for paper" [299].Since then multiple use cases using SAR interaction technology havebeen presented, such as product design [300], interaction design [300],entertainment [112], museums [301], [302] and industrial use casessuch as manual workstations [288], maintenance and shop floor assis-tance [303]. Volkswagen presents a whitepaper with use cases for Spa-tial Augmented Reality [300] in design and manufacturing on theirwebsite. Dedicated mobile projective SAR research is carried out inthe MoSART projects by Cortes et al. [304] and AMP-D by Winkler etal. [305]. Both concepts share body-worn camera-projector systems tosuperimpose digital content onto objects in the physical environment.Even though there are multiple publications on SAR in manufactur-ing, the vast majority of papers present body-worn or hand-held AR
applications due to their wide availability. The most relevant papersfor projective SAR in the context of the VMS are presented below:

9.3 related work on spatial augmented reality in manufacturing 211
As early as 2003, Piper and Ishii proposed CADcast [306] - a "Methodfor Projecting Spatially Referenced Procedural Instructions." The sys-tem projects assembly instructions onto a workbench. They showedin a brief evaluation that task completion time is reduced by usingSAR compared to paper-based methods.
Benko et al. present FoveAR [110], a combination of optical see-through displays with spatial augmented reality projections and askthe design space question about which content to display where. Us-ing their prototype system FoveAR, they present an analysis of theinteractive design space. In their description of their four exemplaryuse cases, they also discuss the advantages of this combination fordisplaying public and private content. Subsequently, the results ofthe design space evaluation are evaluated in the context of this publi-cation.
Uva et al. present a journal paper on the effectiveness of SAR inmanual workstations [288]. In this evaluation on an SAR workbench,assembly tasks on a motor cycle engine are carried out. For this study,Uva et al. use an augmented workbench discussed by the same au-thors in 2016 [307]. This workbench tracks and augments manualassembly activities. The authors investigate whether SAR is an ef-fective support for the operators, while projecting technical instruc-tions. Therefore task performance, task completion time and errorrates have been measured. They come to the conclusion that "SAR pre-sentation mode is significantly better than paper in completion timesand error rates" [288] while using a manual assembly station. In par-ticular, work tasks with high complexities show significantly lowercompletion times as there is a "substantial reduction in complexity"[288]. In contrast to the findings of Uva et al., the VMS frameworkdoes not limit the "main advantage of SAR" to "the reduction of errorrates than to completion times" [288].
Sand et al. present a digital guidance and picking assembly assis-tance system supporting assembly workers at their workstations [308].They provide operational information to untrained workers on assem-bling products without any previous knowledge. Even though thereis no formal evaluation, they show that using SAR enables workersto perform the work tasks and that "projection-based instructions areable to assemble products faster and with a lower error rate, com-pared to the system based on smart glasses" [308].
Doshi et al. propose a projection-based SAR system to improve man-ual spot-welding precision and accuracy for automotive manufactur-ing [309]. They present a video-projection-based SAR system and eval-uate this in a real automotive production plant. Overall, by usingtheir system they determined a 52% reduction in standard deviationsfor manual spot-weld placements. They propose a set of best practicevisual cues for spot-welding, such as circles, crosshairs and arrows in
212 projective spatial augmented reality
different colors, which has also influenced the design space evalua-tion for the VMS.
Schwerdtfeger et al. developed an SAR system that employs laserprojection systems [303] for quality assurance and maintenance. Theyprovide insights into geometric, optical and implementation issuesof laser-based projective SAR systems. In addition, Schwerdtfeger etal. discuss occlusion issues caused by the users and the objects them-selves. They conclude that their body-attached projector setup hasto be faster and more accurate. They thus present a hybrid solutionbetween fully mobile and completely stationary setups: A tripod-mounted SAR projector. This implementation later became commer-cially available as a derivative of this paper and is called "Werklicht."It is applied in the following design space evaluation and studies forthe VMS framework.
Multiple publications are available on the overall performance us-ing SAR: Funk et al. concluded that using in-situ projection at assem-bly workstations results in a significant reduction in task completiontimes: "results show that assembling parts is significantly faster us-ing in-situ projection and locating positions is significantly slowerusing HMDs." [310]. Bimber and Raskas substantiate these findingswith the "high level of consistency between real and virtual environ-ments." [287, p. 8], since "cognitive distance is high if users switchedfrom the information space (the manual) to physical space." Kruijffet al. support these findings by stating that omitting SAR leads to theeffect that users have to "understand the relationship between what isseen directly in the real world and what is shown on the screen whencomparing both, which may require difficult mental rotation and scal-ing" [292]. Therefore, SAR is integrated in the VMS framework’s keyproperties. Collaborative tasks in PV workshops are often coupledwith a geometrical localization task, when one or multiple partici-pants want to show others certain product variants, mounting points,welding spots, mass points or similar geometric references.
Even though not all potential benefits are evaluated explicitly forthe VMS framework, literature can be summarized as follows:
• Lower error rates (compare Uva et. al [288])
• Reduced task completion time (compare Funk et al. [310] andUva et. al [288])
• Context-sensitive information: The reduction of mental work-load associated with a task because only the task-relevant infor-mation is displayed (compare Kim and Dey [311])
• Cognitive distance is high if users switch from information space(the manual) to physical space. Reduction of mental workloadassociated with these textual instructions is high when users tryto memorize the sequence (compare Kim and Dey [311])
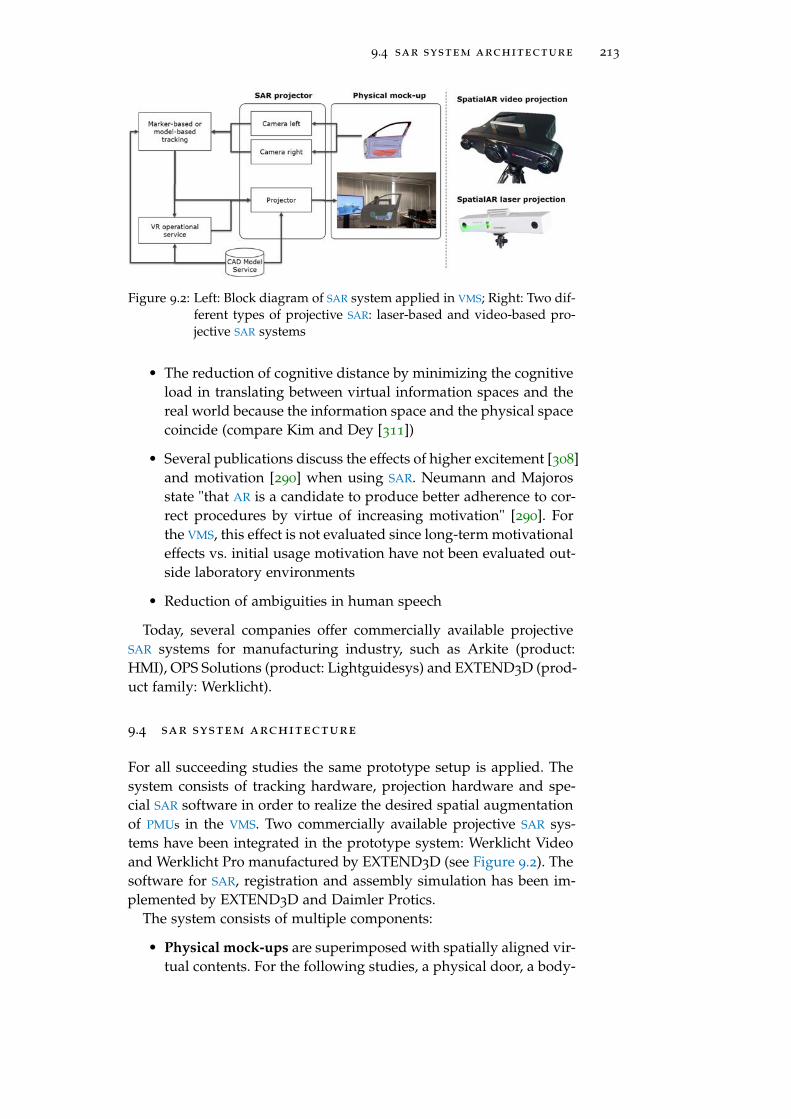
9.4 sar system architecture 213
Figure 9.2: Left: Block diagram of SAR system applied in VMS; Right: Two dif-ferent types of projective SAR: laser-based and video-based pro-jective SAR systems
• The reduction of cognitive distance by minimizing the cognitiveload in translating between virtual information spaces and thereal world because the information space and the physical spacecoincide (compare Kim and Dey [311])
• Several publications discuss the effects of higher excitement [308]and motivation [290] when using SAR. Neumann and Majorosstate "that AR is a candidate to produce better adherence to cor-rect procedures by virtue of increasing motivation" [290]. Forthe VMS, this effect is not evaluated since long-term motivationaleffects vs. initial usage motivation have not been evaluated out-side laboratory environments
• Reduction of ambiguities in human speech
Today, several companies offer commercially available projectiveSAR systems for manufacturing industry, such as Arkite (product:HMI), OPS Solutions (product: Lightguidesys) and EXTEND3D (prod-uct family: Werklicht).
9.4 sar system architecture
For all succeeding studies the same prototype setup is applied. Thesystem consists of tracking hardware, projection hardware and spe-cial SAR software in order to realize the desired spatial augmentationof PMUs in the VMS. Two commercially available projective SAR sys-tems have been integrated in the prototype system: Werklicht Videoand Werklicht Pro manufactured by EXTEND3D (see Figure 9.2). Thesoftware for SAR, registration and assembly simulation has been im-plemented by EXTEND3D and Daimler Protics.
The system consists of multiple components:
• Physical mock-ups are superimposed with spatially aligned vir-tual contents. For the following studies, a physical door, a body-
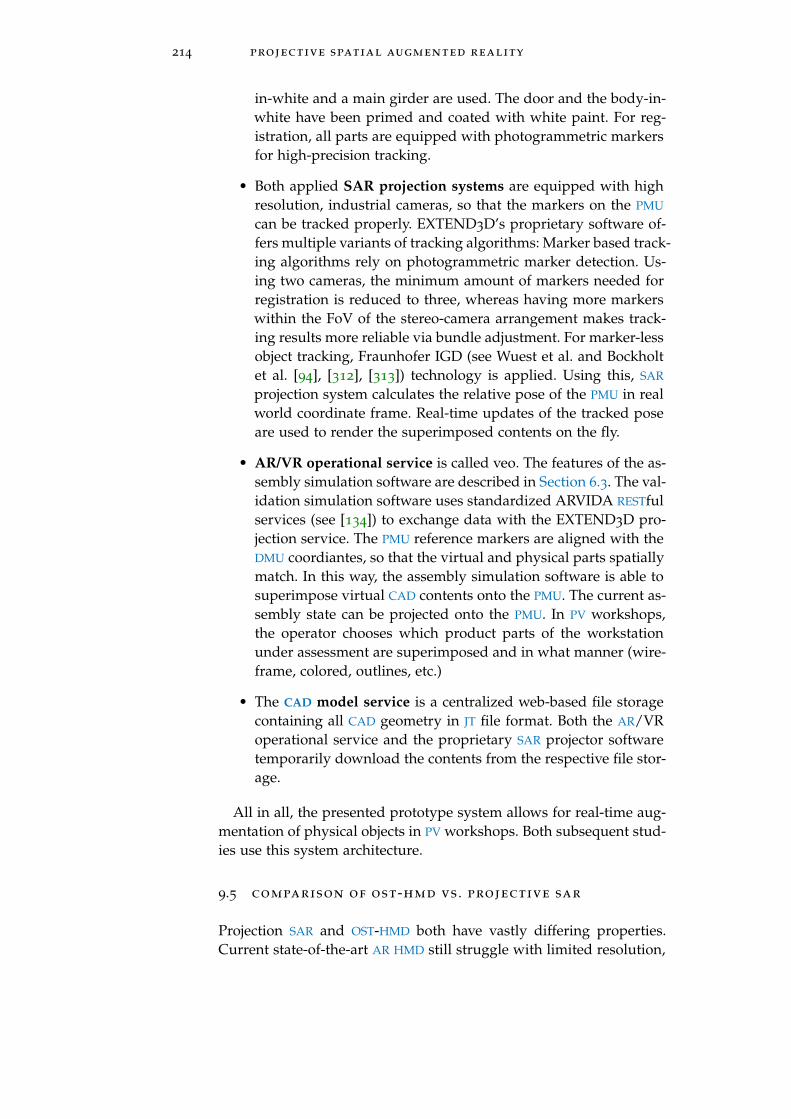
214 projective spatial augmented reality
in-white and a main girder are used. The door and the body-in-white have been primed and coated with white paint. For reg-istration, all parts are equipped with photogrammetric markersfor high-precision tracking.
• Both applied SAR projection systems are equipped with highresolution, industrial cameras, so that the markers on the PMU
can be tracked properly. EXTEND3D’s proprietary software of-fers multiple variants of tracking algorithms: Marker based track-ing algorithms rely on photogrammetric marker detection. Us-ing two cameras, the minimum amount of markers needed forregistration is reduced to three, whereas having more markerswithin the FoV of the stereo-camera arrangement makes track-ing results more reliable via bundle adjustment. For marker-lessobject tracking, Fraunhofer IGD (see Wuest et al. and Bockholtet al. [94], [312], [313]) technology is applied. Using this, SAR
projection system calculates the relative pose of the PMU in realworld coordinate frame. Real-time updates of the tracked poseare used to render the superimposed contents on the fly.
• AR/VR operational service is called veo. The features of the as-sembly simulation software are described in Section 6.3. The val-idation simulation software uses standardized ARVIDA RESTfulservices (see [134]) to exchange data with the EXTEND3D pro-jection service. The PMU reference markers are aligned with theDMU coordiantes, so that the virtual and physical parts spatiallymatch. In this way, the assembly simulation software is able tosuperimpose virtual CAD contents onto the PMU. The current as-sembly state can be projected onto the PMU. In PV workshops,the operator chooses which product parts of the workstationunder assessment are superimposed and in what manner (wire-frame, colored, outlines, etc.)
• The CAD model service is a centralized web-based file storagecontaining all CAD geometry in JT file format. Both the AR/VRoperational service and the proprietary SAR projector softwaretemporarily download the contents from the respective file stor-age.
All in all, the presented prototype system allows for real-time aug-mentation of physical objects in PV workshops. Both subsequent stud-ies use this system architecture.
9.5 comparison of ost-hmd vs . projective sar
Projection SAR and OST-HMD both have vastly differing properties.Current state-of-the-art AR HMD still struggle with limited resolution,
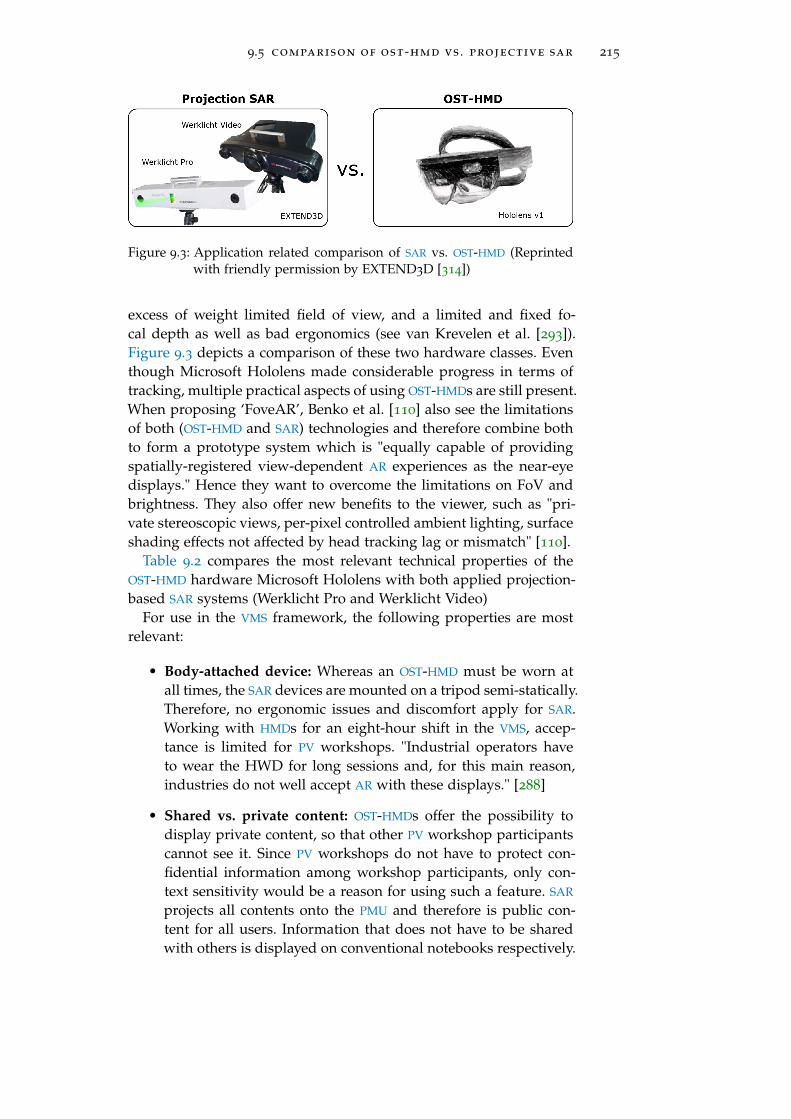
9.5 comparison of ost-hmd vs . projective sar 215
Figure 9.3: Application related comparison of SAR vs. OST-HMD (Reprintedwith friendly permission by EXTEND3D [314])
excess of weight limited field of view, and a limited and fixed fo-cal depth as well as bad ergonomics (see van Krevelen et al. [293]).Figure 9.3 depicts a comparison of these two hardware classes. Eventhough Microsoft Hololens made considerable progress in terms oftracking, multiple practical aspects of using OST-HMDs are still present.When proposing ‘FoveAR’, Benko et al. [110] also see the limitationsof both (OST-HMD and SAR) technologies and therefore combine bothto form a prototype system which is "equally capable of providingspatially-registered view-dependent AR experiences as the near-eyedisplays." Hence they want to overcome the limitations on FoV andbrightness. They also offer new benefits to the viewer, such as "pri-vate stereoscopic views, per-pixel controlled ambient lighting, surfaceshading effects not affected by head tracking lag or mismatch" [110].
Table 9.2 compares the most relevant technical properties of theOST-HMD hardware Microsoft Hololens with both applied projection-based SAR systems (Werklicht Pro and Werklicht Video)
For use in the VMS framework, the following properties are mostrelevant:
• Body-attached device: Whereas an OST-HMD must be worn atall times, the SAR devices are mounted on a tripod semi-statically.Therefore, no ergonomic issues and discomfort apply for SAR.Working with HMDs for an eight-hour shift in the VMS, accep-tance is limited for PV workshops. "Industrial operators haveto wear the HWD for long sessions and, for this main reason,industries do not well accept AR with these displays." [288]
• Shared vs. private content: OST-HMDs offer the possibility todisplay private content, so that other PV workshop participantscannot see it. Since PV workshops do not have to protect con-fidential information among workshop participants, only con-text sensitivity would be a reason for using such a feature. SAR
projects all contents onto the PMU and therefore is public con-tent for all users. Information that does not have to be sharedwith others is displayed on conventional notebooks respectively.
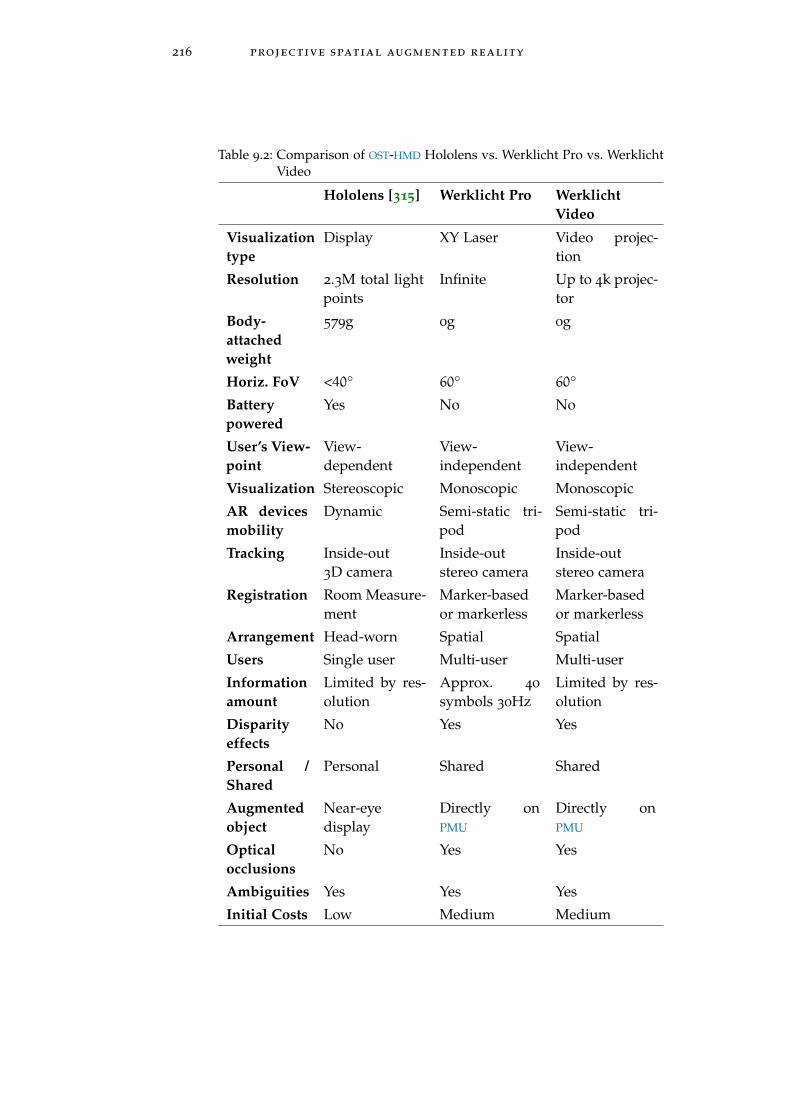
216 projective spatial augmented reality
Table 9.2: Comparison of OST-HMD Hololens vs. Werklicht Pro vs. WerklichtVideo
Hololens [315] Werklicht Pro WerklichtVideo
Visualizationtype
Display XY Laser Video projec-tion
Resolution 2.3M total lightpoints
Infinite Up to 4k projec-tor
Body-attachedweight
579g 0g 0g
Horiz. FoV <40◦ 60◦ 60◦
Batterypowered
Yes No No
User’s View-point
View-dependent
View-independent
View-independent
Visualization Stereoscopic Monoscopic Monoscopic
AR devicesmobility
Dynamic Semi-static tri-pod
Semi-static tri-pod
Tracking Inside-out3D camera
Inside-outstereo camera
Inside-outstereo camera
Registration Room Measure-ment
Marker-basedor markerless
Marker-basedor markerless
Arrangement Head-worn Spatial Spatial
Users Single user Multi-user Multi-user
Informationamount
Limited by res-olution
Approx. 40
symbols 30HzLimited by res-olution
Disparityeffects
No Yes Yes
Personal /Shared
Personal Shared Shared
Augmentedobject
Near-eyedisplay
Directly onPMU
Directly onPMU
Opticalocclusions
No Yes Yes
Ambiguities Yes Yes Yes
Initial Costs Low Medium Medium

9.6 design space exploration of spatial augmented reality 217
• Amount of devices: PV workshops can consist of up to 30 per-sons. If each individual uses OST-HMD, a massive amount ofhardware has to be in place. This involves additional costs andlogistics and maintenance overhead (loading, recharging, cali-bration, wiping, hygiene aspects, etc.)
• View-dependent visualization: Since OST-HMDs are single-userdevices, view-dependent rendering for AR is the main benefit.SAR can also be used for view-dependent rendering but is notactivated in VMS. All workshop participants consume the super-imposed information, so viewpoint-dependent rendering is de-activated. Nevertheless, superimposed data matches perfectlyfor all participants when the virtual data lies on the PMU pro-jection surface. For SAR "this is particularly visible for virtualobjects far away from a projection surface (i.e., with big dispar-ity)." [110]. Especially for mid-air visualizations, SAR has limitedusability.
• Optical occlusions: Since OST-HMD are near-eye displays, no op-tical occlusions between digital content and the line of sightapplies. Line of sight towards the PMU can still be occluded.Following Schwerdtfeger et al. [303] for projection SAR, two rea-sons for occlusion can apply. Either the users occlude the lineof projections and therefore cast shadows onto the PMU, or ob-jects occlude the line of projection. For complex PMUs and withprotruding parts and concave geometry, self-occlusions apply.Therefore the proper placement of the SAR unit is crucial butnot a hindrance factor for PV workshops.
These differences show why the SAR interaction design space is cho-sen for evaluation in the following sections. Uva et al. summarize SAR
as possibly being the "optimal solution for the visualization of bothinstructions and technical information directly on the industrial work-bench" [288]. This assumption is evaluated with regard to its designspace for assembly assessment scenarios in VMS and PV workshops.
9.6 design space exploration of spatial augmented re-ality
As shown in the literature review, the design space of SAR has notbeen described completely for the manufacturing industry. This studygives insights into the applicability of SAR for product validation sce-narios. In the design space study, the following virtual contents aresuperimposed onto the workstation of the PMU:
• 2D Symbols & indicators
• Spatially aligned CAD geometry
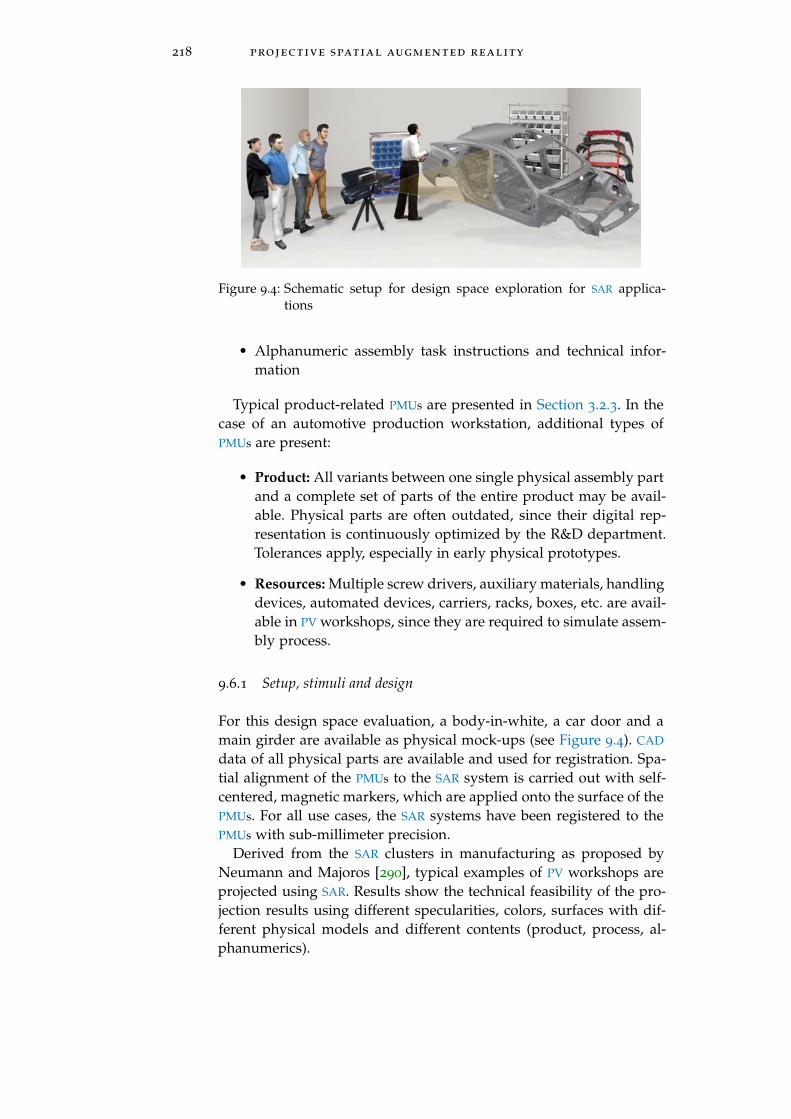
218 projective spatial augmented reality
Figure 9.4: Schematic setup for design space exploration for SAR applica-tions
• Alphanumeric assembly task instructions and technical infor-mation
Typical product-related PMUs are presented in Section 3.2.3. In thecase of an automotive production workstation, additional types ofPMUs are present:
• Product: All variants between one single physical assembly partand a complete set of parts of the entire product may be avail-able. Physical parts are often outdated, since their digital rep-resentation is continuously optimized by the R&D department.Tolerances apply, especially in early physical prototypes.
• Resources: Multiple screw drivers, auxiliary materials, handlingdevices, automated devices, carriers, racks, boxes, etc. are avail-able in PV workshops, since they are required to simulate assem-bly process.
9.6.1 Setup, stimuli and design
For this design space evaluation, a body-in-white, a car door and amain girder are available as physical mock-ups (see Figure 9.4). CAD
data of all physical parts are available and used for registration. Spa-tial alignment of the PMUs to the SAR system is carried out with self-centered, magnetic markers, which are applied onto the surface of thePMUs. For all use cases, the SAR systems have been registered to thePMUs with sub-millimeter precision.
Derived from the SAR clusters in manufacturing as proposed byNeumann and Majoros [290], typical examples of PV workshops areprojected using SAR. Results show the technical feasibility of the pro-jection results using different specularities, colors, surfaces with dif-ferent physical models and different contents (product, process, al-phanumerics).
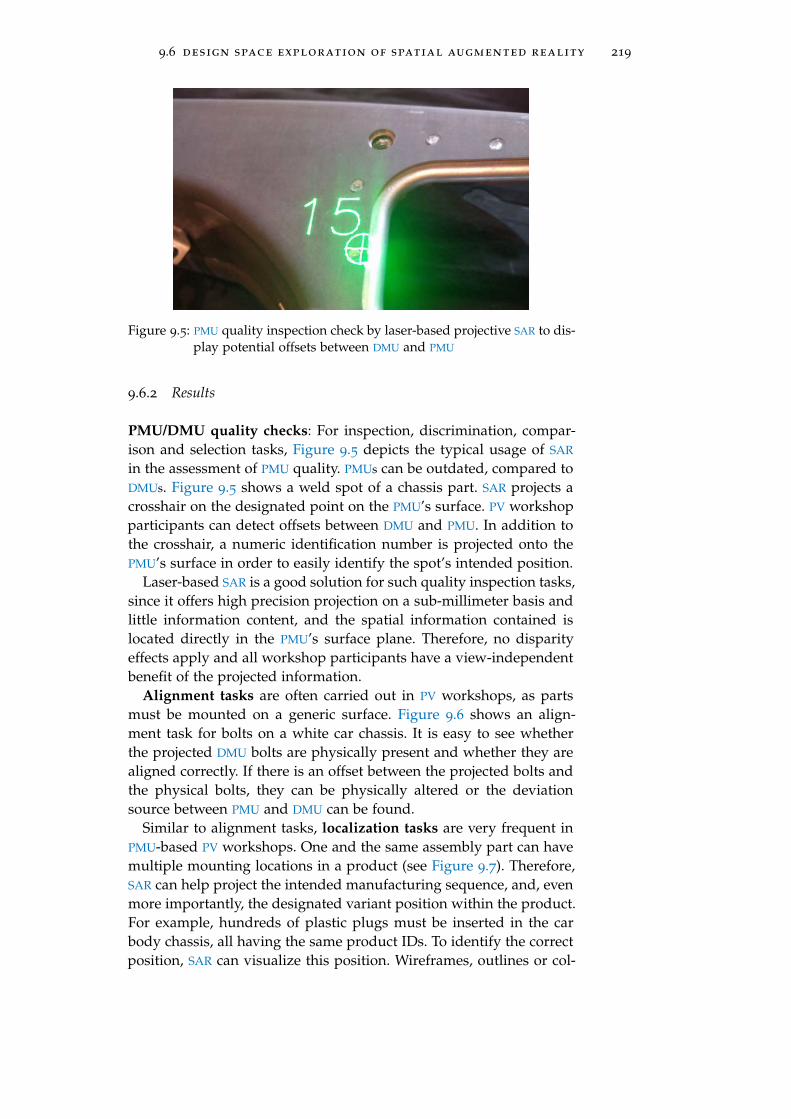
9.6 design space exploration of spatial augmented reality 219
Figure 9.5: PMU quality inspection check by laser-based projective SAR to dis-play potential offsets between DMU and PMU
9.6.2 Results
PMU/DMU quality checks: For inspection, discrimination, compar-ison and selection tasks, Figure 9.5 depicts the typical usage of SAR
in the assessment of PMU quality. PMUs can be outdated, compared toDMUs. Figure 9.5 shows a weld spot of a chassis part. SAR projects acrosshair on the designated point on the PMU’s surface. PV workshopparticipants can detect offsets between DMU and PMU. In addition tothe crosshair, a numeric identification number is projected onto thePMU’s surface in order to easily identify the spot’s intended position.
Laser-based SAR is a good solution for such quality inspection tasks,since it offers high precision projection on a sub-millimeter basis andlittle information content, and the spatial information contained islocated directly in the PMU’s surface plane. Therefore, no disparityeffects apply and all workshop participants have a view-independentbenefit of the projected information.
Alignment tasks are often carried out in PV workshops, as partsmust be mounted on a generic surface. Figure 9.6 shows an align-ment task for bolts on a white car chassis. It is easy to see whetherthe projected DMU bolts are physically present and whether they arealigned correctly. If there is an offset between the projected bolts andthe physical bolts, they can be physically altered or the deviationsource between PMU and DMU can be found.
Similar to alignment tasks, localization tasks are very frequent inPMU-based PV workshops. One and the same assembly part can havemultiple mounting locations in a product (see Figure 9.7). Therefore,SAR can help project the intended manufacturing sequence, and, evenmore importantly, the designated variant position within the product.For example, hundreds of plastic plugs must be inserted in the carbody chassis, all having the same product IDs. To identify the correctposition, SAR can visualize this position. Wireframes, outlines or col-
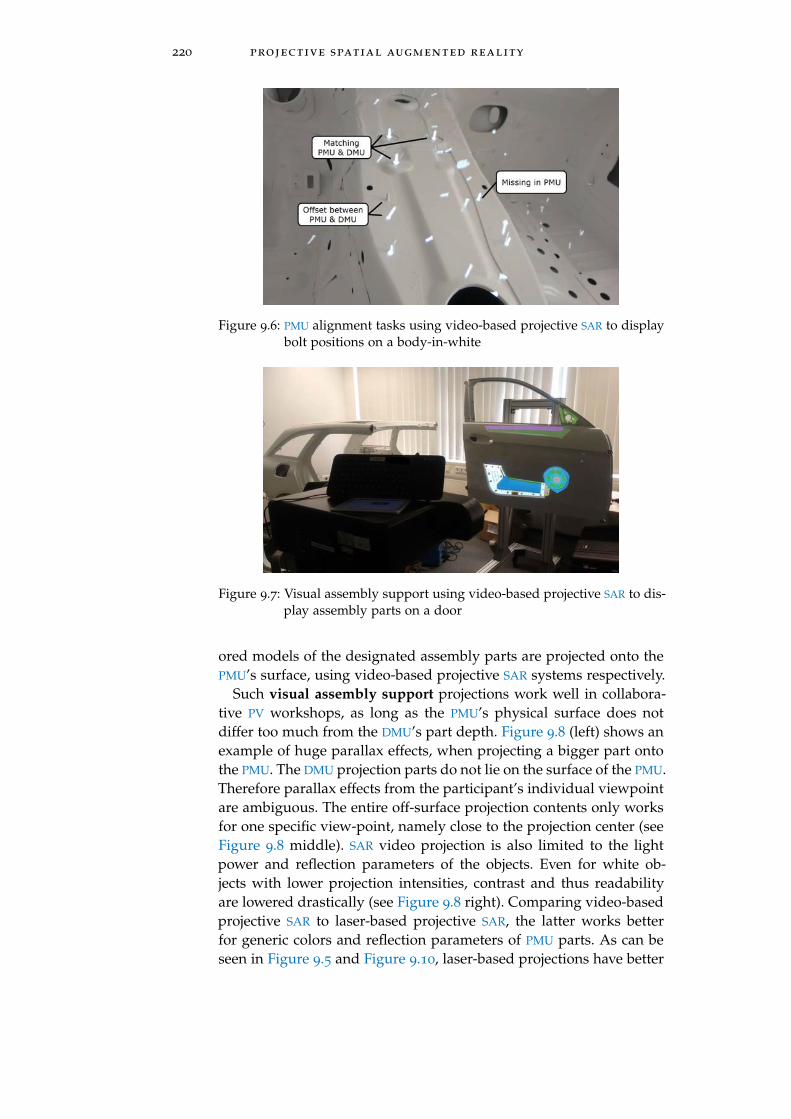
220 projective spatial augmented reality
Figure 9.6: PMU alignment tasks using video-based projective SAR to displaybolt positions on a body-in-white
Figure 9.7: Visual assembly support using video-based projective SAR to dis-play assembly parts on a door
ored models of the designated assembly parts are projected onto thePMU’s surface, using video-based projective SAR systems respectively.
Such visual assembly support projections work well in collabora-tive PV workshops, as long as the PMU’s physical surface does notdiffer too much from the DMU’s part depth. Figure 9.8 (left) shows anexample of huge parallax effects, when projecting a bigger part ontothe PMU. The DMU projection parts do not lie on the surface of the PMU.Therefore parallax effects from the participant’s individual viewpointare ambiguous. The entire off-surface projection contents only worksfor one specific view-point, namely close to the projection center (seeFigure 9.8 middle). SAR video projection is also limited to the lightpower and reflection parameters of the objects. Even for white ob-jects with lower projection intensities, contrast and thus readabilityare lowered drastically (see Figure 9.8 right). Comparing video-basedprojective SAR to laser-based projective SAR, the latter works betterfor generic colors and reflection parameters of PMU parts. As can beseen in Figure 9.5 and Figure 9.10, laser-based projections have better
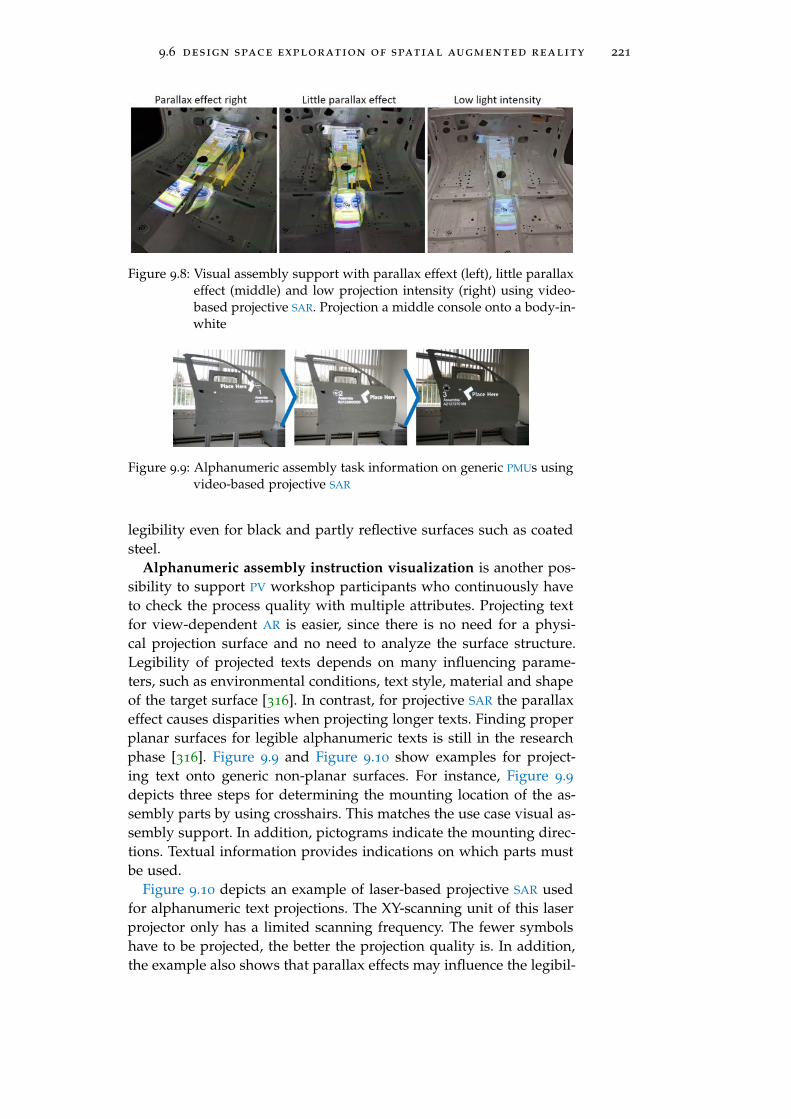
9.6 design space exploration of spatial augmented reality 221
Figure 9.8: Visual assembly support with parallax effext (left), little parallaxeffect (middle) and low projection intensity (right) using video-based projective SAR. Projection a middle console onto a body-in-white
Figure 9.9: Alphanumeric assembly task information on generic PMUs usingvideo-based projective SAR
legibility even for black and partly reflective surfaces such as coatedsteel.
Alphanumeric assembly instruction visualization is another pos-sibility to support PV workshop participants who continuously haveto check the process quality with multiple attributes. Projecting textfor view-dependent AR is easier, since there is no need for a physi-cal projection surface and no need to analyze the surface structure.Legibility of projected texts depends on many influencing parame-ters, such as environmental conditions, text style, material and shapeof the target surface [316]. In contrast, for projective SAR the parallaxeffect causes disparities when projecting longer texts. Finding properplanar surfaces for legible alphanumeric texts is still in the researchphase [316]. Figure 9.9 and Figure 9.10 show examples for project-ing text onto generic non-planar surfaces. For instance, Figure 9.9depicts three steps for determining the mounting location of the as-sembly parts by using crosshairs. This matches the use case visual as-sembly support. In addition, pictograms indicate the mounting direc-tions. Textual information provides indications on which parts mustbe used.
Figure 9.10 depicts an example of laser-based projective SAR usedfor alphanumeric text projections. The XY-scanning unit of this laserprojector only has a limited scanning frequency. The fewer symbolshave to be projected, the better the projection quality is. In addition,the example also shows that parallax effects may influence the legibil-

222 projective spatial augmented reality
Figure 9.10: Alphanumeric assembly task information on generic PMUs us-ing laser-based projective SAR
ity of the overall assembly task instructions. As typical assembly taskinstructions have a length of at least 50 characters, this represents theabsolute limitations of a laser-projection based system. Even more,the projection of alphanumeric texts requires an overall strategy forview-independent legibility on generic surfaces.
9.6.3 Discussion
The presented results indicate the opportunities and limitations ofprojective SAR for use in VMS. Production engineers are able to choosewhether they use OST-HMDs for their assessments or whether theyuse projective SAR. In general, OST-HMDs are single-user devices. Eachuser can have his own view of the virtual scene, whereas projectiveSAR can be used in collaborative situations out of the box. OST-HMD
scenes must be synchronized in order to share the same VE. There-fore, the hardware and software has to be available multiple times."Although HMDs provide an individual image plane for each partic-ipant of a multiple user session, users of large projection systemshave to share the same image plane" [287, p. 297]. Each participantneeds an OST-HMD hardware device which also multiplies the initialhardware investment and maintenance effort. Additionally, the regis-tration quality of OST-HMDs may vary and configuration parameters,such as eye distance settings, must be adapted to each individual.This is more cumbersome than a passive device illuminating the PMUs
within the VMS. Additionally, head-worn displays are heavy and cum-bersome to wear all day long.
Generic tasks are compared below with respect to the three outputdevices considered:
PMU/DMU quality checks: Projective spatial augmented realityhas proved capable of showing differences between PMU and DMU
9.6 design space exploration of spatial augmented reality 223
models. Product and process quality can be checked easily by project-ing symbols, crosshairs for locations or outlines of assembly paths fordesignated locations. Therefore, no view-point specific AR is neededsince parallax effects are small. The registration quality of SAR is moreprecise than current OST-HMD hardware (Microsoft Hololens). There-fore, tolerances in the PMU model can be detected more reliably thanby using head-worn hardware.
Alignment tasks: For alignment tasks, high-precision registrationof DMU and PMU is required. When using the room measurement ofHololens OST-HMD hardware, augmentation offsets between the phys-ical item and augmentation is too big for assembly alignment tasks.Radkowski et al. present two additional calibration routines [317] tocompensate these effects. Therefore, out of the box SAR is more suit-able as a virtual 3D stencil.
Visual assembly support: Work piece tasks can be visualized usingall three AR hardware devices. When projecting the manufacturing se-quences onto the PMU, all workshop participants have a clear idea ofwhich parts must be mounted next. Only for visualization of assem-bly paths in 3D space, OST-HMD hardware is highly recommendedsince manipulation takes place in open space inducing huge paral-lax effects for both SAR types. Reachability checks can be carried outmore easily with SAR, since no body-attached hardware impedes theworker’s movement.
Localization task: As described for the localization tasks, the pro-jection of variants is a clear benefit of augmenting the PMU with ad-ditional information. For this generic task, all three AR variants alsoapply well, but SAR does not require all individuals to wear a head-mounted display. Therefore, all participants share the same digitalinformation, even if they do not have or wear an OST-HMD. This sup-ports the collaboration idea in workshop environments. Another usecase mentioned in the requirements is the "assessment of logisticszone." All three AR devices can support this use case, sharing thesame pros and cons as the localization tasks. In general, for logisticsassessments on the assembly lines, AR technology overachieves therequirements in most cases. Simple pick-by-light or pick-by-beamersystems without 3D augmentation of parts are sufficient in most usecases.
Alphanumeric assembly instruction visualization: Assembly in-structions must be visualized in some way for the workers in PV
workshops since they must derive their actions from those assem-bly task descriptions. Legibility of SAR projected symbols and letterslargely depends on the surface structure and the projection technol-ogy (see Di Donato et al. [316]). The fewer symbols are used, thebetter laser-based projective SAR works, otherwise video-based pro-jective SAR outperforms. Video-based systems only work with limitedcolors and reflection parameters of assembly parts. The combination
224 projective spatial augmented reality
of the close spatial coupling between assembly parts and the corre-sponding alphanumeric assembly task description has proved to behelpful [288] but at this time there is no solution for surface-distortioncompensation on generic surfaces PMUs (see Figure 9.10). Head-wornOST-HMDs are thus clearly the preferred choice when 2D non-spatialcontent must be coupled with 3D registered models.
9.6.4 Summary
The evaluation demonstrated benefits and drawbacks of all of thethree AR hardware types compared:
Laser-based projective AR reaches high precision registration withsub-millimeter overlays and is highly independent of the PMU’s sur-face color and reflection parameters. It can be natively used in col-laborative workshop situations and does not disturb the participantsin terms of required personal calibration routines, ergonomic mat-ters, hygiene of shared body-attached devices and registration to thePMUs. Information density is limited by the XY scanning laser projec-tion unit. Currently, 50 alphanumeric symbols can be projected at thesame time. Laser-projectors are limited to one color.
Video-based projective AR shares most advantages of the laser-based systems, besides the independence of surfaces. It is limited tobright surfaces for good legibility. In contrast, it offers additional ben-efits in terms of projecting unlimited symbols simultaneously (limitedby the resolution of the video projector) using all colors at the sametime.
OST-HMDs offer individual views for each user. Each user requireshis own device and all devices must be synchronized. In contrastto projective SAR systems, digital content can be visualized "mid-air"without having a projection surface. This bypasses the parallax ef-fect of both projective SAR systems. Resolutions and FoV of currentdevices are still limited (reference device Microsoft Hololens v1). Er-gonomic and practical restrictions apply, since users would have towear the weight on their head for a long duration and recharge thebatteries frequently throughout the day.
9.7 evaluation collaborative task performance using
sar
As presented in the design space evaluation, technical operators ofthe PV workshops have various options for visualizing the requireddigital content. However, no quantifiable answer has been given as towhether using AR in the VMS really speeds up work or whether othervisualization possibilities are more efficient. Therefore, the most fre-quent use case "localization task" (see SAR clusters in manufacturingproposed by Neumann and Majoros [290]) is evaluated in detail. PV
9.7 evaluation collaborative task performance using sar 225
workshops are collaborative environments in which all users mustshare knowledge in a highly interdisciplinary manner. Therefore, thedivision of labor and tasks is always a prerequisite. People must com-municate with each other according to their assigned role (see Sec-tion 3.3.4 for participants and stakeholders of PV workshops). Forinstance, PV workshop participant 1 has to explain to everyone elsewhere to attach a part on a certain cavity, bolt or spot of the car bodychassis. This could represent one of the "localization tasks" mentionedabove.
This study carries out an interdisciplinary, collaborative task be-tween two users with unequal prior knowledge, measuring the per-formance and error rate of a localization task. Three different typesof visualization scenarios are compared. Two scenarios are currentlyused in PV workshop situations, namely "verbal explanation" of as-sembly part locations and "visualization on a large screen." Verbal ex-planation is regarded as the baseline, since this is the most frequentway of communicating complex points. The third scenario uses ‘spa-tial augmented reality’ to communicate the localization tasks.
Publication
This evaluation was carried out for this doctoral thesis. Partsof this chapter were published in the paper on "Dual Realityfor production verification workshops" by Otto et al. [79] forthe peer-reviewed conference "CIRP Conference on AssemblyTechnology Systems 2016." The following evaluation has beenextended and revised. The scenarios are described in more de-tail and the link to real world production validation scenariosexplained in-depth.
9.7.1 Study goal
[79]In real life, participants have unequal prior knowledge during theworkshop sessions, since planners present their solution for the firsttime. The overall study goal is to find out whether there is any influ-ence on the overall task completion time when using different meth-ods for sharing prior knowledge on spatial circumstances.
Using SAR in collaborative workshop environments claims to re-duce the efforts of interpreting spatially remote information (com-pare Kim and Dey [311]). Therefore, quantifying a typical use caseof PV workshops provides insights into the effectiveness of applyingsuch a new technology in PV workshops. Do visualization technolo-gies (monoscopic displays and SAR) support the generation of a com-mon spatial understanding in PMU-based workshop situations? As anexample, a "localization task" is carried out in three different scenar-ios. One of these scenarios uses spatial augmented reality technology.
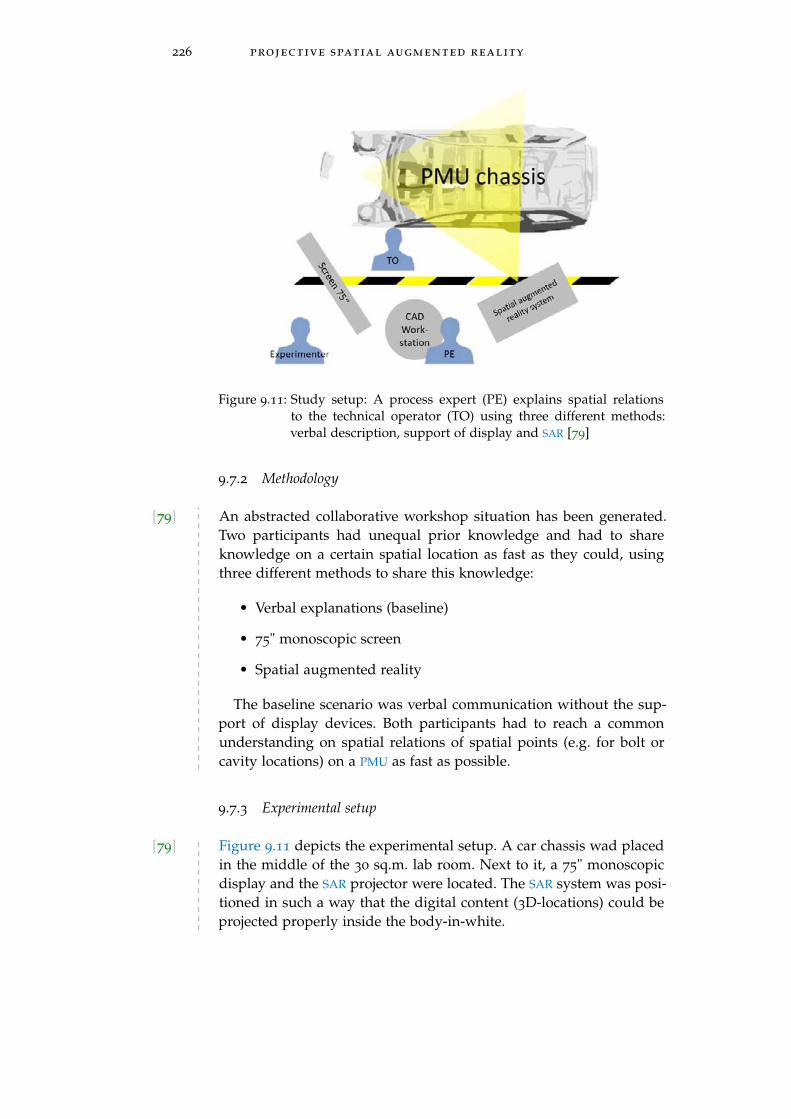
226 projective spatial augmented reality
Figure 9.11: Study setup: A process expert (PE) explains spatial relationsto the technical operator (TO) using three different methods:verbal description, support of display and SAR [79]
9.7.2 Methodology
[79] An abstracted collaborative workshop situation has been generated.Two participants had unequal prior knowledge and had to shareknowledge on a certain spatial location as fast as they could, usingthree different methods to share this knowledge:
• Verbal explanations (baseline)
• 75" monoscopic screen
• Spatial augmented reality
The baseline scenario was verbal communication without the sup-port of display devices. Both participants had to reach a commonunderstanding on spatial relations of spatial points (e.g. for bolt orcavity locations) on a PMU as fast as possible.
9.7.3 Experimental setup
[79] Figure 9.11 depicts the experimental setup. A car chassis wad placedin the middle of the 30 sq.m. lab room. Next to it, a 75" monoscopicdisplay and the SAR projector were located. The SAR system was posi-tioned in such a way that the digital content (3D-locations) could beprojected properly inside the body-in-white.
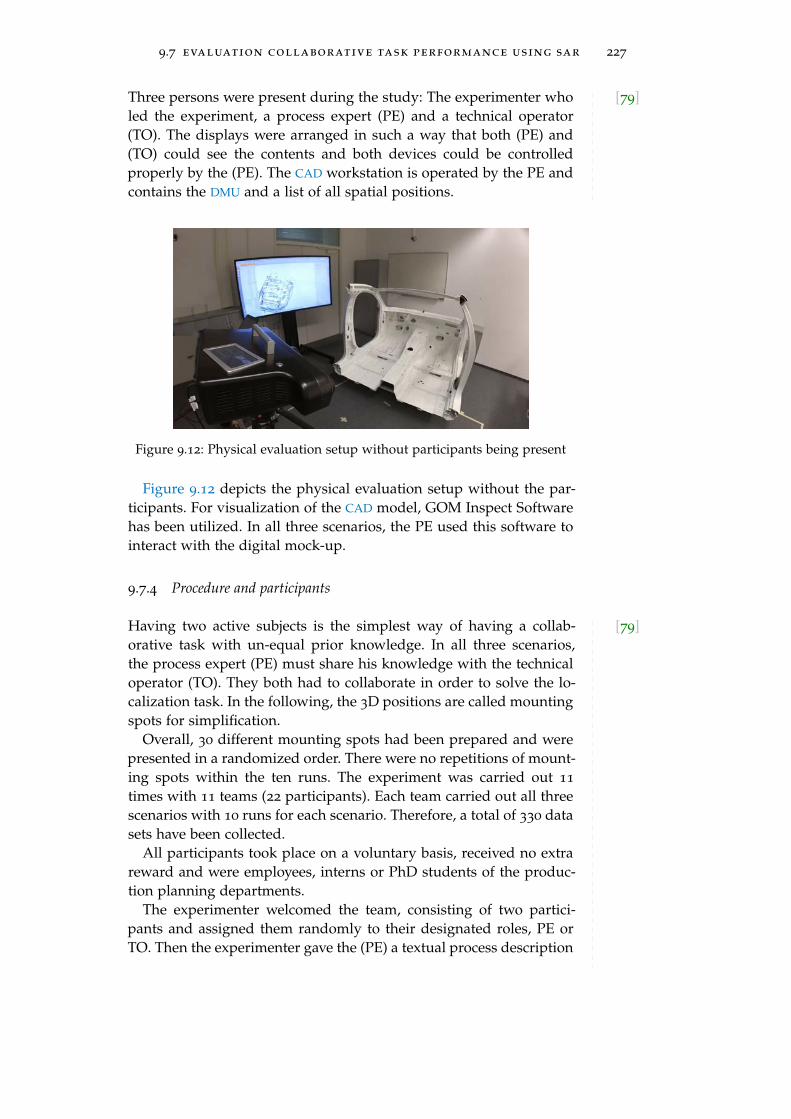
9.7 evaluation collaborative task performance using sar 227
[79]Three persons were present during the study: The experimenter wholed the experiment, a process expert (PE) and a technical operator(TO). The displays were arranged in such a way that both (PE) and(TO) could see the contents and both devices could be controlledproperly by the (PE). The CAD workstation is operated by the PE andcontains the DMU and a list of all spatial positions.
Figure 9.12: Physical evaluation setup without participants being present
Figure 9.12 depicts the physical evaluation setup without the par-ticipants. For visualization of the CAD model, GOM Inspect Softwarehas been utilized. In all three scenarios, the PE used this software tointeract with the digital mock-up.
9.7.4 Procedure and participants
[79]Having two active subjects is the simplest way of having a collab-orative task with un-equal prior knowledge. In all three scenarios,the process expert (PE) must share his knowledge with the technicaloperator (TO). They both had to collaborate in order to solve the lo-calization task. In the following, the 3D positions are called mountingspots for simplification.
Overall, 30 different mounting spots had been prepared and werepresented in a randomized order. There were no repetitions of mount-ing spots within the ten runs. The experiment was carried out 11
times with 11 teams (22 participants). Each team carried out all threescenarios with 10 runs for each scenario. Therefore, a total of 330 datasets have been collected.
All participants took place on a voluntary basis, received no extrareward and were employees, interns or PhD students of the produc-tion planning departments.
The experimenter welcomed the team, consisting of two partici-pants and assigned them randomly to their designated roles, PE orTO. Then the experimenter gave the (PE) a textual process description
228 projective spatial augmented reality
containing names of assembly parts. The (PE) must use this informa-tion to locate the mounting points of the assembly part in CAD modeland guided the (TO), where the respective part must be assembled onthe real chassis. Finally the (TO) must locate and reach the respectivemounting spot on the PMU as fast as possible with his index finger.This sequence has been performed in three different scenarios: Usingverbal explanations only, using a 75" screen with CAD data and usingSAR, highlighting the respective parts directly on the PMU. For eachscenario, the participants carried out the following sequence of tasks:Verbal explanation scenario:
1. The experiment leader reads out the next mounting point
2. PE localizes point in DMU by interacting with PC mouse in 3Dmodel
3. PE verbally describes respective geometric mounting positionto the TO
4. TO has to interpret this verbal information
5. TO has to reach the certain point with his index finger on thePMU
6. TO confirms the end of scenario by saying loudly "Check"
Scenario 75" screen:
1. The experiment leader reads out the next mounting point
2. PE localizes point in DMU by interacting with PC mouse in 3Dmodel
3. PE moves the DMU viewpoint and verbally describes the respec-tive mounting point position simultaneously
4. TO has to interpret this visual and verbal information
5. TO has to reach the mounting point with his index finger on thePMU
6. TO confirms the end of scenario by saying loudly "Check"
SAR explanation scenario:
1. The experiment leader reads out the next mounting point
2. PE localizes the point in a list of SAR points and activates it onSAR projector.
3. TO has to interpret this visual and verbal information
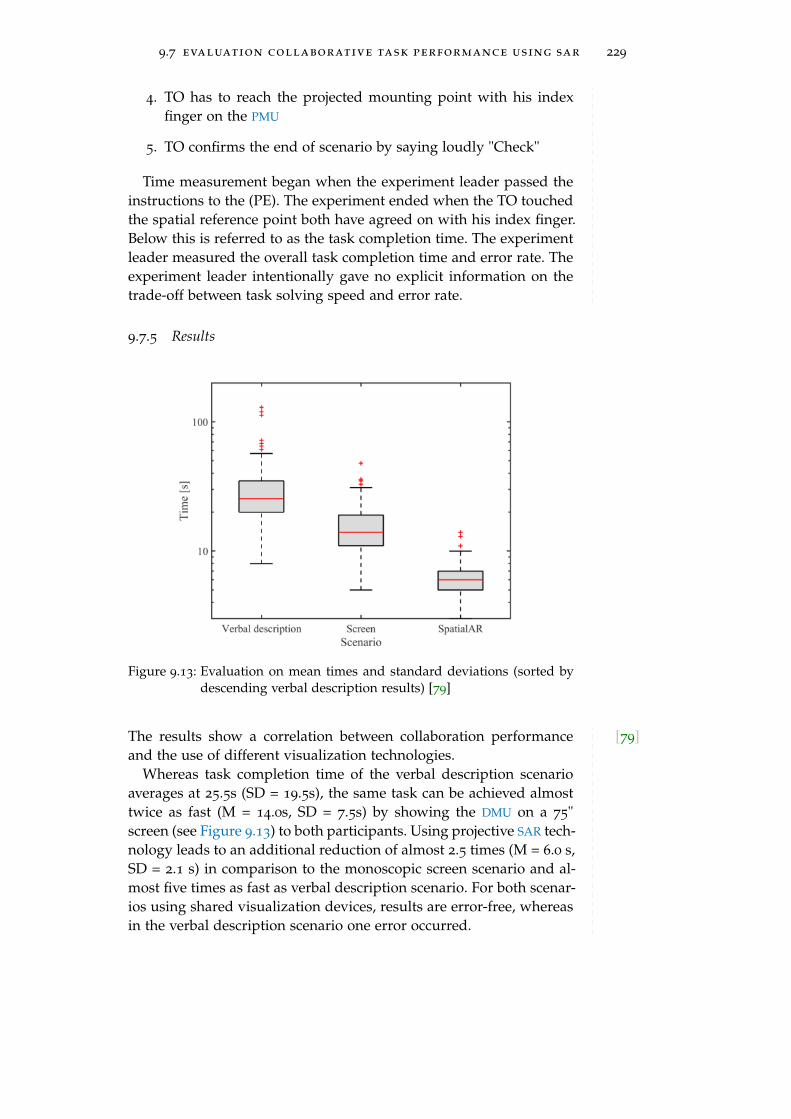
9.7 evaluation collaborative task performance using sar 229
4. TO has to reach the projected mounting point with his indexfinger on the PMU
5. TO confirms the end of scenario by saying loudly "Check"
Time measurement began when the experiment leader passed theinstructions to the (PE). The experiment ended when the TO touchedthe spatial reference point both have agreed on with his index finger.Below this is referred to as the task completion time. The experimentleader measured the overall task completion time and error rate. Theexperiment leader intentionally gave no explicit information on thetrade-off between task solving speed and error rate.
9.7.5 Results
Figure 9.13: Evaluation on mean times and standard deviations (sorted bydescending verbal description results) [79]
[79]The results show a correlation between collaboration performanceand the use of different visualization technologies.
Whereas task completion time of the verbal description scenarioaverages at 25.5s (SD = 19.5s), the same task can be achieved almosttwice as fast (M = 14.0s, SD = 7.5s) by showing the DMU on a 75"screen (see Figure 9.13) to both participants. Using projective SAR tech-nology leads to an additional reduction of almost 2.5 times (M = 6.0 s,SD = 2.1 s) in comparison to the monoscopic screen scenario and al-most five times as fast as verbal description scenario. For both scenar-ios using shared visualization devices, results are error-free, whereasin the verbal description scenario one error occurred.

230 projective spatial augmented reality
9.7.6 Discussion
[79] Two major influencing factors for the significant reduction of taskcompletion times are determined by observing the teams during theirruns: During the verbal description scenario, collaboration is nega-tively influenced by differing mental coordinate systems (COS) of theusers. For instance, the team members have not agreed on whetherthe word "left" refers to the car’s, the PE’s or the TO’s COS, whereasthis effect is eliminated when both participants can see a visualiza-tion. A second major impact factor is time-parallelization during tasksolving. For both visualization scenarios, the TO is anticipating thelocalization of the spatial position within the DMU while the PE isstill searching for it.
As the results showed, only 1 out of 330 data sets failed. This in-dicates that the participants double-checked their results with highertask completion times rather than becoming faster at the expense of ahigher error rate. In accordance with the results of Uva et al., "comple-tion times can be significantly reduced, only if there is a substantialreduction in complexity due to SAR" [288]. This evaluation does notinclude quantitative performance measurements for all proposed vi-sualization and interaction technologies.
9.8 conclusion
In this chapter, SAR technology has been evaluated with respect to itsapplicability and performance for real life PV workshop situations.
The design space evaluation showed that SAR supports PV work-shops in multiple use cases, such as PMU/DMU quality checks, align-ment tasks and localization tasks. Integration of this technology asa standard method in PV workshops can efficiently help PMU build-ups. Additional research must be carried out on how to project texton generic surfaces, so that multi user environments can benefit fromalphanumeric information without experiencing distortion effects.
Overall, this chapter provided insights into practical design con-siderations for collaborative use of AR. The opportunities and draw-backs of SAR were defined in the design space evaluation, such asdistortion, parallax effects and generic projection of 2D content. Nev-ertheless, SAR visualization is a qualified method to be applied formany industrial use cases.
[79] The performance study showed that using SAR for localization tasksas an additional visualization method in PMU-based workshops canspeed up the overall PMU build-up. In addition, SAR tends to helpreduce misunderstandings and generate higher common understand-ing of digital and physical mock-ups.

9.8 conclusion 231
Thus, it can be concluded that SAR technology extends the VMS
framework by an additional interaction technique and helps superim-pose virtual models onto PMUs. Making adequate choices of methodsand tools for PV workshop situations has a positive influence on theoverall workshop performance. Therefore, SAR brings PMUs and DMUs
closer together and enhances workshop efficiency.

10O V E R A L L E VA L U AT I O N O F T H E V I RT U A LM A N U FA C T U R I N G S TAT I O N F R A M E W O R K
This chapter presents an overall evaluation of the VMS framework forcollaborative virtual production validation. This evaluation is basedon contextual inquiry study including semi-structured expert inter-views that were conducted stakeholders of the VMS framework. Draw-ing on the deficiencies found in the pre-evaluation (Chapter 4) andthe key properties of the VMS (Chapter 5), this study shows the prac-tical aspects of the VMS framework’s implementation. In accordancewith the research hypothesis formulated in Chapter 2, the expert in-terviews focused on whether DMU-based workshops can be carriedout in a same quality, less time and with cost savings compared tohardware-based PV workshops".
10.1 participants and interview procedure
Managers of the PV workshops were selected as interview partnerssince they had in-depth experience in organizing and carrying outPV workshops as well as thorough knowledge in the area of assemblyplanning. This qualified them as appropriate interview partners sincethey were also able to speak on behalf of their stakeholders. In addi-tion, these participants were the most frequent customers of VMS sincethey participated in each PV workshop, next to the other participants,such as ergonomists, time experts, workers and many more. The ex-pert interview partners’ details can be found in Table 10.1. Overall, 1
hour 19min of audio was recorded and transcribed.After attending a whole day of DMU-based workshops using the
VMS, the experts were asked about the actual technical implementa-tion of the VMS and its impact on planning quality, reduction of timesand reduction of costs. Besides this, the experts were also encouragedto point out optimization potentials, advantages and disadvantages ofthe implementation details as well as to make suggestions for processimprovements.
All expert interviews were carried out on a voluntary basis andin each participant’s native language (all German). As an introduc-tion, the experts were welcomed to the VMS. Each was shown a stan-dardized demo of the ’Multi-Kinect system,’ ’Spatial augmented real-ity system,’ ’VR assembly simulation in the assessment software veo’and the ’floor visualization system’ as depicted in Figure 10.1. Thisstandardized demo took approximately 20 minutes. Audio files wererecorded and afterwards transcribed using a text document tool. Fi-
233
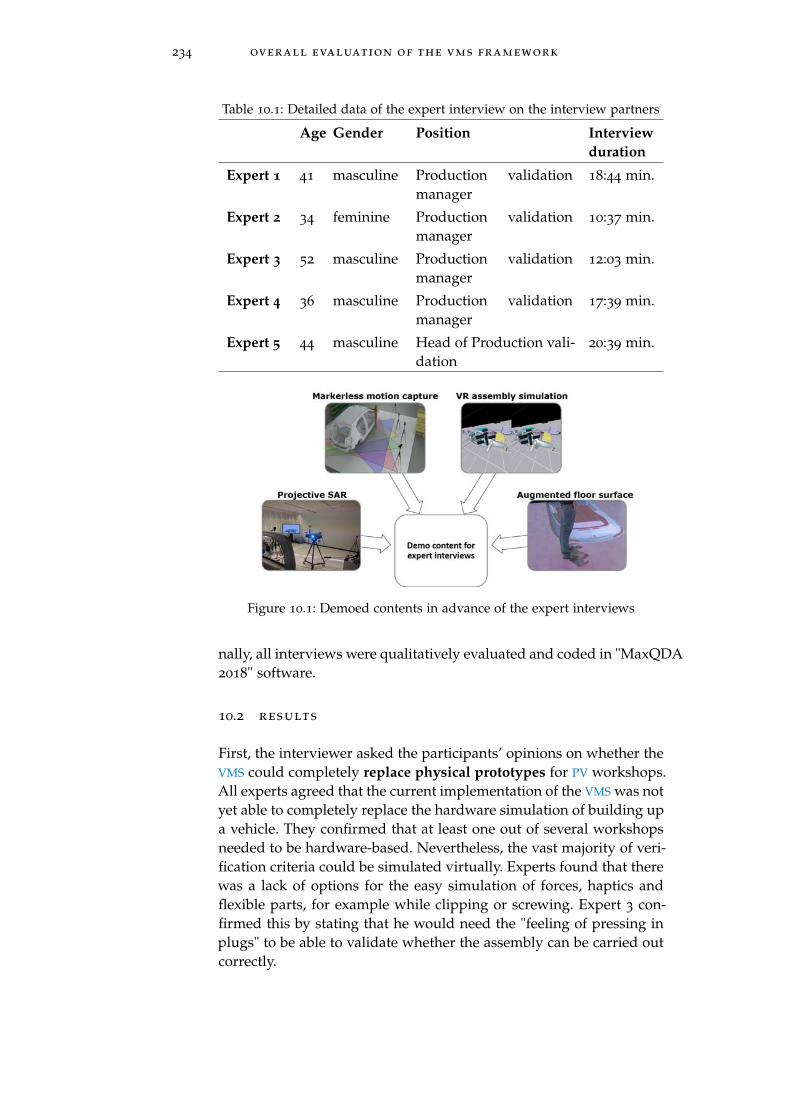
234 overall evaluation of the vms framework
Table 10.1: Detailed data of the expert interview on the interview partners
Age Gender Position Interviewduration
Expert 1 41 masculine Production validationmanager
18:44 min.
Expert 2 34 feminine Production validationmanager
10:37 min.
Expert 3 52 masculine Production validationmanager
12:03 min.
Expert 4 36 masculine Production validationmanager
17:39 min.
Expert 5 44 masculine Head of Production vali-dation
20:39 min.
Figure 10.1: Demoed contents in advance of the expert interviews
nally, all interviews were qualitatively evaluated and coded in "MaxQDA2018" software.
10.2 results
First, the interviewer asked the participants’ opinions on whether theVMS could completely replace physical prototypes for PV workshops.All experts agreed that the current implementation of the VMS was notyet able to completely replace the hardware simulation of building upa vehicle. They confirmed that at least one out of several workshopsneeded to be hardware-based. Nevertheless, the vast majority of veri-fication criteria could be simulated virtually. Experts found that therewas a lack of options for the easy simulation of forces, haptics andflexible parts, for example while clipping or screwing. Expert 3 con-firmed this by stating that he would need the "feeling of pressing inplugs" to be able to validate whether the assembly can be carried outcorrectly.
10.2 results 235
The interviewer asked about the output possibilities and interac-tion methods and how changes by original size visualization influ-ence outcomes of PV workshops. Four out of five experts thought thatthere were good opportunities for applying VR glasses and MicrosoftKinect. Expert 1 provided multiple examples of simulations that takeplace in the vehicle interior, such as the assembly of grab handle con-soles, sky panel assembly or front wall assembly in the virtual vehicle.Two experts pointed out the advantages of ergonomic assessments us-ing VR glasses in combination with full-body tracking using Kinect,such as assessments of accessibility or necessary flexion of the workerwhile mounting a certain part. However, one of the five experts statedthat he could not currently imagine for which actual topics VR glassesor Microsoft Kinect could be applied due to limited accuracy and pre-cision. For expert 2, the possibility of digital "capturing, storing andevaluation of the walking paths" through the sensors integrated inthe LED floor represented a major advantage of the VMS.
After demoing spatial augmented reality to the experts, the inter-viewer asked them how this technology could support PV workshops.Four experts stated that they would like to deploy projective SAR tovisualize different variants or optional equipment onto the physicalprototype. According to Expert 3, it is currently impossible to assessall variants or extra equipment, as only one physical mock-up in aparticular variant can be considered during a PV workshop. Neverthe-less, using SAR, components that have to be mounted in other variantscan be assessed digitally. Expert 4 did not consider the use of spatialaugmented reality to be necessary since he believed that it would besufficient to have a non-available component displayed on a computermonitor or via a ‘VR goggle.’ Therefore he personally saw no benefitin using SAR.
Changing the scope to organizational topics, the interviewer askedwhether workshop participants should be empowered to use the as-sessment tools on their own or whether they should rely on a spe-cialist using the technology for them. All experts agreed that thereshould be a dedicated operator responsible for all simulation tools,whose main task is to support technical operations during the work-shops. Expert 5 stated that in particular the PV managers should befamiliar with technical possibilities as well, but "each workshop par-ticipant should be able to concentrate on his area of expertise."
In addition, Expert 2 expressed doubts that workers and craftsmencould take advantage of virtual assessments due to their ‘lower affin-ity towards virtual assessments,’ as they were accustomed to ‘exclu-sively working with hardware prototypes’ during their regular dailywork. This would have a direct impact on the way they work withvirtual simulations and on their trust in the assessment results.
The experts were asked which additional features or data sets wererequired in the simulation environment and what additional value
236 overall evaluation of the vms framework
this would generate. All experts wished to integrate more dynamics,especially in the context of the assessment of walking paths, fusingdigital recording and simulation with the help of the LED floor. Thiswould also facilitate planning and validation of "shopping carts" or"material zones," which matches the findings in Section 8.4.1. The fea-ture request of "simulating lifting equipment" was also mentioned bytwo experts. They wished to have a multi-axis kinematic model forproper validation of the overall handling device, for example to inter-actively obtain a sense of how a worker can manipulate the handlingdevice with the attached parts. Expert 1 stated that for semi-activehandling devices cycle-time diagrams are required in the context ofhuman-robot collaboration.
Furthermore, Expert 3 remarked that he would like to carry out allassessments in one simulation software program. In addition, for timeanalysis he suggested using predetermined motion time systems suchas methods-time Measurement (MTM) to be automatically derived bythe holistic simulation as well as automatic deduction of ergonomicscales.
The interviewer asked the experts how the usage of the VMS frame-work subjectively influenced the process of PV workshops. By usingVMS, the experts stated that there were opportunities for simplifica-tion and and future-oriented workshops with fewer PMUs available.Expert 3 confirmed that the VMS comes very close to PMU-based as-sessments. He also mentioned the advantage that product data is al-ways up-to-date in the virtual domain, since product data changesoccur continuously during the development and planning phases.The experts appreciated the possibility of parallel visualization ofcontents on the large high resolution displays to create a clearer un-derstanding for workshop participants. Expert 5 also supported theidea that the number of participants could be reduced if the systemcould automatically derive ergonomic or walk path assessments, asergonomics or MTM experts would no longer be necessary to bepresent at the workshops.
When asked about the changed processes in production valida-tion workshops due to the VMS, all experts again emphasized thatat least one PMU is required at the very end of the production prepa-ration process. This is obligatory since assembly tests must ensureperfect haptics, simulation of forces and buildability. Nevertheless,DMU-based validation is sufficient or even outperforming the remain-ing verification criteria. In addition, workers from the assembly de-partment continue to struggle with virtual assessments since they donot completely trust in sole DMU simulation results. However, all fiveexperts agreed that even during PMU phases, the VMS can very well bea supplement to PMU. Different variants or special equipment, whichare currently not available, can be viewed in the virtual domain orcould be assessed with the help of the VMS. In addition, three experts

10.2 results 237
(experts 1, 3 and 4) wanted to change current PV workshop, which fo-cus on production processes, so that they exclusively use virtual tech-niques. Expert 2 stated that the VMS enabled him to introduce newworkshop types on urgent topics, so that smaller workshops could beheld spontaneously without external operator support.
Discussing the impact of the VMS framework on a company-scopelevel, the interviewer asked the experts whether they could save timeor costs using markerless tracking during the PV workshops insteadof marker-based systems. Expert 4 clearly saw a time advantage inusing marker-less tracking with the Multi-Kinect system. This allowsprocesses to be digitally simulated and assessed quickly, since it isnot necessary to put on cumbersome motion capture suits. It usuallytakes 30 minutes to put on these suits and to calibrate them prop-erly, as the markers on the suit must be placed correctly and oftenmultiple test runs must be carried out before the movements can becaptured by marker-based systems. By using the VMS methods, allother experts also considered time savings throughout the workshopsto be very probable, but they demanded technically flawless prepara-tion of the workshop to achieve these time savings. The experts didcomment on the topic of direct cost reductions. Overall, expert 5 wasskeptical whether overall time could be saved. According to his state-ment, there will be no temporal difference, regardless of whether theprocess is performed virtually or on a PMU-basis. But he remarkedthat switching between variants was not possible in the physical do-main and dismantling times of PMU vehicles before the actual start ofthe PV workshops could be reduced.
The interviewer wanted to know where costs can be reduced by us-ing the VMS and in which stage of production, either in PV workshopsthemselves (through reduced time or number of participants), in pro-totype construction (through the reduction of physical prototypes) orin the factory (through better solutions and higher quality). The an-swers of the five experts differed vastly. Expert 1 saw a potential forcost savings in reduced PV workshop duration and therefore lowerpersonnel costs. Three experts (Experts 2, 4 and 5) stated that themain potential for savings could be achieved by reducing the num-ber of physical prototypes since hardware PMUs for the productionvalidation workshops is expensive. Expert 4 weighed up the initialinvestment of the VMS in relation to the cost reductions for hardwareprototypes. He came to the conclusion that the business case is clearlypositive. Experts 2 and 5 agreed that the cost savings are noticeablein the target plant through better process solutions and higher prod-uct quality as larger product quality flaws are detected earlier. Expert2 exemplified these cost savings when finding poor buildability ofcomponents for non-standardized processes earlier.
All experts agreed that by carrying out virtual PV workshops inthe VMS, the resulting quality will be at least as high as by traditional
238 overall evaluation of the vms framework
PMU-based workshops. In terms of quality, all five experts agreed thatmore validation criteria can be validated using VMS methods. Theyespecially emphasized the importance of the possibility to visualizeall product variants and extra equipment, which is currently not pos-sible in PMU-based workshops.
As the interviewer discussed the optimization potentials, three ex-perts mentioned that it would not be possible to determine forcessuch as how parts snap in physically. Moreover, expert 5 did notsee a direct benefit of the VMS in late phases, when PMUs are avail-able in parallel. With regard to improvement potentials, the expertsgave multiple inputs: Expert 2 wanted to simplify the usability of thesimulation software veo. For her, the software had to be as "simpleas possible" and it had to run more fluently during the workshops.In addition, she mentioned that missing collision avoidance couldbe regarded as a software bug, for example when the avatar canwalk through the virtual car. Since this is not possible in the phys-ical domain, the expert was afraid that this might lead to rejectionby the non-experienced workshop participants. Furthermore, expert4 wanted to integrate more data sources such as simulation results ofother tools, e.g. simulated walk paths.
10.3 discussion and summary
The evaluation of the expert interviews shows that the managers ofthe PV workshops sometimes have different opinions about the indi-vidual topics regarding the VMS. However, it can be clearly said thatthe VMS will not be able to completely replace the hardware structuresduring PV workshops in the near future. However, the experts deter-mined potential use of the VMS as a supplement to the PMU build-upsas it offers the possibility of validating more vehicle variants and ver-ification criteria than before.
All experts confirmed that a constant quality of the assessment re-sults by the VMS can be guaranteed. Cost savings were confirmed bythe experts as well. Nevertheless, the experts did not agree on a sin-gle instance where cost savings can be attributed to. Potential costsavings were attributed to four causes: The reduction of time withinPV workshops, the reduction of the number of physical prototypesand finding better solutions and achieving a higher planning qual-ity for the factory. Most experts considered it likely that time will besaved in PV workshops, but also stated that it was difficult to quantifytime reductions in highly dynamic and non-repeatable PV workshops.
11C O N C L U S I O N & O U T L O O K
As a major part of this doctoral thesis, a newly designed frameworkfor virtual validation of manual assembly processes has been intro-duced and evaluated. In the domains of production engineering, com-puter supported collaborative work and human computer interaction,new fundamental research has been presented as well as the applica-tion of basic research to industrial practice. Especially in the domainof human computer interaction, fundamental research has been pub-lished such as studies on human perception. In the following sec-tions, research results and practical usage of the proposed methodsare summarized and discussed in terms of the research questions andresearch hypothesis presented in Section 2.2.
11.1 practical exploitation of the vms framework
The presented VMS framework has been implemented at Daimler AGin Ulm and Sindelfingen and is already widely used for productionvalidation.
By now (2020), 15 multi-week PV workshops for ten car modelshave been carried out using the VMS framework’s methods. Interna-tional workshop groups from the U.S., South Africa, France, Chinaand Germany have taken part in PV workshops in the VMS envi-ronment. Batch assessment allowed the efficient validation of entirefinal assembly lines in the respective countries. Each PV workshopchooses a typical model-mix of products that will be produced in therespective global final assembly line. The manufacturing sequenceand precedence graphs are specifically adapted to factories aroundthe world. Video: Valtteri
Bottas using theVMS:https://youtu.
be/FUINhoVEji8
Methods of the proposed VMS framework are used on a daily ba-sis for PV assessments. Depending on the status of the PDP, differentmethods are applied. The LHRDs are always used for collaborativepublic displays. They have proved to work reliably and to be helpfulfor collaboration on complex, heterogenous data. DHM assessmentsare carried out more frequently using the VMS as preparation leadtimes are minimized. Using the proposed methods, in PV workshopsDHM animation can be carried out on-the-fly compared to virtual as-sessments afterwards. The LED floor is used in later phases of thePDP when walk path optimizations are carried out. For PMU-basedworkshops, projective spatial augmented reality is not in vast practi-cal usage yet as data preparation and projection on generic surfaces
239
240 conclusion & outlook
is still being researched even though PV workshop managers see thebenefits of such a method.
Overall, workshop participants’ feedback is enthusiastic and pos-itive with respect to the presented VMS framework’s methods andtools. They appreciate the massive amount of simultaneously pre-sented data, markerless interaction capabilities and the space for largeworkshop groups.
11.2 research questions and results
Overall, the research questions and the hypothesis are answered asfollows:
Question 1 - Production Engineering
How is assembly validation presented in the literature and car-ried out in industrial practice? Which assessment criteria mustbe evaluated in the automotive production validation process?
In Chapter 3, a holistic literature review on automotive production,production planning and production validation has been presented.PV workshop contents, participants and the workshop characteristicshave been described in-depth to understand the context of the VMS
presented below. Additional insights are given on product-related,process-related, human-related, logistics-related and resource-relatedassessment criteria. These validation criteria not only apply to au-tomotive final assembly but also to the manufacturing industry ingeneral to assure proper production ramp-ups.
Question 2 - Production Engineering
Where are the deficiencies in current physical and virtual auto-motive verification processes, methods and tools? Which crite-ria can already be assessed in the virtual domain?
Based upon the literature review of current automotive final as-sembly, a contextual inquiry study with semi-structured expert inter-views has been carried out to understand the state-of-the-art produc-tion validation processes, methods and tools. Supervision of PV work-shops and interviews with experts in virtual technology and produc-tion planning, have helped reveal current drawbacks of PV processesin physical and digital validation. Hardware-based workshops in par-ticular struggle with limited product parts availability, outdatednessof physical parts, high costs and limitations on assessing a wide vari-ety of extra equipment. Therefore, all experts agree on the necessity tostrengthen digital assessments as they assume DMU-based workshopsto be quicker, enable assessment of all options and allow the instan-taneous change of models. Nevertheless, they also provide insightsinto current limitations on using DMU-based assessments, namely too
11.2 research questions and results 241
little interaction between workshop participants, no interactive ma-nipulation of parts, no holistic process simulations, a lack of digitalhuman models and layouts and especially hard data preparation pro-cesses prior to PV workshops. These drawbacks in virtual assessmentmethods are in accordance with the findings in the literature review.
Question 3 - Human Computer Interaction & CSCW
Which requirements can be derived for a collaborative virtualassessment framework for the production validation of manualassembly tasks? What is the design space for a framework forvirtual and mixed reality car assemblies?
The requirements for a novel framework used in PV workshopshave been derived from strategic, tactical and operative objectives.Tactical objectives comprise the reduction of available PMUs, achiev-ing higher data maturity, enabling late changes and smooth ramp-ups of mixed model lines. On an operational level, this leads to thefollowing consequences: more verification criteria can be assessed inthe virtual domain, workshops are supported by interactive compo-nents, PPR data can be integrated for the first time, all methods areapplicable throughout the PDP and the preparation effort for virtualassessments is reduced.
In order to reach these requirements, a novel framework for collab-orative PV workshops is proposed: The "Virtual Manufacturing Sta-tion." As the literature review reveals, multiple works describe the de-sign space for collaborative, virtual environments in co-located, multi-user workshop setups. These concepts are adopted to the automotiveand, in general, to the manufacturing industry. By analyzing productdetails as well as stakeholders’ and participants’ needs, six key prop-erties are proposed. All key properties support the concept of the VMS.Each key property is exemplified with the in-depth research studiescarried out:
• Collaborative Virtual Environment: The collaboration featuresof the VMS were evaluated in two studies. The VR assemblysimulation software presented drives the PV workshops. It isoptimized for usage in collaborative situations so that all par-ticipants share the same virtual environment. Additionally, aspatial augmented reality study showed that the collaborationperformance increased in terms of task completion time anddecreased error rates.
• Original size output: Having realized a large-scale LED MDE,multiple advances were made. Isometrically registered trackingsetups are enabled by utilizing original size output devices. Anin-depth evaluation showed that size estimations using a LEDfloor output device showing original size content is more accu-rate compared to relative-sized content.
242 conclusion & outlook
• Multi-User support: This key property has been exemplified inergonomic validations. Multiple PV workshop participants canbe tracked simultaneously and instantaneously inside the track-ing frustum and directly manipulate the digital human model.
• Asymmetric and symmetric output for AR/VR assessments: Eachuser can choose either public wall-sized displays for using theCVE or use private displays for individual viewpoint renderingsof individual contents.
• Integration of PMU&DMU: All original size visualizations aimfor an isometrically registered VMS environment. When trackingphysical objects, such as assembly parts or tools in the VMS, theirvirtual representation behaves in the same way. In particular, thedesign space evaluation of spatial augmented reality providesin-depth insights into how the physical and virtual domain canbe blended in the VMS.
• Integration of natural user interfaces: Markerless tracking sys-tems allow instantaneous human full body tracking. Using thistechnology, the virtual domain can be manipulated in an intu-itive manner, such as manipulating the digital human modelfor ergonomic assessments or mid-air gesture interfaces for dis-assembly of car parts.
All key properties are realized in the VMS, exemplified in multiplestudies and are in active usage in PV workshops.
Question 4 - Human Computer Interaction
Which components are required in a VR batch assembly assess-ment simulation software and how can the performance andlimitations of such a VR assembly assessment system be quan-tified?
The requirements for batch assembly assessment validation soft-ware are deduced in this doctoral thesis. Most importantly, PPR datahave to be fused in one central simulation environment for the en-tire factory. In contrast to the evaluated state-of-the-art commercialsoftware components, batch validation of hundreds of work placesare in the focus of the presented simulation software. It unifies allinteractable components, such as standardized protocols for marker-less full-body tracking, seamless geometry projection for spatial aug-mented reality and fast switching between various product variants.Another key property is the ability to visualize content simultane-ously on asymmetric output devices. The software presented is ableto simultaneously show the CVE in original size on LHRDs, the aug-mented floor surface as well as in VR.
11.2 research questions and results 243
Carrying out assembly simulations in VR raises the question aboutthe overall system’s performance. Therefore, a novel VR2A bench-mark is proposed to quantify the overall VR system’s limitations. VR2Acan be universally applied for different VR environments, simulationsoftware and VR hardware devices. As a standardized benchmark, itevaluates the overall assembly simulation system’s capability to vi-sually assess assembly processes and measures the overall achieve-ment rate in terms of precision and spatial limitation. Since the VR2Abenchmark is a standardized, open experiment design, the virtualscene is published under Creative Common licence, so that all third-party researchers can reuse this scene and evaluate their own VR sys-tem’s performance. The VR2A score represents the overall ability ofthe system to visually assess clearances and small assembly part sizeswithout decomposing single influence parameters within the VR inter-action cycle.
[124]Using this VR2A score in combination with the presented simulationframework, assembly part sizes of 75mm and relative clearance of109% are required to achieve an overall VR2A score of 70%. The eval-uation showed that VR2A is a reliable benchmark for quantifying thesystem’s performance and for revealing its limitations in assemblyassessment.
Question 5 - Human Computer Interaction
How can a markerless, scalable tracking system be realized andwhat advantages of motion capture can be achieved? What arethe limitations of markerless tracking systems and what track-ing performance can be determined?
Animation of digital human models is crucial for assembly validation.Therefore, a scalable, markerless motion capture system has been pre-sented and evaluated using multiple depth-cameras. The overall sys-tem has been developed to interactively manipulate digital humanmodels on-the fly for PV workshops.
Kinect V2 is used to realize such a scalable, markerless, multi-depthcamera system. The overall system’s properties and limitations inmarkerless full-body motion capture were evaluated, showing thatthe tracking results of single sensors are error-prone and rotation-variant. Rotation-invariant joints of skeletons can be used for robustmulti-depth camera fusion. A procedure of web-based data gathering,registration, filtering, temporal alignment and fusion is proposed inorder to obtain skeletal tracking data for larger, scalable frustums. Inan experimental setup, the proposed system revealed a mean accu-racy error range from 9.6 mm (SD=4.5 mm) to 26.6 mm (SD=10 mm).
These results indicate that the overall system’s performance is suffi-cient for ergonomic assessments, since DHM animation only requiresa rough pose estimation in PV workshops. In a practical follow-up
244 conclusion & outlook
study, motion tracking results were applied to DHMs and comparedwith physical assessments. Results show that nine out of eleven stan-dardized working postures in the EAWS are feasible using the system,besides large bending over (>60
◦ upper body bending) and lying flaton the floor. By using fused sensor data with the novel method, jit-ter, occlusions and rotation variance are reduced. Comparisons of thesame physical and virtual arrangement show that the presented full-body motion capture system can be used for practical usage (see Fig-ure 7.18) As a result, production related issues can be identified on-the-fly in the virtual domain, even though small deviations betweenPMU and DMU still remain. Overall, having a markerless motion cap-ture system available in PV workshops is a helpful solution to revealquality and ergonomic issues on-the-fly, while checking the overallproduct.
Question 6 - Human Computer Interaction
How do wall-sized displays and floor visualization displaysinfluence spatial perception? Does the variation of interactiontechniques have any influence on spatial perception and taskperformance?
The literature review on LHRDs reveals that these devices allow thedisplay of more data details, multi-scale data, higher complexity anddimensionality and enable collaboration. These effects are leveragedin the VMS framework implementation. Nevertheless, the literaturealso indicates that there further reserach on LHRDs and their influenceon spatial perception will be required, to which this doctoral thesiscontributed.
Six generic use cases were presented where augmented floor sur-faces may help in the context of the manufacturing industry and espe-cially in PV workshops, namely virtual travels with interactive maps,self-navigation in virtual space, size estimation, virtual original sizestencil, original size work place layout assessments and interactivewalk path assessments.
Two setups for VMS framework’s original size output devices wereproposed, implemented and evaluated. First, a large-scale floor pro-jection system for original size digital work place layouts are pro-posed. Since practical usage of this prototype system has revealedconsiderable benefits in PV workshops, a second LED-based setup iscreated with 32 sq.m. of LED walls and 54 sq.m. of LED floor.
Two studies using this LED floor gave insights into spatial percep-tion and task completion time in PV workshops:
[79] The first experiment presented insights on spatial perception and sizeestimations using different modes of perception. Different scenariosshowing original size (absolute) and relative-scale visualizations re-
11.2 research questions and results 245
veal significant differences in size estimations. Size judgment accu-racy is better using absolute visualization scenarios, whereas taskcompletion time increases using the LED floor, both compared tothe relative-sized visualizations in the baseline scenario. As varioususe cases in PV workshops depend on reliable spatial estimations ofhumans, the LED floor proved to be a proper interface and to be ahelpful tool for visualization of virtual original size contents.
Second, a practical experiment was carried out, where the LED floorwas used as a virtual stencil. Using the LED floor as a virtual stencil,the task completion time decreased by a factor of almost two and thenumber of errors was reduced from 75 errors to zero errors.
These studies showed that using LHRDs in PV workshops directlyhelp solve certain tasks more reliably (spatial estimations) as well asfaster in terms of task completion time (virtual stencil). Practically,slight increases in task completion time while performing spatial es-timations are negligible in practical PV workshops as the overall timepercentage of size estimations ranks low compared to the benefit offinding high quality solutions.
Question 7 - Human Computer Interaction & CSCW
What is the design space for using projection spatial aug-mented reality in co-located PMU and DMU-based environmentsand how does computer-mediated communication influenceworkshop performance in terms of task completion time anderrors?
In a design space study, the usage of projective spatial augmentedreality was evaluated for the manufacturing industry. Five differentgeneric tasks were evaluated, namely PMU/DMU checks, alignmenttasks, visual assembly support, localization tasks and alphanumericassembly instruction visualizations. These generic tasks represent typ-ical validation criteria within PV workshops. The design space evalu-ation revealed the limitations of SAR and showed the need for ad-ditional research on how to project text onto generic surfaces, sothat multi-user environments can benefit from alphanumeric informa-tion without dealing with distortion effects. The VMS integrated thistechnology to efficiently support PMU build-ups, even though somedrawbacks of non-view-dependent SAR were made clear in the de-sign space evaluation, such as distortion, parallax effects and genericprojection of textual information.
Applying projective SAR in a performance study showed task com-pletion time decreases when it is used in PMU-based workshops forlocalization tasks. Hence, in physical PV workshops collaboration effi-ciency can be increased by using SAR visualizations. Compared to twoother error-prone baseline visualization scenarios, no errors could befound using the SAR scenario.
246 conclusion & outlook
Question 8 - Production Engineering
What implications are there regarding time, costs and qualitycompared to hardware based workshops? Can integrated vir-tual environments help production planning to achieve goalsmore quickly and reliably during the planning and validationof automotive manual end assembly?
In a contextual inquiry study including a semi-structured expert in-terview, PV workshop managers responded to the overall realizationresults of the VMS. All experts were stakeholders organizing PV work-shops themselves. 1h 19min of transcripts revealed the advantagesand drawbacks compared to hardware-based PV workshops.
Results showed that currently not all tasks can be achieved by soleusage of the VMS framework’s virtual assessment methods, but ithelps reduce the overall amount of required PMUs especially in theearly phases of the PDP. Novel interaction techniques, such as full-body markerless motion capture and VR assessments, are able to re-duce the overall required amount of time in PV workshops and in-crease the quality of the overall assessment validity. Novel interac-tion capabilities such as the augmented floor surface shorten the timespent on assessing the walk paths.
The experts mentioned three fields of cost savings but did not quan-tify them: More efficient production validation, reduction of physi-cal prototypes in early phases and even benefits in production itselfdue to better solutions from production planning and higher productquality.
Overall, in Section 2.2 the research hypothesis has been formulatedas follows:
Research hypothesis
Utilizing collaborative virtual environments in production val-idation workshops for manual assembly tasks, verification cri-teria can be assessed in same quality, less time and less costscompared to hardware-based workshops.
Summarizing answers to the research questions, the research hy-pothesis can be approved. The VMS framework represents a collabora-tive, co-located virtual environment for production validation work-shops. All of the presented studies directly or indirectly support theresearch hypothesis even though each study contributes to singularaspects regarding the VMS key properties. Each study contributes toa specific research question and focuses on an exemplary use case ofthe PV workshop.
Additionally, the final expert interviews (see Chapter 10), the dailypractical usage of the VMS framework and the broad support of theVMS implementation revealed the benefits of shifting PV workshops

11.3 outlook 247
from the physical to the virtual domain. More verification criteria canbe assessed now using DMUs, such as ergonomic assessments andwalk path layouts, and strengthen the collaboration performance. Byusing the VMS’s methods, such as LHRDs, tracking and SAR, productquality increases and errors are reduced when constantly building upthe product with the methods presented. Besides one study (size es-timations), all experiments indicate that task completion times arelowered using the proposed virtual methods. Thus the overall PV
workshop execution time can also be reduced. On a strategic com-pany level, these effects of higher quality and reduced task comple-tion time result in cost reductions compared to hardware-based PV
workshops as fewer physical prototypes are required, higher qualityproduct parts can be found and process quality is increased through-out all phases of the PDP.
11.3 outlook
By now, the VMS is already widely used for production validation.However, multiple research domains have not been integrated. Onecan differentiate short-term and long-term research requirements inthe context of the VMS.
In the short term research, interaction within the VMS framework isstill an ongoing topic for adding realistic animation to the virtual sim-ulation models. PV requires the completion of more verification taskssolely using DMUs. Hence, the simulation environment must be en-riched with additional features, such as collision detection, avoidanceand flexibilization of parts in the presented batch validation system.Even though research has already presented many algorithms for col-lision avoidance and flexibilization of DMU assembly parts, they arestill not widely used in real-time interaction scenarios. In addition,the simulation of haptic feedback is required in VMS’s assessments togive users a realistic feeling of assembly parts.
In the long term, the overall research goal is to achieve a fully au-tomatic deduction of a holistic, dynamic simulation scene by usinggenerative models. The so-called "cyberphysical production equiva-lence" of real production processes must be accomplished withoutany additional authoring effort (compare Stork [102]). By now, DMUs
used in VMS framework use simplified kinematics of product repre-sentations. All complex animation is injected by the user’s interac-tion using tracking systems and human intelligence. Artificial Intel-ligence (AI) approaches may help establish generative motion mod-els. In order to reach a state of cyberphysical equivalence, additionalresearch has to be carried out in the area of collision-free path plan-ning, avoidance of starting collisions, automatic deduction of productprecedence trees, AI human reasoning and generative DHM anima-tion for natural motions and standardized kinematics of DMUs. When
248 conclusion & outlook
all these components are available, holistic simulation of manual as-sembly processes will be achieved without manual interaction. Theresulting simulation model may be used for higher quality validationin the VMS framework. The VMS users’ tasks will change to the adap-tion of simulation parameters in order to optimize simulation modelsinstead of dedicated 3D interaction. Therefore, the overall planningand assessment effort will be drastically reduced since detailed workplans are automatically deduced by the generative simulation model.Simulation results only have to be validated and optimized.
In future, having such a holistic assembly simulation may lead toa higher automation degree in final assembly. If the simulation iscapable to adaptively react to the complex production program andto unexpected situations in final assembly, human flexibility can beincrementally replaced by automated machinery. This leads to a shiftof manual labor to automated processes and changes the paradigmson how planning and production is carried out.
B I B L I O G R A P H Y
[1] Hoda A. ElMaraghy and Waguih H. ElMaraghy. “Variety, Com-plexity and Value Creation.” In: Enabling Manufacturing Com-petitiveness and Economic Sustainability. Ed. by Michael F. Zaeh.Cham: Springer International Publishing, 2014, pp. 1–7. doi:10.1007/978-3-319-02054-9_1.
[2] Behzad Saberi. “The Role of the Automobile Industry in theEconomy of Developed Countries.” In: International Robotics &Automation Journal 4.3 (May 17, 2018). doi: 10.15406/iratj.2018.04.00119.
[3] International Organization of Motor Vehicle Manufacturers.2019 Statistics | OICA. OICA. 2019. url: http://www.oica.net/category/production- statistics/2019- statistics/
(visited on 03/29/2020).
[4] International Organization of Motor Vehicle Manufacturers.1999 Statistics | OICA. OICA. 1999. url: http://www.oica.net/category/production- statistics/1999- statistics/
(visited on 01/14/2020).
[5] Dr. Sebastian Wedeniwski. The Mobility Revolution in the Au-tomotive Industry. Berlin, Heidelberg: Springer Berlin Heidel-berg, 2015. url: http://link.springer.com/10.1007/978-3-662-47788-5 (visited on 01/07/2020).
[6] Felix Kuhnert and Christopher Stürmer. “Five Trends Trans-forming the Automotive Industry.” In: PWC (2018), p. 48. url:https://www.pwc.com/hu/hu/kiadvanyok/assets/pdf/five_
trends_transforming_the_automotive_industry.pdf.
[7] Daimler AG. CASE - Intuitive Mobilität. Daimler. Jan. 2019.url: https://www.daimler.com/case/ (visited on 01/20/2020).
[8] JP Morgan. Driving into 2025: The Future of Electric Vehicles |J.P. Morgan. Aug. 10, 2018. url: https://www.jpmorgan.com/global/research/electric-vehicles (visited on 01/17/2020).
[9] SAE Mobilus. J3016B: Taxonomy and Definitions for Terms Re-lated to Driving Automation Systems for On-Road Motor Vehi-cles - SAE International. Taxonomy and Definitions for TermsRelated to On-Road Motor Vehicle Automated Driving Sys-tems. June 15, 2018. url: https://www.sae.org/standards/content/j3016_201806/ (visited on 11/10/2020).
249
https://www.pwc.com/hu/hu/kiadvanyok/assets/pdf/five_trends_transforming_the_automotive_industry.pdf
250 bibliography
[10] McKinsey & Company. Automotive Revolution – Perspective to-wards 2030. url: https://www.mckinsey.com/industries/automotive-and-assembly/our-insights/disruptive-trends-
that-will-transform-the-auto-industry/de-de# (visitedon 02/10/2020).
[11] K. Feldmann and S. Slama. “Highly Flexible Assembly – Scopeand Justification.” In: CIRP Annals 50.2 (Jan. 1, 2001), pp. 489–498. doi: 10.1016/S0007-8506(07)62987-4.
[12] H. ElMaraghy, G. Schuh, W. ElMaraghy, F. Piller, P. Schönsleben,M. Tseng, and A. Bernard. “Product Variety Management.” In:CIRP Annals - Manufacturing Technology 62.2 (2013), pp. 629–652. doi: 10.1016/j.cirp.2013.05.007.
[13] M. Johnny Rungtusanatham and Fabrizio Salvador. “FromMass Production to Mass Customization: Hindrance Factors,Structural Inertia, and Transition Hazard.” In: Production andOperations Management 17.3 (May 6, 2008), pp. 385–396. doi:10.3401/poms.1080.0025.
[14] Ingrid Göpfert, David Braun, and Matthias Schulz, eds. Au-tomobillogistik. Wiesbaden: Springer Fachmedien Wiesbaden,2017. url: http://link.springer.com/10.1007/978-3-658-11103-8.
[15] Nestor Andres Arteaga Martin, Thomas Bär, and Rainer Stark.“A Reference Framework for Manual Assembly Simulation.”In: Smart Product Engineering. Ed. by Michael Abramovici andRainer Stark. Lecture Notes in Production Engineering. SpringerBerlin Heidelberg, 2013, pp. 293–302. url: http://dx.doi.org/10.1007/978-3-642-30817-8%E2%80%97%2029.
[16] Progenium. Produktportfolios Der Fünf Großen Deutschen Auto-hersteller in Deutschland: 1990 Bis 2014 Das Dilemma Mit DerVielfalt. München, PDF. 2014. url: https://docplayer.org/15484141-Produktportfolios-der-fuenf-grossen-deutschen-
autohersteller - in - deutschland - 1990 - bis - 2014 - das -
dilemma-mit-der-vielfalt-muenchen-24.html (visited on01/19/2020).
[17] PROGENIUM. Das Dilemma Mit Der Vielfalt. url: https://www.progenium.com/wp-content/uploads/2016/04/PROGENIUM-
Das-Dilemma-mit-der-Vielfalt.pdf.
[18] Paul G. Maropoulos and Dariusz Ceglarek. “Design Verifica-tion and Validation in Product Lifecycle.” In: CIRP Annals-Manufacturing Technology 59.2 (2010), pp. 740–759.
[19] Yoram Koren. The Global Manufacturing Revolution: Product-Process-Business Integration and Reconfigurable Systems. Vol. 80. WileySeries in Systems Engineering and Management. John Wiley& Sons, 2010.

bibliography 251
[20] Henry Ford and Samuel Crowther. My Life and Work. Double-day, Page & company, 1922. 311 pp. url: http://archive.org/details/mylifeandwork00crowgoog.
[21] George Chryssolouris. Manufacturing Systems: Theory and Prac-tice. Springer Science & Business Media, Mar. 9, 2013. 431 pp.url: https://www.springer.com/de/book/9780387256832.
[22] H. Kinutani. “Modular Assembly in Mixed-Model Produc-tion at Mazda.” In: Transforming Automobile Assembly. Ed. byKoichi Shimokawa, Ulrich Jürgens, and Takahiro Fujimoto.Berlin, Heidelberg: Springer Berlin Heidelberg, 1997, pp. 94–108. url: https://link.springer.com/chapter/10.1007%2F978-3-642-60374-7_8.
[23] UGS PLM Software. General Assembly Manufacturing. WhitePaper. Plano, TX: UGS PLM Sof tware, 2007, p. 15. url: https://www.plm.automation.siemens.com/zh_cn/Images/11560_
tcm78-49841.pdf.
[24] Uwe Achterholt, Roland Schmid, and Fiona Sheridan. “Mo-mentum: KPMG’s Global Auto Executive Survey 2009.” In:(2009), p. 44. url: https://www.kpmg.de/docs/20090101_Global_Auto_Executive_Survey_2009.pdf.
[25] Julian Weber. Automotive Development Processes: Processes forSuccessful Customer Oriented Vehicle Development. Berlin, Hei-delberg: Springer Berlin Heidelberg, 2009. url: http://link.springer.com/10.1007/978- 3- 642- 01253- 2 (visited on08/19/2020).
[26] Antonino Gomes de Sá and Gabriel Zachmann. “Virtual Re-ality as a Tool for Verification of Assembly and MaintenanceProcesses.” In: Computers & Graphics 23.3 (June 1, 1999), pp. 389–403. doi: 10.1016/S0097-8493(99)00047-3.
[27] Waldemar Walla. “Standard- Und Modulbasierte Digitale Ro-hbauprozesskette : Frühzeitige Produktbeeinflussung BezüglichProduktionsanforderungen Im Karosserierohbau Der Automo-bilindustrie.” KIT Scientific Publishing, 2017. 205 pp. url: https://publikationen.bibliothek.kit.edu/1000061838 (visitedon 02/10/2020).
[28] John Brooke. “SUS-A Quick and Dirty Usability Scale.” In:Usability evaluation in industry 189.194 (1996), pp. 4–7.
[29] James R. Lewis. “Psychometric Evaluation of the PSSUQ Us-ing Data from Five Years of Usability Studies.” In: InternationalJournal of Human-Computer Interaction 14.3-4 (2002), pp. 463–488.
[30] Bob G. Witmer and Michael J. Singer. “Measuring Presence inVirtual Environments: A Presence Questionnaire.” In: Presence7.3 (1998), pp. 225–240.

252 bibliography
[31] T. Bär, M. Riedl, B. Kärcher, H. Hämmerle, H. Beesten, M.Pfeil, and F. Damrath. Physikbasierte Simulation Zur UnterstützungDer Virtuellen Inbetriebnahme. 2014.
[32] Sebastian Süß, Dominik Hauf, Anton Strahilov, and ChristianDiedrich. “Standardized Classification and Interfaces of Com-plex Behaviour Models in Virtual Commissioning.” In: Proce-dia CIRP. The Sixth International Conference on Changeable,Agile, Reconfigurable and Virtual Production (CARV2016) 52
(2016), pp. 24–29. doi: 10.1016/j.procir.2016.07.049.
[33] Achille Mbang Sama. Holistic integration of product, process andresources integration in the automotive industry using the exampleof car body design and production : product design, process model-ing, IT implementation and potential benefits. 2008. doi: 10.5445/KSP/1000008181.
[34] T. Deviprasad and T. Kesavadas. “Virtual Prototyping of As-sembly Components Using Process Modeling.” In: Journal ofManufacturing Systems 22.1 (Jan. 2003), pp. 16–27. doi: 10 .
1016/S0278-6125(03)90002-1.
[35] C.I.R.P., ed. Dictionary of Production Engineering/Wörterbuch DerFertigungstechnik/Dictionnaire Des Techniques de Production MechaniqueVol IV. Berlin, Heidelberg: Springer Berlin Heidelberg, 2011.url: http://link.springer.com/10.1007/978-3-642-12007-7 (visited on 08/04/2020).
[36] John Stark. “Product Lifecycle Management.” In: Product Life-cycle Management. Cham: Springer International Publishing,2015, pp. 1–29. url: http://link.springer.com/10.1007/978-3-319-17440-2_1.
[37] VDI 2221 - Systematic Approach to the Development and Designof Technical Systems and Products. Mar. 1993. url: https://www.beuth.de/de/technische-regel/vdi-2221/973992 (visitedon 02/10/2020).
[38] Munro & Associates, Inc. History of Lean Design® | Munro &Associates, Inc. 2016. url: http://leandesign.com/history-of-lean-design/ (visited on 08/18/2020).
[39] Bruno Lotter and Hans-Peter Wiendahl, eds. Montage in der in-dustriellen Produktion. Berlin, Heidelberg: Springer Berlin Hei-delberg, 2012. url: https://link.springer.com/book/10.1007%2F978-3-642-29061-9.
[40] Christoph Runde, Florin Girbacia, and Eugen Butila. “Virtualand Augmented Environments for Concurrent Engineering:Concurrent Virtual Engineering.” In: Concurrent EngineeringApproaches for Sustainable Product Development in a Multi Disci-plinary Environment. Ed. by Josip Stjepandic, Georg Rock, andCees Bil. London: Springer London, 2013, pp. 849–860. url:

bibliography 253
https://link.springer.com/chapter/10.1007%2F978-1-
4471-4426-7_72.
[41] Geoffrey Boothroyd. “Product Design for Manufacture andAssembly.” In: Computer-Aided Design 26.7 (July 1, 1994), pp. 505–520. doi: 10.1016/0010-4485(94)90082-5.
[42] Oliver Geißel. “AMMU Automotive Mixed Mock-Up: Konzep-tion Einer Neuen Entwicklungsplattform Für Die Automo-bilindustrie.” 2012. url: http://elib.uni- stuttgart.de/opus/volltexte/2012/7191/.
[43] Jörg Roscher. “Bewertung von Flexibilitätsstrategien Für DieEndmontage in Der Automobilindustrie.” Institut für indus-trielle Fertigung und Fabrikbetrieb: Universität Stuttgart, 2008.
[44] G. Lay and E. Schirrmeister. Sackgasse Hochautomatisierung?Ed. by Karlsruhe Fraunhofer-Institut für Systemtechnik undInnovationsforschung. Mitteilungen Aus Der Produktionsin-novationserhebung. PI-Mitteilungen. Karlsruhe: ISI, 2000. 12 pp.
[45] Bruno Lotter. Manufacturing Assembly Handbook - 1st Edition.1st ed. Elsevier, 1989. url: https : / / www . elsevier . com /
books/manufacturing-assembly-handbook/lotter/978-0-
408-03561-3 (visited on 02/15/2020).
[46] József Váncza. “Production Networks.” In: CIRP Encyclopediaof Production Engineering. Ed. by The International Academyfor Produ, Luc Laperrière, and Gunther Reinhart. Berlin, Hei-delberg: Springer Berlin Heidelberg, 2016, pp. 1–8. url: http://link.springer.com/10.1007/978-3-642-35950-7_16829-
1.
[47] Peter Butala and Khumbulani Mpofu. “Assembly Systems.”In: CIRP Encyclopedia of Production Engineering. Ed. by The In-ternational Academy for Produ, Luc Laperrière, and GuntherReinhart. Berlin, Heidelberg: Springer Berlin Heidelberg, 2015,pp. 1–5. url: http://link.springer.com/10.1007/978-3-642-35950-7_16789-1.
[48] Lars Weyand. “Risikoreduzierte Endmontageplanung am Beispielder Automobilindustrie.” 2010. doi: http://dx.doi.org/10.22028/D291-22651.
[49] Company Ford. Innovation: 100 Years of the Moving AssemblyLine | Ford Motor Company. Ford Corporate. 2019. url: http:/ / corporate . ford . com / innovation / 100 - years - moving -
assembly-line.html (visited on 02/15/2020).
[50] Audi Media Center. The Home of the New A3 Sedan – Audi’sExpands Its Site in Gyor into a Fully-Fledged Car Plant. Audi Me-dia Center. 2019. url: https://www.audi-mediacenter.com:443/en/audi-expands-its-hungarian-site-in-gyor-into-
a- fully- fledged- car- factory- 2988/the- home- of- the-
254 bibliography
new-a3-sedan-audis-expands-its-site-in-gyor-into-a-
fully-fledged-car-plant-2999 (visited on 01/26/2020).
[51] Verein Deutscher Ingenieure VDI. VDI-Richtlinie: VDI 2860Blatt 1 Montage- und Handhabungstechnik - Handhabungsfunktio-nen, Handhabungseinrichtungen, Begriffe, Definitionen, Symbole.Verein Deutscher Ingenieure e.V. url: https://www.vdi.de/richtlinien/details/vdi- 2860- blatt- 1- montage- und-
handhabungstechnik-handhabungsfunktionen-handhabungseinrichtungen-
begriffe-definitionen-symbole (visited on 01/27/2020).
[52] DIN 8593-0 DIN. DIN 8593-0 Manufacturing Processes Joining -Part 0: General; Classification, Subdivision, Terms and Definitions.Sept. 2003. url: https://www.beuth.de/de/norm/din-8593-0/65031206 (visited on 01/27/2020).
[53] Christian Küber, Engelbert Westkämper, Bernd Keller, andHans-Friedrich Jacobi. “Planning Method for the Design ofFlexible as Well as Economic Assembly and Logistics Pro-cesses in the Automotive Industry.” In: Procedia CIRP. Researchand Innovation in Manufacturing: Key Enabling Technologiesfor the Factories of the Future - Proceedings of the 48th CIRPConference on Manufacturing Systems 41 (Jan. 1, 2016), pp. 556–561. doi: 10.1016/j.procir.2015.12.038.
[54] Standard. DIN IEC 60050-351:2014-09, Internationales Elektrotech-nisches Wörterbuch_- Teil_351: Leittechnik (IEC_60050-351:2013).Beuth Verlag GmbH, Sept. 2014. doi: 10.31030/2159569.
[55] T. Fujimoto. “What Do You Mean by Automation Ratio? Def-initions by the Japanese Auto Makers.” In: Transforming Au-tomobile Assembly. Ed. by Koichi Shimokawa, Ulrich Jürgens,and Takahiro Fujimoto. Berlin, Heidelberg: Springer BerlinHeidelberg, 1997, pp. 61–69. url: https://link.springer.com/chapter/10.1007%2F978-3-642-60374-7_5.
[56] Walter Eversheim. Organisation in Der Produktionstechnik Band4: Fertigung Und Montage. 2nd ed. VDI-Buch. Berlin Heidel-berg: Springer-Verlag, 1989.
[57] Günther Pawellek. Ganzheitliche Fabrikplanung. Berlin, Heidel-berg: Springer Berlin Heidelberg, 2014. url: https://link.springer.com/book/10.1007%2F978-3-662-43728-5.
[58] Giuseppe Stecca. “Production Planning.” In: CIRP Encyclope-dia of Production Engineering. Ed. by The International Academyfor Produ, Luc Laperrière, and Gunther Reinhart. Berlin, Hei-delberg: Springer Berlin Heidelberg, 2014, pp. 1–4. url: http://link.springer.com/10.1007/978-3-642-35950-7_6569-4.
[59] Claus-Gerold Grundig. Fabrikplanung: Planungssystematik - Meth-oden - Anwendungen. Carl Hanser Verlag GmbH Co KG, 2000.319 pp.
bibliography 255
[60] Mahmut Gülesjn. “Process Planning in Design and Manufac-turing Systems.” In: Expert Systems. Ed. by Cornelius T. Leon-des. Burlington: Academic Press, Jan. 1, 2002, pp. 327–380.doi: 10.1016/B978-012443880-4/50054-5.
[61] Hoda A. ElMaraghy. “Evolution and Future Perspectives ofCAPP.” In: CIRP Annals 42.2 (Jan. 1, 1993), pp. 739–751. doi:10.1016/S0007-8506(07)62537-2.
[62] The International Academy for Production Engineering, LucLaperrière, and Gunther Reinhart, eds. CIRP Encyclopedia ofProduction Engineering. Heidelberg: Springer, Berlin, Heidel-berg, 2014. url: https://doi.org/10.1007/978- 3- 642-20617-7.
[63] Bruno Lotter. Wirtschaftliche Montage: ein Handbuch für Elek-trogerätebau und Feinwerktechnik. VDI-Verlag, 1992. 458 pp.
[64] Marko Hartel and Bruno Lotter. “Planung und Bewertung vonMontagesystemen.” In: Montage in der industriellen Produktion(2006), pp. 407–432. doi: 10.1007/3-540-36669-5_13.
[65] Martin Manns and Nestor Andres Arteaga Martin. “A Vague-ness Measure for Concurrent Engineering of Manual Assem-bly Lines.” In: Enabling Manufacturing Competitiveness and Eco-nomic Sustainability. Ed. by Michael F. Zaeh. Springer Interna-tional Publishing, Jan. 1, 2014, pp. 131–135. url: http://link.springer.com/chapter/10.1007/978-3-319-02054-9_22.
[66] TU Darmstadt. Ergonomic Assessment Worksheet (EAWS). Ar-beitswissenschaft – Technische Universität Darmstadt. url:http://www.iad.tu-darmstadt.de/forschung_15/methodenundlabore/
ergonomic_assessment_worksheet_eaws.de.jsp (visited on07/13/2016).
[67] Philipp Agethen, Felix Gaisbauer, Michael Otto, and EnricoRukzio. “Interactive Simulation for Walk Path Planning withinthe Automotive Industry.” In: Proceedings of the 51st CIRP Con-ference on Manufacturing Systems. CIRP CMS 2018. Vol. 72. Stock-holm, Sweden, Jan. 1, 2018, pp. 285–290. doi: 10 . 1016 / j .
procir.2018.03.223.
[68] Nima Rafibakhsh. “Automated Assembly Planning: From CADModel to Virtual Assembly Process.” In: (2017).
[69] Ming C. Leu, Hoda A. ElMaraghy, Andrew YC Nee, Soh KhimOng, Michele Lanzetta, Matthias Putz, Wenjuan Zhu, and AlainBernard. “CAD Model Based Virtual Assembly Simulation,Planning and Training.” In: CIRP Annals 62.2 (2013), pp. 799–822.
[70] Merriam-Webster. Definition of Mock–Up. url: https://www.merriam-webster.com/dictionary/mock-up (visited on 01/07/2020).

256 bibliography
[71] Carlos Enrique Gorbea Diaz. “Vehicle Architecture and Life-cycle Cost Analysis.” Technische Universität München, 2011.url: http://mediatum.ub.tum.de/?id=1108157 (visited on08/04/2020).
[72] Gerd F. Kamiske and Jörg-Peter Brauer. Qualitätsmanagementvon A bis Z: wichtige Begriffe des Qualitätsmanagements und ihreBedeutung. Hanser, 2011. 402 pp.
[73] Fan Dai. Virtual Reality for Industrial Applications. Heidelberg:Springer Science & Business Media, 2008. 177 pp.
[74] Abhishek Seth, Judy M. Vance, and James H. Oliver. “VirtualReality for Assembly Methods Prototyping: A Review.” In:Virtual Reality 15.1 (Jan. 22, 2010), pp. 5–20. doi: 10.1007/s10055-009-0153-y.
[75] Andreas Syska. Produktionsmanagement: Das A - Z wichtigerMethoden und Konzepte für die Produktion von heute. Springer-Verlag, Aug. 15, 2006. 192 pp.
[76] M. Mousavi, F. A. Aziz, and N. Ismail. “Opportunities andConstraints of Virtual Reality Application in International andDomestic Car Companies of Malaysia.” In: 2012 UKSim 14thInternational Conference on Computer Modelling and Simulation.2012 UKSim 14th International Conference on Computer Mod-elling and Simulation. Mar. 2012, pp. 273–277. doi: 10.1109/UKSim.2012.46.
[77] Karl-Josef Wack, Steffen Strassburger, and Thomas Bär. “Vir-tual Validation of Material Provisioning in Assembly in theAutomotive Industry.” In: Proceedings of the 44th InternationalCIRP Conference on Manufacturing Systems. Madison, Wisconsin,USA. 2011. url: http : / / www . strassburger - online . de /
papers/cirp44_virtual%20validation%20of%20material.
pdf (visited on 08/03/2020).
[78] 3P – Prozess Der Produktionsvorbereitung | Volkswagen. url: http://www.volkswagen-poznan.pl/de/3p-prozess-der-produktionsvorbereitung
(visited on 04/04/2020).
[79] Michael Otto, Michael Prieur, Philipp Agethen, and EnricoRukzio. “Dual Reality for Production Verification Workshops:A Comprehensive Set of Virtual Methods.” In: Proceedings ofthe 6th CIRP Conference on Assembly Technologies and Systems.CIRP CATS 2016. Vol. 44. CIRP CATS 2016. Gothenburg, Swe-den, 2016, pp. 38–43. doi: 10.1016/j.procir.2016.02.140.
[80] Jan C. Aurich, Dirk Ostermayer, and C. H. Wagenknecht. “Im-provement of Manufacturing Processes with Virtual Reality-Based CIP Workshops.” In: International Journal of ProductionResearch 47.19 (2009), pp. 5297–5309. url: https://www.tandfonline.com/doi/abs/10.1080/00207540701816569 (visited on 06/25/2020).

bibliography 257
[81] J. C. Aurich, H. Hagen, D. Ostermayer, and M. Bertram. “VR-Unterstützter KVP-Workshop.” In: wt Werkstattstechnik online95 (2006). url: https://docplayer.org/4106022-Vr-unterstuetzter-kvp-workshop.html (visited on 06/25/2020).
[82] Masaaki Imai. “Gemba Kaizen. A Commonsense, Low-CostApproach to Management.” In: Das Summa Summarum desManagement: Die 25 wichtigsten Werke für Strategie, Führung undVeränderung. Ed. by Cornelius Boersch and Rainer Elschen.Wiesbaden: Gabler, 2007, pp. 7–15. url: https://doi.org/10.1007/978-3-8349-9320-5_2.
[83] ISO Organisation Internationale de Normalisation. ISO 9000:2015(En),Quality Management Systems — Fundamentals and Vocabulary.url: https://www.iso.org/obp/ui/#iso:std:iso:9000:ed-4:v1:en (visited on 02/17/2019).
[84] Osman Balci. “Verification, Validation, and Certification ofModeling and Simulation Applications.” In: Proceedings of the35th Conference on Winter Simulation: Driving Innovation. Win-ter Simulation Conference, 2003, pp. 150–158.
[85] Robert Meißner. Digitale Absicherung der Montagetauglichkeit:ein Beitrag zur Integration von Produktentwicklung und Montage-planung. Otto-von-Guericke-Univ., Lehrstuhl für Maschinen-bauinformatik, 2010. 189 pp.
[86] Ralf Kleedörfer. “Prozeß- und Änderungsmanagement der In-tegrierten Produktentwicklung.” TU München, 1999. 158 pp.url: http://mediatum.ub.tum.de/?id=1192108 (visited on02/28/2020).
[87] He Wang, Xiaowei Zhu, Hui Wang, S. Jack Hu, Zhongqin Lin,and Guanlong Chen. “Multi-Objective Optimization of Prod-uct Variety and Manufacturing Complexity in Mixed-ModelAssembly Systems.” In: Journal of Manufacturing Systems 30.1(Jan. 2011), pp. 16–27. doi: 10.1016/j.jmsy.2011.03.002.
[88] Annki Falck, Roland Örtengren, and Dan Högberg. “EarlyRisk Identification and Cost-Benefit Analyses through ErgonomicsSimulation.” In: (2009).
[89] Karl-Josef Wack, Franz Otto, Martin Manns, and Steffen Strass-burger. “Efficient Preparation of Digital Production Valida-tion.” In: Proceedings of the 44th CIRP Conference on Manu-facturing Systems (ICMS). Madison, USA.
[90] Ulrich Seiffert and Gotthard Rainer. Virtuelle ProduktentstehungFür Fahrzeug Und Antrieb Im KFZ: Prozesse, Komponenten, BeispieleAus Der Praxis. Springer, 2008.
[91] Christoph Picker. Prospektive Zeitbestimmung Für Nicht WertschöpfendeMontagetätigkeiten. 2007. url: http://dx.doi.org/10.17877/DE290R-883 (visited on 05/22/2020).
258 bibliography
[92] REFA. REFA Methodenlehre der Betriebsorganisation, Datenermit-tlung. München: Fachbuchverlag Leipzig, July 28, 1997. 456 pp.
[93] Michael Otto, Michael Prieur, and Enrico Rukzio. “Using Scal-able, Interactive Floor Projection for Production Planning Sce-nario.” In: Proceedings of the Ninth ACM International Confer-ence on Interactive Tabletops and Surfaces, Poster. ACM ITS 2014.Dresden, Germany: Association for Computing Machinery, Nov. 16,2014, pp. 363–368. doi: 10.1145/2669485.2669547.
[94] Ulrich Bockholt, Thomas Bochtler, Volker Enderlein, ManuelOlbrich, Michael Otto, Michael Prieur, Richard Sauerbier, RolandStechow, Andreas Wehe, and Hans-Joachim Wirsching. “Mo-tion Capturing.” In: Web-basierte Anwendungen Virtueller Tech-niken. Ed. by Werner Schreiber, Konrad Zürl, and Peter Zim-mermann. Berlin, Heidelberg: Springer Vieweg, Berlin, Hei-delberg, 2017, pp. 219–262. doi: 10.1007/978-3-662-52956-0_5.
[95] Sören Kunst. Konzeption eines Modells zur Bewertung der Wirtschaftlichkeitvon Virtual Reality Systemen in der Digitalen Fabrik. Apr. 23,2006. 127 pp.
[96] Stefan H Thomke. “Simulation, Learning and R&D Perfor-mance: Evidence from Automotive Development.” In: ResearchPolicy 27.1 (May 1, 1998), pp. 55–74. doi: 10 . 1016 / S0048 -
7333(98)00024-9.
[97] Martin Manns and Nestor Andres Arteaga Martin. “Improv-ing A* Walk Trajectories with B-Splines and Motion Capturefor Manual Assembly Verification.” In: Procedia CIRP. 9th CIRPConference on Intelligent Computation in Manufacturing En-gineering - CIRP ICME ’14 33 (Jan. 1, 2015), pp. 364–369. doi:10.1016/j.procir.2015.06.083.
[98] Reuters. Tesla Is Skipping Traditional Manufacturing Steps forModel 3. Newsweek. Apr. 24, 2017. url: http://www.newsweek.com/tesla-skips-traditional-manufacturing-steps-model-
3-588503 (visited on 04/28/2020).
[99] Z. Szalavári, D. Schmalstieg, A. Fuhrmann, and M. Gervautz.“"Studierstube": An Environment for Collaboration in Aug-mented Reality.” In: Virtual Real. 3.1 (Mar. 1998), pp. 37–48.doi: 10.1007/BF01409796.
[100] Paul Milgram and Fumio Kishino. “A Taxonomy of MixedReality Visual Displays.” In: IEICE TRANSACTIONS on In-formation and Systems 77.12 (1994), pp. 1321–1329. url: http://search.ieice.org/bin/summary.php?id=e77-d_12_1321
(visited on 05/18/2020).

bibliography 259
[101] Joshua Lifton and Joseph A. Paradiso. “Dual Reality: Mergingthe Real and Virtual.” In: Facets of Virtual Environments. Ed. byFritz Lehmann-Grube and Jan Sablatnig. Red. by Ozgur Akan,Paolo Bellavista, Jiannong Cao, Falko Dressler, Domenico Fer-rari, Mario Gerla, Hisashi Kobayashi, Sergio Palazzo, SartajSahni, Xuemin (Sherman) Shen, Mircea Stan, Jia Xiaohua, Al-bert Zomaya, and Geoffrey Coulson. Vol. 33. Berlin, Heidel-berg: Springer Berlin Heidelberg, 2010, pp. 12–28. url: http://link.springer.com/10.1007/978-3-642-11743-5_2.
[102] Andre Stork. “Visual Computing Challenges of Advanced Man-ufacturing and Industrie 4.0 [Guest Editors’ Introduction].”In: IEEE Computer Graphics and Applications 35.2 (Mar. 2015),pp. 21–25. doi: 10.1109/MCG.2015.46.
[103] Monica Bordegoni, Umberto Cugini, Giandomenico Caruso,and Samuele Polistina. “Mixed Prototyping for Product As-sessment: A Reference Framework.” In: International Journalon Interactive Design and Manufacturing (IJIDeM) 3.3 (July 12,2009), pp. 177–187. doi: 10.1007/s12008-009-0073-9.
[104] Hiroshi Ishii. “Tangible Bits: Beyond Pixels.” In: Proceedingsof the 2nd International Conference on Tangible and Embedded In-teraction. ACM, 2008, pp. xv–xxv. url: http://dl.acm.org/citation.cfm?id=1347392.
[105] “Collaborative Virtual Environments.” In: Encyclopedia of Mul-timedia. Ed. by Borko Furht. Boston, MA: Springer US, 2008,pp. 74–75. url: https://doi.org/10.1007/978-0-387-78414-4_235.
[106] Dave Snowdon, Elizabeth F. Churchill, and Alan J. Munro.“Collaborative Virtual Environments: Digital Spaces and Placesfor CSCW: An Introduction.” In: Collaborative Virtual Environ-ments. Springer, 2001, pp. 3–17. url: http://link.springer.com/chapter/10.1007/978-1-4471-0685-2_1.
[107] Mark Billinghurst, Ivan Poupyrev, Hirokazu Kato, and RichardMay. “Mixing Realities in Shared Space: An Augmented Re-ality Interface for Collaborative Computing.” In: IEEE Inter-national Conference on Multimedia and Expo (III). Citeseer, 2000,pp. 1641–1644.
[108] Christian Mai, Sarah Bartsch, and Lea Rieger. “EvaluatingShared Surfaces for Co-Located Mixed-Presence Collaboration| Proceedings of the 17th International Conference on Mobileand Ubiquitous Multimedia.” In: MUM 2018: Proceedings ofthe 17th International Conference on Mobile and Ubiquitous.2018, pp. 1–5. doi: 10.1145/3282894.3282910.
260 bibliography
[109] Eike Langbehn, Eva Harting, and Frank Steinicke. “Shadow-Avatars: A Visualization Method to Avoid Collisions of Phys-ically Co-Located Users in Room-Scale VR.” In: IEEE Work-shop on Everyday Virtual Reality. 2018.
[110] Hrvoje Benko, Eyal Ofek, Feng Zheng, and Andrew D. Wil-son. “Fovear: Combining an Optically See-through near-EyeDisplay with Projector-Based Spatial Augmented Reality.” In:Proceedings of the 28th Annual ACM Symposium on User InterfaceSoftware & Technology. ACM, 2015, pp. 129–135.
[111] Jan Gugenheimer, Evgeny Stemasov, Julian Frommel, and En-rico Rukzio. “ShareVR: Enabling Co-Located Experiences forVirtual Reality between HMD and Non-HMD Users.” In: Pro-ceedings of the 2017 CHI Conference on Human Factors in Comput-ing Systems. ACM, 2017, pp. 4021–4033.
[112] Brett Jones, Rajinder Sodhi, Michael Murdock, Ravish Mehra,Hrvoje Benko, Andrew Wilson, Eyal Ofek, Blair MacIntyre,Nikunj Raghuvanshi, and Lior Shapira. “RoomAlive: MagicalExperiences Enabled by Scalable, Adaptive Projector-CameraUnits.” In: Proceedings of the 27th Annual ACM Symposium onUser Interface Software and Technology. UIST ’14. New York,NY, USA: ACM, 2014, pp. 637–644. doi: 10.1145/2642918.2647383.
[113] Julian Seifert, David Dobbelstein, Dominik Schmidt, Paul Holleis,and Enrico Rukzio. “From the Private into the Public: Privacy-Respecting Mobile Interaction Techniques for Sharing Data onSurfaces.” In: Personal and Ubiquitous Computing 18.4 (2014),pp. 1013–1026.
[114] Ricardo Langner, Ulrich von Zadow, Tom Horak, Annett Mitschick,and Raimund Dachselt. “Content Sharing Between Spatially-Aware Mobile Phones and Large Vertical Displays SupportingCollaborative Work.” In: Collaboration Meets Interactive Spaces.Springer, 2016, pp. 75–96.
[115] Christian Winkler, Markus Löchtefeld, David Dobbelstein, An-tonio Krüger, and Enrico Rukzio. “SurfacePhone: A MobileProjection Device for Single-and Multiuser Everywhere Table-top Interaction.” In: (2014).
[116] Ferran Argelaguet, Andre Kunert, Alexander Kulik, and BerndFroehlich. “Improving Co-Located Collaboration with Show-through Techniques.” In: 3D User Interfaces (3DUI), 2010 IEEESymposium On. IEEE, 2010, pp. 55–62. url: http://ieeexplore.ieee.org/abstract/document/5444719/.

bibliography 261
[117] Steve Ballmer. CES 2010: A Transforming Trend – The Natu-ral User Interface. Huffington Post. Mar. 18, 2010. url: https://www.huffingtonpost.com/steve- ballmer/ces- 2010- a-
transforming-t_b_416598.html (visited on 01/09/2020).
[118] Daniel Wigdor and Dennis Wixon. Brave NUI World: DesigningNatural User Interfaces for Touch and Gesture. 1st. San Francisco,CA, USA: Morgan Kaufmann Publishers Inc., 2011.
[119] JoshB. What Is the Natural User Interface? (Book Excerpt). url:http://nui.joshland.org/2010/03/what-is-natural-user-
interface-book.html (visited on 01/09/2020).
[120] Gabriel Zachmann and Alexander Rettig. “Natural and Ro-bust Interaction in Virtual Assembly Simulation.” In: EighthISPE International Conference on Concurrent Engineering: Researchand Applications (ISPE/CE2001). Vol. 1. 2001, pp. 425–434. url:http://cgvr.cs.uni-bremen.de/papers/ce2001/ce2001.
pdf.
[121] Bernhard Preim and Raimund Dachselt. Interaktive Systeme:Band 2: User Interface Engineering, 3D-Interaktion, Natural UserInterfaces. Springer-Verlag, Apr. 2, 2015. 786 pp.
[122] Tomasz Miaskiewicz and Kenneth A. Kozar. “Personas andUser-Centered Design: How Can Personas Benefit Product De-sign Processes?” In: Design Studies 32.5 (Sept. 1, 2011), pp. 417–430. doi: 10.1016/j.destud.2011.03.003.
[123] Joe Cecil and Atipol Kanchanapiboon. “Virtual EngineeringApproaches in Product and Process Design.” In: The Inter-national Journal of Advanced Manufacturing Technology 31.9-10
(2007), pp. 846–856.
[124] Michael Otto, Eva Lampen, Philipp Agethen, Mareike Lan-gohr, Gabriel Zachmann, and Enrico Rukzio. “A Virtual Real-ity Assembly Assessment Benchmark for Measuring VR Per-formance & Limitations.” In: Proceedings of the 52nd CIRP Con-ference on Manufacturing Systems. CIRP CMS 2019. Vol. 81. Ljubl-jana, Slovenia, 2019, pp. 785–790. doi: 10.1016/j.procir.2019.03.195.
[125] Martin Manns and Néstor Andrés Arteaga Martín. “Auto-mated DHM Modeling for Integrated Alpha-Numeric and Ge-ometric Assembly Planning.” In: Smart Product Engineering(2013), pp. 325–334. doi: 10.1007/978-3-642-30817-8_32.
[126] SangSu Choi, Kiwook Jung, and Sang Do Noh. “Virtual Real-ity Applications in Manufacturing Industries: Past Research,Present Findings, and Future Directions.” In: Concurrent Engi-neering 23.1 (2015), pp. 40–63.
262 bibliography
[127] Holger Graf, Gino Brunetti, and André Stork. “A Methodol-ogy Supporting the Preparation of 3D-CAD Data for DesignReviews in VR.” In: DS 30: Proceedings of DESIGN 2002, the 7thInternational Design Conference, Dubrovnik. 2002, pp. 489–496.
[128] Joseph J. LaViola Jr. “A Discussion of Cybersickness in VirtualEnvironments.” In: ACM SIGCHI Bulletin 32.1 (2000), pp. 47–56.
[129] Matthias Karl and Johannes Behr. “Visualization as a Service(VAAS).” ProStep (München). May 2017. url: https://www.prostep-ivip-symposium.org/fileadmin/Veranstaltungen/
symposium17/Presentations/Presentation_Karl-BMW_Behr-
Fraunhofer-IGD.pdf (visited on 11/03/2020).
[130] 3DInteractive. Technology - 3DInteractive. url: https://www.3dinteractive.de/about-3dinteractive/technology/ (vis-ited on 11/05/2019).
[131] NetAllied Systems GmbH. NetAllied Systems GmbH. url: https://netallied.de/dmu4all.html (visited on 11/06/2020).
[132] Johannes Behr, Christophe Mouton, Samuel Parfouru, JulienChampeau, Clotilde Jeulin, Maik Thöner, Christian Stein, MichaelSchmitt, Max Limper, Miguel de Sousa, Tobias Alexander Franke,and Gerrit Voss. “webVis/Instant3DHub: Visual ComputingAs a Service Infrastructure to Deliver Adaptive, Secure andScalable User Centric Data Visualisation.” In: Proceedings ofthe 20th International Conference on 3D Web Technology. Web3D’15. New York, NY, USA: ACM, 2015, pp. 39–47. doi: 10.1145/2775292.2775299.
[133] AutomationML e.V. AutomationML. Automationml.org. url:http://www.automationml.org/o.red.c/home.html (vis-ited on 04/23/2020).
[134] Werner Schreiber, Konrad Zürl, and Peter Zimmermann, eds.Web-Basierte Anwendungen Virtueller Techniken: Das ARVIDA-Projekt – Dienste-Basierte Software-Architektur Und Anwendungsszenar-ien Für Die Industrie. Springer Vieweg, 2017. url: //www.springer.com/de/book/9783662529553.
[135] Infor. Engineering BOM for Assembly Production. 2018. url: https:/ / docs . infor . com / ln / 10 . 5 / en - us / lnolh / help / ti /
onlinemanual/000519.html (visited on 04/23/2020).
[136] ISO. ISO 14306:2012 - Industrial Automation Systems and Integra-tion – JT File Format Specification for 3D Visualization. Dec. 2012.url: https://www.iso.org/standard/60572.html (visited on10/07/2020).
[137] A2Mac1. Benchmarking Contents. A2Mac1 - Automotive Bench-marking. Apr. 2019. url: https://portal.a2mac1.com/benchmarking-database/ (visited on 04/07/2020).
bibliography 263
[138] Liang Gong, Jonatan Berglund, Dennis Saluäär, and BjörnJohansson. “A Novel VR Tool for Collaborative Planning ofManufacturing Process Change Using Point Cloud Data.” In:Procedia CIRP. Manufacturing Systems 4.0 – Proceedings ofthe 50th CIRP Conference on Manufacturing Systems 63 (2017),pp. 336–341. doi: 10.1016/j.procir.2017.03.089.
[139] Erik Lindskog. “Towards Realistic Visualisation of ProductionSystems.” Fraunhofer Chalmers Centre, 2014.
[140] E. Shellshear, R. Berlin, and J.S. Carlson. “Maximizing SmartFactory Systems by Incrementally Updating Point Clouds.”In: IEEE Computer Graphics and Applications 35.2 (Mar. 2015),pp. 62–69. doi: 10.1109/MCG.2015.38.
[141] M. Heyer and B. Brüderlin. “Visibility-Guided Rendering forVisualizing Very Large Virtual Reality Scenes.” In: Proc. 1stGI Workshop Virtual and Augmented Reality (VR/AR 04), ShakerVerlag. 2004, pp. 163–172.
[142] André Antakli, Pablo Alvarado Moya, Beat Brüderlin, UlrichCanzler, Holger Dammertz, Volker Enderlein, Jürgen Grüninger,Andreas Harth, Hilko Hoffmann, Eduard Jundt, Peter Keitler,Felix Leif Keppmann, Roland Krzikalla, Sebastian Lampe, Alexan-der Löffler, Julian Meder, Michael Otto, Frieder Pankratz, Se-bastian Pfützner, Matthias Roth, Richard Sauerbier, WernerSchreiber, Roland Stechow, Johannes Tümler, Christian Vo-gelgesang, Oliver Wasenmüller, Andreas Weinmann, JochenWillneff, Hans-Joachim Wirsching, Ingo Zinnikus, and Kon-rad Zürl. “Virtuelle Techniken und Semantic-Web.” In: Web-basierte Anwendungen Virtueller Techniken. Ed. by Werner Schreiber,Konrad Zürl, and Peter Zimmermann. Berlin, Heidelberg: SpringerBerlin Heidelberg, 2017, pp. 17–116. doi: 10.1007/978-3-662-52956-0_2.
[143] B. Brüderlin, M. Heyer, and S. Pfützner. “Interviews3D: APlatform for Interactive Handling of Massive Data Sets.” In:IEEE Computer Graphics and Applications 27.6 (Nov. 2007), pp. 48–59. doi: 10.1109/MCG.2007.153.
[144] M. Heyer and B. Brüderlin. “Hardware-Supported OcclusionCulling for Visualizing Extremely Large Models.” In: Proc. 3,Paderborner Workshop, Paderborn Augmented & Virtual Reality inDer Produktentstehung, Hanser Verlag. 2004, pp. 39–49.
[145] Russell M. Taylor, Thomas C. Hudson, Adam Seeger, HansWeber, Jeffrey Juliano, and Aron T. Helser. “VRPN: A Device-Independent, Network-Transparent VR Peripheral System.”In: Proceedings of the ACM Symposium on Virtual Reality Soft-ware and Technology. ACM, 2001, pp. 55–61.

264 bibliography
[146] Don B. Chaffin. “Human Motion Simulation for Vehicle andWorkplace Design.” In: Human Factors and Ergonomics in Man-ufacturing & Service Industries 17.5 (2007), pp. 475–484. doi:10.1002/hfm.20087.
[147] MakeHuman | Open Source Tool for Making 3d Characters. url:http://www.makehuman.org/ (visited on 05/02/2020).
[148] H-Anim. ISO/IEC FCD 19774:200x – Humanoid Animation In-dex. url: http://h-anim.org/Specifications/H-Anim200x/ISO_IEC_FCD_19774/ (visited on 03/17/2017).
[149] Daniel Roth, Jean-Luc Lugrin, Julia Buser, Gary Bente, Ar-nulph Fuhrmann, and Marc Erich Latoschik. “A SimplifiedInverse Kinematic Approach for Embodied VR Applications.”In: 2016 IEEE Virtual Reality (VR). 2016 IEEE Virtual Reality(VR). Greenville, SC, USA: IEEE, Mar. 2016, pp. 275–276. doi:10.1109/VR.2016.7504760.
[150] Eiji Hayashi, Manuel Maas, and Jason I. Hong. “Wave to Me:User Identification Using Body Lengths and Natural Gestures.”In: Proceedings of the SIGCHI Conference on Human Factors inComputing Systems. CHI ’14. New York, NY, USA: ACM, 2014,pp. 3453–3462. doi: 10.1145/2556288.2557043.
[151] Ivan E. Sutherland. “A Head-Mounted Three DimensionalDisplay.” In: Proceedings of the December 9-11, 1968, Fall JointComputer Conference, Part I. ACM, 1968, pp. 757–764.
[152] D.A. Bowman and R.P. McMahan. “Virtual Reality: How MuchImmersion Is Enough?” In: Computer 40.7 (July 2007), pp. 36–43. doi: 10.1109/MC.2007.257.
[153] Helena Van Kerrebroeck, Malaika Brengman, and Kim Willems.“Escaping the Crowd: An Experimental Study on the Impactof a Virtual Reality Experience in a Shopping Mall.” In: Com-puters in Human Behavior 77 (Dec. 1, 2017), pp. 437–450. doi:10.1016/j.chb.2017.07.019.
[154] Kate E. Laver, Stacey George, Susie Thomas, Judith E. Deutsch,and Maria Crotty. “Virtual Reality for Stroke Rehabilitation.”In: Cochrane Database of Systematic Reviews 2 (2015). doi: 10.1002/14651858.CD008349.pub3.
[155] Abbie Brown and Tim Green. “Virtual Reality: Low-Cost Toolsand Resources for the Classroom.” In: TechTrends 60.5 (2016),pp. 517–519.
[156] Zahira Merchant, Ernest T. Goetz, Lauren Cifuentes, WendyKeeney-Kennicutt, and Trina J. Davis. “Effectiveness of VirtualReality-Based Instruction on Students’ Learning Outcomes inK-12 and Higher Education: A Meta-Analysis.” In: Comput-ers & Education 70 (Jan. 1, 2014), pp. 29–40. doi: 10.1016/j.compedu.2013.07.033.

bibliography 265
[157] P. Zimmermann and AG Volkswagen. “Virtual Reality AidedDesign: A Survey of the Use.” In: 2008.
[158] Stig Ottosson. “Virtual Reality in the Product DevelopmentProcess.” In: Journal of Engineering Design 13.2 (June 1, 2002),pp. 159–172. doi: 10.1080/09544820210129823.
[159] Glyn Lawson, Davide Salanitri, and Brian Waterfield. “FutureDirections for the Development of Virtual Reality within anAutomotive Manufacturer.” In: Applied Ergonomics. Transportin the 21st Century: The Application of Human Factors toFuture User Needs 53 (Mar. 1, 2016), pp. 323–330. doi: 10.1016/j.apergo.2015.06.024.
[160] Leif P. Berg and Judy M. Vance. “Industry Use of Virtual Real-ity in Product Design and Manufacturing: A Survey.” In: Vir-tual Reality 21.1 (Mar. 1, 2017), pp. 1–17. doi: 10.1007/s10055-016-0293-9.
[161] Andreas Dünser, Karin Steinbügl, Hannes Kaufmann, and Ju-dith Glück. “Virtual and Augmented Reality As Spatial Abil-ity Training Tools.” In: Proceedings of the 7th ACM SIGCHI NewZealand Chapter’s International Conference on Computer-HumanInteraction: Design Centered HCI. CHINZ ’06. New York, NY,USA: ACM, 2006, pp. 125–132. doi: 10.1145/1152760.1152776.
[162] A. Stork, N. Sevilmis, D. Weber, D. Gorecky, C. Stahl, M.Loskyll, and F. Michel. “Enabling Virtual Assembly Trainingin and beyond the Automotive Industry.” In: 2012 18th Inter-national Conference on Virtual Systems and Multimedia (VSMM).2012 18th International Conference on Virtual Systems andMultimedia (VSMM). Sept. 2012, pp. 347–352. doi: 10.1109/VSMM.2012.6365944.
[163] Charlene Jennett, Anna L. Cox, Paul Cairns, Samira Dhoparee,Andrew Epps, Tim Tijs, and Alison Walton. “Measuring andDefining the Experience of Immersion in Games.” In: Inter-national journal of human-computer studies 66.9 (2008), pp. 641–661.
[164] Stephen R. Ellis. “Presence of Mind: A Reaction to ThomasSheridan’s “Further Musings on the Psychophysics of Pres-ence”.” In: Presence: Teleoperators & Virtual Environments 5.2(1996), pp. 247–259.
[165] Markus Funk, Thomas Kosch, Scott W. Greenwald, and Al-brecht Schmidt. “A Benchmark for Interactive Augmented Re-ality Instructions for Assembly Tasks.” In: Proceedings of the14th International Conference on Mobile and Ubiquitous Multime-dia. MUM ’15. New York, NY, USA: ACM, 2015, pp. 253–257.doi: 10.1145/2836041.2836067.
266 bibliography
[166] John Brooke. “SUS: A Retrospective.” In: Journal of usabilitystudies 8.2 (2013), pp. 29–40.
[167] Diederick C. Niehorster, Li Li, and Markus Lappe. “The Accu-racy and Precision of Position and Orientation Tracking in theHTC Vive Virtual Reality System for Scientific Research.” In: i-Perception 8.3 (June 1, 2017). doi: 10.1177/2041669517708205.
[168] Shinji Umeyama. “Least-Squares Estimation of Transforma-tion Parameters between Two Point Patterns.” In: IEEE Trans-actions on pattern analysis and machine intelligence 13.4 (1991),pp. 376–380.
[169] Lars Fritzsche. “Ergonomics Risk Assessment with Digital Hu-man Models in Car Assembly: Simulation versus Real Life.”In: Human Factors and Ergonomics in Manufacturing & ServiceIndustries 20.4 (July 1, 2010), pp. 287–299. doi: 10.1002/hfm.20221.
[170] John F. Lockett, Ernst Assmann, Rush Green, Matthew P. Reed,Ulrich Raschke, and Jean-Pierre Verriest. “Digital Human Mod-eling Research and Development User Needs Panel.” In: SAETransactions 114 (2005), pp. 886–890. JSTOR: 44682509.
[171] Lars Fritzsche, Ricardo Jendrusch, Wolfgang Leidholdt, Sebas-tian Bauer, Thomas Jäckel, and Attila Pirger. “IntroducingEma (Editor for Manual Work Activities) – A New Tool forEnhancing Accuracy and Efficiency of Human Simulations inDigital Production Planning.” In: Digital Human Modeling. Ed.by Vincent G. Duffy. Lecture Notes in Computer Science 6777.Springer Berlin Heidelberg, 2011, pp. 272–281.
[172] Lars Hanson, Dan Högberg, Johan S. Carlson, Robert Bohlin,Erik Brolin, Niclas Delfs, Peter M\ a ardberg, Gustafsson Ste-fan, Ali Keyvani, and Ida-Märta Rhen. “IMMA–IntelligentlyMoving Manikins in Automotive Applications.” In: Third In-ternational Summit on Human Simulation (ISHS2014). 2014.
[173] R. Dörner, W. Broll, P. Grimm, and B. Jung. Virtual Und Aug-mented Reality (VR / AR): Grundlagen Und Methoden Der VirtuellenUnd Augmentierten Realität. Springer Vieweg, 2013. 351 pp. url:https://www.springer.com/de/book/9783642289033.
[174] Michael M. Otto, Philipp Agethen, Florian Geiselhart, MichaelRietzler, Felix Gaisbauer, and Enrico Rukzio. “Presenting aHolistic Framework for Scalable, Marker-Less Motion Captur-ing: Skeletal Tracking Performance Analysis, Sensor FusionAlgorithms and Usage in Automotive Industry.” In: Journal ofVirtual Reality and Broadcasting, JVRB 3.13 (2016), p. 10. doi:10.20385/1860-2037/13.2016.3.
bibliography 267
[175] Michael Otto, Philipp Agethen, Florian Geiselhart, and EnricoRukzio. “Towards Ubiquitous Tracking: Presenting a Scalable,Markerless Tracking Approach Using Multiple Depth Cam-eras.” In: Proceedings of the EuroVR 2015. EuroVR 2015. Lecco,Italy: European Association for Virtual Reality and AugmentedReality, 2015, p. 7. url: https://www.eurovr-association.org/wp-content/uploads/2019/11/06112017_Proceedings-
1.pdf.
[176] Florian Geiselhart, Michael Otto, and Enrico Rukzio. “On theUse of Multi-Depth-Camera Based Motion Tracking Systemsin Production Planning Environments.” In: Proceedings of the48th CIRP Conference on Manufacturing Systems. CIRP CMS2015. Vol. 41. CIRP CMS. Ischia, Italy: Elsevier, 2015, pp. 759–764. doi: 10.1016/j.procir.2015.12.088.
[177] Michael Otto, Eva Lampen, Felix Auris, Felix Gaisbauer, andEnrico Rukzio. “Applicability Evaluation of Kinect for EAWSErgonomic Assessments.” In: Proceedings of the 52nd CIRP Con-ference on Manufacturing Systems. CIRP CMS 2019. Vol. 81. Ljubl-jana, Slovenia, 2019, pp. 781–784. doi: 10.1016/j.procir.2019.03.194.
[178] Zhidong Xiao, Hammadi Nait-Charif, and Jian J. Zhang. “Au-tomatic Estimation of Skeletal Motion from Optical MotionCapture Data.” In: Motion in Games. International Workshopon Motion in Games. Springer, Berlin, Heidelberg, June 14,2008, pp. 144–153. doi: 10.1007/978-3-540-89220-5_15.
[179] Huiyu Zhou and Huosheng Hu. “Human Motion Trackingfor Rehabilitation—A Survey.” In: Biomedical Signal Processingand Control 3.1 (2008), pp. 1–18.
[180] Gary Bishop, Greg Welch, and B. Danette Allen. “Tracking:Beyond 15 Minutes of Thought.” In: SIGGRAPH Course Pack11 (2001).
[181] Sarvenaz Salehi, Gabriele Bleser, Norbert Schmitz, and Di-dier Stricker. “A Low-Cost and Light-Weight Motion Track-ing Suit.” In: 2013 IEEE 10th International Conference on Ubiq-uitous Intelligence and Computing and 2013 IEEE 10th Interna-tional Conference on Autonomic and Trusted Computing. IEEE,2013, pp. 474–479.
[182] Francesco Caputo, Alessandro Greco, D‘Amato Egidio, Imma-colata Notaro, and Stefania Spada. “IMU-Based Motion Cap-ture Wearable System for Ergonomic Assessment in IndustrialEnvironment.” In: International Conference on Applied HumanFactors and Ergonomics. Springer, 2018, pp. 215–225.
268 bibliography
[183] Daniel Roetenberg, Henk Luinge, and Per Slycke. “Xsens MVN:Full 6DOF Human Motion Tracking Using Miniature InertialSensors.” In: Xsens Motion Technologies BV, Tech. Rep 1 (2009).
[184] Suya You, Ulrich Neumann, and Ronald Azuma. “Hybrid In-ertial and Vision Tracking for Augmented Reality Registra-tion.” In: Proceedings IEEE Virtual Reality (Cat. No. 99CB36316).IEEE, 1999, pp. 260–267.
[185] Advanced Realtime Tracking GmbH. Motion Capture - Markers& Targets - Products - ART Advanced Realtime Tracking. 2019.url: https://ar-tracking.com/products/markers-targets/motion-capture/#c328 (visited on 05/20/2019).
[186] Advanced Realtime Tracking GmbH. DTrack2 User Manual v2.9.0:System User Manual ARTtrack, TRACKPACK & DTrack. 2013.
[187] Jamie Shotton, Ross Girshick, Andrew Fitzgibbon, Toby Sharp,Mat Cook, Mark Finocchio, Richard Moore, Pushmeet Kohli,Antonio Criminisi, Alex Kipman, and Andrew Blake. “Effi-cient Human Pose Estimation from Single Depth Images.” In:Trans. PAMI (2012). doi: 10.1109/TPAMI.2012.241.
[188] Jamie Shotton, Toby Sharp, Alex Kipman, Andrew Fitzgib-bon, Mark Finocchio, Andrew Blake, Mat Cook, and RichardMoore. “Real-Time Human Pose Recognition in Parts fromSingle Depth Images.” In: Communications of the ACM 56.1(2013), pp. 116–124. doi: 10.1145/2398356.2398381.
[189] Antonio Sementille, Luís Escaramuzi Lourenço, José RemoBrega, and Ildeberto Rodello. “A Motion Capture System Us-ing Passive Markers.” In: Jan. 1, 2004, pp. 440–447. doi: 10.1145/1044588.1044684.
[190] Zhe Cao, Tomas Simon, Shih-En Wei, and Yaser Sheikh. Real-time Multi-Person 2d Pose Estimation Using Part Affinity Fields.2016. arXiv: 1611.08050.
[191] N. Hasler, B. Rosenhahn, T. Thormahlen, M. Wand, J. Gall,and H.-P. Seidel. “Markerless Motion Capture with Unsyn-chronized Moving Cameras.” In: Computer Vision and PatternRecognition, 2009. CVPR 2009. IEEE Conference On. 2009, pp. 224–231. doi: 10.1109/CVPR.2009.5206859.
[192] Nils Hasler, Carsten Stoll, Martin Sunkel, Bodo Rosenhahn,and H.-P. Seidel. “A Statistical Model of Human Pose andBody Shape.” In: Computer Graphics Forum. Vol. 28. Wiley On-line Library, 2009, pp. 337–346.
[193] Klaus D. Tönnies. Grundlagen Der Bildverarbeitung. Informatik :Bildverarbeitung. München and Boston [u.a.]: Pearson Studium,2005.
bibliography 269
[194] Marcin Grzegorzek, Christian Theobalt, Reinhard Koch, andAndreas Kolb, eds. Time-of-Flight and Depth Imaging. Sensors,Algorithms, and Applications. Red. by David Hutchison, TakeoKanade, Josef Kittler, Jon M. Kleinberg, Friedemann Mattern,John C. Mitchell, Moni Naor, Oscar Nierstrasz, C. Pandu Ran-gan, Bernhard Steffen, Madhu Sudan, Demetri Terzopoulos,Doug Tygar, Moshe Y. Vardi, and Gerhard Weikum. Vol. 8200.Lecture Notes in Computer Science. Berlin, Heidelberg: SpringerBerlin Heidelberg, 2013. url: https://doi.org/10.1007/978-3-642-44964-2.
[195] J. Sell and P. O’Connor. “The Xbox One System on a Chipand Kinect Sensor.” In: Micro, IEEE 34.2 (Mar. 2014), pp. 44–53. doi: 10.1109/MM.2014.9.
[196] Microsoft. Kinect for Windows Features. 2015. url: http : / /
www.microsoft.com/en-us/kinectforwindows/meetkinect/
features.aspx.
[197] Zhengyou Zhang. “Microsoft Kinect Sensor and Its Effect.”In: MultiMedia, IEEE 19.2 (2012), pp. 4–10. doi: 10.1109/MMUL.2012.24.
[198] Chen Qian, Xiao Sun, Yichen Wei, Xiaoou Tang, and Jian Sun.“Realtime and Robust Hand Tracking from Depth.” In: Pro-ceedings of the IEEE Conference on Computer Vision and PatternRecognition. 2014, pp. 1106–1113.
[199] Christian Schönauer and Hannes Kaufmann. “Wide Area Mo-tion Tracking Using Consumer Hardware.” In: The Interna-tional Journal of Virtual Reality 12.1 (2013), pp. 1–9. url: http://publik.tuwien.ac.at/files/PubDat%E2%80%97%20219247.
pdf.
[200] M. Martínez-Zarzuela, M. Pedraza-Hueso, F. J. Díaz-Pernas,D. González-Ortega, and M. Antón-Rodríguez. “Indoor 3DVideo Monitoring Using Multiple Kinect Depth-Cameras.” In:The International Journal of Multimedia And Its Applications 1
(Mar. 12, 2014), pp. 61–77. doi: 10.5121/ijma.2014.6105.
[201] Andy Wilson. RoomAlive Toolkit. GitHub, 2015. url: https://github.com/Kinect/RoomAliveToolkit (visited on 01/11/2020).
[202] Michael Rietzler, Florian Geiselhart, Janek Thomas, and En-rico Rukzio. “FusionKit: A Generic Toolkit for Skeleton, Markerand Rigid-Body Tracking.” In: Proceedings of the 8th ACM SIGCHISymposium on Engineering Interactive Computing Systems. EICS’16. New York, NY, USA: ACM, 2016, pp. 73–84. doi: 10.1145/2933242.2933263.

270 bibliography
[203] Felix Leif Keppmann, Tobias Käfer, Steffen Stadtmüller, RenéSchubotz, and Andreas Harth. “High Performance LinkedData Processing for Virtual Reality Environments.” In: Pro-ceedings of the ISWC 2014 Posters & Demonstrations Track a Trackwithin the 13th International Semantic Web Conference, ISWC 2014,Riva Del Garda, Italy, October 21, 2014. 2014, pp. 193–196. url:http://ceur-ws.org/Vol-1272/paper%E2%80%97%20149.pdf.
[204] D. Alex Butler, Shahram Izadi, Otmar Hilliges, David Molyneaux,Steve Hodges, and David Kim. “Shake’n’sense: Reducing In-terference for Overlapping Structured Light Depth Cameras.”In: Proceedings of the SIGCHI Conference on Human Factors inComputing Systems. CHI ’12. New York, NY, USA: ACM, 2012,pp. 1933–1936. doi: 10.1145/2207676.2208335.
[205] F. Faion, P. Ruoff, A. Zea, and U.D. Hanebeck. “RecursiveBayesian Calibration of Depth Sensors with Non-OverlappingViews.” In: 2012 15th International Conference on Information Fu-sion (FUSION). 2012 15th International Conference on Infor-mation Fusion (FUSION). 2012, pp. 757–762.
[206] A. Maimone and H. Fuchs. “Encumbrance-Free TelepresenceSystem with Real-Time 3D Capture and Display Using Com-modity Depth Cameras.” In: 2011 10th IEEE International Sym-posium on Mixed and Augmented Reality (ISMAR). 2011 10thIEEE International Symposium on Mixed and Augmented Re-ality (ISMAR). 2011, pp. 137–146. doi: 10.1109/ISMAR.2011.6092379.
[207] Andrew Wilson and Hrvoje Benko. “Combining Multiple DepthCameras and Projectors for Interactions on, above and be-tween Surfaces.” In: Proceedings of the 23nd Annual ACM Sym-posium on User Interface Software and Technology. UIST ’10. NewYork, NY, USA: ACM, 2010, pp. 273–282. doi: 10.1145/1866029.1866073.
[208] Kai Berger, Kai Ruhl, Christian Brümmer, Yannic Schröder,Alexander Scholz, and Marcus Magnor. “Markerless MotionCapture Using Multiple Color-Depth Sensors.” In: Proc. Vision,Modeling and Visualization (VMV) 2011. Oct. 2011, pp. 317–324.
[209] Licong Zhang, Jürgen Sturm, Daniel Cremers, and DongheuiLee. “Real-Time Human Motion Tracking Using Multiple DepthCameras.” In: Intelligent Robots and Systems (IROS), 2012 IEEE/RSJInternational Conference On. IEEE, 2012, pp. 2389–2395. doi: 10.1109/IROS.2012.6385968.
[210] Szymon Rusinkiewicz and Marc Levoy. “Efficient Variants ofthe ICP Algorithm.” In: Proceedings of the Third Intl. Conf. on3D Digital Imaging and Modeling. 2001, pp. 145–152. doi: 10.1109/IM.2001.924423.
bibliography 271
[211] F. Pomerleau, S. Magnenat, F. Colas, Ming Liu, and R. Sieg-wart. “Tracking a Depth Camera: Parameter Exploration forFast ICP.” In: 2011 IEEE/RSJ International Conference on Intelli-gent Robots and Systems (IROS). 2011, pp. 3824–3829. doi: 10.1109/IROS.2011.6094861.
[212] Stylianos Asteriadis, Anargyros Chatzitofis, Dimitrios Zarpalas,Dimitrios S. Alexiadis, and Petros Daras. “Estimating HumanMotion from Multiple Kinect Sensors.” In: Proceedings of the6th International Conference on Computer Vision / Computer Graph-ics Collaboration Techniques and Applications. MIRAGE ’13. NewYork, NY, USA: ACM, 2013, 3:1–3:6. doi: 10.1145/2466715.2466727.
[213] Seongmin Baek and Myunggyu Kim. “Dance Experience Sys-tem Using Multiple Kinects.” In: International Journal of Fu-ture Computer and Communication 4.1 (2015), pp. 45–49. doi:10.7763/IJFCC.2015.V4.353.
[214] S. Kaenchan, P. Mongkolnam, B. Watanapa, and S. Sathien-pong. “Automatic Multiple Kinect Cameras Setting for Sim-ple Walking Posture Analysis.” In: 2013 International ComputerScience and Engineering Conference (ICSEC). 2013 InternationalComputer Science and Engineering Conference (ICSEC). Sept.2013, pp. 245–249. doi: 10.1109/ICSEC.2013.6694787.
[215] Maurizio Caon, Yong Yue, Julien Tscherrig, Elena Mugellini,and Omar Abou Khaled. “Context-Aware 3D Gesture Inter-action Based on Multiple Kinects.” In: AMBIENT 2011, TheFirst International Conference on Ambient Computing, Ap-plications, Services and Technologies. Oct. 23, 2011, pp. 7–12.url: http://citeseerx.ist.psu.edu/viewdoc/download?doi=10.1.1.679.1588&rep=rep1&type=pdf.
[216] N. A. Azis, H. Choi, and Y. Iraqi. “Substitutive Skeleton Fu-sion for Human Action Recognition.” In: 2015 InternationalConference on Big Data and Smart Computing (BIGCOMP). 2015
International Conference on Big Data and Smart Computing(BIGCOMP). Feb. 2015, pp. 170–177. doi: 10.1109/35021BIGCOMP.2015.7072828.
[217] A. Kitsikidis, K. Dimitropoulos, S. Douka, and N. Gramma-lidis. “Dance Analysis Using Multiple Kinect Sensors.” In:2014 International Conference on Computer Vision Theory and Ap-plications (VISAPP). 2014 International Conference on Com-puter Vision Theory and Applications (VISAPP). Vol. 2. Jan.2014, pp. 789–795.
[218] Kwok-Yun Yeung, Tsz-Ho Kwok, and Charlie C. L. Wang. “Im-proved Skeleton Tracking by Duplex Kinects: A Practical Ap-proach for Real-Time Applications.” In: Journal of Computing
272 bibliography
and Information Science in Engineering 13.4 (Oct. 16, 2013). doi:10.1115/1.4025404.
[219] Jasper Brekelmans. Multi Sensor Alpha. Brekel - AffordableMotion Capture Tools. url: https : / / brekel . com / multi -
sensor/ (visited on 05/21/2020).
[220] Q. Wang, G. Kurillo, F. Ofli, and R. Bajcsy. “Evaluation of PoseTracking Accuracy in the First and Second Generations of Mi-crosoft Kinect.” In: 2015 International Conference on HealthcareInformatics. 2015 International Conference on Healthcare Infor-matics. Oct. 2015, pp. 380–389. doi: 10.1109/ICHI.2015.54.
[221] L. Yang, L. Zhang, H. Dong, A. Alelaiwi, and A. E. Saddik.“Evaluating and Improving the Depth Accuracy of Kinect forWindows V2.” In: IEEE Sensors Journal 15.8 (Aug. 2015), pp. 4275–4285. doi: 10.1109/JSEN.2015.2416651.
[222] S. Obdrzalek, G. Kurillo, F. Ofli, R. Bajcsy, E. Seto, H. Jimison,and M. Pavel. “Accuracy and Robustness of Kinect Pose Es-timation in the Context of Coaching of Elderly Population.”In: 2012 Annual International Conference of the IEEE Engineeringin Medicine and Biology Society (EMBC). 2012 Annual Interna-tional Conference of the IEEE Engineering in Medicine andBiology Society (EMBC). 2012, pp. 1188–1193. doi: 10.1109/EMBC.2012.6346149.
[223] Karen Otte, Bastian Kayser, Sebastian Mansow-Model, JuliusVerrel, Friedemann Paul, Alexander U. Brandt, and Tanja Schmitz-Hübsch. “Accuracy and Reliability of the Kinect Version 2 forClinical Measurement of Motor Function.” In: PloS one 11.11
(2016), e0166532.
[224] Rudolph Emil Kalman. “A New Approach to Linear Filteringand Prediction Problems.” In: Journal of basic Engineering 82.1(1960), pp. 35–45.
[225] Ari Shapiro, Andrew Feng, Ruizhe Wang, Hao Li, Mark Bolas,Gerard Medioni, and Evan Suma. “Rapid Avatar Capture andSimulation Using Commodity Depth Sensors.” In: ComputerAnimation and Virtual Worlds 25.3-4 (2014), pp. 201–211. doi:10.1002/cav.1579.
[226] Hao Li, Etienne Vouga, Anton Gudym, Linjie Luo, Jonathan T.Barron, and Gleb Gusev. “3D Self-Portraits.” In: ACM Trans.Graph. 32.6 (Nov. 2013), 187:1–187:9. doi: 10.1145/2508363.2508407.
[227] T. Zhao, S. Li, K. N. Ngan, and F. Wu. “3-D Reconstruction ofHuman Body Shape From a Single Commodity Depth Cam-era.” In: IEEE Transactions on Multimedia 21.1 (Jan. 2019), pp. 114–123. doi: 10.1109/TMM.2018.2844087.
bibliography 273
[228] Konstantina Kilteni, Raphaela Groten, and Mel Slater. “TheSense of Embodiment in Virtual Reality.” In: Presence: Teleoper-ators and Virtual Environments 21.4 (2012), pp. 373–387.
[229] H. Haggag, M. Hossny, S. Nahavandi, and D. Creighton. “RealTime Ergonomic Assessment for Assembly Operations UsingKinect.” In: 2013 UKSim 15th International Conference on Com-puter Modelling and Simulation (UKSim). 2013 UKSim 15th In-ternational Conference on Computer Modelling and Simula-tion (UKSim). Apr. 2013, pp. 495–500. doi: 10.1109/UKSim.2013.105.
[230] Marco Bortolini, Mauro Gamberi, Francesco Pilati, and Al-berto Regattieri. “Automatic Assessment of the ErgonomicRisk for Manual Manufacturing and Assembly Activities throughOptical Motion Capture Technology.” In: Procedia CIRP. 51stCIRP Conference on Manufacturing Systems 72 (Jan. 1, 2018),pp. 81–86. doi: 10.1016/j.procir.2018.03.198.
[231] Lynn McAtamney and E. Nigel Corlett. “RULA: A SurveyMethod for the Investigation of Work-Related Upper LimbDisorders.” In: Applied ergonomics 24.2 (1993), pp. 91–99.
[232] Sue Hignett and Lynn McAtamney. “Rapid Entire Body As-sessment (REBA).” In: Applied ergonomics 31.2 (2000), pp. 201–205.
[233] National Institute for Occupational Safety and Health Divi-sion of Biomedical and Behavioral Science NIOSH. Work Prac-tices Guide for Manual Lifting. Cincinnati, OH: U.S. Dept. ofHealth and Human Services, Public Health Service, Centersfor Disease Control, National Institute for Occupational Safetyand Health, Division of Biomedical and Behavioral Science,1981. 183 pp.
[234] E. OCCHIPINTI. “OCRA: A Concise Index for the Assess-ment of Exposure to Repetitive Movements of the Upper Limbs.”In: Ergonomics 41.9 (Sept. 1, 1998), pp. 1290–1311. doi: 10 .
1080/001401398186315.
[235] K. Schaub and G. Winter. “Design Check. A screening methodto assess physical stress.” In: Der Orthopade 31.10 (Oct. 2002),pp. 987–996. doi: 10.1007/s00132-002-0353-6. pmid: 12376873.
[236] Peter van der Meulen and Andreas Seidl. “Ramsis – The Lead-ing Cad Tool for Ergonomic Analysis of Vehicles.” In: DigitalHuman Modeling. Ed. by Vincent G. Duffy. Lecture Notes inComputer Science. Springer Berlin Heidelberg, 2007, pp. 1008–1017.
274 bibliography
[237] Karlheinz G. Schaub, Jens Mühlstedt, Benjamin Illmann, Se-bastian Bauer, Lars Fritzsche, Torsten Wagner, Angelika C.Bullinger-Hoffmann, and Ralph Bruder. “Ergonomic Assess-ment of Automotive Assembly Tasks with Digital Human Mod-elling and the ‘Ergonomics Assessment Worksheet’ (EAWS).”In: International Journal of Human Factors Modelling and Simu-lation 3.3-4 (Jan. 1, 2012), pp. 398–426. doi: 10.1504/IJHFMS.2012.051581.
[238] Pierre Plantard, Antoine Muller, Charles Pontonnier, GeorgesDumont, Hubert P. H. Shum, and Franck Multon. “InverseDynamics Based on Occlusion-Resistant Kinect Data: Is It Us-able for Ergonomics?” In: International Journal of Industrial Er-gonomics 61 (Sept. 2017), pp. 71–80. doi: 10.1016/j.ergon.2017.05.010.
[239] Michael Otto, Eva Lampen, Philipp Agethen, Gabriel Zach-mann, and Enrico Rukzio. “Using Large-Scale AugmentedFloor Surfaces for Industrial Applications and Evaluation onPerceived Sizes.” In: Personal and ubiquitous computing, PAUC.Theme Issue on Pervasive Displays 2020 (2020), p. 28. doi:10.1007/s00779-020-01433-z.
[240] Peter Peltonen, Esko Kurvinen, Antti Salovaara, Giulio Jacucci,Tommi Ilmonen, John Evans, Antti Oulasvirta, and Petri Saarikko.“It’s Mine, Don’t Touch!: Interactions at a Large Multi-TouchDisplay in a City Centre.” In: Proceedings of the SIGCHI Con-ference on Human Factors in Computing Systems. ACM, 2008,pp. 1285–1294.
[241] Mary Czerwinski, Greg Smith, Tim Regan, Brian Meyers, GeorgeG. Robertson, and Gary K. Starkweather. “Toward Character-izing the Productivity Benefits of Very Large Displays.” In:Interact. Vol. 3. 2003, pp. 9–16.
[242] Christopher Andrews, Alex Endert, Beth Yost, and Chris North.“Information Visualization on Large, High-Resolution Displays:Issues, Challenges, and Opportunities.” In: Information Visual-ization 10.4 (2011), pp. 341–355.
[243] Philipp Agethen, Michael Otto, Stefan Mengel, and EnricoRukzio. “Using Marker-Less Motion Capture Systems for WalkPath Analysis in Paced Assembly Flow Lines.” In: Proceedingsof the 6th CIRP Conference on Learning Factories. CIRP CLF 2016.Vol. 54. 2016, pp. 152–157. doi: 10.1016/j.procir.2016.04.125.
[244] Philipp Agethen, Michael Otto, Felix Gaisbauer, and EnricoRukzio. “Presenting a Novel Motion Capture-Based Approachfor Walk Path Segmentation and Drift Analysis in Manual As-sembly.” In: Proceedings of the Sixth International Conference onChangeable, Agile, Reconfigurable and Virtual Production. CIRP
bibliography 275
CARV 2016. Vol. 52. CIRP CARV 2016. Jan. 1, 2016, pp. 286–291. doi: 10.1016/j.procir.2016.07.048.
[245] Michael Otto, Eva Lampen, Philipp Agethen, Mareike Lan-gohr, Gerald Masan, and Enrico Rukzio. “Evaluation on Per-ceived Sizes Using Large-Scale Augmented Floor Visualiza-tion Devices.” In: Proceedings of the 8th ACM International Sym-posium on Pervasive Displays. ACM PerDis 2019 (Palermo, Italy).Palermo, Italy: Association for Computing Machinery, June 12,2019, pp. 1–7. doi: 10.1145/3321335.3324951.
[246] Mark Weiser. “The Computer for the 21st Century.” In: Scien-tific american 265.3 (1991), pp. 94–105.
[247] Lucia Terrenghi, Aaron Quigley, and Alan Dix. “A Taxon-omy for and Analysis of Multi-Person-Display Ecosystems.”In: Personal and Ubiquitous Computing 13.8 (Nov. 1, 2009), p. 583.doi: 10.1007/s00779-009-0244-5.
[248] Lars Lischke, Jürgen Grüninger, Khalil Klouche, Albrecht Schmidt,Philipp Slusallek, and Giulio Jacucci. “Interaction Techniquesfor Wall-Sized Screens.” In: Proceedings of the 2015 InternationalConference on Interactive Tabletops & Surfaces. ITS ’15. New York,NY, USA: ACM, 2015, pp. 501–504. doi: 10.1145/2817721.2835071.
[249] Fernando Garcia-Sanjuan, Javier Jaen, and Vicente Nacher. “To-ward a General Conceptualization of Multi-Display Environ-ments.” In: Frontiers 3.20 (2016), p. 1.
[250] Yvonne Rogers and Siân Lindley. “Collaborating around Ver-tical and Horizontal Large Interactive Displays: Which WayIs Best?” In: Interacting with Computers 16.6 (2004), pp. 1133–1152.
[251] Xiaojun Bi and Ravin Balakrishnan. “Comparing Usage of aLarge High-Resolution Display to Single or Dual Desktop Dis-plays for Daily Work.” In: Proceedings of the SIGCHI Conferenceon Human Factors in Computing Systems. ACM, 2009, pp. 1005–1014.
[252] Lars Lischke, Sven Mayer, Katrin Wolf, Niels Henze, AlbrechtSchmidt, Svenja Leifert, and Harald Reiterer. “Using Space:Effect of Display Size on Users’ Search Performance.” In: Pro-ceedings of the 33rd Annual ACM Conference Extended Abstractson Human Factors in Computing Systems. CHI EA ’15. NewYork, NY, USA: ACM, 2015, pp. 1845–1850. doi: 10 . 1145 /
2702613.2732845.
[253] Lars Lischke, Sven Mayer, Jan Hoffmann, Philipp Kratzer, StephanRoth, Katrin Wolf, and Pawe\ l Woniak. “Interaction Tech-niques for Window Management on Large High-ResolutionDisplays.” In: Proceedings of the 16th International Conference

276 bibliography
on Mobile and Ubiquitous Multimedia. MUM ’17. New York,NY, USA: ACM, 2017, pp. 241–247. doi: 10.1145/3152832.3152852.
[254] Christopher Andrews, Alex Endert, and Chris North. “Spaceto Think: Large High-Resolution Displays for Sensemaking.”In: Proceedings of the SIGCHI Conference on Human Factors inComputing Systems. ACM, 2010, pp. 55–64.
[255] Daniel Vogel and Ravin Balakrishnan. “Distant Freehand Point-ing and Clicking on Very Large, High Resolution Displays.”In: Proceedings of the 18th Annual ACM Symposium on User In-terface Software and Technology. ACM, 2005, pp. 33–42.
[256] Shahzad Malik, Abhishek Ranjan, and Ravin Balakrishnan.“Interacting with Large Displays from a Distance with Vision-Tracked Multi-Finger Gestural Input.” In: Proceedings of the18th Annual ACM Symposium on User Interface Software andTechnology. ACM, 2005, pp. 43–52.
[257] Nobuchika Sakata, Fumihiro Sato, Tomu Tominaga, and Yoshi-nori Hijikata. “Extension of Smartphone by Wearable Input/Out-put Interface with Floor Projection.” In: International Confer-ence on Collaboration Technologies. Springer, 2017, pp. 168–181.
[258] Carolina Cruz-Neira, Daniel J. Sandin, and Thomas A. De-Fanti. “Surround-Screen Projection-Based Virtual Reality: TheDesign and Implementation of the CAVE.” In: Proceedings ofthe 20th Annual Conference on Computer Graphics and InteractiveTechniques. ACM, 1993, pp. 135–142.
[259] Claudio Pinhanez. “The Everywhere Displays Projector: A De-vice to Create Ubiquitous Graphical Interfaces.” In: Ubicomp2001: Ubiquitous Computing. Springer, 2001, pp. 315–331. url:https://doi.org/10.1007/3-540-45427-6_27 (visited on06/12/2020).
[260] Thomas Augsten, Konstantin Kaefer, René Meusel, CarolineFetzer, Dorian Kanitz, Thomas Stoff, Torsten Becker, ChristianHolz, and Patrick Baudisch. “Multitoe: High-Precision Inter-action with Back-Projected Floors Based on High-ResolutionMulti-Touch Input.” In: Proceedings of the 23nd Annual ACMSymposium on User Interface Software and Technology. ACM, 2010,pp. 209–218. url: https : / / doi . org / 10 . 1145 / 1866029 .
1866064.
[261] Jörg Müller, Dieter Eberle, and Constantin Schmidt. “Base-Lase: An Interactive Focus+Context Laser Floor.” In: Proceed-ings of the 33rd Annual ACM Conference on Human Factors inComputing Systems. CHI ’15. New York, NY, USA: ACM, 2015,pp. 3869–3878. doi: 10.1145/2702123.2702246.
bibliography 277
[262] Nicholas Sheep Dalton. “TapTiles: LED-Based Floor Interac-tion.” In: Proceedings of the 2013 ACM International Conferenceon Interactive Tabletops and Surfaces. ACM, 2013, pp. 165–174.doi: 10.1145/2512349.2512800.
[263] Tobi Delbrück, Adrian M. Whatley, Rodney Douglas, KynanEng, Klaus Hepp, and Paul FMJ Verschure. “A Tactile Lumi-nous Floor for an Interactive Autonomous Space.” In: Roboticsand autonomous systems 55.6 (2007), pp. 433–443. doi: 10.1016/j.robot.2007.01.006.
[264] Jorge D. Camba, Jeff Feng, and Eunsook Kwon. “InteractiveExperiences in Public Spaces: A Novel Floor Display SystemBased on Luminous Modular Units.” In: Hawaii InternationalConference on System Sciences 2018. Hawaii International Con-ference on System Sciences 2018. Jan. 3, 2018. doi: 10.24251/HICSS.2018.040.
[265] Jo Vermeulen, Kris Luyten, Karin Coninx, Nicolai Marquardt,and Jon Bird. “Proxemic Flow: Dynamic Peripheral Floor Visu-alizations for Revealing and Mediating Large Surface Interac-tions.” In: Human-Computer Interaction. Springer, 2015, pp. 264–281.
[266] Kaj Grønbaek, Ole S. Iversen, Karen Johanne Kortbek, Kas-par Rosengreen Nielsen, and Louise Aagaard. “IGameFloor:A Platform for Co-Located Collaborative Games.” In: Proceed-ings of the International Conference on Advances in Computer En-tertainment Technology. ACE ’07. New York, NY, USA: ACM,2007, pp. 64–71. doi: 10.1145/1255047.1255061.
[267] Juliano M. Franz, Joseph W. Malloch, Derek Reilly, and Vini-cius Sanches. “SpaceHopper: Bounce Your Way to GalacticDomination.” In: Extended Abstracts of the 2018 CHI Confer-ence on Human Factors in Computing Systems. CHI EA ’18. NewYork, NY, USA: ACM, 2018, D211:1–D211:4. doi: 10.1145/3170427.3186509.
[268] Dominik Schmidt, Raf Ramakers, Esben W. Pedersen, JohannesJasper, Sven Köhler, Aileen Pohl, Hannes Rantzsch, AndreasRau, Patrick Schmidt, and Christoph Sterz. “Kickables: Tangi-bles for Feet.” In: Proceedings of the 32nd Annual ACM Con-ference on Human Factors in Computing Systems. ACM, 2014,pp. 3143–3152.
[269] Ben Heller, Terry Senior, and Jon Wheat. “The Smartfloor: ALarge Area Force-Measuring Floor for Investigating DynamicBalance and Motivating Exercise.” In: Procedia engineering 72
(2014), pp. 226–231.
278 bibliography
[270] Marianne Graves Petersen, Peter Gall Krogh, Martin Ludvigsen,and Andreas Lykke-Olesen. “Floor Interaction HCI ReachingNew Ground.” In: CHI’05 Extended Abstracts on Human Factorsin Computing Systems. ACM, 2005, pp. 1717–1720.
[271] Alvin W. Law, Jessica W. Ip, Benjamin V. Peck, Yon Visell, PaulG. Kry, and Jeremy R. Cooperstock. “Multimodal Floor forImmersive Environments.” In: ACM SIGGRAPH 2009 Emerg-ing Technologies. ACM, 2009, p. 16.
[272] Dominik Schmidt, Johannes Frohnhofen, Sven Knebel, FlorianMeinel, Mariya Perchyk, Julian Risch, Jonathan Striebel, Ju-lia Wachtel, and Patrick Baudisch. “Ergonomic Interaction forTouch Floors.” In: Proceedings of the 33rd Annual ACM Confer-ence on Human Factors in Computing Systems. CHI ’15. NewYork, NY, USA: ACM, 2015, pp. 3879–3888. doi: 10 . 1145 /
2702123.2702254.
[273] Leyard Inc. Leyard TWA Series. Leyard Inc. url: https : / /
www . leyardeurope . eu / en / products / led - video - walls /
indoor- led- video- walls/leyard- twa- series (visited on09/24/2020).
[274] Anastasia Bezerianos and Petra Isenberg. Perceptual Affordancesof Wall-Sized Displays for Visualization Applications. EuropeanUnion, 2013.
[275] William Epstein. “Attitudes of Judgment and the Size-DistanceInvariance Hypothesis.” In: Journal of experimental Psychology66.1 (1963), p. 78.
[276] William Epstein and Krishan D. Broota. “Attitude of Judg-ment and Reaction Time in Estimation of Size at a Distance.”In: Perception & Psychophysics 18.3 (1975), pp. 201–204.
[277] Mark Wagner. “The Metric of Visual Space.” In: Perception &psychophysics 38.6 (1985), pp. 483–495.
[278] Jack M. Loomis and Joshua M. Knapp. “Visual Perception ofEgocentric Distance in Real and Virtual Environments.” In:Virtual and adaptive environments 11 (2003), pp. 21–46.
[279] Rebekka S. Renner, Boris M. Velichkovsky, and Jens R. Helmert.“The Perception of Egocentric Distances in Virtual Environ-ments - A Review.” In: ACM Comput. Surv. 46.2 (Dec. 2013),23:1–23:40. doi: 10.1145/2543581.2543590.
[280] Jonathan W. Kelly, Lucia A. Cherep, and Zachary D. Siegel.“Perceived Space in the HTC Vive.” In: ACM Trans. Appl. Per-cept. 15.1 (July 2017), 2:1–2:16. doi: 10.1145/3106155.
[281] J. Scott Armstrong and Fred Collopy. “Error Measures forGeneralizing about Forecasting Methods: Empirical Compar-isons.” In: International journal of forecasting 8.1 (1992), pp. 69–80.

bibliography 279
[282] J. Martin Bland and Douglas G. Altman. “Measuring Agree-ment in Method Comparison Studies.” In: Statistical methodsin medical research 8.2 (1999), pp. 135–160.
[283] F. Doil, W. Schreiber, T. Alt, and C. Patron. “Augmented Re-ality for Manufacturing Planning.” In: Proceedings of the Work-shop on Virtual Environments 2003. EGVE ’03. New York, NY,USA: ACM, 2003, pp. 71–76. doi: 10.1145/769953.769962.
[284] K. Pentenrieder, C. Bade, F. Doil, and P. Meier. “AugmentedReality-Based Factory Planning - an Application Tailored toIndustrial Needs.” In: 6th IEEE and ACM International Sympo-sium on Mixed and Augmented Reality, 2007. ISMAR 2007. 6thIEEE and ACM International Symposium on Mixed and Aug-mented Reality, 2007. ISMAR 2007. Nov. 2007, pp. 31–42. doi:10.1109/ISMAR.2007.4538822.
[285] Michele Fiorentino, Rafael Radkowski, Antonio Boccaccio, andAntonio Emmanuele Uva. “Magic Mirror Interface for Aug-mented Reality Maintenance: An Automotive Case Study.” In:Proceedings of the International Working Conference on AdvancedVisual Interfaces. AVI ’16. New York, NY, USA: ACM, 2016,pp. 160–167. doi: 10.1145/2909132.2909268.
[286] Pierre Fite-Georgel. “Is There a Reality in Industrial AugmentedReality?” In: 2011 10th Ieee International Symposium on Mixedand Augmented Reality. IEEE, 2011, pp. 201–210.
[287] Oliver Bimber and Ramesh Raskar. Spatial Augmented Reality:Merging Real and Virtual Worlds. CRC press, 2005. url: https://web.media.mit.edu/~raskar/book/BimberRaskarAugmentedRealityBook.
pdf (visited on 06/06/2020).
[288] Antonio E. Uva, Michele Gattullo, Vito M. Manghisi, DanieleSpagnulo, Giuseppe L. Cascella, and Michele Fiorentino. “Eval-uating the Effectiveness of Spatial Augmented Reality in SmartManufacturing: A Solution for Manual Working Stations.” In:The International Journal of Advanced Manufacturing Technology94.1-4 (Jan. 1, 2018), pp. 509–521. doi: 10.1007/s00170-017-0846-4.
[289] theAreaFB. What Is Projection or Spatial Augmented Reality? AREA.Nov. 18, 2017. url: https://thearea.org/projection-augmented-reality/ (visited on 02/01/2020).
[290] U. Neumann and A. Majoros. “Cognitive, Performance, andSystems Issues for Augmented Reality Applications in Man-ufacturing and Maintenance.” In: Proceedings of Virtual RealityAnnual International Symposium. Virtual Reality Annual Inter-national Symposium. Mar. 1998, pp. 4–11. doi: 10.1109/VRAIS.1998.658416.
280 bibliography
[291] L. De Marchi, A. Ceruti, N. Testoni, A. Marzani, and A. Liv-erani. “Use of Augmented Reality in Aircraft Maintenance Op-erations.” In: 9064 (Mar. 1, 2014), p. 906412. doi: 10.1117/12.2044889.
[292] Ernst Kruijff, J. Edward Swan, and Steven Feiner. “PerceptualIssues in Augmented Reality Revisited.” In: 2010 IEEE Inter-national Symposium on Mixed and Augmented Reality. 2010 IEEEInternational Symposium on Mixed and Augmented Reality.Oct. 2010, pp. 3–12. doi: 10.1109/ISMAR.2010.5643530.
[293] D. W. F. Van Krevelen and Ronald Poelman. “A Survey ofAugmented Reality Technologies, Applications and Limita-tions.” In: International journal of virtual reality 9.2 (2010), p. 1.
[294] X. Wang, S. K. Ong, and A. Y. C. Nee. “A Comprehensive Sur-vey of Augmented Reality Assembly Research.” In: Advancesin Manufacturing 4.1 (Mar. 1, 2016), pp. 1–22. doi: 10.1007/s40436-015-0131-4.
[295] Paula Fraga-Lamas, Tiago M. Fernández-Caramés, Óscar Blanco-Novoa, and Miguel A. Vilar-Montesinos. “A Review on Indus-trial Augmented Reality Systems for the Industry 4.0 Ship-yard.” In: IEEE Access 6 (2018), pp. 13358–13375.
[296] A. Y. C. Nee, S. K. Ong, G. Chryssolouris, and D. Mourtzis.“Augmented Reality Applications in Design and Manufactur-ing.” In: CIRP Annals - Manufacturing Technology 61.2 (2012),pp. 657–679. doi: 10.1016/j.cirp.2012.05.010.
[297] Björn Bliese. “Ein gebrauchstaugliches Augmented Reality-System für geometrische Analysen in der Produktentstehung.”In: (2019). doi: http://dx.doi.org/10.18419/opus-10271.
[298] Pierre Wellner. “DigitalDesk Calculator: Tangible Manipula-tion on a Desk Top Display.” In: Proceedings of the 4th An-nual ACM Symposium on User Interface Software and Tech-nology. ACM, 1991. doi: 10.1145/120782.120785.
[299] Pierre David Wellner. “Interacting with Paper on the Digi-talDesk.” In: Communications of the ACM. 1994. doi: 10 .
1145/159544.159630.
[300] Volkswagen AG. Volkswagen Group Use of Spatial AugmentedReality in the Automotive Industry. Nov. 14, 2016. url: http:/ / www . volkswagenag . com / content / vwcorp / content / en /
innovation/Virtual_technologies/Use_of_spatial_augmented_
reality _ in _ the _ automotive _ industry . html (visited on11/14/2019).
[301] Jiayi Jin. “Spatial Augmented Reality (SAR) for Museum Learn-ing Merging Augmented Reality Based Features in Educa-tional Space.” In: Museum Management and Curatorship (Aug. 1,2017).
bibliography 281
[302] O. Bimber, F. Coriand, A. Kleppe, E. Bruns, S. Zollmann, andT. Langlotz. “Superimposing Pictorial Artwork with ProjectedImagery.” In: IEEE MultiMedia 12.1 (Jan. 2005), pp. 16–26. doi:10.1109/MMUL.2005.9.
[303] Björn Schwerdtfeger, Daniel Pustka, Andreas Hofhauser, andGudrun Klinker. “Using Laser Projectors for Augmented Re-ality.” In: Proceedings of the 2008 ACM Symposium on VirtualReality Software and Technology. VRST ’08. New York, NY, USA:ACM, 2008, pp. 134–137. doi: 10.1145/1450579.1450608.
[304] Guillaume Cortes, Eric Marchand, Guillaume Brincin, and Ana-tole Lécuyer. “MoSART: Mobile Spatial Augmented Realityfor 3D Interaction With Tangible Objects.” In: Frontiers in Roboticsand AI 5.93 (2018).
[305] Christian Winkler, Julian Seifert, David Dobbelstein, and En-rico Rukzio. “Pervasive Information through Constant Per-sonal Projection: The Ambient Mobile Pervasive Display (AMP-D).” In: Proceedings of the SIGCHI Conference on Human Factorsin Computing Systems. ACM, 2014, pp. 4117–4126.
[306] Ben Piper and Hiroshi Ishii. “CADcast: A Method for Project-ing Spatially Referenced Procedural Instructions.” In: Techni-cal Report, MIT Media Lab (2001).
[307] Antonio Emmanuele Uva, Michele Fiorentino, Michele Gat-tullo, Marco Colaprico, Maria F. de Ruvo, Francescomaria Marino,Gianpaolo F. Trotta, Vito M. Manghisi, Antonio Boccaccio, Vi-toantonio Bevilacqua, and Giuseppe Monno. “Design of a Pro-jective AR Workbench for Manual Working Stations.” In: Aug-mented Reality, Virtual Reality, and Computer Graphics. Ed. byLucio Tommaso De Paolis and Antonio Mongelli. Vol. 9768.Cham: Springer International Publishing, 2016, pp. 358–367.doi: 10.1007/978-3-319-40621-3_25.
[308] Oliver Sand, Sebastian Büttner, Volker Paelke, and CarstenRöcker. “smARt.Assembly – Projection-Based Augmented Re-ality for Supporting Assembly Workers.” In: International Con-ference on Virtual, Augmented and Mixed Reality. SpringerInternational Publishing, July 17, 2016, pp. 643–652. doi: 10.1007/978-3-319-39907-2_61.
[309] Ashish Doshi, Ross T. Smith, Bruce H. Thomas, and Con Bouras.“Use of Projector Based Augmented Reality to Improve Man-ual Spot-Welding Precision and Accuracy for Automotive Man-ufacturing.” In: The International Journal of Advanced Manufac-turing Technology 89.5-8 (Mar. 1, 2017), pp. 1279–1293. doi: 10.1007/s00170-016-9164-5.
282 bibliography
[310] Markus Funk, Thomas Kosch, and Albrecht Schmidt. “Interac-tive Worker Assistance: Comparing the Effects of in-Situ Pro-jection, Head-Mounted Displays, Tablet, and Paper Instruc-tions.” In: Proceedings of the 2016 ACM International Joint Confer-ence on Pervasive and Ubiquitous Computing. ACM, 2016, pp. 934–939.
[311] SeungJun Kim and Anind K. Dey. “Simulated AugmentedReality Windshield Display as a Cognitive Mapping Aid forElder Driver Navigation.” In: Proceedings of the SIGCHI Con-ference on Human Factors in Computing Systems. ACM, 2009,pp. 133–142. doi: 10.1145/1518701.1518724.
[312] Harald Wuest. “Efficient Line and Patch Feature Characteriza-tion and Management for Real-Time Camera Tracking.” PhDthesis. Darmstadt: Technische Universität, Nov. 21, 2008. url:http://tuprints.ulb.tu-darmstadt.de/1190/ (visited on10/17/2020).
[313] Harald Wuest and Didier Stricker. “Tracking of Industrial Ob-jects by Using CAD Models.” In: JVRB - Journal of Virtual Re-ality and Broadcasting 4(2007).1 (2007). doi: 10.20385/1860-2037/4.2007.1.
[314] Peter Keitler and Nicolas Heuser. EXTEND3D Produkte: Werk-licht Pro und Werklicht Video. 2020. url: https://www.extend3d.de/produkte.php (visited on 01/01/2020).
[315] Matt Zeller. HoloLens Hardware Details - Mixed Reality. url:https : / / docs . microsoft . com / en - us / windows / mixed -
reality/hololens-hardware-details (visited on 01/04/2020).
[316] Michele Di Donato, Michele Fiorentino, Antonio E. Uva, MicheleGattullo, and Giuseppe Monno. “Text Legibility for ProjectedAugmented Reality on Industrial Workbenches.” In: Comput-ers in Industry 70 (June 2015), pp. 70–78. doi: 10 . 1016 / j .
compind.2015.02.008.
[317] Rafael Radkowski and Sravya Kanunganti. “Augmented Re-ality System Calibration for Assembly Support with the Mi-crosoft Hololens.” In: ASME 2018 13th International Manufac-turing Science and Engineering Conference. American Society ofMechanical Engineers Digital Collection, 2018.