
The Valuation Approach From An Investment Bank · PDF fileValuation Approach From An...
61
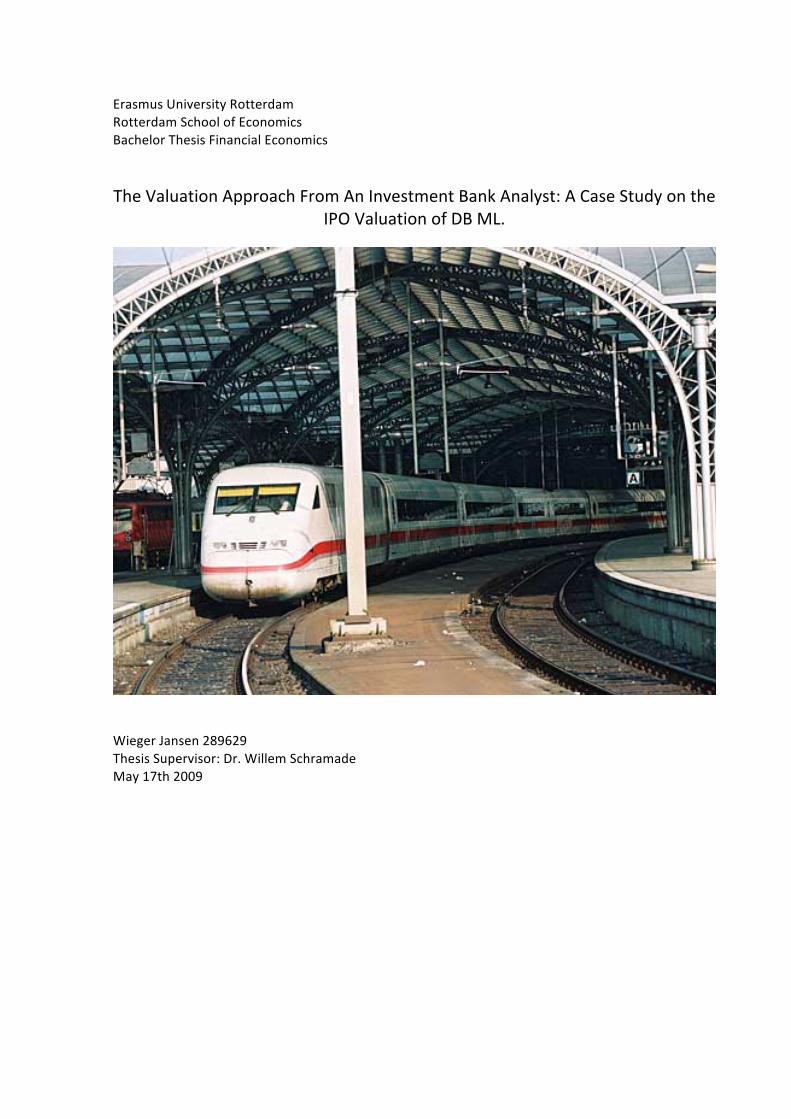
Erasmus University Rotterdam Rotterdam School of Economics Bachelor Thesis Financial Economics The Valuation Approach From An Investment Bank Analyst: A Case Study on the IPO Valuation of DB ML. Wieger Jansen 289629 Thesis Supervisor: Dr. Willem Schramade May 17th 2009
-
Upload
hoangthuan -
Category
Documents
-
view
218 -
download
2
Transcript of The Valuation Approach From An Investment Bank · PDF fileValuation Approach From An...
ErasmusUniversityRotterdamRotterdamSchoolofEconomicsBachelorThesisFinancialEconomics
TheValuationApproachFromAnInvestmentBankAnalyst:ACaseStudyontheIPOValuationofDBML.
WiegerJansen289629ThesisSupervisor:Dr.WillemSchramadeMay17th2009

2
ABSTRACT
Thispaperpresentsresultsontheuseoffinancemethodsbyinvestmentbankanalyststhrough
analyzingsixIPOprospectreportsonalargeGermanmultidivisionalcompany.Theresultsindicate
theanalystsalwaysrelyonmorethanonemethodinordertoestimateavaluation,witheachreport
makinguseofbothaDCFanalysisandtradingmultiples.Furthermore,theresultsindicatetheuseof
asum‐of‐the‐partanalysiswhenacompanyhasmultipledivisionswithdifferentbusiness
descriptionsandriskprofiles.TheresultsalsoindicateconsistencywiththeevidencefromBruner,
Eades&Higgins(1998)withregardtotheestimationofthecostofcapital,wheretheCAPMisstill
themostpopularmodelforthecostofequity.Furthermore,thepapershowsresultsonthe
appropriatetradingmultiples,themethodofcostestimation,theuseofsensitivity&scenario
analysisandtheuseofstrategicanalyses.
3
TABLEOFCONTENTSChapter1.Introduction …4 Chapter2.AnIntroductiontoIPOs …52.1IPOProcessinEurope …52.2ThetimingofIPOsandhotmarkets …62.3UnderpricingofIPOs …82.4UnderperformanceofIPOs …9Chapter3.Methodology&Data …11Chapter4.ValuationMethods …124.1Overviewvaluationmethods …124.2Resultsvaluationmethods …15Chapter5.DiscountedCashFlowAnalysis …175.1OverviewDCFcomponents …17
5.1.1CostofCapital …175.1.2ContinuingValue …18
5.2ResultsDCFAnalysis …19 5.2.1ResultsForecastPeriod …19 5.2.2ResultsCostofCapital …19 5.2.3ResultsCapitalStructure …23 5.2.4ResultsContinuingValue …24Chapter6.TradingMultiples …256.1Resultstradingmultiples …25Chapter7.Growth,Costestimations&Margins …287.1ResultsGrowth,Costestimations&Margins …28
7.1.1ResultsGrowth …28 7.1.2ResultsCostestimations …28 7.1.3ResultsMargins …29Chapter8.Sensitivity&ScenarioAnalysis …308.1DescriptionsSensitivity&ScenarioAnalysis …308.2ResultsSensitivity&ScenarioAnalysis …30Chapter9.RiskFactors …329.1ResultsRiskfactors …32Chapter10.Strategicanalysis …3310.1Overviewstrategicanalysis …3310.2Resultsstrategicanalysis …33Chapter11.Conclusion/Discussion …34References/Bibliography …36Appendix1:ValuationreportDBMobilityLogistics …38
4
Chapter1.IntroductionThepurposeofthispaperistogetinsightsintothepracticesofinvestmentbankanalystsintheuseoffinancemethods,withspecialemphasisontheDCFcomponents(e.g.costofcapital/explicitforecastperiod).WealreadyhaveevidenceofthesetopicsfrompaperslikeBruner,EadesandHiggins(1998)andGraham&Harvey(1999),buttheseareresultsfromsurveysamongfinanceprofessionals,whicharebothrelatedandunrelatedtofinancecompanies.IhavechosenanapproachwhereIcandirectlyobserveaninvestmentbankanalyst’sinputs,namelythroughinvestigatingsixprospectreportsonaGermanrailandlogisticsfirmgoingpublic.ThereasonwhyI’veusedIPOreportsisbecausethesearetraditionalmoretransparentthanotherwisewouldbethecase.Inaddition,itcanbeexpectedthattheresultsfromthesereportsrepresentthebestpracticesinthefieldoffinance,sincetheanalystsresponsibleforthesereportsworkatwell‐respectedinvestmentbanksanddealwithhighfinancedealsonadailybasis.Moreover,thestakes(read:incentives)foraninvestmentbankwithregardstoassurepropervaluationsforanIPOarehigh.OntheseincentivesRitter(1998)quotes:“investmentbankersrarelycompeteforbusinessonthebasisofofferinglowerunderwritingdiscount(orgrossspreads)”.Moreover,“Therearesubstantialeconomiesofscaleinunderwritingcosts.Inspiteoftheseeconomiesofscale,themajorityofIPOsraisingbetween$20millionand$80millionhavegrossspreadsofexactly7,0%”.Furthermore,besidesobservingpracticesonestimatingapropercostofcapital,theIPOreportsalsoprovideanopportunitytoinvestigatewhatvaluationmethodsandassumptionsareusedinordertovalueaprivatefirmgoingpublic.Thiswillbeinterestingsincetheevidenceonthissubjectshowsthatinvestmentbankersareabletocreateadditionalvalueintheirdevelopmentofanofferprice.InastudyconductedbyKimandRitter(1999)onvaluingIPOstheyquote:“investmentbankersapparentlyareabletodosuperiorfundamentalanalysis.Inaddition,investmentbankersareabletoachieveadditionalvaluationaccuracybycanvassingmarketdemandbeforesettingafinalofferprice”.Furthermore:“Ourresultsdemonstratethevalueaddedbyinvestmentbankersinpricingissues”.InadditionI’vealsoconductedmyownvaluation(Appendix.1)forthisparticularcompany,followingthebestpracticesasdescribedbyKoller,Goedhart&Wessels(2005),inordertoindicatedifferencesbetweentextbookrecommendationsandthepractitioners’approach.Thethesisisorganizedasfollowed:FirstIwillexplaininsomemoredetailwhatanIPOisaboutandwhatprocesshastobefollowed,theroleoftheinvestmentbank,andevidenceonissuesrelatedtoIPOpricing.ThereafterIwillexplainthemethodologyanddataofthispaper,whichisfollowedwiththefirstissueathand,namelythevaluationmethods.
5
Chapter2AnIntroductiontoIPOs:Oneofthispaper’sobjectivesisfindingoutwhatmethodsareusedinordertovalueandpriceanIPO.BeforeIwillpresentresultsonthistopics,IwillexplaintheprocessofanIPOfollowedwithwell‐knownIPOpricingphenomena.Thesephenomenaarerelevantinthesensetheyexplainthebehaviorofthefirmsgoingpublic,andwiththemtheirunderwritingteamofinvestmentbanks,onthepricingissues.TheyindicatethatIPOsareconductedintimeswhenmarketsreachtheirpeakatadiscount,whichonaverageleadstolong‐termstockpriceunderperformance.2.1TheIPOProcessinEuropeCompaniesthinkingaboutgoingpublicinaEuropeanmarkethavetwolegallydefinedwaystoaccessthecapitalmarket.ThiscanbeviaEUregulatedmarketsandviamarketsregulatedbythestockexchanges.IPOteamOnceacompanydecidestogothroughwiththeIPOitwillhireateamconsistingofaleadinvestmentbank,accountingfirmandalawfirm.Thecompanyissuingstockneedsassistancefromthebankingsyndicate,acombinationofseveralbanksand/orfinancialserviceproviders,whojointlyplacethepublicofferingwithinvestors.TheleadinvestmentbankorganizesandmanagestheIPOprocess.Thecriteriaforselectingtheleadinvestmentbankandotherbanks/financialcompaniesincludeunderwritingexperience,sectorsknowledgeandawidenetworkwithpotentialinvestors.ProspectusWhenthisteamisatplace,oneofthemosttimeconsumingtasksthisteamfacesisassemblingtheprospectus.Thisprospectusisadocument,whichcanbestbedescribedasabrochurefortheissuingcompany.Thisdocumentincludeseverythingfromhistoricalfinancialstatements,thecompany’smanagementandananalysisofthemarketwherethecompanyisactiveinwithcompetitors,growthfiguresandstrategies.Tosummarizeit’salltheinformationapotentialinvestorneedstomakeadecisiononwhethertoinvestornot.Marketing(RoadShow)TheroadshowisanimportantpartofthemarketingoftheIPO.It’satourvisitingmultiplecitiesaroundtheworldwherethecompanyandbankrepresentativespresentthebusinessplantopotentialinvestors.Thesepotentialinvestorsincludeinstitutionalinvestorsandlarge‐scaleinvestors.Duringthesemeetings,theunderwriterhastheopportunitytomeasurethelevelofinterestintheIPO,whichhelpstheunderwritersindeterminingtheofferprice.PricingandallocatingtheIPOWhentheroadshowisoverandenoughinformationisgatheredconcerningexpecteddemandthecompanyandunderwritersmeettosettheinitialpriceforthesharesissued.Theobjectivefromtheinvestmentbank’ssideistobalancebetweenthecompany’sdesiretomaximizetheIPOproceedsandtheinvestorswhoaspiretoprofitfromtakingonriskininvestinginacompanywithnopublictrackrecord.Everybankintheteamgetsacertainamountofsharestoallocatetoitsclients.
6
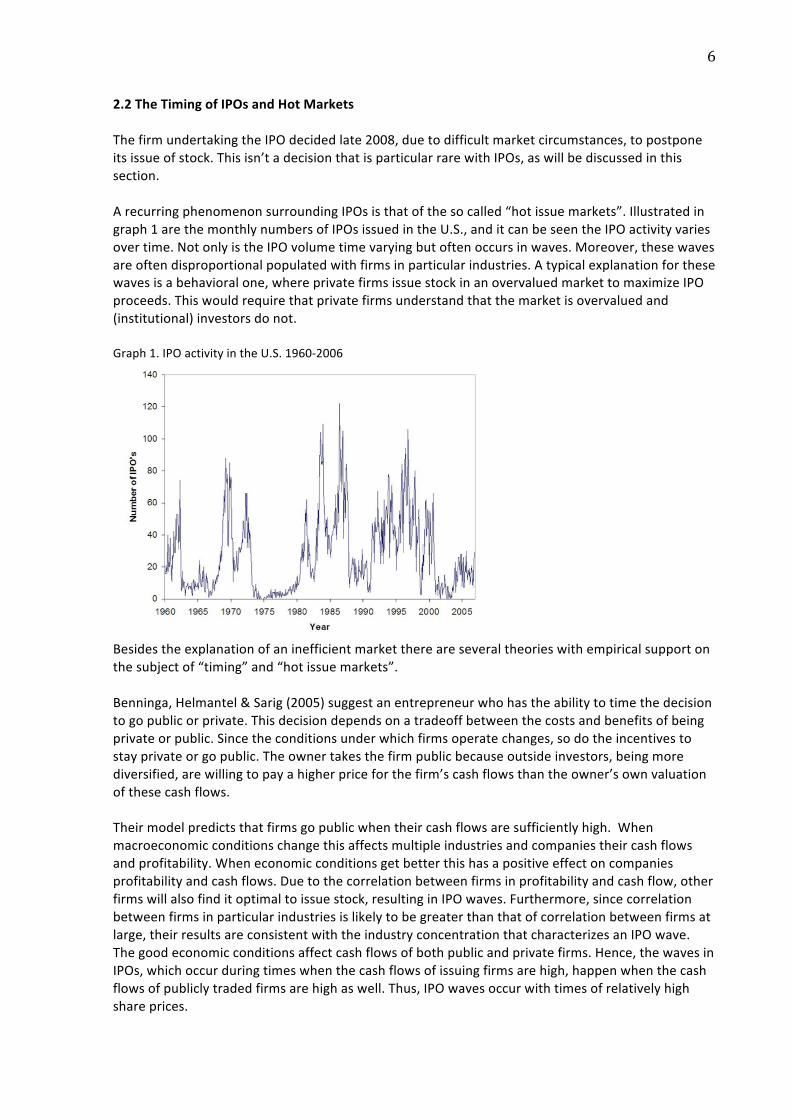
2.2TheTimingofIPOsandHotMarketsThefirmundertakingtheIPOdecidedlate2008,duetodifficultmarketcircumstances,topostponeitsissueofstock.Thisisn’tadecisionthatisparticularrarewithIPOs,aswillbediscussedinthissection.ArecurringphenomenonsurroundingIPOsisthatofthesocalled“hotissuemarkets”.Illustratedingraph1arethemonthlynumbersofIPOsissuedintheU.S.,anditcanbeseentheIPOactivityvariesovertime.NotonlyistheIPOvolumetimevaryingbutoftenoccursinwaves.Moreover,thesewavesareoftendisproportionalpopulatedwithfirmsinparticularindustries.Atypicalexplanationforthesewavesisabehavioralone,whereprivatefirmsissuestockinanovervaluedmarkettomaximizeIPOproceeds.Thiswouldrequirethatprivatefirmsunderstandthatthemarketisovervaluedand(institutional)investorsdonot.Graph1.IPOactivityintheU.S.1960‐2006
Besidestheexplanationofaninefficientmarketthereareseveraltheorieswithempiricalsupportonthesubjectof“timing”and“hotissuemarkets”.Benninga,Helmantel&Sarig(2005)suggestanentrepreneurwhohastheabilitytotimethedecisiontogopublicorprivate.Thisdecisiondependsonatradeoffbetweenthecostsandbenefitsofbeingprivateorpublic.Sincetheconditionsunderwhichfirmsoperatechanges,sodotheincentivestostayprivateorgopublic.Theownertakesthefirmpublicbecauseoutsideinvestors,beingmorediversified,arewillingtopayahigherpriceforthefirm’scashflowsthantheowner’sownvaluationofthesecashflows.Theirmodelpredictsthatfirmsgopublicwhentheircashflowsaresufficientlyhigh.Whenmacroeconomicconditionschangethisaffectsmultipleindustriesandcompaniestheircashflowsandprofitability.Wheneconomicconditionsgetbetterthishasapositiveeffectoncompaniesprofitabilityandcashflows.Duetothecorrelationbetweenfirmsinprofitabilityandcashflow,otherfirmswillalsofinditoptimaltoissuestock,resultinginIPOwaves.Furthermore,sincecorrelationbetweenfirmsinparticularindustriesislikelytobegreaterthanthatofcorrelationbetweenfirmsatlarge,theirresultsareconsistentwiththeindustryconcentrationthatcharacterizesanIPOwave.Thegoodeconomicconditionsaffectcashflowsofbothpublicandprivatefirms.Hence,thewavesinIPOs,whichoccurduringtimeswhenthecashflowsofissuingfirmsarehigh,happenwhenthecashflowsofpubliclytradedfirmsarehighaswell.Thus,IPOwavesoccurwithtimesofrelativelyhighshareprices.
7
AnotherpaperonthissubjectisfromLowryandSchwert(2002).Theyconcludethatthecyclesreflecttwofactors.First,similartypesoffirmschoosetogopublicataboutthesametimeandsecond,andmoreimportant,theinformationaboutthevalueofanIPOfirmthatbecomesavailableduringtheregistrationperiodhasaneffectonthepricesandofferingdecisionforotherfirms.LowryandSchwert(2002)highinitialreturnsprovidepositiveinformationaboutthemarket’svaluationofIPOs,thenmoreprivatecompaniesshouldfileIPOsafterperiodsofhighinitialreturns.Thus,initialreturnsshouldbepositivelycorrelatedwiththenumberofsubsequentfilings.Incontrast,theyexpectinitialreturnstobenegativelycorrelatedtothenumberofsubsequentcancellations.Empiricalfindingsareconsistentwiththepreviousmentionedrelations.TheyfindthattheinformationlearnedduringtheregistrationperiodthatispositivelyrelatedtofutureIPOvolume.Anothertheory,proposedbyPastor&Veronesi(2005),suggestsIPOvolumefluctuatesduetotimevariationinmarketconditions.Themarketconditionsaredefinedashavingthreedimensions:expectedmarketreturn,expectedaggregateprofitabilityandprioruncertaintyaboutpostIPOaverageprofitabilityinexcessofmarketprofitability.Themodelassumesanentrepreneur,calledinventor,whohasanideathatispatentedandhasthepotentialtocreateabnormalreturns.Theentrepreneurstartsaprivatefirmandobtainsarealoptiontotakethefirmpublic.Hechoosestoissueequity,insteadofborrowing,becausehehasastrongincentivetodiversify.Whenmarketconditionswouldbeconstantovertime,itwouldbeoptimaltogopublicassoonasthepatentisobtained.Whenmarketconditionsvaryovertime,astheydo,theinventorhasthepossibilitytopostponetheIPOandwaitformarketconditionstoimprove.Theoptimaltimetogopublic,accordingtoPastor&Veronesi(2005),iswhentheexpectedmarketreturnislow,expectedaggregateprofitabilityishighandprioruncertaintyishigh.AccordingtoPastor&Veronesi(2005)thismeans“IPOwavesshouldbeprecededbyhighmarketreturns,followedbylowmarketreturnsandaccompaniedbyincreaseinaggregateprofitability.Inaddition,IPOwavesshouldbeprecededbyanincreaseddisparitybetweennewfirmsandoldfirmsintermsoftheirvaluationsandreturnvolatilities.IPOvolumeshouldberelatedtochangesinstockprices,butlesssototheirlevels.”Whentheseconditionshavechangedsufficientlymanyinventorschoosetoexercisetheiroptiontogopublic,resultinginaclusteringopIPOs.Thishappensbecausemostofthetimethereisabacklogofprivatefirms,whoarewaitingformarketconditionstoimprovebeforegoingpublic.TheresultingIPOwavetypicallylastsseveralmonths,asallprivatefirmsrarelygopublicatexactlythesametime(firmspecificfactors).IntheirpaperPastor&Veronesi(2005)alsogiveanansweraquestionfromRitterandWelchonwhyissuingvolumedropssoprecipitouslyfollowingstockmarketdrops.Theanswer,theysay,issimple:“whenmarketconditionsworsen,stockpricesdropandIPOvolumedeclinesbecauseprivatefirmschoosetowaitformorefavorablemarketconditionsbeforegoingpublic.”Someoftheimplicationsofthismodelarealsoconsistentwiththebehavioralviewwherefirmsgopublicduetomarketovervaluation.However,thiscouldalsobepartlybecauseIPOtimingisendogenousandpartlyduetoprioruncertaintyabouttheaveragefutureprofitabilityofIPOs.OntheaspectofprioruncertaintyPastor&Veronesi(2005)conclude;“Insteadofassumingthatprioruncertaintyisthesameforallfirms,wecanassumethatthisuncertaintyismoresimilarforfirmsinthesameindustry.Averageexcessprofitabilityisalsolikelytobemorecorrelatedacrossfirmsinthesameindustry.Increasesinindustry‐specificprioruncertaintyorindustry‐specificexcessprofitabilitycanleadtoIPOwavesconcentratedinthegivenindustry,withouttriggeringIPOsinotherindustries.”
8
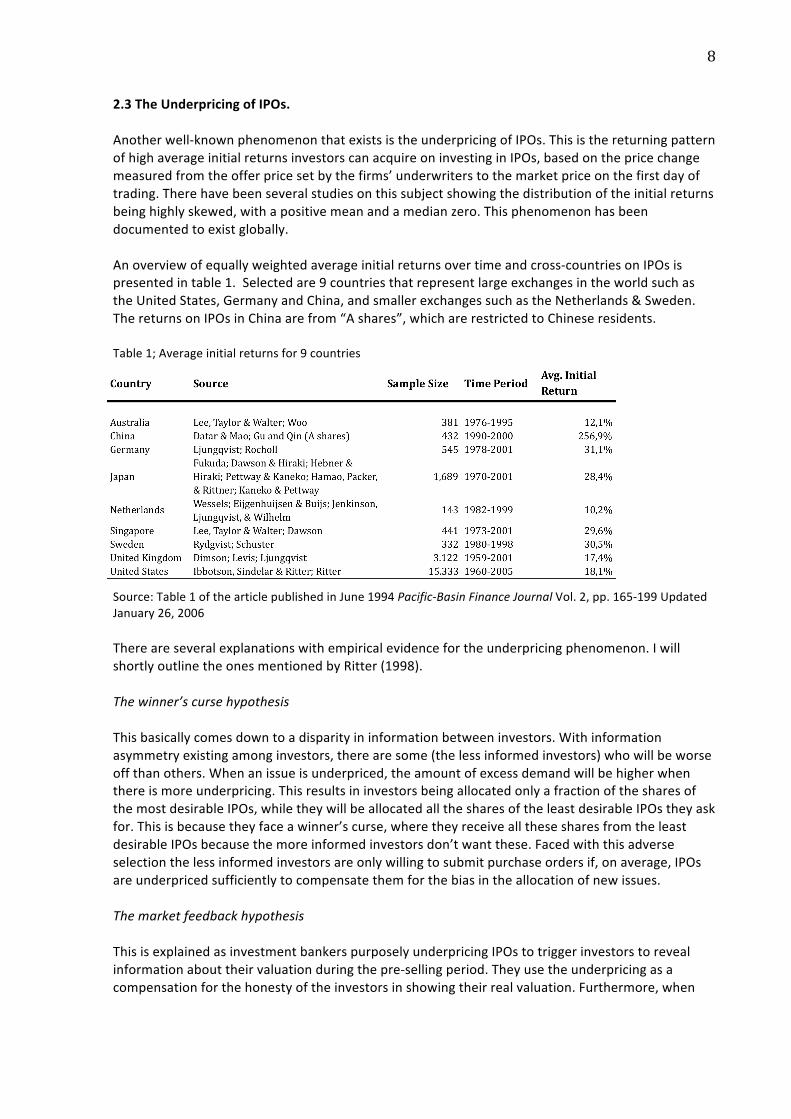
2.3TheUnderpricingofIPOs.Anotherwell‐knownphenomenonthatexistsistheunderpricingofIPOs.ThisisthereturningpatternofhighaverageinitialreturnsinvestorscanacquireoninvestinginIPOs,basedonthepricechangemeasuredfromtheofferpricesetbythefirms’underwriterstothemarketpriceonthefirstdayoftrading.Therehavebeenseveralstudiesonthissubjectshowingthedistributionoftheinitialreturnsbeinghighlyskewed,withapositivemeanandamedianzero.Thisphenomenonhasbeendocumentedtoexistglobally.Anoverviewofequallyweightedaverageinitialreturnsovertimeandcross‐countriesonIPOsispresentedintable1.Selectedare9countriesthatrepresentlargeexchangesintheworldsuchastheUnitedStates,GermanyandChina,andsmallerexchangessuchastheNetherlands&Sweden.ThereturnsonIPOsinChinaarefrom“Ashares”,whicharerestrictedtoChineseresidents.Table1;Averageinitialreturnsfor9countries
Source:Table1ofthearticlepublishedinJune1994Pacific‐BasinFinanceJournalVol.2,pp.165‐199UpdatedJanuary26,2006Thereareseveralexplanationswithempiricalevidencefortheunderpricingphenomenon.IwillshortlyoutlinetheonesmentionedbyRitter(1998).Thewinner’scursehypothesisThisbasicallycomesdowntoadisparityininformationbetweeninvestors.Withinformationasymmetryexistingamonginvestors,therearesome(thelessinformedinvestors)whowillbeworseoffthanothers.Whenanissueisunderpriced,theamountofexcessdemandwillbehigherwhenthereismoreunderpricing.ThisresultsininvestorsbeingallocatedonlyafractionofthesharesofthemostdesirableIPOs,whiletheywillbeallocatedallthesharesoftheleastdesirableIPOstheyaskfor.Thisisbecausetheyfaceawinner’scurse,wheretheyreceiveallthesesharesfromtheleastdesirableIPOsbecausethemoreinformedinvestorsdon’twantthese.Facedwiththisadverseselectionthelessinformedinvestorsareonlywillingtosubmitpurchaseordersif,onaverage,IPOsareunderpricedsufficientlytocompensatethemforthebiasintheallocationofnewissues.ThemarketfeedbackhypothesisThisisexplainedasinvestmentbankerspurposelyunderpricingIPOstotriggerinvestorstorevealinformationabouttheirvaluationduringthepre‐sellingperiod.Theyusetheunderpricingasacompensationforthehonestyoftheinvestorsinshowingtheirrealvaluation.Furthermore,when
9
thefinalofferpriceisset,forthoseIPOswheretheofferpriceisrevisedupwardstheyaremoreunderpricedthanforthosewheretheofferpriceisreviseddownwards.ThebandwagonhypothesisItcouldhappenthatinvestors’choiceonpurchasingsharescouldnotonlydependontheirowninformationaboutanIPO,butalsoifotherinvestorsarewilingtobuy.Inpreventingthisfromhappeninganissuermaydecidetounderpricethesharetotriggerthefirstpotentialinvestorsinmovinginontheshares,andinduceabandwagonwhereallsubsequentinvestorswanttopurchaseirrelevantoftheirowninformation.Theinvestmentbanker’smonopsonypowerhypothesisThisexplanationsuggestsinvestmentbankersunderpriceIPOsbecauseofsuperiormarketknowledge.TheyunderpriceIPOsinordertospendlesseffortonmarketing,andtriggerbuying‐sideclients.ThesignalinghypothesisThisexplainstheunderpricingaspartofasignalingstrategy.Firmsissueshareswithadiscounttoleaveinvestorswithagoodfeeling,allowingthemtosellfutureofferingsatahigherpricethantheywouldotherwisebeableto.However,therearealsoempiricalstudiesshowingthatthisrelationdoesn’texist.TheownershipdispersionhypothesisFirmspurposelyunderpricetheirshareinordertocreateanexcessdemand,whatsubsequentlyhastoleadtoalargenumberofsmallshareholders.Thisdispersioninownershipwillcreatealiquidmarketandmakeitmoredifficultforshareholderstochallengethemanagement.AsquotedbyRitterontheseexplanations;“Manyoftheaboveexplanationsfortheunderpricingphenomenoncanbecriticizedonthegroundsofeithertheextremeassumptionsthataremodeortheunnecessarilyconvolutedstoriesinvolved.Ontheotherhand,mostoftheexplanationshavesomeelementoftruthtothem.Furthermore,theunderpricingphenomenonhaspersistedfordecadeswithnosignofitsimminentdemise”.2.4TheUnderperformanceofIPOsThethirdphenomenonregardingtheIPOpricingisthelongrunpoorstockpriceperformanceofIPOs.ThepoorstockpriceperformanceaftertheIPOhasbeenprocessedispartlyreflectedbythepatternofhighIPOvolumewhenmarketsreachtheirpeaks(highmarket‐to‐bookmultiples).Companiesthatareoldermoreestablishedfirmsgoingpublic(thecaseofDBML)including“reverseLBOS”,andthosethatwentpublicinlight‐volumeyearsdonotseemtoshowlong‐rununderperformance.InternationalevidenceasreportedinthepaperbyRitter(1998)ispresentedintable2.Notethatthetotalabnormalreturniscalculatedas100%minustheratiooftheaveragethree‐yearbuy‐and‐holdgrossreturndividedbytheaveragethree‐yearbuy‐and‐holdgrossreturnonthebenchmark.Inessencethismeansthetotalabnormalreturnof‐12,1%forGermanyisthelossinwealthwouldyouhaveinvestedforthreeyearsinaportfolioconsistingpurelyofIPOs,benchmarkedagainstaportfolioofnonissuingfirms.
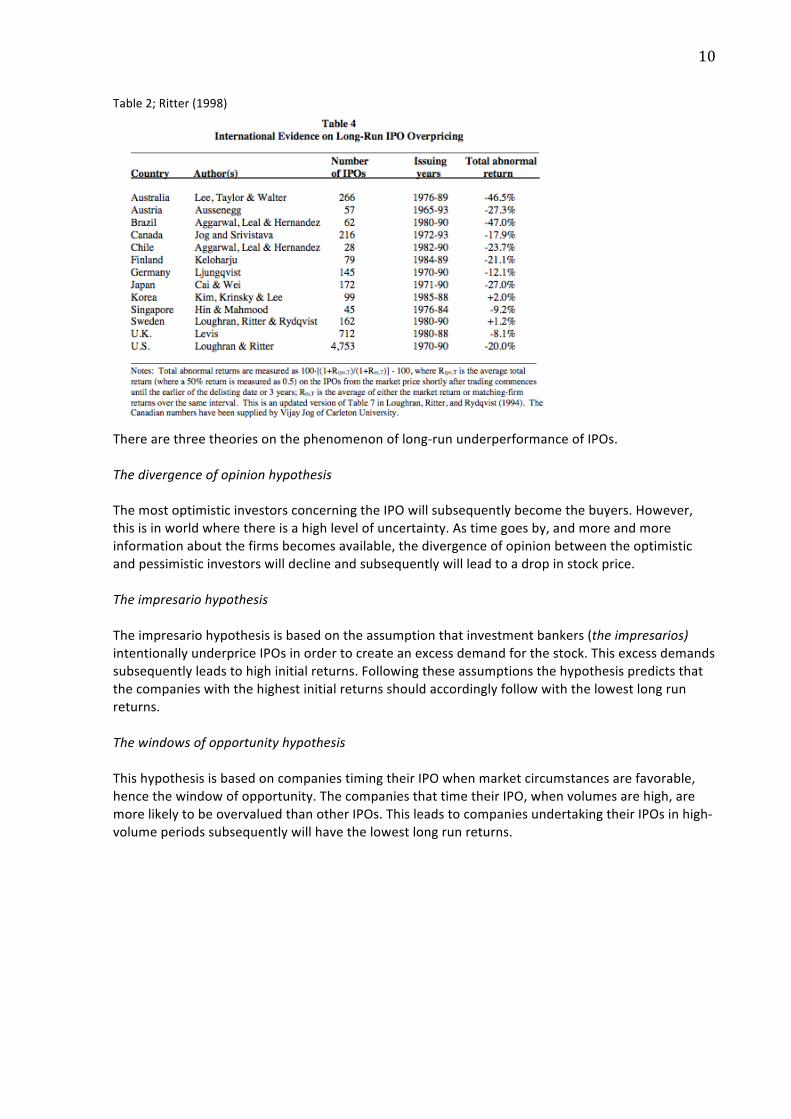
10
Table2;Ritter(1998)
Therearethreetheoriesonthephenomenonoflong‐rununderperformanceofIPOs.ThedivergenceofopinionhypothesisThemostoptimisticinvestorsconcerningtheIPOwillsubsequentlybecomethebuyers.However,thisisinworldwherethereisahighlevelofuncertainty.Astimegoesby,andmoreandmoreinformationaboutthefirmsbecomesavailable,thedivergenceofopinionbetweentheoptimisticandpessimisticinvestorswilldeclineandsubsequentlywillleadtoadropinstockprice.TheimpresariohypothesisTheimpresariohypothesisisbasedontheassumptionthatinvestmentbankers(theimpresarios)intentionallyunderpriceIPOsinordertocreateanexcessdemandforthestock.Thisexcessdemandssubsequentlyleadstohighinitialreturns.Followingtheseassumptionsthehypothesispredictsthatthecompanieswiththehighestinitialreturnsshouldaccordinglyfollowwiththelowestlongrunreturns.ThewindowsofopportunityhypothesisThishypothesisisbasedoncompaniestimingtheirIPOwhenmarketcircumstancesarefavorable,hencethewindowofopportunity.ThecompaniesthattimetheirIPO,whenvolumesarehigh,aremorelikelytobeovervaluedthanotherIPOs.ThisleadstocompaniesundertakingtheirIPOsinhigh‐volumeperiodssubsequentlywillhavethelowestlongrunreturns.
11
Chapter3.METHODOLOGYANDDATAThepurposeofthispaperistodetermineinvestmentbankanalysts’inputsforfinancialmethods,withtheemphasisonthevaluationmethodologyforaninitialpublicoffering.ThedatausedforthisresearchconsistsofauniquesampleofsixIPOprospectreportsforalargeGermanrailandlogisticscompanycalledDBMobilityLogistics.Theinputs(variables)thatarebeinganalyzedconsistofwhatKolleretal.(2005)considertobetheframeworksforvaluation.Inaddition,afterhavingviewedoneoftheIPOreportsIhaveadjusted/addedinputs.Thevariablesthatarebeinganalyzedarethefollowing:
1) ValuationMethods2) DiscountedCashFlowComponents(CostofCapital)3) TradingMultiples4) CostestimationsandMargins5) SensitivityandScenarioAnalysis6) RiskFactors7) StrategicAnalyses
Thedesignofthepaperisasfollowed.ForeveryinputIwillfirstexplainitscontentandimportanceforthevaluationtrack.FurthermoreIwillpresentearlierevidenceonthesubjectfrompapersthatwerepublishedinfinancejournals.AfterthisIwillpresenttheresultsandindicateiftheyareconsistentwithearlierfindingsandtextbookrecommendations.InadditionI’vealsoconductedmyownvaluationofDBMLandpresentedmyownmethodsandassumptionswiththeresults(coloredinred).
12
Chapter4.VALUATIONMETHODS4.1ValuationmethodsoverviewThereareseveralmethodsinordertoestimateacompanyvaluation.However,thesemethodscontaindifferentperceptionsandcanalsodifferinoutcomeofvalueestimation.FromastudybyDeloofetal.(2002)wheretheyexaminetheaccuracyofvaluationmethodsasusedbyinvestmentbanksforBelgianIPOstheyreport;“WefindthatforeachIPOseveralvaluationmethodsareused,ofwhichDiscountedFreeCashFlowisthemostpopular,theDFCFmodelisusedtovalueallIPOsinthesample”.Thefollowingvaluationmethodsareexplained:
• DiscountedCashFlow• TradingComparables• TransactionComparables• Sum‐of‐the‐Parts• EVA• RealOptions
DiscountedCashFlowAnalysisApopularandrecommendedmethodforthecalculationofacompany’svalueisthediscountedcashflowmethod.Thismethodisameansofdeterminingthe“true”(intrinsic)valueofacompany.TheDCFmethoddependsontheflowsinandoutofthecompanyandadiscountrate.Thismodelnotonlyreliesonafirmtheory,butitisalsoaveryflexiblemethodinthesensethatthemodeldependsoncertainassumptionsmade.ValuationwiththeDCFmethodisprimarilybasedon:
• Identifyingkeyvaluedrivers• Forecastingfuturefreecashflows• EstimateproperWACC• Selectingtheappropriatecontinuingvaluemethodology.
Foranaccurateforecastofafirm’sfuturefreecashflowsitisimportanttounderstandwhatdrivesthevalueofafirm.Thisisbothfromtheexternalperspective(keyindustrytrends)asfromtheinternalfirmperspective(i.e.relationshipbetweensalesandearnings).AproperDCFmodeldependsonathoroughunderstandingofthecompany.ThevalueusingaDCFequalsthesumofthenetpresentvalueoftheprojectedfreecashflowsandtheprojectedcontinuingvalue.Thefreecashflowsaregenerallyforecastedfor5to10yearsintothefuture.AfterthistheDCFmethodmakesuseofacontinuingvalue(terminalvalue),sinceitisexpectedthefirmwillcontinueitsoperationsaftertheforecastperiod.AsignificantimportantassumptioninaDCFanalysisisthechoiceofthediscountrate(WACC),whichIwilldiscussfurtheronunderthesectionofassumptions.TradingcomparablesThisvaluationmethodisbasedoncomparingthecompanybeingvaluedtocompanieswithsimilarcharacteristicsusingmultiples.BesidesthismethodgivingaroughvaluationitisalsoamethodthatassesseswhetherthevaluecalculatedusingtheDCFanalysisisinlinewithcomparablestradedinthemarket.
13
ToapplymultiplesproperlytherearefourbestpracticesasdescribedbyKolleretal(2005);
1. ChoosecomparableswithsimilarprospectsforROICandgrowth.2. Usemultiplesbasedonforward‐lookingestimates.3. Useenterprise‐valuemultiplesbasedonEBITAtomitigateproblemswithcapitalstructure
andone‐timegainsandlosses.4. Adjusttheenterprise‐valuemultiplefornon‐operatingitems.
Theidentificationofcomparablefirmsthattradepubliclyshouldbebasedonseveralcharacteristics.Thecompaniesselectedshouldpreferablycomefromthesameindustrywithasimilarriskprofile,similaroperatingcharacteristics(e.g.salesvolume/profitability/growth)similarfinancialcharacteristics(e.g.capitalstructure/dividendpolicy),andsimilarsize.Forthemultipleanalysistobemoreaccurateit’srecommendedtomakeuseofforward‐lookingmultiples.Sincevaluationsarebasedonfutureperformances,thisshouldalsobethecasewhenusingmultiples.Empiricalevidenceshowsforward‐lookingmultiplesareindeedmoreaccurateinpredictingvalue.AsstatedinthearticlebyKimandRitter(1999)onvaluingIPOs,“Comparingtheregressionsusing,respectivelyhistoricalearnings,thecurrentyear’sforecastedearnings,andthenextyear’sforecastedearnings,theaverageabsolutepredictionerrorsfallfrom55,0%to43,7%toonly28,5%,andthepercentageoffirmsthatarevaluedwithin15%oftheactualmultipleincreases.”Thereareseveralvaluationmultiplesthatcanbeusedtocomparecompanies.
• EarningsMultiples(e.g.P/E–EV/EBITDA–EV/EBITA/EV/EBIT)• SalesMultiples(e.g.P/SALES–EV/SALES)• MarkettoBookMultiples(e.g.P/BOOK–EV/OperatingCapital)• IndustryMultiples(e.g.EV/BarrelsofOil–EV/Hectoliters–EV/NumberofSubscribers)
Aspartofthebestpractices,asdescribedbyKolleretal(2005),itisrecommendedtouseenterprise‐valuemultiples.Thisisbecausetheenterprise‐valuemultiplesarelessdependentoncapitalstructurethanP/Eratiosare.TheP/Eratiousesnetincome,whichiscalculatedafternon‐operatinggainsandlosses,sinceanon‐operatinglosscouldcausetheP/Eratiotobeartificiallyhigh.Theenterprise‐valuedependsonalesserextenttocapitalstructure.Howeverisalsoaffected,beittoalesserextent,sinceenterprise‐valuedependsonassumptionsmadeongrowth,thecostofcapitalandROIC.Moreover,theenterprise‐value,aswellasEBITA,shouldbeadjustedfornon‐operatingitems,suchasexcesscashandoperatingleases,toimprovetheaccuracyofthevaluation.Furthermore,thereareseveralalternativemultiplessuchassalesmultiplesandindustrymultiples.Salesmultiplesaregenerallyspeakingnotaccuratevaluepredictors,astheyimposeanextrarestrictioninamannerthattheyrequiresimilaroperatingmargins.Industrymultiplesrelatetheenterprisevalueofacompanytosomeindustrymetric,suchasbarrelsofoil.Theindustrymultiplealsohasitsshortfalls,sinceitdoesn’ttaketheprofitabilityofafirmintoaccount.TransactioncomparablesAvaluationmethodbasedoncomparingthevalueofacompanytopricesbeingpaidforsimilarcompanies.Thisanalysisisperformedwithmultiplessuchastheearningsmultiplesmentionedearlier.Besidesthatthechosencomparablecompaniesshouldbesimilarinamannerliketheonesfortradingcomparablesthereareafewextrapointsofattention.First,thetakeoverpricecouldcontainacontrolpremium,andsecondthetransactionsmayincludestrategicvaluewithdifferentsynergyrationale.
14
Sum‐of‐the‐PartsAsum‐of‐the‐partsanalysisvaluescomponents(divisions)ofacompanyasifitwereseparatebusinesses.Enablingtodeterminethevaluationofacomponentasifitwastobebrokenupandspunoff,oracquiredbyanotherlargerfirm.Itisverywellpossibleforthesum‐of‐the‐partsanalysistoestimateahighervaluationofthebusinessdivisionsonastand‐alonebasisthanforthecompanyasawhole.EconomicValueAdded(EconomicProfit)TheEVAisameasureofsurplusvaluethatiscreatedviainvestments.Incontrasttothediscountedcashflowanalysis,theEVAshowshowandwhenafirmcreates(shareholder)value,andleadstoavaluationthatisidenticaltothatoftheDCFanalysis.Theeconomicprofitisdefinedasfollowing;
• EconomicProfit=InvestedCapitalx(ROIC–WACC)• EconomicProfit=NOPLAT–(InvestedCapitalxWACC)
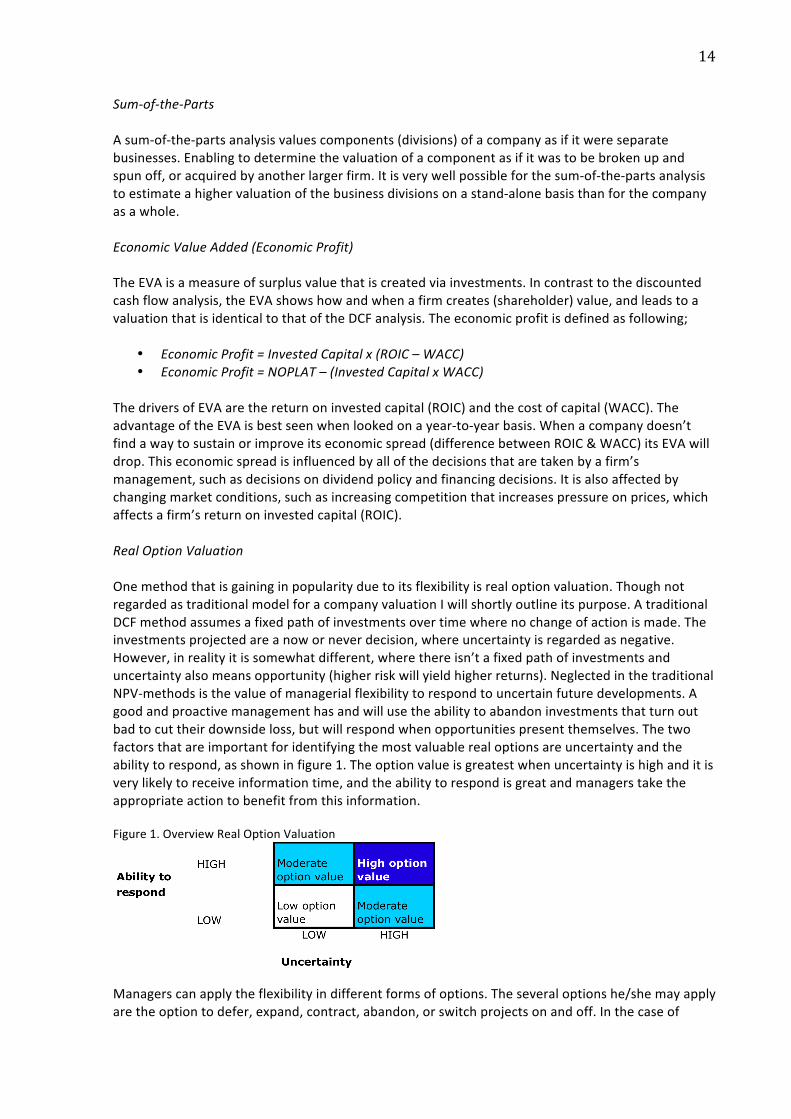
ThedriversofEVAarethereturnoninvestedcapital(ROIC)andthecostofcapital(WACC).TheadvantageoftheEVAisbestseenwhenlookedonayear‐to‐yearbasis.Whenacompanydoesn’tfindawaytosustainorimproveitseconomicspread(differencebetweenROIC&WACC)itsEVAwilldrop.Thiseconomicspreadisinfluencedbyallofthedecisionsthataretakenbyafirm’smanagement,suchasdecisionsondividendpolicyandfinancingdecisions.Itisalsoaffectedbychangingmarketconditions,suchasincreasingcompetitionthatincreasespressureonprices,whichaffectsafirm’sreturnoninvestedcapital(ROIC).RealOptionValuationOnemethodthatisgaininginpopularityduetoitsflexibilityisrealoptionvaluation.ThoughnotregardedastraditionalmodelforacompanyvaluationIwillshortlyoutlineitspurpose.AtraditionalDCFmethodassumesafixedpathofinvestmentsovertimewherenochangeofactionismade.Theinvestmentsprojectedareanoworneverdecision,whereuncertaintyisregardedasnegative.However,inrealityitissomewhatdifferent,wherethereisn’tafixedpathofinvestmentsanduncertaintyalsomeansopportunity(higherriskwillyieldhigherreturns).NeglectedinthetraditionalNPV‐methodsisthevalueofmanagerialflexibilitytorespondtouncertainfuturedevelopments.Agoodandproactivemanagementhasandwillusetheabilitytoabandoninvestmentsthatturnoutbadtocuttheirdownsideloss,butwillrespondwhenopportunitiespresentthemselves.Thetwofactorsthatareimportantforidentifyingthemostvaluablerealoptionsareuncertaintyandtheabilitytorespond,asshowninfigure1.Theoptionvalueisgreatestwhenuncertaintyishighanditisverylikelytoreceiveinformationtime,andtheabilitytorespondisgreatandmanagerstaketheappropriateactiontobenefitfromthisinformation.Figure1.OverviewRealOptionValuation
Managerscanapplytheflexibilityindifferentformsofoptions.Theseveraloptionshe/shemayapplyaretheoptiontodefer,expand,contract,abandon,orswitchprojectsonandoff.Inthecaseof
15
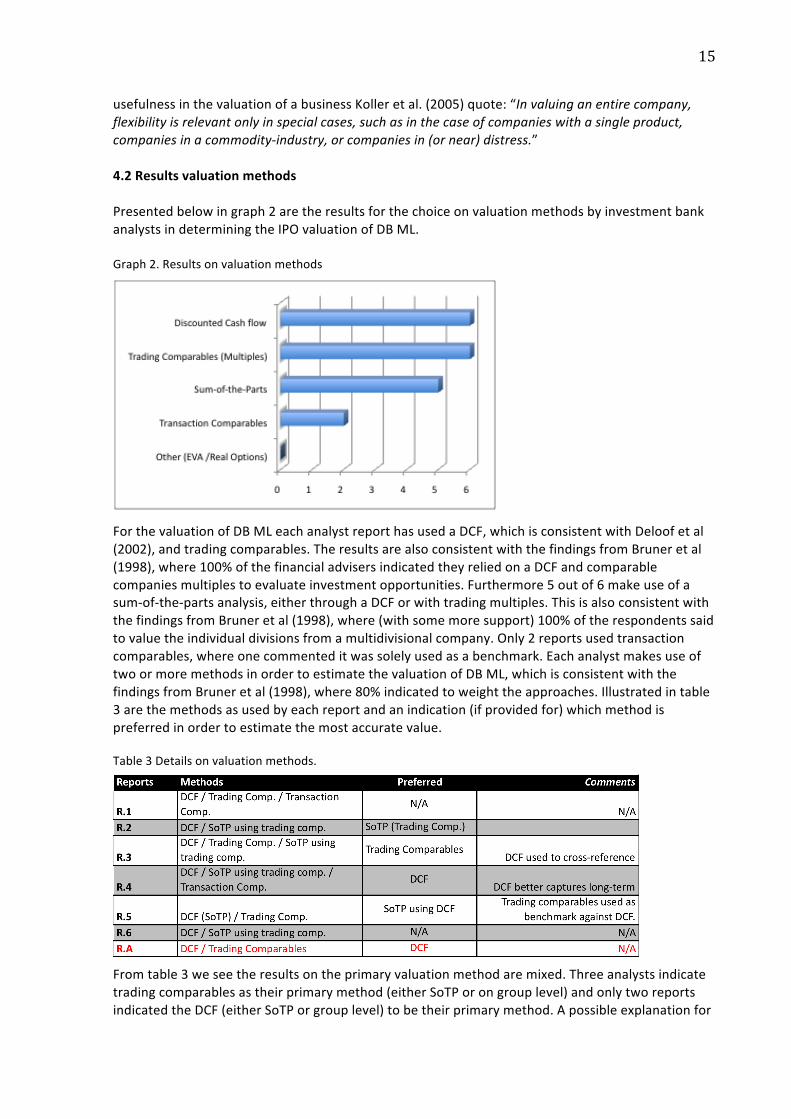
usefulnessinthevaluationofabusinessKolleretal.(2005)quote:“Invaluinganentirecompany,flexibilityisrelevantonlyinspecialcases,suchasinthecaseofcompanieswithasingleproduct,companiesinacommodity‐industry,orcompaniesin(ornear)distress.”4.2ResultsvaluationmethodsPresentedbelowingraph2aretheresultsforthechoiceonvaluationmethodsbyinvestmentbankanalystsindeterminingtheIPOvaluationofDBML.Graph2.Resultsonvaluationmethods
ForthevaluationofDBMLeachanalystreporthasusedaDCF,whichisconsistentwithDeloofetal(2002),andtradingcomparables.TheresultsarealsoconsistentwiththefindingsfromBruneretal(1998),where100%ofthefinancialadvisersindicatedtheyreliedonaDCFandcomparablecompaniesmultiplestoevaluateinvestmentopportunities.Furthermore5outof6makeuseofasum‐of‐the‐partsanalysis,eitherthroughaDCForwithtradingmultiples.ThisisalsoconsistentwiththefindingsfromBruneretal(1998),where(withsomemoresupport)100%oftherespondentssaidtovaluetheindividualdivisionsfromamultidivisionalcompany.Only2reportsusedtransactioncomparables,whereonecommenteditwassolelyusedasabenchmark.EachanalystmakesuseoftwoormoremethodsinordertoestimatethevaluationofDBML,whichisconsistentwiththefindingsfromBruneretal(1998),where80%indicatedtoweighttheapproaches.Illustratedintable3arethemethodsasusedbyeachreportandanindication(ifprovidedfor)whichmethodispreferredinordertoestimatethemostaccuratevalue.Table3Detailsonvaluationmethods.
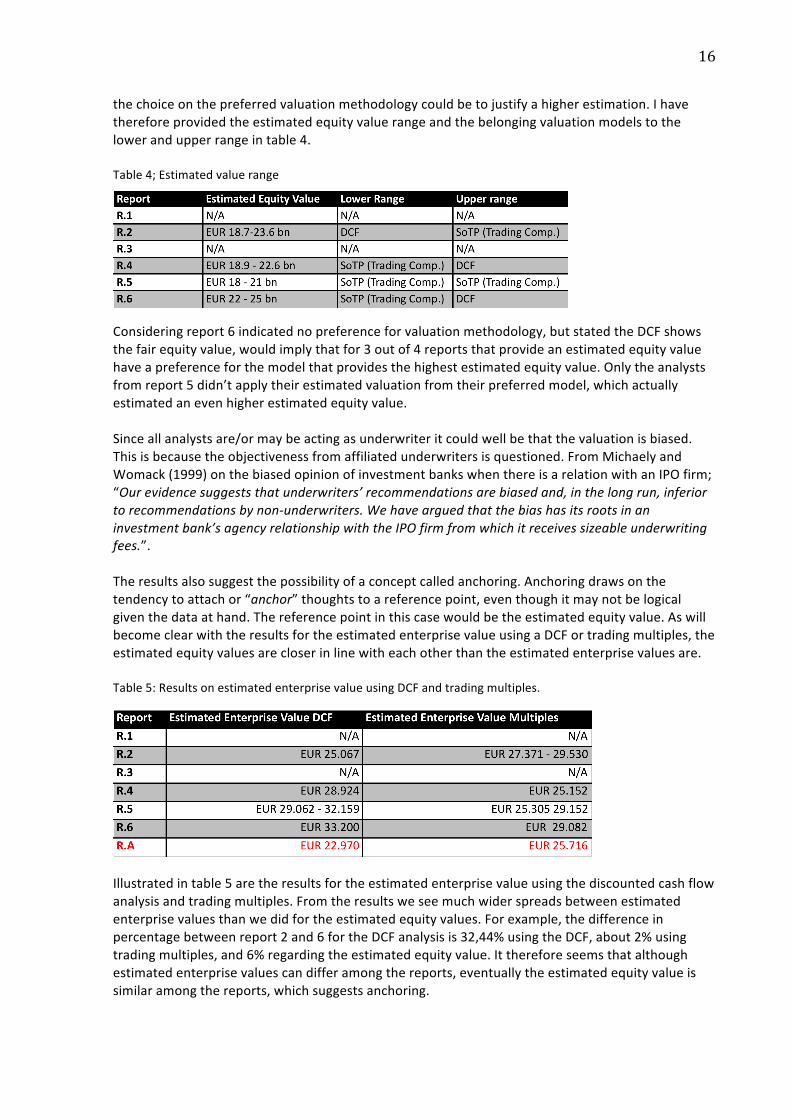
Fromtable3weseetheresultsontheprimaryvaluationmethodaremixed.Threeanalystsindicatetradingcomparablesastheirprimarymethod(eitherSoTPorongrouplevel)andonlytworeportsindicatedtheDCF(eitherSoTPorgrouplevel)tobetheirprimarymethod.Apossibleexplanationfor
16
thechoiceonthepreferredvaluationmethodologycouldbetojustifyahigherestimation.Ihavethereforeprovidedtheestimatedequityvaluerangeandthebelongingvaluationmodelstothelowerandupperrangeintable4.Table4;Estimatedvaluerange
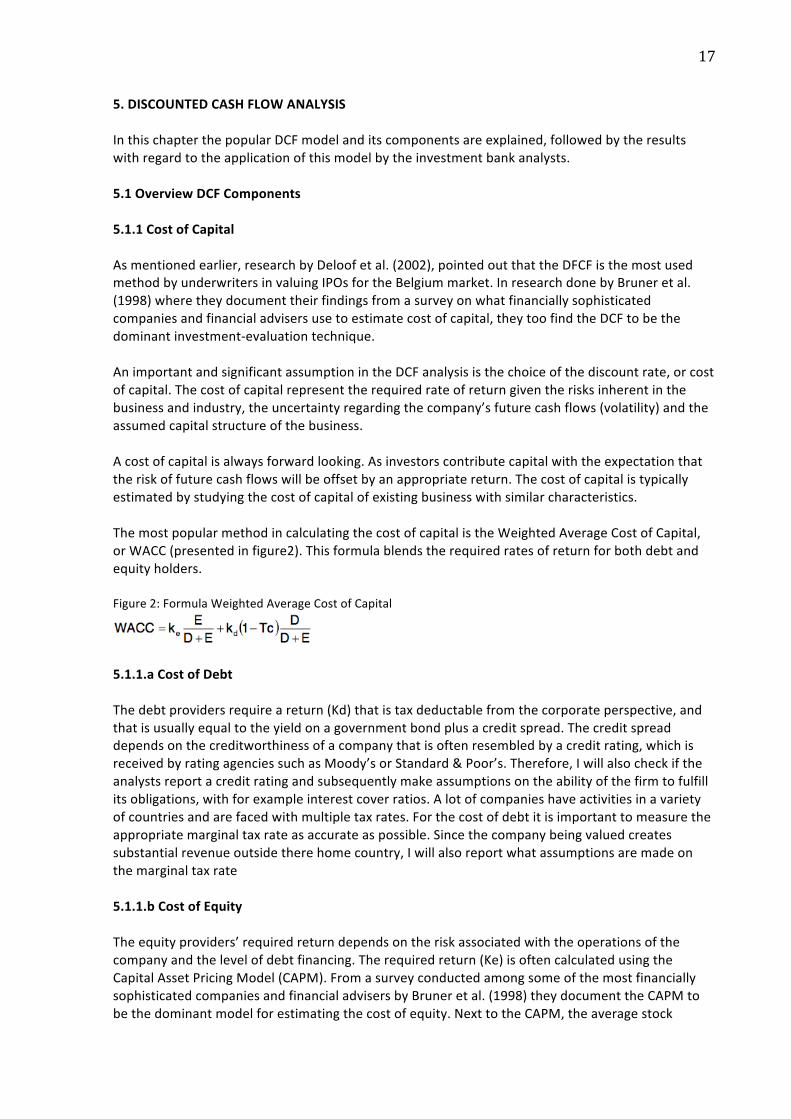
Consideringreport6indicatednopreferenceforvaluationmethodology,butstatedtheDCFshowsthefairequityvalue,wouldimplythatfor3outof4reportsthatprovideanestimatedequityvaluehaveapreferenceforthemodelthatprovidesthehighestestimatedequityvalue.Onlytheanalystsfromreport5didn’tapplytheirestimatedvaluationfromtheirpreferredmodel,whichactuallyestimatedanevenhigherestimatedequityvalue.Sinceallanalystsare/ormaybeactingasunderwriteritcouldwellbethatthevaluationisbiased.Thisisbecausetheobjectivenessfromaffiliatedunderwritersisquestioned.FromMichaelyandWomack(1999)onthebiasedopinionofinvestmentbankswhenthereisarelationwithanIPOfirm;“Ourevidencesuggeststhatunderwriters’recommendationsarebiasedand,inthelongrun,inferiortorecommendationsbynon‐underwriters.Wehavearguedthatthebiashasitsrootsinaninvestmentbank’sagencyrelationshipwiththeIPOfirmfromwhichitreceivessizeableunderwritingfees.”.Theresultsalsosuggestthepossibilityofaconceptcalledanchoring.Anchoringdrawsonthetendencytoattachor“anchor”thoughtstoareferencepoint,eventhoughitmaynotbelogicalgiventhedataathand.Thereferencepointinthiscasewouldbetheestimatedequityvalue.AswillbecomeclearwiththeresultsfortheestimatedenterprisevalueusingaDCFortradingmultiples,theestimatedequityvaluesarecloserinlinewitheachotherthantheestimatedenterprisevaluesare.Table5:ResultsonestimatedenterprisevalueusingDCFandtradingmultiples.
Illustratedintable5aretheresultsfortheestimatedenterprisevalueusingthediscountedcashflowanalysisandtradingmultiples.Fromtheresultsweseemuchwiderspreadsbetweenestimatedenterprisevaluesthanwedidfortheestimatedequityvalues.Forexample,thedifferenceinpercentagebetweenreport2and6fortheDCFanalysisis32,44%usingtheDCF,about2%usingtradingmultiples,and6%regardingtheestimatedequityvalue.Itthereforeseemsthatalthoughestimatedenterprisevaluescandifferamongthereports,eventuallytheestimatedequityvalueissimilaramongthereports,whichsuggestsanchoring.
17
5.DISCOUNTEDCASHFLOWANALYSISInthischapterthepopularDCFmodelanditscomponentsareexplained,followedbytheresultswithregardtotheapplicationofthismodelbytheinvestmentbankanalysts.5.1OverviewDCFComponents5.1.1CostofCapitalAsmentionedearlier,researchbyDeloofetal.(2002),pointedoutthattheDFCFisthemostusedmethodbyunderwritersinvaluingIPOsfortheBelgiummarket.InresearchdonebyBruneretal.(1998)wheretheydocumenttheirfindingsfromasurveyonwhatfinanciallysophisticatedcompaniesandfinancialadvisersusetoestimatecostofcapital,theytoofindtheDCFtobethedominantinvestment‐evaluationtechnique.AnimportantandsignificantassumptionintheDCFanalysisisthechoiceofthediscountrate,orcostofcapital.Thecostofcapitalrepresenttherequiredrateofreturngiventherisksinherentinthebusinessandindustry,theuncertaintyregardingthecompany’sfuturecashflows(volatility)andtheassumedcapitalstructureofthebusiness.Acostofcapitalisalwaysforwardlooking.Asinvestorscontributecapitalwiththeexpectationthattheriskoffuturecashflowswillbeoffsetbyanappropriatereturn.Thecostofcapitalistypicallyestimatedbystudyingthecostofcapitalofexistingbusinesswithsimilarcharacteristics.ThemostpopularmethodincalculatingthecostofcapitalistheWeightedAverageCostofCapital,orWACC(presentedinfigure2).Thisformulablendstherequiredratesofreturnforbothdebtandequityholders.Figure2:FormulaWeightedAverageCostofCapital
5.1.1.aCostofDebtThedebtprovidersrequireareturn(Kd)thatistaxdeductablefromthecorporateperspective,andthatisusuallyequaltotheyieldonagovernmentbondplusacreditspread.Thecreditspreaddependsonthecreditworthinessofacompanythatisoftenresembledbyacreditrating,whichisreceivedbyratingagenciessuchasMoody’sorStandard&Poor’s.Therefore,Iwillalsocheckiftheanalystsreportacreditratingandsubsequentlymakeassumptionsontheabilityofthefirmtofulfillitsobligations,withforexampleinterestcoverratios.Alotofcompanieshaveactivitiesinavarietyofcountriesandarefacedwithmultipletaxrates.Forthecostofdebtitisimportanttomeasuretheappropriatemarginaltaxrateasaccurateaspossible.Sincethecompanybeingvaluedcreatessubstantialrevenueoutsidetherehomecountry,Iwillalsoreportwhatassumptionsaremadeonthemarginaltaxrate5.1.1.bCostofEquityTheequityproviders’requiredreturndependsontheriskassociatedwiththeoperationsofthecompanyandthelevelofdebtfinancing.Therequiredreturn(Ke)isoftencalculatedusingtheCapitalAssetPricingModel(CAPM).FromasurveyconductedamongsomeofthemostfinanciallysophisticatedcompaniesandfinancialadvisersbyBruneretal.(1998)theydocumenttheCAPMtobethedominantmodelforestimatingthecostofequity.NexttotheCAPM,theaveragestock
18
returnsandamultibetaCAPMarethemostpopular.TheCAPMdependsonmultipleassumptions,whicharetherisk‐freerate,beta(riskrelativetothemarket)andanexpectedreturnofthemarket(marketriskpremium).Theseunderlyingassumptionsthathavetobemadeareoftensubjectofdiscussion.Forexampleonthechoiceoftherisk‐freerateBruneretal.(1998)document:“Oursurveyresultsrevealastrongpreferenceonthepartofpractitionersforlong‐termbondyields.Ofbothcorporationsandfinancialadvisers,70%useTreasurybondyieldsmaturitiesoftenyearsorgreater.Incontrast,43%ofthebooksadvocatedtheT‐billyield,whileonly29%usedlong‐termTreasuryyields.”Theyreportevenmoredisparityonchoicesonmarketriskpremium;“Choiceofanequitymarketriskpremiumisthesubjectofconsiderablecontroversybothastoitsvalueandmethodofestimation.Mostofourbest‐practicecompaniesuseapremiumof6%orlowerwhilemanytextsandfinancialadvisersusehigherfigures.”ThedisparityisconfirmedbyKolleretal.(2005)whoquotedthefollowing:“sizingthemarketriskpremium,thedifferencebetweenthemarket’sexpectedreturnandtherisk‐freerate,isarguablythemostdebatedissueinfinance”.5.1.1.cCapitalStructureAnotherimportantassumptionmadeforthevaluationprocessistheassumptionsforthecapitalstructureofafirm.FromtheformulaforcalculatingtheWACCyoucanseethecapitalstructureisakeydeterminantforthecostofcapital.Sincethecostofcapitalshouldrelyontargetweights,ratherthancurrentweights,Iwillprovidetheassumptionsmadebytheinvestmentbankanalystsonestimatingasustainablecapitalstructure.5.1.2ContinuingValueTheestimationoftotalenterprise‐valueconsistsofthepresentvalueofthecashflowsduringtheforecastperiodandthepresentvalueofcashflowsaftertheforecastperiod,theso‐calledcontinuingvalue.Theassumptionsmadeincalculatingthisvalueareimportant,sincethecontinuingvalueoftenaccountsforalargepercentageofafirm’stotalvalue.WhenusingtheenterpriseDCFanalysisthecontinuingvalueiscalculatedusingthenormalizedlevelofNOPLATinthefirstyearaftertheforecastperiod,theexpectedgrowthrateinNOPLATinperpetuity,theexpectedrateofreturnonnewinvestedcapital(RONIC)andtheWACC.Thechoicesonthesefiguresareveryimportantandshouldbechosenthoughtfully.Anerrorinjudgment,forexampleonthechoiceforthegrowthrateinperpetuity,canhavesubstantialinfluencesontheestimationofthecontinuingvalue.FortheRONICitisexpected,consistentwitheconomictheory,competitionwilleventuallyeliminateanyabnormalreturnsandtheRONICwillequaltheWACC.Onthegrowthrateinperpetuityitisexpectedthatafirmcan’tsustaintogrowfasterthantheeconomyforlongperiods.
19
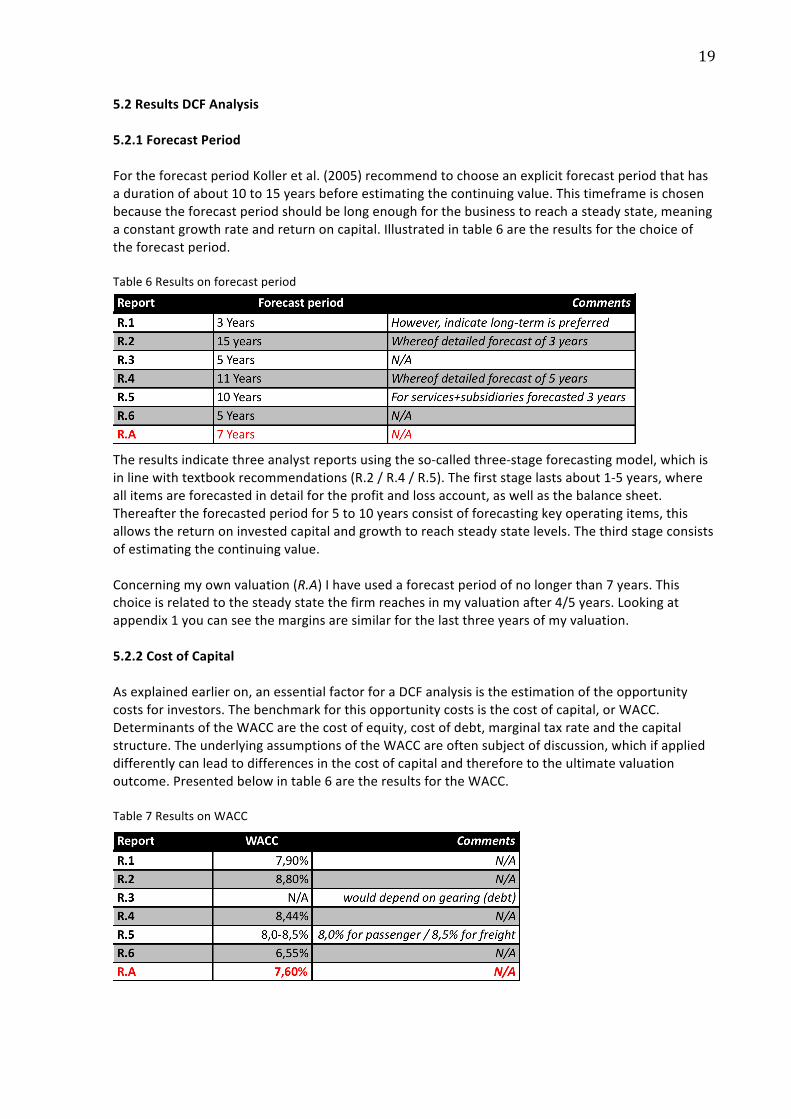
5.2ResultsDCFAnalysis5.2.1ForecastPeriodFortheforecastperiodKolleretal.(2005)recommendtochooseanexplicitforecastperiodthathasadurationofabout10to15yearsbeforeestimatingthecontinuingvalue.Thistimeframeischosenbecausetheforecastperiodshouldbelongenoughforthebusinesstoreachasteadystate,meaningaconstantgrowthrateandreturnoncapital.Illustratedintable6aretheresultsforthechoiceoftheforecastperiod.Table6Resultsonforecastperiod
Theresultsindicatethreeanalystreportsusingtheso‐calledthree‐stageforecastingmodel,whichisinlinewithtextbookrecommendations(R.2/R.4/R.5).Thefirststagelastsabout1‐5years,whereallitemsareforecastedindetailfortheprofitandlossaccount,aswellasthebalancesheet.Thereaftertheforecastedperiodfor5to10yearsconsistofforecastingkeyoperatingitems,thisallowsthereturnoninvestedcapitalandgrowthtoreachsteadystatelevels.Thethirdstageconsistsofestimatingthecontinuingvalue.Concerningmyownvaluation(R.A)Ihaveusedaforecastperiodofnolongerthan7years.Thischoiceisrelatedtothesteadystatethefirmreachesinmyvaluationafter4/5years.Lookingatappendix1youcanseethemarginsaresimilarforthelastthreeyearsofmyvaluation.5.2.2CostofCapitalAsexplainedearlieron,anessentialfactorforaDCFanalysisistheestimationoftheopportunitycostsforinvestors.Thebenchmarkforthisopportunitycostsisthecostofcapital,orWACC.DeterminantsoftheWACCarethecostofequity,costofdebt,marginaltaxrateandthecapitalstructure.TheunderlyingassumptionsoftheWACCareoftensubjectofdiscussion,whichifapplieddifferentlycanleadtodifferencesinthecostofcapitalandthereforetotheultimatevaluationoutcome.Presentedbelowintable6aretheresultsfortheWACC.Table7ResultsonWACC
20
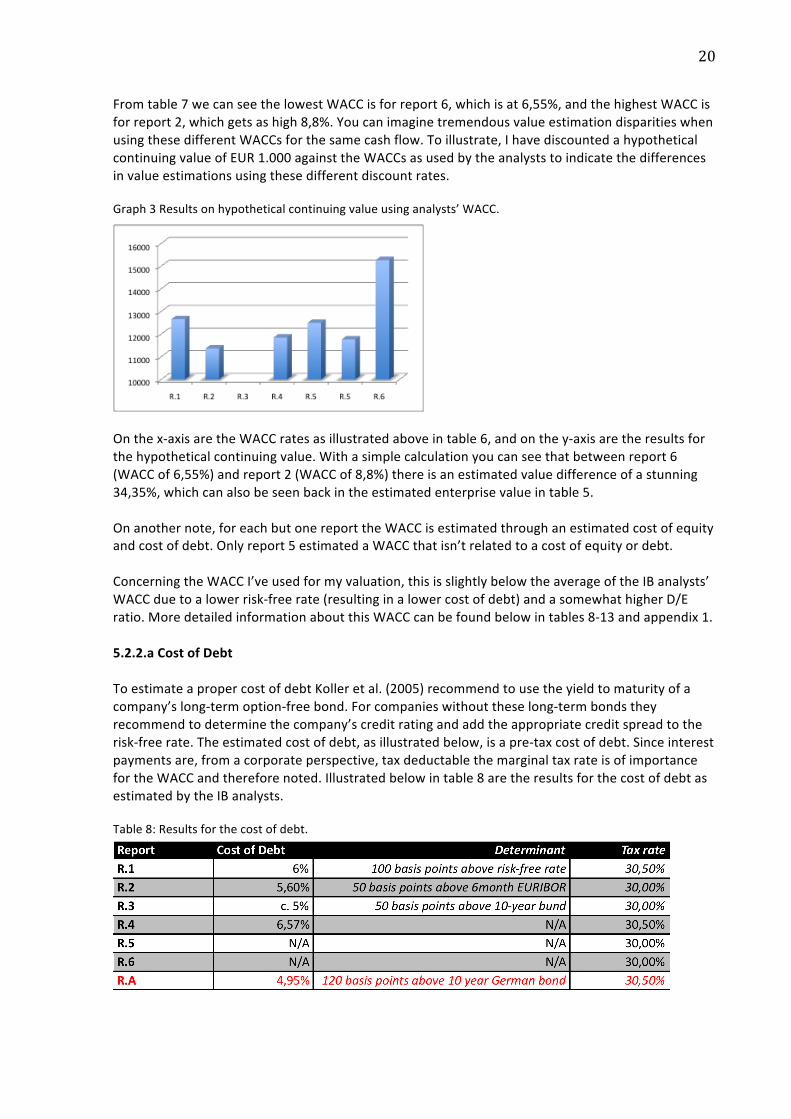
Fromtable7wecanseethelowestWACCisforreport6,whichisat6,55%,andthehighestWACCisforreport2,whichgetsashigh8,8%.YoucanimaginetremendousvalueestimationdisparitieswhenusingthesedifferentWACCsforthesamecashflow.Toillustrate,IhavediscountedahypotheticalcontinuingvalueofEUR1.000againsttheWACCsasusedbytheanalyststoindicatethedifferencesinvalueestimationsusingthesedifferentdiscountrates.Graph3Resultsonhypotheticalcontinuingvalueusinganalysts’WACC.
Onthex‐axisaretheWACCratesasillustratedaboveintable6,andonthey‐axisaretheresultsforthehypotheticalcontinuingvalue.Withasimplecalculationyoucanseethatbetweenreport6(WACCof6,55%)andreport2(WACCof8,8%)thereisanestimatedvaluedifferenceofastunning34,35%,whichcanalsobeseenbackintheestimatedenterprisevalueintable5.Onanothernote,foreachbutonereporttheWACCisestimatedthroughanestimatedcostofequityandcostofdebt.Onlyreport5estimatedaWACCthatisn’trelatedtoacostofequityordebt.ConcerningtheWACCI’veusedformyvaluation,thisisslightlybelowtheaverageoftheIBanalysts’WACCduetoalowerrisk‐freerate(resultinginalowercostofdebt)andasomewhathigherD/Eratio.MoredetailedinformationaboutthisWACCcanbefoundbelowintables8‐13andappendix1.5.2.2.aCostofDebtToestimateapropercostofdebtKolleretal.(2005)recommendtousetheyieldtomaturityofacompany’slong‐termoption‐freebond.Forcompanieswithouttheselong‐termbondstheyrecommendtodeterminethecompany’screditratingandaddtheappropriatecreditspreadtotherisk‐freerate.Theestimatedcostofdebt,asillustratedbelow,isapre‐taxcostofdebt.Sinceinterestpaymentsare,fromacorporateperspective,taxdeductablethemarginaltaxrateisofimportancefortheWACCandthereforenoted.Illustratedbelowintable8aretheresultsforthecostofdebtasestimatedbytheIBanalysts.Table8:Resultsforthecostofdebt.
21
Theresultsshowadisparityinthecostofdebtamongtheanalystreportsthatrunsuptoasmuchas1,57%.Threeanalystsclarifiedontheirchoiceforthecostofdebt.ForallthreeanalystsitwasofgreatimportancethatthemajorshareholderofDBMListhe100%stateownedcompanyDB.ThefirstreportindicatedacreditratingforDBofAa1(Moody’s),whichineffectleadstoa100bpextraabovetherisk‐freerate.Thesecondreports’analystreportedanadditionalcreditspreadof50basispointsabovethe6‐monthEURIBOR,relatedtothecreditworthinessofDBML’smajorshareholderDB.Report3alsoindicatedacredityieldof50bp,whichisaddedtothe10‐yearrateonGermangovernmentbonds.Overalldespitethelackofresultsitcanbesaidthat,withoutacompanybondyield,theappointedcreditratingandsubsequentlyitsbelongingcreditspreadisagooddeterminationforthecostofdebt.FormyestimationofthecostofdebtIhavealsousedthecreditratingofthemothercompanyDBAG(Table8andAppendix1).5.2.2.bCostofEquityAsmentionedearlierevidencepointedoutthatthecostofequityisusuallyestimatedusingtheCAPMoramodifiedCAPM.Illustratedbelowintable9aretheresultsforthecostofequityandthemodelusedtoestimatethispercentage.Table9;ResultsonCostofEquity.
Forallestimatedrequiredreturnsonequity,withtheexceptionofoneduetolackofinformation,theCAPMhasbeenused.Noneofthereportsindicateduseofamulti‐betaCAPM.TheresultsforthecostofequitymodelareinlinewiththeresultsfromBruneretal(1998),where80%ofthefinancialadvisersindicatedtousetheCAPMinordertoestimatethecostofequity,andtheresultsarealsoconsistentwiththeresultsfromGraham&Harvey(1999)where73,5%ofCFOssurveyedindicatedtouseofCAPMforthecostofequity.ItisnosurprisetheCAPMremainsthefavoritemodelforpractitionerstoestimatethecostofequity.AsquotedbyKolleretal(2005)onthetheoryregardingthecostofequity:“Ittakesabettertheorytokillanexistingtheory,andwehaveyettoseethebettertheory.Therefore,wecontinuetousetheCAPMwhilekeepingawatchfuleyeonnewresearchinthearea”.Risk‐freerateUsuallythechoicefortherisk‐freerateisrelatedtogovernmentdefault‐freebonds.Althoughthesedon’tnecessarilyarerisk‐free,thelonger‐termgovernmentbondsfromtheU.S.andWesternEuropehaverelativelylowrisk.FromthesurveyconductedbyBruneretal.(1998)theyfoundthechoiceontherisk‐freeratetobetypicallybetweenthe90‐dayTreasurybillyieldandalong‐termTreasurybondyield.Inthatsamesurvey,70%ofthefinancialadvisersindicatedtouseyieldson10yearsorlongermaturitiesontreasuries.Kolleretal.(2005)recommendagovernmentbondthatbestmatchestheentirecashflowbeingvalued.Illustratedbelowintable10aretheresultsfortherisk‐freerates.
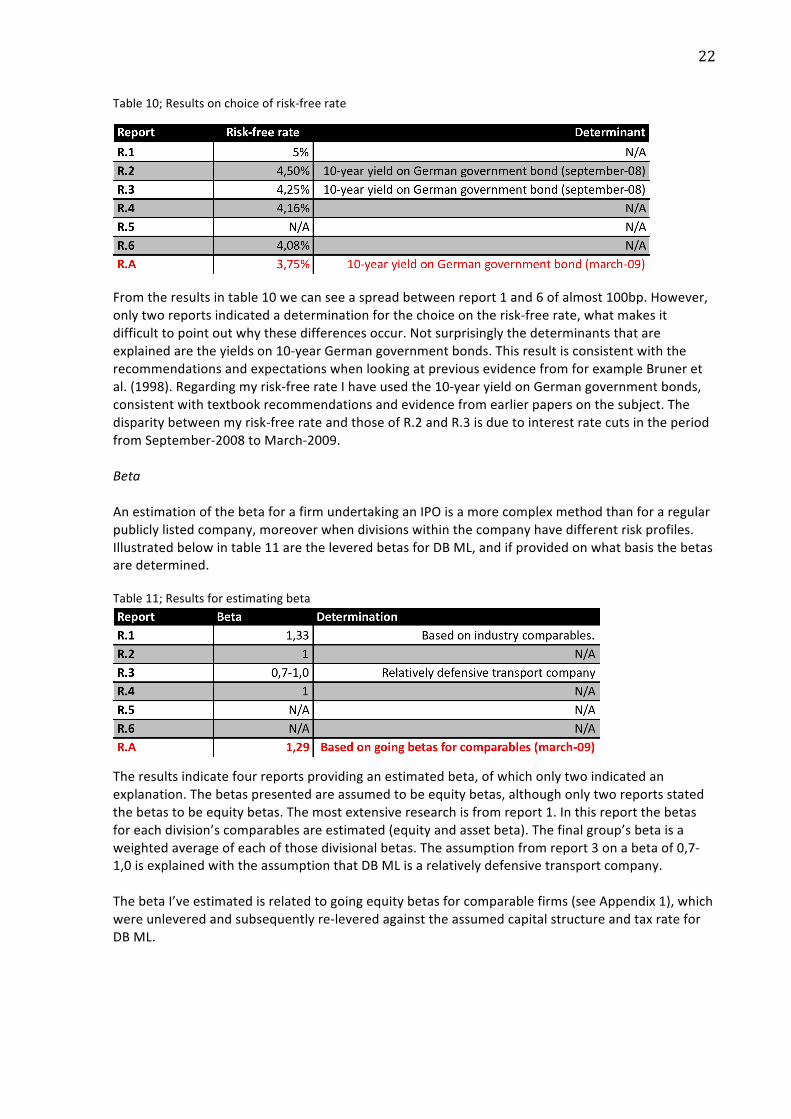
22
Table10;Resultsonchoiceofrisk‐freerate
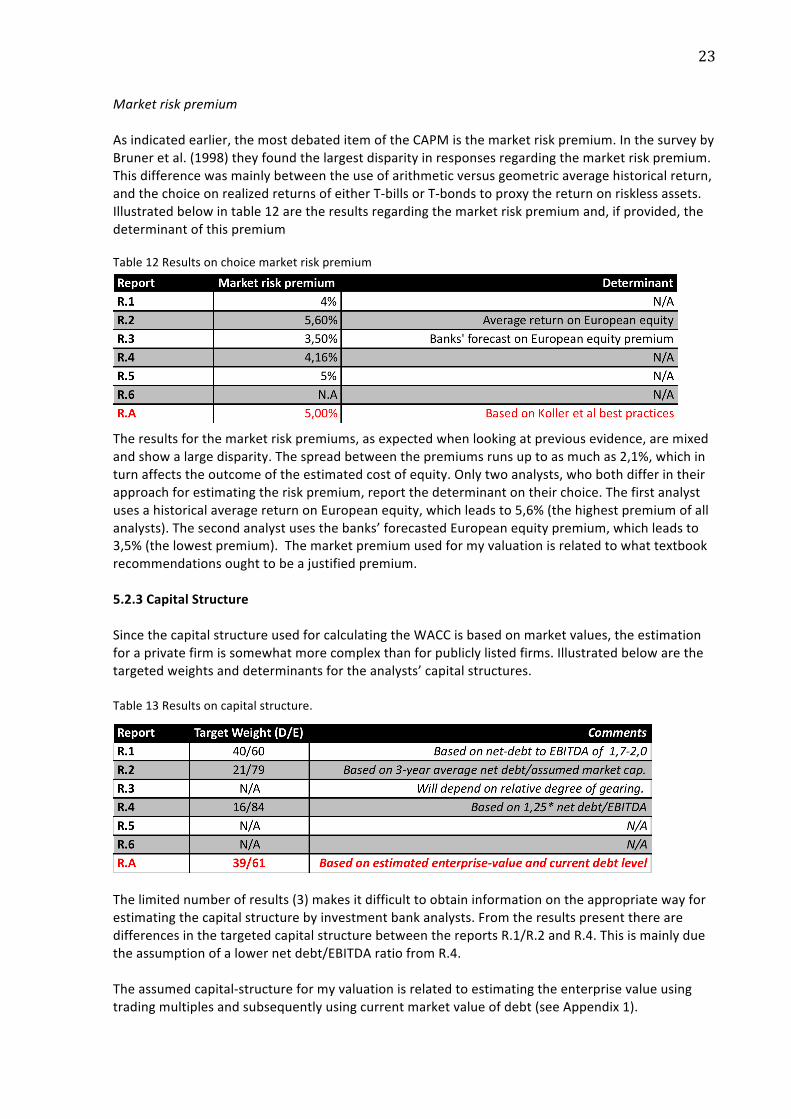
Fromtheresultsintable10wecanseeaspreadbetweenreport1and6ofalmost100bp.However,onlytworeportsindicatedadeterminationforthechoiceontherisk‐freerate,whatmakesitdifficulttopointoutwhythesedifferencesoccur.Notsurprisinglythedeterminantsthatareexplainedaretheyieldson10‐yearGermangovernmentbonds.ThisresultisconsistentwiththerecommendationsandexpectationswhenlookingatpreviousevidencefromforexampleBruneretal.(1998).Regardingmyrisk‐freerateIhaveusedthe10‐yearyieldonGermangovernmentbonds,consistentwithtextbookrecommendationsandevidencefromearlierpapersonthesubject.Thedisparitybetweenmyrisk‐freerateandthoseofR.2andR.3isduetointerestratecutsintheperiodfromSeptember‐2008toMarch‐2009.BetaAnestimationofthebetaforafirmundertakinganIPOisamorecomplexmethodthanforaregularpubliclylistedcompany,moreoverwhendivisionswithinthecompanyhavedifferentriskprofiles.Illustratedbelowintable11aretheleveredbetasforDBML,andifprovidedonwhatbasisthebetasaredetermined.Table11;Resultsforestimatingbeta
Theresultsindicatefourreportsprovidinganestimatedbeta,ofwhichonlytwoindicatedanexplanation.Thebetaspresentedareassumedtobeequitybetas,althoughonlytworeportsstatedthebetastobeequitybetas.Themostextensiveresearchisfromreport1.Inthisreportthebetasforeachdivision’scomparablesareestimated(equityandassetbeta).Thefinalgroup’sbetaisaweightedaverageofeachofthosedivisionalbetas.Theassumptionfromreport3onabetaof0,7‐1,0isexplainedwiththeassumptionthatDBMLisarelativelydefensivetransportcompany.ThebetaI’veestimatedisrelatedtogoingequitybetasforcomparablefirms(seeAppendix1),whichwereunleveredandsubsequentlyre‐leveredagainsttheassumedcapitalstructureandtaxrateforDBML.
23
MarketriskpremiumAsindicatedearlier,themostdebateditemoftheCAPMisthemarketriskpremium.InthesurveybyBruneretal.(1998)theyfoundthelargestdisparityinresponsesregardingthemarketriskpremium.Thisdifferencewasmainlybetweentheuseofarithmeticversusgeometricaveragehistoricalreturn,andthechoiceonrealizedreturnsofeitherT‐billsorT‐bondstoproxythereturnonrisklessassets.Illustratedbelowintable12aretheresultsregardingthemarketriskpremiumand,ifprovided,thedeterminantofthispremiumTable12Resultsonchoicemarketriskpremium
Theresultsforthemarketriskpremiums,asexpectedwhenlookingatpreviousevidence,aremixedandshowalargedisparity.Thespreadbetweenthepremiumsrunsuptoasmuchas2,1%,whichinturnaffectstheoutcomeoftheestimatedcostofequity.Onlytwoanalysts,whobothdifferintheirapproachforestimatingtheriskpremium,reportthedeterminantontheirchoice.ThefirstanalystusesahistoricalaveragereturnonEuropeanequity,whichleadsto5,6%(thehighestpremiumofallanalysts).Thesecondanalystusesthebanks’forecastedEuropeanequitypremium,whichleadsto3,5%(thelowestpremium).Themarketpremiumusedformyvaluationisrelatedtowhattextbookrecommendationsoughttobeajustifiedpremium.5.2.3CapitalStructureSincethecapitalstructureusedforcalculatingtheWACCisbasedonmarketvalues,theestimationforaprivatefirmissomewhatmorecomplexthanforpubliclylistedfirms.Illustratedbelowarethetargetedweightsanddeterminantsfortheanalysts’capitalstructures.Table13Resultsoncapitalstructure.
Thelimitednumberofresults(3)makesitdifficulttoobtaininformationontheappropriatewayforestimatingthecapitalstructurebyinvestmentbankanalysts.FromtheresultspresenttherearedifferencesinthetargetedcapitalstructurebetweenthereportsR.1/R.2andR.4.Thisismainlyduetheassumptionofalowernetdebt/EBITDAratiofromR.4.Theassumedcapital‐structureformyvaluationisrelatedtoestimatingtheenterprisevalueusingtradingmultiplesandsubsequentlyusingcurrentmarketvalueofdebt(seeAppendix1).
24
5.2.4ContinuingValueAftertheexplicitforecastperiodthecontinuingvalueofthefirmiscalculated.Thecontinuingvaluecreatesacredibleforecastforthelongrunbasedonfundamentals.Presentedintable14aretheresultsfortheterminalgrowthassumptionmadetoestimatethecontinuingvalue.Table14Resultsondeterminingcontinuingvalue.
Consistentwithrecommendationsfromliteraturetheterminalgrowthratesaresetlow(inlinewithinflationfigure),notoutpacingthegrowthoftheeconomyforthelonger‐term.Aswillbeshownlateron,withasensitivityanalysis,analystswillbeabletoshowwhatimpactahigher/lowerterminalgrowthratewillhaveontheestimatedvalue.Asmentionedearlieron,theassumptionsunderlyingthecontinuingvalueneedtobeasaccurateaspossible,sincetheterminalvalueoftenaccountsforalargepercentageoftotalestimatedvalue.Toillustratethis,Ihaveprovidedsomemoredetailedinformationontheestimatedterminalvalueintable15.ForthereportsthatprovidedthenecessaryinformationIhavedocumentedtheabsoluteterminalvalue,andthepercentageoftheestimatedterminalvaluerelativetotheestimatedenterprisevalue.Theresultsontheterminalvalueindicatetheimportanceofestimatinganasaccurateaspossibleterminalvalue.Fromtable14weseethatthelowestpercentageofterminalvaluerelativetoenterprisevaluealreadyaccountsfor51,88%ofenterprisevalueandforreport5getsashighas71,30%.Table15ResultsonabsoluteterminalvalueandterminalvaluerelativetoEV.
25
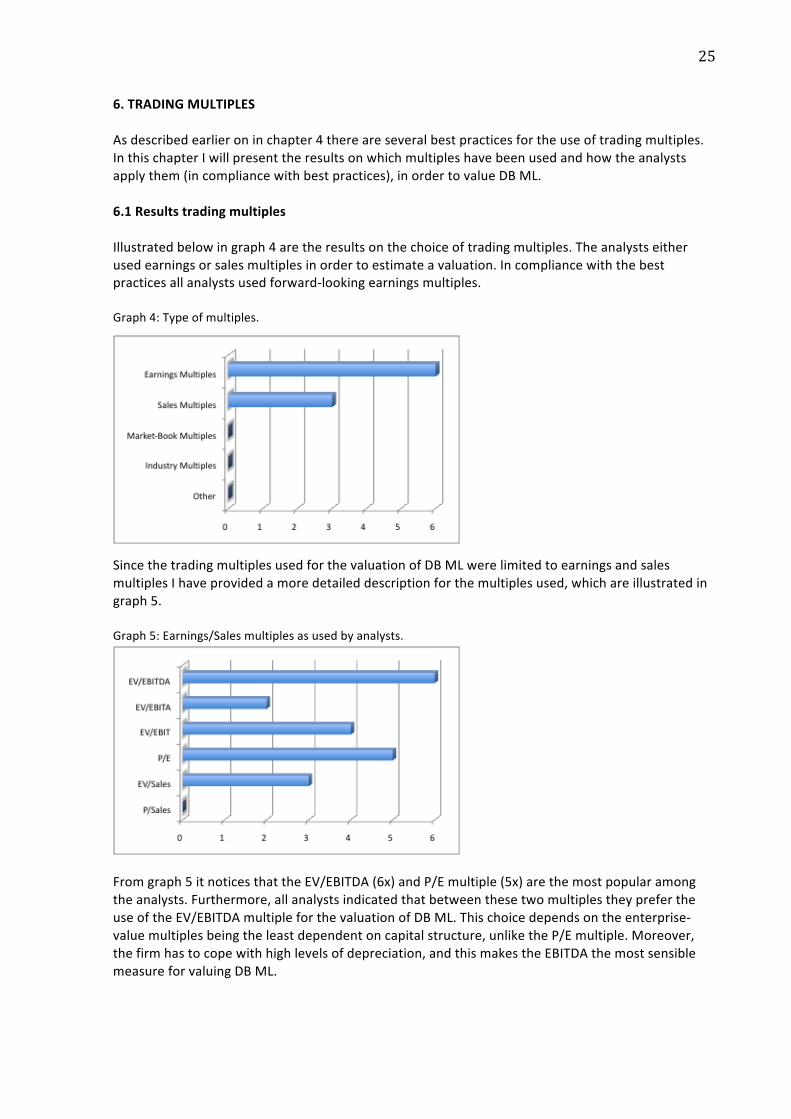
6.TRADINGMULTIPLESAsdescribedearlieroninchapter4thereareseveralbestpracticesfortheuseoftradingmultiples.InthischapterIwillpresenttheresultsonwhichmultipleshavebeenusedandhowtheanalystsapplythem(incompliancewithbestpractices),inordertovalueDBML.6.1ResultstradingmultiplesIllustratedbelowingraph4aretheresultsonthechoiceoftradingmultiples.Theanalystseitherusedearningsorsalesmultiplesinordertoestimateavaluation.Incompliancewiththebestpracticesallanalystsusedforward‐lookingearningsmultiples.Graph4:Typeofmultiples.
SincethetradingmultiplesusedforthevaluationofDBMLwerelimitedtoearningsandsalesmultiplesIhaveprovidedamoredetaileddescriptionforthemultiplesused,whichareillustratedingraph5.Graph5:Earnings/Salesmultiplesasusedbyanalysts.
Fromgraph5itnoticesthattheEV/EBITDA(6x)andP/Emultiple(5x)arethemostpopularamongtheanalysts.Furthermore,allanalystsindicatedthatbetweenthesetwomultiplestheyprefertheuseoftheEV/EBITDAmultipleforthevaluationofDBML.Thischoicedependsontheenterprise‐valuemultiplesbeingtheleastdependentoncapitalstructure,unliketheP/Emultiple.Moreover,thefirmhastocopewithhighlevelsofdepreciation,andthismakestheEBITDAthemostsensiblemeasureforvaluingDBML.
26
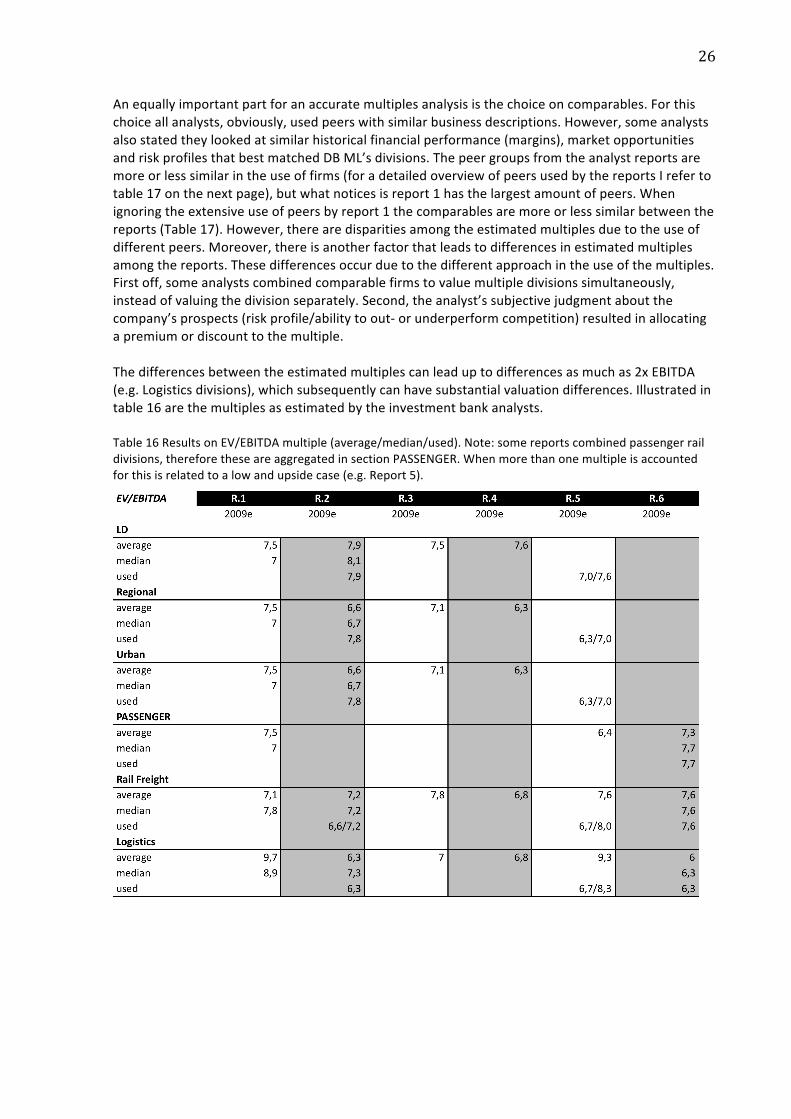
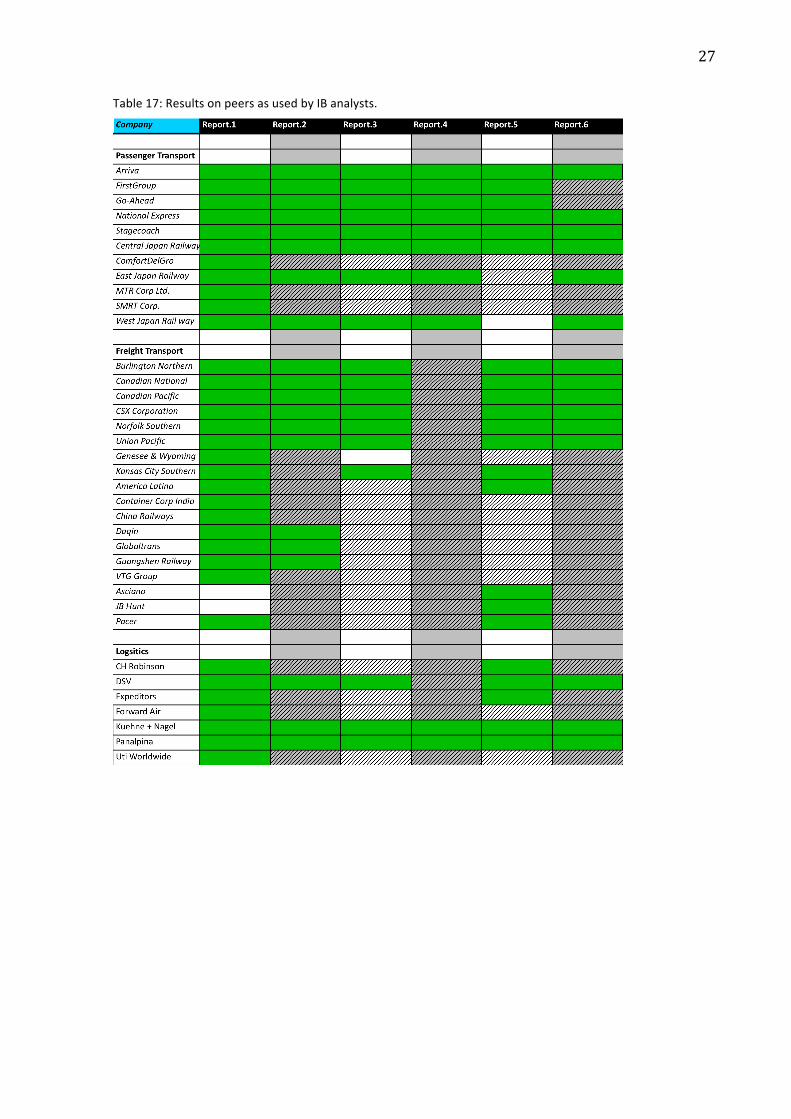
Anequallyimportantpartforanaccuratemultiplesanalysisisthechoiceoncomparables.Forthischoiceallanalysts,obviously,usedpeerswithsimilarbusinessdescriptions.However,someanalystsalsostatedtheylookedatsimilarhistoricalfinancialperformance(margins),marketopportunitiesandriskprofilesthatbestmatchedDBML’sdivisions.Thepeergroupsfromtheanalystreportsaremoreorlesssimilarintheuseoffirms(foradetailedoverviewofpeersusedbythereportsIrefertotable17onthenextpage),butwhatnoticesisreport1hasthelargestamountofpeers.Whenignoringtheextensiveuseofpeersbyreport1thecomparablesaremoreorlesssimilarbetweenthereports(Table17).However,therearedisparitiesamongtheestimatedmultiplesduetotheuseofdifferentpeers.Moreover,thereisanotherfactorthatleadstodifferencesinestimatedmultiplesamongthereports.Thesedifferencesoccurduetothedifferentapproachintheuseofthemultiples.Firstoff,someanalystscombinedcomparablefirmstovaluemultipledivisionssimultaneously,insteadofvaluingthedivisionseparately.Second,theanalyst’ssubjectivejudgmentaboutthecompany’sprospects(riskprofile/abilitytoout‐orunderperformcompetition)resultedinallocatingapremiumordiscounttothemultiple.Thedifferencesbetweentheestimatedmultiplescanleaduptodifferencesasmuchas2xEBITDA(e.g.Logisticsdivisions),whichsubsequentlycanhavesubstantialvaluationdifferences.Illustratedintable16arethemultiplesasestimatedbytheinvestmentbankanalysts.Table16ResultsonEV/EBITDAmultiple(average/median/used).Note:somereportscombinedpassengerraildivisions,thereforetheseareaggregatedinsectionPASSENGER.Whenmorethanonemultipleisaccountedforthisisrelatedtoalowandupsidecase(e.g.Report5).
27
Table17:ResultsonpeersasusedbyIBanalysts.
28
7.GROWTH,COSTESTIMATIONSANDMARGINSTogetagoodoverviewoftheperformanceofacompanythefirm’smarginsareoftencomparedwithindustrycomparables.FromthereportsitbecomesclearthatthebestmarginforthisfirmistheEBITDAmargin.Iwillthereforecomparethedevelopmentofthismarginforeachreport.BesidestheEBITDAmarginIwillalsocomparethenetincomemargins,sincetheseareofimportancetofutureshareholders.SincetheEBITDAmarginisinessencetheoperatingcashflow,Iwillpresentgrowthfiguresandassumptionsmadeforrevenueandcosts.7.1Resultsforgrowth,costestimationsandmargins.7.1.1GrowthPresentedintable18aretheresultsofCAGRforrevenue.Table18:Resultsongrowth.
Theresultsindicatedeviationsamongtherevenuegrowthfigures.Forexample,betweenreport4and5there’sadifferenceintherevenueCAGRof2,6%,whichinabsolutetermsmeansadifferenceinrevenueofEUR2.6billion.However,thedifferenceinrevenuegrowthisn’tsufficienttoexplainanypotentialdifferencesinvaluationoutcome.Relatedtomyvaluation:thegrowthratesaresubstantiallylowerthanthoseoftheinvestmentbankanalysts.ThisismainlyrelatedtotheheavilyslowingoftheeconomyintheperiodSeptember‐2008tillMarch‐2009.FormoredetailsseeAppendix1.7.1.2CostEstimationsTheseconditemfromtheprofitandlossaccountthatisessentialinestimatingtheEBITDAmargin,aretheexpenses.Intable19aretheresultsonthemethodforcostestimation.Table19Resultsonmethodologyoncostsandexpensesestimation.
29
Theresultsfromtable17indicatethatallanalystsmakeuseofmarginsinordertoestimatethecosts,whereonereportalsomadeuseofbottom‐upestimationsforseveraldivisions.Itmayseemasasimplifiedmethod,buteachanalystreportbackedthesemarginswiththeirviewonthecompany’sabilitytocontrolcosts,andforecastedanyincreases/declinesincostcomponentsofDBML.7.1.3.MarginsSincetheEBITDAmarginisseenasthebestmultipletoestimatethevalueofDBML,Ihavepresentedtheresultsforthismarginintable20.Table20ResultsonEBITDAmargin.
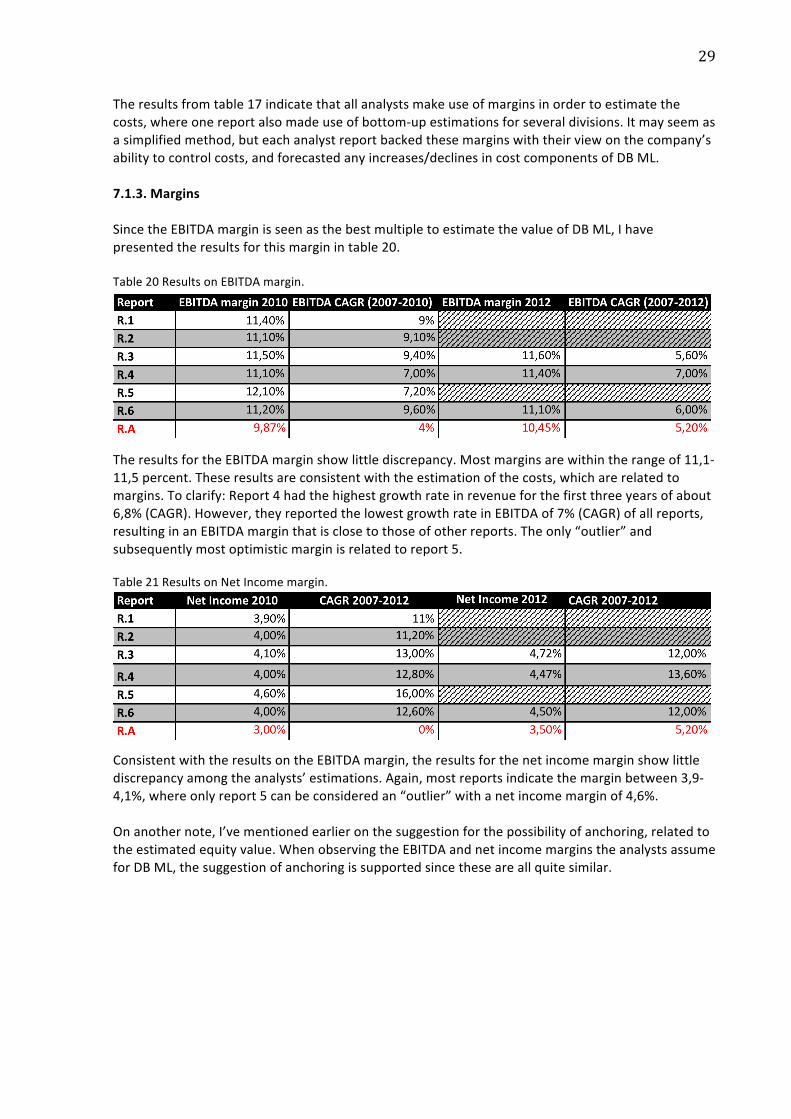
TheresultsfortheEBITDAmarginshowlittlediscrepancy.Mostmarginsarewithintherangeof11,1‐11,5percent.Theseresultsareconsistentwiththeestimationofthecosts,whicharerelatedtomargins.Toclarify:Report4hadthehighestgrowthrateinrevenueforthefirstthreeyearsofabout6,8%(CAGR).However,theyreportedthelowestgrowthrateinEBITDAof7%(CAGR)ofallreports,resultinginanEBITDAmarginthatisclosetothoseofotherreports.Theonly“outlier”andsubsequentlymostoptimisticmarginisrelatedtoreport5.Table21ResultsonNetIncomemargin.
ConsistentwiththeresultsontheEBITDAmargin,theresultsforthenetincomemarginshowlittlediscrepancyamongtheanalysts’estimations.Again,mostreportsindicatethemarginbetween3,9‐4,1%,whereonlyreport5canbeconsideredan“outlier”withanetincomemarginof4,6%.Onanothernote,I’vementionedearlieronthesuggestionforthepossibilityofanchoring,relatedtotheestimatedequityvalue.WhenobservingtheEBITDAandnetincomemarginstheanalystsassumeforDBML,thesuggestionofanchoringissupportedsincetheseareallquitesimilar.
30
8.SENSITIVITY&SCENARIOANALYSISAnimportantpartforthevaluationofafirmisidentifyingkeyvaluedrivers.Todeterminetheseso‐calledvaluedriversthereisatechniquethatiscalledthesensitivityanalysis.Whenthevaluedriversareidentifiedthesefactorsareforecastedwithhighcaution.However,oftentheseforecastsarebasedonasinglepathoutcome,butafixedpathisartificial.Atanymomentintimelotsofuncertaintiesexistandthereforenumerouspotentialoutcomes.InthissectionIwillfirstpresentadescriptionofthesensitivityandscenarioanalysisandsubsequentlypresenttheresultsontheuseofthesemethodsinthereports.8.1DescriptionofasensitivityandscenarioanalysisSensitivityanalysis;Thesensitivityanalysisisatechniquethatdeterminestheimpactonadependentvariablewhenanindependentvariablechanges.Thereareseveraladvantagesusingsuchananalysis,aswellasdisadvantages.Theadvantagesarethatitdeterminesthemostimportantdriversandanalysesimpactonthecashflowand/orvalue.Furthermoreithelpsthemanagementtofocustheirattentiontomonitorandmanagethosefactorsthatareconsideredtobethemostimportantvaluedrivers.Disadvantagesarethattheanalysiscanpossiblyneglectinterdependenciesamongvaluedrivers,whennotexplicitlymodeled.Itcanalsoneglectthelikeliness,oreffortthathastobeputin,tochangeavaluedriver.Moreover,itcanscaremanagersawayfrompotentialinvestmentopportunitiesbecauseofhighsensitivities.Scenarioanalysis;Thescenarioanalysisisausefultooltoevaluatedifferentoutcomesforafirm’sprospectsifasituationturns.Certainlyduringdifficulttimeswhenuncertaintydominates,liketheoneduringthewritingofthispaper(beginning2009),amultiplescenarioanalysisisamusthave.Togiveanillustration;whenafirmhasgoodprospectsandincreasesitsrevenue,itismostofthetimeabletogrowitsearningsbyagreateramount(considertheeconomiesofscale).However,whenafirmisindifficultiesandsubsequentlyhastocopewithasharpdeclineinrevenue,itwouldalsohavetocutdowncosts,whichisn’talwaysdoable.Youcanimaginealargespreadbetweenthevalueofafirmiftheupsidescenariotakesplaceorthemorebearishscenariooccurs.Therefore,consideringmultiplescenariosallowsapotentialinvestortoassignhisonweightoneachpotentialoutcomeandgiveshimavaluationspread.8.2ResultsonsensitivityandscenarioanalysisIllustratedbelowintable22aretheresultsontheuseofasensitivityand/orscenarioanalysis.Fromtheresultsitshowsthatfouranalystsapplythesensitivitymethodrelatedtotheestimatedequityvalue.Theymeasurethesensitivityfortheequityvaluewhenchangesoccurinassumptionsmadeontheweightedaveragedcostofcapitalandtheterminalgrowthrate.Twoanalystreportsalsomeasuredsensitivitiesregardingdivisionalrelatedissues.Thisincludesforexamplethesensitivityonrevenue,EBITDAorEBITifDBMLcouldincreaseitstariffsforpassengerrailtravelbyapercentagepointoriftheycouldincreasetheirconcessionrevenueswithoneormorepercentagepoints.Thisdivisional‐basedsensitivityanalysisisveryusefulinassessingdivisionspecificvaluedrivers.Concerningthescenarioanalysis,therearethreereportsthathaveappliedmultiplescenariosforvalueestimation.Theseconsistofalowercase,basecaseandupsidecasescenario.Theupsidescenario,forexample,isestimatedusingmultipleswithapremiumoragainstapeergroupthat

31
consistsoffirmsthathavebetterprospectsandshowedasuperiorfinancialperformanceandthereforetradeathighermultiples.Table22Resultsonsensitivityandscenarioanalysis.

32
9.RISKFACTORSAsGraham&Harvey(1999)mentionintheirpaperthereareotherriskstoacompanythanmarketrisk(beta).AccordinglyIcheckiftheanalystsconsideranyspecificpre‐determinedriskfactorstobeofahighdegreeofinfluencetotheirvaluation,beitinamultibetaCAPMoraffectingforecastedvariables.Theselectionofpre‐determinedriskfactorsisprimarilybasedonwhatGraham&Harvey(1999)considertobethemostimportantadditionalriskfactors.Astheyquote:“Overall,themostimportantadditionalriskfactorsareinterestraterisk,exchangeraterisk,businesscyclerisk,andinflationrisk.”BesidesthesefactorsmentionedIalsocheckforcommoditypricerisk,withspecialattentiontotheoilprice.However,notethisdoesn’timplythecompanybeingvaluedisexposedsolelytothesepre‐determinedriskfactors.9.1ResultsonriskfactorsInthesectionregardingthecostofequitymethodologywealreadysawthatnoneoftheanalystsusedamultibetamodelwithadditionalriskfactors.However,Ihavecheckedifanyofthepre‐determinedriskfactorsareconsideredbytheanalyststopossiblyaffectthevaluationofDBML.Fromgraph6wecanseeallanalystsconsidertheGDPandcommodityprice(inthiscasetheoilprice)tobeofconsiderationtothevaluationprocess.Othernoticeableriskfactorsaretheexchangerateandtheinflationfigure.Althoughmentionedaspossibleriskfactors,thereisn’taclearjudgmentonthedegreeofinfluencetothevaluationprocess,sincethisisasubjectiveopinionoftheanalyst.FormyownvaluationIhaveconsideredtheGDPtobeofsignificantinfluencetotheestimatedvaluation.Graph6:Resultsriskfactors.
33
10.STRATEGICANALYSISTheultimatevaluationjudgmentshouldnotonlybebasedoncalculusbutalsoqualitativeaspects.Togetanasaccuratevaluationaspossibleitisimportanttogetathoroughunderstandingoftheindustrydynamics,thelong‐termindustryattractiveness,thecompetitivepositionofthefirm,thefirm’slong‐termstrategyandthequalityofthemanagement.Thisinvolvesanalyzingkeyindustrytrends,anddevelopingaviewonthedevelopmentofthesetrends.Itincludesassessingthecompany’scompetitiveenvironmentandevaluatingthecompany’sstrengthsandweaknesses.Therearetwofamiliarandcommonlyusedmodelstoconductastrategicanalysisnamely,Porter’s5forces(externalview)andtheSWOTanalysis(internalview).Therefore,Iwillalsodocumentintowhatextentthesemodelsarebeingused,orelementsthereof.Furthermore,Iwillalsodocumentifthereportincludesareviewofthefirm’smanagement.10.1OverviewstrategicanalysesPorter’s5ForcesPorter’s5Forcesanalysisframeworkconsidersthefollowing5forces:
1) Competitiverivalrywithinanindustry2) Bargainingpowerofsuppliers3) Bargainingpowerofcustomers4) Threatofnewentrants5) ThreatofSubstituteproducts
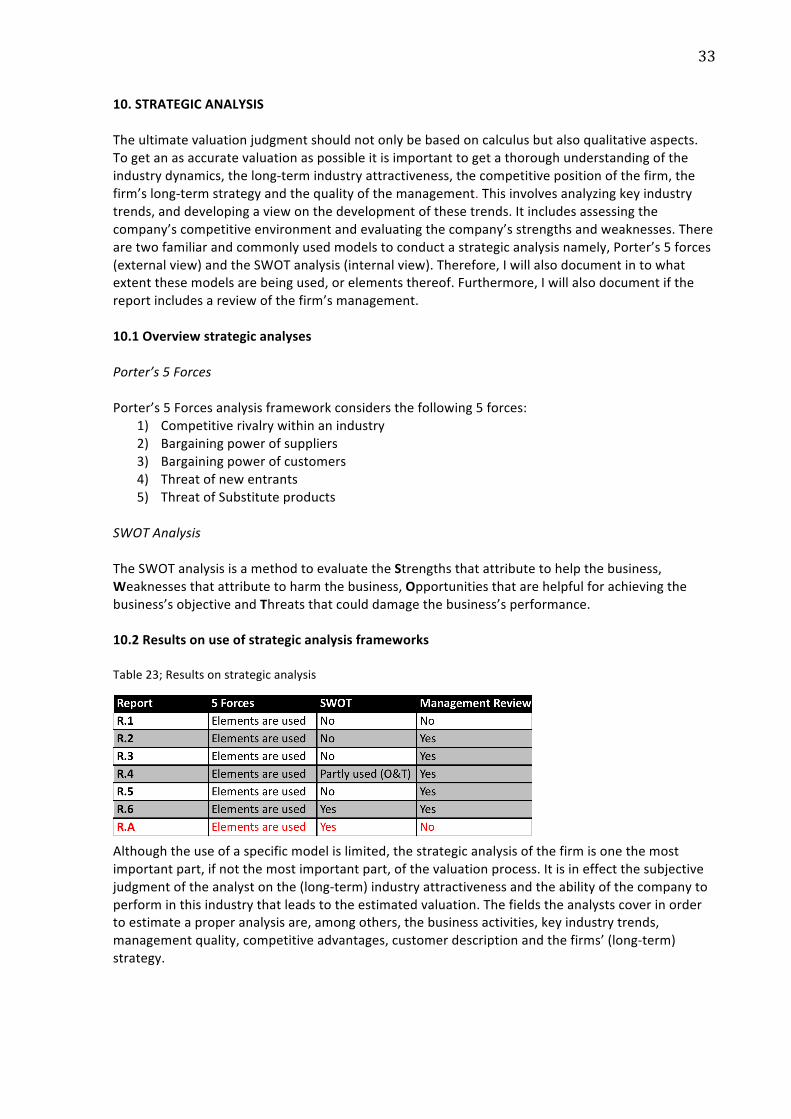
SWOTAnalysisTheSWOTanalysisisamethodtoevaluatetheStrengthsthatattributetohelpthebusiness,Weaknessesthatattributetoharmthebusiness,Opportunitiesthatarehelpfulforachievingthebusiness’sobjectiveandThreatsthatcoulddamagethebusiness’sperformance.10.2ResultsonuseofstrategicanalysisframeworksTable23;Resultsonstrategicanalysis
Althoughtheuseofaspecificmodelislimited,thestrategicanalysisofthefirmisonethemostimportantpart,ifnotthemostimportantpart,ofthevaluationprocess.Itisineffectthesubjectivejudgmentoftheanalystonthe(long‐term)industryattractivenessandtheabilityofthecompanytoperforminthisindustrythatleadstotheestimatedvaluation.Thefieldstheanalystscoverinordertoestimateaproperanalysisare,amongothers,thebusinessactivities,keyindustrytrends,managementquality,competitiveadvantages,customerdescriptionandthefirms’(long‐term)strategy.
34
11.CONCLUSION/DISCUSSIONMyresearchobjectivewastofindoutthebestpracticesforfinancemethods,asusedbyinvestmentbankanalysts.ThroughhavingreviewedsixIPOreportsI’vegotadetailedinsightinhowfinancemethodsareapplied.InthefollowingsectionI’llsummarizemyresultsforeachsubject.ValuationMethodsTheresultsindicatea100%useofbothtradingmultiplesandaDCFanalysisinordertoestimatefairvalue.Furthermore,theresultsindicatetheuseofasum‐of‐the‐partanalysiswhenthecompanyhasmultipledivisions.TheresultsareinconclusivewithregardstowhichmethodisthemostappropriatetovalueanIPO.Inmyviewtheyarebothnecessaryinordertocomeupwithafairvaluation.DCFComponentsConsistentwithpreviousevidencetheWACCisstillthebasisforsettingtheproperdiscountrateinordertovalueafirm.Moreover,aspartoftheWACCtheCAPMisstill,aftermanyyears,thepreferredmodelfortheestimationofthecostofequity.TogointosomemoredetailwithregardstotheCAPMtheresultsindicatethefollowing.Therisk‐freerateshouldbebasedonalong‐term(10yearsormore)governmentbondrate.Wherethebondshouldmatchthecountrythefirmissituated.Theresultsareinconclusivewithrespecttotheestimationofabeta.Inmyvieware‐leveredbetathatisestimatedusingcomparablebetaseemstobethemostappropriatemethod.Onthemarketriskpremiumtheresultsaresimilartothoseofpreviouspapers.Amongtheanalystsaredifferencesinrates(4‐5,6percent)anddeterminants(historicalandforecasted).Itismybelievethatthemarketriskpremiumwillremainoneofthemostdebatedtopicsinthefieldoffinance.Thecostofdebt,eventhoughtheresultsareslim,shouldbeestimated(whenlong‐termoption‐freebondsareabsent)usingthelong‐termrisk‐freerateplusanappropriatecreditspreadbasedonthefirm’screditrating.TradingMultiplesTheresultsfortradingmultiplesindicateconsistencywithbestpracticesasdescribedinthetextbookbyKolleretal.(2005).Thepreferredtradingmultiples,asindicatedbytheanalysts,areforward‐lookingenterprise‐valuemultiple(EV/EBIT(D)A).Thisisbecauseenterprise‐valuemultiplesareunaffectedbycapitalstructureandforward‐lookingearningsarebetterforecastersthancurrentearnings.Theresultsalsoindicateananalyst’ssubjectivejudgmentwithregardstothemultiples.Whenprospectsarebetterthanforthecomparablesthemultiplesareadjustedwithapremiumandviceversa.Growth,CostEstimationsandMarginsTheresultsregardingthedevelopmentsofmarginsandcostestimationindicatetheforecastingofmarginsratherthanforecastingeachlineitemoftheP&Laccount.Thisseemstobeasimplifiedmethod,butisduetothelackofdivisionalfinancialstatements(divisionsareconsolidated)justifiable.Moreover,foreachdivisiontheanalystsgiveaplausibleexplanationfortheirchoiceonmargins.
35
SensitivityandScenarioAnalysisTheresultsindicatea“wide”useamongtheanalysts(5outof6)ofasensitivityanalysis.Thesensitivityanalysisismostlyusedtomeasurethesensitivityoftheestimatedgroupequityvaluetochangesinthelong‐termgrowthrateorcostofcapital.Onereportalsomeasureddivisional‐basedsensitivities,whereforexamplechangesinnumberofpassengersaffectedrevenueandEBITDAonadivisionalbasis.Concerningthescenarioanalysis,theresultsindicatethreereportshavingusedmultiplevaluationoutcomes.Thescenariosconsistofalowcase,basecaseanduppercase.Whenthecompanywouldprospermorethanexpectedtheestimatedvaluationoutcomewouldbehigherandviceversa.Theresultsareinconclusivewithregardtowhichmodelshouldbeusedforthelow,baseoruppercase,ascanbeseenintable20.RiskfactorsTheintentionalmotivationtoinvestigateriskfactorswasthepossibilityofamultibetaCAPMincompliancewithGraham&Harvey(1999).However,sinceamultibetaCAPMhasn’tbeenusedIhavecheckedwhichofthepre‐determinedvariablesareconsideredtopossibleaffectthecompanybeingvalued.Consideringthecompanyisn’tlimitedtotheriskfactorsthatwerepre‐determinedtheGDPandoilpricearethelargestriskfactors(6outof6)forthebusinessofDBML.StrategicanalysisTheresultsindicatehardlyanyuseofaspecifiedstrategicmodel.Only1out6reportsdirectlyusedtheSWOTanalysis.However,thoughnotdirectlyusedthe5forcesfromPorter’smodel,andsomeoftheelementsfromtheSWOT,arecoveredbyeachanalystalbeitinsomeotherform.Althoughtheresultsdon’tindicateanydirectuseofstrategicanalysisdoesn’timplythisisn’timportant.Inthecontrary,thestrategicassessmentofafirmisthemostimportantaspectofavaluation.Havingthatsaid,thevaluationofacompanyshouldbefocusedonbusinessforecasting,andthemodelingisjustarequirementtogeneratearobustvalue.Whenafirmhasbeenthoroughlyresearchedbyananalysthecandevelopastrategicviewontheindustryandthecompany’sperformance,andsubsequentlytranslatethisintoaforecast.Thisistheessenceofavaluationandtheactivitythatcreatestrueinsight.
36
Bibliography/ReferencesBooksKoller,Goedhart&Wessels(2005)Valuation:universityeditionHoboken,NewJersey:JohnWileyandsons.PapersBenninga,S.,Helmantel,M.,Sarig,O.(2005),“TheTimingofInitialPublicOfferings”,JournalofFinancialEconomics,75(1),115‐132Bruner,R.F.,Eades,K.M.,HigginsR.C.,(1998),“BestPracticesinEstimatingtheCostofCapital:SurveyandSynthesis”,FinancialPracticeAndEducation8,Spring/Summer1998,pp13‐28Deloof,Marc,WouterDeMaeseneireandKoenInghelbrecht(2002)“TheValuationofIPOsbyInvestmentBanksandtheStockMarket:EmpiricalEvidence”Graham,J.R.,Harevey,C.R.,(1999),“Thetheoryandpracticeofcorporatefinance:evidencefromthefield”,JournalofFinancialEconomics60,pp.187‐243Kim,M.AndJ.R.Ritter,(1999),“ValuingIPOs”,JournalofFinancialEconomics53,pp.409‐437Lowry,M.,Schwert,G.W.,(2002),“IPOMarketCycles:BubblesorSequentialLearning?”,TheJournalofFinancevol.LXVII,No3,pp.1171‐1198Michaely,R.,Womack,K.L.,(1999),“ConflictofInterestandtheCredibilityofUnderwriterAnalystRecommendations”,ReviewofFinancialStudies–SocFinancialStudiesPastor,L.,Veronesi,P.,(2005),“RationalIPOWaves”,JournalofFinance,Vol.LX,NO.4,pp.1713‐1763Ritter,J.,(1998),“InitialPublicOfferings”,WarrenGorham&LamontHandbookofModernFinance”,reprintedinContemporaryFinanceDigestvol.2,No1,pp.5‐30InternetBloomberg.(2009).FinancialData.Available:www.bloomberg.com.LastaccessedMarch2009.DeutscheBahn.(2009).‐.Available:http://www.deutschebahn.com/site/bahn/en/start.html.LastaccessedMarch2009.EcoTransit.(2008).RailTransportandEnvironment.Available:http://www.ecotransit.org.Lastaccessed20February2009.EC.(2008).Carregistrations.Available:http://ec.europa.eu.LastaccessedFebruary2009.IMF.(2009).DataandStatistics.Available:http://www.imf.org/external/data.htm.LastaccessedMarch2009.SmartMoney.(2009).FinancialData.Available:www.smartmoney.com.LastaccessedMarch2009.

37
InternetcontinuedStatistischesBundesamtDeutschland.(2009).Indicators/Topics.Available:http://www.destatis.de/jetspeed/portal/cms/Sites/destatis/Internet/EN/Navigation/Homepage__NT.psml.LastaccessedMarch2009.WSA.(2009).SteelProduction.Available:www.worldsteel.org.LastaccessedMarch2009
38
APPENDIX1:VALUATIONREPORTPARTI;INTRODUCTIONIwillfirstpresentashortintroductiononthecompanyundertakingtheIPO,namelyDBMobilityLogisticsAG.ThecompanyisasubsidiaryofDeutscheBahnAG,whichisownedbytheFederalRepublicofGermany.DeutscheBahnAGalsoownsDBNetze(Track,StationsandEnergy)thattogetherformGermany’srailinfrastructure.DBMobilityLogisticsprovidesrailtransportservicesfortransportingfreightandpassengers,alltypesoflogisticsservices,andinparticulartransport,freightforwarding,freightandstorageservices,aswellasalltypesofconsultancyandgeneralservices,particularlyinthefieldoftransport,logistics,informationtechnologyandtelecommunications.Thegroupconsistsof6businessunits,forwhichIwillseparatelygiveashortbusinessoverview.LongDistanceOwnsandoperatesGermany’slongdistancerailpassengertransport(ICE).Thisisahigh‐speedrailservicethattransportspassengersnotonlywithinGermany,butalsoto13othercountrieswithinEurope.RegionalThisdivisioncarriespassengersforregionalrailtransportswithinGermany.ItisalsoactivewithintheUnitedKingdom.UrbanThisdivisioncomprisestheurbantransportsystemsinBerlinandHamburg,aswellasurbanbusactivities.MostofthesetransportservicesareprovidedinGermany.Worthnoticing,theurbanbusmarketisstillfor80%runbylocaltransportauthorities.SchenkerRailThisdivisionprovidesrailfreighttransportservices.ItoperatesprimarilyinGermany,Denmark,theNetherlandsandItaly.SchenkerLogisticsThisdivisiongeneratesthelargestrevenuestreamwithintheDBMobilityLogisticsgroup.Theyprovidelogisticsserviceswithglobalactivitiesinvolvingfreight,transport,andotherservicesincommodityandproducttransportviaground,airandsea.ServicesThisdivisionprovidesalltypesofservices,mainlyinthefieldsoftransport,logistics,informationtechnology,andtelecommunications.GeneratedrevenuelargelyviaservicesrenderedtodivisionwithinDBMLandDBAG.
39
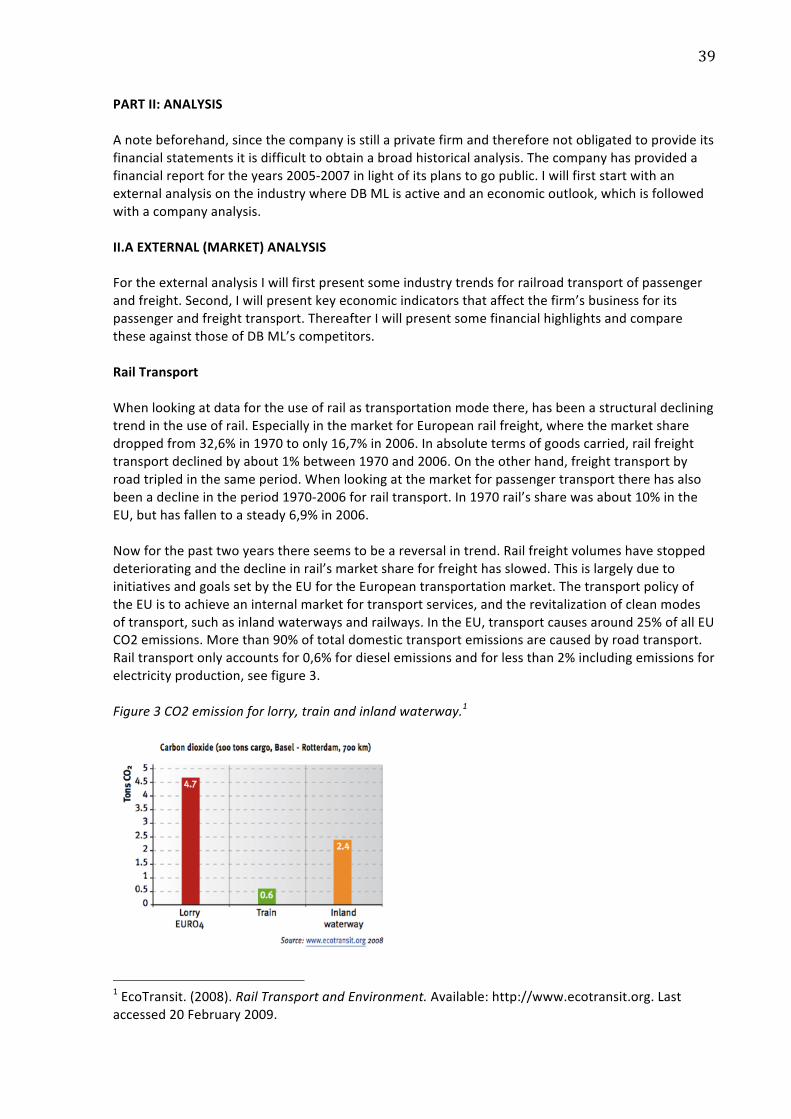
PARTII:ANALYSISAnotebeforehand,sincethecompanyisstillaprivatefirmandthereforenotobligatedtoprovideitsfinancialstatementsitisdifficulttoobtainabroadhistoricalanalysis.Thecompanyhasprovidedafinancialreportfortheyears2005‐2007inlightofitsplanstogopublic.IwillfirststartwithanexternalanalysisontheindustrywhereDBMLisactiveandaneconomicoutlook,whichisfollowedwithacompanyanalysis.II.AEXTERNAL(MARKET)ANALYSISFortheexternalanalysisIwillfirstpresentsomeindustrytrendsforrailroadtransportofpassengerandfreight.Second,Iwillpresentkeyeconomicindicatorsthataffectthefirm’sbusinessforitspassengerandfreighttransport.ThereafterIwillpresentsomefinancialhighlightsandcomparetheseagainstthoseofDBML’scompetitors.RailTransportWhenlookingatdatafortheuseofrailastransportationmodethere,hasbeenastructuraldecliningtrendintheuseofrail.EspeciallyinthemarketforEuropeanrailfreight,wherethemarketsharedroppedfrom32,6%in1970toonly16,7%in2006.Inabsolutetermsofgoodscarried,railfreighttransportdeclinedbyabout1%between1970and2006.Ontheotherhand,freighttransportbyroadtripledinthesameperiod.Whenlookingatthemarketforpassengertransporttherehasalsobeenadeclineintheperiod1970‐2006forrailtransport.In1970rail’ssharewasabout10%intheEU,buthasfallentoasteady6,9%in2006.Nowforthepasttwoyearsthereseemstobeareversalintrend.Railfreightvolumeshavestoppeddeterioratingandthedeclineinrail’smarketshareforfreighthasslowed.ThisislargelyduetoinitiativesandgoalssetbytheEUfortheEuropeantransportationmarket.ThetransportpolicyoftheEUistoachieveaninternalmarketfortransportservices,andtherevitalizationofcleanmodesoftransport,suchasinlandwaterwaysandrailways.IntheEU,transportcausesaround25%ofallEUCO2emissions.Morethan90%oftotaldomestictransportemissionsarecausedbyroadtransport.Railtransportonlyaccountsfor0,6%fordieselemissionsandforlessthan2%includingemissionsforelectricityproduction,seefigure3.Figure3CO2emissionforlorry,trainandinlandwaterway.1
1EcoTransit.(2008).RailTransportandEnvironment.Available:http://www.ecotransit.org.Lastaccessed20February2009.
40
Railtransportationhasotheradvantagesopposedtoroadtransport,besidesbeingmoreenvironmentalfriendly.Railtransportationisasafemeansoftransportation,andhasasubstantialadvantagecomparedtoroadtransportconsideringtheincreasingroadcongestions,whichisalargeincentiveforespeciallycommuterstoshifttorailtraveling.Moreover,insomemarketsegmentsrailtravelingisfasterandcheaperthanothermodesoftransportation.Therevitalizationofrailfreighttransport,asEUgoal,impliesimprovementsinitsperformance,competitivenessandcapacity.Toimprovethequalityofrailfreighttransportandtoensureithassufficientcapacity,theEuropeanCommissionconsidersthattwomainelementsshouldbedevelopedand/orimproved:
‐ Faircompetitionintheprovisionofrailservices‐ Good,reliable(attherequestedtime)andadequatepathsavailableforfreighttransport.
Faircompetitionmakesamoreefficientandcustomerresponsiveindustry.TheEUraillegislationhasconsistentlyencouragedfaircompetitionandmarketopeningonEuropeanlevel,withthefirstrealimplicationofamajorlawin1991.Thislegislationensuresthedistinctionbetweentheinfrastructuremanagement,whorunstherailnetworkandtherailwaycompanieswhouseitfortransportingpurposes.ToensurethisactisappliedproperlyEUmemberstatesmusthavearegulatorybodythatmonitorsthemarketandactsuponanappealifarailwaycompanyhasbeentreatedunfairly.OpeningupmarketsforEuropehascommencedsincethestartof2007,whentherailfreighttransportmarketwascompletelyliberalizedintheEU.Thisinturnmeansthatanylicensedrailwaycompanywiththeappropriatecertificateshastheabilitytorequestaccess,andofferfreighttransportservicesonnationalandinternationallevelthroughouttheEU.Thesameprocessisgoingtobeappliedfortheinternationalpassengerrailtransportmarket.TheEUwillliberalizethemarketstartingJanuary2010.However,themarketforpurelynationalpassengertransportservicesisnotyetopeneduptocross‐bordercompetition.RegardingrailinfrastructuretheEUaimstoupgradeimportantfreightroutesinEuropeby2012‐15.NexttoincreasingfreightrouteswithinEuropetheEUalsoaimstoexpanditsroutestoconnectingcountries.Anotherimportantaspectfortheinfrastructureofrailwaysisthecompatibilitybetweencountries.Inthepastfewyearsalotofdifficultiesandcostswereassociatedwithdifferencesinelectrificationstandardsandsafetyandsignalingsystems.ThroughEUlegislationinteroperabilityispromotedtoovercomesuchdifficulties.Theseabovementionedlegislationsconsiderablycontributetogrowthfortherailfreightmarket.Withthegrowingcontainerizationandlongerdistancesthatneedtobecovered,railfreightwillsurelybenefitfromtheupgradedrailnetwork,fastertrainsandimprovedinfrastructure.Competitionfromroadtransportwillalsobedampedduetotheincreasingroadcongestions,increasingcostsforroadtransportation(oil),andthegrowingawarenessofbeingenvironmentalfriendly.Theinternationalpassengerrailmarketwillalsobenefitfromtheimplicationsoftheseactions.ByopeningupmarketswithinEurope,especiallythelongdistancesegmentwillbenefit.Sincetrainsareabletotravelfasterandfurtherthetrainscompetitivepositionwillincreasesubstantiallytoroadandairtraveling.Illustratedinfigure4aremillionpassenger‐kilometerstraveledwithhigh‐speedrailtransportinGermany.Thenumberofpassenger‐kilometersrosefrom8,85millionin1996to21,64millionin2006(244%increasein10years),indicatingtheincreasingtrendofusinghigh‐speedrailtransportbypassengersinGermany.
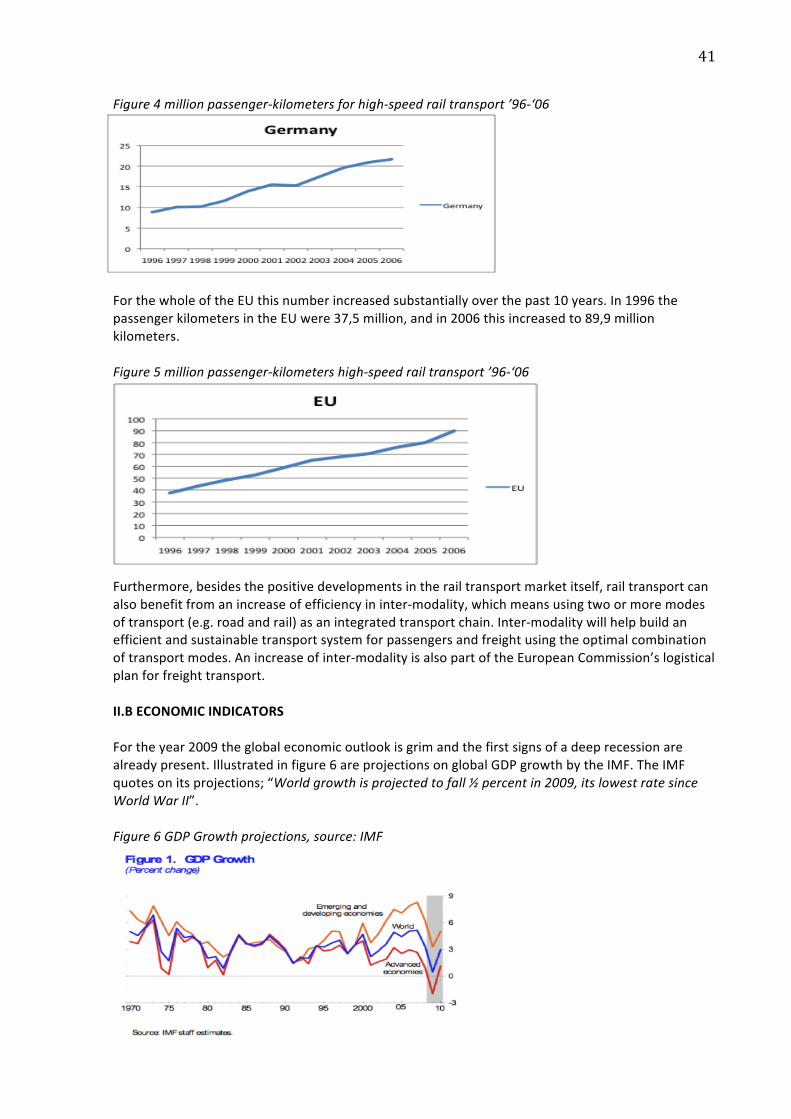
41
Figure4millionpassenger‐kilometersforhigh‐speedrailtransport’96‐‘06
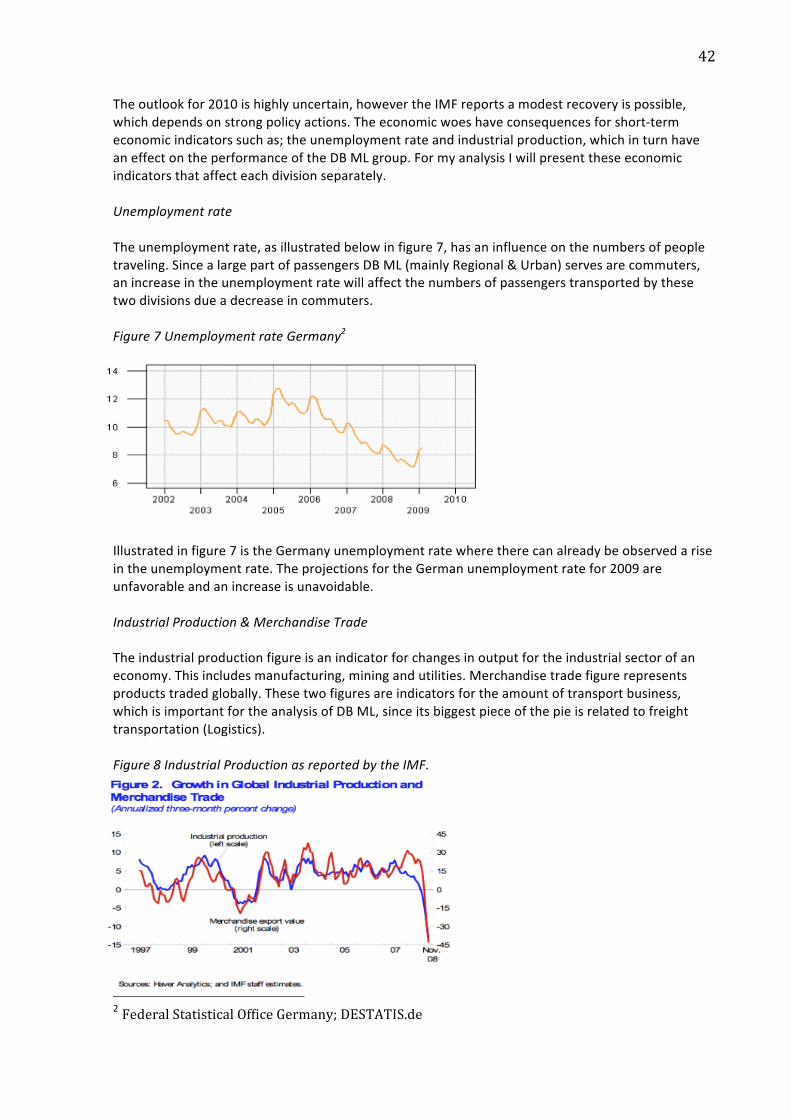
ForthewholeoftheEUthisnumberincreasedsubstantiallyoverthepast10years.In1996thepassengerkilometersintheEUwere37,5million,andin2006thisincreasedto89,9millionkilometers.Figure5millionpassenger‐kilometershigh‐speedrailtransport’96‐‘06
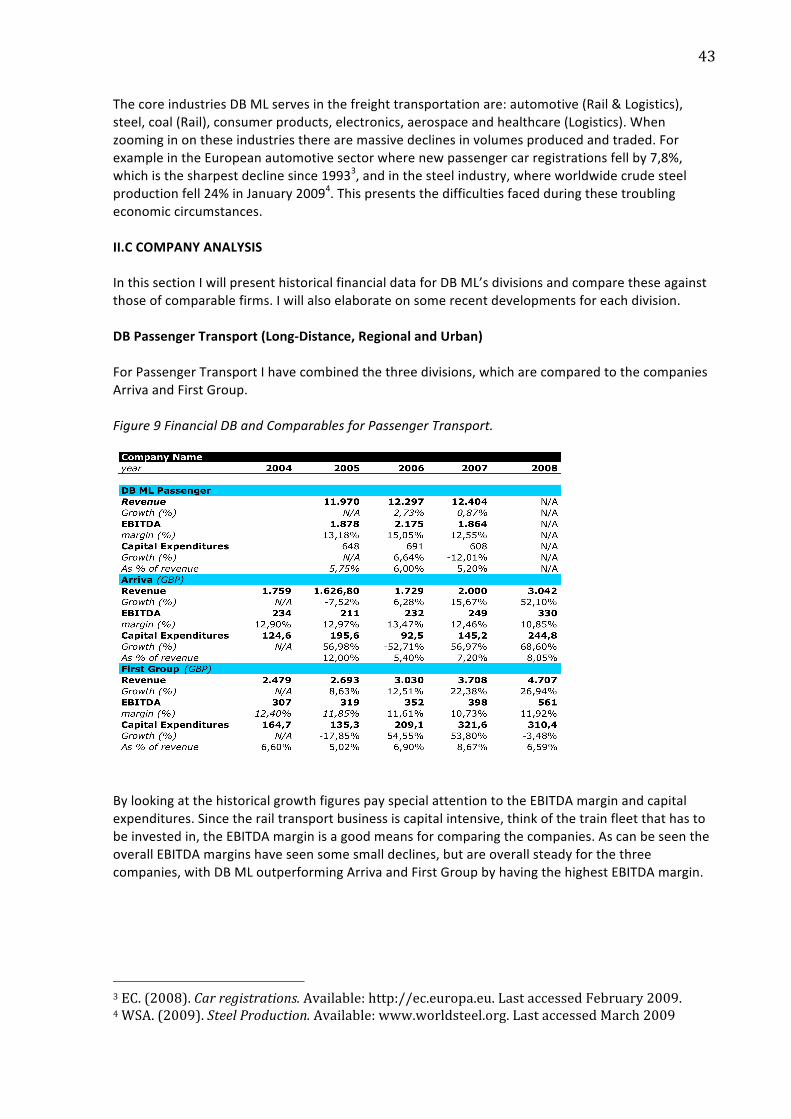
Furthermore,besidesthepositivedevelopmentsintherailtransportmarketitself,railtransportcanalsobenefitfromanincreaseofefficiencyininter‐modality,whichmeansusingtwoormoremodesoftransport(e.g.roadandrail)asanintegratedtransportchain.Inter‐modalitywillhelpbuildanefficientandsustainabletransportsystemforpassengersandfreightusingtheoptimalcombinationoftransportmodes.Anincreaseofinter‐modalityisalsopartoftheEuropeanCommission’slogisticalplanforfreighttransport.II.BECONOMICINDICATORSFortheyear2009theglobaleconomicoutlookisgrimandthefirstsignsofadeeprecessionarealreadypresent.Illustratedinfigure6areprojectionsonglobalGDPgrowthbytheIMF.TheIMFquotesonitsprojections;“Worldgrowthisprojectedtofall½percentin2009,itslowestratesinceWorldWarII”.Figure6GDPGrowthprojections,source:IMF
42
Theoutlookfor2010ishighlyuncertain,howevertheIMFreportsamodestrecoveryispossible,whichdependsonstrongpolicyactions.Theeconomicwoeshaveconsequencesforshort‐termeconomicindicatorssuchas;theunemploymentrateandindustrialproduction,whichinturnhaveaneffectontheperformanceoftheDBMLgroup.FormyanalysisIwillpresenttheseeconomicindicatorsthataffecteachdivisionseparately.UnemploymentrateTheunemploymentrate,asillustratedbelowinfigure7,hasaninfluenceonthenumbersofpeopletraveling.SincealargepartofpassengersDBML(mainlyRegional&Urban)servesarecommuters,anincreaseintheunemploymentratewillaffectthenumbersofpassengerstransportedbythesetwodivisionsdueadecreaseincommuters.Figure7UnemploymentrateGermany2
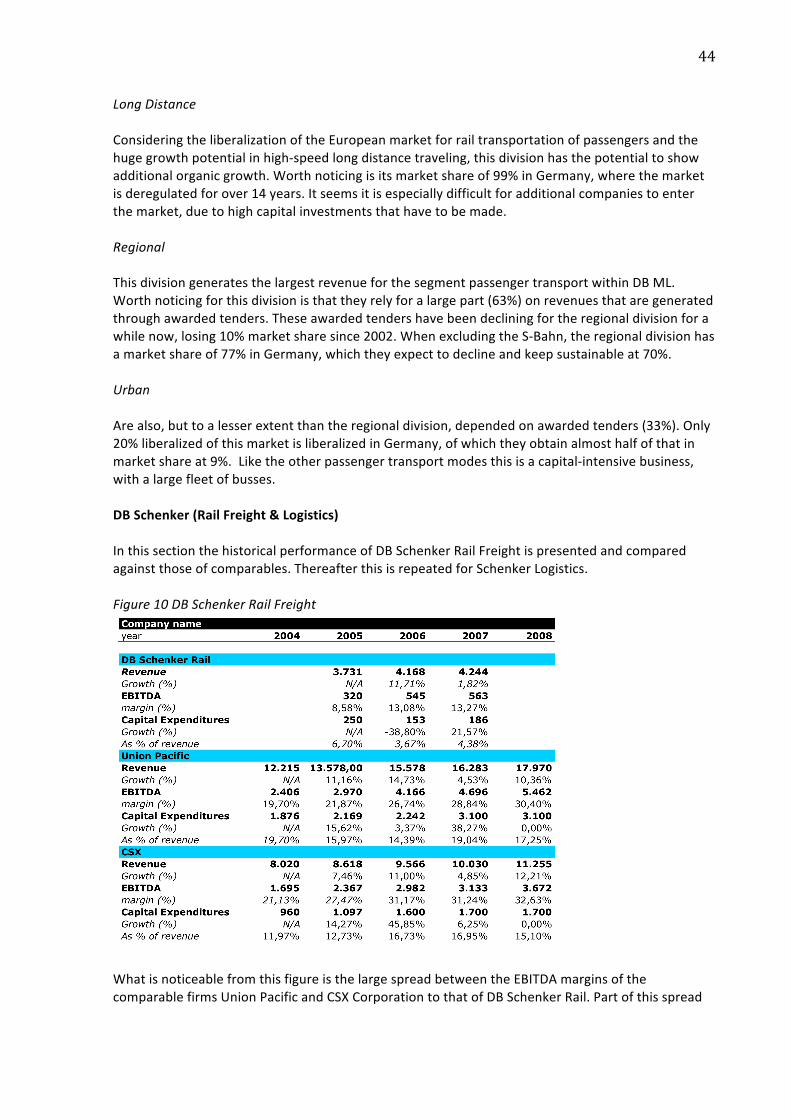
Illustratedinfigure7istheGermanyunemploymentratewheretherecanalreadybeobservedariseintheunemploymentrate.TheprojectionsfortheGermanunemploymentratefor2009areunfavorableandanincreaseisunavoidable.IndustrialProduction&MerchandiseTradeTheindustrialproductionfigureisanindicatorforchangesinoutputfortheindustrialsectorofaneconomy.Thisincludesmanufacturing,miningandutilities.Merchandisetradefigurerepresentsproductstradedglobally.Thesetwofiguresareindicatorsfortheamountoftransportbusiness,whichisimportantfortheanalysisofDBML,sinceitsbiggestpieceofthepieisrelatedtofreighttransportation(Logistics).Figure8IndustrialProductionasreportedbytheIMF.
2FederalStatisticalOfficeGermany;DESTATIS.de
43
ThecoreindustriesDBMLservesinthefreighttransportationare:automotive(Rail&Logistics),steel,coal(Rail),consumerproducts,electronics,aerospaceandhealthcare(Logistics).Whenzoominginontheseindustriestherearemassivedeclinesinvolumesproducedandtraded.ForexampleintheEuropeanautomotivesectorwherenewpassengercarregistrationsfellby7,8%,whichisthesharpestdeclinesince19933,andinthesteelindustry,whereworldwidecrudesteelproductionfell24%inJanuary20094.Thispresentsthedifficultiesfacedduringthesetroublingeconomiccircumstances.II.CCOMPANYANALYSISInthissectionIwillpresenthistoricalfinancialdataforDBML’sdivisionsandcomparetheseagainstthoseofcomparablefirms.Iwillalsoelaborateonsomerecentdevelopmentsforeachdivision.DBPassengerTransport(Long‐Distance,RegionalandUrban)ForPassengerTransportIhavecombinedthethreedivisions,whicharecomparedtothecompaniesArrivaandFirstGroup.Figure9FinancialDBandComparablesforPassengerTransport.
BylookingatthehistoricalgrowthfigurespayspecialattentiontotheEBITDAmarginandcapitalexpenditures.Sincetherailtransportbusinessiscapitalintensive,thinkofthetrainfleetthathastobeinvestedin,theEBITDAmarginisagoodmeansforcomparingthecompanies.AscanbeseentheoverallEBITDAmarginshaveseensomesmalldeclines,butareoverallsteadyforthethreecompanies,withDBMLoutperformingArrivaandFirstGroupbyhavingthehighestEBITDAmargin.3EC.(2008).Carregistrations.Available:http://ec.europa.eu.LastaccessedFebruary2009.4WSA.(2009).SteelProduction.Available:www.worldsteel.org.LastaccessedMarch2009
44
LongDistanceConsideringtheliberalizationoftheEuropeanmarketforrailtransportationofpassengersandthehugegrowthpotentialinhigh‐speedlongdistancetraveling,thisdivisionhasthepotentialtoshowadditionalorganicgrowth.Worthnoticingisitsmarketshareof99%inGermany,wherethemarketisderegulatedforover14years.Itseemsitisespeciallydifficultforadditionalcompaniestoenterthemarket,duetohighcapitalinvestmentsthathavetobemade.RegionalThisdivisiongeneratesthelargestrevenueforthesegmentpassengertransportwithinDBML.Worthnoticingforthisdivisionisthattheyrelyforalargepart(63%)onrevenuesthataregeneratedthroughawardedtenders.Theseawardedtendershavebeendecliningfortheregionaldivisionforawhilenow,losing10%marketsharesince2002.WhenexcludingtheS‐Bahn,theregionaldivisionhasamarketshareof77%inGermany,whichtheyexpecttodeclineandkeepsustainableat70%.UrbanArealso,buttoalesserextentthantheregionaldivision,dependedonawardedtenders(33%).Only20%liberalizedofthismarketisliberalizedinGermany,ofwhichtheyobtainalmosthalfofthatinmarketshareat9%.Liketheotherpassengertransportmodesthisisacapital‐intensivebusiness,withalargefleetofbusses.DBSchenker(RailFreight&Logistics)InthissectionthehistoricalperformanceofDBSchenkerRailFreightispresentedandcomparedagainstthoseofcomparables.ThereafterthisisrepeatedforSchenkerLogistics.Figure10DBSchenkerRailFreight
WhatisnoticeablefromthisfigureisthelargespreadbetweentheEBITDAmarginsofthecomparablefirmsUnionPacificandCSXCorporationtothatofDBSchenkerRail.Partofthisspread
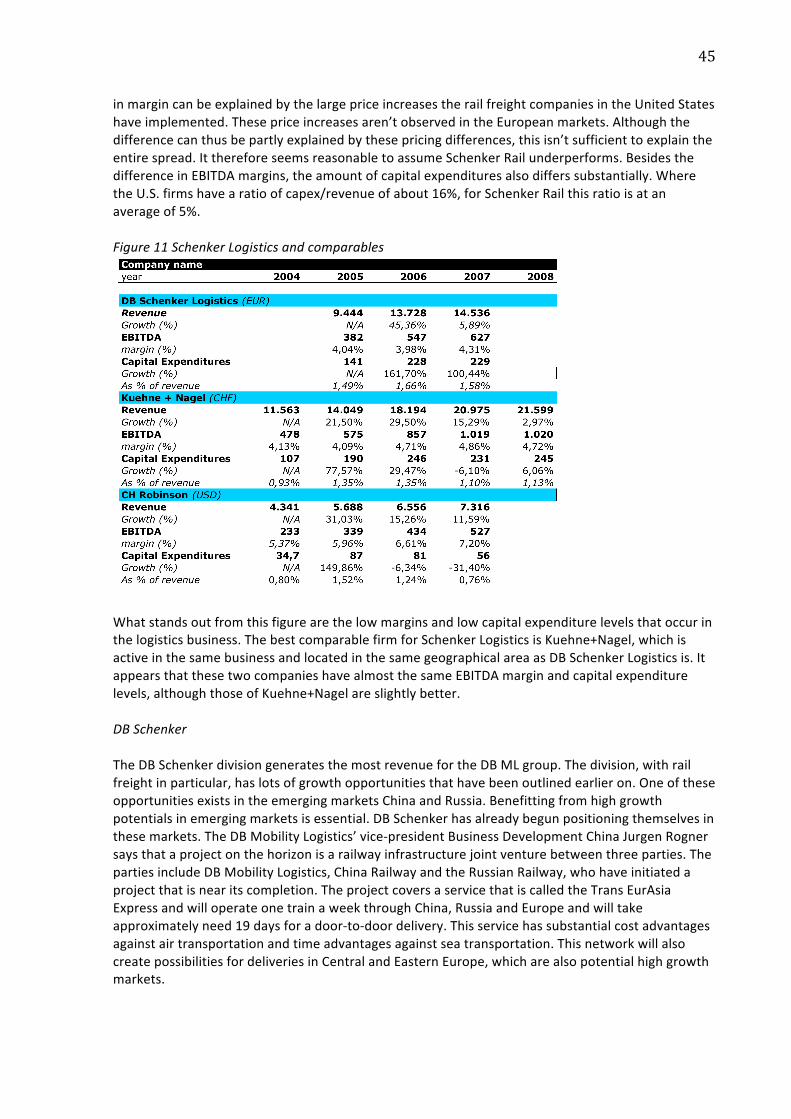
45
inmargincanbeexplainedbythelargepriceincreasestherailfreightcompaniesintheUnitedStateshaveimplemented.Thesepriceincreasesaren’tobservedintheEuropeanmarkets.Althoughthedifferencecanthusbepartlyexplainedbythesepricingdifferences,thisisn’tsufficienttoexplaintheentirespread.ItthereforeseemsreasonabletoassumeSchenkerRailunderperforms.BesidesthedifferenceinEBITDAmargins,theamountofcapitalexpendituresalsodifferssubstantially.WheretheU.S.firmshavearatioofcapex/revenueofabout16%,forSchenkerRailthisratioisatanaverageof5%.Figure11SchenkerLogisticsandcomparables
Whatstandsoutfromthisfigurearethelowmarginsandlowcapitalexpenditurelevelsthatoccurinthelogisticsbusiness.ThebestcomparablefirmforSchenkerLogisticsisKuehne+Nagel,whichisactiveinthesamebusinessandlocatedinthesamegeographicalareaasDBSchenkerLogisticsis.ItappearsthatthesetwocompanieshavealmostthesameEBITDAmarginandcapitalexpenditurelevels,althoughthoseofKuehne+Nagelareslightlybetter.DBSchenkerTheDBSchenkerdivisiongeneratesthemostrevenuefortheDBMLgroup.Thedivision,withrailfreightinparticular,haslotsofgrowthopportunitiesthathavebeenoutlinedearlieron.OneoftheseopportunitiesexistsintheemergingmarketsChinaandRussia.Benefittingfromhighgrowthpotentialsinemergingmarketsisessential.DBSchenkerhasalreadybegunpositioningthemselvesinthesemarkets.TheDBMobilityLogistics’vice‐presidentBusinessDevelopmentChinaJurgenRognersaysthataprojectonthehorizonisarailwayinfrastructurejointventurebetweenthreeparties.ThepartiesincludeDBMobilityLogistics,ChinaRailwayandtheRussianRailway,whohaveinitiatedaprojectthatisnearitscompletion.TheprojectcoversaservicethatiscalledtheTransEurAsiaExpressandwilloperateonetrainaweekthroughChina,RussiaandEuropeandwilltakeapproximatelyneed19daysforadoor‐to‐doordelivery.Thisservicehassubstantialcostadvantagesagainstairtransportationandtimeadvantagesagainstseatransportation.ThisnetworkwillalsocreatepossibilitiesfordeliveriesinCentralandEasternEurope,whicharealsopotentialhighgrowthmarkets.
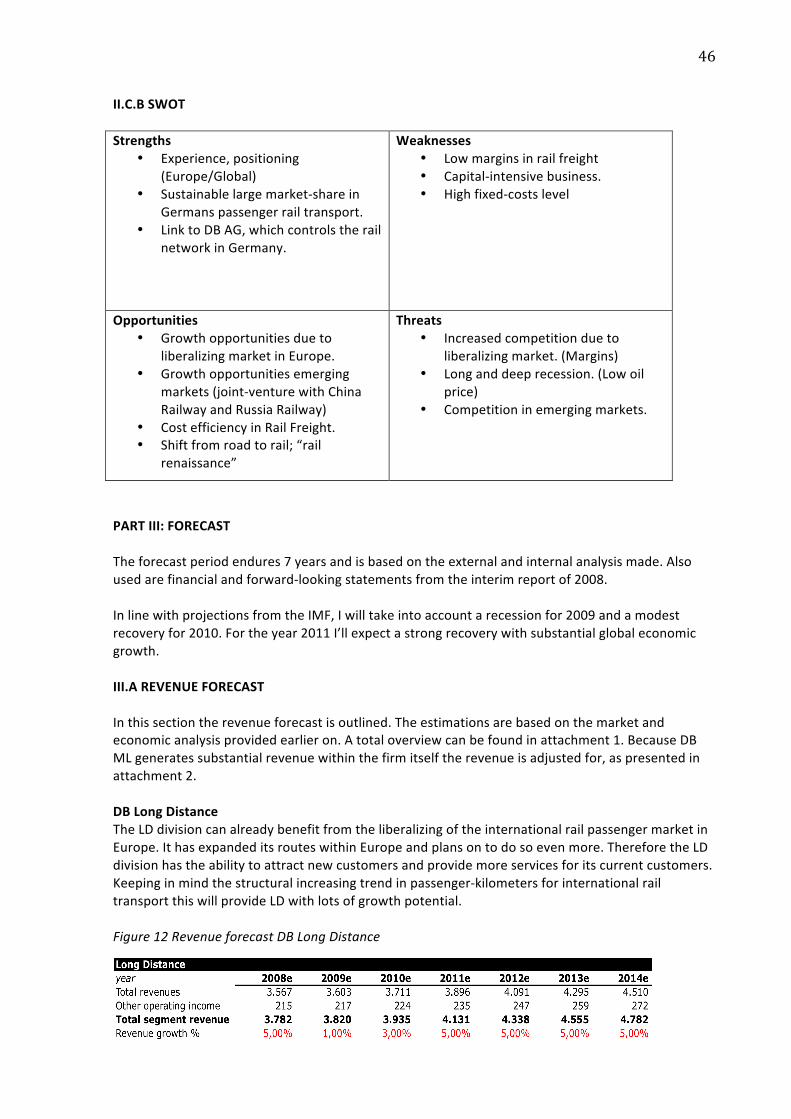
46
II.C.BSWOTStrengths
• Experience,positioning(Europe/Global)
• Sustainablelargemarket‐shareinGermanspassengerrailtransport.
• LinktoDBAG,whichcontrolstherailnetworkinGermany.
Weaknesses• Lowmarginsinrailfreight• Capital‐intensivebusiness.• Highfixed‐costslevel
Opportunities• Growthopportunitiesdueto
liberalizingmarketinEurope.• Growthopportunitiesemerging
markets(joint‐venturewithChinaRailwayandRussiaRailway)
• CostefficiencyinRailFreight.• Shiftfromroadtorail;“rail
renaissance”
Threats• Increasedcompetitiondueto
liberalizingmarket.(Margins)• Longanddeeprecession.(Lowoil
price)• Competitioninemergingmarkets.
PARTIII:FORECASTTheforecastperiodendures7yearsandisbasedontheexternalandinternalanalysismade.Alsousedarefinancialandforward‐lookingstatementsfromtheinterimreportof2008.InlinewithprojectionsfromtheIMF,Iwilltakeintoaccountarecessionfor2009andamodestrecoveryfor2010.Fortheyear2011I’llexpectastrongrecoverywithsubstantialglobaleconomicgrowth.III.AREVENUEFORECASTInthissectiontherevenueforecastisoutlined.Theestimationsarebasedonthemarketandeconomicanalysisprovidedearlieron.Atotaloverviewcanbefoundinattachment1.BecauseDBMLgeneratessubstantialrevenuewithinthefirmitselftherevenueisadjustedfor,aspresentedinattachment2.DBLongDistanceTheLDdivisioncanalreadybenefitfromtheliberalizingoftheinternationalrailpassengermarketinEurope.IthasexpandeditsrouteswithinEuropeandplansontodosoevenmore.ThereforetheLDdivisionhastheabilitytoattractnewcustomersandprovidemoreservicesforitscurrentcustomers.Keepinginmindthestructuralincreasingtrendinpassenger‐kilometersforinternationalrailtransportthiswillprovideLDwithlotsofgrowthpotential.Figure12RevenueforecastDBLongDistance
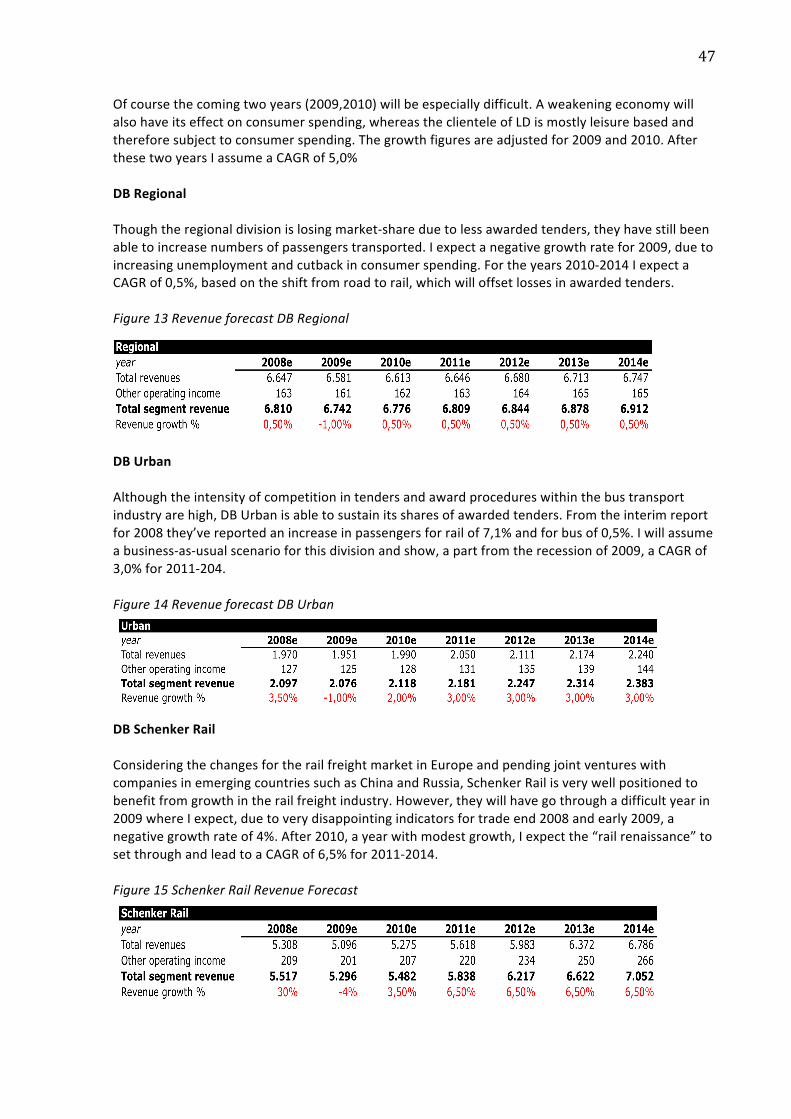
47
Ofcoursethecomingtwoyears(2009,2010)willbeespeciallydifficult.Aweakeningeconomywillalsohaveitseffectonconsumerspending,whereastheclienteleofLDismostlyleisurebasedandthereforesubjecttoconsumerspending.Thegrowthfiguresareadjustedfor2009and2010.AfterthesetwoyearsIassumeaCAGRof5,0%DBRegionalThoughtheregionaldivisionislosingmarket‐shareduetolessawardedtenders,theyhavestillbeenabletoincreasenumbersofpassengerstransported.Iexpectanegativegrowthratefor2009,duetoincreasingunemploymentandcutbackinconsumerspending.Fortheyears2010‐2014IexpectaCAGRof0,5%,basedontheshiftfromroadtorail,whichwilloffsetlossesinawardedtenders.Figure13RevenueforecastDBRegional
DBUrbanAlthoughtheintensityofcompetitionintendersandawardprocedureswithinthebustransportindustryarehigh,DBUrbanisabletosustainitssharesofawardedtenders.Fromtheinterimreportfor2008they’vereportedanincreaseinpassengersforrailof7,1%andforbusof0,5%.Iwillassumeabusiness‐as‐usualscenarioforthisdivisionandshow,apartfromtherecessionof2009,aCAGRof3,0%for2011‐204.Figure14RevenueforecastDBUrban
DBSchenkerRailConsideringthechangesfortherailfreightmarketinEuropeandpendingjointventureswithcompaniesinemergingcountriessuchasChinaandRussia,SchenkerRailisverywellpositionedtobenefitfromgrowthintherailfreightindustry.However,theywillhavegothroughadifficultyearin2009whereIexpect,duetoverydisappointingindicatorsfortradeend2008andearly2009,anegativegrowthrateof4%.After2010,ayearwithmodestgrowth,Iexpectthe“railrenaissance”tosetthroughandleadtoaCAGRof6,5%for2011‐2014.Figure15SchenkerRailRevenueForecast
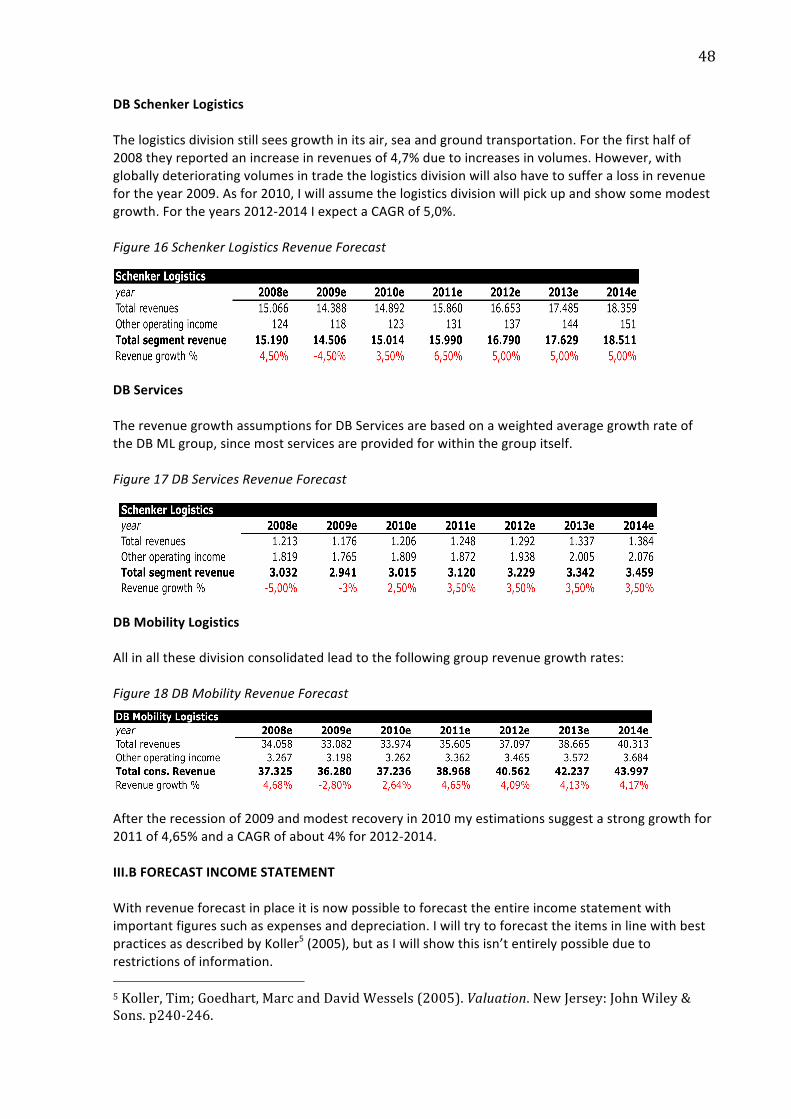
48
DBSchenkerLogisticsThelogisticsdivisionstillseesgrowthinitsair,seaandgroundtransportation.Forthefirsthalfof2008theyreportedanincreaseinrevenuesof4,7%duetoincreasesinvolumes.However,withgloballydeterioratingvolumesintradethelogisticsdivisionwillalsohavetosufferalossinrevenuefortheyear2009.Asfor2010,Iwillassumethelogisticsdivisionwillpickupandshowsomemodestgrowth.Fortheyears2012‐2014IexpectaCAGRof5,0%.Figure16SchenkerLogisticsRevenueForecast
DBServicesTherevenuegrowthassumptionsforDBServicesarebasedonaweightedaveragegrowthrateoftheDBMLgroup,sincemostservicesareprovidedforwithinthegroupitself.Figure17DBServicesRevenueForecast
DBMobilityLogisticsAllinallthesedivisionconsolidatedleadtothefollowinggrouprevenuegrowthrates:Figure18DBMobilityRevenueForecast
Aftertherecessionof2009andmodestrecoveryin2010myestimationssuggestastronggrowthfor2011of4,65%andaCAGRofabout4%for2012‐2014.III.BFORECASTINCOMESTATEMENTWithrevenueforecastinplaceitisnowpossibletoforecasttheentireincomestatementwithimportantfiguressuchasexpensesanddepreciation.IwilltrytoforecasttheitemsinlinewithbestpracticesasdescribedbyKoller5(2005),butasIwillshowthisisn’tentirelypossibleduetorestrictionsofinformation.5Koller,Tim;Goedhart,MarcandDavidWessels(2005).Valuation.NewJersey:JohnWiley&Sons.p240‐246.
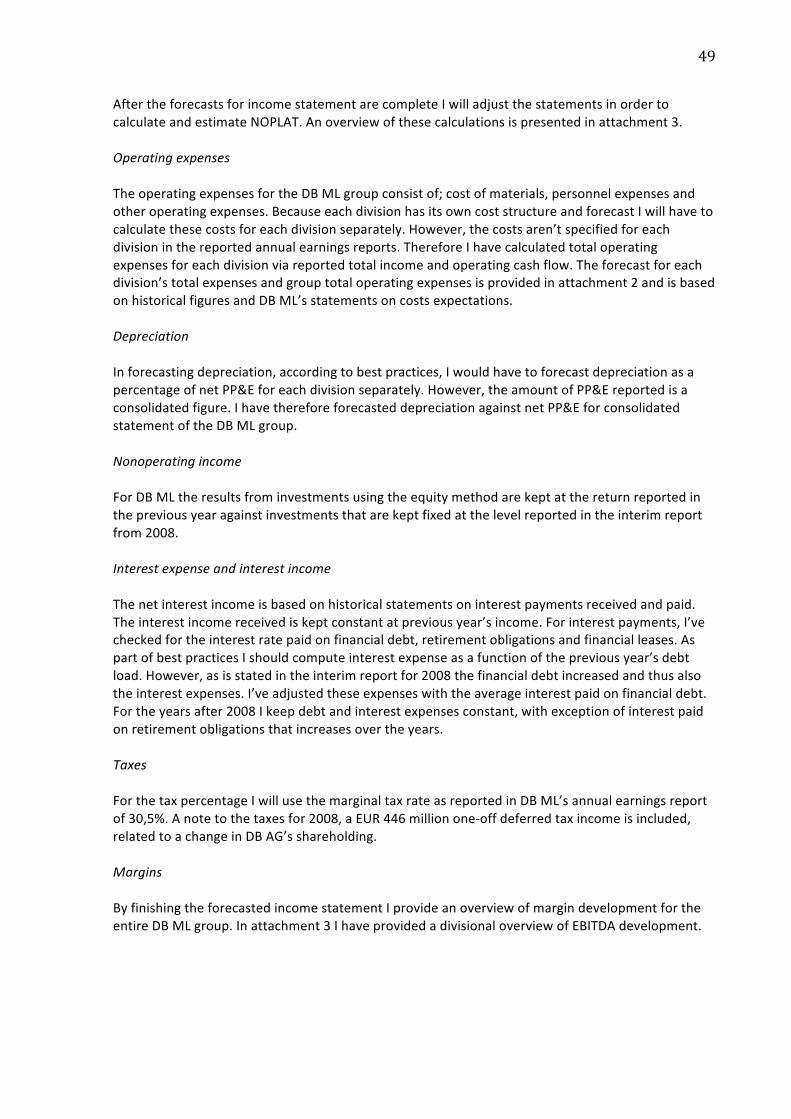
49
AftertheforecastsforincomestatementarecompleteIwilladjustthestatementsinordertocalculateandestimateNOPLAT.Anoverviewofthesecalculationsispresentedinattachment3.OperatingexpensesTheoperatingexpensesfortheDBMLgroupconsistof;costofmaterials,personnelexpensesandotheroperatingexpenses.BecauseeachdivisionhasitsowncoststructureandforecastIwillhavetocalculatethesecostsforeachdivisionseparately.However,thecostsaren’tspecifiedforeachdivisioninthereportedannualearningsreports.ThereforeIhavecalculatedtotaloperatingexpensesforeachdivisionviareportedtotalincomeandoperatingcashflow.Theforecastforeachdivision’stotalexpensesandgrouptotaloperatingexpensesisprovidedinattachment2andisbasedonhistoricalfiguresandDBML’sstatementsoncostsexpectations.DepreciationInforecastingdepreciation,accordingtobestpractices,IwouldhavetoforecastdepreciationasapercentageofnetPP&Eforeachdivisionseparately.However,theamountofPP&Ereportedisaconsolidatedfigure.IhavethereforeforecasteddepreciationagainstnetPP&EforconsolidatedstatementoftheDBMLgroup.NonoperatingincomeForDBMLtheresultsfrominvestmentsusingtheequitymethodarekeptatthereturnreportedinthepreviousyearagainstinvestmentsthatarekeptfixedatthelevelreportedintheinterimreportfrom2008.InterestexpenseandinterestincomeThenetinterestincomeisbasedonhistoricalstatementsoninterestpaymentsreceivedandpaid.Theinterestincomereceivediskeptconstantatpreviousyear’sincome.Forinterestpayments,I’vecheckedfortheinterestratepaidonfinancialdebt,retirementobligationsandfinancialleases.AspartofbestpracticesIshouldcomputeinterestexpenseasafunctionofthepreviousyear’sdebtload.However,asisstatedintheinterimreportfor2008thefinancialdebtincreasedandthusalsotheinterestexpenses.I’veadjustedtheseexpenseswiththeaverageinterestpaidonfinancialdebt.Fortheyearsafter2008Ikeepdebtandinterestexpensesconstant,withexceptionofinterestpaidonretirementobligationsthatincreasesovertheyears.TaxesForthetaxpercentageIwillusethemarginaltaxrateasreportedinDBML’sannualearningsreportof30,5%.Anotetothetaxesfor2008,aEUR446millionone‐offdeferredtaxincomeisincluded,relatedtoachangeinDBAG’sshareholding.MarginsByfinishingtheforecastedincomestatementIprovideanoverviewofmargindevelopmentfortheentireDBMLgroup.Inattachment3IhaveprovidedadivisionaloverviewofEBITDAdevelopment.
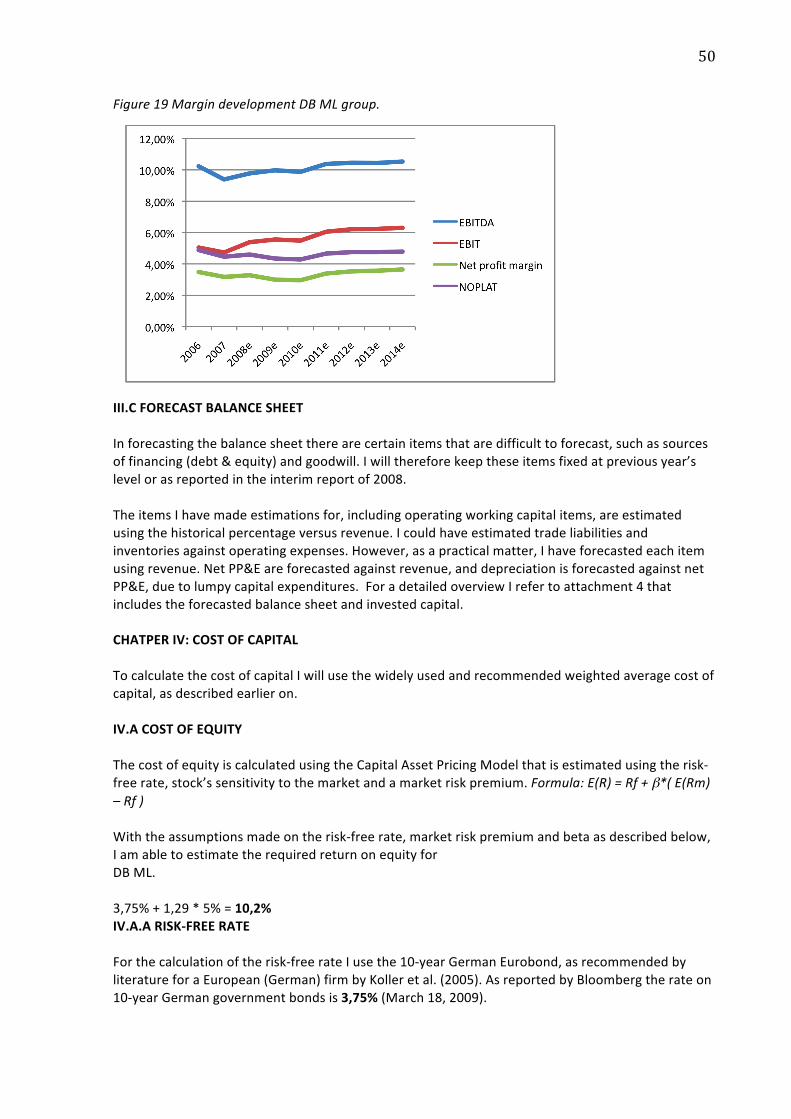
50
Figure19MargindevelopmentDBMLgroup.
III.CFORECASTBALANCESHEETInforecastingthebalancesheettherearecertainitemsthataredifficulttoforecast,suchassourcesoffinancing(debt&equity)andgoodwill.Iwillthereforekeeptheseitemsfixedatpreviousyear’slevelorasreportedintheinterimreportof2008.TheitemsIhavemadeestimationsfor,includingoperatingworkingcapitalitems,areestimatedusingthehistoricalpercentageversusrevenue.Icouldhaveestimatedtradeliabilitiesandinventoriesagainstoperatingexpenses.However,asapracticalmatter,Ihaveforecastedeachitemusingrevenue.NetPP&Eareforecastedagainstrevenue,anddepreciationisforecastedagainstnetPP&E,duetolumpycapitalexpenditures.ForadetailedoverviewIrefertoattachment4thatincludestheforecastedbalancesheetandinvestedcapital.CHATPERIV:COSTOFCAPITALTocalculatethecostofcapitalIwillusethewidelyusedandrecommendedweightedaveragecostofcapital,asdescribedearlieron.IV.ACOSTOFEQUITYThecostofequityiscalculatedusingtheCapitalAssetPricingModelthatisestimatedusingtherisk‐freerate,stock’ssensitivitytothemarketandamarketriskpremium.Formula:E(R)=Rf+β*(E(Rm)–Rf)Withtheassumptionsmadeontherisk‐freerate,marketriskpremiumandbetaasdescribedbelow,IamabletoestimatetherequiredreturnonequityforDBML.3,75%+1,29*5%=10,2%IV.A.ARISK‐FREERATEForthecalculationoftherisk‐freerateIusethe10‐yearGermanEurobond,asrecommendedbyliteratureforaEuropean(German)firmbyKolleretal.(2005).AsreportedbyBloombergtherateon10‐yearGermangovernmentbondsis3,75%(March18,2009).
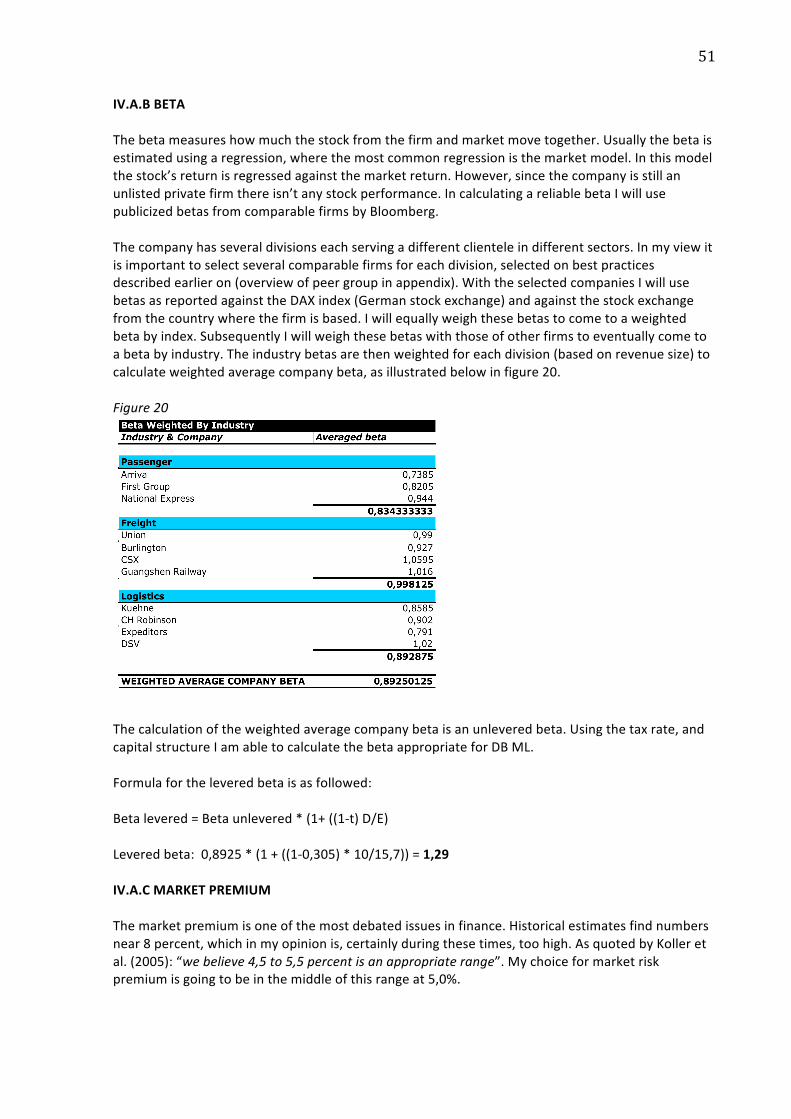
51
IV.A.BBETAThebetameasureshowmuchthestockfromthefirmandmarketmovetogether.Usuallythebetaisestimatedusingaregression,wherethemostcommonregressionisthemarketmodel.Inthismodelthestock’sreturnisregressedagainstthemarketreturn.However,sincethecompanyisstillanunlistedprivatefirmthereisn’tanystockperformance.IncalculatingareliablebetaIwillusepublicizedbetasfromcomparablefirmsbyBloomberg.Thecompanyhasseveraldivisionseachservingadifferentclienteleindifferentsectors.Inmyviewitisimportanttoselectseveralcomparablefirmsforeachdivision,selectedonbestpracticesdescribedearlieron(overviewofpeergroupinappendix).WiththeselectedcompaniesIwillusebetasasreportedagainsttheDAXindex(Germanstockexchange)andagainstthestockexchangefromthecountrywherethefirmisbased.Iwillequallyweighthesebetastocometoaweightedbetabyindex.SubsequentlyIwillweighthesebetaswiththoseofotherfirmstoeventuallycometoabetabyindustry.Theindustrybetasarethenweightedforeachdivision(basedonrevenuesize)tocalculateweightedaveragecompanybeta,asillustratedbelowinfigure20.Figure20
Thecalculationoftheweightedaveragecompanybetaisanunleveredbeta.Usingthetaxrate,andcapitalstructureIamabletocalculatethebetaappropriateforDBML.Formulafortheleveredbetaisasfollowed:Betalevered=Betaunlevered*(1+((1‐t)D/E)Leveredbeta:0,8925*(1+((1‐0,305)*10/15,7))=1,29IV.A.CMARKETPREMIUMThemarketpremiumisoneofthemostdebatedissuesinfinance.Historicalestimatesfindnumbersnear8percent,whichinmyopinionis,certainlyduringthesetimes,toohigh.AsquotedbyKolleretal.(2005):“webelieve4,5to5,5percentisanappropriaterange”.Mychoiceformarketriskpremiumisgoingtobeinthemiddleofthisrangeat5,0%.
52
IV.BCOSTOFDEBTTodeterminethecostofdebtIwillusetheindirectmethodbyaddingacreditspreadtotherisk‐freeraterelatedtothecreditrating.SinceDBMLdoesn’thaveacreditratingbutitsmothercompany(DBAG)does,Iwillusetheirrating.CreditratingforDBAGisAa1,whichimpliesadefaultspreadof70basispointsforthecreditratingabovetherisk‐freerate.However,DBMLfinancesitselfthroughDBAGtreasurythataddsanother50basispoints,puttingtotalcreditspreadto120basispoints.Thisresultsinatotalcostofdebtof:3,75%+0,70%+0,50%=4,95%IV.CCAPITALSTRUCTUREThecapitalstructureisanessentialaspectinordertocalculatetheappropriateWACC.Thecostofcapitalshouldrelyontargetweightsofdebtandequityratherthancurrentweights.Asisshownfromthe2008interimreport’sbalancesheet,DBMLrecentlyacquiredadditionaldebtsummingtotaldebt(Debt+DebtEquivalents)uptoEUR10billion.Iwillassumethisdebtleveltostayfixedformyforecastperiod.IncalculatingtheequityvalueIagainstumbleupontheproblemofDBMLnotbeingalistedfirmsuchthattheequitypriceisn’treadilyobservable.TosolvethisproblemIwillcalculatetheenterprisevalueofDBMLusingmultiplesagainsttradedcomparablefirmsandadjustitfordebt.SinceDBMLhasdifferentdivisionsIwillhavetocalculateseveralenterprise‐valuesusingeachdivision’sEBITDAandpeergroup.SincesomedivisionsofDBMLarecapitalintensiveandsubsequentlydealwithhighvaluesofdepreciation,theEV/EBITDAmultiplethereforeworksbestforestimationoftotalenterprisevalue.Fromattachment(?)itisshownthattheenterprise‐valueforDBMLequalsEUR25.716million.Therefore:EnterpriseValue(EUR25,7billion)–MarketValueofDebt(EUR10billion)=EquityValue(EUR15,7billion)Thereforethefollowingcapitalstructureisapplied:E/V=(15,7/25,7)D/V=(10/25,7)D/E=(10/15,7)V.DWEIGHTEDAVERAGECOSTOFCAPITALUsingtheassumptionsmadeaboveI’mabletoestimatetheproperWACCforDBMLusingthefollowingformula:Re*(E/V)+Rd*(1‐t)*(D/V)ThisleadstoaWACCof:10,2*(15,7/25,7)+4,95*(1‐0,305)*(10/25,7)6,23+1,34=7,567
53
Thepercentage7,567isnowusedasdiscountfactorforthefreecashflowofDBML.CHAPTERV:DISCOUNTEDFREECASHFLOWANALYSISV.ADCFCWithallforecasteditemsinplaceitisnowpossibletoacquirethepresentvalueofthefreecashflowsthroughthediscountedcashflowanalysis.Fromattachment6wegetapresentvalueoffreecashflowsfortheperiod2008‐2014:PresentValueFCF=EUR6.260millionV.BCONTINUINGVALUEAftertheexplicitforecastperiodImakeuseoftheso‐calledcontinuingvalue,asexplainedearlieron.ThecontinuingvaluefortheenterpriseDCFmodeldependsonassumptionsmadeonthenormalizedlevelofNOPLAT(NOPLATt+1),theexpectedrateofreturnonnewinvestedcapital(RONIC),expectedgrowthrateinNOPLATinperpetuity(g)andtheWACC.ForthenormalizedlevelofNOPLATIwillassume2014’sfigurewithanincreaseof5,00%,whichistheaveragegrowthrateofthepast3years.TheRONICfigureshouldbeconsistentwithexpectedcompetitiveconditions.Economictheorysuggeststhatcompetitionwilleventuallyeliminateanyabnormalreturns.IwillthereforesettheRONICequaltotheestimatedWACC.ThegrowthrateforNOPLATinperpetuityisbasedontheexpectedinflationfigurefortheEU,whichistargetedat2,0%.ContinuingValue=NOPLATt+1*(1–(g/RONIC))/WACC–gContinuingValue=EUR27.739millionPVContinuingValueusingWACC=EUR16.647millionV.CENTERPRISE&EQUITYVALUEUSINGDFCFThetotalenterprise‐valueconsistsofthetwoelementsestimatedearlier,namelythepresentvalueofthefreecashflowsandthepresentvalueofthecontinuingvalue.Thiscomesdowntosummingthesetwovalues:PVFCF+PVContinuingValue=EUR6.260million+EUR16.647millionEnterprise‐Value=EUR22.970millionFromhereonwecancalculatetheequityvalue,
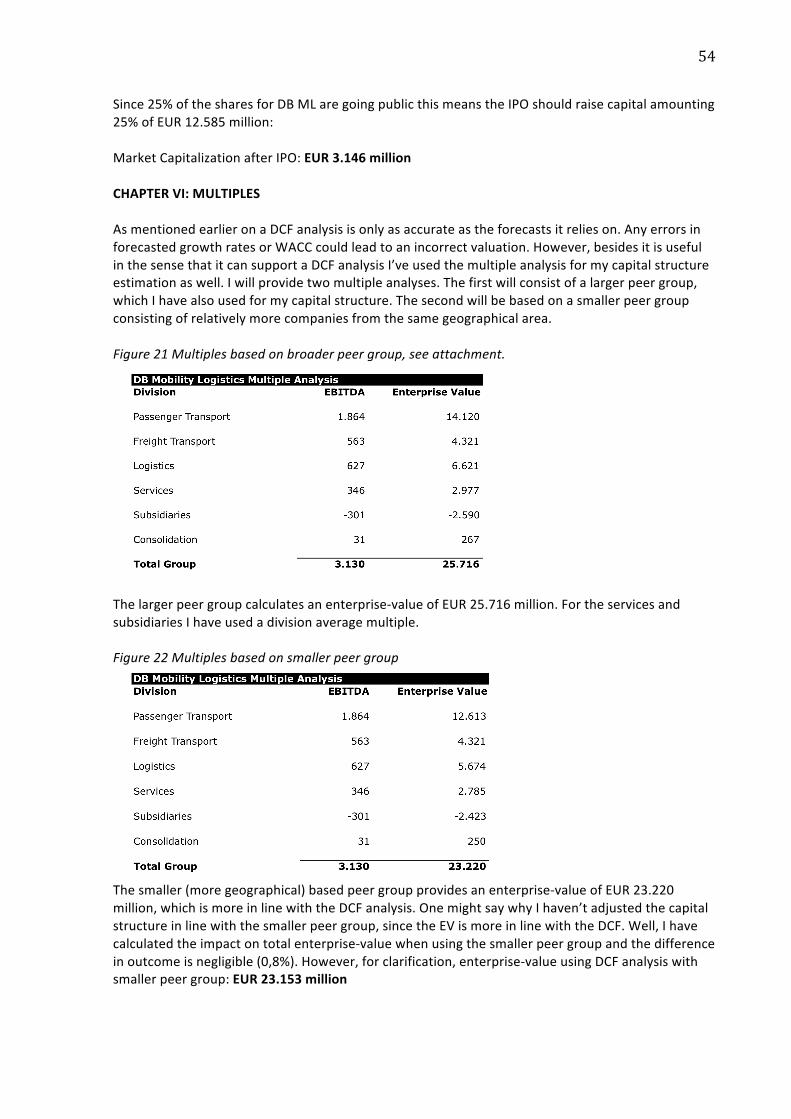
54
Since25%ofthesharesforDBMLaregoingpublicthismeanstheIPOshouldraisecapitalamounting25%ofEUR12.585million:MarketCapitalizationafterIPO:EUR3.146millionCHAPTERVI:MULTIPLESAsmentionedearlieronaDCFanalysisisonlyasaccurateastheforecastsitrelieson.AnyerrorsinforecastedgrowthratesorWACCcouldleadtoanincorrectvaluation.However,besidesitisusefulinthesensethatitcansupportaDCFanalysisI’veusedthemultipleanalysisformycapitalstructureestimationaswell.Iwillprovidetwomultipleanalyses.Thefirstwillconsistofalargerpeergroup,whichIhavealsousedformycapitalstructure.Thesecondwillbebasedonasmallerpeergroupconsistingofrelativelymorecompaniesfromthesamegeographicalarea.Figure21Multiplesbasedonbroaderpeergroup,seeattachment.
Thelargerpeergroupcalculatesanenterprise‐valueofEUR25.716million.FortheservicesandsubsidiariesIhaveusedadivisionaveragemultiple.Figure22Multiplesbasedonsmallerpeergroup
Thesmaller(moregeographical)basedpeergroupprovidesanenterprise‐valueofEUR23.220million,whichismoreinlinewiththeDCFanalysis.OnemightsaywhyIhaven’tadjustedthecapitalstructureinlinewiththesmallerpeergroup,sincetheEVismoreinlinewiththeDCF.Well,Ihavecalculatedtheimpactontotalenterprise‐valuewhenusingthesmallerpeergroupandthedifferenceinoutcomeisnegligible(0,8%).However,forclarification,enterprise‐valueusingDCFanalysiswithsmallerpeergroup:EUR23.153million

55
Allinallthemultiplevaluationusingthegeographicalpeergroupgivesthemostsatisfyingoutcomerelatingtothediscountedcashflowanalysis.Thisisnosurprise,sincethispeergroupismorecomparableinviewofhistoricalandfuturemargins.CHAPTERVII:CONCLUSIONByanalyzingmarkettrendsandimpactofeconomiccircumstancesIhaveprovidedforavaluationthatleadstoanenterprise‐valueforDBMobilityLogisticsnearEUR23billion.Cuttingthisvaluedowntotheequityvalueandconsideringa25%issueofsharesthissuggestDBMLbeingabletoraisecapitalofaboutEUR3.2billion.However,withmoredivisionalspecifiedfinancialinformationIamcertaintheaccuracyofaDCFanalysiswillimprovefurther.Needlesstosaytheeconomicoutlookishighlyunpredictableandthereforethevaluationissubjecttotheseuncertainties.Itthereforeseems,inmyview,unlikelytheIPOwillproceedanytimesoon.
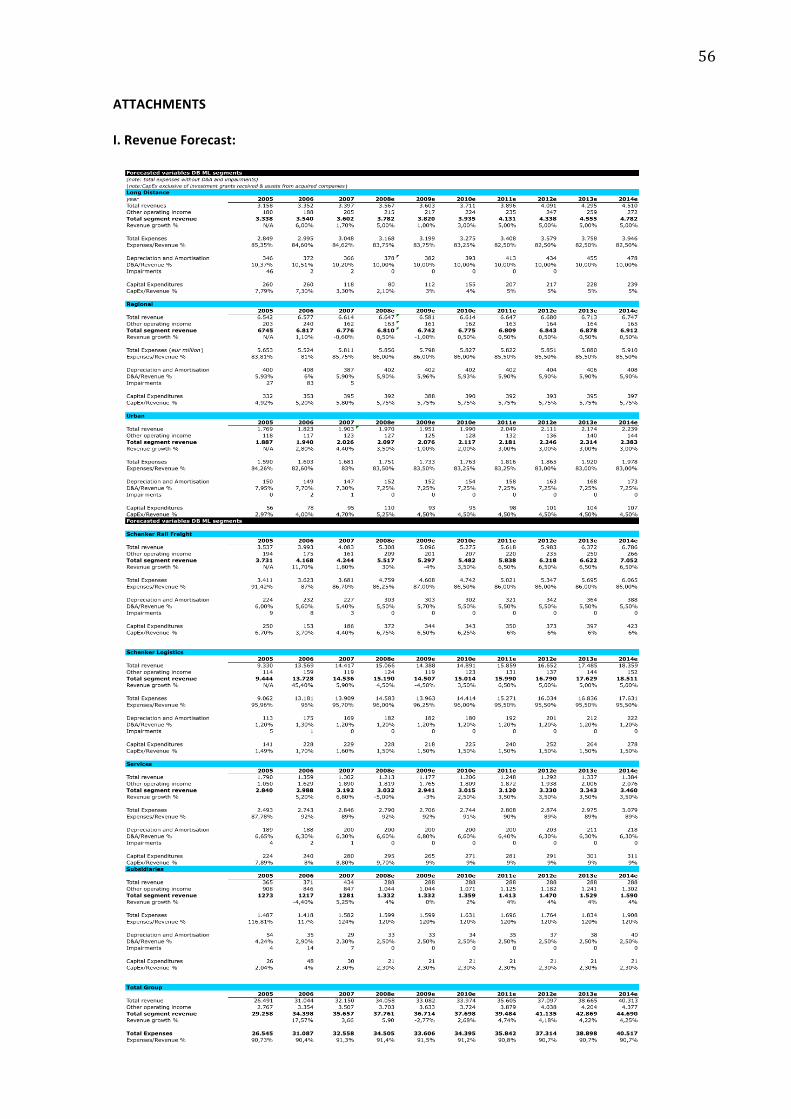
56
ATTACHMENTSI.RevenueForecast:
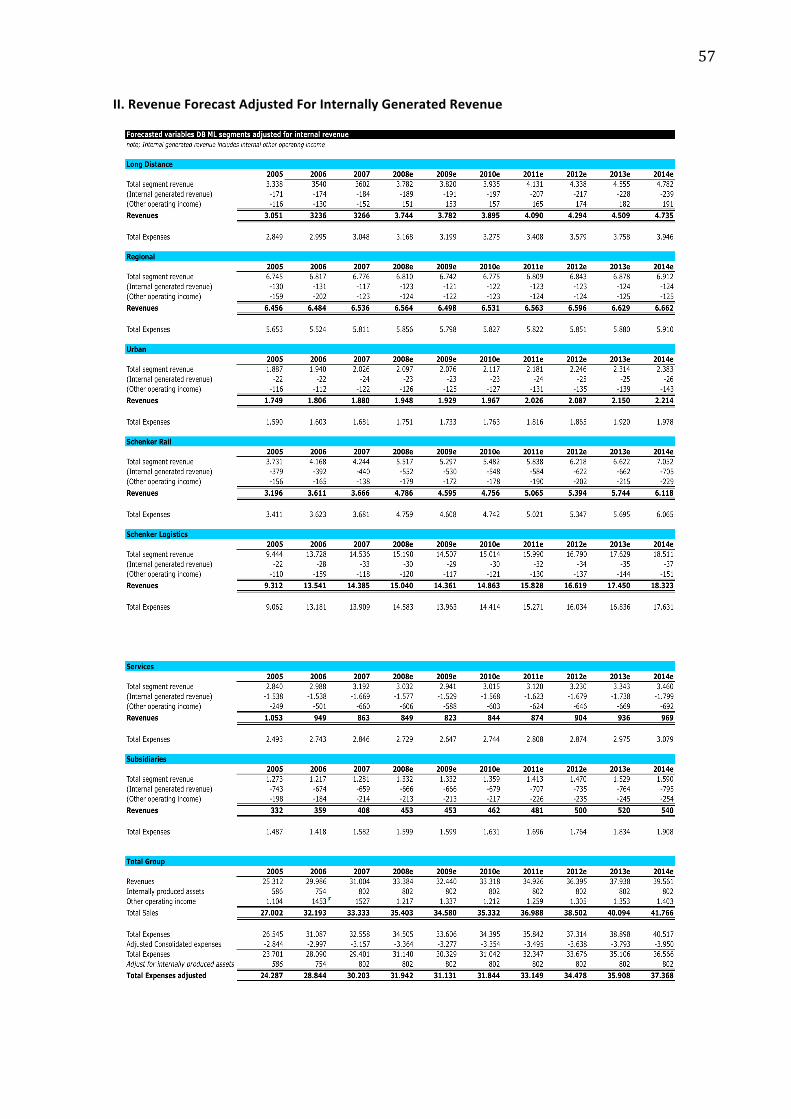
57
II.RevenueForecastAdjustedForInternallyGeneratedRevenue
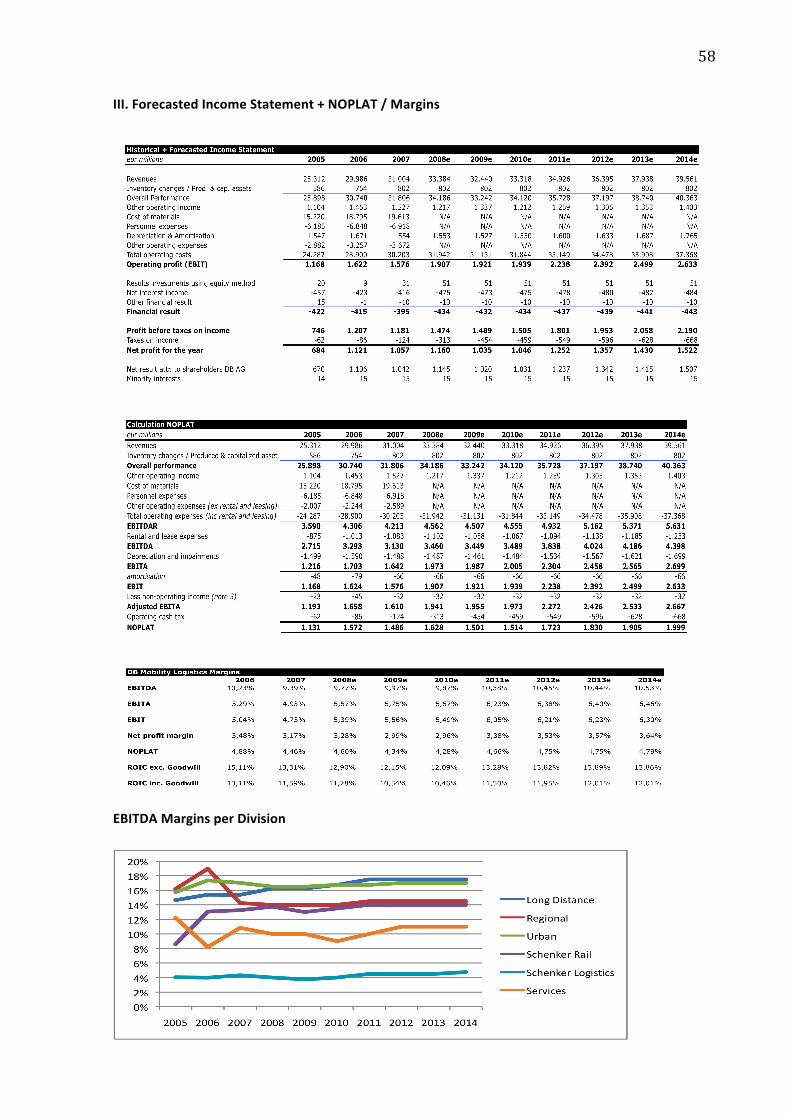
58
III.ForecastedIncomeStatement+NOPLAT/Margins
EBITDAMarginsperDivision
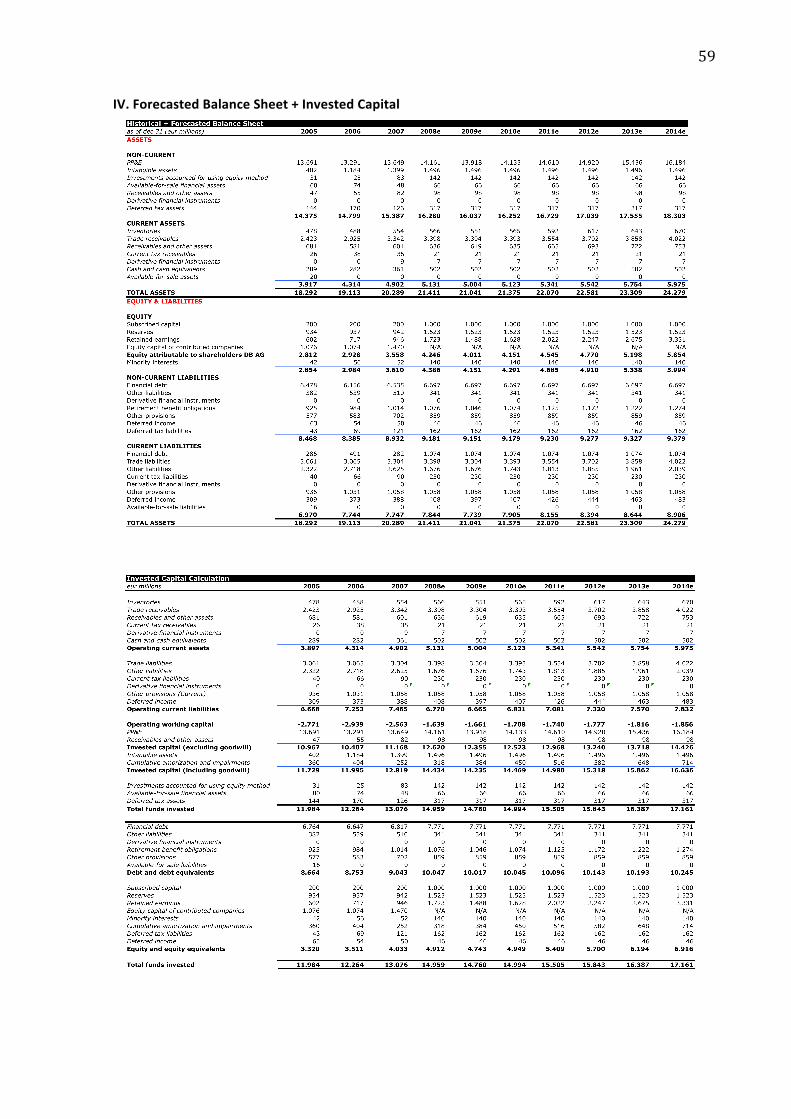
59
IV.ForecastedBalanceSheet+InvestedCapital
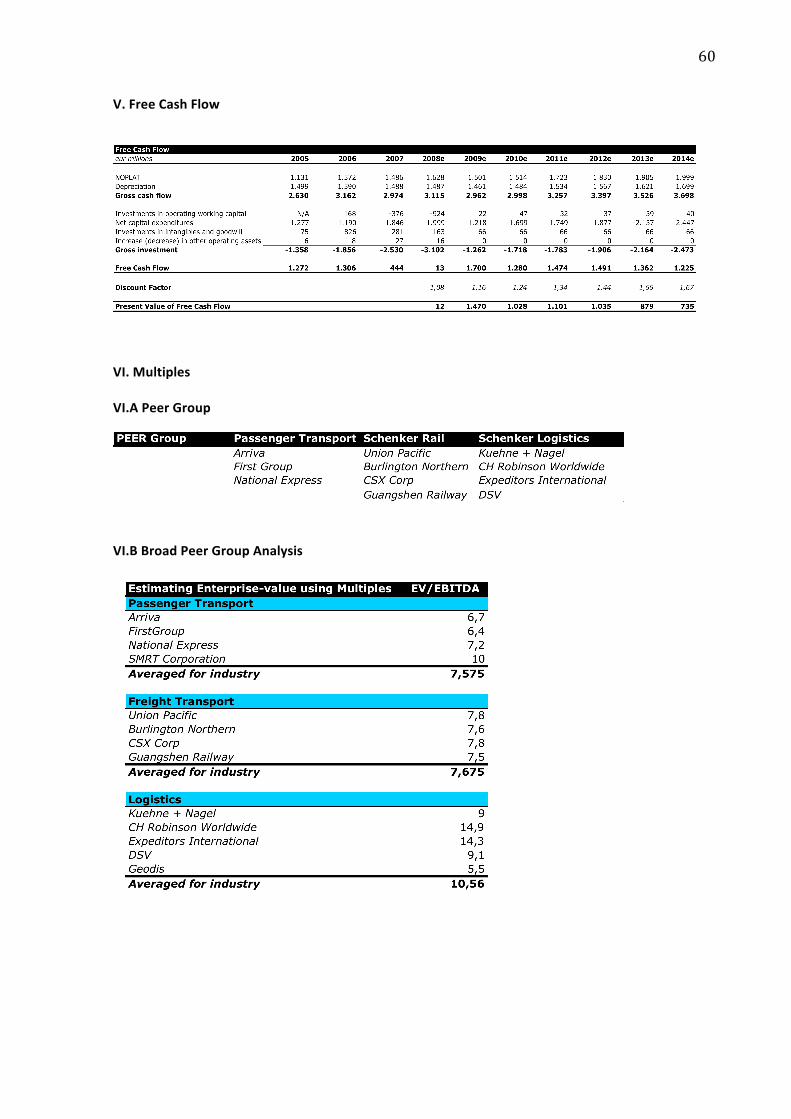
60
V.FreeCashFlow
VI.MultiplesVI.APeerGroup
VI.BBroadPeerGroupAnalysis
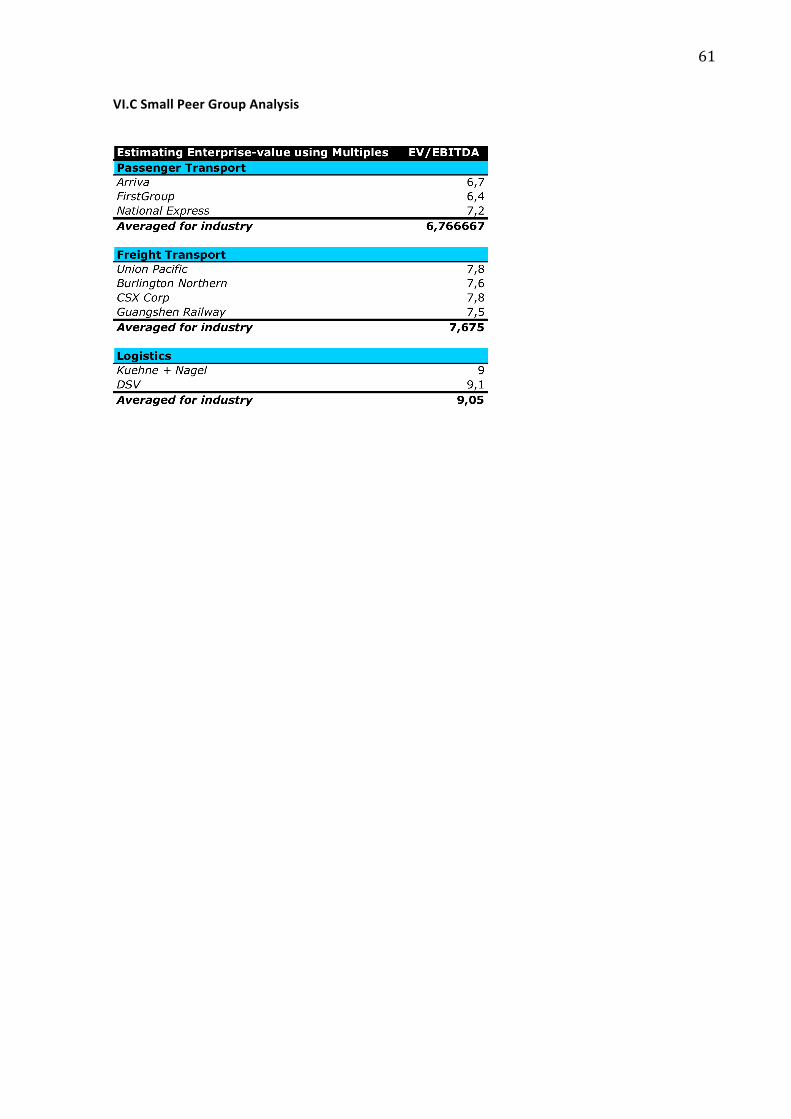
61
VI.CSmallPeerGroupAnalysis