The U.S. Wireless Industry Overview -...
90
The U.S. Wireless Industry Overview Last Updated: April 25, 2012 Scan with Smartphone for PDF
Transcript of The U.S. Wireless Industry Overview -...
The U.S. Wireless Industry Overview
Last Updated: April 25, 2012
Scan with Smartphone for PDF
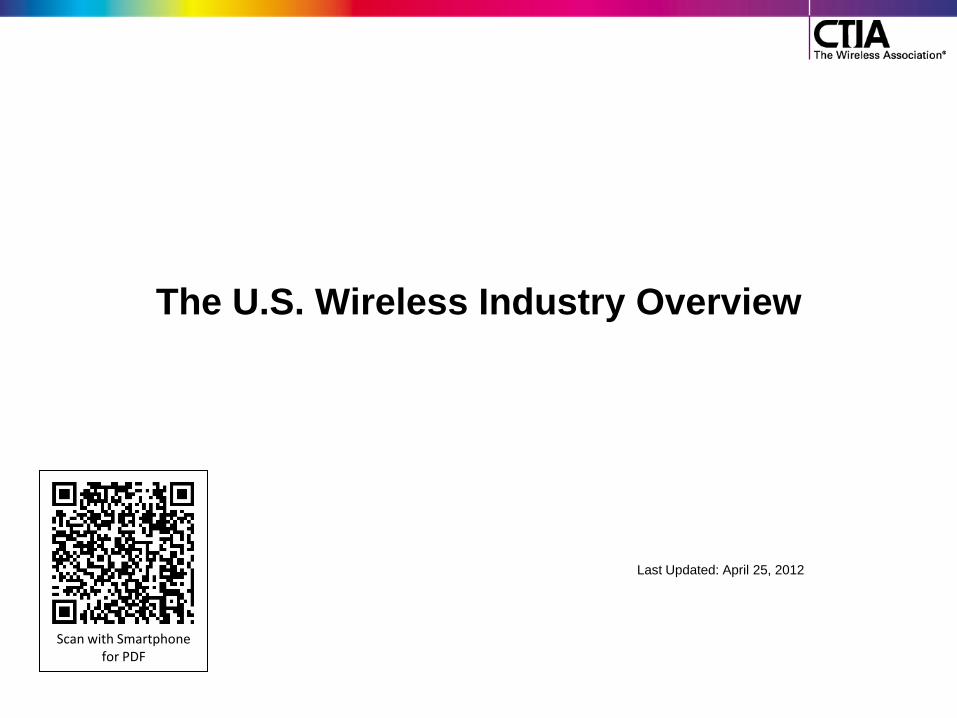
Table of Contents
– Wireless Economy …………………………………………………………….. 5
• Jobs …………………………………………………………………………. 6
• Infrastructure Investment …………………………………………………. 7
• U.S. vs. E.U. Infrastructure Investment …………………………………. 8
• Mobile Shopping …………………………………………………………… 9
• Wireless Enterprise ……………………………………………………..…. 10
• Wireless Accessories ……………………………………………………… 11
• Mobile Entertainment ……………………………………………………… 12
– Wireless Ecosystem: Innovation ……………………………………………... 13
• Applications ………………………………………………………………… 14
• Devices ……………………………………………………………………… 17
– Wireless Demographics and Usage …………………………………………. 23
• Wireless-Only Households ……………………………………………….. 24
• Prepaid Market ……………………………………………………………... 26
• Data Usage …………………………………………………………………. 28
oProjections ……………………………………………………………... 30
Table of Contents Continued
– Wireless Competition ………………………………………………………….. 31
– U.S. Leads in Wireless Value Thanks to Competition …………………….. 34
• U.S. vs. World: Value ……………………………………………………… 35
• U.S. Ranks #1 ……………………………………………………………… 36
– The ―Internet of Things‖ ……………………………………………………….. 38
• Machine-2-Machine ………………………………………………………... 39
• Wireless Technology: Healthcare ………………………………………... 41
• Wireless Technology: Education …………………………………………. 45
• Wireless Technology: Energy …………………………………………….. 47
– Spectrum ……………………………………………………………………….. 49
• What‘s Spectrum? …………………………………………………………. 50
• Spectrum is Our Highway …………………………………………………. 51
• ―Virtuous Cycle‖ ……………………………………………………………. 53
• Spectrum Shortfall Consequences ………………………………………. 54
• NBP on Spectrum ………………………………………………………….. 55
• Spectrum Availability & Pipeline ………………………………………….. 56
• CTIA‘s Position …………………………………………………………….. 57

Table of Contents Continued
– Wireless Taxes and Fees …………………………………………………….. 59
• Wireless Tax Fairness Act of 2011 ………………………………………. 60
• Digital Goods and Services Tax Fairness Act ………………………….. 61
– E-911 Fee & Fund-Raiding …………………………………………………… 62
– Responsible Use ………………………………………………………………. 64
– Universal Service Fund ……………………………………………………….. 67
– Wireless Sustainability ………………………………………………………… 70
– Safe Driving …………………………………………………………………….. 72
• CTIA PSAs ………………………………………………………………..... 75
– Wireless Industry Timeline ……………………………………………………. 76
– Wireless Policy Milestones …………………………………………………… 82
– Additional Resources ………………………………………………………….. 85
– Appendix ………………………………………………………………………... 86
5
Wireless Economy
6
Jobs
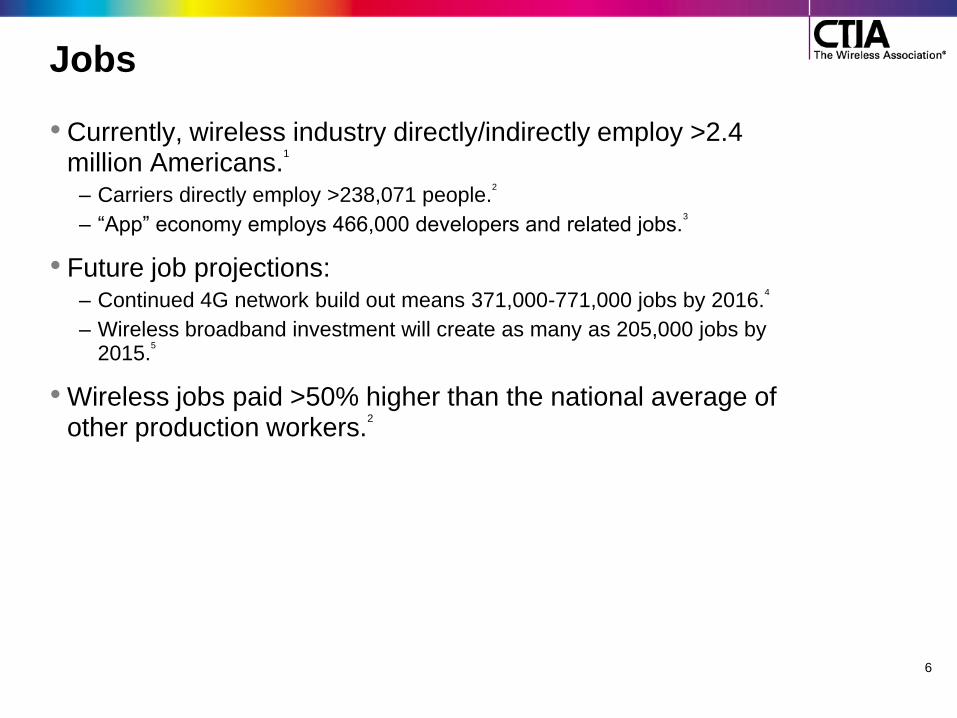
• Currently, wireless industry directly/indirectly employ >2.4 million Americans.
1
– Carriers directly employ >238,071 people.2
– ―App‖ economy employs 466,000 developers and related jobs.3
• Future job projections: – Continued 4G network build out means 371,000-771,000 jobs by 2016.
4
– Wireless broadband investment will create as many as 205,000 jobs by 2015.
5
• Wireless jobs paid >50% higher than the national average of other production workers.
2
7
Infrastructure Investment
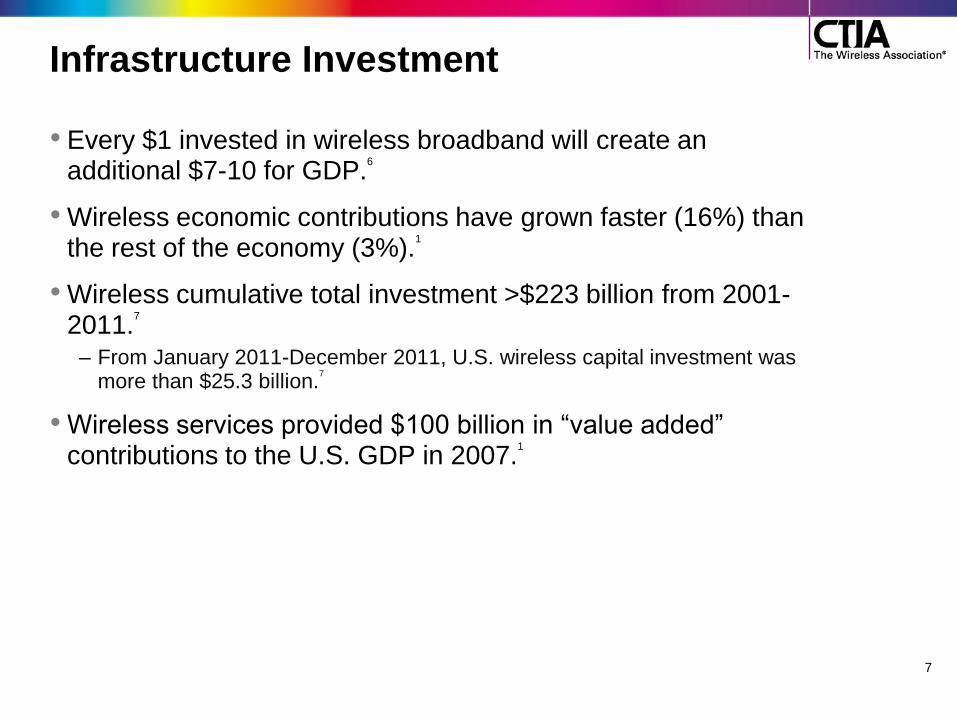
• Every $1 invested in wireless broadband will create an additional $7-10 for GDP.
6
• Wireless economic contributions have grown faster (16%) than the rest of the economy (3%).
1
• Wireless cumulative total investment >$223 billion from 2001-2011.
7
– From January 2011-December 2011, U.S. wireless capital investment was more than $25.3 billion.
7
• Wireless services provided $100 billion in ―value added‖ contributions to the U.S. GDP in 2007.
1

8
U.S. vs. E.U. Infrastructure Investment
• In 2010, U.S. providers reported making capital investments totaling $24.9 billion.
7
Wireless providers in the 5 largest European countries (France, Germany, Italy, Spain and U.K.) spent $13.5 billion combined.
8
$0.0
$5.0
$10.0
$15.0
$20.0
$25.0
EU5 Wireless Capex U.S. Wireless Capex
$13.3
$24.9
Cap
ex
in B
illi
on
s
Comparative Wireless Capex in 2010, EU5 versus USA
Source: Bank of America Merrill Lynch Global Wireless Matrix, 3Q 2011
Mobile Shopping
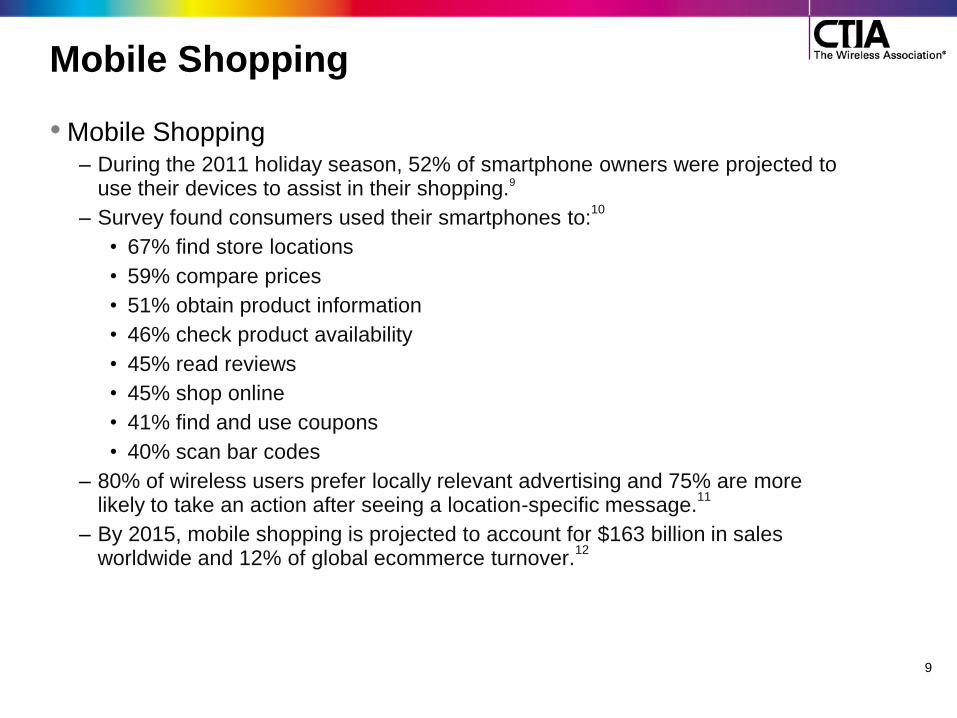
• Mobile Shopping – During the 2011 holiday season, 52% of smartphone owners were projected to
use their devices to assist in their shopping.9
– Survey found consumers used their smartphones to:10
• 67% find store locations
• 59% compare prices
• 51% obtain product information
• 46% check product availability
• 45% read reviews
• 45% shop online
• 41% find and use coupons
• 40% scan bar codes
– 80% of wireless users prefer locally relevant advertising and 75% are more likely to take an action after seeing a location-specific message.
11
– By 2015, mobile shopping is projected to account for $163 billion in sales worldwide and 12% of global ecommerce turnover.
12
9
Wireless Enterprise
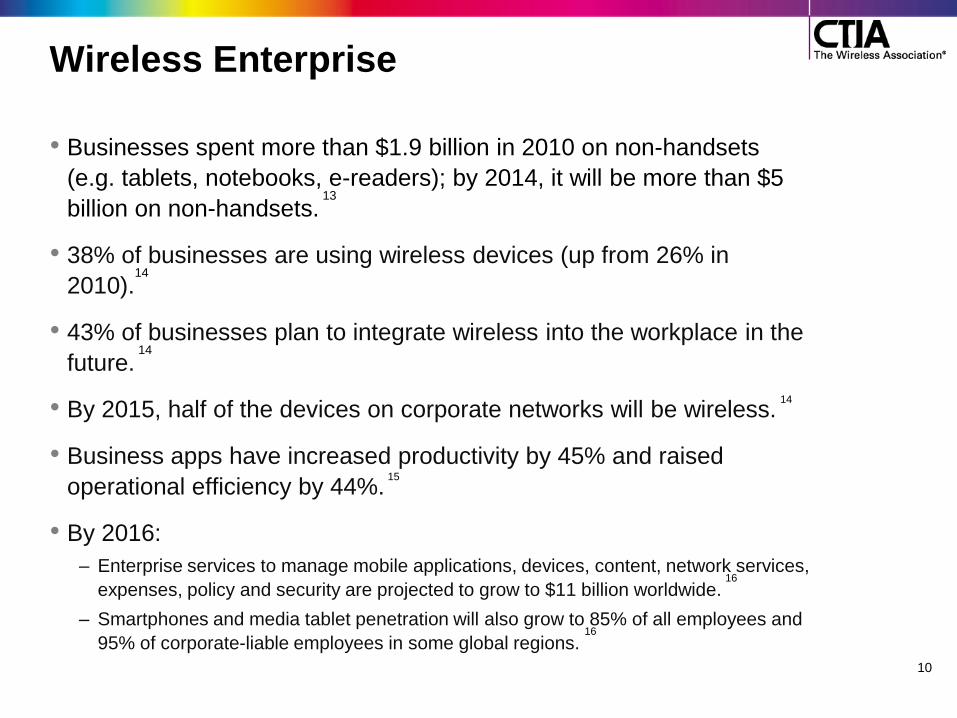
• Businesses spent more than $1.9 billion in 2010 on non-handsets
(e.g. tablets, notebooks, e-readers); by 2014, it will be more than $5
billion on non-handsets. 13
• 38% of businesses are using wireless devices (up from 26% in
2010).14
• 43% of businesses plan to integrate wireless into the workplace in the
future. 14
• By 2015, half of the devices on corporate networks will be wireless. 14
• Business apps have increased productivity by 45% and raised
operational efficiency by 44%. 15
• By 2016:
– Enterprise services to manage mobile applications, devices, content, network services,
expenses, policy and security are projected to grow to $11 billion worldwide. 16
– Smartphones and media tablet penetration will also grow to 85% of all employees and
95% of corporate-liable employees in some global regions. 16
10

Wireless Accessories
• The global market for accessories was $34 billion in 2011 and is expected to grow to $50.2 billion by 2015.
17
• In the U.S., the average consumer spends $60 on accessories for their wireless device.
18
• 47% of mobile phone buyers purchase an accessory at the same time they acquire a new phone.
19
– Cases and car chargers are the accessories most often purchased at the
time of acquiring the device.
• Accessory revenue in 2010:19
– 34% from device protection
– 27% from chargers
– 17% from screen protection
– 13% from headsets
11
Mobile Entertainment
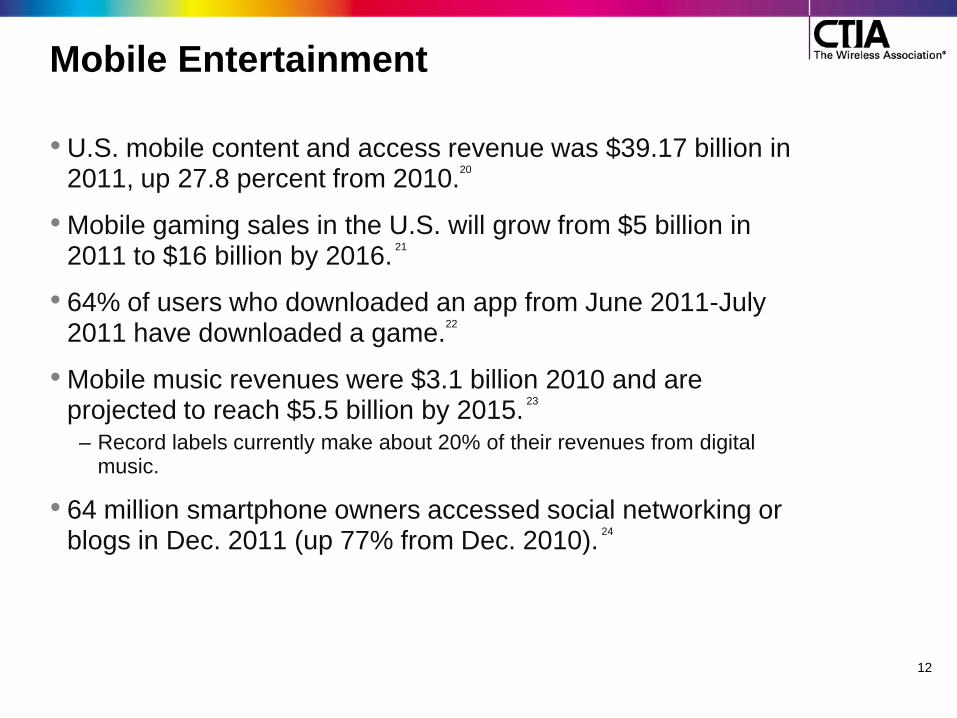
• U.S. mobile content and access revenue was $39.17 billion in 2011, up 27.8 percent from 2010.
20
• Mobile gaming sales in the U.S. will grow from $5 billion in 2011 to $16 billion by 2016.
21
• 64% of users who downloaded an app from June 2011-July 2011 have downloaded a game.
22
• Mobile music revenues were $3.1 billion 2010 and are projected to reach $5.5 billion by 2015.
23
– Record labels currently make about 20% of their revenues from digital
music.
• 64 million smartphone owners accessed social networking or blogs in Dec. 2011 (up 77% from Dec. 2010).
24
12
13
Wireless Ecosystem: Innovation
110,699152,993
439,837
650,105
799,331
985,7171,046,378
1,199,473
1,788,219
0
200,000
400,000
600,000
800,000
1,000,000
1,200,000
1,400,000
1,600,000
1,800,000
2,000,000
May 2009 September
2009April 2010 October
2010December
2010March 2011 April 2011 May 2011 December
2011
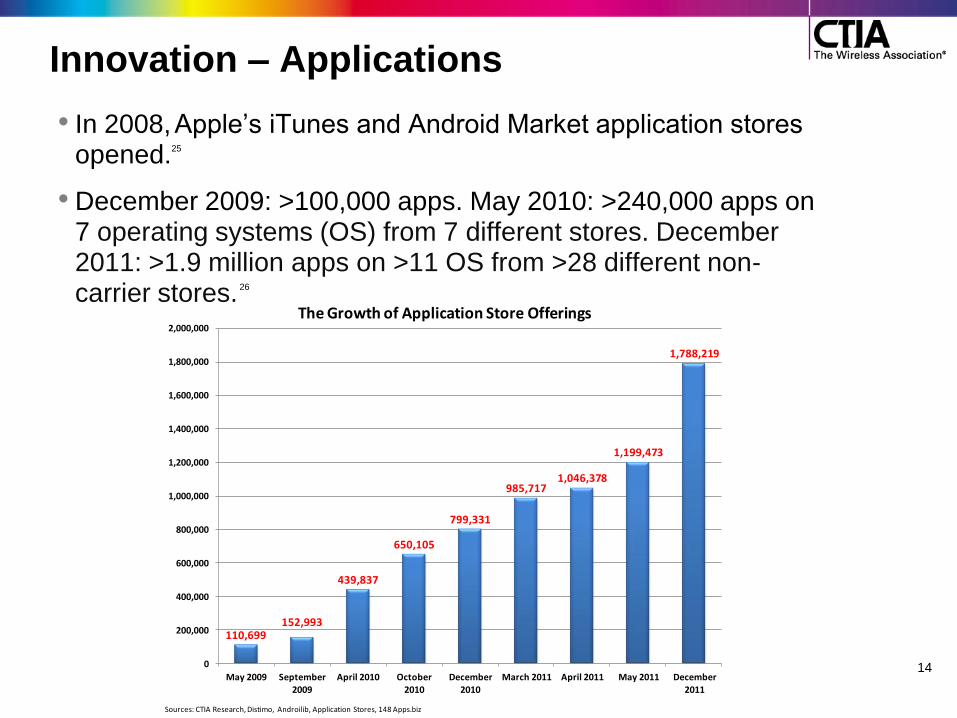
The Growth of Application Store Offerings
Sources: CTIA Research, Distimo, Androilib, Application Stores, 148 Apps.biz
Innovation – Applications
• In 2008, Apple‘s iTunes and Android Market application stores opened.25
• December 2009: >100,000 apps. May 2010: >240,000 apps on 7 operating systems (OS) from 7 different stores. December 2011: >1.9 million apps on >11 OS from >28 different non-carrier stores. 26
14
Innovation – Applications Continued
15
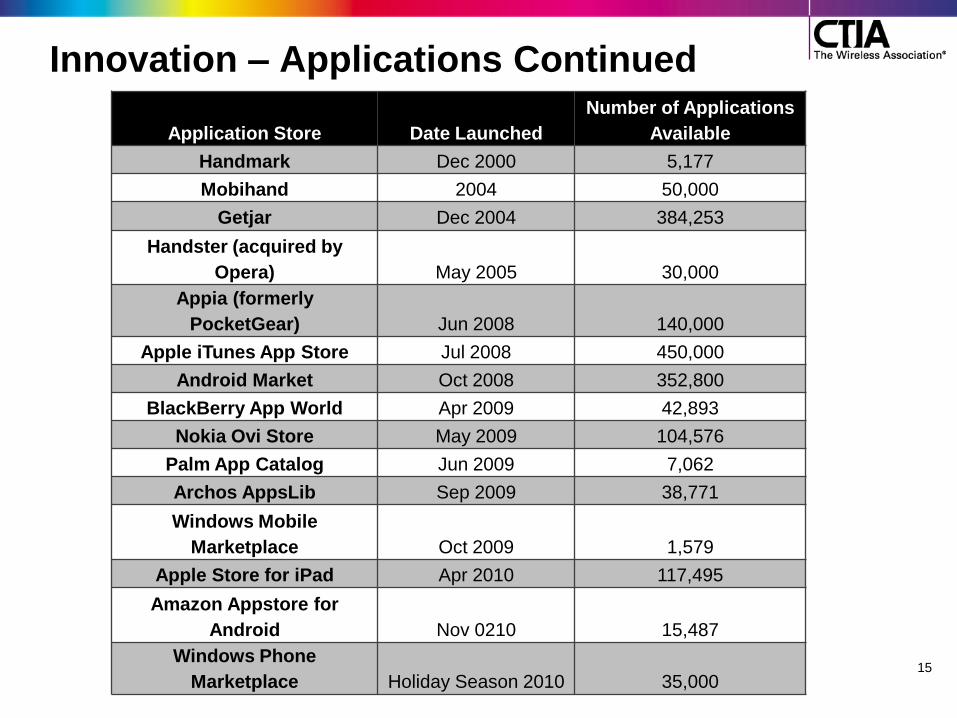
Application Store Date Launched
Number of Applications
Available
Handmark Dec 2000 5,177
Mobihand 2004 50,000
Getjar Dec 2004 384,253
Handster (acquired by
Opera) May 2005 30,000
Appia (formerly
PocketGear) Jun 2008 140,000
Apple iTunes App Store Jul 2008 450,000
Android Market Oct 2008 352,800
BlackBerry App World Apr 2009 42,893
Nokia Ovi Store May 2009 104,576
Palm App Catalog Jun 2009 7,062
Archos AppsLib Sep 2009 38,771
Windows Mobile
Marketplace Oct 2009 1,579
Apple Store for iPad Apr 2010 117,495
Amazon Appstore for
Android Nov 0210 15,487
Windows Phone
Marketplace Holiday Season 2010 35,000

16
Innovation – Applications Continued
• 50% of U.S. cellphone owners (42% of all U.S. adults) have apps on their devices. 27
• Mobile app downloads to increase to 25 billion by 2015, from only 2.6 billion in 2009.28
• App revenue:29 – 2010: $5.2 billion
– 2011: $15.1 billion
– 2015: $57 billion
• By 2016, more than 44 billion apps will have been downloaded.29 – Global population ~7 billion so 6 mobile app downloads for every man,
woman and child.30
• Average smartphone had 22 apps; feature phone 10 apps.31
– Most popular apps: Facebook, Google Maps and The Weather Channel (TWC). 31
– Most popular categories: Games, news, maps, social networking and music. 31
Innovation – Devices • More than 295 million data-capable devices were in the hands of
consumers in December 2011 (95% of all devices); compared to 280.5 million in 2010.7
– >111.5 million of these are smartphones; compared to 78.2 million in 2010.7
– >20.2 million of these are wireless-enabled tablets, laptops and modems; compared to 13.6 million in 2010.
7
• 4G Handsets: – In 2010, the first 4G handset (HTC Evo) was introduced at International CTIA
WIRELESS.
– As of March 2012:
• AT&T: Acer ICONIA TAB; Apple iPad 4G; LG Nitro HD; Samsung Galaxy S II Skyrocket; Samsung
Infuse; HTC Vivid; Pantech Burst; Pantech Pocket; Pantech Element; Impulse 4G; Sony Ericsson
Experia PLAY.
• CellularOne: Motorola Atrix 4G; HTC Inspire 4G.
• MetroPCS: Samsung Galaxy Attain 4G; Samsung Galaxy Indulge; LG Esteem.
• Sprint: Samsung Galaxy S II; Samsung Conquer 4G; Samsung Epid 4G; HTC EVO 3D; HTC EVO
Shift; Motorola PHOTON 4G; Google Nexus S 4G.
• T-Mobile: LG myTouch 4G; LG DoublePlay; Nokia Lumina 710; HTC Amaze 4G; HTC Radar 4G;
Samsung Exhibit II 4G; Samsung Galaxy S II; T-Mobile Sidekick 4G; T-Mobile G2.
• Verizon Wireless: Apple iPad 4G; LG Revolution; LG Spectrum; HTC Rezound; HTC Thunderbolt;
Motorola DROID RAZR; Motorola DROID BIONIC; Motorola DROID XYBOARD; Samsung Galaxy
Nexus; Samsung Stratosphere, Samsung Galaxy Tab 7.7.
17

18
Innovation – Devices Continued
• >630 different handsets and devices are manufactured for the U.S. market.
– In UK, 147 handsets are available.32
• Choose from devices manufactured by >32 companies. – Between April 2010-March 2011, more than 120 new smartphones from
major handset makers were launched.33
• >11 wireless operating systems: Android (Open Handset Alliance); bada (Samsung); Blackberry OS (Research in Motion); BREW (Qualcomm); Java (Sun Microsystems); LiMo (Open Source Linux for Mobile); iOS (Apple); Palm OS (Palm); Symbian (Nokia); WebOS (Palm); Windows Phone (Microsoft).
Top Smartphone Platforms
Share of Smartphone Subscribers – Jan. 2010 Share of Smartphone Subscribers – Oct 2011
RIM 43.0% Google 46.3%
Apple 25.1% Apple 28.1%
Microsoft 15.7% RIM 17.2%
Google 7.1% Microsoft 5.4%
Palm 5.7% Symbian 1.6%
Source: comScore MobiLens
Innovation – Devices Continued
• The average price of a wireless handset has gone from $85 to less than $35.34 The average price of a smartphone has dropped for four consecutive quarters to $135. 35
• 50% of American adults own smartphones as of February2012, up from 38 percent in February 2011. 36
– 49.3% of American adults own a feature phones.36
• By 2015, tablet sales will exceed 49 million units, surpassing laptop sales when one-third of U.S. consumers will own a tablet.37
• By 2015, there will be >15 billion network devices worldwide, or almost 2 devices per person.38
19
Innovation – Devices Continued
• Competition within the wireless ecosystem means consumers have a choice of where and how to purchase handsets: from wireless providers; online stores; and retailers that offer mobile phones with plans, no contract and pre-paid phones and unlocked phones that can be used on any network.39
• Today, more carriers offer unlocked handsets or offer the ability to use unlocked phones on their network, giving consumers choice for where they wish to purchase their devices. 40
• Some of the most advanced wireless devices are launched first in the U.S. – Apple iPhone 4, iPad 2; Google Nexus S and 4G; BlackBerry Curve 8900 and Torch; Motorola Droid Bionic; Samsung Galaxy S II; HTC EVO 3D and Thunderbolt; Amazon Kindle and Kindle Fire; Barnes & Noble Nook; Motorola Xoom.
20
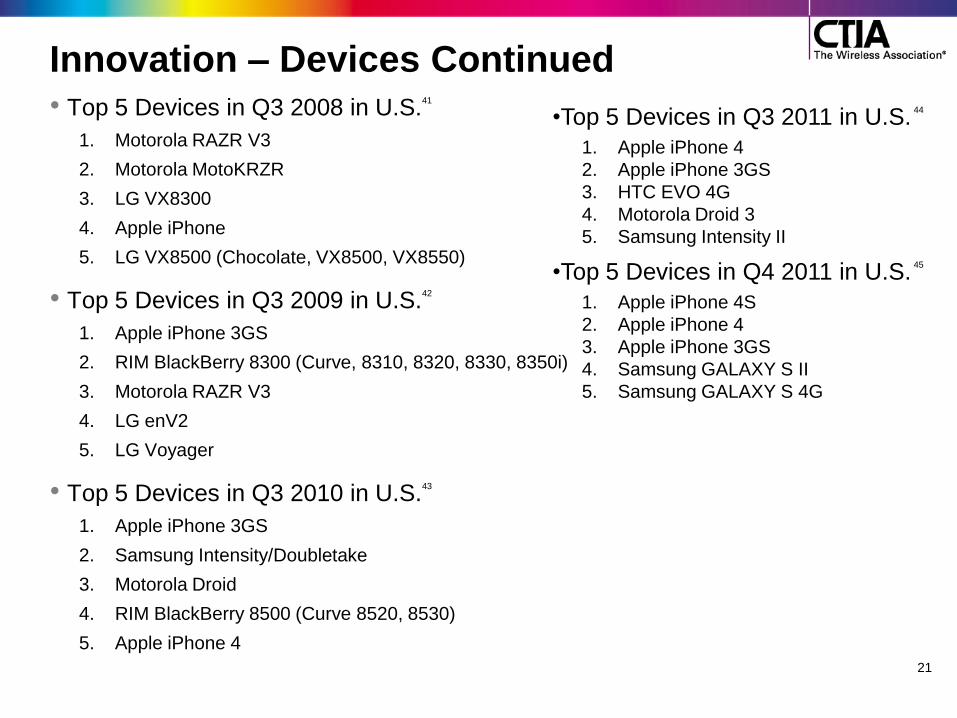
Innovation – Devices Continued • Top 5 Devices in Q3 2008 in U.S.
41
1. Motorola RAZR V3
2. Motorola MotoKRZR
3. LG VX8300
4. Apple iPhone
5. LG VX8500 (Chocolate, VX8500, VX8550)
• Top 5 Devices in Q3 2009 in U.S.42
1. Apple iPhone 3GS
2. RIM BlackBerry 8300 (Curve, 8310, 8320, 8330, 8350i)
3. Motorola RAZR V3
4. LG enV2
5. LG Voyager
• Top 5 Devices in Q3 2010 in U.S.43
1. Apple iPhone 3GS
2. Samsung Intensity/Doubletake
3. Motorola Droid
4. RIM BlackBerry 8500 (Curve 8520, 8530)
5. Apple iPhone 4
21
•Top 5 Devices in Q3 2011 in U.S. 44
1. Apple iPhone 4
2. Apple iPhone 3GS
3. HTC EVO 4G
4. Motorola Droid 3
5. Samsung Intensity II
•Top 5 Devices in Q4 2011 in U.S. 45
1. Apple iPhone 4S
2. Apple iPhone 4
3. Apple iPhone 3GS
4. Samsung GALAXY S II
5. Samsung GALAXY S 4G

Types and Capabilities of Wireless Devices in the U.S.
22
Wireless Demographics and Usage
23
U.S. Wireless-Only Households
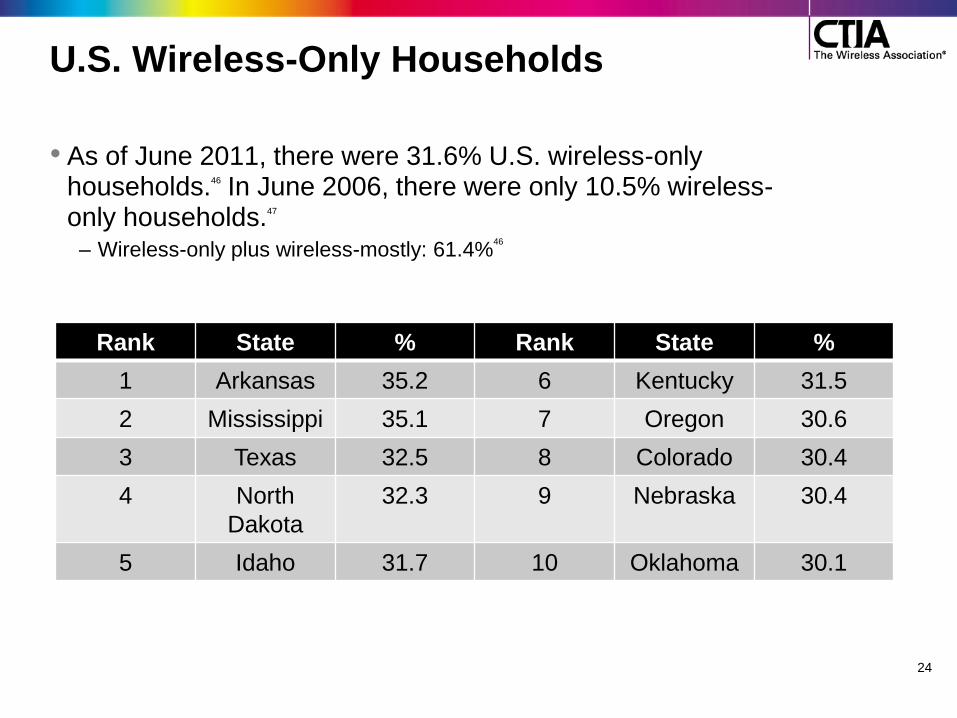
• As of June 2011, there were 31.6% U.S. wireless-only households.46 In June 2006, there were only 10.5% wireless-only households.47
– Wireless-only plus wireless-mostly: 61.4%46
24
Rank State % Rank State %
1 Arkansas 35.2 6 Kentucky 31.5
2 Mississippi 35.1 7 Oregon 30.6
3 Texas 32.5 8 Colorado 30.4
4 North
Dakota
32.3 9 Nebraska 30.4
5 Idaho 31.7 10 Oklahoma 30.1
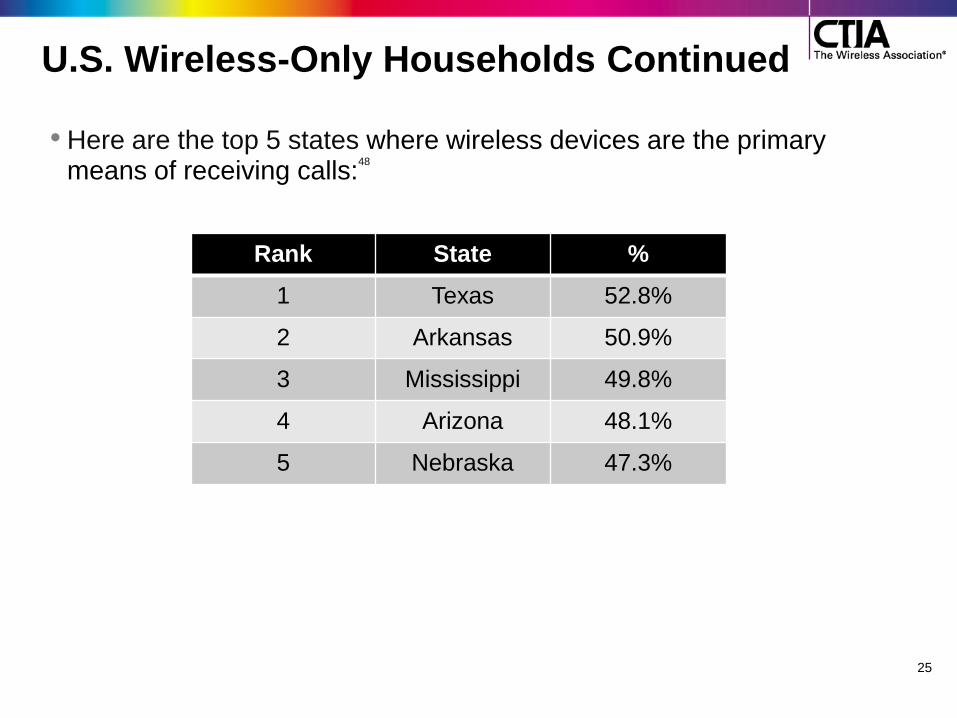
U.S. Wireless-Only Households Continued
• Here are the top 5 states where wireless devices are the primary means of receiving calls:
48
25
Rank State %
1 Texas 52.8%
2 Arkansas 50.9%
3 Mississippi 49.8%
4 Arizona 48.1%
5 Nebraska 47.3%
26
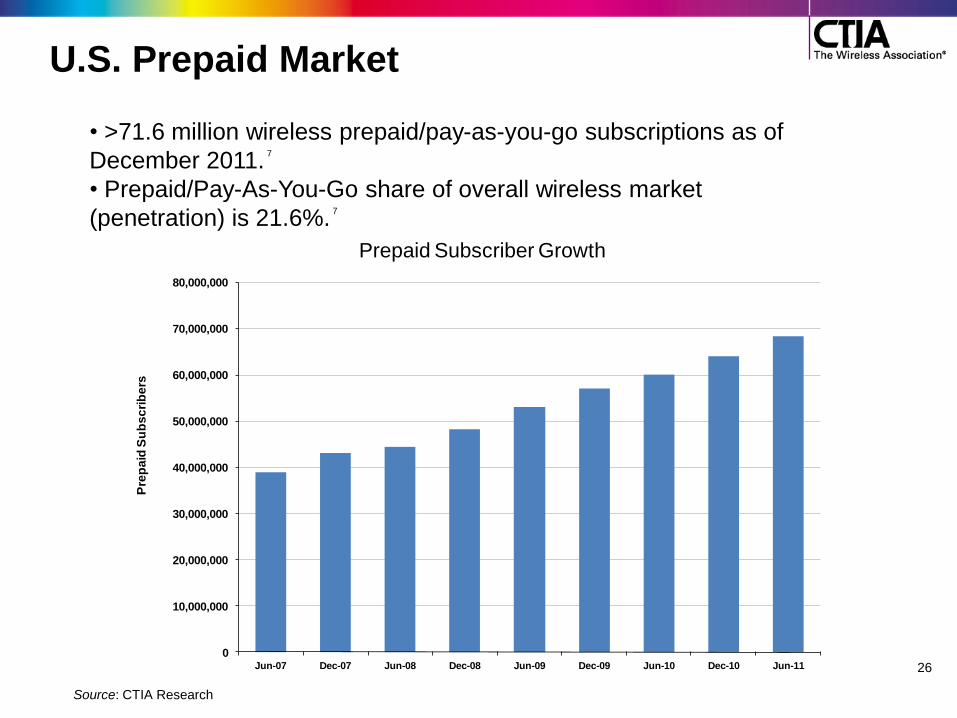
U.S. Prepaid Market
0
10,000,000
20,000,000
30,000,000
40,000,000
50,000,000
60,000,000
70,000,000
80,000,000
Jun-07 Dec-07 Jun-08 Dec-08 Jun-09 Dec-09 Jun-10 Dec-10 Jun-11
Pre
pa
id S
ub
sc
rib
ers
Prepaid Subscriber Growth
Source: CTIA Research
• >71.6 million wireless prepaid/pay-as-you-go subscriptions as of
December 2011. 7
• Prepaid/Pay-As-You-Go share of overall wireless market
(penetration) is 21.6%. 7
27
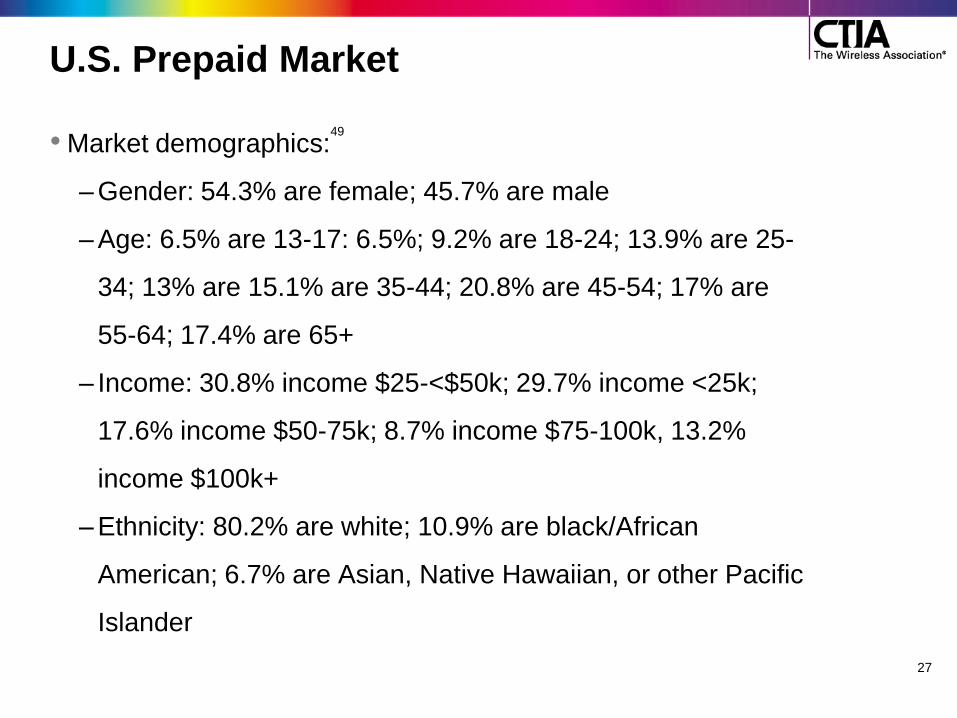
U.S. Prepaid Market
• Market demographics:49
– Gender: 54.3% are female; 45.7% are male
– Age: 6.5% are 13-17: 6.5%; 9.2% are 18-24; 13.9% are 25-
34; 13% are 15.1% are 35-44; 20.8% are 45-54; 17% are
55-64; 17.4% are 65+
– Income: 30.8% income $25-<$50k; 29.7% income <25k;
17.6% income $50-75k; 8.7% income $75-100k, 13.2%
income $100k+
– Ethnicity: 80.2% are white; 10.9% are black/African
American; 6.7% are Asian, Native Hawaiian, or other Pacific
Islander
Data Usage
• From December 2010 to December 2011, wireless data traffic
increased 123% from 388 billion megabytes in 2010 to 866.7 billion
megabytes in 2011. 7
• To put this in perspective, if you were walking and listening to five
songs per mile and each song lasted for four minutes:
– In 2010, you would walk 77,601,961,033 miles, or the equivalent of 3,116,419 times around the world for 2,952,890 years and listen to 97 billion songs.
– In 2011, you would walk 173,364,056,929 miles, or the equivalent of 6,962,132 times around the world for 6,596,806 years and listen to 216.7 billion songs.
• The amount of data the average smartphone user consumers per
month has grown by 89% from 230 MB in Q1 2010 to 435 MB in Q1
2011.51
• Between 2009 and 2010, wireless accounted for more than 85% of all
new connections offering download speeds of at least 768 kbps and
61% with at least 3 mbps, regardless of technology. 50
28
108
161
227
341
0
50
100
150
200
250
300
350
400
December 2009 June 2010 December 2010 June 2011
Bill
ion
s
Six Month MB Volumes
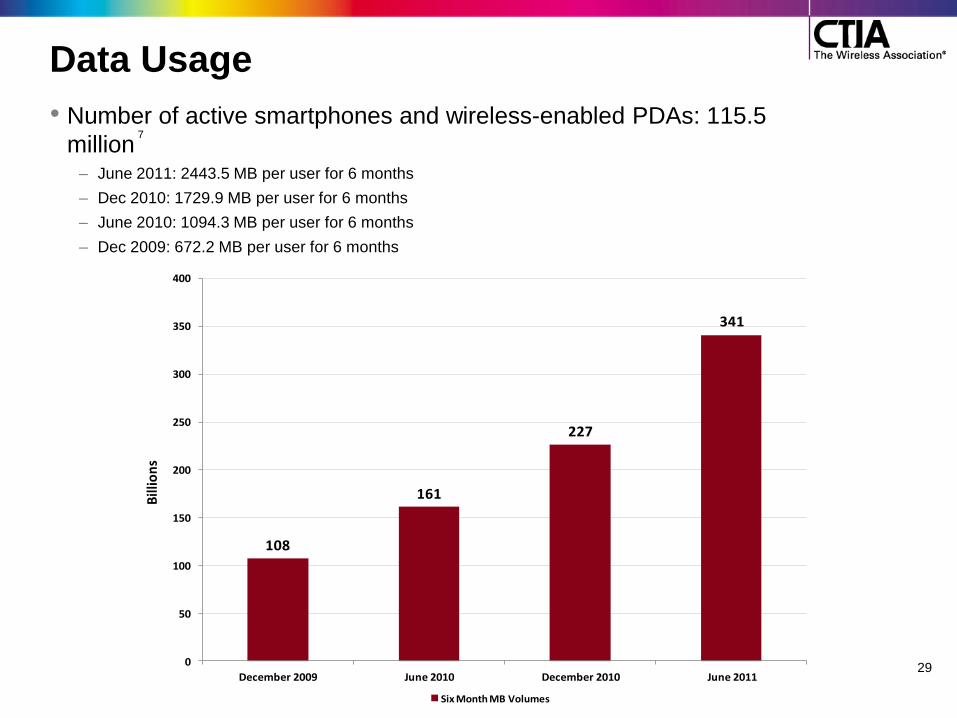
Data Usage
• Number of active smartphones and wireless-enabled PDAs: 115.5
million 7
– June 2011: 2443.5 MB per user for 6 months
– Dec 2010: 1729.9 MB per user for 6 months
– June 2010: 1094.3 MB per user for 6 months
– Dec 2009: 672.2 MB per user for 6 months
29

48,959
118,084
235,411
416,025
674,579
986,039
0
200,000
400,000
600,000
800,000
1,000,000
1,200,000
2010 2011 2012 2013 2014 2015
Tota
l Mo
nth
ly T
era
byt
es
Source: Cisco Systems Visual Networking Index, 2011
Data Usage Projections
• Cisco Systems, The Yankee Group and Coda Research projected (on
average) that data traffic in 2014 would be 35 times the volume of traffic in
2009.52
• Cisco‘s Visual Networking Index (VNI) has projected that wireless data traffic in
North America will grow 20 times from 2010 to 2015, on top of the already
extraordinary growth we‘ve experienced.53
– Combining Cisco‘s projections for the last two years, wireless data traffic in 2015 is expected to be 56 times the volume of traffic in 2009.
30
Wireless Competition
31
32
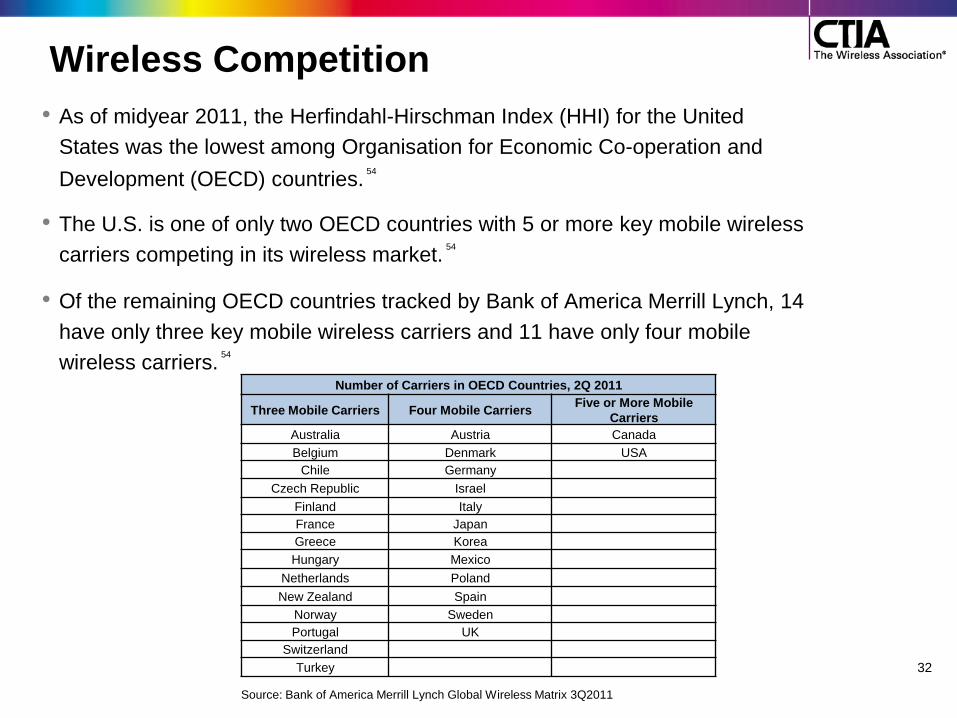
Wireless Competition
• As of midyear 2011, the Herfindahl-Hirschman Index (HHI) for the United
States was the lowest among Organisation for Economic Co-operation and
Development (OECD) countries. 54
• The U.S. is one of only two OECD countries with 5 or more key mobile wireless
carriers competing in its wireless market. 54
• Of the remaining OECD countries tracked by Bank of America Merrill Lynch, 14
have only three key mobile wireless carriers and 11 have only four mobile
wireless carriers. 54
Number of Carriers in OECD Countries, 2Q 2011
Three Mobile Carriers Four Mobile Carriers Five or More Mobile
Carriers
Australia Austria Canada
Belgium Denmark USA
Chile Germany
Czech Republic Israel
Finland Italy
France Japan
Greece Korea
Hungary Mexico
Netherlands Poland
New Zealand Spain
Norway Sweden
Portugal UK
Switzerland
Turkey
Source: Bank of America Merrill Lynch Global Wireless Matrix 3Q2011
33
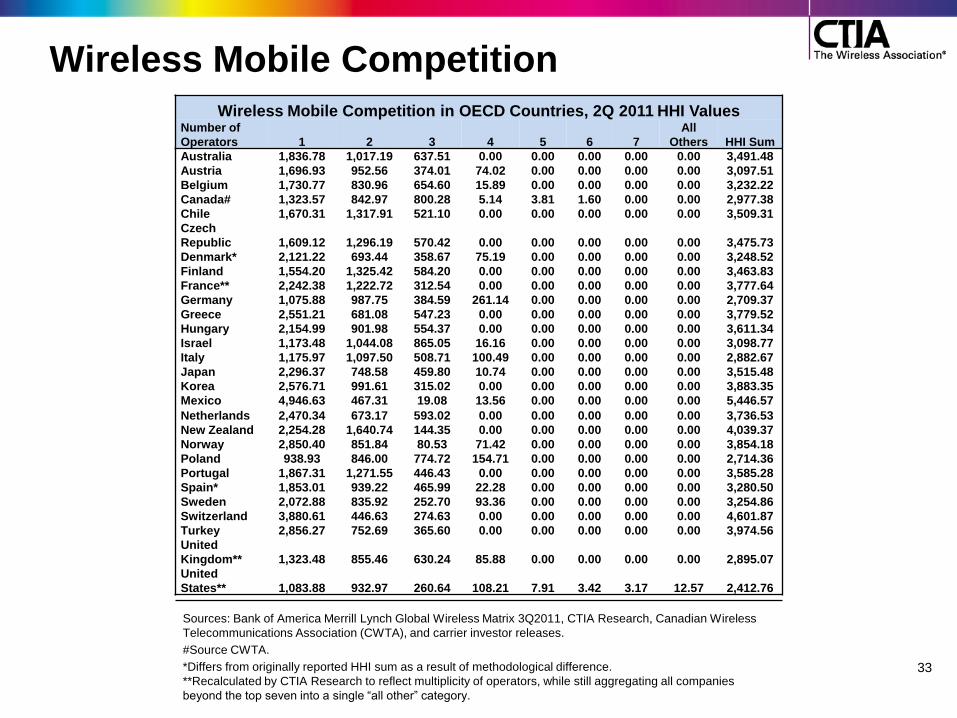
Wireless Mobile Competition
Wireless Mobile Competition in OECD Countries, 2Q 2011 HHI Values Number of
Operators 1 2 3 4 5 6 7
All
Others HHI Sum
Australia 1,836.78 1,017.19 637.51 0.00 0.00 0.00 0.00 0.00 3,491.48
Austria 1,696.93 952.56 374.01 74.02 0.00 0.00 0.00 0.00 3,097.51
Belgium 1,730.77 830.96 654.60 15.89 0.00 0.00 0.00 0.00 3,232.22
Canada# 1,323.57 842.97 800.28 5.14 3.81 1.60 0.00 0.00 2,977.38
Chile 1,670.31 1,317.91 521.10 0.00 0.00 0.00 0.00 0.00 3,509.31
Czech
Republic 1,609.12 1,296.19 570.42 0.00 0.00 0.00 0.00 0.00 3,475.73
Denmark* 2,121.22 693.44 358.67 75.19 0.00 0.00 0.00 0.00 3,248.52
Finland 1,554.20 1,325.42 584.20 0.00 0.00 0.00 0.00 0.00 3,463.83
France** 2,242.38 1,222.72 312.54 0.00 0.00 0.00 0.00 0.00 3,777.64
Germany 1,075.88 987.75 384.59 261.14 0.00 0.00 0.00 0.00 2,709.37
Greece 2,551.21 681.08 547.23 0.00 0.00 0.00 0.00 0.00 3,779.52
Hungary 2,154.99 901.98 554.37 0.00 0.00 0.00 0.00 0.00 3,611.34
Israel 1,173.48 1,044.08 865.05 16.16 0.00 0.00 0.00 0.00 3,098.77
Italy 1,175.97 1,097.50 508.71 100.49 0.00 0.00 0.00 0.00 2,882.67
Japan 2,296.37 748.58 459.80 10.74 0.00 0.00 0.00 0.00 3,515.48
Korea 2,576.71 991.61 315.02 0.00 0.00 0.00 0.00 0.00 3,883.35
Mexico 4,946.63 467.31 19.08 13.56 0.00 0.00 0.00 0.00 5,446.57
Netherlands 2,470.34 673.17 593.02 0.00 0.00 0.00 0.00 0.00 3,736.53
New Zealand 2,254.28 1,640.74 144.35 0.00 0.00 0.00 0.00 0.00 4,039.37
Norway 2,850.40 851.84 80.53 71.42 0.00 0.00 0.00 0.00 3,854.18
Poland 938.93 846.00 774.72 154.71 0.00 0.00 0.00 0.00 2,714.36
Portugal 1,867.31 1,271.55 446.43 0.00 0.00 0.00 0.00 0.00 3,585.28
Spain* 1,853.01 939.22 465.99 22.28 0.00 0.00 0.00 0.00 3,280.50
Sweden 2,072.88 835.92 252.70 93.36 0.00 0.00 0.00 0.00 3,254.86
Switzerland 3,880.61 446.63 274.63 0.00 0.00 0.00 0.00 0.00 4,601.87
Turkey 2,856.27 752.69 365.60 0.00 0.00 0.00 0.00 0.00 3,974.56
United
Kingdom** 1,323.48 855.46 630.24 85.88 0.00 0.00 0.00 0.00 2,895.07
United
States** 1,083.88 932.97 260.64 108.21 7.91 3.42 3.17 12.57 2,412.76
Sources: Bank of America Merrill Lynch Global Wireless Matrix 3Q2011, CTIA Research, Canadian Wireless
Telecommunications Association (CWTA), and carrier investor releases.
#Source CWTA.
*Differs from originally reported HHI sum as a result of methodological difference.
**Recalculated by CTIA Research to reflect multiplicity of operators, while still aggregating all companies
beyond the top seven into a single ―all other‖ category.

U.S. Leads in Wireless Value Thanks to Competition
34
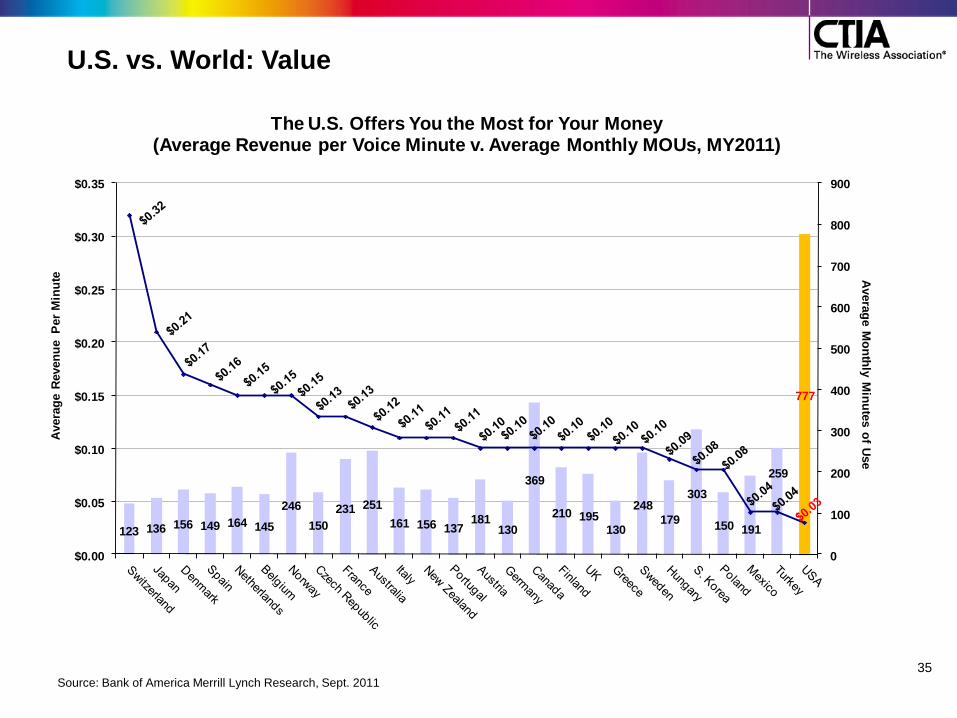
U.S. vs. World: Value
Source: Bank of America Merrill Lynch Research, Sept. 2011
123 136 156 149 164 145
246
150
231 251
161 156 137181
130
369
210 195130
248
179
303
150 191
259
777
0
100
200
300
400
500
600
700
800
900
$0.00
$0.05
$0.10
$0.15
$0.20
$0.25
$0.30
$0.35
Avera
ge M
on
thly
Min
ute
s o
f Use
Avera
ge R
even
ue P
er
Min
ute
The U.S. Offers You the Most for Your Money(Average Revenue per Voice Minute v. Average Monthly MOUs, MY2011)
35
36
U.S. Ranks #1 • Lowest revenue per minute of OECD countries.
– Average revenue per minute is nearly 70% lower than the averages of the other 27 countries.
54
– Average revenue per minute is nearly 70% lower than the average European country.
54
– At the end of 2Q 2011, the average revenue per minute in the U.S. was $0.03. Across Europe‘s developed countries, the average revenue per minute was $0.13. As a result, the average wireless consumer in Europe used just 172 minutes a month compared to 777 minutes a month for the U.S.
8
– Most minutes of use (MOUs) – 2.296 trillion MOUs in 2011 (or 6.3 billion MOUs per day).
7
– Highest MOUs per month per user and the lowest average revenue per minute of service of the 28 OECD countries tracked by Bank of America Merrill Lynch.
54
• Most mobile Internet users than any other country. 54
– U.S. wireless consumers account for 29.3% of all mobile Web surfing. 54
• 3G Technology has been deployed to more than 98% of the U.S. population.34
37
U.S. Ranks #1 Cont’d
• Total U.S. population is <5% of the world‘s total population.55
• Total U.S. subscribership is <6% of the world's total wireless subscribers.56
• The U.S. is home to 21% of global 3G/4G subscribers.56
• The U.S. is home to 56% of global mobile WiMAX subscribers.56
• The U.S. is home to >87% of global LTE subscribers.56
• U.S. has >164 million 3G/4G subscribers.56

The “Internet of Things”
38

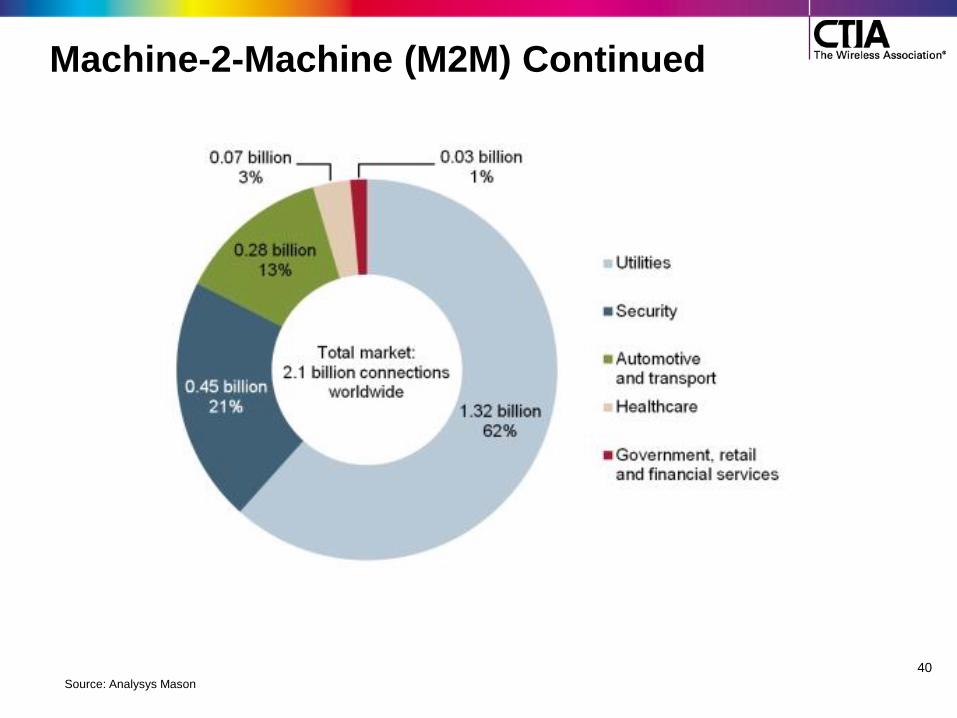
Machine-2-Machine (M2M)
• M2M are applications or mobile units that use wireless networks to communicate with other machines.
– Applications may include telemetry and telematic devices, remote monitoring systems (e.g. smart grid, healthcare, transportation, etc) and other devices that provide status reports to businesses‘ centers (e.g. operations, traffic management, data management, etc).
• By 2020, >16 billion M2M devices worldwide;80 compared to 62 million in 2010.57
• Year-over-year growth is expected to be between 36% to 52%.57
• Transportation and distribution sector is the largest M2M vertical market with >30% market share. 58
• By 2015, more than 40% of M2M connections in the U.S. will run 3G or faster networks. 58
39
Machine-2-Machine (M2M) Continued
40
Source: Analysys Mason
Wireless Technology – Healthcare
•83% of wireless Internet users have looked online
for health information.59
•By 2016, there will be >80 million wearable wireless
sensors for fitness and wellbeing.60
•WHO reports 8 in 10 countries are using mHealth,
e.g., for help lines, emergency toll-free numbers and
telemedicine.60
– 85% of the world‘s population is covered by a commercial wireless
signal.60
– 5 billion cellphone subscribers in the world.60
41
Wireless Technology – Healthcare Continued
• Examples:
• Text4baby sends texts healthcare tips every week to pregnant women and new
moms. While all expectant mothers and new moms may benefit from the text
messages, text4baby is focused on reaching and engaging those populations who
are statistically more at-risk to experience traumatic births, by promoting healthy
behavior through mobile technology. A program of the National Healthy Mothers,
Healthy Babies Coalition (HMHB), text4baby is the largest free national health
initiative to date and is made possible through a public-private partnership that
boasts more than 350 organizations, CTIA-The Wireless Foundation as one of the
program‘s founding partners.61
• Wheelmap is an iPhone app that finds routes for wheelchair users. The user can
also see which public transportation hubs are wheelchair accessible and elevator
locations.62
• GreatCall’s MedCoach iOS app gives users the ability to monitor their
prescriptions, a contact list for nearby doctors and nearby pharmacy locations. The
app also has a 24/7 email service that links to GreatCall‘s HIPPA compliant
customer support team.63
42
Wireless Technology – Healthcare Continued
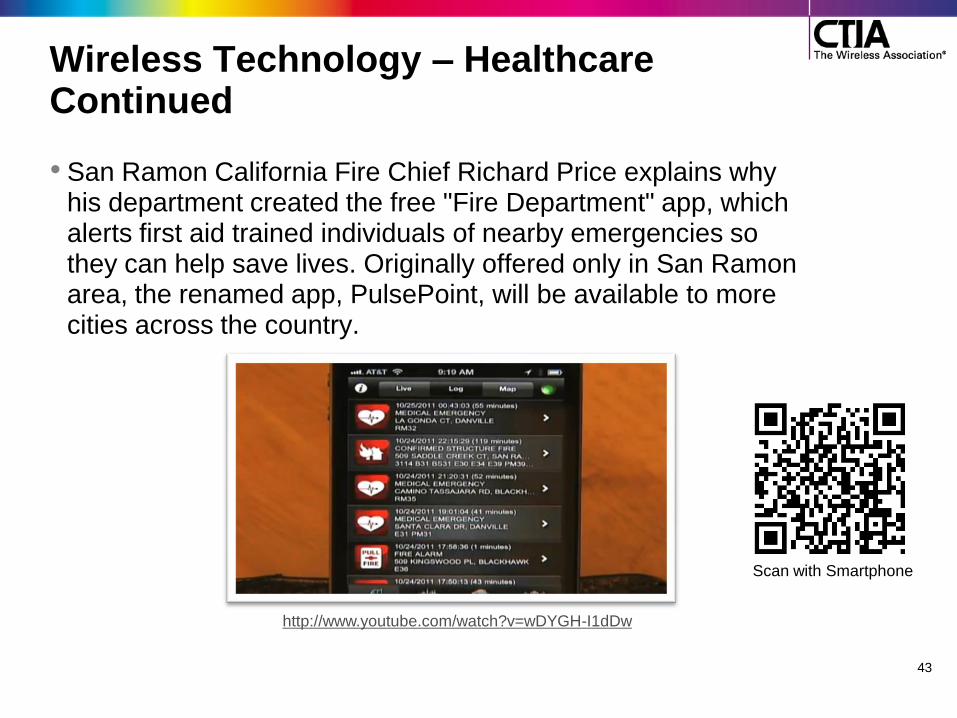
• San Ramon California Fire Chief Richard Price explains why his department created the free "Fire Department" app, which alerts first aid trained individuals of nearby emergencies so they can help save lives. Originally offered only in San Ramon area, the renamed app, PulsePoint, will be available to more cities across the country.
43
Scan with Smartphone
http://www.youtube.com/watch?v=wDYGH-I1dDw
Wireless Technology – Healthcare Continued
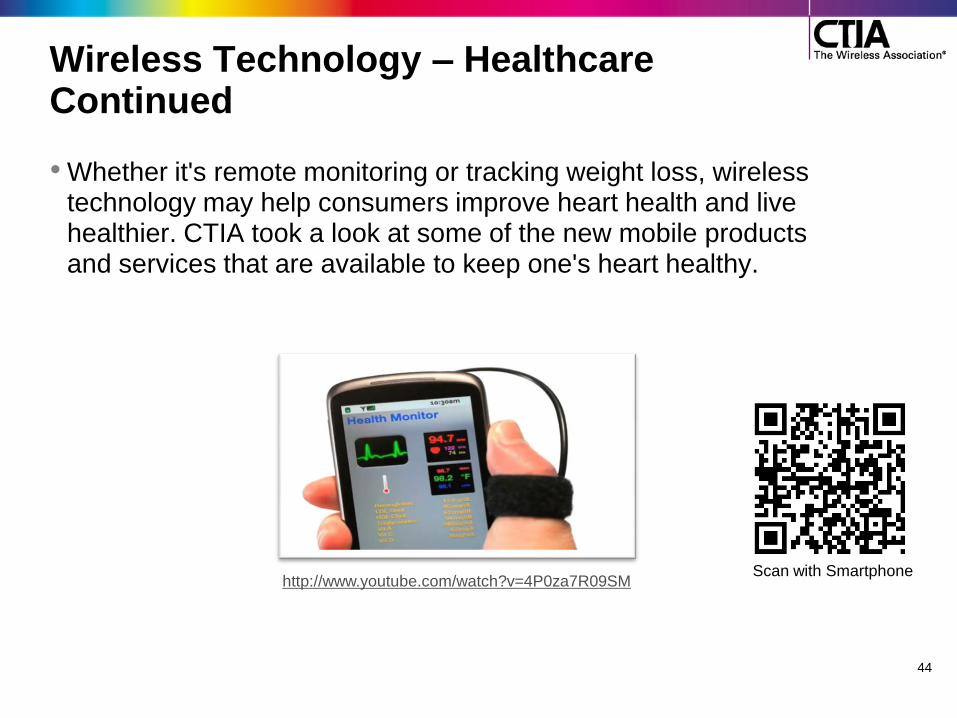
• Whether it's remote monitoring or tracking weight loss, wireless technology may help consumers improve heart health and live healthier. CTIA took a look at some of the new mobile products and services that are available to keep one's heart healthy.
44
Scan with Smartphone
http://www.youtube.com/watch?v=4P0za7R09SM
Wireless Technology – Education
• Project K-Nect, a program that gave smartphones and wireless service to 9th grade math students in North Carolina. Students in the program used their phones to communicate and collaborate with each other and tutors. When compared to other students in their school, district and state, Project K-Nect students were more likely to achieve proficiency in Algebra I & II as well as feel more successful in math in general (85%). When compared nationwide, Project K-Nect students (61%) have a greater self-perception that they are succeeding academically than their peers (39%).
64
• With more than 26,000 apps available on iOS for the education market, school districts are integrating iPads into the classroom. As of January 2012, 1.5 million iPads are in use in educational institutions and schools.
65
Studies have shown that iPads in the classroom has achieved higher literacy rates for kindergarteners and can help autistic students communicate.
66
45
Wireless Technology – Education
• The Joan Ganz Cooney Center at Sesame Workshop and Nokia Research Center formed a research collaboration to examine improving literacy through mobile media. The first project to come out of the collaboration was Story Visit, a distance learning tool that allows children to read stories with relatives who are far away. It combines video conferencing with connected storybooks. When an adult turns the page, the child‘s page turns too, allowing them to read together even though they are physically apart.67
• Museums are tapping into mobile solutions to enhance their learning experiences. For instance, the American Museum of Natural History in New York offers a mobile application which provides information and turn-by-turn directions to specific points of interests in the museum.68
46
Wireless Technology – Energy
• The Telework Research Network said that if 40 percent of employees telecommuted half the time, they‘d save more than 280 million barrel of oil; reduce greenhouse gases by 53 million tons (similar to taking almost 10 million cars off the road for a year); and increase national productivity by 5.5 million man-years, or $235 billion worth of work.
69
• As of January 1, 2012, most of the new smartphones in the U.S. will have a UCS, which will provide an estimated 50 percent reduction in standby energy consumption. It does this by utilizing the micro-USB format as the common universal charging interface and use energy-efficient chargers that meet U.S. ―Energy Star‖ requirements for external power adapters.
• T-Mobile developed a SIM card specifically designed for M2M applications, including smart grid applications. The M2M SIM is much smaller than traditional SIM cards – it is only about the size of a pin head – and is designed to withstand harsh weather conditions where M2M devices may be deployed.
70
47
Wireless Technology – Energy Continued
• Smart grids depend on information conveyed by wireless technology to enable timely action and promote lower energy use. If rolled out nationally, smart grids could eliminate 360 million metric tons of CO2, the equivalent of the emissions produced by 68 million passenger vehicles or the annual energy use of 30 million U.S. homes.
71
• Morgan Stanley predicts the worldwide smart grid market will have grown annually from about $20 billion in 2010 to almost $100 billion by the year 2030.
72
• By 2015, ABI Research says there will be approximately 212 million smart meter systems and smart grid projects installed worldwide.
73
• If America‘s power grid was just 5 percent more efficient, IBM estimates it would save greenhouse emissions equivalent to 53 million cars.
74
48
49
Spectrum

50
What’s Spectrum?
• ALL of the apps, speed, devices and other innovations of the wireless industry are in jeopardy without more spectrum.
– Spectrum is simply defined as the radio frequencies that are designated for specific uses, such as personal communications services and public safety.
―As the demand increases, and the benefits are more compelling by the day, it‘s all the more reason why unleashing more spectrum must be a national priority. That‘s what I want to talk about today: four core reasons why spectrum is at the top of my agenda -- American competitiveness, opportunity, the enormous dollar benefits of freeing up spectrum and the enormous costs of delay.‖
– FCC Chairman Julius Genachowski International CTIA WIRELESS 2011 Show

Spectrum is Our Highway
• To the wireless industry, spectrum is our equivalent to lanes on a highway.
– Cars are like our mobile devices, such as cellphones, smartphones, tablets and wireless Internet cards. In the last ten years, there has been a tremendous increase in the number of cars, or devices, and in the amount of time they‘re spending on the ‗roads‘. To meet that demand, our members need more lanes, or spectrum. Otherwise, we‘ll have a significant traffic jam.
51
Spectrum is Our Highway
• In February 2012, the President signed the Middle Class Tax Relief and Job Creation Act into law. The law includes provisions that would make an important down payment toward the 500 MHz of spectrum that the National Broadband Plan (NBP) identified as needed by the U.S. wireless industry by 2020, 300 MHz of which will be available by 2015.
• The act also:
– Authorizes the FCC to conduct incentive auctions to make bands currently
occupied by television broadcasters available for wireless broadband
services.
– Allows additional unlicensed use in guard bands (subject, appropriately, to
interference protection) and at 5.4 GHz.
– Further streamlines the process for deploying wireless facilities (antennas,
towers, etc.).
• The National Telecommunications and Information Administration (NTIA) released a report in March 2012 that concluded high-value spectrum currently used by the government (1755 to 1850 MHz) should be repurposed for commercial use. The 1755-1780 MHz band can be paired with AWS 3 spectrum and represents a near-term opportunity to bring this spectrum to auction.
52
53
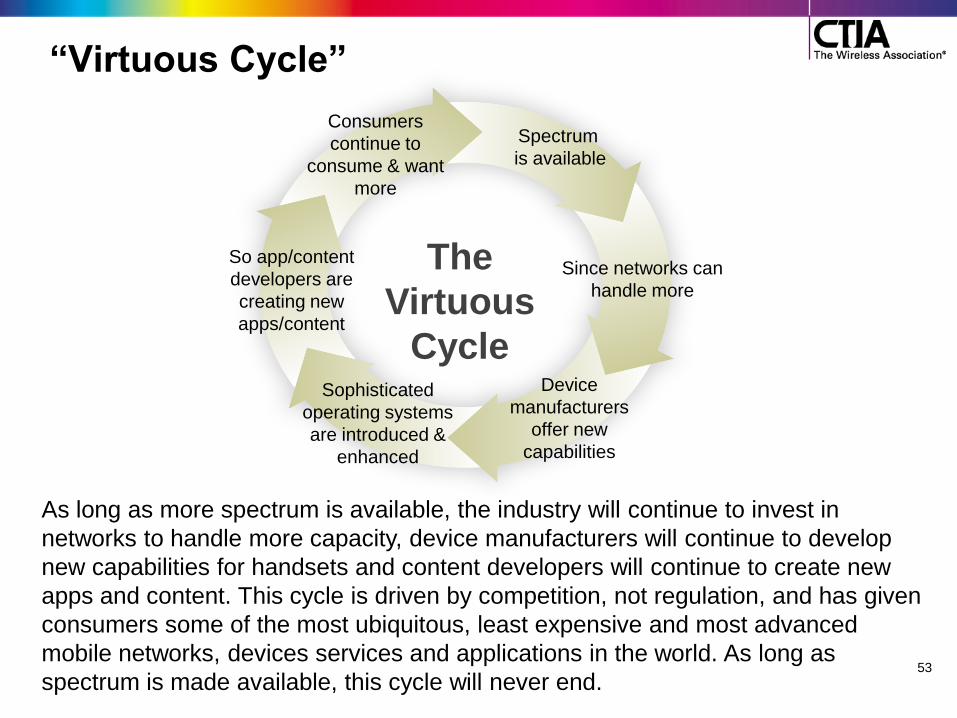
“Virtuous Cycle”
As long as more spectrum is available, the industry will continue to invest in
networks to handle more capacity, device manufacturers will continue to develop
new capabilities for handsets and content developers will continue to create new
apps and content. This cycle is driven by competition, not regulation, and has given
consumers some of the most ubiquitous, least expensive and most advanced
mobile networks, devices services and applications in the world. As long as
spectrum is made available, this cycle will never end.
Spectrum
is available
So app/content
developers are
creating new
apps/content
Consumers
continue to
consume & want
more
Device
manufacturers
offer new
capabilities
The
Virtuous
Cycle
Since networks can
handle more
Sophisticated
operating systems
are introduced &
enhanced
54
Spectrum Shortfall Consequences
• While it is impossible to identify with precision all of the potential harms of not bringing sufficient spectrum to market, Peter Rysavy, an analyst says:
– Not being able to augment capacity through additional spectrum will have multiple adverse consequences:
• Networks will perform at lower levels and be less reliable
• Service plans will change
• The vibrant cycle of innovation in the wireless ecosystem will stall.50
– This spectrum drought could lead to the U.S. ceding global leadership in mobile communications and computing to other countries.
50
– This outcome could impact not only wireless innovation in the U.S. could also impact investment, job growth and improvement in our health care, education and energy sectors.
50
55
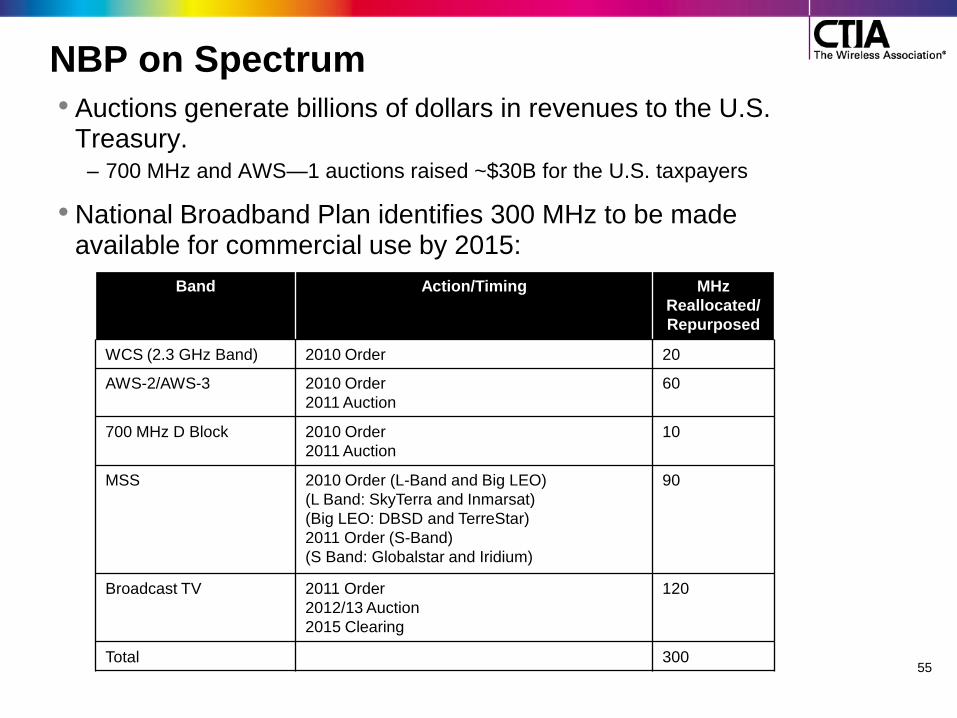
NBP on Spectrum
• Auctions generate billions of dollars in revenues to the U.S. Treasury.
– 700 MHz and AWS—1 auctions raised ~$30B for the U.S. taxpayers
• National Broadband Plan identifies 300 MHz to be made available for commercial use by 2015:
Band Action/Timing MHz
Reallocated/
Repurposed
WCS (2.3 GHz Band) 2010 Order 20
AWS-2/AWS-3 2010 Order
2011 Auction
60
700 MHz D Block 2010 Order
2011 Auction
10
MSS 2010 Order (L-Band and Big LEO)
(L Band: SkyTerra and Inmarsat)
(Big LEO: DBSD and TerreStar)
2011 Order (S-Band)
(S Band: Globalstar and Iridium)
90
Broadcast TV 2011 Order
2012/13 Auction
2015 Clearing
120
Total 300
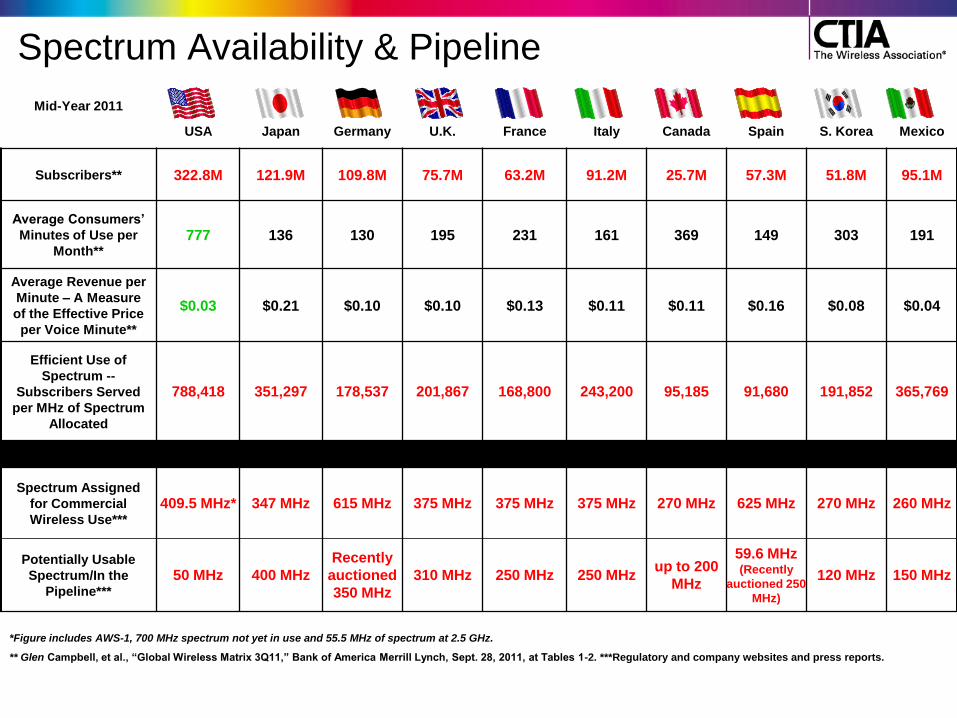
Mid-Year 2011
USA
Japan
Germany
U.K.
France
Italy
Canada
Spain
S. Korea
Mexico
Subscribers** 322.8M 121.9M 109.8M 75.7M 63.2M 91.2M 25.7M 57.3M 51.8M 95.1M
Average Consumers’
Minutes of Use per
Month** 777 136 130 195 231 161 369 149 303 191
Average Revenue per
Minute – A Measure
of the Effective Price
per Voice Minute**
$0.03 $0.21 $0.10 $0.10 $0.13 $0.11 $0.11 $0.16 $0.08 $0.04
Efficient Use of
Spectrum --
Subscribers Served
per MHz of Spectrum
Allocated
788,418 351,297 178,537 201,867 168,800 243,200 95,185 91,680 191,852 365,769
Spectrum Assigned
for Commercial
Wireless Use***
409.5 MHz* 347 MHz 615 MHz 375 MHz 375 MHz 375 MHz 270 MHz 625 MHz 270 MHz 260 MHz
Potentially Usable
Spectrum/In the
Pipeline***
50 MHz 400 MHz
Recently
auctioned
350 MHz
310 MHz 250 MHz 250 MHz up to 200
MHz
59.6 MHz (Recently
auctioned 250
MHz)
120 MHz 150 MHz
*Figure includes AWS-1, 700 MHz spectrum not yet in use and 55.5 MHz of spectrum at 2.5 GHz.
** Glen Campbell, et al., “Global Wireless Matrix 3Q11,” Bank of America Merrill Lynch, Sept. 28, 2011, at Tables 1-2. ***Regulatory and company websites and press reports.
Spectrum Availability & Pipeline
57
CTIA’s Position
• We‘ve identified the following areas for the FCC that are ripe for reallocation:
– Broadcast spectrum
– Government spectrum
– Spectrum below 3 GHz that is currently allocated for fixed wireless use
– Spectrum allocated to U.S. satellite providers
• CTIA encourages policymakers to focus its efforts on spectrum that is:
– Between 400 MHz and 3 GHz
– Available in large, contiguous blocks
– Adjacent to current spectrum allocations
– Internationally harmonized
58
Wireless Taxes & Fees
59
Wireless Taxes & Fees
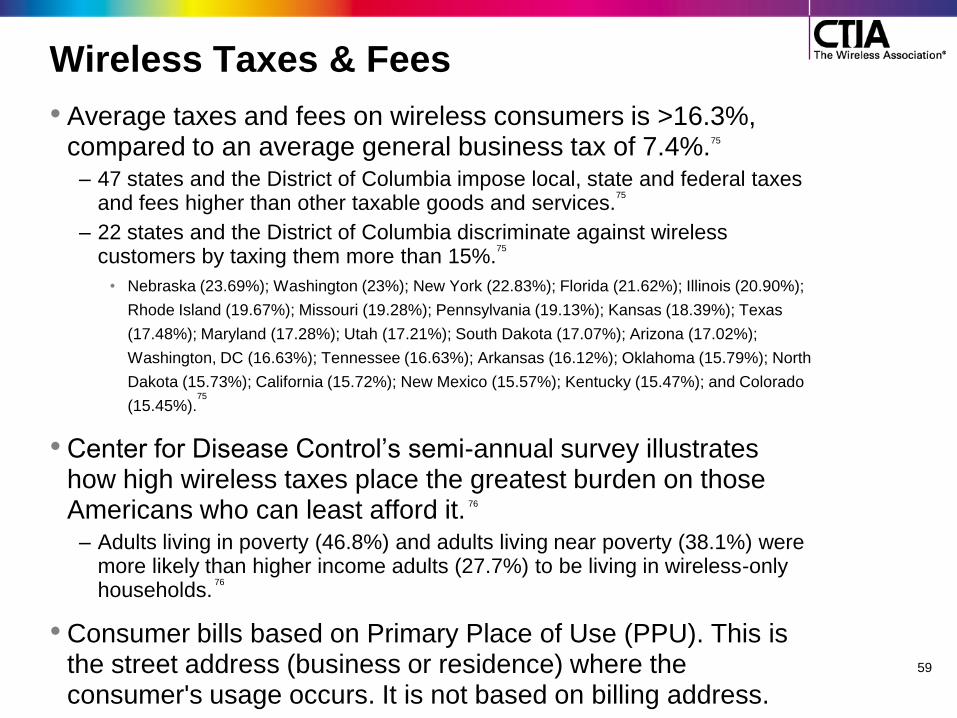
• Average taxes and fees on wireless consumers is >16.3%, compared to an average general business tax of 7.4%.75
– 47 states and the District of Columbia impose local, state and federal taxes and fees higher than other taxable goods and services.
75
– 22 states and the District of Columbia discriminate against wireless customers by taxing them more than 15%.
75
• Nebraska (23.69%); Washington (23%); New York (22.83%); Florida (21.62%); Illinois (20.90%);
Rhode Island (19.67%); Missouri (19.28%); Pennsylvania (19.13%); Kansas (18.39%); Texas
(17.48%); Maryland (17.28%); Utah (17.21%); South Dakota (17.07%); Arizona (17.02%);
Washington, DC (16.63%); Tennessee (16.63%); Arkansas (16.12%); Oklahoma (15.79%); North
Dakota (15.73%); California (15.72%); New Mexico (15.57%); Kentucky (15.47%); and Colorado
(15.45%).75
• Center for Disease Control‘s semi-annual survey illustrates how high wireless taxes place the greatest burden on those Americans who can least afford it. 76
– Adults living in poverty (46.8%) and adults living near poverty (38.1%) were more likely than higher income adults (27.7%) to be living in wireless-only households.
76
• Consumer bills based on Primary Place of Use (PPU). This is the street address (business or residence) where the consumer's usage occurs. It is not based on billing address.
60
Wireless Tax Fairness Act of 2011 (H.R. 1002/S. 543)
• Wireless Tax Fairness Act of 2011 (H.R. 1002/S. 543) would protect consumers from new taxes, fees and surcharges. – The bill would protect consumers from new discriminatory state and
local wireless taxes and fees for five years while state and local governments reform their existing tax systems.
– If state or local governments choose to increase taxes and fees for all other goods and services, then wireless taxes may increase. This bill would prevent singling out wireless consumers from being unfairly taxed.
• The U.S. House of Representatives passed the bipartisan "Wireless Tax Fairness Act of 2011" (H.R.1002) in November 2011. – U.S. Senate companion bill (S. 543) is under consideration.
Digital Goods and Services Tax Fairness Act (H.R. 1860; S. 971)
• As consumers increasingly choose to download goods (e.g. games, eBooks, apps, etc.), state and local governments are taxing these purchases more (and sometimes multiple times) than if the same items were purchase in-person at a store.
• The Digital Goods and Services Tax Fairness Act (H.R. 1860; S. 971) would establish a national framework to prevent multiple and discriminatory taxation of digital goods and services. It provides tax administrators and consumers a better understanding of how digital commerce should be taxed while continuing to encourage digital commerce to flourish, supporting hundreds of thousands jobs and the U.S. economy.
• The bill has received broad bipartisan support in Congress. Its passage would prevent the unfair and discriminatory taxes on wireless goods and services.
61
62
Enhanced 911 (E-911)
E-911 Fee & Fund-raiding
• More than 400,000 wireless E-911 calls are made every single day, or almost 278 calls every minute.
26
• States and localities impose 911 fees on wireless consumers to support and maintain these local 911 services.
• National average is $0.75 per month per line; wireless carriers remit more than $2 billion per year in 911 fees.
77
• Fund-raiding: – Many states have misappropriated dedicated 911 fees for non-911 or
general purposes.
– ENHANCE 911 Act and NET 911 Improvement Act prohibit raiding but there is no strict enforcement.
– In a 2011 FCC report that covers 2010, there were 7 states that used some or all of the E-911 funds to support non-911 programs.
78
• Arizona, Illinois, Oregon and Rhode Island diverted 911 fees to their state‘s general fund.
• South Dakota did not provide disclosure information.
• Virginia and West Virginia used the diverted E-911 fees for other public safety-related purposes.
63

64
Responsible Use
Responsible Use – Kids and Devices
• Mobile Ownership by Children and Teens: 79
– 75% of children ages 12 to 17 regularly use a cellphone.
– 57% of teens somewhat/strongly agree having a mobile phone has improved the quality of their life.
– For children ages 13 to 17:
• 25.5% used a mobile browser to access news or information;
• 32.2% took photos weekly and 66.8 percent took photos monthly;
• 12.1% captured video weekly and 34.7 percent captured video monthly;
• 21.3% uploaded photos to the web monthly; and
• 19.8% used email monthly.
– 98% of parents of cell-owning teens say a major reason their child has the phone is that they can be in touch, regardless of the teen‘s location.
• Mobile Behavioral Issues: 79
– 26% have been bullied or harassed through text messages and phone calls.
– One in three texting teens ages 16 to 17 say they have texted while driving.
65

Responsible Use Continued
• CTIA is committed to help protect America‘s next-gen wireless
users by educating parents and teachers with tools and
resources to help kids make safe and responsible choices
when using their wireless devices and services.
– In 2010, CTIA launched the ―Be Smart. Be Fair, Be Safe: Wireless
Responsible Use‖ (www.besmartwireless.com). The site has has reached
>6 million teachers, students and parents.
• Offers responsible mobile behavior and driving initiatives.
• Lesson plans for educators.
• ―CTIA Mobile Application Rating System with ESRB‖ provides
parents and consumers with reliable information so that
parents and guardians may make decisions about the age-
appropriateness of applications. The rating system uses well-
known and trusted ESRB age rating icons.
66
67
Universal Service Fund
Universal Service Fund (USF)
• Created by the FCC in 1997 and reformed in October 2011 to
promote quality and affordable telecommunications services for all
consumers.
– Increased access to telecommunication services in remote locations,
schools, libraries and rural health care facilities.
– 2011 high cost universal service reforms include creation of a $300 million
dedicated Mobility Fund that makes significant funds potentially available
through 2014. However, this sets the long-term funding-level for mobile
services at only 11 percent of the high cost fund, failing to acknowledge the
fact that consumers are migrating to mobile broadband services.
• Programs:
– Lifeline Program subsidizes basic cellphone service for low-income
consumers. Reformed in January 2012 to address concerns about waste,
fraud and abuse and to create a database to verify customer eligibility.
– Link-Up Program offers reduced fees for installation and startup fees for
wireline and wireless services.
• Paid for by consumers paying out about $8.7 billion in 2011.
• In January 2012, FCC voted to reform the outdated intercarrier
compensation to reflect IP-based and mobile communication
technologies used today.
68
69
Wireless Sustainability
Sustainability
• CTIA carrier and supplier members are becoming more environmentally responsible.
– Some members have saved up to 70% in their energy costs and have significantly reduced their carbon dioxide (CO2) emissions.
– Members have saved tons of CO2 emissions and fuel consumption by increasing the number of service and passenger alternative-fuel vehicles.
– Wireless companies have implemented waste reduction and recycling programs, started commuter/telework programs encouraging employees to carpool or work from home, and created sustainable ecological offices that use renewable energy and are more efficient.
– Companies have started using e-billing systems to reduce carbon footprint.
• April 2011, CTIA launched go wireless go green (www.gowirelessgogreen.com) to help educate consumers and policy makers by:
– Providing useful information about measures consumers can take to be more environmentally responsible.
– Informing consumers of CTIA members‘ initiatives to improve their operations to be more sustainable.
– Acknowledging the eco-friendly value wireless provides to other industries.
70
Sustainability Continued
• All businesses can benefit from wireless technology: – Businesses are saving billions of dollars and reducing their
environmental footprint through implementing wireless technology:
• Millions are saved by wirelessly submitting work orders, customer forms and credit card payments.
71 • Wireless monitoring offers real-time management of fleets (such as
delivery vehicles, school buses or farm equipment) which has the potential to reduce CO2 emissions by about 36 million metric tons (MT) per year, equivalent to annual greenhouse gas emissions from about 6 million passenger vehicles or energy use of 3 million U.S. homes.
71
• Wireless networks connect appliances and smart meters to the smart grid, which has the potential to save 360 million MT of CO2 (equivalent to the greenhouse gas emissions from about 70 million passenger vehicles or the energy use of 30 million U.S. homes) and $15 billion to $35 billion by 2020.
71
• Wireless data provides farmers with actionable knowledge about more precise and resourceful farming techniques. Studies suggest that precision agriculture could conserve water by up to 50 percent and reduce use of fertilizers and pesticides, allowing crop yields to improve while decreasing environmental costs.
71
71

72
Safe Driving
73
Safe Driving
• Mobile devices are one of the greatest public safety tools (more than 400,000 wireless E-911 calls made every day), but we believe there are appropriate and inappropriate times to use them.
• Consumers should make their own decision about what legislation they support at the state and local levels– whether that‘s hands-free or bans on talking on their mobile device while driving.
• Support ban on manual texting and emailing while driving – Worked with Dept. of Transportation, National Conference of State
Legislatures, the American Legislative Exchange Council and other state organizations to develop model legislation (http://ssl.csg.org/SSLinnovationsblogs/DOTTexting_Law_021910.pdf).
• Support wireless restrictions or limits for inexperienced or novice drivers
– Developed with the National Safety Council our teen-focused TV PSA– ―On the Road, Off the Phone‖ (www.onroadoffphone.org).
74
Safe Driving Continued
• We call for a 3-prong solution:
1. Legislation – Worked with the U.S. Department of
Transportation, the National Conference of State Legislatures, the
American Legislative Exchange Council and other state
organizations to craft model legislation that could be adopted
across the country that would prohibit manual texting and emailing
while driving.
2. Technology – Support but caution that it cannot be based on
inflexible mandates that could stifle innovation. They must also be
affordable and consumer-friendly.
3. Education – This is vital. Agree with DOT Secretary LaHood that
personal responsibility is important and every single person needs
to be aware about the serious dangers and possible
consequences of texting and driving.
• CTIA and its members have been education consumers about the
dangers of distracted driving since 1997.
– Developed pocket-sized brochure using the phrase ―BE SAFE‖ as
an acronym to provide 6 simple tips for drivers:
(http://files.ctia.org/pdf/032012SafeDriving.pdf)
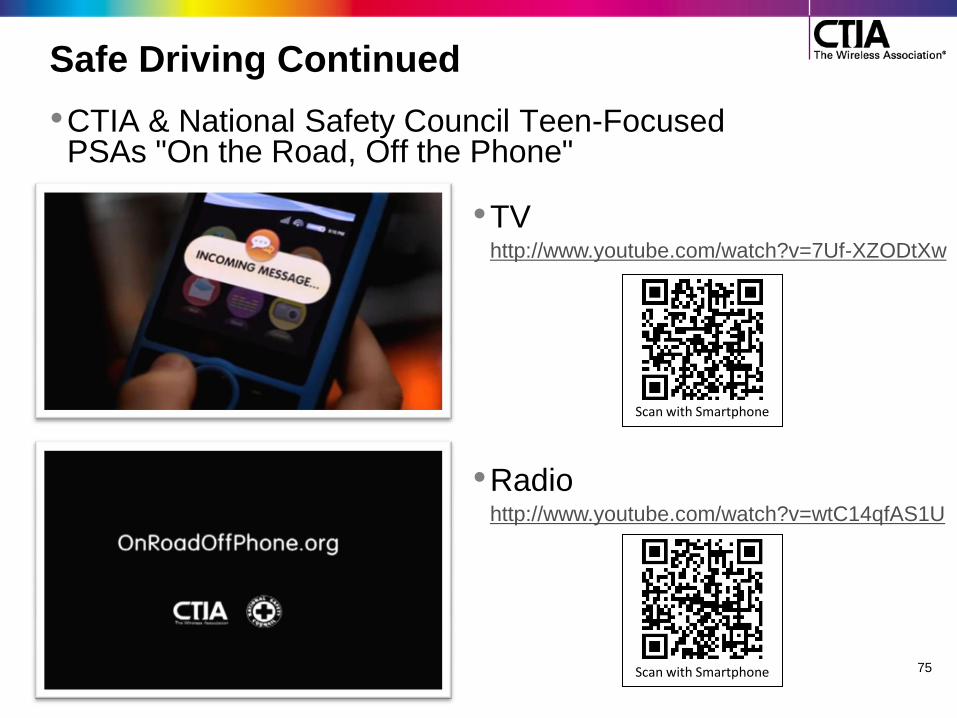
•TV http://www.youtube.com/watch?v=7Uf-XZODtXw)
•Radio http://www.youtube.com/watch?v=wtC14qfAS1U
Scan with Smartphone
75
Safe Driving Continued
•CTIA & National Safety Council Teen-Focused PSAs "On the Road, Off the Phone"
Scan with Smartphone
76
Wireless Industry: Timeline
77
Wireless Industry Highlights
• Oct. 13, 1983 – The first commercial cell phone service was operational in Chicago.
• Dec. 1983 – Baltimore/Washington, DC corridor was the 2nd commercial service system to be activated.
• 1984 – CTIA (then known as Cellular Telecommunications Industry Association) was founded.
• 1985 – 340,213 subscribers; total revenue was $482.4 million; carriers directly employed almost 3,000 people.
• 1987 – Cell phone industry tops $1 billion in revenue.
• 1988 – Average consumer used his/her phone for 122 minutes per month, paying $98.02.
• 1992 – World‘s first commercial text message sent by Logica CMG employees.
78
Wireless Industry Highlights Continued
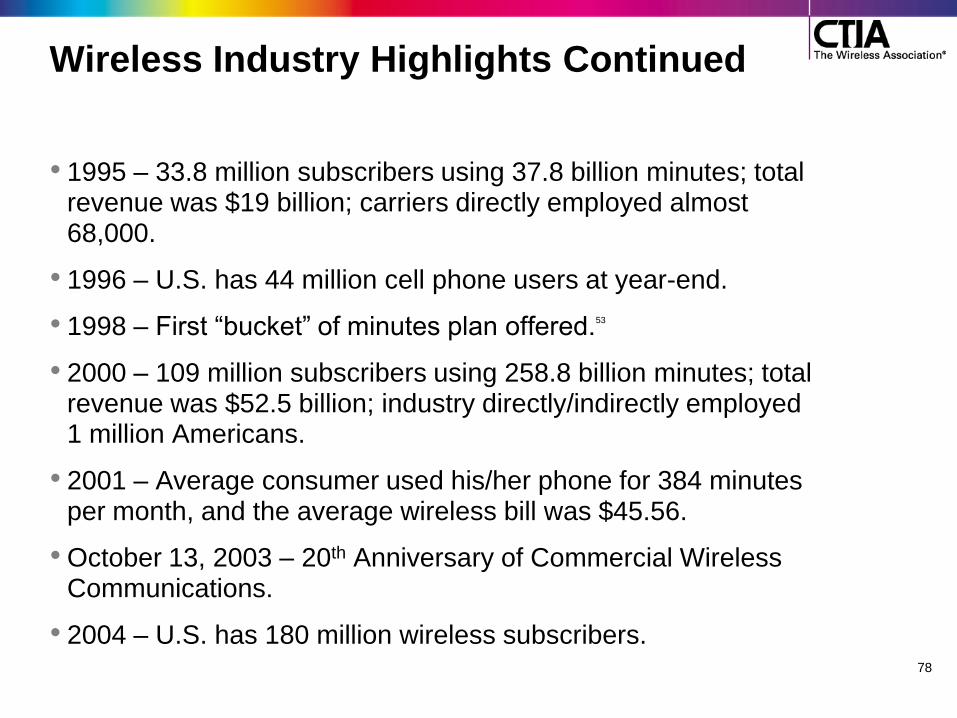
• 1995 – 33.8 million subscribers using 37.8 billion minutes; total revenue was $19 billion; carriers directly employed almost 68,000.
• 1996 – U.S. has 44 million cell phone users at year-end.
• 1998 – First ―bucket‖ of minutes plan offered.53
• 2000 – 109 million subscribers using 258.8 billion minutes; total revenue was $52.5 billion; industry directly/indirectly employed 1 million Americans.
• 2001 – Average consumer used his/her phone for 384 minutes per month, and the average wireless bill was $45.56.
• October 13, 2003 – 20th Anniversary of Commercial Wireless Communications.
• 2004 – U.S. has 180 million wireless subscribers.
79
Wireless Industry Highlights Continued
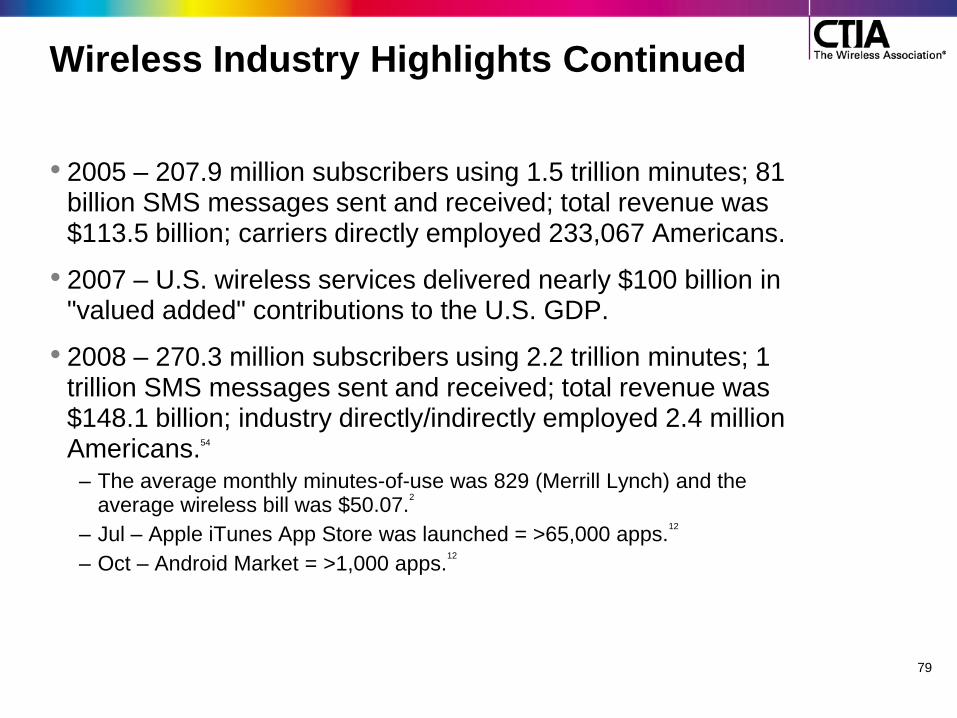
• 2005 – 207.9 million subscribers using 1.5 trillion minutes; 81 billion SMS messages sent and received; total revenue was $113.5 billion; carriers directly employed 233,067 Americans.
• 2007 – U.S. wireless services delivered nearly $100 billion in "valued added" contributions to the U.S. GDP.
• 2008 – 270.3 million subscribers using 2.2 trillion minutes; 1 trillion SMS messages sent and received; total revenue was $148.1 billion; industry directly/indirectly employed 2.4 million Americans.54
– The average monthly minutes-of-use was 829 (Merrill Lynch) and the average wireless bill was $50.07.
2
– Jul – Apple iTunes App Store was launched = >65,000 apps.12
– Oct – Android Market = >1,000 apps.12
80
Wireless Industry Highlights Continued
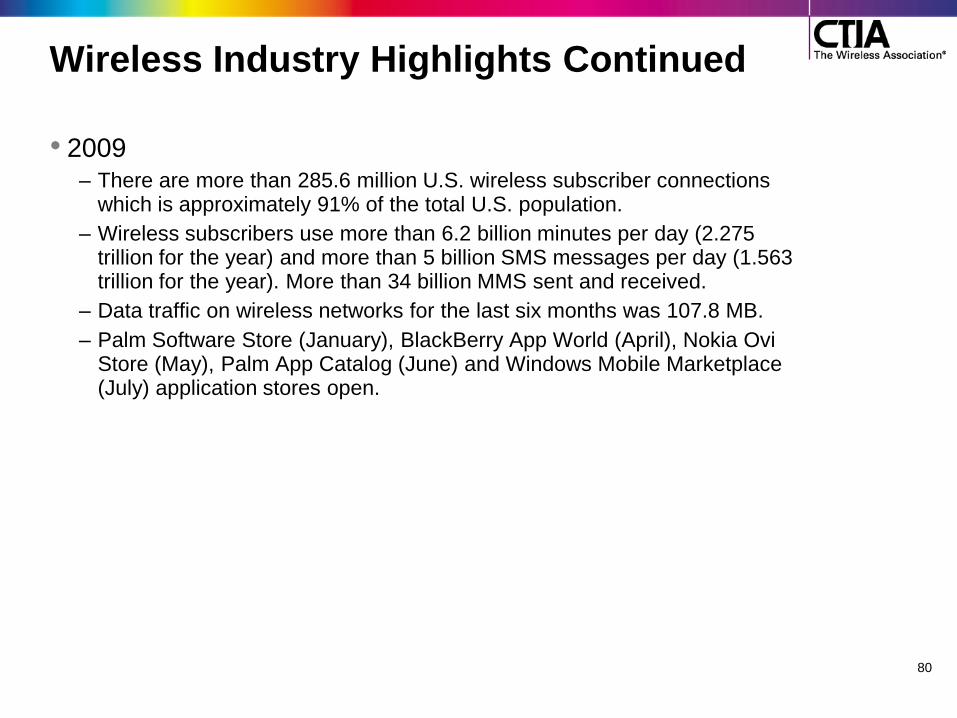
• 2009 – There are more than 285.6 million U.S. wireless subscriber connections
which is approximately 91% of the total U.S. population.
– Wireless subscribers use more than 6.2 billion minutes per day (2.275 trillion for the year) and more than 5 billion SMS messages per day (1.563 trillion for the year). More than 34 billion MMS sent and received.
– Data traffic on wireless networks for the last six months was 107.8 MB.
– Palm Software Store (January), BlackBerry App World (April), Nokia Ovi Store (May), Palm App Catalog (June) and Windows Mobile Marketplace (July) application stores open.
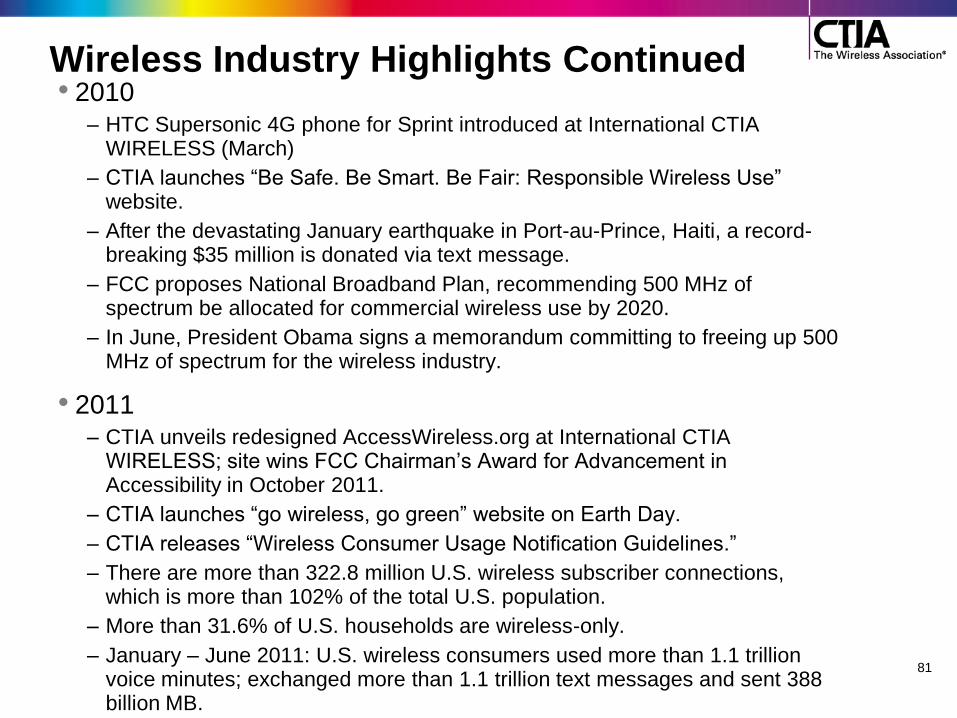
Wireless Industry Highlights Continued • 2010
– HTC Supersonic 4G phone for Sprint introduced at International CTIA WIRELESS (March)
– CTIA launches ―Be Safe. Be Smart. Be Fair: Responsible Wireless Use‖ website.
– After the devastating January earthquake in Port-au-Prince, Haiti, a record-breaking $35 million is donated via text message.
– FCC proposes National Broadband Plan, recommending 500 MHz of spectrum be allocated for commercial wireless use by 2020.
– In June, President Obama signs a memorandum committing to freeing up 500 MHz of spectrum for the wireless industry.
• 2011 – CTIA unveils redesigned AccessWireless.org at International CTIA
WIRELESS; site wins FCC Chairman‘s Award for Advancement in Accessibility in October 2011.
– CTIA launches ―go wireless, go green‖ website on Earth Day.
– CTIA releases ―Wireless Consumer Usage Notification Guidelines.‖
– There are more than 322.8 million U.S. wireless subscriber connections, which is more than 102% of the total U.S. population.
– More than 31.6% of U.S. households are wireless-only.
– January – June 2011: U.S. wireless consumers used more than 1.1 trillion voice minutes; exchanged more than 1.1 trillion text messages and sent 388 billion MB.
81
Wireless Policy Milestones
• 1912 – Radio Act of 1912 – Served as the first federal statue to establish a structure for spectrum management and authorized the Secretary of Commerce to issue radio licenses.
• 1927 – Radio Act of 1927 – Congress transferred radio licensing authority from the Department of Commerce to the Federal Radio Commission (FRC), which issued and revoked licenses, assigned radio frequencies and regulated transmission power levels.
• 1934 – Communications Act of 1934 – Replaced the FRC with the Federal Communications Commission (FCC) to regulate interstate communication by wire and radio.
• 1981 – Cellular Communications Systems Order – FCC determined the cellular industry should have two carriers per market and creates cellular ―A‖ and ―B‖ licenses for each area of the country.
82
Wireless Policy Milestones Continued • 1982 – Communications Amendments Act of 1982 – Congress
gave the FCC authority to issue licenses by lottery and required
applicants to meet certain minimal conditions.
• 1988 – Auxiliary Cellular Services Order – FCC adopted technical
flexibility rules for cellular radio without mandating specific standards,
which permitted the introduction of advanced cellular technologies by
the industry.
• 1993 – Omnibus Budget Reconciliation Act – Congress authorized
the FCC to auction spectrum licenses, granted the FCC broad
authority to forbear from applying unnecessary regulation and
preempted state regulation of wireless rates and entry.
• 1996 – Telecommunications Act – Congress established a national
framework for wireless tower siting.
• 1997 – Balanced Budget Act – Congress directed the FCC to
reallocate spectrum in the 700 MHz band to commercial and public
safety from its previous use for television broadcasting, resulting in the
auctioning of recaptured spectrum. 83
Wireless Policy Milestones Continued • 1999 – Wireless Communications and Public Safety Act of 1999 –
The FCC designated 911 as the universal emergency number for
wireline and wireless service and promoted the use of technologies
that help public safety service providers locate wireless 911 callers.
• 2003 – Secondary Markets Order – The FCC created a ―secondary
market‖ which permitted licensees to lease any amount of their
spectrum.
• 2004 – Commercial Spectrum Enhancement Act – Congress
created the Spectrum Relocation Fund, financed by auction proceeds,
to recover the costs associated with relocating radio communication
systems from certain bands.
• 2005 – Deficit Reduction Act – Congress required television
broadcasters to terminate their analog broadcasts on February 18,
2009 and extended the FCC‘s auction authority through the end of
fiscal year 2011.
• 2012 - Middle Class Tax Relief and Job Creation Act - Authorizes
the FCC to conduct incentive auctions to make bands currently
occupied by television broadcasters available for wireless broadband
as well as provisions on tower siting and antennas.
84

85
Additional Resources/Social Networks • CTIA‘s Position on Policy Topics:
http://www.ctia.org/advocacy/policy_topics/
• CTIA‘s FCC filings: http://www.ctia.org/advocacy/filings/
• CTIA‘s Blog: http://www.ctia.org/blog/
• CTIA‘s website: http://www.ctia.org/
• CTIA LinkedIn: http://www.linkedin.com/groups?gid=4109608&trk=myg_ugrp_ovr
• CTIA Twitter: @ctia
• CTIA Facebook: www.facebook.com/CTIAthewirelessassoc
• CTIA YouTube: http://www.youtube.com/user/CTIATheWirelessAssoc
• CTIA Flickr: http://www.flickr.com/photos/ctia/
86
Appendix 1. Harold Furchtgott-Roth, The Wireless Services Sector: A Key to Economic Growth in America 2008 Report (January 2009).
2. CTIA's Wireless Industry Indices: Top Line Results, released April 2012 available at
http://files.ctia.org/pdf/CTIA_Survey_Year_End_2011_Graphics.pdf.
3. TechNet, The App Economy (February 7, 2012), available at http://www.technet.org/wp-content/uploads/2012/02/TechNet-App-Economy-
Jobs-Study.pdf.
4. Deloitte, The impact of 4G technology on commercial interactions, economic growth, and U.S. competitiveness, August 2011, available at
http://www.deloitte.com/assets/Dcom-UnitedStates/Local%20Assets/Documents/TMT_us_tmt/us_tmt_impactof4g_081911.pdf
5. Robert Crandall and Hal Singer, ―The Economic Impact of Broadband Investment,‖ March 2010, at 3.
6. Larry Summers, ―Technology Opportunities, Job Creation, and Economic Growth,‖ Remarks at the New America Foundation, June 28, 2010.
Available at http://www.whitehouse.gov/administration/eop/nec/speeches/technological-opportunities-job-creation-economic-growth.
7. CTIA's Wireless Industry Indices: Semi-Annual Data Survey Results, A Comprehensive Report from CTIA Analyzing the U.S. Wireless
Industry, Year-End 2011 Results, released April 2012.
8. Glen Campbell, Global Wireless Matrix 3Q11: Look Beyond the Macro Storm, Bank of America Merrill Lynch at 14 (Sep. 28, 2011).
9. ―How consumers will use their mobile devices during the holidays.‖ Mobile Commerce Daily, Nov. 28, 2011, available at
http://www.mobilecommercedaily.com/2011/11/28/how-consumers-will-use-their-mobile-devices-during-the-holidays
10. Deloitte‘s 2011 Annual Holiday Survey, released Oct. 2011, available at http://www.deloitte.com/assets/Dcom-
UnitedStates/Local%20Assets/Documents/Consumer%20Business/us_retail_AnnualHolidaySurvey_2011_pr_102611.pdf
11. JiWire Press Release, ―JiWire's Mobile Audience Insights Report Finds Key Trends in Location and Mobile,‖ Feb. 2012, available at
http://www.marketwatch.com/story/jiwires-mobile-audience-insights-report-finds-key-trends-in-location-and-mobile-2012-02-15
12. ABI Research, Mobile Commerce Sales Explode in United States: Will Top $3.4 Billion in 2010, Dec. 2010, available at
http://www.abiresearch.com/press/3578-Mobile+Commerce+Sales+Explode+in+United+States:+Will+Top+$3.4+Billion+in+2010
13. ―US Business Non-Handset Wireless Spending to Surpass $5 Billion by 2014, Says In-Stat‖, m2m.com available at
http://m2m.tmcnet.com/news/2011/03/21/5389813.htm (last accessed May 18, 2011).
14. GigaOm Pro, ―The Future of Workplaces,‖ Mar. 2011, available at http://livingworkplace.skype.com/assets/pdf/Future_of_Workplaces-
GigaOmPRO.pdf
15. Apps World, ―The Rise of the Enterprise Apps Store,‖ Feb. 2012, available at http://www.apps-world.net/blog/2012/02/europe/the-rise-of-the-
enterprise-apps-store/
16. ABI Research, ―Smartphones and Media Tablets Drive Enterprise Mobility Management Services to $11 Billion by 2016,‖ available at
http://www.abiresearch.com/press/3798-
Smartphones+and+Media+Tablets+Drive+Enterprise+Mobility+Management+Services+to+$11+Billion+by+2016
17. Bicheno, ―Mobile phone accessories market worth $26.5bn, to double by 2015‖, Sept. 2010, available at
http://hexus.net/business/news/economic-indicators/26583-mobile-phone-accessories-market-worth-265bn-double-2015/
18. The Fiscal Times, ―The Apple Economy: Even Accessories Are a Big Biz,‖ Oct. 2011, available at
http://www.thefiscaltimes.com/Articles/2011/10/18/The-Apple-Economy-Even-Accessories-Are-a-Big-Biz.aspx#page1
19. NPD Group, ―The NPD Group offers monthly consumer insights for the U.S. mobile phone and accessories market,‖ Oct. 2011, available at
http://daily.ctia.org/files/CTIAEA2011/showsite/doc/CTIA_Fact_Sheet_from_NPD.pdf
20. Fierce Mobile Content, ―New PQ Media Forecast: U.S. Mobile & Social Media Revenue Surged 30% to $45.4 Billion in 2011, and Projected to
Accelerate 31%,‖ Jan. 2012, available at http://www.fiercemobilecontent.com/press-releases/new-pq-media-forecast-us-mobile-social-media-
revenue-surged-30-454-billion-
87
Appendix Continued
21. ABI Research, Mobile Gaming Revenues Will Exceed $16 Billion in 2016, as In-App Payments Grow, July 2011, available at
http://www.abiresearch.com/press/3735.
22. Nielsen, ―Play Before Work: Games Most Popular Mobile App Category in US,‖ July 2011 available at -
http://blog.nielsen.com/nielsenwire/online_mobile/games-most-popular-mobile-app-category
23. PaidContent, ―Mobile Music: A $5.5 Billion Opportunity For More Than Just Apple,‖ Feb. 2011 available at http://paidcontent.org/2011/02/22/419-
mobile-music-a-5-5-billion-opportunity-for-more-than-just-apple/
24. comScore, ―More than Half of People that Access Social Networks on their Smartphone do so on a Near Daily Basis,‖ Feb. 2012, available
at http://www.comscoredatamine.com/2012/02/more-than-half-of-people-that-access-social-networks-on-their-smartphone-do-so-on-a-near-daily-basis/
25. See Distimo Applications Store overviews available at http://www.distimo.com/appstores/ (last accessed July 26, 2011).
26. CTIA Research
27. Pew Internet & American Life Project, ―Half of adult cell phone owners have apps on their phones,‖ Nov. 2011 available at
http://pewinternet.org/Reports/2011/Apps-update/Part-1/Apps-on-the-rise.aspx
28. Press Release, ―Mobile Entertainment Market to Grow by 15% in 2011 Despite Global Economic Uncertainty, Juniper Report Finds‖,
available at http://www.juniperresearch.com/viewpressrelease.php?id=285&pr=238 (last accessed May 18, 2011).
29. Gartner, ―Gartner Says Worldwide Mobile Application Store Revenue Forecast to Surpass $15 Billion in 2011‖ available at
http://www.gartner.com/it/page.jsp?id=1529214.
30. Posting of Kevin Tofel to GigaOm, What 44 Billion Mobile App Downloads by 2016 Means, http://gigaom.com/mobile/what-44-billion-mobile-
app-downloads-by-2016-means/ (April 28, 2011).
31. ―The State of Mobile Apps‖, Nielsenwire available at http://blog.nielsen.com/nielsenwire/online_mobile/the-state-of-mobile-apps/ (last
accessed July 26, 2011).
32. See BT, http://www.bt.co.uk; O2, http://www.o2.co.uk; 3, http://www.3.co.uk; Virgin Mobile, http://www.virginmobile.com; Carphone
Warehouse, http://www.carphonewarehouse.co.uk; Vodafone, http://www.vodafone.co.uk. Handsets of the same model with differing color
schemes were not counted as unique handsets.
33. ―Poll: 62% of Consumers Feel Their Smartphone Is Obsolete‖, Gigaom available at http://gigaom.com/mobile/poll-62-of-consumers-feel-
their-smartphone-is-obsolete.
34. FCC 15th Annual Report and Analysis of Competitive Market Conditions with Respect to Commercial Mobile Services, 192; David Barden,
Wireless pricing constructive, upgrades more expensive, Bank of America Merrill Lynch at 8, 11 (April 11, 2011).
35. Tom Krazit, How Low Will They Go? Average Smartphone Price Falls Again In U.S., mocoNews, (Nov. 14, 2011), available at
http://moconews.net/article/419-how-low-will-they-go-average-smartphone-price-falls-again-in-u.s.
36. Nielsen Wire, ―Smartphones Account for Half of all Mobile Phones, Dominate New Phone Purchases in the US‖, Mar. 2012 available at
http://blog.nielsen.com/nielsenwire/online_mobile/smartphones-account-for-half-of-all-mobile-phones-dominate-new-phone-purchases-in-the-us
37. See Tablets to Surpass Laptop Sales In 2015, One Third Of US Consumers Will Own One, MobileMarketWatch (Jan. 5, 2011),
http://www.mobilemarketingwatch.com/ tablets-to-surpass-laptop-sales-in-2015-one-third-of-us-consumers-will-own-one-12356/.
88
Appendix Continued
38. InfoWorld, ―Cisco predicts 15 billion network devices in 2015‖, June 2011, available at http://www.infoworld.com/d/networking/cisco-predicts-15-billion-
network-devices-in-2015-788
39. Best Buy, No-Contract Phones, http://www.bestbuy.com/site/Mobile-Cell-Phones/No-Contract-Phones/abcat0801002.c?id=abcat0801002;
Unlocked Mobile Phones, Best Buy, http://www.bestbuy.com/site/Mobile-Cell-Phones/Unlocked-Mobile-Phones/pcmcat156400050037.c?id=pcmcat156400050037.
40. Hayley Tsukayama, Apple begins selling unlocked iPhone 4S, The Washington Post (Nov. 11, 2011), available at
http://www.washingtonpost.com/business/technology/apple-begins-selling-unlocked-iphone-4s/2011/11/11/gIQASVnICN_story.html (Apple has begun selling
unlocked versions of its latest smartphone on its store… ."); See Unlocked Mobile Phones, Best Buy, http://www.bestbuy.com/site/Mobile-
Cell-Phones/Unlocked-Mobile-Phones/pcmcat156400050037.c?id=pcmcat156400050037 (Best Buy offers numerous unlocked phones for
sale.)
41. ―Tops In 2008: Most Popular Mobile Phones, Mastertones‖, Nielsenwire available at http://blog.nielsen.com/nielsenwire/consumer/tops-in-2008-most-
popular-mobile-phones-mastertones/ (last accessed May 18, 2011).
42. ―Top Mobile Phones, Sites and brands for 2009‖, Nielsenwire available at http://blog.nielsen.com/nielsenwire/online_mobile/top-mobile-phones-sites-and-
brands-for-2009/ (last accessed May 18, 2011).
43. ―The Top Trends for 2010‖, Nielsen available at http://blog.nielsen.com/nielsenwire/wp-content/uploads/2010/12/Nielsen-Top-10s-2010.pdf (last accessed
May 18, 2011).
44. ―NPD Group: iPhone 4, 3GS outsold Android phones in Q3,‖ Nov. 2011, available at http://www.tuaw.com/2011/11/15/npd-group-us-iphone-4-3gs-
outsold-android-phones-in-q3/
45. NPD Group, ―Apple Leads Mobile Handsets in Q4 2011‖ Feb. 2012, available at https://www.npd.com/wps/portal/npd/us/news/pressreleases/pr_120206
46. Blumberg SJ, Luke JV. Wireless substitution: Early release of estimates from the National Health Interview Survey, January-June 2011.
National Center for Health Statistics. December 2011. Available at http://www.cdc.gov/nchs/data/nhis/earlyrelease/wireless201112.pdf
47. Blumberg SJ, Luke JV. Wireless substitution: Early release of estimates based on data from the National Health Interview Survey, July –
December 2006. National Center for Health Statistics. May 2007 available at http://www.cdc.gov/nchs/data/nhis/earlyrelease/wireless200705.pdf.
48. National Health Statistics Reports: (April 20, 2011) (Wireless Substitution: State-level Estimates From the National Health Interview Survey,
January 2007-June 2010). Available athttp://www.cdc.gov/nchs/data/nhsr/nhsr039.pdf.
49. comScore MobiLens™ Trend Report, accessed June 7, 2011 (as of March 2011).
50. FCC, Internet Access Services: Status as of December 31, 2010, (2011), available at
http://transition.fcc.gov/Daily_Releases/Daily_Business/2011/db1011/DOC-310261A1.pdf
51. Nielsen Wire, ―Average Smartphone Data Usage Up 89% as Cost per MB Goes Down 46%‖, (2011),
http://blog.nielsen.com/nielsenwire/online_mobile/average-u-s-smartphone-data-usage-up-89-as-cost-per-mb-goes-down-46/
52. See FCC, Mobile Broadband: The Benefits of Additional Spectrum, filing at http://transition.fcc.gov/Daily_Releases/Daily_Business/2010/db1021/DOC-
302324A1.pdf (October, 2010).
89
Appendix Continued
53. Cisco Systems, Cisco Visual Networking Index: Global Mobile Data Traffic Forecast Update, 2010–2015, Feb. 22, 2011, available at
http://www.cisco.com/en/US/solutions/collateral/ns341/ns525/ns537/ns705/ns827/white_paper_c11-520862.html.
54. Bank of America/Merrill Lynch, ―Global Wireless Matrix 3Q11‖.
55. See U.S. Census Bureau at http://www.census.gov/main/www/popclock.html (last accessed July 15, 2011).
56. Informa Telecoms & Media Group, WCIS database, accessed July 15, 2011.
57. Machine-to-machine device connections: worldwide forecast 2010-2020, Analysys Mason, available at
http://www.analysysmason.com/Research/Content/Reports/RRE02_M2M_devices_forecast/.
58. M2M World News, ―Research Predicts Tremendous Growth for the Next-Generation M2M and Connected Device Market‖ Aug. 2011,
available at http://m2mworldnews.com/2011/08/09/79872-research-predicts-tremendous-growth-for-the-next-generation-m2m-and-
connected-device-market/
59. Pew Internet & American Life Project, Profiles of Health Information Seekers, Feb. 2011 available at
http://pewinternet.org/Reports/2011/HealthTopics/Part-2.aspx?view=all
60. MobiHealthNews, ―By 2016: 80M wearable wireless fitness sensors‖, Mobihealthnews, available at http://mobihealthnews.com/11224/by-
2016-80m-wearable-wireless-fitness-sensors/.
61. Text4Baby Website available at http://text4baby.org/
62. Wheelmap, Applications Store, http://itunes.apple.com/us/app/wheelmap/id399239476?mt=8.
63. Press Release, GreatCall, GreatCall Announces MedCoach App, Available in Apples App Store (June 28, 2011), available at
http://www.businesswire.com/news/home/20110628005752/en/GreatCall%C2%AE-Announces-MedCoach%E2%84%A2-App-
Apple%E2%80%99s-App-Store.
64. ―Project K-Nect Evaluation Report‖ July 2010, available at http://www.google.com/url?sa=t&rct=j&q=39%20percent%20project%20k-
nect&source=web&cd=1&ved=0CCEQFjAA&url=http%3A%2F%2Fwww.qualcomm.com%2Fmedia%2Fdocuments%2Ffiles%2Fproject-k-
nect-evaluation-report.pdf&ei=OY6VT-GTJc-16AHX9-X7Cw&usg=AFQjCNEXYCLCZj8IWI3aKhVkhkIuQukJtw
65. TIME, ―Apple's Textbooks: Undeniably Cool, But Will They Help Students?,‖ Jan. 2012. Available at
http://techland.time.com/2012/01/19/apples-textbooks-undeniably-cool-but-will-they-help-students/
66. Indystar, ―Purdue students use iPad app to give autistic kids a voice,‖ April 2012. Available at
http://www.indystar.com/article/20120402/NEWS04/204020352/Purdue-students-use-iPad-app-give-autistic-kids-voice
67. See Story Visit, The Joan Ganz Cooney Center at Sesame Workshop, available at http://www.joanganzcooneycenter.org/Initiatives-34.html
(last visited Dec. 1, 2011).
68. Peter Panepento, Using Mobile Phones to Guide Museum Visitors, The Chronicle of Philanthropy (June 29, 2010),
http://philanthropy.com/blogs/social-philanthropy/using-mobile-phones-to-guide-museum-visitors/25880.
69. Telework Research Council, ―Savings Potential‖ Available at http://www.teleworkresearchnetwork.com/cut-oil
70. Marguerite Reardon, T-Mobile goes for smart grids, CNET News (Apr. 23, 2009), available at http://news.cnet.com/ 8301-1035_3-
10226418-94.html
71. BSR, ―Wireless and the Environment,‖ Oct. 2011. Available at http://files.ctia.org/pdf/Wireless_and_the_Environment_10-06-2011.pdf
72. The Economist, ―Wiser wires,‖ Oct. 2009. Available at http://www.economist.com/node/14586006.
73. ABI Research, ―About 212 Million ―Smart‖ Electric Meters in 2014,‖ Jan. 2010. Available at http://www.abiresearch.com/press/3359-
About+212+Million+%3FSmart%3F+Electric+Meters+in+2014.
http://philanthropy.com/blogs/social-philanthropy/using-mobile-phones-to-guide-museum-visitors/25880
http://philanthropy.com/blogs/social-philanthropy/using-mobile-phones-to-guide-museum-visitors/25880
http://philanthropy.com/blogs/social-philanthropy/using-mobile-phones-to-guide-museum-visitors/25880
http://philanthropy.com/blogs/social-philanthropy/using-mobile-phones-to-guide-museum-visitors/25880
http://philanthropy.com/blogs/social-philanthropy/using-mobile-phones-to-guide-museum-visitors/25880
http://philanthropy.com/blogs/social-philanthropy/using-mobile-phones-to-guide-museum-visitors/25880
http://philanthropy.com/blogs/social-philanthropy/using-mobile-phones-to-guide-museum-visitors/25880
http://philanthropy.com/blogs/social-philanthropy/using-mobile-phones-to-guide-museum-visitors/25880
http://philanthropy.com/blogs/social-philanthropy/using-mobile-phones-to-guide-museum-visitors/25880
http://philanthropy.com/blogs/social-philanthropy/using-mobile-phones-to-guide-museum-visitors/25880
http://philanthropy.com/blogs/social-philanthropy/using-mobile-phones-to-guide-museum-visitors/25880
http://philanthropy.com/blogs/social-philanthropy/using-mobile-phones-to-guide-museum-visitors/25880
http://philanthropy.com/blogs/social-philanthropy/using-mobile-phones-to-guide-museum-visitors/25880
http://philanthropy.com/blogs/social-philanthropy/using-mobile-phones-to-guide-museum-visitors/25880
90
Appendix Continued
74. IBM, ―IBM Intelligent Utility Network Solution,‖ Accessed April 2012. Available at
http://www.ibm.com/smarterplanet/us/en/smart_grid/nextsteps/solution/L420447J94627B46.html
75. Method from COST, ―50-State Study and Report on Telecommunications Taxation,‖ May 2005. Updated March 2011 by Scott Mackey, KSE
Partners, LLP using state statutes and regulations.
76. Blumberg SJ, Luke JV. Wireless substitution: Early release of estimates from the National Health Interview Survey, January-June 2011.
National Center for Health Statistics. December 2011. Available at http://www.cdc.gov/nchs/data/nhis/earlyrelease/wireless201112.pdf.
77. CTIA Comments to the FCC on State 911/E911 Fees and Expenditures. Available at http://files.ctia.org/pdf/filings/111206_-
_FILED_CTIA_911_Fund_Diversion_PN_Comments.pdf
78. FCC 3rd Report to Congress On State 911 Fees and Charges, Nov. 2011. Available at http://www.fcc.gov/document/3rd-report-congress-
state-911-fees-and-charges.
79. Pew Research Center, ―Teens and Mobile Phones,‖ April 2010. Available at http://www.pewinternet.org/~/media/Files/Reports/2010/PIP-
Teens-and-Mobile-2010.pdf
80. Analysis Mason, ―Internet of Things Will Grow to 16 Billion Connectable Consumer Devices by 2020,‖ Oct. 2010. Available at
http://www.analysysmason.com/About-Us/News/Press-releases1/Internet-of-Things-will-grow-to-16-billion-connectable-consumer-devices-
by-2020-says-Analysys-Mason/.