The Textile‑Clothing Industry of Bangladesh:...As a result, the manufacturers become exporters...
36
第 38 号 『社会システム研究』 2019年 3 月 101 査読論文 TheTextile‑ClothingIndustryofBangladesh: ADemand‑SupplyReviewwithAsianCompetitors Md.Masum * ,INABAKazuo ** Abstract The objective of this paper is to investigate the demand-supply structure of the textile- clothing industry (TCI) of Bangladesh in comparison to China, Indonesia, India, and Viet Nam. These countries are the top five clothing-exporting nations in the world, and together they control 91% of clothing exports in the Asian region. The paper applies structural decomposition approach for the demand-side analysis, whereas vertical specialization (VS) and linkage approach are used for the supply-side analysis using national and regional input-output tables for 2000 and 2011 at constant 2000 prices. The results show that the contribution of final demand has outplayed the technical change effect, whereas export contribution and domestic demand expansion have played the growth roles. The technical effect from 2000 to 2011 in the TCI is the highest in China (22%), followed by Viet Nam, India, Bangladesh, and Indonesia. VS in Viet Nam (53%) is the highest, and the lowest is in China (7%). The industry’s output multiplier for Bangladesh in 2011 is 3.19, which is smaller than that of both China and Viet Nam. The paper concluded that the demand- supply linkage of the TCI in Bangladesh is stronger than that of India and Indonesia. Keywords Demand-supply structure, Asian textile-clothing industry, Structural decomposition analysis, Input-output framework JEL classifications D57, R15 * Correspondence to: Md. Masum Associate Professor of Textile Management, Bangladesh University of Textiles, Dhaka, Bangladesh E-mail: [email protected] ** Correspondence to: INABA Kazuo Professor, Faculty of Economics, Ritsumeikan University 1-1-1 Nojihigashi, Kusatsu, Shiga 525-8577, Japan E-mail: [email protected]
Transcript of The Textile‑Clothing Industry of Bangladesh:...As a result, the manufacturers become exporters...

第 38 号 『社会システム研究』 2019年 3 月 101
査読論文
The�Textile‑Clothing�Industry�of�Bangladesh:�A�Demand‑Supply�Review�with�Asian�Competitors
Md.�Masum* ,�INABA�Kazuo**
Abstract
The objective of this paper is to investigate the demand-supply structure of the textile-
clothing industry (TCI) of Bangladesh in comparison to China, Indonesia, India, and Viet
Nam. These countries are the top five clothing-exporting nations in the world, and together
they control 91% of clothing exports in the Asian region. The paper applies structural
decomposition approach for the demand-side analysis, whereas vertical specialization (VS)
and linkage approach are used for the supply-side analysis using national and regional
input-output tables for 2000 and 2011 at constant 2000 prices. The results show that the
contribution of final demand has outplayed the technical change effect, whereas export
contribution and domestic demand expansion have played the growth roles. The technical
effect from 2000 to 2011 in the TCI is the highest in China (22%), followed by Viet Nam,
India, Bangladesh, and Indonesia. VS in Viet Nam (53%) is the highest, and the lowest is
in China (7%). The industry’s output multiplier for Bangladesh in 2011 is 3.19, which is
smaller than that of both China and Viet Nam. The paper concluded that the demand-
supply linkage of the TCI in Bangladesh is stronger than that of India and Indonesia.
Keywords
Demand-supply structure, Asian textile-clothing industry, Structural decomposition
analysis, Input-output framework
JEL classifications
D57, R15
* Correspondence to: Md. Masum
Associate Professor of Textile Management, Bangladesh University of Textiles, Dhaka,
Bangladesh
E-mail: [email protected]
** Correspondence to: INABA Kazuo
Professor, Faculty of Economics, Ritsumeikan University
1-1-1 Nojihigashi, Kusatsu, Shiga 525-8577, Japan
E-mail: [email protected]
102 『社会システム研究』(第 38 号)
1. Introduction
The textile-clothing industry (TCI) 1 is the gateway of choice for most developing
countries in their quest to step into industrialization (Kim, Traore, & Warfield, 2006). The
TCI was a very important industry for the early industrialization of today’s developed
economies such as the United Kingdom (UK), the United States (US), Japan, etc. The TCI
is the primary grounds of development in most Asian countries such as Korea, Taiwan,
Hong Kong, etc. (Chen et al., 2017; Gereffi, 1999). As manufacturer-exporters, those
belonging to the Asian TCI are crucial to the global clothing market. In recent decades, a
significant amount of apparel manufacturing has shifted to Asia, particularly China, which
has become the leading exporter of clothing, followed more recently by Bangladesh (Taplin,
2014). The conclusion of the Multi-Fiber Agreement (MFA) has become a development boon
for Asia (Heron, 2006). Asian manufacturers have experienced trade diversion, especially
in textiles and apparel, through new regionalism beyond initial predictions (Frankel &
Wei, 1995). According to the World Trade Organization (WTO) database, China,
Bangladesh, Hong Kong, Viet Nam, India, and Indonesia are the top six clothing exporters
in the world market and these countries are competitors to each other in the Asian region.
47%
71%
53% 53%
66%
33%
15%5% 9% 9%10%
11%
12%
10%
22%
80%
25%7%
10% 8%
97%
66% 61%53%
82%
0%
20%
40%
60%
80%
100%
120%
BAN CHN IDN IND VIE
Industry output (% of total demand)TCI (% of industry output)Export (% of total demand)TCI Export (% of exports)Clothing export (% of TCI exports)
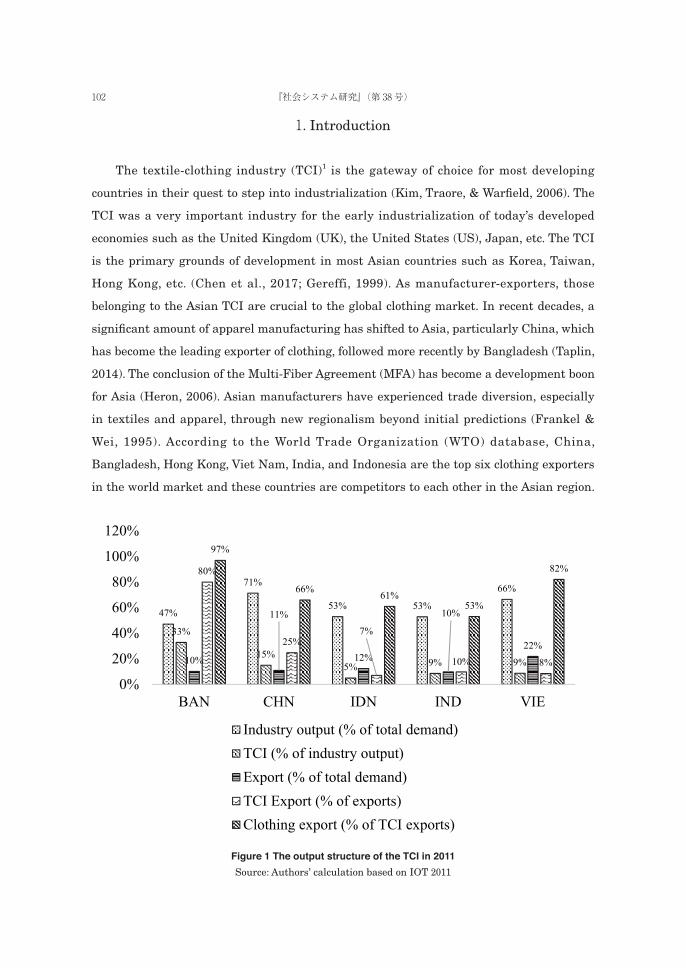
Figure 1 The output structure of the TCI in 2011Source: Authors’ calculation based on IOT 2011
103The Textile-Clothing Industry of Bangladesh(Md. Masum, INABA Kazuo)
International clothing market shares of China, Bangladesh, Viet Nam, India, and
Indonesia are 36%, 6.2%, 5.6%, 4%, and 2%, respectively, of the US $450 billion market in
2016.
Bangladesh’s economy is the smallest among the aforementioned clothing makers in
the Asian region, but its economy is more dependent on the TCI compared to other
economies. Figure 1 depicts the shares of output in the industrial structure of the
economies concerned. The role of TCI is the uppermost in Bangladesh (33%), followed by
China (15%), Viet Nam (9%), India (9%), and Indonesia (5%). When we look at the TCI
export exposure in the export basket, we find that 80% of the export in Bangladesh is TCI
exports, followed by China, India, Viet Nam, and Indonesia. The composition of clothing in
the TCI exports of every country is much higher than textiles, which are 97%, 66%, 61%,
53%, and 82%, respectively, for Bangladesh, China, Indonesia, India, and Viet Nam. India,
Indonesia, and China produce a lot of primary textiles 2. As a result, the clothing exports to
TCI exports ratio in India, Indonesia, and China is lower compared to Viet Nam and
Bangladesh.
These five manufacturer-exporters sell the final output of the TCI (i.e., clothing) to the
common consumer market, which primarily consists of the US and EU. Bangladesh exports
79% of clothing exports to the US and EU, India exports 60%, Indonesia exports 73%,
China exports 44%, and Viet Nam exports 68% to these markets. So, these Asian
manufacturer-exporters are also competitors to each other.
Bangladesh is one of the textile-clothing dominated low-income countries in the world.
The TCI of Bangladesh is the only source that is helping the country to grow rapidly
(Agarwal, Kaur, & De, 2017). Due to low cost abundant labor, TCI creates a competitive
position in the world market for Bangladesh. This industry employs 5 million people. The
value-added contribution of the industry accounted for 11.2% to the gross domestic product
(GDP), and 50% to the manufacturing sector’s value-added in 2016 (Masum & Inaba,
2018). In addition to the private initiatives and foreign direct investment (FDI) 3, the
government is supporting the industry with fiscal and non-fiscal incentives 4. Its
competitive position among its Asian competitors seems lucrative when we look at the
export values as they have soared from nearly nil in 1980 to $28 billion in 2016.
The most important feature of today’s TCI in Bangladesh is that commodities are
produced to satisfy the demand of the developed countries’ consumers. The producers sell
their finished goods to the branded retailing companies like Zara, Tesco, Uniqlo, Walmart,
etc. (Appelbaum & Gereffi, 1994; Gereffi, 1999). In the global clothing trade market, the

104 『社会システム研究』(第 38 号)
retailers and brand merchandisers are playing a dominant role (R Nayak & Padhye, 2015).
The low value-added part is done by the producers in low-income countries and high value-
added part remains to the branded retailers. Bangladesh is comprised primarily of branded
manufacturers, but the relationship between retailers-distributors and manufacturers in
the demand-supply structure is not direct. There is an intermediary who requires 1–4% of
the invoice value. Many of the intermediaries are controlled by foreign dealers (Masum,
2016).
The Bangladeshi TCI has successfully achieved industrial (functional) upgrading. Now,
it faces great challenges in the social upgrading of the industry (Alam & Natsuda, 2016).
Although developed countries have shifted the production process 5, the consumer market
is controlled by them through branded retailers. So, the demand-side of the industry is
controlled by the branded retailers and third-party negotiators like Li & Fung 6. These
retailers place order to the manufacturing factories, and manufacturing factories follow
the order specifications (Masum, 2016). As a result, the manufacturers become exporters
only. But the structural dimension of the demand-side is not yet clear to manufacturing
countries like Bangladesh for sustainable growth of the clothing business. On the other
hand, the supply-side of the manufacturers is also not independent. The supply-side is
dependent on the availability of order (demand) from the branded retailers or trading
firms. As the industrial structure of Bangladesh is heavily dependent on the TCI, the
structural analysis on this industry becomes indispensable. Moreover, TCI of Bangladesh
is competing with the other Asian manufacturers because the buyers (order providers) are
common 7 for all clothing manufacturers in Asia. The WTO database shows that Asian
countries produce 60% of global clothing exports, and the five Asian countries 8 are
responsible for 91% of Asian clothing exports.
This research work gives emphasis on the structural dimension of the demand-side 9
and supply-side 10 of the TCI in Bangladesh with a comparison to other Asian countries.
This work reveals out the role of technology 11 and final demand in the growth path of the
TCI under demand-side analysis of input-output framework. Either only demand from the
branded retailers is the main player of growth or production technology is backing the
growth of the TCI in Bangladesh. This study also analyzes the supply-side of the TCI
incorporating the role of domestic raw materials, role of imported raw materials, and
influence of primary factors.
There have been many research studies on the TCI in Bangladesh. The previous
studies focused on several issues, and some of them are as follows. Clothing exports,
105The Textile-Clothing Industry of Bangladesh(Md. Masum, INABA Kazuo)
employment, and the number of factories have increased after phasing out of the MFA era
(R. Ahmed, 2013). Bangladesh has a unique opportunity to restructure its domestic apparel
sector by introducing new technologies and fostering domestic production linkages
(Bhattacharya & Rahman, 1999). Huq et al. (2014) studied the social sustainability of
Bangladesh’s clothing industry in regard to suppliers. A work on knowledge-based
productivity in low-tech industries found that, in the clothing sector, higher education of
managers, licensing, and R&D raise productivity (Goedhuys, Janz, & Mohnen, 2013). A
study on factory disasters in Bangladesh suggested that the insatiable appetite for
fashionable goods merely feeds a retail system that was set up to resolve earlier supply-
chain problems and ended up taking advantage of changing international trade regimes
(Taplin, 2014), among other studies.
According to structural decomposition analysis of the input-output framework, the key
demand-side determinants in any industry are technical effect, final demand effect, export
expansion effect, import substitution effect, and domestic demand effect. The key supply-
side determinants are vertical specialization (VS) ratio, input multiplier, primary factor
contributions, etc. A very few studies have focused on this structure of the TCI in
Bangladesh. Demand-side and supply-side analyses of the Bangladesh’s TCI with a
comparison to the Asian competitors in the input-output framework have not been
addressed in the previous studies. The main contribution of this research is to analyze the
demand-side and supply-side of the TCI across time and place. This paper makes a
comparison of the TCI between Bangladesh and its Asian competitors 12 in terms of level of
technical development and growth factors. The comparison is made based on structural
decomposition between two periods of each country in the input-output framework.
The specific research questions to be discussed in this paper are:
1. Is technical change affecting the demand-side growth of the TCI in Bangladesh?
2. Is demand-supply structure of the TCI in Bangladesh similar to its Asian
competitors?
The rest of the paper is structured as follows. Section 2 describes the data and
methodology. Section 3 explains the results of the study, including the demand-side of the
TCI based on decomposition techniques, the supply-side of the TCI, and a comparison
among the TCI exporters based on demand-supply indicators. Finally, Section 4 concludes
the paper.
106 『社会システム研究』(第 38 号)
2. Data and methodology
2.1 Data
We have compiled the national input-output tables (IOTs) for Bangladesh and Viet
Nam from the multiregional input-output (MRIO) table of the Asian Development Bank
(ADB). IOTs for China, India, and Indonesia are sourced from the World Input-Output
Database (WIOD). The MRIO tables of ADB and WIOD have used the same 35-sector
classifications. The databases of ADB and WIOD are in current US dollar price. We
converted the current US dollar price IOTs into current local price 13 IOTs. Finally, we
converted the current price IOTs into constant price 14 IOTs.
2.2 Methodology
This paper applies input-output techniques to answer the research questions. In the
input-output framework, the Leontief model is known as the well-established demand-side
model, whereas the Ghosh model is known as the frequently used supply-side model.
Ashyrov, Paas, & Tverdostup (2018) applied the Leontief model for demand-side analysis
and Ghosh model for supply-side analysis for a comparative study of blue industries
between Estonia and Finland. It is the most recent application of Ghosh and Leontief
models together.
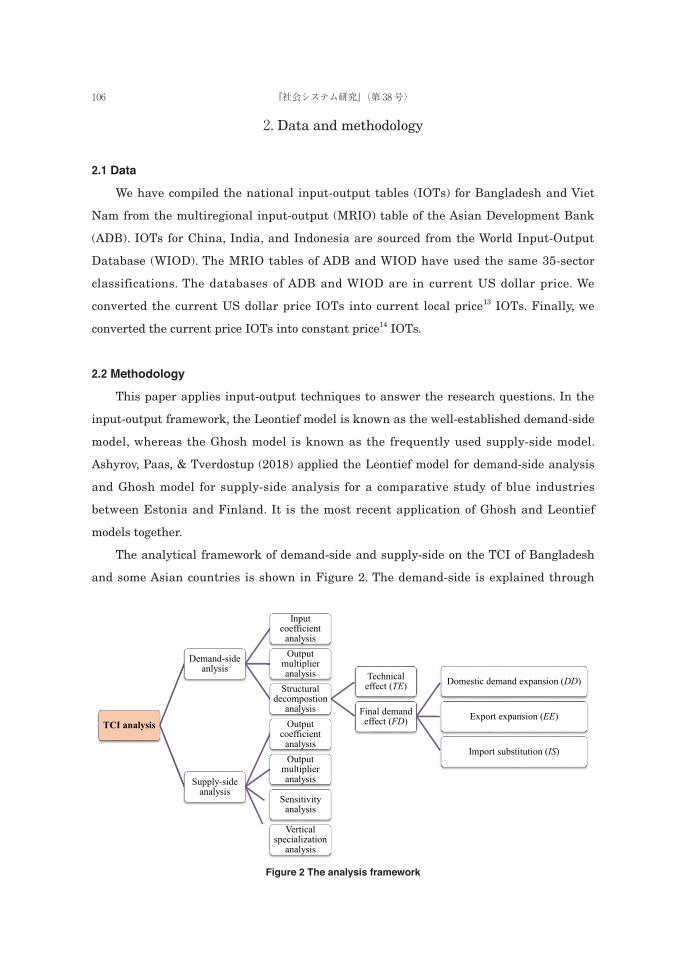
The analytical framework of demand-side and supply-side on the TCI of Bangladesh
and some Asian countries is shown in Figure 2. The demand-side is explained through
TCI analysis
Demand-side anlysis
Input coefficient
analysisOutput
multiplier analysis
Structural decompostion
analysis
Technical effect (TE)
Final demand effect (FD)
Domestic demand expansion (DD)
Export expansion (EE)
Import substitution (IS)
Supply-side analysis
Output coefficient
analysisOutput
multiplier analysis
Sensitivity analysis
Vertical specialization
analysis
Figure 2 The analysis framework

107The Textile-Clothing Industry of Bangladesh(Md. Masum, INABA Kazuo)
demand-side model of Leontief. In addition to input coefficient analysis, structural
decomposition analysis for demand-side explains the final demand by domestic demand
roles, export roles and import substitution effect. The supply-side is explained through
supply-side model of Ghosh 15. Supply-side analysis describes output coefficients, sensitivity
of the TCI, value-added integrated into exports, etc.
Here, in the demand-side, input coefficient means the amount of inputs (sector-wise)
required to satisfy one unit of clothing demand, output multiplier indicates the total
amount of inputs required to produce one unit of output in the clothing sector, technical
effect means the effect of intermediate inputs on the TCI’s output growth, final demand
effect implies the effect of final consumption on TCI’s output growth, domestic demand
implies the role of domestic demand on the growth of the industry, export expansion
implies the role of export on output growth, and finally, import substitution means the
substitution of imports by domestic demand.
On the other hand, output coeffect shows the amount of inputs provided by TCI to
other industries, sensitivity analysis indicates how sensitive the TCI is to the other
industries, and vertical specialization specifies the amount of imported inputs of TCI
integrated into export of clothing.
Demand-side analysis techniques: We analyze the effect of technical change (TE) and
final demand change (FD) on the output growth in the demand-side 16 structure. For
calculating TE and FD, we use the non-competitive IOT as represented in Figure 3 below.
IMD (sector_ j) F TD 1 2 · · · n (f) (x)
Domestic IMS (sector_ i)
1 z11 z12 · · · z1n f1 x1
2 z21 z22 · · · z2n f2 x2
· · · · · · · · ·· · · · · · · · ·· · · · · · · · ·n zn1 zn2 · · · znn fn xn
Import IMS (sector_ i)
1 zm11 zm
12 · · · zm1n f m
1
2 zm21 zm
22 · · · zm2n f m
2
· · · · · · · ·· · · · · · · ·· · · · · · · ·n zm
n1 zmn2 · · · zm
nn f mn
Value–added (ύ) v1 v2 · · · vn
Total Supply (x́) x1 x2 · · · xn
Figure 3 The framework of input–output tableSource: Masum & Inaba (2018)

108 『社会システム研究』(第 38 号)
Using the framework in Figure 3 the authors calculated the input coefficients, which
represented in Figure 4.
IMD, F, TD, and IMS in Figure 3 denote intermediate demand, final demand, total
demand, and intermediate supply, respectively. i indicates supplying sectors, j indicates
demanding sectors,
�� � ∑ ��� � ������
,
�� � ∑ ��� � ∑ �������� �������
, n × n domestic
intermediate matrix is defined as Z (elements are zij), imported intermediate matrix is
termed as Zm, f as the final demand vector, x as the total demand column vector, ύ as the
value-added row vector, x́ is the total supply row vector. As a characteristic feature of the
IOT, the total demand equals total supply, as in xi = xj (Masum & Inaba, 2018).
Then, aij is the input coefficients representing the input of sector i from sector j. The
coefficients, in Figure 4, are defined as
,
, and
. Figure 4 denotes n ×
n domestic intermediate demand and supply coefficients matrix as Ad, imported
intermediate supply and demand coefficients matrix as Am.
Base on the notations and expressions in the above figures, output column vector x is
defined as below in equation (i).
Adx + f = x, or x = (I − Ad)−1 ....................................................................................... (i)
As Leontief invented such analysis, this is known as the Leontief inverse 17. The
elements of this matrix are referred to as inverse matrix coefficients. When the final
IMD (sector_ j)1 2 · · · n
Domestic IMS (sector_ i)
1 a11 a12 · · · a1n
2 a21 a22 · · · a2n
· · · · · · ·· · · · · · ·· · · · · · ·n an1 an2 · · · ann
Import IMS (sector_ i)
1 am11 am
12 · · · am1n
2 am21 am
22 · · · am2n
· · · · · · ·· · · · · · ·· · · · · · ·n am
n1 amn2 · · · am
nn
Value–added (ύ) av1 av
2 · · · avn
Total Supply (x́) 1 1 · · · 1
Figure 4 The input coefficient frameworkSource: Masum & Inaba (2018)
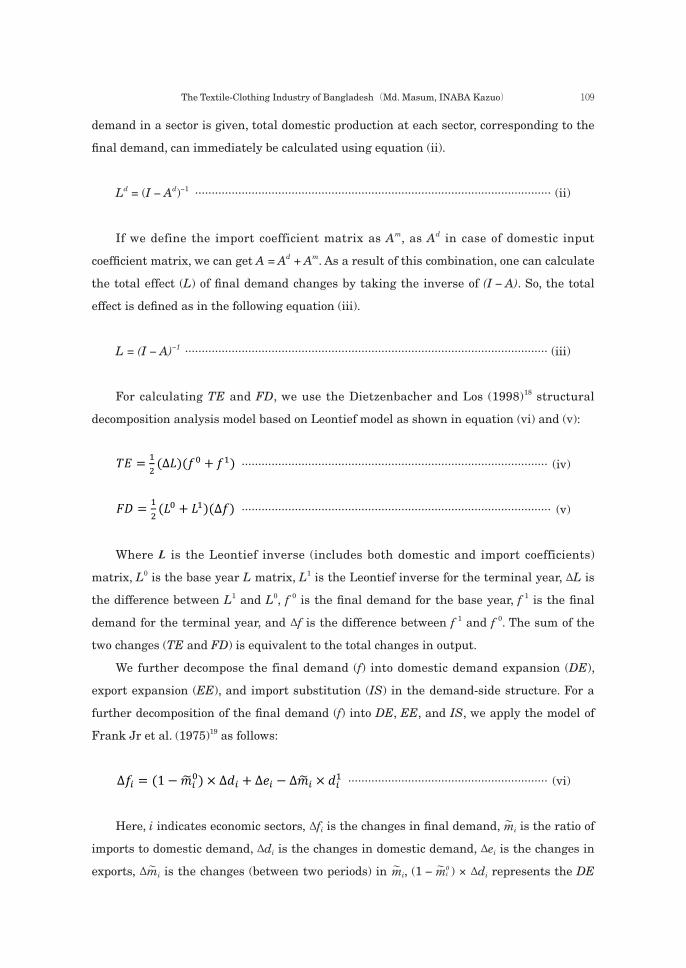
109The Textile-Clothing Industry of Bangladesh(Md. Masum, INABA Kazuo)
demand in a sector is given, total domestic production at each sector, corresponding to the
final demand, can immediately be calculated using equation (ii).
Ld = (I − Ad)−1 ........................................................................................................... (ii)
If we define the import coefficient matrix as Am, as Ad in case of domestic input
coefficient matrix, we can get A = Ad + Am. As a result of this combination, one can calculate
the total effect (L) of final demand changes by taking the inverse of (I − A). So, the total
effect is defined as in the following equation (iii).
L = (I − A)−1 ............................................................................................................. (iii)
For calculating TE and FD, we use the Dietzenbacher and Los (1998) 18 structural
decomposition analysis model based on Leontief model as shown in equation (vi) and (v):
............................................................................................ (iv)
............................................................................................. (v)
Where L is the Leontief inverse (includes both domestic and import coefficients)
matrix, L0 is the base year L matrix, L1 is the Leontief inverse for the terminal year, ΔL is
the difference between L1 and L0, f 0 is the final demand for the base year, f 1 is the final
demand for the terminal year, and Δf is the difference between f 1 and f 0. The sum of the
two changes (TE and FD) is equivalent to the total changes in output.
We further decompose the final demand (f) into domestic demand expansion (DE),
export expansion (EE), and import substitution (IS) in the demand-side structure. For a
further decomposition of the final demand (f) into DE, EE, and IS, we apply the model of
Frank Jr et al. (1975) 19 as follows:
............................................................ (vi)
Here, i indicates economic sectors, Δfi is the changes in final demand, m〜 i is the ratio of
imports to domestic demand, Δdi is the changes in domestic demand, Δei is the changes in
exports, Δm〜 i is the changes (between two periods) in m〜 i, (1 −m〜 0i ) × Δdi represents the DE

110 『社会システム研究』(第 38 号)
coefficient, Δei represents the EE coefficient, and Δm〜 i ×d1i represents the IS coefficient.
Superscript 0 and 1 indicate base year and terminal year, respectively.
We also use output multiplier (OM) for analyzing the demand-side of the TCI 20. OM
measures the combined effects of the direct and indirect repercussions of a change in final
demand (Steenge, 1990). The OM is described as domestic output multiplier (DOM) and
imported output multiplier (IOM). The conceptual framework of the model we use for OM
analysis is the same as the backward linkage analysis models in demand-side model. This
model is based on the conceptual models applied by, among others, Chenery and Watanabe
(1958), Hirschman (1958), Jones (1976), and Cella (1984). The models that we use in this
paper are as follows:
��� � ∑ ��������
................................................................................................... (vii)
Here, LDij represents the elements of Leontief inverse of the domestic input coefficient
matrix, i.e., AD.
To calculate the IOM, or backward economic leakage in other words, we use the
following methodology.
��� � ∑ ���� � ���� �����
........................................................................................ (viii)
Here, Lij is the Leontief inverse of the input coefficients (A), which includes import
input coefficients (AM) and domestic input coefficient matrix (AD), i.e., A = AM + AD
Supply-side analysis techniques: In 1958, Ghosh introduced the supply-side model in the
field of input-output analysis. The basic assumption of the supply-side analysis is that the
output distributions are stable in an economic system, meaning that if the output of sector
i is, for instance, doubled, then the sales from i to each of the sectors that purchase from i
will also be doubled. Instead of fixed input coefficients, fixed output coefficients are
assumed in the supply-side model (Miller & Blair, 2009). The demand-side model gives us
input coefficients (technical coefficients, output multiplier, etc.), and the supply-side
model 21 gives us output coefficients (allocation coefficients, input multiplier, etc.). Beyers
(1976) and Jones (1976) 22 state that the row sums of the supply-side model are considered
to be better measures of forward linkages or input multipliers.
In Figure 5 the output coefficients are defined as
and
, using the
matrix Z and Zm of Figure 3. These bij coefficients indicate the distribution of sector i’s

111The Textile-Clothing Industry of Bangladesh(Md. Masum, INABA Kazuo)
outputs across sectors j that purchase interindustry inputs from i; these are frequently
called allocation coefficients, as opposed to technical coefficients, aij. Final demand
coefficients are defined as
.
The Figure 5 also proves that
∑ ������� � ��� � �
. Bd denotes domestic intermediate
output coefficients matrix. These coefficients relate sectoral gross production to the
primary inputs, that is, to a unit of value entering the interindustry system at the
beginning of the process. As correspondence to x, the x́ is defined as below under output
coefficient framework (Masum & Inaba, 2018).
x́Bd + ύ = x́, or x́ = ύ(I − Bd)−1 ................................................................................... (ix)
where I is the identity matrix, (I − Bd)−1 is the inverse matrix of (I − Bd). This inverse
matrix is known as Ghosh inverse as Gd shown in equation (x). The elements of Gd is
referred to as gdi j . So,
Gd = (I − Bd)−1 ........................................................................................................... (x)
The imported output coefficient matrix is defined as Bm, as Bd in case of domestic
output coefficient matrix. To calculate the total output coefficients, i.e., domestic effect and
import effect, the domestic effect and import effect are combined into one matrix as
B = Bd + Bm, which represented in the following equation (xi).
IMD (sector_ j) F TD1 2 · · · n (f) (x)
Domestic IMS (sector_ i)
1 b11 b12 · · · b1n bf1 1
2 b21 b22 · · · b2n bf2 1
· · · · · · · · ·· · · · · · · · ·· · · · · · · · ·n bn1 bn2 · · · bnn bf
n 1
Import IMS (sector_ i)
1 bm11 bm
12 · · · bm1n
2 bm21 bm
22 · · · bm2n
· · · · · · ·· · · · · · ·· · · · · · ·n bm
n1 bmn2 · · · bm
nn
Figure 5 The output coefficient frameworkSource: Masum & Inaba (2018)
112 『社会システム研究』(第 38 号)
G = (I − B)−1 ............................................................................................................ (xi)
Based on equation (xi), the model specifications for total input multiplier (TIM),
domestic input multiplier (DIM) and imported input multiplier (IIM) are given below. IIM
is also described as the forward economic leakage.
��� � ∑ �������
..................................................................................................... (xii)
Here, Gij represents the elements of Ghosh inverse matrix. The elements include the
domestic coefficients and imported coefficients, i.e., B = BM + BD.
��� � ∑ ��������
.................................................................................................... (xiii)
Here, GDij represents the elements of Ghosh inverse of the domestic output coefficient
matrix, i.e., BD.
To calculate the IIM, or forward economic leakage in other words, we use the following
methodology.
��� � ∑ ���� � ���������
...................................................................................... (xiv)
Here, Gij is the Ghosh inverse of the output coefficients (B), which includes both import
output coefficients (BM) and domestic output coefficient matrix (BD).
When we discuss input multiplier, we define the total forward linkage or input
multiplier (IM) as the sum of DIM and IIM. Then, we calculate the index of the sensitivity
of dispersion (ISD) as listed below 23 to check the sensitivity of the TCI in the economies.
��� � ∑ ���������∑ ∑ �����������
............................................................................................... (xv)
Here, G indicates the Ghosh inverse matrix as it corresponds to the Leontief inverse
matrix L.
We also use VS 24 as a supply-side tool to discover the domestic supply and foreign
supply in TCI exports. VS is an established concept for trade in value-added/supply-side
analysis 25. For this analysis, we apply Hummels et al.’s (2001) model, which is given below
in equation (xvi):

113The Textile-Clothing Industry of Bangladesh(Md. Masum, INABA Kazuo)
VS = uAM [I − AD]−1ê ............................................................................................. (xvi)
Here, u is a 1 × n vector of 1’s, AM is the n × n import coefficient matrix, I is the
identity matrix, AD is the n × n domestic input coefficient matrix, ê is the diagonal matrix
of exports, and n is the number of sectors.
3. Results and discussion
3.1 Demand-side of the TCI
The breakdown of the total demand in Bangladesh shows that 48% of the output is
used for industrial production, 41% of the output is consumed domestically as final
products, and the remaining 10% is exported. The lion share of the total exports is TCI
exports.
The demand-side analysis of the economies reveals that around half of the total output
is consumed as intermediate demand. China consumes 61%, Viet Nam consumes 48%,
India consumes 41%, and Indonesia consumes 40%.
Whereas the average export volume in Viet Nam is notable, textile-clothing shares of
total exports in Bangladesh are very high compared to other countries. The textile-clothing
export in Bangladesh is 80%, which is in contrast to the 13% on average for other
countries. As Figure 6 shows, since 2000 the TCI export share has increased approximately
2.4 times in Bangladesh, 9.2 times in China, 0.36 times in Indonesia, 0.27 times in India,
and 2.7 times in Viet Nam. So, the TCI export growth in China is very high, followed by
Viet Nam and Bangladesh. The export contribution, which is 10–12% for other economies,
is 22% in Viet Nam’s economy. Domestic demand is high in India and Indonesia. The share
of TCI exports in China is also high compared to nations other than Bangladesh.
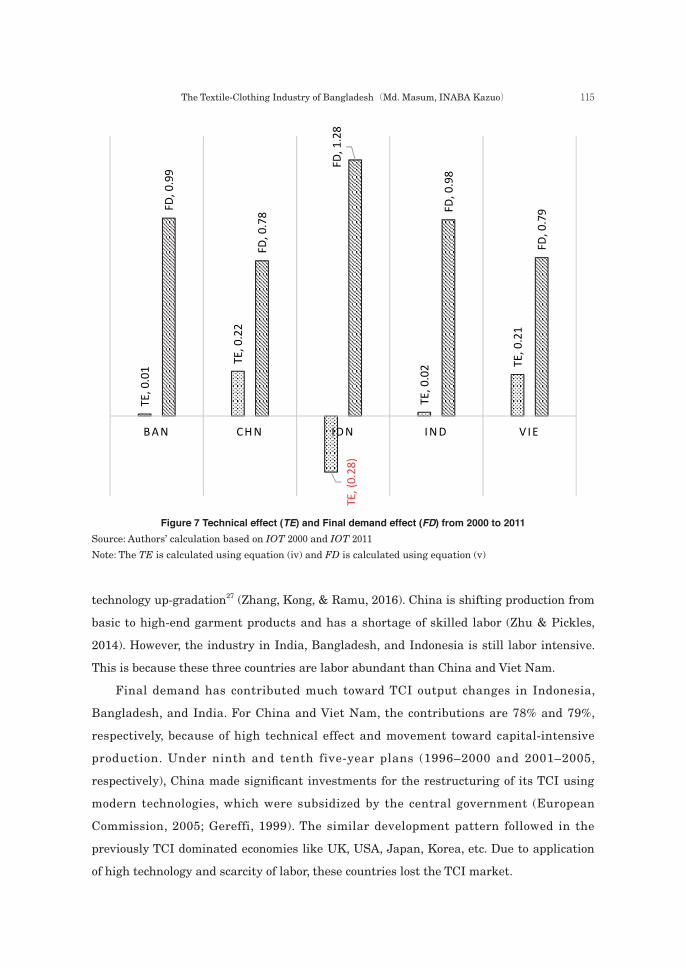
The TCI growth effects: We have divided the output growth effects into technical effect
and final demand effect. Again, the final demand effect consists of domestic demand
expansion, export expansion, and import substitution. Figure 7 depicts the technical effect
on the output growth of the TCI from 2000 to 2011. The industry in Bangladesh has grown
with the active support of foreign demand and local labor force. The technical effect is very
low in Bangladesh. Normally, large firms have an advantage over small ones in regard to
adopting new technology. Insofar as most of the firms in Bangladesh are of small scale,
technology adoption for them remains very difficult (Yunus & Yamagata, 2012). The final
demand helps grow the industry in Bangladesh. The share of the final demand growth

114 『社会システム研究』(第 38 号)
effect is 99% in Bangladesh’s TCI.
The analysis shows that only China, and Viet Nam have a significantly positive
technical effect on the TCI growth 26. On the other hand, Indonesia has had a 28% negative
technical effect on the output growth from 2000 to 2011. As China is growing fast and
moving from low-tech products to high-tech products, its technical effects are positive. Viet
Nam is also progressing with very good technical effects. Technical effect affects Viet Nam’s
production growth due to technology transfer from and proximity to China. After 2000, the
production in China has focused more on value-added and branding cultivation through
48%
61%
40%
41%
Intermediate demand, 48%
41%
28%
48%
50%
Domestic final demand, 30%
10%
11%
12%
10%
Export demand, 22%
80%
25%
7%
10%
TCI export (share of exports), 8%
0% 20% 40% 60% 80% 100%
BAN
CHN
IDN
IND
VIE
TCI export (share of exports) Export demandDomestic final demand Intermediate demand
Figure 6 Demand-side of the economies in 2011 as share of total demandSource: Input-Output Tables
Note: BAN stands for Bangladesh, CHN stands for China, IDN stands for Indonesia, IND stands for India
and VIE stands for Viet Nam. These acronyms are also used in National IOTs.
115The Textile-Clothing Industry of Bangladesh(Md. Masum, INABA Kazuo)
technology up-gradation 27 (Zhang, Kong, & Ramu, 2016). China is shifting production from
basic to high-end garment products and has a shortage of skilled labor (Zhu & Pickles,
2014). However, the industry in India, Bangladesh, and Indonesia is still labor intensive.
This is because these three countries are labor abundant than China and Viet Nam.
Final demand has contributed much toward TCI output changes in Indonesia,
Bangladesh, and India. For China and Viet Nam, the contributions are 78% and 79%,
respectively, because of high technical effect and movement toward capital-intensive
production. Under ninth and tenth five-year plans (1996–2000 and 2001–2005,
respectively), China made significant investments for the restructuring of its TCI using
modern technologies, which were subsidized by the central government (European
Commission, 2005; Gereffi, 1999). The similar development pattern followed in the
previously TCI dominated economies like UK, USA, Japan, Korea, etc. Due to application
of high technology and scarcity of labor, these countries lost the TCI market.
TE, 0.01
TE, 0.22
TE, (0.28)
TE, 0.02 TE
, 0.21
FD, 0.99
FD, 0.78
FD, 1.28
FD, 0.98
FD, 0.79
BAN CHN IDN IND VIE
Figure 7 Technical effect (TE) and Final demand effect (FD) from 2000 to 2011Source: Authors’ calculation based on IOT 2000 and IOT 2011
Note: The TE is calculated using equation (iv) and FD is calculated using equation (v)

116 『社会システム研究』(第 38 号)
Among the final demand components, export has contributed significantly to the
growth path of the TCI, especially in Bangladesh and Viet Nam. The Phase out of MFA
Quota in 2005 brought a boom for Bangladesh and contributed a lot towards growth in
exports of clothing against skepticism (Joarder, Hossain, & Hakim, 2010; Kelegama, 2005;
Majmudar, 1996; Yang & Mlachila, 2007; Yunus & Yamagata, 2012). The export statistics
shows that there was a 339% TCI export growth from 2000 to 2011 and the share of export
has also increased from 65% to 82% in the same period in Bangladesh (Adnan, Rakib, &
Rahman, 2015). Despite the global recession in 2008–09, the growth of the TCI continued
due to two factors. First, the exports of Bangladesh are almost entirely consumer goods ;
and second, Bangladesh has acquired a competitive edge in the world clothing market
(Taslim & Haque, 2011). Sourcing from Bangladesh increased 20% in 2009 while sourcing
from China dropped 5% (F. Z. Ahmed, Greenleaf, & Sacks, 2014).
Export contributed 54%, 45%, and 25% for Bangladesh, Viet Nam, and China,
respectively from the year 2000 to 2011. Export-led growth in Bangladesh is much higher
than other competitors. China’s TCI was also export led, but it is now moving toward
domestic orientation. Since 2011 more than 80% of the TCI products have been consumed
domestically (Lu & Dickson, 2015). In 2003, the domestic market of China consumed US
$63.4 billion worth of clothing, and the overall domestic consumption of textile-clothing
products accounts for two thirds of total production (European Commission, 2005). By the
end of 2020, China will have produced US $750 billion worth of garments, half for export
and the remainder for domestic use (Mirdha, 2017). However, import substitution played
very insignificant roles among the countries, as shown in Table 1. The analysis shows that
the domestic demand has played a greater role in Indonesia and India in regard to TCI
growth due to high population and consumer market. Moreover, the textile base in these
two countries is stronger than clothing base.
Table 1 DE, EE, and IS growth effects from 2000 to 2011
CountriesDomestic Demand Expansion (DE)
Export Expansion (EE) Import Substitution (IS)
BAN 0.45 0.54 -0.01
CHN 0.66 0.25 -0.09
IDN 1.02 0.14 0.16
IND 0.90 0.11 0.01
VIE 0.69 0.45 0.14
Source: Authors’ calculations
Note: This table is calculated using equation (vi).

117The Textile-Clothing Industry of Bangladesh(Md. Masum, INABA Kazuo)
The output multiplier (backward effect): The output multiplier effect quantifies the effect
on the entire economy arising from the initial effect of an exogenous change in any of the
final demand components. It is the amount by which the initial effect is magnified (or
multiplied) to become a total effect (Sim, Secretario, & Suan, 2007). When any one industry
increases its production, an increased demand for inputs from all industries takes place.
An industry with a higher output multiplier indicates that the expansion of that industry’s
production is more beneficial to the economy (Guo & Planting, 2000). The domestic
multiplier effects of the TCI in Bangladesh were 2.08 times in 2000 and 2.14 times in 2011,
which is above average. The average of domestic multiplier in 2000 was1.48 and in 2011
was 1.80. Thus, the effect of the TCI in Bangladesh’s economy has strengthened
domestically. On the other hand, the import leakage has declined from 1.07 to 1.05 times,
indicating slightly increase in the domestic backward linkage to other industries. The TCI
backward linkage shows small increase over time because of increasing demand. The
output multiplier is directly linked with the higher final demand. As clothing demand,
especially exports, has increased, the input demand including yarn, fabric, dye-chemicals,
etc. has also increased. Moreover, the domestic supply capacity to satisfy the input demand
has increased as reflected in declining import leakage.
The output multiplier effect of the TCI on the production of other industries in 2000
and 2011 is summarized in Table 2. In 2011, Viet Nam (2.35) had the highest domestic
multiplier effect of the TCI on the overall industry of the economy. The coefficients for
China, India, and Indonesia are 2.31, 1.96, and 1.57 respectively. The domestic output
multiplier effect has increased in Viet Nam over time as well. The demand for clothing in
Viet Nam has increased manifold as a result, the input taking from the other subsectors
has increased including the imported inputs.
The import multiplier can be used to explain economic leakage, which is summarized
Table 2 The output multipliers of the TCI
CountriesDomestic Output Multiplier Import Output Multiplier
2000 2011 2000 2011
BAN 2.08 2.14 1.07 1.05
CHN 2.44 2.31 1.10 1.02
IDN 1.86 1.57 1.18 1.32
IND 2.19 1.96 1.04 1.09
VIE 1.97 2.35 1.36 1.34
Source: Authors’ calculations
Note: The result of DOM is calculated using equation (vii) and the result of IOM is
calculated using equation (viii)

118 『社会システム研究』(第 38 号)
in Table 2. The IOM analysis reveals that the TCI of Viet Nam and Indonesia were very
much susceptible to imports in 2000 and 2011. The TCI in Indonesia consumed much
imported inputs rather than domestic inputs. Thus, the TCI import leakage of Indonesia
has increased over time, whereas the domestic effect has declined.
3.2 Supply side of the TCI
As Figure 8 shows, 8% of the total imports were the Bangladesh TCI imports in 2011,
which have increased by 1.08 times since 2000. About 87% of the total supply in
Bangladesh’s economy is satisfied domestically as in other economies.
As we mentioned earlier, China’s economy is the largest one followed by India,
87%
91%
88%
89%
Domestic production, 83%
13%
9%
12%
11%
Imports, 17%
8%
2%
6%
3%
TCI import (% of imports), 9%
0% 20% 40% 60% 80% 100%
BAN
CHN
IDN
IND
VIE
TCI import (% of imports) Imports Domestic productionFigure 8 Supply-side of the economies in 2011 as share of total demand
Source: Input-Output Tables
119The Textile-Clothing Industry of Bangladesh(Md. Masum, INABA Kazuo)
Indonesia, Viet Nam, and Bangladesh in accordance with the total demand-supply value.
The domestic supply dominates the economies’ production. Out of the total supply, China
produces 91% locally, India produces 89% locally, Indonesia produces 88% locally, and Viet
Nam produces 83% domestically. The rest is imported. Thus, China imports the lowest
amount, and Viet Nam imports the highest amount in terms of the percentage of the total
supply in the respective economies. Meanwhile, China and India import the lowest volume
of textile-clothing products, for example, 2% and 3% respectively. Indonesia, Bangladesh,
and Viet Nam import 6%, 8%, and 9% of the textile-clothing supply respectively. In
addition, the TCI import supply has increased in China by 1.83 times, Indonesia by 2.29
times, India by 3.05 times, and Viet Nam by 3.43 times.
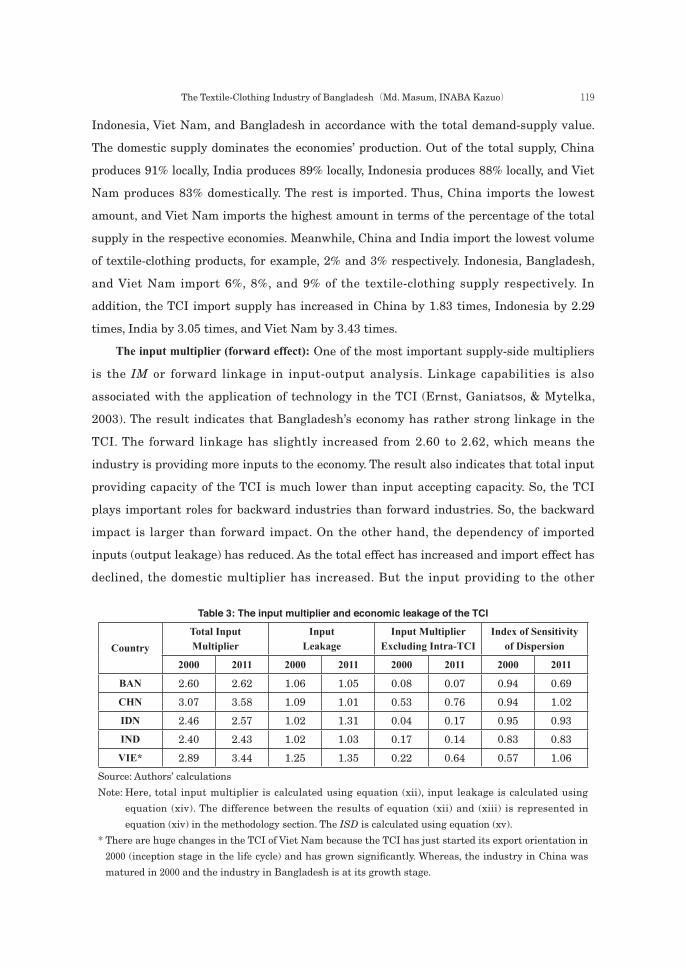
The input multiplier (forward effect): One of the most important supply-side multipliers
is the IM or forward linkage in input-output analysis. Linkage capabilities is also
associated with the application of technology in the TCI (Ernst, Ganiatsos, & Mytelka,
2003). The result indicates that Bangladesh’s economy has rather strong linkage in the
TCI. The forward linkage has slightly increased from 2.60 to 2.62, which means the
industry is providing more inputs to the economy. The result also indicates that total input
providing capacity of the TCI is much lower than input accepting capacity. So, the TCI
plays important roles for backward industries than forward industries. So, the backward
impact is larger than forward impact. On the other hand, the dependency of imported
inputs (output leakage) has reduced. As the total effect has increased and import effect has
declined, the domestic multiplier has increased. But the input providing to the other
Table 3: The input multiplier and economic leakage of the TCI
CountryTotal Input Multiplier
Input Leakage
Input MultiplierExcluding Intra-TCI
Index of Sensitivity of Dispersion
2000 2011 2000 2011 2000 2011 2000 2011
BAN 2.60 2.62 1.06 1.05 0.08 0.07 0.94 0.69
CHN 3.07 3.58 1.09 1.01 0.53 0.76 0.94 1.02
IDN 2.46 2.57 1.02 1.31 0.04 0.17 0.95 0.93
IND 2.40 2.43 1.02 1.03 0.17 0.14 0.83 0.83
VIE* 2.89 3.44 1.25 1.35 0.22 0.64 0.57 1.06
Source: Authors’ calculations
Note: Here, total input multiplier is calculated using equation (xii), input leakage is calculated using
equation (xiv). The difference between the results of equation (xii) and (xiii) is represented in
equation (xiv) in the methodology section. The ISD is calculated using equation (xv).
* There are huge changes in the TCI of Viet Nam because the TCI has just started its export orientation in
2000 (inception stage in the life cycle) and has grown significantly. Whereas, the industry in China was
matured in 2000 and the industry in Bangladesh is at its growth stage.

120 『社会システム研究』(第 38 号)
industry has declined from 0.08 to 0.07 for Bangladesh, which indicates that TCI of
Bangladesh is providing more inputs to itself, i.e., intra-industry transactions (transactions
among yarn, fabric, dye-chemical, etc.) are much higher. The inter-industry dependency of
the industry is notable.
The TCI forward effect of China, Indonesia, India, and Viet Nam also shows upward
trend over time. In addition, input multiplier impact of China and Viet Nam was stronger
than that of Bangladesh in 2011.
The Table 3 also summarizes the net input multiplier effects, which indicate the input
multiplier of the TCI to the other industries excluding the impact on the industry itself
(TCI). The coefficients reveal that the intra-industry impact in Bangladesh is stronger
than that of other countries. The most significant impact of the TCI on other industries is
in China followed by Viet Nam.
The relative importance of the industry is expressed through the index of sensitivity of
dispersion (ISD) of Table 3. The TCI in 2000 was not a sensitive industry 28 for any economy.
However, in 2011, the industry became a sensitive one for China and Viet Nam. Viet Nam
experienced a dramatic change.
The vertical specialization: Vertical specialization is the share of imported inputs used
for production of exported outputs. Intermediate input trade increases as a result of a
vertical production network, in which countries are specialized in each production stage in
the context of the international division of labor, known as VS (Uchida, 2008). The
imported input shares integrated into the export of textile-clothing products of the
countries are provided in Table 4.
Viet Nam imported 53% TCI inputs against the export of the TCI final goods in 2011
followed by Indonesia (32%), India (14%), Bangladesh (9%), and China (7%). The share of
imported inputs integrated into exports has increased in Indonesia by 6%, Viet Nam by
5%, and India by 3% since 2000. In addition, the imported share of exports has decreased
Table 4 The VS coefficients in 2000 and 2011
Countries Year 2000 Year 2011
BAN 0.11 0.09
CHN 0.18 0.07
IDN 0.26 0.32
IND 0.11 0.14
VIE 0.48 0.53
Source: Authors’ calculations
Note: The result in this table is calculated using equation (xvi).

121The Textile-Clothing Industry of Bangladesh(Md. Masum, INABA Kazuo)
in China by 11% and in Bangladesh by 2%. The localization of the Chinese TCI is
noteworthy followed by Bangladesh’s. Meanwhile, Indonesia’s and Viet Nam’s TCI have
become more vertical. The statistics shows that there is improvement in domestic
production linkage. Masum (2016) stated that local knit fabric subsector in Bangladesh
can satisfy 90% of knit fabric demand, washing-dyeing subsector can service 100% of
washing demand, yarn subsector can satisfy 70% of yarn demand, and woven subsector
can serve 40% of woven fabric demand.
3.3 Comparison of the TCI
The Asian textile-clothing exporters have been major beneficiaries of the freer world of
trade in textiles since the implementation of the agreement on textile and clothing (ATC)
replaced the MFA in 1994. This agreement was fully implemented in 2005 under the WTO
multilateral trading system. Asian TCIs were afraid of the Chinese competition due to the
end of the quota system. However, the imposition of safeguard quotas on China in 2006
from the US, and an offer of generalized system of preference facility to other developing
nations from the EU helped other Asian exporters to grow more quickly. Moreover, Viet
Nam was under US quotas negotiated in 2003 until it became a member of the WTO in
late 2006 (James, 2008).
James (2008) assessed the competitiveness of the Asian exporters, which is
summarized in Table 5. He concluded that Bangladesh’s revealed comparative advantage
(RCA) index for clothing export is much higher than those of Viet Nam, China, India, and
Indonesia. On the other hand, the RCA index for textile is higher for India than it is for
China, Indonesia, Bangladesh, and Viet Nam. The unit price calculation reveals that
Bangladesh supplies the lowest-cost clothing to the US market followed by China, Viet
Nam, Indonesia, and India. However, “Made in China” is not losing its price
competitiveness. For example, from 2006 to 2014, the average unit price of US TCI imports
Table 5 The RCA indices for the TCI products of the Asian manufacturers
CountryClothing RCA Index
in 2005Textile RCA Index
in 2005Clothing Unit Value to
the US Market (US$) in 2007
BAN 27.3 1.3 2.3
CHN 3.6 2.7 3.1
IDN 2.2 2.0 3.9
IND 3.2 3.9 4.3
VIE 5.6 1.1 3.9
Source: James (2008)

122 『社会システム研究』(第 38 号)
from China only slightly increased from $1.45 per square meter equivalent (SME) to $1.46
per SME (up 0.7%), whereas the average unit price of TCI imports from the rest of the
world increased from $1.97/SME to $2.13/SME (up 7.9%) (Lu & Dickson, 2015).
The comparative positions of the TCIs of Asian economies based on demand-supply
indicators are summarized in Table 6 below. Factors such as technical change determine
the ultimate gains or losses in productivity, which, in turn, determine international
competitiveness (Fransman, 1986). In this paper, we find that the technical change effect is
higher in China and Viet Nam than in India, Bangladesh, and Indonesia.
Export expansion has a positive relationship with the progress of a developing country,
which was important in explaining the inter-country variance in GDP growth rates (Tyler,
1981). Our analysis finds that the contribution of export expansion is significant in
Bangladesh, whereas Viet Nam, China, Indonesia, and India are the followers respectively.
However, it seems that in the long run, domestic demand expansion makes the industry
stable. Thus, in this sense, Indonesian and Indian TCIs are more sustainable than Viet
Nam and Bangladesh’s TCIs are.
The high backward linkages (output multiplier) may strengthen supply industries,
which feed to other local firms. In addition, the linkage effects on supplier industries may
reduce input costs (Markusen & Venables, 1999). Strong linkages make the industry
competitive in the global market. The results in this paper show that Viet Nam had the
strongest position in the backward effect measure followed by China, Bangladesh, India,
and Indonesia in 2011.
On the other hand, the VS analysis reveal that China is in the top position. VS
Table 6 Demand-Supply growth effects of the economies
Indicators BAN CHN IDN IND VIE
Demand-side
TE 0.01(4*) 0.22 (1) -0.28(5) 0.02(3) 0.21(2)
DE 0.45(5) 0.66(4) 1.02(1) 0.90(2) 0.69(3)
EE 0.54(1) 0.25(3) 0.14(4) 0.11(5) 0.45(2)
DOM in 2011 2.14(3) 2.31(2) 1.57(5) 1.96(4) 2.35(1)
IOM in 2011 1.05(2) 1.02(1) 1.32(4) 1.09(3) 1.34(5)
Supply-side
VS Rate in 2011 0.09(2) 0.07(1) 0.32(4) 0.14(3) 0.53(5)
DIM in 2011 1.57(3) 2.57(1) 1.26(4) 1.40(3) 2.09(2)
IIM in 2011 1.05(3) 1.01(1) 1.31(4) 1.03(2) 1.35(5)
ISD in 2011 0.69(5) 1.02(2) 0.93(3) 0.83(4) 1.06(1)
* The numbers in the parenthesis indicate the comparative ranking of the countries.

123The Textile-Clothing Industry of Bangladesh(Md. Masum, INABA Kazuo)
reduces, in some cases, production costs. However, an increase in comparative advantage is
not necessarily associated with an increase in specialization (Ricci, 1999). In the case of a
TCI in the Asian region, the low rate of VS certifies high competitiveness 29.
The comparative analysis reveals that on the demand side, the contribution of the TCI
to Bangladesh’s economy is much higher compared with other economies in terms of
output and exports. The driver of output growth in Bangladesh is the final demand. The
decomposition of the final demand reveals that domestic demand has contributed greatly
to the economies of Indonesia and India. In addition, import substitution has played a role
in Indonesia’s and Viet Nam’s TCI growth. Meanwhile, technology has played a significant
role in China and Viet Nam in recent times, whereas technical change has a limited role
when it comes to TCI growth in Bangladesh. Bangladesh has reduced her dependency on
imported inputs, which has increased in other countries except for China. Import
dependency is high for Viet Nam and Indonesia.
Bangladesh is becoming a self-subsistence clothing manufacturer. The vertical
specialization rate for Bangladesh was 9% in 2011; it was 53% for Viet Nam in 2011. The
TCI’s output multiplier in Bangladesh for domestic production is 2.14 times, which has
improved since 2000. Meanwhile, the ratio has declined in China, India, and Indonesia,
and Viet Nam has shown a significant shift. The TCI’s import repercussion effect of
Bangladesh has also declined from 1.07 to 1.05, indicating a drop in the dependency on
imports and in the improvement of the domestic supply. The forward analysis reveals that
the TCI of Viet Nam and Indonesia are very much susceptible to imports in 2000 and 2011.
Thus, in general, if we rank the comparative position based on demand-supply
indicators as in Table 6, the demand-supply linkage of the TCI in Bangladesh is stronger
than those in India and Indonesia. The indicators of China and Viet Nam are higher than
Bangladesh’s.
But in terms of economic development and industrial structuring, the economy of
Bangladesh is far behind from China and Viet Nam. The development stage and industrial
structure of these countries are not same. China’s industrial structure has started to
dominate by heavy and chemical industries. China has started to shift TCI to low wage
countries like Myanmar, Cambodia, etc. So, the life cycle of TCI in China is going to be
declined (in 2016 the growth rate was -7%). High technical change in TCI reflects decline of
the life cycle (Masum, 2017). GDP per capita 30 indicates that economy of Bangladesh is the
poorest among the five countries and very much dependent on TCI. According to input-
output table 2011, the TCI’s output as percentage of industrial output is 33% for

124 『社会システム研究』(第 38 号)
Bangladesh, which are 15%, 5%, 9%, and 9% for China, Indonesia, India, and Viet Nam
respectively. The other major industries in the economy of Bangladesh are food, leather,
water transport, paper and printing, etc. All the industries in Bangladesh are labor-
intensive. The major industries for China in 2011 were coke, machinery, metal, chemical,
transport equipment, air transport, electrical equipment, etc. The significant industries in
Viet Nam’s economy are machinery, metal, chemical, chemicals, equipment’s, etc. For
Indonesia, the mentionable industries are machinery, equipment, plastics, paper and
printing, etc. For Indian economy, electrical equipment, transport equipment, coke, plastics,
metal, are mentionable industries in the industrial structure.
4. Conclusions
This paper has analyzed the TCI of Bangladesh from demand-supply aspects in
comparison to other Asian TCI with the input-output framework.
The first stage decomposition (decomposing growth into TE and FD) on the demand
side finds that the growth of the TCI in Bangladesh from 2000 to 2011 is due to the final
demand growth. The final demand growth contributes 99%, and the technical growth
contributes only rarely 1%. The second-stage decomposition (decomposing FD growth into
EE, DE, and IS) concludes that the growth of the final demand is mainly due to export
expansion from 2000 to 2011. So, the structural decomposition analysis on the demand-
side of the TCI in Bangladesh concludes that the growth of the industry is final demand
driven, the role of technology is not so significant. At the same time, export expansion has
contributed much to this growth race, which means that the TCI in Bangladesh is export-
oriented. The average export growth rate over the last decade was 15% (Masum, 2017).
Although technology is important for modern production system, the application of
technology in the TCI is not cost effective. As long as the low-cost labor is available, the
industry should rely more on labor rather than technology. The experience of technology
application in the TCI is not positive. The previous study concluded that technology
replaced the labor in the former manufacturers like France, Germany, UK, USA, Japan,
Korea, etc. Due to unavailability of labor, developed countries replaced labor-intensive
production process with technology, which lead to lose the competitiveness in the consumer
market. This competitive weakness forces them to relocate production process to labor
abundant countries. When we analyze the technical changes with the existing competitors,
it gives our industry a signal that the TCI of Bangladesh is still driven by final demand. It

125The Textile-Clothing Industry of Bangladesh(Md. Masum, INABA Kazuo)
supports the previous findings that the industry is order-driven (Masum, 2016). The
technical change to the Viet Nam and Chinese industry is mentionable. It is the nature of
the TCI that as economy grows and other industrial branches contribute to the economy,
the labor-intensive industry becomes capital-driven or technology dependent. The
characteristics of Chinese economy support this phenomenon. The economic nature of Viet
Nam is different due to proximity to China. As a result, technical changes to Viet Nam’s
TCI is also high. At the same time, the recent agreement 31 between Viet Nam and other 10
pacific countries justifies its technical change. So, after China, Viet Nam is also going to be
the next supply-driven manufacturer of clothing. But, the case of Bangladesh is different.
It is recommended to the Bangladeshi manufacturers to keep the TCI labor dependent
until some structural changes in the economy like China. The backward effect, another
indicator of the demand side, of the TCI in Bangladesh has also increased over time. The
paper also finds that the use of imported raw materials in TCI production in Bangladesh
has declined over time. The increasing output multiplier and reducing dependency on
imported inputs bring benefits for the local raw materials supplier and improves the
sustainability of the TCI in the long run.
Secondly, the supply-side analysis indicates that the TCI’s forward effect and leakage
effect have slightly increased. In addition, the sensitivity analysis indicates that the
industry is not so sensitive to the economy in 2011. The analysis also finds that the local
firms can satisfy 91% of the required inputs integrated into exports into 2011. The fibre
and woven subsectors are import dependent. Some initiatives from the government and
industry insider is necessary to improve the fibre and woven subsector, e.g., the
government should facilitate these subsectors through financial and non-financial benefits,
the concerned parties should find alternative solutions like substitution of natural fibre
into chemical fibre, etc. Based on the above discussion in the body of the paper on the
supply side and the demand side of the TCI of Bangladesh, we can infer that the TCI of
Bangladesh is a demand-driven 32 industry rather than a supply-driven one.
Finally, the comparison of the TCI of Bangladesh with the Asian manufacturers
indicated that the demand-side and supply-side of the industry in every country is not
similar. The demand side of Bangladesh is export driven with a low-tech production system
as in India and Indonesia. The demand side of China and Viet Nam has been relatively
technology driven since 2000. The domestic output multiplier indicates that the demand
side of Bangladesh is almost similar to that of Viet Nam and China. However, the import
leakage implies that the demand side of Bangladesh’s TCI is better than Viet Nam and

126 『社会システム研究』(第 38 号)
Indonesia. When we compare the supply side, we find that the TCIs of China and Viet Nam
are the key industries in their economic structures. However, it is not a key industry in
Bangladesh, although the TCI’s contribution to the national economy is much higher than
other countries’. The input-leakage and vertical specialization rates also indicate that the
supply side of the TCI in Bangladesh is not similar to those of other countries, especially
Viet Nam. Lastly, the comparison concludes that both for the demand side and in the
supply side, China and Viet Nam are ahead of Bangladesh followed by India and Indonesia
as summarized in Table 6.
This paper lacks trade in value added perspective of decomposition. In future, the
authors are planning to analyze the Asian TCI from trade in value added perspective.
Acknowledgement
Earlier versions of this paper have been presented at the KESRA Conference, Seoul,
Korea (February 10, 2017); the International Conference of Economic Structures, Tokyo,
Japan (March 17–19, 2017); the 28th PAPAIOS Conference, Osaka, Japan (October 20–22,
2017); and the RICA Conference, Guangzhou, China (November 23–25, 2017). One of the
earlier versions of this paper has also been published as proceedings of the 25th IIOA
Conference, New Jersey, USA (June 19–23, 2017). The authors acknowledge the
contributions of the discussants and participants as well as anonymous referees of the
journal.
Notes
1 The textile industry and clothing industry are considered to be two industries, but in this
paper, we addressed TCI as one industry. We considered clothing as the finished product of
the textile-clothing industry. Moreover, in input-output framework, it is difficult to discuss
the textile and clothing industry separately. However, when we discuss TCI out of the
input-output framework, we address textile and clothing as separate industries as much as
possible. Here, the main purpose of the study is to analyze the structure of Bangladesh’s
TCI. Roughly 97% of the TCI output in Bangladesh is clothing (Masum & Inaba, 2018). To
analyze the TCI of Bangladesh in comparative form, we choose four other Asian countries,
which are the top four clothing exporters and competitors to Bangladesh.
2 TCI is sometimes divided into primary sector and secondary sector. The primary sector
comprises yarn production, fabric production, and dye-chemical processing. The secondary
sector consists of apparel production, accessory additions, packaging, etc.
127The Textile-Clothing Industry of Bangladesh(Md. Masum, INABA Kazuo)
3 FDI stocks in TCI are US $253, US $1221, and US $2531 million during 2000, 2010, and
2016, respectively, with a share of 20% of total FDI flows in 2016 (Bangladesh Bank, 2016).
4 The government facilitates this industry through the duty-free importing of raw materials,
cash incentives, duty drawbacks, back-to-back credit, and bonded warehouses (N. Ahmed,
2009; Latifee & Kabir, 2015; Masum, 2016).
5 During the past decades, the TCIs around the globe have been trying to adjust to a rapidly
changing business environment while the manufacturing bases have moved into the
developing countries (Rajkishore Nayak, Padhye, Wang, Chatterjee, & Gupta, 2015). The
pattern has been clearly observed in Asia over the past six decades: the successive transfer
of labor-intensive industries from Europe and the United States to Japan to the Asian
newly industrialized countries (Ruan & Zhang, 2014).
6 Li & Fung is one of the Asian trading firms. These firms are the element of triangular
manufacturing in clothing industry. They play the role of negotiator between manufacturer
and branded retailers.
7 This means that the same company place orders to manufacturers of all countries, for an
example, Walmart buys clothing from Bangladesh, India, China, Viet Nam, etc.
8 The top five countries are China, Bangladesh, Viet Nam, Indonesia, and India.
9 Demand-side in the IOT framework is defined as variation and changes in the input
structure of production when we take the final demand as the exogenous variable. The
demand-side is explained by output multiplier, input coefficient, technical and substitution
effects in the production, etc.
10 Supply-side in the IOT framework is defined as the variations and changes in output
structure due to changes in primary inputs and other input supplies. The exogenous
variable in the supply-side model is value added. The supply-side is explained by output
coefficient, input multiplier, value added effect, intermediate input import effect, etc.
11 In input-output framework, technological change means changes in the input-output
coefficients, which do not necessarily impact on total technological growth as indicated in
the Solow or growth accounting (Magacho, McCombie, & Guilhoto, 2018). Rose & Casler
(1996) stated that technical change is often broadly interpreted to include any factor that
causes a change in a technical coefficient, such as true technological change, technical
substitution and scale effects.
12 We did a comparative study of the top five clothing exporter-manufacturers, excluding
Hong Kong because around 95% of textile-clothing exporting from Hong Kong is re-
exporting. As per the WTO database, the export ranking of the clothing exporters is China
128 『社会システム研究』(第 38 号)
($161 billion), European Union ($117 billion), Bangladesh ($28 billion), Viet Nam ($25
billion), India ($18 billion), and Indonesia ($7 billion) in 2016, with annual growth of -7%,
4%, 6%, 5%, -2%, and -2% respectively.
13 We converted the US dollar value IOTs into local currency IOTs as taka for Bangladesh,
dong for Viet Nam, rupee for India, rupiah for Indonesia, and yuan for China.
14 To convert the current price IOTs into constant price IOTs, we calculated sector-wise
domestic deflators (35 deflators), a deflator for exports, and a deflator for imports. For
many cases, due to insufficient data, we use sector-wise GDP deflators for this conversion
purpose.
15 The exogenous variable for supply-side model is value added, whereas, the exogenous
variable for demand-side model is final demand.
16 Analyses concerning domestic demand and exports in the input-output framework are
leveled as demand-side analyses, whereas analyses concerning primary inputs, imports
and value-added are described as supply-side analyses (Mayer & Flachmann, 2011).
17 The details mathematical derivation is available in Miller & Blair (2009)
18 Please see Dietzenbacher and Los (1998) and Miller and Blair (2009) for detailed
mathematical derivation.
19 Please see Frank Jr et al. (1975) for detailed mathematical derivation. Frank Jr et al.’s
(1975) model decomposes the ouput growth into DE, EE, and IS. We apply the same
concept to decompose the f.
20 The multipliers that incorporate direct and indirect effects are also known as simple
multipliers (Miller and Blair 2009)
21 This paper subdivides the TCI into demand-side and supply-side. As Miller and Blair
(2009) discussed in detail that Leontief model explains the demand-side of the industry,
whereas, Ghosh model emphasizes the supply-side. The impact of final demand changes
explained in Leontief model, but the impact of primary input changes explained in Ghosh
model. So, in line with our subdivision of TCI, we apply Ghosh model for supply-side
analysis and Leontief model for demand-side analysis. Although input coefficient is fixed in
Leontief model and output coefficient is fixed in Ghosh model, we discuss them for different
purpose.
22 An early measure of forward linkage was also proposed, based on A and L. But this
measure has been viewed with skepticism, because they are generated by a peculiar
stimulus – a simultaneous increase of one unit in the gross outputs of every sector. This
dissatisfaction led to the suggestion that elements from the Ghosh model would be more

129The Textile-Clothing Industry of Bangladesh(Md. Masum, INABA Kazuo)
appropriate as forward linkage measure (Miller & Blair, 2009). Moreover, one of the
contributions of this paper is to divide the structure of the TCI into demand-side and
supply-side. Demand-side is discussed under Leontief model and supply-side is mostly
discussed under Ghosh model in this paper. There are many examples of suing both models
together, such as, Clements, 1990; Clements & Rossi, 1991; Dietzenbacher, 1992;
Dietzenbacher & Van der Linden, 1997; European Commission, 2007; Guerra & Sancho,
2010; Hewings, 1982; Song, Liu, & Langston, 2005, 2006b, 2006a; among others.
23 The idea of ISD was introduced by Rasmussen (1956) under Leontief model. But, we use
the ISD concept under Ghosh model because we use this measure for supply-side analysis.
Gosh model is a well-established supply-side model. Moreover, base of ISD analysis is
input multiplier or forward linkage. At the same time, row sums of the Ghosh inverse were
suggested as a better measure of normalized forward linkage or ISD (Miller & Blair, 2009).
24 VS is based on Leontief model and represents supply-side. VS indicates share of imported
inputs integrated into exports.
25 See, for example, Dixit and Grossman (1982), Sanyal (1983), Krugman et al. (1995),
Deardorff (2001), Jones (2001), and Timmer et al. (2015), among others.
26 The technical effect on the TCI growth in Bangladesh was -0.09% from 2000 to 2005 and
-0.02% from 2005 to 2011 at the current market price (Masum, 2017).
27 Both horizontal and vertical technology up-gradation have taken place. According to Zhang
et al. (2016), horizontal up-gradation includes training provision, new processes and
material utilization, adaption to machinery and equipment, inventory control, and
organizational evolution; vertical technology up-gradation includes brand creation,
participation in upstream and downstream production, etc.
28 Coefficient > 1 indicates a sensitive industry (Humavindu & Stage, 2013)
29 Here, we consider that the low VS rate is better for developing countries, which reduces
import costs and increases employability. The explanation varies based on the level of
economic development. For developed nations, a higher VS rate is good because developed
nations can outsource their production for the reduction of production costs.
30 GDP per capita (current US$) in 2017 for China, Indonesia, Viet Nam, India, and
Bangladesh are $8827, $3847, $2343, $1940, and $1517 respectively (World Bank, 2018).
31 Comprehensive and Progressive Agreement for Trans-Pacific Partnership (CPTPP) has
signed in March 2018 by Australia, Brunei, Canada, Chile, Japan, Malaysia, Mexico, New
Zealand, Peru, Singapore and Viet Nam. The purpose of CPTPP is to reduce tariff and non-
tariff barriers. The deal covers a market of nearly 500 million people. Viet Nam, as a TCI
130 『社会システム研究』(第 38 号)
manufacturer, will be benefited much from this deal.
32 Demand-driven indicates that the production is driven by the demand generation in the
economy, especially export demand. Whereas, supply driven means industry will produce
output and consumer will accept as supplied by the producer.
References
Adnan, A. T. M., Rakib, A., & Rahman, M. (2015). Export trend of Bangladesh: The dominance
of ready-made garment industry. Research Journal of Economics, Business and ICT, 10(1).
Agarwal, V., Kaur, R., & De, D. (2017). Scenario Analysis of Textile Industry in Asia-Pacific
Trade Agreement (APTA). Procedia Computer Science, 122, 685–690. https://doi.org/https://
doi.org/10.1016/j.procs.2017.11.424
Ahmed, F. Z., Greenleaf, A., & Sacks, A. (2014). The paradox of export growth in areas of weak
governance: The case of the ready made garment sector in Bangladesh. World Development,
56, 258–271.
Ahmed, N. (2009). Sustaining ready-made garment exports from Bangladesh. Journal of
Contemporary Asia, 39(4), 597–618.
Ahmed, R. (2013). An analysis of the change and volatility in the apparel industry of
Bangladesh after MFA era. Journal of Textile and Apparel Technology and Management,
8(1), 1.
Alam, M. S., & Natsuda, K. (2016). The competitive factors of the Bangladeshi garment
industry in the post-MFA era. Canadian Journal of Development Studies/Revue
Canadienne d’études Du Développement, 37(3), 316–336.
Appelbaum, R. P., & Gereffi, G. (1994). Power and profits in the apparel commodity chain. In E.
Bonacich, L. Cheng, N. Chichilla, N. Hamilton, & P. Ong (Eds.), Global production: The
apparel industry in the Pacific Rim (pp. 42–62). Philadelphia: Temple University Press
Philadelphia, PA. Retrieved from https://dukespace.lib.duke.edu/dspace/bitstream/
handle/10161/11456/1994_Ch 4_Cheng %26 Gereffi_US Retailers %26 Asian Garment
Production.pdf?sequence=1
Ashyrov, G., Paas, T., & Tverdostup, M. (2018). The input-output analysis of blue industries:
Comparative study of Estonia and Finland (No. 109). University of Tartu (Estonia).
Bangladesh Bank. (2016). Foreign direct investment (FDI) in Bangladesh. Survey Report.
Dhaka . Retr i eved f rom ht tps : / /www.bb.org.bd /pub /ha l fyear ly / fd i survey /
fdisurveyjanjun2016.pdf
Beyers, W. B. (1976). Empirical identification of key sectors: some further evidence.
131The Textile-Clothing Industry of Bangladesh(Md. Masum, INABA Kazuo)
Environment and Planning A, 8(2), 231–236.
Bhattacharya, D., & Rahman, M. (1999). Female employment under export-propelled
industrialization: Prospects for internalizing global opportunities in Bangladesh’s apparel
sector. Geneva: UNRISD Occasional Paper.
Cella, G. (1984). The input-output measurement of interindustry linkages. Oxford Bulletin of
Economics and Statistics, 46(1), 73–84.
Chen, W., Lau, C. K. M., Boansi, D., & Bilgin, M. H. (2017). Effects of trade cost on the textile
and apparel market: evidence from Asian countries. The Journal of The Textile Institute,
108(6), 971–986.
Chenery, H. B., & Watanabe, T. (1958). International comparisons of the structure of production.
Econometrica, 26(4), 487–521.
Clements, B. J. (1990). On the decomposition and normalization of interindustry linkages.
Economics Letters, 33(4), 337–340.
Clements, B. J., & Rossi, J. W. (1991). Interindustry linkages and economic development: the
case of Brazil reconsidered. The Developing Economies, 29(2), 166–187.
Deardorff, A. V. (2001). Fragmentation in simple trade models. The North American Journal of
Economics and Finance, 12(2), 121–137.
Dietzenbacher, E. (1992). The measurement of interindustry linkages: key sectors in the
Netherlands. Economic Modelling, 9(4), 419–437.
Dietzenbacher, E., & Los, B. (1998). Structural decomposition techniques: sense and sensitivity.
Economic Systems Research, 10(4), 307–324.
Dietzenbacher, E., & Van der Linden, J. A. (1997). Sectoral and spatial linkages in the EC
production structure. Journal of Regional Science, 37(2), 235–257.
Dixit, A. K., & Grossman, G. M. (1982). Trade and protection with multistage production. The
Review of Economic Studies, 49(4), 583–594.
Ernst, D., Ganiatsos, T., & Mytelka, L. (2003). Technological capabilities and export success in
Asia. Routledge.
European Commission. (2005). Study on China’s textiles and clothing industry and its market
expansion strategy. European Commission. Retrieved from https://books.google.co.jp/
books?id=oGOykQEACAAJ
European Commission. (2007). Joint research center’s institute for prospective technological
studies contribution to the report on guiding principles for product market and sector
monitoring. Brussels.
Frank Jr, C. R., Kim, K. S., & Westphal, L. E. (1975). Foreign trade regimes and economic

132 『社会システム研究』(第 38 号)
development: South Korea. In C. R. Frank Jr, K. S. Kim, & L. E. Westphal (Eds.), NBER
Books (pp. 7–100). National Bureau of Economic Research, Inc. Retrieved from http://www.
nber.org/chapters/c4067.pdf
Frankel, J. A., & Wei, S.-J. (1995). The new regionalism and Asia: impact and options. Center
for Pacific Basin Monetary and Economic Studies, Economic Research Department, Federal
Reserve Bank of San Francisco.
Fransman, M. (1986). International competitiveness, technical change and the state: The
machine tool industry in Taiwan and Japan. World Development, 14(12), 1375–1396.
Gereffi, G. (1999). International trade and industrial upgrading in the apparel commodity
chain. Journal of International Economics, 48(1), 37–70.
Goedhuys, M., Janz, N., & Mohnen, P. (2013). Knowledge-based productivity in “low-tech”
industries: evidence from firms in developing countries. Industrial and Corporate Change,
23(1), 1–23.
Guerra, A.-I., & Sancho, F. (2010). Measuring energy linkages with the hypothetical extraction
method: An application to Spain. Energy Economics, 32(4), 831–837.
Guo, J., & Planting, M. A. (2000). Using input-output analysis to measure U . S . economic
structural change over a 24 Year period. In The 13th International Conference on Input-
Output Techniques. International Input-Output Association.
Heron, T. (2006). The ending of the multifibre arrangement: a development boon for the south?
The European Journal of Development Research, 18(1), 1–21.
Hewings, G. J. D. (1982). The empirical identification of key sectors in an economy: a regional
perspective. The Developing Economies, 20(2), 173–195.
Hirschman, A. O. (1958). The strategy of economic development. New Haven: Yale University
Press.
Humavindu, M. N., & Stage, J. (2013). Key sectors of the Namibian economy. Journal of
Economic Structures, 2(1), 1–15. https://doi.org/10.1186/2193-2409-2-1
Hummels, D., Ishii, J., & Yi, K.-M. (2001). The nature and growth of vertical specialization in
world trade. Journal of International Economics, 54(1), 75–96.
Huq, A. F., Stevenson, M., & Zorzini, M. (2014). Social sustainability in developing country
suppliers: An exploratory study in the ready made garments industry of Bangladesh.
International Journal of Operations & Production Management, 34(5), 610–638.
James, W. (2008). Asian textile and apparel trade: moving forward with regional integration
(ERD working paper series No. 111). Asian Development Bank. Retrieved from http://www.
adb.org/sites/default/files/publication/28216/wp111.pdf
133The Textile-Clothing Industry of Bangladesh(Md. Masum, INABA Kazuo)
Joarder, M. A. M., Hossain, A. K. M., & Hakim, M. M. (2010). Post-MFA performance of
Bangladesh apparel sector. International Review of Business Research Papers, 6(4), 134–
144.
Jones, L. P. (1976). The measurement of Hirschmanian linkages. The Quarterly Journal of
Economics, 90(2), 323–333.
Jones, R. W. (2001). Globalization and the fragmentation of production. Seoul Journal of
Economics, 14(1), 1–13.
Kelegama, S. (2005). South Asia After the Quota System, Impact of the MFA Phase-out. Institute
of Policy Studies.
Kim, J.-O., Traore, M. K., & Warfield, C. (2006). The textile and apparel industry in developing
countries. Textile Progress, 38(3), 1–64.
Krugman, P., Cooper, R. N., & Srinivasan, T. N. (1995). Growing world trade: causes and
consequences. Brookings Papers on Economic Activity, 1995(1), 327–377.
Latifee, E. H., & Kabir, R. (2015). Handbook for ready-made garments investors to Bangladesh.
(S. Chowdhury, Ed.). EuroBang Fashion. https://doi.org/10.13140/RG.2.1.2860.7761
Lu, S., & Dickson, A. M. (2015). Where is China’s textile and apparel industry going? China
Policy Institute.
Magacho, G. R., McCombie, J. S. L., & Guilhoto, J. J. M. (2018). Impacts of trade liberalization
on countries’ sectoral structure of production and trade: a structural decomposition
analysis. Structural Change and Economic Dynamics.
Majmudar, M. (1996). Trade Liberalisation in Clothing: the MFA Phase-Out and the Developing
Countries. Development Policy Review, 14(1), 5–36.
Markusen, J. R., & Venables, A. J. (1999). Foreign direct investment as a catalyst for industrial
development. European Economic Review, 43(2), 335–356.
Masum, M. (2016). The Bangladesh Textile-Clothing Industry: A Demand-Supply Review.
Social System Studies, 33(5), 109–139.
Masum, M. (2017). Demand-Supply Direction of the Textile-Clothing Industry of Asian Newly
Industrialized Economy South Korea and Bangladesh. The Ritsumeikan Economic Review,
65(4), 691–735.
Masum, M., & Inaba, K. (2018). A role of textile-clothing industry in the economic structure of
Bangladesh: An input-output analysis. The Ritsumeikan Economic Review, 67(3), 1–20.
Mayer, H., & Flachmann, C. (2011). Extended input-output model for energy and greenhouse
gases. Final Report, Federal Statistical Office of Germany.
Miller, R. E., & Blair, P. D. (2009). Input-output analysis: foundations and extensions. Cambridge

134 『社会システム研究』(第 38 号)
University Press.
Mirdha, R. U. (2017, July 26). Rising apparel exports to China a sign of new opportunities. The
Daily Star. Retrieved from http://www.thedailystar.net/business/rising-apparel-exports-
china-sign-new-opportunities-1438684
Nayak, R., & Padhye, R. (2015). Introduction: the apparel industry. In Garment manufacturing
technology (pp. 1–17). Elsevier.
Nayak, R., Padhye, R., Wang, L., Chatterjee, K., & Gupta, S. (2015). The role of mass
customisation in the apparel industry. International Journal of Fashion Design, Technology
and Education, 8(2), 162–172.
Rasmussen, P. N. (1957). Studies in inter-sectoral relations. Amsterdam: North-Holland.
Ricci, L. A. (1999). Economic geography and comparative advantage: Agglomeration versus
specialization. European Economic Review, 43(2), 357–377.
Rose, A., & Casler, S. (1996). Input–output structural decomposition analysis: a critical
appraisal. Economic Systems Research, 8(1), 33–62.
Ruan, J., & Zhang, X. (2014). “Flying geese” in China: The textile and apparel industry’s pattern
of migration. Journal of Asian Economics, 34, 79–91.
Sanyal, K. K. (1983). Vertical specialization in a Ricardian model with a continuum of stages of
production. Economica, 50(197), 71–78.
Sim, B., Secretario, F., & Suan, E. (2007). Developing an interregional input–output table for
cross-border economies: An application to Lao People’s Democratic Republic and Thailand.
Asian Development Bank.
Song, Y., Liu, C., & Langston, C. (2005). A linkage measure framework for the real estate sector.
International Journal of Strategic Property Management, 9(3), 121–143.
Song, Y., Liu, C., & Langston, C. (2006a). A linkage analysis of the real estate sector using the
hypothetical extraction method. Journal of Applied Input-Output Analysis, 11, 25–47.
Song, Y., Liu, C., & Langston, C. (2006b). Linkage measures of the construction sector using the
hypothetical extraction method. Construction Management and Economics, 24(6), 579–589.
Steenge, A. E. (1990). The CommodityTechnology Revisited: Theoretical Basis and an
Application to Error Location in the Make-Use Framework. Economic Modelling, 7, 376–
387.
Taplin, M. I. (2014). Who is to blame? A re-examination of fast fashion after the 2013 factory
disaster in Bangladesh. Critical Perspectives on International Business, 10(1/2), 72–83.
Taslim, M. A., & Haque, M. S. (2011). Export Performance of Bangladesh Global Recession and
After. Bangladesh Foreign Trade Institute.
135The Textile-Clothing Industry of Bangladesh(Md. Masum, INABA Kazuo)
Timmer, M. P., Dietzenbacher, E., Los, B., Stehrer, R., & Vries, G. J. (2015). An illustrated user
guide to the world input–output database: the case of global automotive production. Review
of International Economics, 23(3), 575–605.
Tyler, W. G. (1981). Growth and export expansion in developing countries: Some empirical
evidence. Journal of Development Economics, 9(1), 121–130.
Uchida, Y. (2008). Vertical specialization in East Asia: some evidence from East Asia using
Asian international input-output tables from 1975 to 2000. Chosakenkyu-Houkokusho,
IDE-JETRO.
World Bank. (2018). GDP per capita (current US$). Retrieved July 1, 2018, from http://www.
worldbank.org/
Yang, Y., & Mlachila, M. (2007). The end of textiles quotas: A case study of the impact on
Bangladesh. The Journal of Development Studies, 43(4), 675–699.
Yunus, M., & Yamagata, T. (2012). The garment industry in Bangladesh. In T. Fukunishi (Ed.),
Dynamics of the Garment Industry in Low-Income Countries: Experience of Asia and Africa.
Tokyo: IDE-JETRO.
Zhang, M., Kong, X. X., & Ramu, S. C. (2016). The transformation of the clothing industry in
China. Asia Pacific Business Review, 22(1), 86–109.
Zhu, S., & Pickles, J. (2014). Bring in, go up, go west, go out: Upgrading, regionalisation and
delocalisation in China’s apparel production networks. Journal of Contemporary Asia,
44(1), 36–63.