The Saudi Insurance Market Report 2012 - مؤسسة النقد … Market Rep… · – Balance...
43
Saudi Arabian Monetary Agency General Insurance Supervision Department The Saudi Insurance Market Report 2012
Transcript of The Saudi Insurance Market Report 2012 - مؤسسة النقد … Market Rep… · – Balance...
Saudi Arabian Monetary Agency
General Insurance Supervision Department
The Saudi Insurance Market Report
2012

The Saudi Insurance Market Report (2012) SAMA – General Insurance Supervision Department – 1
Introduction 4
Insurance Market Performance - Overall
– Gross Written Premiums 6
– Insurance Penetration 7
– Insurance Density 8
– Gross Written Premiums by Line of Business 9
– Net Written Premiums by Line of Business 11
– Retention Ratio by Line of Business 13
– Gross Claims Paid by Line of Business 14
– General and Health Net Earned Premiums vs. Net Claims Incurred 15
– Market Profitability 16
– Balance Sheet - Policyholders’ Assets 17
– Balance Sheet - Shareholders’ Assets 18
– Balance Sheet - Policyholders’ Liabilities and Equity 19
– Balance Sheet - Shareholders’ Liabilities and Equity 20
Insurance Market Performance - By Line of Business
– Health Insurance 22
– Protection and Savings Insurance 23
– Motor Insurance 24
– Property/ Fire Insurance 25
Table of Contents

The Saudi Insurance Market Report (2012) SAMA – General Insurance Supervision Department – 2
Table of Contents
– Engineering Insurance 26
– A&L and Other Insurance 27
– Marine Insurance 28
– Energy Insurance 29
– Aviation Insurance 30
Other Market Indicators
– Commissions Incurred by Line of Business 32
– Employees Breakdown by Nationality 33
– Insurance Market Structure 34
– Capitalization of Insurance Companies 35
Appendix: Data Tables
– Table 1: Gross Written Premiums by Line of Business 37
– Tables 2 & 3: Insurance Penetration and Density 38
– Table 4: Net Written Premiums by Line of Business 39
– Table 5: Retention Ratio by Line of Business 40
– Table 6: Commissions Incurred by Line of Business 41
– Table 7: Gross Claims Paid by Line of Business 42

3
Introduction
The Saudi Insurance Market Report (2012) SAMA – General Insurance Supervision Department – 4
Introduction
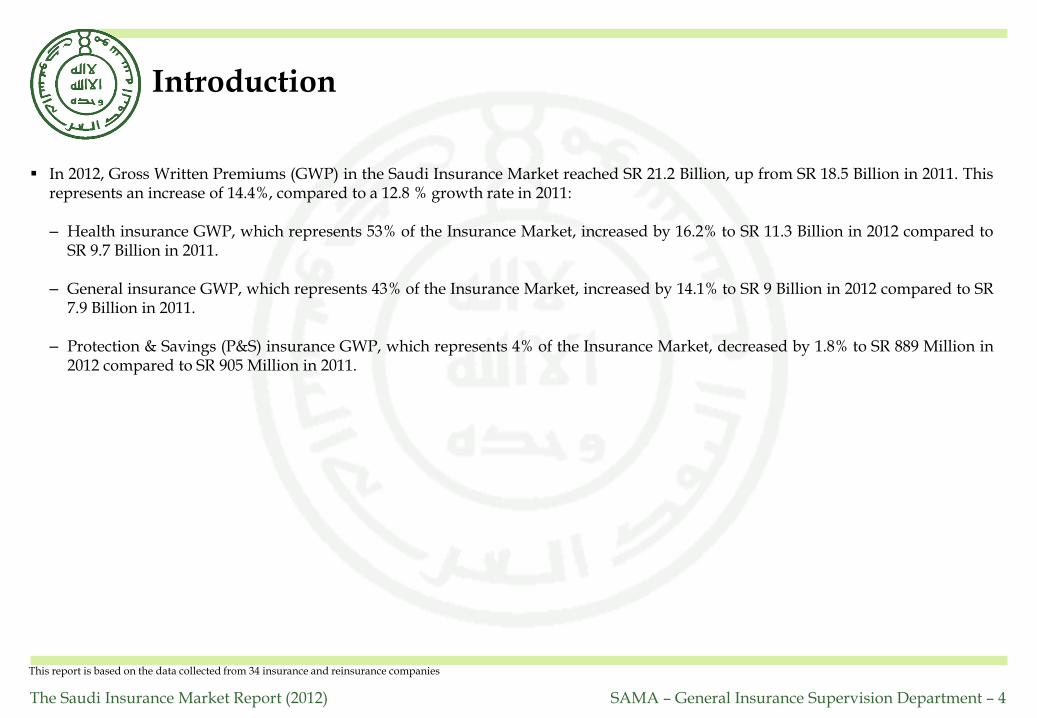
In 2012, Gross Written Premiums (GWP) in the Saudi Insurance Market reached SR 21.2 Billion, up from SR 18.5 Billion in 2011. This represents an increase of 14.4%, compared to a 12.8 % growth rate in 2011:
– Health insurance GWP, which represents 53% of the Insurance Market, increased by 16.2% to SR 11.3 Billion in 2012 compared to SR 9.7 Billion in 2011.
– General insurance GWP, which represents 43% of the Insurance Market, increased by 14.1% to SR 9 Billion in 2012 compared to SR 7.9 Billion in 2011.
– Protection & Savings (P&S) insurance GWP, which represents 4% of the Insurance Market, decreased by 1.8% to SR 889 Million in 2012 compared to SR 905 Million in 2011.
This report is based on the data collected from 34 insurance and reinsurance companies
5
Insurance Market Performance - Overall

The Saudi Insurance Market Report (2012) SAMA – General Insurance Supervision Department – 6
Gross Written Premiums
Gross Written Premiums (2008 to 2012, SR Million)
% Growth 2011–12
-1.8%
16.2%
14.1%
14.4%
4,805
7,2928,690
9,708
11,2851,003
972
905
889
2012
21,174
7،890
2010
16,387
6,725
2009
14,610
6,315
2008
10,919
5,520
594
2011
18,504
9,000
(1) The GWP is the total of accounted premiums. There may be double counting of reinsurance premiums accepted from other Saudi Arabian insurers or reinsurers
General
Health
P&S
The overall insurance Gross Written Premiums (GWP) increased by SR 2.7 Billion to reach SR 21.2 Billion(1) in 2012, compared to SR 18.5 Billion in 2011, which represents a growth rate of 14.4%.
Health insurance remained the biggest line of business in 2012. Its contribution to total GWP slightly increased from 52% in 2011 to 53% in 2012, while General insurance’s contribution to total business volume remains at 43% in 2012.
Health insurance accounted for SR 1.6 Billion of the SR 2.7 Billion increase of GWP, which represents a 59% contribution to the market’s GWP increase.
Protection and Savings insurance remained the smallest line of business accounting for 4% of total GWP, with a decrease in its written premiums by 1.8% in 2012.
In SR Million
2008 2009 2010 2011 2012
SR (M) % Total SR (M) % Total SR (M) % Total SR (M) % Total SR (M) % Total
Protection & Savings
594 5% 1,003 7% 972 6% 905 5% 889 4%
Health 4,805 44% 7,292 50% 8,690 53% 9,708 52% 11,285 53%
General 5,520 51% 6,315 43% 6,725 41% 7,890 43% 9,000 43%
Total 10,919 100% 14,610 100% 16,387 100% 18,504 100% 21,174 100%

The Saudi Insurance Market Report (2012) SAMA – General Insurance Supervision Department – 7
Insurance Penetration
Insurance penetration of total Gross Domestic Product (GDP) is defined as Gross Written Premiums divided by the total GDP.
Over the past five years, insurance penetration has been slightly diminishing at a compounded annual growth rate (CAGR) of 9%.
In 2012, insurance penetration decreased to 0.78%, down from 0.85% in 2011. This is mainly due to a continuous strong growth in total GDP (26% in 2012). The oil sector accounted for a significant part of this growth.
Insurance penetration of non-oil GDP is defined as Gross Written Premiums divided by non-oil GDP.
Insurance penetration of non-oil GDP has slightly decreased at an average annual growth rate of 1%.
Insurance penetration of non-oil GDP decreased 1.56%, from 2.02% in 2012.
0.07%
-1%
0.83%
0.66%
2012
1.56%
2011
2.02%
0.10%
1.98%
1.06%
0.86%
0.14%
0.99%
0.86%
2010
2.04%
2008
1.58%
0.09% 0.12%
1.10% 0.70%
0.80% 0.85%
2009
Insurance Penetration of Non-Oil GDP(2) (2008 to 2012, % of Non-Oil GDP)
0.52% 0.51% 0.45% 0.41%0.27%
1.03%
0.06% 0.07%
0.04%
0.45%
2008
0.40%
2009
0.61% 0.36%
0.03%
0.31%
2010
0.97%
0.33%
0.78%
2012
0.85%
2011
-9%
0.03%
(1) Total GDP of SR 1,786 SR 1,413 SR 1,690 SR 2,163 and SR 2.727 Billion in 2008, 2009, 2010, 2011 and 2012, respectively (2) Non-oil GDP SR 690 SR 738 SR 792 SR 919 SR and SR 1.353 Million in 2008, 2009, 2010, 2011 and 2012 respectively
Insurance Penetration of Total GDP(1) (2008 to 2012, % of Total GDP)
% Growth 2011–12
-8.3%
-25%
-8.2%
-8.9%
% Growth 2011–12
-23.3 %
-30 %
-22.8 %
-21.7%
Total P&S Insurance
Total General Insurance
Total Health Insurance
Total Health Insurance
Total General Insurance
Total P&S Insurance
The Saudi Insurance Market Report (2012) SAMA – General Insurance Supervision Department – 8
Insurance Density
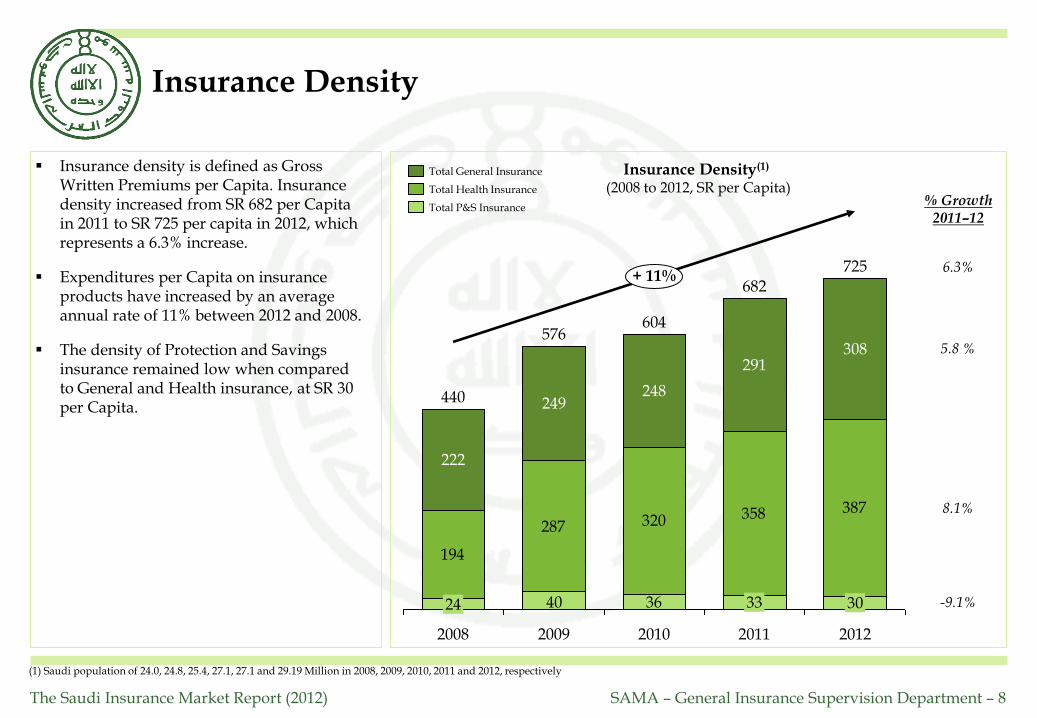
Insurance density is defined as Gross Written Premiums per Capita. Insurance density increased from SR 682 per Capita in 2011 to SR 725 per capita in 2012, which represents a 6.3% increase.
Expenditures per Capita on insurance products have increased by an average annual rate of 11% between 2012 and 2008.
The density of Protection and Savings insurance remained low when compared to General and Health insurance, at SR 30 per Capita.
194
287 320 358 387
3640
291
33
+ 11% 682
2011
308
30
725
2012
440 248
2009
222
24
576
249
2008
604
2010
Insurance Density(1) (2008 to 2012, SR per Capita)
(1) Saudi population of 24.0, 24.8, 25.4, 27.1, 27.1 and 29.19 Million in 2008, 2009, 2010, 2011 and 2012, respectively
% Growth 2011–12
5.8 %
-9.1%
6.3%
8.1%
Total P&S Insurance
Total General Insurance
Total Health Insurance

The Saudi Insurance Market Report (2012) SAMA – General Insurance Supervision Department – 9
Motor and Health insurance accounted for around 75.4% of total GWP in 2012.
Health insurance, which includes both compulsory and non-compulsory lines of business, remained the largest line of business in 2012, accounting for 53.3% of total GWP.
Motor compulsory and non-compulsory lines of business stood in second place with a 22.1% share of total GWP in 2012.
The third lines of business was Property/Fire with a 6.4% share of total GWP in 2012.
All lines of business grew in 2012 except Protection & Saving and Aviation.
Gross Written Premiums by Line of Business
(1) A&L stands for Accidents and Liabilities insurance throughout the document
In SR Million
2008 2009 2010 2011 2012 Growth
SR M % Total SR M % Total SR M % Total SR M % Total SR M % Total %
Aviation 139 1% 174 1% 305 2% 272 1% 67 0.3% -75.4%
Energy 208 2% 302 2% 329 2% 361 2% 385 1.8% 6.6%
A&L and Other
531 5% 544 4% 507 3% 632 3% 691 3.3% 9.4%
Marine 620 6% 525 4% 518 3% 634 3% 743 3.5% 17.2%
P&S 594 5% 1,003 7% 972 6% 905 5% 889 4.2% -1.8%
Engineering 682 6% 810 6% 869 5% 913 5% 1,077 5.1% 18.0%
Property/ Fire 798 7% 905 6% 959 6% 1,157 6% 1,348 6.4% 16.6%
Motor 2,542 23% 3,055 21% 3,239 20% 3,922 21% 4,689 22.1% 19.6%
Health 4,805 44% 7,292 50% 8,690 53% 9,708 52% 11,285 53.3% 16.2%
Total 10,919 100% 14,610 100% 16,387 100% 18,504 100% 21,174 100% 14.4%

The Saudi Insurance Market Report (2012) SAMA – General Insurance Supervision Department – 10
Gross Written Premiums by Line of Business (continued)
2,542
3,055
3,239
3,922
4,6891,157
1,348
959
1,077
972
1,003
361
329
302
208
67
174
139531
810 905
7,292
525
14,610
2009
594
544
620
682 798
4,805
2008
10,919
21,174
889 743
691 385
2011
18,504
9,708 11,285
913 905
634 632
272 304
2010
16,387
8,690
869
518 507
305
2012
+ 17%
Aviation
Health
Energy
Marine
A&L and Other
Motor
P&S
Property/ Fire
Engineering
Gross Written Premiums by Line of Business (2008 to 2012, SR Million)

The Saudi Insurance Market Report (2012) SAMA – General Insurance Supervision Department – 11
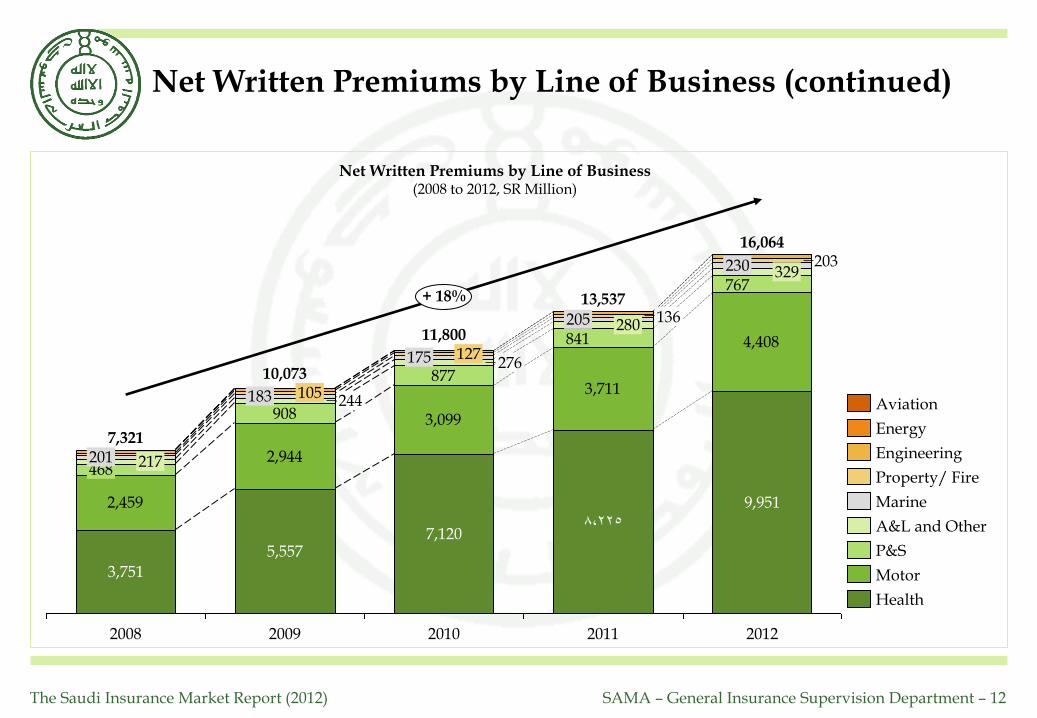
Net Written Premiums (NWP) is defined as the premiums retained by the insurance company, after the subtraction of the premiums ceded to local or international reinsurers from GWP by line of business.
Total NWP increased from SR 13.5 Billion in 2011 to SR 16.1 Billion in 2012, with a 18.7% increase.
Around 89.3% of total NWP in 2012 was generated by Motor and Health insurance.
Health insurance remained the largest line of business accounting for 61.9% of total NWP in 2012.
Motor insurance share of total NWP remained in second place. Motor insurance accounted for 27.4% of NWP in 2012.
Net Written Premiums by Line of Business
In SR Million
2008 2009 2010 2011 2012 Growth
SR M % Total SR M % Total SR M % Total SR M % Total SR M % Total %
Aviation 6 0% 1 0% 5 0% 1 0% 2 0.0% 92.8%
Energy 1 0% 5 0% 8 0% 7 0% 7 0.0% -1.2%
Engineering 122 2% 125 1% 114 1% 131 1% 166 1.0% 26.5%
Property/ Fire 95 1% 105 1% 127 1% 136 1% 203 1.3% 49.9%
Marine 201 3% 183 2% 175 1% 205 2% 230 1.4% 12.0%
A&L and Other
217 3% 244 2% 276 2% 280 2% 329 2.0% 17.6%
P&S 468 6% 908 9% 877 8% 841 6% 767 4.8% -8.8%
Motor 2,459 34% 2,944 29% 3,099 26% 3,711 27% 4,408 27.4% 18.8%
Health 3,751 51% 5,557 55% 7,120 61% 8,225 61% 9,951 61.9% 21.0%
Total 7,321 100% 10,073 100% 11,800 100% 13,537 100% 16,064 100% 18.7%
The Saudi Insurance Market Report (2012) SAMA – General Insurance Supervision Department – 12
Net Written Premiums by Line of Business (continued)
2,459
2,944
3,099
3,711
4,408
908
877
767
841
276
244
203
13613,537
8،225
280 205
2010 2011
+ 18%
16,064
329 230
2012
9,951
7,120
11,800
175 127
2009
10,073
5,557
183 105
2008
7,321
3,751
468 217 201
Net Written Premiums by Line of Business (2008 to 2012, SR Million)
Aviation
Health
Energy
Property/ Fire
Engineering
Motor
Marine
P&S
A&L and Other

The Saudi Insurance Market Report (2012) SAMA – General Insurance Supervision Department – 13
Retention Ratio by Line of Business
The retention ratio measures the written premiums retained by the insurance company. It is calculated by dividing the NWP by the GWP.
The overall retention ratio of insurance companies in the Saudi market increased to 75.8% in 2012 from 73.2% in 2011. This ratio is largely skewed due to the high retention ratio of Motor and Health insurance which collectively account for around 75.4% of total GWP. In 2012, the retention ratios for Motor and Health insurance were 94% and 88%, respectively.
The weighted average retention ratio of other insurance lines of business (i.e., excluding Motor and Health insurance) unchanged at 20% in 2012 compared to 2011
Notes:
- Newly licensed companies are required to adhere to a minimum retention ratio of 30% (as per Article 40 of the Implementing Regulations).
- Retention ratios are not shown for Protection & Savings insurance as the savings element of the contract must be retained in the Saudi Arabian company. Therefore retentions for Protection & Savings insurance are not directly comparable with other insurance lines of business.
96%
82%
54%
34%
13%
13%
2%
2%
2%
0%
12%
14%
32%
44%
85%
95%
2%
4%
A&L & Other
Motor 94%
48%
Health 88%
31%
20%
Property/ Fire 15%
Energy
Aviation
Engineering 15%
71%
Marine
Retention Ratios by Line of Business (2010 to 2012, % of GWP)
2011
2012
2010
Weighted average excluding Motor and Health insurance
Weighted average including all lines of business
The Saudi Insurance Market Report (2012) SAMA – General Insurance Supervision Department – 14
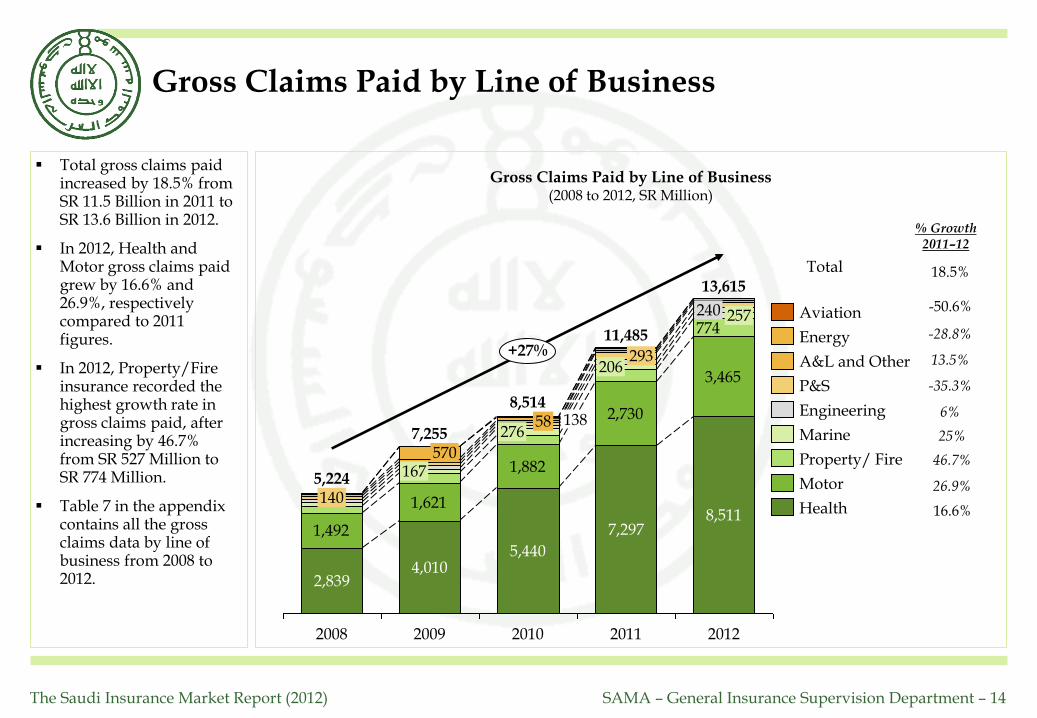
Total gross claims paid increased by 18.5% from SR 11.5 Billion in 2011 to SR 13.6 Billion in 2012.
In 2012, Health and Motor gross claims paid grew by 16.6% and 26.9%, respectively compared to 2011 figures.
In 2012, Property/Fire insurance recorded the highest growth rate in gross claims paid, after increasing by 46.7% from SR 527 Million to SR 774 Million.
Table 7 in the appendix contains all the gross claims data by line of business from 2008 to 2012.
Gross Claims Paid by Line of Business
Gross Claims Paid by Line of Business (2008 to 2012, SR Million)
1,492
1,621
1,882
2,730
3,465
774
138
13,615
8,511
257 240
2011
11,485
7,297
+27%
2012
206 293
2010
7,255
4,010
8,514
167
2008
5,440
5,224
2,839
140
276 58
2009
570
% Growth 2011–12
Total
A&L and Other
Energy
Aviation
Marine
P&S
Engineering
Health
Property/ Fire
Motor
18.5%
-50.6%
-28.8%
13.5%
-35.3%
6%
25%
46.7%
26.9%
16.6%

The Saudi Insurance Market Report (2012) SAMA – General Insurance Supervision Department – 15
General and Health Net Earned Premiums vs. Net Claims Incurred
Net Earned Premiums Vs. Net Claims Incurred (2008 to 2012, SR Million)
Net Earned Premiums (NEP) is equal to NWP minus the change in net unearned premiums reserve, while, Net Claims Incurred (NCI) is the total claims paid plus the change in outstanding and IBNR claims reserve.
The insurance market’s General and Health NEP totaled SR 14.1 Billion in 2012, up from SR 11.7 Billion in 2011, which represents a 21% increase.
General and Health Net Claims Incurred NCI increased by 30% for the year 2012 to reach SR 10.9 Billion.
The loss ratio is equal to NCI divided by NEP.
In 2012, General and Health net claims ratio increased to reach 77.6%.
14,077
11,668
9,616
7,966
5,983
10,926
8,382
6,554
5,649
4,088
+21%
2008 2012 2011
+30%
2010 2009
NEP
NCI
Loss Ratio (% NEP)
77.6% 71.8% 68.2% 70.9% 68.3%

The Saudi Insurance Market Report (2012) SAMA – General Insurance Supervision Department – 16
890
70
927 972
123
1,130
+9%
+ 76%
+22%
Net Result Investment Result Underwriting Result
2011
2012
Insurance Market Profitability (2011-2012, SR Million)
Insurance Market ROA/ ROE (2012, % of Net Result to Assets/ Equity)
9.6%
2.8%
ROA ROE
Insurance underwriting result is the outcome of subtracting all insurance related expenses from insurance related revenues.
The net result is equal to the sum of insurance operation revenues minus the sum of insurance operation expenses.
Investment result is the total of insurance operation investment income minus total of insurance operation investment expense.
In 2012, the insurance underwriting result totaled SR 1.13 Billion, which represents a 22% increase from 2011 figures.
Investment result increased to SR 123 Million in 2012 from SR 70 Million in 2011.
The insurance market’s net result increased to 972 Billion in 2012 from SR 890 Billion in 2011, which represents a 9% increase.
Return on Assets (ROA) is the ratio of net result to total assets. In 2012, insurance market’s ROA was 2.8%.
Return on Equity (ROE) is the ratio of net result to total equity. In 2012, Insurance market’s ROE was 9.6%.
Market Profitability
2012

The Saudi Insurance Market Report (2012) SAMA – General Insurance Supervision Department – 17
Balance Sheet - Policyholders’ Assets
At the end of 2012 insurance companies held SR 3.1 Billion in cash and cash equivalents in their policyholders’ accounts.
Investment accounted for the biggest share of policyholders’ assets, with a value of SR 6.3 Billion, followed by receivables (net) with a value of SR 6 Billion.
Total Policyholders’ (operation) assets amounted to SR 23.3 Billion.
Policyholders’ Assets (2012, SR Thousand)
* Other investments consists mainly of investments in funds related to saving products
Item Name General and
Health Insurance
Protection and Saving Insurance
Total Insurance
Cash and cash equivalents 2,993,629 140,439 3,134,068
Receivables, net 5,927,664 95,587 6,023,251
Reinsurance recoverable 5,284,150 23,616 5,307,766
Deferred policy acquisition cost 566,817 2,699 569,516
Prepaid expenses 540,266 594 540,860
Investments 3,711,262 2,542,661 6,253,923
Deposits at financial institutions 1,545,623 89,597 1,635,220
Loans - 6,868 6,868
Debt securities and fixed income 1,566,054 - 1,566,054
Shares (common, preferred) 313,960 - 313,960
Real estate 11,145 - 11,145
Investment in subsidiaries and affiliates 105,487 - 105,487
Other 168,993 2,446,196 2,615,190
Tangible assets 393,197 2,447 395,644
Intangible assets 16,220 - 16,220
Other policyholders assets 1,032,889 31,443 1,064,332 Total policyholders assets
20,466,094 2,839,486 23,305,580
The Saudi Insurance Market Report (2012) SAMA – General Insurance Supervision Department – 18
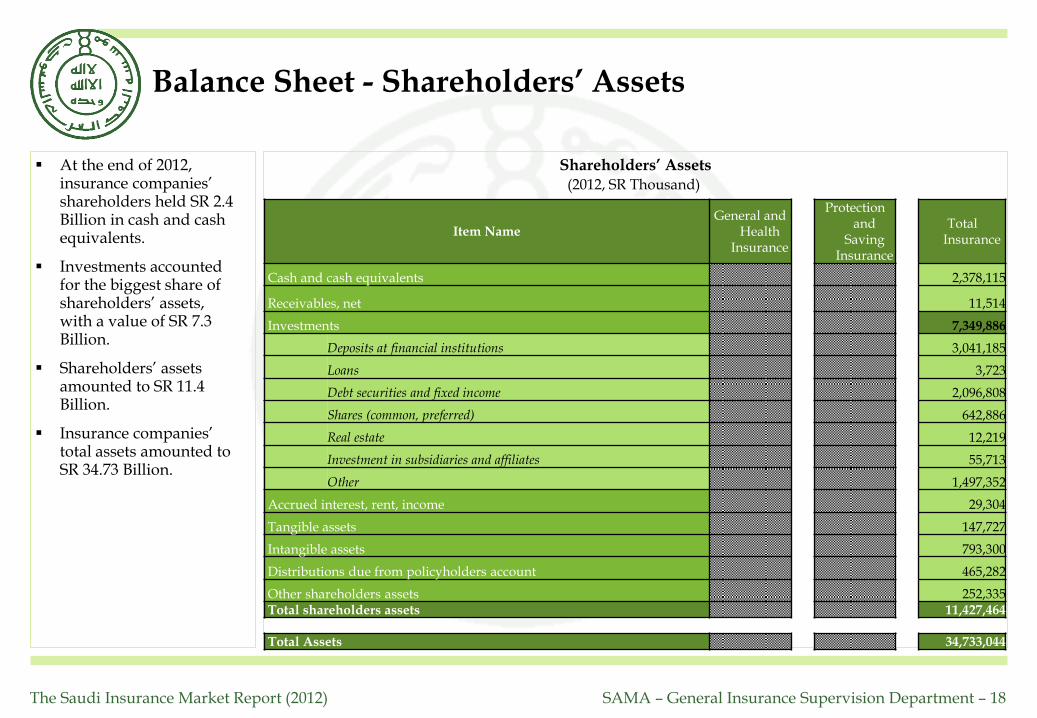
Balance Sheet - Shareholders’ Assets
At the end of 2012, insurance companies’ shareholders held SR 2.4 Billion in cash and cash equivalents.
Investments accounted for the biggest share of shareholders’ assets, with a value of SR 7.3 Billion.
Shareholders’ assets amounted to SR 11.4 Billion.
Insurance companies’ total assets amounted to SR 34.73 Billion.
Shareholders’ Assets (2012, SR Thousand)
Item Name General and
Health Insurance
Protection and
Saving Insurance
Total Insurance
Cash and cash equivalents 2,378,115
Receivables, net 11,514
Investments 7,349,886
Deposits at financial institutions 3,041,185
Loans 3,723
Debt securities and fixed income 2,096,808
Shares (common, preferred) 642,886
Real estate 12,219
Investment in subsidiaries and affiliates 55,713
Other 1,497,352
Accrued interest, rent, income 29,304
Tangible assets 147,727
Intangible assets 793,300
Distributions due from policyholders account 465,282
Other shareholders assets 252,335 Total shareholders assets 11,427,464
Total Assets 34,733,044

The Saudi Insurance Market Report (2012) SAMA – General Insurance Supervision Department – 19
Balance Sheet - Policyholders’ Liabilities and Equity
At the end of 2012, insurance companies held SR 15.8 Billion in technical reserves, which consist of unearned premiums, outstanding claims, IBNR and adjustment expense reserves.
Mathematical reserves amounted to SR 1.9 Billion.
Policyholders’ liabilities and equity amounted to SR 23.3 Billion.
Policyholders’ Liabilities And Equity (2012, SR Thousand)
Item Name General and
Health Insurance
Protection and
Saving Insurance
Total Insurance
Policyholders payables 702,216 31,185 733,401
Reinsurance balances payable 1,126,653 41,171 1,167,824
Technical reserves 15,497,337 79,775 15,577,112
Unearned premium 9,331,566 25,446 9,357,012
Outstanding claims, IBNR and adjustment expenses 6,165,771 54,329 6,220,100
Mathematical reserves - 1,875,305 1,875,305
Other reserves 1,343,077 10,942 1,354,019
Unearned reinsurance commissions 299,841 5,860 305,701
Accrued expense and deferred income 458,474 19,416 477,891
Declared dividend payable 85,596 450 86,046
Distribution due to shareholders account 444,379 13,374 457,753
Other policyholders liabilities 360,774 16,417 377,190
Total policyholders liabilities 20,318,346 2,093,895 22,412,241
Accumulated surplus 147,748 745,591 893,338
Total policyholders liabilities & equity 20,466,094 2,839,486 23,305,580
The Saudi Insurance Market Report (2012) SAMA – General Insurance Supervision Department – 20
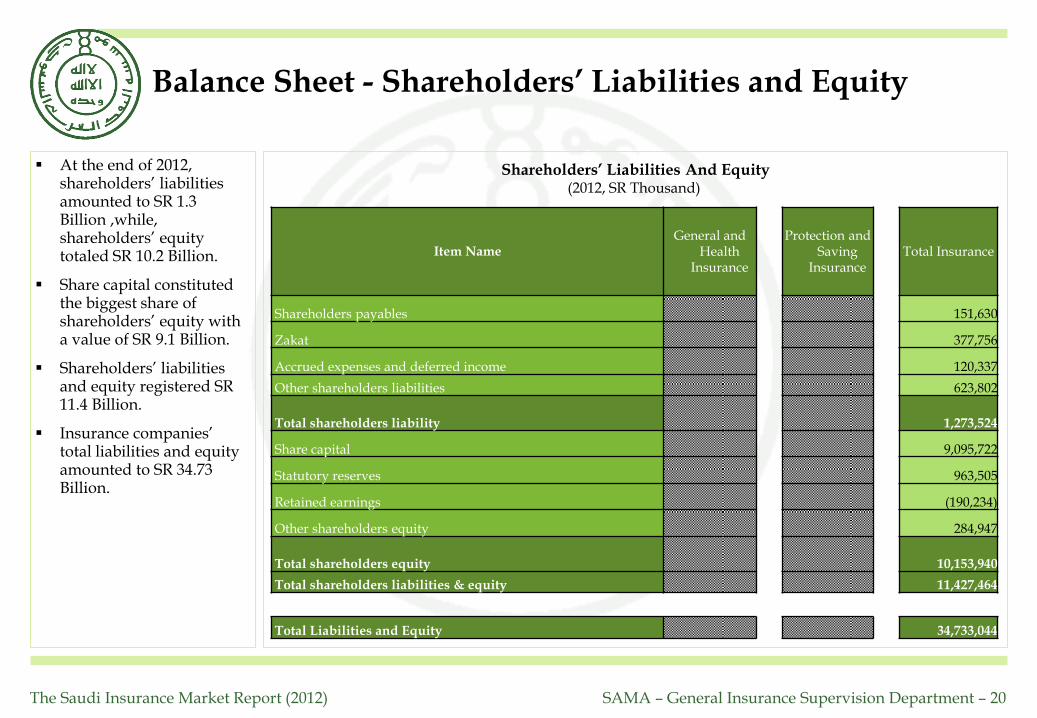
Balance Sheet - Shareholders’ Liabilities and Equity
At the end of 2012, shareholders’ liabilities amounted to SR 1.3 Billion ,while, shareholders’ equity totaled SR 10.2 Billion.
Share capital constituted the biggest share of shareholders’ equity with a value of SR 9.1 Billion.
Shareholders’ liabilities and equity registered SR 11.4 Billion.
Insurance companies’ total liabilities and equity amounted to SR 34.73 Billion.
Shareholders’ Liabilities And Equity (2012, SR Thousand)
Item Name General and
Health Insurance
Protection and Saving
Insurance Total Insurance
Shareholders payables 151,630
Zakat 377,756
Accrued expenses and deferred income 120,337
Other shareholders liabilities 623,802
Total shareholders liability 1,273,524
Share capital 9,095,722
Statutory reserves 963,505
Retained earnings (190,234)
Other shareholders equity 284,947
Total shareholders equity 10,153,940
Total shareholders liabilities & equity 11,427,464
Total Liabilities and Equity 34,733,044

21
Insurance Market Performance - By Line of Business
The Saudi Insurance Market Report (2012) SAMA – General Insurance Supervision Department – 22
Health Insurance
11,285
9,951
9,083
7,391
Health
NEP
NWP
GWP
NCI 66.8%
61%
61.9%
53.3%
% Total
Retention Ratio Loss Ratio
88.2% 81.4%
Health Insurance Performance (2012, SR Million)
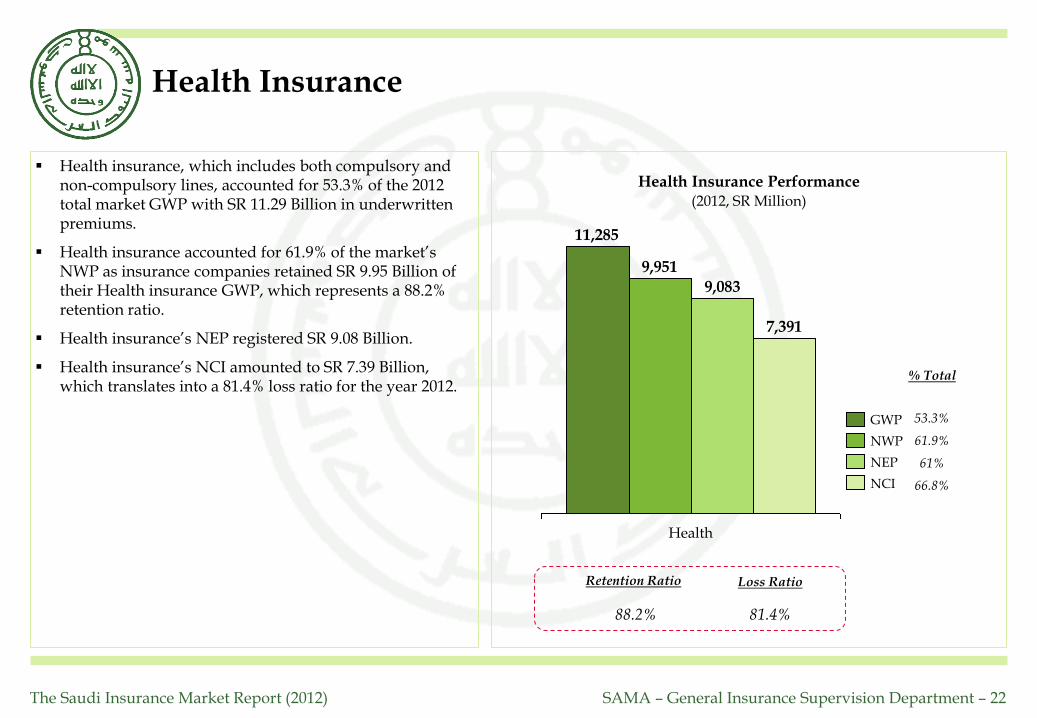
Health insurance, which includes both compulsory and non-compulsory lines, accounted for 53.3% of the 2012 total market GWP with SR 11.29 Billion in underwritten premiums.
Health insurance accounted for 61.9% of the market’s NWP as insurance companies retained SR 9.95 Billion of their Health insurance GWP, which represents a 88.2% retention ratio.
Health insurance’s NEP registered SR 9.08 Billion.
Health insurance’s NCI amounted to SR 7.39 Billion, which translates into a 81.4% loss ratio for the year 2012.
The Saudi Insurance Market Report (2012) SAMA – General Insurance Supervision Department – 23
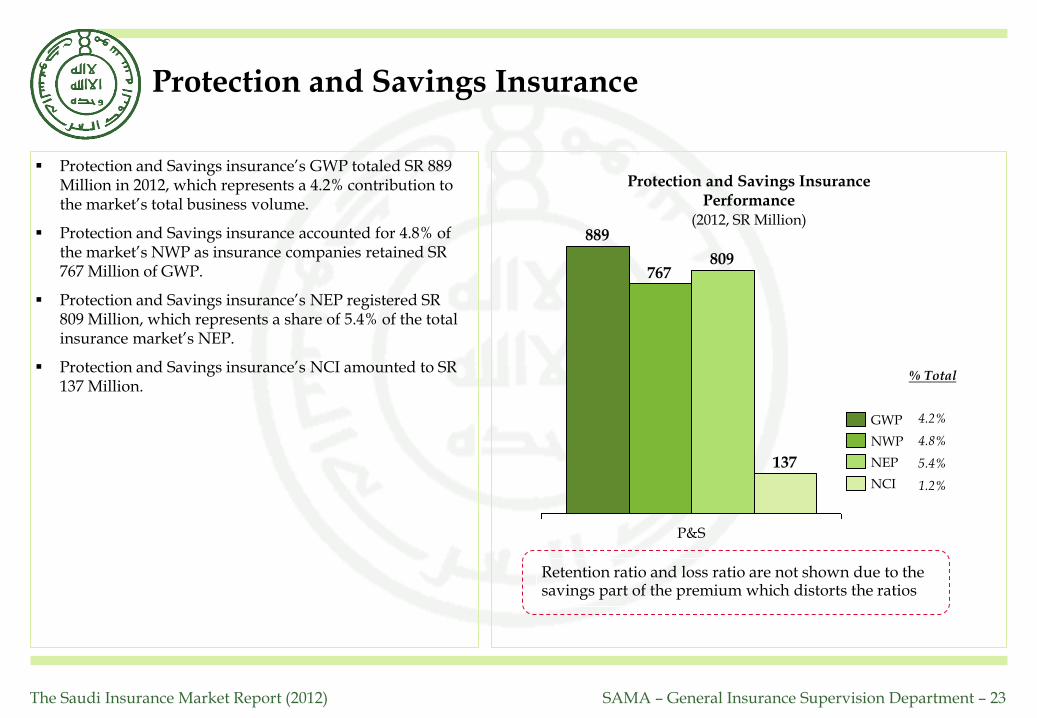
Retention ratio and loss ratio are not shown due to the savings part of the premium which distorts the ratios
Protection and Savings Insurance
889
767809
137
P&S
NCI
NEP
NWP
GWP
1.2%
5.4%
4.8%
4.2%
% Total
Protection and Savings Insurance Performance
(2012, SR Million)
Protection and Savings insurance’s GWP totaled SR 889 Million in 2012, which represents a 4.2% contribution to the market’s total business volume.
Protection and Savings insurance accounted for 4.8% of the market’s NWP as insurance companies retained SR 767 Million of GWP.
Protection and Savings insurance’s NEP registered SR 809 Million, which represents a share of 5.4% of the total insurance market’s NEP.
Protection and Savings insurance’s NCI amounted to SR 137 Million.
The Saudi Insurance Market Report (2012) SAMA – General Insurance Supervision Department – 24
Motor Insurance
4,6894,408
4,100
3,218
Motor
NCI
NEP
NWP
GWP
29.1%
27.5%
27.4%
22.1%
% Total
Retention Ratio Loss Ratio
94% 78.5%
Motor Insurance Performance (2012, SR Million)
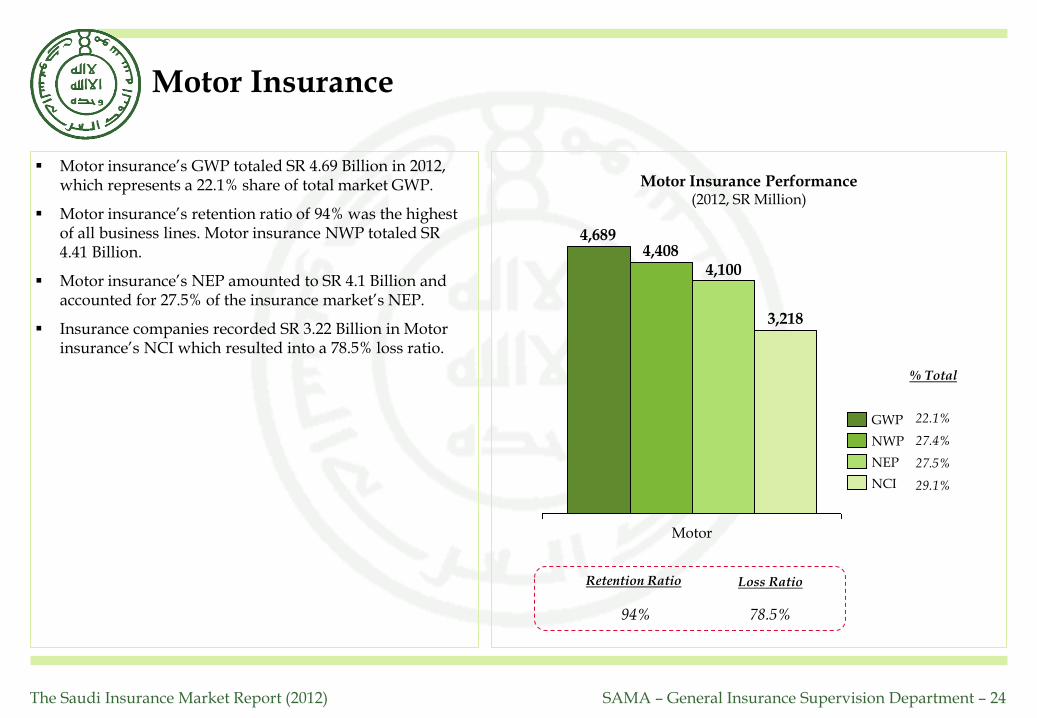
Motor insurance’s GWP totaled SR 4.69 Billion in 2012, which represents a 22.1% share of total market GWP.
Motor insurance’s retention ratio of 94% was the highest of all business lines. Motor insurance NWP totaled SR 4.41 Billion.
Motor insurance’s NEP amounted to SR 4.1 Billion and accounted for 27.5% of the insurance market’s NEP.
Insurance companies recorded SR 3.22 Billion in Motor insurance’s NCI which resulted into a 78.5% loss ratio.
The Saudi Insurance Market Report (2012) SAMA – General Insurance Supervision Department – 25
Property/ Fire Insurance
1,348
203 18191
Property/ Fire
GWP
NWP
NEP
NCI 0.8%
1.2%
1.3%
6.4%
% Total
Retention Ratio Loss Ratio
15.1% 50.5%
Property/ Fire Insurance Performance (2012, SR Million)
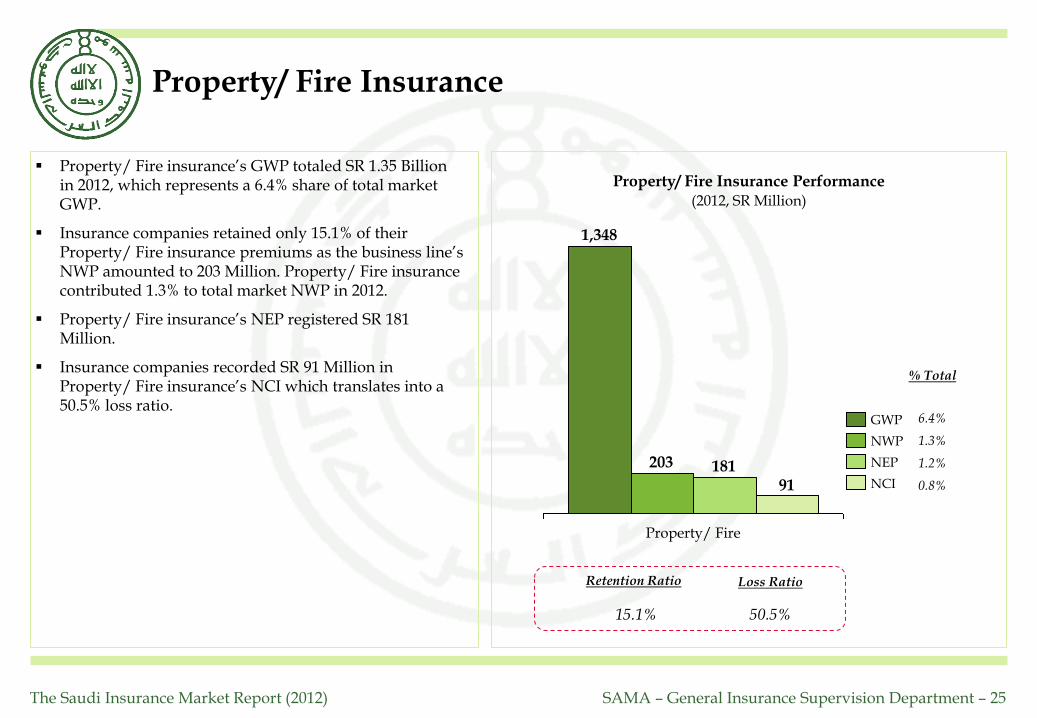
Property/ Fire insurance’s GWP totaled SR 1.35 Billion in 2012, which represents a 6.4% share of total market GWP.
Insurance companies retained only 15.1% of their Property/ Fire insurance premiums as the business line’s NWP amounted to 203 Million. Property/ Fire insurance contributed 1.3% to total market NWP in 2012.
Property/ Fire insurance’s NEP registered SR 181 Million.
Insurance companies recorded SR 91 Million in Property/ Fire insurance’s NCI which translates into a 50.5% loss ratio.
The Saudi Insurance Market Report (2012) SAMA – General Insurance Supervision Department – 26
Engineering Insurance
1,077
166 154
48
Engineering
NCI
NEP
NWP
GWP
0.4%
1.1%
1%
5.1%
% Total
Retention Ratio Loss Ratio
15.4% 31%
Engineering Insurance Performance (2012, SR Million)
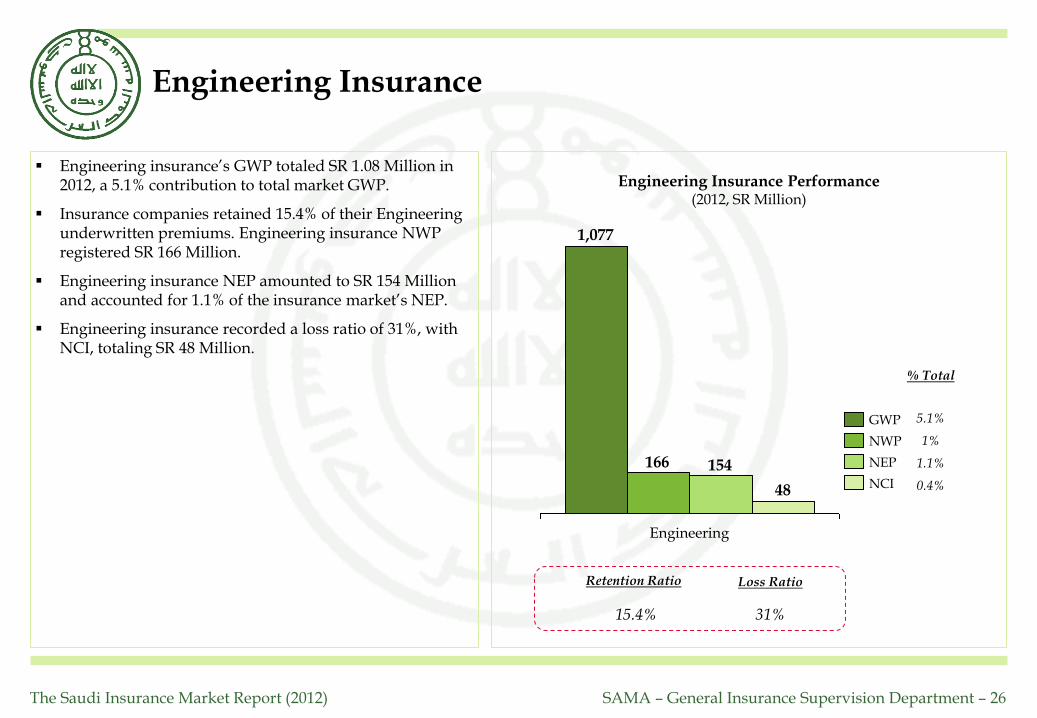
Engineering insurance’s GWP totaled SR 1.08 Million in 2012, a 5.1% contribution to total market GWP.
Insurance companies retained 15.4% of their Engineering underwritten premiums. Engineering insurance NWP registered SR 166 Million.
Engineering insurance NEP amounted to SR 154 Million and accounted for 1.1% of the insurance market’s NEP.
Engineering insurance recorded a loss ratio of 31%, with NCI, totaling SR 48 Million.
The Saudi Insurance Market Report (2012) SAMA – General Insurance Supervision Department – 27
A&L and Other* Insurance
691
329 324
82
A&L and Other
NCI
NEP
NWP
GWP
0.7%
2.2%
2%
3.3%
% Total
Retention Ratio Loss Ratio
47.6% 25.3%
A&L and Other Performance (2012, SR Million)
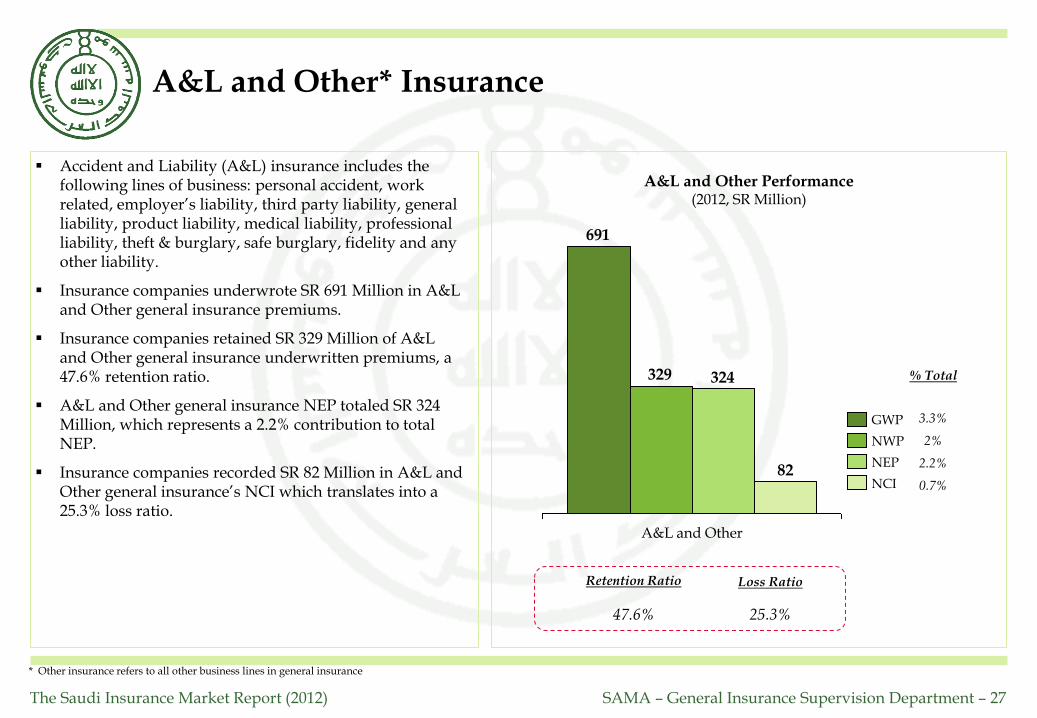
Accident and Liability (A&L) insurance includes the following lines of business: personal accident, work related, employer’s liability, third party liability, general liability, product liability, medical liability, professional liability, theft & burglary, safe burglary, fidelity and any other liability.
Insurance companies underwrote SR 691 Million in A&L and Other general insurance premiums.
Insurance companies retained SR 329 Million of A&L and Other general insurance underwritten premiums, a 47.6% retention ratio.
A&L and Other general insurance NEP totaled SR 324 Million, which represents a 2.2% contribution to total NEP.
Insurance companies recorded SR 82 Million in A&L and Other general insurance’s NCI which translates into a 25.3% loss ratio.
* Other insurance refers to all other business lines in general insurance

The Saudi Insurance Market Report (2012) SAMA – General Insurance Supervision Department – 28
Marine Insurance
743
230 226
94
Marine
NCI
NEP
NWP
GWP
0.9%
1.5%
1.4%
3.5%
% Total
Retention Ratio Loss Ratio
30.9% 41.8%
Marine Insurance Performance (2012, SR Million)
The Marine insurance line of business includes both marine cargo and marine hull insurance.
Marine insurance GWP totaled SR 743 Million in 2012, which represents a 3.5% contribution to total market GWP.
Insurance companies retained 30.9% of their Marine insurance underwritten premiums as the business line’s NWP amounted to SR 230 Million.
Marine insurance’s NEP recorded SR 226 Million, which represents a 1.5% share of total NEP for 2012.
Marine insurance’s NCI amounted to SR 94 Million. This resulted in a loss ratio of 41.8%.
The Saudi Insurance Market Report (2012) SAMA – General Insurance Supervision Department – 29
Energy Insurance
385
7 7 1
Energy
NEP
NWP
NCI
GWP
0.01%
0.05%
0.05%
1.8%
% Total
Retention Ratio Loss Ratio
1.9% 9.3%
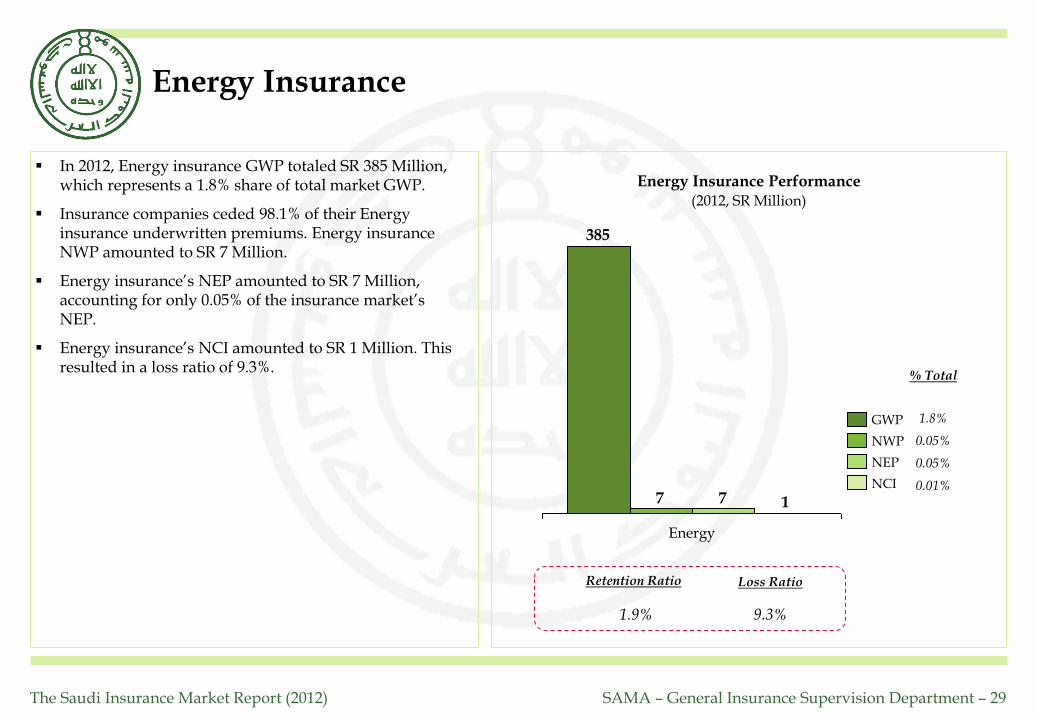
Energy Insurance Performance (2012, SR Million)
In 2012, Energy insurance GWP totaled SR 385 Million, which represents a 1.8% share of total market GWP.
Insurance companies ceded 98.1% of their Energy insurance underwritten premiums. Energy insurance NWP amounted to SR 7 Million.
Energy insurance’s NEP amounted to SR 7 Million, accounting for only 0.05% of the insurance market’s NEP.
Energy insurance’s NCI amounted to SR 1 Million. This resulted in a loss ratio of 9.3%.

The Saudi Insurance Market Report (2012) SAMA – General Insurance Supervision Department – 30
Aviation Insurance
67
2 2 0
Aviation
NCI
NEP
NWP
GWP
0.01%
0.01%
0.01%
0.3%
% Total
Retention Ratio Loss Ratio
3.6% 22%
Aviation Insurance Performance (2012, SR Million)
Aviation insurance GWP reached SR 67 Million in 2012, a 0.3% contribution to total market GWP.
NWP for Aviation insurance reached SR 2.4 Million resulting in a retention ratio of 3.6%.
Aviation insurance’s NEP totaled SR 1.9 Million and NCI amounted to SR 15 Million resulting in a loss ratio of 22% for 2012.

31
Other Market Indicators
The Saudi Insurance Market Report (2012) SAMA – General Insurance Supervision Department – 32
Commissions Incurred by Line of Business
Commissions Incurred by Line of Business (2008 to 2012, SR Million)
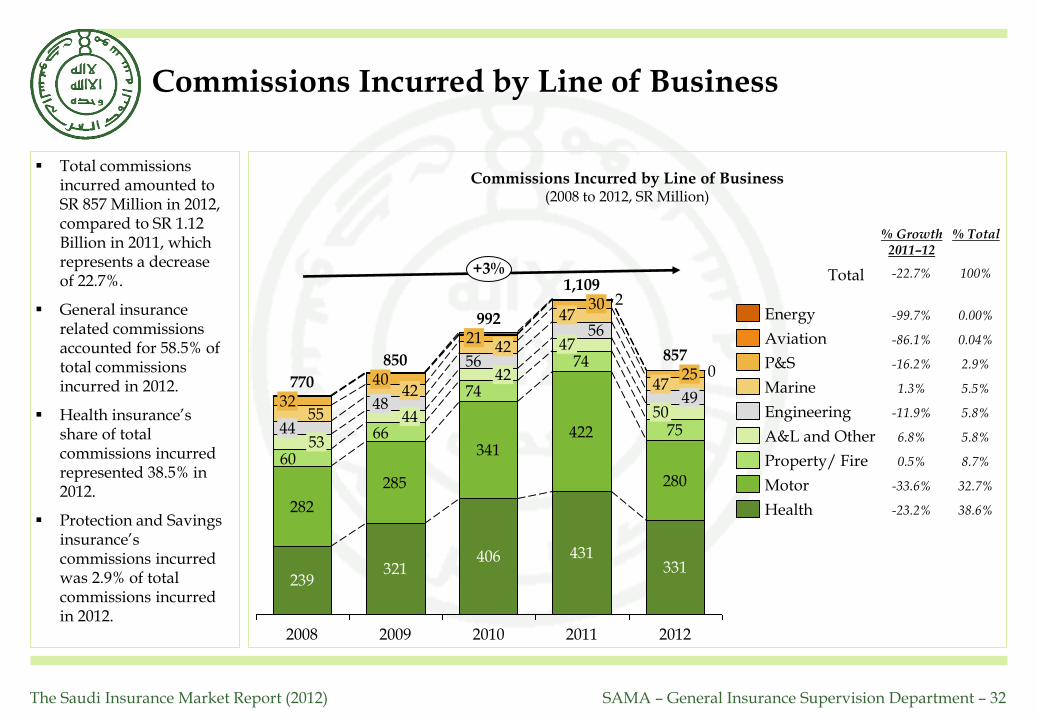
Total commissions incurred amounted to SR 857 Million in 2012, compared to SR 1.12 Billion in 2011, which represents a decrease of 22.7%.
General insurance related commissions accounted for 58.5% of total commissions incurred in 2012.
Health insurance’s share of total commissions incurred represented 38.5% in 2012.
Protection and Savings insurance’s commissions incurred was 2.9% of total commissions incurred in 2012.
282
285
341422
280
74
75
74
66
60
56
56
55
0
2
331
49 50
+3%
2011
25
1,109
431
770
239
53 44
32
992
47
2010
42
42 21
2009
44
47 30
406
2012
857
42 48
40
2008
47
321
850
% Growth 2011–12
-99.7%
-16.2%
6.8%
-86.1%
1.3%
-11.9%
0.5%
-33.6%
-23.2%
Energy
Health
Aviation
Marine
P&S
Motor
Engineering
Property/ Fire
A&L and Other
38.6%
32.7%
8.7%
5.8%
5.8%
5.5%
2.9%
0.04%
0.00%
% Total
Total -22.7% 100%
The Saudi Insurance Market Report (2012) SAMA – General Insurance Supervision Department – 33
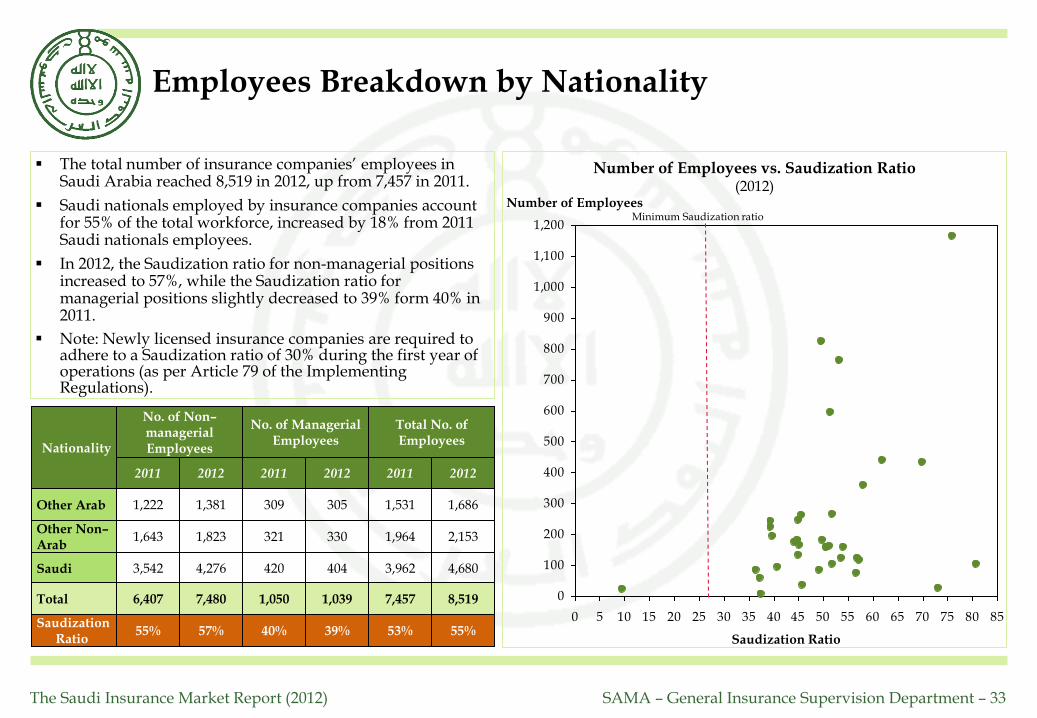
The total number of insurance companies’ employees in Saudi Arabia reached 8,519 in 2012, up from 7,457 in 2011.
Saudi nationals employed by insurance companies account for 55% of the total workforce, increased by 18% from 2011 Saudi nationals employees.
In 2012, the Saudization ratio for non-managerial positions increased to 57%, while the Saudization ratio for managerial positions slightly decreased to 39% form 40% in 2011.
Note: Newly licensed insurance companies are required to adhere to a Saudization ratio of 30% during the first year of operations (as per Article 79 of the Implementing Regulations).
Employees Breakdown by Nationality
Number of Employees vs. Saudization Ratio (2012)
0
100
200
300
400
500
600
700
800
900
1,000
1,100
1,200
0 5 10 15 20 25 30 35 40 45 50 55 60 65 70 75 80 85
Saudization Ratio
Number of Employees Minimum Saudization ratio
Nationality
No. of Managerial Employees
Total No. of Employees
No. of Non–managerial Employees
2011 2012 2011 2012 2011 2012
Other Arab
Other Non–Arab
Saudi
Saudization Ratio
Total
1,222 1,381 309 305 1,531 1,686
1,643 1,823 321 330 1,964 2,153
3,542 4,276 420 404 3,962 4,680
55% 57% 40% 39% 53% 55%
6,407 7,480 1,050 1,039 7,457 8,519
The Saudi Insurance Market Report (2012) SAMA – General Insurance Supervision Department – 34
Insurance Market Structure
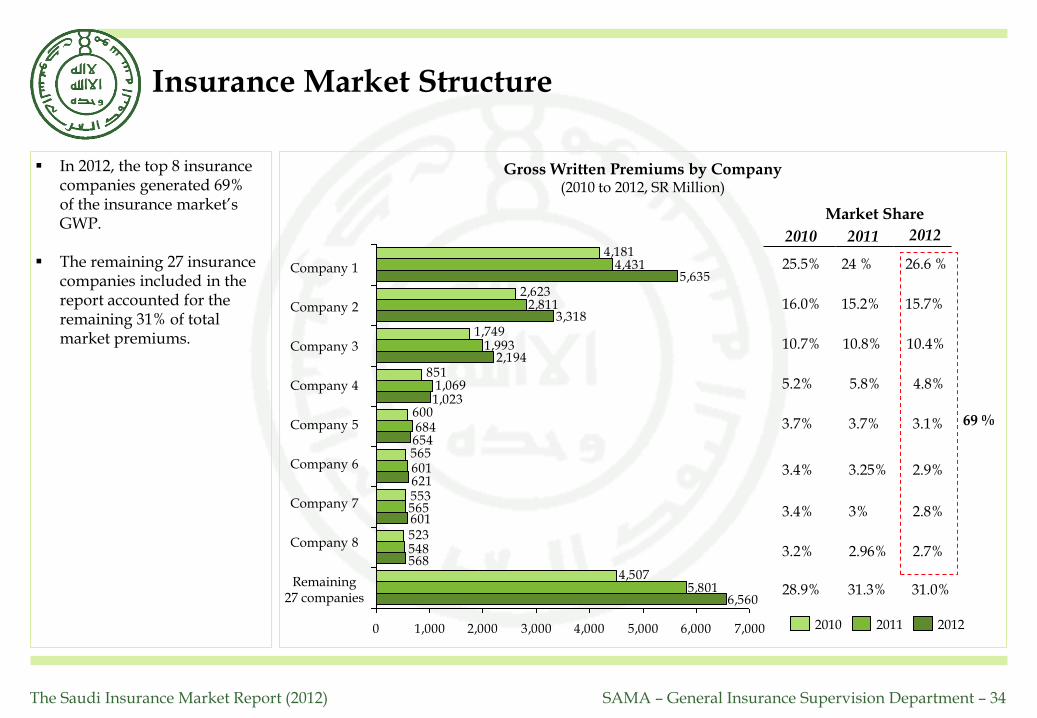
In 2012, the top 8 insurance companies generated 69% of the insurance market’s GWP.
The remaining 27 insurance companies included in the report accounted for the remaining 31% of total market premiums.
Gross Written Premiums by Company (2010 to 2012, SR Million)
4,507
523
553
565
600
851
1,749
2,623
4,181
5,801
548
565
601
684
1,069
1,993
2,811
4,431
6,560
568
601
621
654
1,023
2,194
3,318
5,635
0 1,000 2,000 3,000 4,000 5,000 6,000 7,000 2010 2011 2012
Remaining 27 companies
Market Share
69 %
2010 2011 2012
Company 8
Company 7
Company 6
Company 5
Company 4
Company 3
Company 2
Company 1 25.5%
16.0%
10.7%
5.2%
3.7%
3.4%
3.4%
3.2%
28.9%
24 %
15.2%
10.8%
5.8%
3.7%
3.25%
3%
2.96%
31.3%
26.6 %
15.7%
10.4%
4.8%
3.1%
2.9%
2.8%
2.7%
31.0%

The Saudi Insurance Market Report (2012) SAMA – General Insurance Supervision Department – 35
Capitalization of Insurance Companies
Insurance companies’ equity increased form SR 9.2 Billion at the end of 2011 up to SR 10.15 Billion at the end of 2012, with 25 companies exceeding SR 100 Million.
The largest company by total equity is Tawuniya, with total equity of SR 2.14 Billion at the end of 2012 following an increase from SR 2.05 Billion at the end of 2011.
Note: the Law on Supervision of Cooperative Insurance Companies stipulates a minimum capital of SR 100 Million for insurance companies and SR 200 Million for companies that will undertake insurance and reinsurance activities.
Insurance Companies’ Equity vs. NWP (2012, SR Million)
Equity
2,200
0
NWP
2,200
2,400
4,400
4,600
200
400
1,100 1,000 600 500
600
300 200 100 0 -100 400
Number of Companies
Shareholders’ Equity (2012)
Up to SR 50 Million 5
SR 50 M to SR 100 Million 5
SR 100 M to SR 150 Million 5
SR 150 M to SR 200 Million 7
SR 200 M to SR 500 Million 9
More that SR 500 Million 4

36
Appendix: Data Tables
The Saudi Insurance Market Report (2012) SAMA – General Insurance Supervision Department – 37
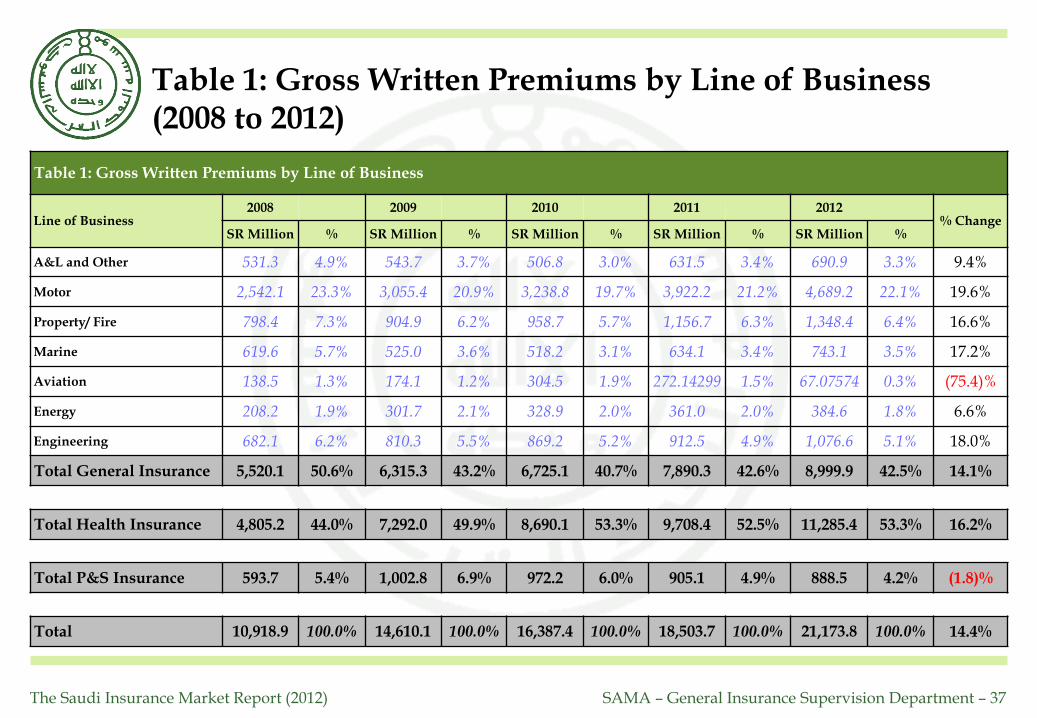
Table 1: Gross Written Premiums by Line of Business (2008 to 2012)
Table 1: Gross Written Premiums by Line of Business
Line of Business 2008 2009 2010 2011 2012
% Change SR Million % SR Million % SR Million % SR Million % SR Million %
A&L and Other 531.3 4.9% 543.7 3.7% 506.8 3.0% 631.5 3.4% 690.9 3.3% 9.4%
Motor 2,542.1 23.3% 3,055.4 20.9% 3,238.8 19.7% 3,922.2 21.2% 4,689.2 22.1% 19.6%
Property/ Fire 798.4 7.3% 904.9 6.2% 958.7 5.7% 1,156.7 6.3% 1,348.4 6.4% 16.6%
Marine 619.6 5.7% 525.0 3.6% 518.2 3.1% 634.1 3.4% 743.1 3.5% 17.2%
Aviation 138.5 1.3% 174.1 1.2% 304.5 1.9% 272.14299 1.5% 67.07574 0.3% (75.4)%
Energy 208.2 1.9% 301.7 2.1% 328.9 2.0% 361.0 2.0% 384.6 1.8% 6.6%
Engineering 682.1 6.2% 810.3 5.5% 869.2 5.2% 912.5 4.9% 1,076.6 5.1% 18.0%
Total General Insurance 5,520.1 50.6% 6,315.3 43.2% 6,725.1 40.7% 7,890.3 42.6% 8,999.9 42.5% 14.1%
Total Health Insurance 4,805.2 44.0% 7,292.0 49.9% 8,690.1 53.3% 9,708.4 52.5% 11,285.4 53.3% 16.2%
Total P&S Insurance 593.7 5.4% 1,002.8 6.9% 972.2 6.0% 905.1 4.9% 888.5 4.2% (1.8)%
Total 10,918.9 100.0% 14,610.1 100.0% 16,387.4 100.0% 18,503.7 100.0% 21,173.8 100.0% 14.4%
The Saudi Insurance Market Report (2012) SAMA – General Insurance Supervision Department – 38
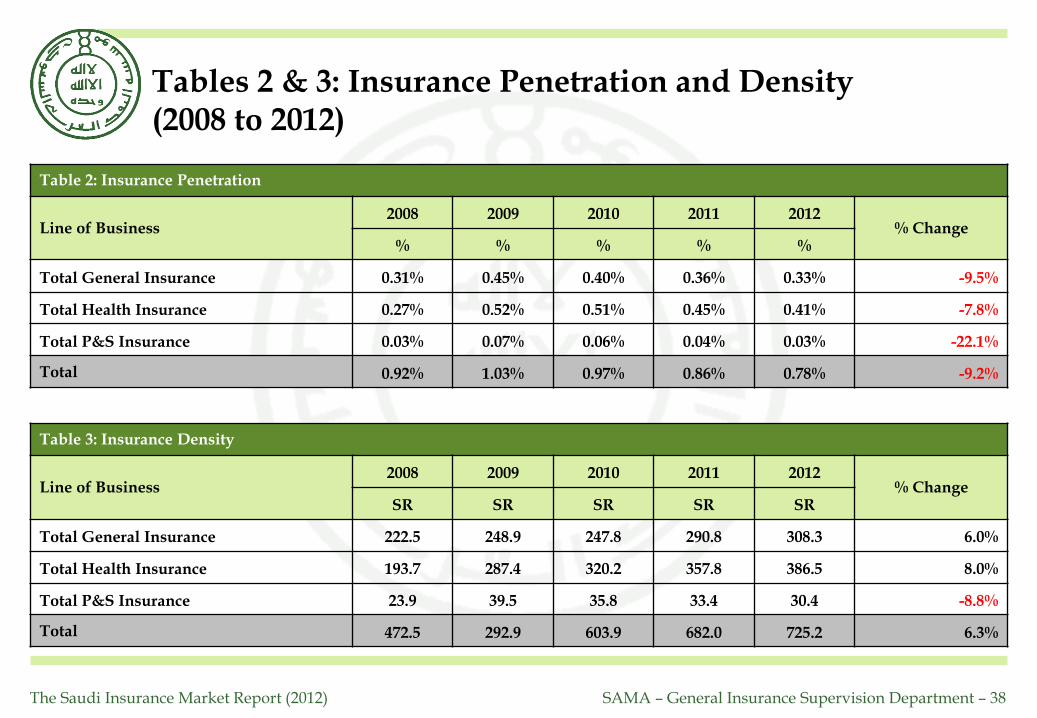
Tables 2 & 3: Insurance Penetration and Density (2008 to 2012)
Table 2: Insurance Penetration
Line of Business 2008 2009 2010 2011 2012
% Change % % % % %
Total General Insurance 0.31% 0.45% 0.40% 0.36% 0.33% -9.5%
Total Health Insurance 0.27% 0.52% 0.51% 0.45% 0.41% -7.8%
Total P&S Insurance 0.03% 0.07% 0.06% 0.04% 0.03% -22.1%
Total 0.92% 1.03% 0.97% 0.86% 0.78% -9.2%
Table 3: Insurance Density
Line of Business 2008 2009 2010 2011 2012
% Change SR SR SR SR SR
Total General Insurance 222.5 248.9 247.8 290.8 308.3 6.0%
Total Health Insurance 193.7 287.4 320.2 357.8 386.5 8.0%
Total P&S Insurance 23.9 39.5 35.8 33.4 30.4 -8.8%
Total 472.5 292.9 603.9 682.0 725.2 6.3%

The Saudi Insurance Market Report (2012) SAMA – General Insurance Supervision Department – 39
Table 4: Net Written Premiums by Line of Business (2008 to 2012)
Table 4: Net Written Premiums by Line of Business
Line of Business 2008 2009 2010 2011 2012
% Change SR Million % SR Million % SR Million % SR Million % SR Million %
A&L and Other 217.3 3.0% 244.3 2.4% 275.9 2.3% 279.8 2.1% 329.0 2.0% 17.6%
Motor 2,458.7 33.6% 2,944.1 29.2% 3,098.8 26.1% 3,710.6 27.4% 4,408.2 27.4% 18.8%
Property/ Fire 95.4 1.3% 105.1 1.0% 126.5 1.0% 135.5 1.0% 203.2 1.3% 49.9%
Marine 201.5 2.8% 183.2 1.8% 175.4 1.5% 204.9 1.5% 229.5 1.4% 12.0%
Aviation 5.5 0.1% 1.1 0.0% 4.8 0.0% 1.2 0.01% 2.395449 0.01% 92.8%
Energy 0.9 0.0% 5.2 0.1% 7.6 0.1% 7.4 0.1% 7.3 0.0% (1.2)%
Engineering 122.2 1.7% 125.3 1.2% 113.9 0.9% 131.2 1.0% 165.9 1.0% 26.5%
Total General Insurance
3,101.6 42.4% 3,608.4 35.8% 3,802.9 31.9% 4,470.7 33.0% 5,345.5 33.3% 19.6%
Total Health Insurance
3,750.9 51.2% 5,556.9 55.2% 7,120.0 60.6% 8,225.1 60.8% 9,951.3 61.9% 21.0%
Total P&S Insurance 468.2 6.4% 908.0 9.0% 876.8 7.5% 841.2 6.2% 767.0 4.8% (8.8)%
Total 7,320.6 100.0% 10,073.2 100.0% 11,799.7 100.0% 13,537.0 100.0% 16,063.8 100.0% 18.7%
The Saudi Insurance Market Report (2012) SAMA – General Insurance Supervision Department – 40
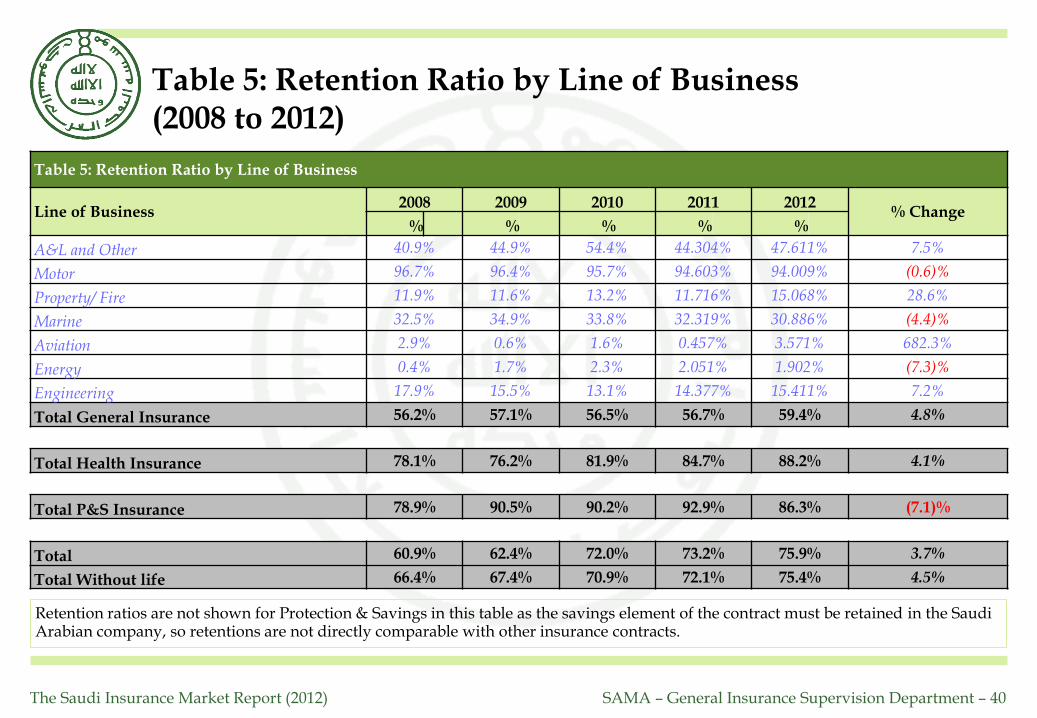
Table 5: Retention Ratio by Line of Business (2008 to 2012)
Retention ratios are not shown for Protection & Savings in this table as the savings element of the contract must be retained in the Saudi Arabian company, so retentions are not directly comparable with other insurance contracts.
Table 5: Retention Ratio by Line of Business
Line of Business 2008 2009 2010 2011 2012
% Change % % % % %
A&L and Other 40.9% 44.9% 54.4% 44.304% 47.611% 7.5%
Motor 96.7% 96.4% 95.7% 94.603% 94.009% (0.6)%
Property/ Fire 11.9% 11.6% 13.2% 11.716% 15.068% 28.6%
Marine 32.5% 34.9% 33.8% 32.319% 30.886% (4.4)%
Aviation 2.9% 0.6% 1.6% 0.457% 3.571% 682.3%
Energy 0.4% 1.7% 2.3% 2.051% 1.902% (7.3)%
Engineering 17.9% 15.5% 13.1% 14.377% 15.411% 7.2%
Total General Insurance 56.2% 57.1% 56.5% 56.7% 59.4% 4.8%
Total Health Insurance 78.1% 76.2% 81.9% 84.7% 88.2% 4.1%
Total P&S Insurance 78.9% 90.5% 90.2% 92.9% 86.3% (7.1)%
Total 60.9% 62.4% 72.0% 73.2% 75.9% 3.7%
Total Without life 66.4% 67.4% 70.9% 72.1% 75.4% 4.5%

The Saudi Insurance Market Report (2012) SAMA – General Insurance Supervision Department – 41
Table 6: Commissions Incurred by Line of Business (2008 to 2012)
Table 6: Commissions Incurred by Line of Business
Line of Business 2008 2009 2010 2011 2012
% Change SR Million % SR Million % SR Million % SR Million % SR Million %
A&L and Other 52.8 6.9% 44.1 5.2% 41.8 4.1% 46.5 4.2% 49.7 5.8% 6.8%
Motor 281.6 36.6% 285.1 33.5% 341.4 34.5% 421.6 38.0% 280.1 32.7% (33.6)%
Property/ Fire 59.5 7.7% 66.4 7.8% 74.1 7.2% 74.4 6.7% 74.7 8.7% 0.5%
Marine 54.9 7.1% 42.3 5.0% 41.6 4.1% 46.8 4.2% 47.4 5.5% 1.3%
Aviation 2.4 0.3% 2.5 0.3% 3.2 0.3% 2.4 0.2% 0.3 0.0% (86.1)%
Energy 3.0 0.4% 0.6 0.1% 7.0 0.7% 0.7 0.1% 0.0 0.0% (99.7)%
Engineering 44.3 5.8% 48.0 5.6% 56.3 5.5% 56.0 5.1% 49.4 5.8% (11.9)%
Total General Insurance
498.7 64.8% 488.9 57.5% 565.5 56.6% 648.4 58.5% 501.7 58.5% (22.6)%
Total Health Insurance
238.9 31.0% 320.7 37.7% 405.9 41.2% 430.7 38.8% 330.6 38.6% (23.2)%
Total P&S Insurance 32.0 4.2% 40.4 4.7% 20.9 2.1% 29.6 2.7% 24.8 2.9% (16.2)%
Total 769.6 100.0% 850.0 100.0% 992.2 100.0% 1,108.7 100.0% 857.1 100.0% (22.7)%
The Saudi Insurance Market Report (2012) SAMA – General Insurance Supervision Department – 42
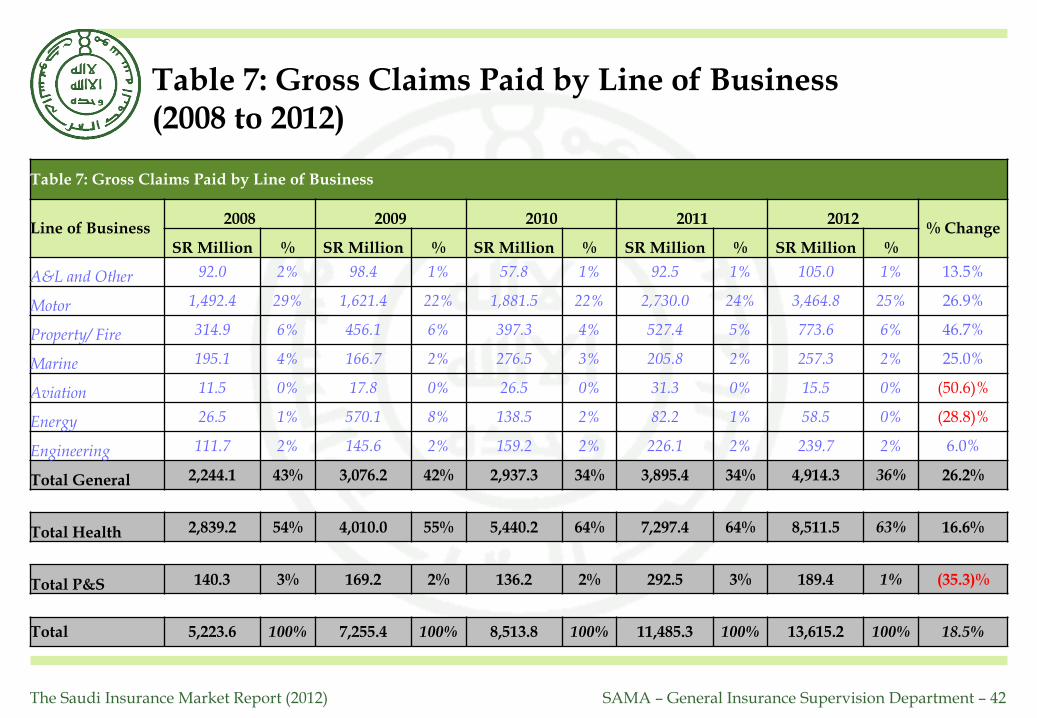
Table 7: Gross Claims Paid by Line of Business (2008 to 2012)
Table 7: Gross Claims Paid by Line of Business
Line of Business 2008 2009 2010 2011 2012
% Change SR Million % SR Million % SR Million % SR Million % SR Million %
A&L and Other 92.0 2% 98.4 1% 57.8 1% 92.5 1% 105.0 1% 13.5%
Motor 1,492.4 29% 1,621.4 22% 1,881.5 22% 2,730.0 24% 3,464.8 25% 26.9%
Property/ Fire 314.9 6% 456.1 6% 397.3 4% 527.4 5% 773.6 6% 46.7%
Marine 195.1 4% 166.7 2% 276.5 3% 205.8 2% 257.3 2% 25.0%
Aviation 11.5 0% 17.8 0% 26.5 0% 31.3 0% 15.5 0% (50.6)%
Energy 26.5 1% 570.1 8% 138.5 2% 82.2 1% 58.5 0% (28.8)%
Engineering 111.7 2% 145.6 2% 159.2 2% 226.1 2% 239.7 2% 6.0%
Total General 2,244.1 43% 3,076.2 42% 2,937.3 34% 3,895.4 34% 4,914.3 36% 26.2%
Total Health 2,839.2 54% 4,010.0 55% 5,440.2 64% 7,297.4 64% 8,511.5 63% 16.6%
Total P&S 140.3 3% 169.2 2% 136.2 2% 292.5 3% 189.4 1% (35.3)%
Total 5,223.6 100% 7,255.4 100% 8,513.8 100% 11,485.3 100% 13,615.2 100% 18.5%