The Rural-Urban Digital Divide in New Zealand: Progress...
36
The Rural-Urban “Digital Divide” in New Zealand: Progress since September 2000 By Bronwyn Howell and Lisa Marriott May 2002 http://www.iscr.org.nz/research/ New Zealand Institute for the Study of Competition and Regulation Inc. PO Box 600 Wellington, New Zealand Phone 64 4 463 5563 Fax 64 4 463 5566 Email [email protected] Acknowledgements: This paper updates The Rural-Urban “Digital Divide” in New Zealand: Fact or Fable? produced by Bronwyn Howell in October 2000. The authors acknowledge the support of Roderick Deane as project sponsor and Darren Lim, Yellow Pages, in providing data for this analysis.
Transcript of The Rural-Urban Digital Divide in New Zealand: Progress...
The Rural-Urban “Digital Divide” in New Zealand:
Progress since September 2000
By Bronwyn Howell and Lisa MarriottMay 2002
http://www.iscr.org.nz/research/
New Zealand Institute for the Study of Competition and Regulation Inc.PO Box 600
Wellington, New Zealand
Phone 64 4 463 5563Fax 64 4 463 5566
Email [email protected]
Acknowledgements: This paper updates The Rural-Urban “Digital Divide” in New Zealand:Fact or Fable? produced by Bronwyn Howell in October 2000. The authors acknowledge thesupport of Roderick Deane as project sponsor and Darren Lim, Yellow Pages, in providing datafor this analysis.

ISCR 6/13/2002 2
Executive Summary
In November 2000, the Institute for the Study of Competition and Regulation reported on the
relative uptake of email and website applications by businesses in various geographical areas of
New Zealand in The Rural-Urban “Digital Divide” in New Zealand: Fact or Fable? This
current paper analyses the changes that have taken place over the 18 months period since the
original paper was published, using the same methodology based upon listing behaviour in New
Zealand’s mot comprehensive business contact information directory, the Yellow Pages.
Findings from the research include:
• some provincial areas still outperform all metropolitan areas in email and website listing
percentages, and hence use;
• rural areas continue to lag their provincial centres in uptake of both technologies;
• many rural and provincial areas have moved significantly higher in ranking vis-à-vis
their metropolitan counterparts in the eighteen months between the two studies; and
• the North Island / South Island “digital divide” is still evident, but is reducing.
The key analysis from the previous report – that provincial and rural New Zealanders face
higher costs of communication, and thus will be more likely to substitute new, lower-cost and
more effective technologies earlier and at higher prices than their metropolitan counterparts -
remains, and may explain the growth in provincial and rural email use relative to metropolitan.
However, identification of the provincial and rural areas that have had highest ranking changes
as those where significant additional educational and promotional effort has been concentrated
(for example, specific local government initiatives and Ministry of Economic Development
Electronic Commerce Action Team promotions, combined with strong local business leadership
and networks to promote awareness and uptake) indicates that, where there is potential to grow
uptake of these technologies, the returns to information-sharing and communication may be
both significant and rapid.
We recommend that further research be undertaken to measure the effects of this information-
sharing and networking more accurately, in order to ensure that businesses in all environments –
rural, urban and metropolitan – can share the economic benefits promised by electronic
commerce. While some rural areas still remain low uptakers of the new technologies, the relative
slip in the rankings of metropolitan areas is a concern. Access to information-sharing,
promotional and networking resources in metropolitan as well as provincial areas may be
necessary in order to promote efficient use of the new technologies by businesses in all areas.
Over-focus on ‘correcting’ a divide that may not actually exist runs the risk of promoting false
perceptions of geographical uptake equity (which will never be efficient at equal uptake
percentages, given the differing communication cost-benefit trade-offs faced by different

ISCR 6/13/2002 3
business types in different regions) at the expense of national economic performance
excellence.
ISCR 6/13/2002 4
Contents
EXECUTIVE SUMMARY ........................................................................................................2
CONTENTS.............................................................................................................................4
LIST OF FIGURES..................................................................................................................5
INTRODUCTION ...................................................................................................................6
METHODOLOGY..................................................................................................................8
THE STUDY...........................................................................................................................10
ISSUE 1: A “DIGITAL DIVIDE” EXISTS BECAUSE URBAN BUSINESSES HAVE PROPORTIONALLY MORE
WEBSITES THAN RURAL ONES...................................................................................................11ISSUE 2: PROVINCIAL NEW ZEALAND IS DRAGGING THE E-COMMERCE CHAIN ...............................14ISSUE 3: NEW ZEALAND E-COMMERCE ACTIVITY BEGINS AND ENDS IN AUCKLAND .......................20
INTERPRETING THE DATA .................................................................................................23
FOCUS ON TECHNOLOGY IN RURAL REGIONS HAS EMPHASISED GROWTH IN THIS AREA AT THE POTENTIAL
EXPENSE AND PROMOTION OF URBAN REGIONS...........................................................................23IT IS EQUALLY POSSIBLE TO INFLUENCE TECHNOLOGY UPTAKE IN RURAL AREAS AS IT IS IN URBAN
AREAS..................................................................................................................................24T HE NORTH ISLAND / SOUTH ISLAND “DIGITAL DIVIDE” IS REDUCING ..........................................25PROXIMITY TO LARGER CITIES MAY IMPACT ON SPEED OF UPTAKE................................................26
CONCLUSIONS ..................................................................................................................28
REFERENCES........................................................................................................................29
APPENDIX 1: YELLOW PAGES DATA ..............................................................................30
APPENDIX 2: TELECOM YELLOW PAGES DATA SUMMARISED BY REGION...........31
APPENDIX 3: TELECOM YELLOW PAGES DATA AGGREGATED BY METROPOLITANCENTRE AND PROVINCIAL AREA CLASSIFICATION..................................................32
APPENDIX 4. TELECOM YELLOW PAGES DATA AGGREGATED BY NORTH ANDSOUTH ISLANDS ................................................................................................................34
APPENDIX 5: TELECOM YELLOW PAGES DATA AGGREGATED BY RURAL ANDURBAN CENTRES................................................................................................................35
APPENDIX 6: E-COMMERCE EVENTS IN NEW ZEALAND, 2001....................................36
ISCR 6/13/2002 5
List of Figures
FIGURE 1: YELLOW PAGES EMAIL AND WEBSITE ADDRESSES AS % OF LISTINGS 10FIGURE 2: WEBSITES AS % OF EMAIL 11FIGURE 3. YELLOW PAGES EMAIL AS % OF LISTINGS 12FIGURE 4. YELLOW PAGES WEBSITES AS % OF LISTINGS 13FIGURE 5: YELLOW PAGES WEBSITE AND EMAIL PERCENTAGES OF LISTINGS 15FIGURE 6. YELLOW PAGES WEBSITE PERCENTAGE OF LISTINGS: RURAL-URBAN SPLIT 16FIGURE 7. YELLOW PAGES EMAIL PERCENTAGE OF LISTINGS: RURAL-URBAN SPLIT 17FIGURE 8. IMPROVEMENTS IN RANKINGS BY WEBSITE UPTAKE 18FIGURE 9. IMPROVEMENTS IN RANKING BY EMAIL UPTAKE 19FIGURE 10. EMAIL AND WEBSITE AS PERCENTAGE OF LISTINGS, NORTH / SOUTH SPLIT 20FIGURE 11. EMAIL AND WEBSITE AS PERCENTAGE OF LISTINGS, NORTH / SOUTH SPLIT EXCLUDING
AUCKLAND URBAN DATA 21FIGURE 12. E-COMMERCE APPLICATION UPTAKE, NORTH / SOUTH SPLIT 22

ISCR 6/13/2002 6
Introduction
In November 2000 the Institute for the Study of Competition and Regulation produced The
Rural-Urban “Digital Divide” in New Zealand: Fact or Fable?1 Information from the Yellow
Pages business contact register was used to challenge the commonly held perception that rural
New Zealand businesses are restricted by the relative disadvantages of an inadequate
telecommunications infrastructure and are much less able to share in the benefits offered by the
Internet and electronic commerce than those city resident businesses. The paper concludes that
while there is evidence of some “rural-urban digital divides” in New Zealand, it is by no means as
simple as saying that all rural businesses are disadvantaged relative to all urban businesses. The
analysis showed the need to separate out the different forms of Internet-based applications as
different patterns of uptake were evident across different applications. When this was
undertaken, the results showed no evidence in the data to support the existence of a “digital
divide” with respect to the uptake of email and website applications between metropolitan and
provincial centres in New Zealand, merely based on geographical measures. Further findings
that emerged from the research include:
• The suggestion of a “divide” which favours earlier adoption of email in particular by
businesses that are more remote from their trading partners over those whose partners
are closer, translating into higher email uptake in the South Island than in the North.
• Evidence to suggest lower levels of uptake of both email and website applications in all
rural areas compared to the level of uptake in their provincial centres.
• Suggestion that some rural and provincial areas (namely Gisborne, Wairarapa, Hawkes
Bay, Manawatu, Wanganui, Taranaki and Waikato) are at a greater disadvantage than
other areas (namely Otago, Marlborough and Nelson and Bays).
It is timely that we now revisit this analysis, to analyse and reinterpret changes in the data.
Clearly economic development and any impediment to accessing new and more productive
technologies are closely related. Businesses with the ability to compete in the digital economy
are considerably more advantaged than those who do not. Further, communities hosting a
technology-literate population are more likely to attract and sustain new businesses.2
Conversely, regions that lack reliable access to technology and the skills to use the tools are less
likely to attract new investment, and economic prosperity as a result. As the information
economy can play a key role in the growth of regional New Zealand, it is important to continue
to measure progress to ensure economic and social growth in rural areas is cultivated. Access to
1 Howell, Bronwyn. 2000. The Rural-Urban “Digital Divide” in New Zealand: Fact or Fable? Institute for the Study ofCompetition and Regulation www.iscr.org.nz/ 2001 Prometheus, 19 (3), p231. 2 http://www.digitaldividenetwork.org/
ISCR 6/13/2002 7
online technologies is a necessary requirement for ensuring equity in access to the information
economy, as well as ensuring governments are able to achieve their electronic commerce
objectives, and allow all New Zealanders to take advantage of the opportunities offered by the
information economy.
A number of international surveys have been released in recent months, which point to
significant digital divides between rural and urban regions,3 although, aside from the ISCR
analysis, there is an absence of population-based data from New Zealand in this regard.4 Thus,
the purpose of this paper is to examine progress since the first paper, and to take advantage of
further research that has become available in the interim, with the aim of further increasing
understanding of New Zealand geographical differences in business use and uptake of
technologies, such as electronic mail and websites.
3 For example the U.K., as reported by the BBC Science / Technology division 4 March 2002. 4 Although Waikato University and NielsenNet conduct survey-based analyses, these are either analysed on a non-geographic rural/urban split (Waikato), or are focused on individual residential as opposed to business use(NielsenNet).

ISCR 6/13/2002 8
Methodology
For the purposes of this study, the methodology of The Rural Urban “Digital Divide” in New
Zealand: Fact or Fable? was used, with data provided by the Internet Yellow Pages (IYP) on
business listings. In its electronic form, the Yellow Pages (YP) directory also includes provision
for businesses to list both an email and a website address. Furthermore, links can be made
directly from the electronic YP to the listed business’s website. Thus the data provided includes
all businesses listing telephone numbers, with a break down of those that also list an email and /
or a website address, within the 18 geographical regions. This information is detailed in
Appendix I, and is current as of February 2002.
The Yellow Pages is the predominant register of businesses in New Zealand engaged in both
business-to-business and business-to-consumer trading. This source allows us to focus upon
business, as opposed to individual, uses of Internet-based technologies. The data collection for
this paper differs slightly, as electronic collection has eliminated some double counting, hence
lower absolute numbers are found, but this has no effect on relativity.
To distinguish between the bases of urban and rural we classify “metropolitan” as Auckland
Urban, Wellington Urban, Christchurch Urban and Otago Urban (Dunedin), with “provincial”
centres including the smaller cities and main provincial towns. “Regional” defines an urban
centre and its rural hinterland combined, while “rural” is used to differentiate the hinterland
from its provincial centre.
There is no charge for a business to list in the IYP, where a standard YP listing is held. A listing
in the YP automatically will be listed in the IYP. Where a business telephone line is held with
Telecom New Zealand, one standard (and accordingly the Internet) YP listing is free of charge.
Many businesses will choose to list under more than one category, and additional listings are
charged for. These prices differ between regions, depending on circulation of the printed
publication, and also are relative to the size and nature of the business, the size of the
advertisement etc. An example can be provided with the Wellington region (circulation
305,000) where an additional listing is charged at $55.20 plus GST. The data used in this
analysis has been de-duplicated for the purposes of this research.
The advantages of using the YP data are detailed in The Rural-Urban “Digital-Divide” in New
Zealand: Fact or Fable? and include:
• The data enable a measure to be taken on a population basis (businesses listing in the
YP), rather than using the sample-based methodologies adopted by other studies. This
ISCR 6/13/2002 9
removes the margin of sampling error present, and overcomes the problem of
insufficient numbers from specific small areas (such as Wairarapa and the West Coast)
which occur in sample-based surveys.
• New Zealand has approximately 205,250 companies while the Yellow pages directory
has listings for 191,000 unique businesses. Thus, even allowing for the fact that not all
businesses are registered companies, not all registered companies are active, and that
there may not necessarily by a one-to-one correspondence between companies and
telephone listings, the YP still appears to provide a fairly comprehensive and
representative directory of New Zealand businesses.
• The data allow the ability to match the location of businesses advertising email and
website addresses to quite tightly defined geographical areas. The combination of
population analysis plus fine distinction in location enables a relatively sophisticated
level of comparison to be undertaken.
• Further, the YP data allows investigation of comparative usage of electronic addresses
by businesses physically located in both their own geographic area, and businesses with a
national organisation facilitated by 0800 and mobile telephone numbers.
The ISCR paper does identify some limitations in this data. The key limitation is that while the
data is population based, there will necessarily be an under-representation of the numbers of
businesses operating email and websites, as not all businesses with websites and email addresses
choose to list these details in the YP directory. Whilst the initial listing (for business telephone
line holders) is free of charge, there is a $5.00 per month charge to list an email address, and a
$20.00 per month charge to add a website link. The fee charged for the listing also assists with
ensuring that those businesses that have chosen to list are active electronic commerce
participants. The ISCR paper acknowledges that whilst the proportion of businesses registering
websites and email addresses is significantly lower than those obtained from the survey-based
methodologies of the MAF and MED/BRC studies, the relative proportions between email and
websites are likely to be an accurate reflection of application uptake. Thus, despite the
limitations posed by the data we have reasonable confidence that the comparative proportions
between email and website listings which we report on in this analysis will reflect actual
differences in the use of each medium in practice.
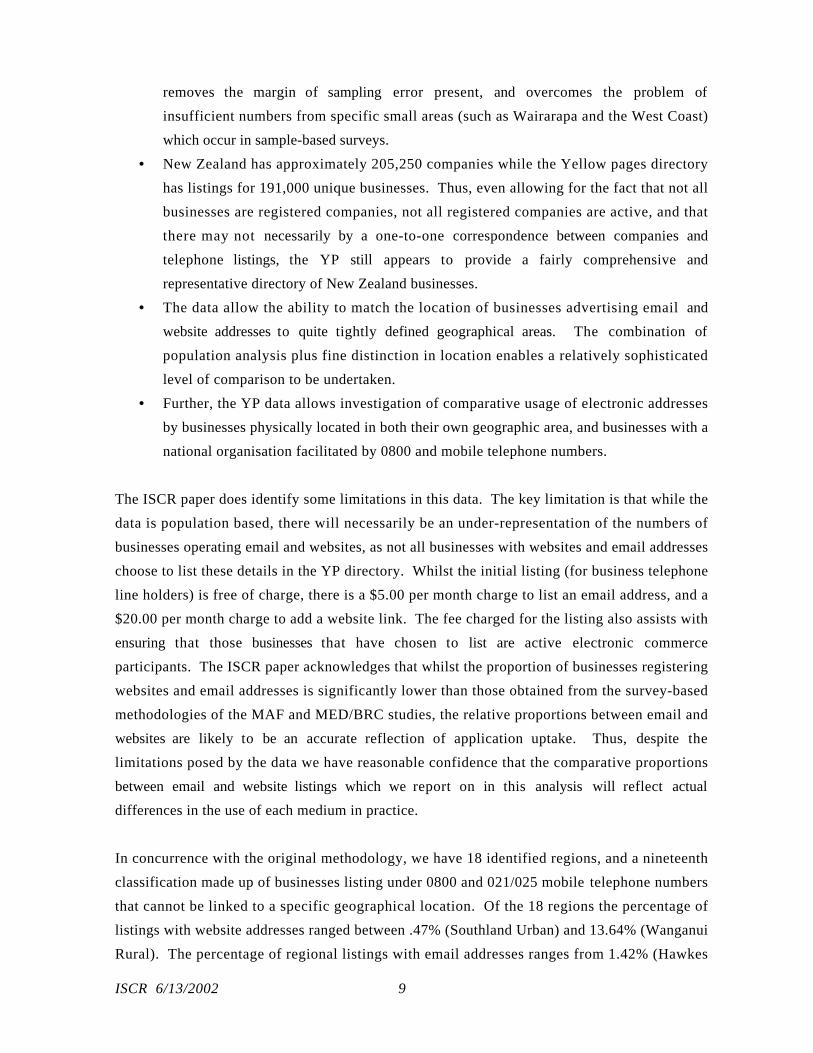
In concurrence with the original methodology, we have 18 identified regions, and a nineteenth
classification made up of businesses listing under 0800 and 021/025 mobile telephone numbers
that cannot be linked to a specific geographical location. Of the 18 regions the percentage of
listings with website addresses ranged between .47% (Southland Urban) and 13.64% (Wanganui
Rural). The percentage of regional listings with email addresses ranges from 1.42% (Hawkes
ISCR 6/13/2002 10
Bay Rural) to 26.52% (Wanganui Rural). This 0800 / 025 ‘region’ displays the largest
proportion of both website listings (at 6.42%) and a high number of email addresses (at
10.04%), although below those of Marlborough Urban (10.37%), Wellington Rural (15.28%),
and Wanganui Rural as previously mentioned. As this classification cannot be analysed on a
geographical basis, and in accordance with the original paper, it is omitted from the discussion of
regional variations. It is however, analysed with regard to why this area is a clear leader in
websites, but has now been overtaken by other areas with regard to email. This trend was
identified in the original paper, however at that time the 0800 ‘region’ was a leader in website
uptake, but only marginally ahead of the nearest geographical regional with email addresses.
Figure 1 shows the regions as a percentage of total listings.
Figure 1: Yellow Pages Email and Website Addresses as % of Listings
0.00%
2.00%
4.00%
6.00%
8.00%
10.00%
12.00%
Website %E-mail %
The Study
The first stage of this report will reconsider the three commonly held perceptual hypotheses of
the “rural-urban” digital divide in New Zealand.

ISCR 6/13/2002 11
Issue 1: A “digital divide” exists because urban businesses haveproportionally more websites than rural ones.The first finding by the original paper confirms that firms using email exceed firms using
websites for commercial activity. Studies such as the MED/BRC study show approximately 80%
of firms using email also having websites. These figures were broken down as 85% in
metropolitan centres and 74% in rural. The original ISCR paper showed a considerable regional
variation, ranging from 35% in Marlborough to 81% for 0800 numbers. The analysis
undertaken for this paper shows an even greater range, with Wellington Rural at 28.57% at the
lower end, and Wairarapa Rural at the top end with 77.78%. Figure 2 displays this information
in descending order.
Figure 2: Websites as % of Email: Rural / Urban Split
0.00%
10.00%
20.00%
30.00%
40.00%
50.00%
60.00%
70.00%
80.00%
90.00%
When the rural and urban data is averaged, our research finds provincial and rural areas having
48.17% of businesses with email and also using a website. This rises to 54.43% in urban areas.
Whilst the MED/BRC study uses their results for the purposes of confirming a “digital divide”
between urban and rural businesses as provincial and rural businesses are less likely to be using a
website, the data continues to show that it is more likely to be because provincial and rural

ISCR 6/13/2002 12
businesses have significantly higher proportions of email addresses than their urban
counterparts.
Appendix 1 shows the range of website and email listings, and Figure 3 shows the ranking of
email as a percentage of listings. As was observed in the original paper, provincial and rural
regions rank strongly towards the top end of the range, with higher proportions of email
addresses listed than their metropolitan counterparts. The highest-ranking metropolitan region
amongst these figures is that of Christchurch with 5.20%, 52% less than the rural region of
Marlborough (at 7.9%). These figures concur with those found in the original paper, with the
exception that the South Island region of Christchurch is now the urban region with the greatest
uptake of email. The results from the original paper found that of the three largest cities of
Auckland, Wellington and Christchurch, that Wellington had the greatest uptake, with
Christchurch second and Auckland third. The positioning now sees these rankings as
Christchurch first, Auckland second and Wellington third.
Figure 3. Yellow Pages Email as % of Listings
0.00%2.00%
4.00%6.00%8.00%
10.00%12.00%
0800
/ 02
5 ET
C
MAR
LBORO
UGH
TO...
NELS
ON &
BAYS
TO...
WAN
GANUI
TOTA
LS
NORT
HLAN
D TO
TALS
TARA
NAKI
TOTA
LS
CHRI
STCH
URCH
TO...
OTAGO T
OTALS
MAN
AWAT
U TO
TALS
SOUT
HLAN
D TO
TALS
AUCK
LAND
TOTA
LSW
EST
COAS
T
WEL
LING
TON
TOTA
LS
GISBO
RNE
TOTA
LS
TIM
ARU-
OAMAR
U T.
..W
AITA
KO T
OTALS
WAI
RARA
PA T
OTALS
BOP
TOTA
LS
HAW
KES
BAY
TOTA
LS
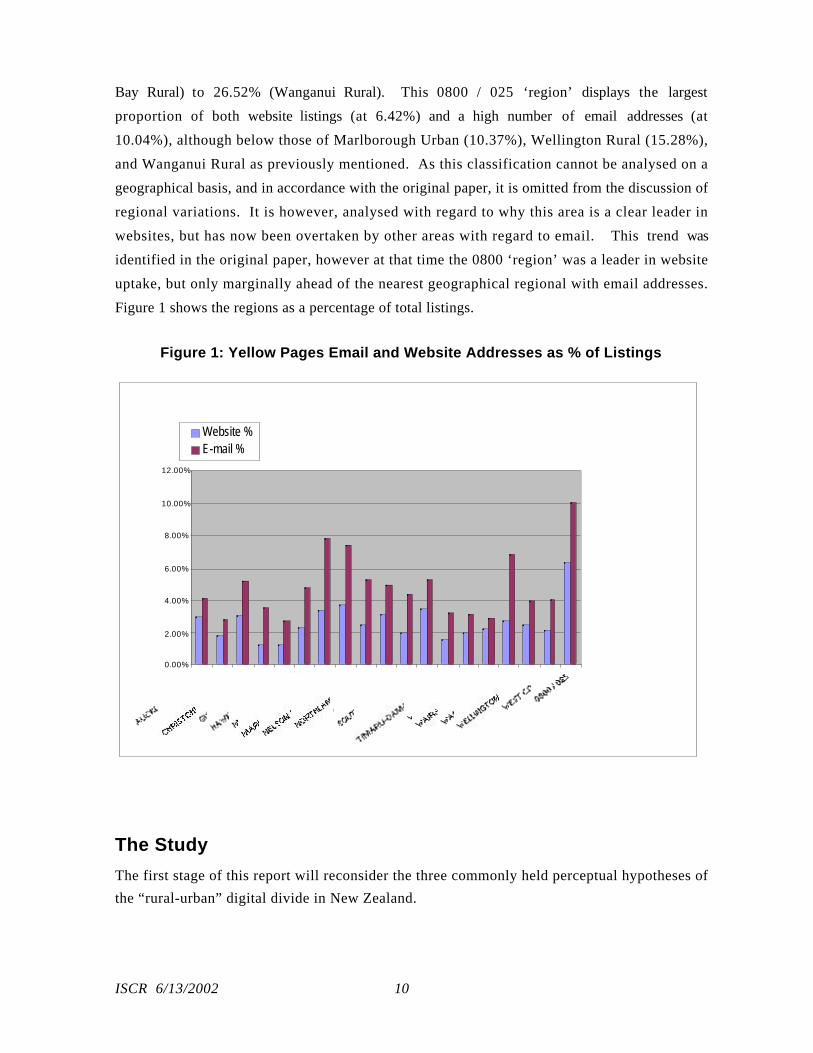
Similarly the figures for websites also do not show a clear advantage for metropolitan centres
over rural regions. This was another feature highlighted by the original study, although it is
more pronounced with recent figures. This is displayed in Figure 4, with regional areas
dominating the upper positions. Again we have seen a change of positions in the three
metropolitan centres, with the original research from Auckland first, Wellington second and
Christchurch third to Christchurch first, Auckland second and Wellington third. Table 1
displays the changes in these positions.
Table 1. Relative City Websites Rankings
ISCR 6/13/2002 13
CITY E-MAIL WEBSITE
Ranking (2000) Ranking (2002) Ranking (2000) Ranking (2002)
Auckland 3 2 1 2
Wellington 1 3 2 3
Christchurch 2 1 3 1
Figure 4. Yellow Pages Websites as % of Listings
0.00%
1.00%
2.00%
3.00%
4.00%
5.00%
6.00%
7.00%
0800
/ 025
NELSON &
BAYS
TARANAKI T
OTALS
M'BOROUGH TOTA
LS
OTAGO T
OTALS
C'CHURCH T
OTALS
AUCKLAND T
OTALS
WANGANUI T
OTALS
NORTHLA
ND TOTA
LS
WELL
INGTO
N TOTA
LS
MANAWATU
TOTA
LS
WAIR
ARAPA TOTA
LSW
EST COAST
SOUTHLA
ND TOTA
LS
WAITA
KO TOTA
LSBOP T
OTALS
TIMARU-O
AMARU
HAWKES B
AY TOTA
LS
GISBORNE T
OTALS
ISCR 6/13/2002 14
The original ISCR study proposes that the yellow pages information provides a more accurate
picture of the use of these new technologies, as opposed to the mere existence of them, which is
the focus of other studies. The fact that businesses pay5 to list their email addresses and websites
indicates active business transactional usage. If this were not the case we would not expect to see
expenditure on listing the electronic contact details. It is, thus, the analysis of uptake that is of
more interest. The figures above tend to confirm the ISCR findings that email is being used
more extensively as a business tool in provincial areas than in metropolitan areas. The ISCR
study proposes that this may indicate that the “digital divide” may in fact be “going the other
way” – that provincial business users of email and websites are, in some areas, considerably
more enabled than their counterparts in urban areas. We find no evidence in this review to
suggest that this has changed.
Issue 2: Provincial New Zealand is dragging the e-commerce chainProvincial areas are frequently thought to have slower uptake of technology for, among other
reasons, the older population as well as a lack of service providers or support providers in some
rural areas. Further, traditionally urban areas have always been the first to receive faster
technologies (Butt, 2000).
The higher provincial and rural uptake of email and websites identified above would appear to
contradict the findings in other surveys (such as the MED/BRC survey mentioned above) that
find provincial New Zealand businesses with a lower uptake of email than their metropolitan
counterparts. The methodology followed in this paper is the same as the original ISCR study,
which defined ‘rural’ differently to the aforementioned study. For the purposes of this section,
data is aligned with the classifications used in the MED/BRD study.6 This data is detailed in
Appendix 5, where Metropolitan Centres represent the totals in the Auckland urban, Auckland
rural, Wellington urban, Christchurch urban, and Otago urban areas. All other regions are
aggregated into the provincial / rural bracket.
Using this information provides a very similar result to previous findings with regard to website
uptake being above the national average in metropolitan centres, and below the national average
in provincial and rural areas. However, email uptake does not display the same pattern, with
remarkably similar uptake in both areas. The spread is negligible with metropolitan centres at
4.36% and provincial and rural areas 4.35%. This is displayed in Figure 5.
5 The current cost of listing an e-mail address with the Internet Yellow Pages is $5.00 plus GST per month and thecost of having a website link from the Yellow Pages listing is $20.00 plus GST per month. It is however, aprerequisite for a website link to have a headline, which costs an additional $15.00 per month plus GST.
ISCR 6/13/2002 15
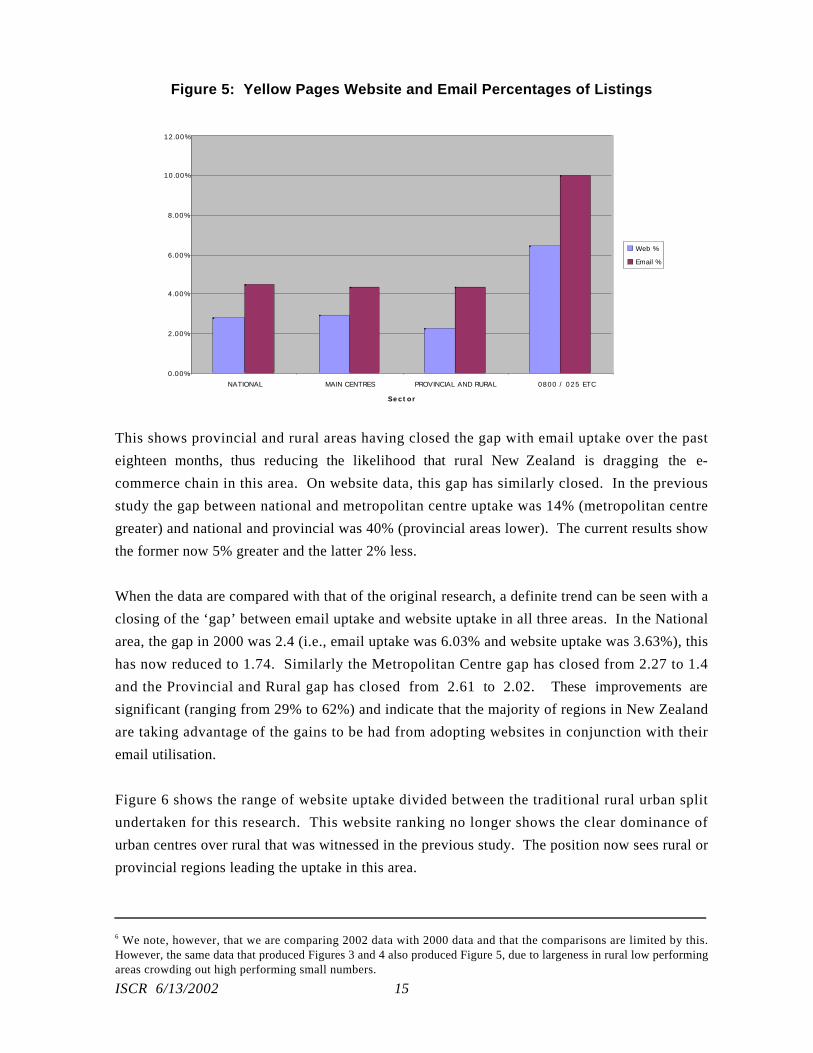
Figure 5: Yellow Pages Website and Email Percentages of Listings
0.00%
2.00%
4.00%
6.00%
8.00%
10.00%
12.00%
NATIONAL MAIN CENTRES PROVINCIAL AND RURAL 0800 / 025 ETC
Sector
Web %
Email %
This shows provincial and rural areas having closed the gap with email uptake over the past
eighteen months, thus reducing the likelihood that rural New Zealand is dragging the e-
commerce chain in this area. On website data, this gap has similarly closed. In the previous
study the gap between national and metropolitan centre uptake was 14% (metropolitan centre
greater) and national and provincial was 40% (provincial areas lower). The current results show
the former now 5% greater and the latter 2% less.
When the data are compared with that of the original research, a definite trend can be seen with a
closing of the ‘gap’ between email uptake and website uptake in all three areas. In the National
area, the gap in 2000 was 2.4 (i.e., email uptake was 6.03% and website uptake was 3.63%), this
has now reduced to 1.74. Similarly the Metropolitan Centre gap has closed from 2.27 to 1.4
and the Provincial and Rural gap has closed from 2.61 to 2.02. These improvements are
significant (ranging from 29% to 62%) and indicate that the majority of regions in New Zealand
are taking advantage of the gains to be had from adopting websites in conjunction with their
email utilisation.
Figure 6 shows the range of website uptake divided between the traditional rural urban split
undertaken for this research. This website ranking no longer shows the clear dominance of
urban centres over rural that was witnessed in the previous study. The position now sees rural or
provincial regions leading the uptake in this area.
6 We note, however, that we are comparing 2002 data with 2000 data and that the comparisons are limited by this.However, the same data that produced Figures 3 and 4 also produced Figure 5, due to largeness in rural low performingareas crowding out high performing small numbers.
ISCR 6/13/2002 16
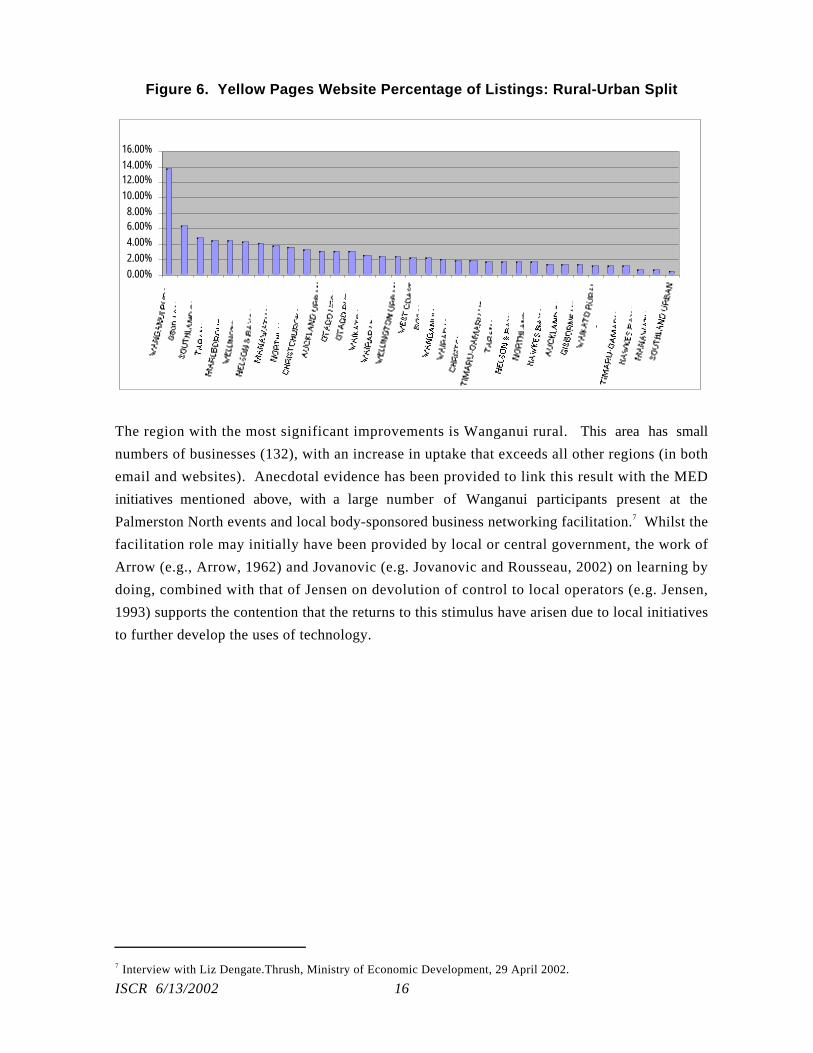
Figure 6. Yellow Pages Website Percentage of Listings: Rural-Urban Split
0.00%
2.00%
4.00%
6.00%8.00%
10.00%
12.00%14.00%
16.00%
The region with the most significant improvements is Wanganui rural. This area has small
numbers of businesses (132), with an increase in uptake that exceeds all other regions (in both
email and websites). Anecdotal evidence has been provided to link this result with the MED
initiatives mentioned above, with a large number of Wanganui participants present at the
Palmerston North events and local body-sponsored business networking facilitation.7 Whilst the
facilitation role may initially have been provided by local or central government, the work of
Arrow (e.g., Arrow, 1962) and Jovanovic (e.g. Jovanovic and Rousseau, 2002) on learning by
doing, combined with that of Jensen on devolution of control to local operators (e.g. Jensen,
1993) supports the contention that the returns to this stimulus have arisen due to local initiatives
to further develop the uses of technology.
7 Interview with Liz Dengate.Thrush, Ministry of Economic Development, 29 April 2002.

ISCR 6/13/2002 17
Figure 7. Yellow Pages Email Percentage of Listings: Rural-Urban Split
0.00%
5.00%
10.00%
15.00%
20.00%
25.00%
30.00%
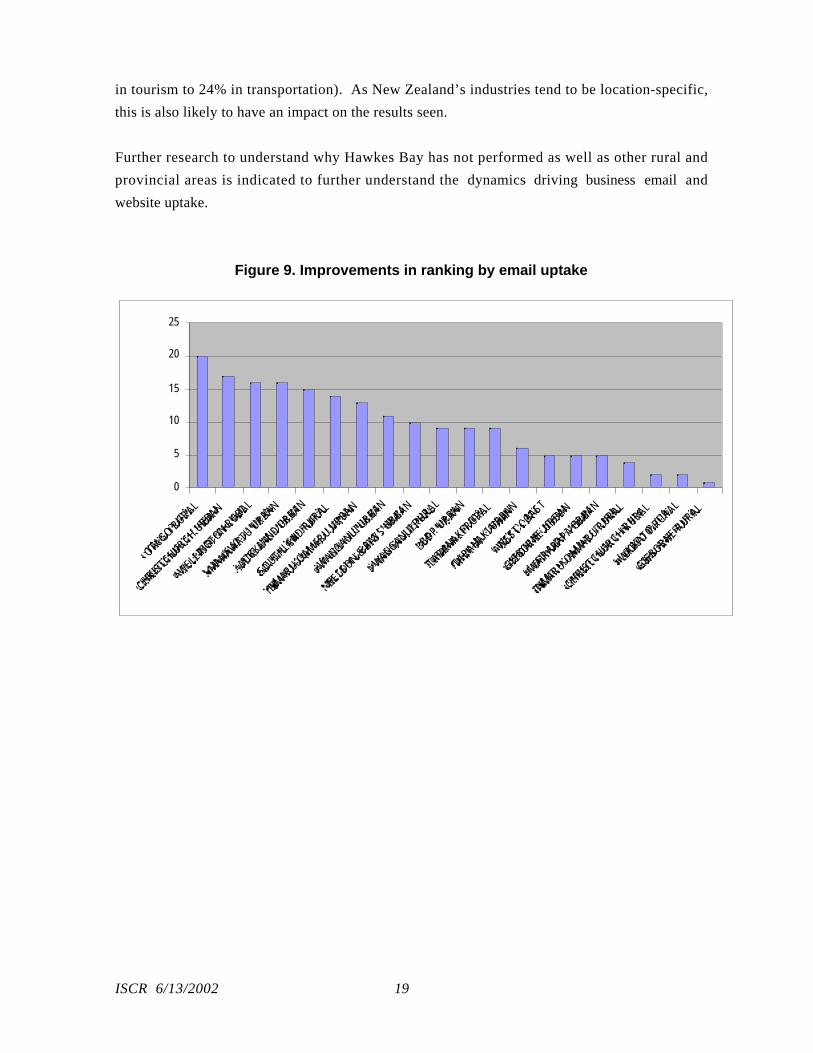
When considering those areas that have had the most significant improvement in uptake for both
website and email technologies the greatest improvements in position have been made in
provincial areas. These are displayed in Figures 8 and 9. An explanation for some of this
movement may relate to e-commerce initiatives that have been undertaken over the past 18
months in some of these areas. For example, in Figure 8, 75% of the areas that have made
positive moves (including the top six regions) in their website rankings can be identified with
regions where the Ministry of Economic Development’s E-Commerce Action Team (ECAT)8
have sponsored or been involved in regional e-commerce events. Further, of the ten regions
identified where these seminars have taken place all have shown an improvement (in either rural
or urban region) in at least one of the two categories, with 50% of the regions showing
improvements in both email and website categories. When considering the email improvements
in Figure 9, 90% of the regions that had MED initiatives are represented by either a rural or an
urban listing with a positive increase.
8 ECAT has been set up to help realise the aim of New Zealand becoming a world leader in adopting e-commerce forcompetitive advantage. www.med.govt.nz/

ISCR 6/13/2002 18
Figure 8. Improvements in rankings by website uptake
0
5
10
15
20
25
30
SOUT
HLAN
D RU
RAL
WAI
RARA
PA R
URAL
WAN
GANU
I RUR
ALTA
RANA
KI U
RBAN
WAI
RARA
PA U
RBAN
TARA
NAKI
RUR
ALW
ELLI
NGTO
N RU
RAL
GISB
ORNE
URB
ANM
ARLB
OROU
GH U
RBAN
HAW
KES
BAY
RURA
LBO
P UR
BAN
TIM
ARU-
OAM
ARU
URBA
N
The one area that did host such an event but is not represented by a significant upward ranking
shift, is the Hawkes Bay. The Hawkes Bay event was one of the few half-day events, whereas the
majority held in other centres were full day. In the previous study, this area did not feature
strongly (being ranked second to last in website listings in rural areas and 22nd out of 36 in
urban regions for website uptake). This positioning is now 32 and 26 respectively, showing a
small improvement in rural areas and a slight decline in urban areas. When looking at email
listings, the previous results showed rural areas ranked at 15th with urban at 12th. Both of these
have declined to 34th and 24 th respectively with the current results. Thus the benefits that have
accrued to the majority of regions involved in the MED events have not been witnessed in the
Hawkes Bay region.
While it is beyond the scope of this study to explain the reasons for Hawkes Bay’s relatively
poor performance, it is noted that this region has a very much higher proportion of its
workforce employed in businesses with five or fewer employees (50%) compared to regions
such as Manawatu and Gisborne (25%)9. It is possible that this higher than average proportion
of workers in small businesses implies that this region has either a smaller number of businesses
that can gain large benefits from the use of email or website uptake, or that the thresholds for the
cost-benefit trade-off for the types of business in these areas is lower than for other regions.
Research undertaken by the Waikato Management School (Clark, 2001) indicates that
predominant industry type may play a large part in the uptake of new technologies. Levels of
website activity were shown to vary considerably depending on the industry (for example, 91%
9 Figures derived from Statistics New Zealand Infos database official statistics.
ISCR 6/13/2002 19
in tourism to 24% in transportation). As New Zealand’s industries tend to be location-specific,
this is also likely to have an impact on the results seen.
Further research to understand why Hawkes Bay has not performed as well as other rural and
provincial areas is indicated to further understand the dynamics driving business email and
website uptake.
Figure 9. Improvements in ranking by email uptake
0
5
10
15
20
25
OTAGO RURAL
CHRISTCHURCH URBAN
WELLIN
GTON RURAL
MANAWATU URBAN
AUCKLAND U
RBAN
SOUTHLAND R
URAL
TIMARU-O
AMARU URBAN
WANGANUI URBAN
NELSON & BAYS U
RBAN
WANGANUI RURAL
BOP URBAN
TARANAKI RURAL
TARANAKI URBAN
WEST COAST
GISBORNE URBAN
WAIRARAPA U
RBAN
TIMARU-O
AMARU RURAL
CHRISTCHURCH RURAL
WAIKATO RURAL
GISBORNE RURAL
ISCR 6/13/2002 20
Issue 3: New Zealand e-commerce activity begins and ends in AucklandThis paper confirms the findings in the original paper, which found that New Zealand’s largest
city, Auckland, does not appear to be the leader in economic commerce. The first paper showed
Auckland urban to be ranked 5th in website listings and 11th in email. This study shows these
positions having declined to 11th in website listings and 14th in email, as rural and provincial
areas have increased. The area now leading the uptake in both websites and email is Wanganui
rural. This area was 15th in website listings and 10th in email uptake in the previous paper. Only
two other rural regions feature strongly (in the top ten) regarding website uptake (Southland and
Wellington rural), and similarly only two are included in the email uptake (again Wellington
rural and Southland – this time the positioning is reversed). Christchurch is the highest-ranking
‘large’ New Zealand city, positioning at 11th for website and email uptake. These changes in
position more likely reflect rural areas increasing their uptake at a faster rate than Auckland, as
opposed to Auckland uptake decreasing in real terms.
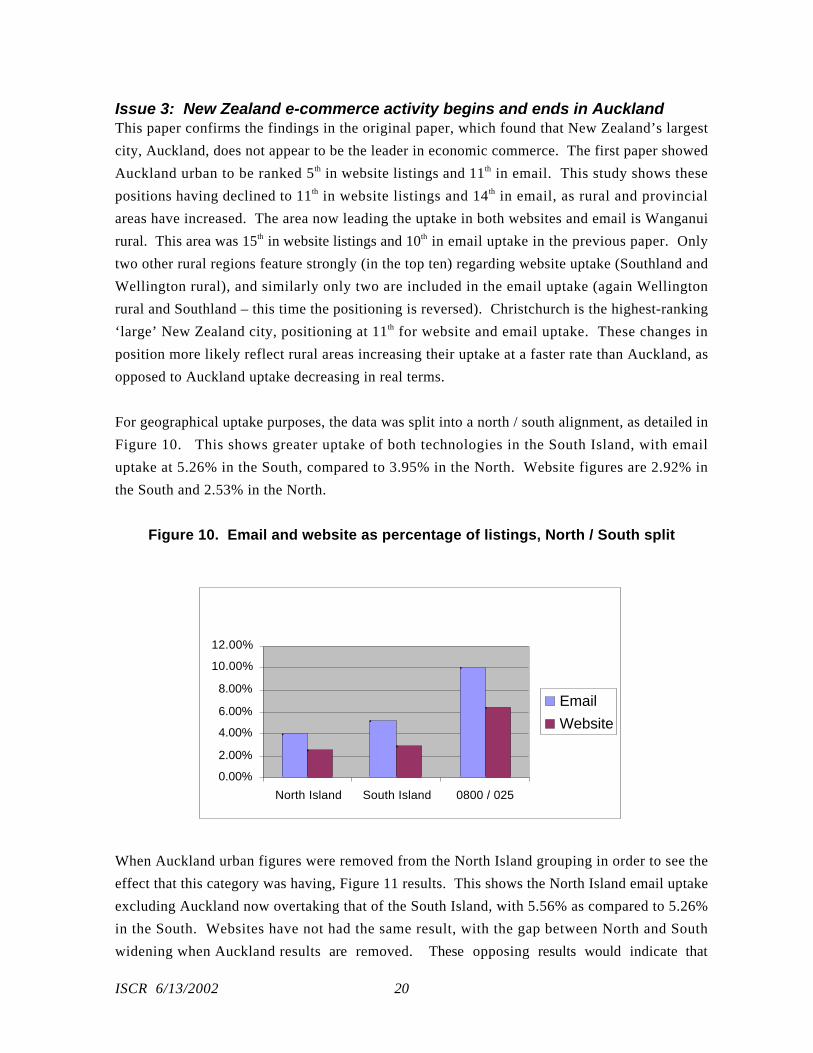
For geographical uptake purposes, the data was split into a north / south alignment, as detailed in
Figure 10. This shows greater uptake of both technologies in the South Island, with email
uptake at 5.26% in the South, compared to 3.95% in the North. Website figures are 2.92% in
the South and 2.53% in the North.
Figure 10. Email and website as percentage of listings, North / South split
0.00%
2.00%
4.00%
6.00%
8.00%
10.00%
12.00%
North Island South Island 0800 / 025
Website
When Auckland urban figures were removed from the North Island grouping in order to see the
effect that this category was having, Figure 11 results. This shows the North Island email uptake
excluding Auckland now overtaking that of the South Island, with 5.56% as compared to 5.26%
in the South. Websites have not had the same result, with the gap between North and South
widening when Auckland results are removed. These opposing results would indicate that

ISCR 6/13/2002 21
Auckland is ‘dragging the chain’ when it comes to email uptake, but is actually increasing the
North Island performance for website uptake. This is consistent with the finding of the previous
paper that website uptake was less affected by the costs of communication than email uptake,
thereby providing no ‘natural’ cost or benefit-based advantage in uptake propensity for rural
and provincial businesses over metropolitans per se.
What can, however, be clearly seen is the pattern recognised in the original paper, where the areas
most distant from Auckland - i.e. those in the South Island - have a significant advantage of
uptake of both categories over the North. Thus, there is no support for the proposal that
Auckland, as the metropolitan commercial location and largest population base, is the leader in
the uptake of these new technologies.
It is proposed in the original paper that a potential explanation for this is rather than supporting
the hypothesis that e-commerce uptake is a function of business concentration, instead the actual
effect of the greater distance from Auckland, and thus the lack of business concentration,
actually provides more potential benefit from new technologies and email in particular, and
hence the greater uptake.
Figure 11. Email and website as percentage of listings, North / South splitexcluding Auckland urban data
0.00%
2.00%4.00%
6.00%
8.00%
10.00%
12.00%
North Island South Island 0800 / 025
Website
Further evidence in this regard is found in Figure 12, which shows the North Island with an
uptake of both email and websites lower than the national average. To put this into context with
the figures, the South Island is 4.5% higher than the national average, with the North Island
being 9% lower. When considering the overall email uptake of the North Island, this is .58% less
than the national average, with the South Island .73% greater. Proportionately this result has the
South Island 16% above the national average, and the North Island 13% below.
When a similar exercise is done with the data from the ISCR original research paper the situation
is now reversed. In the 2000 North / South Island comparison, while Auckland was below the

ISCR 6/13/2002 22
national average, the North Island average increased by over 25% for both website and email
uptake when Auckland was included in the figures. This contrasts with the more recent
information gained which shows the Auckland figures now reducing the overall North Island
average. Rather than Auckland usage diminishing, we believe this reflects the increased uptake
of regions relative to Auckland. Clearly this shift has been significant in order for the provincial
regions to overtake Auckland in the 18 months since the publication of the original ISCR paper,
and is particularly noteworthy given the relative size of the Auckland’s population compared to
the population of the rest of the North Island.
Figure 12. E-Commerce application uptake, North / South split
0.00%
2.00%
4.00%
6.00%
8.00%
10.00%
12.00%
W/SITE % EMAIL %
National
North Island
South Island
NZ 0800 / 02
ISCR 6/13/2002 23
Interpreting the data
The original ISCR study pointed to a number of explanations for the data. These included:
• That earlier and higher provincial and rural email adoption is consistent with higher
communication costs in rural areas.
• That email adoption patterns in rural and provincial areas follow the demand-driven
adoption seen in EFTPOS rollout.
• The optimal time to invest in websites depends more on the size of the firm and the
product than on infrastructure and geographic business location.
• Websites can substitute for email in some business communications.
From the updated data, further propositions are raised.
Focus on technology in rural regions has emphasised growth in this area atthe potential expense and promotion of urban regionsA number of features in the analysis of recent data points to an acceleration in technological
uptake in rural and provincial areas that has not been evidenced in metropolitan areas. This can
potentially be explained by the results of studies10 indicating that the areas most in need of
assistance with uptake were the provincial and rural regions, although these findings were not in
concurrence those found in the original ISCR research paper. As a result of this supposed
inequality between rural and urban regions, initiatives have predominantly focused in these
areas. Appendix 6 details the regions where the Ministry of Economic Development ECAT
team has either been involved in e-commerce events, or regional events have been held.
However, these initiatives have not been held in Auckland, and it is significant that this is the
centre that is performing relatively less well in this study.
Evidence to support this supposition includes the data comparison from the first study. As
noted above, when Auckland is removed from the North Island / South Island comparison, the
results for the North Island uptake increase in both technologies. However, in the earlier study
these results were reversed. When Auckland was removed the North Island figures suffered as a
result, decreasing by over 25% for each technology. This indicates that Auckland businesses
have not kept up with the rest of the North Island with the rate of email and website uptake.
These figures are further supported with a similar exercise undertaken with the South Island, and
removal of Christchurch and Dunedin from the figures. In both the previous study, and the
current study the movement in figures has been in the same direction (with both showing
decreases in the overall South Island figures when the two metropolitan cities are removed from
the results). This can be explained, in some part, by the fact that both Christchurch and Dunedin
10 MED / BRC and MAF studies
ISCR 6/13/2002 24
businesses may have both benefited from spillovers from MED initiatives during the past year,
and as a result have maintained their relative levels of website and email uptake.
When the website regional rankings are looked at as a whole (i.e, rural and urban regions are
grouped together), with the exception of the Christchurch / Canterbury grouping (which was
unchanged), all other regions which feature a ‘large’ New Zealand city (that is, Wellington,
Auckland or Dunedin), are ranked in the bottom third. This would appear to add weight to the
hypothesis that the current focus on rural regions is at the detriment and focus on the larger
cities. In this same ranking, all the regions that had an overall improvement in ranking, are from
regions with significant rural populations (Taranaki, Wairarapa, Wanganui, Marlborough and
Nelson and Bays). This pattern is not dissimilar in the email regional rankings, with no region
featuring one of New Zealand’s four largest cities having an overall improvement in ranking.
The Wellington region and the Dunedin / Otago region are ranked in the lowest third again, with
Christchurch / Canterbury and Auckland showing no net gain or loss.
Thus, the results indicate that the areas most in need of increased attention with regard to
business email and website uptake may now be Auckland and Wellington. It is important that e-
commerce awareness programmes do not promote equity above total uptake, given that the
efficient level of use of these technologies may well be different for businesses in different
regions, given industry type, average employee size and other information-related differences.
There may be some indication from this study that businesses are responding to initiatives based
upon equity of uptake irrespective of these differences – that is, rural and provincial businesses
are connecting in order not to be ‘behind’, and metropolitan businesses may face less
promotion, and are thus less aware of the benefits and are thus less likely to connect.
It is noted that Christchurch fared well in the original ISCR study, ranking at 6th and 7 th position
for website and email uptake respectively, and has managed to maintain its position. The
reasons for this warrant further investigation. The real cause for concern relates to the cities and
regions of Auckland, Wellington and Dunedin that are being overtaken by rural and provincial
regions. This may be either because their efficient level of uptake is lower, or because they lack
the awareness that has been raised in the rural and provincial areas. It is especially important to
understand which of these effects is the dominant reason for the findings in this study, in order
to ensure that new technologies such as broadband are promoted appropriately given that
‘broadband divides’ are becoming a new source of access focus (OECD, 2001).
It is equally possible to influence technology uptake in rural areas as it is inurban areasA strong relationship appears (anecdotally) to exist between regional initiatives and increasing
adoption of technology. This can be witnessed in the improvements in rankings in almost every
ISCR 6/13/2002 25
region that was involved in one of the aforementioned initiatives. Of the 20 areas that made
improvements in their email rankings, there was a fifty-fifty split between rural and urban
regions. Similarly, of the 12 areas that made improvements in website rankings, again there was
an equal division between rural and urban regions. This points to an equivalent opportunity for
New Zealand to assist with technological advancement for all regions of the country.
Further, the remarkable improvement of the Wanganui rural region demonstrates that it is
entirely possible to achieve ‘turn-around’ results in an area that is not achieving business growth
at the same level. The uptake in Wanganui has increased from 0.94% to 13.64% in website
uptake and from 2.7% to 26.52, although it is interesting to note that the Wanganui urban
region has not had the same degree of success. Anecdotal evidence points to strong locally
based regional co-ordination and existing networks assisting in this area.
As attendance at the aforementioned initiatives cannot be separated into rural and urban
attendees it is not possible to ascertain the exact benefits felt in rural versus urban regions based
on this parameter. However, what the results do point towards is the benefits that appear to have
been gained from the initiatives overall. It appears that exposure to information about the
benefits of technology has been sufficient to increase uptake, for both rural and urban areas, and
there is no indication of increased receptivity of rural participants over urban or vice versa.
These initiatives may have lowered information barriers, as described by Jovanovic and
McDonald (1993), leading to increased uptake. There is no reason to suppose that these
methods may be equally successful in raising awareness, and consequently uptake, in
metropolitan areas, if this is deemed desirable.
The North Island / South Island “digital divide” is reducingWhen the relative positions of the North and South are compared between the 2000 study and
more recent information, the ‘gap’ can clearly be seen to be reducing between the two Islands
with regard to uptake of technology. When considering the positions of the Islands, the initial
ISCR study shows the South Island sat much the same as the national average (0.01%
difference), with the North Island clearly below the average by approximately 25% (with the
balance accounted for by 0800/0900 listings). Recent data shows the South Island now 4.5%
above the national average, however the North Island is now only 9.5% below this figure. This
sees a gap of 25 percentage points now reduced to 14. A similar pattern is seen with email
uptake. The initial study returned results that showed the North Island 30% below the national
average, and the South Island 23% above this figure. The recent information does not change
the positioning, however the range is again reduced, with the North Island now 13% below the
national average and the South Island 16% above.
ISCR 6/13/2002 26
The regional initiatives may perhaps partially explain this difference, with 40% of the locations
being in the South Island. Further, the attendances in the North Island locations were generally
higher, with up to 320, while the highest-attended South Island session had 140. Thus, a greater
range of population has had potential exposure to the initiatives in the North Island based on
locations, combined with a greater potential number of businesses being available to influence in
the North Island.
This result shows that strategies aimed at reducing the divide are probably having some effect.
However, the rider on the desirability of equity of uptake still remains – there is no guarantee
that equal uptake by businesses in all regions will be the efficient level, given the differences
between business size, business sector, product form and other factors.
Proximity to larger cities may impact on speed of uptakeAn interesting feature in the results stems from the apparent trend for some provincial areas
close to metropolitan areas to exhibit low email and website uptake. Particular examples are the
Wairarapa and Waikato regions. These regions consist of urban centres, albeit of vastly different
sizes, (Masterton and Hamilton) bordering on to Wellington and Auckland respectively. In the
first study, these regions were poor performers, with ratings of uptake for both websites and
email uptake in the lower half of the range. In the case of email uptake, they were both in the
lower quartile. The current results are similar (Waikato website uptake has dropped four places
in overall ranking).
It is interesting to note firstly the similarity of patterns in the data results of these two areas. One
would perhaps expect to see this in areas with a similar industry focus, however this is not the
case. While both are highly focused on agriculture (as is the majority of New Zealand) the
Wairarapa region has a large wine-growing region while the Waikato is strongly dairy focused.
There are three possible explanations for this trend that warrant investigation: technology
barriers; industry type; and demographic reasons.
It may be that both regions have businesses with information transfer requirements that are
below average, thus a lower uptake is reasonable when considered from a ‘need’ perspective.
This may well result from a larger than average share of businesses that have no need, for
example, for advertising or direct customer contact. This would fit with the suggestion above
that these areas have many organisations that rely on the presence of representatives to
undertake their technology-focused activities on their behalf (for example, reliance on central
processors such as Fonterra. Further, it may be that these regions are more highly populated
with ‘commuter businesses’ – that is, businesses where there is a presence in the adjacent
metropolitan where electronic commerce and business communication is focused, despite also
ISCR 6/13/2002 27
having a physical presence in the provincial area. While we can only speculate, further research
is indicated to explore the extent of these factors for the Wairarapa and the Waikato.
A recent MED-supported study has produced data11 that provides interesting information on the
willingness of individuals and businesses in the Wairarapa to pay for increased Internet
connection speed. Between 6 and 20% of survey respondents appearing willing to pay between
$42 and $56 per month for this benefit. Significantly, only 6% of the commuting population
(that is, workers travelling regularly to Wellington for work purposes) indicated a willingness to
pay the $56 monthly charge for broadband. This may demonstrate some characteristics of the
workers and businesses in this area, with few appearing to justify purchase of (through the lack
of willingness to pay for or lack of need for) an advanced product. The implication is that the
organisations operating in this area may have different information transfer requirements than
their counterparts in other regions, that commuting workers may have substitutes for Internet
access in the centre to which they commute thereby obviating the need for Wairarapa-based
access, or some other as yet unexplained factor.
11 Reported in Infotech, Issue 540 3 June 2002. Wairarapa unhappy with Net speeds – survey.
ISCR 6/13/2002 28
Conclusions
This paper has highlighted significant improvements in the uptake of email and website
applications in provincial and rural areas of New Zealand. Whilst not conclusive, the evidence
points towards this, at least to some degree, being attributable to initiatives undertaken by the
Ministry of Economic Development. This displays the returns possible from promotional
activities and the information dissemination that results, in that the local initiatives have resulted
in changes that are both large and rapid.
The relative growth in rural and provincial areas compared to metropolitan regions since
September 2000 raises questions of whether equally large increases in returns could also be
gained in larger areas with similar promotion.
Thus, whilst theses initiatives are well justified in their apparent success, there is a need to ensure
that overall excellence is not forgone in the pursuit of promoting equity. Whilst it is unclear
whether a similar increase in uptake can be expected in metropolitan areas, the issue is raised
whether the emphasis on provincial promotion may be at the expense of potential growth in
metropolitan areas, which would result in a higher overall economic gain. The results of recent
research (e.g., Boles de Boer, Lewis and Howell, 2000; Howell, 2001) shows New Zealand
leading the way in many e-commerce measures – a position that needs to be maintained. Thus,
there is a requirement for encouraging application uptake at all levels of the country, including
those already performing well, and not just in those areas that would appear to be lagging
behind. The risk incurred if this is not carried out is that New Zealand, not just Auckland, may
lose ground, and thus the benefits associated with e-commerce applications.

ISCR 6/13/2002 29
References
Arrow, Kenneth J. 1962 The Economic Implications of Learning by Doing. Review ofEconomic Studies. 29(3):155-73.
Boles de Boer, David; Lewis Evans and Bronwyn Howell. 2000. The State of e-New Zealand.Wellington: ISCR http://www.iscr.org.nz/research/
Butt, D. 2000. Slow Connections – Building non-urban infrastructure online. www.icvp.com
Clark, Delwyn N. 2001. Net Readiness in New Zealand Industries: Empirical Results, 2001.Department of Strategic Management & Leadership, University of Waikato Management School.
Howell, Bronwyn. 2001. Scoping Report: e-Commerce Performance Measurement for NewZealand. Wellington: ISCR. www.iscr.org.nz/research/
Howell, Bronwyn. 2000. The Rural-Urban “Digital Divide” in New Zealand: Fact or Fable?Wellington: ISCR www.iscr.org.nz/research/ 2001 Prometheus, 19 (3), p231.
Jensen, Michael C. 1993. The modern industrial revolution, exit and the failure of internalcontrol systems. Journal of Finance 48(3):831-880.
Jovanovic, Boyan and Glenn MacDonald. 1993. Competitive Diffusion. National Bureau ofEconomic Research Technical Working Paper 4463. http://www.nber.org.
Jovanovic, Boyan and Peter L. Rousseau. 2002. Moore’s Law and Learning-By-Doing.National Bureau of Economic Research Working Paper 8762.http://www.nber.org/papers/w8762.
Ministry of Economic Development. 2000. Electronic Commerce in New Zealand: A survey ofBusiness Use of the Internet. Wellington:MED. http://med.govt.nz/
Ministry of Economic Development. 2001. Statistics on Information Technology in NewZealand 2001. Wellington:MED. http://med.govt.nz/pbt/infotech/currentstats
OECD Information Society. 2001. Communications Outlook. Paris: OECD.http://www.oecd.org/
ISCR 6/13/2002 30
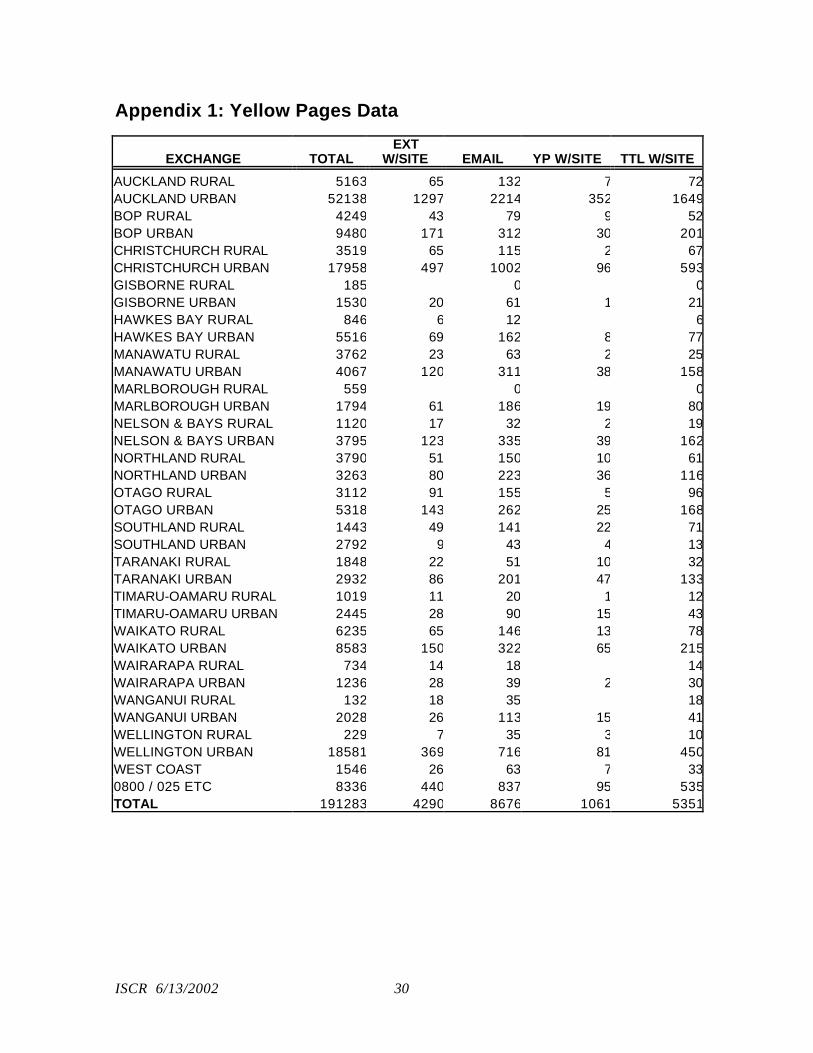
Appendix 1: Yellow Pages Data
EXCHANGE TOTALEXT
W/SITE EMAIL YP W/SITE TTL W/SITE
AUCKLAND RURAL 5163 65 132 7 72AUCKLAND URBAN 52138 1297 2214 352 1649BOP RURAL 4249 43 79 9 52BOP URBAN 9480 171 312 30 201CHRISTCHURCH RURAL 3519 65 115 2 67CHRISTCHURCH URBAN 17958 497 1002 96 593GISBORNE RURAL 185 0 0GISBORNE URBAN 1530 20 61 1 21HAWKES BAY RURAL 846 6 12 6HAWKES BAY URBAN 5516 69 162 8 77MANAWATU RURAL 3762 23 63 2 25MANAWATU URBAN 4067 120 311 38 158MARLBOROUGH RURAL 559 0 0MARLBOROUGH URBAN 1794 61 186 19 80NELSON & BAYS RURAL 1120 17 32 2 19NELSON & BAYS URBAN 3795 123 335 39 162NORTHLAND RURAL 3790 51 150 10 61NORTHLAND URBAN 3263 80 223 36 116OTAGO RURAL 3112 91 155 5 96OTAGO URBAN 5318 143 262 25 168SOUTHLAND RURAL 1443 49 141 22 71SOUTHLAND URBAN 2792 9 43 4 13TARANAKI RURAL 1848 22 51 10 32TARANAKI URBAN 2932 86 201 47 133TIMARU-OAMARU RURAL 1019 11 20 1 12TIMARU-OAMARU URBAN 2445 28 90 15 43WAIKATO RURAL 6235 65 146 13 78WAIKATO URBAN 8583 150 322 65 215WAIRARAPA RURAL 734 14 18 14WAIRARAPA URBAN 1236 28 39 2 30WANGANUI RURAL 132 18 35 18WANGANUI URBAN 2028 26 113 15 41WELLINGTON RURAL 229 7 35 3 10WELLINGTON URBAN 18581 369 716 81 450WEST COAST 1546 26 63 7 330800 / 025 ETC 8336 440 837 95 535TOTAL 191283 4290 8676 1061 5351
ISCR 6/13/2002 31
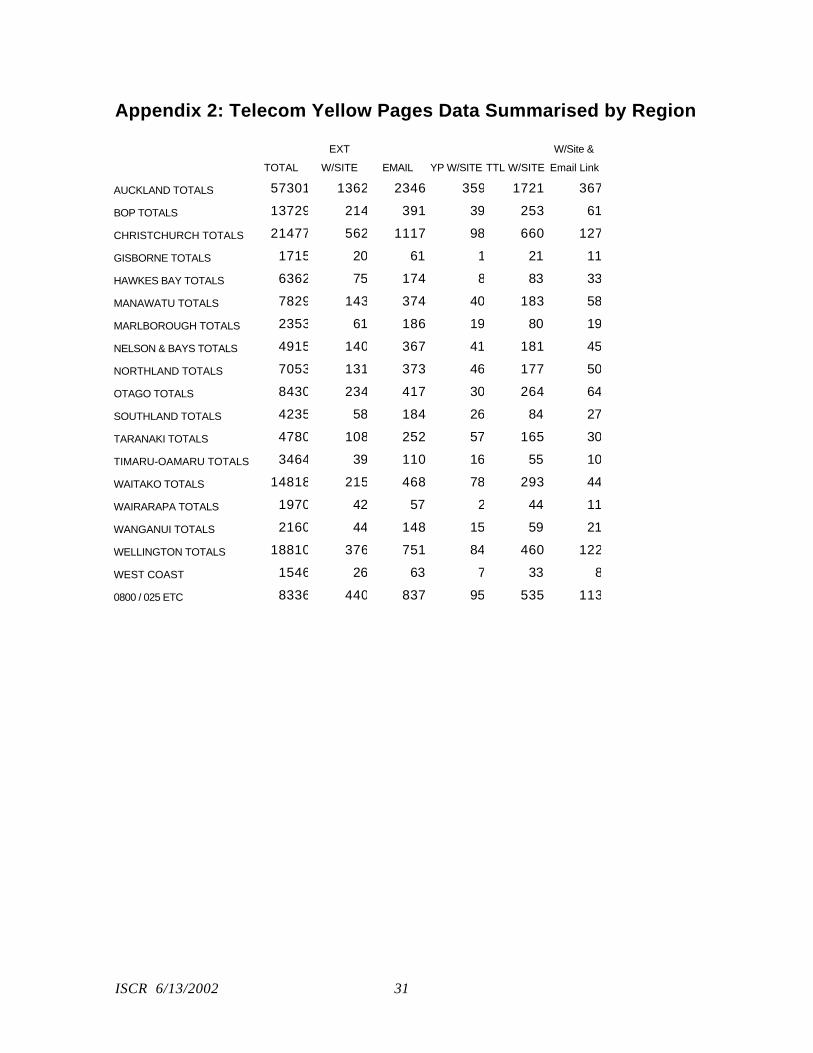
Appendix 2: Telecom Yellow Pages Data Summarised by Region
TOTAL
EXT
W/SITE EMAIL YP W/SITE TTL W/SITE
W/Site &
Email Link
AUCKLAND TOTALS 57301 1362 2346 359 1721 367
BOP TOTALS 13729 214 391 39 253 61
CHRISTCHURCH TOTALS 21477 562 1117 98 660 127
GISBORNE TOTALS 1715 20 61 1 21 11
HAWKES BAY TOTALS 6362 75 174 8 83 33
MANAWATU TOTALS 7829 143 374 40 183 58
MARLBOROUGH TOTALS 2353 61 186 19 80 19
NELSON & BAYS TOTALS 4915 140 367 41 181 45
NORTHLAND TOTALS 7053 131 373 46 177 50
OTAGO TOTALS 8430 234 417 30 264 64
SOUTHLAND TOTALS 4235 58 184 26 84 27
TARANAKI TOTALS 4780 108 252 57 165 30
TIMARU-OAMARU TOTALS 3464 39 110 16 55 10
WAITAKO TOTALS 14818 215 468 78 293 44
WAIRARAPA TOTALS 1970 42 57 2 44 11
WANGANUI TOTALS 2160 44 148 15 59 21
WELLINGTON TOTALS 18810 376 751 84 460 122
WEST COAST 1546 26 63 7 33 8
0800 / 025 ETC 8336 440 837 95 535 113
ISCR 6/13/2002 32
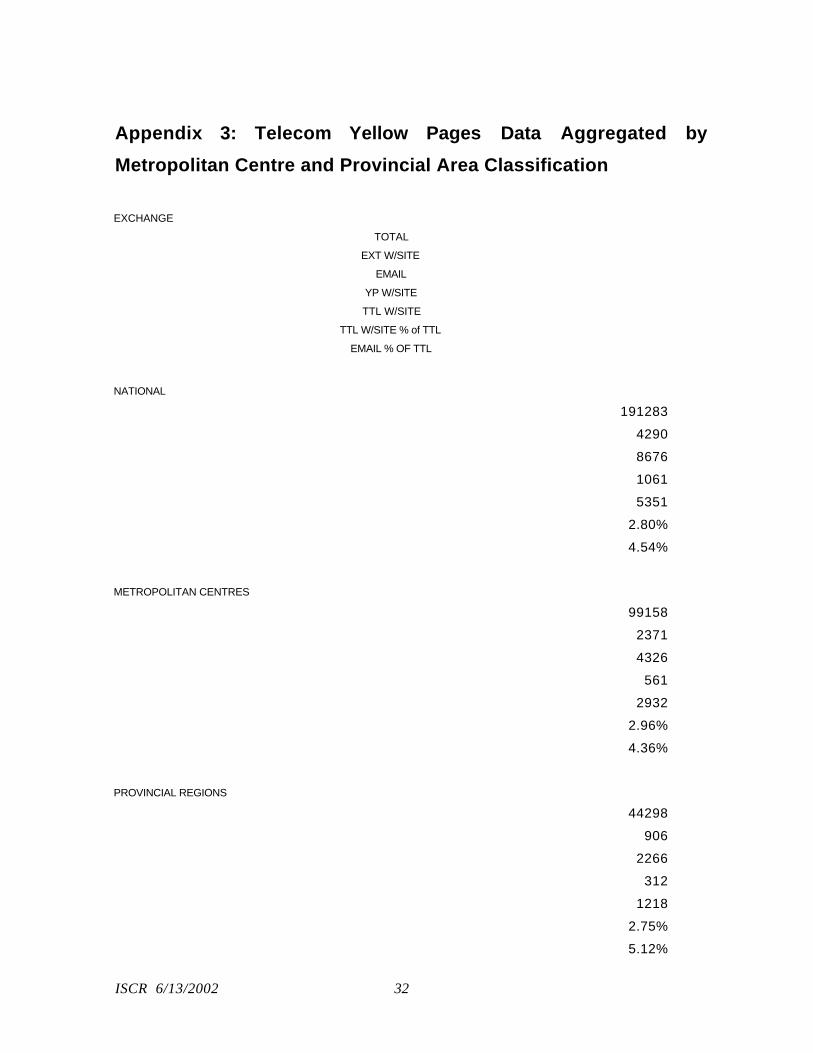
Appendix 3: Telecom Yellow Pages Data Aggregated by
Metropolitan Centre and Provincial Area Classification
EXCHANGE
TOTAL
EXT W/SITE
YP W/SITE
TTL W/SITE
TTL W/SITE % of TTL
EMAIL % OF TTL
NATIONAL
191283
4290
8676
1061
5351
2.80%
4.54%
METROPOLITAN CENTRES
99158
2371
4326
561
2932
2.96%
4.36%
PROVINCIAL REGIONS
44298
906
2266
312
1218
2.75%
5.12%

ISCR 6/13/2002 33
RURAL
39491
573
1247
93
666
1.69%
3.16%
0800 / 025
8336
440
837
95
535
6.42%
10.04%
ISCR 6/13/2002 34
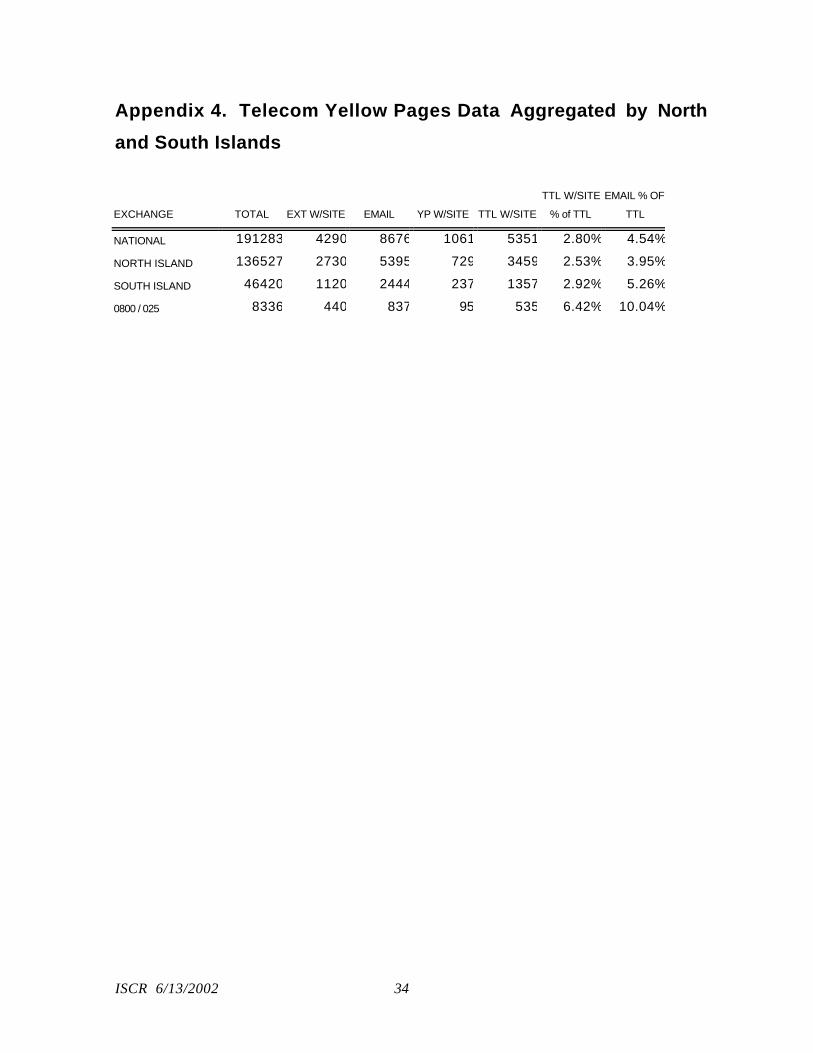
Appendix 4. Telecom Yellow Pages Data Aggregated by North
and South Islands
EXCHANGE TOTAL EXT W/SITE EMAIL YP W/SITE TTL W/SITE
TTL W/SITE
% of TTL
EMAIL % OF
TTL
NATIONAL 191283 4290 8676 1061 5351 2.80% 4.54%
NORTH ISLAND 136527 2730 5395 729 3459 2.53% 3.95%
SOUTH ISLAND 46420 1120 2444 237 1357 2.92% 5.26%
0800 / 025 8336 440 837 95 535 6.42% 10.04%

ISCR 6/13/2002 35
Appendix 5: Telecom Yellow Pages Data Aggregated by Rural
and Urban Centres
TOTAL EXT W/SITE EMAIL YP W/SITE TTL W/SITE
TTL W/SITE
% of TTL
EMAIL % OF
TTL
NATIONAL 191283 4290 8676 1061 5351 2.80% 4.54%
METROPOLITAN CENTRES 99158 2371 4326 561 2932 2.96% 4.36%
PROVINCIAL AND RURAL 83789 1544 3645 412 1956 2.33% 4.35%
0800 / 025 8336 440 837 95 535 6.42% 10.04%
ISCR 6/13/2002 36
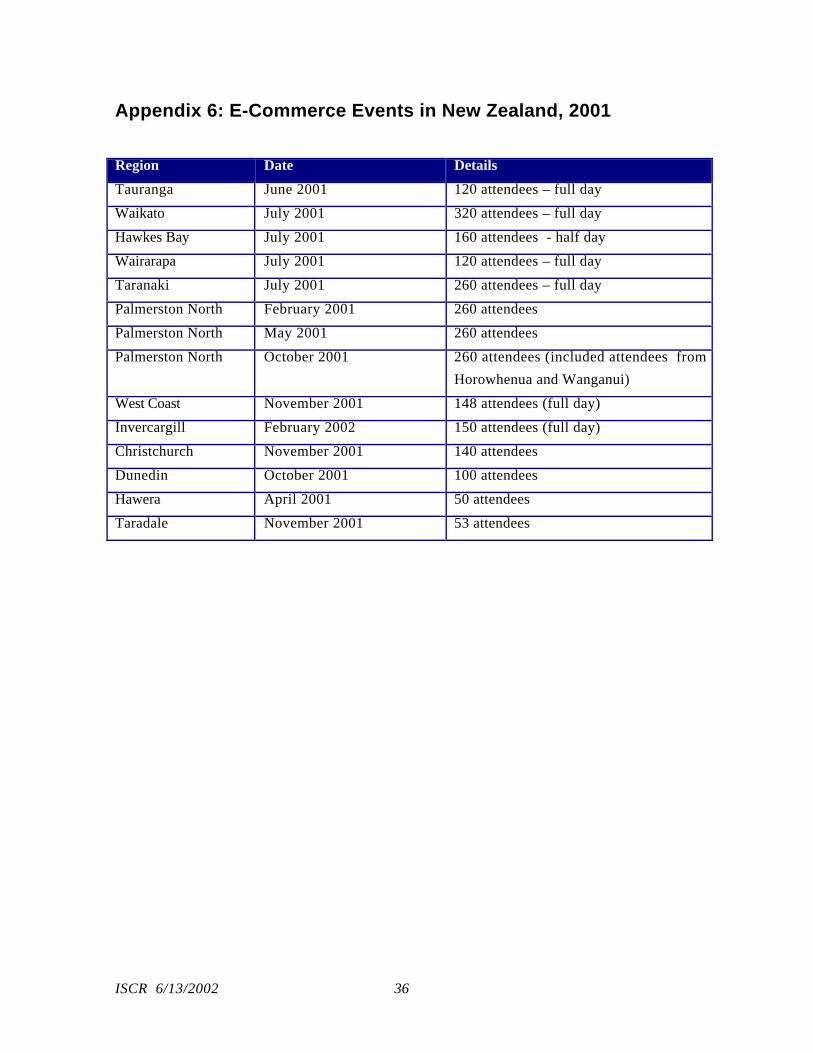
Appendix 6: E-Commerce Events in New Zealand, 2001
Region Date Details
Tauranga June 2001 120 attendees – full day
Waikato July 2001 320 attendees – full day
Hawkes Bay July 2001 160 attendees - half day
Wairarapa July 2001 120 attendees – full day
Taranaki July 2001 260 attendees – full day
Palmerston North February 2001 260 attendees
Palmerston North May 2001 260 attendees
Palmerston North October 2001 260 attendees (included attendees from
Horowhenua and Wanganui)
West Coast November 2001 148 attendees (full day)
Invercargill February 2002 150 attendees (full day)
Christchurch November 2001 140 attendees
Dunedin October 2001 100 attendees
Hawera April 2001 50 attendees
Taradale November 2001 53 attendees