The role of chest imaging in the diagnosis, management ...
14
Inui et al. Insights Imaging (2021) 12:155 https://doi.org/10.1186/s13244-021-01096-1 CRITICAL REVIEW The role of chest imaging in the diagnosis, management, and monitoring of coronavirus disease 2019 (COVID-19) Shohei Inui 1,2* , Wataru Gonoi 1 , Ryo Kurokawa 3 , Yudai Nakai 1 , Yusuke Watanabe 1 , Keita Sakurai 4 , Masanori Ishida 1 , Akira Fujikawa 2 and Osamu Abe 1 Abstract Coronavirus disease 2019 (COVID-19) pandemic has posed a major public health crisis all over the world. The role of chest imaging, especially computed tomography (CT), has evolved during the pandemic paralleling the accumulation of scientific evidence. In the early stage of the pandemic, the performance of chest imaging for COVID-19 has widely been debated especially in the context of comparison to real-time reverse transcription polymerase chain reaction. Current evidence is against the use of chest imaging for routine screening of COVID-19 contrary to the initial expecta- tions. It still has an integral role to play, however, in its work up and staging, especially when assessing complications or disease progression. Chest CT is gold standard imaging modality for COVID-19 pneumonia; in some situations, chest X-ray or ultrasound may be an effective alternative. The most important role of radiologists in this context is to be able to identify those patients at greatest risk of imminent clinical decompensation by learning to stratify cases of COVID-19 on the basis of radiologic imaging in the most efficient and timely fashion possible. The present availability of multiple and more refined CT grading systems and classification is now making this task easier and thereby con- tributing to the recent improvements achieved in COVID-19 treatment and outcomes. In this article, evidence of chest imaging regarding diagnosis, management and monitoring of COVID-19 will be chronologically reviewed. Keywords: SARS-CoV-2, 2019 novel coronavirus, COVID-19, CO-RADS, The RSNA expert consensus statement © The Author(s) 2021. Open Access This article is licensed under a Creative Commons Attribution 4.0 International License, which permits use, sharing, adaptation, distribution and reproduction in any medium or format, as long as you give appropriate credit to the original author(s) and the source, provide a link to the Creative Commons licence, and indicate if changes were made. The images or other third party material in this article are included in the article’s Creative Commons licence, unless indicated otherwise in a credit line to the material. If material is not included in the article’s Creative Commons licence and your intended use is not permitted by statutory regulation or exceeds the permitted use, you will need to obtain permission directly from the copyright holder. To view a copy of this licence, visit http://creativecommons.org/licenses/by/4.0/. Key points • Chest CT is gold standard imaging modality for COVID-19 pneumonia; in some situations, chest X-ray or ultrasound may be an effective alternative. • Chest imaging is not recommended for routine screening of COVID-19 in a resource-abundant envi- ronment. • Chest imaging is useful for assessing complications, disease progression, and prognostication of COVID- 19. • Proposed chest CT classification systems are useful for stratifying cases suspected of COVID-19. Introduction e outbreak of coronavirus disease 2019 (COVID- 19) has begun in Wuhan, Hubei province, China, and rapidly spread all over the world [1]. e World Health Organization (WHO) declared it a Public Health Emer- gency of International Concern on January 30, 2020 and a pandemic on March 11, 2020 [1, 2]. is latter designa- tion facilitated rigorous investigation and multinational large-scale study, with the rate of evidence accumulating explosively. Now this condition that was first reported as “pneumonia of unknown cause” has been profiled to a considerable degree [3]. Open Access Insights into Imaging *Correspondence: [email protected] 1 Department of Radiology, Graduate School of Medicine, The University of Tokyo, 7-3-1, Hongo, Bunkyo-ku, Tokyo 113-8655, Japan 2 Department of Radiology, Japan Self-Defense Forces Central Hospital, 1-2-24, Ikejiri, Setagaya-ku, Tokyo 154-0001, Japan Full list of author information is available at the end of the article
Transcript of The role of chest imaging in the diagnosis, management ...
Inui et al. Insights Imaging (2021) 12:155 https://doi.org/10.1186/s13244-021-01096-1
CRITICAL REVIEW
The role of chest imaging in the diagnosis, management, and monitoring of coronavirus disease 2019 (COVID-19)Shohei Inui1,2* , Wataru Gonoi1, Ryo Kurokawa3, Yudai Nakai1, Yusuke Watanabe1, Keita Sakurai4, Masanori Ishida1, Akira Fujikawa2 and Osamu Abe1
Abstract
Coronavirus disease 2019 (COVID-19) pandemic has posed a major public health crisis all over the world. The role of chest imaging, especially computed tomography (CT), has evolved during the pandemic paralleling the accumulation of scientific evidence. In the early stage of the pandemic, the performance of chest imaging for COVID-19 has widely been debated especially in the context of comparison to real-time reverse transcription polymerase chain reaction. Current evidence is against the use of chest imaging for routine screening of COVID-19 contrary to the initial expecta-tions. It still has an integral role to play, however, in its work up and staging, especially when assessing complications or disease progression. Chest CT is gold standard imaging modality for COVID-19 pneumonia; in some situations, chest X-ray or ultrasound may be an effective alternative. The most important role of radiologists in this context is to be able to identify those patients at greatest risk of imminent clinical decompensation by learning to stratify cases of COVID-19 on the basis of radiologic imaging in the most efficient and timely fashion possible. The present availability of multiple and more refined CT grading systems and classification is now making this task easier and thereby con-tributing to the recent improvements achieved in COVID-19 treatment and outcomes. In this article, evidence of chest imaging regarding diagnosis, management and monitoring of COVID-19 will be chronologically reviewed.
Keywords: SARS-CoV-2, 2019 novel coronavirus, COVID-19, CO-RADS, The RSNA expert consensus statement
© The Author(s) 2021. Open Access This article is licensed under a Creative Commons Attribution 4.0 International License, which permits use, sharing, adaptation, distribution and reproduction in any medium or format, as long as you give appropriate credit to the original author(s) and the source, provide a link to the Creative Commons licence, and indicate if changes were made. The images or other third party material in this article are included in the article’s Creative Commons licence, unless indicated otherwise in a credit line to the material. If material is not included in the article’s Creative Commons licence and your intended use is not permitted by statutory regulation or exceeds the permitted use, you will need to obtain permission directly from the copyright holder. To view a copy of this licence, visit http:// creat iveco mmons. org/ licen ses/ by/4. 0/.
Key points
• Chest CT is gold standard imaging modality for COVID-19 pneumonia; in some situations, chest X-ray or ultrasound may be an effective alternative.
• Chest imaging is not recommended for routine screening of COVID-19 in a resource-abundant envi-ronment.
• Chest imaging is useful for assessing complications, disease progression, and prognostication of COVID-19.
• Proposed chest CT classification systems are useful for stratifying cases suspected of COVID-19.
IntroductionThe outbreak of coronavirus disease 2019 (COVID-19) has begun in Wuhan, Hubei province, China, and rapidly spread all over the world [1]. The World Health Organization (WHO) declared it a Public Health Emer-gency of International Concern on January 30, 2020 and a pandemic on March 11, 2020 [1, 2]. This latter designa-tion facilitated rigorous investigation and multinational large-scale study, with the rate of evidence accumulating explosively. Now this condition that was first reported as “pneumonia of unknown cause” has been profiled to a considerable degree [3].
Open Access
Insights into Imaging
*Correspondence: [email protected] Department of Radiology, Graduate School of Medicine, The University of Tokyo, 7-3-1, Hongo, Bunkyo-ku, Tokyo 113-8655, Japan2 Department of Radiology, Japan Self-Defense Forces Central Hospital, 1-2-24, Ikejiri, Setagaya-ku, Tokyo 154-0001, Japan Full list of author information is available at the end of the article
Page 2 of 14Inui et al. Insights Imaging (2021) 12:155
The role of chest imaging, especially computed tomog-raphy (CT), has evolved during the pandemic paralleling the accumulation of scientific evidence. The performance of chest imaging for COVID-19 has widely been debated since the early period of the pandemic especially in the context of comparison to real-time reverse transcription polymerase chain reaction (RT-PCR). In this article, evi-dence of chest imaging regarding diagnosis, management and monitoring of COVID-19 will be chronologically reviewed.
Controversy of chest CT versus RT‑PCRPatients with SARS-Cov-2 infection can experience a diverse range of clinical presentations, from no symp-toms to acute respiratory distress syndrome (ARDS), septic shock, and/or multiple organ failure [4, 5]. SARS-Cov-2 virus is detectable in the respiratory tract 2–3 days before symptom onset, peaks at symptom onset, and declines over the following 7–8 days [6]. Difficulties in infection control of COVID-19 are in part ascribable to this viral shedding profile, contrasting to that of influenza virus that peaks after symptom onset [7]. RT-PCR is cur-rently the most reliable diagnostic tool for COVID-19 [8]. Specimens obtained from a nasopharyngeal or oro-pharyngeal swab are commonly used [7]. However, the false-negative rate of RT-PCR test is not negligible, esti-mated as 100% on the day of infection (day1) and 38% on the day of symptom onset (day 5), which decreases to 20% at 3 days after symptom onset (day 8) and increases again thereafter [9]. The instability of RT-PCR may be ascribed to variabilities in viral load depending on the disease stage and sampling error [5, 7, 8]. Bronchoalveo-lar lavage is more sensitive than RT-PCR but not realistic for route application [10]. In addition, in the early phase of the pandemic, the use of RT-PCR was limited because of logistical issues—including the development, mass production, and dissemination of the examination kit. The turnaround time of RT-PCR was several days in early 2020 [11].
Given these limitations of RT-PCR, the use of chest CT was widely debated since the early period of the pan-demic, especially in the context of replacing RT-PCR as a diagnostic tool [12, 13]. Chest CT was deemed more available in many hospitals and possibly able to achieve a superior diagnostic performance in the early period of infection [14]. Early radiological studies from China spurred this discussion. On February 2020, a study from China first reported that 5 symptomatic patients showed chest CT abnormalities despite initial PCR negative results [15]. A subsequent study from China reported that chest CT showed a higher sensitivity than RT-PCR (98% vs. 71%) [16]. Similar findings were also reported from a larger cohort study from China that investigated
1014 patients and revealed the sensitivity of chest CT and RT-PCR to be 97% and 88%, respectively, based on which they recommended chest CT for screening of COVID-19 instead of RT-PCR [17]. Finally, a meta-analysis from Korea summarizing early reports published within the first 1 month of the pandemic reported that the sensi-tivity of chest CT exceeds that of RT-PCR (93% vs. 89%) with a specificity of 37% [18].
However, problems were noted in many of the early studies published within 1 months of the pandemic: (1) Patient background was not specified; (2) disease severity of the cohort was biased toward severe and hospitalized cases; (3) the indications for performing chest CT scan were not described; (4) a definition of positive chest CT findings was not provided (despite positive CT findings were not equal to positive CT findings of COVID-19); (5) nonuniformity of the reference standard [19–22]. Antith-esis of screening by chest CT was presented in March 2020 by a Japanese study of a mass infection cohort, reporting the sensitivity of chest CT to be 79% in symp-tomatic and 54% in asymptomatic patients [23, 24].
Based on a risk–benefit analysis including diagnostic performance, medical cost, precaution issue, and risk of radiation exposure, medical specialty societies pub-lished position statements against the use of chest CT for screening of COVID-19 including the American College of Radiology (ACR), the Society of Thoracic Radiology (STR), and the American Society of Emergency Radiol-ogy (ASER) in March to April, 2020 [12, 25, 26]. The Fleischner Society also published a consensus statement of a multidisciplinary expert panel [27]. Their statement offered guidance for the use of chest imaging modalities in different healthcare environments and scenarios [27]. The multidisciplinary panel concluded that chest CT is not recommended for asymptomatic or mild sympto-matic patients with COVID-19 in the absence of accom-panying risk factors or routine screening in a resource abundant environment [27]. On the other hand, they rec-ommended chest CT for medical triage of patients with suspected COVID-19, who present with moderate to severe clinical features and a high-pretest probability of disease in a resource-constrained environment [27]. They also recommended chest CT for patients with moderate to severe symptoms with suspected COVID-19 or those experiencing respiratory functional impairment, hypox-emia, or both after recovery from infection [27]. For these patients, imaging provides a baseline for future compari-son, may reveal an alternative diagnosis, may establish manifestations of important comorbidities in patients with risk factors for disease progression, and may influ-ence treatment strategy and the intensity of monitoring for clinical worsening [27]. They discouraged the use of chest CT for diagnostic purpose of COVID-19; however,
Page 3 of 14Inui et al. Insights Imaging (2021) 12:155
situations are different in a resource-constrained envi-ronment, in which availability of RT-PCR is limited or at emergency room, where patients are critical condition necessitating prompt triage or unconscious and unable to speak their symptoms or exposure history [27].
Role of chest radiographChest X-ray used to be deemed less useful than chest CT because of their lower sensitivity in the diagnosis of sub-tle parenchymal abnormalities and limited ability to help differentiate parenchymal patterns [28]. Chest CT is gold standard imaging technique for thoracic evaluation of COVID-19, but is not always available, for example, for unstable patients in the intensive care unit (ICU) with hypoxemia and hemodynamic failure [29]. For these patients, bedside chest X-ray is still the standard of care. Other advantages of chest X-ray include its ready and wide availability, making it possible to use in almost all clinical settings [28]. Chest X-ray is less-resource inten-sive, is achieved with lower radiation doses, is easier to repeat, and can be performed with portable equipment at the point of care, minimizing the risk of cross-infec-tion related to patient transport [30]. Some early stud-ies argued against the use of chest X-ray as the first-line imaging modality because of its low sensitivity in detect-ing alterations [31, 32]. In contrast, the later statements of several radiological societies have encouraged its use in combination with RT-PCR instead of CT [27, 33].
The sensitivity of chest X-ray depends mainly on two factors, i.e., symptom severity and disease stage [33, 34]. In relation to the former, Kuo et al. conducted a research to evaluate the screening value of chest X-ray with 1964 patients with COVID-19 who were asymptomatic or had mild symptoms as defined by the consensus state-ment of the Fleischner Society [35]. They demonstrated that only 39 patients (2.0%) showed abnormal findings on chest X-ray and full recovered after supplemental oxygenation and inpatient treatment [35]. The results of this study validated the Fleischner Society’s proposal for the first clinical scenario, i.e., chest imaging is not rec-ommended for asymptomatic or mildly symptomatic patients. Although the amount of research focused on the other two clinical scenarios, i.e., mild to severe patients with abundant or limited-resources, some research may provide hints to them [4, 33, 36, 36]. One is an early study by Chen et al., in which their first 99 cases of COVID-19 in Wuhan, China, were described [4]. The study cohort seemingly comprised moderate to severe hospitalized patients, 33% of whom had organ dysfunction, and 100% showing chest radiograph abnormality on admission [4]. Several other studies investigated a less severe spectrum of patients [36, 37]. Wong et al. investigated a cohort of 64 patients (86% symptomatic and 14% asymptomatic),
69% of whom showed chest radiograph abnormalities on admission [36]. Toussie et al. investigated a cohort of 338 patients (43% inpatients and 57% outpatients), 50% of whom showed abnormalities on the first chest radio-graph at a mean of 4 days after onset [37]. The sensitivity of chest X-ray as a function of disease course was investi-gated by Vancheri et al., who recruited 240 mildly symp-tomatic patients with COVID-19 [33]. They showed that the sensitivity of chest X-ray was 63.3% on day 0–2, 72% on day 3–5, 81.2% on day 6–9, and 83.9% on day > 9 [33].
In summary, for the general population, chest X-ray is not recommended as the first-line imaging modality for early disease or asymptomatic or mildly symptomatic patients because of limited sensitivity compared to CT [35, 38]. In contrast, for those with progressed or mod-erate to severe disease, chest X-ray may be an effective alternative for assessing disease progression; the need for chest CT may be negated with positive chest X-ray find-ings [39]. For patients sensitive to radiation exposure, i.e., pregnant women or pediatric patients, or unstable patients unable to be transported to the CT room, chest X-ray is a useful alternative method of chest CT [29, 40].
Role of ultrasoundWith experience lung ultrasonography can be as useful as chest CT and superior to standard chest X-ray for evaluation of pneumonia and/or adult respiratory distress syndrome [40]. It has moreover the added benefits of ease of use, repeatability, no radiation exposure, and being cheap [40]. Point-of-care ultrasound using a hand-held mobile device enables assessments in various settings not only in emer-gency department and intensive care unit, but rural health-care facilities, nursing homes, and aeromedical transport as well [41]. The appropriate use of ultrasonography could decrease chest X-ray and CT use in patients in the ICU [40].
Ultrasonography artefacts arising from the chest wall and pleural surfaces can provide valuable information about diverse lung pathologies either correlating or not correlating with the existing lung pathology of COVID-19 [40]. The normal lung back reflects ultrasound waves providing a transverse parallel hyperechoic lines called A-line [38]. With disease progression, new signs includ-ing pleural line (A-line) thickening and irregularities and B-line artifact, vertical hyperechoic lines starting from the pleura and continuing to the bottom of the image, may be noted [38, 42]. The presence of B-line will vary among focal, multifocal, and confluent pat-terns of involvement [40]. As B-lines reflect interstitial thickening and inflammation, the number increases with disease severity [42]. Consolidation and increased echo-genicity of lung parenchyma with air-filled bronchi may also become apparent and increase in frequency and size [42]. The extent of consolidation may also vary becoming
Page 4 of 14Inui et al. Insights Imaging (2021) 12:155
more prominent with the assumption of diverse pat-terns, from multifocal, small, subpleural consolidations to non-translobar and translobar involvement, and in some cases accompanied by air bronchograms [40]. The most specific finding of pneumonia is “Shred Sign”, which reflects an irregular shredded appearance at the inter-face between aerated normal and consolidated lung [38]. Pleural effusions are uncommon, with generally only those patients who are more critically ill showing them [40]. The presence of A-lines through the recovery phase is considered an indirect sign of recovery [40].
A meta-analysis by Barssoum et al. showed a sensitivity of lung ultrasound of 68–93.3% and of NPV of 52–94.1%, highlighting the value of lung ultrasound as a screening test to rule out COVID-19 pneumonia [43–47]. In con-trast, the available data regarding specificity and PPV are conflicting with one study showing 92.9% and 84.6% for sensitivity and PPV, respectively, and another lower values of 21.3% and 19.2%, respectively [44, 47]. Lu et al. investigated the diagnostic performance of lung ultra-sound with chest CT as the reference demonstrating high sensitivity and specificity in mild, moderate, and severe lung lesions with 68.8%, 77.8%, and 100.0% and 85.7%, 76.2%, and 92.9%, respectively [44].
Standard reporting system of COVID‑19 pneumoniaOne unavoidable issue of the early radiological studies of COVID-19 was the subjectivity of image interpretation because of the insufficient evidence available [19–22].
In addition, early studies evaluated imaging findings in a binary fashion, COVID-19 positive or not, without con-sidering the specificity of the CT findings [15–17]. How-ever, this is in contrast to conventional clinical practice, where imaging findings are reported together with a dif-ferential diagnosis with different probabilities. Although COVID-19 presents a wide spectrum of imaging findings from typical (and highly specific) findings to atypical (and low specific) findings that overlap with those of other conditions, for the pursuit of high sensitivity, the discus-sion of specificity was not sufficient.
Accumulation of evidence has enabled radiologists to classify imaging findings by different specificities and establish standard reporting and CT categorization sys-tems based on the probability of COVID-19 [48]. To date, four major systems have been proposed as summarized in Table 1 [49]. The use of categorical CT grading systems facilitates objective and uniform interpretation of CT and smooth communication with professionals from different fields and with different experiences [48, 50]. The first to be published was by the British Society of Thoracic Imag-ing (BSTI) which issued the Guidance for the Report-ing Radiologist as a diagnostic framework of COVID-19 from chest CT and X-ray (BSTI classification) on March 16, 2020 [51]. BSTI classification comprises four catego-ries, i.e., “CLASSIC COVID-19” (100% confidence for COVID), “PROBABLE COVID-19” (71–99% confidence for COVID), “INDETERMINATE” (< 70% confidence for COVID), “NON-COVID” (70% confidence for alterna-tive) [51].
Table 1 Comparison of the chest CT categorization systems of COVID-19 [49]
RSNA Radiological Society of North America, CO-RADS the COVID-19 reporting and data system, COVID-RADS the COVID-19 imaging reporting and data system, BSTI British Society of Thoracic Imaging, RT-PCR Real-time reverse transcription polymerase chain reaction
Level of suspicion CO-RADS Category COVID-RADS category The RSNA expert consensus statement category
The BSTI guideline statement category
Not interpretable CO-RADS 0 (Scan technically insufficient for assigning a score)
Not defined Not defined Not defined
Very low CO-RADS 1 (Normal or nonin-fectious)
COVID-RADS 0 (Normal) Negative for pneumonia (No features of pneumonia)
NON-COVID (70% confidence for alternative)COVID-RADS 1 (Atypical find-
ings; noninfectious etiology or infectious etiology but inconsistent with COVID-19)
Low CO-RADS 2 (Typical for other infection but not COVID-19)
Atypical appearance (Uncom-monly or not reported fea-tures of COVID-19 pneumonia)
Equivocal/unsure CO-RADS 3 (Features compat-ible with COVID-19 but also other diseases)
COVID-RADS 2A (Fairly typical findings) COVID-RADS 2B (Combination of atypical find-ings with typical/fairly typical findings)
Indeterminate appearance (Nonspecific imaging features of COVID-19 pneumonia)
INDETERMINATE (< 70% confi-dence for COVID)
High CO-RADS 4 (Suspicious for COVID-19)
PROBABLE COVID-19 (71–99% confidence for COVID)
Very high CO-RADS 5 (Typical for COVID-19)
COVID-RADS 3 (Typical find-ings)
Typical appearance (com-monly reported imaging features of greater specificity for COVID-19)
CLASSIC COVID-19 (100% confi-dence for COVID)
Proven CO-RADS 6 (RT-PCR positive for SARS-CoV-2)
Not defined Not defined Not defined
Page 5 of 14Inui et al. Insights Imaging (2021) 12:155
On March 21, 2020, the Radiological Society of North America (RSNA) advocated an expert consen-sus statement on reporting a standard nomenclature and imaging classification for COVID-19 pneumonia (RSNA classification) made up of four categories (“typi-cal appearance”, “indeterminate appearance”, “atypi-cal appearance”, and “negative for pneumonia”) [52] (Fig. 1) [49]. “Typical appearance” is defined as the presence of three imaging features: (1) peripheral and bilateral GGO, (2) multifocal round-shaped GGO, (3) organizing pneumonia pattern including reversed halo sign. GGO is often associated with intralobular lines showing a “crazy-paving pattern” [52]. If GGO exists but their distribution or shape is not typical, it is assigned to the “indeterminate appearance” category, which is defined as the two types of imaging features: (1) multifocal and diffuse but nonperihilar or unilateral nonrounded GGO, (2) few very small GGO with a non-rounded and nonperipheral distribution [52]. If GGO is not present and other causes of pneumonia or intersti-tial pulmonary edema are surmised, it is categorized as
“atypical appearance” [52]. If no features of pneumonia exist, it is categorized as “negative for pneumonia” [52].
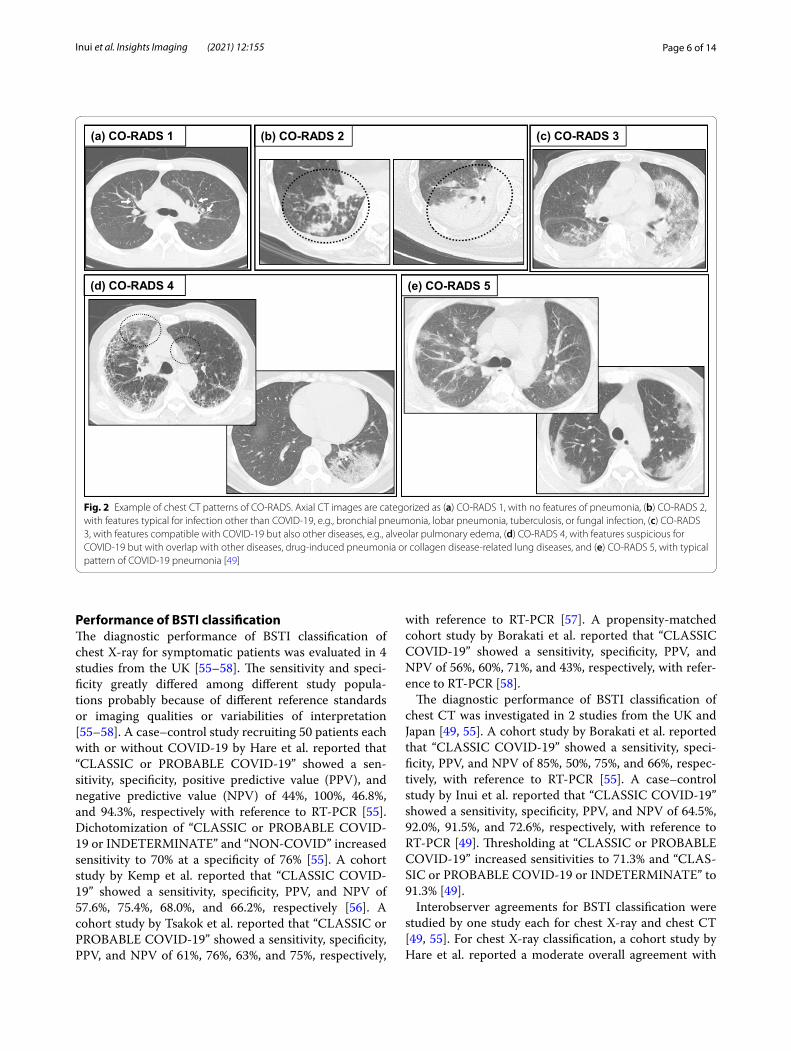
On April 27, a working group of the Dutch Radiological Society proposed the COVID-19 reporting and data sys-tem (CO-RADS) to facilitate the advances in and world-wide dissemination of COVID-19 related information and tools [53]. As shown Table 1, CO-RADS 1 mostly corresponds to RSNA “negative for pneumonia”, CO-RADS 2 to RSNA “atypical appearance”, and CO-RADS 5 to RSNA “typical appearance” [53]. To put it simply, RSNA “indeterminate appearance” was divided into CO-RADS 3 and 4; isolated peripheral GGO or multifo-cal peripheral but unilateral GGO is categorized as CO-RADS 4 and other GGO as CO-RADS 3 [5] (Fig. 2) [49].
On April 28, researchers of the University of Southern California devised a different structured reporting system based on a review of 37 published papers on the chest CT findings of COVID-19 entitled the COVID-19 imaging reporting and data system (COVID-RADS) that divides the CT findings into five categories (COVID-RADS 0, 1, 2A, 2B, and 3) [54].
(a) Negative for pneumonia (b) Atypical appearance
(c) Indeterminate appearance (d) Typical appearance
Fig. 1 Example of chest CT patterns of RSNA classification. Axial CT images are categorized as (a) “Negative for pneumonia” meaning no features of pneumonia, (b) “Atypical appearance”, meaning typical for other infection but not COVID-19, e.g., bronchial pneumonia, lobar pneumonia, tuberculosis, or fungal infection, (c) “Indeterminate appearance”, meaning the presence of feature suspicious for COVID-19 but with overlaps with other diseases, drug-induced pneumonia, collagen disease-related lung diseases, or alveolar pulmonary edema, and (d) “Typical appearance”, meaning the typical pattern of COVID-19 pneumonia [49]
Page 6 of 14Inui et al. Insights Imaging (2021) 12:155
Performance of BSTI classificationThe diagnostic performance of BSTI classification of chest X-ray for symptomatic patients was evaluated in 4 studies from the UK [55–58]. The sensitivity and speci-ficity greatly differed among different study popula-tions probably because of different reference standards or imaging qualities or variabilities of interpretation [55–58]. A case–control study recruiting 50 patients each with or without COVID-19 by Hare et al. reported that “CLASSIC or PROBABLE COVID-19” showed a sen-sitivity, specificity, positive predictive value (PPV), and negative predictive value (NPV) of 44%, 100%, 46.8%, and 94.3%, respectively with reference to RT-PCR [55]. Dichotomization of “CLASSIC or PROBABLE COVID-19 or INDETERMINATE” and “NON-COVID” increased sensitivity to 70% at a specificity of 76% [55]. A cohort study by Kemp et al. reported that “CLASSIC COVID-19” showed a sensitivity, specificity, PPV, and NPV of 57.6%, 75.4%, 68.0%, and 66.2%, respectively [56]. A cohort study by Tsakok et al. reported that “CLASSIC or PROBABLE COVID-19” showed a sensitivity, specificity, PPV, and NPV of 61%, 76%, 63%, and 75%, respectively,
with reference to RT-PCR [57]. A propensity-matched cohort study by Borakati et al. reported that “CLASSIC COVID-19” showed a sensitivity, specificity, PPV, and NPV of 56%, 60%, 71%, and 43%, respectively, with refer-ence to RT-PCR [58].
The diagnostic performance of BSTI classification of chest CT was investigated in 2 studies from the UK and Japan [49, 55]. A cohort study by Borakati et al. reported that “CLASSIC COVID-19” showed a sensitivity, speci-ficity, PPV, and NPV of 85%, 50%, 75%, and 66%, respec-tively, with reference to RT-PCR [55]. A case–control study by Inui et al. reported that “CLASSIC COVID-19” showed a sensitivity, specificity, PPV, and NPV of 64.5%, 92.0%, 91.5%, and 72.6%, respectively, with reference to RT-PCR [49]. Thresholding at “CLASSIC or PROBABLE COVID-19” increased sensitivities to 71.3% and “CLAS-SIC or PROBABLE COVID-19 or INDETERMINATE” to 91.3% [49].
Interobserver agreements for BSTI classification were studied by one study each for chest X-ray and chest CT [49, 55]. For chest X-ray classification, a cohort study by Hare et al. reported a moderate overall agreement with
(a) CO-RADS 1 (b) CO-RADS 2 (c) CO-RADS 3
(d) CO-RADS 4 (e) CO-RADS 5
Fig. 2 Example of chest CT patterns of CO-RADS. Axial CT images are categorized as (a) CO-RADS 1, with no features of pneumonia, (b) CO-RADS 2, with features typical for infection other than COVID-19, e.g., bronchial pneumonia, lobar pneumonia, tuberculosis, or fungal infection, (c) CO-RADS 3, with features compatible with COVID-19 but also other diseases, e.g., alveolar pulmonary edema, (d) CO-RADS 4, with features suspicious for COVID-19 but with overlap with other diseases, drug-induced pneumonia or collagen disease-related lung diseases, and (e) CO-RADS 5, with typical pattern of COVID-19 pneumonia [49]

Page 7 of 14Inui et al. Insights Imaging (2021) 12:155
Fleiss’ kappa of 0.50 among 6 radiologists [55]. For chest CT classification, a cross-sectional study by Inui et al. reported moderate to good agreements with 0.54, 0.61, and 0.54 with Fleiss’ kappa, Cohen’s kappa, and Light’s kappa, respectively [49].
Performance of RSNA classificationDiagnostic performance of the RSNA classification was evaluated for symptomatic patients with reference to RT-PCR as summarized in Table 2 [49, 59–66]. A retrospec-tive single-center cohort study from Italy that included 460 symptomatic patients with suspected COVID-19 from February 27 to March 27, 2020, showed that the sensitivity and specificity of “typical appearance” were 71.6% and 91.6% [61]. When “typical appearance” and “indeterminate appearance” were grouped together, the sensitivity increased to 88.6% [61]. They also revealed that PPV of “typical appearance” was 40.0% at a preva-lence of 16.7% and increased to 87.8% at 46.4% [61]. Similar trends were observed in reports from other coun-tries, i.e., Brazil [60, 63, 66, 67], Japan [49], and USA [64] and other institutions in Italy [61, 62, 65]. Regarding the diagnostic performance against other viral pneumo-nias, a retrospective cohort study from Brazil reported similar results with a sensitivity and specificity of 73.6% and 97.7%, respectively, for “typical appearance” [65]. They also evaluated the CT classification in relation to the duration of symptoms, which showed that “indeter-minate appearance” and “negative for pneumonia” were significantly more frequent in patients with symptom duration of 0–5 days than > 5 days, suggesting milder CT patterns in the early stage of infection [66]. A retrospec-tive cohort study from Italy that compared the diagnostic performance in relation to age reported that PPV, NPV, and accuracy were not statistically different among the different age groups in their study comprising patients > 60, ≥ 50 and < 60, or < 50 [62].
Interobserver agreements could not be directly com-pared because of the difference in methodology, indica-tors, or observer experiences among studies [49, 64, 68]. A cohort study by de Jaegere et al. reported moderate to good interobserver agreement with a weighted kappa of 0.57–0.66 between two chest radiologists and a radiol-ogy resident [68]. A cross-sectional study by Inui et al. included 8 radiologists with different length of experi-ence (4 less than 10 years and 4 more than 10 years) and held an experimental training session to familiarize all of the observers with the categorization systems beforehand [49]. They showed moderate to good interobserver agree-ment across observers with an average Cohen’s kappa of 0.63 and Light’s kappa of 0.55 [49]. Another cohort study by Som and Lang et al. that included 6 radiologists with experience durations ranging 1–15 years reported mod-erate to high interobserver agreements among attending radiologists with kappa values of 0.43–0.86 and moderate agreements among trainee radiologists with kappa values of 0.62 and 0.77 [64].
Factors underlying interobserver disagreements were investigated in these studies. One study revealed that the presence of co-existing lung diseases affected inter-observer agreements because COVID-19 pneumonia often mimics acute aggravation of interstitial pneumonia (IP) or emphysema when superimposed on them [49]. Another study employed a self-reported certainty scoring method, in which each observer noted his/her confidence of each categorization [64]. They found that disagree-ments were associated with two or more dominant find-ings suggestive of multiple diseases, minimal disease, and an ambiguous distribution or morphology of findings [64]. They also identified atelectasis, nodular morphol-ogy, presence of pre-existing disease, and a peribronchial pattern suggestive of organizing pneumonia as sources of uncertainty [6].
Table 2 Performance of RSNA classification
RSNA Radiological Society of North America, RT-PCR real-time reverse transcription polymerase chain reaction, Sen sensitivity, Spe specificity, PPV positive predictive value, NPV negative predictive value, pt patients, CT computed tomography
First author Country Inclusion period [in 2020]
Number of patient RT-PCR positivity (%)
Typical appearance Typical or indeterminate appearance
Sen Spe PPV NPV Sen (%) Spe (%) PPV (%) NPV (%)
Barbosa [60] Brazil Feb to Mar 91 28 64% 85% 61% 86% 92 62 48 95
Cicaresse [61] Italy 2/27–3/27 460 46 72% 92% 88% 79% 89 67 69 87
Falaschi [62] Italy 3/3–4/9 773 60 — — — — 91 79 86 85
Santos [63] Brazil 3/13–3/23 71pt/75CT 45 83% 97% 95% 87% 92 79 78 92
Som [64] USA 1/15–3/30 89 40 86% 80% 74% 89% 98 55 60 98
Colombi [65] Italy 3/30–4/13 239 45 — — — — 85 69 69 85
Inui [49] Japan 1/30–6/30 100 50 74% 83% 81% 76% 92 41 61 84
De Saliva Teles [66] Brazil 3/15–3/24 175 50 74% 98% 97% 79% 83 88 87 84
Page 8 of 14Inui et al. Insights Imaging (2021) 12:155
Tabl
e 3
Perf
orm
ance
of C
O-R
AD
S
CO-R
ADS
the
COVI
D-1
9 re
port
ing
and
data
sys
tem
, RT-
PCR
real
-tim
e re
vers
e tr
ansc
riptio
n po
lym
eras
e ch
ain
reac
tion;
Sen
, sen
sitiv
ity, S
pe s
peci
ficity
, PPV
pos
itive
pre
dict
ive
valu
e, N
PV n
egat
ive
pred
ictiv
e va
lue
Firs
t aut
hor [
refe
renc
e]Co
untr
yIn
clus
ion
peri
od [i
n 20
20]
No.
of p
atie
ntRT
-PCR
po
sitiv
ity
(%)
CO-R
AD
S 5
≥ C
O-R
AD
S 4
≥ C
O-R
AD
S 3
Sen
Spe
PPV
NPV
Sen
(%)
Spe
(%)
PPV
(%)
NPV
(%)
Sen
Spe
PPV
NPV
de Ja
eger
e [6
8]N
ethe
rland
s3/
12–3
/23
9647
62%
98%
96%
75%
8492
9187
––
––
Her
man
s [6
9]N
ethe
rland
s3/
27–4
/20
319
4275
%94
%90
%84
%90
8885
9393
%66
%66
%93
%
De
Smet
[70]
Belg
ium
3/19
–4/2
085
942
78%
93%
89%
86%
8585
8089
89%
85%
69%
90%
Fujio
ka [7
1]Ja
pan
Jan-
Jun
154
4953
%94
%90
%67
%68
8885
74–
––
–
Kore
vaar
[72]
Net
herla
nds
3/16
–4/1
623
947
––
—–
9370
7392
97%
51%
64%
96%
Belli
ni [7
3]Ita
ly3/
9–5/
357
223
––
––
6181
5087
––
––
Tuca
to [7
4]Ita
lyU
nspe
cifie
d12
043
91%
91%
92%
90%
7575
7772
74%
76%
77%
72%
Niv
et [7
5]Fr
ance
3/13
–4/1
451
348
79%
97%
96%
84%
9284
8492
96%
43%
60%
92%
Inui
[49]
Japa
n1/
30–6
/30
100
5065
%89
%86
%72
%86
6873
8391
%54
%66
%86
%
Liev
eld
[76]
Neh
erla
nds
3/19
–3/2
874
150
––
––
8987
7695
95%
54%
49%
96%
Scha
leka
mp
[77]
Net
herla
nds
3/20
–4/3
1070
5071
%88
%86
%75
%86
8182
8592
%66
%73
%89
%
Gro
ss [7
8]G
erm
any
3/22
–4/7
9620
80%
99%
95%
95%
9091
7197
90%
63%
38%
96%
Page 9 of 14Inui et al. Insights Imaging (2021) 12:155
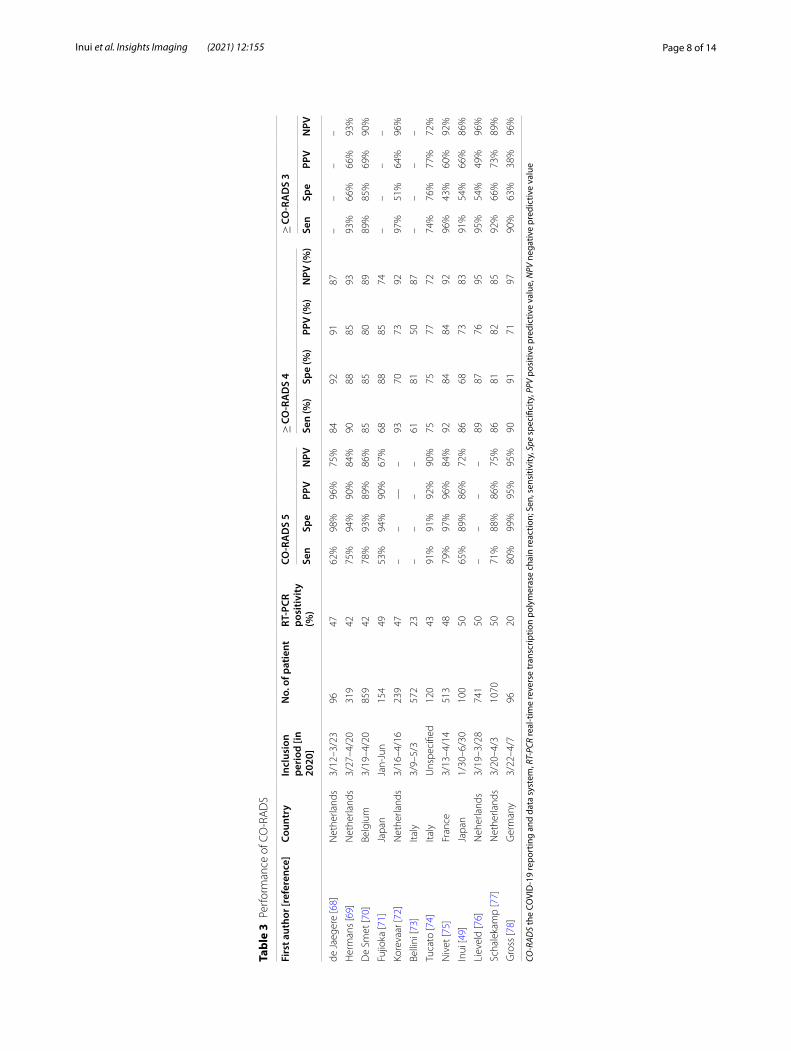
Performance of CO‑RADSDiagnostic performance of CO-RADS was evaluated in both symptomatic and asymptomatic patients with reference to RT-PCR as summarized in Table 3 [49, 59, 68–78]. A retrospective single-center cohort study from the Netherlands that included 1070 symptomatic patients with suspected COVID-19 from March 22 to April 7, 2020, showed that the sensitivity and specific-ity of CO-RADS 5 were 71% and 88%, respectively. [77]. They also showed the sensitivity increased to 86% at the threshold of ≥ CO-RADS 4 and 92% at ≥ CO-RADS 3. The PPV and NPV for CO-RADS 5 were reported to be 86% and 75% at the incidence of 50%, respectively [77]. Similar trends were observed in the subsequent reports from other countries including Belgium [70], France [75], Germany [78], Italy [73, 74], and Japan [49, 71] and other institutions from the Netherlands [68, 69, 72, 76, 77].
Regarding the diagnostic performance for asympto-matic patients, a retrospective cohort study from a pan-demic area in Belgium included 859 asymptomatic and 1138 symptomatic patients with suspected COVID-19 [70]. The sensitivity was lower but the specificity was higher in asymptomatic than symptomatic patients at the thresholds of CO-RADS 3 to CO-RADS 5 (e.g., sensitiv-ity and specificity, 78% and 93% in symptomatic patients for CO-RADS 5 vs 18% and 98% in asymptomatic one) [70]. For asymptomatic patients with an incidence of 5.8%, judgments of COVID-19 positive at the thresholds of ≥ CO-RADS 3 increased the posttest probability to 18–32% with specificity of 89–98% [70]. However, judg-ments of COVID-19 negative only slightly decreased the posttest probability to 3.3–4.4% with sensitivity of 18–45% [70]. Judging from these results, chest CT pat-terns of ≥ CO-RADS 3 in asymptomatic patients raise strong suspicion of COVID-19, while those < CO-RADS 3 do not rule it out, arguing against the use of chest CT as a screening test for asymptomatic individuals. On the other hand, for symptomatic patients with an incidence of 42%, only CO-RADS 5 increased the posttest probabil-ity to 89% [70]. Therefore, from the standpoint of infec-tion control, CO-RADS 5 may be used as a triage tool to quarantine symptomatic individuals in settings with bot-tlenecks in RT-PCR tests.
In relation to the duration of symptoms, CO-RADS achieved the highest diagnostic performance in patients with a symptom duration of 2–7 days, followed by those with symptom durations of more than 7 days and less than 2 days [77]. Abdel-Tawab et al. investigated 359 patients with COVID-19 and showed that the chest CT positivity as defined by ≥ CO-RADS 3 was only 9.4% for asymptomatic/mild symptomatic group, which increased to 94.7% and 97.8% for moderately and severely symp-tomatic groups, respectively [48]. They also showed that
chest CT positivity is roughly parallel to age groups as defined by < 15 years, 15–50 years, or > 50 years [48]. A head-to-head comparison study from Japan showed that the diagnostic performance of CO-RADS exceeded that of RSNA classification and COVID-RADS (area under the receiver operating characteristic curve: AUCs; 0.84.xx for CO-RADS versus 0.81 for RSNA classification and 0.80 for COVID-RADS) [49].
Interobserver agreements of CO-RADS also vary in methods among studies. A cohort study by de Bellini et al. recruited 9 radiologists and reported substantially varied results between different levels of experience with a Fleiss’ kappa of 0.38–0.66 [73]. A cohort study by de Jaegere et al. reported good interobserver agree-ment with a weighted kappa of 0.65–0.77 between two chest radiologists and a radiology resident [68]. A cross-sectional study by Inui et al. reported good agreement with Fleiss’ kappa of 0.62 among 8 observers [49]. Some studies used an interclass coefficient (ICC) as an indica-tor [48, 71]. However, ICC is the best option for use with continuous variables or categorical variables with the ordinal scale of the same distance between categories (e.g., score 1–5) [79]. Instead, the CT categorization sys-tems are nominal scales that numbered (e.g., CO-RADS 0–6) groups of CT patterns and therefore, the use of ICC is not recommended.
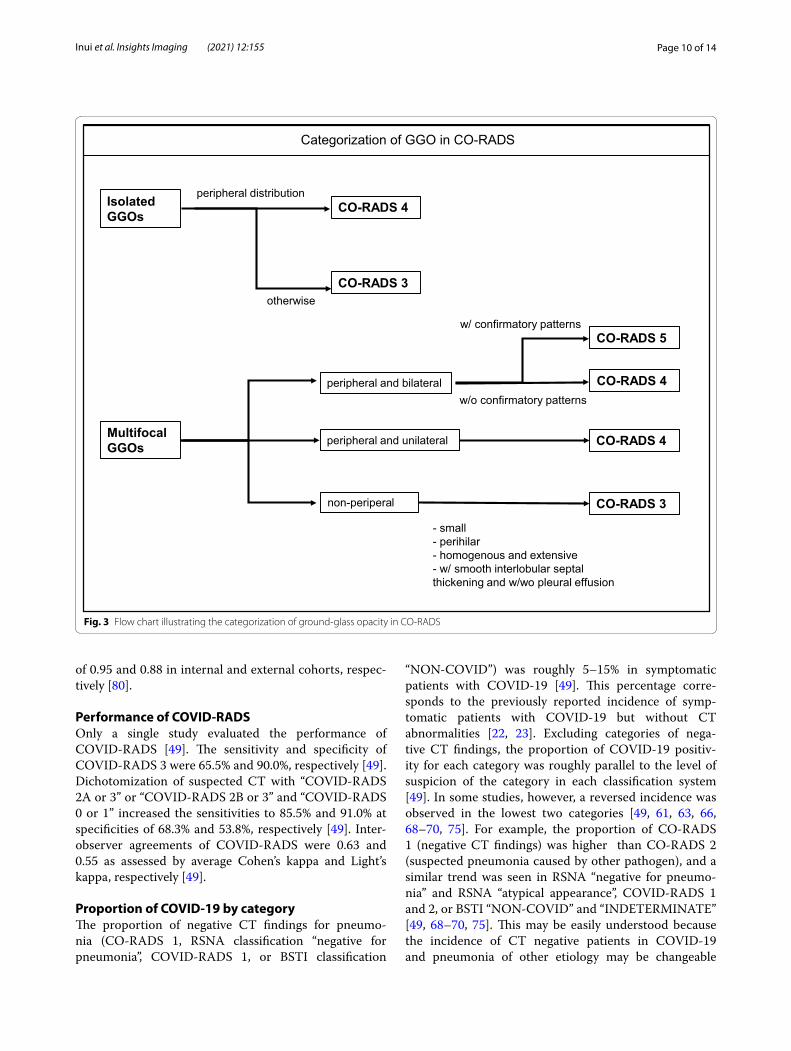
CO-RADS is a detailed categorization system but has the one potential limitation of complexity of its GGO cat-egorization [49]. To resolve this issue, Inui et al. proposed the use of sample CT patterns that may facilitate the understanding and categorization work as summarized in Fig. 3 [49]. With this workflow, first GGOs incompat-ible with CO-RADS 1 or 2 are classified into isolated GGOs regardless of size [49]. For an isolated GGO, those with peripheral distribution fall into CO-RADS 4 and not CO-RADS 3 [49]. For multifocal GGOs, lesions are further classified into peripheral or non-peripheral dis-tribution [49]. Multifocal, peripheral and bilateral GGOs fall into CO-RADS 5 if the confirmatory patterns are pre-sent and CO-RADS 4 if not [49]. Multifocal and periph-eral but unilateral GGOs are categorized as CO-RADS 4 regardless of the presence of the confirmatory pattern [49]. Then, non-peripheral lesions are categorized as CO-RADS 3 regardless of laterality. Such lesions include small, perihilar, and homogeneous extensive ones [49].
Another possible solution to avoid the complexity of CO-RADS categorization is to an artificial intelligence (AI)-based algorithm created by the authors of CO-RADS original article [80]. This software is available for free, works in the local computer, and automatically perform CO-RADS categorization from DICOM files of chest CT [80]. The performance of AI-based system was externally validated in the original article with an AUC
Page 10 of 14Inui et al. Insights Imaging (2021) 12:155
of 0.95 and 0.88 in internal and external cohorts, respec-tively [80].
Performance of COVID‑RADSOnly a single study evaluated the performance of COVID-RADS [49]. The sensitivity and specificity of COVID-RADS 3 were 65.5% and 90.0%, respectively [49]. Dichotomization of suspected CT with “COVID-RADS 2A or 3” or “COVID-RADS 2B or 3” and “COVID-RADS 0 or 1” increased the sensitivities to 85.5% and 91.0% at specificities of 68.3% and 53.8%, respectively [49]. Inter-observer agreements of COVID-RADS were 0.63 and 0.55 as assessed by average Cohen’s kappa and Light’s kappa, respectively [49].
Proportion of COVID‑19 by categoryThe proportion of negative CT findings for pneumo-nia (CO-RADS 1, RSNA classification “negative for pneumonia”, COVID-RADS 1, or BSTI classification
“NON-COVID”) was roughly 5–15% in symptomatic patients with COVID-19 [49]. This percentage corre-sponds to the previously reported incidence of symp-tomatic patients with COVID-19 but without CT abnormalities [22, 23]. Excluding categories of nega-tive CT findings, the proportion of COVID-19 positiv-ity for each category was roughly parallel to the level of suspicion of the category in each classification system [49]. In some studies, however, a reversed incidence was observed in the lowest two categories [49, 61, 63, 66, 68–70, 75]. For example, the proportion of CO-RADS 1 (negative CT findings) was higher than CO-RADS 2 (suspected pneumonia caused by other pathogen), and a similar trend was seen in RSNA “negative for pneumo-nia” and RSNA “atypical appearance”, COVID-RADS 1 and 2, or BSTI “NON-COVID” and “INDETERMINATE” [49, 68–70, 75]. This may be easily understood because the incidence of CT negative patients in COVID-19 and pneumonia of other etiology may be changeable
Isolated GGOs
Multifocal GGOs
peripheral distributionCO-RADS 4
CO-RADS 3otherwise
peripheral and bilateral
peripheral and unilateral
non-periperal
CO-RADS 5
CO-RADS 4w/o confirmatory patterns
CO-RADS 4
CO-RADS 3
- small- perihilar- homogenous and extensive- w/ smooth interlobular septal thickening and w/wo pleural effusion
Categorization of GGO in CO-RADS
w/ confirmatory patterns
Fig. 3 Flow chart illustrating the categorization of ground-glass opacity in CO-RADS

Page 11 of 14Inui et al. Insights Imaging (2021) 12:155
depending on the inclusion criteria among community-acquired infection populations. Specifically, CT positiv-ity is roughly parallel to the severity of symptoms and age and dependent on disease stage [48, 77].
Comparison of the proposed CT categorization systemsEach of the proposed standard reporting system has its own pros and cons. The RSNA and BSTI classifications are easy to interpret and categorize based on gestalt imag-ing interpretation of CT, as their categories are assigned according to specific patterns [49]. One disadvantage of the RSNA classification is that it does not address any co-existing lung diseases, thereby probably compromis-ing the diagnostic performance, as discussed above [49, 64]. In contrast, CO-RADS is seemingly complex because its categorization of GGO is more detailed (3 categories in CO-RADS vs. 2 categories in the other) and employs more rigorous definitions [49]. However, this kind of detailed categorization enhances the overall diagnostic performance and enables more effective optimization of diagnostic thresholds depending on the pre-test prob-abilities of the corresponding area. In addition, broad evidence is available regarding its clinical application in various settings [49, 59, 68–78]. Meanwhile, complexity may be the only disadvantage, which may be resolved by use of the proposed flow chart (Fig. 3). COVID-RADS is also a complex system that assigns scores for each CT finding, while the overall score is defined by a combina-tion of them [49]. One disadvantage of COVID-RADS is that it does not consider zonal distribution of lesions on the axial plane [49]. In addition, it categ orizes “multifo-cal GGO” as a “typical finding” but there may be overlap with other diseases including bronchial, viral, or fungal pneumonia, lymphoproliferative diseases, and early-stage interstitial pneumonia [49]. Moreover, typical patterns of COVID-19 may be downgraded from COVID-RADS 3 to 2B when they are accompanied with “fairly typical findings” including a small amount of pleural effusion, pulmonary, emphysema, or fibrosis, with many such COVID-19 cases encountered [49]. In summary, the authors conclude that CO-RADS is the most balanced, effectively optimized, and evidence-based method among the proposed reporting systems.
Clinical course of COVID‑19 pneumoniaDefining disease stage and predicting and monitoring disease progression are major roles of chest imaging. A typical pattern of disease progression of COVID-19 starts as subpleural non-segmented GGOs or small rounded GGOs in the middle layer of the lung parenchyma that distribute unilaterally or bilaterally, culminating in a
crazy-paving pattern and subsequent consolidation [81, 82]. According to Pan et al., chest CT patterns can be divided into the following 4 stages: (1) early stage (day 0–4), when the main findings are GGOs occasionally accompanied by crazy-paving patterns that distribute unilaterally or bilaterally (chest CT findings may be nega-tive at this stage), (2) progressive stage (day 5–8), when regions progressively congregate and extend bilaterally, with increased frequency and proportion of crazy-pav-ing and consolidation, (3) peak stage (day 9–13), when regions slowly expand with an increasing proportion of consolidation and peaks out often accompanied with an organizing pneumonia pattern, i.e., volume reduction, perilobular distribution, and/or residual parenchymal band, and (4) absorption stage (days ≥ 14), when con-solidations are gradually absorbed with GGOs being the most frequent findings [81]. The disease severity peaks at 6–11 days on chest CT and 10–12 days on chest X-ray after symptom onset [35, 81].
Prognostic value of chest imaging findingsSome imaging findings were revealed to be useful to predict the clinical course or prognosis of COVID-19. Columbi et al. evaluated the percentage of well-aerated lung area visually or with a computer-aided method, in which normal opacity area less than 71–73% was associ-ated with ICU admission or death with odds ratio (OR) of 5.4 [83]. They also showed that patients who were admit-ted to ICU or died had a higher percentage of ≥ 4 affected lobes [83]. Li et al. also investigated the relationship between prognosis and pneumonia extension as evalu-ated by the chest CT score, in which patients who died had higher CT scores on the initial examination in those over 60 years [84]. Lieveld et al. showed that the chest CT score was significantly positively associated with hospital and ICU admission, and in-hospital and 30-day mortal-ity for all age groups in patients with COVID-19 and CT patterns ≥ CO-RADS 3 [76]. Abdel-Tawab et al. showed that all death cases occurred in patients with CO-RADS 5 and “typical appearance” of RSNA classification, sug-gesting possible prognostic value of the CT categoriza-tion systems [48].
Similar results were obtained from studies that inves-tigated chest X-ray on admission. Toussie et al. scored chest X-ray on a 7-point scale for each lung in young and middle-aged patients [36]. They showed that a total score of ≥ 2 was associated with hospital admission (OR 6.2) and total score of ≥ 3 was an independent predictor of intubation (OR 4.7) in young and middle-aged patients. Schalekamp and Huisman et al. reported that distribu-tion of lung disease on chest X-ray and chest X-ray sever-ity score was associated with ICU admission and/or death [85].
Page 12 of 14Inui et al. Insights Imaging (2021) 12:155
One notable fact to keep in mind when interpreting evidence regarding the prognostic value of the initial chest CT or X-ray is that these studies were based on patients with moderate-to-severe lung involvement. The relationship between the degree of lung involvement in the initial chest imaging and prognosis is mostly applica-ble to asymptomatic or mildly symptomatic patients from the authors’ experience. However, in the authors’ experi-ence, in some patients with mild symptoms but especially with risk factors, acute aggravation is often experienced after about 1 week of symptom onset, often resulting in death inside or outside the hospital. Therefore, cau-tion is needed when applying the evidence to individual patients, and close monitoring is recommended for high-risk patients whose symptoms were even mild or the ini-tial chest imaging findings were minimal.
Long‑term chest imaging findingsCT abnormalities may persist after recovery of COVID-19. Han and Fan et al. reported 6-month follow-up results of severe COVID-19 pneumonia [86]. Surprisingly, 40/114 (35%) of patients showed CT abnormalities suggestive of fibrotic change, which was associated with factors including age over 50, ARDS, and more prominent CT lung involve-ment [86]. This may be ascribed in part to the fact that the severity of the lung parenchyma injury may reflect the intensity of the repair process including hyaline membrane production and fibroblast accumulation, which later results in fibrotic changes [87–89]. They also showed that 27/104 (26%) of patients had abnormal diffusing capacity of the lung as assessed by carbon monoxide or DLCO, which was more frequent in those with fibrotic changes on CT [86]. Grist et al. investigated 129Xe MRI in dyspneic patients at 3-months after COVID-19 pneumonia [90]. They showed hyperpolarized Xe MRI abnormalities in comparison with healthy subjects in structurally and functional normal lung as assessed by CT and lung function test [90].
ConclusionChest imaging is not recommended for routine screening of COVID-19 in a normal clinical situation. It still has an integral role to play, however, in its work up and staging, especially when assessing complications or disease pro-gression. The most important role of radiologists in this context is to be able to identify those patients at great-est risk of imminent clinical decompensation by learning to stratify cases of COVID-19 on the basis of radiologic imaging in the most efficient and timely fashion possible. The present availability of multiple and more refined CT grading systems and classification is now making this task easier and thereby contributing to the recent improve-ments achieved in COVID-19 treatment and outcomes.
AbbreviationsACR : American College of Radiology; AI: Artificial intelligence; ARDS: Acute respiratory distress syndrome; ASER: American Society of Emergency Radiol-ogy; AUC : Area under the receiver operating characteristic curve; BSTI: British Society of Thoracic Imaging; CO-RADS: The COVID-19 reporting and data system; CoV: Coronavirus; COVID-19: Coronavirus disease 2019; COVID-RADS: The COVID-19 imaging reporting and data system; CT: Computed tomogra-phy; GGO: Ground-glass opacity; ICC: Interclass coefficient; ICU: Intensive care unit; IP: Interstitial pneumonia; NPV: Negative predictive value; OR: Odds ratio; PPV: Positive predictive value; RSNA: Radiological Society of North America; RT-PCR: Real-time reverse transcription polymerase chain reaction; STR: Society of Thoracic Radiology; WHO: World Health Organization.
Authors’ contributionsAll authors read and approved the final manuscript.
FundingNot applicable.
Availability of data and materialNot applicable.
Declarations
Ethics approval and consent to participateThis article contains data extracted from published papers. All procedures were in accordance with the 1964 Declaration of Helsinki and its later amendments.
Consent for publicationNot applicable.
Competing interestsThe authors declare that they have no competing interests.
Author details1 Department of Radiology, Graduate School of Medicine, The University of Tokyo, 7-3-1, Hongo, Bunkyo-ku, Tokyo 113-8655, Japan. 2 Department of Radiology, Japan Self-Defense Forces Central Hospital, 1-2-24, Ikejiri, Setagaya-ku, Tokyo 154-0001, Japan. 3 Division of Neuroradiology, Department of Radiology, University of Michigan, 1500 E Medical Center Dr, UH B2, Ann Arbor, MI 48109, USA. 4 Department of Radiology, National Center for Geriatrics and Gerontology, 7-430, Morioka-cho, Obu, Aichi 474-8511, Japan.
Received: 28 August 2021 Accepted: 22 September 2021
References 1. Burki T (2020) Outbreak of coronavirus disease 2019. Lancet Infect Dis
20:292–293 2. Cucinotta D, Vanelli M (2020) WHO declares COVID-19 a pandemic. Acta
Biomed 91:157 3. Zhu N, Zhang D, Wang W et al (2020) A novel coronavirus from patients
with pneumonia in China, 2019. N Engl J Med 382:727–733 4. Chen N, Zhou M, Dong X et al (2020) Epidemiological and clinical char-
acteristics of 99 cases of 2019 novel coronavirus pneumonia in Wuhan, China: a descriptive study. Lancet 395:507–513
5. Shi H, Han X, Jiang N et al (2020) Radiological findings from 81 patients with COVID-19 pneumonia in Wuhan, China: a descriptive study. Lancet Infect Dis 20:425–434
6. Rhee C, Kanjilal S, Baker M et al (2021) Duration of severe acute respira-tory syndrome coronavirus 2 (SARS-CoV-2) infectivity: When is it safe to discontinue isolation? Clin Infect Dis 72:1467–1474
7. Lau LL, Cowling BJ, Fang VJ et al (2010) Viral shedding and clinical illness in naturally acquired influenza virus infections. J Infect Dis 201:1509–1516
8. Sethuraman N, Jeremiah SS, Ryo A (2020) Interpreting diagnostic tests for SARS-CoV-2. JAMA 323:2249–2251
Page 13 of 14Inui et al. Insights Imaging (2021) 12:155
9. Kucirka LM, Lauer SA, Laeyendecker O et al (2020) Variation in false-negative rate of reverse transcriptase polymerase chain reaction–based SARS-CoV-2 tests by time since exposure. Ann Int Med 173:262–267
10. Patrucco F, Carriero A, Falaschi Z et al (2021) COVID-19 diagnosis in case of two negative nasopharyngeal swabs: association between chest CT and bronchoalveolar lavage results. Radiology 298:E152–E155
11. Giri B, Pandey S, Shrestha R, Pokharel K, Ligler FS, Neupane BB (2020) Review of analytical performance of COVID-19 detection methods. Anal Bioanal Chem 413:35–48
12. Sardanelli F, Di Leo G (2020) Assessing the value of diagnostic tests in the coronavirus disease 2019 pandemic. Radiology 296:E193–E194
13. Şendur HN (2020) Debate of chest CT and RT-PCR test for the diagnosis of COVID-19. Radiology 297:E341-342
14. Long C, Xu H, Shen Q et al (2020) Diagnosis of the coronavirus disease (COVID-19): rRT-PCR or CT? Eur J Radiol 126:108961
15. Xie X, Zhong Z, Zhao W, Zheng C, Wang F, Liu J (2020) Chest CT for typical coronavirus disease 2019 (COVID-19) pneumonia: relationship to nega-tive RT-PCR testing. Radiology 296:E41–E45
16. Fang Y, Zhang H, Xie J et al (2020) Sensitivity of chest CT for COVID-19: comparison to RT-PCR. Radiology 296:E115–E117
17. Ai T, Yang Z, Hou H et al (2020) Correlation of chest CT and RT-PCR testing for coronavirus disease 2019 (COVID-19) in China: a report of 1014 cases. Radiology 296:E32–E40
18. Kim H, Hong H, Yoon SH (2020) Diagnostic performance of CT and reverse transcriptase polymerase chain reaction for coronavirus disease 2019: a meta-analysis. Radiology 296:E145-155
19. Raptis CA, Hammer MM, Short RG et al (2020) Chest CT and coronavirus disease (COVID-19): a critical review of the literature to date. AJR Am J Roentgenol 215:839–842
20. Raptis CA, Hammer MM, Henry TS, Hope MD, Bhalla S (2020) Reply to letters addressing “chest CT and coronavirus disease (COVID-19): a critical review of the literature to date.” AJR Am J Roentgenol 215:W67–W68
21. Hope MD, Raptis CA, Henry TS (2020) Chest computed tomography for detection of coronavirus disease 2019 (COVID-19): don’t rush the science. Ann Intern Med 173:147–148
22. Suchá D, van Hamersvelt RW, van den Hoven AF et al (2020) Suboptimal quality and high risk of bias in diagnostic test accuracy studies on chest radiography and computed tomography in the acute setting of the COVID-19 pandemic: a systematic review. Radiol Cardiothorac Imaging 2:e200342
23. Inui S, Fujikawa A, Jitsu M et al (2020) Chest CT findings in cases from the cruise ship diamond princess with coronavirus disease (COVID-19). Radiol Cardiothorac Imaging 2:e200110
24. Inui S, Fujikawa A, Jitsu M et al (2020) Erratum: Chest CT findings in cases from the cruise ship “diamond princess” with coronavirus disease 2019 (COVID-19). Radiol Cardiothorac Imaging 2:e204002
25. American College of Radiology (2020) ACR Recommendations for the use of chest radiography and computed tomography (CT) for suspected COVID-19 infection. https:// www. acr. org/ Advoc acy- and- Econo mics/ ACR- Posit ion- State ments/ Recom menda tions- for- Chest- Radio graphy- and- CT- for- Suspe cted- COVID 19- Infec tion. Accessed 1 June 2021.
26. Society of Thoracic Radiology (2020) STR/ASER COVID-19 position state-ment (March 11, 2020). https:// thora cicrad. org/? page_ id= 2879. Accessed 1 June 2021.
27. Rubin GD, Ryerson CJ, Haramati LB et al (2020) The role of chest imaging in patient management during the COVID-19 pandemic: a multinational consensus statement from the Fleischner society. Radiology 296:172–180
28. Schaefer-Prokop C, Prokop M (2021) Chest radiography in COVID-19: no role in asymptomatic and oligosymptomatic disease. Radiology 298:E156–E157
29. Gandhi D, Ahuja K, Grover H et al (2020) Review of X-ray and computed tomography scan findings with a promising role of point of care ultra-sound in COVID-19 pandemic. World J Radiol 12:195
30. Akl EA, Blažić I, Yaacoub S et al (2021) Use of chest imaging in the diagno-sis and management of COVID-19: a WHO rapid advice guide. Radiology 298:E63–E69
31. Ng MY, Lee EY, Yang J et al (2020) Imaging profile of the COVID-19 infection: radiologic findings and literature review. Radiol Cardiothorac Imaging 2:e200034
32. Zu ZY, Jiang MD, Xu PP et al (2020) Coronavirus disease 2019 (COVID-19): a perspective from China. Radiology 296:E15–E25
33. Vancheri SG, Savietto G, Ballati F et al (2020) Radiographic findings in 240 patients with COVID-19 pneumonia: time-dependence after the onset of symptoms. Eur Radiol 30:6161–6169
34. Sadiq Z, Rana S, Mahfoud Z, Raoof A (2021) Systematic review and meta-analysis of chest radiograph (CXR) findings in COVID-19. Clin Imaging 80:229–238
35. Kuo BJ, Lai YK, Tan ML et al (2021) Utility of screening chest radiographs in patients with asymptomatic or minimally symptomatic COVID-19 in Singapore. Radiology 298:E131–E140
36. Wong HYF, Lam HYS, Fong AHT et al (2020) Frequency and distribution of chest radiographic findings in patients positive for COVID-19. Radiology 296:E72–E78
37. Toussie D, Voutsinas N, Finkelstein M et al (2020) Clinical and chest radiography features determine patient outcomes in young and middle-aged adults with COVID-19. Radiology 297:E197–E206
38. Gandhi D, Jain N, Khanna K, Li S, Patel L, Gupta N (2020) Current role of imaging in COVID-19 infection with recent recommendations of point of care ultrasound in the contagion: a narrative review. Ann Transl Med 8:1094
39. Harahwa TA, Yau THL, Lim-Cooke MS, Al-Haddi S, Zeinah M, Harky A (2020) The optimal diagnostic methods for COVID-19. Diagnosis 7:349–356
40. Dirk-André E, Sidhu PS, Lim A et al (2021) The role of lung ultrasound in COVID-19 disease. Insights Imaging 12:81
41. Yau O, Gin K, Luong C et al (2021) Point-of-care ultrasound in the COVID-19 era: a scoping review. Echocardiography 38:329–342
42. Smith MJ, Hayward SA, Innes SM, Miller ASC (2020) Point-of-care lung ultrasound in patients with COVID-19–a narrative review. Anaesthesia 75:1096–1104
43. Barssoum K, Victor V, Salem A et al (2021) Echocardiography, lung ultrasound, and cardiac magnetic resonance findings in COVID-19: a sys-tematic review. Echocardiography. https:// doi. org/ 10. 1111/ echo. 15152
44. Lu W, Zhang S, Chen B et al (2020) A clinical study of noninvasive assess-ment of lung lesions in patients with coronavirus disease-19 (COVID-19) by bedside ultrasound. Ultraschall Med 41:300–307
45. Pare JR, Camelo I, Mayo KC, Leo MM et al (2020) Point-of-care lung ultrasound is more sensitive than chest radiograph for evaluation of COVID-19. West J Emerg Med 21:771–778
46. Fonsi GB, Sapienza P, Brachini G et al (2020) Is lung ultrasound imaging a worthwhile procedure for severe acute respiratory syndrome coronavirus 2 pneumonia detection? J Ultrasound Med 40:1113–1123
47. Narinx N, Smismans A, Symons R et al (2020) Feasibility of using point-of-care lung ultrasound for early triage of COVID-19 patients in the emergency room. Emerg Radiol 27:663–670
48. Abdel-Tawab M, Bosha MAA, Mohamed IA et al (2021) Comparison of the CO-RADS and the RSNA chest CT classification system concerning sen-sitivity and reliability for the diagnosis of COVID-19 pneumonia. Insights Imaging 12:55
49. Inui S, Kurokawa R, Nakai Y et al (2020) Comparison of chest CT grading systems in coronavirus disease 2019 (COVID-19) pneumonia. Radiol Cardiothorac Imaging 2:e200492
50. Neri E, Coppola F, Larici AR et al (2020) Structured reporting of chest CT in COVID-19 pneumonia: a consensus proposal. Insights Imaging 11:92
51. British Society of Thoracic Imaging (2020) Thoracic imaging in COVID-19 infection, guidance for the reporting radiologist. British Society of Thoracic Imaging. https:// www. bsti. org. uk/ media/ resou rces/ files/ BSTI_ COVID- 19_ Radio logy_ Guida nce_ versi on_2_ 16. 03. 20. pdf. Accessed 1 June 2021.
52. Simpson S, Kay FU, Abbara S et al (2020) Radiological society of North America Expert consensus statement on reporting chest CT findings related to COVID-19. Endorsed by the society of thoracic radiology, the American College of Radiology, and RSNA—secondary publication. Radiol Cardiothorac Imaging 2:152
53. Prokop M, van Everdingen W, van Rees Vellinga T et al (2020) CO-RADS: a categorical CT assessment scheme for patients suspected of having COVID-19-definition and evaluation. Radiology 296:E97–E104
54. Salehi S, Abedi A, Balakrishnan S, Gholamrezanezhad A (2020) Coronavi-rus disease 2019 (COVID-19) imaging reporting and data system (COVID-RADS) and common lexicon: a proposal based on the imaging data of 37 studies. Eur Radiol 30:4930–4942
Page 14 of 14Inui et al. Insights Imaging (2021) 12:155
55. Hare SS, Tavare AN, Dattani V et al (2020) Validation of the British society of thoracic imaging guidelines for COVID-19 chest radiograph reporting. Clin Radiol 75:710.e9-710.e14
56. Kemp OJ, Watson DJ, Swanson-Low CL et al (2020) Comparison of chest X-ray interpretation by emergency department clinicians and radiologists in suspected COVID-19 infection: a retrospective cohort study. BJR Open 2:20200020
57. Tsakok M, Shaw R, Murchison A et al (2020) Diagnostic accuracy of initial chest radiograph compared to SARS-CoV-2 PCR in patients with suspected COVID-19. BJR Open. https:// doi. org/ 10. 1259/ bjro. 20200 034
58. Borakati A, Perera A, Johnson J, Sood T (2020) Diagnostic accuracy of X-ray versus CT in COVID-19: a propensity-matched database study. BMJ Open 10:e042946
59. Kwee RM, Adams HJA, Kwee TC (2020) Diagnostic performance of CO-RADS and the RSNA classification system in evaluating COVID-19 at chest CT: a meta-analysis. Radiol Cardiothorac Imaging 3:e200510
60. Barbosa PNVP, Bitencourt AGV, Miranda GDD, Almeida MFA, Chojniak R (2020) Chest CT accuracy in the diagnosis of SARS-CoV-2 infection: initial experience in a cancer center. Radiol Bras 53:211–215
61. Ciccarese F, Coppola F, Spinelli D et al (2020) Diagnostic accuracy of North America expert consensus statement on reporting CT findings in patients suspected of having COVID-19 infection: an Italian single-center experience. Radiol Cardiothorac Imaging 2:e200312
62. Falaschi Z, Danna PS, Arioli R et al (2020) Chest CT accuracy in diagnosing COVID-19 during the peak of the Italian epidemic: a retrospective cor-relation with RT-PCR testing and analysis of discordant cases. Eur J Radiol 130:109192
63. Santos JMMM, Fonseca APA, Anastacio EPZ, Minenelli FF, de Albuquer-que Cavalcanti CF, da Silva Teles GB (2020) Initial results of the use of a standardized diagnostic criteria for chest computed tomography findings in coronavirus disease 2019. J Comput Assist Tomogr 44:647–651
64. Som A, Lang M, Yeung T et al (2020) Implementation of the radiological society of North America expert consensus guidelines on reporting chest CT findings related to COVID-19: A multireader performance study. Radiol Cardiothorac Imaging 2:e200276
65. Colombi D, Petrini M, Maffi G et al (2020) Comparison of admission chest computed tomography and lung ultrasound performance for diagnosis of COVID-19 pneumonia in populations with different disease preva-lence. Eur J Radiol 133:109344
66. da Silva Teles GB, Fonseca EKUN, Yokoo P et al (2021) Performance of chest computed tomography in differentiating coronavirus disease 2019 from other viral infections using a standardized classification. J Thorac Imaging 36:31–36
67. Grando RD, Brentano VB, Zanardo AP et al (2002) Clinical usefulness of tomographic standards for COVID-19 pneumonia diagnosis: experience from a Brazilian reference center. Braz J Infect Dis 24:524–533
68. de Jaegere TM, Krdzalic J, COVID-19 CT Investigators South-East Nether-lands (CISEN) study group (2020) Radiological society of North america chest CT classification system for reporting COVID-19 pneumonia: inter-observer variability and correlation with reverse-transcription polymerase chain reaction. Radiol Cardiothorac Imaging 2:213
69. Hermans JJ, Groen J, Zwets E et al (2020) Chest CT for triage during COVID-19 on the emergency department: Myth or truth? Emerg Radiol 27:641–651
70. De Smet K, De Smet D, Ryckaert T et al (2021) Diagnostic performance of chest CT for SARS-CoV-2 infection in individuals with or without COVID-19 symptoms. Radiology 298:E30–E37
71. Fujioka T, Takahashi M, Mori M et al (2020) Evaluation of the usefulness of CO-RADS for chest CT in patients suspected of having COVID-19. Diagnostics 10:608
72. Korevaar DA, Kootte TS, Smits LP et al (2020) Added value of chest com-puted tomography in suspected COVID-19: an analysis of 239 patients. Eur Respir J 56:2001377
73. Bellini D, Panvini N, Rengo M et al (2021) Diagnostic accuracy and inter-observer variability of CO-RADS in patients with suspected coronavirus disease-2019: a multireader validation study. Eur Radiol 31:1932–1940
74. Tucato G, Zaboli Z, Panebianco L et al (2021) Clinical application of the COVID-19 reporting and data system (CO-RADS) in patients with suspected SARS-CoV-2 infection: observational study in an emergency department. Clin Radiol 76:74.e23-74.e29
75. Nivet H, Crombé A, Schuster P et al (2021) The accuracy of teleradiolo-gists in diagnosing COVID-19 based on a French multicentric emergency cohort. Eur Radiol 31:2833–2844
76. Lieveld AW, Azijli K, Teunissen BP et al (2021) Chest CT in COVID-19 at the ED: validation of the COVID-19 reporting and data system (CO-RADS) and CT severity score: a prospective, multicenter, observational study. Chest 159:1126–1135
77. Schalekamp S, Bleeker-Rovers CP, Beenen LF et al (2021) Chest CT in the emergency department for diagnosis of COVID-19 pneumonia: Dutch experience. Radiology 298:E98–E106
78. Gross A, Heine G, Martin Schwarz M, Thiemig D, Gläser S, Albrecht T (2021) Structured reporting of chest CT provides high sensitivity and specificity for early diagnosis of COVID-19 in a clinical routine setting. Br J Radiol 94(1117):20200574
79. Hallgren KA (2012) Computing inter-rater reliability for observational data: an overview and tutorial. Tutor Quant Methods Psychol 8:23–34
80. Lessmann N, Sánchez CI, Beenen L et al (2021) Automated assessment of COVID-19 reporting and data system and chest CT severity scores in patients suspected of having COVID-19 using artificial intelligence. Radiology 298:E18–E28
81. Pan F, Ye T, Sun P et al (2020) Time course of lung changes at chest CT during recovery from coronavirus disease 2019 (COVID-19). Radiology 295:715–721
82. Wang Y, Dong C, Hu Y et al (2020) Temporal changes of CT findings in 90 patients with COVID-19 pneumonia: a longitudinal study. Radiology 296:E55–E64
83. Colombi D, Bodini FC, Petrini M et al (2020) Well-aerated lung on admit-ting chest CT to predict adverse outcome in COVID-19 pneumonia. Radiology 296:E86–E96
84. Li Y, Yang Z, Ai T, Wu S, Xia L (2020) Association of “initial CT” findings with mortality in older patients with coronavirus disease 2019 (COVID-19). Eur Radiol 30:6186–6193
85. Schalekamp S, Huisman M, van Dijk RA et al (2021) Chest CT in the emergency department for diagnosis of COVID-19 pneumonia: Dutch experience. Radiology 298:E46–E54
86. Han X, Fan Y, Alwalid O et al (2021) Six-month follow-up chest CT findings after severe COVID-19 pneumonia. Radiology 299(1):E177–E186. https:// doi. org/ 10. 1148/ radiol. 20212 03153
87. Adachi T, Chong JM, Nakajima N et al (2020) Clinicopathologic and immunohistochemical findings from autopsy of patient with COVID-19, Japan. Emerg Infect Dis 26:2157–2161
88. Okudela K, Hayashi H, Yoshimura Y et al (2020) A Japanese case of COVID-19: an autopsy report. Pathol Int 70:820–824
89. Menter T, Haslbauer JD, Nienhold R et al (2020) Postmortem examina-tion of COVID-19 patients reveals diffuse alveolar damage with severe capillary congestion and variegated findings in lungs and other organs suggesting vascular dysfunction. Histopathology 77(2):198–209. https:// doi. org/ 10. 1111/ his. 14134
90. Grist JT, Chen M, Collier GJ et al (2021) Hyperpolarized 129 Xe MRI abnor-malities in dyspneic participants 3 months after COVID-19 pneumonia: preliminary results. Radiology. https:// doi. org/ 10. 1148/ radiol. 20212 10033
Publisher’s NoteSpringer Nature remains neutral with regard to jurisdictional claims in pub-lished maps and institutional affiliations.