THE QUALITY OF TEACHER PREPARATIONwvde.state.wv.us/certification/data/qtp/pass_rates_07-08.pdfTHE...
66
THE QUALITY OF TEACHER PREPARATION IN WEST VIRGINIA Compiled by The Office of Professional Preparation Division of Educator Quality and System Support West Virginia Department of Education Charleston, WV 25305 August 2009
Transcript of THE QUALITY OF TEACHER PREPARATIONwvde.state.wv.us/certification/data/qtp/pass_rates_07-08.pdfTHE...

THE QUALITY OF TEACHER PREPARATION
IN
WEST VIRGINIA
Compiled by
The Office of Professional Preparation Division of Educator Quality and System Support
West Virginia Department of Education Charleston, WV 25305
August 2009

TABLE OF CONTENTS
Title Page…………..…………………………………………………………………………………………..i Table of Contents…………………………………………………………………………………………….iii SECTION I: OVERVIEW Foreword……………………………………………………………………………………………………....4 Major Conclusions……………………………………………………………………...…………………….5 Acknowledgements…………………………………………………………………………………………..6 Title II Contacts……………………………………………………………………………………………….7 SECTION II: THE PROGRAMS Historical Information and Accreditation………………………………………………………………….9 Program Completer Profile………………………………………………………………………………...10 Field Experiences……………………………………………………………………….…………………..12 Student Teaching……………………………………………………………………….…………………..13 State Assessment Passing Scores……………………………………………………….………………16 SECTION III: RELEASABLE INSTITUTIONAL PROGRAM COMPLETER PERFORMANCE Alderson-Broaddus College………………………………………………………………………………..18 Appalachian Bible College ………………………………………………………………………………. 20 Bethany College…………………………………………………………………………………………….22 Bluefield State College……………………………………………………………………………………..24 Concord College…………………………………………………………………………………………….26 Davis & Elkins College……………………………………………………………………………………..28 Fairmont State College……………………………………………………………………………………..30 Glenville State College……………………………………………………………………………………..32 Marshall University…………………………………………………………………….……………………34 Ohio Valley College…………………………………………………………………………………………36 Salem International University…………………………………………………………………………….38 Shepherd College……………………………………………………………………….………………….40 University of Charleston……………………………………………………………………………………42 West Liberty State College………………………………………………………………………………...44 West Virginia State College………………………………………………………………………………..46 West Virginia University……………….…………………………………………………………………...48 West Virginia University – Parkersburg…………………………………………………………………..50 West Virginia Wesleyan College……………………………………………………….………………….52 Wheeling Jesuit University…………………………………………………………………………………54 SECTION IV: PERFORMANCE ASSESSMENT DATA Alderson-Broaddus College Appalachian Bible College ………………………………………………………………………………..56
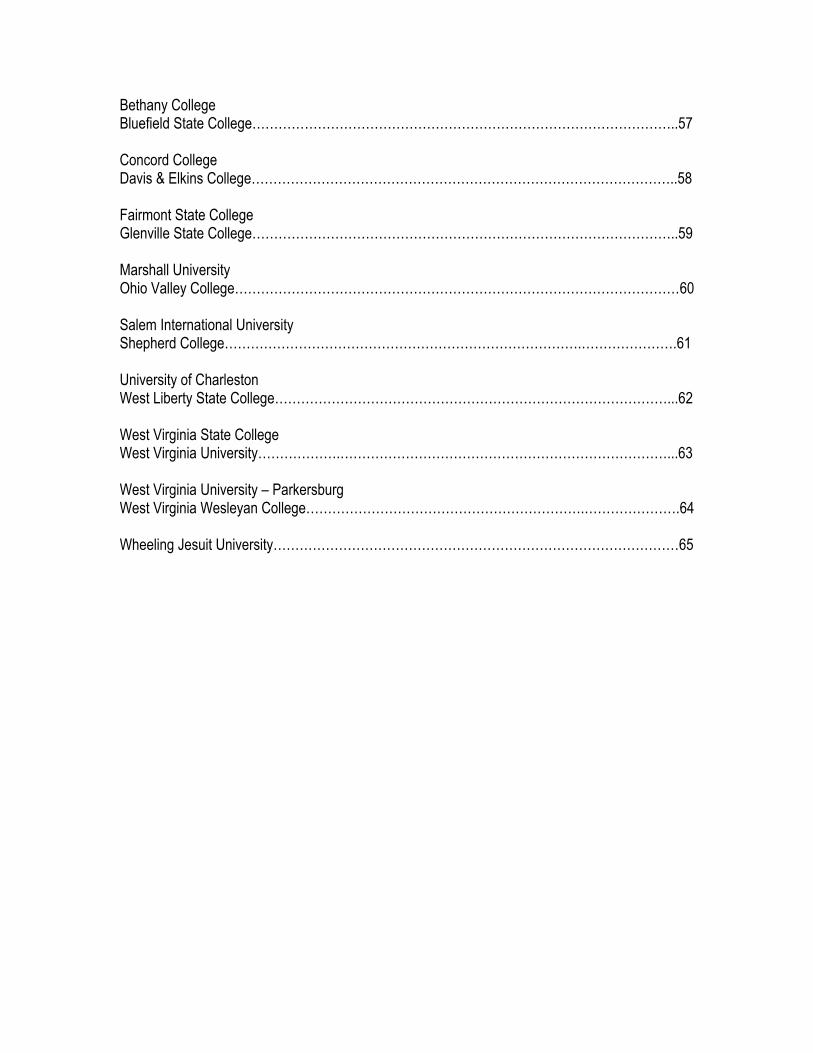
Bethany College Bluefield State College……………………………………………………………………………………..57 Concord College Davis & Elkins College……………………………………………………………………………………..58 Fairmont State College Glenville State College……………………………………………………………………………………..59 Marshall University Ohio Valley College…………………………………………………………………………………………60 Salem International University Shepherd College……………………………………………………………………….………………….61 University of Charleston West Liberty State College………………………………………………………………………………...62 West Virginia State College West Virginia University……………….…………………………………………………………………...63 West Virginia University – Parkersburg West Virginia Wesleyan College……………………………………………………….………………….64 Wheeling Jesuit University…………………………………………………………………………………65

SECTION I:
OVERVIEW

FOREWORD
No Child Left Behind legislation requires having a highly qualified teacher in every classroom to ensure that all students achieve academic proficiency by 2013-2014. Meeting the highly qualified teacher challenge is one that necessitates pertinent training at both the preservice and inservice levels for West Virginia’s classroom teachers. The nineteen institutions with West Virginia approved professional preparation programs are charged to provide the training necessary for their graduates to meet the growing needs of students in West Virginia’s classrooms. The Quality of Teacher Preparation in West Virginia examines the quality of teacher preparation in the eighteen institutions of higher education that have West Virginia approved professional preparation programs. The publication contains information regarding the demographics of program completers, the requirements of field experiences and student teaching, as well as the performance of program completers on the state and institutional assessments. For this publication, a program completer is defined as an individual who has completed an approved professional preparation program in West Virginia and qualifies for a Provisional Professional Teaching Certificate in West Virginia. The information provided pertains to the 1,165 individuals who qualify as 1,552 program completers for school year September 1, 2007 through August 31, 2008. You are encouraged to use The Quality of Teacher Preparation in West Virginia to assist you in the development of educational policies and programs. Inquiries regarding this publication should be directed to Nathan Estel, Executive Director or Kellie Crawford, Coordinator, Office of Professional Preparation. Steve Paine State Superintendent of Schools
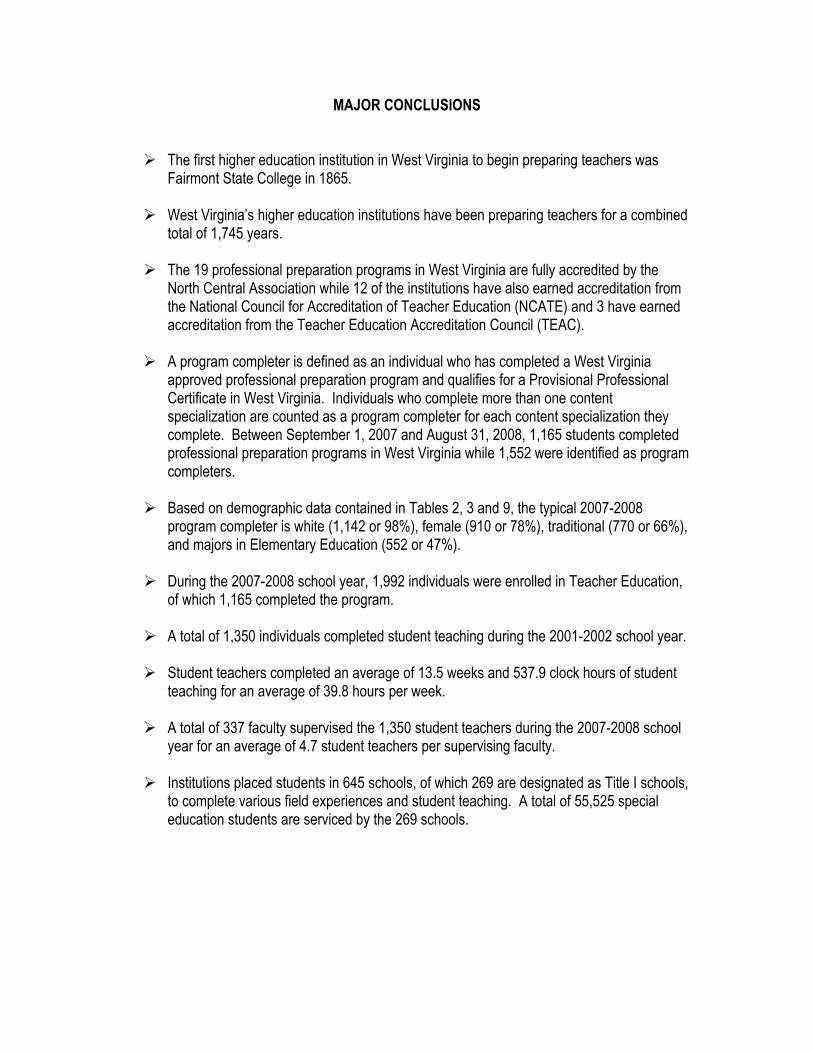
MAJOR CONCLUSIONS
The first higher education institution in West Virginia to begin preparing teachers was
Fairmont State College in 1865. West Virginia’s higher education institutions have been preparing teachers for a combined
total of 1,745 years. The 19 professional preparation programs in West Virginia are fully accredited by the
North Central Association while 12 of the institutions have also earned accreditation from the National Council for Accreditation of Teacher Education (NCATE) and 3 have earned accreditation from the Teacher Education Accreditation Council (TEAC).
A program completer is defined as an individual who has completed a West Virginia
approved professional preparation program and qualifies for a Provisional Professional Certificate in West Virginia. Individuals who complete more than one content specialization are counted as a program completer for each content specialization they complete. Between September 1, 2007 and August 31, 2008, 1,165 students completed professional preparation programs in West Virginia while 1,552 were identified as program completers.
Based on demographic data contained in Tables 2, 3 and 9, the typical 2007-2008
program completer is white (1,142 or 98%), female (910 or 78%), traditional (770 or 66%), and majors in Elementary Education (552 or 47%).
During the 2007-2008 school year, 1,992 individuals were enrolled in Teacher Education,
of which 1,165 completed the program. A total of 1,350 individuals completed student teaching during the 2001-2002 school year.
Student teachers completed an average of 13.5 weeks and 537.9 clock hours of student
teaching for an average of 39.8 hours per week. A total of 337 faculty supervised the 1,350 student teachers during the 2007-2008 school
year for an average of 4.7 student teachers per supervising faculty. Institutions placed students in 645 schools, of which 269 are designated as Title I schools,
to complete various field experiences and student teaching. A total of 55,525 special education students are serviced by the 269 schools.

ACKNOWLEDGEMENTS The Quality of Teacher Preparation in West Virginia is a publication that evolved from a West Virginia Department of Education collaborative, statewide initiative with the state’s higher education institutions. The Office of Professional Preparation within the Division of Educator Quality and System Support is responsible for the design, compilation, and distribution of the information contained in the report. The Office of Professional Preparation acknowledges the leadership of Nathan Estel fman, Executive Director and the work of Kellie Crawford, Coordinator in the production of the document. A special thank you is given to the Title II Contacts, listed on the following page, for their cooperation and collaboration in the production of this publication.

West Virginia Professional Preparation Institutions
Title II Contacts
Sally Digman Karen Morgan Alderson-Broaddus College Salem International University Keely Camden Doug Kennard Bethany College Shepherd University Betsy Steenken Paige Carney Bluefield State College University of Charleston Kathy Liptak Ann Rose Concord University West Liberty State College Steve Creasey Sandi Orr Davis & Elkins College West Virginia State University Van Dempsey Judy Abbott Fairmont State University West Virginia University Kevin Cain Cindy Gissy Glenville State College West Virginia University - Parkersburg Tom Klein Deb Bush Marshall University West Virginia Wesleyan College Jo Pennington Connie Myer Ohio Valley University Wheeling Jesuit University

SECTION II:
THE PROGRAMS

TABLE 1
WEST VIRGINIA TEACHER PREPARATION PROGRAMS
STATE AND PRIVATELY SUPPORTED INSTITUTIONS
ACCREDITATION STATUS AND DATES OF ESTABLISHMENT
September 1, 2007 - August 31, 2008
Institution Location Year Established
Year Teacher
Preparation
Program Began
Number of Years
Preparing
Teachers
Alderson-Broaddus College* Philippi, WV 1932 1932 77
Appalachian Bible College* Bradley, WV 1950 2003 6
Bethany College* Bethany, WV 1840 1915 94
Bluefield State College Bluefield, WV 1895 1905 104
Concord University Athens, WV 1872 1875 134
Davis & Elkins College* Elkins, WV 1904 1917 92
Fairmont State University Fairmont, WV 1865 1865 144
Glenville State College Glenville, WV 1872 1872 137
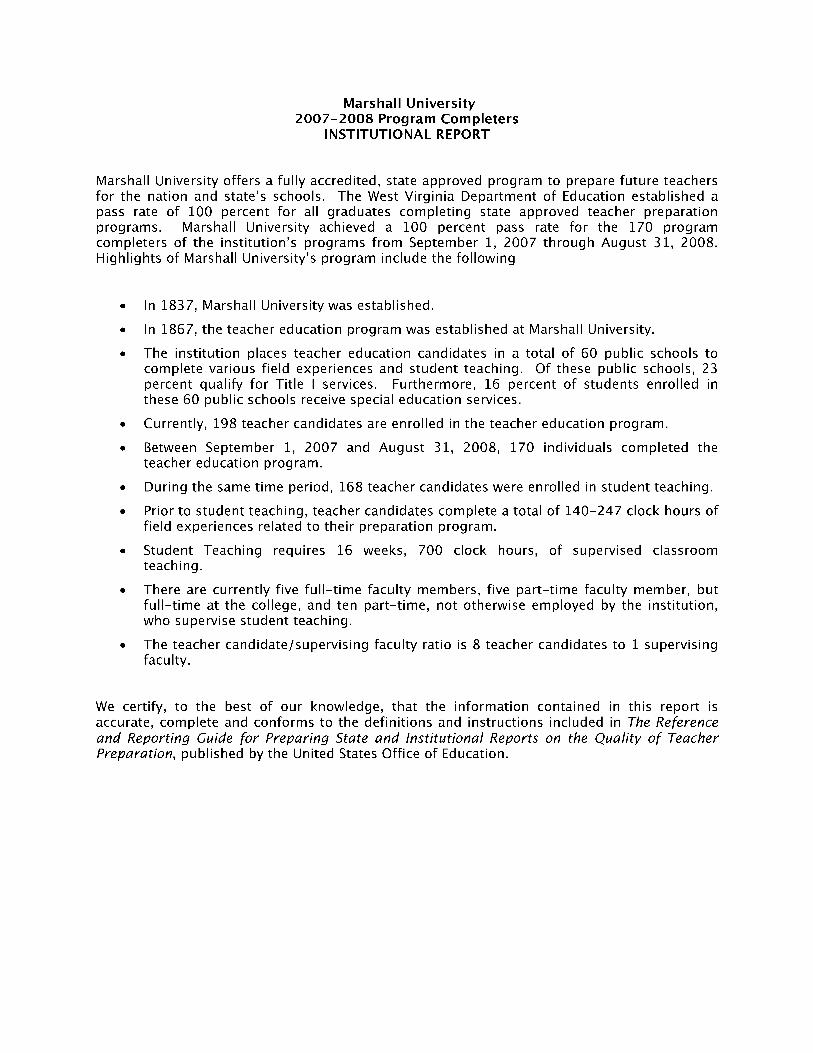
Marshall University Huntington, WV 1837 1867 142
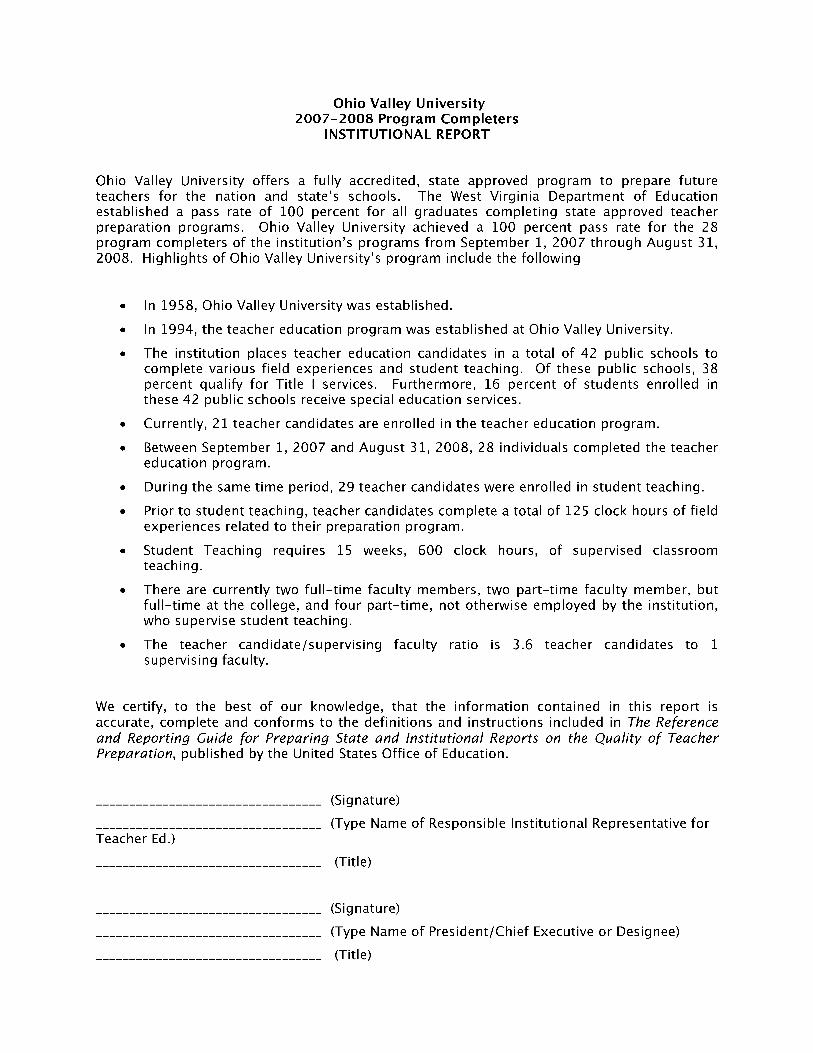
Ohio Valley University* Vienna, WV 1958 1994 15
Salem International University* Salem, WV 1888 1889 120
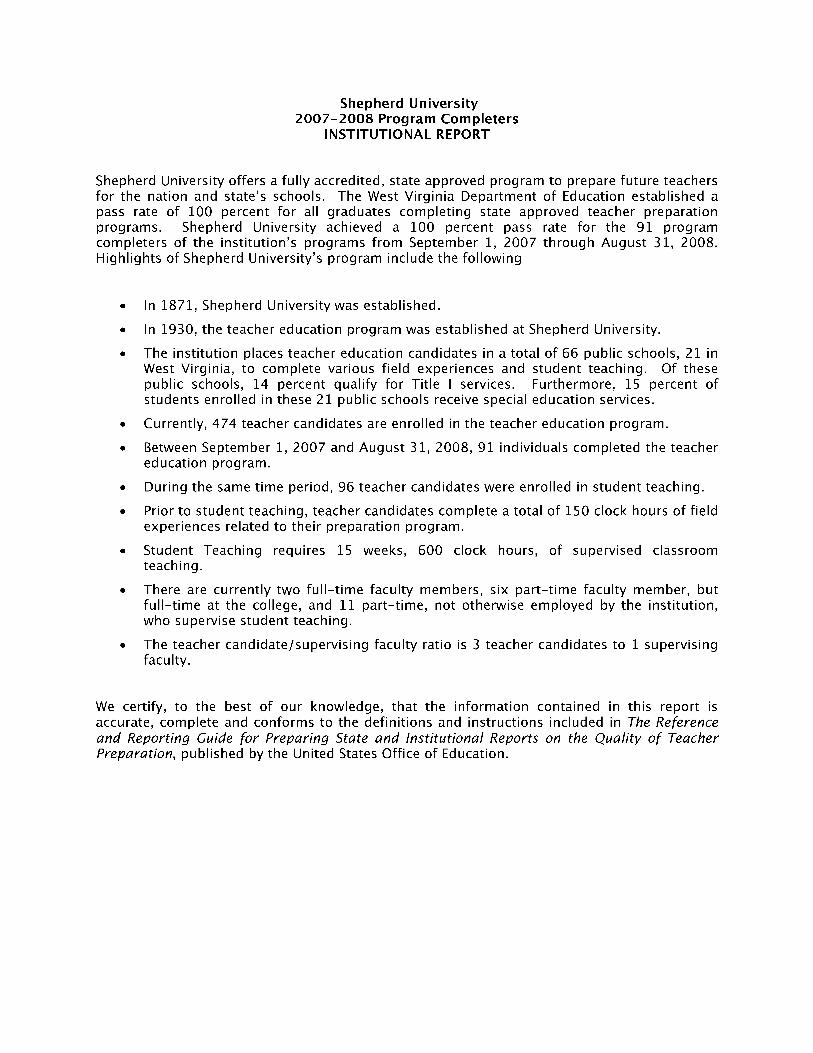
Shepherd University Shepherdstown, WV 1871 1930 79
University of Charleston* Charleston, WV 1888 1889 120
West Liberty University West Liberty, WV 1837 1870 135
West Virginia State University Institute, WV 1891 1911 98
West Virginia University Morgantown, WV 1867 1927 82
WVU - Parkersburg Parkersburg, WV 1971 1991 18
West Virginia Wesleyan College* Buckhannon, WV 1890 1901 108
Wheeling Jesuit University* Wheeling, WV 1954 1969 40
TOTAL YEARS 1,745
AVG. YEARS 92
*Privately Supported Institutions
NCATE Accredited Institutions (Boldfaced)
TEAC Accredited Institutions (Italicized)

TABLE 2
WEST VIRGINIA PROGRAM COMPLETER PROFILE
DEMOGRAPHIC DATA BY INSTITUTION
ENROLLMENT, GENDER AND STUDENT STATUS
September 1, 2007 - August 31, 2008
COLLEGE
Total Number
of Students
Enrolled in
Teacher
Education
Actual Number
of Students
Completing
Program
Male FemaleTraditional
Student
Non
Traditional
Student
Alderson-Broaddus College 14 8 1 7 8 0
Appalachian Bible College 5 5 0 5 4 1
Bethany College 77 31 7 26 31 0
Bluefield State College 62 24 1 23 5 19
Concord University 81 65 15 50 43 22
Davis & Elkins College 11 10 1 9 5 5
Fairmont State University 103 128 31 97 70 58
Glenville State College 172 59 18 41 51 8
Marshall University 198 170 30 140 122 48
Ohio Valley University 21 28 7 21 20 8
Salem International University 10 3 0 3 3 0
Shepherd University 92 91 24 67 39 52
University of Charleston 3 13 1 12 12 1
West Liberty University 137 108 29 79 74 34
West Virginia State University 66 66 11 55 39 27
West Virginia University 755 255 60 195 195 60
WVU - Parkersburg 68 40 4 36 17 23
West Virginia Wesleyan College 74 24 5 19 22 2
Wheeling Jesuit University 43 37 12 25 10 27
TOTALS 1,992 1,165 257 910 770 395

TABLE 3
WEST VIRGINIA PROGRAM COMPLETER PROFILE
DEMOGRAPHIC DATA BY INSTITUTION
RACE/ETHNICITY
September 1, 2007 - August 31, 2008
COLLEGE
Actual Number
of Students
Completing
Program
CaucasianAfrican
AmericanAsian
Native
AmericanHispanic Other
Alderson-Broaddus College 8 7 1
Appalachian Bible College 5 5
Bethany College 31 31
Bluefield State College 24 23 1
Concord University 65 64 1
David & Elkins College 10 9 1
Fairmont State University 128 128
Glenville State College 59 59
Marshall University 170 166 2 2
Ohio Valley University 28 28
Salem International University 3 3
Shepherd University 91 90 1
University of Charleston 13 13
West Liberty University 108 107 1
West Virginia State University 66 60 6
West Virginia University 255 249 2 2 2
WVU - Parkersburg 40 39 1
West Virginia Wesleyan College 24 24
Wheeling Jesuit University 37 37
TOTALS 1,165 1,142 13 6 1 0 3

TABLE 4
NUMBER OF FIELD EXPERIENCES AND CLOCK HOURS
PRIOR TO CLINICAL PRACTICE REQUIRED BY EACH INSTITUTION
September 1, 2007 - August 31, 2008
COLLEGETotal Number of
Field Experiences
Total Clock Hours
of Field
Experiences
Alderson-Broaddus College 7 125-160
Appalachian Bible College 23 310.5
Bethany College 6-8 128-153
Bluefield State College 3-6 150-170
Concord University 4-8 125-173
David & Elkins College 1-3 125
Fairmont State University 3 125
Glenville State College 2-4 125-170
Marshall University 4-6 140-247
Ohio Valley University 8-9 125
Salem International University 10 195
Shepherd University 3 150
University of Charleston 7-13 140-209
West Liberty University 4-7 130-240
West Virginia State University 7 200
West Virginia University 1-4 125-318
WVU - Parkersburg 12-13 345-365
West Virginia Wesleyan College 8 205-227
Wheeling Jesuit University 5-6 125-272
RANGE 1-23 125-365
*In addition, methods courses in each content area requires a field experience or
work with public school students.

TABLE 5
ENROLLMENTS AND LENGTH OF CLINICAL PRACTICE
BY INSTITUTION
September 1, 2007 - August 31, 2008
COLLEGENumber Enrolled
in Fall Semester
2007
Number Enrolled
in Spring
Semester 2008
Number Enrolled
in Summer
Semester 2008
Total Number
Enrolled in
Clinical Practice
9/1/2007 -
8/31/2008
Number of Weeks
Spent in Clinical
Practice
Number of Clock
Hours of Clinical
Practice
Average Number
of Hours per
Week
Alderson-Broaddus College 0 11 0 11 15 600 40
Appalachian Bible College 1 4 0 5 12 480 40
Bethany College 49 2 0 51 14 560 40
Bluefield State College 0 27 0 27 12 480 40
Concord University 36 29 0 65 16 600 37.5
Davis & Elkins College 7 3 0 10 14 560 40
Fairmont State University 79 84 0 163 12 480 40
Glenville State College 22 37 0 59 15 600 40
Marshall University 72 96 0 168 16 700 43.75
Ohio Valley University 12 17 0 29 15 600 40
Salem International University 2 1 0 3 16 600 37.5
Shepherd University 44 52 0 96 15 600 40
University of Charleston 3 9 0 12 14 560 40
West Liberty University 37 47 3 87 12 480 40
West Virginia State University 46 22 0 68 15 600 40
West Virginia University 228 133 23 384 12 to 16 465 to 600 37.5
WVU - Parkersburg 28 12 0 40 16 640 40
West Virginia Wesleyan College 11 18 0 29 13 520 40
Wheeling Jesuit University 13 30 0 43 14 560 40
TOTALS 690 634 26 1350 256 10220 39.8
RANGE 0-228 1-133 0-23 3-384 12-16 465-640 37.5-43.75
AVERAGE 36.3 33.4 1.4 71.1 13.5 537.9 39.8

TABLE 6
NUMBER OF FACULTY INVOLVED IN SUPERVISION
OF TEACHER CANDIDATES BY INSTITUTION
September 1, 2007 - August 31, 2008
COLLEGENumber of
Full-Time
Faculty
Number of
Part-Time
Faculty
Total
Number of
Faculty
Total
Number of
Teacher
Candidates
Number of
Teacher
Candidates per
Supervising
Faculty
Alderson-Broaddus College 2 2 4 11 2.8
Appalachian Bible College 1 0 1 5 5.0
Bethany College 5 4 9 51 5.7
Bluefield State College 0 4 4 27 6.8
Concord University 7 6 19 65 3.4
Davis & Elkins College 2 1 3 10 3.3
Fairmont State University 11 12 23 163 7.1
Glenville State College 6 10 16 59 3.7
Marshall University 5 15 20 168 8.4
Ohio Valley University 2 6 8 29 3.6
Salem International University 3 0 3 3 1.0
Shepherd University 2 17 31 96 3.1
University of Charleston 3 0 3 12 4.0
West Liberty University 9 18 21 87 4.1
West Virginia State University 5 8 17 68 4.0
West Virginia University 37 60 123 384 3.1
WVU - Parkersburg 6 4 10 40 4.0
West Virginia Wesleyan College 3 10 19 29 1.5
Wheeling Jesuit University 3 0 3 43 14.3
TOTALS 112 177 337 1,350 89
RANGE 0-37 0-60 1-123 3-384 1.0-14.3
AVERAGE 5.9 9.3 17.7 71.1 4.7
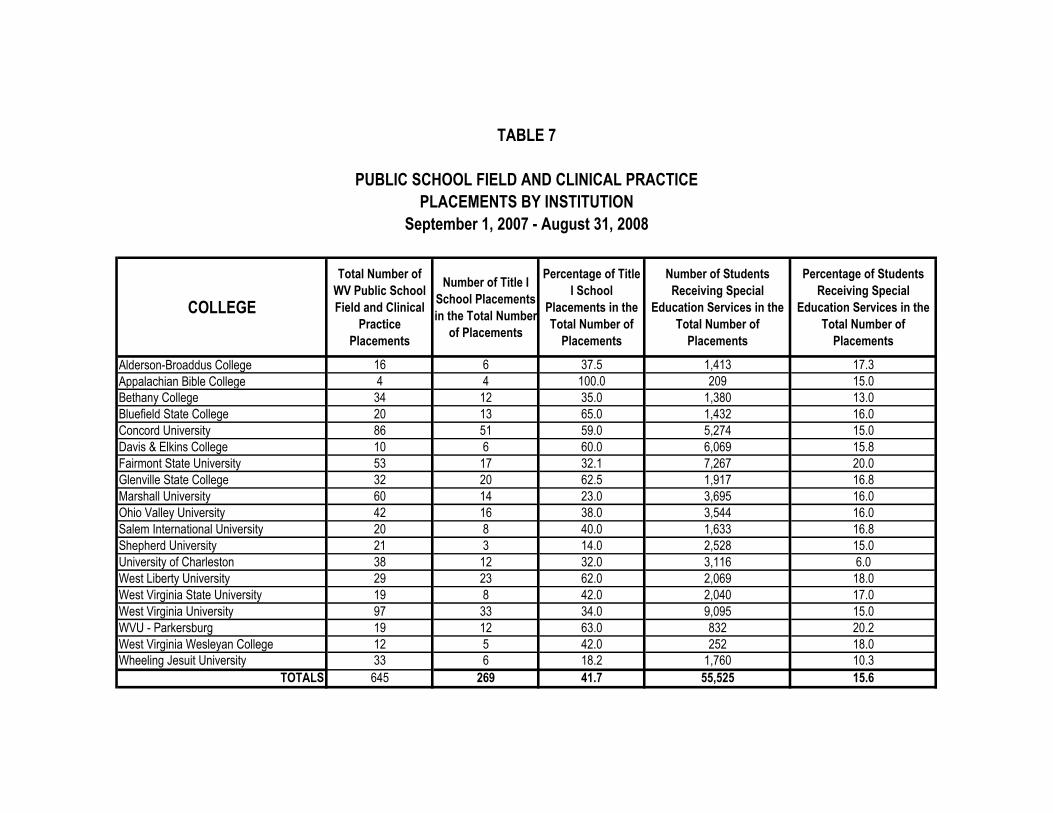
TABLE 7
PUBLIC SCHOOL FIELD AND CLINICAL PRACTICE
PLACEMENTS BY INSTITUTION
September 1, 2007 - August 31, 2008
COLLEGE
Total Number of
WV Public School
Field and Clinical
Practice
Placements
Number of Title I
School Placements
in the Total Number
of Placements
Percentage of Title
I School
Placements in the
Total Number of
Placements
Number of Students
Receiving Special
Education Services in the
Total Number of
Placements
Percentage of Students
Receiving Special
Education Services in the
Total Number of
Placements
Alderson-Broaddus College 16 6 37.5 1,413 17.3
Appalachian Bible College 4 4 100.0 209 15.0
Bethany College 34 12 35.0 1,380 13.0
Bluefield State College 20 13 65.0 1,432 16.0
Concord University 86 51 59.0 5,274 15.0
Davis & Elkins College 10 6 60.0 6,069 15.8
Fairmont State University 53 17 32.1 7,267 20.0
Glenville State College 32 20 62.5 1,917 16.8
Marshall University 60 14 23.0 3,695 16.0
Ohio Valley University 42 16 38.0 3,544 16.0
Salem International University 20 8 40.0 1,633 16.8
Shepherd University 21 3 14.0 2,528 15.0
University of Charleston 38 12 32.0 3,116 6.0
West Liberty University 29 23 62.0 2,069 18.0
West Virginia State University 19 8 42.0 2,040 17.0
West Virginia University 97 33 34.0 9,095 15.0
WVU - Parkersburg 19 12 63.0 832 20.2
West Virginia Wesleyan College 12 5 42.0 252 18.0
Wheeling Jesuit University 33 6 18.2 1,760 10.3
TOTALS 645 269 41.7 55,525 15.6

TABLE 8
STATE ASSESSMENT PASSING SCORESREQUIRED OF PROGRAM COMPLETERS
September 1, 2007 - August 31, 2008
ASSESSMENT PASSING SCOREPre-Professional Skills
Reading 174
Writing 172
Mathematics 172
Principles of Learning and Teaching
K-6 165
5-9 159
7-Adult 156
Content Specialization
Agriculture 430
Art 160
Biology 152
Business Education 570
Chemistry 157
Driver Education 141
Early Childhood Education (K-4) 530
Early Education (PreK-K) 590
Elementary Education 155
English (5-9) 147
English (5-Adult) 155
Family & Consumer Science 530
French 131
General Math (5-9) 148
General Science (5-9) 151
General Science (5-Adult) 148,142 & 149
German 132
Health 640
Latin 480
Marketing 600
Mathematics 133
Music 155
Oral Communications 600
Physical Education 150
Physics 126
School Library Media 570
Social Studies (5-9) 151
Social Studies (5-Adult) 148
Spanish 143
Technology Education 570
Wellness 640 & 150
Special Education Specializations
Autism 146
Behavior Disorders 156 & 146
Mentally Impaired 146
Multi-Categorical 156 & 146
Preschool Special Needs 550
Severe Disabilities 146
Specific Learning Disabilities 133 & 146
Visually Impaired 660

SECTION III:
RELEASABLE
INSTITUTIONAL PROGRAM COMPLETER PERFORMANC

WaiversFirst
Attempt
Best
Attempt
First
Attempt
Best
Attempt
First
Attempt
Best
Attempt
ACT/SAT
Masters
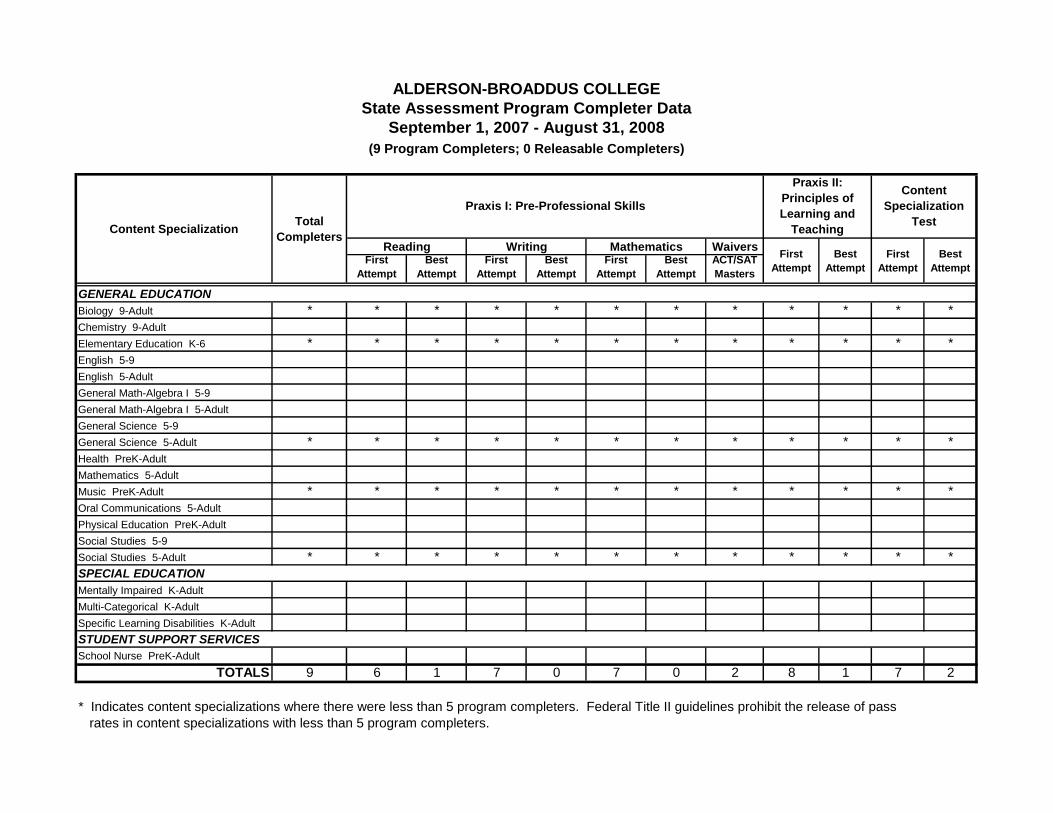
GENERAL EDUCATION
Biology 9-Adult * * * * * * * * * * * *
Chemistry 9-Adult
Elementary Education K-6 * * * * * * * * * * * *
English 5-9
English 5-Adult
General Math-Algebra I 5-9
General Math-Algebra I 5-Adult
General Science 5-9
General Science 5-Adult * * * * * * * * * * * *
Health PreK-Adult
Mathematics 5-Adult
Music PreK-Adult * * * * * * * * * * * *
Oral Communications 5-Adult
Physical Education PreK-Adult
Social Studies 5-9
Social Studies 5-Adult * * * * * * * * * * * *
SPECIAL EDUCATION
Mentally Impaired K-Adult
Multi-Categorical K-Adult
Specific Learning Disabilities K-Adult
STUDENT SUPPORT SERVICES
School Nurse PreK-Adult
TOTALS 9 6 1 7 0 7 0 2 8 1 7 2
* Indicates content specializations where there were less than 5 program completers. Federal Title II guidelines prohibit the release of pass
rates in content specializations with less than 5 program completers.
(9 Program Completers; 0 Releasable Completers)
ALDERSON-BROADDUS COLLEGE
State Assessment Program Completer Data
September 1, 2007 - August 31, 2008
MathematicsFirst
Attempt
Best
Attempt
First
Attempt
Content SpecializationTotal
Completers
Praxis I: Pre-Professional Skills
Praxis II:
Principles of
Learning and
Teaching
Content
Specialization
Test
Reading WritingBest
Attempt
WaiversFirst
Attempt
Best
Attempt
First
Attempt
Best
Attempt
First
Attempt
Best
Attempt
ACT/SAT
Masters
GENERAL EDUCATION
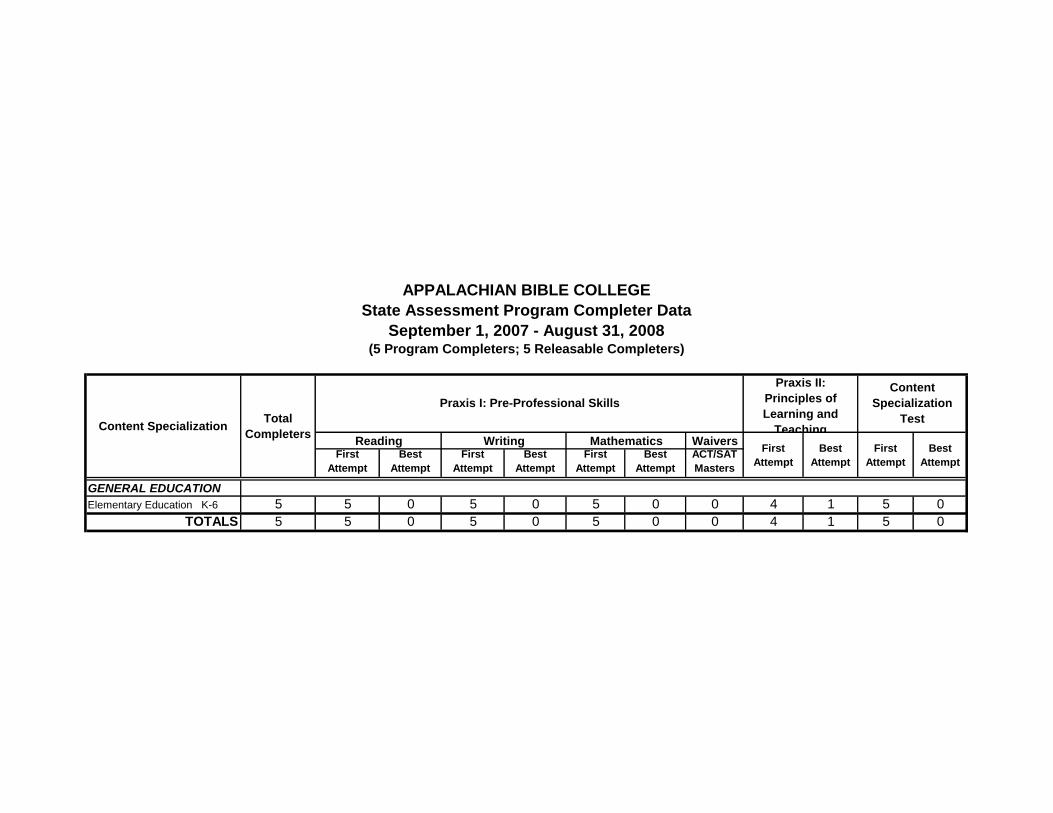
Elementary Education K-6 5 5 0 5 0 5 0 0 4 1 5 0
TOTALS 5 5 0 5 0 5 0 0 4 1 5 0
APPALACHIAN BIBLE COLLEGE
State Assessment Program Completer Data
September 1, 2007 - August 31, 2008
Content SpecializationTotal
Completers
Praxis I: Pre-Professional Skills
Praxis II:
Principles of
Learning and
Teaching
Content
Specialization
Test
Reading WritingBest
Attempt
(5 Program Completers; 5 Releasable Completers)
MathematicsFirst
Attempt
Best
Attempt
First
Attempt

WaiversFirst
Attempt
Best
Attempt
First
Attempt
Best
Attempt
First
Attempt
Best
Attempt
ACT/SAT
Masters
GENERAL EDUCATION
Art PreK-Adult * * * * * * * * * * * *
Biology 9-Adult
Chemistry 9-Adult
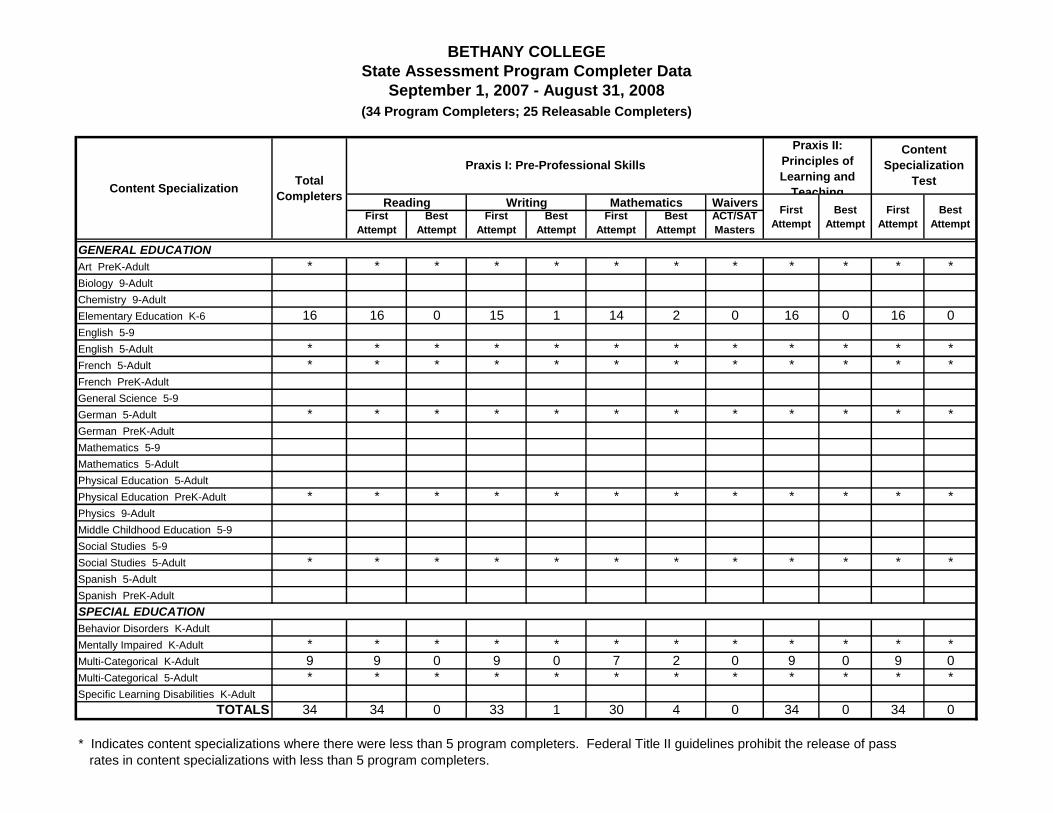
Elementary Education K-6 16 16 0 15 1 14 2 0 16 0 16 0
English 5-9
English 5-Adult * * * * * * * * * * * *
French 5-Adult * * * * * * * * * * * *
French PreK-Adult
General Science 5-9
German 5-Adult * * * * * * * * * * * *
German PreK-Adult
Mathematics 5-9
Mathematics 5-Adult
Physical Education 5-Adult
Physical Education PreK-Adult * * * * * * * * * * * *
Physics 9-Adult
Middle Childhood Education 5-9
Social Studies 5-9
Social Studies 5-Adult * * * * * * * * * * * *
Spanish 5-Adult
Spanish PreK-Adult
SPECIAL EDUCATION
Behavior Disorders K-Adult
Mentally Impaired K-Adult * * * * * * * * * * * *
Multi-Categorical K-Adult 9 9 0 9 0 7 2 0 9 0 9 0
Multi-Categorical 5-Adult * * * * * * * * * * * *
Specific Learning Disabilities K-Adult
TOTALS 34 34 0 33 1 30 4 0 34 0 34 0
* Indicates content specializations where there were less than 5 program completers. Federal Title II guidelines prohibit the release of pass
rates in content specializations with less than 5 program completers.
BETHANY COLLEGE
State Assessment Program Completer Data
September 1, 2007 - August 31, 2008
Content SpecializationTotal
Completers
Praxis I: Pre-Professional Skills
Praxis II:
Principles of
Learning and
Teaching
Content
Specialization
Test
Reading Writing
(34 Program Completers; 25 Releasable Completers)
Best
Attempt
MathematicsFirst
Attempt
Best
Attempt
First
Attempt


WaiversFirst
Attempt
Best
Attempt
First
Attempt
Best
Attempt
First
Attempt
Best
Attempt
ACT/SAT
Masters
GENERAL EDUCATION
Elementary Education K-6 24 21 3 23 1 23 1 0 19 5 18 6
English 5-9 6 5 1 6 0 6 0 0 5 1 6 0
General Science 5-9 * * * * * * * * * * * *
Mathematics 5-9 5 5 0 5 0 5 0 0 5 0 5 0
Social Studies 5-9 * * * * * * * * * * * *
TOTALS 41 37 4 40 1 40 1 0 34 7 34 7
BLUEFIELD STATE COLLEGE
State Assessment Program Completer Data
September 1, 2007 - August 31, 2008
MathematicsFirst
Attempt
Best
Attempt
First
Attempt
Content SpecializationTotal
Completers
(41 Program Completers; 35 Releasable Completers)
Praxis I: Pre-Professional Skills
Praxis II:
Principles of
Learning and
Teaching
Content
Specialization
Test
Reading WritingBest
Attempt


WaiversFirst
Attempt
Best
Attempt
First
Attempt
Best
Attempt
First
Attempt
Best
Attempt
ACT/SAT
Masters
GENERAL EDUCATION
Art 5-Adult
Art PreK-Adult
Biology 9-Adult
Business Education 5-Adult * * * * * * * * * * * *
Chemistry 9-Adult
Early Education PreK-K 5 4 1 4 1 3 2 0 NA NA 5 0
Elementary Education K-6 34 31 3 31 3 31 3 0 26 8 29 5
English 5-9
English 5-Adult * * * * * * * * * * * *
General Science 5-9 * * * * * * * * * * * *
General Science 5-Adult * * * * * * * * * * * *
Health 5-Adult * * * * * * * * * * * *
Health PreK-Adult * * * * * * * * * * * *
Mathematics 5-9 * * * * * * * * * * * *
Mathematics 5-Adult * * * * * * * * * * * *
Music PreK-Adult * * * * * * * * * * * *
Oral Communications 5-Adult
Physical Education 5-Adult
Physical Education PreK-Adult 6 4 2 4 2 5 1 0 3 3 5 1
School Library-Media PreK-Adult
Social Studies 5-Adult 8 7 0 7 0 5 2 1 6 2 5 3
SPECIAL EDUCATION
Behavior Disorders K-Adult
Mentally Impaired K-Adult
Multi-Categorical K-6 * * * * * * * * * * * *
Multi-Categorical 5-Adult * * * * * * * * * * * *
Preschool Special Needs PreK-K 5 4 1 4 1 3 2 0 NA NA 5 0
Specific Learning Disabilities K-Adult
TOTALS 79 65 11 65 11 64 12 3 52 17 68 11
* Indicates content specializations where there were less than 5 program completers. Federal Title II guidelines prohibit the release of pass
rates in content specializations with less than 5 program completers.
CONCORD UNIVERSITY
State Assessment Program Completer Data
September 1, 2007 - August 31, 2008
MathematicsFirst
Attempt
Best
Attempt
First
Attempt
Content SpecializationTotal
Completers
Praxis I: Pre-Professional Skills
(79 Program Completers; Releasable Completers)
Praxis II:
Principles of
Learning and
Teaching
Content
Specialization
Test
Reading WritingBest
Attempt


WaiversFirst
Attempt
Best
Attempt
First
Attempt
Best
Attempt
First
Attempt
Best
Attempt
ACT/SAT
Masters
GENERAL EDUCATION
Art PreK-Adult
Biology 9-Adult
Business Education 5-Adult
Chemistry 9-Adult * * * * * * * * * * * *
Elementary Education K-6 * * * * * * * * * * * *
English 5-9
English 5-Adult * * * * * * * * * * * *
General Math-Algebra I 5-9 * * * * * * * * * * * *
General Science 5-9
General Science 5-Adult
Health PreK-Adult * * * * * * * * * * * *
Mathematics 5-Adult * * * * * * * * * * * *
Music PreK-Adult
Oral Communications 5-Adult
Physical Education PreK-Adult * * * * * * * * * * * *
Social Studies 5-9
Social Studies 5-Adult * * * * * * * * * * * *
Spanish 5-9
Spanish PreK-Adult * * * * * * * * * * * *
Theatre PreK-Adult
TOTALS 14 11 3 14 0 12 2 0 13 1 11 3
NOTE: Shading indicates no exam required.
* Indicates content specializations where there were less than 5 program completers. Federal Title II guidelines prohibit the release of pass
rates in content specializations with less than 5 program completers.
DAVIS & ELKINS COLLEGE
State Assessment Program Completer Data
September 1, 2007 - August 31, 2008
Content SpecializationTotal
Completers
Praxis I: Pre-Professional Skills
Praxis II:
Principles of
Learning and
Teaching
Content
Specialization
Test
Reading Writing
(14 Program Completers; 0 Releasable Completers)
Best
Attempt
MathematicsFirst
Attempt
Best
Attempt
First
Attempt


WaiversFirst
Attempt
Best
Attempt
First
Attempt
Best
Attempt
First
Attempt
Best
Attempt
ACT/SAT
Masters
GENERAL EDUCATION
Art 5-Adult
Art PreK-Adult
Biology 9-Adult * * * * * * * * * * * *
Business Education 5-Adult 8 8 0 6 2 8 0 0 6 2 8 0
Business Education 9-Adult
Chemistry 9-Adult * * * * * * * * * * * *
Computer Science PreK-Adult * * * * * * * * * * * *
Elementary Education K-6 53 35 15 33 17 34 16 3 37 13 45 8
English 5-Adult 8 4 0 3 1 3 1 4 7 1 8 0
Family & Consumer Science 5-Adult * * * * * * * * * * * *
French 5-Adult * * * * * * * * * * * *
General Math-Algebra I 5-9 * * * * * * * * * * * *
General Science 5-Adult * * * * * * * * * * * *
Health 5-Adult 8 7 0 4 3 7 0 1 8 0 8 0
Journalism 5-Adult 6 3 1 3 1 4 0 2 6 0
Mathematics 5-Adult * * * * * * * * * * * *
Music PreK-Adult * * * * * * * * * * * *
Oral Communications 5-Adult * * * * * * * * * * * *
Physical Education PreK-Adult 8 6 2 3 5 8 0 0 7 1 7 1
Physics 9-Adult
School Library-Media PreK-Adult * * * * * * * * * * * *
Social Studies 5-Adult 15 11 3 11 3 11 3 1 14 1 14 1
Spanish PreK-Adult
Technology Education 5-Adult * * * * * * * * * * * *
SPECIAL EDUCATION
Mentally Impaired K-Adult
Multi-Categorical K-6 * * * * * * * * * * * *
Multi-Categorical 5-Adult 11 5 0 4 1 5 0 1 11 0 11 0
Multi-Categorical K-Adult 18 9 1 7 3 10 0 8 17 1 17 1
Specific Learning Disabilities K-Adult
STUDENT SUPPORT SERVICES
School Nurse PreK-Adult
TOTALS 171 107 27 92 42 111 23 33 149 19 146 15
NOTE: Shading indicates no exam required.
* Indicates content specializations where there were less than 5 program completers. Federal Title II guidelines prohibit the release of pass
rates in content specializations with less than 5 program completers.
(171 Program Completers; 135 Releasable Completers)
FAIRMONT STATE UNIVERSITY
State Assessment Program Completer Data
September 1, 2002 - August 31, 2005
Content SpecializationTotal
Completers
Praxis I: Pre-Professional Skills
Praxis II:
Principles of
Learning and
Teaching
Content
Specialization
Test
Reading WritingBest
Attempt
MathematicsFirst
Attempt
Best
Attempt
First
Attempt


WaiversFirst
Attempt
Best
Attempt
First
Attempt
Best
Attempt
First
Attempt
Best
Attempt
ACT/SAT
Masters
GENERAL EDUCATION
Art PreK-Adult
Biology 9-Adult * * * * * * * * * * * *
Business Education 5-Adult
Chemistry 9-Adult
Early Education PreK-K 17 11 5 13 3 13 3 1 14 3 16 1
Elementary Education K-6 29 21 7 22 6 20 8 1 25 4 25 4
English 5-9 * * * * * * * * * * * *
English 5-Adult * * * * * * * * * * * *
General Math-Algebra I 5-9 * * * * * * * * * * * *
General Science 5-9 * * * * * * * * * * * *
General Science 5-Adult * * * * * * * * * * * *
Mathematics 5-Adult * * * * * * * * * * * *
Music PreK-Adult 7 6 1 2 5 7 0 0 7 0 4 3
Physical Education PreK-Adult 9 3 6 7 2 7 2 0 8 1 8 1
Social Studies 5-9 * * * * * * * * * * * *
Social Studies 5-Adult 8 5 1 4 2 8 0 2 8 0 6 4
SPECIAL EDUCATION
Behavior Disorders K-Adult
Mentally Impaired K-Adult
Multi-Categorical K-Adult 8 5 2 4 3 5 2 1 8 0 8 0
Specific Learning Disabilities K-Adult
TOTALS 98 64 26 67 23 73 19 8 88 10 86 14
* Indicates content specializations where there were less than 5 program completers. Federal Title II guidelines prohibit the release of pass
rates in content specializations with less than 5 program completers.
GLENVILLE STATE COLLEGE
State Assessment Program Completer Data
September 1, 2007 - August 31, 2008
Content SpecializationTotal
Completers
Praxis I: Pre-Professional Skills
Praxis II:
Principles of
Learning and
Teaching
Content
Specialization
Test
Reading Writing
(98 Program Completers; 78 Releasable Completers)
Best
Attempt
MathematicsFirst
Attempt
Best
Attempt
First
Attempt
WaiversFirst
Attempt
Best
Attempt
First
Attempt
Best
Attempt
First
Attempt
Best
Attempt
ACT/SAT
Masters
GENERAL EDUCATION
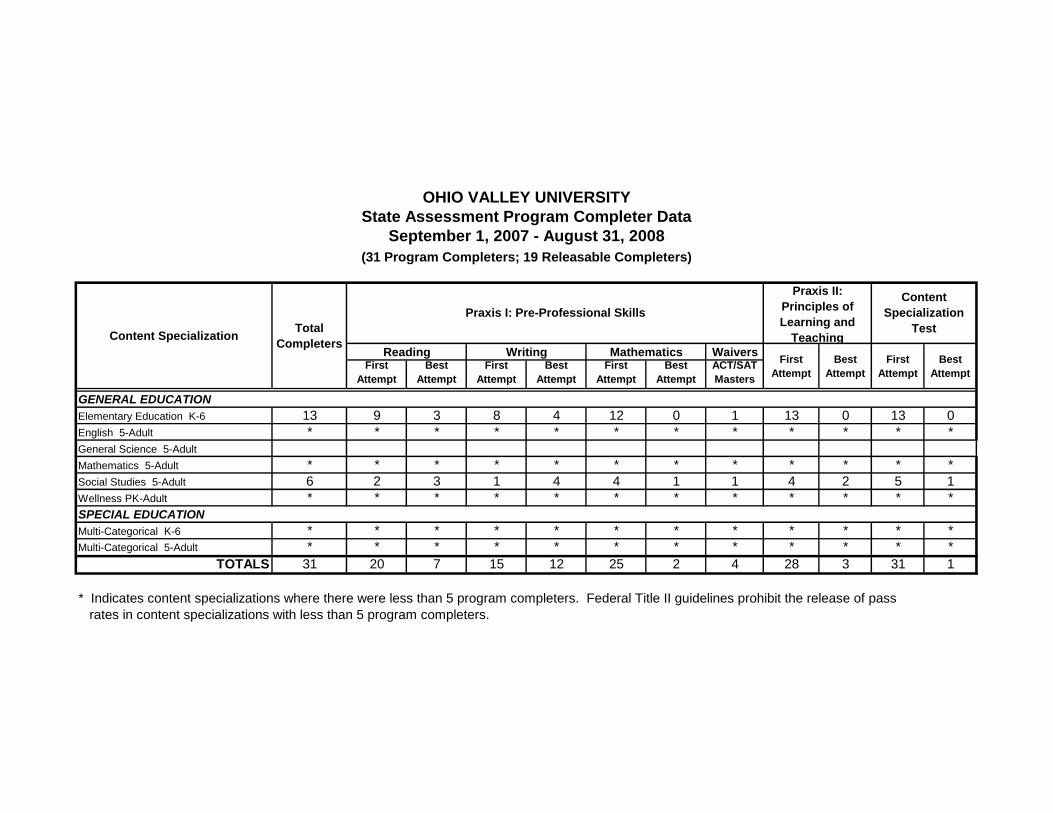
Elementary Education K-6 13 9 3 8 4 12 0 1 13 0 13 0
English 5-Adult * * * * * * * * * * * *
General Science 5-Adult
Mathematics 5-Adult * * * * * * * * * * * *
Social Studies 5-Adult 6 2 3 1 4 4 1 1 4 2 5 1
Wellness PK-Adult * * * * * * * * * * * *
SPECIAL EDUCATION
Multi-Categorical K-6 * * * * * * * * * * * *
Multi-Categorical 5-Adult * * * * * * * * * * * *
TOTALS 31 20 7 15 12 25 2 4 28 3 31 1
* Indicates content specializations where there were less than 5 program completers. Federal Title II guidelines prohibit the release of pass
rates in content specializations with less than 5 program completers.
OHIO VALLEY UNIVERSITY
State Assessment Program Completer Data
September 1, 2007 - August 31, 2008
Content
Specialization
Test
Reading WritingBest
Attempt
MathematicsFirst
Attempt
Best
Attempt
First
Attempt
Content SpecializationTotal
Completers
Praxis I: Pre-Professional Skills
Praxis II:
Principles of
Learning and
Teaching
(31 Program Completers; 19 Releasable Completers)


WaiversFirst
Attempt
Best
Attempt
First
Attempt
Best
Attempt
First
Attempt
Best
Attempt
ACT/SAT
Masters
GENERAL EDUCATION
Elementary Education K-6 * * * * * * * * * * * *
Health PreK-Adult
Physical Education PreK-Adult
Social Studies 5-Adult * * * * * * * * * * * *
TOTALS 3 3 0 3 0 3 0 0 3 0 3 0
* Indicates content specializations where there were less than 5 program completers. Federal Title II guidelines prohibit the release of pass
rates in content specializations with less than 5 program completers.
(3 Program Completers; 0 Releasable Completers)
SALEM INTERNATIONAL UNIVERSITY
State Assessment Program Completer Data
September 1, 2007 - August 31, 2008
Content SpecializationTotal
Completers
Praxis I: Pre-Professional Skills
Praxis II:
Principles of
Learning and
Teaching
Content
Specialization
Test
Reading WritingBest
Attempt
MathematicsFirst
Attempt
Best
Attempt
First
Attempt

WaiversFirst
Attempt
Best
Attempt
First
Attempt
Best
Attempt
First
Attempt
Best
Attempt
ACT/SAT
Masters
GENERAL EDUCATION
Art PreK-Adult * * * * * * * * * * * *
Biology 9-Adult * * * * * * * * * * * *
Business Education 5-Adult
Chemistry 9-Adult
Early Education PreK-K
Elementary Education K-6 25 17 3 18 2 18 2 5 24 1 25 0
English 5-9
English 5-Adult * * * * * * * * * * * *
Family & Consumer Science 5-Adult * * * * * * * * * * * *
General Math-Algebra I 5-9
General Science 5-Adult
Health 5-Adult * * * * * * * * * * * *
Mathematics 5-Adult * * * * * * * * * * * *
Music PreK-Adult * * * * * * * * * * * *
Physical Education PreK-Adult 5 4 1 4 1 5 0 0 3 2 5 0
Social Studies 5-9 * * * * * * * * * * * *
Social Studies 5-Adult 6 4 1 5 0 5 0 1 6 0 6 0
STUDENT SUPPORT SERVICES
School Nurse PreK-Adult
TOTALS 54 40 6 42 4 39 7 8 49 5 53 1
NOTE: Shading indicates no exam required.
* Indicates content specializations where there were less than 10 program completers. Federal Title II guidelines prohibit the release of pass
rates in content specializations with less than 10 program completers.
(54 Program Completers; 36 Releasable Completers)
SHEPHERD UNIVERSITY
State Assessment Program Completer Data
September 1, 2007 - August 31, 2008
Content SpecializationTotal
Completers
Praxis I: Pre-Professional Skills
Praxis II:
Principles of
Learning and
Teaching
Content
Specialization
Test
Reading WritingBest
Attempt
MathematicsFirst
Attempt
Best
Attempt
First
Attempt


WaiversFirst
Attempt
Best
Attempt
First
Attempt
Best
Attempt
First
Attempt
Best
Attempt
ACT/SAT
Masters
GENERAL EDUCATION
Biology 9-Adult
Elementary Education K-6 7 6 0 5 1 5 1 1 6 1 7 0
English 5-Adult * * * * * * * * * * * *
General Science 5-Adult * * * * * * * * * * * *
Music PreK-Adult
Social Studies 5-Adult
Wellness PreK-Adult
TOTALS 10 8 0 7 1 7 1 2 9 1 8 2
* Indicates content specializations where there were less than 5 program completers. Federal Title II guidelines prohibit the release of pass
rates in content specializations with less than 5 program completers.
UNIVERSITY OF CHARLESTON
State Assessment Program Completer Data
September 1, 2007 - August 31, 2008
MathematicsFirst
Attempt
Best
Attempt
First
Attempt
Content SpecializationTotal
Completers
( 10 Program Completers; 7 Releasable Completers)
Praxis I: Pre-Professional Skills
Praxis II:
Principles of
Learning and
Teaching
Content
Specialization
Test
Reading WritingBest
Attempt


WaiversFirst
Attempt
Best
Attempt
First
Attempt
Best
Attempt
First
Attempt
Best
Attempt
ACT/SAT
Masters
GENERAL EDUCATION
Art PreK-Adult 5 3 2 3 2 5 0 0 4 1 3 2
Early Education PreK-K 19 13 4 15 2 15 2 2 14 5 17 2
Elementary Education K-6 50 35 14 37 12 39 10 1 44 6 41 9
English 5-9
English 5-Adult 8 7 1 8 0 7 1 0 8 0 8 0
General Math-Algebra I 5-9 * * * * * * * * * * * *
General Science 5-9 * * * * * * * * * * * *
General Science 5-Adult * * * * * * * * * * * *
Health PreK-Adult 15 11 3 10 4 11 3 1 15 0 15 0
Mathematics 5-Adult 6 6 0 5 1 6 0 0 6 0 4 2
Music PreK-Adult 5 4 0 3 1 4 0 1 5 0 5 0
Physical Education PreK-Adult 14 11 3 10 4 11 3 0 14 0 13 1
Social Studies 5-9
Social Studies 5-Adult 6 4 1 5 0 5 0 1 6 0 6 0
SPECIAL EDUCATION
Behavior Disorders K-Adult * * * * * * * * * * * *
Mentally Impaired K-Adult * * * * * * * * * * * *
Multi-Categorical K-Adult 14 8 6 8 6 8 6 0 13 1 14 0
Specific Learning Disabilities K-Adult
STUDENT SUPPORT SERVICES
School Nurse PreK-Adult
TOTALS 152 109 36 111 34 119 26 7 139 13 136 16
* Indicates content specializations where there were less than 5 program completers. Federal Title II guidelines prohibit the release of pass
rates in content specializations with less than 5 program completers.
WEST LIBERTY STATE COLLEGE
State Assessment Program Completer Data
September 1, 2007 - August 31, 2008
Content SpecializationTotal
Completers
Praxis I: Pre-Professional Skills
Praxis II:
Principles of
Learning and
Teaching
Content
Specialization
Test
Reading Writing
( 152 Program Completers; 142 Releasable Completers)
Best
Attempt
MathematicsFirst
Attempt
Best
Attempt
First
Attempt
WaiversFirst
Attempt
Best
Attempt
First
Attempt
Best
Attempt
First
Attempt
Best
Attempt
ACT/SAT
Masters
GENERAL EDUCATION
Art 5-Adult
Art PreK-Adult
Biology 9-Adult
Business Education 5-Adult * * * * * * * * * * * *
Chemistry 9-Adult
Early Education PreK-K
Elementary Education K-6 36 32 4 27 9 30 6 0 24 12 32 4
English 5-9
English 5-Adult 9 9 0 8 1 8 1 0 9 0 9 0
French PreK-Adult * * * * * * * * * * * *
General Science 5-Adult * * * * * * * * * * * *
Health 5-Adult * * * * * * * * * * * *
Journalism 5-Adult
Mathematics 5-9
Mathematics 5-Adult * * * * * * * * * * * *
Music PreK-Adult * * * * * * * * * * * *
Physical Education PreK-Adult * * * * * * * * * * * *
Reading K-6 8 6 2 8 0 8 0 0 5 3
Social Studies 5-9 * * * * * * * * * * * *
Social Studies 5-Adult * * * * * * * * * * * *
Spanish PreK-Adult * * * * * * * * * * * *
Theatre PreK-Adult
SPECIAL EDUCATION
Mentally Impaired K-6 * * * * * * * * * * * *
Mentally Impaired 5-Adult
Mentally Impaired K-Adult
Multi-Categorical K-AD * * * * * * * * * * * *
Specific Learning Disabilities 5-Adult
Specific Learning Disabilities K-Adult
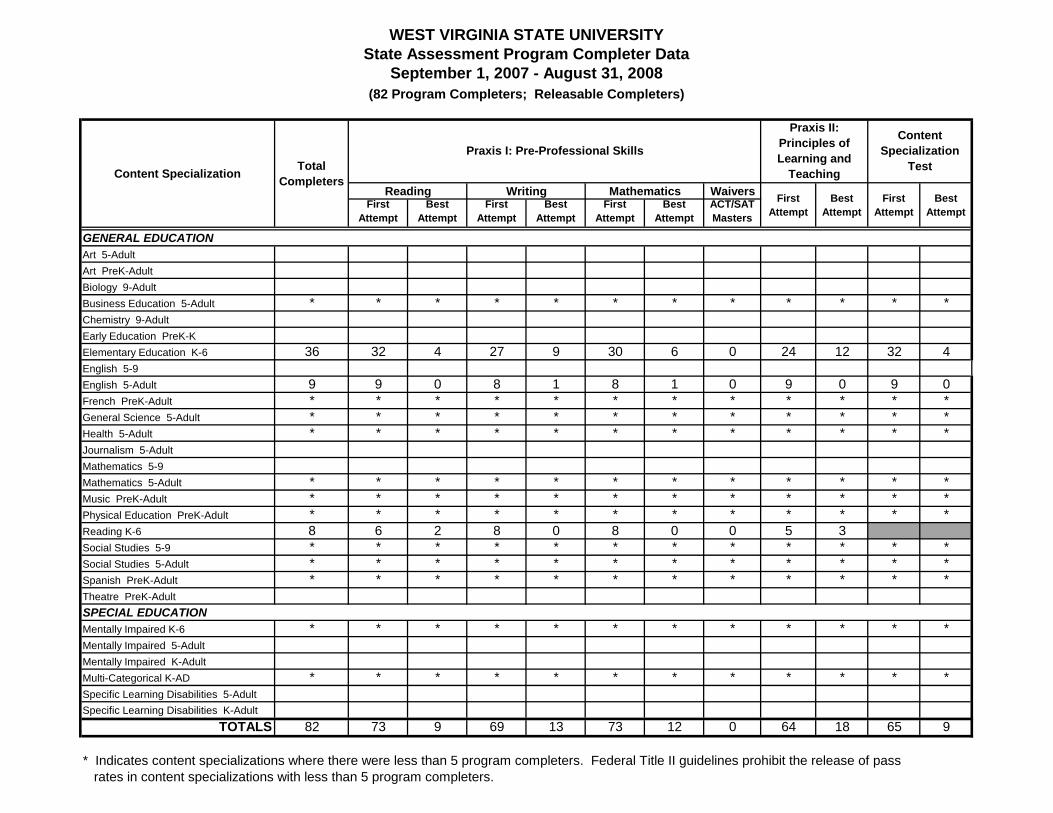
TOTALS 82 73 9 69 13 73 12 0 64 18 65 9
* Indicates content specializations where there were less than 5 program completers. Federal Title II guidelines prohibit the release of pass
rates in content specializations with less than 5 program completers.
WEST VIRGINIA STATE UNIVERSITY
State Assessment Program Completer Data
September 1, 2007 - August 31, 2008
Content SpecializationTotal
Completers
Praxis I: Pre-Professional Skills
Praxis II:
Principles of
Learning and
Teaching
Content
Specialization
Test
Reading Writing
(82 Program Completers; Releasable Completers)
Best
Attempt
MathematicsFirst
Attempt
Best
Attempt
First
Attempt

WaiversFirst
Attempt
Best
Attempt
First
Attempt
Best
Attempt
First
Attempt
Best
Attempt
ACT/SAT
Masters
GENERAL EDUCATION
Agriculture 5-Adult 9 6 1 7 0 7 0 2 8 1 9 0
Art PreK-Adult 7 7 0 7 0 7 0 0 7 0 6 1
Biology 9-Adult 7 4 0 4 0 4 0 3 7 0 6 1
Chemistry 9-Adult * * * * * * * * * * * *
Early Education PreK-K 23 19 2 21 0 19 2 2 22 1 23 0
Elementary Education K-6 85 61 5 65 1 62 4 19 77 8 76 9
English 5-9 * * * * * * * * * * * *
English 5-Adult 22 5 1 6 0 6 0 16 22 0 19 3
French 5-9
French 5-Adult
French PreK-Adult
General Math-Algebra I 5-9 14 7 3 9 1 9 1 4 11 3 10 4
General Science 5-9 7 5 0 5 0 5 0 2 6 1 5 2
General Science 5-Adult 11 5 0 5 0 5 0 6 11 0 10 1
German 9-Adult
Health 5-Adult 17 13 4 13 4 15 2 0 16 1 15 2
Journalism 9-Adult
Mathematics 5-Adult 5 4 0 4 0 4 0 1 4 1 3 2
Music PreK-Adult 32 22 3 22 3 32 0 7 31 1 31 1
Physical Education PreK-Adult 17 13 4 13 4 15 2 0 16 1 15 2
Physics 9-Adult * * * * * * * * * * * *
Preschool Education Birth-PreK
Reading Specialist PreK-Adult
Russian 9-Adult
Social Studies 5-9 5 5 0 5 0 5 0 0 5 0 5 0
Social Studies 5-Adult 14 9 0 9 0 9 0 5 13 1 14 0
Spanish 5-9 * * * * * * * * * *
Spanish 5-Adult 6 2 1 3 0 3 0 3 6 0 6 0
Spanish PreK-Adult
SPECIAL EDUCATION
Behavior Disorders K-Adult
Gifted K-6
Gifted 5-Adult
Mentally Impaired K-Adult
Multi-Categorical K-6 22 19 1 18 2 20 0 2 21 1 22 0
Multi-Categorical 5-Adult * * * * * * * * * * * *
Multi-Categorical K-Adult * * * * * * * * * * * *
Preschool Special Needs PreK-K
Severely/Profoundly Impaired K-Adult * * * * * * * * * * * *
Specific Learning Disabilities K-Adult
Visually Impaired PreK-Adult
TOTALS 323 213 25 223 15 234 11 85 301 22 289 31
NOTE: Shading indicates no test required.
* Indicates content specializations where there were less than 5 program completers. Federal Title II guidelines prohibit the release of pass
rates in content specializations with less than 5 program completers.
WEST VIRGINIA UNIVERSITY
State Assessment Program Completer Data
September 1, 2007 - August 31, 2008
Content SpecializationTotal
Completers
Praxis I: Pre-Professional Skills
Praxis II:
Principles of
Learning and
Teaching
Content
Specialization
Test
Reading Writing
(323 Program Completers; 303 Releasable Completers)
Best
Attempt
MathematicsFirst
Attempt
Best
Attempt
First
Attempt


WaiversFirst
Attempt
Best
Attempt
First
Attempt
Best
Attempt
First
Attempt
Best
Attempt
ACT/SAT
Masters
GENERAL EDUCATION
Elementary Education K-6 39 30 7 30 7 29 8 2 31 8 35 4
English 5-9 * * * * * * * * * * * *
General Math-Algebra I 5-9 * * * * * * * * * * * *
General Science 5-9 * * * * * * * * * * * *
Social Studies 5-9 * * * * * * * * * * * *
TOTALS 54 43 8 43 8 41 10 3 45 9 50 4
WEST VIRGINIA UNIVERSITY - PARKERSBURG
State Assessment Program Completer Data
September 1, 2007 - August 31, 2008
Content SpecializationTotal
Completers
Praxis I: Pre-Professional Skills
Praxis II:
Principles of
Learning and
Teaching
Content
Specialization
Test
Reading Writing
(54 Program Completers; 39 Releasable Completers)
Best
Attempt
MathematicsFirst
Attempt
Best
Attempt
First
Attempt

WaiversFirst
Attempt
Best
Attempt
First
Attempt
Best
Attempt
First
Attempt
Best
Attempt
ACT/SAT
Masters
GENERAL EDUCATION
Art 5-Adult
Art PreK-Adult
Biology 9-Adult * * * * * * * * * * * *
Chemistry 9-Adult
Elementary Education K-6 13 8 2 10 0 9 1 3 12 1 12 1
English 5-Adult * * * * * * * * * * * *
General Math-Algebra I 5-9
General Science 5-Adult * * * * * * * * * * * *
Health PreK-Adult
Mathematics 5-Adult * * * * * * * * * * * *
Music PreK-Adult * * * * * * * * * * * *
Physical Education 5-Adult
Physical Education PreK-Adult * * * * * * * * * * * *
Physics 9-Adult
Social Studies 5-9
Social Studies 5-Adult * * * * * * * * * * * *
SPECIAL EDUCATION
Specific Learning Disabilities K-6 * * * * * * * * * * * *
Specific Learning Disabilities K-Adult 5 3 1 4 0 4 0 1 4 1 5 0
TOTALS 31 21 3 24 0 23 1 7 29 2 30 1
* Indicates content specializations where there were less than 5 program completers. Federal Title II guidelines prohibit the release of pass
rates in content specializations with less than 5 program completers.
(31 Program Completers; 18 Releasable Completers)
WEST VIRGINIA WESLEYAN COLLEGE
State Assessment Program Completer Data
September 1, 2007 - August 31, 2008
Content SpecializationTotal
Completers
Praxis I: Pre-Professional Skills
Praxis II:
Principles of
Learning and
Teaching
Content
Specialization
Test
Reading WritingBest
Attempt
MathematicsFirst
Attempt
Best
Attempt
First
Attempt


WaiversFirst
Attempt
Best
Attempt
First
Attempt
Best
Attempt
First
Attempt
Best
Attempt
ACT/SAT
Masters
GENERAL EDUCATION
Biology 9-Adult * * * * * * * * * * * *
Chemistry 9-Adult * * * * * * * * * * * *
Elementary Education K-6 7 6 1 7 0 7 0 0 7 0 7 0
English 5-Adult 9 9 0 9 0 9 0 0 9 0 8 1
French 5-Adult * * * * * * * * * * * *
General Science 5-Adult * * * * * * * * * * * *
Mathematics 5-Adult 5 5 0 5 0 5 0 0 4 1 5 0
Physics 9-Adult * * * * * * * * * * * *
Social Studies 5-Adult 10 10 0 10 0 9 1 0 10 0 10 0
Spanish 5-Adult * * * * * * * * * * * *
SPECIAL EDUCATION
Behavior Disorders K-Adult
Multi-Categorical K-Adult * * * * * * * * * * * *
Specific Learning Disabilities K-Adult
TOTALS 43 42 1 43 0 42 1 0 42 1 37 6
* Indicates content specializations where there were less than 5 program completers. Federal Title II guidelines prohibit the release of pass
rates in content specializations with less than 5 program completers.
( 43 Program Completers; Releasable Completers)
WHEELING JESUIT UNIVERSITY
State Assessment Program Completer Data
September 1, 2007 - August 31, 2008
MathematicsFirst
Attempt
Best
Attempt
First
Attempt
Content SpecializationTotal
Completers
Praxis I: Pre-Professional Skills
Praxis II:
Principles of
Learning and
Teaching
Content
Specialization
Test
Reading WritingBest
Attempt

SECTION IV:
PERFORMANCE ASSESSMENT DATA

4 3 2 1
Preparation and Planning 16 3 2 0 3.67
Content Knowledge 20 1 0 0 3.95
Assessment 15 6 0 0 3.71
Pedagogy 17 4 0 0 3.81
Classroom
Management/Climate15 5 0 1 3.62
Instructional Technology 18 3 0 0 3.86
Diversity/Special Needs 19 2 0 0 3.90
Professionalism/Learning
Community17 3 0 0 3.67
4 3 2 1
Preparation and Planning 3 2 0 0 3.6
Content Knowledge 3 2 0 0 3.6
Pedagogy 3 2 0 0 3.6
Diversity/Special Needs 3 2 0 0 3.6
Classroom
Management/Climate
Appalachian Bible College
Performance Assessment of Student Teachers
2007-2008
Area of Evaluation
5- Number of teachers sampled
100% Responding
Performance Assessment of Student Teachers
Alderson-Broaddus College
2007-2008
21 - Number of teachers sampled
100% Responding
Area of Evaluation
Above
Entry
Entry Below
Entry
Un-
acceptable
Mean
Score
Above
EntryEntry
Below
Entry
Un-
acceptable
Mean
Score
0 0 3.6
Professionalism/Learning
Community0 0 3.6
3 2
3 2
Mean Satisfaction Rating of Student Teachers by Cooperating Teachers

4 3 2 1
Preparation and Planning 32 13 0 0 3.71
Content Knowledge 28 17 0 0 3.62
Pedagogy 42 3 0 0 3.93
Classroom
Management/Climate30 15 0 0 3.67
Instructional Technology 36 9 0 0 3.80
Diversity/Special Needs 32 13 0 0 3.71
Professionalism/Learning
Community36 9 0 0 3.80
4 3 2 1
Preparation and Planning 34 8 0 0 3.81
Content Knowledge 37 5 0 0 3.88
Pedagogy 40 2 0 0 3.95
Classroom
Management/Climate34 8 0 0 3.81
Instructional Technology 40 2 0 0 3.95
Diversity/Special Needs 39 3 0 0 3.93
Professionalism/Learning
Community40 2 0 0 3.95
Mean
Score
108 - Number of teachers sampled
42% Responding
Bethany College
Performance Assessment of Student Teachers
2007-2008
Above
EntryEntry
Below
Entry
Un-
acceptableArea of Evaluation
42 - Number of teachers sampled
100% Responding
Area of EvaluationAbove
EntryEntry
Below
Entry
Un-
acceptable
Mean
Score
Bluefield State College
Performance Assessment of Student Teachers
2007-2008
Mean Satisfaction Rating of Student Teachers by Cooperating Teachers

4 3 2 1
Preparation and Planning 49 16 0 0 3.75
Content Knowledge 45 20 0 0 3.69
Pedagogy 48 17 0 0 3.74
Classroom
Management/Climate37 26 2 0 3.48
Instructional Technology 44 21 0 0 3.68
Diversity/Special Needs 44 21 0 0 3.68
Professionalism/Learning
Community41 22 2 0 3.54
4 3 2 1
Preparation and Planning 4 6 0 0 3.40
Content Knowledge 9 1 0 0 3.90
Pedagogy 2 8 0 0 3.20
Classroom
Management/Climate8 2 0 0 3.80
Instructional Technology 8 2 0 0 3.80
Diversity/Special Needs 6 4 0 0 3.60
Professionalism/Learning
Community6 4 2 0 3.60
2007-2008
Area of EvaluationUn-
acceptable
Mean
Score
Concord University
Performance Assessment of Student Teachers
Above
EntryEntry
Below
Entry
Un-
acceptable
Mean
ScoreArea of Evaluation
127 - Number of teachers sampled
100% Responding
Davis & Elkins College
Performance Assessment of Student Teachers
2007-2008
15- Number of teachers sampled
100% Responding
Above
EntryEntry
Below
Entry
Mean Satisfaction Rating of Student Teachers by Cooperating Teachers

4 3 2 1
Preparation and Planning 61 10 0 0 3.86
Content Knowledge 64 7 0 0 3.90
Pedagogy 61 10 0 0 3.86
Classroom
Management/Climate61 10 0 0 3.86
Instructional Technology 64 7 0 0 3.90
Diversity/Special Needs 62 8 1 0 3.86
Professionalism/Learning
Community68 3 0 0 3.96
4 3 2 1
Preparation and Planning 32 10 0 0 3.76
Content Knowledge 28 14 0 0 3.67
Pedagogy 33 9 0 0 3.79
Classroom
Management/Climate32 10 0 0 3.76
Instructional Technology 30 12 0 0 3.71
Diversity/Special Needs 27 15 0 0 3.64
Professionalism/Learning
Community36 6 0 0 3.86
2007-2008
Area of EvaluationAbove
EntryEntry
Below
Entry
Un-
acceptable
Mean
Score
Fairmont State University
Performance Assessment of Student Teachers
Above
EntryEntry
Below
Entry
Un-
acceptable
Mean
ScoreArea of Evaluation
71- Number of teachers sampled
90% Responding
Glenville State College
Performance Assessment of Student Teachers
2007-2008
59- Number of teachers sampled
100% Responding
Mean Satisfaction Rating of Student Teachers by Cooperating Teachers
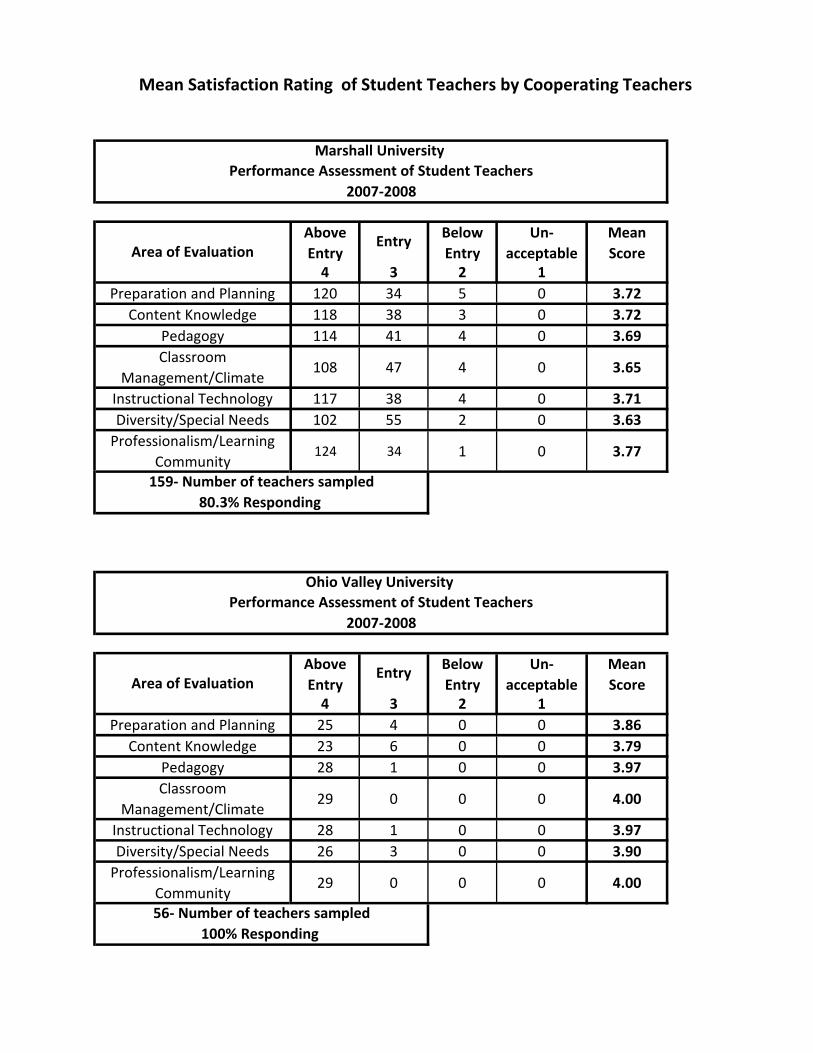
4 3 2 1
Preparation and Planning 120 34 5 0 3.72
Content Knowledge 118 38 3 0 3.72
Pedagogy 114 41 4 0 3.69
Classroom
Management/Climate108 47 4 0 3.65
Instructional Technology 117 38 4 0 3.71
Diversity/Special Needs 102 55 2 0 3.63
Professionalism/Learning
Community124 34 1 0 3.77
4 3 2 1
Preparation and Planning 25 4 0 0 3.86
Content Knowledge 23 6 0 0 3.79
Pedagogy 28 1 0 0 3.97
Classroom
Management/Climate29 0 0 0 4.00
Instructional Technology 28 1 0 0 3.97
Diversity/Special Needs 26 3 0 0 3.90
Professionalism/Learning
Community29 0 0 0 4.00
2007-2008
Area of EvaluationAbove
EntryEntry
Below
Entry
Un-
acceptable
Mean
Score
Marshall University
Performance Assessment of Student Teachers
Above
EntryEntry
Below
Entry
Un-
acceptable
Mean
ScoreArea of Evaluation
159- Number of teachers sampled
80.3% Responding
Ohio Valley University
Performance Assessment of Student Teachers
2007-2008
56- Number of teachers sampled
100% Responding
Mean Satisfaction Rating of Student Teachers by Cooperating Teachers

4 3 2 1
Preparation and Planning 4 3 0 0 3.57
Content Knowledge 4 3 0 0 3.57
Pedagogy 0 7 0 0 3.00
Classroom
Management/Climate4 3 0 0 3.57
Instructional Technology 0 7 0 0 3.00
Diversity/Special Needs 0 7 0 0 3.00
Professionalism/Learning
Community0 7 0 0 3.00
4 3 2 1
Preparation and Planning 92 0 3.00
Content Knowledge 92 0 3.00
Pedagogy 92 0 3.00
Classroom
Management/Climate92 0 3.00
Instructional Technology 92 0 3.00
Diversity/Special Needs 92 0 3.00
Professionalism/Learning
Community92 0 3.00
7- Number of teachers sampled
100% Responding
2007-2008
Area of EvaluationAbove
EntryEntry
Below
Entry
Un-
acceptable
Mean
Score
Salem International University
Performance Assessment of Student Teachers
92- Number of teachers sampled
100% Responding
Shepherd University Performance Assessment of Student Teachers
2007-2008
Area of EvaluationAbove
EntryEntry
Below
Entry
Un-
acceptable
Mean
Score
Mean Satisfaction Rating of Student Teachers by Cooperating Teachers

4 3 2 1
Preparation and Planning 8 5 0 0 3.62
Content Knowledge 8 5 0 0 3.62
Pedagogy 8 5 0 0 3.62
Classroom
Management/Climate8 5 0 0 3.62
Instructional Technology 8 5 0 0 3.62
Diversity/Special Needs 8 5 0 0 3.62
Professionalism/Learning
Community8 5 0 0 3.62
4 3 2 1
Preparation and Planning 23 42 10 0 3.17
Content Knowledge 28 38 8 1 3.24
Pedagogy 27 40 8 0 3.25
Classroom
Management/Climate18 36 21 0 2.96
Instructional Technology 15 29 26 5 2.72
Diversity/Special Needs 32 29 14 0 3.24
Professionalism/Learning
Community40 35 0 0 3.53
Mean Satisfaction Rating of Student Teachers by Cooperating Teachers
University of CharlestonPerformance Assessment of Student Teachers
2007-2008
Mean
Score
13- Number of teachers sampled
100% Responding
Area of EvaluationAbove
EntryEntry
Below
Entry
Un-
acceptable
West Liberty University
Performance Assessment of Student Teachers2007-2008
Mean
Score
75- Number of teachers sampled
100% Responding
Area of EvaluationAbove
EntryEntry
Below
Entry
Un-
acceptable

4 3 2 1
Preparation and Planning 73 7 0 0 3.91
Content Knowledge 72 8 0 0 3.90
Pedagogy 74 6 0 0 3.93
Classroom
Management/Climate72 8 0 0 3.90
Instructional Technology 72 7 1 0 3.89
Diversity/Special Needs 70 10 0 0 3.88
Professionalism/Learning
Community75 5 0 0 3.94
4 3 2 1
Preparation and Planning 96 6 0 0 3.94
Content Knowledge 97 5 0 0 3.95
Pedagogy 94 8 0 0 3.92
Classroom
Management/Climate91 11 0 0 3.89
Instructional Technology 97 5 0 0 3.95
Diversity/Special Needs 92 10 0 0 3.90
Professionalism/Learning
Community95 7 0 0 3.93
Mean Satisfaction Rating of Student Teachers by Cooperating Teachers
West Virginia State University
Performance Assessment of Student Teachers
80- Number of teachers sampled
100% Responding
West Virginia University
Performance Assessment of Student Teachers2007-2008
2007-2008
Area of EvaluationAbove
EntryEntry
Below
Entry
Un-
acceptable
Mean
Score
Mean
Score
105- Number of teachers sampled
97% Responding
Area of EvaluationAbove
EntryEntry
Below
Entry
Un-
acceptable

4 3 2 1
Preparation and Planning 31 50 0 0 3.38
Content Knowledge 44 37 0 0 3.54
Pedagogy 31 50 0 0 3.38
Classroom
Management/Climate31 50 0 0 3.38
Instructional Technology 31 50 0 0 3.38
Diversity/Special Needs 40 41 0 0 3.49
Professionalism/Learning
Community45 36 0 0 3.56
4 3 2 1
Preparation and Planning 21 2 0 0 3.91
Content Knowledge 22 1 0 0 3.96
Pedagogy 19 4 0 0 3.83
Classroom
Management/Climate22 1 0 0 3.96
Instructional Technology 20 3 0 0 3.87
Diversity/Special Needs 17 6 0 0 3.74
Professionalism/Learning
Community21 2 0 0 3.91
Mean Satisfaction Rating of Student Teachers by Cooperating Teachers
West Virginia University - ParkersburgPerformance Assessment of Student Teachers
Performance Assessment of Student Teachers2007-2008
2007-2008
Area of EvaluationAbove
EntryEntry
Below
Entry
Un-
acceptable
Mean
Score
Mean
Score
40- Number of teachers sampled
100% Responding
Area of EvaluationAbove
EntryEntry
Below
Entry
Un-
acceptable
59- Number of teachers sampled
100% Responding
West Virginia Wesleyan College

4 3 2 1
Preparation and Planning 19 3 1 0 3.78
Content Knowledge 19 3 1 0 3.78
Pedagogy 18 4 1 0 3.74
Classroom
Management/Climate18 5 0 0 3.78
Instructional Technology 17 5 0 1 3.65
Diversity/Special Needs 19 3 1 0 3.78
Professionalism/Learning
Community14 9 0 0 3.61
62.2% Responding
2007-2008
Area of EvaluationAbove
EntryEntry
Below
Entry
Un-
acceptable
Mean Satisfaction Rating of Student Teachers by Cooperating Teachers
Mean
Score
Wheeling Jesuit University Performance Assessment of Student Teachers
23- Number of teachers sampled