THE MEASUREMENT OF ECONOMIC PERFORMANCE …archives.cerium.ca/IMG/pdf/1-Measurement.pdf · THE...
64
THE MEASUREMENT OF ECONOMIC PERFORMANCE AND SOCIAL PROGRESS REVISITED OFCE N° 2009-33 DECEMBER 2009 Professor Joseph E. Stiglitz Chair, Columbia University Professor Amartya Sen Chair Adviser, Harvard University Professor Jean-Paul Fitoussi Coordinator of the Commission, IEP OFCE - Centre de recherche en économie de Sciences Po 69, quai d’Orsay - 75340 Paris Cedex 07 - Tél/ 01 44 18 54 00 - Fax/ 01 45 56 06 15 www.ofce.sciences-po.fr
Transcript of THE MEASUREMENT OF ECONOMIC PERFORMANCE …archives.cerium.ca/IMG/pdf/1-Measurement.pdf · THE...
THE MEASUREMENT OF ECONOMIC PERFORMANCE AND SOCIAL PROGRESS REVISITED
OFCE
N° 2009-33 DECEMBER 2009
Professor Joseph E. Stiglitz
Chair, Columbia University Professor Amartya Sen
Chair Adviser, Harvard University Professor Jean-Paul Fitoussi
Coordinator of the Commission, IEP
OFCE - Centre de recherche en économie de Sciences Po 69, quai d’Orsay - 75340 Paris Cedex 07 - Tél/ 01 44 18 54 00 - Fax/ 01 45 56 06 15 www.ofce.sciences-po.fr
p0798467
Zone de texte
1. Stiglitz J., Sen A., Fitoussi J.-P., 2009, The measurement of economic performance and social progress revisited, Columbia University, IEP, OFCE Working Paper, 64 p.
The Measurement of Economic
Performance and Social Progress
Revisited
Reflections and Overview
Joseph STIGLITZ, Amartya SEN and Jean-Paul FITOUSSI
www.stiglitz-sen-fitoussi.fr

The Measurement of Economic Performance and Social Progress Revisited
ProlegomenaTHE MULTIPLE PURPOSES OF MEASUREMENT
1. In February 2008, the President of the French Republic, Nicholas Sarkozy, unsatisfiedwith the present state of statistical information about the economy and the society, asked,Joseph Stiglitz (President of the Commission), Amartya Sen (Advisor) and Jean PaulFitoussi (Coordinator) to create a Commission, subsequently called “The Commissionon the Measurement of Economic Performance and Social Progress” (CMEPSP). TheCommission’s aim has been to identify the limits of GDP as an indicator of economicperformance and social progress, including the problems with its measurement, toconsider what additional information might be required for the production of morerelevant indicators of social progress, to assess the feasibility of alternative measurementtools, and to discuss how to present the statistical information in an appropriate way.
2. The Commission reviewed the purposes to be served by systems of measurement ofeconomic performance and social progress, and the extent to which current systems servethese purposes.
3. The purposes of our statistical systems are multiple, and a metric that is adapted to onepurpose may be ill suited to another. Sometimes confusion is engendered when a measureadapted to one purpose is used to highlight another. For example, GDP is neither ameasure of income nor a measure of well-being. What we want to measure is the keyquestion. We may want to measure, for instance, the levels of market activity—one of theoriginal objectives of national income measurement. But increasingly, there is a demandto go beyond measures of market activity to measures of well-being. Whatever it is thatwe want to measure, we can measure the flows (for instance, the level of production and/or income) during a given time interval, say a year. We may measure changes in thoseflows, say their rate of growth over time. We may want to compare levels of incomeacross countries or we may be interested in international comparisons of countries’growth rates.
4. It is important to distinguish between these different purposes, since they are affecteddifferently by the various shortcomings of national accounts. For example, measuring thelevel of production requires a direct measure of government output. But while theadoption of direct measures of government output has been used to give a better measureof growth rates, to date there have been few attempts to adjust the measured levels ofnational income. To measure changes in levels through time requires distinguishing priceand quantity effects, which in turn implies the capacity to measure quality changes.
5. There are long recognized problems in GDP as a measure of economic performance, butmany of the changes in the structure of our society have made these deficiencies of
4
REFLECTIONS AND OVERVIEW
greater consequence. At the same time, advances both in our conceptual understandingof the issues and data availability mean that it is now possible to construct betterindicators. Better indicators might be able to address one of the concerns that motivatedthis report: a marked distance between standard measures of important socio economicvariables like economic growth, inflation, unemployment, etc. and widespreadperceptions
6. International comparisons of levels and more importantly of rates of growth play a veryimportant role in the design of policy. Comparisons are indeed possible if the proceduresand definitions used to compute the accounts are comparable. Yet there are still “largedifferences in the ways National Accounts calculations are carried out even amongEuropean countries, let alone between Europe and the U.S1”. This may have far-reaching consequences. It makes no sense, for instance, to structural reforms intended toimport the “best practice” of the country performing the best in terms of growth rate, ifthe growth rates of the two countries differ mainly because of differences in the waysNational Accounts are computed.
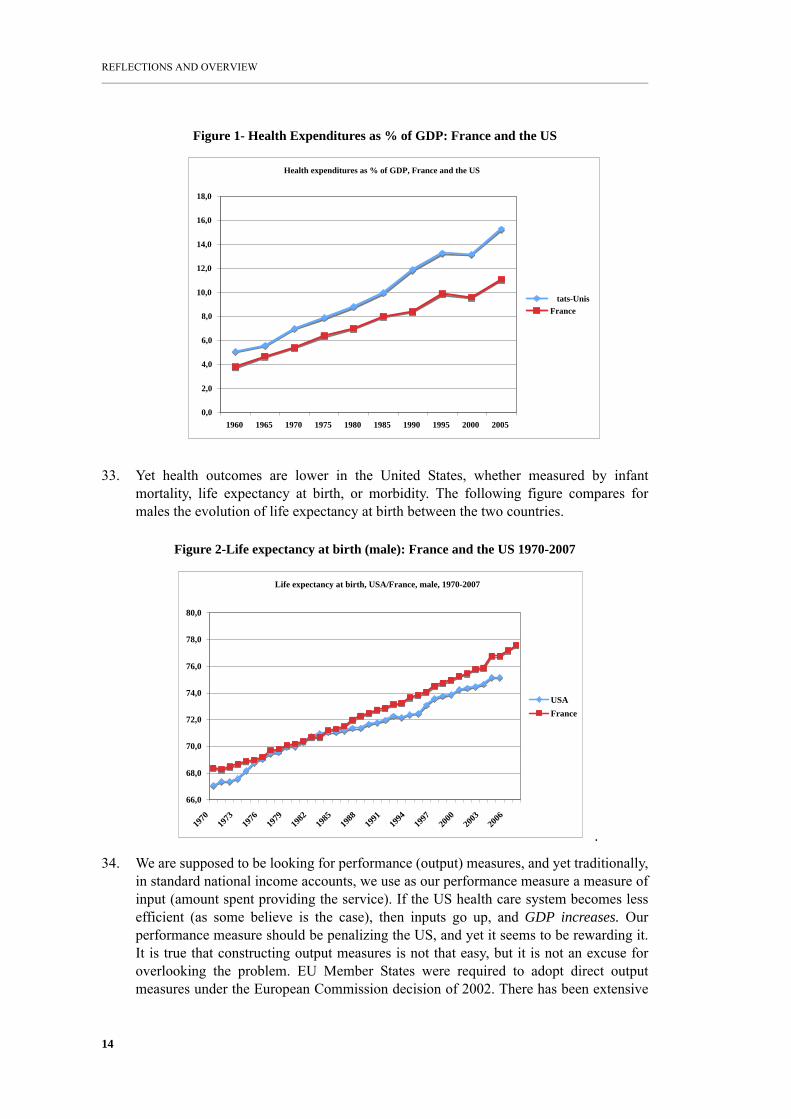
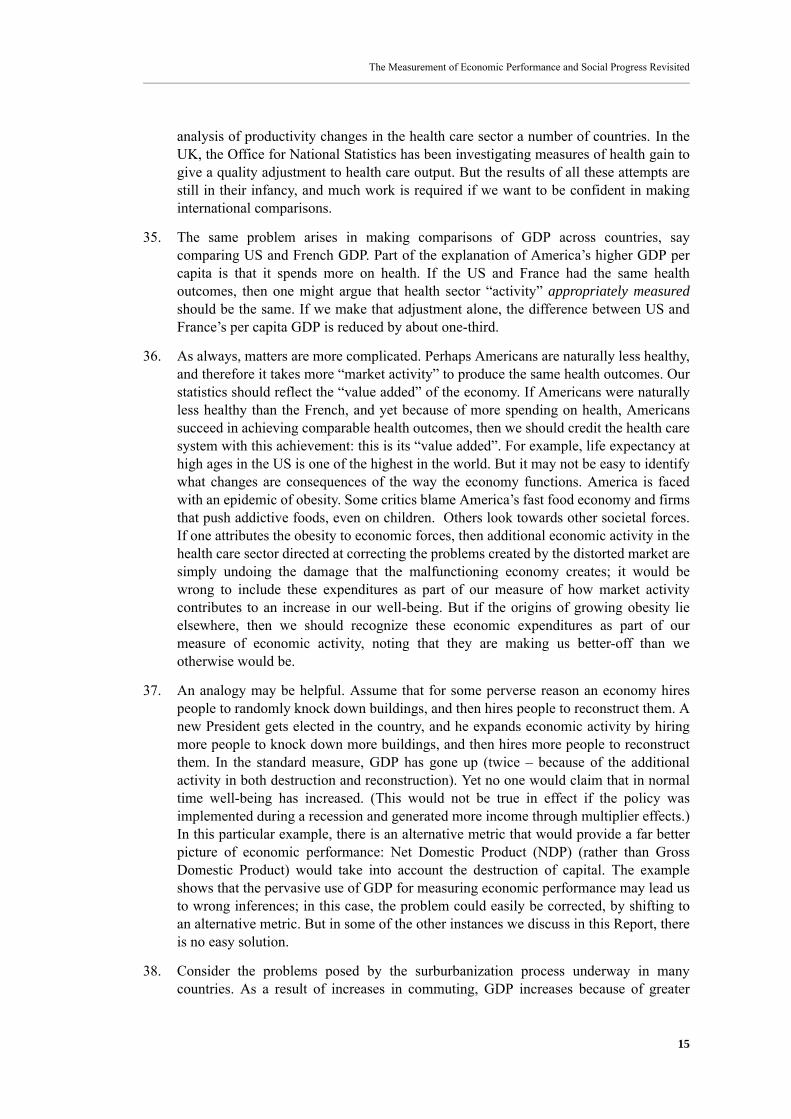
7. Policies have also been affected by widespread statistical analyses of the determinants ofgrowth and economic performance; but inferences made from those statistical studiesmay be flawed if the measures themselves are flawed. Those conducting this researchand relying on these results must be well informed concerning the limitations of ourstatistics on which they are based.
8. But what is of particular concern is when narrow measures of market performance areconfused with broader measures of welfare. What we measure affects what we do; and ifour measurements are flawed, decisions may be distorted. Policies should be aimed atincreasing societal welfare, not GDP. Choices between promoting GDP and protectingthe environment may be false choices, once environmental degradation is appropriatelyincluded in our measurement of economic performance. This report, building onextensive earlier work, describes the additions and subtractions that can and should bemade to provide a better measure of welfare.
9. Advances in research across a number of disciplines enables, however, the developmentof broader, more encompassing measures of well being. Some of these dimensions arereflected in traditional statistics, but are given more prominence: unemployment has aneffect on well-being that goes well beyond the loss of income to which it gives rise. Otherdimensions to which we call attention are health, education, security, and social-connectedness. These dimensions affect the capabilities of people which depend on theextent of their opportunity set and of their freedom to choose among this set, the live theyvalue2. Some economic reforms in recent years may have increased GDP, but theiradverse effects on these other dimensions on Quality of Life are unmistable.
10. We care about the future—that the living standards that we enjoy today should be enjoyedby future generations. Our statistical systems should tell us whether or not what we aredoing is sustainable, economically, environmentally, politically, or socially. There is
1. Joachen Hartwig (2005): “On Misusing National Account Data for Governance Purposes », Working paper 05-101, KOFSwiss Economic Institute, ETH, Zurich.
2. Amartya Sen: “Well Being, Agency and Freedom: the Dewey Lectures, 1984”, The Journal of Philosophy, 82, 169-221,1985.
The Measurement of Economic Performance and Social Progress Revisited
5
reason to believe that, at least in certain dimensions, what we are doing is notsustainable, but current statistics do not reflect this—just as they gave little indication ofthe unsustainability of the U.S. economic growth in the years preceding the crisis.
11. There is no single indicator that can capture something as complex as our society. Butbecause what we choose to measure and how we construct our measures can have suchan important role in the decisions that are made, it is important that there be an open andpublic discussion of our system of metrics. Hopefully, this Report will play a role in thisPublic Dialogue.
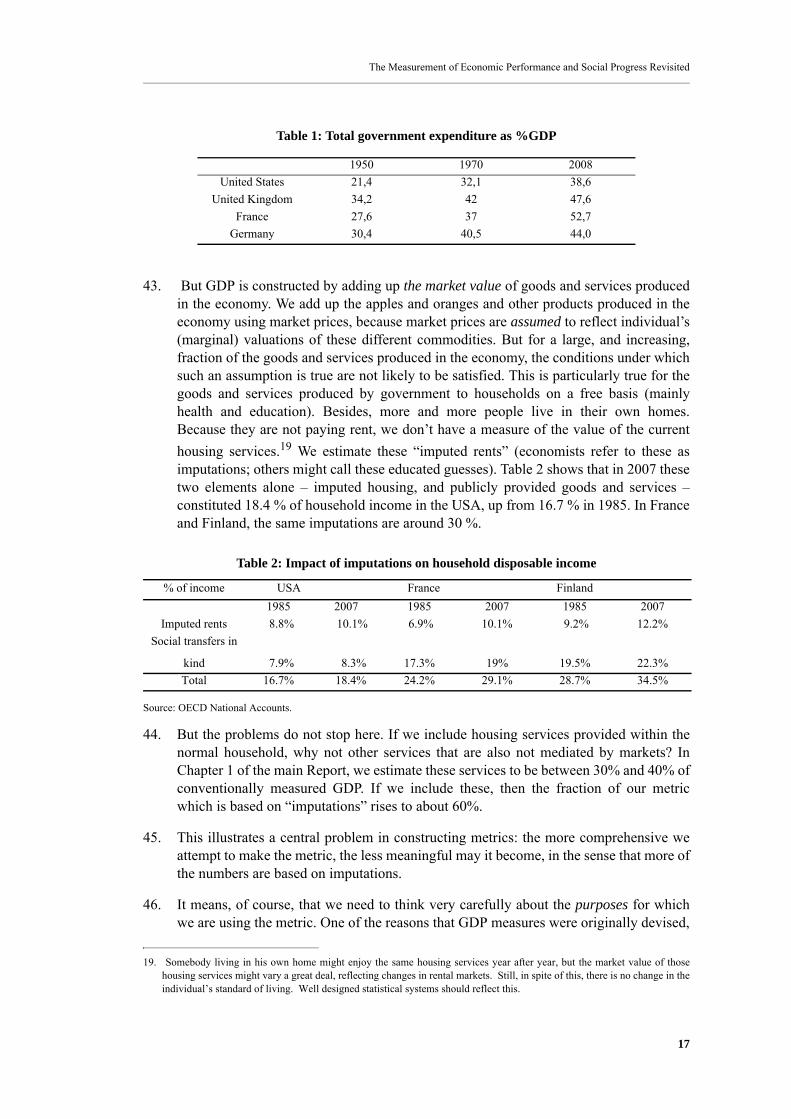
I - Uses and Misuses of GDP
1. Between the time we began working on this Report and the time we completed it, theeconomic context has radically changed. We are now living through one of the worstfinancial, economic and social crises in history. Part of the reason why the crisis tookmany with such surprise is that the “measurement” systems we use to assess andmonitor economic performance failed. They suggested that in the years prior to thecrisis the economy was doing far better than it was. The crisis has raised questions ofhow to value assets – if we value the houses produced back then at current marketprices, output at that time would be much lower. So too for the profits recorded by oneof the seemingly most dynamic sectors of the economy, the financial sector, which werenot just ephemeral, but, in many cases, based on suspect valuations. Not only havequestions been raised about the assessment of the economic performance of these firms,but because GDP, our standard measure of national economic performance, reflects thesum total of the economic performance of all firms in the economy, questions are beingraised about the assessment of national economic performance.
2. No single measure, or even a limited set of measures, can provide all the informationrequired to assess and manage an economy. But many are asking today, why did neitherthe private accounting system nor the public one deliver an adequate early warning? It isperhaps going too far to hope that if we had possessed a better measurement system, onethat would have signaled problems ahead, government might have taken early measuresto avoid or at least to mitigate the present turmoil. But perhaps had there been moreawareness of the limitations of standard metrics, like GDP, there would have been lesseuphoria over economic performance in the years prior to the crisis; metrics thatincorporated assessments of sustainability (e.g. increasing indebtedness) would haveprovided a more cautious view of economic performance. In effect, sustainabilityissues, in a broad sense, apply not only to the environment and to natural resources, butalso to other types of capital.
3. Often, the requisite information is available somewhere within our statistical apparatus,but because it is not given sufficient prominence, it is overlooked. To some extent, thatwas true for this crisis: data about increasing household indebtedness was available3.
3. Although, the level of housing prices was so high, that the inference that this indebtedness was sustainable was common.
6
REFLECTIONS AND OVERVIEW
But the excessive focus on GDP metrics—and a failure to understand the limitations ofthat measure-- meant that these statistics were not given the prominence they deserved.At other times, information is subject to alternative interpretations.
4. Even prior to the crisis, many concerned about the degradation of the environment orthe depletion of natural resources argued that national accounts gave a false impressionof economic performance, as they measured the “goods” being produced, but not the“bads”. They worried that growth statistics did not include an adequate appraisal of itssustainability4. If we take a broader view of sustainability and include other assets, suchas human capital and social cohesion, information is simply missing.
5. This dramatic episode is teaching us a very important lesson: Those attempting to guidethe economy are like pilots steering a course without a reliable compass. The decisionswe make depend on what we measure, how we do our measurements, and how weinterpret them. We are almost “flying blind” when the metrics on which action is basedare ill-designed. Today, there is a broad consensus that we need better metrics and thatwe need to understand the limitations and uses of existing metrics.
6. Statisticians, economists and governments have, of course, long been concerned withthe many shortcomings of our statistical systems. Many of the issues we will discuss inthis overview are longstanding issues, which were already raised by those very scholarswho helped to build the present System of National Accounts. The joke of ProfessorPaul Samuelson (one of the great modern economists, and winner of the 1970 NobelPrize) is known by almost all generations of students since the 1950s: “what happens tothe GDP when a professor marries his servant?” William Nordhaus and James Tobin ofYale University (winner of the 1981 Nobel Price) in a famous paper published in 19735
highlighted many of the problems that still lie before us. Since then, these problemshave been further investigated, and we have drawn extensively on the large andimportant literature that deals with them.
7. Moreover, reflecting many of the same concerns which motivated this Commission,work has been undertaken on the measurement of economic performance and socialprogress by the OECD, EU and UN. The references to the literature and to these worksappear in the technical chapters of this Report, and they have been an important sourcefor the work of the Commission. It is not just that the Commission’s work does not existin a vacuum; it is precisely because there is such interest in these issues that we believethat the timing of the work of the Commission is opportune. We hope our Report willprovide further impetus to meet the difficult tasks ahead.
8. In this overview we will attempt to give a flavour of these problems, while at the sametime emphasizing the difficulty of constructing alternative measures. In writing ourReport, we do not underestimate the sophistication and seriousness of current nationalincome accounting practices, nor the difficulties facing attempts to make improvements.There are nearly always good reasons for the imperfect compromises that are made inconstructing the accounts. But while those compromises may make sense for one
4. A very small number of countries have wealth accounts. The third chapter of this Report tackles the issue of valuing assets(wealth) and changes in wealth, which is at the core of assessing sustainability.
5. Nordhaus, W. and J. Tobin (1973), “Is Growth Obsolete?” in The Measurement of Economic and Social Performance,National Bureau of Economic Research, 1973
The Measurement of Economic Performance and Social Progress Revisited
7
purpose, they may not be the best or most appropriate compromise for others, as thefollowing discussion should help to clarify. And those who use these statistics, whetherthey are scholars attempting to understand better the determinants of economicperformance or politicians attempting to shape policies that will ameliorate existingsocietal problems and lead, more broadly, to social progress, must understand better thelimitations of these indicators.
9. The purpose of this Report is to take stock of what has already been done, to assess theweaknesses (and strengths) of current metrics, and to propose some modifications to theexisting statistical apparatus. In doing so, we attempt to reflect the growing concerns ofcitizens throughout the world about quality of life – its objective as well as its subjectivedeterminants6 – and the sustainability of growth and the environment. We hope too thatthis Report will promote greater understanding of the assumptions that underlie theconstruction of these metrics as well as their consequent limitations, and that it will givea renewed impetus for the many initiatives attempting to improve our metrics and thedata on which they rest.
10. Statistical systems are tools for economic management, but they serve a multiplicity ofobjectives. Our statistical systems were originally created to provide an assessment ofthe performance of the market economy, and, particularly, to monitor cyclicalfluctuations. This is still a critical function. But the metrics developed for this purposeare often used (or misused) as a measure of societal well-being. This would be justifiedonly under a set of very specific – and most often unrealistic – assumptions. One of thepurposes of this Report is to bring to the fore the problems in doing this, and to suggestalternative measures that might more adequately reflect broader notions of societalwell-being and social progress. National income accountants have already, in fact,constructed a variety of measures, and we hope our Report will provide some guidanceto the appropriate use of each, along with greater awareness of their respectivelimitations.
11. In our review of existing metrics, we will discuss (a) some of the areas in which ourmetrics are incomplete, leaving outside measurement some important phenomena likethe environment, home production etc.; (b) the defects of some existing measures.While sometimes the information required to construct a better metric is not available,in other instances it is.
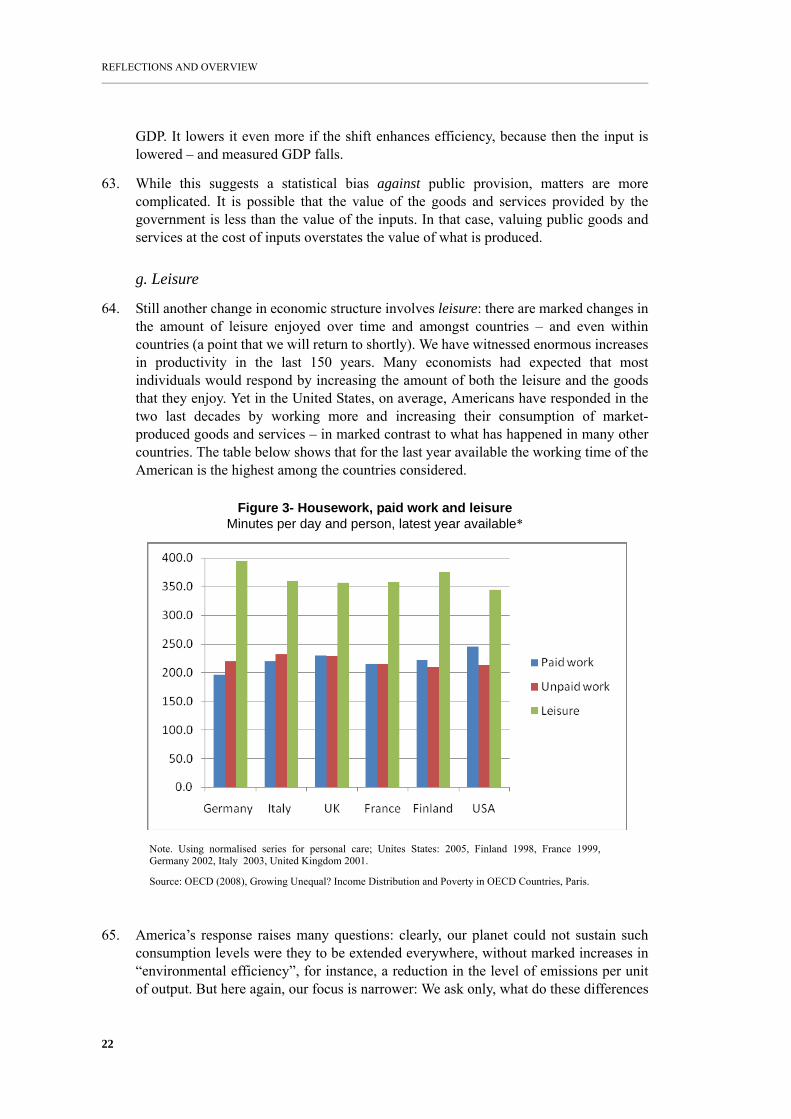
12. Thus, our Report is simultaneously a plea for revisions of our national account system, acall for the end of the dominant use of GDP in assessing everything – performance,well-being, quality of life, etc. – and an appeal for the gathering of more informationthat would enable us to assess and monitor economic performance and social progressbetter, so as to reflect those things that citizens care about.
6. The development of the capability approach by Amartya Sen emphasizes the objective determinants of the quality of life,without reducing the measure of the quality of life to those determinants. Cf. Sen A. (1999), Development as Freedom,Oxford University Press, Delhi.
8
REFLECTIONS AND OVERVIEW
I-1 Measuring Economic Performance
13. It has become a commonplace to say that it is important to monitor and assessperformance, whether of firms or countries or individuals. This is especially the case asour societies have become more performance-oriented. We expect results, whether fromour managers, our workers, or our politicians. Individual rewards are typically based onperformance, and incentive systems have to be based on metrics. What we measureaffects, of course, what we do. And what individually or collectively we are aiming ataffects what we measure. There is an intricate relationship between objectives,measures and actions. If teachers are rewarded for their students’ performance onreading test scores, they will teach reading, perhaps at the expense of broader cognitiveskills.
14. So too for countries. Politicians are asked to guide the collective actions of society,whether through regulations, taxes, or expenditures. But towards what ends? They aretold to increase GDP. But they are also told to pay attention to many aspects of thequality of life – from social justice and urban amenities to noise, air, and waterpollution. The two sometimes seem contradictory – paying attention to social objectivessometimes seems to run counter to pursuing economic objectives. But that should notnecessarily be the case. Economic activities are not so much an end in themselves, but ameans to an end – to higher living standards. If our indicators suggest that pursuingactions directed at improving living standards, broadly defined, have an adverse effecton the economy, perhaps the problem is with our economic measurements.
15. The apparent contradiction between the different objectives alluded to in the precedingparagraph is as old as the post-World War II system of National Accounts itself. Ineffect, while national income measurement had its origin in macroeconomic accounting,stemming from the work of Keynes and Kuznets, there was another, often moretheoretical literature, which focused on the measurement of welfare, and whosetheoretical underpinning may be found in the work of Pigou, Hicks and Samuelson.7There is tension between these two strands, which may lead to conflicting views aboutthe treatment of some aspects of the economy, for example, the government sector.8 Butthis tension has perhaps increased through time as the economy became more complex,and measurement of non-market phenomena – in particular, the increased provision bythe state of public goods and services – became more important for a fair account ofeconomic activity. But if the public debate and a number of remarks in this overview areleaning towards welfare measurement as a primary purpose, that does not mean that wepropose to dispense with macroeconomic accounting. On the contrary, we think that therole of accounts in macroeconomic management is, has been, and will remain essential.Indeed, we have entitled the first part of this Report, in which we discuss how we mightimprove the measurement of the economy’s output “Classical GDP issues”.
16. There are other reasons for dissatisfaction with our system of economic measurements.They often seem out of touch with our perceptions. Government statisticians may
7. Arthur C. Pigou (1920), The Economics of Welfare, MacMillan; John R. Hicks (1940), “The valuation of social income”,Economica, vol.7, pp. 105-24; Paul A. Samuelson (1947), Foundations of Economic Analysis, Harvard University Press.
8. There is a deeper conflict – most of the literature in the Pigou tradition assumes markets that function well, while the macro-economic literature is concerned about valuation in situations where there is a deep “market failure”, which can lead topersistent unemployment and excess capacity. These market failures play a central role in the discussion below.
The Measurement of Economic Performance and Social Progress Revisited
9
correctly announce that the rate of inflation has been “only” 3%, but an importantfraction of citizens may feel that their own costs of living are going up far faster. Theymay be told that the country is experiencing a rapid increase in economic performance,and yet there may be a widespread perception that living standards are going down.
17. Such disparities between what government agencies say and what individuals feel orknow about their own status contributes to public distrust of government, and of societalinstitutions more generally. If the measurement system which is supposed to give abroad account of the situation is incongruent with people’s own perceptions, they mayhave the feeling that the statistics that used to describe what is happening in our societyare being manipulated, in an attempt to manipulate the democratic processes, and as aconsequence they may lose confidence in democracy itself. (We should emphasize that,in most cases, the government is not in fact engaged in such manipulation; it is simplythat, especially in circumstances where there is less than full confidence in government,views that this is the case may become widespread.9) That could have far-reachingconsequences. It is why governments in many countries and especially in Europe havetaken the problem seriously, and rightly so. In the last few years, a number of officialreports have addressed the measurement of inflation and living standards to respond tothe heated debate about their measurement and about alleged underestimations bystatistical offices.10 Other countries have attempted to construct broader measures ofsocial progress that are more reflective of societal values, paying more attention to theenvironment, for instance.11
18. It is thus important to know the reason for these disparities, and to address them. Theremay be a simple explanation – the benefits of an increase in GDP may be going to arelatively few individuals, with most individuals in society actually being worse-off. Ifthat is the case (and it is, in many countries12), then it suggests that greater attention bepaid to metrics of societal performance other than average per-capita income, to metricsthat are more congruent with widespread perceptions of well-being. It is theoreticallyeasy to construct such measures. Median disposable income describes the income of the“representative individual” – representative in the sense that half the individuals have ahigher income, half a lower income. It is thus a good candidate. But as Chapter 1 of themain Report shows, such a construction is complex as it has to rely on data other thanthose used in the national accounts, and it may be difficult to make this data consistentwith the underlying national accounts. Nonetheless, it is essential to create such
9. Of course, there may have been attempts to manipulate accounts. There are allegations that in Argentina under governmentpressure, the official statistical agency published inflation rates that were much lower than they actually were. Today, thegovernment has to address a very serious credibility problem in the release of economic performance indicators. In othercases, decisions to reform national accounts are in part motivated by the consequences of flawed measurements;overestimating inflation may lead to larger increases in payments that are indexed to inflation. When governments seek toreduce budgetary outlays because of large budgetary deficits, it is understandable that those adversely affected by thestatistical reforms become suspect, whether or not those suspicions are justified.
10. Controversies over the measurement of inflation have been particularly intense in the United States (see, e.g. the so calledBoskin Report: Boskin, Michael J., E. Dulberger, R. Gordon, Z. Griliches, and D. Jorgenson (1996), “Toward a MoreAccurate Measure of the Cost of Living”, Final Report to the US Senate Finance Committee, December 4.) and inArgentina.
11. Particularly noteworthy is the work of Bhutan’s government, which has been active in its search for better measurementsof societal well-being, as it has attempted to develop a measure of GNH, gross national happines
12. A recent study by the IMF made this point very clearly: “Based on observed movements in Gini coefficients (the mostwidely used summary measure of inequality) inequality has risen in all but the low income country aggregate over the pasttwo decades, although there are significant regional and country differences”. World Economic Outlook, October 2007.
10
REFLECTIONS AND OVERVIEW
measures, if we are to obtain a picture of what is happening to most individuals in oursociety. (More generally, there are many reasons why it is desirable to try to constructincome distribution data. This has been done recently by a few statistical offices, inparticular France’s INSEE.)
19. On the other hand, the explanation for disparities in perception may be more complex.There may be technical problems with how we measure health and education, twosectors of increasing importance (together, in the US, they comprise close to a third ofGDP); or it may be that our measures leave out something important, like our sense ofsecurity, or include some expenditures that individuals do not think of as important totheir sense of well-being.13
20. The risk is that, as countries strive to increase measured GDP, they take actions whichnow, or in the future, may actually lower societal well-being. This is especially the caseif our metrics do not take account of sustainability, if current consumption puts injeopardy, for instance, future living standards. The most obvious cases involvedepletion of resources and the degradation of the environment. Countries that enjoyhigh living standards today by depleting their inheritance of natural resources – withoutinvesting the proceeds – are “robbing” future generations. It is possible that doing thisdoes not even increase their welfare, as people usually care about the well-being of theirchildren, but they may unintentionally act this way, at least partially because they arenot informed, absent the right metric.
21. The world as a whole has put the planet at risk, as emissions of greenhouse gases lead toglobal warming, with potential catastrophic effects, at least for some countries. Weknow that the way we, as an international community, have conducted ourselves is notsustainable. We know that it is impossible for the world, as we know it, to survive ifcurrent patterns of living and production continue, and even more so if they areextended to the billions in the developing world. Yet, some, even in the richest countryof the world, claim that were they to change, we would pay an economic price. Clearly,our metrics are faulty: our measures should tell us that what we are doing today is notsustainable, that current consumption is at least partly at the expense of futuregenerations; in that sense we may be living beyond our means. Better metrics wouldindicate higher sustainable incomes from altering patterns of consumption andproduction in ways that reduce emissions.
22. This is not the only example of non-sustainability. Argentina’s overall growth in theearly 1990s was based, in part, on the growth of consumption, and the growth ofconsumption was based, in turn, on borrowing from abroad. On the basis of standardmetrics, it appeared as if the economy was performing well. Yet better metrics wouldhave reflected the increased indebtedness; it would have suggested that the country’sgrowth might not have been sustainable. So too the US, and indeed many of theadvanced industrial countries, experienced unsustainable growth in the middle of thisdecade. Again, growth was based on borrowing. In the US, the borrowing supported anunsustainable housing bubble that led the country to believe that it was wealthier than it
13. There may be “psychological” problems: in forming their beliefs about inflation, individuals may pay more attention toincreases in the products of certain commodities that seem particularly salient than their weight in their market basket mightindicate. Later, we will emphasize that individual’s sense of well-being may be affected by being unemployed in a way thatis greater than can be accounted for by the loss in income.
The Measurement of Economic Performance and Social Progress Revisited
11
was and that it could accordingly live beyond its means. It borrowed hundreds ofbillions of dollars from abroad, not for productive investment, but for a consumptionbinge. The standard metrics, however, provided no warning sign, no reliable measure ofsustainable consumption. Not surprisingly, nothing was done to curb the excesses. Onemay object that these episodes were the consequence, not of the metric by itself, but ofthe fact that in both cases the relevant metric was ignored. After all, data onindebtedness are not lacking! The analysis was faulty, not the metric. But in fact in bothcases the data were also telling us that the wealth of the country was increasing and thusthat growth was sustainable. This emphasizes the need for better measures, orindicators, of sustainability.
23. One of the consequences of using incomplete metrics may be wrong inferences aboutwhat are good policies and practices. While greater reliance on quantitative methods ineconomics and other social sciences has led to increasing use of metrics in analyticstudies (e.g. to assess the determinants of good economic performance), not all thosewho employ these data are fully aware of the assumptions that go into theirconstruction, the complex trade-offs that inform these decisions, and their consequentlimitations, or of the implications that these limitations might have for the inferencesthat are drawn. Users of these studies are in turn often even less aware of theimplications of these limitations for making inferences about alternative policy regimes.
24. For instance, throughout the world, many economists are engaged in studying whatmakes for successful growth. There are large numbers of empirical studies relatingeconomic outcomes to various policies. If the wrong metrics14 are employed, incorrectinferences will be made. Many concluded, for instance, that financial deregulation wasgood, because it led to rapid expansion of the financial industry and an increase inmeasured GDP. We now know that that growth was not sustainable; that much of theprofits earned in 2004-2007 might more appropriately be looked at as winnings ingambling by some, which were more than offset by the losses in 2008, and thefollowing years, by others. When looked at from a five-year perspective, the sectorearned zero or negative profits. Better metrics will not ensure that we always devise theright policies or even that we make the right inferences, but they do make it less likelythat we will make the wrong inferences.
25. The fact that the financial sector was growing so fast should have been a warning sign.Financial services are, for an important part, a means to an end, not an end inthemselves. They are supposed to improve the economy’s ability to manage risk andallocate capital, and in doing so, they increase its overall efficiency, capturing forthemselves a fraction of the gains. To a large extent, the benefits of the financial sectorshould be reflected in the increased output of the economy, especially in the long run, asbetter management of risk enables the economy to undertake higher risk while obtaininga higher return on activities, and as the improved allocation of capital leads to increasedgrowth. The fact that a sector which largely provides intermediate goods was growing
14. Here as elsewhere in this overview we will encounter the same problem: it is not easy to disentangle what is due to theimperfections in existing metrics and what is due to faulty analytical interpretations and/or misuses of existing metrics. Thisproblem is not surprising as we need a conceptual framework to build a measurement system. We hope that our Report willcontribute both to the construction of better metrics, which will lead to more reliance inferences, to greater attention to theuse of the appropriate metrics (within the set of existing and/or improved metrics), and to greater awareness of thelimitations of the metrics, and therefore of the inferences that can be drawn from studies based on their use.
12
REFLECTIONS AND OVERVIEW
so rapidly should be a cause of concern, unless our metrics show a more thancompensating improvement in the measures of economic performance that focus onfinal output – on the goods and services that individuals actually enjoy.15 If intermediategoods and services are taking up more and more of a society’s resources, it could be asign of increasing inefficiency (except if the country is selling those services to othercountries).
26. In several countries, the issue of the measurement of economic performance and socialprogress has become especially important, precisely because of the worry that standardmeasures may encourage our societies to move in wrong directions. And as the presentcrisis is telling us, moving in wrong directions can lead to social distress and adeterioration in social welfare.
27. Developing countries may be encouraged to allow a foreign mining company to developa mine, even though the country receives low royalties, even though the environmentmay be degraded, and even though miners may be exposed to health hazards, becauseby doing so GDP will be increased. But this Report emphasizes that GDP is not the onlymeasure on which the country should be focusing. It should focus also on thesustainable well-being of the citizens of the country, and even though GDP may beincreased, better and/or alternative measures may show the mine as decreasing societalwell-being.
28. Today, as we have noted, many countries face difficult choices as they begin to addressa range of environmental concerns. This will require changing not only modes ofproduction, but also patterns of living. There are high environmental costs associatedwith suburban sprawl. There will have to be heavy investments in better-insulatedhousing and more fuel-efficient cars. Some will complain that the economic costs aretoo high and that as a consequence measured GDP may go down – but at least some ofthose complaints are based on a measurement failure: our metrics do not accuratelyreflect economic well-being, nor the fact that such expenditures may actually increasewell-being in the long run.
29. This Report attempts to provide a more systematic account of the deficiencies in ouraccounting systems and to suggest a research program that might address them. Most ofthe examples given below have long been recognized by specialists in national incomeaccounting, but we thought it nonetheless useful to review them, partly because theymay not be well understood by many of those who make use of these metrics and/or ofstudies based on them. Some of the anomalies in our current system are small and/ortechnical, but others go to the heart of what we mean by “societal well-being”.
15. Some of the output of the financial services sector may be a final good in conventional accounting, e.g. that part that is solddirectly to individuals (rather than to firms.) Even then, of course, in measuring improvements in economic performance weshould be measuring, for instance, the savings in overall transactions costs (time and money). Several governments haveargued that revenues generated through certain fees may also reflect monopoly power; as we explain below, there aredifficulties in ascertaining how best to include such fees in our system of national accounts. Further problems may resultwhen there are persistent problems of consumer ignorance or producer misrepresentation. Assume that individuals are notfully apprised of the fees that they pay on their credit cards. If they fully understood them, they would not have borrowed asmuch on their credit card. The “exploitive” fees do not then really represent their valuation of the services provided by thecredit card company. Under current account, these fees are an addition to GDP. They might more accurately thought of assimply a transfer payment from the household to the finance company. An increase in these exploitive fees does notrepresent an improvement in economic performance; it is the contrary.
The Measurement of Economic Performance and Social Progress Revisited
13
I-2 On some complexities in the measurement of economic performances
30. There is a long list of ways in which standard measures fail to capture important aspectsof societal well-being. A standard joke captures some of what is wrong with ourmeasures. Contrast the impact on GDP of two individuals. One is a happily marriedwoman (man) who goes home after work to her husband (his wife). Both may go homeafter a working day. They get pleasure from cooking their gourmet meal together, usingingredients which they have grown in their garden, and which they follow by a quietevening reading together. The net contribution to GDP is the value of the fewingredients in their meal that they had to purchase and the cost of the books. Bycontrast, the lonely bachelor eats an unhealthy meal at a fast food restaurant, then goesto a bar where he drinks excessively as solace for his loneliness, visits a prostitute, andthen wrecks his car while driving back home, taking a taxi the remaining distance. Thisunhappy individual has, by contrast, contributed greatly to GDP – the cost ofpreparation and serving of the meal and drinks, the sexual services, the repair costs ofthe automobile, and the taxi home all enter into GDP accounting16.
31. An increase in violence in society decreases our sense of security. If we respond bybuilding more prisons, by hiring more bodyguards, by installing more surveillancesystems, GDP may go up. But no one would say society is better-off. Those who arespending more to protect themselves against increased violence are suffering a loss ofwelfare both because their purchasing power on other goods decreases and because theyfeel insecure. This is an issue of considerable importance, as expenditures on prisons(and security costs in general) have been rising rapidly.17 Who would pretend thatgrowth in the manufacturing and trade of private guns, mainly for self-defense reasons,is contributing positively to GDP?18
32. The US spends more on health care (as a percentage of its income and per capita) thanany other country. In 2008, health care expenditures represented more than 15% of USGDP, compared to 11% in France. While the percentage of national income spent onhealth has been increasing around the world, the gap between the US and France (andmost other countries) has been increasing, as shown in the following figure.
16. Of course this joke is willingly caricatural as its purpose is pedagogical. Sexual services are usually part of the undergroundeconomy, as they are illegal. Homework falls disproportionately on women; and some of the more productive homeactivities, like childcare, are not considered in the joke.
17. Between 1986 and 2001, State prison expenditures in constant dollars increased at an annual rate of 6.4% compared to 4.2%for education. It is the highest rate of growth of all state expenditures. Cf. “Bureau of Justice Statistics, Special Report onState Prison Expenditures, 2001”, June 2004, NCI 202949. http://www.ojp.usdoj.gov/bjs/pub/pdf/spe01.pdf.
18. This example illustrates a problem that we will discuss more extensively later: some might claim that the increased purchaseof guns has increased security from what it would have been otherwise, and in that sense, they are contributing to societalwell-being. From this perspective, it would be wrong to exclude them from our measurement of national output. But if thereason for the increase in the purchase of guns is that there has been a general increase in violence, then the change insocietal well-being would have to take that into account. The increase in arms purchases will only partially offset the effectof the increased insecurity. In that case, it might seem better not to include these purchases, at least for purposes of makingcomparisons over time. Indeed, even excluding these purchases results in an overestimate of the improvement of societalwell-being, because it does not include any measure of the residual increase in insecurity.
14
REFLECTIONS AND OVERVIEW
Figure 1- Health Expenditures as % of GDP: France and the US
33. Yet health outcomes are lower in the United States, whether measured by infantmortality, life expectancy at birth, or morbidity. The following figure compares formales the evolution of life expectancy at birth between the two countries.
Figure 2-Life expectancy at birth (male): France and the US 1970-2007
.
34. We are supposed to be looking for performance (output) measures, and yet traditionally,in standard national income accounts, we use as our performance measure a measure ofinput (amount spent providing the service). If the US health care system becomes lessefficient (as some believe is the case), then inputs go up, and GDP increases. Ourperformance measure should be penalizing the US, and yet it seems to be rewarding it.It is true that constructing output measures is not that easy, but it is not an excuse foroverlooking the problem. EU Member States were required to adopt direct outputmeasures under the European Commission decision of 2002. There has been extensive
Health expenditures as % of GDP, France and the US
0,0
2,0
4,0
6,0
8,0
10,0
12,0
14,0
16,0
18,0
1960 1965 1970 1975 1980 1985 1990 1995 2000 2005
�tats-UnisFrance
Life expectancy at birth, USA/France, male, 1970-2007
66,0
68,0
70,0
72,0
74,0
76,0
78,0
80,0
1970
1973
1976
1979
1982
1985
1988
1991
1994
1997
2000
2003
2006
USAFrance
The Measurement of Economic Performance and Social Progress Revisited
15
analysis of productivity changes in the health care sector a number of countries. In theUK, the Office for National Statistics has been investigating measures of health gain togive a quality adjustment to health care output. But the results of all these attempts arestill in their infancy, and much work is required if we want to be confident in makinginternational comparisons.
35. The same problem arises in making comparisons of GDP across countries, saycomparing US and French GDP. Part of the explanation of America’s higher GDP percapita is that it spends more on health. If the US and France had the same healthoutcomes, then one might argue that health sector “activity” appropriately measuredshould be the same. If we make that adjustment alone, the difference between US andFrance’s per capita GDP is reduced by about one-third.
36. As always, matters are more complicated. Perhaps Americans are naturally less healthy,and therefore it takes more “market activity” to produce the same health outcomes. Ourstatistics should reflect the “value added” of the economy. If Americans were naturallyless healthy than the French, and yet because of more spending on health, Americanssucceed in achieving comparable health outcomes, then we should credit the health caresystem with this achievement: this is its “value added”. For example, life expectancy athigh ages in the US is one of the highest in the world. But it may not be easy to identifywhat changes are consequences of the way the economy functions. America is facedwith an epidemic of obesity. Some critics blame America’s fast food economy and firmsthat push addictive foods, even on children. Others look towards other societal forces.If one attributes the obesity to economic forces, then additional economic activity in thehealth care sector directed at correcting the problems created by the distorted market aresimply undoing the damage that the malfunctioning economy creates; it would bewrong to include these expenditures as part of our measure of how market activitycontributes to an increase in our well-being. But if the origins of growing obesity lieelsewhere, then we should recognize these economic expenditures as part of ourmeasure of economic activity, noting that they are making us better-off than weotherwise would be.
37. An analogy may be helpful. Assume that for some perverse reason an economy hirespeople to randomly knock down buildings, and then hires people to reconstruct them. Anew President gets elected in the country, and he expands economic activity by hiringmore people to knock down more buildings, and then hires more people to reconstructthem. In the standard measure, GDP has gone up (twice – because of the additionalactivity in both destruction and reconstruction). Yet no one would claim that in normaltime well-being has increased. (This would not be true in effect if the policy wasimplemented during a recession and generated more income through multiplier effects.)In this particular example, there is an alternative metric that would provide a far betterpicture of economic performance: Net Domestic Product (NDP) (rather than GrossDomestic Product) would take into account the destruction of capital. The exampleshows that the pervasive use of GDP for measuring economic performance may lead usto wrong inferences; in this case, the problem could easily be corrected, by shifting toan alternative metric. But in some of the other instances we discuss in this Report, thereis no easy solution.
38. Consider the problems posed by the surburbanization process underway in manycountries. As a result of increases in commuting, GDP increases because of greater
16
REFLECTIONS AND OVERVIEW
spending on transportation. If the country fails to provide adequate publictransportation, there will be greater use of private means of transport, and an increase intraffic jams and thus higher oil consumption, all contributing to increased GDP. But thewell-being of society is clearly lower. People literally lose time (commuting time is notleisure, nor, like work, does it yield a direct return) and pollution increases.
39. If the road infrastructure is in bad shape, GDP may increase still more, as a result of afurther increase in the number of car accidents, with the resulting increase in theturnover of the automobile repair sector and in medical expenditures. What should betreated as a bad – a deficiency in the provision of a public good – will be accounted as agood – an increase in GDP. Again, better accounting systems that take account of thedestruction of physical and human capital would avoid these faulty inferences, but it ishard to make the necessary adjustments, and in practice none of the metrics in use do sofully.
40. The worry is that some of the increases in economic activity that have been observed inmany countries are analogous, though in much less transparent ways.
II. Accounting for the changing structure of our economy
41. There have been large changes in the structure of our societies, which mean that even ifthe measures which were used 50 years ago did a good job of reflecting economicperformance then¸ they may not do as good a job now. These changes in the structure ofsociety – and differences across countries – mean that we need to be careful in makingcomparisons over long periods of time. By the same token, differences in the structuresof different economies make comparisons across countries difficult. In addition, therehave been changes in societal values. Even if environmental degradation and resourcedepletion were as important a half century ago as they were today, there was lessrecognition of these problems, and therefore less recognition of their import for themeasurement of economic performance or societal well-being. While most of theproblems to which we call attention in the following paragraphs have long beenrecognized, these changes in our economy and our society have given them heightenedimportance.
II-1 The growing role of imputations
42. The step rise in public expenditures after the Second World War and the concomitantexpansion of government have in many countries represented a structural change.
The Measurement of Economic Performance and Social Progress Revisited
17
Table 1: Total government expenditure as %GDP
43. But GDP is constructed by adding up the market value of goods and services producedin the economy. We add up the apples and oranges and other products produced in theeconomy using market prices, because market prices are assumed to reflect individual’s(marginal) valuations of these different commodities. But for a large, and increasing,fraction of the goods and services produced in the economy, the conditions under whichsuch an assumption is true are not likely to be satisfied. This is particularly true for thegoods and services produced by government to households on a free basis (mainlyhealth and education). Besides, more and more people live in their own homes.Because they are not paying rent, we don’t have a measure of the value of the currenthousing services.19 We estimate these “imputed rents” (economists refer to these asimputations; others might call these educated guesses). Table 2 shows that in 2007 thesetwo elements alone – imputed housing, and publicly provided goods and services –constituted 18.4 % of household income in the USA, up from 16.7 % in 1985. In Franceand Finland, the same imputations are around 30 %.
Table 2: Impact of imputations on household disposable income
Source: OECD National Accounts.
44. But the problems do not stop here. If we include housing services provided within thenormal household, why not other services that are also not mediated by markets? InChapter 1 of the main Report, we estimate these services to be between 30% and 40% ofconventionally measured GDP. If we include these, then the fraction of our metricwhich is based on “imputations” rises to about 60%.
45. This illustrates a central problem in constructing metrics: the more comprehensive weattempt to make the metric, the less meaningful may it become, in the sense that more ofthe numbers are based on imputations.
46. It means, of course, that we need to think very carefully about the purposes for whichwe are using the metric. One of the reasons that GDP measures were originally devised,
1950 1970 2008United States 21,4 32,1 38,6
United Kingdom 34,2 42 47,6France 27,6 37 52,7
Germany 30,4 40,5 44,0
19. Somebody living in his own home might enjoy the same housing services year after year, but the market value of thosehousing services might vary a great deal, reflecting changes in rental markets. Still, in spite of this, there is no change in theindividual’s standard of living. Well designed statistical systems should reflect this.
% of income USA France Finland1985 2007 1985 2007 1985 2007
Imputed rents 8.8% 10.1% 6.9% 10.1% 9.2% 12.2%Social transfers in
kind 7.9% 8.3% 17.3% 19% 19.5% 22.3%Total 16.7% 18.4% 24.2% 29.1% 28.7% 34.5%
18
REFLECTIONS AND OVERVIEW
as we noted above (par. 10), was to measure the level of market economic activity, thegoods and services produced in the market. This is a rather narrow objective, and evenhere, there are problems, as we have noted.
47. There are three sets of often interrelated problems: (a) conceptual problems of whatshould be included; (b) measurement problems of what is included; and (c) valuationproblems of what is included. Sometimes we can measure inputs, but not outputs.Sometimes we can observe outputs, but are not sure how to value them. The biases areoften complex: sometimes they lead to an underestimate, sometimes to an overestimate.
Intermediate goods
48. In the following paragraphs, we describe some of the controversies over what should beincluded in our metrics.
49. We explained earlier that we should not include intermediate goods and services (likefinancial services), but only final goods and services, to avoid double counting.Intermediate goods are in effect already included in the value of final goods andservices. But it is not always possible to ascertain what is final and what is intermediate.Transportation services sometimes are part of consumption, but commuting to work isbest thought as part of work, a necessary cost to earning income. Typically, we cannoteven measure “transportation services”. Rather, we estimate the input of oil and carsused in transport. A more fuel-efficient car will enable the same transportation servicesto be provided with less input of oil. Unless we correctly account for the improvementin the quality of the car, it might appear as if economic activity is lowered as a result ofless input of oil.
Defensive expenditures
50. Individuals are risk averse, and thus value security. Insurance companies provideinsurance that reduces insecurity, but many other aspects of economic activity aredirected at managing risk. Firms facing the threat of an interruption of supplies maykeep greater inventories. Firms facing higher price volatility may lay off some of thatrisk through trading in futures markets. But changes in economic policy may affect thelevel of risk, and therefore the need for engaging in these risk-reducing activities. Forinstance, some argue that financial and capital market liberalization has resulted ingreater risk and volatility. If so, it would be misleading to say that the economic activityinduced to layoff the risk was an increase in economic well-being. This is an example ofa category of expenditures called defensive expenditures, which may in fact constitutean important part of standard measurement of GDP. Here, as elsewhere, the problem isthat we don’t have a good way of measuring the output in which we are reallyinterested, individuals’ sense of security. Again, in our metrics of performance (output)we include expenditures directed at reducing insecurity, but we recognize that the waythe economy is designed may, in fact, indirectly give rise to the needs that theseexpenditures are intended to address. (The similarity between this problem and that ofobesity, discussed earlier, should be clear.)
51. The problem in making comparisons over time is that the structure of the economy maychange in ways that increase (or decrease) the importance of these measurement
The Measurement of Economic Performance and Social Progress Revisited
19
problems. Social disintegration may lead to an increased importance of defensiveexpenditures. Vertical disintegration of production may make the problems posed byintermediate goods more complex to resolve in order to avoid double counting.
II-2 How structural changes may bias our measure of performance
52. A few principles guide our thinking. We wish to avoid obvious distortions and biases.Changes in the economic structure – including in the way certain economic activitiesare conducted – may result in systematic overestimates or underestimates.
a. Biases against home production
53. For instance, our measure of performance should not increase simply because someactivity switches from home production to market production or from public productionto private production. Recent decades have seen marked shifts from home to marketproduction20; and typically, in developed countries, market production is moreimportant than in developing countries. For instance, people go out to restaurants moreoften, eating at home less frequently. Even at home, they are more likely to use preparedmeals, and when they do not buy a prepared meal, they are less likely to use vegetablesgrown in their own garden. Few in Europe or America make their own clothes. Intraditional extended families, the grandmother babysits; increasingly in the modernfamily, such services are bought in the market. Fortunately, most national statisticaloffices now conduct time-use surveys, and we now have relatively good information oninputs of hours into non-market work.21
54. This means a measure focusing on market production is likely to overstate increases inwell-being: some of the measured increase is simply a shift in the locus of production.Indeed, many might argue that no McDonald’s meal could come close to being a realsubstitute for Grandma’s cooking.
55. Fortunately, such changes occur gradually over time and for that reason will not causeabrupt changes in measured GDP. If, on the contrary, we see that market output hasfallen by 5% between this year and last, it means something significant has happened tothe performance of the economy. To be sure, there will be more “leisure” and, ofnecessity, with budgets cut, more home production of meals. Yet, it says somethingsignificant to state that market production has fallen dramatically. There are goodreasons that measures of market activity play such an important role in ourmeasurement of economic performance. In particular, in a recession individualrecourse to “non-market” production is not voluntary – it is the result of individuals notbeing able to find work – so there is typically a large loss of well-being. There is a
20. It might be worth noting that this shift – in the US at least – results from the reallocation of women’s time to market work.Men have actually gone the opposite way, devoting more time to home production and reducing their participation in paidemployment (although not nearly enough to counterbalance changes in women’s time allocation).
21. But while we have measures of time allocation, three problems remain: (a) Some of the time devoted to cooking may bemore a form of leisure. (This problem arises, too, in a somewhat different form, in market production; individuals mayenjoy market work just as they enjoy non-market work. In principle, to the extent that that is the case systematically in somejob, the wage for that job would adjust to reflect these non-pecuniary benefits.) (b) There are difficulties of valuing the timeallocated to home production. (See the discussion below). (c) There are difficulties in assessing productivityimprovements. We are interested in measures of output; we are attempting to infer output from inputs.
20
REFLECTIONS AND OVERVIEW
failure of the economy to work in the way that it should. It is important to havediagnostics that tell us of the magnitude of this “disease”, and much of traditionalnational income accounting is directed at this objective.
56. While it is desirable to go beyond market production, assessing the value of homeproduction poses real difficulties. As difficult as matters are in the public sector (to bediscussed shortly), matters are even worse in assessing non-market economic activities.We have difficulty measuring and valuing inputs, not just in measuring and valuingoutputs. We know that there have been marked changes in home production – automaticwashing machines, dishwashers, dryers, and vacuum cleaners are technologicalrevolutions no less important than mechanization within the market. Some of the valueof these inputs is “captured” in the value of market sales, particularly when appropriateadjustments are made for the improvement of these household durables. Still, as thediscussion below illustrates, significant problems of quantification of these changesremain.
57. Extended families in many countries provide their members “insurance” services.Everybody helps out when someone is in trouble. In some countries, these insuranceservices are moved into the market, in others they have been shifted to the government.While the “risk” services may be similar, how they are evaluated in the national incomeaccounts may differ markedly.
b. Depreciation and technical progress
58. There have been several other long-run changes in the structure of our economy. Again,taking account of these is not so important when our focus is on the level of marketactivity (or changes in those levels over a short time-span) rather than on the level ofsocietal well-being. One such change involves depreciation. We need to take account ofthe depreciation of our capital stock, just as we need to take into account the depletionof our natural resources.22 Otherwise we would overstate the material dimension of ourwell-being. In a manufacturing economy, depreciation may be largely a matter ofmachines wearing out. In a modern innovation economy, depreciation is largely a matterof technological obsolescence – which in turn depends on a hard-to-predict variable, thepace of innovation. In the “old” economy, the ratio of NDP (net output, taking accountof depreciation) to GDP (gross output, ignoring depreciation) may be high and stable. Inthe “new” economy, the ratio is probably much lower and certainly much more variable.If this is indeed the case, it means that NDP (and thus a more relevant measure of well-being) has increased more slowly than GDP. More of gross output is spent just replacingequipment that has become obsolete.
c. Imperfections in competition and the New Economy
59. Among the sources of growth in both developed and developing countries have beensectors, like telecommunications and airlines, in which firms can engage in pricediscrimination. Different individuals may face different prices, and significant quantity
22. These issues are closely linked to those discussed later on sustainability. If we do not invest to offset the depreciation of amachine producing today’s output, that output (and the consumption which is based on it) can’t be sustained. When we addto consumption the gross investment that we are making today, we get an exaggerated view of today’s “output.”
The Measurement of Economic Performance and Social Progress Revisited
21
discounts or surcharges may exist. Prices are used to value output, but only because theyrepresent how individuals, at the margin, value one good against another. This no longerholds when there is price discrimination and profits no longer measure the (marginal)valuations of the output less the (marginal) valuations of the inputs. If marketimperfections grow, then changes in the price of, say, telecommunications services nolonger accurately reflect changes in marginal valuations. Growth may be overstated.
d. Other market failures
60. Markets fail for a variety of reasons – imperfections of competition discussed in theprevious paragraph, externalities such as pollution, incomplete risk markets, orinvoluntary unemployment. The importance of these market failures can change overtime, in some cases markedly so. Urbanization has increased the importance of urbanamenities. Waste disposal may not be a problem in sparsely populated rural sectors, butbecomes critical in urban areas. We must spend money to get what was once obtained atno cost. In some ways, this is like the switch from non-market activity to marketactivity; it is a switch from “free” to “purchased”.23
e. Globalization
61. Globalization is one of the other important forces facing our society, and it too poseschallenges to our measurement system. As we have noted, the incomes of a country’scitizens may differ markedly from the output produced within the country – in capital-exporting countries, it may be much larger, in capital-importing countries much smaller.Not taking into account capital flows may provide a vastly distorted picture; andbecause capital flows can change quickly in a short period of time, this is an arena inwhich change poses difficulty both for long-run and short-run comparisons. Thisimplies that the relevant measure (at least for the assessment of the welfare of thecitizens in the country) in a globalized world is the Gross National Product (GNP), andthe refinements to that concept presented in Chapter 1. These measures include netincome received from or paid abroad -- rather than the GDP which does not, yet it is thelatter concept that is typically used today. For purposes of the welfare of the citizens ofa country, what matters is not what is produced within the country, but the incomes ofthe citizens of the country.24
f. The growth of government
62. Another major change in many economies is the increasing role of government. Again,we would get a distorted view of the world if output were to increase or decrease simplybecause some activity shifts from private to public production. In principle, it should notchange. But in the public sector, we measure output by input. Thus, a shift from theprivate to the public sector in which nothing else changes almost necessarily lowers
23. With some market failures, prices may still reflect individual’s marginal valuations. It is only that the market prices are notthose that would prevail were these market failures corrected. Often, however, there are impacts on the well-being of others(this is the case with externalities) that are not captured in market prices; and in many cases there are adverse effects onnatural assets, which should be taken into account in any system of national accounts. See below.
24. Obviously, migration, and especially temporary migration, presents further complexities, which we do not address here.
22
REFLECTIONS AND OVERVIEW
GDP. It lowers it even more if the shift enhances efficiency, because then the input islowered – and measured GDP falls.
63. While this suggests a statistical bias against public provision, matters are morecomplicated. It is possible that the value of the goods and services provided by thegovernment is less than the value of the inputs. In that case, valuing public goods andservices at the cost of inputs overstates the value of what is produced.
g. Leisure
64. Still another change in economic structure involves leisure: there are marked changes inthe amount of leisure enjoyed over time and amongst countries – and even withincountries (a point that we will return to shortly). We have witnessed enormous increasesin productivity in the last 150 years. Many economists had expected that mostindividuals would respond by increasing the amount of both the leisure and the goodsthat they enjoy. Yet in the United States, on average, Americans have responded in thetwo last decades by working more and increasing their consumption of market-produced goods and services – in marked contrast to what has happened in many othercountries. The table below shows that for the last year available the working time of theAmerican is the highest among the countries considered.
Figure 3- Housework, paid work and leisureMinutes per day and person, latest year available*
Note. Using normalised series for personal care; Unites States: 2005, Finland 1998, France 1999,Germany 2002, Italy 2003, United Kingdom 2001.
Source: OECD (2008), Growing Unequal? Income Distribution and Poverty in OECD Countries, Paris.
65. America’s response raises many questions: clearly, our planet could not sustain suchconsumption levels were they to be extended everywhere, without marked increases in“environmental efficiency”, for instance, a reduction in the level of emissions per unitof output. But here again, our focus is narrower: We ask only, what do these differences
The Measurement of Economic Performance and Social Progress Revisited
23
imply for evaluating economic performance? Surely, if one society chooses to limit itsconsumption of material goods, enjoying more leisure, including time devoted toculture, the arts, and community engagement, it should not be counted against it.Citizens in such a society might be far happier than in one which works longer hours,spending less time both with the family and in the community. Citizens in the hard-working society complain that, while they are working hard for the family, they have notime left for the family. Yet, our conventional measures would attribute better economicperformance to the harder- working and unhappier society: both incomes and growthwould be higher. Furthermore, the increase in average working time may be itself theconsequence of the society’s malfunctioning. If inequality becomes pervasive, thenumber of persons who have to work harder to ensure their living may greatly increase(there is a negatively sloped Hicksian labour supply curve): they may claim that theyhave no choice but to work harder (though of course they could, were they willing toaccept a much lower standard of material consumption than other citizens). It would bequestionable whether this evolution is welfare-enhancing, even if GDP increases as aconsequence.
66. One needs to look at these issues, of course, from a lifetime perspective, and from thisperspective, the discrepancies across societies and over time may be even larger. Forinstance, in some societies, individuals retire earlier than in others. Mobility maychange over time and differ across countries; in countries with lower mobility, for agiven level of contemporaneous inequality, lifetime inequalities will be greater. Poorerindividuals often have to retire earlier, because of the back-breaking work in which theyare engaged; thus their lifetime earnings may be an even smaller fraction of meanlifetime income than their current income is of current mean income.
67. The retirement decision illustrates the complexity of measuring performance. Manyindividuals would prefer to work more years if their work were interesting25; work is animportant part of their self-identity. Standard economic models view work as a cost, yetfor many individuals, meaningful and decent work gives some sense to life. In somecountries, there are important changes to the nature of the workplace. More democraticworkplaces can make work more interesting and rewarding. Standard metrics take noaccount of these changes. The extensions of our systems of metrics discussed in Chapter2 of the main Report hold the promise of being able to do this.
68. By the same token, individuals spend longer in school today than they used to. Some ofthis education is “consumption”, but some is “investment”. The former mightappropriately be included in “leisure”, the latter as an intermediate good, an input intothe production of other goods and services.
h. Distribution
69. A final important change in the structure of many societies around the world isincreasing inequality. The distribution of income and wealth determines who enjoysaccess to the goods and services produced within a society. (It also has import for
25. There is no contradiction here with the preceding paragraphs. Individuals may at the same time value leisure during theirprofessional life and because the latter is rewarding still prefer to retire at an older age.
24
REFLECTIONS AND OVERVIEW
influence in political processes.) Earlier, we noted that one of the reasons that changesin GDP per capita over time (and differences across countries) often fail to reflectwidespread perceptions of such changes (or differences) is that the benefits of growthare not just unequally distributed, but may be becoming more so: most of society can beworse-off, even as a few are so much better-off that average incomes have increased.
70. One of the reasons that most people may perceive themselves as being worse-off eventhough average GDP is increasing is because they are indeed worse-off. This has beenthe case, for instance, in the United States in recent years: in 2006, median householdincome (that is, the income of the household such that half of the households hadincomes greater than that amount, half less) was lower than in 1998, even though GDPper capita had increased by about 9% over that period. If we take a longer perspective,over the last 40 years median household income has increased by only 30%, while GDPper capita has doubled.
71. While there is no single number that summarizes the manifold distributional changes (ordifferences across countries), what is clear is that average income does not provide anadequate summary statistic. If societies care about inequality, then a policy thatsimultaneously increased national income and inequality could either increase ordecrease societal welfare. By the same token, if average income is increasing but at thesame time inequality is increasing, it is not clear whether societal well-being isincreasing or decreasing. And inequality may increase in a variety of ways, as it is amultidimensional concept. The relevant question is: “inequality of what?”26 . If forexample, the way chosen to increase production and income, is labour cost reductionthrough a decrease, say, in health insurance, average income may well go up (becausecompetitvity is enhanced), but the capabilities of some fraction of the population, theirfreedom to choose their life will almost surely go down.
72. There are many elements of the distribution of income that constitute part of the pictureof what is happening to a society. In societies in which incomes are growing rapidly,elderly people may have a much lower income than younger people, unless societieshave a good social security system – beyond that which can be provided by privatesavings. As we noted earlier, societies with greater social and economic mobility mayhave less inequality in lifetime incomes than other societies with comparable measuredinequalities at a moment of time.
73. What matters is thus not just inequality of income or consumption, but inequalities inthe opportunities, capacities, and life chances of those born under differentcircumstances. The capability approach to the quality of life emphasizes the objectivedeterminants of well-being, without reducing it to those determinants. If the capabilitiesof different individuals – such as having adequate nourishment or the literacy requiredto participate actively in political life – become more unequal, social mobility will beimpaired27. The question then is why, to start with, capabilities became more unequaland the answer can’t be but that the provision of public goods and services hasdeteriorated. There is, in effect, considerable concern that in some societies there has
26. Cf. Amartya Sen: “Equality of What?”, in S. McMurrin (ed), Tanner Lectures on Human Values, vol I (Cambridge:Cambridge University Press and Salt Lake City, UT: University of Utah Press, 1980)
27. Cf Amartya Sen (op. cit.) and by the same author: commodities and capabilities, Oxford: Oxford University Press, 1999
The Measurement of Economic Performance and Social Progress Revisited
25
been deterioration in broader measures of socio-economic mobility, though in others ithas improved. Policies (such as the quality and inclusivity of public education) mayimprove these broader measures of socio-economic mobility. This is an arena where thefailure to gather relevant data may have led to the pursuit of policies with adversesocietal consequences.
74. “In noting the nature of Human lives, we have reason to be interested not only in thevarious things we succeed in doing, but also in the freedoms that we actually have tochoose between different kinds of live”28. This is the philosophical underpinning to thecapability approach to measuring the quality of life. It is why this approach, which wedescribe extensively in Chapter 2 of the main report, argues that the quality of lifeshould be conceived and measured directly in terms of functionings – i.e. beings anddoings that people value and have reason to value – and capabilities instead of resourcesor utility. “Even though the much used economic criteria of advancement, reflected in amass of readily produced statistics, have tended to focus specifically on theenhancement of inanimate objects of convenience (for example in the GNP or GDPwhich have been the focus of a myriad of economic studies of progress), thatconcentration could be ultimately justified – to the extent it could be – only throughwhat these objects do to the human lives they can directly or indirectly influence”29.Focusing on outcome is in effect very limitative, because capability captures not onlyachievement, but also unchosen alternatives. If a person chooses to work fewer hours toenjoy more leisure, this implies that he had the opportunity to work longer hours. If thecost of unemployment for an unemployed person is much higher than the lost inincome, it is likely because it includes a lost alternative.
75. Measurement problems – of the kind addressed in this Report – bedevil our attempt toascertain what is happening to the distribution of income. We can describe, for instance,how money (or nominal) income for different groups is changing. But that does not tellthe whole story. The elderly may consume more medical services, so that if there is ahigher rate of inflation in medical services, their real income should be adjusted toreflect this. To achieve the same functioning as the younger, they need a higher income,a characteristic that the capability approach emphasizes. The government may, for thatreason, provide more medical services for the elderly without charge or at discountedprices. Our statistics may or may not trace who receives various publicly providedservices. We noted earlier that development is often associated with urbanization. Butprices of goods and services in the rural area may differ from those in the urban area,and the rate of increase of prices may also differ.30 Recent years have seen prices ofhousing in urban areas increase markedly relative to rural areas. One of thecontroversies over the extent of poverty concerns the prices that urban dwellers have topay for the goods they consume. Locally produced food and housing may be much lessexpensive, but imported goods may be more expensive. The poor may buy many keygoods in small quantities, which drives up their cost of living. Adjustments in“purchasing power parity” numbers in recent years have provided markedly differentpictures both of the level of poverty around the world and the magnitude of poverty
28. Amartya Sen: The idea of Justice, Allen Lane, 2009, P.1829. Amartya Sen, Op. Cit. 30. These remarks highlight the risks of using a single consumer price index to adjust nominal incomes for different groups.
26
REFLECTIONS AND OVERVIEW
reduction. The number of persons in absolute poverty (less than 1 dollar per day) hasdecreased from about 1.5 billion in 1981 to less than 1 billion in 2004. But if theabsolute poverty line is increased to 2 dollars per day, this number has slightly increasedduring the same period: from 2.4 billion in 1981 to 2.5 billion in 200431.
76. Unfortunately, in many areas, even when we have the appropriate conceptualframeworks, there are problems in getting relevant data. Many inequalities, includingthose related to gender (both in terms of consumption and household work), occurwithin the household, and therefore are masked by “household” data. There areproblems in reconciling data generated by household surveys used in assessing incomeand consumption inequalities with those underlying national income accounts. OurReport emphasizes the need for greater investments in data.
i. Change in household size
77. There have been many significant demographic changes in recent years that affect themeasurement and interpretation of the data on economic performance and societal well-being. Here we emphasize family size. Most individuals live within households, andhousehold sizes have been changing. Most households today are smaller than theypreviously were. Adjustments are often made to reflect economies of scale in householdliving. If the average size of households goes down, then, using these householdadjustments, well-being will increase less than proportionately to the increase inunadjusted household income. But this conventional approach misses one importantpoint: individuals, for the most part, have chosen to live in smaller households. Thereare perceived benefits: perhaps fewer “free rider” problems, perhaps fewer coordinationproblems, or perhaps some people value greatly the increased “space” that it provides.The fact that they could have chosen to live in larger family units suggests that thesebenefits outweigh the more narrowly defined economic disadvantages.
78. The move to more nuclear families has other consequences. More extended familiesprovide a variety of services (babysitting, cooking) and additional security, whichtypically are not reflected in our performance measurements.
j. Changes in the pace of change
79. Changes are always occurring, and will always occur. But there have been changes inthe pace of change, and these may have a qualitative as well as a quantitative effect.They make the task of assessing change more difficult. They throw into question long-term comparisons. Some have suggested, for instance, that the magnitude of economicfluctuations in the post-Keynesian world is little different than earlier32. But even if thestatistical analysis of the data is correct, it may be little more than a statistical artifact, ameasurement error. We know, for instance, using other metrics, that there is adifference: since the advent of Keynes the length of economic expansions has beenlonger, of downturns shorter. But with the quickening pace of innovation (if our metrics
31. Cf. Francisco H.G. Ferreira and Martin Ravallion, “Global Poverty and Inequality: A Review of the Evidence”, PolicyResearch Working paper no. 4623, The World Bank, May 2008.
32. Cf. Christina Romer: “The Prewar Business Cycle Reconsidered; New Estimates on Gross National Product, 1869-1908”,The Journal of Political Economy, Vol.97 n°1 February 1989.
The Measurement of Economic Performance and Social Progress Revisited
27
on the pace of innovation are correct), there may be problems making comparisons overeven shorter periods of time.
Some concluding observations
80. We have listed several important changes in the structure of economies throughout theworld. These and other important changes in economic structure pose large numbers ofpolicy challenges. Our concern in this Report is narrower: we are concerned withassessing economic performance and social progress. It may be relatively easy tocompare two economies with similar structures. It is far more difficult to makecomparisons involving economies with different structures. Since economic structuresnormally change slowly, these differences in structure may not be that important inassessing the change over a decade. But they take on central importance in assessingchanges over longer periods of time, or in making comparisons, even among advancedindustrial countries, where, say, one country has chosen to rely more on governmentprovision of certain social services and the other has turned to private provision.
81. The discussion in the following chapters will show the valiant efforts national incomestatisticians are making to deal with these intractable problems. Yet, it will also showthe limitations of these statistics. One of the important lessons to emerge from thisReport is the need for caution: one has to be aware of these limitations as one attemptsto make judgments, whether about the effectiveness of certain policies, or themagnitudes of progress over time, or differences across countries.
III. The way we proceed
82. Because what we measure affects what we do, the construction of measures ofeconomic performance has become the subject of some political controversy. Notsurprisingly, some in the mining industry resisted early efforts to construct measures of“green GDP”, which took into account the effects of mining on resource depletion andenvironmental degradation.
83. This is a Report of technical experts. But as technical experts, we realize that a society’svalues are inevitably embedded in the construction of an index of economicperformance and social progress. We have attempted to discuss the construction ofindices reflecting the valuations, capabilities, and perceptions of individual members ofsociety. Individuals and households are the basic units of analysis. Yet their perceptionstoo must be seen within a social context.
84. It is our belief that an open discussion of the issues – and problems – involved inmeasuring economic performance and social progress provides an important contextwithin which societies can engage in critical debates about societal values. Given thediversity of views within our society, it is not surprising that we have not put forward asingle “best” or “correct” way of measuring economic performance and social progress.There are many indicators of societal well-being. But we strive to go beyond simply
28
REFLECTIONS AND OVERVIEW
listing a set of factors that affect individual and societal well-being. Part of our objectiveis to find quantitative metrics for key factors, and to assess the relative importance ofvarious factors and to discuss the methodologies by which such quantitativeassessments may be made.
85. Consider, for instance, health – clearly an important determinant of individual andsocietal well-being. There have been marked improvements in health status in mostcountries around the world. Life expectancy of men in France has increased from 68years to 77 years over the period 1970 to 2006, and in the US from 67 years to 75 yearsover the same period.
86. These improvements are an important aspect of societal progress in recent decades. Weshould make note of these improvements, even if we cannot be sure what causes them,and even if were are not sure of the best way of quantifying them. The changes incomplex: there have been large changes in the quality of medicine, and in social moresthat affect health status. Changes in the environment or chemicals that are added tofood may have mixed effects on health status. But when changes in health status aredirectly related to economic activity, it would be wrong not to include them somehow inour measurement of economic performance.
87. But how do we add up improvements in health status with changes in material well-being or increases in leisure? Again, there are standard techniques – how muchindividuals value an additional year of life, or reductions in the risk of certaindisabilities. Yet these techniques do not command the assent of many economists andsocial scientists, let alone support from other segments of society, for whom life may beviewed as priceless. We cannot resolve these matters here; but they suggest that, untilthere is broader societal consensus, it would be best to present such indicatorsseparately.
88. This approach has sometimes been referred to as constructing a “dashboard” ofindicators. As is so often the case, there are trade-offs: a single metric is easier tounderstand, and yet one cannot expect to summarize all the relevant informationconcerning the performance of something as complex as our society within a singleindicator.
89. But while we believe that there should be an array of carefully chosen statistics(illustrated by the discussions of this Report), we believe that the construction of somesimple “aggregate” measures, along the lines of traditional GDP measures, can beextremely useful. There is a need for an “extended” or “adjusted” GDP-like measure.
90. This Report progresses through a succession of revisions and extensions of the standardmeasures. Each of the revisions is important, in its own way, both for assessing changesin well-being and making comparisons across countries.
91. Chapter I of the main Report begins with a review of several long-discussedadjustments. The need for most of the adjustments discussed in Part I is widelyrecognized, and yet, ironically, some of the reforms of recent years have moved in theopposite direction. In particular, while GDP measures output within a country, muchmore relevant for assessing the well-being of a country’s citizens is the income of thosewithin the country, which was more closely captured by the GNP numbers that weremore widely used prior to 1990. In our report, we discuss refinements to this concept (in
The Measurement of Economic Performance and Social Progress Revisited
29
particular, Net Domestic Disposal Income, NDDI). The differences have becomeparticularly important in an era of globalization, with large flows of money going fromone country to another.
92. The first set of reforms focuses on better measures of market income and output –taking into account, for instance, depletion of natural resources, degradation of theenvironment (issues which are also central to the discussion of Part III), and bettermeasurement of health, education, and other services provided by the government. Thefailure to take into account resource depletion means that many countries overestimatetheir true output – and the failure to take into account environmental degradation almostsurely means that the world as a whole is overestimating global income.
93. We proceed from there to look for better measures of individual and societal welfare,taking into account most importantly, recent innovations in assessing well-being.
94. The current crisis, and the climatic crisis associated with global warming, has drawn ourattention to the importance of sustainability – any measure of economic performance(whether it is a measure of output or income or a broader measure of well-being) has toaddress not just what is happening today, but the consequences of today’s actions on thefuture. The final part of this Report describes the progress that has been made inconstructing the appropriate metrics that rise to this challenge.
95. There are accordingly three Chapters to the Report (both in their technical and non-technical versions): The first focuses on improvements in the measurement of outputand income (what we refer to as the classical GDP issues). The second on broadermeasures of well-being; the third on measuring sustainability. Our Report progressesfrom the easiest to measure to the more difficult, from the areas in which there is broadconsensus to those in which there is less consensus. Sections IV through VI deal withthese issues. But we are more concerned with well-being than activity. Sections VIIwill consider other approaches to monitoring societal progress. Finally, in Section VIIIwe discuss the problems of sustainability.
IV. Measuring the level of market activity and government services
96. We have begun with the challenges posed by measuring the level of market activity,proceeding from there to the measurement of overall activity. Sections V and VIconsider adjustments to our measurement of market activity that provide a betterassessment of well-being (leisure, defensive expenditures, etc.). In a sense, thesesections can be thought of as attempts within the classical framework of doing a betterjob of assessing changes in welfare.
97. One would have thought that there are few problems in measuring market activity. Allone has to do is add up the market value of goods and services produced, then constructsome measure of inflation to convert nominal values into real values, and one will havea good measure of real national income. As the discussion above should have suggested,
30
REFLECTIONS AND OVERVIEW
matters are more complicated. Here we highlight a few of the key points that areelaborated at much greater length in the Report.
98. Several of these are related to the fact that, as we have already noted, much of what wecall market activity is only partially so. The government buys its inputs (labour, othergoods and services) in the market, but most of what it delivers is not sold, and evenwhen it sells certain goods and services, it does not do so in a competitive marketplace.While the discussion below focuses on problems with assessing the value ofgovernment output, there are problems in other sectors as well. In many countries, mostcitizens do not buy housing services, but rather own their own home. While they havepurchased their home in the market, there is no market price for the housing servicesthey have obtained this year.33
Measuring the value of the output of marketed goods and services: quality
99. Much of the increase in GDP today occurs not as a result of, say, an increase in thenumber of cars purchased, but of improvements in their quality. They pollute the airless, they are safer, they get more miles per gallon, and they may even be morecomfortable. The challenge then is to figure out, when the price of a car increases, howmuch of the increase represents an increase in “quality” and how much inflation. Thedifficulty is compounded when we deal with services. Whereas for manufactures it iseasy to define the unit purchased, this is much harder for many services. This difficultyhas long been recognized, and it implies that for the service sector, especially forcomplex services, the quality question will be much harder to resolve. There arestandard techniques – hedonic prices, by which statisticians determine how muchindividuals are willing to pay for a specific dimension of quality, for instance, anincrease in miles per gallon.
100. But this refers to private, not social valuations. This highlights one point, made earlier –prices represent private valuations, not social valuations.
There is a distinction between private and social valuations whenever there is anexternality. If, for example, oil is being subsidized, if there are no charges for greenhousegas emissions, the private value of a more fuel-efficient car may be low, while the socialvalue may be high. In this accounting framework, it appears that there is a trade-off:tightening the environmental regulations for car producers shows up as a reduction forthe consumer in the value of the cars produced, as the car makers have to charge more forsomething that consumers directly value little. But if we charged everyone for the valueof greenhouse gas emissions – if we made users of cars pay for the full value of their“externalities”, their contribution to global warming – then, of course, the privatevaluation of these emission reduction changes would be high. There would be no trade-
33. Systems of national income accounting typically impute the flow of housing services. In principle, if rents fall dramatically(as they are in the United States today), the value of the flow of housing services will fall. From a (short-run) welfareperspective, the effects are offsetting, the lower (imputed) rental income as homeowners being offset by lower rentpayments. Neither is there any real change in economic activity, since individuals are doing exactly the same thing as theywere doing before. There is a change in the market value of these imputations. If, somehow, the economy managed to getitself through this episode of declining rents without any change in employment and output of other goods, it would bemisleading to suggest a marked decline in GDP simply because of the decline in the value of imputed rents.
The Measurement of Economic Performance and Social Progress Revisited
31
off. Indeed, if, for some reason, car manufacturers were reluctant to produce lowemission cars, then regulations forcing the production of low emission cars would showup as an increase in GDP. This discussion highlights that many of our perceived trade-offs between environment and growth are little more than a statistical artifact.
101. Underestimating the extent of improvements in quality is equivalent to overestimatingthe extent of inflation – highlighting the close link between the concerns of this Reportand other reports focusing on the measurement of inflation. For instance, an important,but controversial, report reviewing the measurement of inflation in the United States,the so-called Boskin Commission Report,34 argued that the US had been overestimatingthe rate of inflation by between 1 and 2%, and thereby underestimating the real rate ofgrowth. Of that amount, it estimated that 0.6% was due to mismeasurement of qualitychanges. Whatever its limitations, the Boskin Report had the merit of drawing attentionto the quality question, attempting to quantify its importance, and proposing measuresto deal with it.
102. In the coming years, especially difficult problems will be arising as we start to pricecertain externalities, most importantly greenhouse gases. It might appear that chargingfor greenhouse gases raises prices (assuming those charges are passed on) and istherefore inflationary. If firms respond by investing more to produce the same realoutput, say of cars, with less emissions, it will appear as if real output and productivityhas declined. Part of this decrease may be explained by the fact that the new cars aremore expensive to produce. But the output of greenhouse gases has a social cost – it isan output with negative value. We should have been subtracting the value of this “bad”from GDP. True output, valuing both the output of cars and the (negative) output ofgreenhouse gases, may have actually increased. Again, the failure to assign the correctvaluation has given us an incorrect indication of what is happening to societal output.
Measuring the value of output of publicly produced goods and services
103. We have no good way of measuring the value of goods and services produced by thegovernment. We often use a simplification – we measure the output by the value of theinputs. But this assumes that the increase in productivity in the government sector is thesame as in the rest of the economy, and that there is no “social dividend”. Consider, forinstance, what happens if we nationalized a private insurance company, providing thesame insurance policy to the holders. The services of the insurance industry when it isprivate are measured by the inputs of labour (or other factors of production) plus theprofits. But if the government gives the insurance away freely, then, by definition, thereare no profits. Citizens pay for the costs, of course, through taxes. It is as if thegovernment sold the insurance at the market price and then rebated the profits through asocial dividend. Because there are no profits, the output of the nationalized industry willbe smaller than the output when it was in the private sector. But this is just a fiction ofthe way we measure national output. There is a very important caveat here: studies thatargue that national output is lower in economies in which the government plays a more
34. Boskin, Michael J., E. Dulberger, R. Gordon, Z. Griliches, and D. Jorgenson (1996), “Toward a More Accurate Measure ofthe Cost of Living”, Final Report to the US Senate Finance Committee, December 4.
32
REFLECTIONS AND OVERVIEW
important role in the economy may simply be reflecting accounting conventions. Theyare not saying anything about reality. To do that, one would have to look at realmeasures of productivity, for instance, cost per telephone line.
104. The import of this is that if there is faster productivity growth in the public sector thanin the private sector, our measure underestimates growth, and conversely if there isslower growth. The problem arises when productivity in the public and private sector donot move in tandem35, so real output does not move in tandem.
105. The difficulty is measuring these productivity increases – and while our analysis showsthat how we treat these sectors has large consequences, we cannot resolve whetherconventional measures are biased up or down, or whether there are systematic biases inassessing well-being in one country relative to another. The fact that the US has poorerhealth outcomes while spending more money suggests a lower level of efficiency in theprovision of health services, and taking this into account may markedly change ourperceptions of relative standards of living. And this is true, without even taking intoaccount differences in (health) “security”, differences in risks faced by citizens inAmerica versus other countries.
106. Measuring output by input (and therefore omitting “profits”) might seem to bias theoutput of the public sector downward. It may, however, be true that in some countriesgovernment provides public services that are not valued by their citizens or it providesthem in such an inefficient way that valuing output by input may provide anoverestimate of the value of the services. There may be, in effect, hidden transferpayments in the public sector, and one should never confuse transfer payments witheconomic activity.
107. There have been some attempts to measure and value output in the public sector,especially in the UK36, prompted by the type of problems we have just exposed. Tounderstand the complexity of the valuation of output in the public sector, considereducation. We can ask, how many students are educated? If we spend more resources toeducate the same number of students, this would suggest that education productivity hasgone down. That may or may not be the case. If most of the extra resources go intoadministration, it may be a sign of inefficient delivery mechanisms. If, however,additional resources go into smaller class sizes, it may improve the quality ofeducation.37 A good measure would reflect this; there would be an increase in output,even though there has been no change in the number of students educated. The worry isthat by focusing on the number of students, we build in the assumption that productivityis declining, even when in the relevant sense, it is increasing. Consider a country whereimmigration increases. Because of cultural and language problems this may require, tomaintain “quality”, a more than proportionate increase in the number of professors and/or a reduction in class size. Should we then speak of a decrease in productivity, knowing
35. This assumes that wage growth moves with productivity, which it typically does. In the short run, however, the two mayagain not move in tandem.
36. Tony Atkinson, “Measurement of Government Output and Productivity for the National Accounts”, Atkinson Review: FinalReport, HMSO, 31 January 2005, Palgrave-MacMillan.
37. Cf. e.g. Sid Glibert, “Quality Education: Does Class Size Matter?” Research File, April 1995, Vol. 1 No. 1; ChristopherJespen and Steve Rivkin, “Class Size Reduction and Student Achievement: The Potential Tradeoff between Teacher Qualityand Class Size”, The Journal of Human Resources, Vol. 44, No. 1, 2009.
The Measurement of Economic Performance and Social Progress Revisited
33
that if these special efforts are not undertaken the overall quality of education woulddecrease?
108. Alternatively, additional resources may go into providing better education to disabledstudents. In this case, most students will not see any change in quality, but a few will seemarked changes (this is an example where distributional consequences are paramount).
109. We can measure the quality of the education of students – performance on test scores –but that too is an intermediate variable. What we are really interested in is long-termeconomic productivity (and perhaps even good and well-adjusted citizens). This may behard to assess. But even then, as we have noted, it doesn’t fully inform us of the valueadded by the education system, because other societal changes (some related to theeconomic system) may affect the quality of the inputs, the performance of the studentsin the absence of the educational expenditures.
110. In the health sector, measures of input may be an even poorer indicator of output. It isnot the number of heart surgeries that is of concern, but how successful they are, andthere have been marked improvements.38
111. Fortunately, we do have some indicators of overall success (even if they are imperfectmeasures of value added): in the area of health, life expectancy, child mortality39, etc.,and in the area of education, performance on test scores. (Test scores are only relevantto the extent that they correlate with future productivity or broader measures of well-being, but they are a better indicator than number of students educated.) Whileimprovements in these areas should not be viewed simply as the outcome of the health(medical) or education system, because of impacts of other changes in the economy andsociety (health, as we have noted, is affected by diet and smoking), they can be viewedas measures of societal progress more generally.
112. Health outcomes are an arena in which distribution is as important as it is for income.There is, for instance, a wide dispersion of life expectancies. Several studies haveshown that the relation between income distribution and life expectancy is sufficientlystrong to produce significant associations in analyses of cross-sectional data and of datacovering changes over time. The correlation almost disappears for the higher deciles(from the 7th to the 9th). The relationship is thus strongly non-linear, meaning thanhealth is more responsive to changes in income among the least well-off40.
113. For education outcomes, the best cross-country metrics of performance are provided bythe Pisa test. But this test may not be the best for comparison across time within acountry.
114. In the judiciary sector, an input-based measure of output may be especially misleading.The output of the sector should be some measure of (confidence in) justice. But asociety characterized by a low level of trust between its citizens will have more courts,
38. David Cutler, Your Money or Your Life, Strong Medicine for America’s Health Care System, Oxford University Press, 2005.39. It is not easy to measure how our health care system is doing in extending life or reducing infant mortality. Cf. Angus
Deaton, David Cutler and Adriana Lleras-Muney, “The Determinants of Mortality”, Journal of Economic Perspectives,2006.
40. R.G. Wilkinson, “Income Distribution and Life Expectancy”, British Medical Journal, 18 January 1992.
34
REFLECTIONS AND OVERVIEW
more lawyers, and more conflicts. The consequent increase in GDP would not be a goodmeasure of an increase in societal welfare.
115. While there are methodological disagreements about how to make the adjustments toquality or the measurement of government output, there is a broad consensus that someadjustments should be made, and even about the principles that should guide suchadjustments. The disagreements arise in the practical implementation of theseprinciples.
V. Economic Activity and Societal Well-Being
116. So far, we have focused on measures of economic activity, and even more narrowly, ofmarket activity. But we are interested in measures of well-being. Here we will follow inthe second tradition on national income measurement, launched notably by the work ofHicks and Samuelson, focusing on welfare measurement.
117. But going from a measure of market economic activity to a measure of economic well-being involves measurement, valuation, and conceptual problems (e.g. what aspects ofeconomic activity should and should not be included).
118. While measures of economic activity focus on production, measures of well-beingfocus on household income and consumption. When we adjust for changes in prices, themarket basket of consumption goods (reflected in the consumer price index) is differentfrom the market basket of produced goods (reflected in what is called the GDPdeflator). In addition, the market basket of consumption goods consumed by the richand the poor, by the young and the old, by those in cities and those in rural areas, maydiffer markedly, and so we should have a different consumer price index for each ofthese groups. Reporting what happens to relative nominal incomes may not tell us allwe want to know about relative real incomes. The most obvious example relates to therapid rate of increase in urban housing and medical costs, with the result that the realincome of both the elderly – at least those who are not sufficiently subsidized throughan insurance scheme – and urban dwellers may be rising less rapidly than would besuggested by looking at their incomes and deflating by the “average” consumer priceindex.
119. When we look at an open economy, two important adjustments need to be made. Wehave already discussed one: income from domestic production may accrue to foreigncompanies and citizens, so measures of what is produced in the country (such as GrossDomestic Product) may differ from measures of the income of those within the country(Gross National Product, , GNP, which had been the dominant metric before 1990, thegross income (i.e. ignoring depreciation) of those living in the country. In the Report,we present refinements on this concept.)
120. The second adjustment relates to price changes. There may be marked differencesbetween the prices of the goods produced by the country and the prices of the goodsconsumed by the country. This is most obvious in the case of oil exporters, who face
The Measurement of Economic Performance and Social Progress Revisited
35
large fluctuations in the price of what they produce relative to the price of what theyconsume. The level of economic activity – the amount of oil produced – may changelittle, but the level of consumption that this oil may sustain may vary greatly.
121. For households, capital gains on the assets that they own can be an important part oftheir “income”. Yet national income statistics usually exclude these gains. The increasesin stock and housing prices during the 1990s and the early years of this decade were animportant contributor to individuals’ sense of well-being, and the capital losses in 2008contributed significantly to individuals’ sense of a decrease in well-being. Year-to-yearvariations in wealth valuation should presumably be taken into account only if we areconfident that markets value wealth correctly, an issue that we discuss more extensivelyin Section 1 above and Chapter 3 of the main Report, where we tackle the sustainabilityissue.
122. In addition to these two adjustments, several others are required in going from ameasure of economic activity to a measure of individual well-being. Typically, wesubtract out taxes to obtain a measure of (household) disposable income. Individuals donot directly get enjoyment out of the taxes they pay, but they do benefit from theservices that government provides, and that is why it is important to add back in the(correct) value of public services. A few other adjustments are required to take accountof: (a) intermediate goods; (b) security; (c) defensive expenditures; (d) leisure; (e) non-market activity; and (f) depreciation, resource depletion, and the degradation of theenvironment. Non market activity is discussed in section VI, and the issues posed bydepreciation and depletion are postponed to the discussion of sustainability (SectionVIII). The first three adjustments (combined with the other adjustments previouslydescribed) give us a measure that is sometimes referred to as adjusted disposableincome41. The table below gives the real adjusted disposable income for France, the USand Finland. But in order to proceed to international comparisons we need to deflatenominal income or consumption. The problem is that both relative prices andconsumption baskets differ across countries. Constructing appropriate price indices orPurchasing Power Parities (PPPs) have a long tradition in the OECD countries.Worldwide PPPs are periodically released by the World Bank. Their use avoids themany defects of comparisons based on nominal exchange rates. If, for example, the eurosuddenly appreciates by 20% vis-à-vis the dollar, that does not mean that the adjusteddisposable income of Europeans suddenly jumps by 20% relative to that of Americans.Of course, all the problems of construction of price indices apply to the construction ofPPPs. Still, there is a broad consensus that PPPs provide the best bases of cross-countrycomparisons of standards of living.
123. The table below shows that the difference in real adjusted disposable income betweenFrance and the US—taking into account the benefits received from the government aswell as the taxes taken away-- is much smaller (more than 20% smaller) than thedifference in real disposable income between the two countries, just because the socialtransfers in kind received by the population are much greater in France. Indeed, the
41. Though the term “disposable” may not be fully appropriate, since individuals may not have “control” over the value ofpublic services they receive. If the government has a balanced budget, and if the value of output is correctly valued by thevalue of inputs, then adding back the value of public services while subtracting out the value of taxes would leave the valueof disposable income unchanged..\
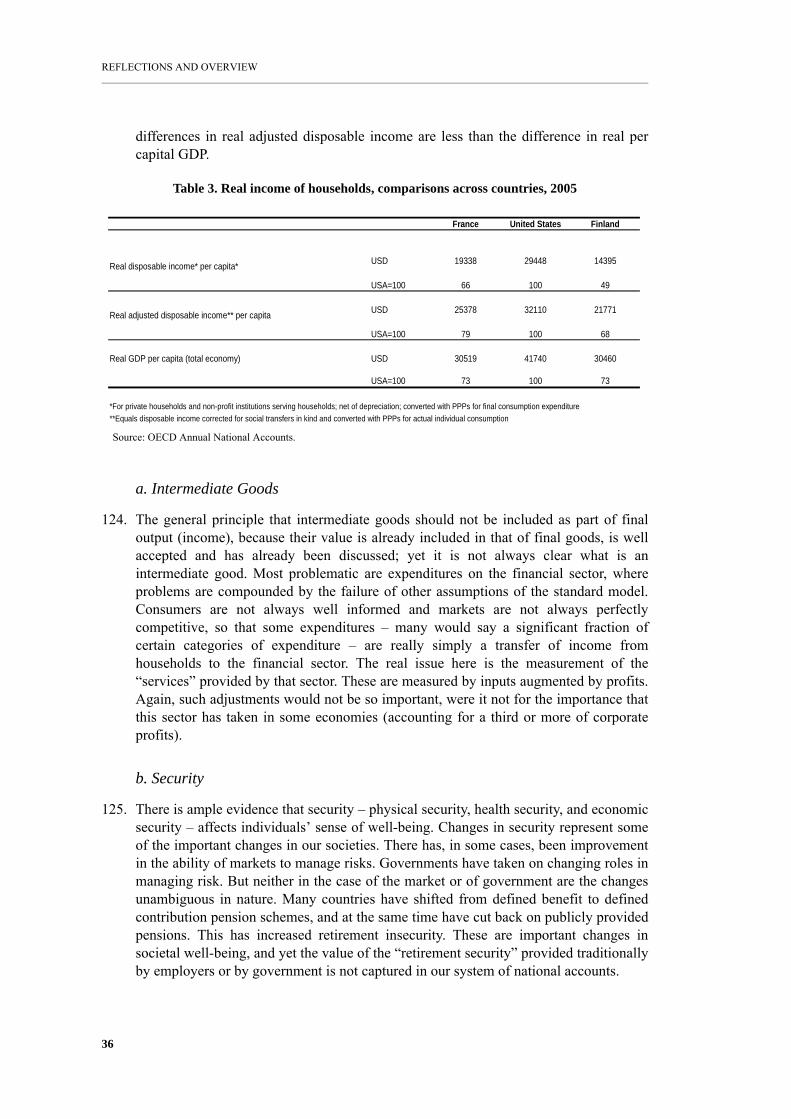
36
REFLECTIONS AND OVERVIEW
differences in real adjusted disposable income are less than the difference in real percapital GDP.
a. Intermediate Goods
124. The general principle that intermediate goods should not be included as part of finaloutput (income), because their value is already included in that of final goods, is wellaccepted and has already been discussed; yet it is not always clear what is anintermediate good. Most problematic are expenditures on the financial sector, whereproblems are compounded by the failure of other assumptions of the standard model.Consumers are not always well informed and markets are not always perfectlycompetitive, so that some expenditures – many would say a significant fraction ofcertain categories of expenditure – are really simply a transfer of income fromhouseholds to the financial sector. The real issue here is the measurement of the“services” provided by that sector. These are measured by inputs augmented by profits.Again, such adjustments would not be so important, were it not for the importance thatthis sector has taken in some economies (accounting for a third or more of corporateprofits).
b. Security
125. There is ample evidence that security – physical security, health security, and economicsecurity – affects individuals’ sense of well-being. Changes in security represent someof the important changes in our societies. There has, in some cases, been improvementin the ability of markets to manage risks. Governments have taken on changing roles inmanaging risk. But neither in the case of the market or of government are the changesunambiguous in nature. Many countries have shifted from defined benefit to definedcontribution pension schemes, and at the same time have cut back on publicly providedpensions. This has increased retirement insecurity. These are important changes insocietal well-being, and yet the value of the “retirement security” provided traditionallyby employers or by government is not captured in our system of national accounts.
Table 3. Real income of households, comparisons across countries, 2005
Source: OECD Annual National Accounts.
France United States Finland
USD 19338 29448 14395
USA=100 66 100 49
USD 25378 32110 21771
USA=100 79 100 68
Real GDP per capita (total economy) USD 30519 41740 30460
USA=100 73 100 73
*For private households and non-profit institutions serving households; net of depreciation; converted with PPPs for final consumption expenditure**Equals disposable income corrected for social transfers in kind and converted with PPPs for actual individual consumption
Real disposable income* per capita*
Real adjusted disposable income** per capita
The Measurement of Economic Performance and Social Progress Revisited
37
126. Better (or worse) macro-economic management may result in less (or greater) economicvolatility. Better (or worse) social insurance means that the risk borne by citizens as aresult of this volatility may be less (or greater). It is possible but difficult to value therisk that individuals face – what they would pay to reduce or eliminate the risk – but oursystem of national accounts does not do this. For poor individuals, unable to accesscredit markets, with little savings beyond their retirement accounts, even a short periodof unemployment may impose great hardship. But this problem is greater in the UnitedStates, where the loss of a job is typically associated with the loss of health insurance. Indeveloping countries where the system of social protection is embryonic, economicstability is even more important, as fluctuations of output may have irreversibleconsequences on the destiny of important fractions of the population.
127. These are changes that have been a consequence of alterations in our economic system,which have large import for societal well-being, and yet our system of economicaccounts does not reflect these changes. In assessing economic performance – bothchanges in time and differences across countries – we need to develop better metrics, atleast for the extent of economic insecurity.
128. Economic security naturally falls within the remit of a system of economic accounts.But so too do other dimensions of security that affect well-being, such as our sense ofphysical security.
c. Defensive Expenditures
129. Increases in spending for security guards to protect property or prisons to incarceratesocietal offenders are included in our system of national accounts, but the question is,should they be? These are not inconsequential – earlier, we noted the substantialspending in the United States on prisons. In the case of security guards employed byfirms, these are intermediate expenditures – a cost of production. But more difficultproblems (discussed in section 2.2) are raised by expenditures by households andgovernment. This raises the fundamental questions posed earlier for other categories ofpublic expenditure: We should be measuring the “output”, our sense of security; instead,we measure inputs. And, in assessing the economic system, we should be measuring thenet value added by the economic (and perhaps social) system. If failings in the socio-economic system lead to more insecurity (crime), for instance, as a result of failures ineducation, then the increased expenditures on police and prisons is simply offsetting thedeficiencies in our education system. Savings in one account are offset by increasedexpenditures in another. If, however, the increase in crime is a result of some exogenousforce, unrelated to the socio-economic system, then the increased expenditures onprisons are increasing welfare relative to what it would otherwise have been. Socialprogress may be less than we would have hoped (because of the adverse changes inbehaviour), and our metrics of social progress should reflect this fact; but there has beenan increase in the “value added” of the economic system, in undoing these adversechanges, and our metrics of economic performance should reflect this as well.
130. As we noted earlier, there are many aspects of changes in expenditures in the process ofmodernization that fall within this category – the increased expenditures onenvironmental services to offset the costs of urbanization (the benefits of which, forinstance, are reflected in the system of economic accounts in transportation costs that
38
REFLECTIONS AND OVERVIEW
are lower than they otherwise would have been). With the rise in the world’s urbanpopulation from 1.6 billion to 3.3 billion in the last 30 years, these “urban defensive”expenditures may not be inconsiderable.42
d. Leisure
131. A final extension of our standard model is to include leisure. Not including leisure in ameasure of societal well-being would bias our measurement system to encourage theprovision of goods and services – a bias that we should be particularly sensitive about asthe world faces environmental problems posed by high levels of production. Standardtheories suggest that societies might rationally take some of the benefits resulting fromimprovements in technology in the form of increased leisure – and it may be a symptomof a dysfunctional society if that is not the case. Yet a society’s decision to enjoy moreleisure as it becomes better-off would be counted against it in standard measures ofGDP and the variants discussed so far. Some account of changes in leisure over timeand differences in leisure need to be made, though again, as in so many of the otherareas of non-market activity, there are problems of measurement and valuation, whichare discussed at length in Chapter 1of the main Report.
132. A particular problem is posed by involuntary unemployment – where individuals cannotwork as much as they would like – or they enjoy more leisure and/or home work thanthey would like. Even if we had data with which we could ascertain what fraction of theadditional time were devoted to leisure, we would have a problem of valuing it –because it is, in part, involuntary, the value is less than the (marginal) wage. (Theproblem of involuntary unemployment includes not just the “officially” unemployed,but also those working part-time involuntarily, because they could not find full-timeemployment.) But still, individuals can choose to engage in non-market activity(discussed in the next section), so that the value of leisure should be at least as great asthe (marginal) imputed value of labour devoted to non-market activity.
VI. Non-Market Economic activity
133. GDP – and our modifications – began as a measurement of market activity (in thebroadest sense of the term, including government). But much activity occurs outside themarket, and this too has important implications for societal well-being.
134. Accordingly, the second set of changes focuses on going beyond market production tonon-market production. As we noted, we already do this, in the case of owner-occupiedhousing. But home production is far more important. Here, even more than in the areaspreviously discussed, we encountered measurement and valuation problems – how
42. Nordhaus and Tobin’s classic study that attempts to come up with a better measure of societal well-being includedsignificant adjustments for these defensive expenditures. For example, they propose to subtract from total privateconsumption a number of components that do not contribute positively to welfare, in particular, commuting.
The Measurement of Economic Performance and Social Progress Revisited
39
much of the activity has occurred, and how do we value these activities relative to, say,market activities. Some of the same problems referred to earlier arise in themeasurement of improvements in productivity and changes in quality. As we broadenthe scope of our definition, we have to rely increasingly on imputations, on educatedguesses, and this reduces the confidence we have in the numbers, and thus theirusefulness. This reliance on imputations is of particular concern because the magnitudeof non-market activity (as conventionally measured) is so large. We are caught in adilemma: because it is so large, to ignore it is to ignore important elements of humanactivity.
135. To be sure, we have much more data today to ascertain what individuals do when theyare not engaged in work. Time-use studies allow us to break down more precisely thekinds of non-market activities individuals are engaged in. Problems of ascertainingwhich activities are “intermediate goods”, which are forms of “leisure”, and which arereally non-market “production” abound. For instance, driving to work is part of the costof market activity that is not reflected in market data. If a society spends more timetraveling to work, it is not an increase in final output, but really reflects a reduction inproductivity, almost surely reflected in a reduction in leisure (or perhaps some othermarket or non-market activity).
136. We may be more confident about measuring certain changes – shifts from homeproduction to market production that occur broadly within society – and it would bewrong not to make note of these changes. Failing to do so may seriously bias ourestimates of improvements in societal well-being. As we have already noted, ascountries develop, there is often a shift from home to market production. The increasesin market production may thus overstate increases in well-being. By the same token,policies that encourage market over non-market production distort the economy. Thoseengaged in non-market production often argue that not to include it in our measure ofsocietal well-being is to devalue the important services provided by those who areengaged in these non-market activities. An important example may help make the pointstronger. There is a serious omission in the valuation of home-produced goods – thevalue of breast milk. This is clearly within the System of National Accounts productionboundary, is quantitatively non-trivial and also has important implications for publicpolicy and child and maternal health43.
VII. Societal Well-Being
137. The amendments we propose to traditional GDP accounting are incrementalimprovements. They allow us to come closer to what really matters for citizens, theirwell-being, or more generally, the quality of their lives. But while these areimprovements, they leave out much that is important, partly because they focus on the
43. For a good discussion of this issue, cf. Julie Smith and Lindy Ingham, “Mother’s Milk and Measures of Economic Output”,Feminist Economics, Vol. 11, No. 1, March 2005, pp. 41 – 62.
40
REFLECTIONS AND OVERVIEW
present, and partly because well-being has a much broader content. It includes in effectthe full range of factors that make life worth living, reaching beyond its material side.Fortunately, innovations in social science research provide us tools with which we canassess individuals’ sense of their own well-being.
VII-1 Happiness, well-being and quality of life
138. Before beginning our discussion of broader metrics of societal well-being, someclarification is in order. In the public debate, the notions of Happiness, Well-being andQuality of life are used almost as if they were synonymous, but there are somedistinctions that may prove useful. Without entering a semantic debate, it seemed to usfrom the outset that, while all of these notions have a subjective component, some mightbe better suited for measurement. In particular, there is a notion of “quality of life”(described more fully in the Report) that is more suited for measurement and forcomparative assessment. In the discussion below, we will use this term interchangeablywith the term “well-being”.
139. The central problem can be explained in the following way: all approaches to themeasurement of the quality of life based on (marketed) resources (or on people’scommand over commodities) remain limited in important ways. First, many resourcesare not marketed. Second, many of the determinants of human well-being are notresources but aspects of people’s life-circumstances. Lastly, resources are means thatare transformed into well-being in ways that differ across people: those individuals withgreater capacities for enjoyment or greater abilities for achievement in valuabledomains of life may be better-off even if they command fewer economic resources.44
These arguments, by themselves, suggest that metrics based solely on access to orcommand over resources are inadequate metrics for quality of life. Which othermetric(s) should be used for assessing quality of life depends on the philosophicalperspective taken.
140. Recent advances in research have led to new and credible measures. These measures,while not replacing conventional economic indicators, now have the potential to movefrom research to standard statistical practice. While some of these measures reflectstructural conditions that are relatively invariant over time but that differ systematicallyacross countries, others are more responsive to policies and more suitable formonitoring changes over short periods of time. Both types of indicator play importantroles in measuring quality of life.
VII-2 Conceptual approaches to measuring quality of life
141. Three conceptual approaches have drawn the attention of the Commission as useful inthinking about the measurement of quality of life.
142. The first approach, developed in close connection with psychological research, is basedon the notion of subjective well-being. A long philosophical tradition views individualsas the best judges of their own conditions. (This approach is closely linked to the
44. To link this discussion with that of the preceding section: some individuals may be more efficient in “home production,”others in market-production.
The Measurement of Economic Performance and Social Progress Revisited
41
utilitarian tradition but has a broader appeal due to the strong presumption, in manystreams of ancient and modern culture, that enabling people to be “happy” and“satisfied” with their life is a universal goal of human existence.)
143. The second approach is rooted in the notion of capabilities. This approach conceives aperson’s life as a combination of various “doings and beings” (functionings) and of hisor her freedom to choose among these functionings (capabilities). Some of thesecapabilities may be quite elementary, such as being adequately nourished and escapingpremature mortality, while others may be more complex, such as having the literacyrequired to participate actively in political life. “In contrast with the utility-based linesof thinking, individual advantage is judged in the capability approach by a person’scapability to do things he or she has reason to value. A person’s advantage in terms ofopportunities is judged to be lower than that of another if she has less capability – lessreal opportunity – to achieve those things that she has reason to value.45” It is why thecapability approach is focusing on freedom.
144. The third approach, developed within the tradition of welfare economics, weights thevarious non-monetary dimensions of quality of life (beyond the goods and services thatare traded in markets) in a way that respects people’s preferences. Welfare economicshas traditionally relied on the notion of “willingness-to-pay” to extend the scope ofmonetary measures to non-market aspects of life. But evaluations based on totalwillingness-to-pay may disproportionately reflect the preferences of those who arebetter-off in society. The “fair allocations approach”46 tries to overcome this weaknessof traditional welfare economics by explicitly referring to equity criteria. We use thatterminology below.
145. These approaches have obvious differences, but also similarities. All these approachespoint to the importance of a number of features for quality of life that go beyondcommand over resources. Measuring these aspects of well-being or quality of liferequires the use of types of data (i.e. responses to questionnaires and non-marketobservations of personal states) that are not captured by market transactions.
VII-3 Subjective measures of quality of life
146. In recent years, much research has focused on what people value and how they act inreal life. A significant part of this research has been undertaken by psychologists andeconomists based on subjective data on people’s reported or experienced well-being.
147. Subjective measures have always been part of the traditional tool-kit of economists andstatisticians, as many features of our economies and societies (e.g. unemployment) aremeasured through people’s responses to a standard set of questions. (Not working is anobjective statistic; but to be unemployed, one has to be “not working, but seekingemployment”; seeking employment is typically a subjective statement, not based onparticular actions, such as filling out an application form.) The specific feature of the
45. Amartya Sen, The Idea of Justice, op.cit.46. Cf. Kolm S.C. 1972, Justice et équité, Paris: Ed. du CNRS. Translated as Justice and Equity, Cambridge, Mass.: MIT Press,
2000. Cf. also the survey on the theory of fair allocations by Thomson W., H. Varian 1985, “Theories of justice based onsymmetry”, in Hurwicz, Schmeidler, Sonnenschein (eds.): Social Goals and Social Organizations (pp. 261–289).Cambridge, UK: Cambridge University Press.
42
REFLECTIONS AND OVERVIEW
subjective measures of quality of life discussed here is that what people report abouttheir own conditions has no obvious objective counterpart: we can compare “perceived”and “actual” inflation, for example, but only respondents can provide information ontheir own subjective states and values. Despite this feature, a rich literature on thesesubjective measures concludes that the results of these studies are replicable and theyhelp predict people’s behaviour.
148. Subjective approaches distinguish between the dimensions of quality of life (i.e.people’s subjective experiences and their evaluations) and the objective factors shapingthem. They focus on the subjective dimensions of quality of life, which encompassseveral aspects. The most important of these are: a) people’s evaluations, either of theirlives as a whole or of life’s various domains, such as family, work and financialconditions; b) people’s actual feelings, such as pain, worry and anger, or pleasure, prideand respect. Within this second broad category of people’s feelings, the research onsubjective well-being distinguishes between positive and negative affects, as both maycharacterize the experience of each person.
149. All these aspects of subjective well-being (cognitive evaluations, positive and negativeaffects) should be measured separately to get a satisfactory appreciation of people’slives. Subjective measures of people’s life-evaluations and affects provide measures ofquality of life that can be monitored over time; some of these measures can also becompared across countries in reliable ways. The interest of these measures is that theyprovide information beyond that conveyed by income. For example, younger and olderpeople in most developed countries report higher evaluations of their lives than prime-age people, a pattern that contrasts sharply with that for income.
150. One point where various subjective measures of people’s well-being agree is thatunemployment has a very adverse effect on people’s quality of life. People who becomeunemployed report lower life-evaluations, even after controlling for their lower income.The adverse effects persist over time. The unemployed also report higher prevalence ofvarious negative affects (sadness, stress and pain) and lower levels of positive ones(joy). One may also suspect that the adverse effects of unemployment are felt even bythose who are not themselves unemployed, especially in societies where there is highunemployment. These subjective measures suggest that the costs of unemploymentexceed the income-loss suffered by those who lose their jobs, reflecting the existence ofnon-pecuniary effects among the unemployed, and of fears and anxieties generated byunemployment in the rest of society.
151. These important advances in the measurement of subjective well-being are largely theresult of the efforts of individual researchers and commercial data providers. But thesedata remain limited in terms of the statistical inferences that they allow. Nationalstatistical systems need to build on these efforts, and incorporate questions on variousaspects of subjective well-being in their standard surveys.
VII-4 Objective features shaping quality of life
152. Both the capability and the fair allocation approaches give prominence to the objectiveconditions and opportunities available to people. Both of these conceptual approachesregard an expansion of people’s opportunities in these domains as intrinsically
The Measurement of Economic Performance and Social Progress Revisited
43
important for people’s lives. Future research should help clarify the role played by theseobjective features in subjective well-being, and might contribute to the critical task ofan assessment of the relative weights to be associated with different factors.
153. The range of objective features to be considered in any assessment of quality of life willdepend on the purpose of the exercise. In general, all these measures highlight that howsocieties are organized makes a difference for people’s quality of life, and that theirinfluences are not all captured by conventional measures of the associated economicresources.
a. Health
154. Health is a basic feature shaping both the length and the quality of people’s lives. Itsassessment requires good measures of both mortality and morbidity. Data gaps remainsignificant in both fields. Mortality statistics by age and gender document the risk ofdeath confronting people and are used to calculate the expected length of a person’s life.These indicators are today available in all developed countries but remain limited inlarge parts of the developing world, in particular for adults, and this limits thepossibility of monitoring progress in achieving the UN Millennium DevelopmentGoals.
155. The state of advancement is far more limited for statistics on morbidity, a situation thathas led to long-standing disagreements on whether or not declines in mortality havebeen matched by similar declines in morbidity. Existing measures of morbidity rest on avariety of sources: records of peoples’ height and weight; diagnostics from healthprofessionals; registers for specific diseases; and self-reports drawn for censuses andsurveys. The variety of measures and underlying data is inevitable given the manymanifestations of poor health, but is also a real obstacle to comparing countries andmonitoring changes in people’s health status over time. Measures are even sparser whenmoving from physical to mental disorders, despite evidence that these affect (at least inmild forms) a large share of people, that most of these disorders go untreated, and thattheir incidence has been increasing in some countries.
156. The variety of dimensions of people’s health has led to several attempts to define asummary measure that combines both mortality and morbidity. Several combinedindices of people’s health exist, but none currently commands universal agreement.
157. There are large differences in health outcomes as well as in access to those factors(including resources) that affect health outcomes. National statistics that simplydescribe average outcomes accordingly provide an inadequate description of a country’shealth status, and are an incomplete basis for making comparisons over time or acrosscountries, or for assessing either the extent of social progress or economic performanceeven in this limited dimension.
b. Education
158. A long tradition of economic research has stressed the importance of education inproviding the skills and competencies that underpin economic production. Buteducation (like health) matters for quality of life independently of its effects on people’searnings and productivity. Education is strongly associated with people’s life-
44
REFLECTIONS AND OVERVIEW
evaluations even after controlling for their higher income. Further, better-educatedpeople typically have better health status, lower unemployment, more socialconnections, and greater engagement in civic and political life. The consensus is thateducation brings a range of returns (monetary and non-monetary) that benefit both theperson investing in education and the community in which they live. Measuring the sizeof these wider benefits of education is an important research priority.
159. Available educational indicators cover a broad range of fields. Some refer to inputs (e.g.school enrolment, educational expenditures and school resources), others refer tothroughputs and outputs (e.g. graduation rates, number of completed years of schooling,standardized test measures of people’s achievements in terms of literacy and numeracyor other cognitive skills). Which of these indicators is more relevant depends on thestage of development of each country and on the goal of the evaluation exercise. Theavailable indicators highlight large differences across countries, with various differenteducational indicators sometimes highlighting contrasting patterns. Within countries,measures of inequalities in learning outcomes are especially important for youth at thebottom of the achievement scale and who are at risk of poverty and exclusion from well-paid and rewarding jobs in adult life. As education is an important predictor of manydimensions of people’s lives, all social surveys should systematically includeinformation on the learning experiences of respondents and of their parents, as well asinformation on other features that would enable a better assessment of the role ofeducation in shaping the quality of life.
c. The balance of time
160. How people spend their time, and the features of people’s personal activities, matter forquality of life irrespectively of the income that they generate. They affect people’ssubjective well-being. The main activities discussed here are paid work, commuting,unpaid work and leisure time. Housing, although not representing an activity per se, isalso discussed because it is the setting for a number of personal activities and because ofits importance for the quality of life.
161. Paid work matters for quality of life not just because it generates income with whichother material goods are purchased, but also because it provides identity to people andopportunities to socialize with others. Not all jobs are equally valuable in this respect,and this underscores the importance of collecting more systematic information on thequality of paid work, as is being done in the context of ongoing research on “decentwork” pursued by a number of international organizations. Some national surveysprovide information on many aspects of the distance between work and decent work,such as precarious employment, gender gaps in employment and wages, discriminationin the workplace, etc. Their practical use is, however, limited by their small sample sizeand by differences in the survey design across countries.
162. Commuting time is also a key feature of the quality of work, and its monitoring requiresinformation on the number of hours spent travelling to and from work, as well as on theaccessibility, quality and affordability of public transportation systems.
163. Unpaid domestic work, such as shopping and the care of children and other householdmembers, is important from the perspective of assessing both the total amount ofhousehold services produced and how family chores are distributed between men and
The Measurement of Economic Performance and Social Progress Revisited
45
women. As we noted earlier, changes in technology may affect not only the productivityof domestic work, but also the quality of the work experience. Certain activities, such ascooking, depending on how they are conducted and the circumstances under which theyare conducted, may contribute either negatively or positively to a sense of well-being.
164. A long tradition of research has emphasized the importance of leisure-time for qualityof life. This points to the importance of developing indicators of both its quantity(number of hours) and quality.
165. Finally, despite the importance of housing for a variety of social outcomes (such aschildren’s education), no core set of housing indicators currently exists for internationalcomparisons: remedying this situation would require better information on the numberof people who are homeless or living in emergency shelters, and on housing quality(e.g. in terms of overcrowding and the availability of local services).
166. In several cases, suitable indicators in these various fields already exist, and thechallenge is to improve upon what has been achieved in the past and to systemize thecollection and analysis of data so that meaningful comparisons can be made acrosscountries and over time. In other areas, however, existing measures remain seriouslydeficient, and progress requires investment in new statistical capacity. A case in point,cutting across all the activities described above, is that of measuring how people spendtheir time and their subjective experiences with various activities. Time is the naturalmetric for comparing personal activities, and one priority should be to developmeasurement tools grounded on clear definitions and based on surveys with a consistentdesign, representative of patterns over a full year, and undertaken with sufficientregularity (all being requirements that are not often met). These surveys should provideinformation about both the amount of time spent in various activities and the enjoymentthat they provide.
VII-5 Political voice and governance
167. Political voice is an integral dimension of the quality of life. Intrinsically, the ability toparticipate as full citizens, to have a say in the framing of policies, to dissent withoutfear and to speak up against wrong are essential freedoms and capabilities.
168. The opportunities for expression and the degree of responsiveness of the politicalsystem depend on the institutional features of each country, such as the presence of afunctioning democracy, universal suffrage, a free media, and civil society organizations.This also depends on some key aspects of governance, such as legislative guaranteesand the rule of law. Legal guarantees require effective implementation, which dependson how various institutions (e.g. the police, the judiciary and various administrativeservices) function, whether they are free from corruption, political interference andsocial prejudice, and whether they can be held accountable for their decisions.
169. Comparisons based on existing indicators of political voice, legislative guarantees andthe rule of law highlight vast differences between countries, especially between thosewith a long history of democratic functioning and those that have moved fromauthoritarian to democratic regimes only more recently and that have not yet establishedthe full range of freedom and rights. Even in the developed world, however, low trust in
46
REFLECTIONS AND OVERVIEW
public institutions and declining political participation point to a growing gap in howcitizens and political elites perceive the functioning of democratic institutions.
170. Indicators of political voice and democratic governance should help evaluate thefunctioning of multiparty democracy and universal suffrage, the degree ofdecentralization in government decisions and the sense of participation have in thedecisions being made, the presence of a free media and various freedoms (e.g. to formand join civil organizations, trade unions and professional bodies, or to participate incivic and social activities). Relevant indicators should cover the rights embedded inconstitutions, laws, international covenants on human rights and basic freedoms, as wellas the functioning of the judicial system. Indicators of many of these aspects aretypically compiled by bodies outside the boundaries of national statistical systems andare mainly based on the opinion of experts. These indicators need to be complemented,and in some cases replaced, by surveys on citizens’ own perceptions about thefunctioning of political, legal and executive institutions, the difficulties they face inaccessing them, and the trust that they place in them. Such surveys also need to captureinequalities in access to these institutions across socio-economic groups.
VII-6. Social connections
171. Social connections improve quality of life in a variety of ways. The effects are bothdirect and indirect. People with more social connections report higher life-evaluations,and for many the most pleasurable personal activities involve socializing. The benefitsof social connections extend to people’s health and to the probability of finding a job, aswell as to various characteristics of the neighbourhood where people live (e.g. crime orthe performance of local schools). These social connections are sometimes described as“social capital” to highlight the benefits (direct and indirect) that they bring.
172. The drivers of changes in people’s social connections are not always well understood,and should be an important arena of research. Developments within markets as well ascertain government policies may have reduced the ties of individuals with theircommunity. What is clear is that a decline in these ties may negatively affect people’slives, even when certain of the “economic” functions associated with these social tiesare taken up by market or government alternatives, and even when these alternativesincrease the level of (measured) economic activity (as in the case where the informalsurveillance of neighbours is replaced by salaried security guards, or when family“insurance” is replaced by market insurance).
173. Research on social connections has traditionally relied on proxy measures, such as thenumber of associations to which each person belongs, or the frequency of activitiesassumed to result from social connections (e.g. altruistic behaviour and voter turn-out).However, it is by now accepted that these are not good measures of social connections,and that reliable measures require surveys that inform about peoples’ behaviours andactivities. In recent years, a number of statistical offices (in the United Kingdom,Australia, Canada, Ireland, the Netherlands and, most recently, the United States) havestarted surveys that measure various forms of social connections, such as civic andpolitical engagement, membership and voluntary work in various organizations,relationship with neighbours and family members etc. Similar surveys should beimplemented elsewhere, based on questions and protocols that allow valid comparisons
The Measurement of Economic Performance and Social Progress Revisited
47
across countries and over time. Progress should also be made in measuring additionaldimensions of social connections (such as trust in others, social isolation, availability ofinformal support in case of need, engagement in the workplace and in religiousactivities, friendship across lines of race, religion and social class), building on theexperience already accumulated by some countries in these fields.
VII-7. Environmental conditions
174. Environmental conditions are important not only for sustainability, but also because oftheir immediate impact on the quality of people’s lives. First, they affect human healthboth directly (through air and water pollution, hazardous substances and noise) andindirectly (through climate change, transformations in the carbon and water cycles,biodiversity loss and natural disasters that affect the health of ecosystems). Secondly,people benefit from environmental services, such as access to clean water andrecreation areas, and their rights in this field (including rights to access environmentalinformation) have been increasingly recognized. Third, people value environmentalamenities or disamenities, and these valuations affect their actual choices (e.g. of whereto live).
175. Measuring the effects of environmental conditions on people’s lives is, however,complex. These effects manifest themselves over different timescales, and their impactsvary depending on people’s characteristics (e.g. where they live and work, theirmetabolic intake).
176. Much progress has been achieved in the last two decades in terms of measuringenvironmental conditions. However, from a quality-of-life perspective, existingindicators remain limited in important respects: for example, indicators of emissionsmainly refer to the aggregate quantities of various pollutants, rather than to the share ofpeople exposed to dangerous doses. Existing indicators should hence be supplementedby regular monitoring, for instance, the number of premature deaths from exposure toair pollution; the number of people lacking access to water services and to nature; orthe number who are exposed to hazardous levels of noise and pollution, etc. In addition,more work is needed to relate changes in environmental indicators to changes in well-being.
VII-8. Personal insecurity
177. Assessing personal insecurity requires identifying those external factors that put at riskthe physical integrity of each person: crimes, accidents, and natural disasters are someof the most obvious factors. While these elements account for only a minority of alldeaths, and they are captured by general mortality statistics, the rationale for havingspecific measures of their frequency is that they can have a different emotional effectthan deaths related to medical conditions. The importance of these sources of insecurityon people’s subjective well-being is reflected both in their efforts to avoid physicalinsecurity and the large impacts of bereavement on subjective well-being.
178. Manifestations of personal insecurity affect quality of life for a large number of people,with even larger numbers reporting fears of being a victim of a physical aggression. Themost remarkable feature of these reports on subjective fears is how little they are related
48
REFLECTIONS AND OVERVIEW
to experienced victimization: countries with a higher share of people reporting fear ofcrime do not have a higher frequency of experienced victimization while, withincountries, older and richer people feel more unsafe than younger and poorer people,despite being less likely to be a victim of crime.
179. These patterns highlight the importance of developing more regular and reliablemeasures of personal security to orient public discussions. Victimization surveys are anessential tool. But other tools need to be mobilized to assess the importance of otherthreats to personal security, such as domestic violence and violence in countries ravagedby conflicts and wars.47
VII-9. Economic insecurity
180. Uncertainty about the material conditions that may prevail in the future reflects theexistence of a variety of risks, in particular associated with unemployment, illness, andold age. The realization of these risks has obvious negative consequences for the qualityof life of the person affected.
181. Job loss can lead to economic insecurity when unemployment is recurrent or persistent,the replacement rate is low, and workers have to accept major cuts in pay, hours or bothto find a new job. The consequences of job instability are both immediate (asreplacement income is typically lower than the earnings on the previous job) and longerterm (due to potential losses in wages when the person does find another job). Whileindicators of these consequences are available for some countries, cross-countrycomparisons are difficult, requiring special investments in this direction. Fears of jobloss can have negative consequences for the quality of life of each worker (e.g. physicaland mental illness, tensions in family life), for firms (e.g. adverse impacts on workers’motivation and productivity, lower identification with corporate objectives) and forsociety as a whole.
182. Illness can cause economic insecurity both directly, through the medical costsassociated with it, and indirectly, through the loss of income due to inability to work.One indicator of economic insecurity due to illness is provided by the share of peoplewithout health insurance. However, health insurance can cover different contingencies,and even insured people may incur high out-of-pocket health expenses in the event ofillness.
183. Old-age is not a risk per se, but it can still imply economic insecurity due to uncertaintyabout the needs and resources that will be available after having withdrawn from thelabour market. Two types of risk, in particular, are important. The first is the risk ofinadequate resources during retirement, due to insufficient pension payments in thefuture. Even when there is no risk associated with the pension amounts, there may beuncertainty about the adequacy of pension payments when they are not indexed toinflation. And even when they are inflation-indexed, if well-being is affected by relativeincome then when incomes of workers are rising rapidly, the aged may feel a risk ofrelative deprivation. The second is the risk of volatility in pension payments: while all
47. This is an example where the collection of objective data might actually affect individual perceptions, and therefore theresense of well-being.
The Measurement of Economic Performance and Social Progress Revisited
49
retirement-income systems are exposed to some types of risk, the greater role of theprivate sector in financing old-age pensions and the consequent shifting of risks fromgovernment and firms towards individuals has led to increasing the volatility of pensionpayments.
184. A comprehensive measure of economic insecurity would ideally account for both thefrequency of each risk and its consequences, and some attempts in this direction havebeen made. A further problem is that of aggregating across the various risks that shapeeconomic insecurity, as the indicators that describe these risks lack a common metric toassess their severity.
VII-9. On the interdependence of the various dimensions of quality of life
185. Most of the measurement challenges described above are specific to each feature ofquality of life, and the Commission has only hinted at some of the work required,leaving it to future work in each field to detail a concrete action plan. Other challengesare, however, cross-cutting and unlikely to be picked up through initiatives separatelyundertaken in each field. Three of these issues deserve special attention.
Assessing links across quality of life dimensions
186. The first cross-cutting challenge is to better assess the relationship between the variousdimensions of quality of life. Some of the most important policy questions for quality oflife relate to how developments in one area (e.g. education) affect developments inothers (e.g. health status, political voice and social connections), and how developmentsin all fields are related to those in income. In effect, ignoring the cumulative effects ofmultiple disadvantages will provide an inaccurate assessment of the extent of certainsocial problems, possibly leading to sub-optimal policies: for example, if the loss inquality of life of being both poor and sick far exceeds the sum of the two separateeffects, governments may need to target their interventions more on those who cumulatethese disadvantages.
187. Assessing these links across various dimensions of quality of life will not be easy, asstatistical systems continue to be highly segmented across disciplines. But progress canbe achieved by developing information on the “joint distribution” of the most salientfeatures of quality of life (such as health status, education, political voice, etc.). acrossall residents in a country. Concrete steps in this direction could be accomplished byincluding in all surveys a few standard questions that allow classifying respondentsbased on a limited set of characteristics that describe their conditions in a broad range offields.
b. Inequalities in quality of life
188. The second cross-cutting challenge is to develop indicators of quality of life thatprovide information about the inequalities in individual conditions in the variousdimensions of quality of life rather than just about the average conditions in eachcountry. When combined with work on the linkages across “conditions” we can obtainbetter assessments of the extent of inequalities in quality of life.
50
REFLECTIONS AND OVERVIEW
189. While established methodologies and data sources could allow measuring inequalitiesin the distribution of economic resources in a fairly reliable way, the situation is muchless satisfactory with respect to non-monetary dimensions of quality of life.
190. The problems, however, go deeper than developing suitable measures. There are manytypes of inequalities, and each of them is significant in itself: this suggests that weshould avoid the presumption that one of them will always encompass all others. At thesame time, because of the links among dimensions, various types of inequalities maystrengthen each other. Gender disparities, for example, while pervasive in mostcountries and groups, are typically much larger for households with lower socio-economic status: the combined effect of gender and socio-economic inequality is oftento exclude young women from poor households from attending school and gettingrewarding jobs, denying them possibilities of self-expression and political voice, andexposing them to hazards that put at risk their health.
191. There exists a wealth of interesting research on inequality and deprivation indimensions other than material resources, and much has been written on the role ofcomposite indicators. For instance, Mackenbach (2006) points out that between-groupdifference are especially important in the case of health. In all countries around theworld, people with lower education, lower income and from lower occupational classestend to die at younger ages and to have, within their shorter lifetimes, a higherprevalence of different health problems. In European countries, the mortality rates ofless-educated men are, on average, 50% higher than those of more-educated men, whilethe difference is 30% for women48. A 2006 OECD study on education highlights themagnitude of the differences in within education: the test scores (in science) of studentsaged 15 in France were around 146 points higher at the top quarter of the achievementscale than at the bottom quarter, a difference equivalent to almost 4 years ofschooling49. With respect to composite indicators, detailed surveys of the manyinitiatives in this area are provided by Afsa et al. (2008) and Gadrey and Jany-Catrice(2007)50.
192. Building on this work, it is critical that inequalities be assessed in a comprehensive way,by looking at differences in quality of life across people, groups and generations.Further, as people can be classified according to different criteria, each with somerelevance for the quality of people’s lives, inequalities should be measured anddocumented for a plurality of groups. Appropriate surveys should be developed toassess the complementarities between the various types of inequalities, and to identifytheir underlying causes.
c. Aggregating across quality-of-life dimensions
193. The third challenge to quality-of-life research is that of aggregating the rich array ofmeasures in a parsimonious way. The search for a scalar measure of quality of life is
48. Mackenbach, J. P., “Health Inequalities: Europe in Profile”, UK Presidency of the EU, February 2006.49. OECD, “Programme for International Student Assessment” (2006).50. Afsa, C., Blanchet, D., Marcus, V., Mira d’Ercole, M., Pionnier, P.A., Ranuzzi, G., Rioux, L. and Schreyer, P. (2008),
“Survey of existing approaches to measuring socio-economic progress”, background paper for the first meeting of theCMEPSP, Paris, April 2008. Gadrey, J. and Jany-Catrice, F. (2007), “Les nouveaux indicateurs de richesse”, 2nd edition,Repères-La Découverte, Paris.
The Measurement of Economic Performance and Social Progress Revisited
51
often perceived as the single most important challenge in this field. While this emphasisis partly misplaced – there are still important challenges in the construction of each ofthe indices, and the information content of any aggregate index will always reflect thequality of the measures used in its construction – there are important reasons to attemptto construct aggregate metrics.
194. Traditionally, the most common response to these demands for parsimony has been toaggregate a number of indicators (suitably selected and scaled) of average performancein various fields at the country-level. The best example of this approach is the HumanDevelopment Index. This measure has played an important information andcommunication role, leading to country-rankings that differ significantly from thosebased on per-capita GDP, especially for some less developed countries. However, allchoices on the weights used to construct this (and other similar indices) arecontroversial – they are either arbitrary or reflect value judgments on which there is notbroad consensus. More fundamentally, many such indices (including the HDI) ignorethe distribution of individual conditions within each country and the linkages amongconditions. As a result, the combined country-wide index will not change if averageperformance in each domain remains the same while the correlation of individualconditions across domains declines.
195. Several aggregate measures of quality of life are possible, reflecting the variousconceptual approaches discussed. Some of these measures are already being used (e.g.average levels of life satisfaction51 for a country as a whole). Others could beimplemented if national statistical systems made the necessary investment to collect andmake public the type of data needed to allow their computation.
Concluding remarks
196. It is clear that individual’s sense of well-being is affected not just by their materialgoods (appropriately measured and valued), but by many other factors, some of whichwe have called attention to earlier in this overview. For some of these, there may existobjective metrics, but for others, subjective assessments may provide the best approachto measurement. Individuals may, for instance, be affected by their sense of security,and by their bonds with others. But even the seemingly non-economic factors areaffected by economic structures. Reforms in the workplace may lead to increasedmarket efficiency, but lower worker job satisfaction, and therefore a reduction in theirsense of well-being. One of the criticisms of globalization (in the way it has proceeded)is that it has contributed to the weakening of a sense of community.
197. Moreover, it is important to understand more fully the links between various measuresof market and non-market activity and of leisure and these quality-of-life metrics. It isnot clear how well the relative marginal contributions of various goods and services towell-being correspond to market prices.
198. This work is just at its beginning stage, and yet the results obtained so far are extremelypromising. Replicable measurement is possible.
51. Data on life-evaluations have been collected in several representative surveys. In several cases (e.g. various waves of theWorld Values Survey), these measures are based on qualitative responses, such as feeling “quite” or “fairly” happy withone’s life, or on other scales that assess life satisfaction.
52
REFLECTIONS AND OVERVIEW
VIII. Sustainability
199. Until now we have been concerned with the measurement of the “present”, whether inquantitative or in qualitative terms – how, for instance, certain market or non-marketactivities today affect the sense of well-being today. But our Commission aims at goingbeyond the measurement of individual and societal well-being today, moving thehorizon towards the long run. What is missing in our information set to be tranquilabout the future? The answer is obviously our capacity to assess the sustainability of ourpresent situation and more generally of the economic, social, political andenvironmental context in which we live.
VIII-1 What does sustainability mean?
200. Sustainability is a concept which by definition has a long-term dimension.Sustainability refers, in a broad sense, to the notion of the durability and stability ofdynamic processes in the long run. Concern for the sustainability of economicdevelopment can be traced back at least as far as Malthus’ famous population principle.Long before the Club of Rome, the classics were predicting that the world will becharacterized in the long run by stagnation (zero growth), and though some of thereasons for their gloom differed, these analyses were generally based on the fact of thefiniteness of the world.
201. More recently, the Brundtland Commission (1987) has popularized the definition ofsustainable development as “development that meets the needs of the presentgenerations without compromising the ability of the future generations to meet theirown needs”. This definition implicitly mixes social, environmental and economiccomponents of present and future well-being. But while the Brundtland report had thegreat merit of underlining from the outset that sustainability was a multidimensionalphenomenon, it did not offer any precise evaluation of these components. It was, in thissense, both too general and too abstract.
202. The plea for sustainable development has been sounded so repeatedly in politicaldiscourse that sometimes it seems to have lost credibility, not only because actions didnot follow promises, but because the meaning of the concept was so fuzzy that everyonewas free to understand it according to their own interpretation.
203. At the micro level, sustainability means that individuals and/or families think that thefuture for them and their children and grandchildren will be better than the past, or atleast not worse than the present. This positive expectation not only contributes to thecurrent generation’s sense of well-being, but also has consequences for the nature ofsociety. It has been argued, for instance, that when most families hold such hopes,society becomes more tolerant, fairer, and more supportive of democracy52. Theopposite occurs when an economic evolution proves to be unsustainable. Fear of thefuture generally leads to the development of protectionist attitudes, “beggar myneighbour” policies, and anti-immigrant sentiments. None of this should come as asurprise: precariousness, which is the converse of sustainability, is an impediment to a
52. Cf. Benjamin Friedman, The Moral Consequences of Economic Growth, Alfred A. Knopf, 2005.
The Measurement of Economic Performance and Social Progress Revisited
53
good life. Hence social progress, which is the thing people really care about, goes handin hand with sustainability. This is why it is essential to attempt to develop a metric toaccount for it, however imperfect such a metric may be.
204. Whatever measure we devise, we have to recognize that it will be grounded on ourpresent imperfect knowledge of the future. Even high levels of consumption of naturalresources might be sustainable, if there is rapid enough technological progress.
205. Even if there are doubts about the precise or best measure, doubt does not justifyparalysis, and for the reasons set out above, there is some urgency to come up with ameasure or a set of measures of sustainability.
206. The literature gives many different definitions of sustainability. A very simple butnatural formulation is the following: Assume that C is the current state of consumption,and W(C) is the wealth that is required to sustain that level of consumption forever.Then consumption is weakly sustainable if the wealth bequeathed to the next generation(time period) exceeds W(C). There is a more demanding concept of sustainability thatfocuses not just on the level of consumption but also on its rate of growth. If C is aconsumption path – defined not just by the level of consumption but by its rate ofgrowth and if current resources are not sufficient to sustain that consumption path, thenthe consumption path is not sustainable. The worry today is that, because of thefiniteness of our world, even sustainability in the weak sense might not be assured. Thisworry is grounded on the concern that while the stock of some resources are increasing(physical capital), these cannot compensate for the diminution of the stock of others—in particular key environmental resources.
207. Much of the literature focuses the degree of substitutability between the differentcomponents of wealth. The “weak” approach to sustainability considers that increasesin physical capital and/or human capital can compensate for losses in natural wealth, i.e.that there always exists a positive degree of substitutability. This allows a globalassessment of sustainability using a single measure of “wealth”. “Weak” here meansthat the requirement for sustainability is not too demanding, as it implies that asufficiently high pace of technical progress or savings is all that is needed to ensuresustainability. The “strong” approach argues that sustainability requires separatelymaintaining the quantity or quality of many different environmental resources. It ismotivated by a concern that we may not be able, for instance, to deal with the worseningof the atmosphere by increases in the amounts of physical capital, or more generally,that even if we could, there is a high degree of uncertainty about the trade-offs, so muchso that it is worth focusing on each of the key resources separately. Following this uptherefore requires large sets of separate statistics, each pertaining to one particularsubdomain of global sustainability.
VIII-2 On some complexities in measuring sustainability
208. 201. In principle, the most direct (and comprehensive) way to measure well-being in thelong run is “simply” to add future consumption to current consumption – weighed bythe appropriate marginal valuations (just as we add up the consumption of oranges andapples), to get an appropriate long-run metric. If we followed that approach, we wouldfocus on “consumption” in each period, not on broader measures of national output,
54
REFLECTIONS AND OVERVIEW
which include investment. Investment is an intermediate good – an input into theproduction of consumption in future years. In this approach, the critical decision is theweight to attach to future consumption, that is the “discount rate”, which measures theextent to which future consumption gets less weight than current consumption.53, a kindof measure of the depreciation of the future.
209. 202. In this approach, if future feasible consumption is less than the current level, it isobvious that the current level is not sustainable. If it exceeds the current level, it isobvious that the level is sustainable.
210. There are some problems with this approach, quite apart from the fact that, as we haveseen above, the standard statistical apparatus may give a partial measure of totalconsumption. A critical difference between consumption today and that in future yearsis that we know today’s consumption, while we can only form expectations concerningfuture consumption. Economists traditionally have a way around this problem: they turnto the market to assign values, just as they do contemporaneously; the value of an assetis the expected present discounted value of the dividends (returns) that it yields. Thus,by looking at asset values, we can estimate the value of (expected) future consumption –or at least that part of future consumption that will be generated by our land, physicaland human capital and other resources.
211. Recent events have cast doubt (for those who previously did not have such doubts) onthe extent to which the current market prices of assets provide good assessments.
212. Risk itself poses considerable complexity in interpreting what we should mean bysustainability. Assume that there is uncertainty about the future rate of technologicalprogress. Should sustainability require that we have a 99% probability of continuingcurrent levels of consumption? A 99.9% probability? If we impose a very highprobability, we would force the current generation to sacrifice current consumption forfuture generations, who almost surely will be much better-off.54 Again, we often rely onmarket risk assessments. But the current crisis has again highlighted the risk of doingso. The market may overestimate the ease with which physical capital can substitute forthe loss of natural capital, and as a result, may assign too low of a probability to the riskthat current levels of consumption are not sustainable. This is belabouring the obvious,as markets are certainly not as far-sighted as to account for what may happen in two orthree generations! Can we do better than the market? That is almost a philosophicalquestion which can be answered, considering the deep uncertainty surrounding theissue, only by political decisions based on some form of consensus. Besides, what is ofconcern is the well-being of future generations. This is an issue of intertemporal equity,and interest rates are of limited relevance in providing guidance on this issue.55 Makingmatters worse is that markets for key environmental variables (like “carbon”) do notexist, and the dramatic change in prices that might occur were appropriate social prices
53. The appropriate discount rate has been one of the critical issues under debate in the environmental literature. It is morerelevant for discussions of policy than the issues upon which the Commission focuses. Those who believe that we shoulddiscount future consumption at a high rate typically are simply not concerned with sustainability: the loss of well being offuture generations is outweighed by the gains to the present generation.
54. Further complexities are added to interdependencies: in the circumstances in which climate change turns out to be worsethan expected, much of the capital stock may turn out to be in the wrong place (e.g. under water).
55. There are some extreme cases—infinitely lived individuals, or finitely lived individuals with perfect altruism—in whichmarket prices would be of relevance; but these assumptions have little to do with the world in which we live.
The Measurement of Economic Performance and Social Progress Revisited
55
imposed might have large impacts on current values of interest rates and the relevantrisk premia.
213. Still, it is important for any society to form an assessment, no matter how imperfect,about whether its current consumption or well-being is sustainable, and whether this iscoming at the expense of future generations.56 We can ascertain whether a society’swealth is increasing or decreasing (per capita). If (appropriately measured) it isincreasing, then presumably society can do in the future whatever it did today, i.e. it cansustain its per-capita income. But we need a comprehensive measure of wealth, and weneed to be sure that the valuations are correct. A comprehensive measure obviouslyincludes measures of physical capital, human capital and natural capital (including theenvironment). Changes in capital include those arising from investment in plant andequipment, education, the depletion of natural resources, depreciation of physicalcapital, and environmental degradation.
214. Accordingly, we believe that a good system of national accounts should report both alevel of consumption and a comprehensive measure of the change in wealth {C, ΔW}.The task is difficult, because many components of wealth are not measured at all (i.e.human capital) or are often ill-measured.
215. The current crisis highlights the problem of relying on market prices for the valuation ofwealth. Net wealth as measured was increasing in periods prior to the crisis, but thatwas the consequence of a market failure. Private debt was increasing, but according tothe market, asset prices were increasing at a faster pace. A reliance on market priceswould have led to the conclusion that the high levels of pre-crisis consumption in manycountries were sustainable. The revaluation of wealth that occurred subsequentlyshowed that they were not. The ongoing controversy over mark to market accountingshows that today, even ardent advocates of markets have lost faith in their valuations, atleast in the short run. The difficulty is finding an alternative.
216. Market prices fail to provide accurate and reliable estimates of the expected presentdiscounted value of future consumption (returns) not just because of the irrationalexuberance and pessimism to which markets are prone. Market prices may be highlydistorted, for instance, at one time putting too low a price on risk, and at another toohigh a price.
217. The most serious distortions in market prices arise out of the failure to price scarceenvironmental resources. The market today assigns no or a low price to carbonemissions, and yet there is a broad scientific consensus that there is a real scarcity value.The world is rapidly using up the available global “carbon space”, but those who areusing it are not being charged. The result is that the prices of all goods and services thatmake use of this carbon space – essentially all goods and services – are being distorted.
56. What is relevant, of course, is not just the level of aggregate consumption, but also particular policies. There is, for instance,concern that America’s health care system is unsustainable, in the sense that it seems to require an ever-increasing share ofGDP. Some economists use forecasts of future prices to estimate the necessary taxes that would have to be levied to sustainit, or, in the absence of additional taxes, the magnitude of the debt. One has to be careful, however, using such naïveextrapolations. Something will have to adjust – the policies are correctly identified as “non-sustainable”. But it is probablywrong to infer that expenditures will simply increase in the way forecast. There are limits to the share of GDP that a societywill be willing to devote to medical care.
56
REFLECTIONS AND OVERVIEW
218. We need to take a comprehensive approach to the measurement of wealth, including allassets and all liabilities. Liabilities include the costs of future waste disposal andrepairing environmental damage.
219. These adjustments for changes in wealth are even more important when it comes toresource-dependent countries. Their stock of resources is being depleted, and theirwealth is increasing only if the proceeds are being reinvested, whether in physical,human or financial capital.
220. While national income accounts have long taken account of the depreciation of physicalcapital, there are serious problems in the measurement of depreciation (none of thestandard methodologies correspond to the theoretical construct of true economicdepreciation), and these problems may have become more serious, as we noted earlier,with increases in the pace of innovation and the consequence increases in the rate ofobsolescence.
221. One commonly used measure of net national income entails simply adding up (withappropriate prices) consumption and the change in wealth. “Green” measures of GDP/NDP/NNP subtract from the standard measures the value of the depletion of naturalresources and environmental degradation. While such extensions are a move in the rightdirection, they typically do not embrace a sufficiently comprehensive measure ofwealth. Valuing environmental inputs into the economic system is the (relatively) easierstep. Since these inputs are incorporated into products that are sold in the market place,it is possible (in principle) to use direct means to assign a value for them based onmarket principles. In contrast, as pollution emissions are outputs, there is no direct wayto assign a value to them. All the indirect methods of valuation will depend to someextent on “what if” scenarios. Thus, translating valuations of degradation intoadjustments to macro-economic aggregates takes us beyond the realm of ex-postaccounting into a much more hypothetical situation. The very speculative nature of thissort of accounting explains the great discomfort and strong resistance among manyaccountants to this practice.
222. For a country that was on an unsustainable consumption path, an analysis employing acomprehensive and accurate measure of wealth would show a time series of decreasingnet national income.57
223. Three remarks are in order. Even if we agree that the level of present patterns ofconsumption is unsustainable, in view of the adverse effect on the environment, it doesnot necessarily imply that future generations should consume less. Such a statementwould be true only if we assume that they will consume the same basket of goods. Butthey may well change their consumption habits – because their tastes evolve, becausesome new products appear and/or because of a change in relative prices due to theincreasing scarcity of natural resources. Indeed, these changes in prices are likely toinduce both innovations and changes in consumption patterns. Second, the price of aresource near to exhaustion rises to infinity only if this resource has no substitute. And
57. For the world as a whole, as the resource approaches zero, unless there are substitutes, the price would approach infinity;presumably, the ever-rising price would induce innovation and extreme conservation in the utilization of the resource, sothat the pace of utilization of the resource would be greatly reduced. (Many individual countries have, of course, seen theexhaustion of particular resources, e.g. the UK’s supply of North Sea oil.)
The Measurement of Economic Performance and Social Progress Revisited
57
that depends on a number of phenomena, including technical progress, which areimpossible to ascertain today. Third, this analysis highlights the importance of risk –and the valuation of risk.
VIII-3. What do we want to measure?
224. There have been many attempts at building indicators of sustainable development.Some of them directly stem from an accounting framework (the Nordhaus-Tobinapproach) and are therefore familiar to economists or accountants. Many of these havebeen based on the Samuelson-Hicks welfare approach. Some others are morespecifically environmental and have become very popular amongst NGOs andenvironmentalists. Several statistical bodies or scholars have, in parallel, developedeclectic approaches that combine several dimensions of sustainability, under the formeither of extensive dashboards or of so-called “composite” indicators that add up, in oneway or another, various indicators to form an “index”.
225. The situation therefore appears to be characterized by an excess bounty, rather than byscarcity. But this is not necessarily good news, especially when different indicatorsprovide diverging messages about the sustainability of different economic models orabout the contributions of different countries to worldwide sustainability. This has beena source of perplexity for public opinion and for policy makers: which indicators shouldone focus upon, which should be priorities for further development? So far, a consensushas not developed for any of the existing approaches.
226. What do we really want to measure? Since the Brundtland Report, the notion ofsustainable development has expanded to become an encompassing concept absorbingall dimensions of present and future economic, social and environmental well-being.The two first chapters of the Report have concentrated on the measure of current well-being. Here we are concerned with the sustainability of this well-being, or, whatamounts to the same thing, the “sustainable” component of “sustainable development”.This question of durability can be expressed in the following terms: assuming we havebeen able to assess what is the current level of well-being, the question is to knowwhether the continuation of present trends allows (at least) the preservation of thiscurrent level of well-being. It is why we have asserted that social progress in the longrun presupposes sustainability.
227. As a first guide for sorting out the many different approaches reviewed in ourReport, we separate these two notions, assessing current well-being andassessing its durability or sustainability, because the two questions areanalytically distinct.
228. Some dashboards of sustainable development have mixed together measurement ofcurrent well-being and of its sustainability. While dashboards are useful, we want toselect a limited number of indicators – a “micro” dashboard – including some indicatorsspecifically dedicated to the sustainability issue, based on a clear notion of whatsustainability means.
229. Composite indicators based on such eclectic dashboards raise similar problems, withone additional one – the way in which their various items are weighted is arbitrary, with
58
REFLECTIONS AND OVERVIEW
consequences that are seldom made explicit.58 Such aggregation procedures aresometimes presented as superior to the monetary aggregations that are used for buildingeconomic indices, precisely because they are not linked to any form of marketvaluation. Indeed, there are many reasons why market values cannot be trusted whenaddressing sustainability issues, and more specifically their environmental component.But monetary or not, an aggregation procedure always means putting relative values onthe items that are introduced in the index. The problem is not that these weightingprocedures are hidden, non-transparent or non-replicable: they are often very explicitlypresented by the authors of the indices – and this is one of the merits of this literature.The problem is rather than their normative foundations or their societal implications areseldom made explicit or justified.
VIII-4 Measuring our legacy to the future
230. As we have seen, the capacity of future generations to have standards of well-being atleast equal to ours depends upon whether we pass on to them sufficient amounts of allthose assets that matter for well-being. Let’s note W the “extended wealth” index thatwould be used to quantify this stock of resources. Measuring sustainability amounts toassessing whether this global stock (or particular components of it) is evolvingpositively or negatively, i.e. computing current rates of change dW (or dWi). If this isnegative, downward adjustments in consumption or well-being will be required sooneror later. This is exactly what one should understand by “non-sustainability”.
231. In our view, such a formulation of the sustainability issue has a strong potential forproviding the common language necessary for constructive debates between thosecoming from very different fields and perspectives. Just to take one example, it fullyanswers one of the longstanding objections made to GDP by environmentalists, i.e. thefact that ecological catastrophes can increase GDP through their implied impact oneconomic activity. In an extended wealth approach, an ecological catastrophe isregistered as a destruction of capital. This accounts for the fact that it decreasessustainability by decreasing the resources available for generating well-being tomorrow.This can be avoided only if some action is taken to repair the corresponding damage,these actions being counted as positive investment.
232. Some environmentalists worry that the depletion of certain key resources that areessential cannot be compensated for by, say, more investment in physical capital.Economists respond that if that were the case, markets should reflect that scarcity by avery high price, which would induce conservation of that resource and the developmentof substitutes. Techno-optimists point out that since Malthus, there have been thoseforecasting doom – whether due to a scarcity of land or of some other resource. So far,this has not occurred. But environmentalists say that markets are short-sighted, and thatwe have repeatedly seen their inability to take into account future effects.
233. This criticism holds, however, only when the indicators are computed at fixed prices.But if a natural resource becomes crucial for human survival, and cannot be replaced byother produced assets, a correct implementation of the index would posit a relative price
58. In contrast, market based indices use relative prices, which, when markets are competitive, reflect individuals’ marginalvaluations.
The Measurement of Economic Performance and Social Progress Revisited
59
for the natural resource that tends to infinity. In that case, no realistic change in otherassets will be able to restore sustainability. Appropriately constructed indices willreflect the risk of such changes in relative prices.
234. Our Commission believes that, nonetheless, there are sufficient societal concerns aboutcertain key aspects of the depletion and degradation of our natural resources thatreporting what is happening to certain key physical stocks may be warranted.
235. A difficulty in discussions of sustainability using the extended wealth framework (asconventionally employed) is posed by the apparent contradiction between its messagethat we can easily compensate for the depletion of resources and the degradation of theenvironment and the many arguments that have been developed in favour of strong andrapid actions in several environmental domains, climatic change being the mostemblematic of them. The power of compounding can give the feeling that there willalways be sufficient money available to pay for unfavourable environmental impacts,and that current problems are therefore more important. Simplistic uses of monetaryindices of sustainability (often incorrectly constructed, paying insufficient attention tofuture potential risks) may seemingly provide some support to such a bias in favour ofthe present. The approaches we recommend are designed to avoid such a bias; webelieve that it is imperative to pay due attention to the problems arising from thedepreciation of environmental assets that are essential to human well-being or evensurvival.
a. “True saving”
236. Measures of “true savings” represent more comprehensive attempts at measuringchanges in wealth, using “correct” valuations. As we have emphasized, wealth includeseverything that can be transferred through time, whether privately or collectivelyowned.
237. Interestingly, most approaches (including those described at length in Chapter 3 of themain Report) do not rely on market valuations, simply because the presumption thatmarkets do not work for purposes of long-term intertemporal valuations is so strong.They do not work well, even in the case of standard marketed goods, but even less wellin the area of the environment, which is the focus of so much of the concern aboutsustainability.
238. It is also why we argue for a pragmatic approach that combines limited-scope“synthetic” indicators (in that they aggregate over a wealth of items, like true savings)to measure overconsumption with a few, well-chosen physical measures. We have,however, reservations about very encompassing approaches – which, in our view, sufferfrom their excessive ambition, e.g. summarizing current well-being and itssustainability with a single number – as well as about those that focus on a long list ofseparate resources, implicitly assuming no substitutability among them or between themand other forms of capital.
239. We argue for an extended wealth framework. This requires information that is not oftenavailable. Moreover, there is often a high degree of uncertainty about the appropriatetrade-offs (weights associated with the various components of an extended wealthmeasure). We thus argue in favour of a multi-dimensional approach to sustainability. We
60
REFLECTIONS AND OVERVIEW
emphasize the problems raised by technological and other uncertainties, as well as thoseraised by the international dimension of the sustainability issue. We suggest stayingwith a modest approach, i.e. focusing the monetary aggregation on items for whichreasonable valuation techniques exist, such as physical capital, human capital and fossilresources. This should be complemented with a limited set of physical and other non-monetary indicators dealing with climate change and global warming, and biodiversity,as well as the social capital and “institutional assets” that we transmit to futuregenerations.
b. Footprints
240. Although apparently quite different from “extended wealth” notions, various attempts atmeasuring sustainability through the use of “footprints” are, in fact, also inspired by thegeneral approach of comparing the level of an existing stock with current consumptionflows and their induced effects on some dimensions of the environment. In this sense,they may also be regarded as “wealth” measures in which the focus is exclusively onnatural capital, and the valuation convention differs in that no market prices areexplicitly used. The results are expressed not in terms of the conventional “moneymetrics” but in terms of some physical metric (such as the total use of carbon, or theland required to sustain consumption levels).
241. The Ecological Footprint (EF hereafter) measures “how much of the regenerativecapacity of the biosphere is used by human activities (consumption)”. It does so bycalculating the amount of biologically productive land and water area required tosupport a given population at its current level of consumption and resource utilization.A country’s Footprint (demand side) is the total area required to produce the food, fiberand timber that it consumes, absorb the waste that it generates, and provide areas for itsinfrastructures (built-up areas). On the supply side, “biocapacity is the productivecapacity of the biosphere and its ability to provide a flux of biological resources andservices useful to humanity”, as Moran, Wackernagel and their co-authors (2008)phrased it.
242. The results are well-known and rather striking: since the mid-1980s, humanity’sfootprint has been larger than the planet's carrying capacity, and in 2003 humanity’stotal Footprint exceeded the Earth’s biocapacity by approximately 25 per cent (wewould have needed an extra 25% Planet to meet our needs, to put it informally). While1.8 global hectares per person are available world-wide, Europeans use 4.9 globalhectares per person and North Americans use twice that amount, that is, much morethan the actual bio-capacities of these two geographical zones.
243. This index may be regarded as an extended account approach, even if its results are notexpressed in monetary terms. Indeed, this indicator shares with accounting approachesthe idea of reducing heterogeneous elements to one common measurement unit (theglobal hectare, e.g one hectare with productivity equal to the average productivity of the11.2 billion bioproductive hectares on Earth). It assumes the substitutability at least ofdifferent forms of natural capital (demands on different natural capital goods areadditively assessed in terms of land area), but implicitly rejects notions that physical orother forms of capital can substitute for natural capital. In fact, there is no virtue to anysaving or accumulation: not only does any positive ecological surplus (biocapacity
The Measurement of Economic Performance and Social Progress Revisited
61
exceeding ecological footprint) not entail an increase in some natural capital stock andhence an improvement of the productive capacity in the future, but investments incapital goods that might reduce future ecological footprints have an adverse effectbecause of the demands that they impose on today’s ecological footprint.
244. The results of this and similar metrics are problematic for measuring a country’s ownsustainability – or would be relevant only in a world of autarky. Differences in resourceendowments provide one of the main motivations of trade. The fact that denselypopulated (low biocapacity) countries like the Netherlands have ecological deficitswhilst sparsely populated (high biocapacity) countries like Finland enjoy a surplus canbe seen as part of a normal situation where the trade of goods is mutually beneficialrather than an indicator of non-sustainability. It is better to consider EFs as an attempt toassess the magnitude of global non-sustainability.
245. Less encompassing but more rigorously defined indicators, such as the “CarbonFootprint” (CF), would seem better suited to assess a particular dimension ofsustainability, insofar as they are more clearly physical measures of a physical stock andof changes in that stock. (Again, they are better as measures of global sustainability, andthere are complicated problems of assessment in general equilibrium models, e.g. inevaluating the carbon used to produce each of the inputs that go into each product.Marginal carbon utilizations may differ, for instance, from average utililization.Moreover, measuring sustainability requires an assessment of future changes intechnology.)
246. One use of these indicators is to send strong messages concerning the over-utilization ofthe absorbing capacity of our planet. Because these metrics can be calculated at anylevel of disaggregation59, they can be a powerful instrument for monitoring behavioursof individual actors.
c. Global perspectives
247. In a globalized world one needs to take a global perspective. This is obviously the case(and well recognized) for global warming, but it is also true for other depletable andrenewable natural resources.
248. Taking a global perspective means that one cannot overlook the fact that some countriesare more vulnerable than others to the degradation of the global environment.Regardless of where carbon gas is emitted, we know that climatic change has a stronglyuneven distribution of consequences on different countries. Does worldwidesustainability mean the preservation of well-being for the average of the worldpopulation, or for those of its members that are more directly confronted by the adverseconsequences of such an environmental threat? Whatever one’s views on the long-termsustainability of the world’s current path, for the Maldives, Bangladesh, and the low-lying Pacific Island states, the current path is not sustainable.
59. Subject to the qualifications made in the previous paragraph.
62
REFLECTIONS AND OVERVIEW
d. Other dimensions of sustainability
249. While environmentalists have performed a service in calling our attention tosustainability, the examples of non-sustainability resulting from excessive debt make itclear that these sustainability issues are far broader. Here too the present crisis helps usto understand other dimensions of sustainability, namely the human and socialdimensions. A major crisis such as the current one or that of 1997-1998 can have long-term effects on the future welfare of some categories of populations, in particular indeveloping countries, as a result, for instance, of interrupted educations or malnutrition.And in turn, these consequences may jeopardize the sustainability of the social and thepolitical system.
250. The discussion of sustainability serves to remind us that by looking at an economytoday, we get a very incomplete picture of complex dynamic processes. Earlier, weemphasized the importance of the distribution of income. Again, we looked at a“snapshot”, a picture at a moment in time. But what matters for individuals is theirlifetime income – especially if they can borrow to smooth out their income over time.Societies are, and should be, concerned with social mobility across generations.
251. In the development literature, emphasis is placed not just on economic andenvironmental sustainability, but also on political and social sustainability. We have nogood metrics, for these other important aspects of society. Still, an important aspect ofpolitical sustainability is access to “voice” and social sustainability and equality ofopportunity. Metrics on these variables can and should be developed. (See also theearlier discussion in Section XX)
252. An important warning should be sounded in closing. La Palisse would have said that anecessary condition for sustainability is that a catastrophe should not arise that preventsachieving sustainability. Climate change can precipitate the advent of such acatastrophe. Such a catastrophe would change dramatically the world in which we live,and therefore how we live—so much so that much of what we have said might seemirrelevant. We thus badly need indicators measuring how close we are to such acatastrophe. Our Report has been written by economists and social scientists who dealwith numbers describing our economy and our society. We thus rely on scientists onclimate change and other natural scientists to conceive these indicators of a potentialcatastrophe in our physical surroundings. We simply do not have the expertise to do thisby ourselves.
The Measurement of Economic Performance and Social Progress Revisited
63
THE WAY AHEAD: CONCLUDING REMARKS
253. The Members of the Commission believe that our work has just begun. We areconvinced that what we measure and how we measure it makes a difference – for policy,for judgments about what works and what doesn’t.
254. It should be obvious that no single number can summarize anything as complex andvariegated as “society”. But, inevitably, certain numbers – in particular GDP – havetaken center stage. Millions are spent forecasting what that number will be next monthor next year.
255. The members of the Commission agreed that such a number may be misleading if itwere applied to all purposes, and especially as a broader measure of societalperformance. We have described a number of reforms that, depending on the purpose ofthe measure, would provide better metrics. Many of these reforms are attainable withrelatively little investment in the collection and analysis of statistical data. And we arehopeful that our discussion of the strengths and limits of different metrics will lead tomore care in the use of each, and better selection of the use of appropriate metrics fordifferent purposes. For example, we have identified measures that are better adapted tothe measurement of the well-being of citizens in a country in a globalized world thanGDP; the evolution of median income is more telling about the representative agentthan per-capita GDP.
256. Measurement of “present” economic performance also includes an assessment of“quality of life”. Quality of life includes the full range of factors that make life worthliving, including those that are not traded in markets and not captured by monetarymeasures. While many of our measures are directed at ascertaining short-runmovements in the level of market activity, the Commission considers that the time hascome to make a clear move from measuring production to measuring welfare, to try toclose the gap between our measures of economic performance and widespreadperceptions of well-being. Building on existing research, it proposes new and crediblemeasures for at least some aspect of quality of life.
257. Our societies have become more concerned about the environment, as we have realizedthat what we have been doing has placed our planet at risk. This realization reinforcesthe importance of sustainability, and heightens the imperative for the development ofmetrics that assess sustainability. While we have argued for the development of abroader measure of extended wealth to assess sustainability, we believe that such anapproach should be supplemented with some physical measures.
258. We believe that a global debate around the issues and recommendations raised in theReport provides an important venue for a discussion of societal values, for what we, as asociety, care about, and whether we are really striving for what is important
259. We hope that ours Report will provide the impetus not only for this broader discussion,but also for on-going research into the development of better metrics that will contributeto a better assessment of economic performance and social progress.


![Sistem Penilaian Kinerja [ Performance Measurement Systems ]](https://static.fdocument.pub/doc/165x107/56815196550346895dbfcc66/sistem-penilaian-kinerja-performance-measurement-systems-.jpg)