The Long Term Impact of the Financial Crisis on Public ...
30
The Long Term Impact of the Financial Crisis on Public Pension System Financing: Stress Testing Models of Mandatory Pension Systems in Middle Income and Developing Countries Richard Hinz, Asta Zviniene, Sergiy Biletskyy, Tatyana Bogomolova September 2009 Discussion Paper provided for the Expert Group Meeting on Population Ageing, Intergenerational Transfers and Social Protection, Santiago, Chile. October 20-21, 2009 All results are preliminary and represent the views of the authors only. Please do not cite or circulate.
Transcript of The Long Term Impact of the Financial Crisis on Public ...

The Long Term Impact of the Financial Crisis on Public Pension System Financing: Stress Testing Models of Mandatory Pension Systems in Middle Income and Developing Countries
Richard Hinz, Asta Zviniene, Sergiy Biletskyy, Tatyana Bogomolova
September 2009
Discussion Paper provided for the Expert Group Meeting on Population Ageing, Intergenerational Transfers and Social Protection, Santiago, Chile. October 20-21, 2009 All results are preliminary and represent the views of the authors only. Please do not cite or circulate.


1
A. INTRODUCTION
The global financial crisis has focused considerable attention on its potential impact on pension systems and the retirement security of aging populations. Most of this attention has been directed towards the effects of the dramatic decline in the value of the assets in individual retirement savings accounts and the rapid deterioration of the financing of employer sponsored and collectively managed defined benefit arrangements in developed countries. In addition to these immediately evident effects, the crisis potentially will also have an equally consequential impact on public pension systems across a wide range of settings.
These will primarily be the result of the decline in earnings and employment associated with the broader economic consequences of the worldwide recession. Nearly all economies have already experienced sharp declines in overall employment levels while others are beginning to show a similar decline in the level of earnings. Both of these will likely result in a meaningful decline in the taxable wage base resulting in a significant reduction in revenue for many years to come. Expenditures on the other hand can be expected to remain relatively constant or in some instances increase over the short term as workers opt to claim benefits when faced with employment losses.
On the other side of the ledger, because benefit formulas for these systems are linked to the earnings, expenditures will, over the long term, adjust to the lower earnings levels. This adjustment process, however, will require a decade if not longer to play out. In the meantime there may be a significant deterioration of financial status that can have material consequences on the fiscal position of the government that stands behind these systems, and if of sufficient magnitude, on their long term financial sustainability. This impact will be especially pronounced when viewed in comparison to the anticipated pre-crisis financing path for these systems that had, in most cases, assumed a continuation of the robust growth of the preceding decade to achieve a long term balance between revenue and expenditures. These impacts will likely emerge slowly over the next several years. However, they may present a challenge to policy makers of far greater magnitude and duration than the more immediate decline in asset prices.
To provide an initial assessment of the dynamics of the impact of the financial crisis on pension systems, in this paper the World Bank’s PROST1 (The Pension Reform Options Simulation Toolkit) projection model is used to undertake a series of “stress test” simulations that evaluate the impact of the crisis on both the short and long term financial status and benefit outcomes of several prototypical pension systems that have been developed to be representative of the kinds of systems now operating. This is done by developing “typical” pension systems that are roughly representative of the demographic environments and system designs in the three regions in the developing world (Central Europe (CE), Latin America and the Caribbean (LAC) and the Middle East and North Africa (MENA)) where large public pension systems are in operation and then evaluating how they might be expected to respond to a range of crisis scenarios.
The analysis establishes a pre-crisis baseline for each system and then subjects it to a various levels of shock and recovery paths that have been formulated to be representative of the projections for the path of the crisis within the developing world. This not intended to be a forecast of what will occur in any particular country or region but rather to illustrate the dynamics, timing and potential magnitude of the effect of the crisis on pension systems with characteristics that are consistent with the kinds of systems now in operation.
These simulations are then used to evaluate the effects of a variety of policy responses to the crisis that have already been undertaken or are being considered. This is designed to further illustrate the 1 The Pension Reform Options Simulation Toolkit (PROST) see ‘Modeling Pension Reform’, Pension Reform Primer Briefing, World Bank, 2000

2
dynamics of the response of these systems to externally generated stress and to provide some initial assessment of the longer term effects of the various approaches to assist policy makers in determining the appropriate responses to the crisis.
B. DEFINING THE MACROECONOMIC SCENARIOS
The initial step in the analysis is to define a set of crisis scenarios that cover the full range of
macroeconomic conditions that will determine the outcomes within the pension system resulting from the financial crisis. This requires assumptions about the path of GDP growth, and the associated impact on earnings and employment that will determine the contributions and benefits from the system and for systems with a funded second pillar or reserves the asset prices resulting from the crisis and assumed path of recovery. These assumptions are summarized below.
GDP Path. There are a wide range of diverse views about the depth and duration of the impacts of the current financial crisis. Projections by the World Bank and the International Monetary Fund (IMF) continue to be updated as new experience and analysis emerges. The latest projections from the World Bank (June 22 Global Economic Prospects 2009 Forecast Update) anticipate a much sharper economic slowdown than was projected as recently as several months earlier. These latest projections indicate a negative 2.9 per cent Gross Domestic Product (GDP) growth for the World in 2009 followed by a modest recovery of 2.0 per cent growth in 2010. This represent a more pessimistic scenario compared to the projected negative 1.7 per cent decline forecast as recently as March 30 2009.
This overall projection however includes wide variations among regions. The forecast the CE region anticipates a decline in GDP of 4.7 per cent and for the LAC region a decline of 2.2 per cent. Other regions are projected to experience sharp reduction in growth compared to prior years but remain in positive territory including a positive growth of GDP in the MENA region of 3.1 per cent for 2009, 5.0 per cent in East Asia and 4.6 per cent in South Asia. On the other hand the high income the Organization for Economic Cooperation and Development (OECD) countries are forecast to decline by 4.2 per cent and some individual countries expected to experience a decrease in output for the year in excess of ten percent.
To try to encompass this diverse range of possible paths of the current and any future crisis that will bound the range of possible outcomes, four scenarios have been developed for use in the analysis. These include (1) a Baseline No-Crisis Scenario designed to provide a reference for comparison of the crisis scenarios from the path expected only a year before. This begins with a real GDP growth rate of 5.2 per cent per year that gradually decelerates over 20 years to steady state of real growth of 2.5 per cent per year, (2) a Moderate Crisis Scenario consistent with the current overall global forecast that includes a 2 per cent decline in the 2009 followed by a relatively rapid return to positive growth of 2 per cent and 4 per cent for the following two years after which growth settles gradually to the long term level of 2.5 per cent within a decade. In addition two more severe scenarios are also included to evaluate more extreme stress that could be imposed by a much greater initial shock (as will be experienced by a number of countries in 2009) and a slower path of recovery. These include (3) a Severe Shock with Rapid Recovery Scenario in which GDP declines by 6 per cent in 2009 but then returns to the 2.5 per cent path within four years and (4) a Severe Shock and Slow Recovery in which the same 6 per cent decrease is experienced in 2009 but the recovery to a long term positive level requires an additional decade. The different paths of these four GDP scenarios are shown in figure 1 below.
In considering the implications of these scenarios it is important to keep in mind the cumulative impact that these assumptions about the path of GDP will have in relation to the no-crisis baseline scenario. This is extremely relevant in evaluating the fiscal effects and potential policy options because

3
many pension systems have been designed and reformed in recent decade to calibrate revenue and expenditure flows based on projections similar to the baseline scenario. In addition to the overall impact on the long term financial balance of these systems resulting from the crisis it is equally, if not more relevant from a policy response perspective, to consider the impact in terms of the marginal effect in relation to a non-crisis baseline, especially in regard to the first several years when the marginal fiscal impact is likely to be most pronounced and the constraints in addressing it greatest. The graph in figure 1 shows the cumulative effect of the three crisis scenarios in relation to the baseline. This illustrates the key point that even the relatively moderate crisis scenario of one year decline in output followed by a rapid return to growth will result in a path of output (and consequently the revenue stream for a pension system) that remains substantially below the level of the pre-crisis expectations.
Figure 1: Base Case Scenarios for the GDP Growth and Cumulative Differences
Impact on Earnings and Employment – The Covered Wage Bill. One of the key variables of interest in evaluating the financial status of the pension system is the effect of the crisis on the “covered wage bill”. The revenues of the system are a function of the size of the covered wage bill, the contribution rate and collection efficiency. The experience from prior financial crises indicates that losses in the covered wage bill (earnings from formal sector work) are likely to be substantially higher than losses in GDP. This is due to both losses in overall employment, a shift in employment from the formal to the informal sector and a decline in wages. The impact on the formal wage bill resulting from several previous crises has been estimated by the World Bank as shown in figure 2 and summarized in table 1 below. These indicate significant wage and employment effects of a financial crisis that vary considerably depending on the nature of the economy. Some experience large declines in overall employment while others experience significant wage declines. In either result the magnitude of the decline has exceeded the proportional decrease in overall GDP.

4
Figure 2: Effect of the Previous Financial Crises on the Manufacturing Wage
Bill
Share of Wage Bill Falls During Crises
25.00
30.00
35.00
40.00
45.00
50.00
55.00
1993 1994 1995 1996 1997 1998 1999 2000 2001 2002 2003 2004
Nic
arag
ua &
Mex
ico
(%)
0.00
5.00
10.00
15.00
20.00
25.00
30.00
35.00
40.00
45.00
50.00
Mexico Nicaragua Russia Argentina
Mexican Tequila
Argentina Financial
Nicaragua Financial
Russian Fianancial
Russia and A
rgentina (%)
TABLE 1: CHANGES IN WAGE BILL IN PREVIOUS FINANCIAL CRISES
Wage bill share of GDP fell Financial Crisis From To
Fall as % of initial level
Russia (1998) 38.5 25 35%
Argentina (2001) 42 34 19%
Mexico (1994) 38.5 32 17%
Nicaragua (1996) 33 31 6% Source: Authors calculations derived from ‘How Should Labor Market Policy Respond to the Financial Crisis’, World Bank Policy Note, World Bank, 2009
Based on this kind of evidence, within the various crisis scenarios it is assumed that there will be a somewhat greater decline in the overall wage bill than the decrease in output and that this decline will include both reductions in covered employment and decreases in wage levels among covered workers. In addition to the magnitude of the decline, the outcomes for the pension system will also to some extent depend on the way in which this decrease is distributed between covered employment and wage levels.
For the baseline scenario it is assumed that the overall share of the covered wage bill remains constant as proportion of GDP growth. For the crisis scenarios a more complex approach is adopted. For these it is assumed that the constant proportion of covered wage bill to GDP is maintained when GDP growth is positive or zero but will decline more rapidly than GDP when growth becomes negative. It is assumed that in response to the initial shock the covered wage bill will decline at twice the rate of the decrease in GDP when GDP growth becomes negative. Therefore the 6 per cent decline in GDP assumed in the first year of the severe crisis scenario is assumed to result in a 12 per cent decline in the overall covered wage bill. It is further assumed that at positive GDP growth rates growth variations are fully absorbed by the wage growth while in the environment of declining GDP 2/3 of this decline is the result of losses in employment and 1/3 is a result in a decline in wage levels.

5
The combined effects of these assumptions on the covered wage bill (which in conjunction with the payroll tax rate will determine the expected overall revenues of the pension system) are illustrated in figure 3. This shows how the change in the wage bill will overshoot the adjustment path of the GDP and will only return to that path once employment levels fully recover.
Figure 3: Cumulative Difference in GDP and Wage Bill Growth
Asset Values. Modeling outcomes for a system that includes a funded second pillar requires assumptions about movements in asset prices. Based on reported values for the regions in which funded systems are prevalent it is assumed that the average loss in a balanced portfolio has been 20 per cent in 2008. An additional 10 per cent net loss for 2009 is assumed reflecting the experience of the initial months of 2009 that is somewhat offset by the more recent recovery. Asset prices are then assumed to start growing again in 2010 although in the case of two most severe scenarios at a slower pace than assumed in the base case. This will lead to further, albeit slower, divergence between base case and crisis scenario asset price levels. These assumptions and the cumulative effect are shown in figure 4 below. In addition to cumulative effect on the asset prices, comparable effect on wage levels is also shown. It is important to note, that while both wages and asset prices are assumed to adjust to a similar extent in the long run, asset price adjustments happens much faster and “overshoot” downwards in the moderate crisis scenario.
Figure 4: Changes in Asset Values

6
C. DEFINITION OF THREE REPRESENTATIVE PENSION SYSTEMS
The second element in constructing the analysis is the formulation of several prototypical pension
systems described by the demographic conditions and pension system design characteristics currently in place. Subjecting these to the common set of crisis scenarios will then illustrate the relationship between conditions and design and the outcomes of a financial crisis. The selection of three exemplary systems is in part determined by judgments regarding sets of common systems within several regions that have sufficient variation to shed light on the relationship between characteristics and outcomes and in part on the current availability of data on a sufficient number of countries within a region.
This results in three systems that are representative of the pension systems of the three regions that cover a relatively large (for developing countries) portion of the population. These are designed to be representative of pension systems found in Central Europe, Latin America and the Caribbean and the Middle East and North Africa. Other regions may have significant systems in some countries but neither the common aspects of design, prevalence or availability of data to support such an exercise. Each of these prototype systems is designed to provide a composite that is broadly representative of the region. None has characteristics that are perfectly aligned with any single country or pension systems but all are generally representative of what is in place in each of the regions.
• The Central Europe prototype is based on a composite of characteristics from: Bosnia and Herzegovena, Lithuania, Serbia, Slovakia, Romania
• The Latin American system is derived from characteristics observed in: Brazil, Colombia, Mexico, Nicaragua
• The Middle East and North Africa model is derived from the demographics and system characteristics in: Egypt, Iran, Morocco, Syria, Tunisia
Developing these indicative models required formulating a set of both demographic and systems
design characteristics that are then entered into the PROST model as system parameters against which the various crisis scenarios and recovery paths are run. The main parameters for the three systems are outlined below.
Demographic Conditions. A great deal of the variation in impact of the crisis on pension systems is likely to be related to differences in underlying demographic circumstances. The three regions have very different demographic conditions as shown in the population pyramids for each of the representative systems in figure 5 below. The system based on information from Central Europe is associated with a rapidly aging population characterized by birth rates that have been very low for decades but especially in the last 20 years, and by life expectancy that is relatively high. The Latin America model represents a much younger population but one in which fertility rates declined rapidly in recent decades and will, over the forthcoming decades, begin to exhibit many of the now well known characteristics of an aging population. The MENA model on the other hand reflects the much younger age structure and high fertility rates of the region that will start undergoing a similar demographic transition only in several decades.

7
Figure 5: Age Distribution of the Population
Central Europe
120 120
1
21
41
61
81
Age
Men (thousands) Women (thousands)
Latin America
120 120
1
21
41
61
81
Age
Men (thousands) Women (thousands)
Middle East and North Africa
120 120
1
21
41
61
81
Age
Men (thousands) Women (thousands)
Pension System Coverage. A parameter that also reflects some important differences between the three examples is the extent of coverage of the pension system. The key characteristic in this respect is the rate of coverage by the pension system in relation to age, especially along the demarcation between contributors and beneficiaries. The data from the countries evaluated to develop these prototypes indicates even greater differences than are evident in the underlying demographics. These are shown in the graphs of average rates of coverage by age in figure 6.2
The CE systems, with their origins in the formerly socialist economies in which employment in the formal sector was mandatory and strongly enforced, have very high coverage rates among older age groups who have accrued credits under the antecedent arrangements (including survivor pensions would increase these rates even further to almost 100 per cent). These coverage rates, however, drop rapidly among younger age groups which typically experience higher unemployment rates and are more likely to engage in informal employment. It is however assumed that in the future as the younger workers advance in age they will be increasingly likely to begin to contribute to the pension system although will not be able to reach current coverage rates of the elderly.
The Latin American model in contrast reflects a much lower level of coverage. Here the coverage rates of working age and elderly population are observed to be below 40 per cent at every age and remain relatively level. The MENA system is derived from an entirely different pattern that is the result of the relatively recent implementation of pension systems in the region, generally later entry into employment and a greater difference by gender in formal sector employment. This model has a lower coverage rate of the elderly reflecting systems that have not reached maturity but coverage of working age groups is similar as in LAC. In the future maturation of the system is expected to significantly increase the coverage of the elderly in this region.
2 Coverage rates for pensioners presented in the graph include old age and disability benefits but exclude survivors.

8
Figure 6: Pension System Coverage as Proportion of Total Population by Age
System Dependency Rates. This difference in coverage rates together with demographic trends manifests itself in differences in one of the primary determinants of any pension system attributes, the dependency rate defined as the number of participants eligible to collect benefits, those above the retirement age or disabled, in proportion to the number of active contributors. The interaction of the underlying demographics and coverage rates typically results in increase in this ratio over time, especially when there is an underlying pattern of declining fertility and increasing longevity as is the case in nearly every country. The projected evolution of the system dependency rate for the three systems is shown in figure 7. This shows the much higher dependency rate for the CE region due to the already old population in the region and the very high coverage rates of the elderly. This ratio is expected to grow in line with those of other regions, but eventually will stabilize and even decline slightly as coverage rates of the old decline and fertility rates increase to population replacement level. The LAC and MENA models can be expected to have similar rates of increase but from much lower current levels. In MENA slower aging is compensated by ongoing pension system maturation yielding similar dependency ratio as in LAC.

9
Figure 7: Dependency Ratios: Number of Old Age and Disabled Pensioners per 100 Contributors
System Design Parameters. The other source of influence is the design of the pension system itself. There are significant differences across regions in the underlying structure, contribution rates, benefit eligibility requirements (most importantly retirement age) and benefit formulas that will have a major impact on how the system will respond to an exogenous shock like the financial crisis. There is a greater degree of heterogeneity among these basic design parameters among pension systems than in the underlying demographic conditions, with the characteristics of individual systems reflecting a combination of historical context, cultural values, economic conditions as well as limitations imposed by demographics.
Reflecting this reality it is not feasible to derive robust averages that would accurately reflect differences in these parameters. It is likely to be more accurate to try to derive a combination of characteristics that reflects the observed trends in the region and fit together as a consistent whole resulting in more stylized than empirically derived models. The result of the effort to develop a representative set of parameters for the three systems in shown in table 2 below. In Central Europe the pressures of more accentuated population aging, rapid out migration in many settings and rapidly increasing rates of evasion or informalization of labor associated with the economic transition has resulted in an environment in which benefits have had to be constrained to stay within the financing envelope. This resulted in the combination of very high contribution rates and relatively low pension benefits. Although the attempts have been made to increase statutory retirement ages, high prevalence of disability pensions have had limited impact on effective retirement ages.
The CE prototype therefore reflects a system that has been significantly reformed to try to bring benefits in line with the fiscal realities. The effective benefit accrual rate is set at 1.4 per cent of the reference earnings level resulting from an estimated average benefit in relation to the average wage in the economy at the relatively low level of 47 per cent. Contribution rates remain high at 28 per cent of taxable wages reflecting the level of collections required to support even these modest benefits with the high and increasing system dependency rates. This combined with high coverage rates results in a high proportion of GDP in both contributions and expenditures. The high coverage rates are associated with long wage averaging periods for the calculation of benefits that will influence the dynamics of the response to macro economic shocks. Overall the systems are assumed to operate with current financing flow deficits at about 0.5 per cent of GDP consistent with pre-crisis experience in the region.
In the LAC model, younger populations and lower coverage rates of the elderly have provided
sufficient fiscal space to maintain high benefit levels at lower contribution rates. Here the representative system is estimated to provide benefits equivalent to 81 per cent of the average earnings. This is

10
associated with an annual accrual rate of 2.8 per cent, while the willingness of governments in the regions to subsidize these schemes from general budgets allowed for lower contribution rates. As with the CE system retirement ages remain relatively low in relation to longevity reflecting the current parameters of these systems. Here contributions are a much lower proportion of GDP at 3.3 per cent as are benefits at 2.8 per cent resulting in a system that operates very close to a neutral cash flow basis showing a 0.5 per cent annual surplus.
The MENA model is designed to represent the relatively immature pension systems more prevalent in the region. Accrual rates are between the two other systems generating average benefits of 60 per cent of earnings. These are based on a benefit design that utilizes much shorter averaging periods of earnings that are estimated at 7 years reflecting current practice in the region. The critical difference however is in the balance of the financing flows. The younger age structure and low coverage rates among the elderly due to the more recent establishment of the system results in expenditures of only 1.3 per cent of GDP against revenues of 3.4 per cent of GDP resulting in a significant build-up of reserves.
TABLE 2: KEY PENSION SYSTEM PARAMETERS
CE LAC MENA GDP per capita (US$) 11135 7487 6282 Average old age pension as proportion of average wage 47% 81% 60% Average survivors pension as proportion of average wage 21% 50% 34% Pension contribution rate 28% 18% 19% Averaging period for wage base calculation 20 10 7 Average length of service at retirement (male/female) 35/30 26/25 26/25 Effective retirement age (male/female) 57/55 56/55 57/54 Life expectancy at retirement 19/25 20/24 19/24 Effective accrual rate 1.4% 2.4% 1.9% Contributions as % of GDP 5.9% 3.0% 3.5% Expenditures as % of GDP 7.2% 2.8% 1.3%
Making generalizations about indexation policies is extremely hard. Historically, throughout much of the developing world pension indexation policies were relatively murky, resulting in ad hoc revisions of benefits which have loosely followed wage and/or revenue growth. More recently some countries have made indexation rules more formal specifying either wage or inflation indexation (mostly in CE), but even that did not prevent some of them to relapse into ad hoc indexation practices often masked by pension recalculations, issuance of pension bonuses, corrections of perceived past injustices, etc. Therefore, for reasons of simplicity it is assumed that all three regional systems will index pension benefits to the overall rate of wage growth.
Funded Pillars. To be fully representative of the pension systems within CE and LAC regions the modeling attempted to reflect the reforms of the past two decades which created supplementary funded pillars. At present, with the possible exception of Chile, these remain in a very nascent stage of development with participation of only some of the younger cohorts, holding only a small level of assets and few providing any benefit payments to retirement age members. They are however of significance in considering the impact of the crisis both because asset losses could possibly lead to a decrease in benefits for some individuals nearing retirement and because they account for a meaningful proportion of the contribution flows among the younger cohorts. To incorporate these into the simulations the systems representing the CE and LAC regions are constructed with the assumption that 25 per cent of the total pension contributions are directed to individual accounts for those individuals who participate in the multi-pillar system. Although the majority of the benefits in both in the aggregate and on an individual basis are assumed to remain in the public system operating on essentially a pay as you go basis this

11
implies that benefits from the pay-as-you-go system will eventually be reduced by 25 per cent for those who participate in the mixed system3. It is assumed for simplicity that all future entrants will participate in the multi-pillar system. To integrate this into the analysis an assumption based on observed patterns of the average participation by age in the funded pillars for the two regions is presented below.
Figure 8: Participants of the Funded System in CE and LAC Regions
*Note: LAC average has been derived from data on Argentina, Colombia, El Salvador, Peru, and Uruguay; CE average is derived from data on Estonia, Hungary, Lithuania, Poland, and Slovakia.
In addition to these individual accounts because the MENA example runs a significant surplus it is assumed, consistent with what is observed in many of the countries of the region, that a public system has initial reserves on the order of 15 per cent of GDP and will continue accumulating them in the future to back the future liabilities as long as projected revenues are expected to exceed expenditures.
D. BASELINE (PRE-CRISIS) STATUS OF THE THREE SYSTEMS
The starting point for evaluation of the impact of a financial crisis and its associated macroeconomic
consequences is the simulation of baseline (or non-crisis) values for the metrics against which the projected consequences of the crisis will be measured. The primary area of interest is the evaluation of changes in the financial flows best summarized as net annual fiscal balance (revenues less expenditures) expressed as a proportion of GDP. The baseline values for the three representative systems are shown in figure 10 below. It is important to always keep in mind in interpreting these values (and especially in interpreting the projections of the impact of the crisis) that both the financial flows and the underlying GDP are moving simultaneously in these projections and the changes are therefore a result of both factors.
The baseline values illustrate the different starting points and expected path of development of the three different types of systems. Most importantly they illustrate the degree to which the demographic transition in all three settings will be the primary determinant of the financial balance. The CE system, that has been experiencing strongest financial pressures is starting with 1.3 per cent of GDP deficit that is projected to deteriorate to as low as negative 6 per cent of GDP over the subsequent 35 years. This is a reflection of the age structure of the population and high levels of benefit receipt that will cause the ratio of contributors to beneficiaries to steadily decrease as the smaller age cohorts pass through the prime
3 The average weight of funded pillar for 11 CE countries with multi-pillar systems is 24 per cent. See “Social Protection Responses to the Global Economic Crisis” by K. Lindert and A. Schwarz.

12
working years. It is also partially a reflection of the diversion of a portion of the contributions to funded accounts that creates a transition deficit. The fiscal condition would be expected to begin to improve when the groups with relatively smaller pay-as-you-go financed benefits (and meaningful second pillar accounts) and lower coverage begin to retire around 2050.
The Latin American system initially indicates a similar but less articulated pattern with a later process of fiscal deterioration resulting from the similar structural effect of establishing funded accounts and a later demographic transition although not affected by post-transition coverage contraction effects. The long term fiscal condition of this system is projected to be worse than the CE projections because there is no assumption of benefit level contraction that has occurred with the typical CE region reforms. The MENA system shows a very different pattern resulting from the much younger population. The system is expected to run an operating surplus of nearly 2 per cent of GDP for the next two decades following which it too would experience a rapid decline in the financing balance. This is assumed to result in the gradual build up and then draw down of reserves for the system.
Figure 9: Annual Financial Balances as a Share of GDP with no Crisis
The projected baseline level of the funding reserves for the MENA system are shown in figure 11. This indicates that in these projections the MENA system would steadily accumulate reserves beginning at 15 per cent of GDP and reaching a level of 40 per cent of GDP by about 2030. This would result in a Funding Ratio (value of the reserves divided by the present value of benefit obligations) that exceeds 40 per cent for much of this period and then rapidly declines as the system matures. It is interesting to note that the rate of increase of reserves is positive until about 2040 in these projections while the funding ratio peaks nearly two decades earlier as growth of liabilities supersedes the speed of growth of reserves.
Figure 10: Funding Ratio and PAYG Reserves as a Share of GDP for MENA

13
In addition to the financing flows for the respective system, the other primary metric of analysis is the
value of the benefits that the system is expected to deliver to its members. This provides a point of comparison to determine the possible longer term impact of the financial crisis on the capacity of the systems to deliver income replacement in retirement. For this the metric used is the average value of the projected benefits as a share of the average wage in the economy. The baseline values for these projections are shown in figure 12. This illustrates how the CE and LAC systems are expected to produce lower benefits in the future both due to the demographic factors and on-going benefit reforms. It also illustrates the gradual replacement of pay-as-you-go financed benefits with those derived from the funded individual accounts in the CE and LAC regions where it is assumed that one quarter of contributions are directed to an individual account for the younger age cohorts. These accounts however are not likely to produce a meaningful proportion of retirement income for another two decades.
Figure 11: Projected Replacement Rates (Average Pension/Average Wage)
E. EVALUATION OF THE IMPACT OF THE CRISIS
Following the development of the three indicative systems and estimation of the baseline values for
key parameters that are outlined above the PROST model was used to project how these would be affected by the economic shocks and varying recovery paths that comprise the three crisis scenarios. The results of this exercise and related analysis are presented in the following sections.
The main variable of immediate interest is the potential effect on financing arrangements. This will be a consequence of the level and timing of changes in both the collections to support the system (Revenues) and the payment of benefits (Expenditures). To illustrate the timing and dynamics of the projected effects these are addressed separately and then in combination to illustrate the net impact.
Changes in Revenues. The simulations indicate that the anticipated shock to employment levels and earnings associated with the crisis can be expected to have a significant effect on the revenues of all three of the pension systems. The annual changes in collections in relation to the baseline projections for both the Pay as You Go and funded portion of the systems derived from the simulations are shown graphically in figure 13 below. These indicate that there are potentially very large changes in the financing flows especially for the example from the CE region. Even the relatively moderate crisis scenario (a negative 2 per cent rate of GDP growth in 2009 followed by a rapid return to long term positive growth within two years) results in revenue reductions between 0.1 and 0.2 per cent of GDP each year for at least five years. The more severe scenarios (negative 6 per cent decline in GDP and slower recoveries) leads to a reduction of collections at a level nearing 1 per cent of GDP per year over an even longer period. The

14
reductions are at a much lower level for the LAC and MENA systems although they follow a similar pattern. The differences are primarily a result of the lower contribution and coverage rates for these systems.
Figure 12: Changes in Contribution Revenues as a Share of GDP
To place these in context it is useful to also measure the changes on a cumulative basis. These estimates are shown in table 3 below. This indicates that for the CE system the cumulative revenue losses calculated as a deviation from the base case in the initial ten year period can be expected to range from a relatively modest 0.9 per cent of GDP for the moderate crisis to as high as 5.8 per cent of GDP for the more severe shock (negative 6 per cent) followed by a slow recovery. The other systems indicate impacts at about half of this level which is a function of the lower contribution and coverage rates. The GDP related measures actually understate the impact in some respects because they are measured in relation to a lower absolute level of GDP in the immediate post-crisis years.
TABLE 3: CUMULATIVE CHANGE IN THE SHARE OF REVENUE IN GDP
2018 2025 2050 2075CE – Severe Shock – Slow Recovery -5.8% -7.3% -8.0% -8.1%CE – Severe Shock – Fast Recovery -4.0% -4.1% -3.9% -4.6%CE – Moderate Crisis -0.9% -1.1% -1.2% -1.4% LAC – Severe Shock – Slow Recovery -2.8% -3.5% -3.6% -3.6%LAC – Severe Shock – Fast Recovery -1.6% -1.7% -2.0% -2.1%LAC – Moderate Crisis -0.3% -0.3% -0.2% -0.3% MENA – Severe Shock – Slow Recovery -3.0% -3.7% -4.0% -3.8%MENA – Severe Shock – Fast Recovery -1.5% -1.4% -1.6% -2.0%MENA – Moderate Crisis -0.4% -0.6% -0.9% -1.0%

15
An alternative view of system finances considers the change in revenues as a proportion of the baseline (no-crisis) revenue stream. This is shown graphically in figure 14 below. This mirrors the cumulative decline in GDP presented in figure 1 and is the same for all regions. This indicates that despite what may appear to be relatively modest revenue losses in proportion to GDP, even the moderate crisis scenario will reduce subsequent collections to about 80 per cent of the prior expected path with the more severe scenarios resulting in a reduction of the revenue stream to as low as one half of the level that had been anticipated.
Figure 13: Annual Revenues as a Share of Baseline Projections
Expenditures. The other side of the ledger for the pension systems indicates a very different pattern of outcomes that can be expected to result from the crisis. Unlike collections, benefits formulas are retrospective (they are derived from prior years earning records that remain unchanged as a result of the crisis) making system expenditure adjustment through valorization and indexation parameters lag changes in earnings. Furthermore, “indexing downward” in the environment of falling wages is likely not to occur so the analysis assumes a “no-decrease” constraint in indexation rules.
As would be expected the projections indicate that in contrast to the decline in annual revenues as a share of GDP, the expected expenditures may be projected to increase in relation to the broader economy under such circumstances. These annual projected changes are shown graphically in figure 15. This indicates a very different outcome on the expenditure side with costs in the CE simulation spiking rapidly from between 0.4 per cent to nearly 1 per cent of GDP depending on the scenario and persisting at increased levels for an extended period.
Most interesting is the projected pattern over the long term. This indicates an opposite effect to the short term in which the lower earnings records and diminished density of contributions history due to prolonged unemployment spells results in lower expenditures compared to the baseline estimates. In contrast to the CE projections, the LAC system shows a lower amplitude of the initial spike due to its lower size in relation to GDP but moving rapidly to lower expenditures within a decade as shortened careers decrease future benefits much more in the high accrual rate and shorter average career environment. The MENA example shows similar though less pronounced long term effects.
In interpreting all of these results it is important to keep in mind two caveats. First, the effects over the short term of expenditure increases when measured in proportion to GDP are in part driven by the lower level of GDP included in the crisis scenarios. However, they do not include “dynamic” effects such as higher levels of early retirement and disability benefit claims that are typically associated with significant earnings and employment disruptions.

16
Figure 14: Changes in Expenditure as a Share of GPD.
As with the revenues it is useful to summarize these annual changes into cumulative intervals. These are shown in table 4. This illustrates the cumulative “turning points” for the various systems. In the CE example, with high coverage of an older population and low accrual rates, there is a cumulative increase in expenditures for several decades under all of the scenarios. This is because many current retirees “gain” from under adjustment of benefits to falling wages, while future benefit reductions are relatively small in proportion to the average benefit. The LAC example however indicates how the younger population, shorter average careers and high accrual rates translate into a far more rapid adjustment in expenditure levels. A system with the demographics and parameters characteristics of this region is projected to experience a net decrease in outlays in a decade after the crisis and over the longer term experience a very substantial decrease unless changes are made to the formulas in the future. The more severe is the economic shock from the crisis and the slower the recovery the greater is the reduction in future benefits. In very simplified terms the crisis tends to reduce the size of the pension system in the future. The bigger and the more generous the system is relative to the overall economy, the more “savings” such a reduction will produce.
TABLE 4: CUMULATIVE CHANGE IN EXPENDITURE AS PERCENTAGE OF GDP
2018 2025 2050 2075 CE – Severe Shock – Slow Recovery 7.6% 9.4% 3.3% -3.4% CE – Severe Shock – Fast Recovery 6.3% 8.5% 7.3% 2.9% CE – Moderate Crisis 0.8% 0.3% -0.9% -1.4% LAC – Severe Shock – Slow Recovery 0.0% -3.6% -26.2% -46.1% LAC – Severe Shock – Fast Recovery 0.1% -2.1% -17.0% -27.7% LAC – Moderate Crisis -0.2% -0.9% -6.0% -7.7% MENA – Severe Shock – Slow Recovery 2.2% 2.8% -1.1% -6.2% MENA – Severe Shock – Fast Recovery 2.0% 2.8% 1.1% -2.8% MENA – Moderate Crisis 0.4% 0.2% -0.7% -1.4%

17
Differences in the cumulative impact reflect the differences in the system demography, contribution density, maturity and generosity as shown in figure 16 below.
Figure 15: Annual Expenditure as a Share of Baseline Projections
Net Change in System Financial Balance. Combining the revenue and expenditure projections provides a summary evaluation of the timing and depth of the impact that can be expected from the crisis scenarios. There are two useful ways to illustrate this: (1) as an annual change from the baseline path that shows the depth of the fiscal gap (or surplus) in relation to the baseline path or (2) in relation to the overall financing path of the system. The first of these shows how much of an adjustment would be required to achieve the same overall fiscal outcome for the system in each year compared to the “no-crisis” scenario while the second illustrates the impact of the crisis in the context of the longer term path of the system.
The year by year net changes in system cash flows (excluding the impact of different investment income flows) is shown in figure 17 below. This shows the dramatic difference in the pattern of outcomes that are projected for the different systems. The CE system indicates operating deficits of between 0.5 and 2.0 per cent of GDP in the year following the initial shock followed by relatively small net gains in the later years. The LAC and MENA simulations indicate similar though less pronounced shocks in the earlier years driven by the short and medium term revenue losses. These however are followed by much larger long term positive fiscal impacts relative to the baseline analysis.

18
Figure 16: Net Reduction in Current Financial Balance as Percentage of GDP
Perhaps the most useful summary of the marginal fiscal impact that could be expected from the crisis is the cumulative value of the changes in the projected fiscal gap. This answers the question “What share of base year GDP would need to be transferred to the respective system to retain the long term fiscal balance projected under “no-crisis” scenario over the given time horizon.?” These estimates are shown in table 5 below.
These cumulative values demonstrate the differing magnitude of the effect of the financial crisis on the systems. The CE region shows fiscal impacts over a ten year window that range from 1.7 per cent of GDP for the more optimistic scenario to 13.4 per cent of GDP for a more severe shock. The LAC system on the other hand indicates effects that peak at a far lower level of 2.8 per cent of GDP over the ten year horizon that then rapidly decline and reverse to show very significant positive net impacts over the very long term. The MENA results are similar although less pronounced to those of the LAC simulations.
TABLE 5: CUMULATIVE CHANGE IN FISCAL GAP AS PERCENTAGE OF GDP
2018 2025 2050 2075 CE – Severe Shock – Slow Recovery -13.4% -16.6% -11.3% -4.7% CE – Severe Shock – Fast Recovery -10.3% -12.5% -11.2% -7.5% CE – Moderate Crisis -1.7% -1.4% -0.3% 0.1% LAC – Severe Shock – Slow Recovery -2.8% 0.1% 22.7% 42.5% LAC – Severe Shock – Fast Recovery -1.7% 0.4% 15.0% 25.6% LAC – Moderate Crisis -0.1% 0.6% 5.8% 7.5% MENA – Severe Shock – Slow Recovery -5.2% -6.5% -2.9% 2.4% MENA – Severe Shock – Fast Recovery -3.6% -4.1% -2.7% 0.8% MENA – Moderate Crisis -0.7% -0.8% -0.2% 0.4%

19
It is also very useful to consider the net impact not only as a marginal change but also from the perspective of the changes in nominal fiscal balances for the respective systems. This illustrates the potential effects of the crisis in relation to the effects of the more fundamental factors of demographic environment and underlying elements of system design in the long run. The aggregate fiscal balances of the systems are shown in figure 18.
This indicates a relatively less consequential effect of the crisis in relation to the more fundamental factors that will determine the long run fiscal path of the representative pension systems. As the graphs indicate all of the systems can be expected to experience long term downward trends in their annual fiscal balance. This is primarily a result of the underlying demographic trends of population aging. The projections illustrate that due to these underlying demographics and the fact that the systems benefits and finances do not in any of the cases fully adjust to address these fundamental factors all of the systems can be expected to have cash flow deficits that are a meaningful proportion of GDP.
When viewed in this context the significant marginal effects discussed above appear to be relatively modest in relation to the more fundamental factors. In all cases they have only a relatively small impact and do not alter the longer term pattern of operating deficits projected to extend beyond 5 per cent of GDP within 20 years in CE and LAC examples. The MENA example with a younger population indicates operating surpluses for an extended period but then shows a similar rapid decline during the demographic transition with the same relatively small effects of even the more severe crisis scenarios.
Figure 17: Crisis Scenarios and Long Term Fiscal Balance
The MENA example, because it represents an immature system that will have annual operating surpluses in the near future and consequently build up funding reserves also should consider the potential impact of the crisis on the level of these reserves. The projection of reserve levels for such a system for the three crisis scenarios is shown in figure 19 below. Consistent with the dynamics of the revenue flows discussed above this indicates that the crisis lead to some decline in the funding ratios and value of reserves over most of the projection period but that over the long term the decline in the value of future

20
benefits resulting from the same decrease in employment and earning that diminished revenues would eventually offset this. Perhaps the most interesting aspect of these projections is that the projected exhaustion date of the reserves (the point at which the various lines reach 0 per cent) is effectively the same for the various crisis and baseline scenarios.
Changes in Benefit Levels. Closely related to the possible impact on the long term fiscal status of
the pension systems, the crisis will also affect the benefits derived from these systems. As discussed above the impact over even relatively short terms (for pension systems) can, under some scenarios, be positive on the margin from a purely fiscal perspective. This is due to the manner in which the reduction of coverage resulting from the crisis will translate into shorter periods of covered employment and eventually lower future benefits. Before considering possible policy interventions to address the crisis it is therefore useful to consider the likely change in projected benefit levels that would result from this adjustment process.
The projected average benefit levels expressed as an average earnings replacement rate for the various systems and scenarios are shown in figure 18 below. In the two systems that are assumed to have introduced a funded element (CE and LAC) the total benefit levels are shown as a solid line. The benefits derived for the pay-as-you-go parts of all of the systems are indicated by the dotted lines. The thicker lines in all cases indicate the baseline projections which provide the most relevant point of comparison.
Figure 18: PAYG Reserve and Funding Ratio for MENA

21
Figure 19: Average Benefit as Share of Average Wage
The analysis indicates an interesting and somewhat counter-intuitive aspect of the impact that can be
expected from the financial crisis that will need to be kept in mind in considering potential policy responses. In all cases the effective replacement rate of the systems (average benefits as a proportion of the average wage in the economy) is expected to increase over the short term, both in terms of the overall income replacement rate but also in relation to the pre-crisis baseline. This is not because benefits will increase in absolute terms, in fact they will decline. Instead it is the result of the decline in the value of the earnings that is expected to occur over several years following the crisis. Because wage valorization and pension indexation are usually performed based on the past rather than current inflation and wage data the benefits will also adjust to the lower earnings levels with the lag. More importantly, if negative indexation in response to falling wages does not occur (it is assumed in the analysis that this would be politically infeasible and certainly inconsistent with a fiscal stimulus to address the crisis) the overall benefit levels will remain relatively constant and therefore increase relative to the declining wage base. After about a decade however this effect will begin to disappear as the “beneficiaries” of a “no downward indexation” policy during the crisis years start to die in larger numbers.
This provides an illustration of how the overall fiscal effects of the crisis are achieved. In the initial
years benefits remain high while revenues decline. Over the longer term however the benefit formulas increasingly are derived based on shorter careers (and therefore fall relative to the baseline) while revenues rebound as earnings share of GDP recovers net positive fiscal effects are achieved. Several aspects of this process are useful to note. The first is that over the very long term the replacement rates of all the systems essentially converge to the baseline path. A second is that the slope of the projected decline of replacement rates is greater for the LAC system than the others. This is because of the shorter careers, more generous benefit structure of the pay-as-you-go portion of the Latin American system and the different age mix of current.
Finally, introduction of the funded portion of the systems to some extent dampens the impact of the crisis over the longer term. Although these accounts experience a large reduction in the very short term they represent a relatively small part of the benefit value in the early years. In subsequent years members

22
are presumed to benefit from the rebound in asset values which is faster compared to the recovery of wage growth. This increasingly offsets the lower replacement rates of the pay-as-you-go systems thus limiting the losses in replacement rates. This illustrates some of the diversification value of funded accounts that in past has motivated their adoption.
F. THE CRISIS IMPACT IN THE CONTEXT OF OTHER FACTORS
The foregoing discussion indicates that although the financial crisis can be expected to have some
relatively significant short term impacts, over the longer term, these effects are relatively small in relation to the more fundamental factors of system design and demographic trends. In all of the examples examined both the fiscal balance and average income replacement rates converge to the projected non-crisis baseline over the long term as the systems adjust to lower earnings levels. In some cases the long term fiscal effects can be expected to be positive in the sense that the crisis would somewhat diminish the structural deficits within the current design parameters. Before considering the possible impact of some likely types of policy interventions it is useful to provide some further context by comparing the projected effects to what could be expected to result from changes in fundamental parameters of the system. This is essentially assessing the impact of the financial crisis compared to the effect of a change in the underlying demographic assumptions or a change in a key design/behavioral parameter.
For this purpose the effects of the crisis are compared to the impact of (1) a one additional year increase in overall life expectancy that is achieved by 2050 (roughly the magnitude of the adjustments in these assumptions that have been periodically made to reflect unanticipated longevity gains) and (2) an increase in effective retirement age of one year by 2015 (that could be either a result of a relatively small reform or behavioral change resulting from individuals trying to compensate for lower incomes resulting from the crisis). The impact of each of these changes is evaluated in terms of their effect on the cumulative Net Present Value of changes in revenues and expenditures for the various systems. The results are shown first for the two assumption changes and then for the three crisis scenarios in the table 6 below.
TABLE 6: CUMULATIVE NET FISCAL EFFECTS AS A SHARE OF GDP FOR CRISIS SCENARIOS IN COMPARISON TO CHANGES IN LIFE EXPECTANCY AND EFFECTIVE RETIREMENT AGE
a.
2025 2050 2075 1 year increase in life expectancy by 2050 -0.5% -6.8% -21.6% 1 year increase in retirement age by 2015 14.0% 29.9% 34.8% Severe Shock Slow Recovery -16.6% -11.3% -4.7% Severe Shock Fast Recovery -12.5% -11.2% -7.5%
CE
Moderate Crisis -1.4% -0.3% 0.1% b.
2025 2050 2075 1 year increase in life expectancy by 2050 -0.2% -3.7% -18.4% 1 year increase in retirement age by 2015 8.1% 21.1% 26.7% Severe Shock Slow Recovery -2.2% 19.6% 39.4% Severe Shock Fast Recovery -2.2% 11.4% 22.0%
LAC
Moderate Crisis 0.1% 5.1% 6.8%

23
c.
2025 2050 2075 1 year increase in life expectancy by 2050 -0.1% -2.6% -16.8% 1 year increase in retirement age by 2015 4.0% 13.4% 21.9% Severe Shock Slow Recovery -6.5% -2.9% 2.4% Severe Shock Fast Recovery -4.1% -2.7% 0.8%
MENA
Moderate Crisis -0.8% -0.2% 0.4%
This analysis indicates that although the effects of the crisis on the fiscal balance of the systems can be in excess of 10-15 per cent of GDP in some cases (notably the short to medium term impact in CE) they are roughly proportional, and in some cases considerably less, than what could be expected to result from relatively small refinements in demographic assumptions or a minor (in relation to what is typically imposed by a systemic reform) change in the age of retirement. The effect of a one year increase in average life expectancy has a similar or far greater negative impact on all of the system’s projected financial balances than the most severe crisis scenario. For all of the representative systems the net effect of a one year increase in the effective retirement age would more than offset any negative fiscal effect from any of the crisis scenarios. In the CE system, which shows the greatest potential negative impact of the crisis, an increase in retirement age by one year would effectively offset the overall fiscal impact of the crisis by about 2025 when the mid range crisis scenario is projected to have a negative 12.5 per cent of GDP impact compared to a positive impact on the order of 14 per cent of GDP that would result from the increase in retirement age.
These results provide an important perspective on the sensitivity of the pension systems to short term shocks in comparison to more fundamental factors. This reinforces the earlier observation that overall long term effects of the crisis are relatively small in comparison to the structural challenges imposed by population aging. The analysis indicates that on balance the aggregate long term impact of the crisis is likely to be roughly equivalent to what would result from a marginal revision to a key underlying assumption about demographics or a modest change in the retirement behavior of members. An alternative perspective would view the projected crisis impact as equivalent to the error or uncertainty regarding any one of several key assumptions on which long term projections are typically based. This provides a useful context for consideration of the overall importance of the crisis in relation to other factors and for the consideration of potential policy interventions.
G. EVALUATION OF POTENTIAL POLICY RESPONSES
Faced with the prospect of an immediate increase in fiscal gap that could be as high as 1-2 per cent of
GDP per year at the outset and with a cumulative effect of as much as 15 per cent of GDP over the ensuing decade many countries are considering, or have already imposed revisions to their pension systems. Although there are a very wide range of alternative approaches that have been suggested the policy interventions can generally be viewed as comprising three main groups: (1) raising the retirement ages (which has been a common reform as systems seek to adapt to longevity increases), (2) changing the indexation of benefits from wage (or mixed) to price indexation, and (3) redirecting the flow of contributions from individual accounts (i.e. funded pillars) to the pay-as-you-go system to fill the fiscal gap. The projected effect of each of these approaches is considered in the section below. Other reforms including raising contribution rates or overall reductions in benefit levels have also been adopted by some countries but are less interesting from the analytical perspective.
Raising the Retirements Age. One of the simplest approaches is to raise the minimum age at which members of the system may retire. Many countries have already enacted reforms of this nature to try to

24
bring their systems into balance in response to the large decreases in mortality rates that they have experienced in the past several decades. Figure 19 below shows the projected impact of an increase in the effective retirement age of one year for the various systems compared only to the mid range crisis scenario (a severe shock followed by a rapid recovery).
This is similar to the sensitivity analysis in the preceding section but shows the projected outcome in relation to the overall fiscal position of the system assuming that it has already been subject to the impact of the crisis rather than comparing it to the effect of the crisis against a non-crisis baseline. The graphs indicate that such an intervention would have a small effect on the overall fiscal path of the three systems, although in the case of CE it could add back about 1 per cent of GDP to the systems fiscal balance in the early years. This is partially explained by the fact that by raising the retirement age the period for which benefits would accrue would also increase offsetting the effect shorter periods of pension receipt through higher benefit levels.
Figure 20: Effect of 1-year Increase in Effective Retirement Age by 2015 (Balance as Percentage of GDP)
Moving to Price Indexation. An alternative intervention that has been considered is to change
the form of post retirement indexation of benefits. As discussed in the initial section on assumptions, although practices remain uneven and often ad hoc, most transition and developing countries with pay-as-you-go systems either formally or effectively have indexed their benefits to increases in the overall wage levels. In the baseline cases it is assumed that this practice will continue. However, this type of indexation will face significant challenges as the result of the financial crisis and at least for the short term is unlikely to continue. In addition to a loss in asset values one of the key impacts of the crisis is likely to be a very significant decline in wage levels in these countries, many of which have experienced very rapid increases in wages levels that have exceeded the overall growth in the economies. The substantial decline in wages that has already been observed in many countries and, as noted earlier, is expected to exceed the overall decline in GDP, would, if these policies are adhered to, result in a downward reduction in benefit levels. This however is unlikely to be implemented. For this reason in all of the simulations it is assumed that there would be no negative indexation of benefits despite the assumption of diminishing wage levels.
25
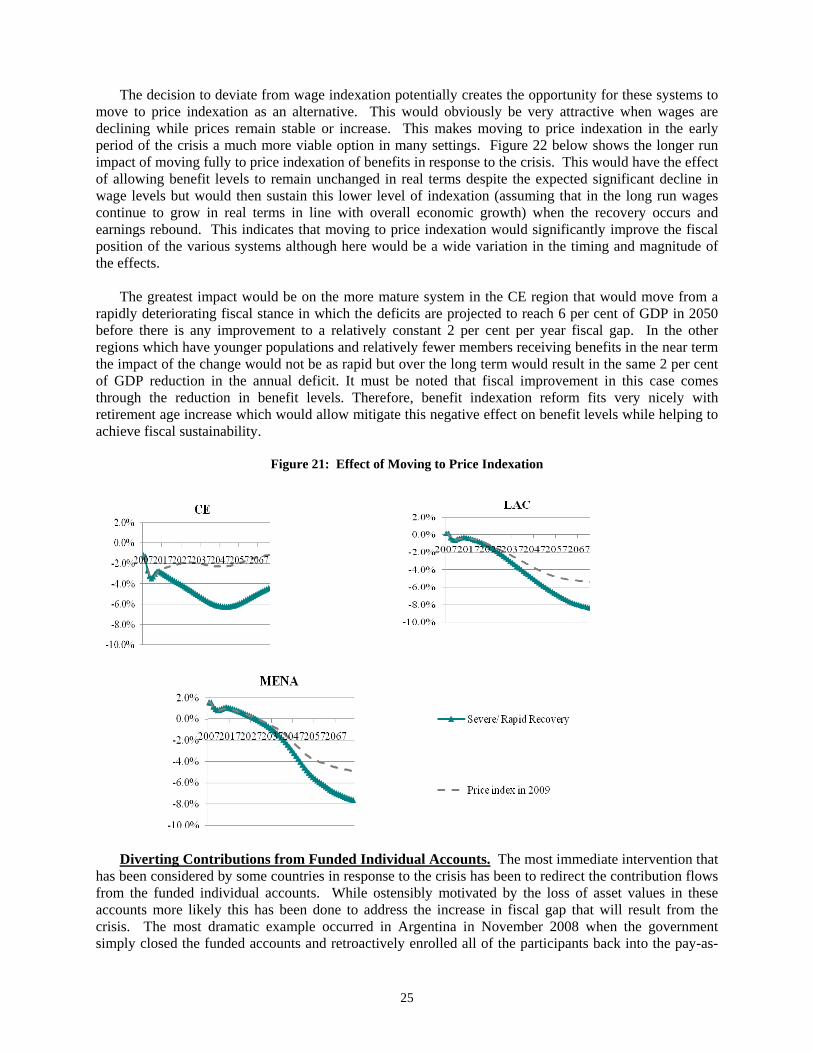
The decision to deviate from wage indexation potentially creates the opportunity for these systems to move to price indexation as an alternative. This would obviously be very attractive when wages are declining while prices remain stable or increase. This makes moving to price indexation in the early period of the crisis a much more viable option in many settings. Figure 22 below shows the longer run impact of moving fully to price indexation of benefits in response to the crisis. This would have the effect of allowing benefit levels to remain unchanged in real terms despite the expected significant decline in wage levels but would then sustain this lower level of indexation (assuming that in the long run wages continue to grow in real terms in line with overall economic growth) when the recovery occurs and earnings rebound. This indicates that moving to price indexation would significantly improve the fiscal position of the various systems although here would be a wide variation in the timing and magnitude of the effects.
The greatest impact would be on the more mature system in the CE region that would move from a rapidly deteriorating fiscal stance in which the deficits are projected to reach 6 per cent of GDP in 2050 before there is any improvement to a relatively constant 2 per cent per year fiscal gap. In the other regions which have younger populations and relatively fewer members receiving benefits in the near term the impact of the change would not be as rapid but over the long term would result in the same 2 per cent of GDP reduction in the annual deficit. It must be noted that fiscal improvement in this case comes through the reduction in benefit levels. Therefore, benefit indexation reform fits very nicely with retirement age increase which would allow mitigate this negative effect on benefit levels while helping to achieve fiscal sustainability.
Figure 21: Effect of Moving to Price Indexation
Diverting Contributions from Funded Individual Accounts. The most immediate intervention that has been considered by some countries in response to the crisis has been to redirect the contribution flows from the funded individual accounts. While ostensibly motivated by the loss of asset values in these accounts more likely this has been done to address the increase in fiscal gap that will result from the crisis. The most dramatic example occurred in Argentina in November 2008 when the government simply closed the funded accounts and retroactively enrolled all of the participants back into the pay-as-

26
you-go system. Other countries have taken a more intermediate approach by permitting members to temporarily suspend their contributions to the funded accounts and to accrue additional benefits in return for the redirection of these contributions to the other parts of the system.
A full evaluation of the consequences of these types of interventions involves a wide range of issues that are likely to be determined more by the specific circumstances of individual pension systems and how such a transition is implemented than the kinds of basic principles that are addressed in the preceding analysis. These include the valuation and disposition of the assets, generosity of the pay-as-you-go system, how the individual countries may have financed the transition costs to the funded system, the period and timing of any temporary diversions and the specific characteristics of individuals who had elected to transfer contributions to a funded account in countries where this was optional.
It is feasible however to consider this approach in a very simplified fashion to shed some light on possible outcomes for the two representative systems with funded individual accounts, those in the CE and LAC regions, that are addressed in the simulations. This is done by simply assuming that the systems would close the funded pillar and retroactively enroll all of the members into the earnings based pay-as-you-go system as if they had continued to make contributions all along. This would generate additional positive cash flows in the short term in return for incurring additional benefit obligations over the longer term. This is because those enrolled in the funded elements of the system are younger and would not be eligible to receive benefits until at least a decade after such a transition. It is very important to note that the simulations do not include any use of the assets of the funded system in future financing of the pension so represent only a limited evaluation of such an approach. However, since a very large portion of the accumulated assets in these funded systems remains in government debt it is perhaps a fairly realistic scenario because the motivations for such an intervention would likely include retiring outstanding public debt that was increasingly difficult to service due to the financial crisis.
Figure 21 below shows the results of this relatively simple simulation of the timing of revenues and expenditures that would result in the two stylized systems if the funded individual accounts were closed and the affected individuals reverted to the earnings based pay-as-you-go system. This indicates that this could significantly address the cash flow reductions in the short term but would result in greater liabilities over the longer term exactly when cash flow problems are projected to become even more severe.
Figure 22: Diversion of Funded Account Contributions to the pay-as-you-go System
Table 7 below summarizes this analysis by showing the cumulative fiscal effect of such a diversion of
contributions for the two systems. This shows that the fiscal effect – relative to the crisis effects with no intervention – would have a larger impact in the Central European system which has less generous benefit levels and therefore lower costs for re-enrolling members in the PAYG elements than in the LAC system with more generous future benefit levels. It also indicates that over the very long term in LAC the costs would exceed the increased revenue.

27
TABLE 7: CUMULATIVE NET FISCAL EFFECT FROM CONTRIBUTION DIVERSION AS PERCENTAGE GDP
2025 2050 2075 CE, Severe Shock Fast Recovery 17.9% 31.4% 7.2% LAC, Severe Shock Fast Recovery 8.0% 13.6% -21.8%
H. CONCLUDING OBSERVATIONS
The global financial crisis can be expected to have a significant impact on the various types of public
pension systems currently in place in developing and transition economies. There is however no simple way to characterize these impacts because they will vary between different systems and depending on the time period under consideration.
Over the short term the crisis will impose some rather severe impacts on the financing flows that support the three types of pension systems evaluated. This is because the decline in earnings and employment levels resulting from the crisis will severely diminish the revenues of systems. This will result in a shortfall of revenues relative to pre-crisis expectations that can amount to as much as 1 per cent of GDP and extend over a number of years if the recovery is prolonged. In contrast benefit levels (and therefore expenditures) that are derived from earnings histories will remain largely unaffected. The net effect will be the emergence of a cumulative fiscal gap that can be expected to be between less than 1 per cent of GDP if the crisis is moderate and recovery fast to as high as cumulative 13 per cent of GDP over the forthcoming decade. The systems in Central Europe that are more mature and have a higher dependency rates will be on the high end of these estimates while those in Latin America and the Middle East-North Africa region will be on the lower end. This gap will impose cash flow problems for the CE and LAC systems that do not maintain reserves but will be likely to simply alter the path of reserve accumulation in the MENA region.
Over the longer run (50-75 years), benefit levels will adjust downward form the pre-crisis path and all
of the systems will reach a new equilibrium. In the LAC and MENA region with a younger population this will occur more quickly and the net effect on the fiscal balance of the system in the LAC region can actually be anticipated to be positive within a couple of decades because of the longer term decline in benefits compared to the pre-crisis path and expected recovery of the revenue stream. In the MENA region the main effect will be to change the path of reserve accumulation although reserve levels can be expected to converge to the pre-crisis path over the long term.
However, despite the significant short term effects of the crisis in comparison to prior expectations, the impact of the crisis is likely to be relatively small in relation to the more fundamental factors of system design and the underlying demographic structure. The net effect of the crisis is likely to have only a small overall effect on the continuing deteriorating finances of these pension systems that is driven primarily by population aging and unsustainable benefit formulas. Most systems will be facing large and emerging financing shortfalls in the forthcoming decades which the financial crisis will accentuate to only a marginal degree. Looking at this another way, the overall effect of the crisis is likely to be less than the impact of an additional one year gain in life expectancy over the next 40 years, a difference that is less than many countries have experienced in the past and is well within the error in current projections for future mortality rates.

28
Countries facing the short term impacts of the crisis will continue to have to make difficult choices if they are unable to finance the fiscal deficits they will face in the near term. They will likely require accessing new financing to cover the gap in the short term or some reduction of benefit levels. Over the longer term the systems will reach a new equilibrium in which lower benefits will offset the revenue losses of the crisis so the challenge is largely one of balancing the financing over the relevant time period which will vary considerably between countries and regions.
Diverting the flows from funded individual accounts which has been one of the more drastic interventions considered in response to the crisis can address the short term cash flow issues to some degree. This however will come at a potentially high long term cost. In the LAC region with more generous benefits and younger workers the net effect from such an intervention could be significantly higher liabilities and financing deficits in the future. In Central European systems with less generous benefits the fiscal costs to the guarantor of the scheme will not be significant however such a change will potentially result in meaningful prospective benefit losses to younger members because the PAYG benefit formulas are less generous and the affected members would lose any upside potential from investments in the financial markets. In both regions such a policy would roll back the reforms of the previous two decades that were designed to prefund the future costs associated with expected population aging and leave members solely dependent on the PAYG system.
One change with potentially very significant effects on the long term financing balance of public pension systems that the crisis may provide an impetus for is a change from wage to price indexing. Although most systems formally or effectively wage index benefits there will be strong pressure to deviate from this practice in the face of declining wage levels. A move to price indexation that would surely be popular and would increase costs over the short term could have a very meaningful impact on the long term fiscal sustainability of these systems. Such a change would, however, result in lower future benefit levels in relation to prevailing earnings so would require careful consideration.
Viewed in the full context of these complex effects and possible responses the financial crisis can be perceived as simultaneously a serious challenge to be addressed but also an opportunity.