THE ILLUSION OF ASIAN SUCCESS - c.ymcdn.com · THE ILLUSION OF ASIAN SUCCESS: Buck Gee ... Bay Area...
42
THE ILLUSION OF ASIAN SUCCESS: Buck Gee - Executive Advisor, Ascend Denise Peck - Executive Advisor, Ascend Scant Progress for Minorities in Cracking the Glass Ceiling from 2007–2015
Transcript of THE ILLUSION OF ASIAN SUCCESS - c.ymcdn.com · THE ILLUSION OF ASIAN SUCCESS: Buck Gee ... Bay Area...

THE ILLUSION OF ASIAN SUCCESS:
Buck Gee - Executive Advisor, AscendDenise Peck - Executive Advisor, Ascend
Scant Progress for Minorities in Cracking the Glass Ceiling from 2007–2015
THE ILLUSION OF ASIAN SUCCESS: Scant Progress for Minorities in Cracking the Glass Ceiling from 2007–2015
2
TABLE OF CONTENTS
EXECUTIVE SUMMARY � � � � � � � � � � � � � � � � � � � � � � � � � � � � � � � � � � � � � � � � � � � � � � � � � � � � � � � � � � � � 3
INTRODUCTION � � � � � � � � � � � � � � � � � � � � � � � � � � � � � � � � � � � � � � � � � � � � � � � � � � � � � � � � � � � � � � � � � 5
EEOC WORKPLACE DIVERSITY DATA � � � � � � � � � � � � � � � � � � � � � � � � � � � � � � � � � � � � � � � � � � � � � � � 5
INCREASED NUMBERS OF MINORITY EXECUTIVES, BUT LITTLE PROGRESS � � � � � � � � � � � � � � � 6
EVALUATING THE MILLENNIAL EFFECT IN THE PIPELINE� � � � � � � � � � � � � � � � � � � � � � � � � � � � � � 10
THE INTERSECTION OF RACE AND GENDER � � � � � � � � � � � � � � � � � � � � � � � � � � � � � � � � � � � � � � � 12
COMPARING THE EFFECTS OF RACE VS GENDER � � � � � � � � � � � � � � � � � � � � � � � � � � � � � � � � � � � � 15
RACIAL AND GENDER GAPS FOR MINORITY WOMEN AND MEN � � � � � � � � � � � � � � � � � � � � � � 16
DETAILED ANALYSIS OF ASIAN MEN AND WOMEN � � � � � � � � � � � � � � � � � � � � � � � � � � � � � � � � � � 18
DETAILED ANALYSIS OF BLACK MEN AND WOMEN � � � � � � � � � � � � � � � � � � � � � � � � � � � � � � � � � 20
DETAILED ANALYSIS OF HISPANIC MEN AND WOMEN � � � � � � � � � � � � � � � � � � � � � � � � � � � � � � � 22
A SUMMARY FRAMEWORK AND KEY CHALLENGES � � � � � � � � � � � � � � � � � � � � � � � � � � � � � � � � � � 23
IMPLICATIONS FOR SILICON VALLEY � � � � � � � � � � � � � � � � � � � � � � � � � � � � � � � � � � � � � � � � � � � � � � 25
THE ILLUSION OF ASIAN SUCCESS: Scant Progress for Minorities in Cracking the Glass Ceiling from 2007–2015
3
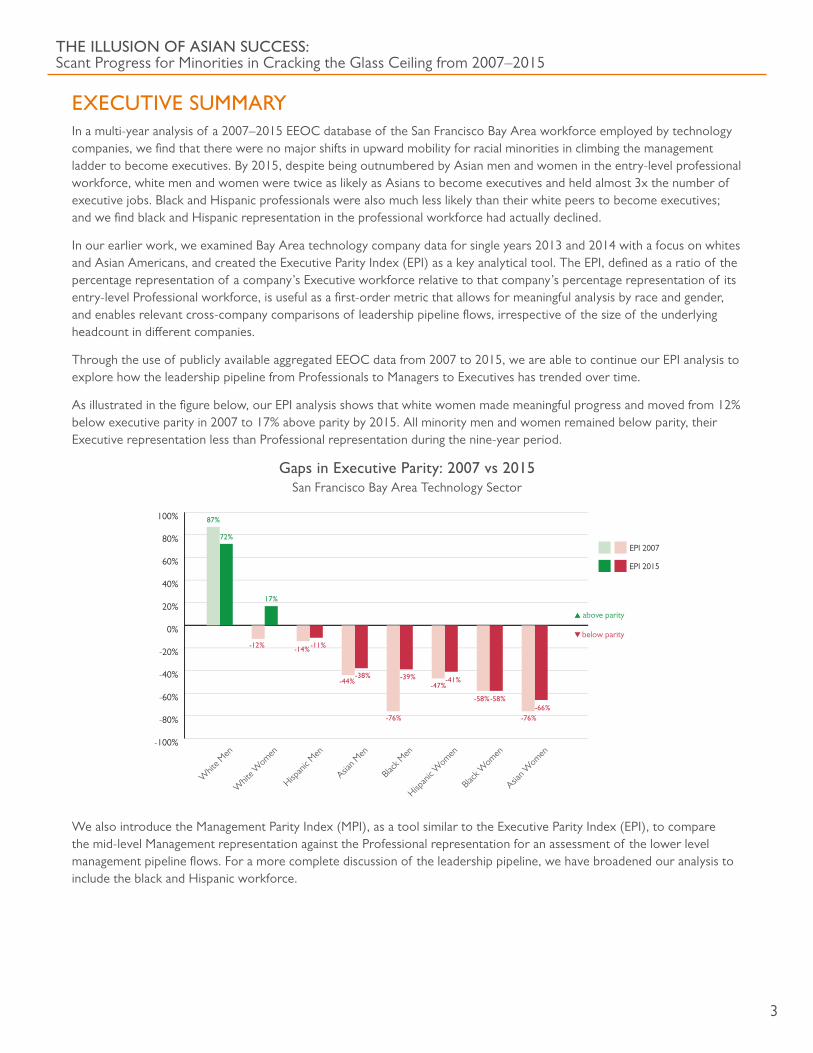
EXECUTIVE SUMMARYIn a multi-year analysis of a 2007–2015 EEOC database of the San Francisco Bay Area workforce employed by technology companies, we find that there were no major shifts in upward mobility for racial minorities in climbing the management ladder to become executives. By 2015, despite being outnumbered by Asian men and women in the entry-level professional workforce, white men and women were twice as likely as Asians to become executives and held almost 3x the number of executive jobs. Black and Hispanic professionals were also much less likely than their white peers to become executives; and we find black and Hispanic representation in the professional workforce had actually declined.
In our earlier work, we examined Bay Area technology company data for single years 2013 and 2014 with a focus on whites and Asian Americans, and created the Executive Parity Index (EPI) as a key analytical tool. The EPI, defined as a ratio of the percentage representation of a company’s Executive workforce relative to that company’s percentage representation of its entry-level Professional workforce, is useful as a first-order metric that allows for meaningful analysis by race and gender, and enables relevant cross-company comparisons of leadership pipeline flows, irrespective of the size of the underlying headcount in different companies.
Through the use of publicly available aggregated EEOC data from 2007 to 2015, we are able to continue our EPI analysis to explore how the leadership pipeline from Professionals to Managers to Executives has trended over time.
As illustrated in the figure below, our EPI analysis shows that white women made meaningful progress and moved from 12% below executive parity in 2007 to 17% above parity by 2015. All minority men and women remained below parity, their Executive representation less than Professional representation during the nine-year period.
Gaps in Executive Parity: 2007 vs 2015 San Francisco Bay Area Technology Sector
We also introduce the Management Parity Index (MPI), as a tool similar to the Executive Parity Index (EPI), to compare the mid-level Management representation against the Professional representation for an assessment of the lower level management pipeline flows. For a more complete discussion of the leadership pipeline, we have broadened our analysis to include the black and Hispanic workforce.
Asian M
en
Asian W
omen
Hispan
ic Men
Whit
e Men
Black M
enHisp
anic
Women
Whit
e Women
Black W
omen-100%
-80%
-60%
-40%
-20%
0%
20%
40%
60%
80%
100%
above parity
below parity
EPI 2007
EPI 2015
87%
72%
17%
-12% -14%-11%
-44%-38%
-76%
-39%-47%
-41%
-58%-58%
-76%-66%

THE ILLUSION OF ASIAN SUCCESS: Scant Progress for Minorities in Cracking the Glass Ceiling from 2007–2015
4
In analyzing the changes in representation of the leadership pipeline by race and gender in the Bay Area technology sector from 2007–2015, we also find that:
• Asians had become the largest racial cohort of Professionals, yet• Asians were the least likely among all races to become Managers and Executives, and• Asian women were the least likely to become Executives.
• The number of black Executives had increased by 43%, yet• An 18% decline in the number of black Managers could portend a decline of black Executives, and• The number of black Professional women declined by 13%.
• The number of Hispanic Executives had increased by 24%, yet• Hispanics remained only 3.5% of all Executives, and• Hispanics declined from 5.2% to 4.8% of all Professionals.
• The representation of white women as Executives had significantly improved by 2015, exceeding their representation as Professionals, yet
• Similar improvements were not seen for any racial minority women group, and• Race remained a more significant factor than gender in impacting the glass ceiling.
Our analysis points to distinctive diversity challenges for each racial/gender cohort in Bay Area technology companies, with different solutions for each, namely:
• Company programs to attract and retain talent should focus on black, Hispanic, and white women. Special emphasis should be given to retaining black women.
• Company programs to develop and promote leaders should focus on both men and women in the black, Hispanic, and Asian workforce. Special emphasis should focus on Hispanic and Asian women.
Having previously analyzed national EEO-1 reports from 2014, 2015, and 2016 made public by individual Bay Area technology companies, we determined that our analysis of pipeline diversity at the Bay Area aggregated technology sector level in this report is entirely consistent with what we saw at individual company levels. The consistency, along with the scant progress for women and minorities in the Bay Area sector, suggests that the diversity challenge is a region-wide sector problem that should be addressed by the leading companies working collectively rather than each technology company working individually.
The need for a collective effort has recently been recognized at the national level with the recent announcement of Fortune 500 CEO-led alliance “CEO Action for Diversity and Inclusion” as a forum for sharing best practices. Many in the Bay Area have already joined the alliance, including CEOs from Adobe, AMD, HPE, Cisco, Netapp, and Salesforce. But as the next step, our clarion call is for the leading technology companies to join together in a cooperative effort to aggregate and analyze their internal data by race and gender; proactively enlist their minority leadership and employee community involvement; and develop joint and individual metrics to bend the curve in the Bay Area’s ability to attract, retain, and promote talented women and minorities.
THE ILLUSION OF ASIAN SUCCESS: Scant Progress for Minorities in Cracking the Glass Ceiling from 2007–2015
5
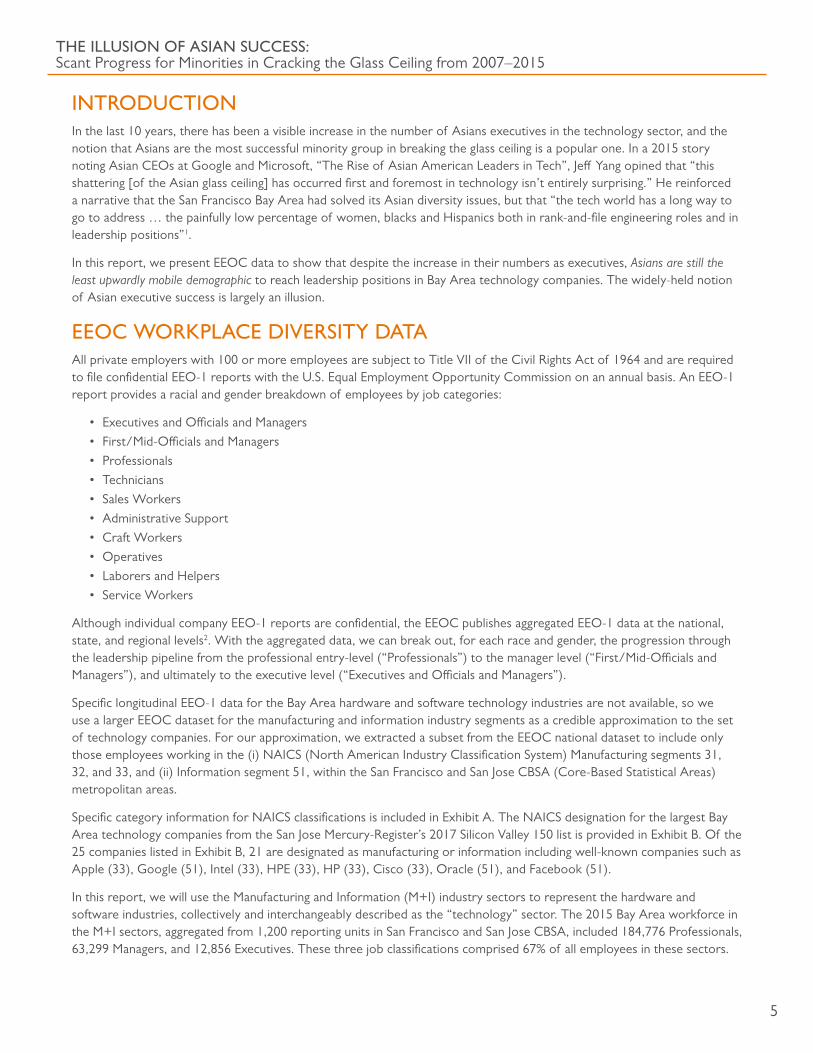
INTRODUCTIONIn the last 10 years, there has been a visible increase in the number of Asians executives in the technology sector, and the notion that Asians are the most successful minority group in breaking the glass ceiling is a popular one. In a 2015 story noting Asian CEOs at Google and Microsoft, “The Rise of Asian American Leaders in Tech”, Jeff Yang opined that “this shattering [of the Asian glass ceiling] has occurred first and foremost in technology isn’t entirely surprising.” He reinforced a narrative that the San Francisco Bay Area had solved its Asian diversity issues, but that “the tech world has a long way to go to address … the painfully low percentage of women, blacks and Hispanics both in rank-and-file engineering roles and in leadership positions”1.
In this report, we present EEOC data to show that despite the increase in their numbers as executives, Asians are still the least upwardly mobile demographic to reach leadership positions in Bay Area technology companies. The widely-held notion of Asian executive success is largely an illusion.
EEOC WORKPLACE DIVERSITY DATAAll private employers with 100 or more employees are subject to Title VII of the Civil Rights Act of 1964 and are required to file confidential EEO-1 reports with the U.S. Equal Employment Opportunity Commission on an annual basis. An EEO-1 report provides a racial and gender breakdown of employees by job categories:
• Executives and Officials and Managers• First/Mid-Officials and Managers• Professionals• Technicians• Sales Workers• Administrative Support• Craft Workers• Operatives • Laborers and Helpers• Service Workers
Although individual company EEO-1 reports are confidential, the EEOC publishes aggregated EEO-1 data at the national, state, and regional levels2. With the aggregated data, we can break out, for each race and gender, the progression through the leadership pipeline from the professional entry-level (“Professionals”) to the manager level (“First/Mid-Officials and Managers”), and ultimately to the executive level (“Executives and Officials and Managers”).
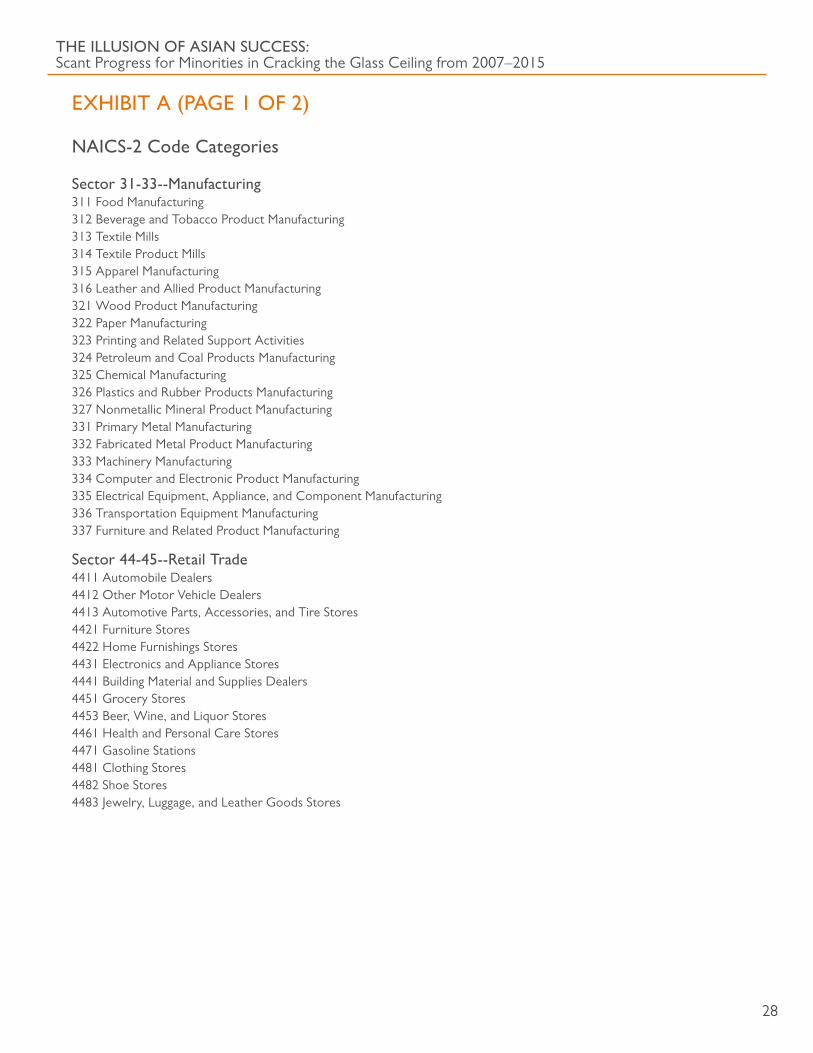
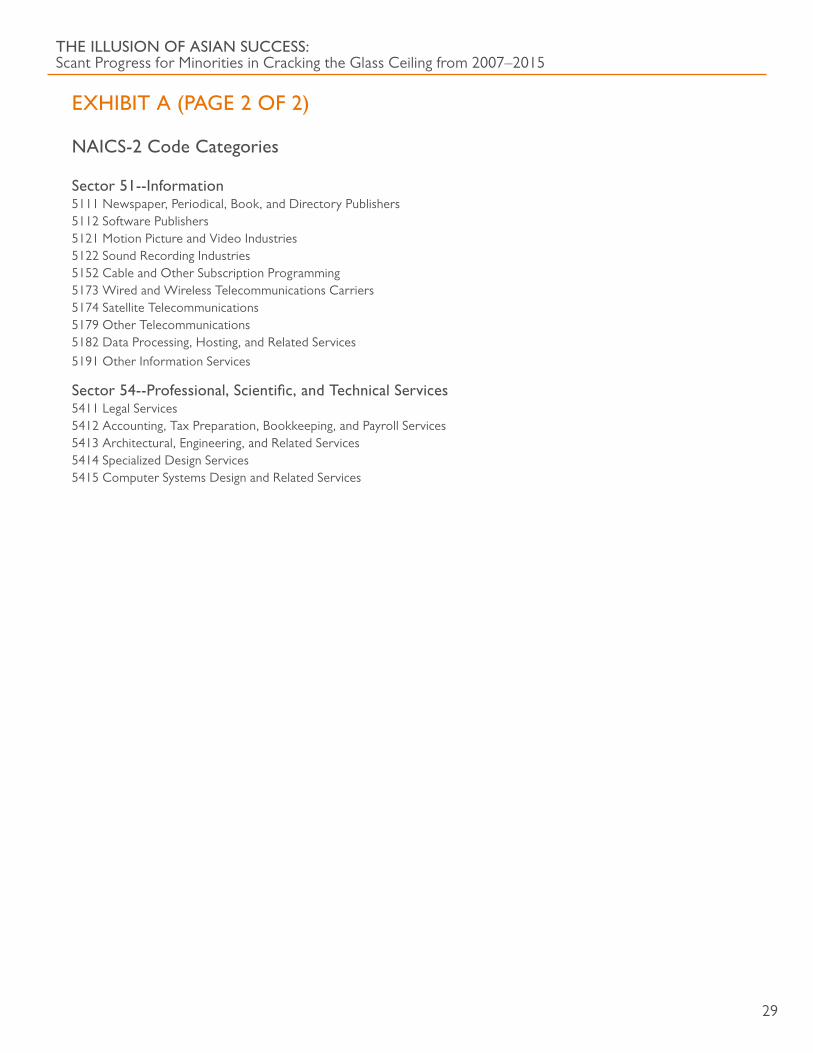
Specific longitudinal EEO-1 data for the Bay Area hardware and software technology industries are not available, so we use a larger EEOC dataset for the manufacturing and information industry segments as a credible approximation to the set of technology companies. For our approximation, we extracted a subset from the EEOC national dataset to include only those employees working in the (i) NAICS (North American Industry Classification System) Manufacturing segments 31, 32, and 33, and (ii) Information segment 51, within the San Francisco and San Jose CBSA (Core-Based Statistical Areas) metropolitan areas.
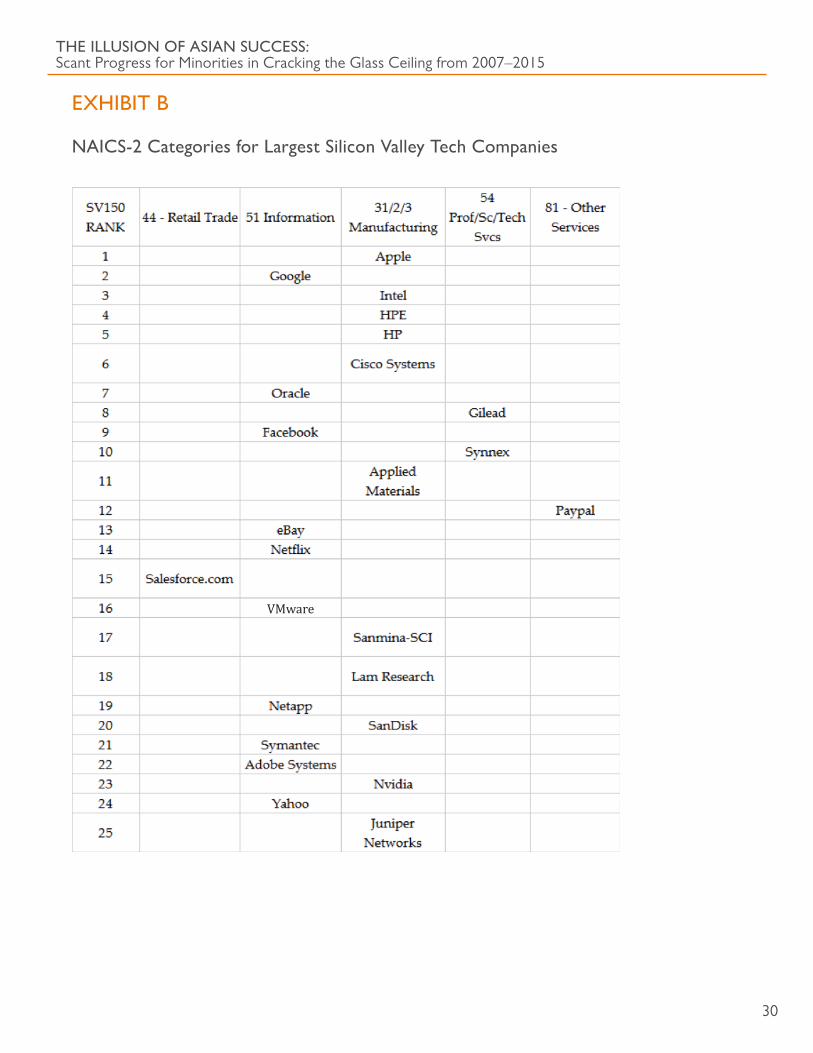
Specific category information for NAICS classifications is included in Exhibit A. The NAICS designation for the largest Bay Area technology companies from the San Jose Mercury-Register’s 2017 Silicon Valley 150 list is provided in Exhibit B. Of the 25 companies listed in Exhibit B, 21 are designated as manufacturing or information including well-known companies such as Apple (33), Google (51), Intel (33), HPE (33), HP (33), Cisco (33), Oracle (51), and Facebook (51).
In this report, we will use the Manufacturing and Information (M+I) industry sectors to represent the hardware and software industries, collectively and interchangeably described as the “technology” sector. The 2015 Bay Area workforce in the M+I sectors, aggregated from 1,200 reporting units in San Francisco and San Jose CBSA, included 184,776 Professionals, 63,299 Managers, and 12,856 Executives. These three job classifications comprised 67% of all employees in these sectors.

THE ILLUSION OF ASIAN SUCCESS: Scant Progress for Minorities in Cracking the Glass Ceiling from 2007–2015
6
We did not include the professional/technical services sector as a component of the dataset in the EPI analysis in this report, but sensitivity analyses of 2015 data including this additional sector result in similar EPI figures and do not substantially change our EPI findings for that year. In addition, an EPI analysis using a 2014 aggregated dataset of 75 technology companies published as part of an EEOC study3 was consistent with an EPI analysis of the 2014 manufacturing and information sectors. We only used datasets from 2007 to 2015 because the available datasets2 from earlier years 1996-2006 were not sufficiently disaggregated by industry segments and region for our purposes. Additional discussion about the dataset is attached as Exhibit C.
For the remainder of this report, we use the terms “Executives”, “Managers”, and “Professionals” to refer to the three highest EEO-1 job categories. Executives are generally defined by the EEOC as “…those individuals within two reporting levels of the CEO, whose responsibilities require frequent interaction with the CEO”. Managers are generally defined as “Individuals who serve as managers, other than those who serve as Executive/Senior Level Officials and Managers”; this category is commonly referred to as middle management. Professionals are defined as non-management jobs requiring “… bachelor and graduate degrees, and/or professional certification”; this category is commonly referred to as entry-level or individual contributors. Detailed definitions of these job categories are in Exhibit D.
Our racial terminology in this report uses the major race categories in the EEO-1 reports: White, Black or African American, Hispanic or Latino, and Asian. Consistent with the EEO-1 definition, we use the term “Asians” to refer to Asians and Asian Americans, both foreign-born and U.S.-born, and to include any person having origins in the Far East, Southeast Asia, or the Indian Subcontinent.
INCREASED NUMBERS OF MINORITY EXECUTIVES, BUT LITTLE PROGRESSThe EEOC data show that the number of minority Executives increased from 2007 to 2015. As detailed in Figure 1, the number of nonwhite Executives increased faster than the number of white Executives. From 2007 to 2015, Asians had the largest increase at 59%. Black (1.1%) and Hispanic Executives (3.5%) remained a very small share of total Executives, making up only 4.6% in 2015. The “Other” racial category in Figure 1 reflects a total of the following races from the EEO-1 reports: American Indian, Hawaiian, Pacific Islander, Alaskan Native, and two-or-more races. Although “Other” is included in the charts below, this category will not be included in our subsequent analysis.
Figure 1� Executive Workforce by Race: 2007–2015 Bay Area Manufacturing and Information (M+I) Sectors

THE ILLUSION OF ASIAN SUCCESS: Scant Progress for Minorities in Cracking the Glass Ceiling from 2007–2015
7
The numbers in Figure 1 reflect the actual employee numbers from the aggregated EEO-1 reports, but to quantify and analyze upward mobility through the management pipeline, additional comparative context is required to properly interpret these tables.
Consider the 2015 Executive representation of Asians (25.2%). As a measure of upward mobility through the management pipeline, is this good or bad?
• As Asians were only 5.7%4 of the U.S. population, would 25.2% mean that they were overrepresented as Executives? Or…
• As Asians were 35%4 of the Bay Area population, would 25.2% mean that they were underrepresented as Executives?
We suggest that neither context is correct if we want to evaluate upward mobility through the management pipeline. Comparisons with the external U.S. Census population reflect both the success of companies to (i) recruit from the external population for their employee workforce and (ii) promote talented employees through the internal pipeline. A better approach to evaluate upward mobility is to look only at the internal pipeline numbers, comparing the internal executive population directly to the professional population in the pipeline.
Figure 2 summarizes the EEO-1 data as percentage representation for each race in the Professional categories. Using the Executive data from Figure 1 and Professional data from Figure 2, we can better understand the recruiting vs promotion effects for Asians in technology:
i. Recruiting: Asians were 47.3% of the Professional individual contributors in 2015. When compared to their national or regional population, Asians were successfully being recruited into the technology sector.
ii. Promotions: Asians were 25.2% of Executives in 2015. Compared to their 47.3% share of the Professional workforce, Asians were not as successfully being promoted to the Executive level.
Figure 2� Professional Representation by Race: 2007–2015 Bay Area Manufacturing and Information (M+I) Sectors
M+I Professionals (%) 2007 2008 2009 2010 2011 2012 2013 2014 2015White prof (%) 47.1% 46.5% 46.6% 46.2% 45.8% 45.0% 44.9% 44.4% 43.8%Black prof (%) 2.5% 2.4% 2.2% 2.2% 2.0% 2.0% 2.0% 1.9% 1.9%Hispanic prof (%) 5.2% 4.9% 4.9% 4.8% 4.7% 4.7% 4.7% 4.7% 4.8%Asian prof (%) 44.4% 45.0% 45.1% 45.2% 45.6% 46.2% 46.2% 46.7% 47.3%
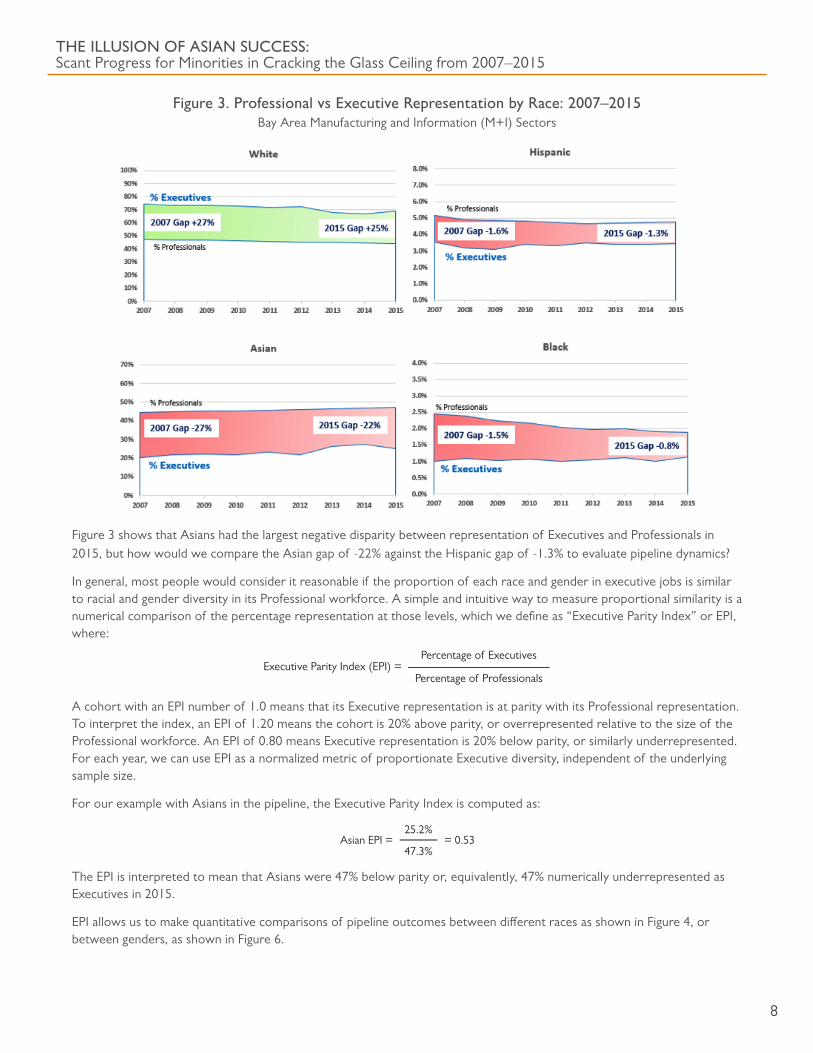
Figure 3 shows Executive vs Professional comparison charts, using the data from Figures 1 and 2. It illustrates that the Executive representation of Asians, blacks, and Hispanics was lower than their Professional representation from 2007 to 2015. It also shows that white Executive representation substantially exceeded white Professional representation and that the Executive vs Professional gap declined only slightly from 27% to 25% in the nine years 2007–2015.
THE ILLUSION OF ASIAN SUCCESS: Scant Progress for Minorities in Cracking the Glass Ceiling from 2007–2015
8
Figure 3� Professional vs Executive Representation by Race: 2007–2015 Bay Area Manufacturing and Information (M+I) Sectors
Figure 3 shows that Asians had the largest negative disparity between representation of Executives and Professionals in 2015, but how would we compare the Asian gap of -22% against the Hispanic gap of -1.3% to evaluate pipeline dynamics?
In general, most people would consider it reasonable if the proportion of each race and gender in executive jobs is similar to racial and gender diversity in its Professional workforce. A simple and intuitive way to measure proportional similarity is a numerical comparison of the percentage representation at those levels, which we define as “Executive Parity Index” or EPI, where:
A cohort with an EPI number of 1.0 means that its Executive representation is at parity with its Professional representation. To interpret the index, an EPI of 1.20 means the cohort is 20% above parity, or overrepresented relative to the size of the Professional workforce. An EPI of 0.80 means Executive representation is 20% below parity, or similarly underrepresented. For each year, we can use EPI as a normalized metric of proportionate Executive diversity, independent of the underlying sample size.
For our example with Asians in the pipeline, the Executive Parity Index is computed as:
The EPI is interpreted to mean that Asians were 47% below parity or, equivalently, 47% numerically underrepresented as Executives in 2015.
EPI allows us to make quantitative comparisons of pipeline outcomes between different races as shown in Figure 4, or between genders, as shown in Figure 6.
THE ILLUSION OF ASIAN SUCCESS: Scant Progress for Minorities in Cracking the Glass Ceiling from 2007–2015
9
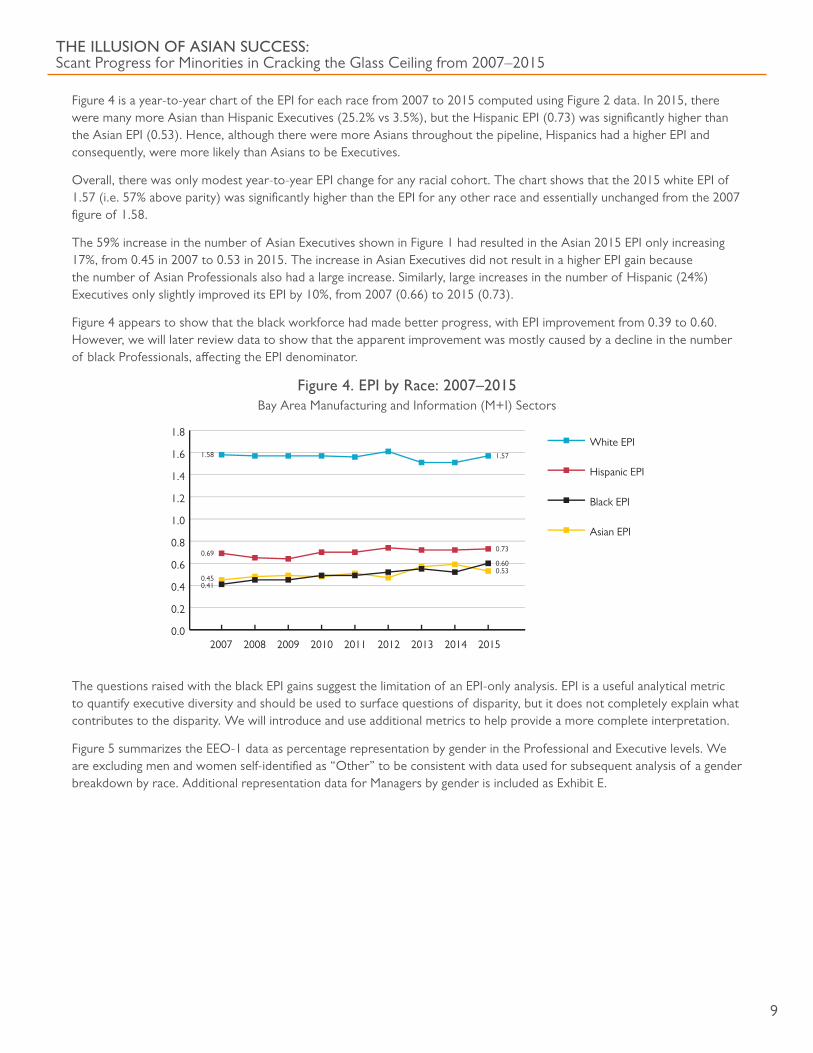
Figure 4 is a year-to-year chart of the EPI for each race from 2007 to 2015 computed using Figure 2 data. In 2015, there were many more Asian than Hispanic Executives (25.2% vs 3.5%), but the Hispanic EPI (0.73) was significantly higher than the Asian EPI (0.53). Hence, although there were more Asians throughout the pipeline, Hispanics had a higher EPI and consequently, were more likely than Asians to be Executives.
Overall, there was only modest year-to-year EPI change for any racial cohort. The chart shows that the 2015 white EPI of 1.57 (i.e. 57% above parity) was significantly higher than the EPI for any other race and essentially unchanged from the 2007 figure of 1.58.
The 59% increase in the number of Asian Executives shown in Figure 1 had resulted in the Asian 2015 EPI only increasing 17%, from 0.45 in 2007 to 0.53 in 2015. The increase in Asian Executives did not result in a higher EPI gain because the number of Asian Professionals also had a large increase. Similarly, large increases in the number of Hispanic (24%) Executives only slightly improved its EPI by 10%, from 2007 (0.66) to 2015 (0.73).
Figure 4 appears to show that the black workforce had made better progress, with EPI improvement from 0.39 to 0.60. However, we will later review data to show that the apparent improvement was mostly caused by a decline in the number of black Professionals, affecting the EPI denominator.
Figure 4� EPI by Race: 2007–2015 Bay Area Manufacturing and Information (M+I) Sectors
0.0
0.2
0.4
0.6
0.8
1.0
1.2
1.4
1.6
1.8
Hispanic EPI
Asian EPI
White EPI
Black EPI
2007 2008 2009 2010 2011 2012 2013 2014 2015
1.58 1.57
0.73
0.600.53
0.69
0.450.41
Figure 4. EPI by Race: 2007–2015Bay Area Manufacturing and Information (M+1) Sectors
The questions raised with the black EPI gains suggest the limitation of an EPI-only analysis. EPI is a useful analytical metric to quantify executive diversity and should be used to surface questions of disparity, but it does not completely explain what contributes to the disparity. We will introduce and use additional metrics to help provide a more complete interpretation.
Figure 5 summarizes the EEO-1 data as percentage representation by gender in the Professional and Executive levels. We are excluding men and women self-identified as “Other” to be consistent with data used for subsequent analysis of a gender breakdown by race. Additional representation data for Managers by gender is included as Exhibit E.

THE ILLUSION OF ASIAN SUCCESS: Scant Progress for Minorities in Cracking the Glass Ceiling from 2007–2015
10
Figure 5� Representation by Gender in the Pipeline: 2007–2015 Bay Area Manufacturing and Information (M+I) Sectors
M+I Executives 2007 2008 2009 2010 2011 2012 2013 2014 2015All men (%) 82.0% 81.2% 82.3% 81.3% 80.9% 80.4% 79.2% 79.3% 79.0%All women (%) 17.0% 17.9% 16.9% 17.6% 18.1% 18.3% 19.7% 19.5% 19.6%
Figure 6 is a year-to-year chart of the EPI by gender from 2007 to 2015 computed using Figure 5 data. Although the EPI for women improved by 28% from 0.53 to 0.68, their executive representation remained 32% below parity.
Figure 6� EPI by Gender: 2007–2015 Bay Area Manufacturing and Information (M+I) Sectors
2007 2008 2009 2010 2011 2012 2013 2014 2015
Figure 6. EPI by Gender: 2007–2015Bay Area Manufacturing and Information (M+1) Sectors
0.0
0.2
0.4
0.6
0.8
1.0
1.2
1.4
Women EPI
Men EPI1.22
1.15
0.68
0.53
The complete dataset of Executives, Managers, and Professionals with numbers, percentage representation, and EPI disaggregated by race and gender is provided in Exhibit F.
In summary, our EPI analysis of 2007–2015 data shows that by 2015:
• Although the number of minority Executives increased, the Executive representation relative to the size of minority Professionals had not substantially changed.
• All racial minorities had an EPI below parity, and Asians had the lowest EPI (0.53), 47% below parity.• The EPI gender analysis shows that despite some gains, women were 32% below parity.
EVALUATING THE MILLENNIAL EFFECT IN THE PIPELINEWe have often heard an argument that the Asian gaps will eventually be closed as more Asian millennials reach the executive age. The argument contends that Asian millennials are comfortable in a more diverse and inclusive workplace, are more eager for leadership roles, and will have fewer barriers reaching management and executive levels. We have also heard a more general argument that the culture in Bay Area technology companies has markedly changed in the 21st century and that these companies are committed to build a diverse workforce and leadership team. As a result, the next generation of leaders will be more diverse in gender and race.

THE ILLUSION OF ASIAN SUCCESS: Scant Progress for Minorities in Cracking the Glass Ceiling from 2007–2015
11
We can use the 2007–2015 data to evaluate these arguments. If the Asian millennial/new century argument is valid, we should have seen evidence of changes in the leadership pipeline through 2007–2015. Millennials are generally defined as those born between 1980–1995, so that the leading edge of the millennial generation would have been 27 years old in 2007 and 35 in 2015. It may be too early to see a “millennial effect” for Asians at executive levels because millennials are just beginning to reach that stage in their careers. However, millennials should have been a steadily increasing portion of middle management in the 2007–2015 period and, by 2015, should have dominated the ranks of middle management. The millennial argument would forecast more Asian executives in the future because there would be more Asian managers today.
To examine whether Asian millennials have had an effect on the racial diversity at middle manager levels, we can use an analytical tool similar to the EPI, the Management Parity Index (MPI), defined as:
The 2007–2015 MPI for each race is shown in Figure 7 using data in Exhibit G. The flat Asian line on the chart shows no material change in the proportional representation and does not support the notion that the Asian executive gap will be solved by millennials.
Figure 7� MPI by Race: 2007−2015 Bay Area Manufacturing and Information (M+I) Sectors
2007 2008 2009 2010 2011 2012 2013 2014 2015
Figure 7. MPI by Race: 2007–2015Bay Area Manufacturing and Information (M+1) Sectors
0.0
0.2
0.4
0.6
0.8
1.0
1.2
1.4
Hispanic MPI
Asian MPI
White MPI
Black MPI
1.32 1.311.26
1.15
0.69
1.231.22
0.62
It is not unexpected that the chart shows that Asians were below management parity and less represented in Management ranks proportionate to their individual contributor Professional numbers. It is a surprise, however, to find that Asians were the only minority group underrepresented in middle management. We conclude that Asians were not only the least likely to be executives in 2015, as indicated in Figure 4, but also the least likely to become Executives in the near future, as suggested by the absence of any significant EPI or MPI improvement from 2007 to 2015 in Figures 4 and 7.
More generally, Figure 7 indicates that there was very little change in MPI for any race, a finding that does not support the argument that the millennial generation would intrinsically solve the executive gaps for blacks or Hispanics. Moreover, there is no evidence that corporate efforts to increase management diversity had made a meaningful difference for any race in this nine year period.
Figure 8 is the MPI chart by gender, combining all races. Women overall had moved from 9% below parity to slightly above parity by 2014, suggesting that that technology companies had made progress on gender issues. Unlike the MPI racial trend, which had little change from 2007 to 2015, the MPI by gender analysis finds that women were promoted into middle management in proportion to their numbers in the Bay Area technology workforce. Is it possible that the 13% increase in women’s MPI is an indication of a millennial effect?

THE ILLUSION OF ASIAN SUCCESS: Scant Progress for Minorities in Cracking the Glass Ceiling from 2007–2015
12
We suspect that rather than a millennial effect, the 13% MPI increase more likely reflected the corporate focus on gender diversity, which had led to the 28% increase in the women’s EPI that we see in Figure 6. As we argued earlier, it would have been too early to have a millennial effect on EPI, so a millennial effect on MPI should be a leading indicator and be similar or greater than any changes to EPI. Hence, because the EPI 28% increase was much larger than the 13% MPI increase, we would attribute the MPI gain to a focus on women. Consequently, we suggest that there is no clear evidence that millennials had an effect improving the executive pipeline for women.
Figure 8� MPI by Gender: 2007−2015 Bay Area Manufacturing and Information (M+I) Sectors
2007 2008 2009 2010 2011 2012 2013 2014 2015
Figure 8. MPI by Gender: 2007–2015Bay Area Manufacturing and Information (M+1) Sectors
1.041.03
0.99
0.91
0.80
0.85
0.90
0.95
1.00
1.05
1.10
Women MPI
Men MPI
In summary, our MPI analysis of 2007–2015 data shows that:
• There was no material change in the proportional representation for any race to support the notion that the millennial generation will improve racial diversity at executive levels.
• There is no clear evidence that the millennial generation would improve gender diversity at executive levels.• There is no evidence that the corporate efforts to increase management diversity had made a meaningful difference in
closing the gap for any racial minority.• The evidence does suggest that technology companies made progress to promote women overall into middle
management, achieving management parity in 2014.
THE INTERSECTION OF RACE AND GENDERThis report focuses on longitudinal EEO-1 data to better interpret our earlier work, which used the EPI analysis of 2013 and 2014 data to examine issues with Asian men and Asian women in technology companies. Our earlier papers explored qualitative root cases, citing gaps in awareness and expectations, gaps in role models, and gaps in behaviors. We also made program and policy recommendations to improve leadership pipeline outcomes for Asians. Readers interested in those topics may consult our earlier publications5,6. We will not include similarly detailed qualitative discussions in this report.
Our earlier work separated the racial data into each gender to explore the racial vs gender aspects of the glass ceiling. Using that approach, Figures 9 and 10 chart the EPI for men (by race) and women (by race) to understand executive parity changes since 2007.
As Figure 9 indicates, from 2007–2015, the EPI for white men had declined, but remained well above parity. During this same time period, however, all minority men had made little progress in proportionate Executive representation: Hispanic men EPI grew from 0.86 to 0.89; black men EPI grew 0.53 to 0.59; and Asian men EPI grew from 0.56 to 0.62.

THE ILLUSION OF ASIAN SUCCESS: Scant Progress for Minorities in Cracking the Glass Ceiling from 2007–2015
13
Figure 9� EPI for Men: 2007−2015 Bay Area Manufacturing and Information (M+I) Sectors
2007 2008 2009 2010 2011 2012 2013 2014 2015
Figure 9. EPI for Men: 2007–2015 Bay Area Manufacturing and Information (M+1) Sectors
0.50.60.70.80.91.01.11.21.31.41.51.61.71.81.9
Hispanic Men EPI
Asian Men EPI
White Men EPI
Black men EPI
1.87
1.72
0.89
0.620.59
0.86
0.560.53
Figure 10 shows the EPI trend for all women from 2007–2015 and indicates that there was substantial progress for white and black women, modest gains for Asian women, and no change for Hispanic women. White women saw meaningful gains, moving from below 12% parity to 17% above parity during this nine-year period.
Minority women remained far below parity in 2015, with black women EPI moving from 0.24 to 0.61 and Hispanic women unchanged at 0.42. Asian women EPI rose from 0.24 to 0.34 but lagged all others, at 66% below parity.
Figure 10� EPI for Women: 2007−2015 Bay Area Manufacturing and Information (M+I) Sectors
2007 2008 2009 2010 2011 2012 2013 2014 2015
Figure 10. EPI for Women: 2007–2015Bay Area Manufacturing and Information (M+1) Sectors
1.17
0.61
0.42
0.34
0.2
0.3
0.4
0.5
0.6
0.7
0.8
0.9
1.0
1.1
1.2
0.61
Hispanic Women EPI
Asian Women EPI
White Women EPI
Black Women EPI0.88
0.42
0.24
Although Figure 10 indicates a large gain for black women, a more detailed review of the data for black men and women finds that the improvement in EPI reflects a significant loss of black Professionals rather than a material gain in the number of black Executives. We will review the black pipeline data in more detail later in this report.
Figures 11 and 12 are separate MPI charts for men and women, with separate lines for race.
Figure 11 shows that white women had the highest MPI among women overall, reaching 45% above management parity in 2015. Their EPI was also higher than the MPI for men of any race. Asian women had the lowest MPI, 31% below parity.
Figure 12 shows that Hispanic men had the highest MPI among men, 32% above management parity in 2015. Asian men had the lowest MPI, 31% below parity.

THE ILLUSION OF ASIAN SUCCESS: Scant Progress for Minorities in Cracking the Glass Ceiling from 2007–2015
14
Figure 11� Women’s MPI by Race: 2007−2015 Bay Area Manufacturing and Information (M+I) Sectors
2007 2008 2009 2010 2011 2012 2013 2014 2015
Figure 11. Women’s MPI by Race: 2007–2015 Bay Area Manufacturing and Information (M+1) Sectors
0.0
0.2
0.4
0.6
0.8
1.0
1.2
1.4
1.6
Hispanic Women MPI
Asian Women MPI
White Women MPI
Black Women MPI
1.27
1.45
1.28
1.13
0.69
1.20
1.02
0.54
Figure 12� Men’s MPI by Race: 2007−2015 Bay Area Manufacturing and Information (M+I) Sectors
2007 2008 2009 2010 2011 2012 2013 2014 2015
Figure 12. Men’s MPI by Race: 2007–2015Bay Area Manufacturing and Information (M+1) Sectors
0.0
0.2
0.4
0.6
0.8
1.0
1.2
1.4
1.6
Hispanic Men MPI
Asian Men MPI
White Men MPI
Black Men MPI
1.361.341.23
0.66 0.69
1.07
1.251.32
As shown in Figures 11 and 12, only Asians had an MPI below parity in any year during the entire period.
In summary, by analyzing the racial differences by gender during 2007–2015, we find that:
At the Executive level:
• White men remained substantially above executive parity, 72% above parity in 2015.• White women EPI had materially improved since 2007, reaching parity by 2012 and 17% above parity by 2015.• All minority men and minority women EPI remained well below parity.• Asian women were the least represented as Executives, 66% below parity in 2015.
At the Management level:
• White women had the highest 2015 MPI of any cohort of men or women (1.45).• Asian men and Asian women were the only cohorts below management parity (MPI 0.69).

THE ILLUSION OF ASIAN SUCCESS: Scant Progress for Minorities in Cracking the Glass Ceiling from 2007–2015
15
COMPARING THE EFFECTS OF RACE VS GENDERThe EPI figures for the 2015 Manufacturing and Information sector are shown in Figure 13, ranked by EPI. This EPI chart shows that the pipeline outcomes varied widely by race and gender. At the top end, white men had an EPI of 1.72, 72% above executive parity. At the bottom, Asian women had an EPI is 0.34 and were 66% below parity. The chart indicates that only white men and white women were above parity, while all minority men and minority women were below parity.
Figure 13� EPI by Race and Gender: 2015 Bay Area Manufacturing and Information (M+I) Sectors
Figure 13. EPI by Race and Gender: 2015Bay Area Manufacturing and Information (M+1) Sectors
0.0
0.2
0.4
0.6
0.8
1.0
1.2
1.4
1.6
1.8
Asian M
en
Asian W
omen
Hispan
ic Men
Whit
e Men
Black M
en
Hispan
ic W
omen
Whit
e Women
Black W
omen
1.72
1.17
0.89
0.62 0.61 0.59
0.420.34
The EPI figures also allow us to quantify the gender gap for each race. Figure 14 is a table of the EPI gender gaps comparing the different 2015 EPI figures for men and women of each race. This table shows that white men had an EPI (1.72) that is 47% higher than white women EPI (1.17). In other words, white men were 47% more likely than white women to be Executives, and there was a 47% “gender gap” between the relative representation of white men and white women.
Figure 14� Gender Gaps in EPI by Race: 2015
Men Women Gender GapWhite 1.72 1.17 47%Hispanic 0.89 0.42 112%Black 0.59 0.61 -3%Asian 0.62 0.34 85%
Figure 14 also shows that there was a -3% “gender gap” in the EPI between black men and black women, which is interpreted to mean that black women were 3% more likely to be an Executive than black men in 2015. We will show in a subsequent section that this statement, although arithmetically correct, was the direct result of the loss of black women in the Professional workforce rather than the gains of black women in Executive levels. Our review of longitudinal data finds that the 2015 EPI value was an outlier and not indicative of the pipeline dynamics for black women.
We can also use EPI in the same way to quantify the “racial gap” between white men vs minority men, as well as the racial gap between white women vs minority women. As shown in Figure 15, white men had an EPI (1.72) that was 93% higher than Hispanic men EPI (0.89). Thus, white men were 93% more likely than Hispanic men to be Executives. Similarly, Figure 15 shows that white women were 178% more likely than Hispanic women to be Executives.
THE ILLUSION OF ASIAN SUCCESS: Scant Progress for Minorities in Cracking the Glass Ceiling from 2007–2015
16
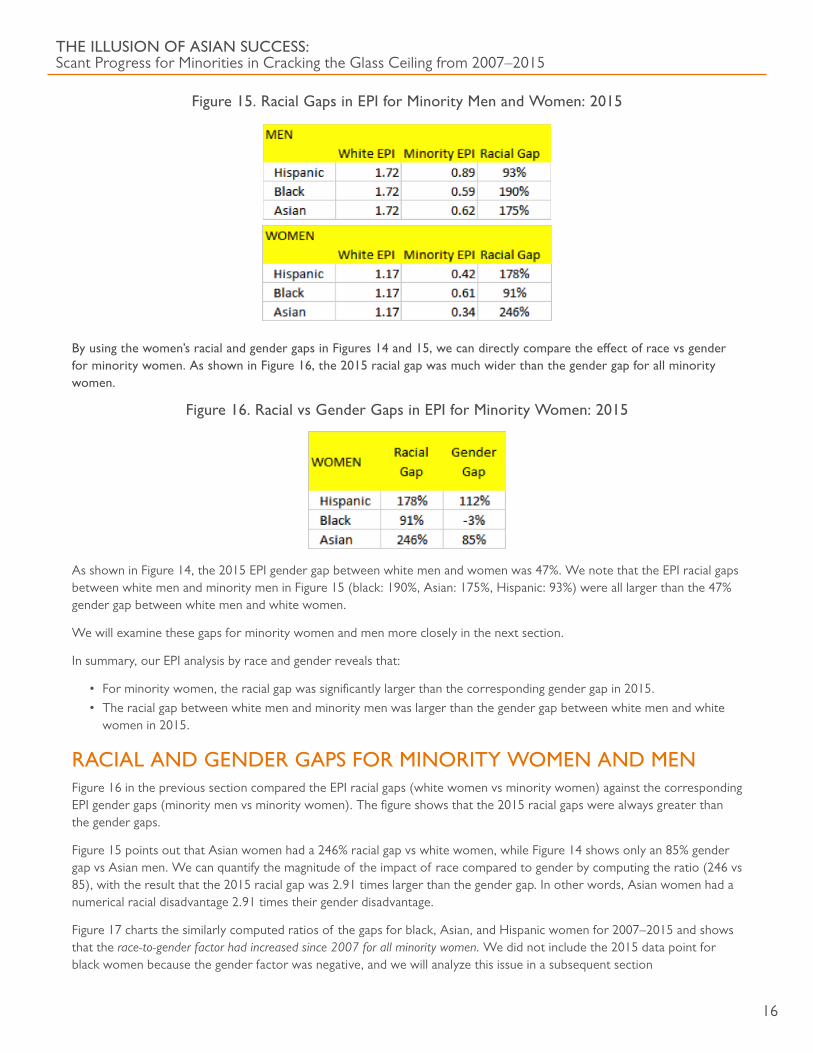
Figure 15� Racial Gaps in EPI for Minority Men and Women: 2015
By using the women’s racial and gender gaps in Figures 14 and 15, we can directly compare the effect of race vs gender for minority women� As shown in Figure 16, the 2015 racial gap was much wider than the gender gap for all minority women�
Figure 16� Racial vs Gender Gaps in EPI for Minority Women: 2015
As shown in Figure 14, the 2015 EPI gender gap between white men and women was 47%. We note that the EPI racial gaps between white men and minority men in Figure 15 (black: 190%, Asian: 175%, Hispanic: 93%) were all larger than the 47% gender gap between white men and white women.
We will examine these gaps for minority women and men more closely in the next section.
In summary, our EPI analysis by race and gender reveals that:
• For minority women, the racial gap was significantly larger than the corresponding gender gap in 2015.• The racial gap between white men and minority men was larger than the gender gap between white men and white
women in 2015.
RACIAL AND GENDER GAPS FOR MINORITY WOMEN AND MENFigure 16 in the previous section compared the EPI racial gaps (white women vs minority women) against the corresponding EPI gender gaps (minority men vs minority women). The figure shows that the 2015 racial gaps were always greater than the gender gaps.
Figure 15 points out that Asian women had a 246% racial gap vs white women, while Figure 14 shows only an 85% gender gap vs Asian men. We can quantify the magnitude of the impact of race compared to gender by computing the ratio (246 vs 85), with the result that the 2015 racial gap was 2.91 times larger than the gender gap. In other words, Asian women had a numerical racial disadvantage 2.91 times their gender disadvantage.
Figure 17 charts the similarly computed ratios of the gaps for black, Asian, and Hispanic women for 2007–2015 and shows that the race-to-gender factor had increased since 2007 for all minority women. We did not include the 2015 data point for black women because the gender factor was negative, and we will analyze this issue in a subsequent section

THE ILLUSION OF ASIAN SUCCESS: Scant Progress for Minorities in Cracking the Glass Ceiling from 2007–2015
17
In general, although minority women faced both racial and gender gaps, Figure 17 illustrates that race, not gender, was increasingly the more important factor in limiting minority women in the pipeline. The data show that for black women, the racial gap was 5.35x the gender gap in 2014; for Asian women, the racial gap was 2.91x the gender gap in 2015; and for Hispanic women, the racial gap was 1.59x the gender gap in 2015.
Figure 17� Racial vs Gender Gaps: 2007–2015 Minority Women
Figure 17. Racial vs Gender Gaps: 2007–2015Minority Women
0
1
2
3
4
5
6Hispanic Women
Asian Women
Black Women
2007 2008 2009 2010 2011 2012 2013 2014 2015
2.19
5.35
2.91
1.59
1.98
1.04
In the previous section of this paper, we concluded that in 2015, the EPI gaps between white men and all minority men were larger than the EPI gap between white men and white women, suggesting that white women were more successful than minority men reaching Executive levels.
To directly compare white women to minority men, we use the same approach in our comparison of 2015 EPI for Asian men (0.62) against white men (1.72), computing a 175% EPI gap. Comparing the 2015 EPI for Asian men (0.62) against white women (1.17), we find the EPI gap to be 88%. In other words, white women were 88% more likely than Asian men to be an Executive in 2015. For black men, the 2015 EPI gap was 97%. For Hispanic men, the EPI gap was 31%.
Figure 18 charts the women-to-minority men EPI gaps for the 2007–2015 period and shows that gaps had increased since 2007 for all minority men. Hence, Figures 17 and 18 suggest that, regardless of gender, race alone had always been more important than gender alone (and increasingly so) as a limiting factor to the higher levels of executive leadership.
Figure 18� Relative EPI Gap Size: 2007–2015 Minority Men vs White Women
Figure 18. Relative EPI Gap Size: 2007–2015Minority Men vs White Women
0%
20%
40%
60%
80%
100%
120%Hispanic Men
Asian Men
Black Men
2007 2008 2009 2010 2011 2012 2013 2014 2015
2%
56%
65%
97%
88%
31%
THE ILLUSION OF ASIAN SUCCESS: Scant Progress for Minorities in Cracking the Glass Ceiling from 2007–2015
18
In summary, our analysis of EPI gaps by race and gender reveals that:
• Although minority women face both racial and gender gaps, race, not gender, was the increasingly dominant factor limiting minority women reaching executive levels from 2007 to 2015. More specifically, for black women, the racial gap was 5.35x the gender gap in 2014; for Asian women, the racial gap was 2.91x the gender gap in 2015; and for Hispanic women, the racial gap was 1.59x the gender gap in 2015.
• An evaluation of gaps for minority men and women suggests that, regardless of gender, race alone was always more important than gender alone (and increasingly so) as a limiting factor to the higher levels of executive leadership.
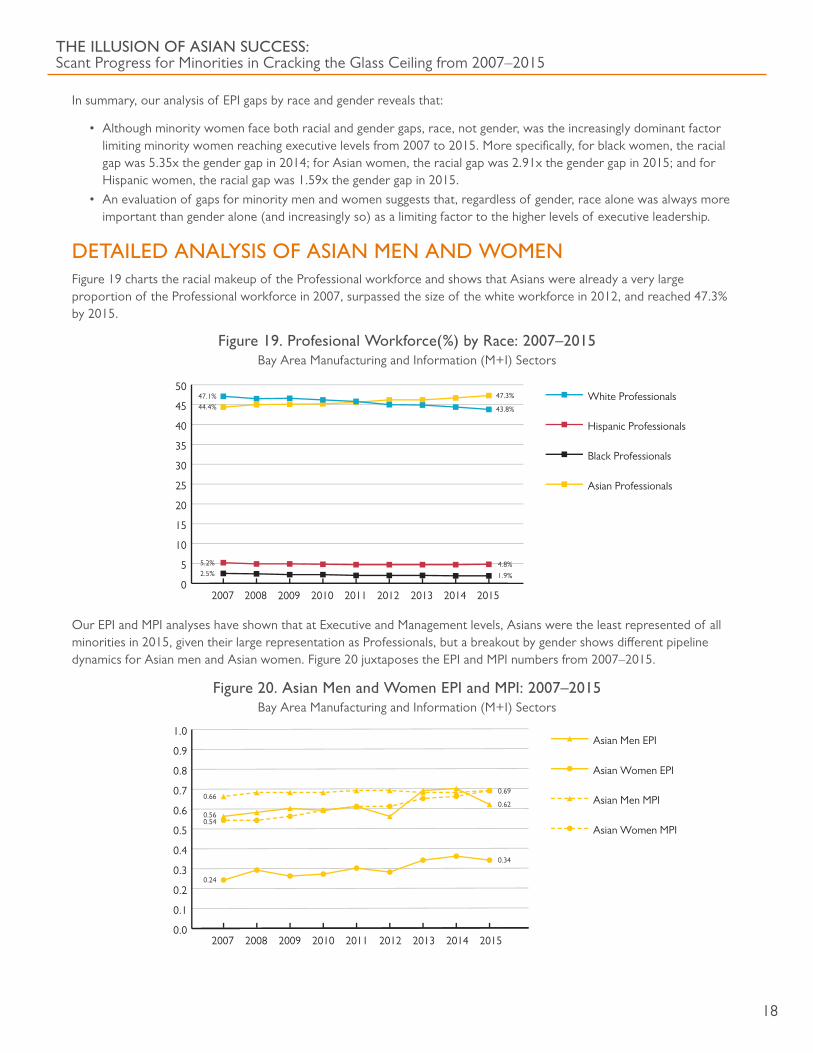
DETAILED ANALYSIS OF ASIAN MEN AND WOMENFigure 19 charts the racial makeup of the Professional workforce and shows that Asians were already a very large proportion of the Professional workforce in 2007, surpassed the size of the white workforce in 2012, and reached 47.3% by 2015.
Figure 19� Profesional Workforce(%) by Race: 2007–2015 Bay Area Manufacturing and Information (M+I) Sectors
Figure 19. Professional Workforce (%) by Race: 2007–2015Bay Area Manufacturing and Information (M+1) Sectors
2007 2008 2009 2010 2011 2012 2013 2014 20150
5
10
15
20
25
30
35
40
45
50
Hispanic Professionals
Asian Professionals
White Professionals
Black Professionals
2.5%5.2%
44.4%47.1% 47.3%
43.8%
4.8%
1.9%
Our EPI and MPI analyses have shown that at Executive and Management levels, Asians were the least represented of all minorities in 2015, given their large representation as Professionals, but a breakout by gender shows different pipeline dynamics for Asian men and Asian women. Figure 20 juxtaposes the EPI and MPI numbers from 2007–2015.
Figure 20� Asian Men and Women EPI and MPI: 2007–2015 Bay Area Manufacturing and Information (M+I) Sectors
Figure 20. Asian Men and Women EPI and MPI: 2007–2015Bay Area Manufacturing and Information (M+1) Sectors
2007 2008 2009 2010 2011 2012 2013 2014 20150.0
0.1
0.2
0.3
0.4
0.5
0.6
0.7
0.8
0.9
1.0
Asian Women EPI
Asian Men EPI
Asian Women MPI
Asian Men MPI0.69
0.66
0.560.54
0.24
0.62
0.34

THE ILLUSION OF ASIAN SUCCESS: Scant Progress for Minorities in Cracking the Glass Ceiling from 2007–2015
19
The MPI results show that by 2015, proportional management representation of Asian women was the same as Asian men (0.69), both below management parity by 31%. This means that Asian women were as likely as Asian men to be Managers. Apparently, both Asian men and Asian women have had similar difficulties being promoted into middle management levels.
The EPI results, however, tell a different story.
The 2015 EPI for Asian men (0.62) was only slightly lower than its corresponding MPI number (0.69). This suggests that promoting more Asian men into middle management would result in roughly corresponding increases at executive levels. For Asian women, however, the large difference between their EPI (0.34) and MPI (0.69) numbers is clear evidence of an executive gender gap.
In an earlier section we compared racial vs gender gaps and concluded that for Asian women, the race vs gender gap widened from 2.19x in 2007 to 2.91x in 2015. To better understand what drove this increase, we compare the 2007 EPI numbers for white men and women vs Asian men and women, shown in Figure 21 against the comparable 2015 numbers in Figure 22.
Figure 21� Gender and Racial EPI Gaps: 2007 White vs Asian
EPI 2007Men Women Gender Gap
White 1.87 0.88 113%Asian 0.56 0.24 137%Racial Gap 233% 271%
In Figure 21, Asian men 2007 EPI was 0.56 compared to Asian women EPI at 0.24. The 2007 EPI gender gap between Asian men and women was 137%. A similar calculation finds that white women were 271% more likely than Asian women to be Executives.
Figure 22� Gender and Racial EPI Gaps: 2015 White vs Asian
EPI 2015Men Women Gender Gap
White 1.72 1.17 47%Asian 0.62 0.34 85%Racial Gap 175% 246%
Comparing 2007 to 2015, we see some EPI improvements as the gaps for Asian women decreased in race (271% → 246%) and gender (137% → 85%). This comparison shows that the racial vs gender factor had grown from 2x in 2007 to 3x by 2015 for Asian women because the racial gap improved only slightly while the gender gap had made significant improvements for both white and Asian women. This finding suggests that the focus on gender diversity had reduced the gap between men and women, but had no meaningful effect on improving the likelihood of Asian women to become Executives.
In summary, our analysis of EEO-1 data for Asian men and women reveals that:
• Asians were the largest racial group of technology Professionals in the Bay Area in 2015.• Asian men and women were similarly below MPI parity as the only racial group underrepresented as Managers.• The race vs gender gaps for Asian women widened from ~2x in 2007 to ~3x in 2015 due to a shrinking gender gap.
THE ILLUSION OF ASIAN SUCCESS: Scant Progress for Minorities in Cracking the Glass Ceiling from 2007–2015
20
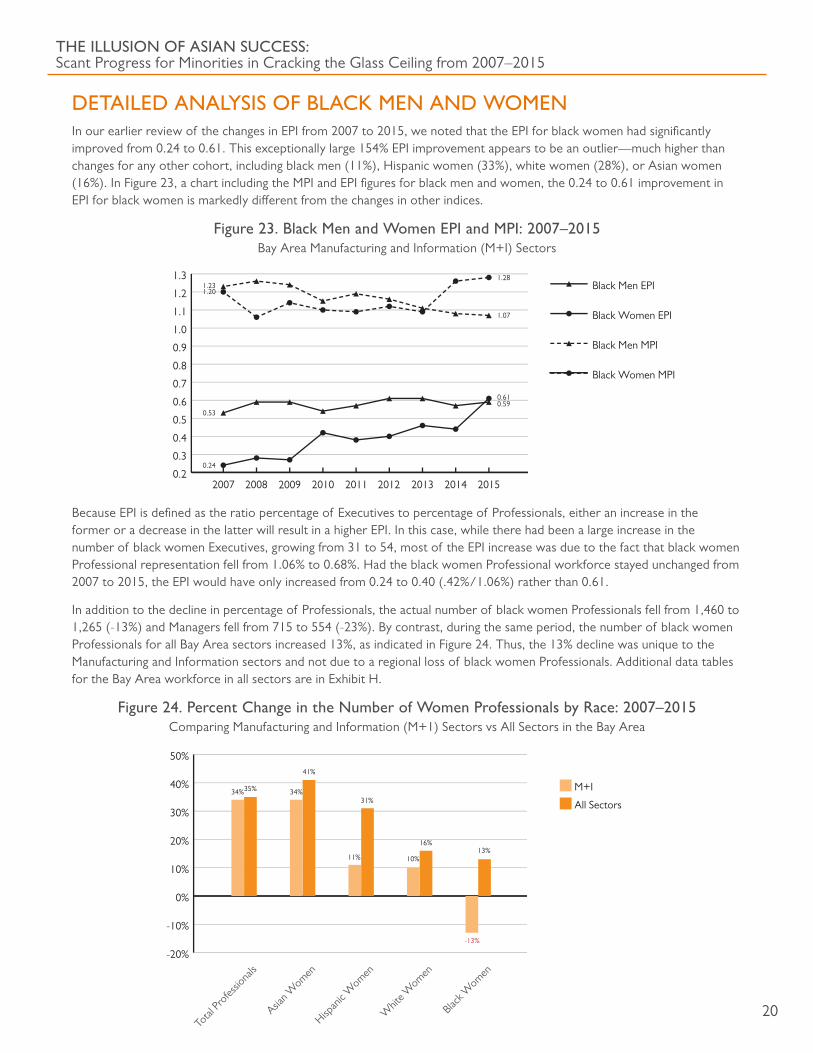
DETAILED ANALYSIS OF BLACK MEN AND WOMENIn our earlier review of the changes in EPI from 2007 to 2015, we noted that the EPI for black women had significantly improved from 0.24 to 0.61. This exceptionally large 154% EPI improvement appears to be an outlier—much higher than changes for any other cohort, including black men (11%), Hispanic women (33%), white women (28%), or Asian women (16%). In Figure 23, a chart including the MPI and EPI figures for black men and women, the 0.24 to 0.61 improvement in EPI for black women is markedly different from the changes in other indices.
Figure 23� Black Men and Women EPI and MPI: 2007–2015 Bay Area Manufacturing and Information (M+I) Sectors
Figure 23. Black Men and Women EPI and MPI: 2007–2015Bay Area Manufacturing and Information (M+1) Sectors
2007 2008 2009 2010 2011 2012 2013 2014 20150.2
0.3
0.4
0.5
0.6
0.7
0.8
0.9
1.0
1.1
1.2
1.3Black Men EPI
Black Women EPI
Black Men MPI
Black Women MPI
1.231.20
0.53
0.24
1.28
1.07
0.610.59
Because EPI is defined as the ratio percentage of Executives to percentage of Professionals, either an increase in the former or a decrease in the latter will result in a higher EPI. In this case, while there had been a large increase in the number of black women Executives, growing from 31 to 54, most of the EPI increase was due to the fact that black women Professional representation fell from 1.06% to 0.68%. Had the black women Professional workforce stayed unchanged from 2007 to 2015, the EPI would have only increased from 0.24 to 0.40 (.42%/1.06%) rather than 0.61.
In addition to the decline in percentage of Professionals, the actual number of black women Professionals fell from 1,460 to 1,265 (-13%) and Managers fell from 715 to 554 (-23%). By contrast, during the same period, the number of black women Professionals for all Bay Area sectors increased 13%, as indicated in Figure 24. Thus, the 13% decline was unique to the Manufacturing and Information sectors and not due to a regional loss of black women Professionals. Additional data tables for the Bay Area workforce in all sectors are in Exhibit H.
Figure 24� Percent Change in the Number of Women Professionals by Race: 2007–2015 Comparing Manufacturing and Information (M+1) Sectors vs All Sectors in the Bay Area
Figure 24. Percent Change in the Number of Women Professionals by Race: 2007–2015Comparing Manufacturing and Information (M+1) Sectors vs All Sectors in the Bay Area
-20%
-10%
0%
10%
20%
30%
40%
50%
Whit
e Women
Hispan
ic W
omen
Total
Profes
siona
ls
Asian W
omen
Black W
omen
M+I
All Sectors34% 34%
11% 10%13%
-13%
16%
31%
41%
35%

THE ILLUSION OF ASIAN SUCCESS: Scant Progress for Minorities in Cracking the Glass Ceiling from 2007–2015
21
The number of black men as Professionals had increased 14%, but fell 15% as Managers in Manufacturing and Information. Including both men and women, black Managers declined by 18%. The decline in the number of black Professionals and Managers could portend a future decline in the number of black Executives, barring exceptional steps to stem or reverse the decline.
The decline in the black workforce is a serious challenge not only for technology companies, but also across all sectors in the entire Bay Area region. The black Professional workforce in the technology sector shrank from 2.5% in 2007 to 1.9% by 2015. And across all industry sectors, the Bay Area saw its black Professional workforce shrink from 3.6% to 3.1%.
Figure 25 compares the 2007 EPI numbers for black and white men and women. The figure shows that, for black women the racial gap (263%) was 2.2x the gender gap (120%) in 2007.
Figure 25� Gender and Racial EPI Gaps: 2007 White vs Black
EPI 2007Men Women Gender Gap
White 1.87 0.88 113%Black 0.53 0.24 120%Racial Gap 250% 263%
Figure 26 is a similar chart with the 2015 EPI numbers. However, we doubt there was a negative (-3%) black gender gap. As we noted earlier, there was a significant decrease in the number of black women Professionals, so that the jump to 0.61 in 2015 reflected both (i) some success in promoting black women but (ii) a significant failure in attracting and retaining them from 2007 to 2015.
Figure 26� Gender and Racial EPI Gaps: 2015 White vs Black
EPI 2015Men Women Gender Gap
White 1.72 1.17 47%Black 0.59 0.61 -3%Racial Gap 190% 91%
We cannot use the 2015 EPI calculations to compare racial vs gender effects, but we can consider the comparison during the 2007–2015 period in our dataset as shown in Figure 27.
Figure 27� Gender and Racial Gaps: 2007–2015 White vs Black
Eliminating the 2015 data point from Figure 27 as an anomaly, we can use historical data to say that, for black women, the racial gap was in the range of 2–5x the gender gap.
THE ILLUSION OF ASIAN SUCCESS: Scant Progress for Minorities in Cracking the Glass Ceiling from 2007–2015
22
In summary, our analysis of EEO-1 data finds that the efforts by technology companies to increase the size of their black workforce were not successful.
• The Bay Area black Professional workforce shrank.• In technology, it declined from 2.5% of Professionals in 2007 to 1.9% by 2015. • Across all sectors, it also declined, from 3.6% to 3.1%.
• Technology has been getting a smaller share of Bay Area black Professional workforce.• The number of black women Professionals in all sectors increased by 13%, but declined by 13% in technology
by 2015.• The number of black men Professionals in all sectors increased by 22.6%, but only increased by 14% in
technology.• The number of blacks in management has declined in Bay Area technology.
• Despite black men and women being promoted into middle management at a level above parity, there was little effect on executive parity.
• An 18% decline in black men and black women in 2007–2015 as Managers could portend a future decline in the representation of black Executives.
DETAILED ANALYSIS OF HISPANIC MEN AND WOMENAs detailed in Exhibit F, executive representation for Hispanic men or women was virtually unchanged from 2007 to 2015 in technology. Hispanic men had minor declines in Professional (3.14% to 3.09%) and Managerial (4.3% to 4.1%) representation. Hispanic women also declined in representation in Professional (2.0% to 1.7%) and Managerial (2.0% to 1.9) levels.
The small size of the Hispanic representation in the technology sector was similar to Hispanic representation in all sectors in the Bay Area (Exhibit H). Across all sectors in 2015, Hispanic men were 3.0% of Professionals and 4.8% of Managers. Across all sectors in 2015, Hispanic women were 2.8% of Professionals and 3.0% of Managers.
Overall, the Hispanic workforce in the technology sector declined from 5.2% of Professionals in 2007 to 4.8% by 2015. This contrasts to their percentage representation in the Bay Area Professional workforce across all sectors, which was unchanged during this period, starting with 5.8% in 2007 and ending also with about 5.8% 2015.
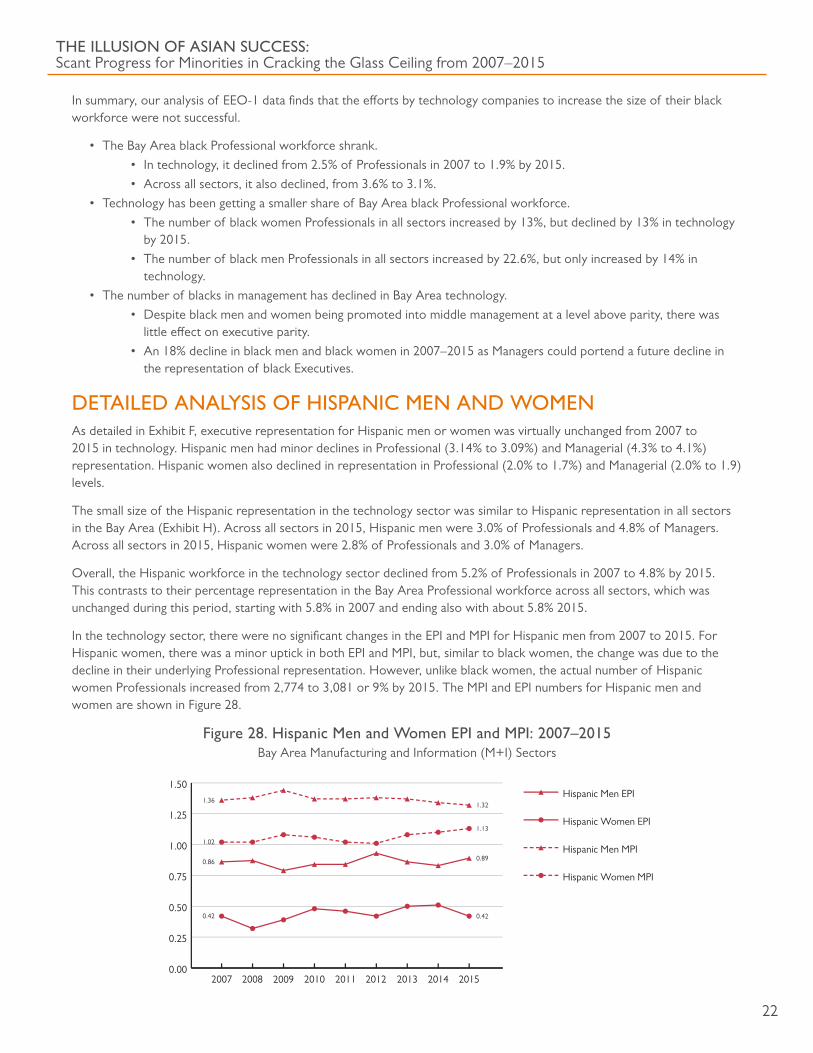
In the technology sector, there were no significant changes in the EPI and MPI for Hispanic men from 2007 to 2015. For Hispanic women, there was a minor uptick in both EPI and MPI, but, similar to black women, the change was due to the decline in their underlying Professional representation. However, unlike black women, the actual number of Hispanic women Professionals increased from 2,774 to 3,081 or 9% by 2015. The MPI and EPI numbers for Hispanic men and women are shown in Figure 28.
Figure 28� Hispanic Men and Women EPI and MPI: 2007–2015 Bay Area Manufacturing and Information (M+I) Sectors
Figure 28. Hispanic Men and Women EPI and MPI: 2007–2015Bay Area Manufacturing and Information (M+I) Sectors
2007 2008 2009 2010 2011 2012 2013 2014 20150.00
0.25
0.50
0.75
1.00
1.25
1.50Hispanic Men EPI
Hispanic Women EPI
Hispanic Men MPI
Hispanic Women MPI
1.361.32
1.13
0.89
0.42
1.02
0.86
0.42

THE ILLUSION OF ASIAN SUCCESS: Scant Progress for Minorities in Cracking the Glass Ceiling from 2007–2015
23
Figures 29 and 30 compare Hispanic vs White EPI numbers from 2007 and 2015 in the technology sector. For Hispanic women in 2007, the racial and gender gaps were similar (188% vs 176%) so that the race vs gender gap was 1.04. By 2015, the gender gap for Hispanic women was relatively unchanged (106 → 112%), while the racial gap jumped from 111% to 178% solely due to the gains of white women. Hence, for Hispanic women, the factor of race vs gender moved from 1.04x in 2007 to 1.59x in 2015 because white women EPI improved while Hispanic women EPI did not.
Figure 29� Gender and Racial EPI Gaps: 2007 White vs Hispanic EPI 2007
Men Women Gender GapWhite 1.87 0.88 113%Hispanic 0.86 0.42 106%Racial Gap 117% 111%
Figure 30� Gender and Racial EPI Gaps: 2015 White vs Hispanic
EPI 2015Men Women Gender Gap
White 1.72 1.17 47%Hispanic 0.89 0.42 112%Racial Gap 93% 178%
In summary, our analysis of EEO-1 data for Hispanic men and women finds that:
• Hispanic Representation in the Professional workforce in the Bay Area had not grown from 2007–2015.• Hispanic Professionals in all sectors in the Bay Area was unchanged at 5.8%.• Hispanic Professionals in technology shrank from 5.2% to 4.8%.
• There was little change in EPI and MPI for Hispanic men and women in technology.• EPI for both Hispanic men and Hispanic women remained below parity.• Hispanic men and Hispanic women remained above MPI parity.
• For Hispanic women in technology, the race vs gender comparison moved from 1.04x to 1.59x by 2015.
A SUMMARY FRAMEWORK AND KEY CHALLENGESThrough our analysis of longitudinal data, we found that the glowing image of Asian executive success is an illusion. Despite prominent Asian CEO symbols for executive achievement, Asians in technology have actually had the least success in climbing the management ladder. We have also found that neither blacks nor Hispanics had fared much better, and that black men and women were moving in the wrong direction, altogether.
As illustrated in Figure 31, we found that white women moved from 12% below executive parity to 17% above executive parity by 2015. All minority men and women remained below parity, their Executive representation less than Professional representation.

THE ILLUSION OF ASIAN SUCCESS: Scant Progress for Minorities in Cracking the Glass Ceiling from 2007–2015
24
Figure 31� Gaps in Executive Parity: 2007 vs 2015 San Francisco Bay Area Technology Sector
Asian M
en
Asian W
omen
Hispan
ic Men
Whit
e Men
Black M
enHisp
anic
Women
Whit
e Women
Black W
omen
Figure 31. Gaps in Executive Parity: 2007 vs 2015San Francisco Bay Area Technology Sector
-100%
-80%
-60%
-40%
-20%
0%
20%
40%
60%
80%
100%
above parity
below parity
EPI 2007
EPI 2015
87%
72%
17%
-12% -14%-11%
-44%-38%
-76%
-39%-47%
-41%
-58%-58%
-76%-66%
From 2007 to 2015, gender gaps remained for women of all races and racial gaps remained for all minority men and women. In almost all cases, there were more improvements in the gender vs racial gaps. The data suggests racial factors were consistently more critical than gender as impediments through the leadership pipeline. For Asians, the racial gap was 3x the gender gap by 2015. For blacks, the racial gap was 2–5x the gender gap. For Hispanics, the racial gap was 1.6x the gender gap.
As a business framework to evaluate the implications of our analysis, we believe that all companies share the fundamental imperative to attract, retain, and promote the best talent. In Figure 32, we overlay key elements of our analysis into a snapshot framework to summarize how Bay Area technology companies were faring to attract, retain, and promote diverse talent.
Figure 32� Diversity Challenges by Cohort
Talent Challenges Attract and Retain Talent Promote Talent
Cohort Change in Professional Workforce from 2007 to 2015
Percentage of Professionals in 2015
Executive Parity Index in 2015
White Men 31% growth 32% 72% above parity
White Women 10% growth 11% 17% above parity
Black Men 15% growth 1.2% 41% below parity
Black Women -13% decline 0.7% 39% below parity
Hispanic Men 32% growth 3.1% 11% below parity
Hispanic Women 11% growth 1.7% 58% below parity
Asian Men 46% growth 32% 38% below parity
Asian Women 34% growth 15% 66% below parity
Highlighted in italicized red are the diversity challenges for each racial/gender cohort. In summary, our analysis suggests that:
• Company programs to attract and retain talent should focus on black, Hispanic, and white women. Special emphasis should be given to retaining black women.
• Company programs to develop and promote leaders should focus on both men and women in the black, Hispanic, and Asian workforce. Special emphasis should focus on Hispanic and Asian women.
THE ILLUSION OF ASIAN SUCCESS: Scant Progress for Minorities in Cracking the Glass Ceiling from 2007–2015
25
IMPLICATIONS FOR SILICON VALLEYThe imperative to attract, retain, and promote the best talent can drive growth and a variety of successful cultures as long as the internal culture evolves to be generally consistent with the social norms and aspirational values of employees and, implicitly, the external community. Aberrant cultures will ultimately create internal conflicts with adverse consequences to employee motivation or worse. One such example in early Silicon Valley lore is the departure of the “traitorous eight” engineers from Shockley Semiconductor to start Fairchild Semiconductor and, subsequently, Intel. In a more recent example, an aberrant culture blew up into an embarrassing legal and public relations problem for a well-known Bay Area ride-sharing company.
Silicon Valley has built its cultural core as an egalitarian and innovative meritocracy. Executives and individual contributors sit in open office cubicles. CEOs eschew executive floors, private dining rooms, or reserved parking spaces. Managers embrace the concept of “managing by walking around” in the development labs or on the factory floor. And although not always true, the aspirational belief persists that the best ideas should prevail fairly and that the most talented should succeed, regardless of race, nationality, or gender.
Today, that aspirational belief in fairness and support for talented people drives Silicon Valley’s embrace of the need for racial and gender diversity, its honest admission that the region has much work to do, and its commitment to improve workforce diversity at all levels. Unfortunately, our longitudinal analysis suggests that the region has made little progress in its ability to attract a more diverse workforce or promote more racial diversity in its leadership community.
Our analysis of 2007–2015 data shows that past efforts to attract and retain blacks and Hispanics have, in the aggregate, failed. It shows that past efforts to promote blacks, Hispanics, and Asians have also failed to make meaningful progress in developing diverse executive teams to mirror the region’s Professional workforce.
These results raise the question whether it is reasonable to expect that doing more of the same will create different outcomes in the next few years? Or should companies reevaluate and innovate their diversity programs?
Is this a problem that can be solved by individual companies working on their own to solve these diversity challenges? Or should Silicon Valley consider a collective approach and view this as an aggregate problem for the region?
Having previously analyzed national EEO-1 reports from 2014, 2015, and 2016 made public by individual Bay Area technology companies, we find that our analysis of pipeline diversity at the Bay Area aggregated technology sector level in this report is entirely consistent with what we have seen at individual company levels. The consistency, along with the scant progress for women and minorities in the Bay Area sector, suggests that the diversity challenge is a region-wide sector problem that should be addressed by the leading companies working collectively rather than each technology company working individually.
A regional approach is not new to the Bay Area. In the past, the Silicon Valley Leadership Group was founded as a forum for leading Silicon Valley companies to address regional problems of housing and traffic. The Bay Conservation and Development Commission was formed to manage regional development of the San Francisco Bay. Joint Venture Silicon Valley was created to facilitate public/private initiatives to work on critical social and economic problems facing the region.
The need for a collective effort has recently been recognized at the national level with the recent announcement of Fortune 500 CEO-led alliance “CEO Action for Diversity and Inclusion” as a forum for sharing best practices7. Many in the Bay Area have already joined the alliance, including CEOs from Adobe, AMD, HPE, Cisco, Netapp, and Salesforce. But as the next step, our clarion call is for the leading technology companies to join together in a cooperative effort to aggregate and analyze their internal data by race and gender; proactively enlist their minority leadership and employee community involvement; and develop joint and individual metrics to bend the curve in the Bay Area’s ability to attract, retain, and promote talented women and minorities.
THE ILLUSION OF ASIAN SUCCESS: Scant Progress for Minorities in Cracking the Glass Ceiling from 2007–2015
26
A collective effort should include key stakeholders, especially Asian, Hispanic, black and women executive leaders, working together with a shared vision and common purpose. One recent example of such a common purpose is "Ascend Pinnacle", an initiative working to increase the number of Asians on Fortune 500 boards. A key component of Pinnacle’s progress has been its partnerships with the Latino Corporate Directors Association, Thirty Percent Coalition, and the Alliance for Board Diversity.
As former technology executives, we still share the Silicon Valley “can-do” optimism and believe that, with the proper data to identify the region’s challenges, its business leaders will find a way to more effectively attract, retain, and promote a more diverse workforce consistent with its cultural core.
THE ILLUSION OF ASIAN SUCCESS: Scant Progress for Minorities in Cracking the Glass Ceiling from 2007–2015
27
ABOUT THE AUTHORS
BUCK GEE is an executive advisor to Ascend. He retired in 2008 from Cisco Systems, where he was vice president and general manager of the Data Center Business Unit. He served as executive sponsor for Cisco's Asian employee resource network and on Cisco's Inclusion and Diversity Council. He joined Cisco with its 2004 acquisition of Andiamo Systems where he was president and CEO. Previously, he held management positions in engineering, marketing, and business development at numerous Silicon Valley companies including Hewlett Packard and National Semiconductor. He has also taught computer engineering courses at Stanford University and Howard University. He is a member of the Committee of 100. He holds BS/EE and MS/EE degrees from Stanford University and an MBA from the Harvard Business School.
DENISE PECK is an executive advisor to Ascend, and is a co-creator and facilitator of its leadership programs for Asian women and millennials. Denise spent fourteen years at Cisco Systems, during which she held vice president positions in marketing, operations, engineering services, and IT, in both San Jose and Shanghai, China. Denise was an executive sponsor and advocate of Cisco’s diversity initiatives, particularly on behalf of women and Asian employee networks. Prior to Cisco, Denise held senior marketing management positions over thirteen years at Sun Microsystems. She has a BA degree in economics from U.C. Berkeley and an MBA from the Graduate School of Business at Stanford University.
ACKNOWLEDGMENTSWe wish to thank those who provided guidance on our paper including the support of key leaders from Ascend. We also acknowledge the assistance of board member Anna Mok in facilitating our Ascend partnership. Finally, we extend our gratitude to Caroline Simard and Melissa Abad from the research team at the Clayman Institute for Gender Research at Stanford University and Professor Karthick Ramakrishnan from UC-Riverside/AAPI Data for thoughtful comments on our research.
ABOUT ASCENDAscend is the largest, non-profit Pan-Asian membership organization for business professionals in North America. Established in 2005, Ascend's reach includes 60,000+ senior executives, professionals, and MBA/undergraduate students involved in its 50+ chapters in the United States and Canada. As a career lifecycle organization, it offers robust leadership and professional development programs designed to cultivate Pan-Asian talent by supporting its members in reaching their career potential and by supporting its corporate partners to develop a strong, diverse, and inclusive workforce to achieve business growth. Ascend Foundation's research provides the basis to the development of Ascend’s leadership and development programs.
ABOUT ASCEND FOUNDATIONAscend Foundation is a 501(c)(3) organization with a mission to educate, advocate, and enable Pan-Asian business leaders to reach their full potential. Through its research and thought leadership activities, the Foundation’s goal is to help Pan-Asian leaders make greater impacts in business.
THE ILLUSION OF ASIAN SUCCESS: Scant Progress for Minorities in Cracking the Glass Ceiling from 2007–2015
28
EXHIBIT A (PAGE 1 OF 2)
NAICS-2 Code Categories
Sector 31-33--Manufacturing311 Food Manufacturing 312 Beverage and Tobacco Product Manufacturing 313 Textile Mills 314 Textile Product Mills 315 Apparel Manufacturing 316 Leather and Allied Product Manufacturing 321 Wood Product Manufacturing 322 Paper Manufacturing 323 Printing and Related Support Activities 324 Petroleum and Coal Products Manufacturing 325 Chemical Manufacturing 326 Plastics and Rubber Products Manufacturing 327 Nonmetallic Mineral Product Manufacturing 331 Primary Metal Manufacturing 332 Fabricated Metal Product Manufacturing 333 Machinery Manufacturing 334 Computer and Electronic Product Manufacturing 335 Electrical Equipment, Appliance, and Component Manufacturing 336 Transportation Equipment Manufacturing 337 Furniture and Related Product Manufacturing
Sector 44-45--Retail Trade 4411 Automobile Dealers 4412 Other Motor Vehicle Dealers 4413 Automotive Parts, Accessories, and Tire Stores 4421 Furniture Stores 4422 Home Furnishings Stores 4431 Electronics and Appliance Stores 4441 Building Material and Supplies Dealers 4451 Grocery Stores 4453 Beer, Wine, and Liquor Stores 4461 Health and Personal Care Stores 4471 Gasoline Stations 4481 Clothing Stores 4482 Shoe Stores 4483 Jewelry, Luggage, and Leather Goods Stores
THE ILLUSION OF ASIAN SUCCESS: Scant Progress for Minorities in Cracking the Glass Ceiling from 2007–2015
29
EXHIBIT A (PAGE 2 OF 2)
NAICS-2 Code Categories
Sector 51--Information 5111 Newspaper, Periodical, Book, and Directory Publishers 5112 Software Publishers 5121 Motion Picture and Video Industries 5122 Sound Recording Industries 5152 Cable and Other Subscription Programming 5173 Wired and Wireless Telecommunications Carriers 5174 Satellite Telecommunications 5179 Other Telecommunications 5182 Data Processing, Hosting, and Related Services 5191 Other Information Services
Sector 54--Professional, Scientific, and Technical Services5411 Legal Services 5412 Accounting, Tax Preparation, Bookkeeping, and Payroll Services 5413 Architectural, Engineering, and Related Services 5414 Specialized Design Services 5415 Computer Systems Design and Related Services
THE ILLUSION OF ASIAN SUCCESS: Scant Progress for Minorities in Cracking the Glass Ceiling from 2007–2015
30
EXHIBIT B
NAICS-2 Categories for Largest Silicon Valley Tech Companies
VMware

THE ILLUSION OF ASIAN SUCCESS: Scant Progress for Minorities in Cracking the Glass Ceiling from 2007–2015
31
EXHIBIT C
A Discussion About the Dataset
As mentioned earlier in this report, specific longitudinal EEO-1 data for the Bay Area hardware and software technology industries are not available, so we use a larger EEOC dataset for the manufacturing (NAICS 31, 32, 33) and information industry (NAICS 51) segments as a credible approximation to the set of high-tech companies. Although several large companies (e.g. Oracle) are in multiple businesses, including professional services and have portions of their workforce designated as NAICS 54 professional scientific and technical services, we have not included NAICS 54 as part of our dataset analyzed in this report because that sector also includes consulting, accounting and legal services.
To evaluate the sensitivity of that decision, we have separately done 2015 EPI computations to include NAICS 54. A comparison of EPI analysis of two datasets (with and without NAICS 54) is included as Exhibit I. The comparison shows that the EPI figures are similar and that the EPI-based conclusions are not likely to be significantly affected.
In addition, we have previously completed an EPI analysis using a 2014 aggregated dataset of 75 high-tech companies published as part of an EEOC study3. A comparison of EPI analysis of two datasets (NAICS 32,32,33,51 vs EEOC 75) is included as Exhibit J. The comparison shows that the EPI figures are similar and that the EPI-based conclusions are not likely to be significantly affected.
Finally, we have separately done EPI analyses using publicly available EEO-1 reports from various technology companies: Adobe, Apple, Cisco, eBay, Facebook, Google, HP, Intel, LinkedIn, Microsoft, Nvidia, Twitter, Uber, Yahoo, and Yelp. We used these companies’ most recent publicly available EEO-1 reports (dating from 2013 to 2016, depending on the company) with consolidated data for their entire U.S. workforce. The comparison of the aggregate 2015 EPI Asian vs White results to the EPI results for each company is included as Exhibit K. Although the EPI results vary from company to company, the findings from our aggregate EPI analysis of Bay Area technology sector appear to be generally consistent with the individual results using consolidated U.S. workforce data with almost all of the companies examined.

THE ILLUSION OF ASIAN SUCCESS: Scant Progress for Minorities in Cracking the Glass Ceiling from 2007–2015
32
EXHIBIT D
EEO-1 Job Classifications
Executive/Senior Level Officials and ManagersIndividuals who plan, direct and formulate policies, set strategy and provide the overall direction of enterprises/organizations for the development and delivery of products or services, within the parameters approved by boards of directors or other governing bodies. Residing in the highest levels of organizations, these executives plan, direct or coordinate activities with the support of subordinate executives and staff managers. They include, in larger organizations, those individuals within two reporting levels of the CEO, whose responsibilities require frequent interaction with the CEO. Examples of these kinds of managers are: chief executive officers, chief operating officers, chief financial officers, line of business heads, presidents or executive vice presidents of functional areas or operating groups, chief information officers, chief human resources officers, chief marketing officers, chief legal officers, management directors and managing partners.
First/Mid Level Officials and ManagersIndividuals who serve as managers, other than those who serve as Executive/Senior Level Officials and Managers, including those who oversee and direct the delivery of products, services or functions at group, regional or divisional levels of organizations. These managers receive directions from the Executive/Senior Level management and typically lead major business units. They implement policies, programs and directives of executive/senior management through subordinate managers and within the parameters set by Executive/Senior Level management. Examples of these kinds of managers are: vice presidents and directors, group, regional or divisional controllers; treasurers; human resources, information systems, marketing, and operations managers. The First/Mid Level Officials and Managers subcategory also includes those who report directly to middle managers. These individuals serve at functional, line of business segment or branch levels and are responsible for directing and executing the day-to-day operational objectives of enterprises/organizations, conveying the directions of higher level officials and managers to subordinate personnel and, in some instances, directly supervising the activities of exempt and non-exempt personnel. Examples of these kinds of managers are: first-line managers; team managers; unit managers; operations and production mangers; branch managers; administrative services managers; purchasing and transportation managers; storage and distribution managers; call center or customer service managers; technical support managers; and brand or product managers.
ProfessionalsMost jobs in this category require bachelor and graduate degrees, and/or professional certification. In some instances, comparable experience may establish a person's qualifications. Examples of these kinds of positions include: accountants and auditors; airplane pilots and flight engineers; architects; artists; chemists; computer programmers; designers; dieticians; editors; engineers; lawyers; librarians; mathematical scientists; natural scientists; registered nurses; physical scientists; physicians and surgeons; social scientists; teachers; and surveyors.
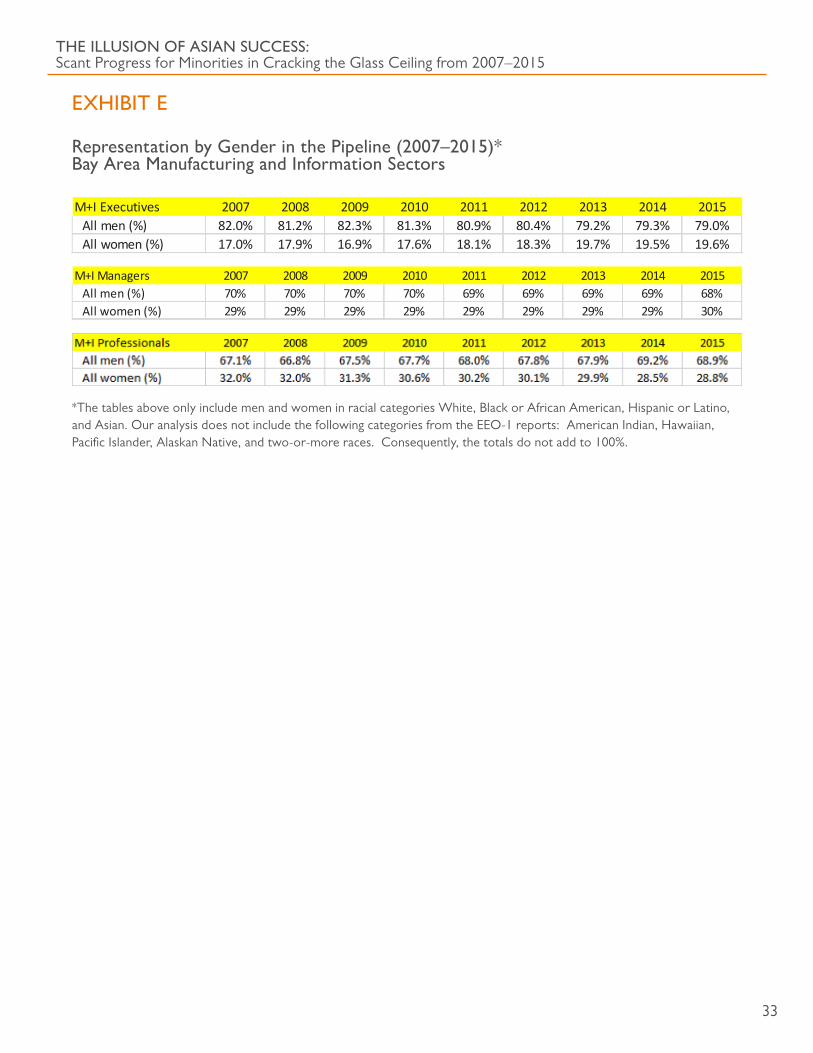
THE ILLUSION OF ASIAN SUCCESS: Scant Progress for Minorities in Cracking the Glass Ceiling from 2007–2015
33
EXHIBIT E
Representation by Gender in the Pipeline (2007–2015)*Bay Area Manufacturing and Information Sectors
M+I Executives 2007 2008 2009 2010 2011 2012 2013 2014 2015All men (%) 82.0% 81.2% 82.3% 81.3% 80.9% 80.4% 79.2% 79.3% 79.0%All women (%) 17.0% 17.9% 16.9% 17.6% 18.1% 18.3% 19.7% 19.5% 19.6%
M+I Managers 2007 2008 2009 2010 2011 2012 2013 2014 2015All men (%) 70% 70% 70% 70% 69% 69% 69% 69% 68%All women (%) 29% 29% 29% 29% 29% 29% 29% 29% 30%
*The tables above only include men and women in racial categories White, Black or African American, Hispanic or Latino, and Asian. Our analysis does not include the following categories from the EEO-1 reports: American Indian, Hawaiian, Pacific Islander, Alaskan Native, and two-or-more races. Consequently, the totals do not add to 100%.
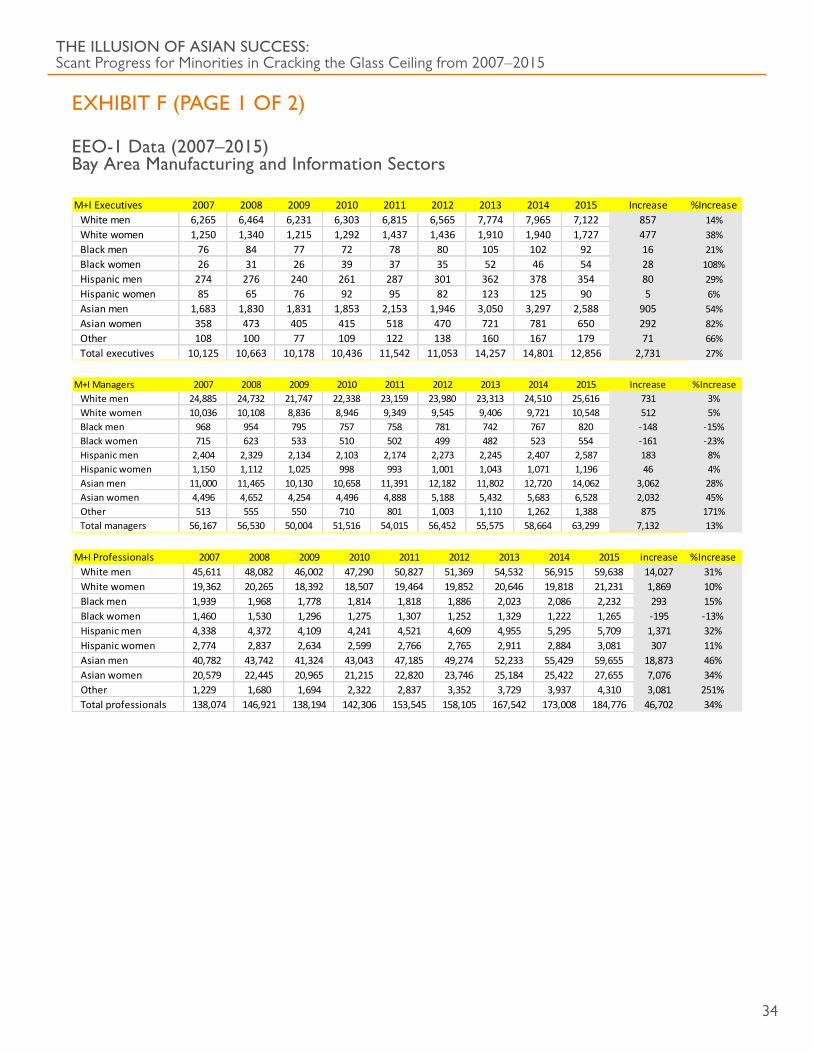
THE ILLUSION OF ASIAN SUCCESS: Scant Progress for Minorities in Cracking the Glass Ceiling from 2007–2015
34
EXHIBIT F (PAGE 1 OF 2)
EEO-1 Data (2007–2015)Bay Area Manufacturing and Information Sectors
M+I Executives 2007 2008 2009 2010 2011 2012 2013 2014 2015 Increase %IncreaseWhite men 6,265 6,464 6,231 6,303 6,815 6,565 7,774 7,965 7,122 857 14%White women 1,250 1,340 1,215 1,292 1,437 1,436 1,910 1,940 1,727 477 38%Black men 76 84 77 72 78 80 105 102 92 16 21%Black women 26 31 26 39 37 35 52 46 54 28 108%Hispanic men 274 276 240 261 287 301 362 378 354 80 29%Hispanic women 85 65 76 92 95 82 123 125 90 5 6%Asian men 1,683 1,830 1,831 1,853 2,153 1,946 3,050 3,297 2,588 905 54%Asian women 358 473 405 415 518 470 721 781 650 292 82%Other 108 100 77 109 122 138 160 167 179 71 66%Total executives 10,125 10,663 10,178 10,436 11,542 11,053 14,257 14,801 12,856 2,731 27%
M+I Managers 2007 2008 2009 2010 2011 2012 2013 2014 2015 Increase %IncreaseWhite men 24,885 24,732 21,747 22,338 23,159 23,980 23,313 24,510 25,616 731 3%White women 10,036 10,108 8,836 8,946 9,349 9,545 9,406 9,721 10,548 512 5%Black men 968 954 795 757 758 781 742 767 820 -148 -15%Black women 715 623 533 510 502 499 482 523 554 -161 -23%Hispanic men 2,404 2,329 2,134 2,103 2,174 2,273 2,245 2,407 2,587 183 8%Hispanic women 1,150 1,112 1,025 998 993 1,001 1,043 1,071 1,196 46 4%Asian men 11,000 11,465 10,130 10,658 11,391 12,182 11,802 12,720 14,062 3,062 28%Asian women 4,496 4,652 4,254 4,496 4,888 5,188 5,432 5,683 6,528 2,032 45%Other 513 555 550 710 801 1,003 1,110 1,262 1,388 875 171%Total managers 56,167 56,530 50,004 51,516 54,015 56,452 55,575 58,664 63,299 7,132 13%
M+I Professionals 2007 2008 2009 2010 2011 2012 2013 2014 2015 increase %IncreaseWhite men 45,611 48,082 46,002 47,290 50,827 51,369 54,532 56,915 59,638 14,027 31%White women 19,362 20,265 18,392 18,507 19,464 19,852 20,646 19,818 21,231 1,869 10%Black men 1,939 1,968 1,778 1,814 1,818 1,886 2,023 2,086 2,232 293 15%Black women 1,460 1,530 1,296 1,275 1,307 1,252 1,329 1,222 1,265 -195 -13%Hispanic men 4,338 4,372 4,109 4,241 4,521 4,609 4,955 5,295 5,709 1,371 32%Hispanic women 2,774 2,837 2,634 2,599 2,766 2,765 2,911 2,884 3,081 307 11%Asian men 40,782 43,742 41,324 43,043 47,185 49,274 52,233 55,429 59,655 18,873 46%Asian women 20,579 22,445 20,965 21,215 22,820 23,746 25,184 25,422 27,655 7,076 34%Other 1,229 1,680 1,694 2,322 2,837 3,352 3,729 3,937 4,310 3,081 251%Total professionals 138,074 146,921 138,194 142,306 153,545 158,105 167,542 173,008 184,776 46,702 34%

THE ILLUSION OF ASIAN SUCCESS: Scant Progress for Minorities in Cracking the Glass Ceiling from 2007–2015
35
EXHIBIT F (PAGE 2 OF 2)
EEO-1 Data (2007–2015)Bay Area Manufacturing and Information Sectors
EPI TRENDS 2007 2008 2009 2010 2011 2012 2013 2014 2015White men EPI 1.87 1.85 1.84 1.82 1.78 1.83 1.68 1.64 1.72White women EPI 0.88 0.91 0.90 0.95 0.98 1.03 1.09 1.14 1.17Black men EPI 0.53 0.59 0.59 0.54 0.57 0.61 0.61 0.57 0.59Black women EPI 0.24 0.28 0.27 0.42 0.38 0.40 0.46 0.44 0.61Hispanic men EPI 0.86 0.87 0.79 0.84 0.84 0.93 0.86 0.83 0.89Hispanic women EPI 0.42 0.32 0.39 0.48 0.46 0.42 0.50 0.51 0.42Asian men EPI 0.56 0.58 0.60 0.59 0.61 0.56 0.69 0.70 0.62Asian women EPI 0.24 0.29 0.26 0.27 0.30 0.28 0.34 0.36 0.34Other 1.20 0.82 0.62 0.64 0.57 0.59 0.50 0.50 0.60

THE ILLUSION OF ASIAN SUCCESS: Scant Progress for Minorities in Cracking the Glass Ceiling from 2007–2015
36
EXHIBIT G
Representation by Race in the Pipeline (2007–2015)Bay Area Manufacturing and Information Sectors
M+I Executives (%) 2007 2008 2009 2010 2011 2012 2013 2014 2015White exec (%) 74.2% 73.2% 73.2% 72.8% 71.5% 72.4% 67.9% 66.9% 68.8%Black exec (%) 1.0% 1.1% 1.0% 1.1% 1.0% 1.0% 1.1% 1.0% 1.1%Hispanic exec (%) 3.5% 3.2% 3.1% 3.4% 3.3% 3.5% 3.4% 3.4% 3.5%Asian exec (%) 20.2% 21.6% 22.0% 21.7% 23.1% 21.9% 26.5% 27.6% 25.2%
M+I Managers (%) 2007 2008 2009 2010 2011 2012 2013 2014 2015White mgr (%) 62.2% 61.6% 61.2% 60.7% 60.2% 59.4% 58.9% 58.4% 57.1%Black mgr(%) 3.0% 2.8% 2.7% 2.5% 2.3% 2.3% 2.2% 2.2% 2.2%Hispanic mgr (%) 6.3% 6.1% 6.3% 6.0% 5.9% 5.8% 5.9% 5.9% 6.0%Asian mgr (%) 27.6% 28.5% 28.8% 29.4% 30.1% 30.8% 31.0% 31.4% 32.5%
M+I Professionals (%) 2007 2008 2009 2010 2011 2012 2013 2014 2015White prof (%) 47.1% 46.5% 46.6% 46.2% 45.8% 45.0% 44.9% 44.4% 43.8%Black prof (%) 2.5% 2.4% 2.2% 2.2% 2.0% 2.0% 2.0% 1.9% 1.9%Hispanic prof (%) 5.2% 4.9% 4.9% 4.8% 4.7% 4.7% 4.7% 4.7% 4.8%Asian prof (%) 44.4% 45.0% 45.1% 45.2% 45.6% 46.2% 46.2% 46.7% 47.3%
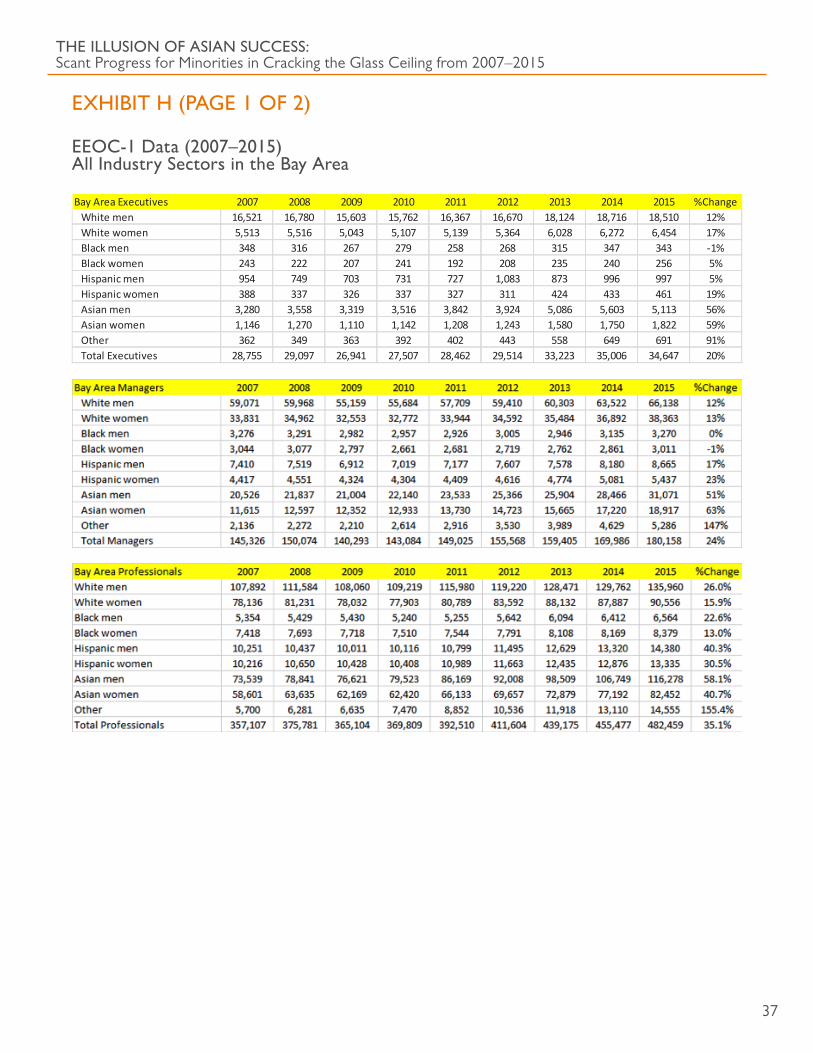
THE ILLUSION OF ASIAN SUCCESS: Scant Progress for Minorities in Cracking the Glass Ceiling from 2007–2015
37
EXHIBIT H (PAGE 1 OF 2)
EEOC-1 Data (2007–2015)All Industry Sectors in the Bay Area
Bay Area Executives 2007 2008 2009 2010 2011 2012 2013 2014 2015 %ChangeWhite men 16,521 16,780 15,603 15,762 16,367 16,670 18,124 18,716 18,510 12%White women 5,513 5,516 5,043 5,107 5,139 5,364 6,028 6,272 6,454 17%Black men 348 316 267 279 258 268 315 347 343 -1%Black women 243 222 207 241 192 208 235 240 256 5%Hispanic men 954 749 703 731 727 1,083 873 996 997 5%Hispanic women 388 337 326 337 327 311 424 433 461 19%Asian men 3,280 3,558 3,319 3,516 3,842 3,924 5,086 5,603 5,113 56%Asian women 1,146 1,270 1,110 1,142 1,208 1,243 1,580 1,750 1,822 59%Other 362 349 363 392 402 443 558 649 691 91%Total Executives 28,755 29,097 26,941 27,507 28,462 29,514 33,223 35,006 34,647 20%
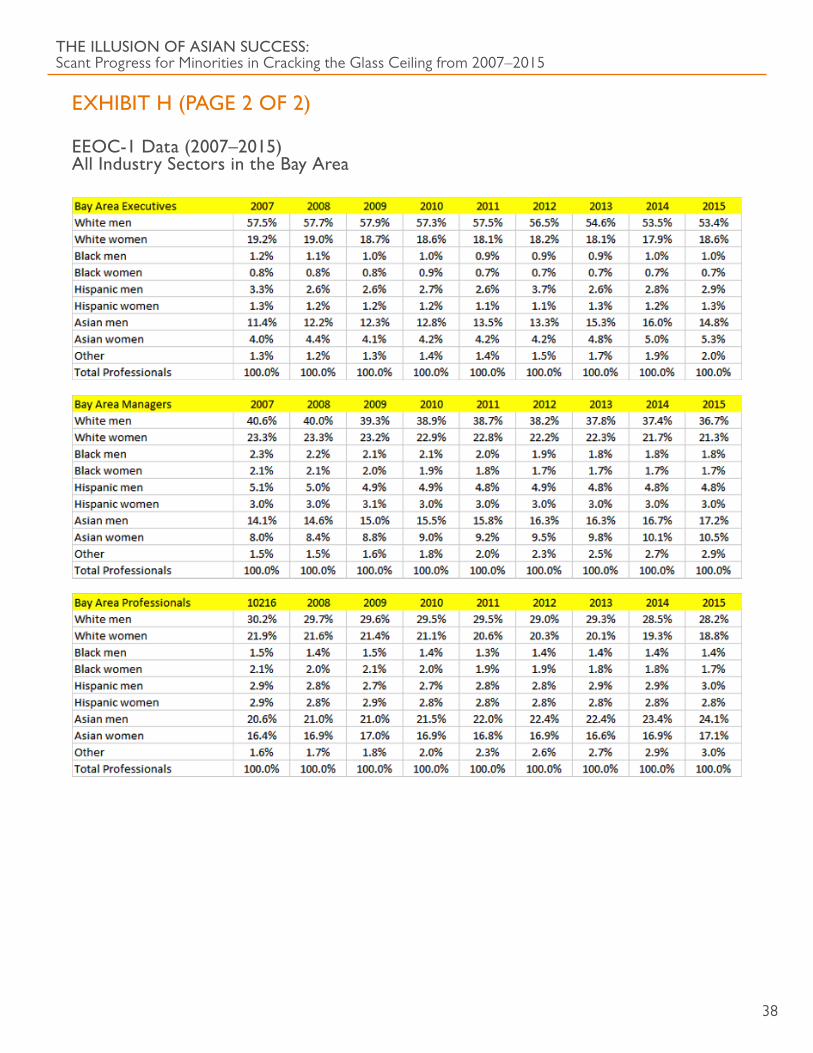
THE ILLUSION OF ASIAN SUCCESS: Scant Progress for Minorities in Cracking the Glass Ceiling from 2007–2015
38
EXHIBIT H (PAGE 2 OF 2)
EEOC-1 Data (2007–2015)All Industry Sectors in the Bay Area
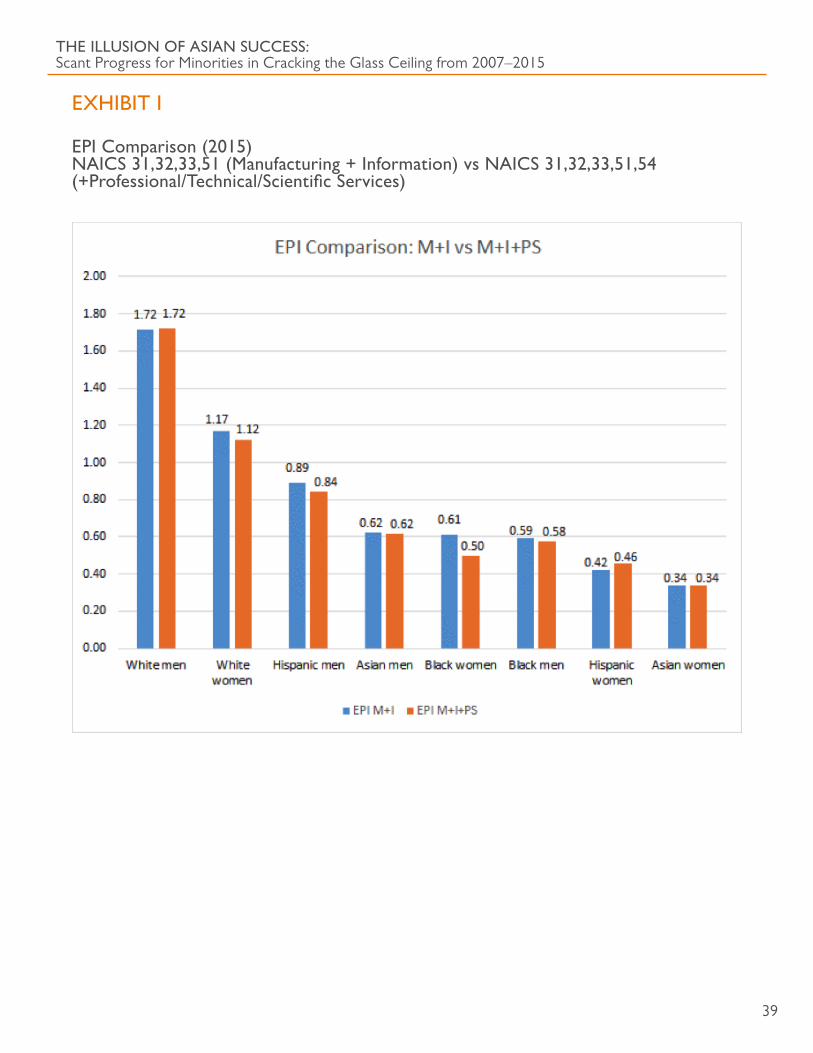
THE ILLUSION OF ASIAN SUCCESS: Scant Progress for Minorities in Cracking the Glass Ceiling from 2007–2015
39
EXHIBIT I
EPI Comparison (2015)NAICS 31,32,33,51 (Manufacturing + Information) vs NAICS 31,32,33,51,54 (+Professional/Technical/Scientific Services)
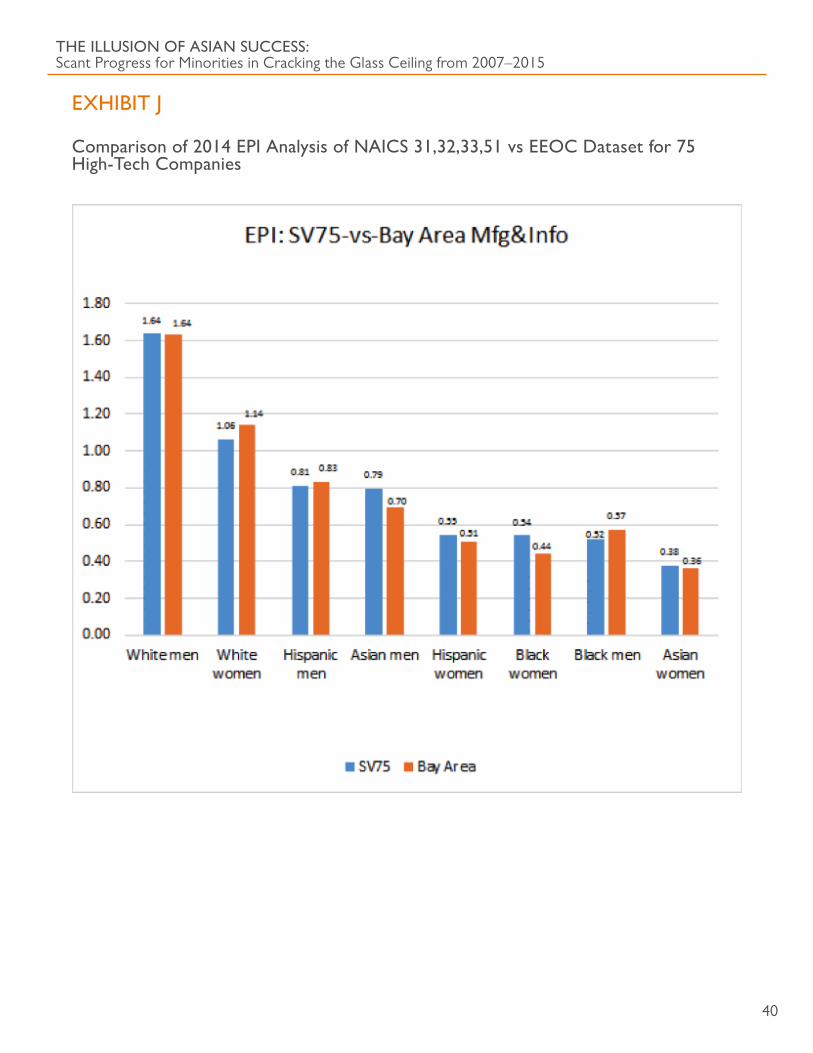
THE ILLUSION OF ASIAN SUCCESS: Scant Progress for Minorities in Cracking the Glass Ceiling from 2007–2015
40
EXHIBIT J
Comparison of 2014 EPI Analysis of NAICS 31,32,33,51 vs EEOC Dataset for 75 High-Tech Companies
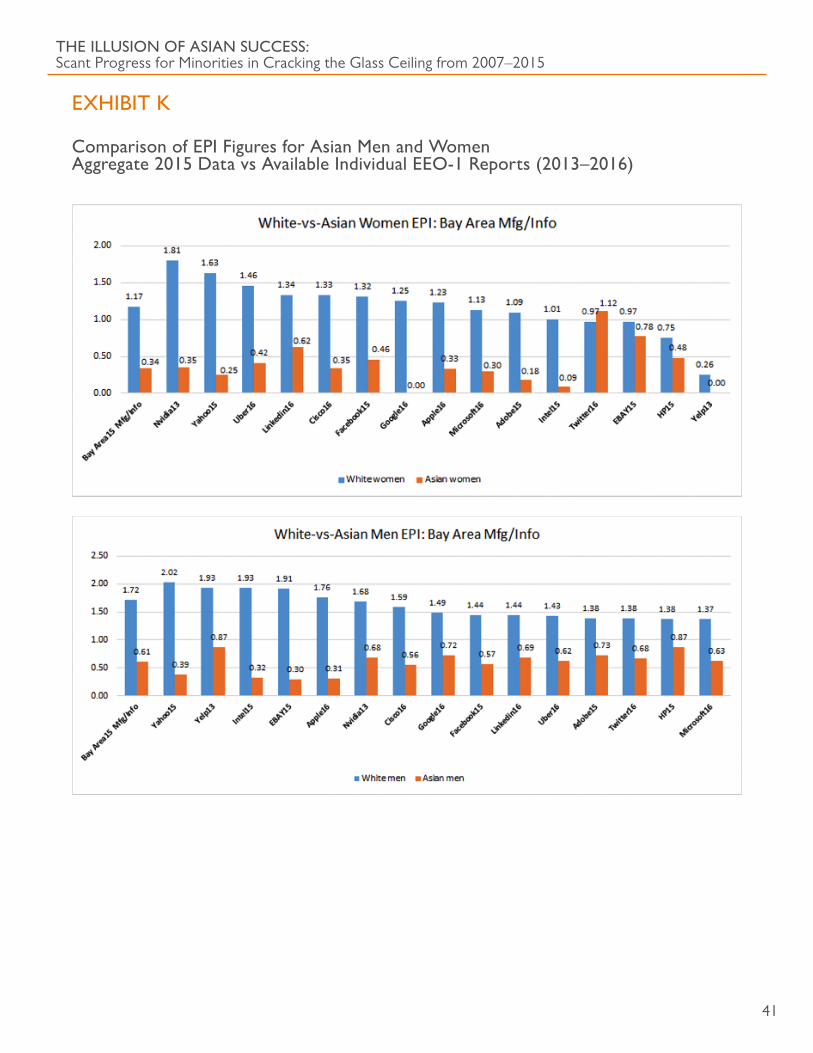
THE ILLUSION OF ASIAN SUCCESS: Scant Progress for Minorities in Cracking the Glass Ceiling from 2007–2015
41
EXHIBIT K
Comparison of EPI Figures for Asian Men and WomenAggregate 2015 Data vs Available Individual EEO-1 Reports (2013–2016)
THE ILLUSION OF ASIAN SUCCESS: Scant Progress for Minorities in Cracking the Glass Ceiling from 2007–2015
42
REFERENCES1. “The Rise of Asian American Leaders in Tech”, Jeff Yang, CNN, Aug 14, 2015,
http://www.cnn.com/2015/08/14/opinions/yang-google-ceo-immigration/
2. “Job Patterns For Minorities And Women In Private Industry (EEO-1)”, EEOC https://www.eeoc.gov/eeoc/statistics/employment/jobpat-eeo1/index.cfm
3. “Diversity in High Tech”, EEOC, May 2016 https://www.eeoc.gov/eeoc/statistics/reports/hightech/upload/diversity-in-high-tech-report.pdf
4. US Census Quickfacts: United States, Santa Clara and San Francisco Counties, July 1, 2016, https://www.census.gov/quickfacts/fact/table/US,sanfranciscocountycalifornia,santaclaracountycalifornia/PST045216
5. “Hidden in Plain Sight”, Gee, Peck, Wong, Ascend May 2015, https://c.ymcdn.com/sites/ascendleadership.site-ym.com/resource/resmgr/Research/HiddenInPlainSight_Paper_042.pdf\
6. “Lost in Aggregation”, Gee, Wong, Ascend September, 2016 https://c.ymcdn.com/sites/ascendleadership.site-ym.com/resource/resmgr/research/lostinaggregation-paper.pdf
7. CEO Action for Diversity and Inclusion: https://www.ceoaction.com/