The FHA Does Not Produce Sustainable Homeownership€¦ · The FHA Does Not Produce Sustainable...
42
The FHA Does Not Produce Sustainable Homeownership Edward Pinto, Resident Fellow American Enterprise Institute December 5, 2013 The views expressed here are those of the author alone and do not necessarily represent those of the American Enterprise Institute. Government Involvement in Residential Mortgage Markets Sponsored by: the Federal Reserve Bank of Atlanta
-
Upload
duongduong -
Category
Documents
-
view
229 -
download
0
Transcript of The FHA Does Not Produce Sustainable Homeownership€¦ · The FHA Does Not Produce Sustainable...
The FHA Does Not Produce Sustainable Homeownership
Edward Pinto, Resident Fellow American Enterprise Institute December 5, 2013 The views expressed here are those of the author alone and do not necessarily represent those of the American Enterprise Institute.
Government Involvement in Residential Mortgage Markets Sponsored by: the Federal Reserve Bank of Atlanta
‘Mortgage’ - just another word for trouble
• Market home ownership aggressively to borrowers with poor credit.
• Push families into homes they can’t afford.
• Saddle them with loans that barely build equity. • Provide no incentives for fiscal discipline. • Tolerate high failure rate, leaving families in
financial ruin and communities reeling.
2
NightmareAtFHA.com
FHA has a history of abusive lending
“We have been fighting abuse, fraud, and neglect of the FHA program that has destroyed too many neighborhoods and too many families' dreams of homeownership for more than 25 years….The FHA program has a national default rate 3 to 4 times the conventional market, and in many urban neighborhoods it routinely exceeds 10 times. In addition, the FHA program is hemorrhaging money….” Statement by the late-Gale Cincotta (a long-time community activist) made before the Subcommittee on Housing and Community Opportunity of the House Financial Services Committee, April 1, 1998
NightmareAtFHA.com
3
FHA’s Original Goal: End ‘Mortgage’ Becoming Another Word for Trouble
NightmareAtFHA.com
4
• When established in 1934 by Congress, FHA implemented commonsense underwriting standards—increasing down payments to a minimum of 20%, establishing reliable and speedy loan pay downs with a 15-20 year loan term, using a residual income test to assure a borrower’s reasonable ability to pay, and requiring demonstration of a good credit history. ▫ From 1934 to 1960, these standards helped millions upon
millions of Americans safely and confidently achieve the American dream of eventually owning their home free and clear of a mortgage and helped increase the homeownership rate to new heights.
▫ Over its first 20 years, the FHA paid only 5,712 claims out of 2.9 million insured mortgages for a cumulative claims rate of 0.2%.
FHA Underwriting Standard--1936
• “To be economically sound, a mortgage must be based on good security and involve a borrower with characteristics and income which indicate a strong probability that the debt will be paid off in accordance with conditions of the transaction. Such a mortgage transaction is mutually advantageous to the borrower, the mortgagee, and the Federal Housing Administration.”
NightmareAtFHA.com
5
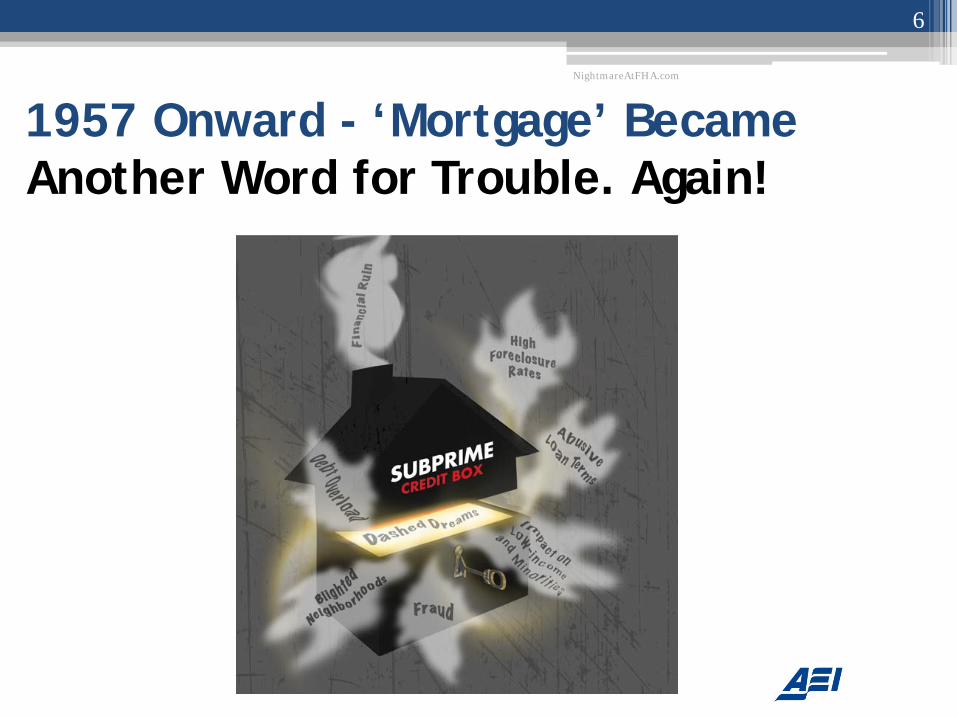
1957 Onward - ‘Mortgage’ Became Another Word for Trouble. Again!
NightmareAtFHA.com
6
FHA and HUD Made Foreclosures Commonplace Across America
NightmareAtFHA.com
7
• Starting in the late-1950s Congress imposed increasingly lax standards for FHA insurance. • From 1975 to 2011, over 3 million FHA borrowers would
lose their homes to foreclosure. • Beginning in the early-1990s, powerful lobbies,
politicians, and HUD replicated FHA’s abandonment of commonsense underwriting at Fannie Mae, Freddie Mac, and throughout the mortgage market. ▫ 8 million families would experience foreclosure from 2007
to the present.
nightmareatfha.com
| 88
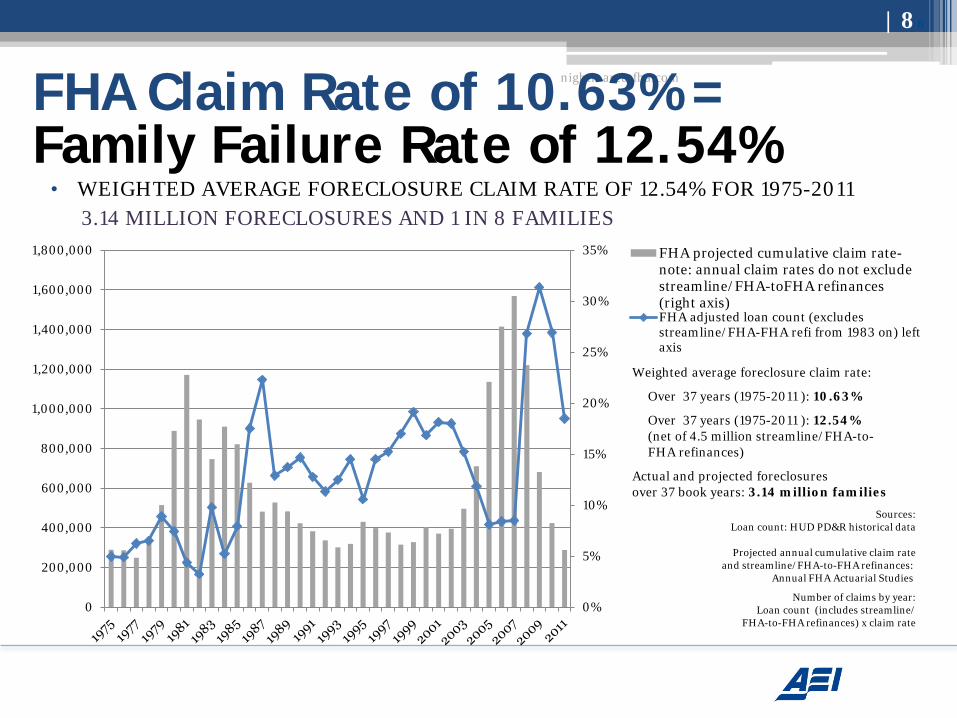
FHA Claim Rate of 10.63% =
• WEIGHTED AVERAGE FORECLOSURE CLAIM RATE OF 12.54% FOR 1975-2011 Family Failure Rate of 12.54%
3.14 MILLION FORECLOSURES AND 1 IN 8 FAMILIES
0%
5%
10%
15%
20%
25%
30%
35%
0
200,000
400,000
600,000
800,000
1,000,000
1,200,000
1,400,000
1,600,000
1,800,000 FHA projected cumulative claim rate-note: annual claim rates do not excludestreamline/FHA-toFHA refinances(right axis)FHA adjusted loan count (excludesstreamline/FHA-FHA refi from 1983 on) leftaxis
Weighted average foreclosure claim rate:
Over 37 years (1975-2011 ): 10.63%
Over 37 years (1975-2011 ): 12.54% (net of 4.5 million streamline/FHA-to- FHA refinances)
Actual and projected foreclosures over 37 book years: 3.14 million families
Sources: Loan count: HUD PD&R historical data
Projected annual cumulative claim rate
and streamline/FHA-to-FHA refinances: Annual FHA Actuarial Studies
Number of claims by year: Loan count (includes streamline/
FHA-to-FHA refinances) x claim rate
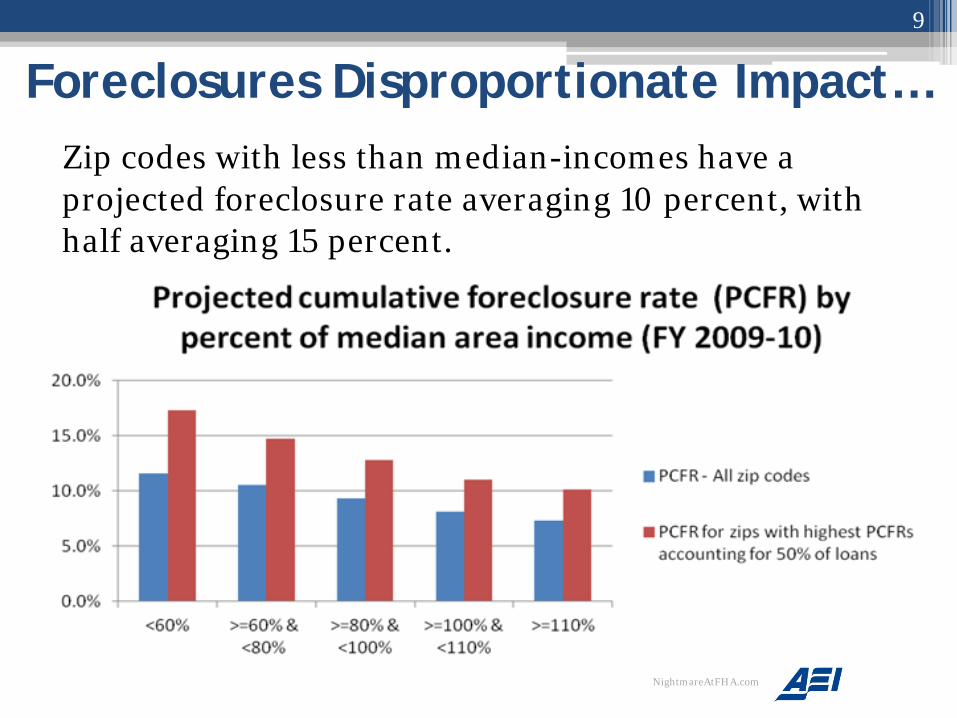
Foreclosures Disproportionate Impact… Zip codes with less than median-incomes have a
projected foreclosure rate averaging 10 percent, with half averaging 15 percent.
9
9
NightmareAtFHA.com
Cross-subsidies Pay for Catastrophic Losses in Working Class Neighborhoods
• The five zip codes in Atlanta with the highest projected failure rates had rates that ranged from 24 to 30 percent.
• The five zip codes in Atlanta with the lowest projected failure rates had rates that ranged from 2 to 4 percent.
• The five zip codes in Miami with the highest projected failure rates had rates that ranged from 21 to 33 percent.
• The five zip codes in Miami with the lowest projected failure rates had rates that ranged from 4 to 6 percent.
See Appendix I.
NightmareAtFHA.com
10
Harm to a Family’s Credit • Foreclosed borrowers denied access to most forms of credit
for 3-to-5 years and limits on the ability to rent. ▫ Denied the opportunity to build equity, provide security for their
family, and have the down payment for their next home as their family grows.
• At a projected foreclosure rate averaging 10 percent, nearly 1 in 5 FHA loans is delinquent 30 days or more at least once in a two year period.
• In a working class neighborhood with a projected foreclosure rate averaging 17 percent*, nearly 1 in 3 FHA loans is delinquent 30 days or more at least once in a two year period.
• Mortgage delinquencies negatively impact credit scores, access, and credit cost (see Appendix B).
*Foreclosure rate for FHA borrowers with a FICO score of 620-659.
11
NightmareAtFHA.com
Harm to Communities
• Reduction in neighboring property values. • Blight and higher levels of crime. • Poorer health. • Disproportionate impact on children, seniors,
and minorities. • Stress on community services. • Reduced property tax receipts.
12
NightmareAtFHA.com
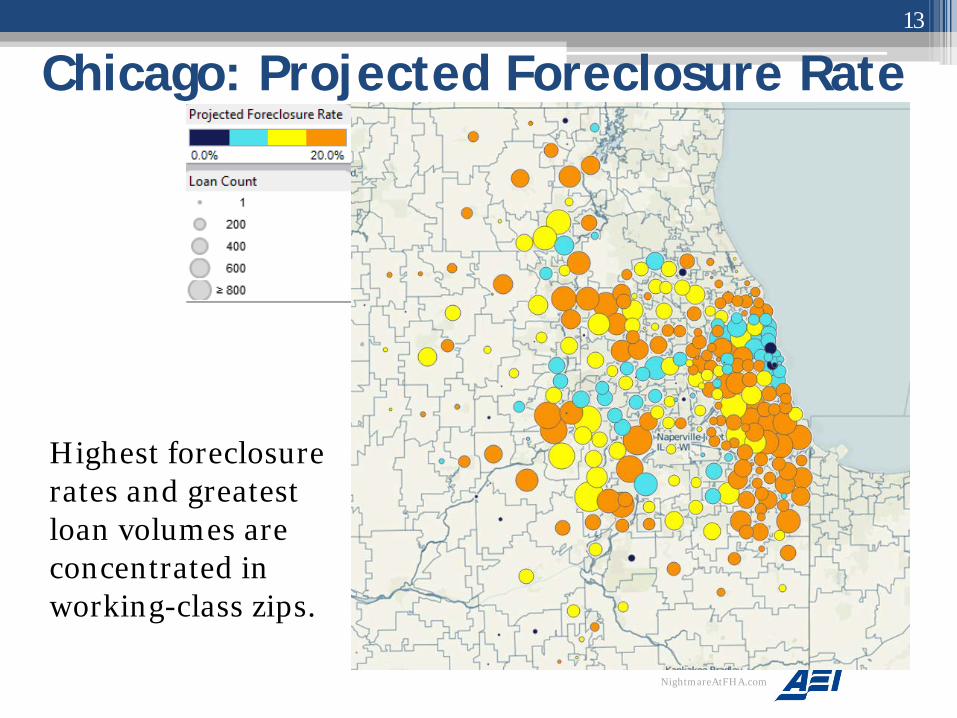
Chicago: Projected Foreclosure Rate
Highest foreclosure rates and greatest loan volumes are concentrated in working-class zips.
13
NightmareAtFHA.com
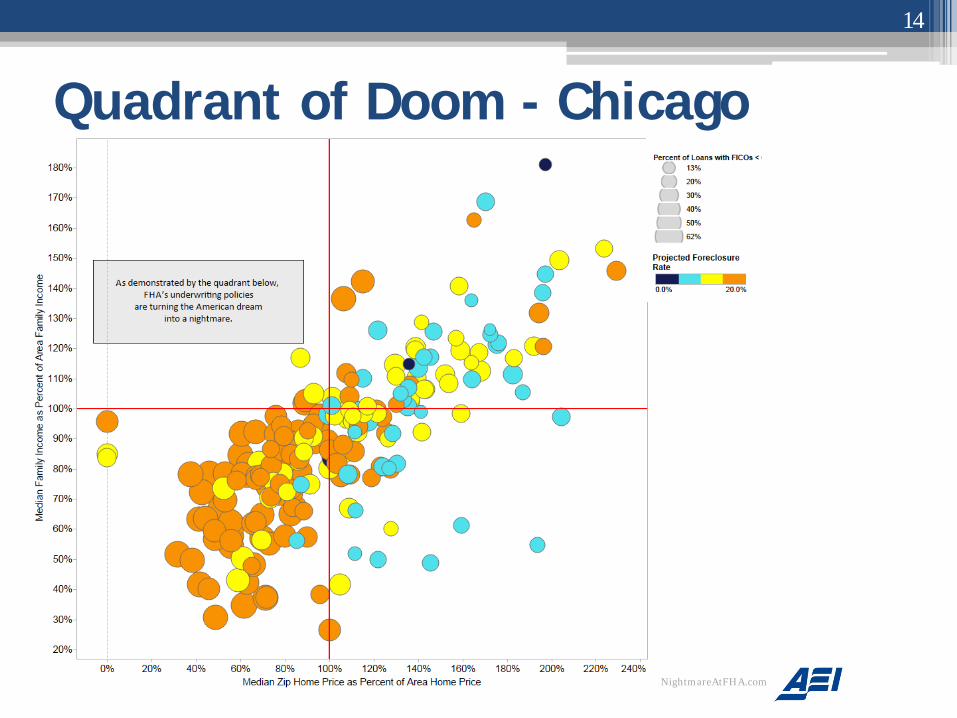
Quadrant of Doom - Chicago
14
NightmareAtFHA.com
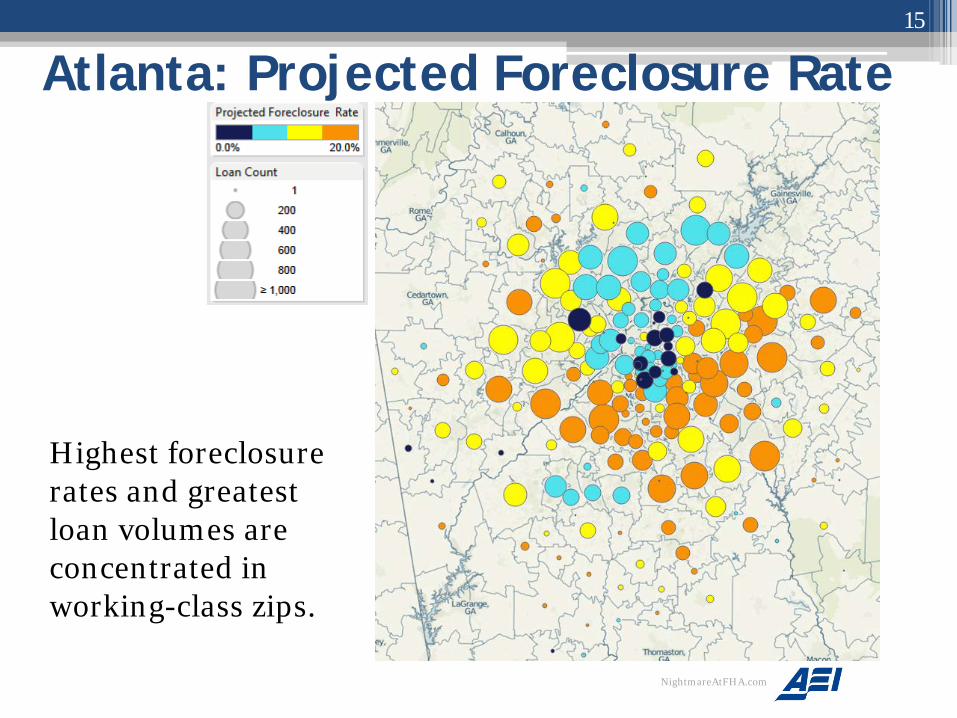
Atlanta: Projected Foreclosure Rate
Highest foreclosure rates and greatest loan volumes are concentrated in working-class zips.
15
NightmareAtFHA.com
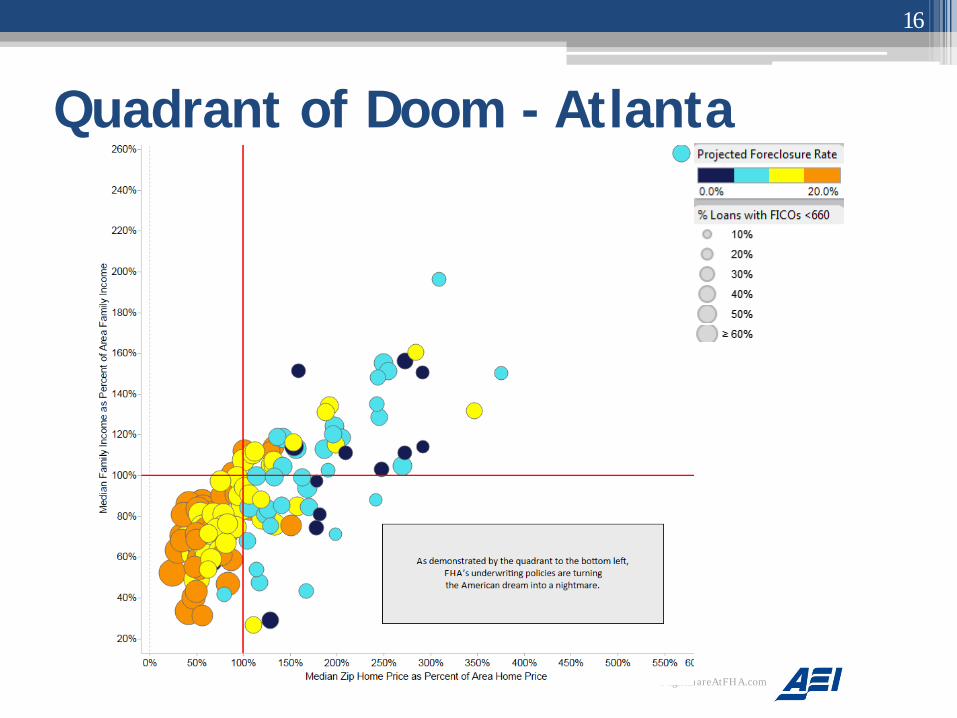
Quadrant of Doom - Atlanta
16
NightmareAtFHA.com
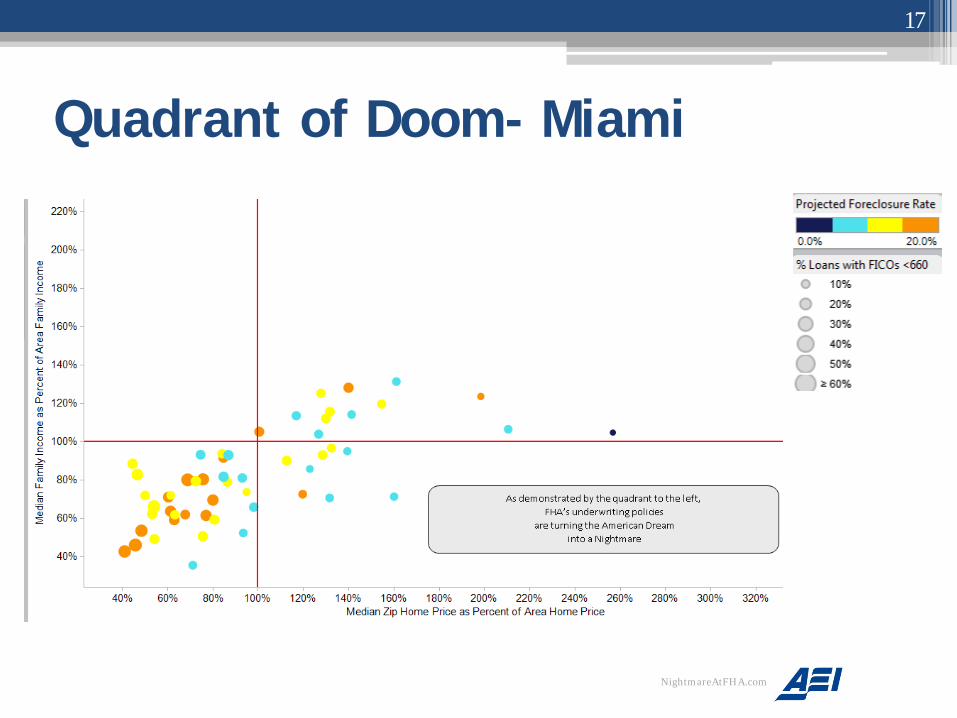
Quadrant of Doom- Miami
17
NightmareAtFHA.com

Quadrant of Doom - Tampa
18
NightmareAtFHA.com
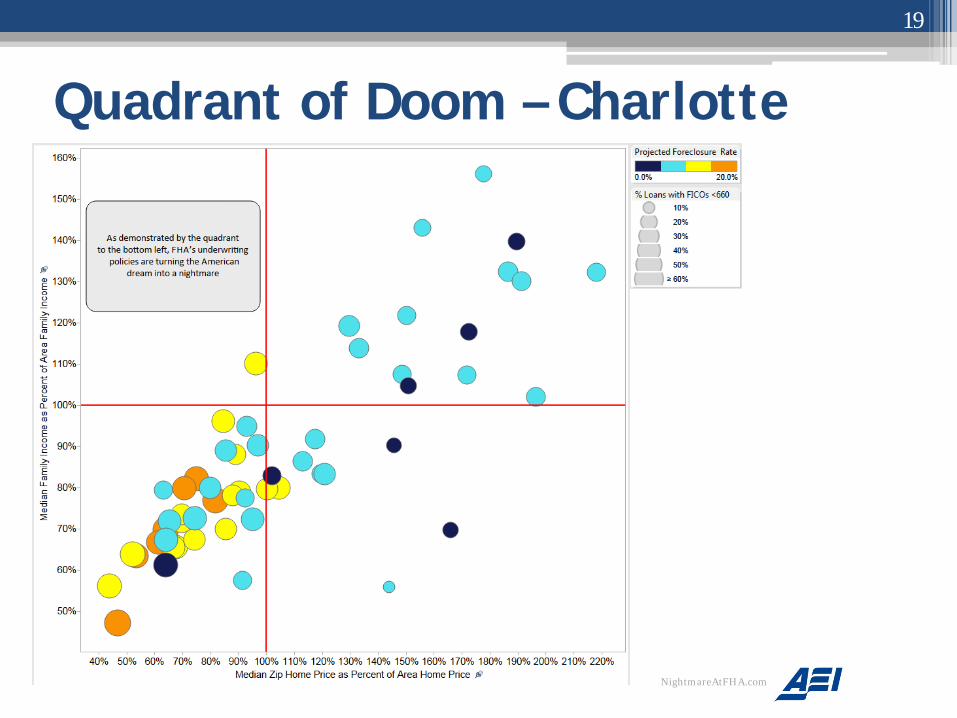
Quadrant of Doom – Charlotte
19
NightmareAtFHA.com
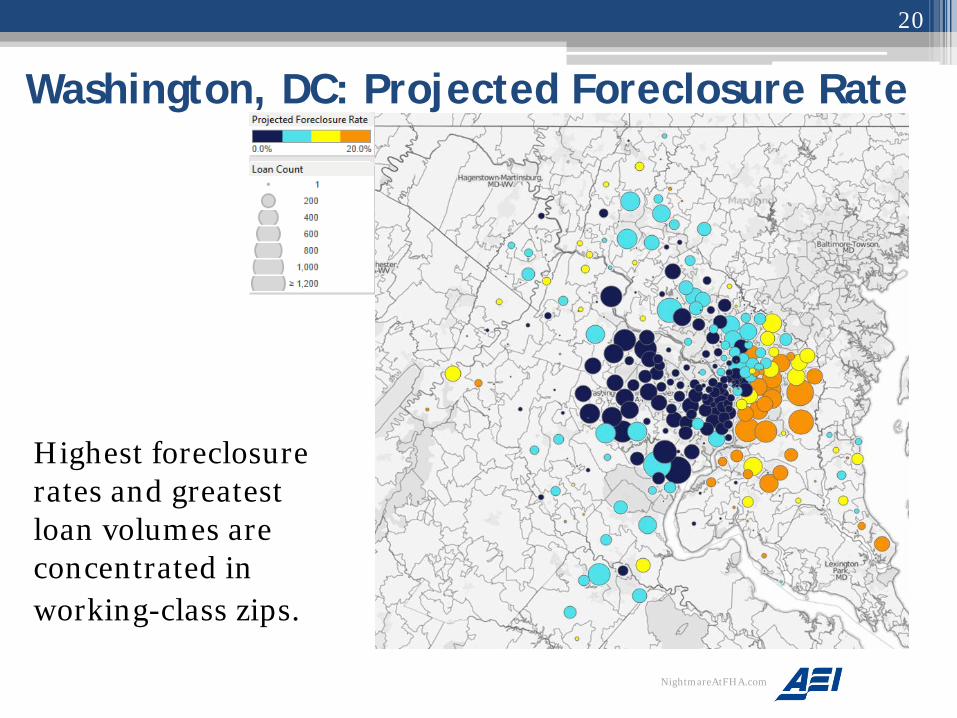
Washington, DC: Projected Foreclosure Rate
Highest foreclosure rates and greatest loan volumes are concentrated in working-class zips.
20
NightmareAtFHA.com
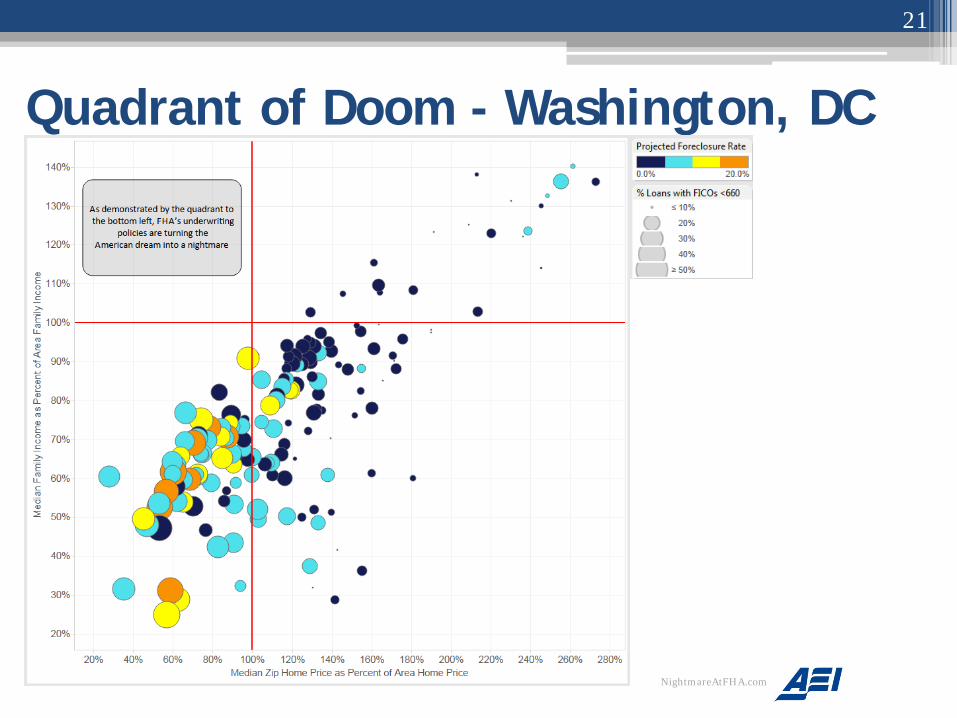
Quadrant of Doom - Washington, DC
21
NightmareAtFHA.com
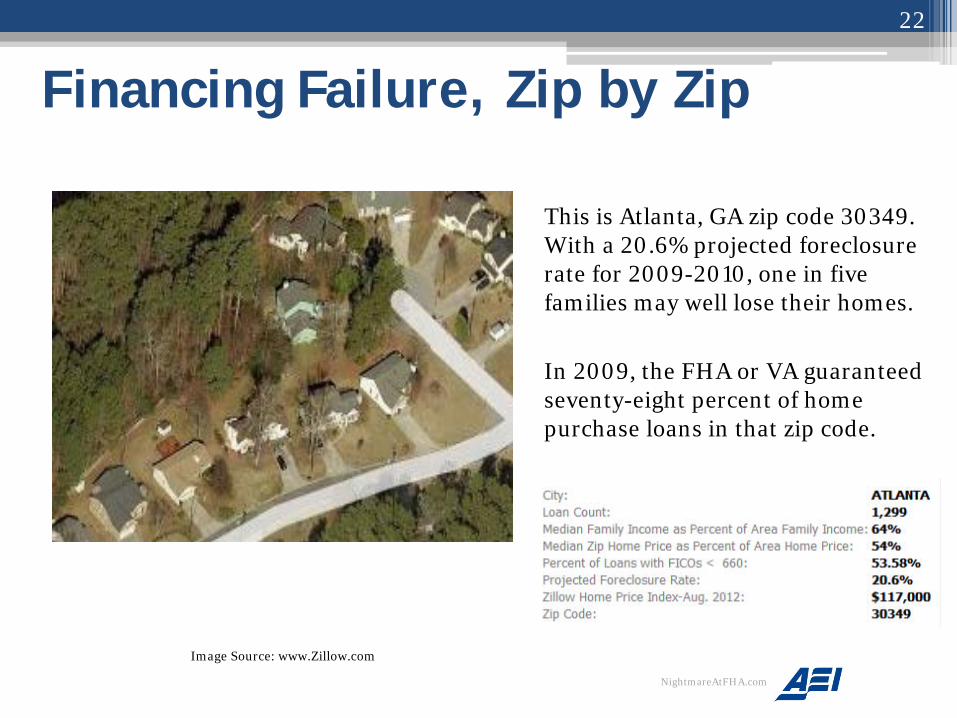
Financing Failure, Zip by Zip
This is Atlanta, GA zip code 30349. With a 20.6% projected foreclosure rate for 2009-2010, one in five families may well lose their homes.
22
In 2009, the FHA or VA guaranteed seventy-eight percent of home purchase loans in that zip code.
NightmareAtFHA.com
Image Source: www.Zillow.com

WORKING CLASS COMMUNITIES DESERVE COMMON SENSE REFORM • Reduce coverage below 100 percent (Section 234 of the Protecting American
Taxpayers and Homeowners Act of 2013 (PATH))–Appendix C; • Advise consumer as to foreclosure risk based applicant’s risk profile
(Section 236 of PATH); • Limit seller concessions to 3 percent (Section 263 of PATH)–Appendix D; • Utilize residual income test (Section 267 of PATH)–Appendix E; • Reinstitute vetted appraisal panels with rotational assignment–Appendix F; • Introduce countercyclical stress test and countercyclical LTV ratios–
Appendix G; • Underwrite for risk – balance down payment, loan term, FICO, and debt-to-
income (DTI to achieve meaningful equity–Appendix H; and • Support accumulation of meaningful equity by prohibiting second
mortgages and cash out refinances and by requiring any rate reduction on a rate and term refinance to be dedicated to faster amortization.
NightmareAtFHA.com
23
The relevant public policy question • What is the tolerance for failure for loans under
such a government program?
• What is the tolerance for failure given the concentration of failure that occurs with respect to working class families and neighborhoods?
• Answer: These common sense reforms will allow FHA to reduce its cycle default rate to 6-7%.
NightmareAtFHA.com
24
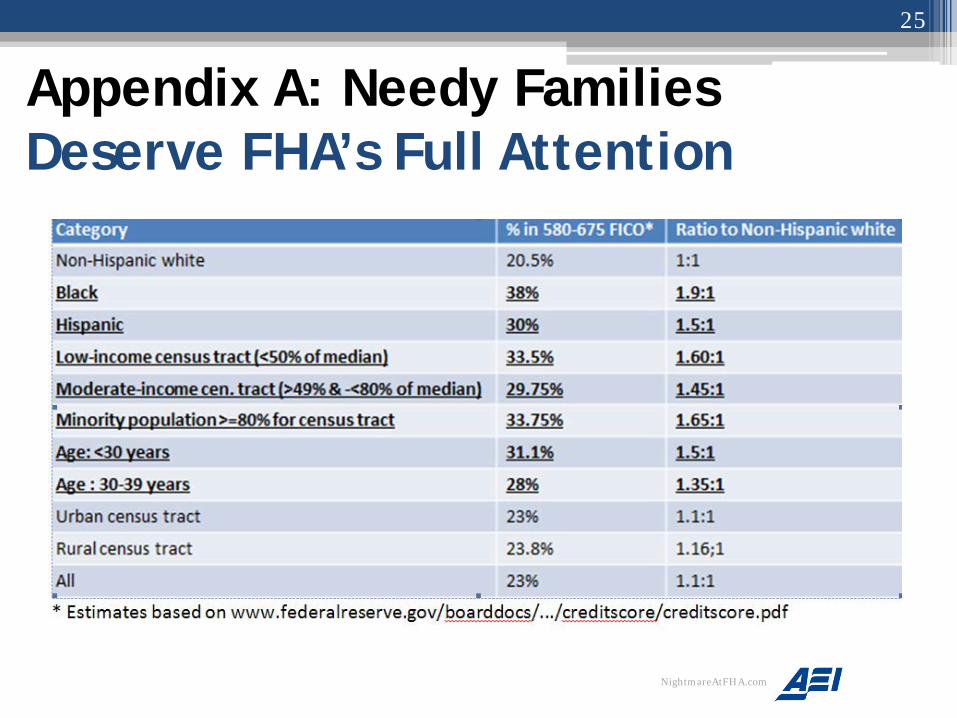
Appendix A: Needy Families Deserve FHA’s Full Attention
25
NightmareAtFHA.com
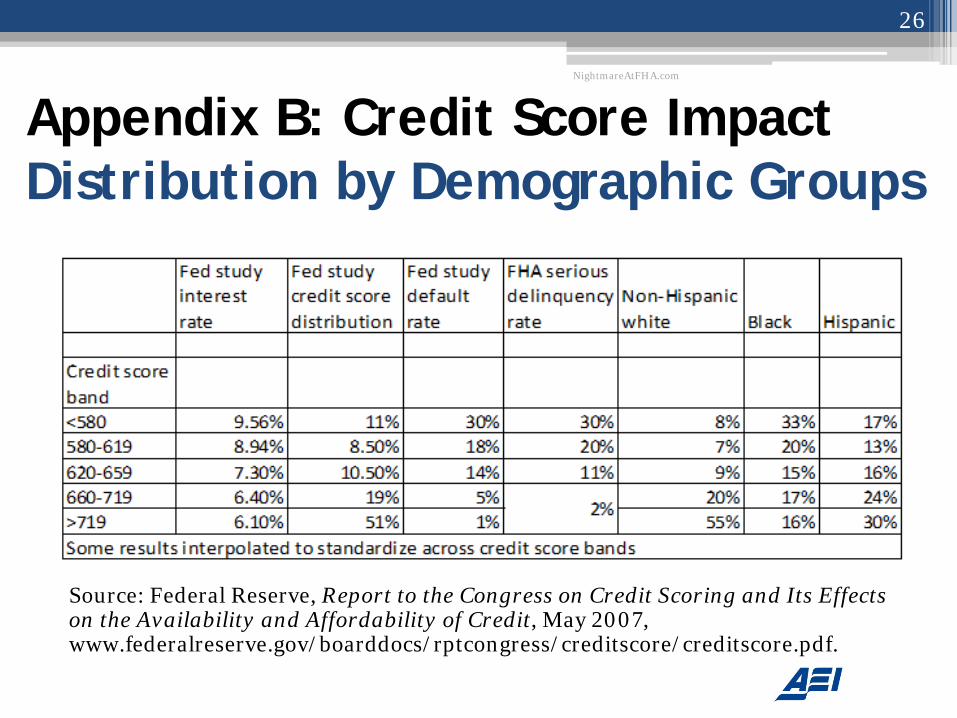
Appendix B: Credit Score Impact Distribution by Demographic Groups
Source: Federal Reserve, Report to the Congress on Credit Scoring and Its Effects on the Availability and Affordability of Credit, May 2007, www.federalreserve.gov/boarddocs/rptcongress/creditscore/creditscore.pdf.
NightmareAtFHA.com
26
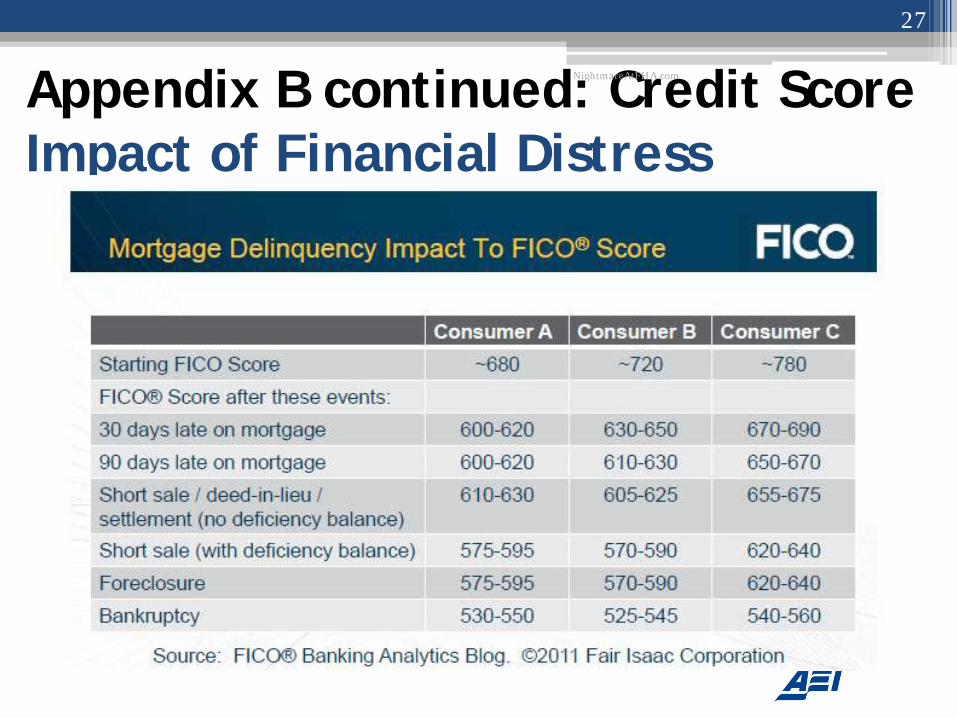
Appendix B continued: Credit Score Impact of Financial Distress
NightmareAtFHA.com
27
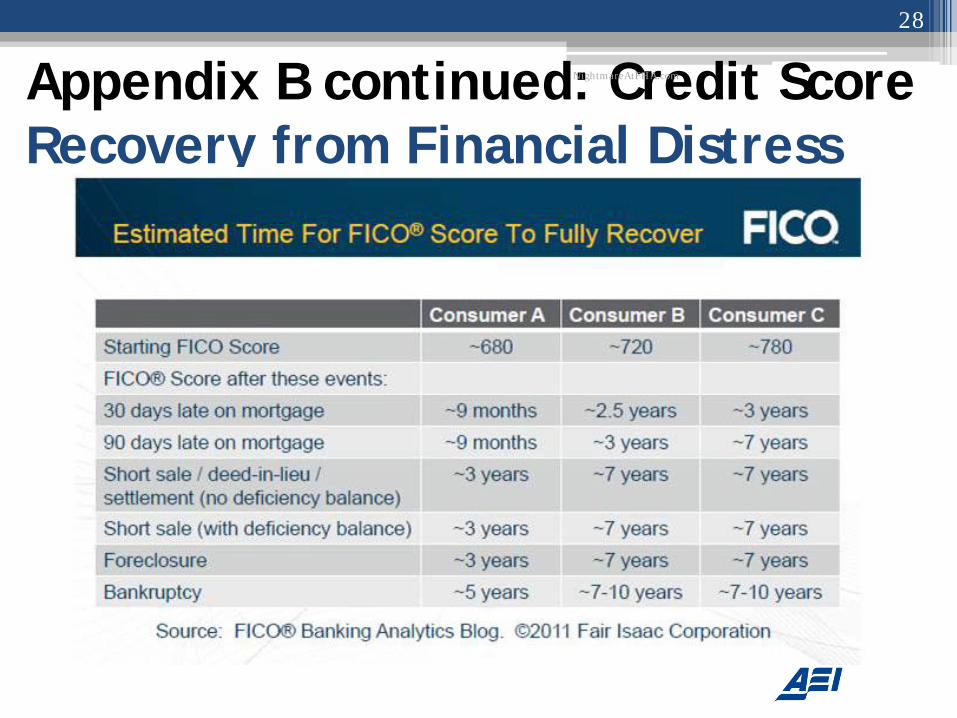
Appendix B continued: Credit Score Recovery from Financial Distress
NightmareAtFHA.com
28
APPENDIX C REDUCE COVERAGE BELOW 100% • VA pays up to an average of 25%, averaging 25% while
FHA pays up to 100% of the claim amount, averaging 63%.
• FHA’s loss rate is an estimated 5 times the VA’s (2 times the incidence and 2.5 times the severity).
• The VA charges 1/3 FHA’s premium (present value basis).
• VA Issuers absorb 1.6 times the overall loss rate compared to FHA issuers for the same fee.
NightmareAtFHA.com
29
APPENDIX C CONTINUED VA’S 25% COVERAGE • Did not deter ability to play a countercyclical role.
• VA’s volume tripled from 2007 to 2009. • In 2009 the VA’s median FICO score was 705, similar to the FHA’s
median of 694.
• Did not deter ability to serve underserved borrowers in a sustainable manner. • In 2005, 43% of the VA’s originations had a FICO between 600-679,
virtually identical to FHA’s 44%.
• VA has experienced substantially lower serious delinquency rates than the FHA for decades and are currently half the FHA rate (2001-2012).
NightmareAtFHA.com
30
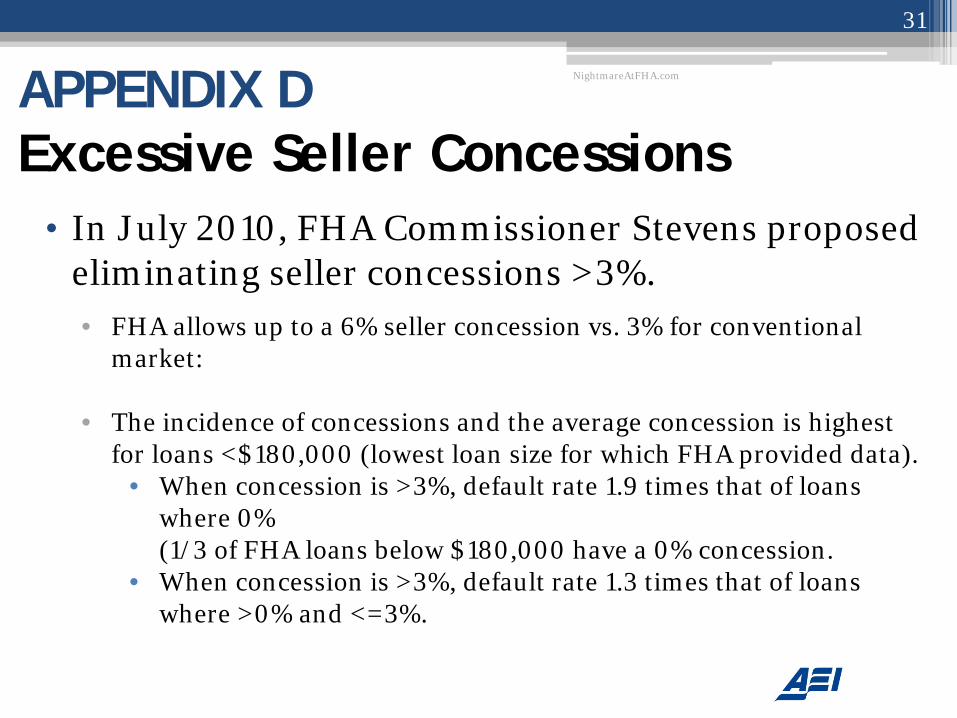
APPENDIX D Excessive Seller Concessions
• In July 2010, FHA Commissioner Stevens proposed eliminating seller concessions >3%.
• FHA allows up to a 6% seller concession vs. 3% for conventional market:
• The incidence of concessions and the average concession is highest for loans <$180,000 (lowest loan size for which FHA provided data).
• When concession is >3%, default rate 1.9 times that of loans where 0% (1/3 of FHA loans below $180,000 have a 0% concession.
• When concession is >3%, default rate 1.3 times that of loans where >0% and <=3%.
NightmareAtFHA.com
31

APPENDIX E Utilize Residual Income Test
• VA requires underwriters to identify and verify income available to meet:
• The mortgage payment • Other shelter expenses (includes utilities and maintenance) • Debts and obligations (includes job related expenses such as
child care) • Family living expenses • Residual income needs
• The resulting debt-to-income ratio (DTI) is secondary to residual income as an underwriting factor.
NightmareAtFHA.com
32
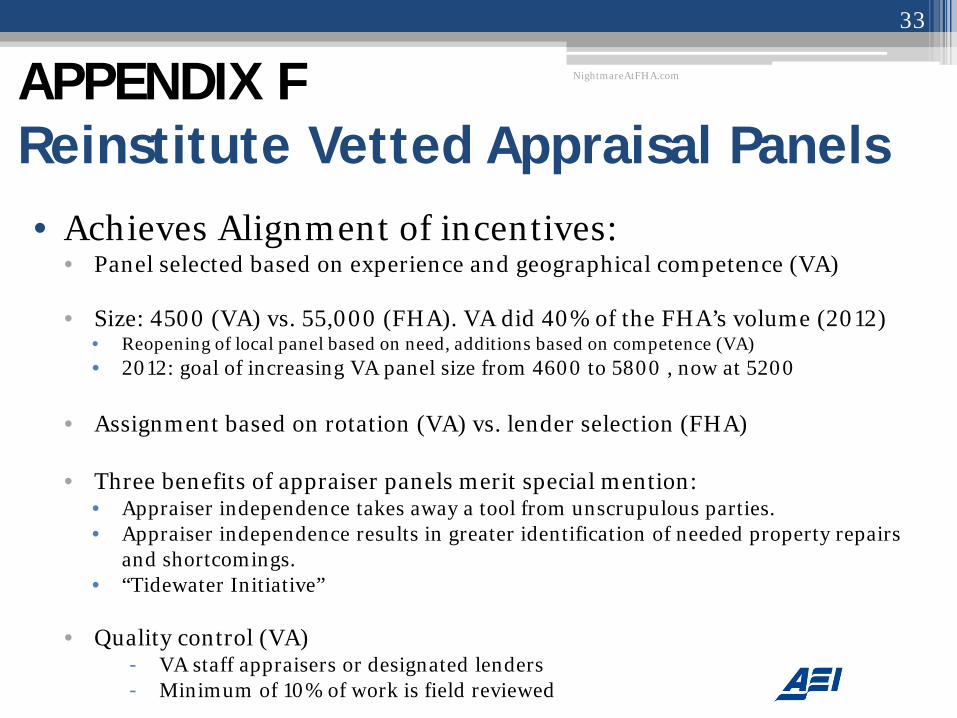
APPENDIX F Reinstitute Vetted Appraisal Panels • Achieves Alignment of incentives:
• Panel selected based on experience and geographical competence (VA)
• Size: 4500 (VA) vs. 55,000 (FHA). VA did 40% of the FHA’s volume (2012) • Reopening of local panel based on need, additions based on competence (VA) • 2012: goal of increasing VA panel size from 4600 to 5800 , now at 5200
• Assignment based on rotation (VA) vs. lender selection (FHA)
• Three benefits of appraiser panels merit special mention: • Appraiser independence takes away a tool from unscrupulous parties. • Appraiser independence results in greater identification of needed property repairs
and shortcomings. • “Tidewater Initiative”
• Quality control (VA) - VA staff appraisers or designated lenders - Minimum of 10% of work is field reviewed
NightmareAtFHA.com
33
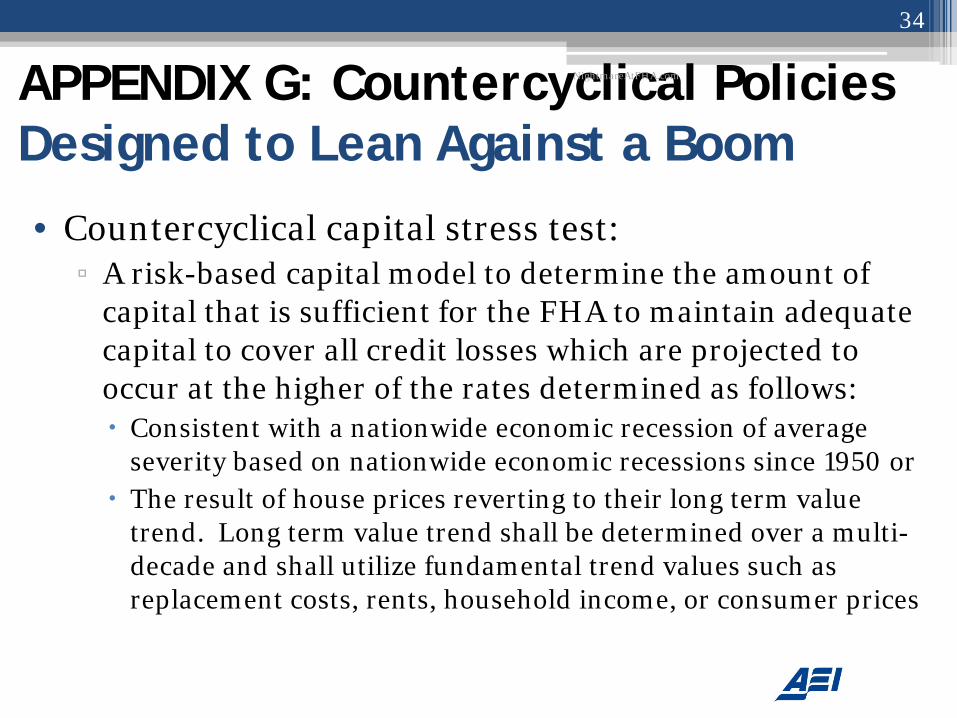
APPENDIX G: Countercyclical Policies Designed to Lean Against a Boom
• Countercyclical capital stress test: ▫ A risk-based capital model to determine the amount of
capital that is sufficient for the FHA to maintain adequate capital to cover all credit losses which are projected to occur at the higher of the rates determined as follows: Consistent with a nationwide economic recession of average
severity based on nationwide economic recessions since 1950 or The result of house prices reverting to their long term value
trend. Long term value trend shall be determined over a multi-decade and shall utilize fundamental trend values such as replacement costs, rents, household income, or consumer prices
NightmareAtFHA.com
34

APPENDIX G: Countercyclical Policies Designed to Lean Against a Boom
• A Countercyclical Loan-to-Value ratio (CCLTV) reflecting the underlying sustainable lending value trend.
• The standard for the CCLTV shall consider the sustainable lending value based on long-term trends, in addition to the current price, thus creating a standard for a countercyclical loan-to-value ratio.
• The sustainable lending value trend shall take into account the result of house prices reverting to their long term value trend.
• Long term value trend shall be determined over a multi-decade and shall utilize fundamental trend values such as replacement costs, rents, household income, or consumer prices.
NightmareAtFHA.com
35
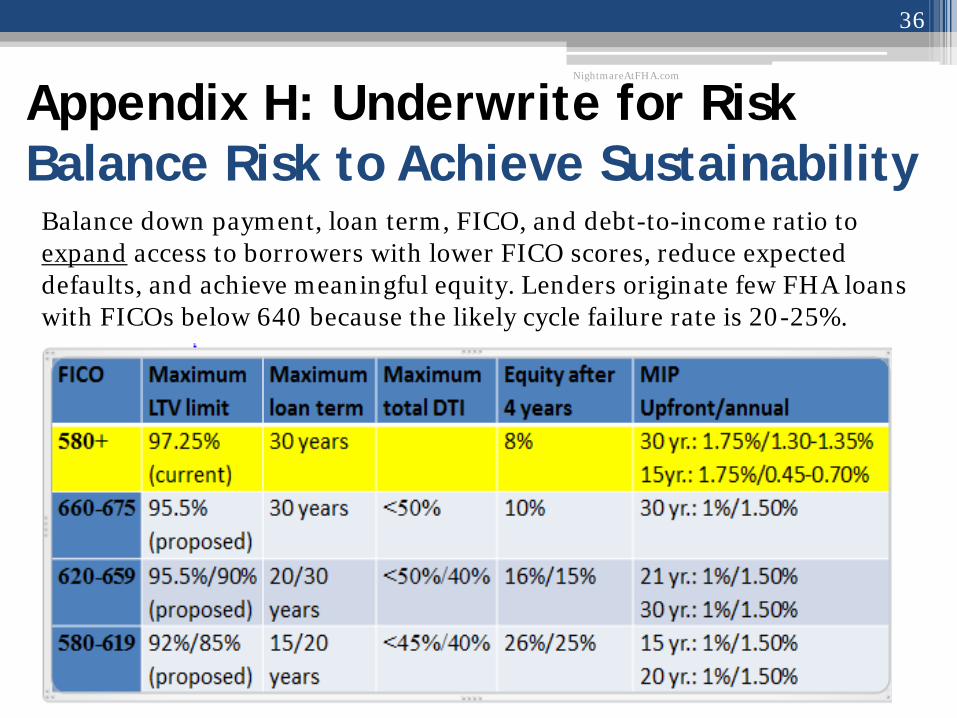
Appendix H: Underwrite for Risk Balance Risk to Achieve Sustainability
NightmareAtFHA.com
36
Balance down payment, loan term, FICO, and debt-to-income ratio to expand access to borrowers with lower FICO scores, reduce expected defaults, and achieve meaningful equity. Lenders originate few FHA loans with FICOs below 640 because the likely cycle failure rate is 20-25%.
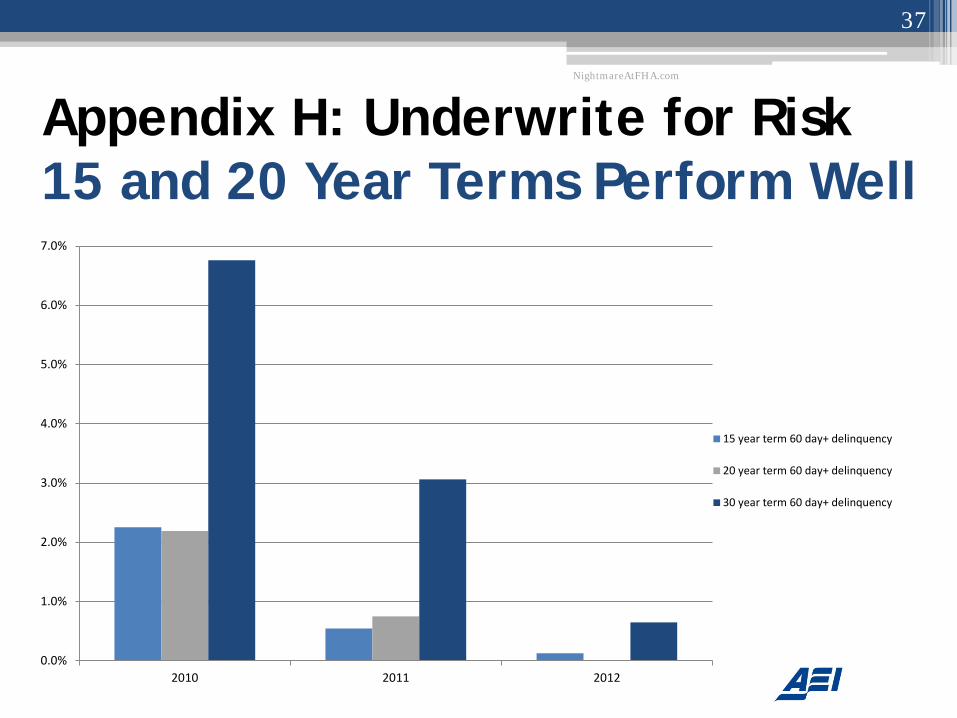
Appendix H: Underwrite for Risk 15 and 20 Year Terms Perform Well
NightmareAtFHA.com
37
0.0%
1.0%
2.0%
3.0%
4.0%
5.0%
6.0%
7.0%
2010 2011 2012
15 year term 60 day+ delinquency
20 year term 60 day+ delinquency
30 year term 60 day+ delinquency
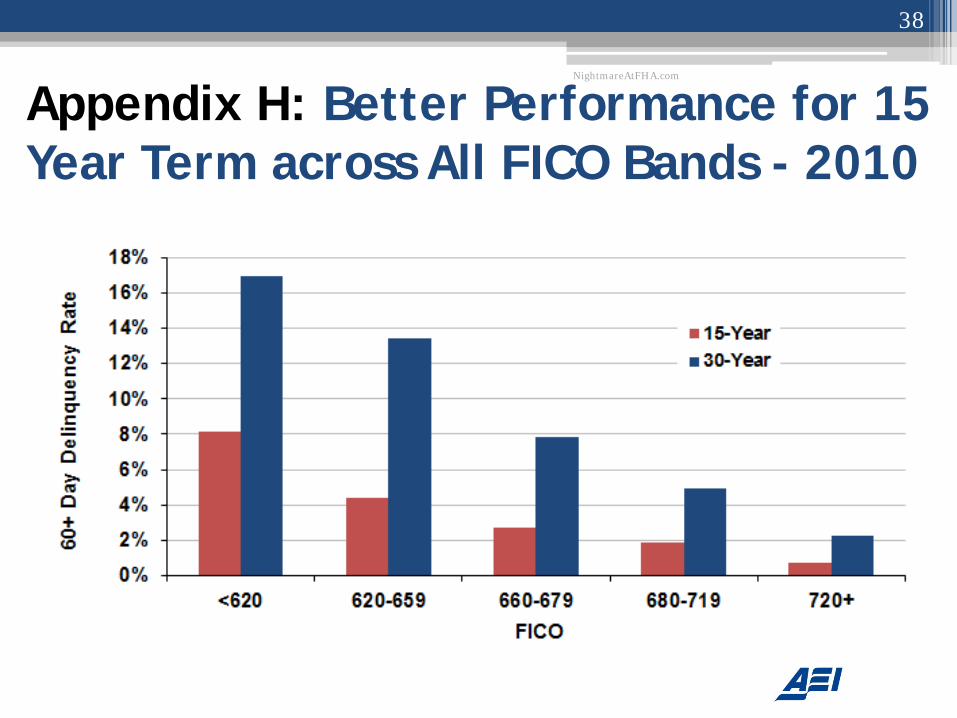
Appendix H: Better Performance for 15 Year Term across All FICO Bands - 2010
NightmareAtFHA.com
38
Appendix I: Disproportionate Impact on Working-Class Communities
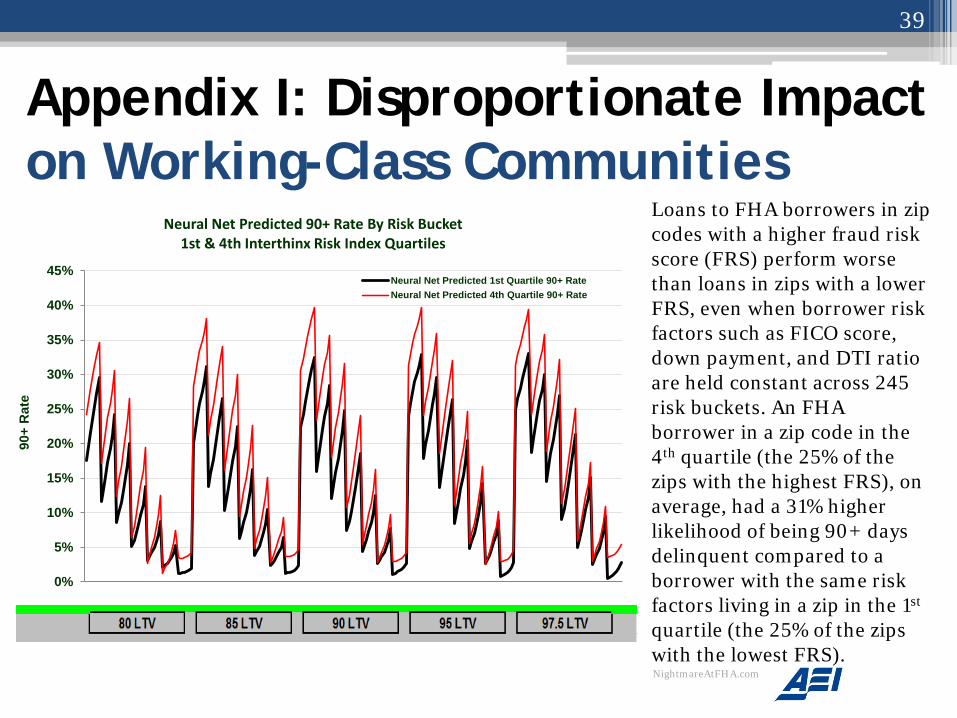
Loans to FHA borrowers in zip codes with a higher fraud risk score (FRS) perform worse than loans in zips with a lower FRS, even when borrower risk factors such as FICO score, down payment, and DTI ratio are held constant across 245 risk buckets. An FHA borrower in a zip code in the 4th quartile (the 25% of the zips with the highest FRS), on average, had a 31% higher likelihood of being 90+ days delinquent compared to a borrower with the same risk factors living in a zip in the 1st quartile (the 25% of the zips with the lowest FRS).
39
NightmareAtFHA.com
0%
5%
10%
15%
20%
25%
30%
35%
40%
45%
90+
Rat
e
Neural Net Predicted 90+ Rate By Risk Bucket 1st & 4th Interthinx Risk Index Quartiles
Neural Net Predicted 1st Quartile 90+ RateNeural Net Predicted 4th Quartile 90+ Rate
Appendix I: Disproportionate Impact on Working-Class Communities
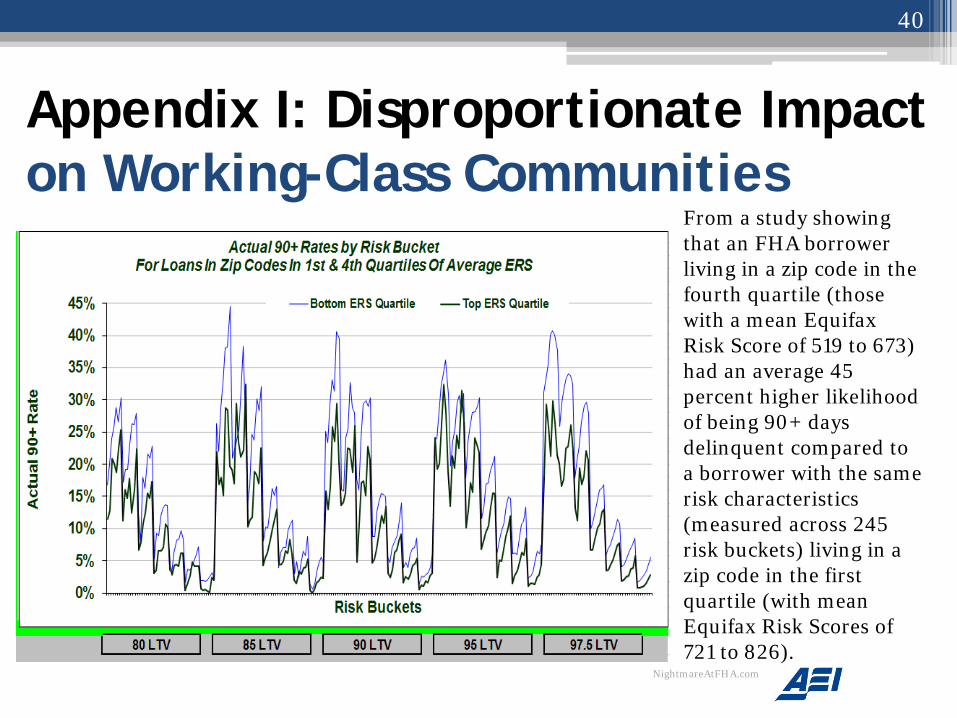
From a study showing that an FHA borrower living in a zip code in the fourth quartile (those with a mean Equifax Risk Score of 519 to 673) had an average 45 percent higher likelihood of being 90+ days delinquent compared to a borrower with the same risk characteristics (measured across 245 risk buckets) living in a zip code in the first quartile (with mean Equifax Risk Scores of 721 to 826).
40
NightmareAtFHA.com

Appendix I: Harm To Working-Class Families and Communities
From a recent study where 19 of 23 cities had higher FHA projected foreclosure rates in low-income zip codes than in middle- income zip codes.
Replicates the National Training and Information Center’s’ 2002 study for the same 22 cities (did not include Pittsburgh).
That study found 21 of 22 cities had higher FHA loan default rates in low-income census tracts than in middle- income census tracts. Low income zip = <50% of median income Middle income zip = 80%-120% of median income
41
NightmareAtFHA.com
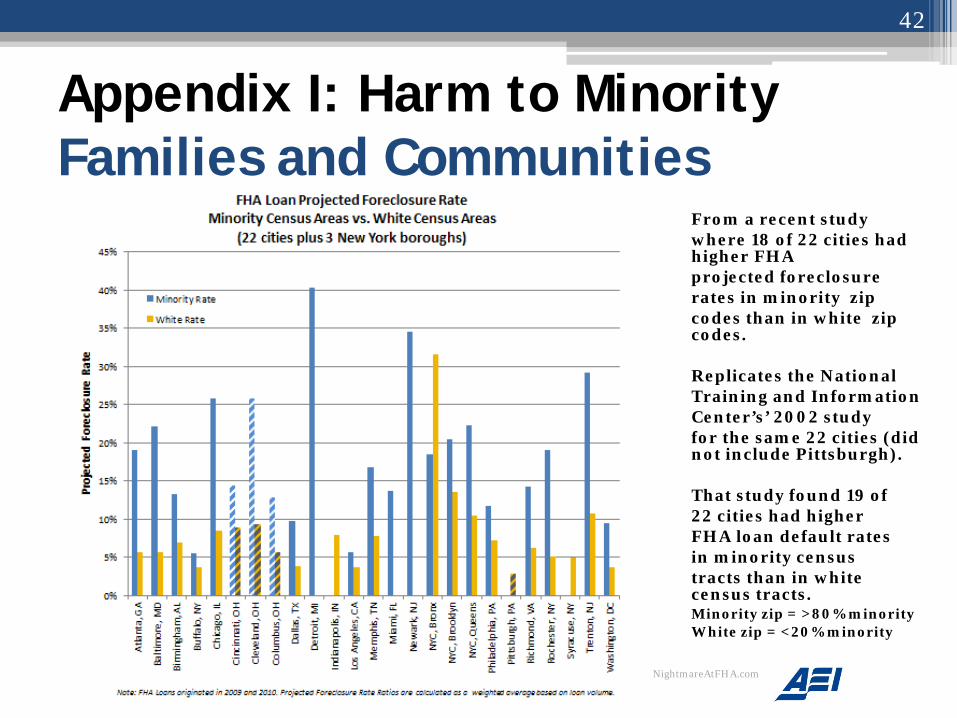
Appendix I: Harm to Minority Families and Communities
From a recent study where 18 of 22 cities had higher FHA projected foreclosure rates in minority zip codes than in white zip codes.
Replicates the National Training and Information Center’s’ 2002 study for the same 22 cities (did not include Pittsburgh).
That study found 19 of 22 cities had higher FHA loan default rates in minority census tracts than in white census tracts. Minority zip = >80% minority White zip = <20% minority
42
NightmareAtFHA.com