
THE EMERGENCE OF CHINA AND INDIA AS NEW …
66
GLOBALISERINGSFORUM RAPPORT #6 THE EMERGENCE OF CHINA AND INDIA AS NEW INNOVATION POWER HOUSES – THREAT OR OPPORTUNITY?
Transcript of THE EMERGENCE OF CHINA AND INDIA AS NEW …

Tata, ett stort indiskt konglomerat, köpte Land Rover och Jaguar 2008. Samma år
förvärvades svenska Volvo PV av kinesiska Geely. Samtidigt är två kinesiska företag,
ZTE och Huawei, numera Ericssons främsta konkurrenter på telekom-marknaden.
Autoliv och Ericsson, två stora svenska företag, har innovationsorienterade dotter-
bolag i Kina eller Indien. Representerar dessa exempel en bredare global omlokalise-
ring av innovativ verksamhet?
Globaliseringsforums sjätte rapport, The emergence of China and India as new inno-
vation power houses – threat or opportunity?, analyserar globala innovationsf löden
och effekterna av att forskning och utveckling, FoU, lokaliseras till Indien och Kina.
Dessutom undersöks faktorer som påverkar företags benägenhet att globalisera sina
FoU- och innovationsverksamheter.
Rapporten är författad av Cristina Chaminade, professor Lunds universitet, Davide
Castellani, professor University of Perugia och Lunds universitet samt Monica Plech-
ero, Italian National Research Council, CNR.
W W W . E N T R E P R E N O R S K A P S F O R U M . S E
G L O B A L I S E R I N G S F O R U M R A P P O R T # 6
GL
OB
AL
IS
ER
IN
GS
FO
RU
M R
AP
PO
RT
#6
THE EMERGENCE OF CHINA AND INDIA AS NEW
INNOVATION POWER HOUSES – THREAT OR OPPORTUNITY?

The emergence of china and india as new innovaTion power houses – ThreaT or opporTuniTy?
cristina chaminade, davide castellani and monica plechero

Globaliseringsforum Rapport #6© Entreprenörskapsforum, 2014ISBN: 91-89301-55-2Författare: Cristina Chaminade, Davide Castellani and Monica PlecheroGrafisk form och produktion: Klas Håkansson, EntreprenörskapsforumOmslagsfoto: IStockphoto
• enTreprenörskapsforum
Entreprenörskapsforum är en oberoende stiftelse och den ledande nätverksor-ganisationen för att initiera och kommunicera policyrelevant forskning om entre-prenörskap, innovationer och småföretag. Stiftelsens verksamhet finansieras med såväl offentliga medel som av privata forskningsstiftelser, näringslivs- och andra intresseorganisationer, företag och enskilda filantroper. Författarna svarar själva för problemformulering, val av analysmodell och slutsatser i rapporten.
För mer information se www.entreprenorskapsforum.se
GLOBALISERINGSFORUMS STYRGRUPP:Ulf Berg – tidigare Business Sweden (Ordförande)Leona Achtenhagen – JIBS JönköpingSvante Andersson – Högskolan i HalmstadAnna Belfrage – Kreab Gavin AndersonBirgitta Ed – Six Year PlanHåkan Gergils – EcofinAnna Hallberg – AlmiChristian Ketels – Harvard Business SchoolGöran Marklund – VinnovaFredrik Sjöholm – Lunds universitet, IFN och Örebro Universitet
TIDIGARE UTGIVNA RAPPORTER FRÅN GLOBALISERINGSFORUM:#5 Offentliga insatser för exportfinansiering – Ari Kokko#4 Sverige som kunskapsnation – Martin Andersson, Sten Dieden & Olof Ejermo#3 Born Globals – Torbjörn Halldin#2 Sweden’s position in the global economy – Christian Ketels#1 Internationalization competence of SMEs – Leona Achtenhagen
förordGlobaliseringsforum är Entreprenörskapsforums arena med fokus på globalise-ringens effekter på entreprenörskap, mindre företag och innovationer. Syftet är att föra fram policyrelevant forskning till beslutsfattare inom såväl politiken som privat och offentlig sektor. De rapporter som presenteras och de policyrekom-mendationer som förs fram ska vara väl förankrade i vetenskaplig forskning.
Globaliseringsforums sjätte rapport analyserar globala innovationsflöden och effekterna av att forskning och utveckling, FoU, ökar i Indien och Kina. Dessutom undersöks faktorer som påverkar företags benägenhet att globalisera sina FoU- och innovationsverksamheter. Det visar sig att Sverige har en större andel projekt riktade mot Kina och Indien än övriga EU-länder och att globalisering av innovation också är särskilt hög för svenska småföretag. Skälet kan vara nödvän-dighetsbaserat och en följd av bristande lokala resurser. Författarna uppmanar beslutsfattare att följa graden av internationalisering av innovation, särskilt för små företag och i marginaliserade regioner. De kan bl a behöva stöd för utbildning i internationellt företagande för att kunna maximera de potentiella vinsterna av internationaliseringen.
Rapporten är författad av Cristina Chaminade, professor Lunds universitet, Davide Castellani, professor University of Perugia och Lunds universitet samt Monica Plechero, Italian National Research Council, CNR. Författarna svarar för de slutsatser, policyrekommendationer och den analys som presenteras.
Stockholm i februari 2014
Maria Adenfelt Pontus Braunerhjelm Forskningsledare Entreprenörskapsforum VD och professor och docent Uppsala universitet Entreprenörskapsforum


innehållförord 3
sammanfaTTning 7
1. inTroducTion 9
2. changes in The global geography of innovaTion:
cross-border r&d invesTmenTs and research collaboraTion 13
2.1. Cross-border R&D related foreign direct investments by country of origin and destination 14
2.2. Offshoring of R&D and manufacturing activities from EU regions 19
2.3. International collaboration for innovation 21
3. impacT of inTernaTionalizaTion of r&d and oTher innovaTion acTiviTies 25
3.1. Some theoretical remarks on the effects of R&D offshoring
on productivity in the home economies 25
3.1. The impact of R&D offshoring on productivity growth in home regions. Evidence from
the European Union 27
3.2. Impact of global research collaboration on degree of novelty of innovation 30
4. deTerminanTs of The inTernaTionalizaTion of innovaTion acTiviTies
and iTs impacT: regions, compeTences and indusTries 35
4.1. Industry differences 35
4.2. Regional differences 39
4.3. Firm differences: the role of competences 43
5. conclusions and policy implicaTions 47
6. daTa bases used in The reporT 51
acknowledgemenTs 53
abouT The auThors 53
references 54
annex 1 59
annex 2 63

6 T h e e m e rge nc e of c h i na a n d i n di a a s n e w i n no vaT ion p o w e r house s

s w e di sh e n T r e p r e n e u r sh i p f oru m 7
sammanfattningUnder 2008 köpte Tata, ett stort indiskt konglomerat, både Land Rover och Jaguar. Samma år, köptes den svenska ikonen Volvo personvagnar av kinesiska Geely samti-digt som ett annat kinesiskt företag, Beijing Automotive Industry Holding Corporation (BAIC), köpte ett par äldre modeller av SAAB. Två kinesiska företag, ZTE och Huawei, är nu Ericssons främsta konkurrenter på telekom-marknaden. Ericsson och Autoliv, två stora svenska företag har innovationsorienterade dotterbolag i Kina eller Indien. Hur väl representerar de här fallen en bredare global omlokalisering av innovativ verksamhet? Vilka är konsekvenserna av dessa förändringar för organisering och effekter av globala innovationsaktiviteter? Rapporten belyser dessa frågeställningar och för ett resonemang kring huruvida och i så fall hur dessa förändringar innebär hot eller möjligheter för svenska företag. Rapporten undersöker även under vilka villkor globalisering av innovationsaktiviteter har positiva effekter för produktivitet.
Rapporten är indelad i tre sektioner. Den första ger en översikt av de globala inno-vationsflödena. Den andra sektionen analyserar effekter av att forskning och utveck-ling (FoU) flyttar till Indien och Kina. Den tredje sektionen undersöker faktorer som påverkar företags benägenhet att globalisera sina FoU- eller innovationsaktiviteter. Analysen i rapporten baseras på unik data insamlad i Europa och BRIC-länder samt data från fDi Markets. Dessa data analyseras med ekonometriska tekniker så väl som med deskriptiv statistik.
Genom att lyfta fram nyckelresultat sätts rapportens fokus på Kina och Indiens rol-ler som både mottagare och upphovsländer av global FoU och produktionsrelaterade investeringar. Resultaten visar viktiga skillnader mellan de två länderna. Kina rankas högre än Indien både vad gäller mottagande och initierande av FoU-projekt med grundforskning som bas. Vidare visar undersökningar att Kina och Indien attraherar olika FoU-relaterade initiativ till ett spektrum av industrier. Kina tenderar att attra-hera mer grundforskning inom tillverkningsindustrier medan Indien lockar till sig mer tillämpad forskning inom servicesektorn.
I kontrast till internationaliseringen av produktionsaktiviteter visar resultaten att gränsöverskridande investeringar i FoU-relaterade aktiviteter tenderar att vara min-dre begränsade av geografiskt avstånd än investeringar i tillverkning. Att utlandsbasera FoU och innovativ verksamhet är fortfarande relativt ovanligt för europeiska länder, men när sker är det ett globalt fenomen och Kina och Indien spelar en viktig roll som mottagarländer. Bland de europeiska länderna har Sverige en större andel projekt riktade mot Kina och Indien än övriga EU och skillnaden är tydligast inom FoU-relaterade projekt.
Globalisering av innovation är också särskilt hög för svenska småföretag - ett av sex svenska innovativa företag med färre än 50 anställda har samarbetat med kinesiska och indiska partners för att utveckla sina innovationer.

8 T h e e m e rge nc e of c h i na a n d i n di a a s n e w i n no vaT ion p o w e r house s
s a m m a n faT T n i ng
Forsking kring effekterna av internationalisering av innovationsrelaterade aktiviter visar att utlandsbaserad FoU kan associeras med högre produktivitetstillväxt inom EU och att globala forskningssamarbeten har ett samband med fler nya innovationer. Undantaget från de positiva effekterna är investeringsprojekt i Indien vilka löper en högre risk att ”urholkas” på grund av svårigheterna i att organisera värdekedjan. Resultaten visar att svenska företag investerar mer i Indien än deras europeiska mot-svarigheter vilket skulle kunna leda till produktivitetsförluster. I vilket fall är antalet projekt för få för att kunna dra några tydliga slutsatser.
Resultaten pekar även på att alla företag inte visar samma benägenhet att internationalisera sina innovationssatsningar. Kompetensnivån eller branschen de verkar inom påverkar deras möjligheter att internationalisera FoU och andra inno-vationsrelaterade aktiviteter. Vidare påverkas innovationsgeografin av det regionala innovationssystemet. Det är företag från mindre starka, men inte för marginaliserade regioner, som i högre utsträckning engagerar sig i globala forskningssamarbeten och utlandsbaserad FoU. Resultaten indikerar även att globalisering av innovation inte är ett val utan en nödvändighet driven av kompetensbrist i närområdet.
Rapporten kommer fram till att den snabba tillväxten av innovationskapacitet i Kina och Indien öppnar möjligheter för svenska företag. Dock föreligger ett flertal hinder som begränsar eller till och med hämmar de potentiellt positiva effekter som globalisering av innovationsaktiviteter kan innebära:
• Internationalisering av innovation relaterade till tjänster löper högre risk än innovation relaterade till produktion.
• Internationalisering av innovation till Kina och länder i sydöstra Asien förefaller vara kopplade till större vinster än till Indien.
• I Sverige är det inte bara stora företag som är mer benägna att internatio-nalisera sina innovationsaktiviteter. Små och mellanstora innovativa företag samarbetar aktivt med kinesiska och indiska partners. Dock kan begränsade resurser och kapacitet hindra att dessa företag maximerar de potentiella vinsterna av internationalisering.
Att styra geografiskt avlägsna innovationsprocesser är kostsamt och komplext. Studier visar att de flesta små och medelstora företag misslyckas med att internatio-nalisera sina innovationssatsningar. Små företag kan behöva extra stöd för utbildning i internationellt företagande och interkulturell kommunikation genom policyförslag som stöttar born-globalföretag eller utvecklingen av teknologisk kompetens.
Slutligen rekommenderas beslutsfattare att över tid följa graden av internationali-sering av innovation, speciellt i små företag och i marginaliserade regioner. För dessa kan internationalisering vara en nödvändighet på grund av bristande lokala resurser och således inte ett aktivt val.
s w e di sh e n T r e p r e n e u r sh i p f oru m 9
1introductionIt is generally accepted that innovation activities are becoming highly internationa-lized1. In their pursuit of knowledge for innovation, firms and other organizations set-up relationships beyond national borders. Traditionally, the internationalization of research and development (R&D) and other innovation activities has taken place within Europe, USA and Japan, but this may be changing.
The presence of new economic powers with strong innovation capabilities is changing the global geography of innovation. For example, some knowledge inten-sive activities (like R&D) that were previously located mainly in Europe are now increasingly located in China, India or other fast growing emerging economies2. At the same time, a growing number of multinational corporations (MNCs) from emerging economies are also locating innovation facilities in Europe or acquiring European companies to access their technology. In 2010 the car division of Volvo, an icon in Sweden, was acquired by the Chinese Geely; in the ICT industry two Chinese firms, ZTE and Huawei, are currently the most important competitors to Sweden’s Ericsson in the global telecommunication market.
One of the arguments most often put forward to explain this global shift is acknow-ledging the accumulation of competences in certain regions around the world, such as Bangalore in India (Arora et al. 2001; Saxenian 2001; Parthasarathy and Aoyama 2006) or Beijing in China (Altenburg et al. 2008). These and other regions in develo-ping countries have become knowledge hubs in global value chains, particularly in
1. Throughout this report, we will refer to internationalization of innovation and R&D rather interchangeably. While we are aware that that the two concepts are distinct, and not all innovations are the result of R&D activities, analyzing the internationalization of various forms of innovations is beyond the scope of this work. This reflects a sort of bias that has characterized the economic literature, also due to the lack of appropriate data on the innovative activities that are less dependent on R&D investments.
2. Some of these investments may imply closing down plants and labs in the home countries, but some may result in an overall expansion of the firm activities and be complementary to the activities at home.
10 T h e e m e rge nc e of c h i na a n d i n di a a s n e w i n no vaT ion p o w e r house s
C H a p t e r 1 i n T roduc T ion
ICT industries (Chaminade and Vang 2008). Emerging economies are no longer just an option for outsourcing “standardized production” but are actually growing as hotspots for innovation activities, acting as receptors of R&D investments, but also as sources of innovation, some of them new to the world (Plechero, 2010). The potential “loss” of some landmark firms to foreign investors may increase the trend towards protectionism, instead of ensuring a favourable framework to benefit from the change. This may be detrimental, as we still do not know the impact of the engagement in global innovation networks or under which circumstances globaliza-tion of innovation is a necessary condition (for example, if firms are located in mar-ginal regions or if the knowledge needed for innovation is unavailable in the region). Restricting the access to global innovation networks may actually have a negative impact on the innovativeness of the firms and the regions where they are located.
Sweden is particularly sensitive to changes in the global geography of innova-tion due to its high degree of internationalization. Sweden is ranked at No.1 in outward R&D investments of European firms, approximately 43 percent of the R&D of its domestic firms being performed abroad, followed at a significant distance by Germany at 21 percent (European Commission, 2012). Furthermore, even when R&D is performed in Sweden, it is often done in collaboration with international partners. Sweden is the European country with the highest percentage of innovative firms that collaborate with China and India for innovation.
This report aims at understanding the changes in the global geography of innovation and to discuss the challenges and opportunities that emerge from the changing global innovation landscape. In particular, our focus is on two countries China and India as they are the two new and leading innovation powerhouses. They are emerging among the main destinations for R&D-related offshoring investments worldwide, and as well as important partners in R&D collaboration projects for both large and small firms.
The report is structured as follows. First we provide an overview of the global shifts in innovation, providing evidence of changes in the geography, strategy, nature of the innovation activities performed abroad and the actors engaging in global inno-vation. Two key questions are posed: What is the extent and scope of the changes in the geography of innovation worldwide? What is different now from a decade ago? Second, we will analyse the impact of the shift in global innovative activities by looking at the effect of R&D offshoring projects of European firms on the productivity growth in the home regions, and the effect of global research collaboration on the degree of novelty. We confront the puzzle of whether the offshoring of R&D contributes to strengthening EU countries, by increasing the productivity of EU regions, or, rather if this process is causing a hollowing out of the EU knowledge base. This complex issue bears obvious far reaching implications for policy, inasmuch there should be reasons to fear for a loss of competences due to the global shift in innovative activities. To anticipate, while our analysis will provide reassuring answers on this matter, it will draw out the difference between the impact of R&D offshoring towards India from those stemming from moving R&D to China and South-East Asia.

s w e di sh e n T r e p r e n e u r sh i p f oru m 11
Against this background of evidence generally documenting how offshoring of innovation has a positive impact on productivity, section 3 investigates the factors affecting the propensity of firms to engage in internationalization of R&D. We zoom-in on and explore the role of competences, regions and industries. We conclude this report with some reflections for policy makers. What are the chal-lenges and opportunities that emerge with the new global configuration of economic activities? What are the main constraints for Swedish firms to tap into and benefit from accessing global innovation networks?
The report is mainly based on three data sources: 1) a dedicated firm-based sur-vey conducted in Pune and Beijing in 2007-2008 (referred to as VR-data in the text), 2) a dedicated firm-based survey conducted in five European countries (Sweden, Denmark, Norway, Estonia and Germany) plus Brazil, South-Africa, India and China (referred to as INGINEUS-data in the text) in 2009 and 3) an original data base com-piling data from different sources, like fDiMarkets by fDi Intelligence at the Financial Times and the EU Regional Database by Eurostat. To avoid repetition, the databases are described in detail in Annex 1.

12 T h e e m e rge nc e of c h i na a n d i n di a a s n e w i n no vaT ion p o w e r house s

s w e di sh e n T r e p r e n e u r sh i p f oru m 13
2changes in the global geography of innovation: cross-border r&d investments and research collaboration3 Innovation has long been an international phenomenon, but it has hardly been a global one4. The empirical evidence at both macro (Castellacci and Archibugi, 2008) and micro level (Cantwell and Piscitello, 2005; 5; Saliola and Zanfei, 2009) suggests that 1) the majority of R&D is conducted close to the headquarters; 2) when R&D is internationalized, inbound and outbound R&D flows have traditionally taken place between the technologically and economically advanced high-income countries; 3) R&D international flows have been driven almost exclusively by large MNCs headqu-artered in high-income countries.
In this chapter we point to evidence that that this paradigm is changing. R&D and other innovation activities are becoming global, and global innovation networks are no longer a phenomenon exclusive of large MNCs.
This chapter is concerned with the pulse of these changes, asking empirically about their extent and scope in the geography of innovation worldwide? To answer this question, we look at two mechanisms: cross-border R&D related investments abroad (offshoring of R&D) as well as global research collaboration for the development of an innovation.
3. Chapter written by Cristina Chaminade, Circle, Lund University and Davide Castellani, University of Perugia, Centro Studi Luca d’Agliano, CIRCLE and IWH.
4. While internationalization can be conceptualized as the simple geographical spread of economic activities across national boundaries with low levels of functional integration (Dickens, 2007), globalization implies both extensive geographical spread and also high degree of functional integration (op.cit: 8).

14 T h e e m e rge nc e of c h i na a n d i n di a a s n e w i n no vaT ion p o w e r house s
C H a p t e r 2 c h a nge s i n T h e gl ob a l geogr a p h y of i n no vaT ion
2.1. cross-border r&d related foreign direct investments by country of origin and destination
Main finding: China and India are playing a prominent role as recipients, but also as R&D investors themselves.
While innovation activities are still highly concentrated in the advanced econo-mies, the R&D flows to and from middle-income countries have increased substan-tially in the last decade (Amighini et al., 2010; Ramamurti and Singh, 2009; Unctad, 2006). In 2006 the UNCTAD published a report on Research and Development (R&D) Foreign Direct Investment which pointed, almost for the first time, to the changing role of developing countries in the global flows of innovation-related investments (UNCTAD 2006). It showed how R&D investments to and from develo-ping countries had grown dramatically in a few years.
Using data on the number of foreign direct investments announced during the period 2003-2012 as recorded in the fDi Markets database5, we can look at the changes in the cross-border greenfield investment projects. It is possible to focus on the facts regarding countries of origin and destination, the nature of the invest-ment and relevant industries6. fDiMarkets classifies investment events in terms of core business activities, allowing the researcher to distinguish investments related to manufacturing from those related to R&D or “Design, development and testing” (DDT)7.
Table 2.1. shows the cross-border investment projects in R&D and manufactur-ing by country of destination. In terms of receiving countries in the period 2003-2012, China and India were the most important destination of R&D related projects worldwide, both for applied research (DDT) and basic research (R&D). India ranks higher as a recipient of investments related to design, development and testing, which is coherent with a strategy of adaptation of products to the local market, while China is the most important destination for projects involving more basic research. Chapter 3 is devoted to analysing the differences between China and India in terms of technological competences and industrial specialization.
5. The databases are described in detail at the end of the report.6. It is important to highlight that fDI markets covers only greenfield investments, leaving out
mergers and acquisitions and other forms of R&D collaboration that can be very important for certain countries, firms and sectors.
7. For this report we use the database developed by Castelli and Castellani (2013) where the authors had reclassified a number of investment projects. See Castelli and Castellani for a detailed description of the methodology.
s w e di sh e n T r e p r e n e u r sh i p f oru m 15
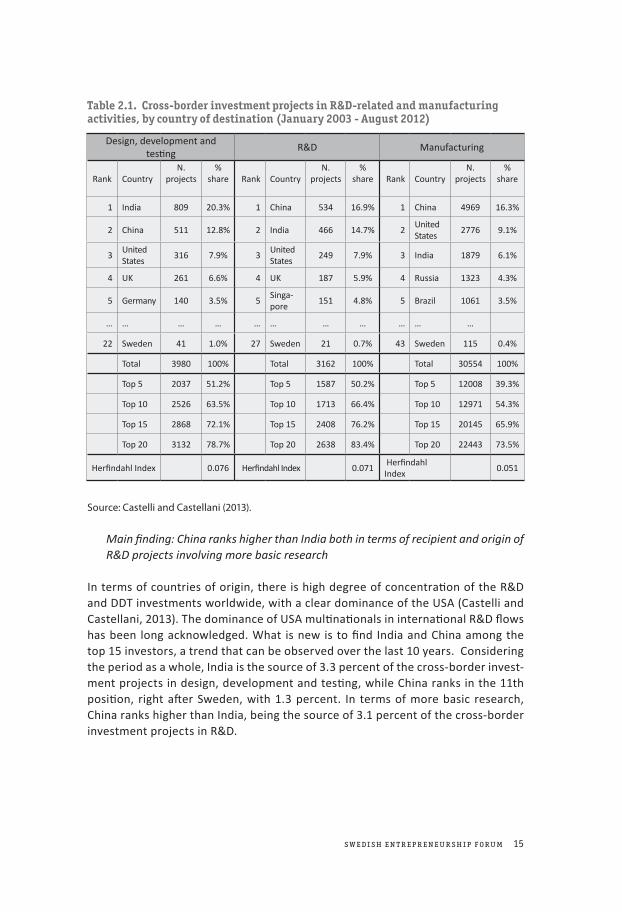
Table 2.1. cross-border investment projects in r&d-related and manufacturing activities, by country of destination (January 2003 - august 2012)
Source: Castelli and Castellani (2013).
Main finding: China ranks higher than India both in terms of recipient and origin of R&D projects involving more basic research
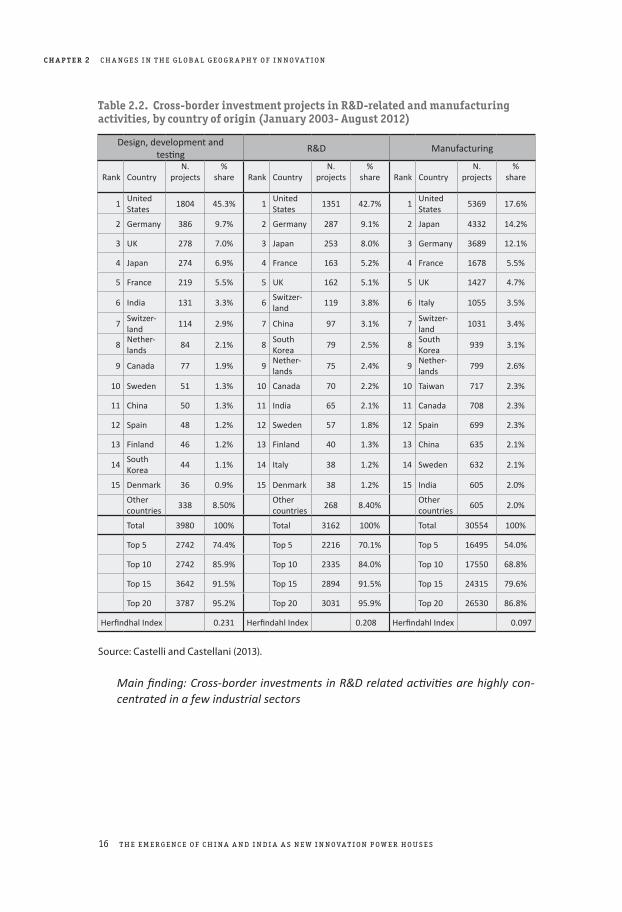
In terms of countries of origin, there is high degree of concentration of the R&D and DDT investments worldwide, with a clear dominance of the USA (Castelli and Castellani, 2013). The dominance of USA multinationals in international R&D flows has been long acknowledged. What is new is to find India and China among the top 15 investors, a trend that can be observed over the last 10 years. Considering the period as a whole, India is the source of 3.3 percent of the cross-border invest-ment projects in design, development and testing, while China ranks in the 11th position, right after Sweden, with 1.3 percent. In terms of more basic research, China ranks higher than India, being the source of 3.1 percent of the cross-border investment projects in R&D.
Design, development and testi ng
R&D Manufacturing
Rank CountryN.
projects%
share Rank CountryN.
projects%
share Rank CountryN.
projects%
share
1 India 809 20.3% 1 China 534 16.9% 1 China 4969 16.3%
2 China 511 12.8% 2 India 466 14.7% 2United States
2776 9.1%
3United States
316 7.9% 3United States
249 7.9% 3 India 1879 6.1%
4 UK 261 6.6% 4 UK 187 5.9% 4 Russia 1323 4.3%
5 Germany 140 3.5% 5Singa-pore
151 4.8% 5 Brazil 1061 3.5%
… … … … … … … … … … …
22 Sweden 41 1.0% 27 Sweden 21 0.7% 43 Sweden 115 0.4%
Total 3980 100% Total 3162 100% Total 30554 100%
Top 5 2037 51.2% Top 5 1587 50.2% Top 5 12008 39.3%
Top 10 2526 63.5% Top 10 1713 66.4% Top 10 12971 54.3%
Top 15 2868 72.1% Top 15 2408 76.2% Top 15 20145 65.9%
Top 20 3132 78.7% Top 20 2638 83.4% Top 20 22443 73.5%
Herfi ndahl Index 0.076 Herfi ndahl Index 0.071 Herfi ndahl Index
0.051
16 T h e e m e rge nc e of c h i na a n d i n di a a s n e w i n no vaT ion p o w e r house s
C H a p t e r 2 c h a nge s i n T h e gl ob a l geogr a p h y of i n no vaT ion
Table 2.2. cross-border investment projects in r&d-related and manufacturing activities, by country of origin (January 2003- august 2012)
Source: Castelli and Castellani (2013).
Main finding: Cross-border investments in R&D related activities are highly con-centrated in a few industrial sectors
Design, development and testi ng
R&D Manufacturing
Rank CountryN.
projects%
share Rank CountryN.
projects%
share Rank CountryN.
projects%
share
1United States
1804 45.3% 1United States
1351 42.7% 1United States
5369 17.6%
2 Germany 386 9.7% 2 Germany 287 9.1% 2 Japan 4332 14.2%
3 UK 278 7.0% 3 Japan 253 8.0% 3 Germany 3689 12.1%
4 Japan 274 6.9% 4 France 163 5.2% 4 France 1678 5.5%
5 France 219 5.5% 5 UK 162 5.1% 5 UK 1427 4.7%
6 India 131 3.3% 6Switzer-land
119 3.8% 6 Italy 1055 3.5%
7Switzer-land
114 2.9% 7 China 97 3.1% 7Switzer-land
1031 3.4%
8Nether-lands
84 2.1% 8South Korea
79 2.5% 8South Korea
939 3.1%
9 Canada 77 1.9% 9Nether-lands
75 2.4% 9Nether-lands
799 2.6%
10 Sweden 51 1.3% 10 Canada 70 2.2% 10 Taiwan 717 2.3%
11 China 50 1.3% 11 India 65 2.1% 11 Canada 708 2.3%
12 Spain 48 1.2% 12 Sweden 57 1.8% 12 Spain 699 2.3%
13 Finland 46 1.2% 13 Finland 40 1.3% 13 China 635 2.1%
14South Korea
44 1.1% 14 Italy 38 1.2% 14 Sweden 632 2.1%
15 Denmark 36 0.9% 15 Denmark 38 1.2% 15 India 605 2.0%
Other countries
338 8.50%Other countries
268 8.40%Other countries
605 2.0%
Total 3980 100% Total 3162 100% Total 30554 100%
Top 5 2742 74.4% Top 5 2216 70.1% Top 5 16495 54.0%
Top 10 2742 85.9% Top 10 2335 84.0% Top 10 17550 68.8%
Top 15 3642 91.5% Top 15 2894 91.5% Top 15 24315 79.6%
Top 20 3787 95.2% Top 20 3031 95.9% Top 20 26530 86.8%
Herfi ndhal Index 0.231 Herfi ndahl Index 0.208 Herfi ndahl Index 0.097
s w e di sh e n T r e p r e n e u r sh i p f oru m 17
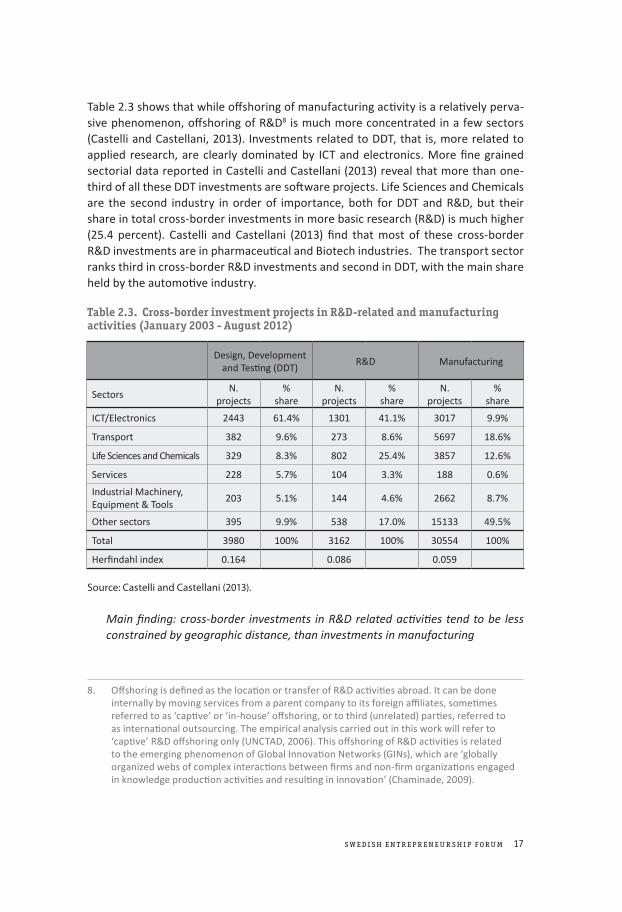
Table 2.3 shows that while offshoring of manufacturing activity is a relatively perva-sive phenomenon, offshoring of R&D8 is much more concentrated in a few sectors (Castelli and Castellani, 2013). Investments related to DDT, that is, more related to applied research, are clearly dominated by ICT and electronics. More fine grained sectorial data reported in Castelli and Castellani (2013) reveal that more than one-third of all these DDT investments are software projects. Life Sciences and Chemicals are the second industry in order of importance, both for DDT and R&D, but their share in total cross-border investments in more basic research (R&D) is much higher (25.4 percent). Castelli and Castellani (2013) find that most of these cross-border R&D investments are in pharmaceutical and Biotech industries. The transport sector ranks third in cross-border R&D investments and second in DDT, with the main share held by the automotive industry.
Table 2.3. cross-border investment projects in r&d-related and manufacturing activities (January 2003 - august 2012)
Source: Castelli and Castellani (2013).
Main finding: cross-border investments in R&D related activities tend to be less constrained by geographic distance, than investments in manufacturing
8. Offshoring is defined as the location or transfer of R&D activities abroad. It can be done internally by moving services from a parent company to its foreign affiliates, sometimes referred to as ‘captive’ or ‘in-house’ offshoring, or to third (unrelated) parties, referred to as international outsourcing. The empirical analysis carried out in this work will refer to ‘captive’ R&D offshoring only (UNCTAD, 2006). This offshoring of R&D activities is related to the emerging phenomenon of Global Innovation Networks (GINs), which are ‘globally organized webs of complex interactions between firms and non-firm organizations engaged in knowledge production activities and resulting in innovation’ (Chaminade, 2009).
Design, Development and Testi ng (DDT)
R&D Manufacturing
SectorsN.
projects%
shareN.
projects%
shareN.
projects%
share
ICT/Electronics 2443 61.4% 1301 41.1% 3017 9.9%
Transport 382 9.6% 273 8.6% 5697 18.6%
Life Sciences and Chemicals 329 8.3% 802 25.4% 3857 12.6%
Services 228 5.7% 104 3.3% 188 0.6%
Industrial Machinery, Equipment & Tools
203 5.1% 144 4.6% 2662 8.7%
Other sectors 395 9.9% 538 17.0% 15133 49.5%
Total 3980 100% 3162 100% 30554 100%
Herfi ndahl index 0.164 0.086 0.059

18 T h e e m e rge nc e of c h i na a n d i n di a a s n e w i n no vaT ion p o w e r house s
C H a p t e r 2 c h a nge s i n T h e gl ob a l geogr a p h y of i n no vaT ion
Some prior research has assumed that innovation, when it occurs, evolves from global production networks (Yeung, 2007) and overlaps with global production networks. In other words, that R&D tends to co-locate with production facilities (Liu et al., 2013). While this may be true in some cases (Ernst, 2010), it does not hold in all, particularly in technology intensive industries (Audretsch and Feldman, 1996; Mariani, 2002).
In Table 2.4 we provide some evidence in this direction, showing cross-border investments in DDT and R&D activities by area of origin9 and destination, including projects in manufacturing activities as a benchmark. Our results show, first of all, that cross-border investments in R&D-related activities are less bound by geographic distance than projects in manufacturing activities. For example, while intra-Europe investments (Western and Eastern Europe) in manufacturing account for 47,7 per-cent of all cross-border investments of MNCs from Western Europe, this share drops to 36,1 percent in the case of DDT projects and 37,3 percent for R&D. Conversely, investments of European MNCs in Asia are 25,6 percent for manufacturing, but 39,7 percent for R&D investments and 36,4 percent for DDT.
More generally, while 46,3 percent of manufacturing investments performed by European MNCs are located in distant areas (namely in Asia and the Americas), the same regions attract a much higher share of R&D-related investments (58,7 percent).
A similar pattern emerges for Asian and North American MNCs. In the case of Asian MNCs, only 29,5 percent of investments in manufacturing are directed to (Western and Eastern) Europe and (North and Latin) America, while the share of investments in R&D-related activities in the same areas is 45,8 percent for DDT and 41,9 percent for R&D. Finally, projects of North American MNCs directed towards geographically distant areas, such as Europe, Asia, Africa and Middle-East, are 75,4 percent in the case of manufacturing and about 90 percent for R&D-related (89,9 percent for DDT and 91,1 percent for R&D).
The evidence is consistent with some recent econometric studies showing that geographic distance between the home and host country may be less of an obstacle for R&D-related projects than it is for manufacturing. This is because companies may need to locate R&D investments in distant locations where they can gain access to specific knowledge otherwise inaccessible (Castellani et al., 2013, Chaminade and de Fuentes, 2012). That distance can of course be compensated for by other diverse forms of proximity, especially cultural, institutional and relational (Hansen, 2012). While knowledge (codified) can be transferred across large geographical distances without the need of local interaction, it still requires a certain common understanding between the partners involved in the knowledge exchange for that knowledge to be useful for innovation. Relational proximity (Amin and Cohendet 2005; Gertler 2008) can link together geographically distant actors, enabling the transfer of knowledge. This view is corroborated by results from Table 2.5. For example, it can be seen that
9. For simplicity we show only the three largest areas of origin: Asia-Pacific, Western Europe and North America.

s w e di sh e n T r e p r e n e u r sh i p f oru m 19
despite higher geographic distance, North American MNCs are more likely than Asian or European companies to invest in the Middle East, in particular Israel and the UAE. Similarly, the likelihood of European MNCs doing R&D-related investments in Latin America (especially Brazil and Mexico) appears similar to that of (the much closer) North American MNCs.
Table 2.4 cross-border investment projects in r&d related activities, by main areas of origin and destination (January 2003 - august 2012, percentage share)
Source: Castelli and Castellani (2013).
2.2. offshoring of r&d and manufacturing activities from eu regions
Main finding: Offshoring of R&D is still rather uncommon in Europe, but when it happens it is a rather global phenomenon, and China and India play a non-negligible role as recipient countries.
Castellani and Pieri (2013) have recently drawn together the information on the region of origin of each investor and the main business activity involved in each of
Area of desti nati on
Area of origin AfricaAsia-
Pacifi c
Lati n America & Caribbean
Middle East
North America
Rest ofEurope
WesternEurope Total
Design, Development and Testi ng
North America 1.5% 56.5% 6.4% 2.2% 3.7% 5.8% 23.9% 100%
Western Europe
3.1% 36.4% 6.6% 2.1% 15.7% 10.9% 25.2% 100%
Asia-Pacifi c 1.7% 47.6% 4.9% 2.2% 18.7% 1.5% 23.4% 100%
R&D
North America 0.5% 52.1% 4.6% 4.6% 4.4% 4.6% 29.3% 100%
Western Europe
1.8% 39.7% 3.9% 2.3% 15.1% 7.8% 29.5% 100%
Asia-Pacifi c 0.9% 55.2% 2.1% 1.6% 16.7% 2.9% 20.7% 100%
Manufacturing
North America 2.5% 37.9% 16.6% 2.3% 7.9% 10.3% 22.5% 100%
Western Europe
4.5% 25.6% 8.4% 1.6% 12.3% 24.7% 23.0% 100%
Asia-Pacifi c 3.9% 60.2% 6.4% 2.3% 11.1% 7.4% 8.7% 100%

20 T h e e m e rge nc e of c h i na a n d i n di a a s n e w i n no vaT ion p o w e r house s
C H a p t e r 2 c h a nge s i n T h e gl ob a l geogr a p h y of i n no vaT ion
the international projects in the fDi Markets database. For the 2003-2006 period they were able to compute the number of R&D offshoring projects as a share of total investment projects originating from each NUTS2 region10, and for purposes of com-parison, the share of outward investments in manufacturing activities. In line with the idea that R&D offshoring is still a limited, although increasing phenomenon, they find that only a relatively small number of regions show some R&D offshoring activity, while manufacturing offshoring is much more pervasive and accounts for a larger share of total outward investments in each region. Not surprisingly, the core regions of the EU attract a higher share of R&D investments, while peripheral regions appear relatively specialized in attracting manufacturing plants.
Table A1 in the Appendix provides some basic statistics in line with these patterns. On average, about 12,75 offshoring and 9,28 incoming projects per year have been recorded. However, the distribution of the number of projects is highly skewed: more than 25 percent of regions had no offshoring, and more than 10 percent did not attract any inward investment. This skewness is even more evident in the case of the number of offshoring projects in R&D activities (OFF_RD): these are carried out by slightly more than 10 percent of the regions (the 90th percentile is equal to 1). Finally, offshoring projects in manufacturing activities (OFF_MAN) take place in about 50 percent of the regions in the sample. This is consistent with the fact that offshoring is still a rather rare phenomenon in Europe, and the offshoring of R&D even more so.
It is noteworthy that less than one-third of R&D offshoring projects are directed towards other European countries, so the bulk of such investment is actually directed to non-European countries. The main non-European recipients of R&D offshoring are China and India, followed by the developed countries and other South-East Asian countries. Other developing countries, which include important destinations such as Brazil and Russia, also attract a considerable number of projects. Consistent with this view, the number of R&D offshoring projects towards non-EU countries is double the number of projects directed towards other EU countries (on average 0,38 vs. 0,17 projects per region-year. The importance of R&D offshoring towards China and India can be appreciated from the average of 0,10 projects per region-year for OFF_RDChina, and 0,07 for OFF_RDIndia, a value consistent with the number of R&D offshoring pro-jects towards developed countries.
10. To clarify what is intended for R&D investments, here are two examples that fDi Markets reports with specific reference to IBM as an investor. Example 1: a nanotech research centre in Egypt is intended to be a world class facility for both local engineers and scientists, and IBM’s own researchers, to develop nanotechnology programs. The centre will work in coordination with other IBM Research efforts in the field in Switzerland and the US. Example 2: a business solution centre to promote new technologies that help save energy used to run computer equipment and reduce hardware management costs. Teaming up with automakers and electronics manufacturers, the centre will study how to make the best use of advanced technologies. IBM Japan intends to use the results of these efforts to win system development projects.
s w e di sh e n T r e p r e n e u r sh i p f oru m 21
2.3. international collaboration for innovation
Main finding: The globalization of innovation activities is not only a phenomenon of large multinational companies, particularly for Sweden.
Cross-border R&D investment is one of the mechanisms that firms may use in their asset seeking strategies. But of course it is not the only one. They may access knowledge needed for their innovation process by engaging in a variety of market and non-market mechanisms. Primary methods include purchasing technology and knowledge embodied in machinery or patents, and jointly developing innovation in collaboration with external partners. While cross-border R&D investments are inherently dominated by multinatio-nal companies, these and other mechanisms are more suitable for other types of firms.
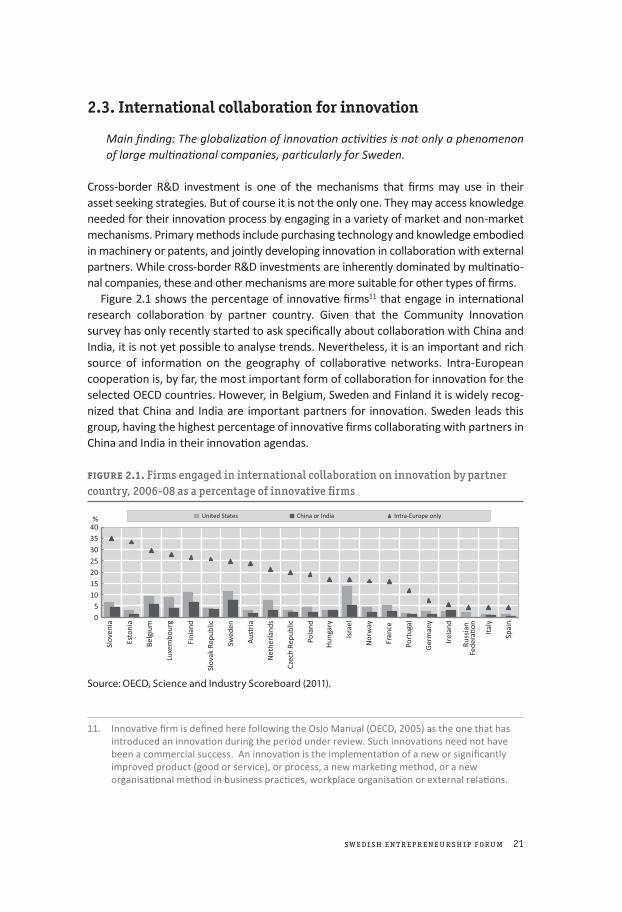
Figure 2.1 shows the percentage of innovative firms11 that engage in international research collaboration by partner country. Given that the Community Innovation survey has only recently started to ask specifically about collaboration with China and India, it is not yet possible to analyse trends. Nevertheless, it is an important and rich source of information on the geography of collaborative networks. Intra-European cooperation is, by far, the most important form of collaboration for innovation for the selected OECD countries. However, in Belgium, Sweden and Finland it is widely recog-nized that China and India are important partners for innovation. Sweden leads this group, having the highest percentage of innovative firms collaborating with partners in China and India in their innovation agendas.
Figure 2.1. Firms engaged in international collaboration on innovation by partner country, 2006-08 as a percentage of innovative firms
Source: OECD, Science and Industry Scoreboard (2011).
11. Innovative firm is defined here following the Oslo Manual (OECD, 2005) as the one that has introduced an innovation during the period under review. Such innovations need not have been a commercial success. An innovation is the implementation of a new or significantly improved product (good or service), or process, a new marketing method, or a new organisational method in business practices, workplace organisation or external relations.
United States China or India Intra-Europe only
Slov
enia
Esto
nia
Belg
ium
Luxe
mbo
urg
Finl
and
Slov
ak R
epub
lic
Swed
en
Aus
tria
Net
herl
ands
Czec
h Re
publ
ic
Pola
nd
Hun
gary
Isra
el
Nor
way
Fran
ce
Port
ugal
Ger
man
y
Irel
and
Russ
ian
Fede
ra�o
n
Ital
y
Spai
n
40353025201510
50
%

22 T h e e m e rge nc e of c h i na a n d i n di a a s n e w i n no vaT ion p o w e r house s
C H a p t e r 2 c h a nge s i n T h e gl ob a l geogr a p h y of i n no vaT ion
Sweden is a very interesting case in this respect, since both large and small firms report collaboration with Chinese and Indian firms in the development of their innovation. A close reading of Table 2.5, which shows data from the Community Innovation Survey for Sweden, reveals that most of the surveyed firms do not collaborate for innovation with external partners. Moreover, it appears that this is particularly the case for small and medium size enterprises (only 504 firms of less than 50 employees collabo-rate with external partners for innovation, with respect to 1,341 firms that answered the question on collaboration for innovation). However, when they do collaborate, a more than 20 percent do so with partners in India and China.
Table 2.5. collaboration for innovation with partners in india and china by swedish firms, by size of the firm (number of employees), 2006-2008.
Source: Eurostat (2010).
This propensity to collaborate for innovation with partners in China and India is slightly lower for small firms, but still about 16 percent of the small Swedish firms (with less than 50 employees) that collaborate for innovation, do so with partners in India and China. This share is 18 percent for medium firms (50 to 250 employees) and 31,07 percent for large firms, which is the highest percentage among the surveyed countries in the European Union. These results confirm that the globalization of R&D and other innovative activities is not restricted to or only a phenomenon of large firms, but also heavily involves SMEs. This is especially the case for Swedish firms.
The evidence presented in this section suggests that the internationalization of R&D and inventive activities has been on the rise. This change was at first mainly motivated by the need to better exploit existing home-based advantages (i.e. by
Total fi rms that answered
questi on on collaborati ons
Total fi rms that col-
laborate for innovati on
Total fi rms that col-
laborate with partners in China and
India
% of fi rms collaborati ng with partners in China and
India as a share of all fi rms (that
answered the questi on)
% fi rms that collabo-rate with
partners in China and India as a
share of all fi rms that
collaborate for innova-
ti on
(A) (B) (C) (C)/(A) (C)/(B)
<50 1341 504 81 6.04 16.07
50<250 542 263 48 8.86 18.25
>=250 467 309 96 20.56 31.07
Total 2350 1076 225 9.57 20.91

s w e di sh e n T r e p r e n e u r sh i p f oru m 23
adapting existing products to foreign market needs). More recently, the need to source complementary assets, talents and competences abroad has also become an important and sustained motive (Dunning and Lundan, 2009). Innovation processes are becoming global, spreading beyond the Triad countries (Europe, US and Japan). This global shift is observable in terms of both R&D related investments (offshoring of R&D) and Global research collaboration. Sweden is particularly sensitive to these changes since it is one of the most internationalized European economies. This is evident both in terms of outward R&D (more than 40 percent of the R&D of domestic firms is performed abroad) and research collaboration.
The trend towards internationalization of R&D activities has raised concerns that the knowledge base of advanced countries may be ‘hollowed out’, worsening their relative international competitiveness.12 At the same time, economic research has highlighted the potential benefits of offshoring R&D in terms of reverse technology transfer and increased competitiveness at home. However, while there are works investigating the impact of internationalization of R&D both on the innovative and productive performance at the level of the firm, evidence of the overall impact of this phenomenon on the home economy is still scarce and inconclusive (Castelli and Castellani, 2013). This lack of evidence is particularly unfortunate from the policy perspective, since an informed policy intervention needs to evaluate both the firm-level effects and their interactions at a more aggregate level. Next we will analyse the impact of the globalization of R&D activities in terms of productivity growth in European regions (section 3.1.) as well as degree of novelty (section 3.2.).
12. See, for example, Lieberman (2004) for the US, and Kirkegaard (2005) or InnoGrips (2012) for Europe.

24 T h e e m e rge nc e of c h i na a n d i n di a a s n e w i n no vaT ion p o w e r house s

s w e di sh e n T r e p r e n e u r sh i p f oru m 25
33. impact of internationalization of r&d and other innovation activities
3.1. some theoretical remarks on the effects of r&d offshoring on productivity in the home economies
Main finding: There is not a clear consensus in the literature on the impact of offshoring of R&D on home countries
Economic research has not reached a consensus (Bardhan, 2006) on what is the impact of offshoring on productivity in the home countries or regions. Several studies find a positive relationship between the internationalization of research innovation and the degree of innovation and productivity at home. For example, Criscuolo (2009), using data on patent citations, provides evidence of a reverse technology transfer to European firms, and D’Agostino et al. (2010) find that the patenting activity of OECD countries and regions increased when these territories offshored R&D activities in emerging economies (BRICKST). Using Spanish data, Nieto and Rodriguez (2011) find that offshoring is positively associated with firms’ propensity to innovate, with a greater effect on product than process innovations, and through captive than offshore outsourcing. Similar results can be found in the ProInno (2007) report. According to the R&D managers of 158 EU companies, the benefits from R&D offshoring were magnified by the co-occurrence of other
26 T h e e m e rge nc e of c h i na a n d i n di a a s n e w i n no vaT ion p o w e r house s
C H a p t e r 3 i m pac T of i n T e r naT iona l i z aT ion of r& d a n d o T h e r i n no vaT ion ac T i v i T i e s
factors, such as the ability to choose successful R&D projects, the length of time it took to commercialize the innovative idea, the cost efficiency of innovation proces-ses and, finally, the ability to learn from the R&D conducted by other firms. Two recent reports commissioned by the European Commission reach a similar conclu-sion: internationalization of R&D does not affect productivity and innovation in EU firms (InnoGrips, 2012).
R&D offshoring may affect the productivity of firms through a variety of chan-nels. First, R&D labs abroad are required to be able to quickly and effectively adapt products to the needs and specificities of new markets13. Second, the need to enhance innovation capability leads firms to engage in competence-creating acti-vities and interaction with different and geographically dispersed actors (Cantwell and Mudambi, 2005). Third, R&D offshoring is necessary to gain access to strategic complementary assets, as well as highly qualified and/or lower cost R&D personnel (Puga and Trefler, 2008).
The diverse effects of R&D offshoring on the aggregate productivity of the home region through the reallocation of market shares (i.e. the between-component) is much less explored. Offshoring enables firms to sell more into foreign markets (thanks to the quick adaptation of their products), increasing the need for services and activities concentrated in the home territory (Barba Navaretti et al., 2010). Since offshoring firms are relatively more productive than the purely domestic ones regionally, the increase in market shares due to offshoring can boost aggregate productivity.
Finally, R&D offshoring may also have significant indirect effects on the home region. These ‘spillover’ effects on the productivity, size and entry/exit of other firms in a local context, have been analysed at length with reference to foreign-owned firms in host economies, but they may well occur in the case of R&D offshoring as well. On the one hand, firms’ offshoring R&D may close down activities in the home country, thus disrupting linkages with local firms and institutions. This can shrink the activities of local firms, which may ultimately be forced to exit. Alternatively, if R&D offshoring enables some reverse knowledge transfer, domestic counterparts may also accrue benefits from some positive externalities, via labour mobility, imitation or inter-firm linkages (Castellani and Zanfei, 2006).
In sum, R&D offshoring affects the home region productivity through a variety of channels, and only some of them are observable at the level of the individual firm. The clear virtue of an expanded aggregate perspective is that it permits evaluation of the net effect of such different transmission channels. Moreover, most of these ripple effects are likely to be relatively confined in space, making the regional rather than the country level far more useful for capturing them.
13. Eventually, innovation developed for the local markets may be decontextualized, becoming part of the knowledge base of multinational firms, and then subsequently exploited elsewhere Zanfei (2000).

s w e di sh e n T r e p r e n e u r sh i p f oru m 27
3.1. The impact of r&d offshoring on productivity growth in home regions. evidence from the european union14
Main finding: R&D offshoring is associated with higher productivity growth in the EU regions.
Let’s now turn to investigating to what extent the productivity growth of 262 regions in Europe is associated with the offshoring of R&D activities by domestic multinational enterprises (MNEs) based in the same regions. It is worth mentioning that this issue is particularly relevant in the European Union (EU) where regional competitiveness and social and economic cohesion have long been crucial concerns for policy makers.15
We compiled a dataset on international investment projects and use it to build uni-que measures of outward investments in R&D at the regional level for the countries of the European Union. We then estimate regressions of productivity growth as a function of the lagged number of international R&D investments, controlling for a measure of incoming multinational activity, as well as other regional characteristics and country fixed effects.16
Furthermore, we investigate the specific effects of offshoring R&D towards diffe-rent geo-economic areas. Since, as emphasized earlier, China and India are two major recipients of international investments in R&D, we investigate the different effect of offshoring R&D towards those countries, as well as other important non-European locations including the rest of South-East Asia.
We find that offshoring regions have a higher productivity growth relative to non-offshoring regions, but the correlation between the intensity of offshoring (the num-ber of outward investments projects) and the productivity growth of home regions is actually negative.17 To the contrary, regions attracting multinationals have a lower productivity growth, whereas a higher number of incoming multinationals is associated with higher productivity growth. Our specification allows assessing that the threshold of offshoring investments above which the overall effect is negative is over 60 projects, which means that less than five percent of the regions actually experience a negative productivity growth as a result of their involvement in offshoring. This is consistent with recent research suggesting the plausibility of an inverted-U relationship between offshoring and innovation (Grimpe and Kaiser, 2010) due to the increasing difficulties in orchestrating the relevant value chain (Kotabe and Mudambi, 2009). It is notewor-thy that above a certain threshold, inward investments are positively associated with host region productivity growth. According to our estimates, about one-quarter of
14. This section is largely based on Castellani and Pieri (2013).15. As a matter of fact, 35 percent of the EU budget for the period 2007-2013 has been allocated
to promote social and economic cohesion among the regions of its member states.16. The results of the econometric analysis are included in Annex 1.17. The details of the econometric models as well as the results are reported in Annex 1.

28 T h e e m e rge nc e of c h i na a n d i n di a a s n e w i n no vaT ion p o w e r house s
C H a p t e r 3 i m pac T of i n T e r naT iona l i z aT ion of r& d a n d o T h e r i n no vaT ion ac T i v i T i e s
EU regions benefit from incoming multinationals. This result suggests that policies to attract foreign investors may not bring their positive effects on the productivity of the receiving regions unless they successfully attract a sizable number of investors.
Our use of information on the types of investment made abroad makes it possible to investigate the relationship between R&D offshoring (as opposed to offshoring of manufacturing) and regional productivity. The results, reported in columns (2) and (3) of Table A.2 in Annex 1, show that the R&D offshoring is associated with significantly higher productivity growth, while offshoring in manufacturing activities is not. In the case of R&D offshoring there is no evident inverted-U relation with productivity growth. This is probably related to the fact that the level of the internationalization of R&D of European regions has not reached the threshold where the ‘hollowing-out’ effects can, so to speak, kick-in.
In order to gain greater insight into how R&D offshoring and the home region pro-ductivity growth are related, it is invaluable to distinguish R&D offshoring towards distant countries outside Europe, as opposed to offshoring within the European area.
Main findings: The positive correlation between R&D offshoring and the productivity growth of home region is particularly strong in the case of R&D offshoring towards the South-East Asia, while it is negative in the case of R&D offshoring towards India.
The effect on productivity growth is mostly positive, including the case of China, but it is often imprecisely estimated. The effect is generally larger and significant in the case of R&D offshoring toward South-East Asian countries. Conversely, those regions that are offshoring R&D intensively towards India experience significantly lower pro-ductivity growth rates.
This may be related to a combination of country and sector specific characteristics, since the patterns of R&D offshoring towards South-East Asia and India have quite pecu-liar profiles (see next section 4). Whereas the former is disproportionally concentrated in high-tech manufacturing (43 percent of all R&D projects in the area are in these industries), the latter is much more concentrated in knowledge-intensive services (52 percent). Using case studies from the mobile handset and financial services industries, Mudambi and Venzin (2010) provide a novel perspective on the disintegration, mobi-lity, and reintegration of value chain activities in a global context. One of their findings is consistent with the idea that orchestrating the value chain in knowledge-intensive services, such as the financial industry, is more complex than in the case of the manu-facturing industry (e.g. mobile handsets). This explains to some degree why we may observe less offshoring and international outsourcing in the service industries. But when firms do offshore such services, like in the case of service offshoring to India, the risk of ‘hollowing out’, due to difficulties in orchestrating the value chain, are greater. Conversely, in the case of high-tech manufacturing the organizational problems are fewer, and the ‘gains’ of R&D offshoring may be greater than the ‘pains’. The case of South-East Asia over the last decade fits well in this interpretative framework. The rapid growth of electronics firms such as Samsung and LG from South Korea, or HTC from Taiwan and virtually all other multinationals have R&D centres producing
s w e di sh e n T r e p r e n e u r sh i p f oru m 29
cutting-edge technologies in these countries. By offshoring R&D to South-East Asian countries European firms can tap into these sources of advanced knowledge, which foster the introduction of new product and boost productivity growth at home.
Main finding: The evidence of lower productivity of the R&D offshoring towards India has potential implications for Sweden
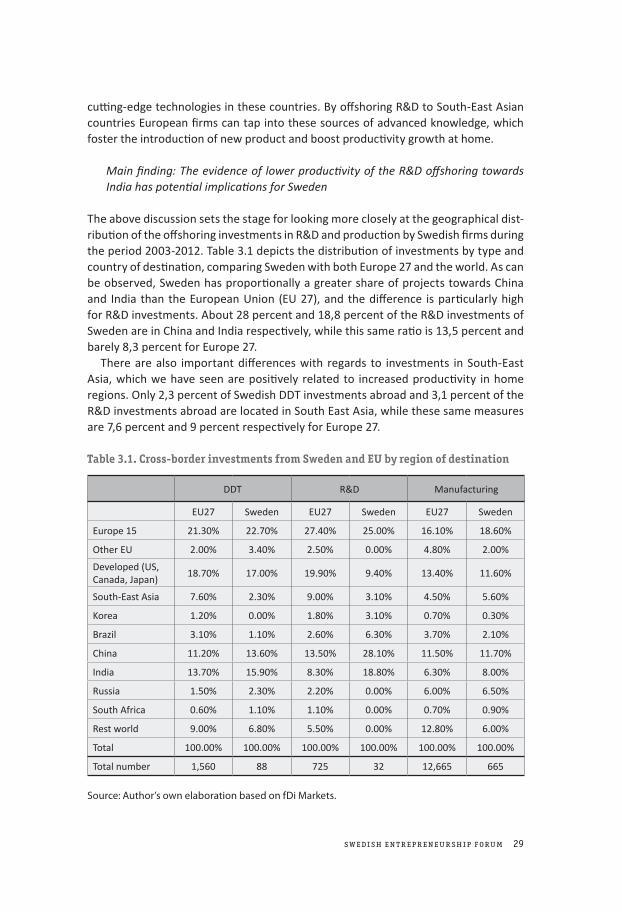
The above discussion sets the stage for looking more closely at the geographical dist-ribution of the offshoring investments in R&D and production by Swedish firms during the period 2003-2012. Table 3.1 depicts the distribution of investments by type and country of destination, comparing Sweden with both Europe 27 and the world. As can be observed, Sweden has proportionally a greater share of projects towards China and India than the European Union (EU 27), and the difference is particularly high for R&D investments. About 28 percent and 18,8 percent of the R&D investments of Sweden are in China and India respectively, while this same ratio is 13,5 percent and barely 8,3 percent for Europe 27.
There are also important differences with regards to investments in South-East Asia, which we have seen are positively related to increased productivity in home regions. Only 2,3 percent of Swedish DDT investments abroad and 3,1 percent of the R&D investments abroad are located in South East Asia, while these same measures are 7,6 percent and 9 percent respectively for Europe 27.
Table 3.1. cross-border investments from sweden and eu by region of destination
Source: Author’s own elaboration based on fDi Markets.
DDT R&D Manufacturing
EU27 Sweden EU27 Sweden EU27 Sweden
Europe 15 21.30% 22.70% 27.40% 25.00% 16.10% 18.60%
Other EU 2.00% 3.40% 2.50% 0.00% 4.80% 2.00%
Developed (US, Canada, Japan)
18.70% 17.00% 19.90% 9.40% 13.40% 11.60%
South-East Asia 7.60% 2.30% 9.00% 3.10% 4.50% 5.60%
Korea 1.20% 0.00% 1.80% 3.10% 0.70% 0.30%
Brazil 3.10% 1.10% 2.60% 6.30% 3.70% 2.10%
China 11.20% 13.60% 13.50% 28.10% 11.50% 11.70%
India 13.70% 15.90% 8.30% 18.80% 6.30% 8.00%
Russia 1.50% 2.30% 2.20% 0.00% 6.00% 6.50%
South Africa 0.60% 1.10% 1.10% 0.00% 0.70% 0.90%
Rest world 9.00% 6.80% 5.50% 0.00% 12.80% 6.00%
Total 100.00% 100.00% 100.00% 100.00% 100.00% 100.00%
Total number 1,560 88 725 32 12,665 665

30 T h e e m e rge nc e of c h i na a n d i n di a a s n e w i n no vaT ion p o w e r house s
C H a p t e r 3 i m pac T of i n T e r naT iona l i z aT ion of r& d a n d o T h e r i n no vaT ion ac T i v i T i e s
These results suggest that offshoring of R&D and DDT by Swedish firms may not have the expected positive impact for productivity in the home regions due to the type of project and country of destination. Swedish firms invest more in India than their European counterparts, and this may have a negative impact in terms of productivity. However, this point is tentative and needs to be further investigated. The number of projects is still too low to be able to draw any robust conclusions.
In sum, our results suggest that regions experience a higher productivity growth when firms based in the region initiate some offshoring activity, but this positive association fades with the number of investment projects carried out abroad. These findings are consistent with a core proposition rooted in theory. The argument is that while increasing use of offshoring and outsourcing allows adaption of existing products to new markets and access to new or complementary forms of knowledge, it may also determine a dilution of firm-specific resources, deterioration of integra-tive capabilities and the need of greater supervision by managers. However, these ‘decreasing returns’ of offshoring do not seem to occur in the case of R&D. In fact, our estimates suggest that a single additional R&D offshoring project is associated with a significantly higher regional productivity growth the following year. This is to be expected given that offshoring of European R&D is still relatively low, so that the tipping point where the ‘pains’ outweigh the ‘gains’ may simply not have yet been reached.
When we try to disentangle the contribution to the overall effect of R&D offsho-ring towards China, India and other geo-economic areas, we find that that offshoring towards China has a mildly positive effect on productivity at home, while offshoring towards India is significantly associated with a drop in productivity growth in EU regions. This effect is counterbalanced by a robustly positive impact of offshoring R&D towards other countries in the South-East Asia region. This is consistent with the peculiar character of specialization of the Indian economy (as we will discuss in the next chapter) and, consequently, of the kind of activities offshored towards that country.
3.2. impact of global research collaboration on degree of novelty of innovation18 As we have seen earlier, Swedish firms tend to collaborate for innovation with inter-national partners more than their European counterparts. This is particularly evident regarding their collaboration with Chinese and Indian partners for innovation. Even more interesting is the fact that in Sweden, even small and medium size firms (SMEs) report collaborating for innovation with partners in China and India.
18. This section is largely based on Plechero and Chaminade (2013) and Harirchi and Chaminade (forthcoming).

s w e di sh e n T r e p r e n e u r sh i p f oru m 31
From a theoretical perspective, economic geographers have traditionally argued that SMEs external relations are more confined to the region than those of large firms. A decade ago Kaufman and Todtling (2002) argue one of the reasons for this is that SMEs are less capable of searching for and using codified knowledge, forcing them to rely more on personal ways of transferring this knowledge through local networks. However, more recent works have started to emphasize the importance of tapping into global networks for innovation (Morrison et al., 2013, Plechero and Chaminade, 2010). Understanding the nature of the impact of this global research collabora-tion should as well also provide some insights into the opportunities and caveats that research collaboration with distant partners can bring to firms, particularly in Sweden.
Main finding: Collaborating for innovation with international partners is necessary for new to the industry and new to the world innovations.
Aslensen and Harirchi (2013) using INGINEUS data have recently analysed the impact of local and global research collaboration on the degree of novelty in SMEs in the ICT industry, comparing Sweden, Norway and India. The issue of the degree of novelty is captured by asking firms about the most important innovation in the period 2006-2008 and having them distinguish whether the identified product or service was new to the firm, industry or to the world. To capture the geography of the research col-laboration, the authors queried the firms about whom they had actively collaborated with in the development of their most important innovation. They were asked to indicate where the partner was located (the fixed-choice options were in the region, domestic, and several others for international category).
Consistent with the findings of Plechero and Chaminade (2013), our results con-firm that collaborating for innovation with partners localized in the region or in the country does not impact the likelihood of introducing new to the industry or new to the world innovations. To the contrary, collaborating with international partners is strongly and significantly related to new to the industry and new to the world innovations. In other words, international linkages are related to new to the world innovations. Plechero and Chaminade’s research also suggests that the type of part-ners matter. Collaborating with international clients, suppliers and competitors in the development of an innovation may contribute to new to the industry or new to the world innovations, while collaborating with international universities does not seem to be related to the degree of novelty.
Main finding: The introduction of very novel innovations is the result of collabora-tion with users in middle income countries, like China or India, as well as with users from advanced economies

32 T h e e m e rge nc e of c h i na a n d i n di a a s n e w i n no vaT ion p o w e r house s
C H a p t e r 3 i m pac T of i n T e r naT iona l i z aT ion of r& d a n d o T h e r i n no vaT ion ac T i v i T i e s
The importance of collaborating with international clients is further explored by Harirchi and Chaminade (forthcoming). Again using INGINEUS data and looking at both large and small and medium sized firms, their analysis shows that for firms located in Europe collaborating with international customers matters for the degree of novelty. This is in line with existing theories that argue that collaboration with international customers is positively related to radical innovations. What is more interesting, however, is their investigation of the impact by looking at the specific location of those clients. Their results are summarized in Table 3.2.
Table 3.2. impact of global research collaboration on the degree of novelty
Source: Harirchi and Chaminade (Forthcoming).
For firms located in high-income countries19, markets in low-income countries have traditionally been seen as a way to diffuse innovations developed in high-income countries. Thus, user-producer interaction is regarded more as sourcing informa-tion for the product adaptation. However, the results of Harirchi and Chaminade (forthcoming) indicate that firms from advanced economies such as Sweden have also started to collaborate more closely with customers located in low- and middle-income countries to develop new to the world innovation. In accordance with recent empirical studies, this can be related to technologically sophisticated customers, especially consumers in Asian countries (Whang & Hobday, 2011; Yeung, 2007) that can be attributed to the countries’ expanding middle-class. It should be emphasized that our data refers explicitly to collaborations with customers in regards to the development of the most important innovations, and not market adaptation (sour-cing). Thus, active collaboration with customers located in low and middle-income countries is related to new to the world innovations.
On the other hand, firms located in middle-income countries may have fewer technological resources, and consequently less absorptive capacity. Collaborating with advanced customers located in high-income countries may thus be too difficult. However, collaborating with users located in other low- or middle-income countries may have a higher impact on the degree of novelty.
19. High-income: Western Europe, North America, Japan and Australia. Low and middle income: East Europe, Central and South America, Africa, China, India and Rest of Asia.
Use
rs
Producers (fi rms)
High Income Middle income
High Income New to the worldNo eff ect of the degree
of novelty
Middle/low income New to the world New to the industry

s w e di sh e n T r e p r e n e u r sh i p f oru m 33
In sum, collaborating with external partners in the development of innovation is positively associated with innovations that are more novel, either new to the industry or to the world. This is particularly the case for market partners like clients, suppli-ers, competitors of consultancy. What is particularly interesting is that that actively collaborating with external partners has a positive impact in terms of innovation (Aslensen and Harirchi (2013), Harirchi and Chaminade (Forthcoming)).

34 T h e e m e rge nc e of c h i na a n d i n di a a s n e w i n no vaT ion p o w e r house s

s w e di sh e n T r e p r e n e u r sh i p f oru m 35
4determinants of the internationalization of innovation activities and its impact: regions, competences and industries20
We have argued that internationalization of innovation activities in general has a positive impact both in terms of productivity and degree of innovation. But what determines a higher or lower engagement in internationalization of innovation? And what determines the ultimate impact of this internationalization?
In this section we investigate what are the determinants of the internationalization of innovation activities and its impact. In particular, we will be looking at the role of industries, regions and competences in supporting or constraining the engagement in different forms of global innovation networks (from offshoring of R&D to collabo-ration for innovation).
4.1. industry differences
Main finding: Globalization of innovation activities is highly contingent to the type of knowledge base prevailing in the industry
20. By Cristina Chaminade and Monica Plechero.

36 T h e e m e rge nc e of c h i na a n d i n di a a s n e w i n no vaT ion p o w e r house s
C H a p t e r 4 de T e r m i na n T s of T h e i n T e r naT iona l i z aT ion of i n no vaT ion ac T i v i T i e s a n d i T s i m pac T
Not all industries are equally globalized or show the same propensity to internationa-lize R&D and innovation related activities. As shown in Table 2.3. the ICT, Transport (automotive) and life science industries are the most innovative and globalized (Castelli and Castellani, 2013). Thus, the analysis of globalization of innovation needs a secto-rial perspective. Not only are the sources of innovation different (Pavitt 1984), but the nature of their knowledge bases also differ (Laestadius 1998; Asheim and Gertler 2005; Asheim, Coenen et al. 2007) and as a consequence so does the geography of their networks (Asheim, Coenen et al. 2007; Moodysson, Coenen et al. 2008).
Industries in which knowledge is fundamentally of a tacit nature will, in principle, display different patterns of knowledge sourcing within and across national bor-ders, than industries in which a substantial part of the knowledge can be codified (Moodysson 2008; Moodysson, Coenen et al. 2008). In industries characterized by analytical knowledge bases like life sciences, scientific knowledge is important. Knowledge is derived through R&D processes and it is mainly codified, thus being more prone to long distant interactions for innovation (Martin and Moodysson, 2013). In industries characterized by synthetic knowledge bases, like autos, innovation is often the result of incremental change through the search for engineering solutions. Industries like shipbuilding or machine manufacturing rely more on learning by doing and tacit knowledge than analytic knowledge bases, which may limit the possibility of sustained long distant collaborative research project (global research collaboration). This family of industries may by its very nature force firms to establish R&D depart-ments in close proximity to the users (R&D offshoring). Finally, symbolic knowledge bases characterized cultural industries like film of video gaming, making them highly context specific and thus more resistant and difficult to transfer across geographical borders (Martin and Moodysson 2011). So, recognizing the spectrum of knowledge bases predominant in a variety of industries, we may expect different spatial patterns of knowledge sourcing.
Main finding: China and India attract different R&D related activities in a variety of industries. China seems to attract more basic research in manufacturing related industries, while India attracts more applied research in services.
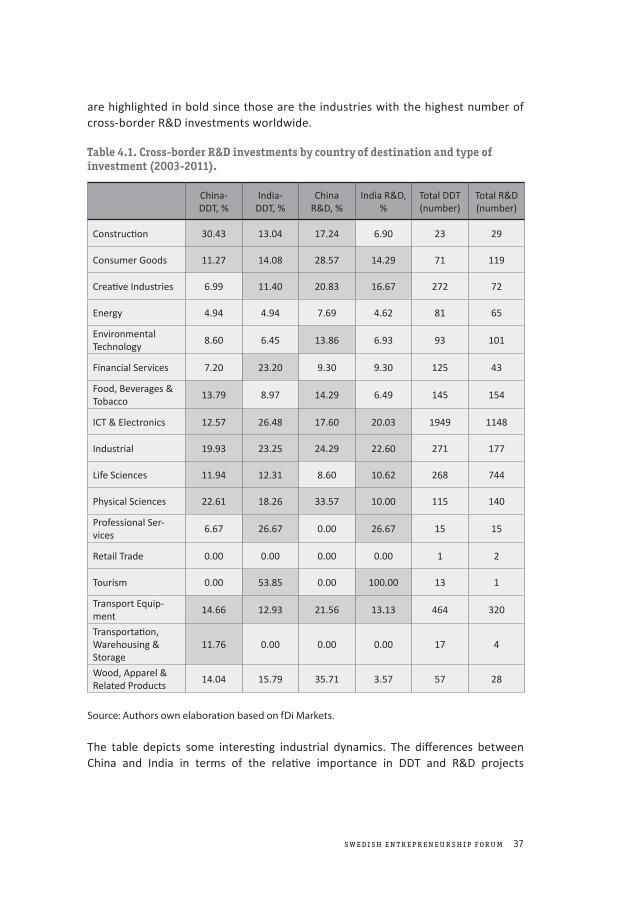
Using fDi Markets data on DDT and R&D cross-border investments, we can single out the percentage of greenfield investments in a particular industry that goes to China and India. This is shown in Table 4.1. By attending to the type of investment, we can observe the kinds of R&D related projects in particular industries in each country that are playing a significant role. Table 4.1 shows the breakdown of pro-jects by industry and type of investment. We highlight those industries in which more than 10% of the DDT or R&D cross-border investments in that particular indu-stry go to India or China. For example, looking at the first row, 30,43 percent of the total number of DDT cross-border projects in Construction go to China and 13,04 percent go to India. ICT and Electronics, Life Sciences and Transport Equipment
s w e di sh e n T r e p r e n e u r sh i p f oru m 37
are highlighted in bold since those are the industries with the highest number of cross-border R&D investments worldwide.
Table 4.1. cross-border r&d investments by country of destination and type of investment (2003-2011).
Source: Authors own elaboration based on fDi Markets.
The table depicts some interesting industrial dynamics. The differences between China and India in terms of the relative importance in DDT and R&D projects
China- DDT, %
India- DDT, %
China R&D, %
India R&D, %
Total DDT (number)
Total R&D (number)
Constructi on 30.43 13.04 17.24 6.90 23 29
Consumer Goods 11.27 14.08 28.57 14.29 71 119
Creati ve Industries 6.99 11.40 20.83 16.67 272 72
Energy 4.94 4.94 7.69 4.62 81 65
Environmental Technology
8.60 6.45 13.86 6.93 93 101
Financial Services 7.20 23.20 9.30 9.30 125 43
Food, Beverages & Tobacco
13.79 8.97 14.29 6.49 145 154
ICT & Electronics 12.57 26.48 17.60 20.03 1949 1148
Industrial 19.93 23.25 24.29 22.60 271 177
Life Sciences 11.94 12.31 8.60 10.62 268 744
Physical Sciences 22.61 18.26 33.57 10.00 115 140
Professional Ser-vices
6.67 26.67 0.00 26.67 15 15
Retail Trade 0.00 0.00 0.00 0.00 1 2
Tourism 0.00 53.85 0.00 100.00 13 1
Transport Equip-ment
14.66 12.93 21.56 13.13 464 320
Transportati on, Warehousing & Storage
11.76 0.00 0.00 0.00 17 4
Wood, Apparel & Related Products
14.04 15.79 35.71 3.57 57 28

38 T h e e m e rge nc e of c h i na a n d i n di a a s n e w i n no vaT ion p o w e r house s
C H a p t e r 4 de T e r m i na n T s of T h e i n T e r naT iona l i z aT ion of i n no vaT ion ac T i v i T i e s a n d i T s i m pac T
respectively can be explained by a variety of factors. Particularly important are the industrial specialization of both countries, and the breath and the quality of techno-logical capabilities (Plechero, 2010; Chaminade and the Fuentes, 2012).
First, India attracts more ICT and Life science projects, both in R&D as well as design, development and testing (DDT). India R&D investments are highly oriented towards services and life sciences, particularly software services and pharmaceuti-cals (Batelle, 2012). This explains why India performs better in attracting R&D related projects in ICT, life sciences and creative industries. India (particularly Bangalore) is considered to be a knowledge hub for software development, attracting a large amount of investments for software development (coding), integration and testing. Regarding the creative industries, India is home of one of the most important movie industries in the world, Bollywood, economically comparable to Hollywood. The vast expertise in this industry and associated networks may explain the large proportion of DDT projects in creative industries located in India.
Second, China attracts proportionally more projects in R&D and DDT in the Transport equipment industry, including automotive, one of the most globalized indu-stries. China, is currently considered to be a leading country in R&D in motor vehicles, after Germany, Japan, US and South Korea (Battelle, 2012). The investment of General Motors in China offers some insights into the kind of projects China is attracting. GM has recently as part of the GM China advanced technical centre opened in Shanghai an Advanced Materials Lab whose purposes is to do “cutting edge-research for new battery technologies and lightweight automotive materials” (Battelle, 2012:23).
Third, Environmental technologies and Physical sciences tend in general to globalize their innovation activities less, but when they do China is the preferred destination for both R&D and DDT. The Chinese government has adopted a proactive energy policy supporting the development of clean energy, which provides a favou-rable framework of conditions for the development of environmental technologies (Battelle, 2012). China is now the top country in the world in terms of the number of scientists and engineers. In contrast, India has one of the lowest ratios of scientists and engineers per million people (Battelle, 2012). Furthermore, industry funding of R&D is also relatively low in India as compared to China, one third of the total as com-pared to two thirds in China. The amount of R&D dedicated to basic research in India is also barely one fourth of the total R&D. China, on the other hand, has a broader science base which allows companies to establish large R&D facilities embracing a variety of domains. This is particularly necessary in the development of technolo-gically complex products drawing on a large and growing variety of scientific fields.
Finally, both countries are receivers of DDT projects in consumer goods and food and beverage, while China is also a recipient of R&D projects in this industry. In both industries (consumer goods and food and beverage) R&D is closely related to the investments in manufacturing in these industries.
These differences in industrial specialization between the two countries may explain the different impact of offshoring of R&D towards China and India. As sug-gested by Mudambi and Venzin (2010), coordinating activities in the value chain of knowledge intensive services is more complex than in manufacturing activities. What
s w e di sh e n T r e p r e n e u r sh i p f oru m 39
the sectorial analysis suggests is that the type of activities that are offshored to China may be easier to integrate with other globally dispersed production and innovation activities which, in turn, may explain the positive impact of offshoring to China in contrast to India.21
4.2. regional differences22
Main finding: The characteristics of the regional innovation system influence the geography of the innovation activities
The literature in economic geography shows that the geography of the knowledge linkages depends significantly on the types of Regional Innovation Systems (RIS) where the firms are located23 (Asheim and Gertler, 2005; Asheim et al., 2011; Tödtling et al., 2011). Innovations in general, and knowledge sharing in particular, are social processes shaped by institutions (Amin and Thrift, 1994) that can be region-specific. On the other hand, the institutional framework and the dynamics of networks among agents and knowledge flows are important determinants for absorptive capacity, and the innovative potential that exist in a region (Malberg & Maskell, 2006; Asheim & Gertler, 2005; Cooke, 2001). Regions with strong systems of innovation may facilitate collaboration and generation of new knowledge, fostering innovation within those regions, both developed (Asheim et al. 2007) and emerging (Chaminade, 2011).
Furthermore, recent evidence suggests that the institutional thickness of a region in a particular industry, rather than the specific country, is directly related to the pro-pensity of the relevant firms to engage in global innovation networks (Chaminade, 2012; Tödtling et al. 2011). Therefore, we expect the thickness of a RSI to impact firms’ innovation performance and engagement in global innovation networks.
When we take the institutional framework of a region into account, it is possible to distinguish between strong regions as well as marginal regions. Regions are generally considered strong (institutionally thick) when there is a solid organizational infrastruc-ture (i.e. the number and diversity of organizations in that particular innovation system), high levels of interaction among local actors, a culture of collective repre-sentation and shared norms and values that serve to constitute the social identity of a particular locality (Amin and Thrift, 1994; Tödtling and Trippl, 2005; Chaminade and Plechero, 2014). According to Cooke et al. (2000) and Chaminade and Plechero (2014), organizationally and institutionally thick RISs are often located in metropolitan areas.
21. Westermark (2013) provides several examples of the difficulties of coordinating distant projects between Swedish and Indian SMEs in the IT industry. Of the four cases that she follows over 6 years, only two were successful.
22. This section is largely based on Chaminade and Plechero (forthcoming).23. RISs can be defined as “wider setting of organizations and institutions affecting and
supporting learning and innovation in a region” (Asheim, 2009, p. 28).

40 T h e e m e rge nc e of c h i na a n d i n di a a s n e w i n no vaT ion p o w e r house s
C H a p t e r 4 de T e r m i na n T s of T h e i n T e r naT iona l i z aT ion of i n no vaT ion ac T i v i T i e s a n d i T s i m pac T
In general, these regions, also show high levels of innovation dynamics (Tödtling et al., 2011). Therefore, there is a strong relationship between organizational and institutio-nal thickness and innovation. We will use the term “thick RIS” to refer to an RIS that is highly innovative as well as organizationally and institutionally thick.
In contrast, organizationally and institutionally thin RISs are normally found in less urbanized regions, and are characterized by the strong presence of SMEs. They often have limited innovative capacity, lack support organizations and have a low level of agglomeration when compared to thick regions. We will call these RISs “thin RISs”.Empirical studies on the organizational and institutional thickness of a particular RIS are scarce. This is largely due to the difficulties of measuring most of the intangible elements that define institutional thickness. Studies are thus based on qualitative information collected in a specific location like Birmingham (Coulson & Ferrario, 2007) or Vienna and Salzburg (Tödtling & Trippl, 2005). Traditionally it has been assumed that firms located in institutionally thick regions would be more innovative and more engaged internationally. In this respect, we would expect firms located in institutionally thick regions to be more innovative and more engaged in international R&D flows (such as R&D offshoring or R&D collaboration) than firms located in more marginal or institutionally thin regions.
The exploratory analysis presented in this section is based on INGINEUS data. The dataset is described in detail at the end of this report. The INGINEUS dataset allows us to observe the relation between different types of regional institutional thickness of a selection of European, Chinese and Indian regions, and the degree of participa-tion in some global innovation networks (GIN). Although the INGINEUS data covers three industries, for this study we focused exclusively on the ICT industry. This focus helps eliminate potential misinterpretation of the results due to industrial differences rather than regional disparities.
Using data on R&D investments in the region, R&D output, patent activity and degree of specialization in the ICT industry, we classified all cases in the dataset as Tier 1, 2 or 3 (Chaminade and Plechero, forthcoming)24. We classified as Tier 1 those regions that are highly innovative (above average in R&D investment, R&D output, patent activity), highly specialized in the ICT industry (high number of educational facilities, firms and employment in the ICT industry) and with frequent interactions and a strong identity (they are considered as the most important ICT cluster in the country). These regions are the ones with the highest regional innovation dynamics. The following regions were classified as Tier 1: Stockholm in Sweden, Oslo & Akershus and Vestlandet in Norway, Tallin in Estonia, Bangalore in India and Beijing in China.
The regions classified as Tier 2 are those where the number of firms and employ-ment in the ICT industry is aligned with the average of the rest of the country, with some specialized supporting institutions, but with weaker interactions, culture and
24. A complete list of all sources of information used for the classification in Tiers can be found in Chaminade and Plechero (forthcoming). The list is available in Annex 2.

s w e di sh e n T r e p r e n e u r sh i p f oru m 41
shared norms and lower level of innovation dynamics. Examples in Sweden are the Scania region around Malmö and Lund and Gothenburg, in India Chennai, Hyderabad, Pune, New Delhi and Mumbai and in China Shenzhen. Even though these regions are performing well in terms of ICT, they are still below the large ICT specialization and institutional performance of Tier 1 regions.
Regions classified as Tier 3 are more marginal, with low innovative performance and infrastructure, low ICT specialization and weaker institutional settings. In general in these regions there is a lack of support organizations for the ICT industry compared to other domestic regions, as is the case for Trivandrum in India, Shanghai in China and Nord-Norge in Norway.
Table 4.2. classification of regions by tiers
Source: Chaminade and Plechero (forthcoming).
Main finding: it is firms located in regions that are not too strong or not too mar-ginal that engage more in global research collaboration and offshoring of R&D
Next we look at the differences by Tier, independently of whether the region is loca-ted in an emerging economy or a developed country. That is, we want to see if firms based in regions Tier 1 differ in terms of the geography of their networks from firms in Tier 2 or 3. Tables 4.3. and 4.4. depict the different degree of participation of those firms in global innovation activities in terms of global collaboration for innovation25 and global offshoring of innovation.26
25. We refer here to the collaboration for the most important innovation of the firms from 2006-2008.
26. We refer here to offshoring of innovation activities in a location outside the firm’s home country. Our definition encompasses both offshored innovation activities carried out within the boundaries of the firms, and those outsourced to independent parties. Such offshored activities may be aimed to increase sales in the home and/or in the global markets.
Tier 1 No. of fi rms Tier 2 No. of fi rms Tier 3 No. of fi rms
Stockholm 57 Göteborg 17 Nord- Norge 8
Oslo & Akershus
63 Skåne Region 16 Trivandrum 20
Vestlandet 12 New Delhi 76 Shanghai 35
Tallinn 14 Mumbai 70
Bangalore 50 Chennai 41
Beijing 147 Hyderabad 26
Pune 20
Shenzhen 35
Total 343 301 63
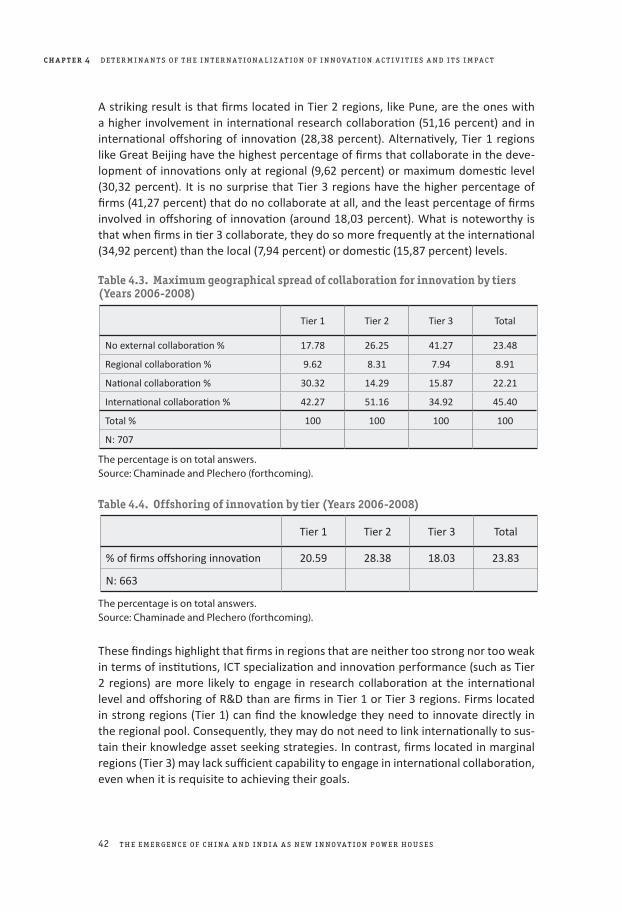
42 T h e e m e rge nc e of c h i na a n d i n di a a s n e w i n no vaT ion p o w e r house s
C H a p t e r 4 de T e r m i na n T s of T h e i n T e r naT iona l i z aT ion of i n no vaT ion ac T i v i T i e s a n d i T s i m pac T
A striking result is that firms located in Tier 2 regions, like Pune, are the ones with a higher involvement in international research collaboration (51,16 percent) and in international offshoring of innovation (28,38 percent). Alternatively, Tier 1 regions like Great Beijing have the highest percentage of firms that collaborate in the deve-lopment of innovations only at regional (9,62 percent) or maximum domestic level (30,32 percent). It is no surprise that Tier 3 regions have the higher percentage of firms (41,27 percent) that do no collaborate at all, and the least percentage of firms involved in offshoring of innovation (around 18,03 percent). What is noteworthy is that when firms in tier 3 collaborate, they do so more frequently at the international (34,92 percent) than the local (7,94 percent) or domestic (15,87 percent) levels.
Table 4.3. maximum geographical spread of collaboration for innovation by tiers (years 2006-2008)
The percentage is on total answers. Source: Chaminade and Plechero (forthcoming).
Table 4.4. offshoring of innovation by tier (years 2006-2008)
The percentage is on total answers. Source: Chaminade and Plechero (forthcoming).
These findings highlight that firms in regions that are neither too strong nor too weak in terms of institutions, ICT specialization and innovation performance (such as Tier 2 regions) are more likely to engage in research collaboration at the international level and offshoring of R&D than are firms in Tier 1 or Tier 3 regions. Firms located in strong regions (Tier 1) can find the knowledge they need to innovate directly in the regional pool. Consequently, they may do not need to link internationally to sus-tain their knowledge asset seeking strategies. In contrast, firms located in marginal regions (Tier 3) may lack sufficient capability to engage in international collaboration, even when it is requisite to achieving their goals.
Tier 1 Tier 2 Tier 3 Total
No external collaborati on % 17.78 26.25 41.27 23.48
Regional collaborati on % 9.62 8.31 7.94 8.91
Nati onal collaborati on % 30.32 14.29 15.87 22.21
Internati onal collaborati on % 42.27 51.16 34.92 45.40
Total % 100 100 100 100
N: 707
Tier 1 Tier 2 Tier 3 Total
% of fi rms off shoring innovati on 20.59 28.38 18.03 23.83
N: 663

s w e di sh e n T r e p r e n e u r sh i p f oru m 43
The fact that firms in Tier 2 regions (and eventually Tier 3) are the ones that engage more in international R&D flows suggests that internationalization of R&D and other innovation activities may be a compensatory mechanism. When the firm cannot find the knowledge resources needed to innovate locally, they may search for them inter-nationally. However, establishing a global or international network of R&D partners, or opening an R&D subsidiary abroad, requires a minimum level of technological capability that firms in marginal regions may not have.
We have emphasized that being located in a strong innovation system may reduce the propensity of a firm to engage in international or global innovation networks. That said, it is also true that international or global networks are often related to new to the world innovations (Plechero and Chaminade, 2013, Aslensen and Harirchi, 2013). Consequently, engaging in global research collaboration or global offshoring of innovation may itself play a critical role, facilitating the access to new knowledge that is required to move from new to the firm or new to the industry to new to the world. It is important to recognize this powerful vital ability by pointing out the complex myriad interactions between firm-level competences, industrial specialization and regions.
The astute reader should continually bear in mind that what we are capturing in the analysis is outbound networks, that is, how the firms that are located in a region engage in research collaboration or offshoring abroad. What we are not capturing are inbound flows. It is reasonable to think that strong regions also attract a higher proportion of R&D related investments than more marginal regions. Indeed, know-ledge accumulated in a certain region is one of the most important drivers for global research collaboration and offshoring of innovation (Chaminade and de Fuentes, 2012). In particular, the access to qualified human capital at a lower cost is indeed becoming an important driver for European and American firms that offshore innova-tion in China and India.
4.3. firm differences: the role of competences27
Micro characteristics such as size or the ownership structure of the firm (Calof, 1994; Dean et al., 2000; Fritch and Lukas, 2001; Kleiknetch and Van Reijnen 1992; Moen, 1999; Sousa et al., 2008; Vonortas, 1997) and firm level competences like the qualifi-cation of human resources, the prior international experience of managers, the edu-cational background and ethnicity of the CEO (Sousa et al., 2008; Nielsen and Nielsen, 2011) are considered as determinative factors of a firm’s international performance.
Competences influence both the access to international networks as well as the impact that internationalization may have on firm performance. For example, we know from the analysis of the impact of offshoring of R&D that it is not a sufficient
27. This section is largely based on Chaminade and de Fuentes (2012) and Plechero and Chaminade (2013).
44 T h e e m e rge nc e of c h i na a n d i n di a a s n e w i n no vaT ion p o w e r house s
C H a p t e r 4 de T e r m i na n T s of T h e i n T e r naT iona l i z aT ion of i n no vaT ion ac T i v i T i e s a n d i T s i m pac T
condition for the increase of knowledge and productivity at home (Castellani and Pieri, forthcoming). First, offshored labs need to be able to extract knowledge in foreign locations, requiring time and investments to establish relationships with actors in the host innovation system (Narula and Michel, 2009). Second, the firm must be able to manage reverse knowledge transfers (from the offshored labs back to the headquarters and the rest of the company), which may require the adoption of sophisticated mechanisms for the dissemination and integration of both explicit and tacit knowledge (Gupta and Govindarajan, 2000). In this regard, the large-scale offshoring of knowledge-intensive activities tends to be accompanied by an increa-sing specialization within the firm, which may reduce the ability to orchestrate the entire value chain, exacerbating the risk of ‘hollowing out’ the competencies of the offshoring firm. For example, as the firm becomes more reliant on its independent suppliers, it may not be able to keep pace with the evolving design and engineering technologies (Kotabe and Mudambi, 2009). More generally, the benefits from disag-gregation, reconfiguration, and dispersion of the firm may increase with corporate restructuring. Yet this may occur at a diminishing rate, as the overall costs of mana-ging greater complexity, disaggregation, dispersion, relocation, and coordination can escalate more quickly after a certain point.
Similar arguments can be used for global research collaboration. If internal capa-bilities are weak, the capacity to create, absorb and seek knowledge from external sources is limited (Dantas et al. 2007; Cohen and Levinthal, 1990). As a consequence, the ability to participate in different modes of globalization of innovation will also be reduced (Plechero and Chaminade, 2013). A variety of researchers concerned with the different competences that matter for internationalization of innovation activi-ties, particularly for research collaboration, highlight the role of human resources (Cohen and Levinthal, 1990) and how technological capacity is related to the innova-tion performance in global markets (Leonard-Barton, 1992; Prasad et al., 2001).
What these studies point out is that engaging in global research collaboration or offshoring of R&D and other innovation activities is very complex, at the firm level requiring a high level of organizational and technological capabilities. In the next section we explore which internal competences matter for the internationalization of innovation.
Main finding: Firm internal competences are significantly related to global research collaboration and offshoring of innovation
Regional institutions and sectorial specialization have an important role in sustain-ing the capability of firms to engage in global innovation networks. Such firms also need a certain level of in-house competences (skills, knowledge and technological capabilities).
Using both the VR database and the INGINEUS dataset, we have analysed which competences enable access to global innovation networks for firms located in

s w e di sh e n T r e p r e n e u r sh i p f oru m 45
Sweden, China and India.28 Table 4.5 summarizes the main results of Chaminade and de Fuentes (2012) and Plechero and Chaminade (2013).
Table 4.5. competences as enablers for different modes of globalization of innova-tion undertaken in china, india and sweden
* Significance levels: 1% *** (p<0.01); 5% ** (p<0.05); 10%* (p<0.10). Sources: synthetic results from Chaminade and de Fuentes (2012) Plechero and Chaminade (2013).
Intramural R&D impacts positively the probability to engage in global research collaboration in Sweden, China and India. There are, however, also interesting and important differences of such firms located in Sweden from those located in China and India, as Table 4.5. shows.
For firms located in Sweden, the qualification of human capital in terms of educa-tion, the percentage of human capital employed in R&D activities and the presence of intramural R&D activities29 are enablers for the engagement in global research collaboration (Chaminade and de Fuentes, 2012). For global offshoring of innovation through is cross-border investments in R&D, what matters more is whether the firm has advanced and stable production systems such as quality control, just in time, continuous improvement, quality circles, team work and internal manuals. This result confirms that coordination of R&D activities between R&D subsidiaries and the firm’s headquarters is normally a very complex process. It involves the strategic integration of both internal and external networks and therefore requires a range of advanced managerial and organizational competences (Chaminade and de Fuentes, 2012).
We note that what matters more for firms located in India and China for the engagement in global research collaboration are process related competences, like the degree of sophistication of machinery and equipment. The internal educational
28. The results presented here are based on Lv et al. (2013), Plechero and Chaminade (2013) and Chaminade and de Fuentes (2012).
29. Intramural R&D are defined in the Oslo manual as ‘creative work undertaken within the enterprise to increase the stock of knowledge and its use to devise new and improved products and processes’.
Competences as enablers
Global research collaborati on
Employees postgraduate degree (*) (Sweden)R&D employees (*) (number of full ti me equivalents employees) (Sweden)Intramural R&D (*) (Sweden, India, China)Degree of sophisti cati on of machinery and equipment (**) (India, China)
Global off shoring of innovati onAdvanced producti on systems (*) (such as just in ti me producti on, conti nuous improvement, quality circles, internal manual) (Sweden)

46 T h e e m e rge nc e of c h i na a n d i n di a a s n e w i n no vaT ion p o w e r house s
C H a p t e r 4 de T e r m i na n T s of T h e i n T e r naT iona l i z aT ion of i n no vaT ion ac T i v i T i e s a n d i T s i m pac T
level of human resources and the intramural R&D, very important for firms located in Sweden, play a minor role compared to the organizational and process-related type of competences (Plechero, 2012).
What these comparative results suggest is that Swedish firms are operating in the higher value-added, research intensive segment of the value-chain, while Chinese and Indian firms are in the lower segments30, at least when it comes to product inno-vation. This general distinction is confirmed by the firm interviews conducted on site in Pune and Beijing by two of the authors (Chaminade and Plechero). Although Indian firms are very innovative when it comes to process innovation and the introduction of new business models, in terms of their final product they tend to imitate the pro-duct portfolio of the leaders in the market from developed countries (Chaminade and De Fuentes, 2012; Plechero, 2012). Process and organizational competences are important tools that may allow firms located in India and China to gain key positions in global innovation networks. The power asymmetry in the global division of labour between firms from developed and emerging economies, as well as the higher degree of technological sophistication of firms, has until now allowed firms from developed countries to maintain a certain competitive advantage in the global market. The appropriation of the value generated in the network typically goes in the direction of those who are able to display the capability to efficiently coordinate the division of work and develop robust business models (Gereffi et al., 2005).
30. See Chaminade and Vang (2008) for a detailed description of on the role of India in the global software industry.

s w e di sh e n T r e p r e n e u r sh i p f oru m 47
5conclusions and policy implications31
Sweden is one of the countries with the highest engagement in global innovation networks in terms of research collaboration, sourcing of technology and offshoring of R&D in Europe (Chaminade et al., 2010). Firms (as well as universities) are very active internationally in terms of their research and innovation activities.
Given that profile, it is no surprise that Swedish firms and policymakers are more sensitive to changes in the global geography of innovation activities. This report has sought to lay bare this building block, showing the global trends in offshoring of R&D and research collaboration, and revealing the dual role of China and India as main destinations for R&D offshoring globally while simultaneously playing a growing role as the origin of investments.
The patterns of R&D offshoring as well as research collaboration of Swedish firms reflect the general global trends. While most of the international innovation activities of Swedish firms continue to take place within Europe and the USA, they are also actively engaged in innovation activities with China and India. This growing invol-vement in China and India extends beyond the large enterprises that dominate the Swedish innovation system, including small and medium size enterprises. In Sweden about 10 percent of the innovative firms that engage in collaboration for innovation, do so with Chinese or Indian partners. These firms represent one-fifth of all Swedish firms engaged in collaboration for innovation. It is remarkable that these figures are still pretty high among small firms: 16 percent of innovative firms with less than 50 employees that engaged in collaboration for innovation have at least one partner from China or India.
31. By Cristina Chaminade and Davide Castellani.

48 T h e e m e rge nc e of c h i na a n d i n di a a s n e w i n no vaT ion p o w e r house s
C H a p t e r 5 conc lusions a n d p ol ic y i m p l ic aT ions
A second building block of this report has been to try and answer what is the impact of such internationalization of innovation activities – being offshoring of R&D or research collaboration. We provide evidence that R&D offshoring is still a relatively limited phenomenon. In other words, the bulk of R&D is still carried out in the home countries of multinational companies, but the share of R&D offshored to advanced and (increasingly) to emerging countries is non-negligible and it is increasing rapidly. In general, we find that offshoring regions have a higher productivity growth than non-offshoring regions, but the gains from offshoring decrease when the extent of this process exceeds some threshold level. Interestingly enough, the extent of off-shoring of R&D is positively associated with the home region productivity growth, regardless of whether offshoring occurs within Europe or towards other emerging or advanced countries. Probably, this has to do with the fact that R&D offshoring has still not reached the threshold level.
Although more research is needed to understand and separate the channels underlying the positive relation between R&D offshoring and productivity growth at home, our study sends a reassuring message to Swedish policymakers. It supports the idea that carrying out R&D abroad –on average– is associated with strengthening rather than ‘hollowing out’ of European sources of competitiveness. From this point of view, governments should not discourage offshoring (of R&D in particular). To the contrary, they should implement policies that allow firms to engage in global R&D projects, gaining access to complementary assets and technologies unavailable in their home economies, as well as to qualified research staff.
The positive association between offshoring and productivity growth in the home regions is particularly strong in the case of R&D offshoring toward the South-East Asian countries. The only exception is R&D offshoring towards India, which is nega-tively associated with productivity growth. We posit that the positive results for South-East Asian countries and negative for India may be explained by a combination of destination country characteristics and the sectorial composition of the offshored R&D activities. As a matter of fact, one should note that in South-East Asia the largest share of investments tend to be heavily concentrated in high-tech manufacturing sec-tors, whereas in India they are in knowledge-intensive services, especially software, business, financial and bank services. In terms of the policy implications, policy action towards internationalization of innovation activities should recognize the importance of differences across industrial sectors. While the internationalization of R&D and other innovation activities related to manufacturing may have a positive impact in terms of productivity growth of the home country, the implications of offshoring of R&D related to knowledge intensive services can be more problematic.
Orchestrating the value chain in such knowledge-intensive services may be more complex than in the case of the manufacturing industry, especially when such value chain is not linear, as in many manufacturing industries. The inherent difficulty of that process could explain why offshoring of R&D and global research collaboration is associated with high technological and organizational firm-based competen-ces. Globalizing innovation activities may produce positive gains, but orchestrating
s w e di sh e n T r e p r e n e u r sh i p f oru m 49
geographically distant innovation processes is a costly and complex process, and not all firms have the required capabilities to engage in global innovation networks, either in the form of offshoring of R&D or research collaboration. On the other hand, the relatively lower organizational problems in high-tech manufacturing and the concentration of cutting edge technologies developed in South-East Asian countries, contribute to a soundly positive association of offshoring R&D in this area with the productivity growth of EU regions. Taking this background of factors into account, policy makers should consider the possibility of directly supporting the develop-ment of management techniques for international business and cross-cultural communication (Borrás, 2011).
These types of direct interventions for the development of competences related to managing the internationalization process may be particularly relevant for SMEs (Achtenhagen 2011). Our report confirms that globalization of innovation is no longer a phenomenon exclusive to large firms. Since SMEs tend to be more embedded in the regional innovation systems, they may serve as pipelines that mediate between global and local knowledge networks. Policy makers need to recognize this emerging state of affairs, and begin to articulate policies targeting the specific needs of small and medium size enterprises. This awareness of the critical role of such meta-networks is particularly important, for example, in Sweden in regards to developing policies sensitive to and supporting firms that are very internationalized since their inception (the so-called born-global firms). Specific efforts should be made to under-standing how SMEs use the knowledge acquired through international networks in their innovation processes, and how they combine it with local knowledge sources.
Still related to competences, this reports shows that strong technological com-petences are positively related to offshoring of R&D and research collaboration. General policies supporting the development of technological capabilities continue to be paramount. Benefiting from international innovation networks is contingent on having sufficient absorptive capacity to locate and integrate relevant knowledge into innovation processes. Internationalization of innovation should not be seen as diminishing the importance of investing in technological capabilities at home. In this new state of affairs it is rather the opposite that is true.
Last, the exploratory analysis presented in this report shows that offshoring of R&D and global research collaboration may be the only option to access critical knowledge needed to innovate for firms located in regions that lack a strong orga-nizational infrastructure (critical mass of R&D labs, specialized firms in the industry, universities) and networks. Firms in these marginal regions may need extra effort to internationalize their innovation activities, both in terms of absorptive capacity and international, but also domestic and local, linkages. Policy makers, in addition to providing direct support in the form of training in international business and cross cultural communication, may support firms in these regions by creating incentives for sustained general networking and the presence of foreign MNCs. Unfortunately, with the data currently available we are not yet able to pinpoint which institutions influence more or less on the capacity of firms to engage in international innovation

50 T h e e m e rge nc e of c h i na a n d i n di a a s n e w i n no vaT ion p o w e r house s
C H a p t e r 5 conc lusions a n d p ol ic y i m p l ic aT ions
networks which could provide policy makers with a more nuanced understanding of how to support internationalization in firms located in more marginal regions.
Finally, efforts should be made at the policy level to regularly measure the degree of internationalization of innovation activities and its impact. It is particularly critical to understand how and why Swedish small and medium size enterprises use their collaborative networks with Chinese and Indian partners for innovation, and to monitor changes over time. It is also paramount to continue monitoring changes in the global geography of innovation. The analysis of the more recent data on offsho-ring of R&D activities, shows a decline in the number of projects going to China and India. Whether this trend is a structural change or rather an ad-hoc response to the contemporary crises remains to be studied.

s w e di sh e n T r e p r e n e u r sh i p f oru m 51
6data bases used in the report
The fDi Markets is an online database maintained by fDi Intelligence, a specialist divi-sion of The Financial Times Ltd. that monitors cross-border Greenfield investments covering all sectors and countries worldwide.32 This resource documented 60,301 worldwide Greenfield investments projects that appeared in publicly available infor-mation in the period 2003-2008. For each project, fDi Markets reports information on the investment, such as the industry and main business activity,33 the location where the investment takes place (host country, regions and cities), as well as the name and location of the investing company (home). The database is routinely used as the data source in UNCTAD’s World Investment Report and in publications by the Economist Intelligence Unit.
32. A team of in-house analysts search daily for investment projects from various publicly available information sources, including, Financial Times newswires, nearly 9,000 media, over 1,000 industry organizations and investment agencies, data purchased from market research and publication companies. Each project identified is cross-referenced against multiple sources, and over 90 percent of projects are validated with company sources. A useful resource is http://fdimarkets.com/. Unfortunately, no information is provided on mergers and acquisitions.
33. fDi Markets classifies each project into one of 18 business activities, from sales/marketing (the largest category) to business services, manufacturing, logistics, testing and extraction, research and development (R&D), design, development and testing (DDT), headquarters and other activities. We focus on projects in R&D, but we compare results with investment projects in other value-added activities. In particular, we use projects in manufacturing activities as our main benchmark.
52 T h e e m e rge nc e of c h i na a n d i n di a a s n e w i n no vaT ion p o w e r house s
C H a p t e r 6 daTa b a se s usi d i n T h e r e p or T
The INGINEUS database contains firm level data in three sectors (ICT, Automotive, Agro processing) collected through a 2009 survey covering 9 countries: Brazil, India, China, South Africa, Norway, Sweden, Germany, Estonia and Denmark. The database contains information on the main production activities of the firm, firm size, market, sales information and R&D activity. 1,215 responses were collected from all industries and countries, with the combined sample dominated by ICT responses (936 in total). The core of the questionnaire focuses on the types of innovation, the geographic network and collaborations with customers, suppliers, universities, research institu-tions, government etc., the offshoring of production and innovation and the role of the institutional framework (mainly at national and international level) supporting or hampering the access to Global Innovation Networks.
The VR database contains firm level data in three sectors (automotive component, green-biotech and software) collected in a 2008 survey in Pune (India) and Beijing (China). We used the same questionnaire for both regions and sectors so as to ensure the complete comparability of the results. The database contains information about firms’ structural characteristics (i.e. size, age), their innovation activities, interna-tionalization strategies, competences and local-global linkages. In total, 1087 ques-tionnaires were collected. The dataset has been used to explore different internal and external factors of the firms leading to different degrees of innovation of firms in developing countries. The primary interest is in their networks of collaboration and sourcing in different geographical levels, and the variety of forms of globalization of innovation the firms in these two specific regions have been involved in. It can be used to explore and pursue comparative analysis of how firms in these regions behave in terms of innovation and internationalization.

s w e di sh e n T r e p r e n e u r sh i p f oru m 53
acknowledgementsThe research leading to some of the results presented in this report has received funding from the European Union’s Seventh Framework Programme [FP7/2007-2013] under grant agreement no. 225368 (INGINEUS, Impact of Networks, Globalisation, and their Interaction with EU Strategies). The authors alone are responsible for its contents, which do not necessarily reflect the views or opinions of the European Commission. The European Commission is not responsible for any use that might be made of the information appearing herein. Additional financial support for this research came from the Swedish Research Council (Linnaeus Grant No. 349200680).
about the authorsCristina Chaminade is a full professor in Innovation Studies at Lund University. She holds a doctoral degree in Economics from the Autonomous University of Madrid. She is one of the leading experts in globalization of innovation, particularly in global innovation networks and innovation in emerging economies. She has actively worked on innovation in developing countries such as China, India, South Africa, Thailand, and Brazil for over 15 years. She’s been an advisor to international organizations such as the European Commission, UNCTAD, OECD and UN-ECLAC. She has published in international journals, refereed books and handbooks in the fields of innovation, development studies and knowledge management such as Research Policy, Industry and Innovation, Innovation and Development and European Planning Studies. She is one of the editors of the Handbook of Innovation Systems in Developing Countries, published by Edward Elgar in 2009. Currently she is coordinating two research pro-jects dealing with globalization of innovation, the first on emerging multinationals in Europe, and the second on regional variety and global innovation networks, funded by Riksbanken and the Wallenberg foundation respectively.
Davide Castellani is Professor of Applied Economics at the University of Perugia and a Research Fellow of Centro Studi Luca d’Agliano, CIRCLE and IWH. He holds a PhD from the University of Ancona (Italy) and a MSc from Universitat Pompeu Fabra (Barcelona, Spain). His research focuses on the determinants of the internationaliza-tion of firms and its effects on international technology transfer and firms’ econo-mics performances. These include the location choice of multinational firms and the effects of foreign investments on productivity in the home and host countries. His works have been published in international journals including, Cambridge Journal of Economics, Journal of Economic Behaviour and Organization, Journal of International Business Studies, Journal of International Economics, Oxford Economic Papers, Research Policy, The Review of World Economics/Welwirtshaftliches Archiv and The

54 T h e e m e rge nc e of c h i na a n d i n di a a s n e w i n no vaT ion p o w e r house s
r e f e r e nc e s
World Economy. He is the author (with A. Zanfei) of a book on “Multinational Firms, Innovation and Productivity”, published by Edward Elgar in 2006.
Monica Plechero earned her Ph.D. in economic geography from CIRCLE and the Department of Human Geography, Lund University in 2012. She is currently visiting the Institute of Research on Population and Social Policy at Italian National Research Council (CNR) in Rome. Her main research topic concerns global innovation networks and different forms of globalization of innovation in emerging economies. Monica’s recent research is focused on how Chinese and Indian firms are upgrading their innovation capabilities to go international, and how regional and global linkages are effecting firms’ capability to compete in the global market. She has recently been involved in several projects on globalization of innovation with partners in Europe, China, India and South Africa.
referencesBooksActenhagen, L., 2011. Internationalization competence of SMEs, Research Report,
published by Swedish Entrepreneurship Forum.Amin, A. and Thrift, N., 1994. Globalization, Institutions, and Regional Development
in Europe, Eds. Oxford University Press: Oxford, 1-19.Asheim, B.T. and Gertler, M. S., 2005. The Geography of Innovation: Regional
Innovation Systems. In Fagerberg, J., Mowery, D. and Nelson, R. (eds.), The Oxford Handbook of Innovation. Oxford University Press: Oxford, 291-317.
Castellani, D. and Zanfei, A., 2006. Multinational firms, innovation and productivity. Edward Elgar: Cheltenham.
OECD, 2011. Science and Industry Scoreboard. Paris: OCED. Plechero, M. 2012. The changing geography of innovation. Chinese and Indian
regions and the global flows of innovation. PhD dissertation. Lund University Press.
ProInno Europe, 2007. The implications of R&D offshoring on the innovation capacity of EU firms. Tech. rep., Helsinki School of Economics & LTT.
UNCTAD, 2006. Globalization of R&D and developing countries. Proceedings of the Expert Meeting, 24-26 January 2005. United Nations, Geneva.
JournalsAltenburg, T., Schmitz, H., Stamm, A. 2008. Breakthrough? China’s and India’s
Transition from Production to Innovation. World Development, 36(2), 325-344.

s w e di sh e n T r e p r e n e u r sh i p f oru m 55
Amighini, A., Sanfilippo, M., Rabellotti, R. 2010. The rise of multinationals from emerging countries: A review of the literature. Working Papers Prin 004, Dipartimento Scienze Economiche, University of Bologna.
Amin, A., Cohendet, P. 2005. Geographies of Knowledge Formation in Firms. Industry and Innovation, 12, 465-486.
Arora, A., Arunachalam, V. S., Asundi, J., Fernandes, R. 2001. The Indian Software Industry. Research Policy, 30, 1267-1287.
Asheim, B., Coenen, L., Vang, J. 2007. Face-to-face, buzz, and knowledge bases: soci-ospatial implications for learning, innovation, and innovation policy. Environment and Planning C: Government and Policy, 25, 655 – 670.
Asheim, B.,T., Moodysson, J., Tödtling, F., 2011. Constructing Regional Advantage: Towards State-of-the-Art Regional Innovation System Policies in Europe? European Planning Studies, 19 (7), 1133-1139.
Aslesen, H.W. and Harirchi, G. 2013. The effect of local and global linkages on the innovativeness among ICT SMEs: Does location specific context matter? CIRCLE Electronic Working Papers, forthcoming.
Audretsch, D.B., Feldman, M.P. 1996. R&D spillovers and the geography of innova-tion and production. The American Economic Review, 86, 630-640.
Barba Navaretti, G., Castellani, D., Disdier, A.-C., 2010. How does investing in cheap labour countries affect performance at home? France and Italy. Oxford Economic Papers. 62 (2), 234–260.
Bardhan, A., 2006. Managing globalization of R&D: Organizing for offshoring innovation. Human Systems Management 25 (2), 103–114.
Battelle (2012) 2013 Global R&D Funding Forecast. http://battelle.org/docs/r-d-funding-forecast/2013_r_d_funding_forecast.pdf?sfvrsn=0. Accessed in December 2013.
Borrás, S. 2011. INGINEUS final policy brief. www.ingineus-eu.org. Bruche, G., 2009. The Emergence of China and India as New Competitors in MNCs
Innovation Networks. Competition & Change, 13, 267-288.Cantwell, J. A., Mudambi, R., 2005. MNE competence-creating subsidiary mandates.
Strategic Management Journal 26 (12), 1087–1181.Cantwell, J., Piscitello, L. 2005. Recent Location of Foreign-owned Research and
Development Activities by Large Multinational Corporations in the European Regions: The Role of Spillovers and Externalities. Regional Studies, 39, 1-16.
Castellacci, F., Archibugi, D. 2008. The technology clubs: The distribution of know-ledge across nations. Research Policy, 37, 1659-1673.
Castellani, D., Pieri, F., (2013) R&D offshoring and the productivity growth of European regions. Research Policy, 42 (9), 1581–1594.
Castelli, C., Castellani, D., 2013. The internationalisation of R&D: sectoral and geographic patterns of cross-border investments, Economia e Politica Industriale/Journal of Industrial and Business Economics, 1, 127-143.
Chaminade, C., 2009. On the concept of Global Innovation Networks. CIRCLE Electronic Working Paper 2009/05.
56 T h e e m e rge nc e of c h i na a n d i n di a a s n e w i n no vaT ion p o w e r house s
r e f e r e nc e s
Chaminade, C., 2011. Are Knowledge Bases Enough? A Comparative Study of the Geography of Knowledge Sources in China (Great Beijing) and India (Pune). European Planning Studies, 19 (7), 1357-1373.
Chaminade, C., 2012. Regiones competitivas en una economía global: análisis de los vínculos entre variedad regional y modos de inserción en redes globales de innovación [Competitive regions in a global economy: exploring the links between regional variety and modes of globalization of innovation]. Información Comercial Española, 869, 133-148.
Chaminade, C., de Fuentes, C., 2012. Competences as drivers and enablers of globalization of innovation: Swedish ICT industry and emerging economies, Innovation and Development, 2 (2), 209-229.
Chaminade, C. de Fuentes, C., 2013. Who are the world leaders in innovation? CIRCLE Electronic Working Papers.
Chaminade, C., Plechero, M., 2014. Do Regions Make a Difference? Regional Innovation Systems and Global Innovation Networks in the ICT Industry. European Planning Studies. Preprint available as Circle Electronic Working Papers 2013/32.
Chaminade, C., Vang, J., 2008. Globalisation of knowledge production and regional innovation policy: Supporting specialized hubs in the Bangalore software industry. Research Policy, 37, 1684-1696.
Chaminade, C., Zabala J.M. Treccani, A., 2010. The Swedish national innovation system and its relevance for the emergence of global innovation networks. CIRCLE Electronic Working Papers 2010/09.
Cooke, P., 2001. Regional Innovation Systems, Clusters and the Knowledge Economy. Industrial and Corporate Change, 10 (4), 945–74.
Criscuolo, P., 2009. Inter-firm reverse technology transfer: the home country effect of R&D internationalization. Industrial and Corporate Change, 18 (5), 869–899.
D’Agostino, L., Laursen, K., Santangelo, G., 2012. The impact of R&D off- shoring on the home knowledge production of OECD investing regions. Journal of Economic Geography, 13 (1), 145–175.
Dickens, P. (2007). Global Shifts: mapping the changing contours of the world economy (5th Edition ed.). New York: Guilford.
Dunning, J. H., Lundan, S. M., 2009. The internationalization of corporate R&D: A review of the evidence and some policy implications for home countries. Review of Policy Research, 26 (1-2), 13–33.
Ernst, D. 2010. Upgrading through innovation in a small network economy: insights from Taiwan’s IT industry. Economics of innovation and new technology, 19, 295-324.
Gereffi, G., Humphrey, J., Sturgeon, T., 2005. The governance of global value chains. Review of International Political Economy, 12 (1), 78–104.
Gertler, M. (2008). Buzz Without Being There? Communities of Practice in Context. Community, Economic Creativity, and Organization, 1, 203-227.

s w e di sh e n T r e p r e n e u r sh i p f oru m 57
Grimpe, C., Kaiser, U., 2010. Balancing internal and external knowledge acqui- sition: The gains and pains from R&D outsourcing. Journal of Management Studies 47 (8), 1483–1509.
Gupta, A., Govindarajan, V., 2000. Knowledge flows within multinational corpora-tions. Strategic Management Journal, 21, 473–496.
Kemeny, T. 2011. Are international technology gaps growing or shrinking in the age of globalization? Journal of Economic Geography, 11, 1-35.
Kirkegaard, J. F., 2005. Outsourcing and offshoring: Pushing the European model over the hill, rather than off the cliff! WP 05-1, Institute for International Economics, Washington D.C.
Kotabe, M., Mudambi, R., 2009. Global sourcing and value creation: Opportunities and challenges. Journal of International Management 15 (2), 121–242.
Laestadius, S. (1998). Technology level, knowledge formation and industrial competence in paper manufacturing. Microfoundations of economic growth. A Schumpeterian perspective, The University of Michigan Press, Ann Arbor, 212-226.
Lieberman, J., 2004. Offshore outsourcing and America’s competitive edge: losing out in the high technology R&D and services sectors. White Paper by Office of Senator Lieberman, Washington D.C.
Liu, J., Chaminade, C., Asheim, B. (2013) The geography and governance of global innovation networks. European Planning Studies. 21(9), 1456-1473.
Lv. P., Plechero M., Basant R., 2013. International Competitive Strategy Choices: Comparing Firms in China and India. Asian Pacific Business Review, 19 (4), 542-558.
Mariani, M. 2002. Next to Production or to Technological Clusters? The Economics and Management of R&D Location. Journal of Management and Governance, 6, 131-152.
Martin, R., Moodysson J., 2013. Comparing knowledge bases: On the geography and organization of knowledge sourcing in the regional innovation system of Scania, Sweden. European Urban and Regional Studies, 20 (2), 170-187.
Moodysson, J. 2008. Principles and Practices of Knowledge Creation: On the Organization of” Buzz” and” Pipelines” in Life Science Communities. Economic Geography, 84, 449-469.
Moodysson, J., Coenen L., Asheim B., 2008. Explaining spatial patterns of innova-tion: analytical and synthetic modes of knowledge creation in the Medicon Valley life-science cluster. Environment and Planning, 40, 1040 - 1056.
Mudambi, R., Venzin, M., 2010. The strategic nexus of offshoring and outsourcing decisions. Journal of Management Studies ,47 (8), 1510–1533.
Narula, R., Michel, J., 2009. Reverse knowledge transfer and its implications for European policy. UNU-MERIT Working Paper Series 035, United Nations University.
Nieto, M. J., Rodriguez, A., 2011. Offshoring of R&D: Looking abroad to improve innovation performance. Journal of International Business Studies, 42, 345-361.

58 T h e e m e rge nc e of c h i na a n d i n di a a s n e w i n no vaT ion p o w e r house s
r e f e r e nc e s
Parthasarathy, B., Aoyama, Y. 2006. From software services to R&D services: Local entrepreneurship in the software industry in Bangalore, India. Environment and Planning A, 38, 1269-1285.
Pavitt, K. 1984. Sectorial patterns of technical change: Towards a taxonomy and a theory. Research Policy, 13, 343-373.
Plechero, M., Chaminade, C., 2013. The influence of micro-characteristics in dif-ferent modes of globalization of innovation: A comparative study of Indian (Pune) and Chinese (Beijing) firms. Industry and Innovation 20 (7), 661-682.
Plechero, M., 2010. Effect of geographical proximity and technological capabilities on the degree of novelty in emerging economies. CIRCLE Electronic Working Paper 2010/12.
Ramamurti, R., Singh, J., 2009. Emerging multinationals in emerging markets. Cambridge, UK: Cambridge University Press.
Saliola, F., Zanfei A., 2009. Multinational firms, global value chains and the organiza-tion of knowledge transfer, Research Policy, 38, 369–381.
Saxenian, A. L. (2001). Bangalore: The Silicon Valley of Asia? SCID Working Paper 91, Stanford Center for International Development.
Tödtling, F., Trippl, M., 2005. One size fits all?: Towards a differentiated regional innovation policy approach. Research Policy, 34, 1203-1219.
Tödtling, F., Lengauer, L., Höglinger, C., 2011. Knowledge Sourcing and Innovation in “Thick” and “Thin” Regional Innovation Systems—Comparing ICT Firms in Two Austrian Regions. European Planning Studies, 19, 1245-1276.
Yeung, H. W. 2007. From followers to market leaders: Asian electronics firms in the global economy. Asia Pacific Viewpoint, 48, 1-25.
Zanfei, A., 2000. Transnational firms and the changing organisation of innovative activities. Cambridge Journal of Economics 24 (5), 515–42.

s w e di sh e n T r e p r e n e u r sh i p f oru m 59
annex 1. methodological annex for the analysis of the impact of offshoring of r&d (section 3.1)
Data sourcesWe exploit an original database compiled by recovering data from different sources. Data refer to European regions at the NUTS 2 level . This level of analysis has been chosen for three main reasons. First, it allows us to take into account within-country heterogeneity (in terms of labour productivity, R&D investments abroad and other observed and unobserved characteristics); second, it defines comparable units across different countries; third, more information is available about regional characteristics at this level of disaggregation.
Labour ProductivityThe dependent variable is labour productivity growth, which has been computed as the ratio of the regional gross value added (at basic prices in millions of euro), obtained from the EU Regional Database by Eurostat , and employment (thousands of employees) in the region, obtained from the European Regional Database by Cambridge Econometrics (release 2006). Value added has been deflated using nation-wide indexes, available in the Growth and Productivity Accounts database developed by EU KLEMS (releases 2008 and 2009). The last year for which information on value added are available in Eurostat’s EU Regional database is 2006.
Measures of offshoringMeasures of offshoring have been recovered from fDi Markets (see the Data Appendix for more information on this data source). One of the limitations of the fDi Markets database is that it collects planned future greenfield investments. Some of these pro-jects may not actually be realized or may be realized in a different form from the one originally announced. However, the database is regularly updated and uncompleted projects are deleted from the database. In this regard, data on the projects for the early years of the series should be more reliable than data for more recent years. We tackle this issue by discarding the last two years of data, and using information from the period 2003 to 2006. Our measure of offshoring is then built as the number of outward investment projects from each region in each of these years. We have also built measures of inward investments at the regional level, to control for the fact that regions engaged in outward internationalization may also be those attracting more foreign multinationals; and measures of R&D vs. manufacturing offshoring, among the latter distinguished offshoring of R&D by geo-economic area. Table 3.1 provides the mean, as well different percentiles of the distribution of these variables. The variable INW denotes the number of inward investment in a region-year, while OFF measures the number of offshoring projects from each region-year. The suffix MAN and RD denote the number of projects in manufacturing activities and in R&D, respectively. The apices denote R&D investments by geo-economic areas.
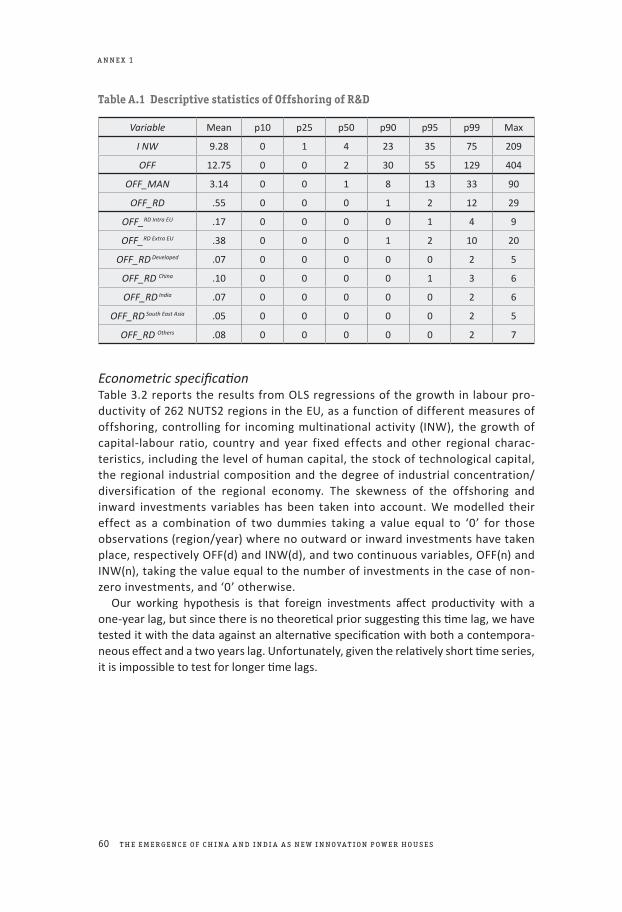
60 T h e e m e rge nc e of c h i na a n d i n di a a s n e w i n no vaT ion p o w e r house s
a n n e x 1
Table a.1 descriptive statistics of offshoring of r&d
Econometric specificationTable 3.2 reports the results from OLS regressions of the growth in labour pro-ductivity of 262 NUTS2 regions in the EU, as a function of different measures of offshoring, controlling for incoming multinational activity (INW), the growth of capital-labour ratio, country and year fixed effects and other regional charac-teristics, including the level of human capital, the stock of technological capital, the regional industrial composition and the degree of industrial concentration/diversification of the regional economy. The skewness of the offshoring and inward investments variables has been taken into account. We modelled their effect as a combination of two dummies taking a value equal to ‘0’ for those observations (region/year) where no outward or inward investments have taken place, respectively OFF(d) and INW(d), and two continuous variables, OFF(n) and INW(n), taking the value equal to the number of investments in the case of non-zero investments, and ‘0’ otherwise.
Our working hypothesis is that foreign investments affect productivity with a one-year lag, but since there is no theoretical prior suggesting this time lag, we have tested it with the data against an alternative specification with both a contempora-neous effect and a two years lag. Unfortunately, given the relatively short time series, it is impossible to test for longer time lags.
Variable Mean p10 p25 p50 p90 p95 p99 Max
I NW 9.28 0 1 4 23 35 75 209
OFF 12.75 0 0 2 30 55 129 404
OFF_MAN 3.14 0 0 1 8 13 33 90
OFF_RD .55 0 0 0 1 2 12 29
OFF_RD Intra EU .17 0 0 0 0 1 4 9
OFF_RD Extra EU .38 0 0 0 1 2 10 20
OFF_RD Developed .07 0 0 0 0 0 2 5
OFF_RD China .10 0 0 0 0 1 3 6
OFF_RD India .07 0 0 0 0 0 2 6
OFF_RD South East Asia .05 0 0 0 0 0 2 5
OFF_RD Others .08 0 0 0 0 0 2 7

s w e di sh e n T r e p r e n e u r sh i p f oru m 61
Table a.2 The effect of r&d offshoring on the productivity growth of eu regions
Dependent variable ∆yij,t ∆yij,t ∆yij,t ∆yij,t
Variable (1) -2.2 (2) 3.5 (3) 5.6 (4) 5.7
(OLS) (OLS) (OLS) (OLS)
OFF (d)t−10.0061** 0.0059** 0.0063** 0.0061**
(0.0025) (0.0025) (0.0025) (0.0025)
OFF (n)t−1-0.0001*** -0.0002*** -0.0002*** -0.0002***
(0.0000) (0.0001) (0.0001) (0.0001)
OFF_MAN (n)t−10.0002
(0.0002)
OFF_RD (n)t−10.0013**
(0.0005)
OFF_RDINTRA-EU (n)t−10.0019
(0.0020)
OFF_RDDEVELOPED (n)t−10.0022
(0.0026)
OFF_RDCHINA (n)t−10.0027
(0.0019)
OFF_RDINDIA (n)t−1-0.0067***
(0.0026)
OFF_RDSOUTH-EAST ASIA (n)t−10.0051***
(0.0015)
OFF_RDOTHERS (n)t−1 0.0008
(0.0020)
INW (d)t−1-0.0055** -0.0057** -0.0055** -0.0057**
(0.0024) (0.0024) (0.0024) (0.0024)
INW (n)t−10.0003** 0.0003*** 0.0003*** 0.0003***
(0.0001) (0.0001) (0.0001) (0.0001)
∆kl 0.2386*** 0.2392*** 0.2393*** 0.2392***
(0.0837) (0.0838) (0.0838) (0.0838)
Regional controls Yes Yes Yes Yes
Country dummies Yes Yes Yes Yes
Year dummies Yes Yes Yes Yes
Log-likelihood 1710 1710 1711 1710
Observati ons 760 760 760 760
Regions 262 262 262 262

62 T h e e m e rge nc e of c h i na a n d i n di a a s n e w i n no vaT ion p o w e r house s
a n n e x 1
In column (1) we find that offshoring regions have a higher productivity growth relative to non-offshoring regions (OFF(d)), but the effect of offshoring is slightly diminishing in the number of investments (OFF(n)). On the contrary, regions attrac-ting multinationals have a lower productivity growth (INW(d)), but a higher number of incoming multinationals is associated with higher productivity growth (INW(n)). Our specification allows computing the threshold number of offshoring investments where the overall effect becomes negative. In particular, taking the partial derivative of labour productivity growth with respect to OFF(d), we obtain:
so the effect of offshoring will be positive as long as
Taking specification (2) as a reference, with = 0.0061 and = -0.0001, the marginal effect of offshoring would be positive for a number of outgoing projects smaller or equal to .

s w e di sh e n T r e p r e n e u r sh i p f oru m 63
annex 2. sources of data and variables used for the analysis of regional differences (section 4.2)Table a.3. information and references related to the type of ris tier in the different regions
Tier 1 RIS Some informati onMain references for the in-formati on collected on RIS
quality and ICT clusters
TallinICT employees at the regional level make up 60-70% of the ICT
employees in the whole country.Kalvet (2004)
Oslo & Akershus
Vestlandet
Around Oslo there are 3 ICT clusters. About 60% of ICT compa-nies in the whole country. are located there. This area accounts for approximately 45,000 employees in this industry (ICT provi-
des 7.55% of total employment).Vestlandet is considered to be in the vanguard in the EU for ICT industry, growth and GDP, with a high level of regional innova-
ti on performance, in parti cular for the enablers
RIS scoreboard (2009)Transform (2006)
Hansen & Serin (2010) Rekene project report
(2011)
StockholmThe Stockholm area employs around 100,000 people in the ICT industry (ICT provides 9.86% of total employment) and is consi-
dered a leading region in the EU.
RIS (2009)Transform (2006)
Hansen & Serin (2010)
Beijing
A leading region in China in terms of both its research infrastruc-ture and innovati on performance, with a specializati on in high
tech industries. More than 8,129 soft ware fi rms are located there.
China Economic Census (2008)
Guan et al. (2009)
Bangalore
RIS World leader in ICT (mainly soft ware).In Karnataka state where Bangalore is located, there are around 554,000 employees in the soft ware industry (2009). Soft ware ex-ports were above 17 billion US$ (34% of total in India) in 2008/9.
Malik and Ilavarasan (2011) Ptak and Bagch
Tier2 RIS Sources
The Skåne region
Göteborg
The Skåne region employs around 23,000 people in the ICT industry.
The ICT industry in Göteborg grew recently with Ericsson and Volvo IT driving innovati on. There are around 4,700 ICT compa-
nies with 22,000 employees.
Hansen & Serin (2010)Franzén & Wallgren (2010)
SchenzhenAround 3,000 ICT manufacturing fi rms, high concentrati on of ICT
fi rms in the cluster, but less technological interacti onWang et al. (2010)
Hyderabad; Chennai; Mumbai;
Pune; New Delhi
All these regions are increasing their role in the ICT industry and developing services and infrastructure supporti ng the industry
in the RIS. The RISs of Mumbai, Pune, New Delhi and Hyderabad are becoming stronger.
In Pune the ICT industry is increasing. In this region there are 200,000 employees in the ICT industry, with soft ware exports
earning around 3.5 billion US$.Hyderabad’s ICT export is esti mated to be around 4.7 billion US$
Chennai’s soft ware export is esti mated around 3.8 billion US$
Ptak and Bagchi-Sen (2011)Malik and Ilavarasan (2011)
MCCIA (2008)Grondeau (2007)
OECD (2010)
Tier3 RIS
Shanghai
Shanghai plays a key role in heavy industry and fi nancial services, but is sti ll not internati onally competi ti ve in the high tech indu-stry. The insti tuti ons and quality of innovati on systems for the
ICT industry in this region are thus sti ll marginal with respect to other parts of the country. Due to the recent rapid development,
Shanghai has greater urban problems (inequality of resources, social problems, lack of adequate infrastructure) in comparison
to other regions where an ICT cluster is present
Abelson (1999) Yang, (2002)
Trivandrum Trivandrum’s export of ICT is less than 1 billion US$ Malik and Ilavarasan (2011)
Nord-NorgeThis is considered a potenti al region in terms of ICT, but the
innovati on acti viti es and innovati on output of fi rms in this region are sti ll at a fairly low level.
RIS (2009)Transform (2006)

64 T h e e m e rge nc e of c h i na a n d i n di a a s n e w i n no vaT ion p o w e r house s
a n n e x 2
Table a.4. list of indicators from the survey questions used in the analysis
Indicator Descripti on Details
Networks Indicator capturing the fi rm’s external network (in terms of geographical level of interacti ons and external relati ons)
Pseudo conti nuous variable built by factor reducti on of the following variables: a) Sources of technology (internal to the fi rm or external such as MNCs not formally con-nected, non-MNC fi rms, and public industry organizati ons)b) Collaborati on for innovati on with diff erent types of partners such as clients, suppliers, competi tors, consultancy companies, govern-ment and universiti es in diff erent geographical locati ons (regional, domesti c and internati onal) c) Linkages (e.g. research relati onships) with diff erent types of foreign organizati ons (clients, suppliers, competi tors, consultancy companies, government and universiti es)(Min -1.32366; Max 2.79244) Factor analysis: VE=46.89
Innovati on performance (Inno_Perform)
Indicator capturing fi rm’s innovati on intensity
Pseudo conti nuous variable built by factor reducti on of the following variables: a) Presence of signifi cant R&D acti vityb) Full ti me employees for R&D c) Experience in world level innovati on
(Min -1.04059; Max 2.67445) Factor analysis: VE=61.26
Collaborati on for innovati on
Indicator showing the maximum geo-graphical spread of the fi rm’s collabora-ti on for innovati on with external actors. Internati onal collaborati on for innovati on = geographical spread of collaborati on that includes actors from internati onal locati ons, for European fi rms including distant ones like China or India
0=no collaborati ons1=max regional collaborati ons2=max domesti c collaborati ons3=max collaborati on in other internati onal locati ons
Off shoring of innovati on
Indicator showing if the fi rm has off sho-red innovati on acti viti es for the purposes of serving home country or global markets in a locati on outside the fi rm’s home country
0=no off shoring innovati on1=off shoring innovati on
Organizati onal Form
Indicator capturing the fi rm’s organiza-ti onal form
Dummy variablesStandalone =1 if standalone, 0 otherwiseSubsidiary =1 if MNC subsidiary, 0 otherwiseHeadquarter =1 if MNC, 0 otherwise
Size Indicator capturing the fi rm’s size (in terms of full-ti me equivalent employees)
Dummy variablesSmall =1 if FTE ≤49, 0 otherwiseMedium =1 if FTE between 50 and 249, 0 otherwiseLarge =1 if FTE ≥250, 0 otherwise

Tata, ett stort indiskt konglomerat, köpte Land Rover och Jaguar 2008. Samma år
förvärvades svenska Volvo PV av kinesiska Geely. Samtidigt är två kinesiska företag,
ZTE och Huawei, numera Ericssons främsta konkurrenter på telekom-marknaden.
Autoliv och Ericsson, två stora svenska företag, har innovationsorienterade dotter-
bolag i Kina eller Indien. Representerar dessa exempel en bredare global omlokalise-
ring av innovativ verksamhet?
Globaliseringsforums sjätte rapport, The emergence of China and India as new inno-
vation power houses – threat or opportunity?, analyserar globala innovationsf löden
och effekterna av att forskning och utveckling, FoU, lokaliseras till Indien och Kina.
Dessutom undersöks faktorer som påverkar företags benägenhet att globalisera sina
FoU- och innovationsverksamheter.
Rapporten är författad av Cristina Chaminade, professor Lunds universitet, Davide
Castellani, professor University of Perugia och Lunds universitet samt Monica Plech-
ero, Italian National Research Council, CNR.
W W W . E N T R E P R E N O R S K A P S F O R U M . S E
G L O B A L I S E R I N G S F O R U M R A P P O R T # 6
GL
OB
AL
IS
ER
IN
GS
FO
RU
M R
AP
PO
RT
#6
THE EMERGENCE OF CHINA AND INDIA AS NEW
INNOVATION POWER HOUSES – THREAT OR OPPORTUNITY?


![Trabajo Diaspora India Y China[1]](https://static.fdocument.pub/doc/165x107/55597d5dd8b42a60298b521d/trabajo-diaspora-india-y-china1.jpg)