The Effect of Customer Relationship Management on Brand ...
11
The Effect of Customer Relationship Management on Brand Loyalty: A Case Study on the Body Shop Indonesia’s Customers Vidyarini Dwita 1 , Megawati 2 , Puspa Leni 3 , Jumiatul Mulya 3 Universitas Negeri Padang, Padang, Indonesia, [email protected] Universitas Negeri Padang, Padang, Indonesia, [email protected] Sekolah Tinggi Ilmu Ekonomi Perdagangan, Padang, Indonesia, [email protected] Sekolah Tinggi Ilmu Ekonomi Perdagangan, Padang, Indonesia, [email protected] Abstract This study aims to analyze the benefits of Customer Relationship Management (CRM) on Brand Loyalty for cosmetic consumers of The Body Shop Indonesia. The main idea of CRM is to share benefits to customers, allow it to complicate competition costs, encourage companies to increase customer loyalty to a product brand. Multiple regression analysis is applied to analyze the relationship between CRM on Brand Loyalty. The questionnaire was distributed to respondents by using self-administrative questionnaire and purposive sampling. Numbers of samples are 110 people and they are The Body Shop members. The results portrays that CRM which are Continuity Marketing, One-to-One Marketing along with Partnering Program have positive and significant effect on Brand Loyalty. Keywords: Brand Loyalty, Customer Relationship Management, Customer Loyalty Introduction Woman and cosmetic industry are two inseparable components. The unique and principle of woman characteristics are beauty and splendor (Kartini, 2006) and one of the ways to meet them by cosmetics. For women who hunger in keeping beautiful performance, cosmetic industry is challenged to regularly grow up being terribly promised job. Cosmetic market in Indonesia is enlivened by either local products or imported one from foreign cosmetic companies. Within strict competition, cosmetic industry has to work hard creating Brand Loyalty on its progress. It relates to company strategy to stick its customer and appeal the new ones who are loyal on particular brand. Therefore, a developed strategy to boost consumers’ loyalty on a product although there are many other products comes up. The Body Shop is Green and ethical brand and it came to Indonesia in 1992 under PT Monica Hijau Lestari. One of the Body Shop outlets in Indonesia has been available in the city of Padang, West Sumatera. According to Durianto (2001), loyal customer is commonly going to use particular brand regularly even though there are many other alternative products as competitors offer primer ones in some attributes. Brand Loyalty in product is expected to drive the Body Shop as one of consumers’ choice for the future. Relationship-based approach has to be committed to comprehend what are customers needed and wanted as long term assets (Barnes, 2003). In this case, a customer relationship management (CRM) has to be developed. The core idea of CRM beneficials for customer, resist to competition with other competitors, thus it allows company to enhance customers’ loyalty on a product brand. According to Mc Leod (2007), customer relationship management (CRM) is consisted of three indicators: Continuity Marketing, One-to-One Marketing, and Partnering Program. Natania (2013) study at The Body Shop Indonesia through membership program “Love Your Body” in July-December 2013” reported that customer relationship management strategy is elevatable Brand Loyalty on its customers. Oliver (1996) Customer loyalty is deafly held commitment to re-buy or re-patronize a preferred product or service consistently in the future, despite situational influences and marketing efforts having the potential to cause switching behavior. Aaker (1996) assumes that a loyal consumer base represents a barrier to entry, a basis for a price premium, time to respond to competitors, and a bulwark against deleterious price Advances in Economics, Business and Management Research, volume 124 4th Padang International Conference on Education, Economics, Business and Accounting (PICEEBA-2 2019) Copyright © 2020 The Authors. Published by Atlantis Press SARL. This is an open access article distributed under the CC BY-NC 4.0 license -http://creativecommons.org/licenses/by-nc/4.0/. 944
Transcript of The Effect of Customer Relationship Management on Brand ...
The Effect of Customer Relationship Management on Brand Loyalty: A Case Study on
the Body Shop Indonesia’s Customers
Vidyarini Dwita1, Megawati2, Puspa Leni3, Jumiatul Mulya3
Universitas Negeri Padang, Padang, Indonesia, [email protected]
Universitas Negeri Padang, Padang, Indonesia, [email protected]
Sekolah Tinggi Ilmu Ekonomi Perdagangan, Padang, Indonesia, [email protected]
Sekolah Tinggi Ilmu Ekonomi Perdagangan, Padang, Indonesia, [email protected]
Abstract This study aims to analyze the benefits of Customer Relationship Management (CRM) on Brand
Loyalty for cosmetic consumers of The Body Shop Indonesia. The main idea of CRM is to share
benefits to customers, allow it to complicate competition costs, encourage companies to increase
customer loyalty to a product brand. Multiple regression analysis is applied to analyze the
relationship between CRM on Brand Loyalty. The questionnaire was distributed to respondents
by using self-administrative questionnaire and purposive sampling. Numbers of samples are 110
people and they are The Body Shop members. The results portrays that CRM which are
Continuity Marketing, One-to-One Marketing along with Partnering Program have positive and
significant effect on Brand Loyalty.
Keywords: Brand Loyalty, Customer Relationship Management, Customer Loyalty
Introduction Woman and cosmetic industry are two inseparable components. The unique and principle of woman
characteristics are beauty and splendor (Kartini, 2006) and one of the ways to meet them by cosmetics. For
women who hunger in keeping beautiful performance, cosmetic industry is challenged to regularly grow up
being terribly promised job. Cosmetic market in Indonesia is enlivened by either local products or imported
one from foreign cosmetic companies. Within strict competition, cosmetic industry has to work hard creating
Brand Loyalty on its progress. It relates to company strategy to stick its customer and appeal the new ones
who are loyal on particular brand. Therefore, a developed strategy to boost consumers’ loyalty on a product
although there are many other products comes up.
The Body Shop is Green and ethical brand and it came to Indonesia in 1992 under PT Monica Hijau
Lestari. One of the Body Shop outlets in Indonesia has been available in the city of Padang, West Sumatera.
According to Durianto (2001), loyal customer is commonly going to use particular brand regularly even
though there are many other alternative products as competitors offer primer ones in some attributes. Brand
Loyalty in product is expected to drive the Body Shop as one of consumers’ choice for the future.
Relationship-based approach has to be committed to comprehend what are customers needed and wanted as
long term assets (Barnes, 2003). In this case, a customer relationship management (CRM) has to be developed.
The core idea of CRM beneficials for customer, resist to competition with other competitors, thus it allows
company to enhance customers’ loyalty on a product brand. According to Mc Leod (2007), customer
relationship management (CRM) is consisted of three indicators: Continuity Marketing, One-to-One
Marketing, and Partnering Program. Natania (2013) study at The Body Shop Indonesia through membership
program “Love Your Body” in July-December 2013” reported that customer relationship management
strategy is elevatable Brand Loyalty on its customers.
Oliver (1996) Customer loyalty is deafly held commitment to re-buy or re-patronize a preferred product or
service consistently in the future, despite situational influences and marketing efforts having the potential to
cause switching behavior. Aaker (1996) assumes that a loyal consumer base represents a barrier to entry, a
basis for a price premium, time to respond to competitors, and a bulwark against deleterious price
Advances in Economics, Business and Management Research, volume 124
4th Padang International Conference on Education, Economics, Business and Accounting (PICEEBA-2 2019)
Copyright © 2020 The Authors. Published by Atlantis Press SARL.This is an open access article distributed under the CC BY-NC 4.0 license -http://creativecommons.org/licenses/by-nc/4.0/. 944
completion, and brand loyalty is a core dimension of brand equity. In addition, brand loyalty is the final
destination of brand management, and if a company wants to test the weakness or strength of its customers’
loyalty, it can easily check whether consumers still favor its product in contrast to competitors.
Brand loyalty is the attitude of consumers in purchasing by prioritizing a particular brand based on the
experience of the use of the brand (Deighton, Henderson, & Neslin, 1994; Aaker, 1991; Chi, et, al, 2009).
Assael (1998) defines that brand loyalty is that consumers satisfy their past experience in use of the same
brand and incur repurchase behavior. Brand loyalty is the virtue of the brand chosen by consumers because
of its satisfaction so it does not consider other brands when buying a product (Baldinger & Rubinson, 1996;
Cavero & Cebollada, 1997; Chi, et, al, 2009). Brand loyalty represents a repurchase commitment in the future
purchase that promise consumers will not change their brand loyalty in different situations and still buy their
favorable brands (Oliver, 1999). Bloemer and Kasper (1995) argue that a real brand loyalty should include
brand preferences and repurchase behaviors that present in a long term commitment, brand commitment and
psychological processing (decision making and evaluation) function while Fornell (1992) proposes that brand
loyalty can be measured from customer repurchase intention and price tolerance. So brand loyalty is a
tangible manifestation of a consumer's long-term commitment in prioritizing and intending to buy back from
a product with the same brand and is not price sensitive. Consumers with a strong commitment to a
particular brand will constantly search for any marketing activity related to the brand. It is very hard to say
that consumers hold brand loyalty. Action loyalty indicates that consumers not only have preferences to a
specific brand but also perform purchase action repetitively, and become action inertia (Chi, et, al., 2009).
According to Kotler and Keller (2009) defines customer loyalty as "The long term success of the particular
brand is not based on the number of consumers who purchase it only once, but on the number who becomes
repeat purchase". Through this definition, Kotler and Keller (2009) want to explain that consumers will be
loyal measured through three things below, namely: Word of mouth, recommending others to buy or refer to
others. Another reject, refusing to use other products or showing immunity to the pull of competitors. Repeat
purchasing, how often do repeat purchases.
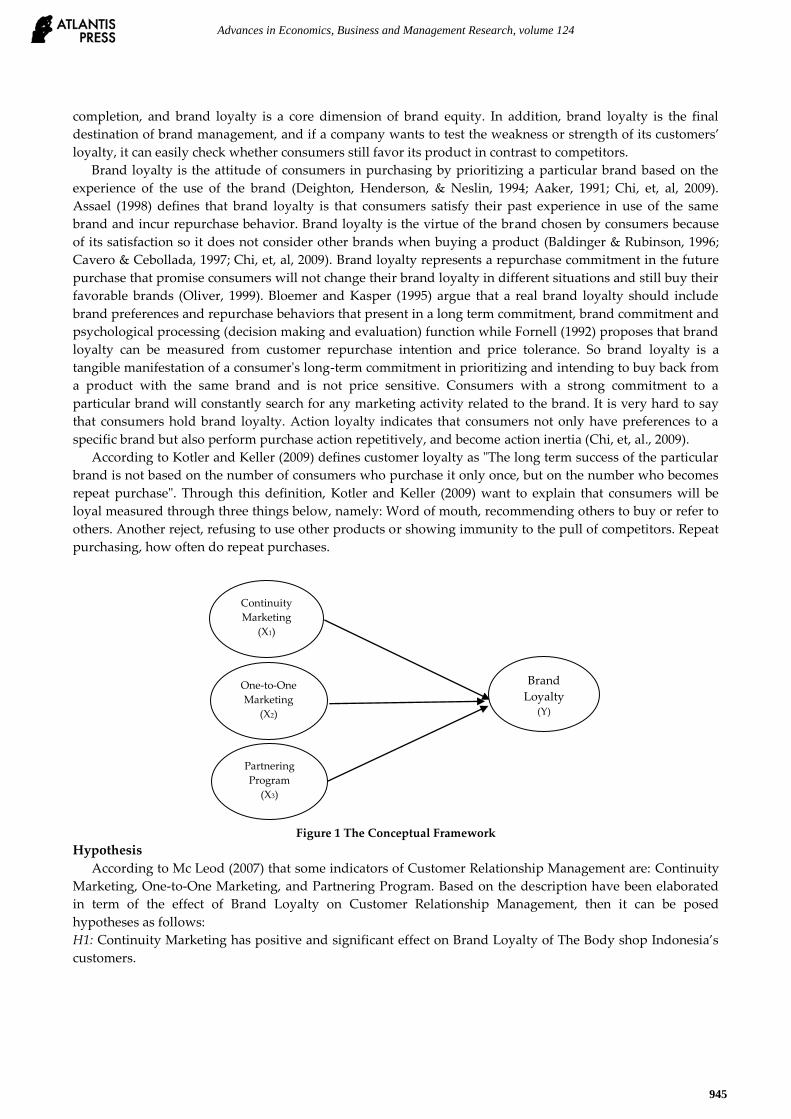
Figure 1 The Conceptual Framework
Hypothesis
According to Mc Leod (2007) that some indicators of Customer Relationship Management are: Continuity
Marketing, One-to-One Marketing, and Partnering Program. Based on the description have been elaborated
in term of the effect of Brand Loyalty on Customer Relationship Management, then it can be posed
hypotheses as follows:
H1: Continuity Marketing has positive and significant effect on Brand Loyalty of The Body shop Indonesia’s
customers.
Continuity
Marketing
(X1)
One-to-One
Marketing
(X2)
Partnering
Program
(X3)
Brand
Loyalty
(Y)
Advances in Economics, Business and Management Research, volume 124
945

H2: One-to- one marketing has positive and significant effect on Brand Loyalty of The Body shop Indonesia’s
customers.
H3: Partnering Program has positive and significant effect on Brand Loyalty of The Body shop Indonesia’s
customers.
H4: Continuity Marketing, One-to-One Marketing and Partnering Program as CRM program simultaneously
has positive and significant effect on Brand Loyalty of The Body shop Indonesia’s customers.
Methods This study is associative. According to Sugiono (2003), associative study is a kind of study asks for
relationship between two or more variables which coincidentally come up in simultaneous. Number of
sample in this study is 110 people. Sampling technique used is non probability sampling-purposive sampling
technique. Data collecting is by using research instrument, questionnaire has been examined its validity and
reliability. Scale used is likert scale and multiple linear regression analysis with SPSS version 16.0 for
Windows program used for hypothesis test.
Results and Discussion Based on the research questionnaires distributed to 110 respondents, it could be recognized that research
respondents’ demography on th e table 1 below.
Table 1 The Demographic Profile of Respondents
Category Frequency %
Age:
< 20 years old
21 to 30 years old
31 to 40 years old
> 40 years old
20
52
30
8
18
47
27
7
Gender:
Female
Male
106
4
96
4
Educational Background:
Senior High School
Diploma
Bachelor
Postgraduate
28
30
42
10
25
27
38
9
Occupation:
College student
Government employee
Private Employee
Entrepreneur
Others
28
20
52
7
3
25
18
47
6
3
Source: Processed Data, 2019
Based on the table 1, it could be discerned that majority of respondents were young females and they were
dominated by less than 40 years old, their highest educational background were bachelor and diploma,
majority of their occupation were employees. This result represented that The Body Shop Indonesia’s
customers in the city of Padang were partly young and well educated females. They worked as employee in
private companies in Padang.
According to Muljono (2003), instrument is a tool fulfills academic standard and it can be used to quantify
an object or collect data regarding to a variable. To obtain the collected data, then it used validity and
reliability tests. Validity test uses correlation value, Corrected Item-Total Correlation.
Advances in Economics, Business and Management Research, volume 124
946
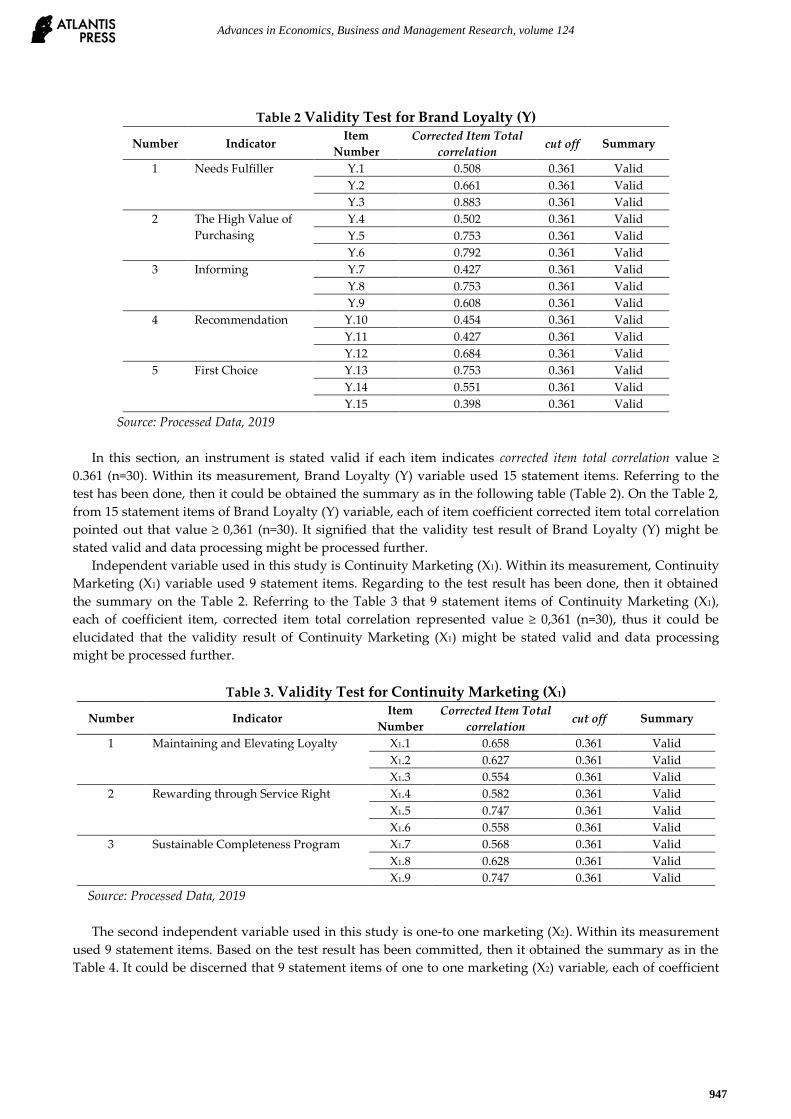
Table 2 Validity Test for Brand Loyalty (Y)
Number Indicator Item
Number
Corrected Item Total
correlation cut off Summary
1 Needs Fulfiller Y.1 0.508 0.361 Valid
Y.2 0.661 0.361 Valid
Y.3 0.883 0.361 Valid
2 The High Value of
Purchasing
Y.4 0.502 0.361 Valid
Y.5 0.753 0.361 Valid
Y.6 0.792 0.361 Valid
3 Informing Y.7 0.427 0.361 Valid
Y.8 0.753 0.361 Valid
Y.9 0.608 0.361 Valid
4 Recommendation Y.10 0.454 0.361 Valid
Y.11 0.427 0.361 Valid
Y.12 0.684 0.361 Valid
5 First Choice Y.13 0.753 0.361 Valid
Y.14 0.551 0.361 Valid
Y.15 0.398 0.361 Valid
Source: Processed Data, 2019
In this section, an instrument is stated valid if each item indicates corrected item total correlation value ≥
0.361 (n=30). Within its measurement, Brand Loyalty (Y) variable used 15 statement items. Referring to the
test has been done, then it could be obtained the summary as in the following table (Table 2). On the Table 2,
from 15 statement items of Brand Loyalty (Y) variable, each of item coefficient corrected item total correlation
pointed out that value ≥ 0,361 (n=30). It signified that the validity test result of Brand Loyalty (Y) might be
stated valid and data processing might be processed further.
Independent variable used in this study is Continuity Marketing (X1). Within its measurement, Continuity
Marketing (X1) variable used 9 statement items. Regarding to the test result has been done, then it obtained
the summary on the Table 2. Referring to the Table 3 that 9 statement items of Continuity Marketing (X1),
each of coefficient item, corrected item total correlation represented value ≥ 0,361 (n=30), thus it could be
elucidated that the validity result of Continuity Marketing (X1) might be stated valid and data processing
might be processed further.
Table 3. Validity Test for Continuity Marketing (X1)
Number Indicator Item
Number
Corrected Item Total
correlation cut off Summary
1 Maintaining and Elevating Loyalty X1.1 0.658 0.361 Valid
X1.2 0.627 0.361 Valid
X1.3 0.554 0.361 Valid
2 Rewarding through Service Right X1.4 0.582 0.361 Valid
X1.5 0.747 0.361 Valid
X1.6 0.558 0.361 Valid
3 Sustainable Completeness Program X1.7 0.568 0.361 Valid
X1.8 0.628 0.361 Valid
X1.9 0.747 0.361 Valid
Source: Processed Data, 2019
The second independent variable used in this study is one-to one marketing (X2). Within its measurement
used 9 statement items. Based on the test result has been committed, then it obtained the summary as in the
Table 4. It could be discerned that 9 statement items of one to one marketing (X2) variable, each of coefficient
Advances in Economics, Business and Management Research, volume 124
947
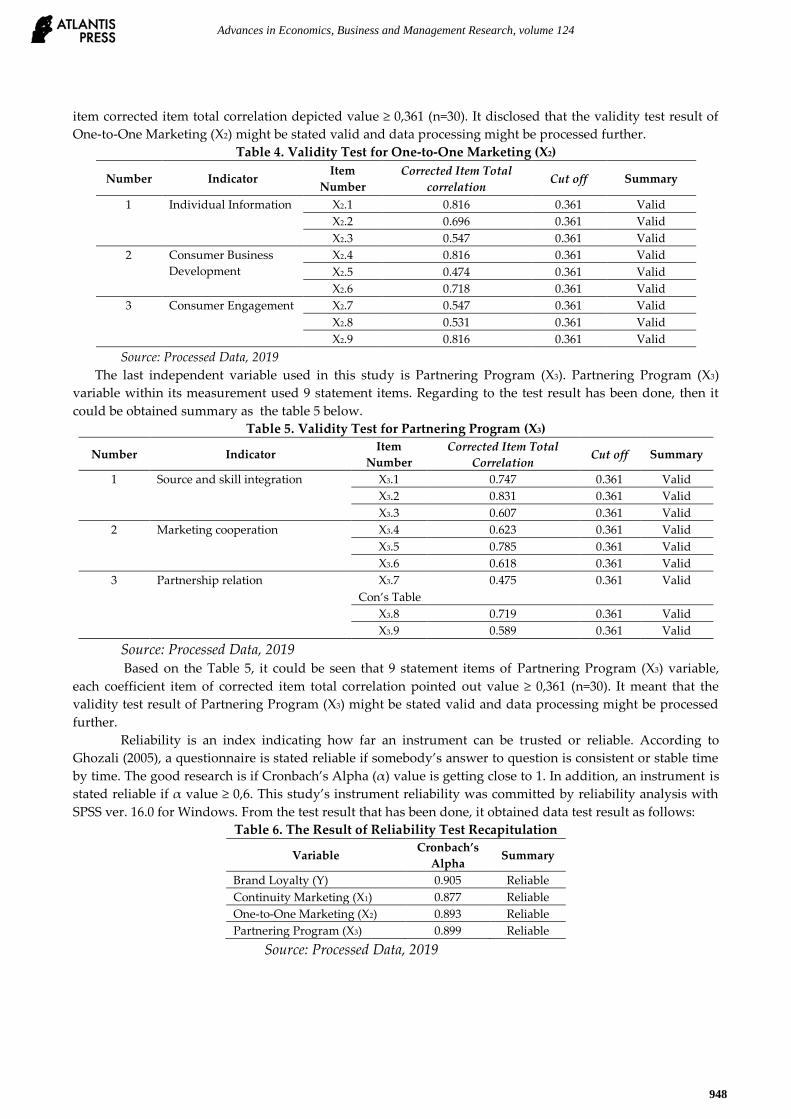
item corrected item total correlation depicted value ≥ 0,361 (n=30). It disclosed that the validity test result of
One-to-One Marketing (X2) might be stated valid and data processing might be processed further.
Table 4. Validity Test for One-to-One Marketing (X2)
Number Indicator Item
Number
Corrected Item Total
correlation Cut off Summary
1 Individual Information X2.1 0.816 0.361 Valid
X2.2 0.696 0.361 Valid
X2.3 0.547 0.361 Valid
2 Consumer Business
Development
X2.4 0.816 0.361 Valid
X2.5 0.474 0.361 Valid
X2.6 0.718 0.361 Valid
3 Consumer Engagement X2.7 0.547 0.361 Valid
X2.8 0.531 0.361 Valid
X2.9 0.816 0.361 Valid
Source: Processed Data, 2019
The last independent variable used in this study is Partnering Program (X3). Partnering Program (X3)
variable within its measurement used 9 statement items. Regarding to the test result has been done, then it
could be obtained summary as the table 5 below.
Table 5. Validity Test for Partnering Program (X3)
Number Indicator Item
Number
Corrected Item Total
Correlation Cut off Summary
1 Source and skill integration X3.1 0.747 0.361 Valid
X3.2 0.831 0.361 Valid
X3.3 0.607 0.361 Valid
2 Marketing cooperation X3.4 0.623 0.361 Valid
X3.5 0.785 0.361 Valid
X3.6 0.618 0.361 Valid
3 Partnership relation X3.7 0.475 0.361 Valid
Con’s Table
X3.8 0.719 0.361 Valid
X3.9 0.589 0.361 Valid
Source: Processed Data, 2019
Based on the Table 5, it could be seen that 9 statement items of Partnering Program (X3) variable,
each coefficient item of corrected item total correlation pointed out value ≥ 0,361 (n=30). It meant that the
validity test result of Partnering Program (X3) might be stated valid and data processing might be processed
further.
Reliability is an index indicating how far an instrument can be trusted or reliable. According to
Ghozali (2005), a questionnaire is stated reliable if somebody’s answer to question is consistent or stable time
by time. The good research is if Cronbach’s Alpha (α) value is getting close to 1. In addition, an instrument is
stated reliable if α value ≥ 0,6. This study’s instrument reliability was committed by reliability analysis with
SPSS ver. 16.0 for Windows. From the test result that has been done, it obtained data test result as follows:
Table 6. The Result of Reliability Test Recapitulation
Variable Cronbach’s
Alpha Summary
Brand Loyalty (Y) 0.905 Reliable
Continuity Marketing (X1) 0.877 Reliable
One-to-One Marketing (X2) 0.893 Reliable
Partnering Program (X3) 0.899 Reliable
Source: Processed Data, 2019
Advances in Economics, Business and Management Research, volume 124
948
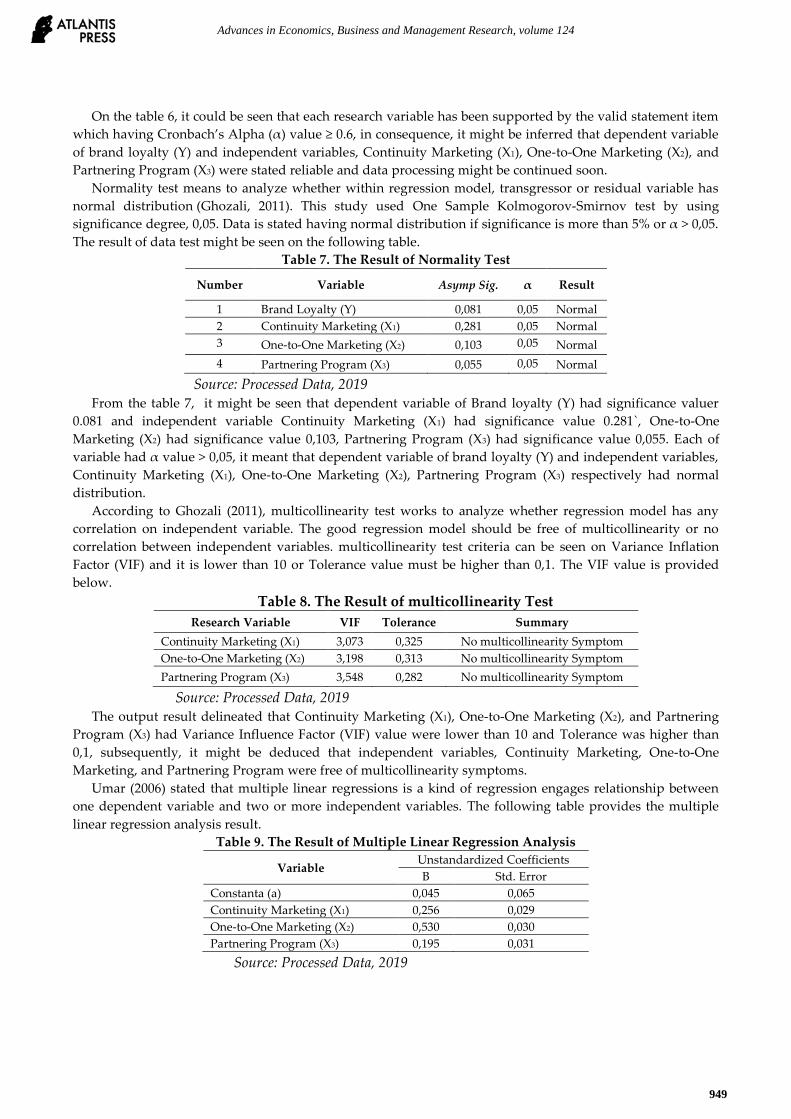
On the table 6, it could be seen that each research variable has been supported by the valid statement item
which having Cronbach’s Alpha (α) value ≥ 0.6, in consequence, it might be inferred that dependent variable
of brand loyalty (Y) and independent variables, Continuity Marketing (X1), One-to-One Marketing (X2), and
Partnering Program (X3) were stated reliable and data processing might be continued soon.
Normality test means to analyze whether within regression model, transgressor or residual variable has
normal distribution (Ghozali, 2011). This study used One Sample Kolmogorov-Smirnov test by using
significance degree, 0,05. Data is stated having normal distribution if significance is more than 5% or α > 0,05.
The result of data test might be seen on the following table.
Table 7. The Result of Normality Test
Number Variable Asymp Sig. α Result
1 Brand Loyalty (Y) 0,081 0,05 Normal
2 Continuity Marketing (X1) 0,281 0,05 Normal
3 One-to-One Marketing (X2) 0,103 0,05 Normal
4 Partnering Program (X3) 0,055 0,05 Normal
Source: Processed Data, 2019
From the table 7, it might be seen that dependent variable of Brand loyalty (Y) had significance valuer
0.081 and independent variable Continuity Marketing (X1) had significance value 0.281`, One-to-One
Marketing (X2) had significance value 0,103, Partnering Program (X3) had significance value 0,055. Each of
variable had α value > 0,05, it meant that dependent variable of brand loyalty (Y) and independent variables,
Continuity Marketing (X1), One-to-One Marketing (X2), Partnering Program (X3) respectively had normal
distribution.
According to Ghozali (2011), multicollinearity test works to analyze whether regression model has any
correlation on independent variable. The good regression model should be free of multicollinearity or no
correlation between independent variables. multicollinearity test criteria can be seen on Variance Inflation
Factor (VIF) and it is lower than 10 or Tolerance value must be higher than 0,1. The VIF value is provided
below.
Table 8. The Result of multicollinearity Test
Research Variable VIF Tolerance Summary
Continuity Marketing (X1) 3,073 0,325 No multicollinearity Symptom
One-to-One Marketing (X2) 3,198 0,313 No multicollinearity Symptom
Partnering Program (X3) 3,548 0,282 No multicollinearity Symptom
Source: Processed Data, 2019
The output result delineated that Continuity Marketing (X1), One-to-One Marketing (X2), and Partnering
Program (X3) had Variance Influence Factor (VIF) value were lower than 10 and Tolerance was higher than
0,1, subsequently, it might be deduced that independent variables, Continuity Marketing, One-to-One
Marketing, and Partnering Program were free of multicollinearity symptoms.
Umar (2006) stated that multiple linear regressions is a kind of regression engages relationship between
one dependent variable and two or more independent variables. The following table provides the multiple
linear regression analysis result.
Table 9. The Result of Multiple Linear Regression Analysis
Variable Unstandardized Coefficients
B Std. Error
Constanta (a) 0,045 0,065
Continuity Marketing (X1) 0,256 0,029
One-to-One Marketing (X2) 0,530 0,030
Partnering Program (X3) 0,195 0,031
Source: Processed Data, 2019
Advances in Economics, Business and Management Research, volume 124
949
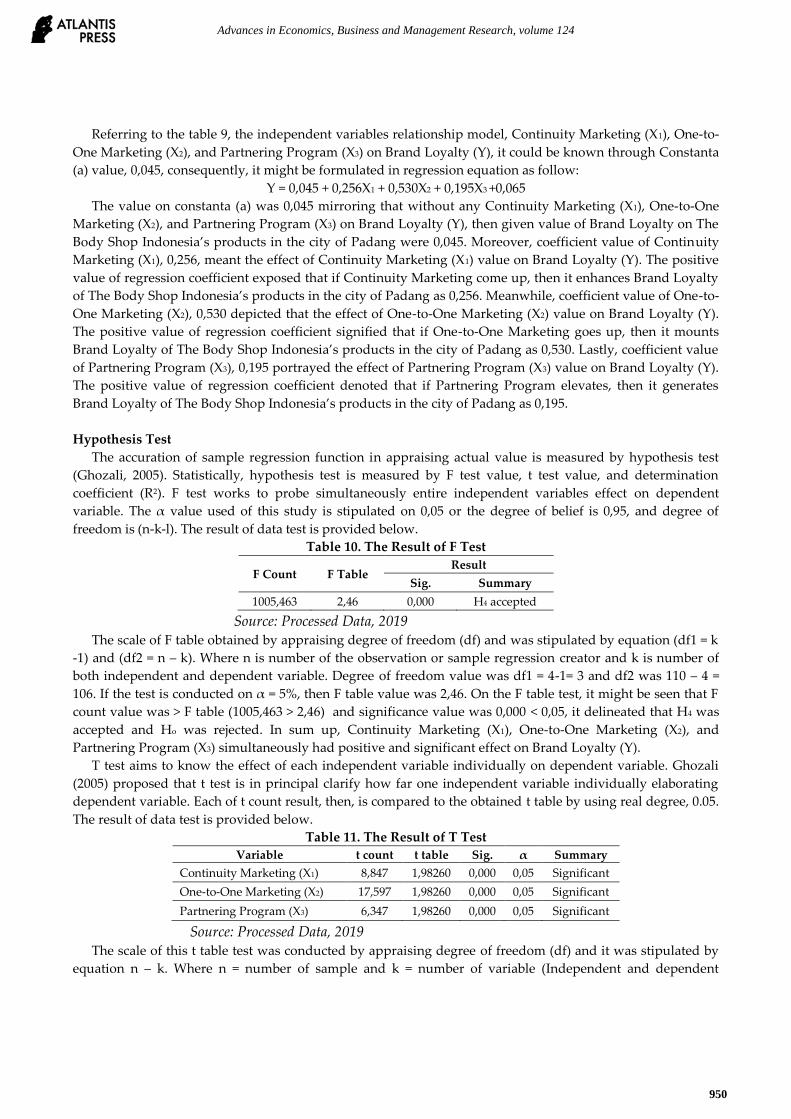
Referring to the table 9, the independent variables relationship model, Continuity Marketing (X1), One-to-
One Marketing (X2), and Partnering Program (X3) on Brand Loyalty (Y), it could be known through Constanta
(a) value, 0,045, consequently, it might be formulated in regression equation as follow:
Y = 0,045 + 0,256X1 + 0,530X2 + 0,195X3 +0,065
The value on constanta (a) was 0,045 mirroring that without any Continuity Marketing (X1), One-to-One
Marketing (X2), and Partnering Program (X3) on Brand Loyalty (Y), then given value of Brand Loyalty on The
Body Shop Indonesia’s products in the city of Padang were 0,045. Moreover, coefficient value of Continuity
Marketing (X1), 0,256, meant the effect of Continuity Marketing (X1) value on Brand Loyalty (Y). The positive
value of regression coefficient exposed that if Continuity Marketing come up, then it enhances Brand Loyalty
of The Body Shop Indonesia’s products in the city of Padang as 0,256. Meanwhile, coefficient value of One-to-
One Marketing (X2), 0,530 depicted that the effect of One-to-One Marketing (X2) value on Brand Loyalty (Y).
The positive value of regression coefficient signified that if One-to-One Marketing goes up, then it mounts
Brand Loyalty of The Body Shop Indonesia’s products in the city of Padang as 0,530. Lastly, coefficient value
of Partnering Program (X3), 0,195 portrayed the effect of Partnering Program (X3) value on Brand Loyalty (Y).
The positive value of regression coefficient denoted that if Partnering Program elevates, then it generates
Brand Loyalty of The Body Shop Indonesia’s products in the city of Padang as 0,195.
Hypothesis Test
The accuration of sample regression function in appraising actual value is measured by hypothesis test
(Ghozali, 2005). Statistically, hypothesis test is measured by F test value, t test value, and determination
coefficient (R2). F test works to probe simultaneously entire independent variables effect on dependent
variable. The α value used of this study is stipulated on 0,05 or the degree of belief is 0,95, and degree of
freedom is (n-k-l). The result of data test is provided below.
Table 10. The Result of F Test
F Count F Table Result
Sig. Summary
1005,463 2,46 0,000 H4 accepted
Source: Processed Data, 2019
The scale of F table obtained by appraising degree of freedom (df) and was stipulated by equation (df1 = k
-1) and (df2 = n – k). Where n is number of the observation or sample regression creator and k is number of
both independent and dependent variable. Degree of freedom value was df1 = 4-1= 3 and df2 was 110 – 4 =
106. If the test is conducted on α = 5%, then F table value was 2,46. On the F table test, it might be seen that F
count value was > F table (1005,463 > 2,46) and significance value was 0,000 < 0,05, it delineated that H4 was
accepted and Ho was rejected. In sum up, Continuity Marketing (X1), One-to-One Marketing (X2), and
Partnering Program (X3) simultaneously had positive and significant effect on Brand Loyalty (Y).
T test aims to know the effect of each independent variable individually on dependent variable. Ghozali
(2005) proposed that t test is in principal clarify how far one independent variable individually elaborating
dependent variable. Each of t count result, then, is compared to the obtained t table by using real degree, 0.05.
The result of data test is provided below.
Table 11. The Result of T Test
Variable t count t table Sig. α Summary
Continuity Marketing (X1) 8,847 1,98260 0,000 0,05 Significant
One-to-One Marketing (X2) 17,597 1,98260 0,000 0,05 Significant
Partnering Program (X3) 6,347 1,98260 0,000 0,05 Significant
Source: Processed Data, 2019
The scale of this t table test was conducted by appraising degree of freedom (df) and it was stipulated by
equation n – k. Where n = number of sample and k = number of variable (Independent and dependent
Advances in Economics, Business and Management Research, volume 124
950
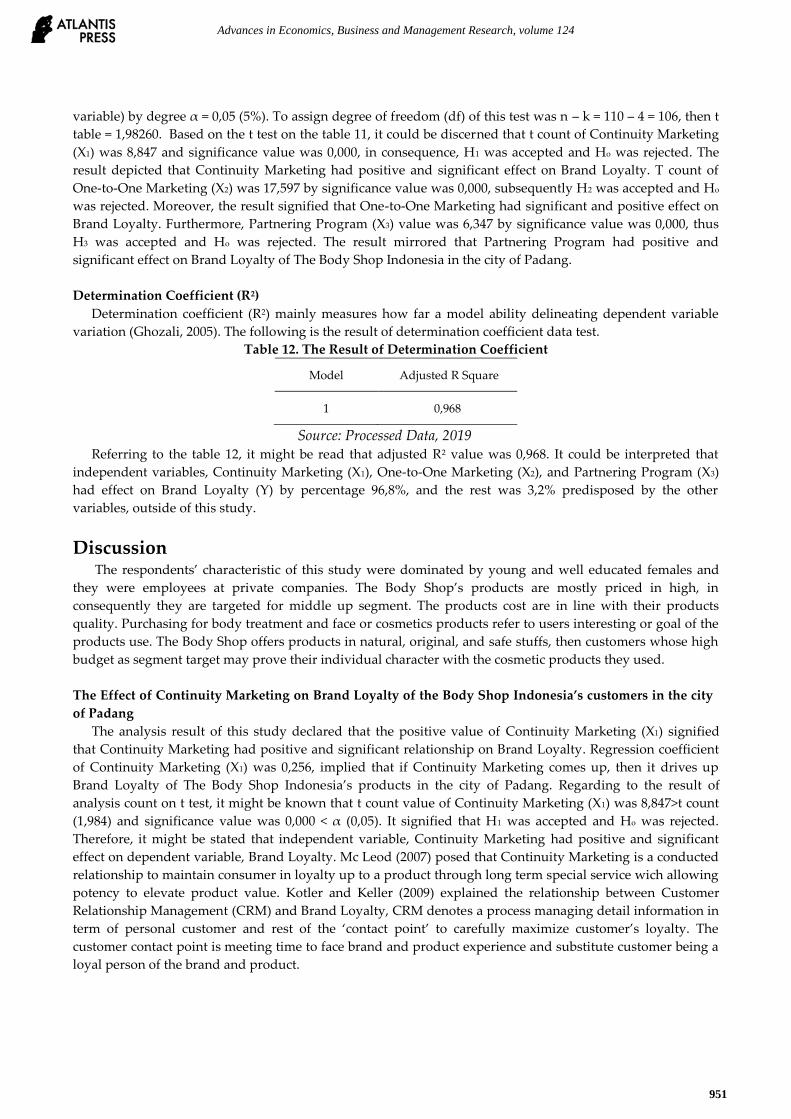
variable) by degree α = 0,05 (5%). To assign degree of freedom (df) of this test was n – k = 110 – 4 = 106, then t
table = 1,98260. Based on the t test on the table 11, it could be discerned that t count of Continuity Marketing
(X1) was 8,847 and significance value was 0,000, in consequence, H1 was accepted and Ho was rejected. The
result depicted that Continuity Marketing had positive and significant effect on Brand Loyalty. T count of
One-to-One Marketing (X2) was 17,597 by significance value was 0,000, subsequently H2 was accepted and Ho
was rejected. Moreover, the result signified that One-to-One Marketing had significant and positive effect on
Brand Loyalty. Furthermore, Partnering Program (X3) value was 6,347 by significance value was 0,000, thus
H3 was accepted and Ho was rejected. The result mirrored that Partnering Program had positive and
significant effect on Brand Loyalty of The Body Shop Indonesia in the city of Padang.
Determination Coefficient (R2)
Determination coefficient (R2) mainly measures how far a model ability delineating dependent variable
variation (Ghozali, 2005). The following is the result of determination coefficient data test.
Table 12. The Result of Determination Coefficient
Model Adjusted R Square
1 0,968
Source: Processed Data, 2019
Referring to the table 12, it might be read that adjusted R2 value was 0,968. It could be interpreted that
independent variables, Continuity Marketing (X1), One-to-One Marketing (X2), and Partnering Program (X3)
had effect on Brand Loyalty (Y) by percentage 96,8%, and the rest was 3,2% predisposed by the other
variables, outside of this study.
Discussion The respondents’ characteristic of this study were dominated by young and well educated females and
they were employees at private companies. The Body Shop’s products are mostly priced in high, in
consequently they are targeted for middle up segment. The products cost are in line with their products
quality. Purchasing for body treatment and face or cosmetics products refer to users interesting or goal of the
products use. The Body Shop offers products in natural, original, and safe stuffs, then customers whose high
budget as segment target may prove their individual character with the cosmetic products they used.
The Effect of Continuity Marketing on Brand Loyalty of the Body Shop Indonesia’s customers in the city
of Padang
The analysis result of this study declared that the positive value of Continuity Marketing (X1) signified
that Continuity Marketing had positive and significant relationship on Brand Loyalty. Regression coefficient
of Continuity Marketing (X1) was 0,256, implied that if Continuity Marketing comes up, then it drives up
Brand Loyalty of The Body Shop Indonesia’s products in the city of Padang. Regarding to the result of
analysis count on t test, it might be known that t count value of Continuity Marketing (X1) was 8,847>t count
(1,984) and significance value was 0,000 < α (0,05). It signified that H1 was accepted and Ho was rejected.
Therefore, it might be stated that independent variable, Continuity Marketing had positive and significant
effect on dependent variable, Brand Loyalty. Mc Leod (2007) posed that Continuity Marketing is a conducted
relationship to maintain consumer in loyalty up to a product through long term special service wich allowing
potency to elevate product value. Kotler and Keller (2009) explained the relationship between Customer
Relationship Management (CRM) and Brand Loyalty, CRM denotes a process managing detail information in
term of personal customer and rest of the ‘contact point’ to carefully maximize customer’s loyalty. The
customer contact point is meeting time to face brand and product experience and substitute customer being a
loyal person of the brand and product.
Advances in Economics, Business and Management Research, volume 124
951
The result of this study is in line with Natania (2013) study analyzed “Customer Relationship
Management strategy of The Body Shop Indonesia in building of Brand Loyalty: (case study: Membership
program “Love Your Body Period July-December 2013”).” Her study reported that Customer Relationship
Management and Membership simultaneously had positive and significant effect on Brand Loyalty.
The Effect of One-to-One Marketing on Brand Loyalty of the Body Shop Indonesia’s customers in the city
of Padang
The analysis result of this study disclosed that the positive value of One-to-One Marketing (X2) had
positive and significant relationship on Brand Loyalty. Regression coefficient of One-to-One Marketing (X2)
was 0,530. It meant that if One-to-One Marketing increases, then it enhances Brand Loyalty of The Body Shop
Indonesia’s products in the city of Padang. Based on the result of analysis count on t test, it might be
acknowledged that t count value of One-to-One Marketing (X2) was 17,597>t count (1,98260) and significance
value was 0,000 < α (0,05). It indicated that H2 was accepted and Ho was rejected. Subsequently, it might be
stated that independent variable, One-to-One Marketing had positive and significant effect on dependent
variable, Brand Loyalty. One-to-One Marketing is a strategy to satisfy any loyal consumer’s needs in unique
and individual (Mc Leod, 2007). On the other hand, Budiman (2009) argued that CRM encourages company
to open communication lines as easy as possible with high response in order to bind relationship with
company’s party. Owing to that fact, their loyalty to company is slowly going to rise and grow up. Therefore,
company is getting benefit of Customer Relationship Management (CRM) application and having loyal
customer to offered products. This result confirms a study which is conducted by Kartika, at. al., (2011) under
tittle “The effect of Customer Relationship Management to customer Loyality PT BCA Tbk.” They announced
that Customer Relationship Management (CRM) had effect on customer loyalty.
The Effect of Partnering Program on Brand Loyalty of the Body Shop Indonesia’s customers in the city of Padang
The result of this study portrayed that the positive value of Partnering Program (X3) had positive and
significant relationship on Brand Loyalty. Regression coefficient of Partnering Program(X3) was 0,195. It
implied that if Partnering Program goes up, then it elevates Brand Loyalty of The Body Shop Indonesia’s
products in the city of Padang. Due to the result of analysis count on t test, it migh be recognized that t count
value of Partnering Program(X3) was 6,347>t count (1,98260) and significance value was 0,000 < α (0,05). It
pointed out that H3 was accepted and Ho was rejected. Hence, it might be stated that independent variable,
Partnering Program had positive and significant effect on dependent variable, Brand Loyalty. Mc Leod (2007)
posed that Partnering Program is partnership relation between loyal consumer and marketer to serve end
consumer. In addition, Barnes (2003) defined CRM Partnering Program as relation based has to be acted to
understand what customer needed and wanted, and consider customer as long term asset. The result of this
study affirms a study was conducted by Kalalo (2013) and she declared that CRM and Service Quality
simultaneously and partially had significant effect on consumer loyalty. It verifies that company whose basis
customer in high loyalty may diminish company’s marketing cost due to keeping customer is cheaper than
having new one. By promoting Partnering Program, then Brand Loyalty to The Body Shop Indonesia’s
customer is going up.
The Effect of Continuity Marketing, One-to-One Marketing, and Partnering Program on Brand Loyalty of
the Body Shop Indonesia’s customers in the city of Padang
The F test result in this study indicated that F count value was > F table (1005,463 > 2,46) and significance
value was 0,000 < 0,05. It portrayed that H4 was accepted and Ho was rejected. It might be concluded that
Customer Relationship Management (CRM) program which are comprised of Continuity Marketing (X1),
One-to-One Marketing (X2) and Partnering Program (X3) simultaneously had positive and significant effect on
Brand Loyalty (Y) Customer of The Body Shop Indonesia in the city of Padang. Adjusted R2 value was 0,968.
Advances in Economics, Business and Management Research, volume 124
952

It figured out that Brand Loyalty customer of The Body Shop Indonesia in the city of Padang might be
described by Customer Relationship Management (CRM) which are consisted of Continuity Marketing, One-
to-One Marketing and Partnering Program as 96,8 %. Whereas, 3,2% was predisposed by the other variables,
outside of this study.
In the late 1990s, customer relationship management (CRM) is formed as a popular business term, which
holds the same roots with relationship marketing and enhances the paradigm with the emerging information
technologies (öztaysi et.al, 2011). During the mass production age, the competition in the business world
was about efficient production and capturing the new customers in the market. The 4P (product, price, place
and promotion) was developed as a tool for marketing success and has been the unchallenged paradigm for
marketing management (Gronroos, 1989; öztaysi et.al, 2011). But the changing environment, especially the
energy crisis, progress in service industry and the focus on quality management, forced the companies to
change their focus from customer acquisition to customer retention (Sheth, 2002; öztaysi et.al,2011) by building
relationships with customers and adding more value to goods and services (Lindgreen and Wynstra, 2005;
öztaysi et.al, 2011).
Conclusion Continuity Marketing, One-to-One Marketing, and Partnering Program either partially or simultaneously
had positive and significant effect on Brand Loyalty of The Body Shop Indonesia in the city of Padang. CRM
program quality refinement is driving up brand loyalty of The Body Shop Indonesia in the city of Padang.
The Body Shop Indonesia’s marketing team in the city of Padang has applied CRM program to its customer
through good membership management “Love your Body.” Customers are registered in company’s database
(name, phone number, and date of birth), in consequence sale promotion program may be on target, and
customers are getting much benefit as member of the Body Shop. Value for money is gained by customers to
bind relationship between them and The Body Shop. The Body Shop Indonesia’s marketing team in the city of Padang is suggested to maintain relationship
with customers by binding cooperation and refine services and lines with third party, such as supplier, mass
media, bank, and social institution. Outstanding and trustworthy cooperation with supplier, effective
promotion, and simplicity in purchasing transaction are generating customers’ satisfaction to trust and loyal
to The Body Shop’s brand in the city of Padang. The next researchers is suggested to use more representative
samples, for instance using sample of customer from all around Sumatera region and other analysis
instruments such as AMOS and PLS to scrutinize the effect of each CRM variable on Brand Loyalty or maybe
another relevant variables.
References Aaker, D. A. (1996). Measuring brand equity across products and markets. California Management Review,
38(3), 102-20.
Aaker, D. A., & Keller, K. L. (1990). Consumer evaluations of brand extensions. Journal of Marketing, 54(1),
27-42.
Assael, H.(1998). Consumer behavior and marketing Action, 6th ed. Cincinnati, Ohio: South-Western
Baldinger, A.L., & Rubinson, J. (1996). Brand loyalty: The link between attitude and behavior. Journal of
Research, 36, 22-34.
Bandyopadhyay, S., Gupta, K., & Dube, L. (2005). Does brand loyalty influence double jeopardy? A
theoretical and empirical study. Journal of Product & Brand Management, 14(7), 414-423.
Barnes, 2003. Secret of Customer Relationship Management (Rahasia manajemen Hubungan pelanggan), penerbit
ANDI: Yogyakarta
Bloemer, M. M., & Kasper, D. P. (1995). The complex relationship between consumer satisfaction and brand
loyalty. Journal of Economic Psychology, 16, 311-329.
Budiman, Ellen ,2009. Penerapan CRM Pada Perusahaan Unilever .Universitas Bina Nusantara.
Advances in Economics, Business and Management Research, volume 124
953
Cavero, S., & Cebollada, J. (1997). Brand choice and marketing strategy: An application to the market of
laundry detergent for delicate clothes in Spain. Journal of International Consumer Marketing,10, 57-71.
Chaudhuri, A. (1995). Brand equity or double jeopardy? Journal of Product & Brand Management, 4(1), 26–
32.
Chi, Hsin Kuang., Huery Ren Yeh and Ya Ting Yang. 2009. The Impact of Brand Awareness on Consumer
Purchase Intention: The Mediating Effect of Perceived Quality and Brand Loyalty. The Journal of
International Management Studies, Volume 4, Number 1, p, 135−144.
Dinarti SH Manurung, 2009, Pengaruh Kepuasan Konsumen Terhadap Loyalitas merek Pada Pelanggan Kartu
Prabayar Simpati. Universitas Sumatera Utara: Medan
Deighton, J., Henderson, C.M., & Neslin, S.A. (1994). The effects of advertising on brand switching and repeat
purchasing. Journal of Marketing Research,16, 28-43.
Durianto, D., Sugaiarto, & Sitinjak , T., 2001. Strategi Menaklukkan Pasar melalui Riset Ekuitas dan Perilaku
Konsumen, Penerbit Gramedia: Jakarta
Fornell, C. (1992). A national customer satisfaction barometer: The Swedish experience. Journal of Marketing,
55, 1-22.
Ghozali, Imam.2005. Aplikasi Analisis Multivariate Dengan Program SPSS. Penerbit : UNDIP
Gronroos, C. (1989), “Defining marketing: a market-oriented approach”, European Journal of
Marketing, Vol. 23 No. 1, pp. 52-60.
Jessica Natania, 2013. Strategi Customer Relationship Management The Body Shop Indonesia dalam Membangun
Brand Loyalty.
Kartika Imasari, Kezia Kurniawati Nursalin,2011. Penagruh Customer Relationship Management Terhadap
Loyalitas Pelanggan Pada PT. BCA, Tbk. Jurnal Ekonomi Hal 183-192 Vol. 10, No.3 ISSN : 1412 – 3851
Kartini, 2006. Psikologi Wanita. Penerbit Mandar Maju :Bandung
Kotler, Philip;Keller. (2014). Marketing Management 14th ed. Prentice Hall. Pearson
Educational Inter.
Lindgreen, A. and Wynstra, F. (2005), “Value in business markets: what do we know? Where are we going?”,
Industrial Marketing Management, Vol. 34 No. 7, pp. 732-48.
Mc Leod, Raymond Jr., Zikmund, William G., and Gilbert, Faye W., 2002. Customer Relationship Management:
Integrating Marketing Strategy and Information Technology, 1st Edition. Wiley.
Mowen, John C., Michael Minor. 2002. Perilaku Konsumen, Jilid Kedua Penerbit Erlangga : Jakarta.
Oliver, Richard L. (1999). Whence Consumer Loyalty? Journal of Marketing, 63, 33-44.
ö¨ ztaysI,Basar. Selime Sezgin& Ahmet Fahri O zok (2011) A measurement tool for CRM processes. Industrial
Management & Data Systems Vol. 111 No. 6, 2011 pp. 943-960
Rinny E. Kalalo, 2013. Customer Relationship Management dan Kualitas Pelayanan Pengaruhnya Terhadap
Loyalitas Konsumen PT. Matahari Dept. Store, Manado. Jurnal EMBA 1553 Vol. 1 No. 4 Desember 2013, Hal.
1553- 1561. ISSN 2303 -1174
Sheth, J.N. (2002), “The future of relationship marketing”, Journal of Services Marketing, Vol. 16 No. 7, pp.
590-2.
Sugiono, 2003. Metode Penelitian Bisnis . Penerbit Alfabeta : Bandung
Turban, Efraim. 2004. Electronic Commerce A Managerial Perspective. Prentice Hall: New Jersey
Advances in Economics, Business and Management Research, volume 124
954