
The Education of Beta - Callan · CALLAN INVESTMENTS INSTITUTE Research June 2014 The Education of...
33
Knowledge. Experience. Integrity. CALLAN INVESTMENTS INSTITUTE Research June 2014 The Education of Beta Can Alternative Indices Make Your Portfolio Smarter? Alternatives to traditional cap-weighted indices have been growing in popularity as investors strive to add diversification using a transparent, mechanical, and low-cost approach. Alternative index strategies, sometimes called “smart beta,” promise enhanced return, often with lower risk and greater diversification power. We examine a number of such strategies and find that many feature persistent tilts (especially to value and small cap stocks), which account for the majority of their risk and return characteristics. Because alternative index strategies reweight stocks from the same universe, diversification with stan- dard benchmarks has been very weak. Investors can use alternative index strategies to capture factor tilts instead of relying on active manage- ment, or they can reallocate assets out of cap-weighted index strategies to a middle ground between traditional passive and active. While past performance results have been strong, there is no reason to expect future outperformance from these strategies unless the embedded tilts continue to be rewarded. For those who really believe in factor tilts (such as value and small cap), risk premia strategies—which can invest across multiple asset classes and permit short-selling—are far more compelling than single- asset-class, long-only alternative index strategies. Introduction Implementing a strategic asset allocation policy used to be straightforward: the investor chose between active and passive approaches. Passive index tracking provided broad exposure to a market, a fully diver- sified benchmark for performance measurement, and passive returns with low implementation fees. Active management was everything else, mainly the realization of manager skill by delivering performance above the passive benchmark. Passive beta has long been synonymous with capitalization-weighted indices (CWI), where prices and shares outstanding determined a security’s weight and rebalancing was nearly automatic. Those were the good old days.
Transcript of The Education of Beta - Callan · CALLAN INVESTMENTS INSTITUTE Research June 2014 The Education of...
Knowledge. Experience. Integrity.
CALLAN INVESTMENTS INSTITUTE
Research
June 2014
The Education of Beta
Can Alternative Indices Make Your Portfolio Smarter?
Alternatives to traditional cap-weighted indices have been growing in popularity as investors strive to
add diversification using a transparent, mechanical, and low-cost approach.
Alternative index strategies, sometimes called “smart beta,” promise enhanced return, often with lower
risk and greater diversification power. We examine a number of such strategies and find that many
feature persistent tilts (especially to value and small cap stocks), which account for the majority of their
risk and return characteristics.
Because alternative index strategies reweight stocks from the same universe, diversification with stan-
dard benchmarks has been very weak.
Investors can use alternative index strategies to capture factor tilts instead of relying on active manage-
ment, or they can reallocate assets out of cap-weighted index strategies to a middle ground between
traditional passive and active.
While past performance results have been strong, there is no reason to expect future outperformance
from these strategies unless the embedded tilts continue to be rewarded.
For those who really believe in factor tilts (such as value and small cap), risk premia strategies—which
can invest across multiple asset classes and permit short-selling—are far more compelling than single-
asset-class, long-only alternative index strategies.
IntroductionImplementing a strategic asset allocation policy used to be straightforward: the investor chose between
active and passive approaches. Passive index tracking provided broad exposure to a market, a fully diver-
sified benchmark for performance measurement, and passive returns with low implementation fees. Active
management was everything else, mainly the realization of manager skill by delivering performance above
the passive benchmark. Passive beta has long been synonymous with capitalization-weighted indices
(CWI), where prices and shares outstanding determined a security’s weight and rebalancing was nearly
automatic. Those were the good old days.
2
Today so-called “smart beta” approaches aim to combine both passive and active elements to deliver the
best of both worlds: transparent construction, the promise of diversification, and all at low cost. In this
paper we explore how such strategies are put together, how they have performed over the past decade,
and how they can be used by investors. We also discuss observations about their future prospects.
Our research suggests that many forms of smart beta feature pronounced value and small cap tilts, which
account for a significant amount of the risk and return differences when compared to CWI. If investors de-
sire such tilts, they can be easily implemented using traditional passive and active strategies. The broader
question remains: What is the economic justification for such tilts to outperform over the long term?
Without a satisfactory answer, many smart beta strategies may not be a good fit for institutional portfolios.
The Demand for “Smarter” IndicesThough widely used, CWI have their shortcomings. Securities with inflated prices can balloon to take up
a larger and larger share of an index, like technology stocks during the dot-com bubble or financials prior
to the 2008 crisis. Investors who like to avoid bubbles (wouldn’t we all) have loudly, and often correctly,
criticized traditional indices for promoting stocks with poor fundamentals only to see values come crash-
ing down after the bubble has popped.
An increasing number of investors have been calling for different ways of constructing indices, with
weights determined by approaches as diverse as simple averages, quality of cash flows, or risk. These
investors see CWI as inefficient, and have conviction that they can be “smarter” about index construction.
Some of these alternative indices have been around for decades, others are newer and seek to make
traditional beta “smarter.”
First a brief comment on naming: many new strategies in this area are called “smart beta,” a name we
dislike because it tells you nothing about how it is smarter than plain-old dumb beta. The same goes for
the terms strategic, scientific, advanced, engineered, and even better beta. We refer to strategies that do
not use capitalization weights as “alternative indices” because they represent an alternate approach to
the norm. Many styles fall under the broad umbrella of alternative indices, including low volatility indices,
equally weighted indices, and fundamental indices. The category seems to be better defined by what it
is not, rather than by what it is: alternative indices are not capitalization weighted. They are also more
expensive than traditional index strategies, but cheaper than traditional active management.
What Was Old Is New AgainLike many financial innovations, alternative indices became popular in the wake of a crisis. Investor reaction
to major drawdowns, increased focus on diversification, and bubble avoidance set the stage for strategies
that would have done better through the turmoil of 2008. Though the monikers “smart beta” and “alternative
index” are relatively new, the design has been around for decades. Take the Dow Jones Industrial Average
(DJIA), first started in 1896. It is composed of a concentrated sampling of economically significant large
companies. These securities are then weighted using a lightly modified cap-weighted formula with some
constraints. In effect the DJIA is a “smart” index, though rarely referred to as such. Many more examples dot
the landscape, including simple GDP- and equal-weighted equity indices. The difference today, however,
3Knowledge. Experience. Integrity.
is not just the marketing. Novel construction can lead to strategies with unique traits. Similar to the dot-com
boom, when placing a lower case “i” or “e” in front of a company’s name nearly guaranteed a higher earn-
ings multiple, it would seem that calling your strategy “smart beta” instantly makes it more interesting and
relevant, and promises higher returns.
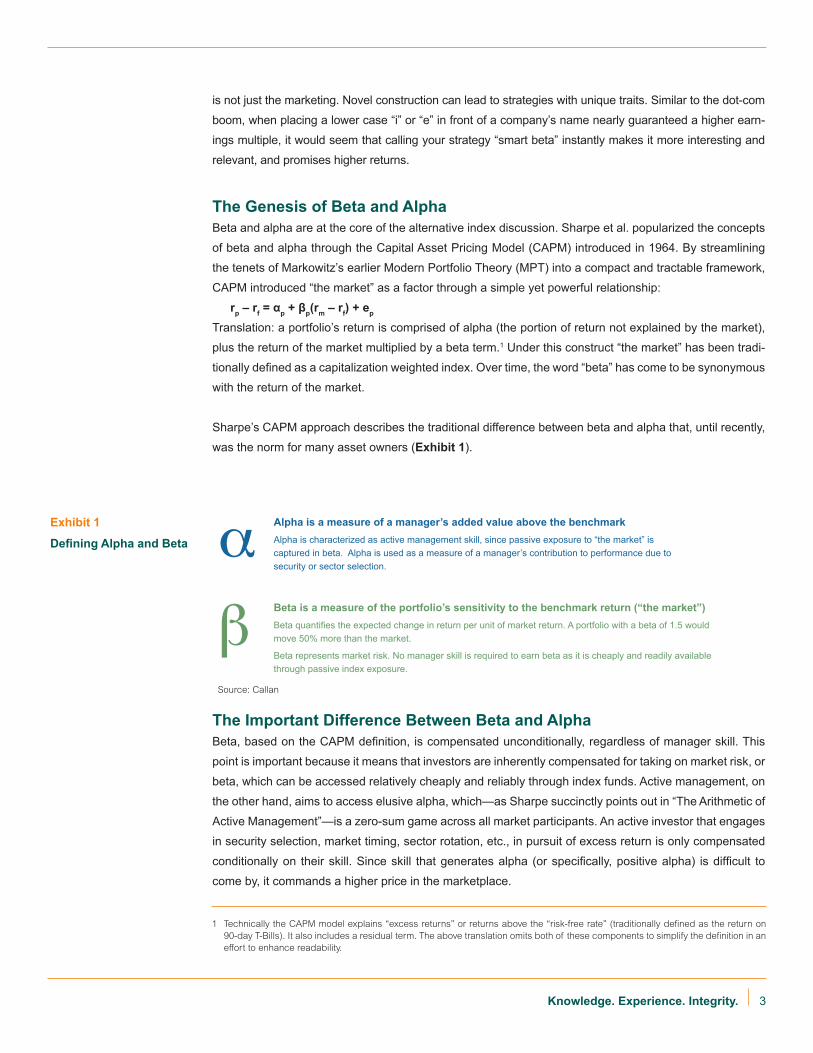
The Genesis of Beta and AlphaBeta and alpha are at the core of the alternative index discussion. Sharpe et al. popularized the concepts
of beta and alpha through the Capital Asset Pricing Model (CAPM) introduced in 1964. By streamlining
the tenets of Markowitz’s earlier Modern Portfolio Theory (MPT) into a compact and tractable framework,
CAPM introduced “the market” as a factor through a simple yet powerful relationship:
rp – rf = αp + βp(rm – rf) + ep
Translation: a portfolio’s return is comprised of alpha (the portion of return not explained by the market),
plus the return of the market multiplied by a beta term.1 Under this construct “the market” has been tradi-
tionally defined as a capitalization weighted index. Over time, the word “beta” has come to be synonymous
with the return of the market.
Sharpe’s CAPM approach describes the traditional difference between beta and alpha that, until recently,
was the norm for many asset owners (Exhibit 1).
Exhibit 1
Defining Alpha and Beta α
β
Alpha is a measure of a manager’s added value above the benchmarkAlpha is characterized as active management skill, since passive exposure to “the market” is captured in beta. Alpha is used as a measure of a manager’s contribution to performance due to security or sector selection.
Beta is a measure of the portfolio’s sensitivity to the benchmark return (“the market”)Beta quantifies the expected change in return per unit of market return. A portfolio with a beta of 1.5 would move 50% more than the market.
Beta represents market risk. No manager skill is required to earn beta as it is cheaply and readily available through passive index exposure.
The Important Difference Between Beta and AlphaBeta, based on the CAPM definition, is compensated unconditionally, regardless of manager skill. This
point is important because it means that investors are inherently compensated for taking on market risk, or
beta, which can be accessed relatively cheaply and reliably through index funds. Active management, on
the other hand, aims to access elusive alpha, which—as Sharpe succinctly points out in “The Arithmetic of
Active Management”—is a zero-sum game across all market participants. An active investor that engages
in security selection, market timing, sector rotation, etc., in pursuit of excess return is only compensated
conditionally on their skill. Since skill that generates alpha (or specifically, positive alpha) is difficult to
come by, it commands a higher price in the marketplace.
1 Technically the CAPM model explains “excess returns” or returns above the “risk-free rate” (traditionally defined as the return on 90-day T-Bills). It also includes a residual term. The above translation omits both of these components to simplify the definition in an effort to enhance readability.
Source: Callan
4
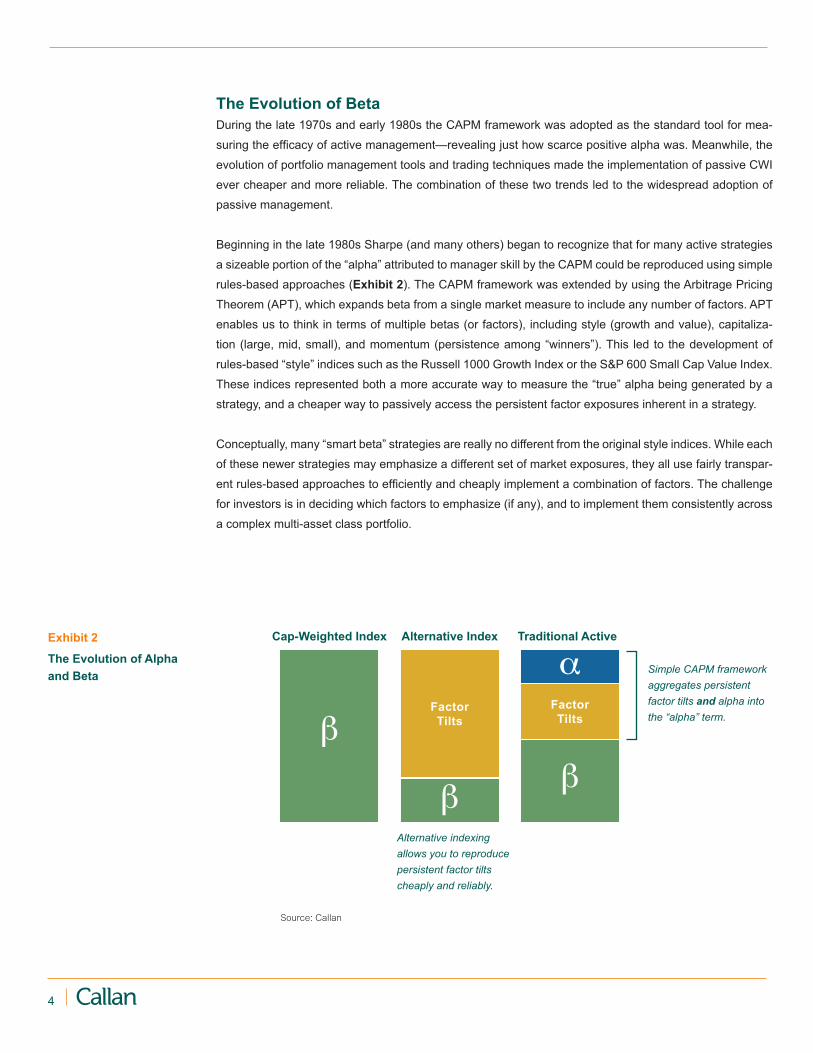
The Evolution of BetaDuring the late 1970s and early 1980s the CAPM framework was adopted as the standard tool for mea-
suring the efficacy of active management—revealing just how scarce positive alpha was. Meanwhile, the
evolution of portfolio management tools and trading techniques made the implementation of passive CWI
ever cheaper and more reliable. The combination of these two trends led to the widespread adoption of
passive management.
Beginning in the late 1980s Sharpe (and many others) began to recognize that for many active strategies
a sizeable portion of the “alpha” attributed to manager skill by the CAPM could be reproduced using simple
rules-based approaches (Exhibit 2). The CAPM framework was extended by using the Arbitrage Pricing
Theorem (APT), which expands beta from a single market measure to include any number of factors. APT
enables us to think in terms of multiple betas (or factors), including style (growth and value), capitaliza-
tion (large, mid, small), and momentum (persistence among “winners”). This led to the development of
rules-based “style” indices such as the Russell 1000 Growth Index or the S&P 600 Small Cap Value Index.
These indices represented both a more accurate way to measure the “true” alpha being generated by a
strategy, and a cheaper way to passively access the persistent factor exposures inherent in a strategy.
Conceptually, many “smart beta” strategies are really no different from the original style indices. While each
of these newer strategies may emphasize a different set of market exposures, they all use fairly transpar-
ent rules-based approaches to efficiently and cheaply implement a combination of factors. The challenge
for investors is in deciding which factors to emphasize (if any), and to implement them consistently across
a complex multi-asset class portfolio.
Exhibit 2
The Evolution of Alpha and Beta
β
ββ
αFactor Tilts
Factor Tilts
Alternative Index Traditional ActiveCap-Weighted Index
Alternative indexing allows you to reproduce persistent factor tilts cheaply and reliably.
Simple CAPM framework aggregates persistent factor tilts and alpha into the “alpha” term.
Source: Callan
5Knowledge. Experience. Integrity.
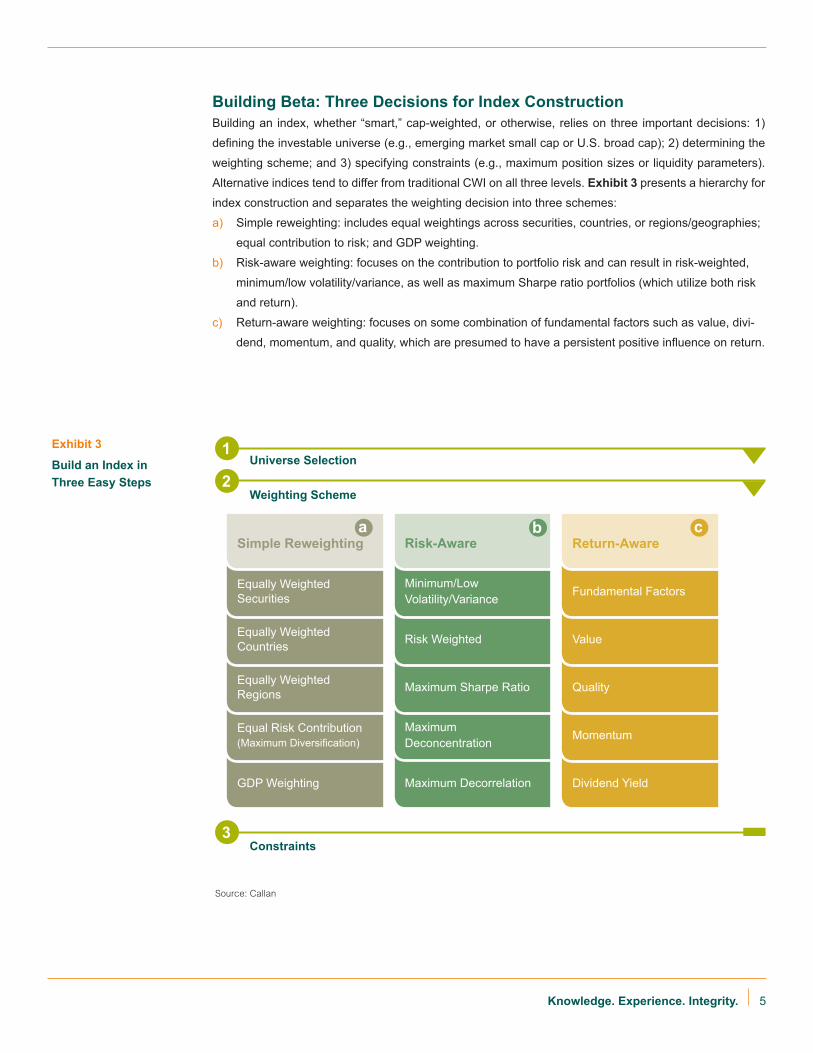
Exhibit 3
Build an Index in Three Easy Steps
Building Beta: Three Decisions for Index ConstructionBuilding an index, whether “smart,” cap-weighted, or otherwise, relies on three important decisions: 1)
defining the investable universe (e.g., emerging market small cap or U.S. broad cap); 2) determining the
weighting scheme; and 3) specifying constraints (e.g., maximum position sizes or liquidity parameters).
Alternative indices tend to differ from traditional CWI on all three levels. Exhibit 3 presents a hierarchy for
index construction and separates the weighting decision into three schemes:
a) Simple reweighting: includes equal weightings across securities, countries, or regions/geographies;
equal contribution to risk; and GDP weighting.
b) Risk-aware weighting: focuses on the contribution to portfolio risk and can result in risk-weighted,
minimum/low volatility/variance, as well as maximum Sharpe ratio portfolios (which utilize both risk
and return).
c) Return-aware weighting: focuses on some combination of fundamental factors such as value, divi-
dend, momentum, and quality, which are presumed to have a persistent positive influence on return.
GDP Weighting
Equal Risk Contribution(Maximum Diversification)
Equally Weighted Regions
Equally Weighted Countries
Equally Weighted Securities
Simple Reweighting
Maximum Decorrelation
Maximum Deconcentration
Maximum Sharpe Ratio
Risk Weighted
Minimum/Low Volatility/Variance
Risk-Aware
Dividend Yield
Momentum
Quality
Value
Fundamental Factors
Return-Aware
1
2
3
a b c
Universe Selection
Weighting Scheme
Constraints
Source: Callan
6
Before proceeding to alternative indices, we briefly explore how three common cap-weighted equity indi-
ces are constructed: the S&P 500, Russell 3000, and MSCI EAFE.
• The S&P 500’s universe selection includes “500 of the top companies in leading industries of the U.S.
economy” with market capitalizations of more than $4.6 billion (as of March 31, 2014), and with at
least 50% of the shares outstanding available for trading. The inclusion criteria are carefully managed
by committee and therefore do not simply represent the largest 500 companies. Constituent stocks
are weighted based on market capitalization and constraints, including positive earnings over recent
periods and adequate liquidity.2
• The Russell 3000 is more transparent in construction, as the universe selection consists of all U.S.
common stocks. These are ranked annually from largest to smallest market capitalization, and the top
3000 stocks form the Russell 3000 Index. Constraints exclude stocks that trade for less than $1.00,
stocks with market capitalizations under $30 million, and foreign stocks.3
• The MSCI EAFE (Europe, Australasia, and Far East) selects the largest 85% of stocks from each of
21 developed market countries, weighted by free-float adjusted market capitalization (which includes
only shares readily available in the market), with typical liquidity and investability constraints applied.4
Build Your Own IndexIn the cap-weighted examples above, the universe selection alone can provide a portfolio bias toward
some characteristics (as in the S&P 500), while the weighting scheme determines how individual securi-
ties are combined. Some alternative indices are specified entirely at the universe selection level. For in-
stance, the allowable universe can be defined as low volatility stocks (those with lower historical standard
deviations), but the weighting scheme may be cap-weights. Typically alternative indices both redefine the
universe and employ an alternative weighting scheme. A low volatility index may use the same starting
point as the example above, but can weight those low volatility securities in a risk-minimizing manner to
create a minimum-variance portfolio. Multiple approaches can be combined, and the process can be ap-
plied to equity or fixed income securities.
The Limits of DiversificationMany alternative index approaches introduce tilts when compared to traditional CWI, such as overweight-
ing value or small cap stocks. These factor tilts seem incidental at first. They are rarely obvious when
learning about how a particular strategy is built, but they are crucial to our understanding of how alternative
indices differ from CWI. Just like traditional CWI, alternative indices focus on a single asset class, equities
most often, and are long-only (no shorting is allowed). Although alternative indices can be found in several
asset classes, we focus our analysis exclusively on U.S. equity strategies.
2 S&P Dow Jones Indices.
3 Russell.
4 MSCI.
7Knowledge. Experience. Integrity.
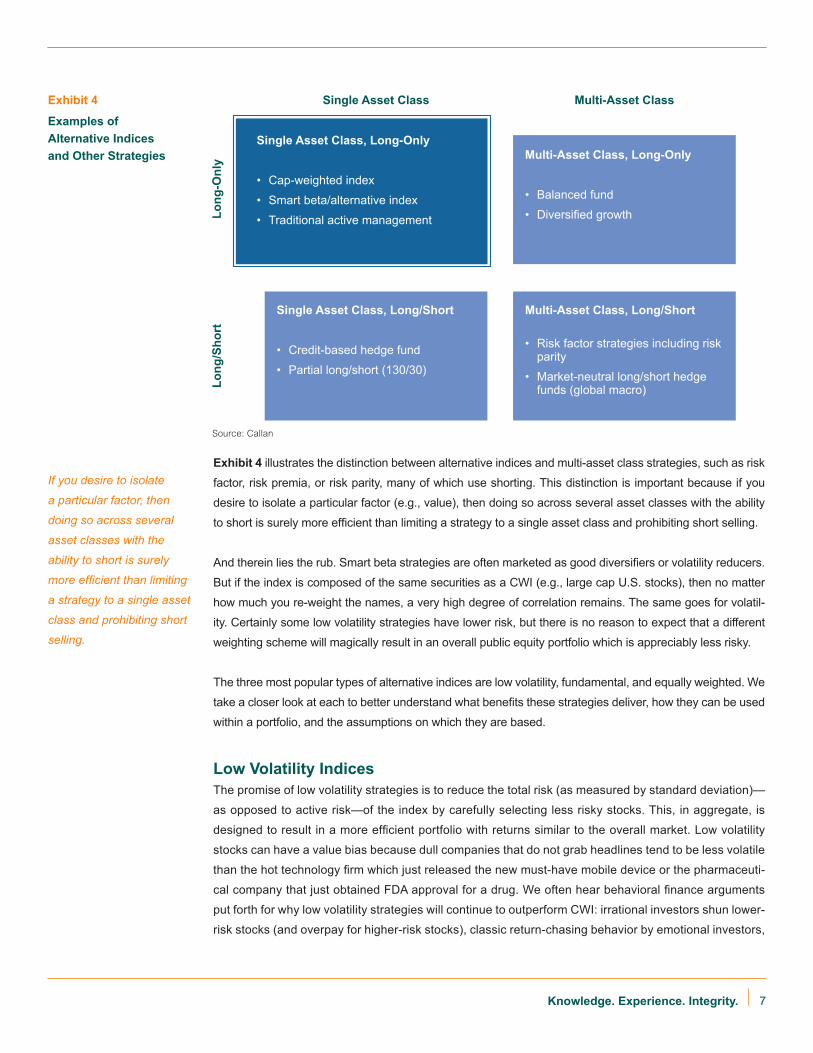
Exhibit 4
Examples of Alternative Indices and Other Strategies
Single Asset Class Multi-Asset Class
Long
-Onl
yLo
ng/S
hort
Single Asset Class, Long-Only
• Cap-weighted index
• Smart beta/alternative index
• Traditional active management
Multi-Asset Class, Long-Only
• Balanced fund
• Diversified growth
Multi-Asset Class, Long/Short
• Risk factor strategies including risk parity
• Market-neutral long/short hedge funds (global macro)
Single Asset Class, Long/Short
• Credit-based hedge fund
• Partial long/short (130/30)
If you desire to isolate
a particular factor, then
doing so across several
asset classes with the
ability to short is surely
more efficient than limiting
a strategy to a single asset
class and prohibiting short
selling.
Exhibit 4 illustrates the distinction between alternative indices and multi-asset class strategies, such as risk
factor, risk premia, or risk parity, many of which use shorting. This distinction is important because if you
desire to isolate a particular factor (e.g., value), then doing so across several asset classes with the ability
to short is surely more efficient than limiting a strategy to a single asset class and prohibiting short selling.
And therein lies the rub. Smart beta strategies are often marketed as good diversifiers or volatility reducers.
But if the index is composed of the same securities as a CWI (e.g., large cap U.S. stocks), then no matter
how much you re-weight the names, a very high degree of correlation remains. The same goes for volatil-
ity. Certainly some low volatility strategies have lower risk, but there is no reason to expect that a different
weighting scheme will magically result in an overall public equity portfolio which is appreciably less risky.
The three most popular types of alternative indices are low volatility, fundamental, and equally weighted. We
take a closer look at each to better understand what benefits these strategies deliver, how they can be used
within a portfolio, and the assumptions on which they are based.
Low Volatility IndicesThe promise of low volatility strategies is to reduce the total risk (as measured by standard deviation)—
as opposed to active risk—of the index by carefully selecting less risky stocks. This, in aggregate, is
designed to result in a more efficient portfolio with returns similar to the overall market. Low volatility
stocks can have a value bias because dull companies that do not grab headlines tend to be less volatile
than the hot technology firm which just released the new must-have mobile device or the pharmaceuti-
cal company that just obtained FDA approval for a drug. We often hear behavioral finance arguments
put forth for why low volatility strategies will continue to outperform CWI: irrational investors shun lower-
risk stocks (and overpay for higher-risk stocks), classic return-chasing behavior by emotional investors,
Source: Callan
8
and asset managers focusing on information ratios rather than Sharpe ratios. Not all market participants
believe that these behaviors will persist.
Low volatility strategies represent a number of approaches that include minimum volatility, minimum vari-
ance, and maximum Sharpe ratio (MSR). While these terms sound somewhat similar, there are big differ-
ences in the way each strategy is assembled. There are three main approaches to putting together such
an index. The first involves just picking from a set of low volatility stocks and using capitalization weights.
The second expands on this by using optimization tools to weight the low volatility stocks into a low volatility
portfolio. The third approach is to select from low and high volatility stocks and optimize them into a portfolio
with the best return/risk ratio (as represented by the Sharpe ratio). The subtleties are important because
each approach leads to a unique portfolio.
The MSCI USA Minimum Volatility Index uses the MSCI USA as a starting point and optimizes the stocks
for the lowest absolute volatility (subject to constraints which help maintain investability). On the surface
the strategy seems to meet the stated goals: over the past 10 years, performance has exceeded the S&P
500 by 0.85% while realized standard deviation has been lower (11.66% versus 14.69%). However, over
the past five years performance has lagged the CWI S&P 500 by 1.56%. Tracking error, when compared
to the S&P 500, has been similar to many traditional active managers, in the 5% to 7% range—a far cry
from the 0% expected of cap-weighted index-tracking funds.
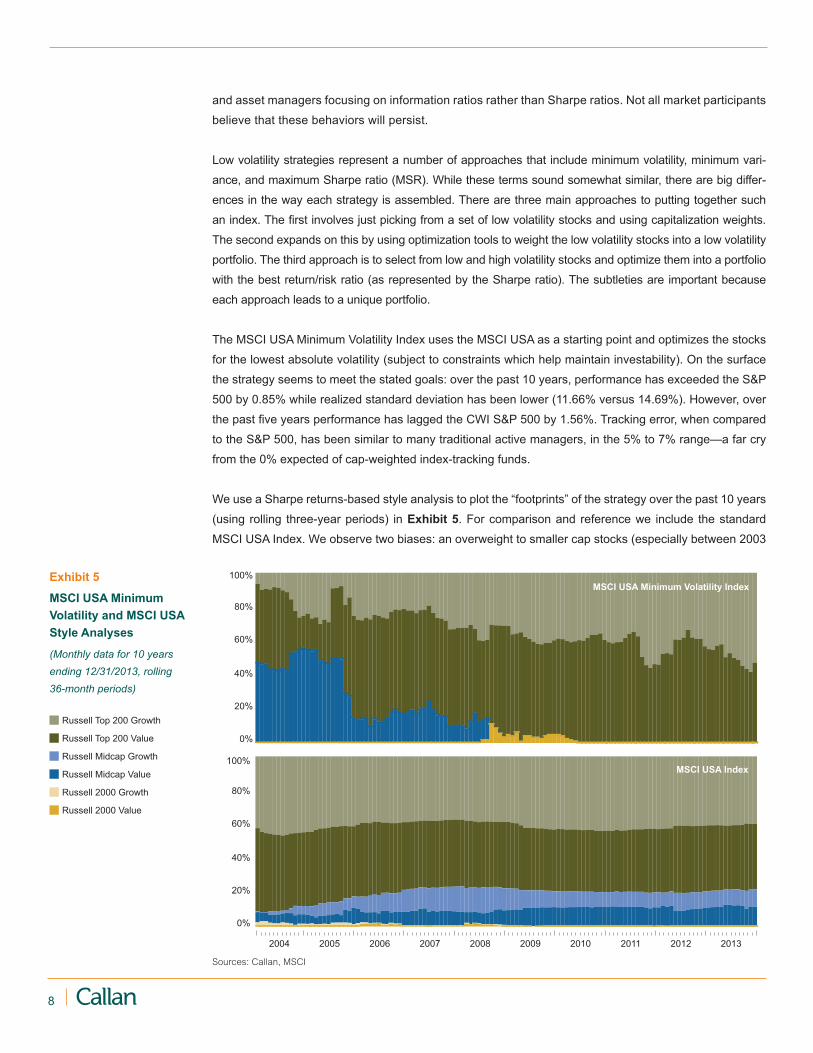
We use a Sharpe returns-based style analysis to plot the “footprints” of the strategy over the past 10 years
(using rolling three-year periods) in Exhibit 5. For comparison and reference we include the standard
MSCI USA Index. We observe two biases: an overweight to smaller cap stocks (especially between 2003
Exhibit 5
MSCI USA Minimum Volatility and MSCI USA Style Analyses
(Monthly data for 10 years ending 12/31/2013, rolling 36-month periods)
0%
20%
40%
60%
80%
100%
0%
20%
40%
60%
80%
100%
2004 2005 2006 2007 2008 2009 2010 2011 2012 2013
MSCI USA Minimum Volatility Index
MSCI USA Index
Russell Top 200 Growth
Russell Top 200 Value
Russell 2000 Growth
Russell 2000 Value
Russell Midcap Growth
Russell Midcap Value
Sources: Callan, MSCI
9Knowledge. Experience. Integrity.
and 2008) and a pronounced value tilt (darker shaded bars). The choppiness observed in the low volatility
analysis is due to frequent required rebalancing, a hallmark of all alternative index strategies. The MSCI
USA Minimum Volatility Index annual turnover is constrained to a maximum of 20% as compared to a real-
ized turnover of 2.5% for the cap-weighted MSCI USA.5
The R2 measure, which can range from 0 to 1, indicates the proportion of variation in the returns that is ex-
plained by the characterization in the style analysis. The minimum volatility index’s R2 is nearly 0.75, which
implies a moderately strong relationship: something other than simply re-weighting slices of CWI is respon-
sible for the return pattern. For reference, the MSCI USA Index R2 is 0.99.
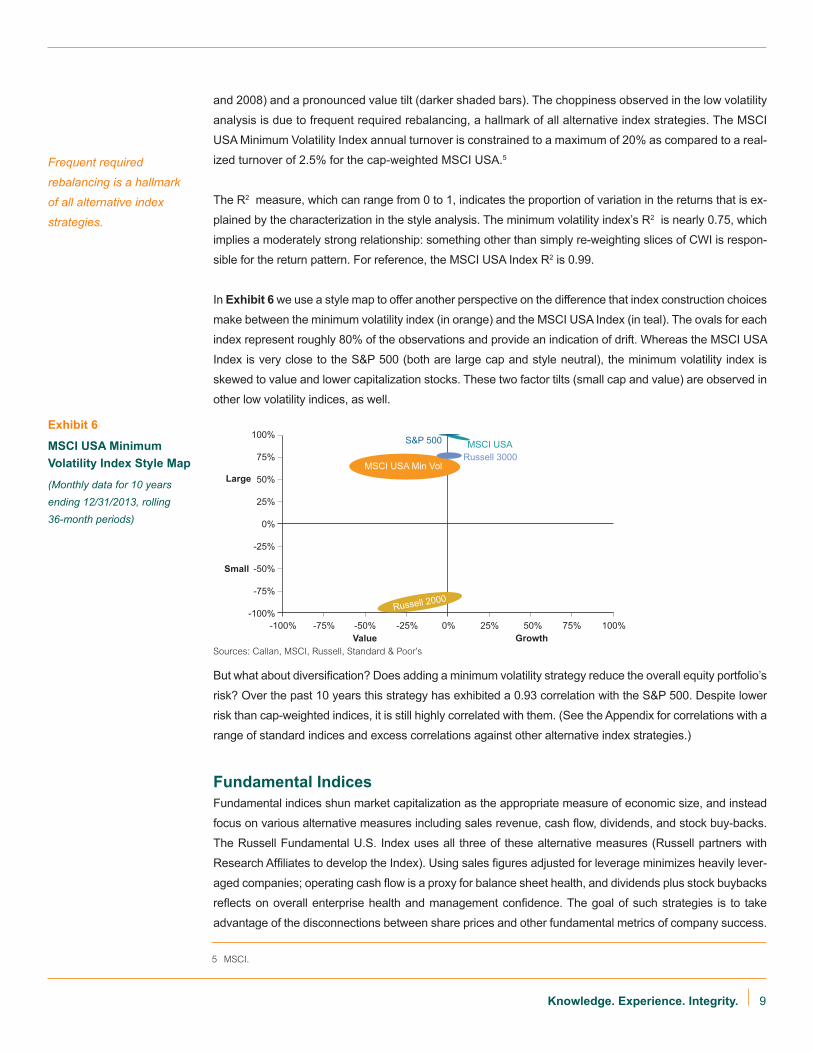
In Exhibit 6 we use a style map to offer another perspective on the difference that index construction choices
make between the minimum volatility index (in orange) and the MSCI USA Index (in teal). The ovals for each
index represent roughly 80% of the observations and provide an indication of drift. Whereas the MSCI USA
Index is very close to the S&P 500 (both are large cap and style neutral), the minimum volatility index is
skewed to value and lower capitalization stocks. These two factor tilts (small cap and value) are observed in
other low volatility indices, as well.
But what about diversification? Does adding a minimum volatility strategy reduce the overall equity portfolio’s
risk? Over the past 10 years this strategy has exhibited a 0.93 correlation with the S&P 500. Despite lower
risk than cap-weighted indices, it is still highly correlated with them. (See the Appendix for correlations with a
range of standard indices and excess correlations against other alternative index strategies.)
Fundamental IndicesFundamental indices shun market capitalization as the appropriate measure of economic size, and instead
focus on various alternative measures including sales revenue, cash flow, dividends, and stock buy-backs.
The Russell Fundamental U.S. Index uses all three of these alternative measures (Russell partners with
Research Affiliates to develop the Index). Using sales figures adjusted for leverage minimizes heavily lever-
aged companies; operating cash flow is a proxy for balance sheet health, and dividends plus stock buybacks
reflects on overall enterprise health and management confidence. The goal of such strategies is to take
advantage of the disconnections between share prices and other fundamental metrics of company success.
Exhibit 6
MSCI USA Minimum Volatility Index Style Map
(Monthly data for 10 years ending 12/31/2013, rolling 36-month periods)
Large
Small
Value Growth
100%
100%
75%
75%
50%
50%
25%
25%
0%
0%
-25%
-25%
-50%
-50%
-75%
-75%-100%
-100%
S&P 500 MSCI USARussell 3000
MSCI USA Min Vol
Russell 2000
Frequent required
rebalancing is a hallmark
of all alternative index
strategies.
5 MSCI.
Sources: Callan, MSCI, Russell, Standard & Poor’s
10
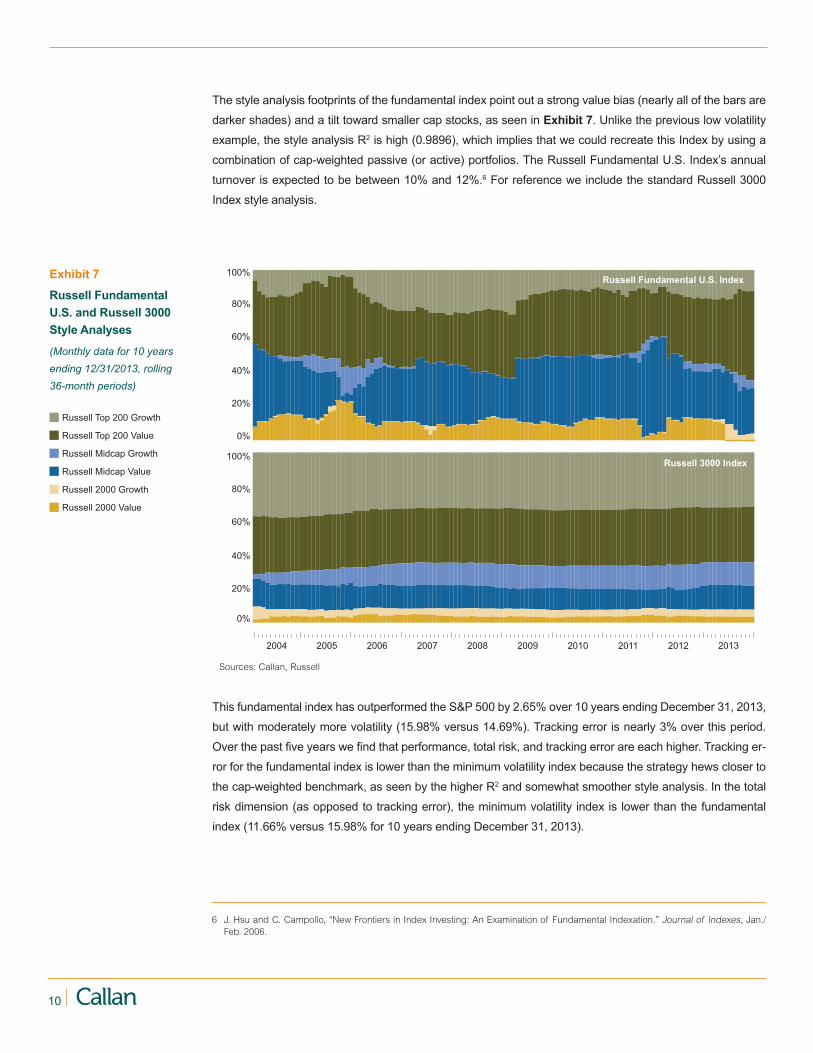
The style analysis footprints of the fundamental index point out a strong value bias (nearly all of the bars are
darker shades) and a tilt toward smaller cap stocks, as seen in Exhibit 7. Unlike the previous low volatility
example, the style analysis R2 is high (0.9896), which implies that we could recreate this Index by using a
combination of cap-weighted passive (or active) portfolios. The Russell Fundamental U.S. Index’s annual
turnover is expected to be between 10% and 12%.6 For reference we include the standard Russell 3000
Index style analysis.
This fundamental index has outperformed the S&P 500 by 2.65% over 10 years ending December 31, 2013,
but with moderately more volatility (15.98% versus 14.69%). Tracking error is nearly 3% over this period.
Over the past five years we find that performance, total risk, and tracking error are each higher. Tracking er-
ror for the fundamental index is lower than the minimum volatility index because the strategy hews closer to
the cap-weighted benchmark, as seen by the higher R2 and somewhat smoother style analysis. In the total
risk dimension (as opposed to tracking error), the minimum volatility index is lower than the fundamental
index (11.66% versus 15.98% for 10 years ending December 31, 2013).
Exhibit 7
Russell Fundamental U.S. and Russell 3000 Style Analyses
(Monthly data for 10 years ending 12/31/2013, rolling 36-month periods)
0%
20%
40%
60%
80%
100%
0%
20%
40%
60%
80%
100%
2004 2005 2006 2007 2008 2009 2010 2011 2012 2013
Russell 3000 Index
Russell Fundamental U.S. Index
Russell Top 200 Growth
Russell Top 200 Value
Russell 2000 Growth
Russell 2000 Value
Russell Midcap Growth
Russell Midcap Value
6 J. Hsu and C. Campollo, “New Frontiers in Index Investing: An Examination of Fundamental Indexation.” Journal of Indexes, Jan./Feb. 2006.
Sources: Callan, Russell
11Knowledge. Experience. Integrity.
Equally Weighted IndicesEqual weighting is the simplest form of index construction. In light of the more complex approaches dis-
cussed above, just averaging an entire universe eliminates many complicated choices. One well-known
example is the S&P 500 Equal Weight Index, which consists of the same constituents as the widely tracked
S&P 500, but with each company allocated a fixed 0.2% weight. Intuitively we know that such a weighting
scheme will introduce a significant small cap bias because the stocks that have a lower market capitalization
are now held at the same weight as major multinational corporations. We expect that the portfolio will likely
also have a value tilt because equal weighting will expand the presence of value stocks, which tend to trade
at lower multiples. Equal weighting is widely used in active management, where, for instance, a fundamental
manager will equally weight 30 high-conviction stocks to form her portfolio.
Exhibit 8
Russell Fundamental U.S. Index Style Map
(Monthly data for 10 years ending 12/31/2013, rolling 36-month periods)
Large
Small
Value Growth
100%
100%
75%
75%
50%
50%
25%
25%
0%
0%
-25%
-25%
-50%
-50%
-75%
-75%-100%
-100%
S&P 500
Russell 3000
Russell Fundamental
Russell 2000
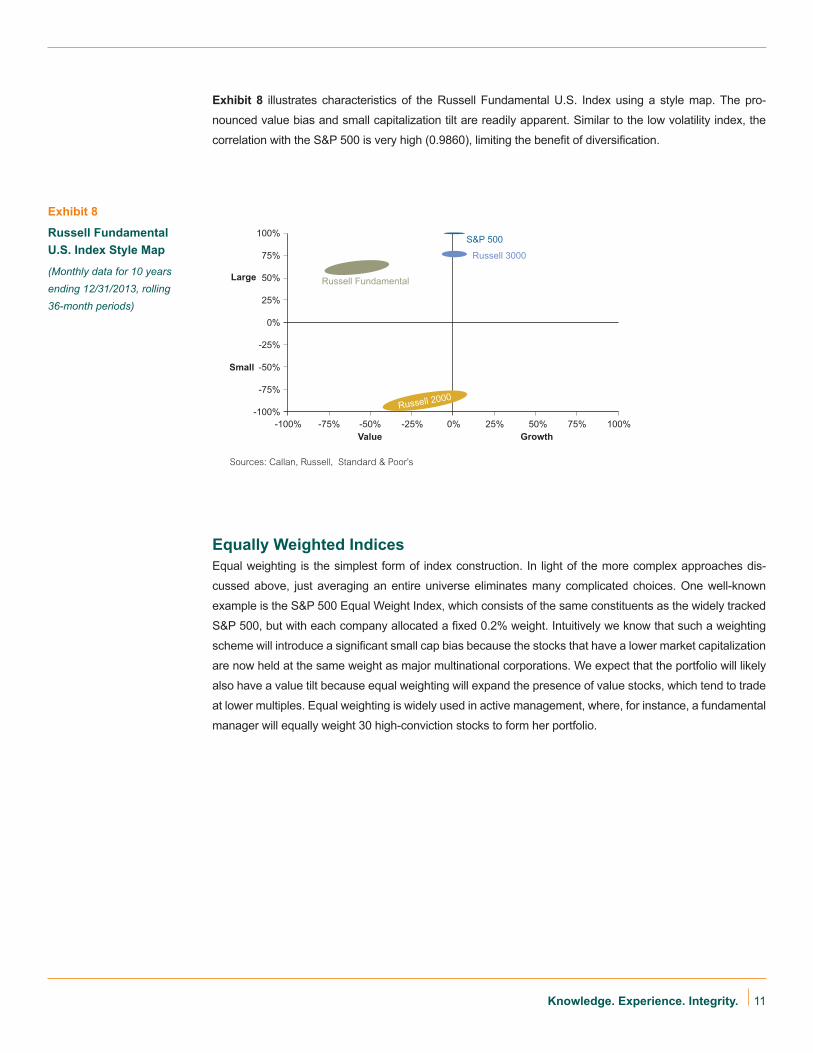
Exhibit 8 illustrates characteristics of the Russell Fundamental U.S. Index using a style map. The pro-
nounced value bias and small capitalization tilt are readily apparent. Similar to the low volatility index, the
correlation with the S&P 500 is very high (0.9860), limiting the benefit of diversification.
Sources: Callan, Russell, Standard & Poor’s
12
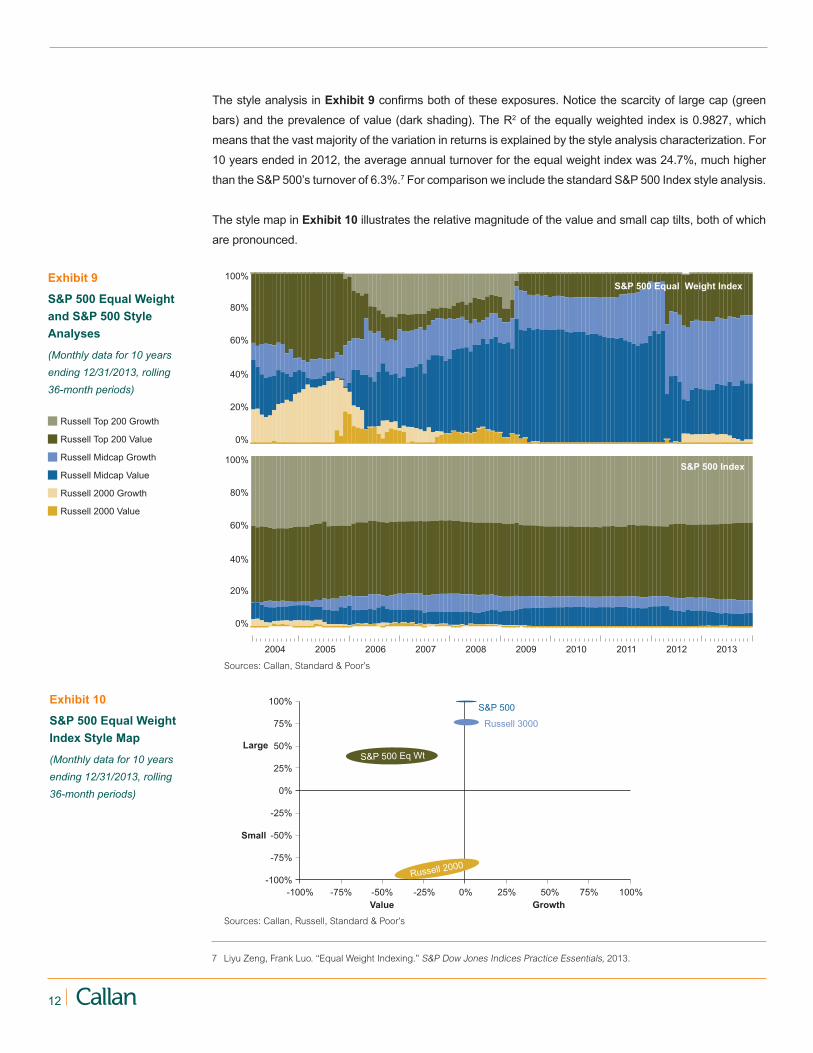
The style analysis in Exhibit 9 confirms both of these exposures. Notice the scarcity of large cap (green
bars) and the prevalence of value (dark shading). The R2 of the equally weighted index is 0.9827, which
means that the vast majority of the variation in returns is explained by the style analysis characterization. For
10 years ended in 2012, the average annual turnover for the equal weight index was 24.7%, much higher
than the S&P 500’s turnover of 6.3%.7 For comparison we include the standard S&P 500 Index style analysis.
The style map in Exhibit 10 illustrates the relative magnitude of the value and small cap tilts, both of which
are pronounced.
Exhibit 10
S&P 500 Equal Weight Index Style Map
(Monthly data for 10 years ending 12/31/2013, rolling 36-month periods)
Large
Small
Value Growth
100%
100%
75%
75%
50%
50%
25%
25%
0%
0%
-25%
-25%
-50%
-50%
-75%
-75%-100%
-100%
S&P 500
Russell 3000
S&P 500 Eq Wt
Russell 2000
Exhibit 9
S&P 500 Equal Weight and S&P 500 Style Analyses
(Monthly data for 10 years ending 12/31/2013, rolling 36-month periods)
0%
20%
40%
60%
80%
100%
0%
20%
40%
60%
80%
100%
2004 2005 2006 2007 2008 2009 2010 2011 2012 2013
S&P 500 Index
S&P 500 Equal Weight Index
Russell Top 200 Growth
Russell Top 200 Value
Russell 2000 Growth
Russell 2000 Value
Russell Midcap Growth
Russell Midcap Value
7 Liyu Zeng, Frank Luo. “Equal Weight Indexing.” S&P Dow Jones Indices Practice Essentials, 2013.
Sources: Callan, Standard & Poor’s
Sources: Callan, Russell, Standard & Poor’s

13Knowledge. Experience. Integrity.
As with the two previous examples, performance relative to the S&P 500 has been strong over the past 10
years, with the equal weight index beating the cap-weighted benchmark by 2.38%. However, historical risk
over this period was much higher, 17.61% versus 14.69% for the S&P 500. Similarly, tracking error is near
5%. This index relies on the same stocks as in the S&P 500, so we expect a very high correlation with the
cap-weighted index. Over the 10-year period ending December 31, 2013, the correlation is 0.9743. Looking
forward, we have a hard time developing an economic justification for why equal weighting a portfolio should
deliver outsized returns.
All three alternative index strategies seem to exhibit positive performance versus cap-weighted benchmarks.
This could be for a variety of reasons, including the use of data mining in the development of these strate-
gies. Value and small cap were rewarded over the past 10 years; the amount of readily available data does
not include many periods where these strategies underperform. Factor tilts are prevalent in alternative indi-
ces and have certainly paid off recently—but is it reasonable to assume that they will do so going forward?
Interested readers can examine findings from eight additional alternative indices covering U.S. and non- U.S.
equity in the Appendix. Results are broadly similar across all strategy types.
Alternative Indices: Active or Passive?Does a mechanical, rules-based strategy meet the definition of active management? A strong argument can
be made that any weighting scheme or security selection process other than cap-weighted is active. For a
real world illustration we turn to “low-risk active” or “enhanced indexing” strategies popularized in the 1990s
by quantitatively oriented asset managers. These strategies start with a CWI, and then carefully reweight the
component stocks or bonds within tightly defined parameters while adhering to industry and sector neutrality.
Enhanced index strategies were presented to investors as lower-fee, quasi-passive products, but were then
typically categorized as active strategies because the portfolio manager’s judgment could effectively over-
ride model weights. The primary difference between alternative and “enhanced” index strategies has to do
with where decisions are made in the hierarchy of portfolio management events—in universe selection and
weighting schemes for alternative index strategies, and in security selection for enhanced index products
(given that the universe selection is the same as the underlying benchmark and differences between bench-
mark capitalization weighting and enhanced portfolios are relatively small). Another big difference is that
enhanced index strategies are tuned to minimize tracking error relative to a traditional CWI, whereas alterna-
tive indices are constructed without tracking error in mind. Selecting a “tilt” is itself an act of judgment, and
renders the resulting alternative index strategy active. The decision to include an alternative index strategy
in a portfolio is an active one, even if the implementation of the strategy is mainly passive. The investor is
making an active choice, akin to the decision that an asset manager makes when tilting a portfolio toward a
certain factor, security, sector, or region.
Like active management, if all market participants adopted alternative index strategies, the average of their
investments would still aggregate to traditional CWI definitions. This process feeds back into setting prices
and informs CWI weights. Alternative indices aggregate to a zero-sum game.
The decision to include an
alternative index strategy in
a portfolio is an active one.
14
Where Do Alternative Index Strategies Fit in the Portfolio?Alternative index strategies are typically single-asset class and long-only, and are relatively easy to place
within the corresponding equity or fixed income sleeve. Some investors may want to include alternative
index strategies in their hedge fund or alternatives allocations. However, should capital for alternative index
strategies be sourced from existing active or passive CWI allocations? The answer may depend on how
skeptical the investor is of traditional active management. Allocating to lower-fee, transparent, and mechani-
cal alternative index strategies may make sense for investors who grudgingly engage in active management.
On the other hand, investors who are convinced of the merit of active management may wish to exchange
traditional index holdings for alternative index strategies (resulting in additional tracking error). We have
observed alternative index strategies used in the following ways:
• Low/minimum volatility strategies coupled with liability-driven investing (LDI) portfolios promise low
surplus risk8 for investors who are hedging liabilities.
• Low/minimum volatility strategies, used when an investor is required to hold a high equity allocation,
aim to reduce overall portfolio risk.
• Fundamental index strategies can be a substitute for CWI if the investor believes they are more repre-
sentative of “the market,” or as a substitute for active managers for active management non-believers.
• Equally weighted approaches intentionally lower portfolio capitalization, which offers liquidity to the
small cap market.
All alternative index strategies strive to deliver a return stream different from traditional strategies, but as
previously noted, their diversification has limits.
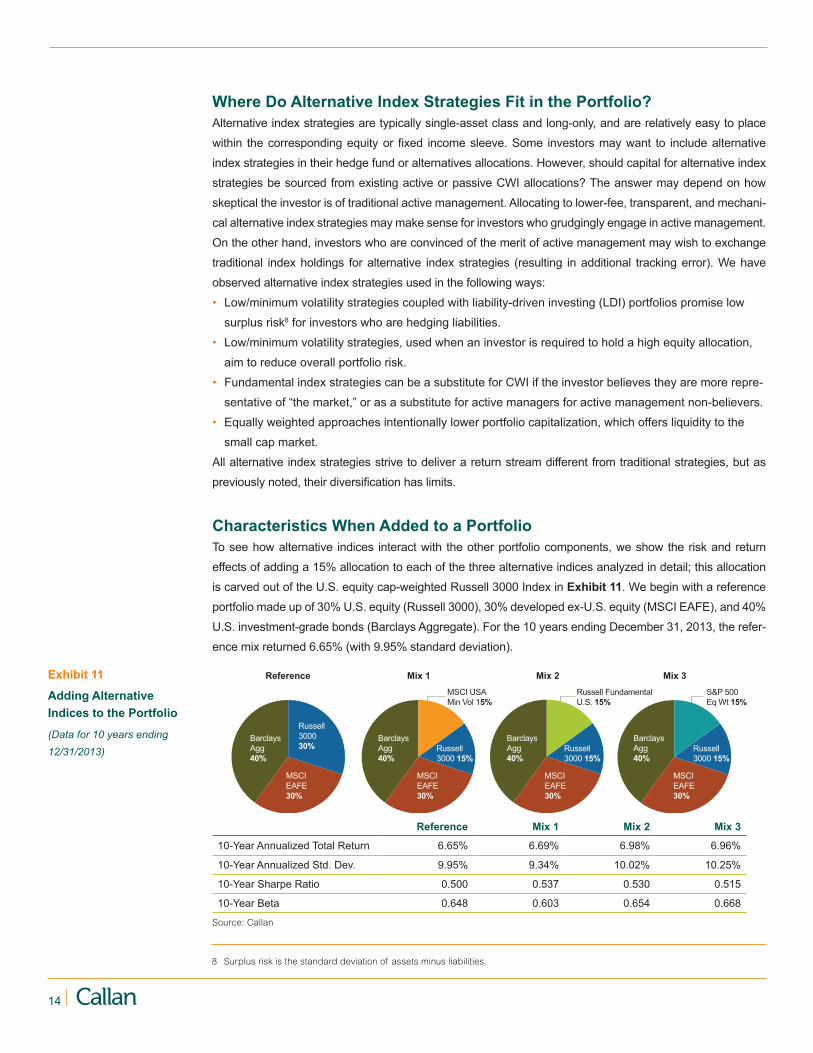
Characteristics When Added to a PortfolioTo see how alternative indices interact with the other portfolio components, we show the risk and return
effects of adding a 15% allocation to each of the three alternative indices analyzed in detail; this allocation
is carved out of the U.S. equity cap-weighted Russell 3000 Index in Exhibit 11. We begin with a reference
portfolio made up of 30% U.S. equity (Russell 3000), 30% developed ex-U.S. equity (MSCI EAFE), and 40%
U.S. investment-grade bonds (Barclays Aggregate). For the 10 years ending December 31, 2013, the refer-
ence mix returned 6.65% (with 9.95% standard deviation).
Exhibit 11
Adding Alternative Indices to the Portfolio
(Data for 10 years ending 12/31/2013)
Russell300030%
MSCIEAFE30%
MSCIEAFE30%
MSCIEAFE30%
BarclaysAgg40%
BarclaysAgg40%
BarclaysAgg40%
MSCI USA Min Vol 15%
Russell3000 15%
Russell3000 15%
Russell FundamentalU.S. 15%
S&P 500Eq Wt 15%
MSCIEAFE30%
BarclaysAgg40%
Reference Mix 1 Mix 2 Mix 3
Russell3000 15%
Reference Mix 1 Mix 2 Mix 3
10-Year Annualized Total Return 6.65% 6.69% 6.98% 6.96%
10-Year Annualized Std. Dev. 9.95% 9.34% 10.02% 10.25%
10-Year Sharpe Ratio 0.500 0.537 0.530 0.515
10-Year Beta 0.648 0.603 0.654 0.668
8 Surplus risk is the standard deviation of assets minus liabilities.
Source: Callan
15Knowledge. Experience. Integrity.
Mixes one, two, and three each add 15% to a single alternative index strategy (MSCI USA Minimum Volatil-
ity Index, Russell Fundamental U.S. Index, and S&P 500 Equal Weight Index, respectively). All three mixes
achieved higher return than the reference portfolio, but Mix two and Mix three did so by assuming more risk,
while Mix one (with the minimum volatility index) somewhat lowered portfolio risk. Detailed characteristics for
each strategy can be found in the Appendix.
This backward-looking analysis suggests that adding moderate amounts of alternative index strategies to
a standard reference portfolio slightly improves risk-adjusted return characteristics. Whether these relation-
ships persist going forward is the obvious question for asset owners. To assert a return premium or risk
advantage over CWI, we must believe that the universe selection and weighting scheme decisions offer an
economic or behavioral rationale for better returns.
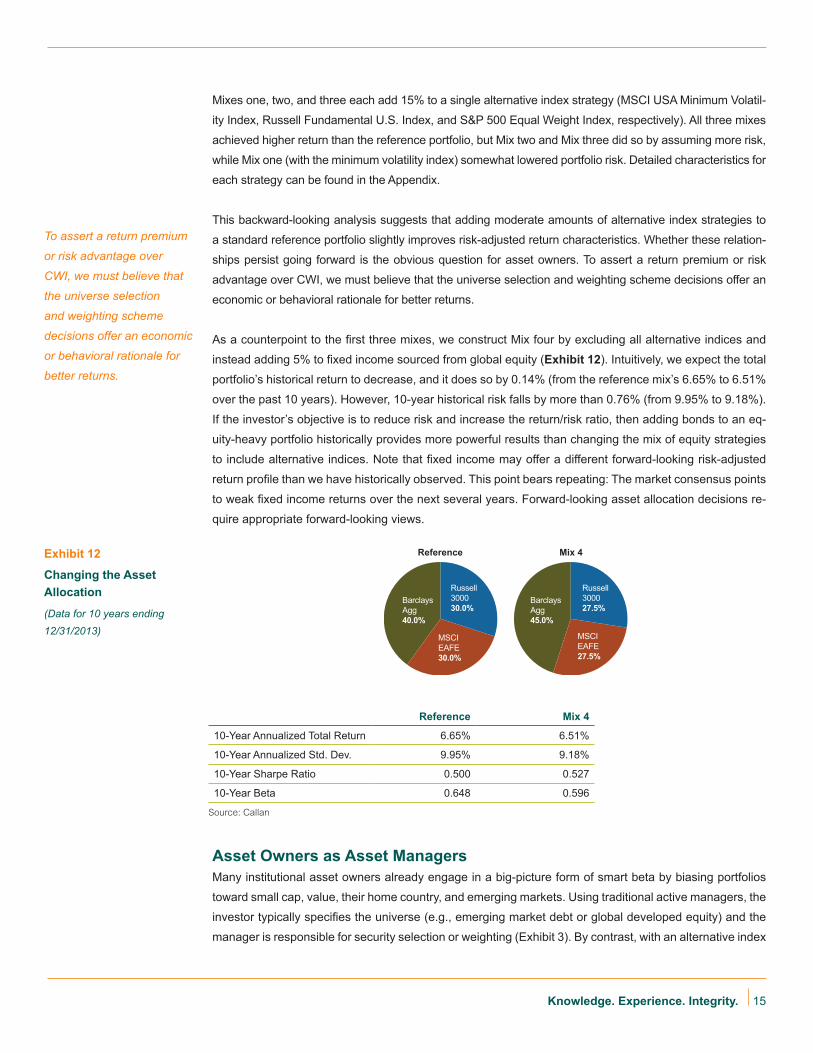
As a counterpoint to the first three mixes, we construct Mix four by excluding all alternative indices and
instead adding 5% to fixed income sourced from global equity (Exhibit 12). Intuitively, we expect the total
portfolio’s historical return to decrease, and it does so by 0.14% (from the reference mix’s 6.65% to 6.51%
over the past 10 years). However, 10-year historical risk falls by more than 0.76% (from 9.95% to 9.18%).
If the investor’s objective is to reduce risk and increase the return/risk ratio, then adding bonds to an eq-
uity-heavy portfolio historically provides more powerful results than changing the mix of equity strategies
to include alternative indices. Note that fixed income may offer a different forward-looking risk-adjusted
return profile than we have historically observed. This point bears repeating: The market consensus points
to weak fixed income returns over the next several years. Forward-looking asset allocation decisions re-
quire appropriate forward-looking views.
Exhibit 12
Changing the Asset Allocation
(Data for 10 years ending 12/31/2013)
Russell300030.0%
MSCIEAFE30.0%
BarclaysAgg40.0%
Russell300027.5%
MSCIEAFE27.5%
BarclaysAgg45.0%
Reference Mix 4
Reference Mix 4
10-Year Annualized Total Return 6.65% 6.51%
10-Year Annualized Std. Dev. 9.95% 9.18%
10-Year Sharpe Ratio 0.500 0.527
10-Year Beta 0.648 0.596
To assert a return premium
or risk advantage over
CWI, we must believe that
the universe selection
and weighting scheme
decisions offer an economic
or behavioral rationale for
better returns.
Asset Owners as Asset ManagersMany institutional asset owners already engage in a big-picture form of smart beta by biasing portfolios
toward small cap, value, their home country, and emerging markets. Using traditional active managers, the
investor typically specifies the universe (e.g., emerging market debt or global developed equity) and the
manager is responsible for security selection or weighting (Exhibit 3). By contrast, with an alternative index
Source: Callan
16
strategy these decisions are shifted to the asset owner. This shift on a policy level, from CWI to alternative
indices, moves some of the asset management burden to the asset owner because they are now respon-
sible for security selection and other basic strategy definitions. Those investors allocating to alternative
index strategies should have appropriate governance and benchmarking policies in place.
ConclusionThis paper has explored the origins of alternative indices, how their construction reveals specific factor
tilts, and their impact when paired with traditional cap-weighted indices in a portfolio. We examined three
alternative index strategies in detail and found that they feature significant exposure to value and small
cap, which may not be rewarded in the future, though historical performance has been favorable. The
various tilts found in alternative index strategies are obscured by naming conventions and marketing, but
are readily apparent upon empirical examination. Interested readers can find additional analysis (including
Fama-French-Carhart regression) on 11 alternative indices in the Appendix.
Alternative indices are one way to express a belief in value and small cap factor tilts. Investors already
use traditional value and small cap strategies (active and passive) to tilt portfolios toward these factors.
For an investor that really believes in value and small cap (or other factors), the most efficient way to im-
plement is by adopting a risk premia strategy that can invest across multiple asset classes and permits
short-selling, which is far more compelling than a single-asset class, long-only alternative index strategy.
Additionally, alternative indices appear to offer minimal diversification benefits versus traditional cap-
weighted indices: Rearranging stocks picked from the same pool still leads to very high correlations.
Investors who are skeptical of active management can use alternative indices to extend a passive core
to obtain exposure to desirable factors in a transparent manner. On the other hand, investors who be-
lieve in the value of active management can use alternative indices to obtain low-cost, semi-passive
exposure in a portfolio dominated by traditional active strategies. Regardless of your perspective, the
availability of a “middle ground” option located between active and passive enables greater control in
constructing portfolios of managers when implementing a strategic asset allocation.
For an investor that really
believes in value and small
cap (or other factors),
the most efficient way to
implement is by adopting
a risk premia strategy that
can invest across multiple
asset classes and permits
short-selling, which is far
more compelling than a
single-asset class, long-only
alternative index strategy.
Rearranging stocks
picked from the same pool
still leads to very high
correlations.
The author wishes to thank Greg Allen, Ivan “Butch” Cliff, and Jay Kloepfer for their essential contributions to the
development of this paper.
17Knowledge. Experience. Integrity.
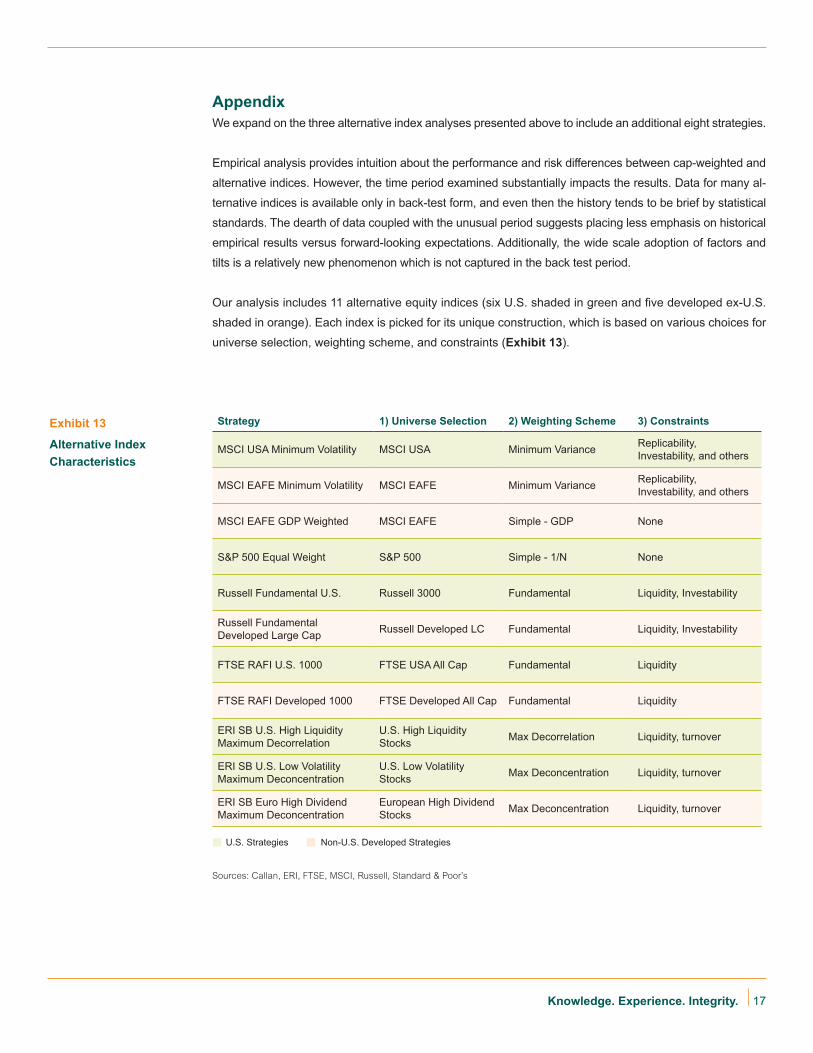
AppendixWe expand on the three alternative index analyses presented above to include an additional eight strategies.
Empirical analysis provides intuition about the performance and risk differences between cap-weighted and
alternative indices. However, the time period examined substantially impacts the results. Data for many al-
ternative indices is available only in back-test form, and even then the history tends to be brief by statistical
standards. The dearth of data coupled with the unusual period suggests placing less emphasis on historical
empirical results versus forward-looking expectations. Additionally, the wide scale adoption of factors and
tilts is a relatively new phenomenon which is not captured in the back test period.
Our analysis includes 11 alternative equity indices (six U.S. shaded in green and five developed ex-U.S.
shaded in orange). Each index is picked for its unique construction, which is based on various choices for
universe selection, weighting scheme, and constraints (Exhibit 13).
Strategy 1) Universe Selection 2) Weighting Scheme 3) Constraints
MSCI USA Minimum Volatility MSCI USA Minimum Variance Replicability, Investability, and others
MSCI EAFE Minimum Volatility MSCI EAFE Minimum Variance Replicability, Investability, and others
MSCI EAFE GDP Weighted MSCI EAFE Simple - GDP None
S&P 500 Equal Weight S&P 500 Simple - 1/N None
Russell Fundamental U.S. Russell 3000 Fundamental Liquidity, Investability
Russell Fundamental Developed Large Cap Russell Developed LC Fundamental Liquidity, Investability
FTSE RAFI U.S. 1000 FTSE USA All Cap Fundamental Liquidity
FTSE RAFI Developed 1000 FTSE Developed All Cap Fundamental Liquidity
ERI SB U.S. High Liquidity Maximum Decorrelation
U.S. High Liquidity Stocks Max Decorrelation Liquidity, turnover
ERI SB U.S. Low Volatility Maximum Deconcentration
U.S. Low Volatility Stocks Max Deconcentration Liquidity, turnover
ERI SB Euro High Dividend Maximum Deconcentration
European High Dividend Stocks Max Deconcentration Liquidity, turnover
Exhibit 13
Alternative Index Characteristics
U.S. Strategies Non-U.S. Developed Strategies
Sources: Callan, ERI, FTSE, MSCI, Russell, Standard & Poor’s
18
MSCI: The minimum volatility indices strive to reflect the performance characteristics of a minimum vari-
ance strategy by optimizing the parent index (MSCI USA and MSCI EAFE in this analysis) for the lowest
absolute volatility for a given covariance matrix of stock returns within a set of constraints that maintain
index replicability and investability. Constraints include turnover limits along with minimum and maximum
constituent allocations and sector and country weights relative to the parent index. The index is rebal-
anced (or re-optimized) semi-annually.
S&P: The equal weight index consists of the same constituents as the widely tracked S&P 500, but each
company is allocated a fixed weight (0.2%) and is rebalanced quarterly.
Russell/Research Affiliates: The index starts with the Russell Global Index universe with a liquidity
screen applied that captures 95% of liquidity based on average-daily-dollar-traded-volume to facilitate
investability. Three measures of economic size are selected: adjusted sales, retained operating cash flow,
and dividend plus buybacks, all averaged over five years. Securities representing the bottom 2% of the
fundamental weight are removed to enhance investability.
FTSE RAFI: The index comprises 1000 companies with the largest RAFI fundamental scores selected from
the corresponding FTSE parent indices. The scores are based on four fundamental factors: dividends, cash
flows, sales, and book value. Screens are applied for liquidity and the index is reviewed annually.
ERI: The maximum deconcentration strategy aims to maximize the effective number of stocks, which is
equivalent to minimizing the concentration as measured by the Herfindahl Index. This strategy aims to get
as close as possible to equal weights while respecting practical investment constraints, including turnover
and liquidity concerns. The maximum decorrelation strategies combine securities specifically to exploit the
risk reduction effect stemming from low correlations (instead of reducing portfolio risk by concentrating in
low volatility stocks). For high liquidity indices, only the most liquid constituents are selected (those with a
score above the 60th percentile). Index turnover is constrained and liquidity adjustments are made. The
indices are reviewed in full annually and are reoptimized at least biannually.
Our analysis shows that alternative index weighting schemes can lead to significant exposure to equity
risk factors, even in those cases where the strategy objective does not specify a factor tilt. We calculate
empirical results using two methods: 1) returns-based style analysis with index-based factors and 2)
Fama-French-Carhart four-factor regression for U.S.-based strategies and four-ratio regression for devel-
oped ex-U.S. strategies.
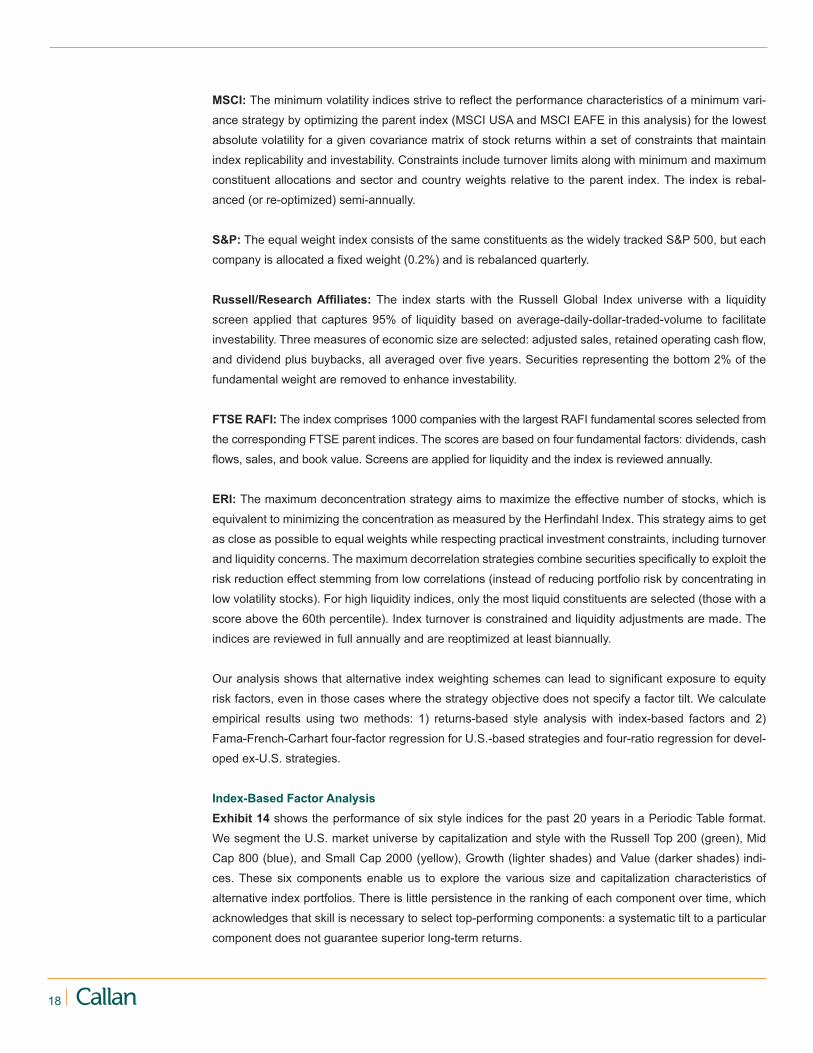
Index-Based Factor AnalysisExhibit 14 shows the performance of six style indices for the past 20 years in a Periodic Table format.
We segment the U.S. market universe by capitalization and style with the Russell Top 200 (green), Mid
Cap 800 (blue), and Small Cap 2000 (yellow), Growth (lighter shades) and Value (darker shades) indi-
ces. These six components enable us to explore the various size and capitalization characteristics of
alternative index portfolios. There is little persistence in the ranking of each component over time, which
acknowledges that skill is necessary to select top-performing components: a systematic tilt to a particular
component does not guarantee superior long-term returns.
19Knowledge. Experience. Integrity.
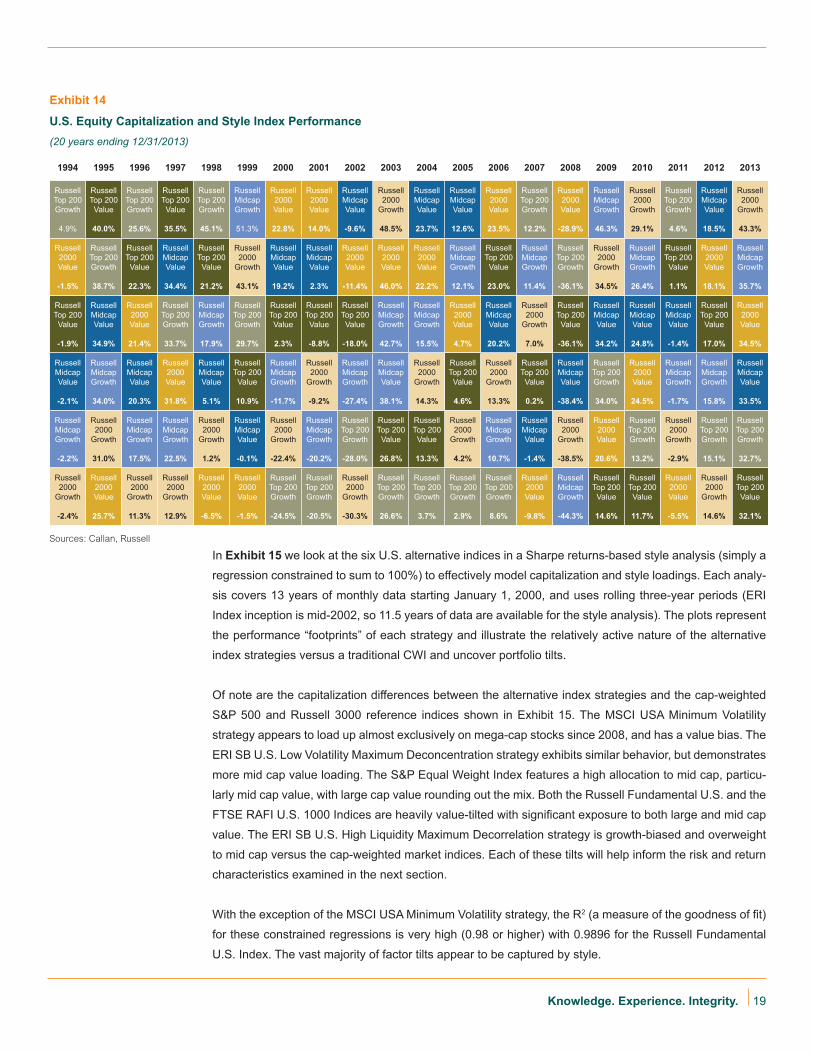
In Exhibit 15 we look at the six U.S. alternative indices in a Sharpe returns-based style analysis (simply a
regression constrained to sum to 100%) to effectively model capitalization and style loadings. Each analy-
sis covers 13 years of monthly data starting January 1, 2000, and uses rolling three-year periods (ERI
Index inception is mid-2002, so 11.5 years of data are available for the style analysis). The plots represent
the performance “footprints” of each strategy and illustrate the relatively active nature of the alternative
index strategies versus a traditional CWI and uncover portfolio tilts.
Of note are the capitalization differences between the alternative index strategies and the cap-weighted
S&P 500 and Russell 3000 reference indices shown in Exhibit 15. The MSCI USA Minimum Volatility
strategy appears to load up almost exclusively on mega-cap stocks since 2008, and has a value bias. The
ERI SB U.S. Low Volatility Maximum Deconcentration strategy exhibits similar behavior, but demonstrates
more mid cap value loading. The S&P Equal Weight Index features a high allocation to mid cap, particu-
larly mid cap value, with large cap value rounding out the mix. Both the Russell Fundamental U.S. and the
FTSE RAFI U.S. 1000 Indices are heavily value-tilted with significant exposure to both large and mid cap
value. The ERI SB U.S. High Liquidity Maximum Decorrelation strategy is growth-biased and overweight
to mid cap versus the cap-weighted market indices. Each of these tilts will help inform the risk and return
characteristics examined in the next section.
With the exception of the MSCI USA Minimum Volatility strategy, the R2 (a measure of the goodness of fit)
for these constrained regressions is very high (0.98 or higher) with 0.9896 for the Russell Fundamental
U.S. Index. The vast majority of factor tilts appear to be captured by style.
Exhibit 14
U.S. Equity Capitalization and Style Index Performance (20 years ending 12/31/2013)
1994 1995 1996 1997 1998 1999 2000 2001 2002 2003 2004 2005 2006 2007 2008 2009 2010 2011 2012 2013
Russell Top 200 Growth
4.9%
Russell Top 200 Value
40.0%
Russell Top 200 Growth
25.6%
Russell Top 200 Value
35.5%
Russell Top 200 Growth
45.1%
Russell Midcap Growth
51.3%
Russell 2000 Value
22.8%
Russell 2000 Value
14.0%
Russell Midcap Value
-9.6%
Russell 2000
Growth
48.5%
Russell Midcap Value
23.7%
Russell Midcap Value
12.6%
Russell 2000 Value
23.5%
Russell Top 200 Growth
12.2%
Russell 2000 Value
-28.9%
Russell Midcap Growth
46.3%
Russell 2000
Growth
29.1%
Russell Top 200 Growth
4.6%
Russell Midcap Value
18.5%
Russell 2000
Growth
43.3%
Russell 2000 Value
-1.5%
Russell Top 200 Growth
38.7%
Russell Top 200 Value
22.3%
Russell Midcap Value
34.4%
Russell Top 200 Value
21.2%
Russell 2000
Growth
43.1%
Russell Midcap Value
19.2%
Russell Midcap Value
2.3%
Russell 2000 Value
-11.4%
Russell 2000 Value
46.0%
Russell 2000 Value
22.2%
Russell Midcap Growth
12.1%
Russell Top 200 Value
23.0%
Russell Midcap Growth
11.4%
Russell Top 200 Growth
-36.1%
Russell 2000
Growth
34.5%
Russell Midcap Growth
26.4%
Russell Top 200 Value
1.1%
Russell 2000 Value
18.1%
Russell Midcap Growth
35.7%
Russell Top 200 Value
-1.9%
Russell Midcap Value
34.9%
Russell 2000 Value
21.4%
Russell Top 200 Growth
33.7%
Russell Midcap Growth
17.9%
Russell Top 200 Growth
29.7%
Russell Top 200 Value
2.3%
Russell Top 200 Value
-8.8%
Russell Top 200 Value
-18.0%
Russell Midcap Growth
42.7%
Russell Midcap Growth
15.5%
Russell 2000 Value
4.7%
Russell Midcap Value
20.2%
Russell 2000
Growth
7.0%
Russell Top 200 Value
-36.1%
Russell Midcap Value
34.2%
Russell Midcap Value
24.8%
Russell Midcap Value
-1.4%
Russell Top 200 Value
17.0%
Russell 2000 Value
34.5%
Russell Midcap Value
-2.1%
Russell Midcap Growth
34.0%
Russell Midcap Value
20.3%
Russell 2000 Value
31.8%
Russell Midcap Value
5.1%
Russell Top 200 Value
10.9%
Russell Midcap Growth
-11.7%
Russell 2000
Growth
-9.2%
Russell Midcap Growth
-27.4%
Russell Midcap Value
38.1%
Russell 2000
Growth
14.3%
Russell Top 200 Value
4.6%
Russell 2000
Growth
13.3%
Russell Top 200 Value
0.2%
Russell Midcap Value
-38.4%
Russell Top 200 Growth
34.0%
Russell 2000 Value
24.5%
Russell Midcap Growth
-1.7%
Russell Midcap Growth
15.8%
Russell Midcap Value
33.5%
Russell Midcap Growth
-2.2%
Russell 2000
Growth
31.0%
Russell Midcap Growth
17.5%
Russell Midcap Growth
22.5%
Russell 2000
Growth
1.2%
Russell Midcap Value
-0.1%
Russell 2000
Growth
-22.4%
Russell Midcap Growth
-20.2%
Russell Top 200 Growth
-28.0%
Russell Top 200 Value
26.8%
Russell Top 200 Value
13.3%
Russell 2000
Growth
4.2%
Russell Midcap Growth
10.7%
Russell Midcap Value
-1.4%
Russell 2000
Growth
-38.5%
Russell 2000 Value
20.6%
Russell Top 200 Growth
13.2%
Russell 2000
Growth
-2.9%
Russell Top 200 Growth
15.1%
Russell Top 200 Growth
32.7%
Russell 2000
Growth
-2.4%
Russell 2000 Value
25.7%
Russell 2000
Growth
11.3%
Russell 2000
Growth
12.9%
Russell 2000 Value
-6.5%
Russell 2000 Value
-1.5%
Russell Top 200 Growth
-24.5%
Russell Top 200 Growth
-20.5%
Russell 2000
Growth
-30.3%
Russell Top 200 Growth
26.6%
Russell Top 200 Growth
3.7%
Russell Top 200 Growth
2.9%
Russell Top 200 Growth
8.6%
Russell 2000 Value
-9.8%
Russell Midcap Growth
-44.3%
Russell Top 200 Value
14.6%
Russell Top 200 Value
11.7%
Russell 2000 Value
-5.5%
Russell 2000
Growth
14.6%
Russell Top 200 Value
32.1%
Sources: Callan, Russell

20
0%
20%
40%
60%
80%
100%
2004 2005 2006 2007 2008 2009 2010 2011 2012 2013
S&P 500 Equal Weight Index
0%
20%
40%
60%
80%
100%MSCI USA Minimum Volatility Index
0%
20%
40%
60%
80%
100%FTSE RAFI U.S. 1000 Index
0%
20%
40%
60%
80%
100%
0%
20%
40%
60%
80%
100%ERI SB U.S. Low-Volatility Maximum Deconcentration Index
0%
20%
40%
60%
80%
100%ERI SB U.S. High-Liquidity Maximum Decorrelation Index
Russell Fundamental U.S. Index
No data available
No data available
Russell Top 200 Growth
Russell Top 200 Value
Russell 2000 Growth
Russell 2000 Value
Russell Midcap Growth
Russell Midcap Value
Exhibit 15
U.S. Alternative Index Style Analyses (Monthly data for 10 years ending 12/31/2013, rolling 36-month periods)
Sources: Callan, ERI, FTSE, MSCI, Russell, Standard & Poor’s
21Knowledge. Experience. Integrity.
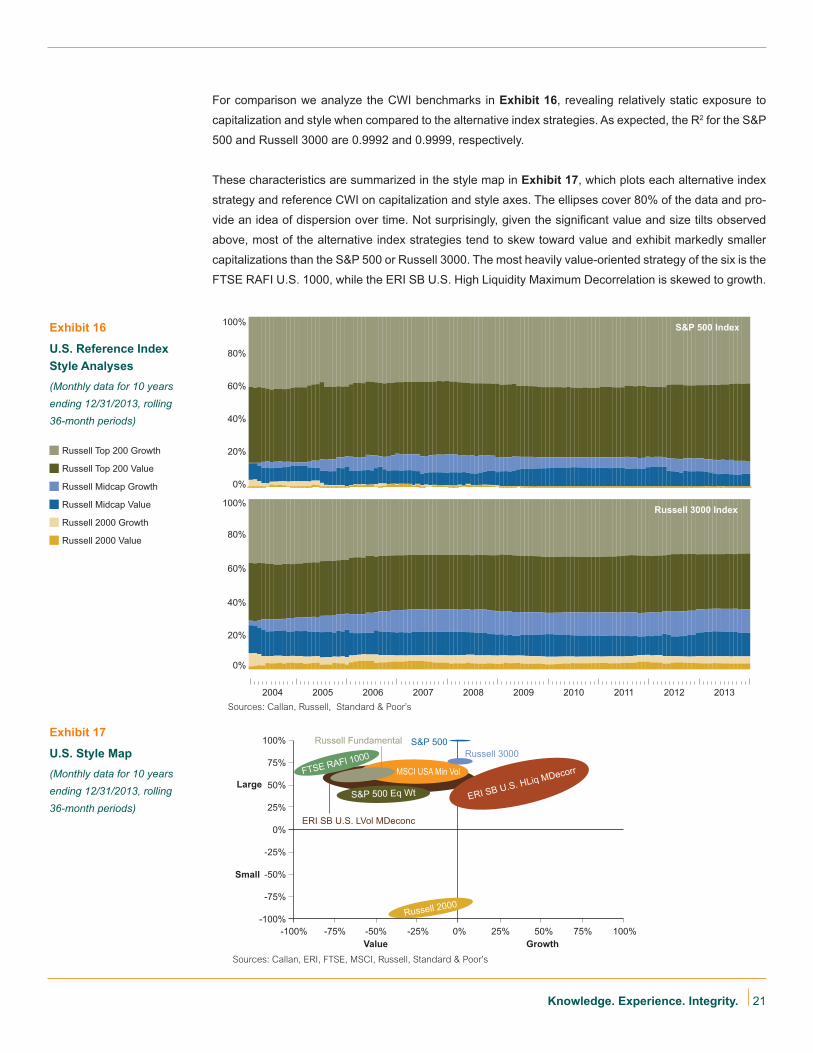
For comparison we analyze the CWI benchmarks in Exhibit 16, revealing relatively static exposure to
capitalization and style when compared to the alternative index strategies. As expected, the R2 for the S&P
500 and Russell 3000 are 0.9992 and 0.9999, respectively.
These characteristics are summarized in the style map in Exhibit 17, which plots each alternative index
strategy and reference CWI on capitalization and style axes. The ellipses cover 80% of the data and pro-
vide an idea of dispersion over time. Not surprisingly, given the significant value and size tilts observed
above, most of the alternative index strategies tend to skew toward value and exhibit markedly smaller
capitalizations than the S&P 500 or Russell 3000. The most heavily value-oriented strategy of the six is the
FTSE RAFI U.S. 1000, while the ERI SB U.S. High Liquidity Maximum Decorrelation is skewed to growth.
Russell Top 200 Growth
Russell Top 200 Value
Russell 2000 Growth
Russell 2000 Value
Russell Midcap Growth
Russell Midcap Value
Exhibit 16
U.S. Reference Index Style Analyses (Monthly data for 10 years ending 12/31/2013, rolling 36-month periods)
Exhibit 17
U.S. Style Map (Monthly data for 10 years ending 12/31/2013, rolling 36-month periods)
0%
20%
40%
60%
80%
100%
2004 2005 2006 2007 2008 2009 2010 2011 2012 2013
S&P 500 Index
0%
20%
40%
60%
80%
100%Russell 3000 Index
Large
Small
Value Growth
100%
100%
75%
75%
50%
50%
25%
25%
0%
0%
-25%
-25%
-50%
-50%
-75%
-75%-100%
-100%
S&P 500Russell 3000
Russell Fundamental
ERI SB U.S. LVol MDeconc
Russell 2000
MSCI USA Min Vol
S&P 500 Eq Wt
FTSE RAFI 1000
ERI SB U.S. HLiq MDecorr
Sources: Callan, Russell, Standard & Poor’s
Sources: Callan, ERI, FTSE, MSCI, Russell, Standard & Poor’s
22
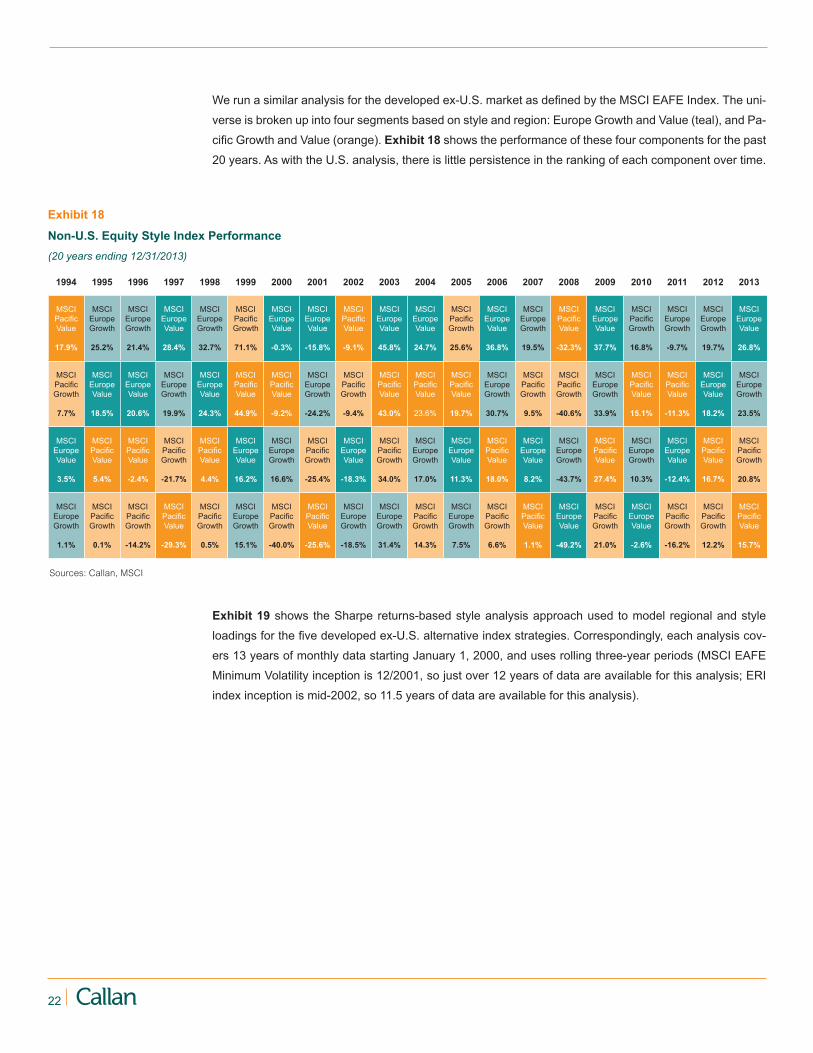
We run a similar analysis for the developed ex-U.S. market as defined by the MSCI EAFE Index. The uni-
verse is broken up into four segments based on style and region: Europe Growth and Value (teal), and Pa-
cific Growth and Value (orange). Exhibit 18 shows the performance of these four components for the past
20 years. As with the U.S. analysis, there is little persistence in the ranking of each component over time.
Exhibit 18
Non-U.S. Equity Style Index Performance (20 years ending 12/31/2013)
1994 1995 1996 1997 1998 1999 2000 2001 2002 2003 2004 2005 2006 2007 2008 2009 2010 2011 2012 2013
MSCI Pacific Value
17.9%
MSCI Europe Growth
25.2%
MSCI Europe Growth
21.4%
MSCI Europe Value
28.4%
MSCI Europe Growth
32.7%
MSCI Pacific Growth
71.1%
MSCI Europe Value
-0.3%
MSCI Europe Value
-15.8%
MSCI Pacific Value
-9.1%
MSCI Europe Value
45.8%
MSCI Europe Value
24.7%
MSCI Pacific Growth
25.6%
MSCI Europe Value
36.8%
MSCI Europe Growth
19.5%
MSCI Pacific Value
-32.3%
MSCI Europe Value
37.7%
MSCI Pacific Growth
16.8%
MSCI Europe Growth
-9.7%
MSCI Europe Growth
19.7%
MSCI Europe Value
26.8%
MSCI Pacific Growth
7.7%
MSCI Europe Value
18.5%
MSCI Europe Value
20.6%
MSCI Europe Growth
19.9%
MSCI Europe Value
24.3%
MSCI Pacific Value
44.9%
MSCI Pacific Value
-9.2%
MSCI Europe Growth
-24.2%
MSCI Pacific Growth
-9.4%
MSCI Pacific Value
43.0%
MSCI Pacific Value
23.6%
MSCI Pacific Value
19.7%
MSCI Europe Growth
30.7%
MSCI Pacific Growth
9.5%
MSCI Pacific Growth
-40.6%
MSCI Europe Growth
33.9%
MSCI Pacific Value
15.1%
MSCI Pacific Value
-11.3%
MSCI Europe Value
18.2%
MSCI Europe Growth
23.5%
MSCI Europe Value
3.5%
MSCI Pacific Value
5.4%
MSCI Pacific Value
-2.4%
MSCI Pacific Growth
-21.7%
MSCI Pacific Value
4.4%
MSCI Europe Value
16.2%
MSCI Europe Growth
16.6%
MSCI Pacific Growth
-25.4%
MSCI Europe Value
-18.3%
MSCI Pacific Growth
34.0%
MSCI Europe Growth
17.0%
MSCI Europe Value
11.3%
MSCI Pacific Value
18.0%
MSCI Europe Value
8.2%
MSCI Europe Growth
-43.7%
MSCI Pacific Value
27.4%
MSCI Europe Growth
10.3%
MSCI Europe Value
-12.4%
MSCI Pacific Value
16.7%
MSCI Pacific Growth
20.8%
MSCI Europe Growth
1.1%
MSCI Pacific Growth
0.1%
MSCI Pacific Growth
-14.2%
MSCI Pacific Value
-29.3%
MSCI Pacific Growth
0.5%
MSCI Europe Growth
15.1%
MSCI Pacific Growth
-40.0%
MSCI Pacific Value
-25.6%
MSCI Europe Growth
-18.5%
MSCI Europe Growth
31.4%
MSCI Pacific Growth
14.3%
MSCI Europe Growth
7.5%
MSCI Pacific Growth
6.6%
MSCI Pacific Value
1.1%
MSCI Europe Value
-49.2%
MSCI Pacific Growth
21.0%
MSCI Europe Value
-2.6%
MSCI Pacific Growth
-16.2%
MSCI Pacific Growth
12.2%
MSCI Pacific Value
15.7%
Exhibit 19 shows the Sharpe returns-based style analysis approach used to model regional and style
loadings for the five developed ex-U.S. alternative index strategies. Correspondingly, each analysis cov-
ers 13 years of monthly data starting January 1, 2000, and uses rolling three-year periods (MSCI EAFE
Minimum Volatility inception is 12/2001, so just over 12 years of data are available for this analysis; ERI
index inception is mid-2002, so 11.5 years of data are available for this analysis).
Sources: Callan, MSCI
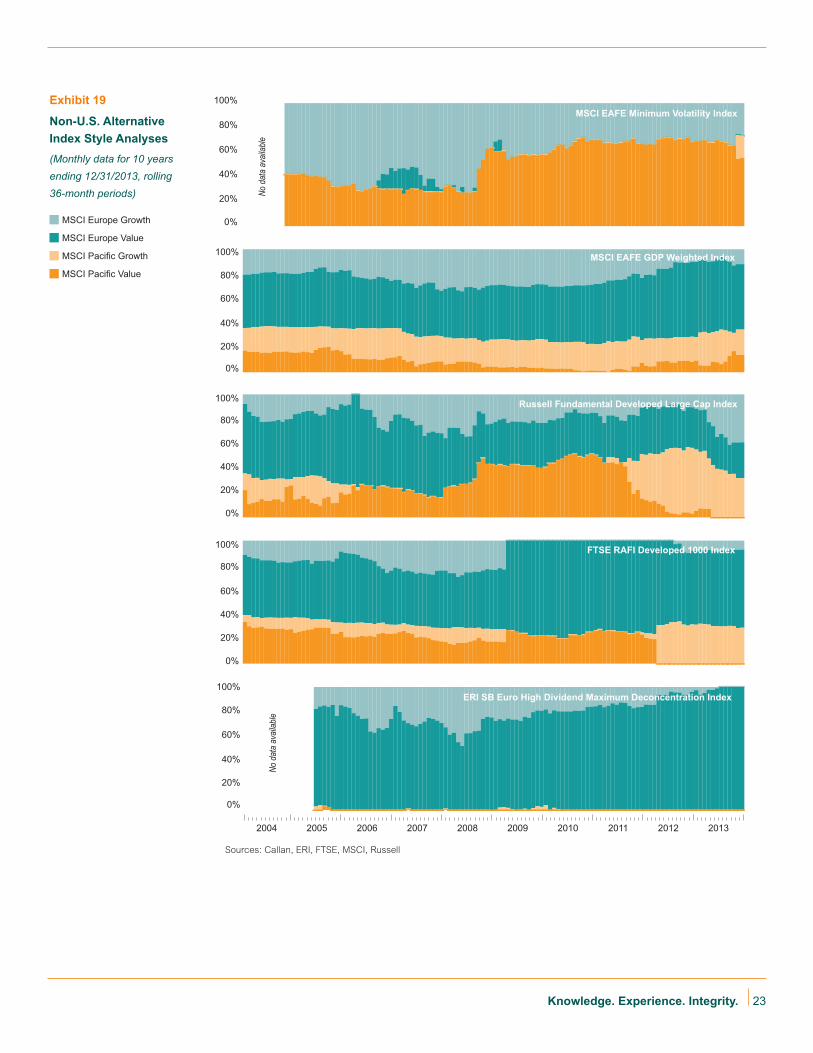
23Knowledge. Experience. Integrity.
Exhibit 19
Non-U.S. Alternative Index Style Analyses (Monthly data for 10 years ending 12/31/2013, rolling 36-month periods)
0%
20%
40%
60%
80%
100%
2004 2005 2006 2007 2008 2009 2010 2011 2012 2013
MSCI EAFE GDP Weighted Index
0%
20%
40%
60%
80%
100%MSCI EAFE Minimum Volatility Index
0%
20%
40%
60%
80%
100% FTSE RAFI Developed 1000 Index
0%
20%
40%
60%
80%
100%
0%
20%
40%
60%
80%
100%ERI SB Euro High Dividend Maximum Deconcentration Index
Russell Fundamental Developed Large Cap Index
No d
ata
avail
able
No d
ata
avail
able
MSCI Europe Growth
MSCI Europe Value
MSCI Pacific Growth
MSCI Pacific Value
Sources: Callan, ERI, FTSE, MSCI, Russell
24
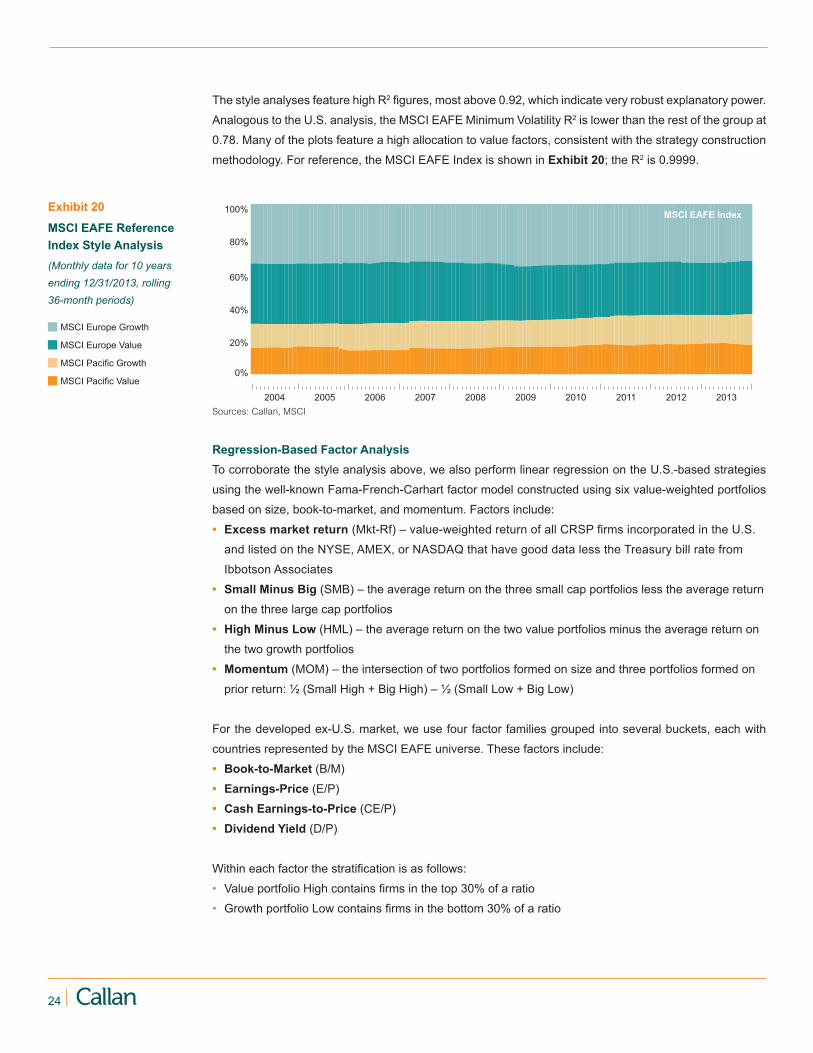
Exhibit 20
MSCI EAFE Reference Index Style Analysis (Monthly data for 10 years ending 12/31/2013, rolling 36-month periods)
The style analyses feature high R2 figures, most above 0.92, which indicate very robust explanatory power.
Analogous to the U.S. analysis, the MSCI EAFE Minimum Volatility R2 is lower than the rest of the group at
0.78. Many of the plots feature a high allocation to value factors, consistent with the strategy construction
methodology. For reference, the MSCI EAFE Index is shown in Exhibit 20; the R2 is 0.9999.
Regression-Based Factor AnalysisTo corroborate the style analysis above, we also perform linear regression on the U.S.-based strategies
using the well-known Fama-French-Carhart factor model constructed using six value-weighted portfolios
based on size, book-to-market, and momentum. Factors include:
• Excess market return (Mkt-Rf) – value-weighted return of all CRSP firms incorporated in the U.S.
and listed on the NYSE, AMEX, or NASDAQ that have good data less the Treasury bill rate from
Ibbotson Associates
• Small Minus Big (SMB) – the average return on the three small cap portfolios less the average return
on the three large cap portfolios
• High Minus Low (HML) – the average return on the two value portfolios minus the average return on
the two growth portfolios
• Momentum (MOM) – the intersection of two portfolios formed on size and three portfolios formed on
prior return: ½ (Small High + Big High) – ½ (Small Low + Big Low)
For the developed ex-U.S. market, we use four factor families grouped into several buckets, each with
countries represented by the MSCI EAFE universe. These factors include:
• Book-to-Market (B/M)
• Earnings-Price (E/P)
• Cash Earnings-to-Price (CE/P)
• Dividend Yield (D/P)
Within each factor the stratification is as follows:
• Value portfolio High contains firms in the top 30% of a ratio
• Growth portfolio Low contains firms in the bottom 30% of a ratio
0%
20%
40%
60%
80%
100%
2004 2005 2006 2007 2008 2009 2010 2011 2012 2013
MSCI EAFE Index
MSCI Europe Growth
MSCI Europe Value
MSCI Pacific Growth
MSCI Pacific Value
Sources: Callan, MSCI
25Knowledge. Experience. Integrity.
Exhibit 21
U.S. Fama-French-Carhart Regression (Monthly data for 10 years ending 12/31/2013)
Exhibit 22
Non-U.S. Four Factor Regression (Monthly data for 10 years ending 12/31/2013)
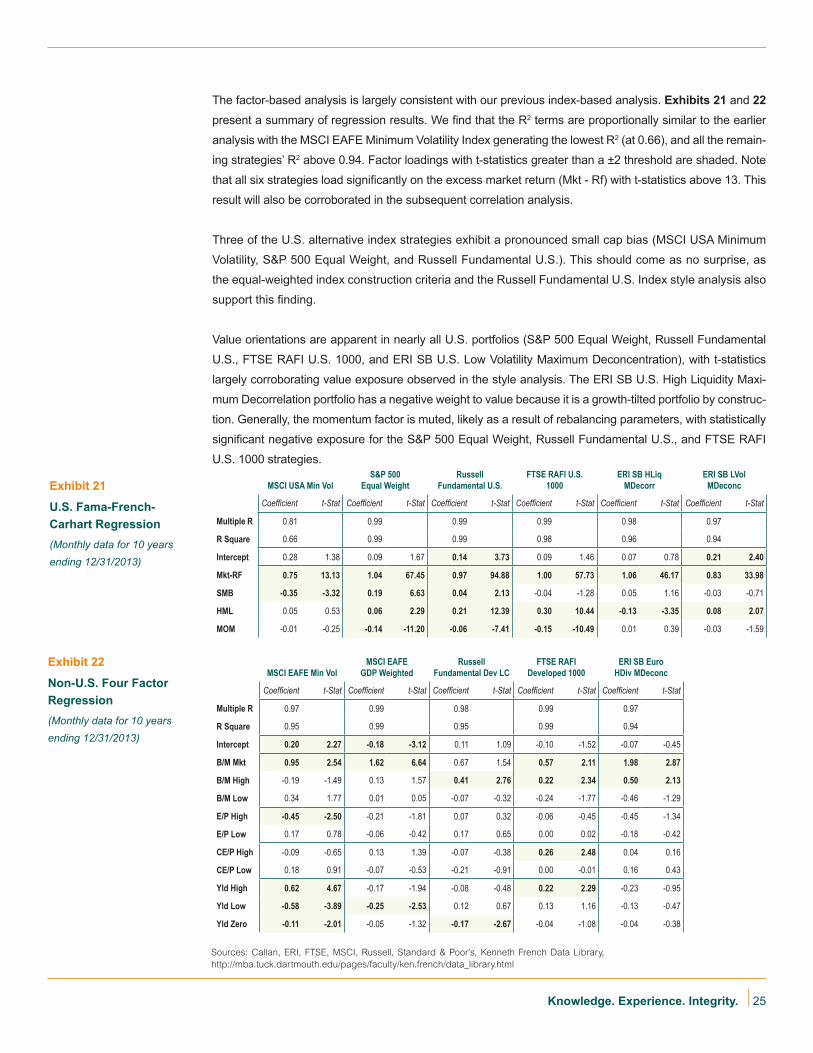
The factor-based analysis is largely consistent with our previous index-based analysis. Exhibits 21 and 22
present a summary of regression results. We find that the R2 terms are proportionally similar to the earlier
analysis with the MSCI EAFE Minimum Volatility Index generating the lowest R2 (at 0.66), and all the remain-
ing strategies’ R2 above 0.94. Factor loadings with t-statistics greater than a ±2 threshold are shaded. Note
that all six strategies load significantly on the excess market return (Mkt - Rf) with t-statistics above 13. This
result will also be corroborated in the subsequent correlation analysis.
Three of the U.S. alternative index strategies exhibit a pronounced small cap bias (MSCI USA Minimum
Volatility, S&P 500 Equal Weight, and Russell Fundamental U.S.). This should come as no surprise, as
the equal-weighted index construction criteria and the Russell Fundamental U.S. Index style analysis also
support this finding.
Value orientations are apparent in nearly all U.S. portfolios (S&P 500 Equal Weight, Russell Fundamental
U.S., FTSE RAFI U.S. 1000, and ERI SB U.S. Low Volatility Maximum Deconcentration), with t-statistics
largely corroborating value exposure observed in the style analysis. The ERI SB U.S. High Liquidity Maxi-
mum Decorrelation portfolio has a negative weight to value because it is a growth-tilted portfolio by construc-
tion. Generally, the momentum factor is muted, likely as a result of rebalancing parameters, with statistically
significant negative exposure for the S&P 500 Equal Weight, Russell Fundamental U.S., and FTSE RAFI
U.S. 1000 strategies.
MSCI EAFE Min VolMSCI EAFE
GDP WeightedRussell
Fundamental Dev LCFTSE RAFI
Developed 1000ERI SB Euro
HDiv MDeconc
Coefficient t-Stat Coefficient t-Stat Coefficient t-Stat Coefficient t-Stat Coefficient t-Stat
Multiple R 0.97 0.99 0.98 0.99 0.97
R Square 0.95 0.99 0.95 0.99 0.94
Intercept 0.20 2.27 -0.18 -3.12 0.11 1.09 -0.10 -1.52 -0.07 -0.45
B/M Mkt 0.95 2.54 1.62 6.64 0.67 1.54 0.57 2.11 1.98 2.87
B/M High -0.19 -1.49 0.13 1.57 0.41 2.76 0.22 2.34 0.50 2.13
B/M Low 0.34 1.77 0.01 0.05 -0.07 -0.32 -0.24 -1.77 -0.46 -1.29
E/P High -0.45 -2.50 -0.21 -1.81 0.07 0.32 -0.06 -0.45 -0.45 -1.34
E/P Low 0.17 0.78 -0.06 -0.42 0.17 0.65 0.00 0.02 -0.18 -0.42
CE/P High -0.09 -0.65 0.13 1.39 -0.07 -0.38 0.26 2.48 0.04 0.16
CE/P Low 0.18 0.91 -0.07 -0.53 -0.21 -0.91 0.00 -0.01 0.16 0.43
Yld High 0.62 4.67 -0.17 -1.94 -0.08 -0.48 0.22 2.29 -0.23 -0.95
Yld Low -0.58 -3.89 -0.25 -2.53 0.12 0.67 0.13 1.16 -0.13 -0.47
Yld Zero -0.11 -2.01 -0.05 -1.32 -0.17 -2.67 -0.04 -1.08 -0.04 -0.38
MSCI USA Min VolS&P 500
Equal WeightRussell
Fundamental U.S.FTSE RAFI U.S.
1000ERI SB HLiq
MDecorrERI SB LVol
MDeconc
Coefficient t-Stat Coefficient t-Stat Coefficient t-Stat Coefficient t-Stat Coefficient t-Stat Coefficient t-Stat
Multiple R 0.81 0.99 0.99 0.99 0.98 0.97
R Square 0.66 0.99 0.99 0.98 0.96 0.94
Intercept 0.28 1.38 0.09 1.67 0.14 3.73 0.09 1.46 0.07 0.78 0.21 2.40
Mkt-RF 0.75 13.13 1.04 67.45 0.97 94.88 1.00 57.73 1.06 46.17 0.83 33.98
SMB -0.35 -3.32 0.19 6.63 0.04 2.13 -0.04 -1.28 0.05 1.16 -0.03 -0.71
HML 0.05 0.53 0.06 2.29 0.21 12.39 0.30 10.44 -0.13 -3.35 0.08 2.07
MOM -0.01 -0.25 -0.14 -11.20 -0.06 -7.41 -0.15 -10.49 0.01 0.39 -0.03 -1.59
Sources: Callan, ERI, FTSE, MSCI, Russell, Standard & Poor’s, Kenneth French Data Library, http://mba.tuck.dartmouth.edu/pages/faculty/ken.french/data_library.html
26
The developed ex-U.S. framework is somewhat different than the U.S.-based analysis, but still provides
useful insight. We observe that all of the R2 terms are very high (over 0.94), providing some statistical
comfort in the findings. With the exception of the Russell Fundamental Developed Large Cap strategy, all
portfolios had statistically significant positive weights to the B/M factor (and three, including the Russell
Fundamental Developed Large Cap, to the High B/M slice). Both the MSCI EAFE Minimum Volatility and
FTSE RAFI Developed 1000 show positive weights to higher-yielding stocks.
Overall, the high R2 terms and significant factor weights provide compelling evidence that these alternative
index portfolios are constructed with meaningful tilts that contribute to risk and return characteristics.
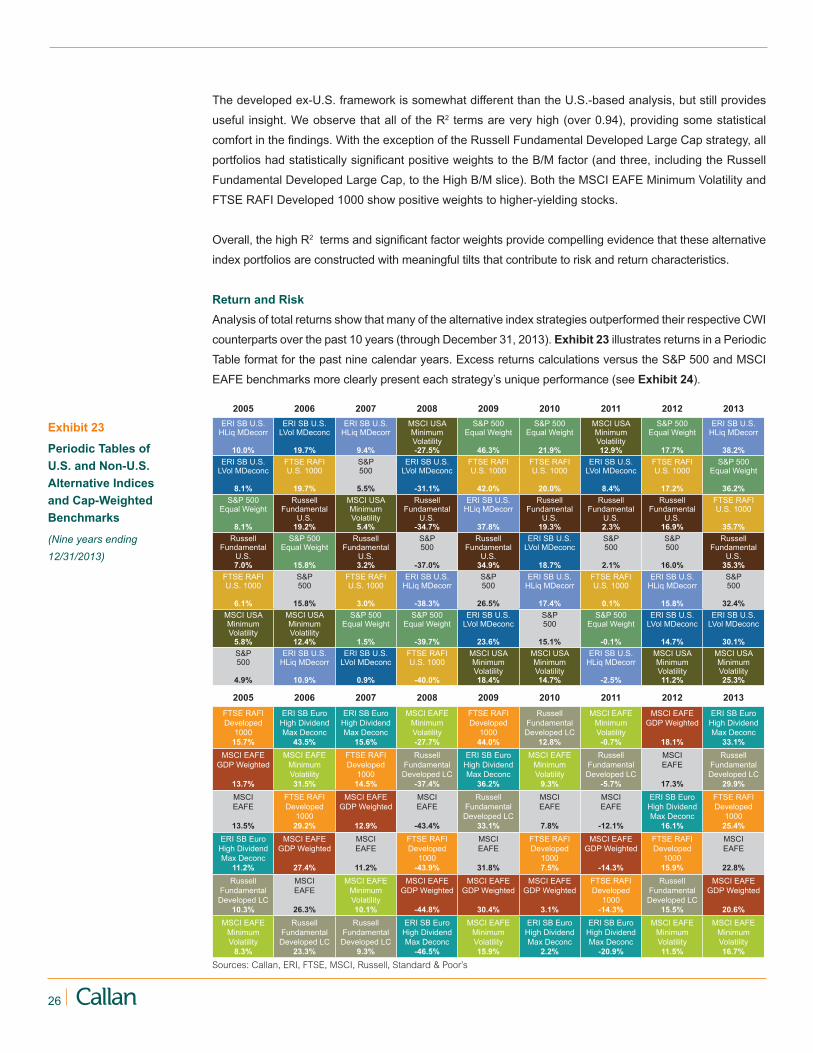
Return and RiskAnalysis of total returns show that many of the alternative index strategies outperformed their respective CWI
counterparts over the past 10 years (through December 31, 2013). Exhibit 23 illustrates returns in a Periodic
Table format for the past nine calendar years. Excess returns calculations versus the S&P 500 and MSCI
EAFE benchmarks more clearly present each strategy’s unique performance (see Exhibit 24).
2005 2006 2007 2008 2009 2010 2011 2012 2013ERI SB U.S.
HLiq MDecorr
10.0%
ERI SB U.S. LVol MDeconc
19.7%
ERI SB U.S. HLiq MDecorr
9.4%
MSCI USA Minimum Volatility-27.5%
S&P 500 Equal Weight
46.3%
S&P 500 Equal Weight
21.9%
MSCI USA Minimum Volatility12.9%
S&P 500 Equal Weight
17.7%
ERI SB U.S. HLiq MDecorr
38.2%ERI SB U.S.
LVol MDeconc
8.1%
FTSE RAFI U.S. 1000
19.7%
S&P500
5.5%
ERI SB U.S. LVol MDeconc
-31.1%
FTSE RAFI U.S. 1000
42.0%
FTSE RAFI U.S. 1000
20.0%
ERI SB U.S. LVol MDeconc
8.4%
FTSE RAFI U.S. 1000
17.2%
S&P 500 Equal Weight
36.2%S&P 500
Equal Weight
8.1%
Russell Fundamental
U.S.19.2%
MSCI USA Minimum Volatility
5.4%
Russell Fundamental
U.S.-34.7%
ERI SB U.S. HLiq MDecorr
37.8%
Russell Fundamental
U.S.19.3%
Russell Fundamental
U.S.2.3%
Russell Fundamental
U.S.16.9%
FTSE RAFI U.S. 1000
35.7%Russell
Fundamental U.S.7.0%
S&P 500 Equal Weight
15.8%
Russell Fundamental
U.S.3.2%
S&P500
-37.0%
Russell Fundamental
U.S.34.9%
ERI SB U.S. LVol MDeconc
18.7%
S&P500
2.1%
S&P500
16.0%
Russell Fundamental
U.S.35.3%
FTSE RAFI U.S. 1000
6.1%
S&P500
15.8%
FTSE RAFI U.S. 1000
3.0%
ERI SB U.S. HLiq MDecorr
-38.3%
S&P500
26.5%
ERI SB U.S. HLiq MDecorr
17.4%
FTSE RAFI U.S. 1000
0.1%
ERI SB U.S. HLiq MDecorr
15.8%
S&P500
32.4%MSCI USA Minimum Volatility
5.8%
MSCI USA Minimum Volatility12.4%
S&P 500 Equal Weight
1.5%
S&P 500 Equal Weight
-39.7%
ERI SB U.S. LVol MDeconc
23.6%
S&P500
15.1%
S&P 500 Equal Weight
-0.1%
ERI SB U.S. LVol MDeconc
14.7%
ERI SB U.S. LVol MDeconc
30.1%S&P500
4.9%
ERI SB U.S. HLiq MDecorr
10.9%
ERI SB U.S. LVol MDeconc
0.9%
FTSE RAFI U.S. 1000
-40.0%
MSCI USA Minimum Volatility18.4%
MSCI USA Minimum Volatility14.7%
ERI SB U.S. HLiq MDecorr
-2.5%
MSCI USA Minimum Volatility11.2%
MSCI USA Minimum Volatility25.3%
2005 2006 2007 2008 2009 2010 2011 2012 2013FTSE RAFI Developed
100015.7%
ERI SB Euro High Dividend Max Deconc
43.5%
ERI SB Euro High Dividend Max Deconc
15.6%
MSCI EAFE Minimum Volatility-27.7%
FTSE RAFI Developed
100044.0%
Russell Fundamental Developed LC
12.8%
MSCI EAFE Minimum Volatility-0.7%
MSCI EAFE GDP Weighted
18.1%
ERI SB Euro High Dividend Max Deconc
33.1%MSCI EAFE
GDP Weighted
13.7%
MSCI EAFE Minimum Volatility31.5%
FTSE RAFI Developed
100014.5%
Russell Fundamental Developed LC
-37.4%
ERI SB Euro High Dividend Max Deconc
36.2%
MSCI EAFE Minimum Volatility
9.3%
Russell Fundamental Developed LC
-5.7%
MSCIEAFE
17.3%
Russell Fundamental Developed LC
29.9%MSCIEAFE
13.5%
FTSE RAFI Developed
100029.2%
MSCI EAFE GDP Weighted
12.9%
MSCIEAFE
-43.4%
Russell Fundamental Developed LC
33.1%
MSCIEAFE
7.8%
MSCIEAFE
-12.1%
ERI SB Euro High Dividend Max Deconc
16.1%
FTSE RAFI Developed
100025.4%
ERI SB Euro High Dividend Max Deconc
11.2%
MSCI EAFE GDP Weighted
27.4%
MSCIEAFE
11.2%
FTSE RAFI Developed
1000-43.9%
MSCIEAFE
31.8%
FTSE RAFI Developed
10007.5%
MSCI EAFE GDP Weighted
-14.3%
FTSE RAFI Developed
100015.9%
MSCIEAFE
22.8%Russell
Fundamental Developed LC
10.3%
MSCIEAFE
26.3%
MSCI EAFE Minimum Volatility10.1%
MSCI EAFE GDP Weighted
-44.8%
MSCI EAFE GDP Weighted
30.4%
MSCI EAFE GDP Weighted
3.1%
FTSE RAFI Developed
1000-14.3%
Russell Fundamental Developed LC
15.5%
MSCI EAFE GDP Weighted
20.6%MSCI EAFE
Minimum Volatility
8.3%
Russell Fundamental Developed LC
23.3%
Russell Fundamental Developed LC
9.3%
ERI SB Euro High Dividend Max Deconc
-46.5%
MSCI EAFE Minimum Volatility15.9%
ERI SB Euro High Dividend Max Deconc
2.2%
ERI SB Euro High Dividend Max Deconc
-20.9%
MSCI EAFE Minimum Volatility11.5%
MSCI EAFE Minimum Volatility16.7%
Exhibit 23
Periodic Tables of U.S. and Non-U.S. Alternative Indices and Cap-Weighted Benchmarks
(Nine years ending 12/31/2013)
Sources: Callan, ERI, FTSE, MSCI, Russell, Standard & Poor’s

27Knowledge. Experience. Integrity.
Alternative Index Return St. Dev. Sharpe Beta Excess R. TE ER / TE Info. Ratio
MSCI USA Min Vol 8.26% 11.66% 0.57 0.74 0.85% 5.79% 0.15 0.49
Russell Fundamental U.S. 10.05% 15.98% 0.53 1.07 2.65% 2.86% 0.93 0.82
S&P 500 Equal Weight 9.78% 17.61% 0.46 1.17 2.38% 4.65% 0.51 0.40
FTSE RAFI U.S. 1000 9.35% 17.17% 0.45 1.13 1.95% 4.67% 0.42 0.31
ERI SB US High Liquidity Max Decorr 9.81% 13.24% 0.62 0.87 2.40% 3.77% 0.64 0.88
ERI SB US Low Vol Max Deconc 9.19% 16.20% 0.47 1.07 1.79% 3.94% 0.45 0.38
S&P 500 7.41% 14.69% 0.39
S&P 500 Growth 7.69% 14.13% 0.43
S&P 500 Value 7.05% 15.94% 0.34
MSCI EAFE Min Vol 9.19% 12.94% 0.58 0.66 2.27% 7.67% 0.30 0.77
MSCI EAFE GDP Weighted 6.44% 19.49% 0.24 1.07 -0.47% 2.27% -0.21 -0.34
Russell Fundamental Developed LC 8.91% 16.40% 0.44 0.88 2.00% 4.42% 0.45 0.62
FTSE RAFI Developed 1000 8.51% 20.21% 0.34 1.10 1.60% 3.81% 0.42 0.36
ERI SB Euro High Dividend Max Deconc 8.18% 23.14% 0.28 1.23 1.27% 7.40% 0.17 0.12
MSCI EAFE 6.91% 18.15% 0.29
MSCI EAFE Growth 6.97% 17.48% 0.30
MSCI EAFE Value 6.77% 19.24% 0.26
Exhibit 24
Summary Performance and Risk Statistics
(Monthly data for 10 years ending 12/31/2013)
Turning to risk, we observe that some alternative index strategies had markedly higher annualized
standard deviation than the S&P 500 over the same time period. Both low volatility strategies did indeed
exhibit lower volatility. Tracking error for U.S. strategies versus the S&P 500 is in a similar range to many
traditional active strategies, 3% to 5%. Tracking error for developed ex-U.S. alternative index strategies
versus MSCI EAFE is higher than their U.S. counterparts, with some over 7%. Note that tracking error
may not be as applicable to alternative index strategies as with traditional active strategies because
these portfolios are constructed without reference to the cap-weighted benchmark, but nevertheless will
be used by many investors for attribution and performance measurement purposes. Looking at overall
standard deviation is likely a more relevant calculation. Information ratios do vary over time, but are
robust over the 10-year sample (Exhibit 24).
Sources: Callan, ERI, FTSE, MSCI, Russell, Standard & Poor’s
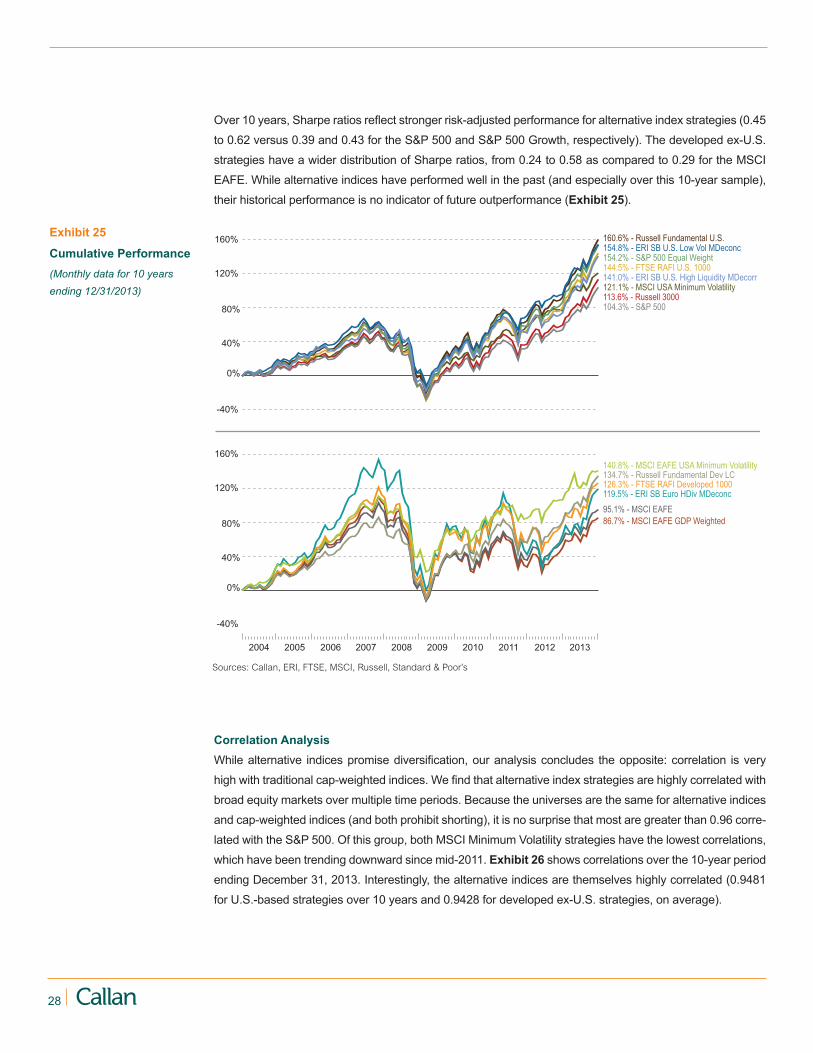
28
Exhibit 25
Cumulative Performance (Monthly data for 10 years ending 12/31/2013)
-40%
0%
40%
80%
120%
160%
104.3% - S&P 500113.6% - Russell 3000121.1% - MSCI USA Minimum Volatility 141.0% - ERI SB U.S. High Liquidity MDecorr144.5% - FTSE RAFI U.S. 1000154.2% - S&P 500 Equal Weight154.8% - ERI SB U.S. Low Vol MDeconc160.6% - Russell Fundamental U.S.
-40%
0%
40%
80%
120%
160%
2004 2005 2006 2007 2008 2009 2010 2011 2012 2013
86.7% - MSCI EAFE GDP Weighted95.1% - MSCI EAFE119.5% - ERI SB Euro HDiv MDeconc126.3% - FTSE RAFI Developed 1000134.7% - Russell Fundamental Dev LC140.8% - MSCI EAFE USA Minimum Volatility
Over 10 years, Sharpe ratios reflect stronger risk-adjusted performance for alternative index strategies (0.45
to 0.62 versus 0.39 and 0.43 for the S&P 500 and S&P 500 Growth, respectively). The developed ex-U.S.
strategies have a wider distribution of Sharpe ratios, from 0.24 to 0.58 as compared to 0.29 for the MSCI
EAFE. While alternative indices have performed well in the past (and especially over this 10-year sample),
their historical performance is no indicator of future outperformance (Exhibit 25).
Correlation AnalysisWhile alternative indices promise diversification, our analysis concludes the opposite: correlation is very
high with traditional cap-weighted indices. We find that alternative index strategies are highly correlated with
broad equity markets over multiple time periods. Because the universes are the same for alternative indices
and cap-weighted indices (and both prohibit shorting), it is no surprise that most are greater than 0.96 corre-
lated with the S&P 500. Of this group, both MSCI Minimum Volatility strategies have the lowest correlations,
which have been trending downward since mid-2011. Exhibit 26 shows correlations over the 10-year period
ending December 31, 2013. Interestingly, the alternative indices are themselves highly correlated (0.9481
for U.S.-based strategies over 10 years and 0.9428 for developed ex-U.S. strategies, on average).
Sources: Callan, ERI, FTSE, MSCI, Russell, Standard & Poor’s
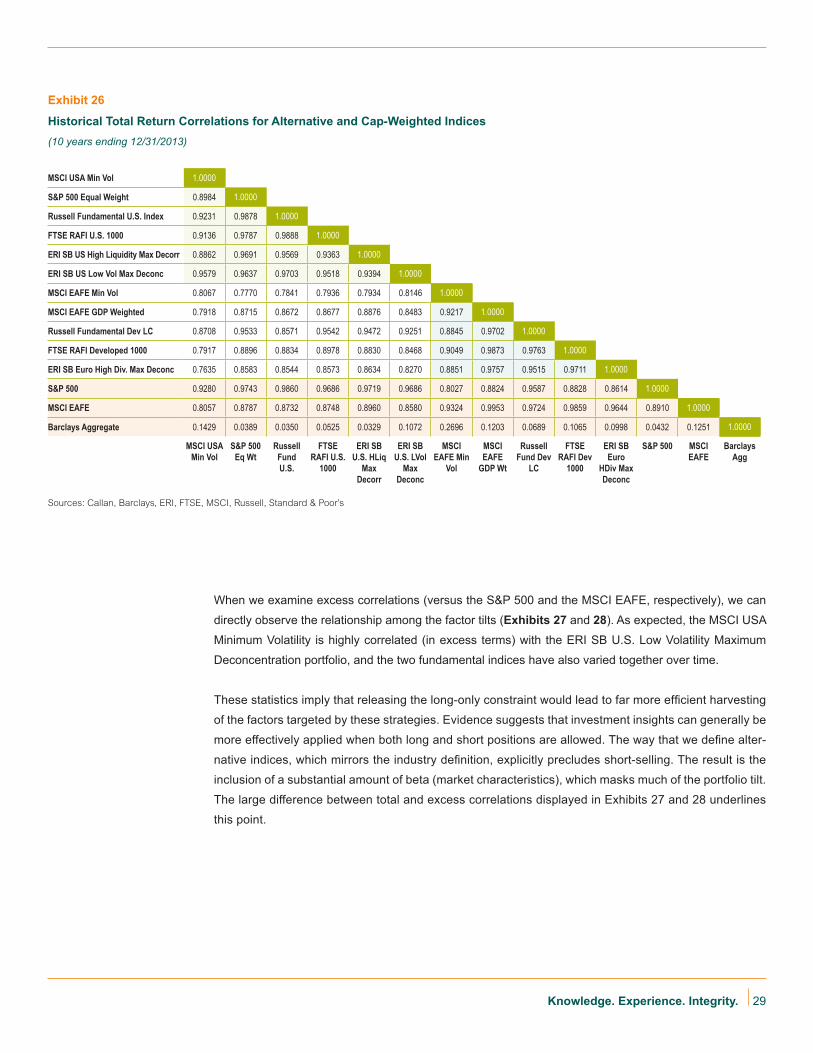
29Knowledge. Experience. Integrity.
Exhibit 26
Historical Total Return Correlations for Alternative and Cap-Weighted Indices (10 years ending 12/31/2013)
MSCI USA Min Vol 1.0000
S&P 500 Equal Weight 0.8984 1.0000
Russell Fundamental U.S. Index 0.9231 0.9878 1.0000
FTSE RAFI U.S. 1000 0.9136 0.9787 0.9888 1.0000
ERI SB US High Liquidity Max Decorr 0.8862 0.9691 0.9569 0.9363 1.0000
ERI SB US Low Vol Max Deconc 0.9579 0.9637 0.9703 0.9518 0.9394 1.0000
MSCI EAFE Min Vol 0.8067 0.7770 0.7841 0.7936 0.7934 0.8146 1.0000
MSCI EAFE GDP Weighted 0.7918 0.8715 0.8672 0.8677 0.8876 0.8483 0.9217 1.0000
Russell Fundamental Dev LC 0.8708 0.9533 0.8571 0.9542 0.9472 0.9251 0.8845 0.9702 1.0000
FTSE RAFI Developed 1000 0.7917 0.8896 0.8834 0.8978 0.8830 0.8468 0.9049 0.9873 0.9763 1.0000
ERI SB Euro High Div. Max Deconc 0.7635 0.8583 0.8544 0.8573 0.8634 0.8270 0.8851 0.9757 0.9515 0.9711 1.0000
S&P 500 0.9280 0.9743 0.9860 0.9686 0.9719 0.9686 0.8027 0.8824 0.9587 0.8828 0.8614 1.0000
MSCI EAFE 0.8057 0.8787 0.8732 0.8748 0.8960 0.8580 0.9324 0.9953 0.9724 0.9859 0.9644 0.8910 1.0000
Barclays Aggregate 0.1429 0.0389 0.0350 0.0525 0.0329 0.1072 0.2696 0.1203 0.0689 0.1065 0.0998 0.0432 0.1251 1.0000
MSCI USA Min Vol
S&P 500 Eq Wt
Russell Fund U.S.
FTSE RAFI U.S.
1000
ERI SB U.S. HLiq
Max Decorr
ERI SB U.S. LVol
Max Deconc
MSCI EAFE Min
Vol
MSCI EAFE
GDP Wt
Russell Fund Dev
LC
FTSE RAFI Dev
1000
ERI SB Euro
HDiv Max Deconc
S&P 500 MSCI EAFE
Barclays Agg
When we examine excess correlations (versus the S&P 500 and the MSCI EAFE, respectively), we can
directly observe the relationship among the factor tilts (Exhibits 27 and 28). As expected, the MSCI USA
Minimum Volatility is highly correlated (in excess terms) with the ERI SB U.S. Low Volatility Maximum
Deconcentration portfolio, and the two fundamental indices have also varied together over time.
These statistics imply that releasing the long-only constraint would lead to far more efficient harvesting
of the factors targeted by these strategies. Evidence suggests that investment insights can generally be
more effectively applied when both long and short positions are allowed. The way that we define alter-
native indices, which mirrors the industry definition, explicitly precludes short-selling. The result is the
inclusion of a substantial amount of beta (market characteristics), which masks much of the portfolio tilt.
The large difference between total and excess correlations displayed in Exhibits 27 and 28 underlines
this point.
Sources: Callan, Barclays, ERI, FTSE, MSCI, Russell, Standard & Poor’s
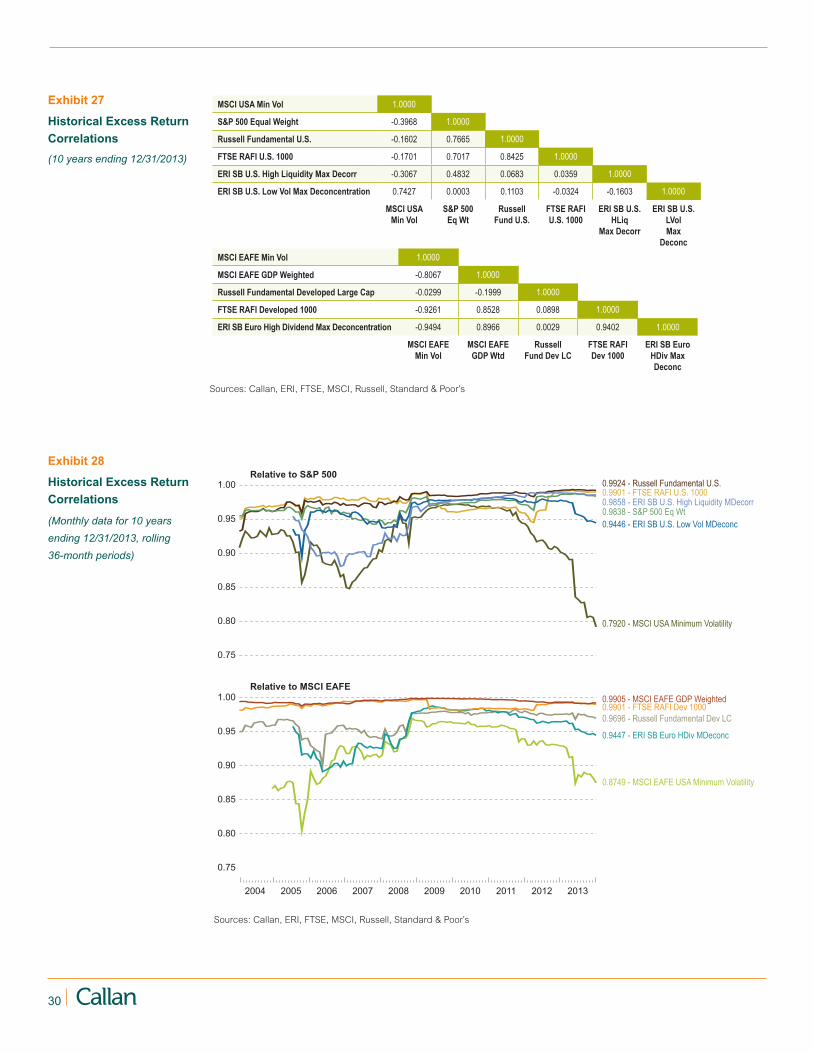
30
Exhibit 28
Historical Excess Return Correlations
(Monthly data for 10 years ending 12/31/2013, rolling 36-month periods)
0.75
0.80
0.85
0.90
0.95
1.00
0.7920 - MSCI USA Minimum Volatility
0.9858 - ERI SB U.S. High Liquidity MDecorr0.9901 - FTSE RAFI U.S. 1000
0.9838 - S&P 500 Eq Wt0.9446 - ERI SB U.S. Low Vol MDeconc
0.9924 - Russell Fundamental U.S.
0.75
0.80
0.85
0.90
0.95
1.00
2004 2005 2006 2007 2008 2009 2010 2011 2012 2013
0.9905 - MSCI EAFE GDP Weighted
0.9447 - ERI SB Euro HDiv MDeconc
0.9901 - FTSE RAFI Dev 10000.9696 - Russell Fundamental Dev LC
0.8749 - MSCI EAFE USA Minimum Volatility
Relative to S&P 500
Relative to MSCI EAFE
MSCI USA Min Vol 1.0000
S&P 500 Equal Weight -0.3968 1.0000
Russell Fundamental U.S. -0.1602 0.7665 1.0000
FTSE RAFI U.S. 1000 -0.1701 0.7017 0.8425 1.0000
ERI SB U.S. High Liquidity Max Decorr -0.3067 0.4832 0.0683 0.0359 1.0000
ERI SB U.S. Low Vol Max Deconcentration 0.7427 0.0003 0.1103 -0.0324 -0.1603 1.0000
MSCI USAMin Vol
S&P 500Eq Wt
RussellFund U.S.
FTSE RAFIU.S. 1000
ERI SB U.S. HLiq
Max Decorr
ERI SB U.S. LVolMax
DeconcMSCI EAFE Min Vol 1.0000
MSCI EAFE GDP Weighted -0.8067 1.0000
Russell Fundamental Developed Large Cap -0.0299 -0.1999 1.0000
FTSE RAFI Developed 1000 -0.9261 0.8528 0.0898 1.0000
ERI SB Euro High Dividend Max Deconcentration -0.9494 0.8966 0.0029 0.9402 1.0000
MSCI EAFEMin Vol
MSCI EAFEGDP Wtd
RussellFund Dev LC
FTSE RAFIDev 1000
ERI SB Euro HDiv Max Deconc
Exhibit 27
Historical Excess Return Correlations (10 years ending 12/31/2013)
Sources: Callan, ERI, FTSE, MSCI, Russell, Standard & Poor’s
Sources: Callan, ERI, FTSE, MSCI, Russell, Standard & Poor’s
31Knowledge. Experience. Integrity.
Bibliography
Amenc, N., F. Goltz, and A. Lodh. “Choose Your Betas: Benchmarking Alternative Equity Index
Strategies.” Journal of Portfolio Management, vol. 39, no. 1, Fall 2012.
Amenc, N., and L. Martellini. “Risk Allocation: A New Investment Paradigm?” Journal of Portfolio
Management, vol. 40, no. 2, Winter 2014.
Brown, S., and W. Goetzmann. “Hedge Funds with Style.” Journal of Portfolio Management, vol. 29, no.
2, Winter 2003.
Carhart, M. “On Persistence in Mutual Fund Performance.” Journal of Finance, vol. 52, no. 1, March
1997.
Fama, E.F., and K.R. French. “Common Risk Factors in the Returns on Stocks and Bonds.” Journal of
Financial Economics, vol. 33, no. 1, 1993.
French, K.R. “Data Library.” Dartmouth University, http://mba.tuck.dartmouth.edu/pages/faculty/ken.
french/data_library.html
Markowitz, H. “Portfolio Selection.” Journal of Finance, vol. 7, no. 1, March 1952.
Podkaminer, E. “Risk Factors as Building Blocks for Portfolio Diversification: The Chemistry of Asset
Allocation.” CFA Institute Investment Risk and Performance, vol. 2013, no. 1, January 2013.
Roll, R., and S. Ross. “An Empirical Investigation of the Arbitrage Pricing Theory.” Journal of Finance,
vol. 35, no. 5, December 1980.
Sharpe, W.F. “A Simplified Model for Portfolio Analysis.” Management Science, vol. 9, no. 2, 1963.
Sharpe, W.F. “Capital Asset Prices: A Theory of Market Equilibrium under Conditions of Risk.” Journal of
Finance, vol. 19, no. 3, 1964.
Sharpe, W.F. “The Arithmetic of Active Management.” Financial Analysts Journal, vol. 47, no. 1, 1991.
Sharpe, W.F. “Asset Allocation: Management Style and Performance Measurement.” Journal of Portfolio
Management, vol. 18, no. 2, Winter 1992.
32
About the AuthorEugene L. Podkaminer, CFA, is a Senior Vice President and consultant in the Capital
Markets Research group. He assists clients with strategic investment planning, conducts
asset allocation studies, develops optimal investment manager structures, and provides
custom research. Eugene is a shareholder of the firm.
Prior to joining Callan in 2010 Eugene spent nearly a decade with Barclays Global Investors. As a Senior
Strategist in the Client Advisory Group he advised some of the world’s largest and most sophisticated
pension plans, non-profits, and sovereign wealth funds in the areas of strategic asset allocation, liability
driven investing, manager structure optimization, and risk budgeting. As Chief Strategist of Barclays’ CIO-
outsourcing platform Eugene executed CIO-level functions for corporate pension plans and endowments.
Eugene was also a Senior Investment Consultant with Alan Biller and Associates.
Eugene received a BA in Economics from the University of San Francisco and an MBA from Yale University.
He earned the right to use the Chartered Financial Analyst designation and is a member of the CFA
Society of San Francisco and CFA Institute.
Certain information herein has been compiled by Callan and is based on information provided by a variety of sources believed to be reliable for which Callan has not necessarily verified the accuracy or completeness of or updated. This report is for informational pur-poses only and should not be construed as legal or tax advice on any matter. Any investment decision you make on the basis of this report is your sole responsibility. You should consult with legal and tax advisers before applying any of this information to your particular situation. Reference in this report to any product, service or entity should not be construed as a recommendation, approval, affiliation or endorsement of such product, service or entity by Callan. Past performance is no guarantee of future results. This report may consist of statements of opinion, which are made as of the date they are expressed and are not statements of fact. The Callan Investments Institute (the “Institute”) is, and will be, the sole owner and copyright holder of all material prepared or developed by the Institute. No party has the right to reproduce, revise, resell, disseminate externally, disseminate to subsidiaries or parents, or post on internal web sites any part of any material prepared or developed by the Institute, without the Institute’s permission. Institute clients only have the right to utilize such material internally in their business.
If you have any questions or comments, please email [email protected].
About Callan AssociatesCallan was founded as an employee-owned investment consulting firm in 1973. Ever since, we have
empowered institutional clients with creative, customized investment solutions that are uniquely backed
by proprietary research, exclusive data, ongoing education and decision support. Today, Callan advises
on more than $1.8 trillion in total assets, which makes us among the largest independently owned invest-
ment consulting firms in the U.S. We use a client-focused consulting model to serve public and private
pension plan sponsors, endowments, foundations, operating funds, smaller investment consulting firms,
investment managers, and financial intermediaries. For more information, please visit www.callan.com.
About the Callan Investments InstituteThe Callan Investments Institute, established in 1980, is a source of continuing education for those in
the institutional investment community. The Institute conducts conferences and workshops and provides
published research, surveys, and newsletters. The Institute strives to present the most timely and relevant
research and education available so our clients and our associates stay abreast of important trends in the
investments industry.
© 2014 Callan Associates Inc.

Corporate Headquarters
Callan Associates600 Montgomery Street Suite 800San Francisco, CA 94111800.227.3288415.974.5060
www.callan.com
Regional Offices
Atlanta800.522.9782
Chicago800.999.3536
Denver855.864.3377
New Jersey800.274.5878


![Callan Book 6 [Stage 11].pdf](https://static.fdocument.pub/doc/165x107/55cf9ace550346d033a37cb8/callan-book-6-stage-11pdf.jpg)