THE BANK OF NAGOYA, LTD. - 名古屋銀行 Branches Number of Branches: 112 (As of March 31, 2017)...
79
Transcript of THE BANK OF NAGOYA, LTD. - 名古屋銀行 Branches Number of Branches: 112 (As of March 31, 2017)...


Established 1949 Number of Employees 1,948 (As of March 31, 2017)
Subsidiaries
NagoyaLease Co., Ltd. Nagoya Business Service Co., Ltd. Nagoya Card, Ltd. NAGOYA MC Card Co., Ltd.
THE BANK OF NAGOYA, LTD. 19-17 Nishiki 3-chome, Naka-ku,
Nagoya City, Aichi 460-0003 Japan Tel: +81 52 962 9520 Fax: +81 52 961 6605 https://www.meigin.com/

Domestic Branches Number of Branches: 112 (As of March 31, 2017)
Overseas
Nantong Branch
2nd Floor, Business Service Outsourcing Center, Building C, 188 Tongsheng Road, Economic and Technological Development Area, Nantong, Jiangsu, China Tel +86 513 89192280 Fax +86 513 89192281
Shanghai Representative Office
Room 1809, Shanghai International Trade Center, 2201 Yan-an Road (West), Shanghai, China Tel +86 21 62754207 Fax +86 21 62759461
2 branches in Shizuoka
1 branch in Osaka
1 branch in Tokyo
106 branches in Aichi (56 branches in Nagoya City)
2 branches in Gifu
2 branches in Shizuoka
Contents
Message from the Management 1
Operating Environment 2
Operating Results (Nonconsolidated basis) 4
Medium- and Long-term Management Strategies 18
Issues to Address 19
Breakdown of Loans (Nonconsolidated basis) 21 Balance of problem loans under the Banking Act (risk monitored loans) 21 Balance of problem loans under the Financial Revitalization Act 22
Unrealized Gains on Securities (Nonconsolidated basis) 23
Capital Adequacy Ratio 23
Rating 23
Organization of the Bank 24
Board of Directors and Audit and Supervisory Board 25
Principal Shareholders 25
Independent Auditor’s Report 26
Consolidated Balance Sheets 27
Consolidated Statements of Income 29
Consolidated Statements of Changes in Net Assets 31
Consolidated Statements of Cash Flows 33
Notes to Consolidated Financial Statements 34

1
Message from the Management
We would first like to extend our sincere gratitude to all our stakeholders for their patronage to the Bank of Nagoya.
From this fiscal year, the Bank of Nagoya will begin implementation of the 20th medium-term management plan, “Stronger, Longer, Deeper” - Deepening Bonds with Local Community. By providing highly satisfying service, we will strive to be able to create strong, long, and deep bonds with “local communities,” “regional customers,” and “employees,” and remain the most relied upon bank in the region going forward.
Furthermore, Mr. Ichiro Fujiwara has now assumed the role of President. Working together with Chairman Kazumaro Kato under the new framework, we will fulfill our duty as a regional financial institution and put into practice our guiding precept of “fostering regional prosperity,” and we ask you to give us your even stronger support and patronage in the future.
June 2017
Kazumaro Kato Chairman
Ichiro Fujiwara President

2
Operating Environment
In the fiscal year ended March 31, 2017, the Bank conducted a range of initiatives to increase vitality in the local community and increase customer satisfaction.
Firstly, we held “Meigin Joint,” which is a reverse-style trade fair, as well as a number of different trade fairs in conjunction with other financial institutions, as an initiative to support our customers in their business. Many of our customers have told us “we want to participate next time too,” due to the trade fairs being highly focused on particular themes and industries, as well as having a high contract rate. Also, we have displayed a top-class record as an approved support institution, not just as a regional financial institution, but also on a national level, with the number of businesses selected for the “FY2016 Revised Innovative Manufacturing, Commerce, and Service Support Subsidies (commonly known as the Manufacturing Subsidies)” rising to 73.
Next, as an initiative to increase the convenience and satisfaction of our customers, we support our customers’ desire to make social contributions through the development of donation-type private placement bond products. Also, as an initiative to protect the savings of our elderly customers, we have placed a usage limit on some cash card transfers. We have entered a business collaboration with HOKEN NO MADOGUCHI GROUP INC., and we will respond to the insurance needs of our ever-diversifying customers by leveraging the knowhow and various tools at the disposal of the HOKEN NO MADOGUCHI GROUP. We have also concluded a point-sharing agreement with CHUBU Electric Power Co., Inc., and we are improving the convenience of our “Bankstage” internet banking service for individuals. In addition, we have concluded tie-up agreements with institutions including the State Bank of India (India) and the Foreign Investment Agency (Vietnam), to provide a complete range of financial services and create a system to support the overseas expansion of our customers.
Next, with regard to our branches, we have refurbished our Osaka and Toyohashi branches with the concept of “the Customer’s Perspective.” Furthermore, with regard to our information center “The Bank of Nagoya Heartful Plaza,” which is located on the 16th floor of the Dai Nagoya Building adjoining Nagoya Station, one year has passed since its opening, and has conducted approximately 100 seminars covering a range of topics, including asset formation, inheritance, gourmet, and health, which have had around 1,000 participants in total.
The 19th medium-term management plan carried the slogan of “Change! Making Changes! A Fresh Start!”—Becoming a Bank Overflowing with Satisfaction,” and the plan covered was a three-year period in which we focused on flexibly responding to changes in the economic environment, and improving growth potential through innovative manufacturing. Specifically, we have built an All-Hands-In Sales Platform through BPR (Business Process Reengineering), increased CS and ES, and all officers

3
have worked together to become a bank that is truly needed by our customers.
Major features of this plan were “increasing the concentration of transactions with our customers,” and “increasing the number of customers.” Specifically, we aimed to increase “newly created customers,” “new business transactions,” and “the amount of financing for small and medium sized enterprises.” As a result of the three-year plan, we were able to post satisfactory results for all figures, lay the groundwork for our growth strategy, and build an All-Hands-In Sales Platform.
We feel that it is our responsibility to think of initiatives order for our customers to grow and develop, and to increase the vitality of local communities, and to actively engage in these initiatives. To this end, we thoroughly engage our customers, and present creative proposals that not only provide “the products that our customers wish for,” but “anticipate what our customers will wish for next before the customers themselves.”
Furthermore, we also give consideration and actively advise our clients with regard to how to grow within the changing economic environment based on business viability evaluations.
These initiatives are examples of the implementation of our guiding precept of “fostering regional prosperity.” Our happiness lies in satisfying our customers and making them happy, and we take pride in this. Going forward, we will value our corporate philosophy, which has remained unchanged since the Bank’s establishment, and our officers will act as one.

4
Operating Results (Nonconsolidated basis)
The Bank’s guiding precept is “fostering regional prosperity.” The Bank has strived to provide financial services in order to develop the regional economy, and going forward we will continue to conduct business strongly rooted in the region in order to help our customers grow and prosper.
The Bank’s policy with regard to our customers is to comply with the intent of the “Benchmarks for Financial Intermediary Functions,” developed by the Financial Services Agency. In addition, we have selected disclosure items from the “Benchmarks” in accordance with our management policy and strategy. Going forward, we will give consideration to revising and adding to these as appropriate. Furthermore, if any of the following initiatives correspond to a “Benchmark” they have been marked with BENCHMARK.
Financing Initiatives Closely Tied to the Region
Basic Policies Behind the Bank’s Initiative–––––––––––––––––
1. Basic Policies for Demonstrating Customer Consulting Capabilities
(1) Evaluate business viability (identify and analyze business content and growth potential, as well as business goals and issues) through day-to-day and ongoing relationship strengthening.
(2) Propose optimal solutions through business viability evaluation.
(3) Work with customers to resolve management issues and, if necessary, propose revisions to solutions.
2. Proactive Participation in improving revitalization of “Towns, People, and Jobs” in Local Communities
(1) Coordinate with local governments, working together with them to proactively participate in initiatives for revitalization of the entire region.
(2) Provide support for developing growth fields and creating higher added value through industrial agglomeration.
3. Proactive Dissemination of Information to the Region and Customers
Proactively provide information to the region and customers with respect to specific goals and achievements of financing initiatives closely tied to the region.
Initiatives to Improve the Management of Small and Medium Sized Enterprises (“SME”), and Increase the Vitality of Local Communities––––––––––––––––
Initiatives relating to management support, including new loans for small and medium sized enterprises
The Bank’s guiding precept has been “fostering regional prosperity” ever since it was first founded, and we have treated displaying streamlined financial intermediary functions in the region as an important issue. In addition, due to the enforcement of the SME Financing Facilitation Act, we have developed the “Basic Policy on Financing Facilitation,” established a framework for financing facilitation, and further enhanced our initiatives aimed at financing facilitation, in order to respond to all kinds of consultations from our regional SME customers in detail, and in a timely and appropriate fashion. The SME Financing Facilitation Act ceased operation on March 31, 2013, but the Bank’s basic policy and framework for financing facilitation remain unchanged. As before, we continue to respond appropriately our SME customers’ consultations about refinancing and new loans.

5
[Outline of the Basic Policy on Financing Facilitation] Basic position on refinancing of loans, etc. With regard to consultations and applications for new loans and refinancing of loans, etc., we
strive to sincerely listen to our customers’ requirements and comprehend our customers’ circumstances in detail, before proactively and flexibly responding to consultations in order to reduce the burden of our customers’ capital requirements and repayments as much as possible.
If conditions are attached with regard to applications for new loans or refinancing of loans, etc., or if a loan must be rejected due to unavoidable circumstances, we strive to explain the reasoning swiftly, appropriately, and thoroughly, based on past the previous transactional relationship with the customer, etc., in order to gain the customer’s understanding.
We will respond with sincerity to our customers’ business consultations and actively support initiatives aimed at management improvement.
If other financial institutions, etc., are involved, we will strive to collaborate closely with said parties while remaining conscious of the duty of confidentiality.

6
(As of March 31, 2017)
ライフステージ別の経営支援体制(全与信先 26,851 先、融資残高合計 17,222 億円)
※ライフステージを判断できない先(過去 5 期分の決算情報未取得先 4,057 先、1,731 億円)は除外しております
– Founding stage –
1,781
¥46.2 billion
– Growth stage –
2,161
¥137.6 billion
– Stable stage –
15,987
¥1,197.1 billion
– Downturn stage –
828 ¥41.2 billion
– Regeneration stage – 1,690
¥82.2 billion
Routine visits
Creating a relationship of trust, understanding and analyzing management issues, and continuous monitoring
Providing varied solutions for each stage
Venture capital referrals Support for business plan announcement conferences Referrals for public aid systems
M&A, Business succession
Support for the overseas expansion Business matching Management consultation
Management improvement and business recovery
THE BANK OF NAGOYA
Head office branch
Specialist division in charge of management improvement support and business recovery, etc.
Branches
Collaboration
External specialists and external support organizations
Universities, Business Recovery Fund and more
Certified public tax accountants, Attorneys, Certified public accountants and more
Management support system for each stage of life (Total borrowers: 26,851. Total loaned funds: ¥1,722.2 billion)
Number of borrowers and amount financed for each stage of life BENCHMARK
*Borrowers for whom it is not possible to determine a stage of life (4,057 borrowers for whom settlement information for the past five fiscal years has not been obtained that have borrowed a total of ¥173.1 billion) have been excluded
Collaboration

7
Number of main clients and amount financed Clients are counted on a group basis
11,050 ¥702.7 billion
Number of clients for whom management indices, etc., improved and amount financed Including clients for whom the main group companies improved (1) net sales, (2) operating profit margin, (3) labor productivity, or (4) increased number of employees
7,836 ¥510.7 billion
(As of March 31, 2017)
Amount financed for clients over time that have improved management indices, etc., as of the end of the fiscal year
Number of clients for whom an improvement in management indices (net sales, operating profit margin, labor productivity, etc.) or an increase in the number of employees can be observed, of companies for whom we are the main bank (on a group basis), as well as the amount financed to these clients over time BENCHMARK

8
(As of March 31, 2017)
Number of main clients as a proportion of all clients over time
12,413 12,350 12,387
Year endedMarch 2015
Year endedMarch 2016
Year endedMarch 2017
(47.0%) (46.1%) (45.5%)
All clients
26,403 26,785 27,196 (Unit: Companies)
Main clients
Clients over time by region
25,065 25,354 25,601
457 492 534
881
Year endedMarch 2015
Year endedMarch 2016
Year endedMarch 2017
Base region
Outside base region
Outside Aichi Prefecture (Tokyo, Osaka, Shizuoka)
Outside Aichi Prefecture (Gifu, Tajimi, Hamamatsu)
Aichi Prefecture
(Unit: Companies)
939 1,061
Number of corporate clients engaged in compound transactions
15,881 16,240
Year endedMarch 2015
Year endedMarch 2016
Year endedMarch 2017
16,717(Unit: Clients)
Number of all clients and regional clients over time (on a per client basis) BENCHMARK
Number of main clients over time and proportion of all clients (on a per client basis) BENCHMARK
Number of corporate clients engaged in compound transactions UNIQUE BENCHMARK
Base region: Branches within Aichi Prefecture, Gifu branch, Tajimi branch, Hamamatsu branch
Outside base region: Tokyo branch, Osaka branch, Shizuoka branch
Number of corporate clients engaged in compound transactions: Number of business clients (corporate clients) that have one or more transactions listed in the Bank’s designated main client items (EB bundle transfer, direct payroll deposit, Densai operators, NISA account operators, or related corporate clients)
Clients: Borrowers and recipients of all types of assistance

9
Initiative on Business Manager Guarantee Guidelines The Bank has always taken care to perform a thorough check of the intention with regard to
guarantees when concluding agreements in the case of obtaining individual guarantees when providing finance. Now, the Bank will observe the “Guideline on Business Manager Guarantees” announced by the Business Manager Guarantee Guideline Working Group (Secretariat: Japanese Bankers Association and The Japan Chamber of Commerce and Industry) and has upgraded its systems to comply with the Guideline. In future, we will strive to respond sincerely in accordance with the Guideline when concluding guarantee agreements with customers, or when receiving a request from a customer acting as a guarantor to clear the guaranteed debt in line with the Guideline.
[Achievements]
Results for Fiscal 2016
Number of new unsecured loans 2,412
Number of loans with guarantee contracts cancelled 345
Number of guaranteed debt clearances based on the Guideline 5
Ratio of new loans that do not depend on business manager guarantees
9.06%
Status of Measures on Business Viability Evaluation Utilization of Business Viability Evaluation Sheet
Since April 2015, we have been creating Business Viability Evaluation Sheets to accurately evaluate the content and growth potential of a business (business viability evaluation) and provide financing and advice appropriate to the customer life stage.
[Achievements] Total Number of Business Viability Evaluation Sheets created as of March 31, 2017: 1,773

10
(As of March 31, 2017)
Number of borrowers (Proportion of all borrowers)
1,690 (6.3%)
Balance of amount financed (Proportion of balance of amount financed for all borrowers)
¥348.5 billion (20.2%)
*Number of borrowers for whom financing is conducted based on a business viability evaluation: Clients for whom financing has
been conducted having drafted the Business Viability Evaluation Sheet prescribed by the Bank
Number of borrowers for whom financing is conducted based on a business viability evaluation as well as amount financed, and proportion of borrowers and amount financed (individual client basis) BENCHMARK

11
Start-ups and New Business Pioneers Start-up Support
In May 2016, “The Bank of Nagoya Motto-Jimoto Start-up Support Team” started “Start-up Café,” in conjunction with the Japan Finance Corporation. This event provides support to those that are planning to start up a new business, and is a one-stop financing and consultation service for customers that are considering starting up or incorporating a new business. At the Start-up Café, it conducted lectures concerning financing, market development, and marketing, as well as reviewing the business plans of participants, etc. In February 2017, we held the second Start-up Café initiative, “Start-up Café Mini-Seminar” in which we offered practical seminar presentations on the key points following the launch of a start-up and the essential basics on drafting a founding plan and arranging financing. Going forward, we will work together with various organizations, etc., to provide support for starting up and incorporating new businesses.
New Business Development
[Utilizing the Fund for Agriculture, Forestry and Fisheries Investment Limited Partnership] We are conducting investment, etc., in customers that are engaging in sixth-sector industrialization, through the Aichi-Jimoto Fund for Agriculture, Forestry and Fisheries Investment Limited Partnership, which was established by financial institutions including the Bank, along with the Agriculture, forestry and fisheries Fund corporation for Innovation, Value-chain and Expansion Japan. We are supporting new businesses that utilize the primary sector, such as by establishing the No. 1 project in June 2016.
[Support for Applications for Manufacturing Subsidies]
We introduced clients to outside specialists associated with the Bank and provided support for drafting business plans for capital investment of new businesses and making applications to subsidy schemes. As a result of our active support, we were selected as number 1 in Aichi Prefecture and number 2 nationally out of the 73 projects selected for the “2016 Revised Innovative Manufacturing, Commerce, and Service Support Subsidies.”
(As of March 31, 2017)
Clients that Received Support at Founding Stage (Type of Support)
Suport for dra fting a
founding plan
20Investment in cl ients at founding
s tage (proper)
511Investment in
cl ients at founding
s ta ge (credit guara ntee)
1,270
Introduction to government
financial agencies or
start-up support
institutions
9
(Unit: Companies)
Total clients that received support at founding stage *Founding stage: Period of five years from founding 1,810

12
Further Significant Progress During the Growth Phase Support for Overseas Expansion We support our customers’ overseas expansion into China and Southeast Asia with a focus
on regional mid-sized companies and SMEs. In particular, we help them to diversify the fund procurement methods used by their local subsidiaries overseas by actively providing cross-border loans and syndicated loans with the JBIC.
[Achievements]
Results for Fiscal 2016
Transfers of capital 29
Transfer of loans to parent and subsidiary 22
Standby letters of credit 7
Cross-border loans and syndicated loans with the JBIC 2
Bond 4
Total 64
In addition to our Nantong Branch in China, we also dispatch Bank employees to local
affiliated financial institutions and the Japan External Trade Organization (JETRO) to provide information aligned to actual local situations.
[Bank Employee Dispatch Destinations] Bangkok Bank Public Company Limited (Thailand), PT. Bank Negara Indonesia (Persero) Tbk. (Indonesia), Sumitomo Mitsui Banking Corporation (China), JETRO Ho Chi Minh (Vietnam), JETRO Nagoya
We have also set up an environment for providing information on local areas by forming alliances with financial institutions other than those to which we have dispatched Bank employees.
[Alliance Partners] KASIKORNBANK Public Company Limited (Thailand), Metropolitan Bank and Trust Company (Philippines), Joint Stock Commercial Bank for Foreign Trade of Vietnam (Vietnam), Foreign Investment Agency (Vietnam), State Bank of India (India), State of Aguascalientes (Mexico), State of Jalisco (Mexico), State of Guanajuato (Mexico), State of Nuevo León (Mexico), Banamex (Mexico), Bank of Communications Co., Ltd. (China), Bank of China (China)
Diagram of scheme for syndicated loans (example)
THE BANK OF NAGOYA
Japan Bank for International Cooperation (JBIC)
Our customers
Local subsidiaries overseas
Operating funds
Operating funds
Loans to parent and subsidiary
13
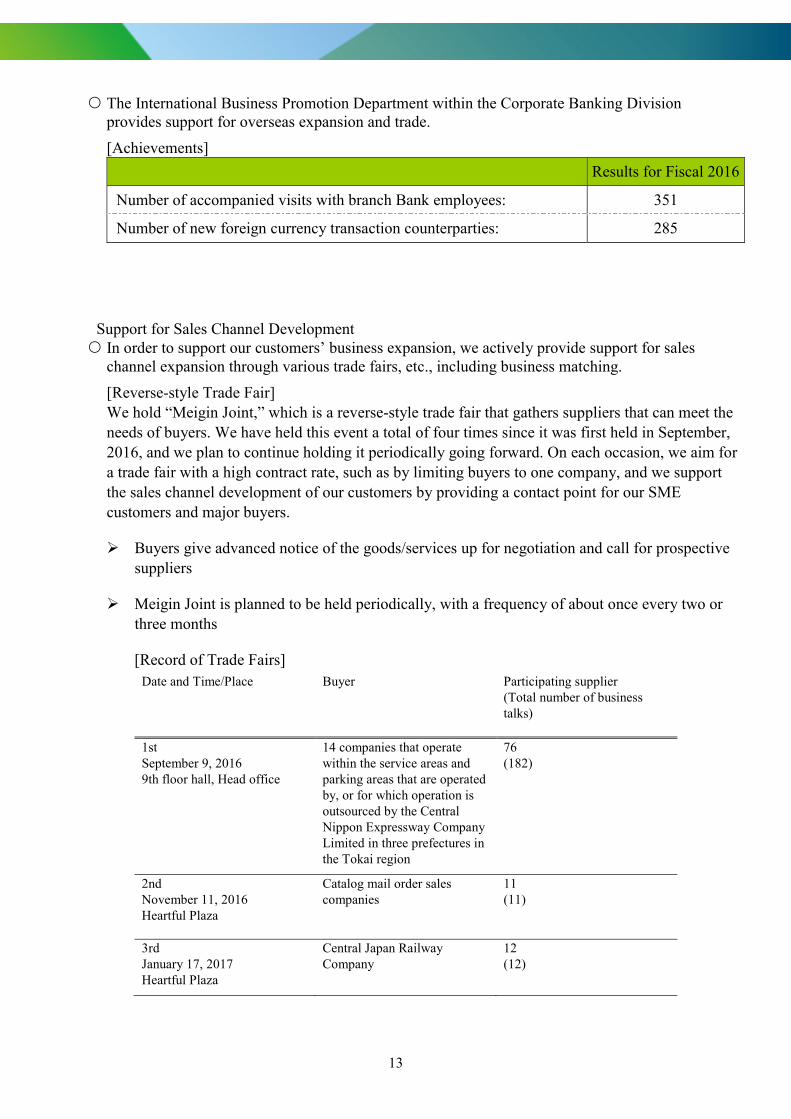
The International Business Promotion Department within the Corporate Banking Division provides support for overseas expansion and trade.
[Achievements]
Results for Fiscal 2016
Number of accompanied visits with branch Bank employees: 351
Number of new foreign currency transaction counterparties: 285
Support for Sales Channel Development In order to support our customers’ business expansion, we actively provide support for sales
channel expansion through various trade fairs, etc., including business matching.
[Reverse-style Trade Fair] We hold “Meigin Joint,” which is a reverse-style trade fair that gathers suppliers that can meet the needs of buyers. We have held this event a total of four times since it was first held in September, 2016, and we plan to continue holding it periodically going forward. On each occasion, we aim for a trade fair with a high contract rate, such as by limiting buyers to one company, and we support the sales channel development of our customers by providing a contact point for our SME customers and major buyers.
Buyers give advanced notice of the goods/services up for negotiation and call for prospective suppliers
Meigin Joint is planned to be held periodically, with a frequency of about once every two or three months
[Record of Trade Fairs] Date and Time/Place Buyer Participating supplier
(Total number of business talks)
1st September 9, 2016 9th floor hall, Head office
14 companies that operate within the service areas and parking areas that are operated by, or for which operation is outsourced by the Central Nippon Expressway Company Limited in three prefectures in the Tokai region
76 (182)
2nd November 11, 2016 Heartful Plaza
Catalog mail order sales companies
11 (11)
3rd January 17, 2017 Heartful Plaza
Central Japan Railway Company
12 (12)

14
4th February 22, 2017 Heartful Plaza
Local major equipment manufacturers
13 (13)
5th April 27, 2017 Heartful Plaza
Major engineering companies 10 (10)
[Support for Companies Involved with Food and Agriculture] Since March 2016, we have held the “Aichi-Jimoto Agriculture, Forestry and Fisheries Growth Support ‘Food’ and ‘Agriculture’ Trade Fair,” which is a trade fair relating to food and agriculture for regional vitalization through sixth-sector industrialization and collaboration between agriculture, commerce and industry, together with seven local credit unions, and we held the second event in March 2017. We support the sales channel development of our customers by providing a contact point for our SME customers and major buyers that are well-versed in the business of “food” and “agriculture.”
“Aichi-Jimoto Fund for Agriculture, Forestry and Fisheries Investment Limited Partnership” Decision to invest in Aichi Prefecture No. 1 Project (June 10, 2016) <Advice and proposals for business growth and development>
Aichi-Jimoto Agriculture, Forestry and Fisheries Growth Support “Food” and “Agriculture” Trade Fair
1st 2nd
Held on March 24, 2016 Held on March 3, 2017
NAGOYA TRADE & INDUSTRY CENTRE
Fukiage Hall
NAGOYA TRADE & INDUSTRY CENTRE
Fukiage Hall
Results Results
Participating
companies
126 (318 persons) Participating
companies
203 (555 persons)
Buyer companies
participating in
individual business
talks
73 (156 persons) Buyer companies
participating in
individual business
talks
102 (157 persons)
Number of individual
business talks
443 Number of individual
business talks
512
Regular attendees 236 persons Regular attendees 520 persons
15
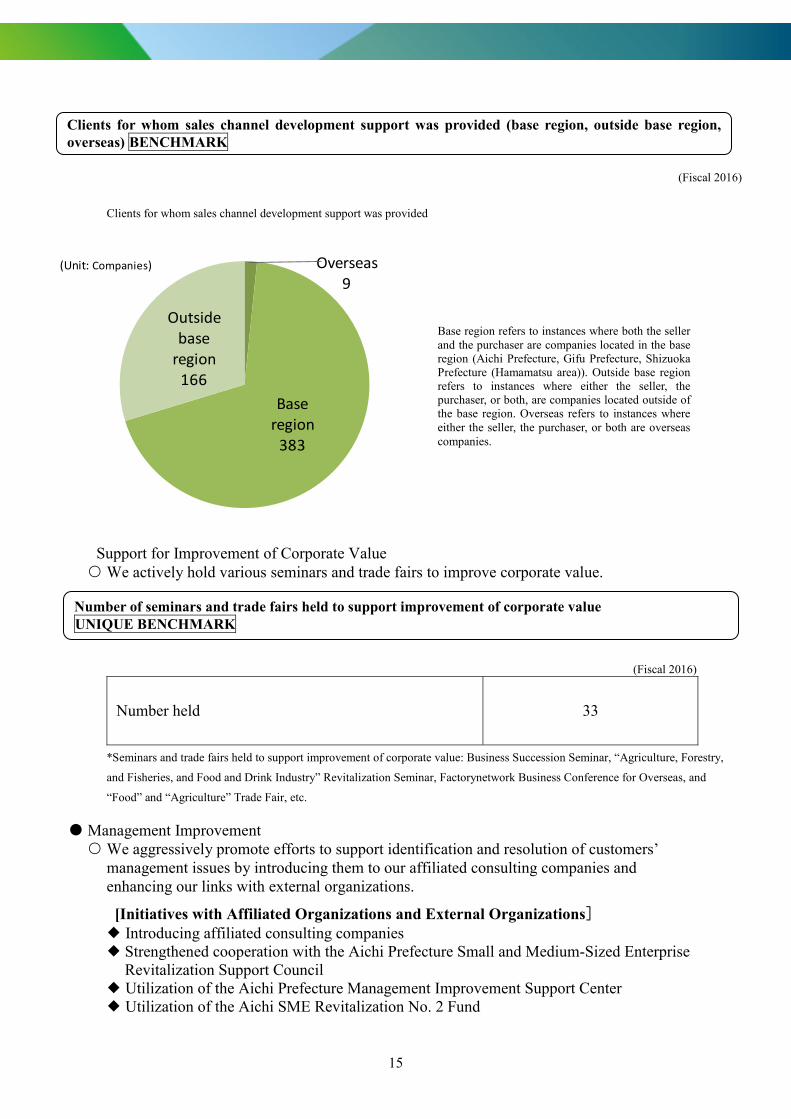
(Fiscal 2016)
Clients for whom sales channel development support was provided
Overseas9
Baseregion
383
Outsidebase
region166
(Unit: Companies)
Support for Improvement of Corporate Value We actively hold various seminars and trade fairs to improve corporate value.
(Fiscal 2016)
Number held 33
*Seminars and trade fairs held to support improvement of corporate value: Business Succession Seminar, “Agriculture, Forestry,
and Fisheries, and Food and Drink Industry” Revitalization Seminar, Factorynetwork Business Conference for Overseas, and
“Food” and “Agriculture” Trade Fair, etc.
Management Improvement We aggressively promote efforts to support identification and resolution of customers’
management issues by introducing them to our affiliated consulting companies and enhancing our links with external organizations.
[Initiatives with Affiliated Organizations and External Organizations] Introducing affiliated consulting companies Strengthened cooperation with the Aichi Prefecture Small and Medium-Sized Enterprise
Revitalization Support Council Utilization of the Aichi Prefecture Management Improvement Support Center Utilization of the Aichi SME Revitalization No. 2 Fund
Number of seminars and trade fairs held to support improvement of corporate value UNIQUE BENCHMARK
Clients for whom sales channel development support was provided (base region, outside base region, overseas) BENCHMARK
Base region refers to instances where both the seller and the purchaser are companies located in the base region (Aichi Prefecture, Gifu Prefecture, Shizuoka Prefecture (Hamamatsu area)). Outside base region refers to instances where either the seller, the purchaser, or both, are companies located outside of the base region. Overseas refers to instances where either the seller, the purchaser, or both are overseas companies.

16
Results for Fiscal 2016
Number of management consultation proposition cases 141
Number of new contracts with the Aichi Prefecture Small and Medium-Sized Enterprise Revitalization Support Council and the Aichi Prefecture Management Improvement Support Center (Total number of cases in the process of negotiations as of March 31, 2017)
18 (117)
Management analysis by the Credit Guarantee Corporations 87
(As of March 31, 2017)
Progress of management improvement plans for SME clients that change loan conditions
Favorable clients
142
Satisfactory clients
1,209
Unfavorable clients
501Total
number ofconditionschanged
1,852
(Unit: Companies)
Business Succession For owner-operated companies who face the absence of a successor or concerns over the
problem of transferring owner’s shares to a successor, we provide funding support and consultation regarding M&As.
[Achievements]
Details Results for Fiscal
2016
Business Succession
Suggestion of issues arising in proposals for business succession 247
Of which, introductions to affiliated consulting company in conjunction with business succession
4
Of which, funding support provided in conjunction with business succession
9
M&A
Consultation on M&A regarding corporate acquisition and corporate divestment
392
Of which, successful M&As 11
Progress of management improvement plans for SMEs that change loan conditions BENCHMARK

17
Initiatives to Stimulate Regional Economies Initiative (1): Expansion of the regional vitalization project team partnership agreement Ensuring a complete system to support the formulation and promotion of comprehensive
regional strategies by each local government, in order to proactively participate in improving revitalization of “Towns, People, and Jobs” in local communities.
Initiative (2): Utilization of the Aichi Prefecture Special Agricultural Zone Guarantee
In March 2017, the Bank financed a customer that ran an orchard to establish a farm restaurant. This project was the first in Aichi Prefecture utilizing the “Aichi Prefecture Special Agricultural Zone Guarantee” financing system established by AICHI GUARANTEE based on the national strategic special zones. It has contributed to the stimulation of regions and industries involved with agriculture, such as new participation in agriculture by commerce and industry and increased business scale, while expanding the range of financing methods for agricultural producers.
Initiative (3): Support for the tourism sector In June 2016, the Bank started the “Tokai Hokuriku Tourism Revitalization Project”
which was a trans-regional collaboration with The Hokkoku Bank, The Fukui Bank, The First Bank of Toyama, The Hyakugo Bank, and The Juroku Bank, in order to revitalize the tourism industry and achieve regional vitalization in the Tokai and Hokuriku regions. In December 2016, we established booths of tourism organizations representing each prefecture at the three-bank business trade fair hosted by us along with The Hyakugo Bank, and The Juroku Bank, as the plan for the first stage of the project. Going forward, we will support the revitalization of the tourism industry by jointly promoting business support for tourism-related business operators.
Production/supply Processing/cooking/supply
Primary producers Sixth-sector businesses
Company A ●Tourist farm operation ●Agricultural production operation ●Establishment/ management/ operation of a farm restaurant
Consumers
Partner company THE BANK OF NAGOYA
Company C
Company B
[New business] ●Work on commission for cooking and supply to farm restaurant ●Construction and operation of winemaking facilities
Food supply
Work commission
Restaurant earnings
Food and drink supply
Payment
Operation knowhow Fund procurement
Consulting fee

18
Medium- and Long-term Management Strategies
We are conducing initiatives based on the following five basic policies in the three-year 20th medium-term management plan “Stronger, Longer, Deeper” - Deepening Bonds with Local Community,” started in April 2017, in order to create strong, long, and deep bonds with “local communities,” “regional customers,” and “employees” by providing highly satisfying service, and remain the most relied upon financial institution in the region.
(1) Stronger - Realizing a more fulfilling lifestyle for our regional customers The entire Bank of Nagoya Group creates strong bonds with customers by establishing a service and sales framework from the perspective of the customers.
(2) Longer - Maintaining a framework that aims for “transactions over many years” Creating long-lasting bonds with our customers by establishing a framework to provide solutions that meet the needs of customers, based on business viability evaluations.
(3) Deeper - Actively creating a pleasant environment within the bank through thorough staff education Creating deep bonds with our customers by creating challenging yet pleasant corporate environment and deepening diversity through staff education.
(4) Strengthening our All-Hands-In Sales Platform through a continuous BPR strategy (5) Strengthening our governance, risk management, and compliance (GRC) systems

19
Issues to Address
Social structure is rapidly changing due to the declining birth rate and aging population, the declining population, and developments in IT (information technology), etc. The business environment in which financial institutions operate is also feeling the impact on profits from reduced loan interest income, with intense competition between banks in Aichi Prefecture including with megabanks and financial institutions from other prefectures, in addition to the introduction of the negative interest rate policy.
In order to adapt to this business environment, it is our policy to strengthen earning potential by deepening transactions by increasing the Bank’s share and weight for each customer, in addition to increasing the number of our customers.
We will actively carry out various initiatives to achieve this deepening of transactions, including measures to expand financing through business viability evaluations, ensure full business support, enhance solution proposals, enhance regional vitalization support through collaboration between industry, universities, government, and financial institutions, and provide products that are suited to the customer’s life stage.
Under our philosophy of “fostering regional prosperity,” we will solve our customers’ various issues and achieve co-existence with local communities with the goal of becoming a bank truly needed by the region.
Management Policy
Based on the guiding precept of “fostering regional prosperity—which shall both develop the Bank and bring happiness to bank employees,” the Bank’s management policy comprises the following five matters which cover the overall image of what the Bank aims to be: “Contribute to the regional community,” “Strengthen our earnings power and ensure thoroughness in risk management,” “Provide financial services that suit the needs of the customers,” “Put compliance into practice” and “Establish a free and open-minded corporate climate.” In accordance with this basic policy, we will strive to further increase our corporate value as a regional financial institution which fosters regional prosperity. At the same time, we will work to fulfill this duty and earn the unshakeable support and trust of our shareholders and all other stakeholders.

20
The Bank’s Corporate Governance
At the Bank of Nagoya, we consider enhancing corporate governance to be one of the most important management challenges. While striving to further enhance our corporate value as a regional financial institution that fosters regional prosperity, we shall fulfill our responsibilities as a corporate citizen and work to establish unshakeable support and trust from all stakeholders, particularly the shareholders.
Based on this principle, the Bank’s guiding precept is to “foster regional prosperity—which shall both develop the Bank and bring happiness to bank employees” through (1) good service—a sincere, considerate and speedy service; (2) good people—lift people, broaden people and create a cheery workplace; and (3) good management—sound and richly innovative management that seeks full participation from employees. To this end, we shall strive to share the basic sense of values and ethics of directors and employees of the Bank, and to ensure that these are reflected in the Bank’s operations. We have formulated a “Code of Ethics for Bank of Nagoya Directors and Employees” and “Regulations for Complying with Laws and Regulations etc.” and through this we are striving to raise corporate value.
The Bank has a swift decision-making framework, led by the Board of Directors, that strictly operates internal regulations and delegates authority as appropriate. To this end, in order to enhance the clarity of the system of responsibility, further improve the vitality and strengthen the supervisory functions of the of the Board of Directors, we have invited two highly independent outside directors, and adopted an executive officer system by the appointment of the Board of Directors. Furthermore, we have adopted an audit and supervisory board members system featuring five audit and supervisory board members (of whom three are outside audit and supervisory board members) that coordinate with the independent auditor and the Internal Audit Division to audit the execution of the duties of directors. We have determined that we are able to adequately strengthen our corporate governance through this system.
Risk Management System
The Bank has enhanced its risk management system by establishing the Asset Liability Management (ALM) Committee to oversee credit risk, liquidity risk, and market risk, and the Operational Risk Management Committee to oversee risks related to internal operations, such as system risk and administrative risk. The Bank also considers compliance as a top priority and aims to establish a system of checks and balances and tighten internal controls by, for example, establishing a Compliance Committee that includes attorneys at law from outside the Bank. Status of all risks the Bank should address is covered by monthly meetings of these three committees, which will be then reported to the Board of Directors. This consolidated reporting system is designed in the way to enhance the Board of Directors’ ability to monitor the Bank’s risk control functions.

21
Breakdown of Loans (Nonconsolidated basis) Balance of problem loans under the Banking Act (risk monitored loans)
(As of March 31)
2017 (Millions of yen)
2016 (Millions of yen)
Rate of change (%)
Total loans and bills discounted
2,389,010 2,240,959 6.60
Claims to borrowers in bankruptcy *1
1,071 1,523 -29.67
Past due loans *2 48,883 47,615 2.66
Accruing loans past due three months or more *3
22 27 -18.51
Restructured loans *4 12,115 12,087 0.23
Ratio of risk monitored loans to total loans and bills discounted
2.60% 2.73% -0.13%
*1 Claims to borrowers in bankruptcy
Of non-accrual loans for which there is no prospect of payment or collection of principal and/or interest, for reasons such as the delay in payment of interest or principal having continued for a considerable period of time, those are subject to the following grounds set forth in the Order for Enforcement of the Corporation Tax Act of Japan: (a) Petition for commencement of reorganization proceedings pursuant to the provisions of the Corporate Reorganization
Act or Act on Special Treatment of Corporate Reorganization Proceedings and Other Insolvency Proceedings of Financial Institutions.
(b) Petition for commencement of rehabilitation proceedings pursuant to the provisions of the Civil Rehabilitation Act. (c) Petition for commencement of bankruptcy proceedings pursuant to the provisions of the Bankruptcy Act. (d) Petition for commencement of special liquidation proceedings pursuant to the provisions of the Companies Act. (e) Suspension of transactions through a clearing house (including bank syndicates that undertake clearing in the relevant
regions when there is no clearing house) (f) Should there be a significant decrease in the economic value of monetary claims against foreign governments, central
banks, and local governments, due to long-term delays in the performance of obligations, and should the receipt of payment be recognized as being extremely difficult.
*2 Past due loans These are non-accrual loans other than claims to borrowers in bankruptcy and loans for which interest payments are deferred in order to assist the financial recovery of borrowers in financial difficulties.
*3 Accruing loans past due three months or more These are loans for which the payment of the principal and/or interest is past due three months or more from the day following contractual payment date, excluding claims to borrowers in bankruptcy and past due loans.
*4 Restructured loans These are loans for which the Bank has relaxed the lending conditions for borrowers in financial difficulties—such as by a reduction of the original rate, forbearance of interest and/or principal payment, granting a maturity date extension—in order to support their financial recovery or restructuring. These exclude claims to borrowers in bankruptcy, past due loans and accruing loans past due three months or more.

22
Balance of problem loans under the Financial Revitalization Act
(As of March 31)
2017 (Millions of yen)
2016 (Millions of yen)
Rate of change (%)
Bankrupt and quasi-bankrupt *5
4,932 6,734 -26.75
Doubtful *6 45,130 42,528 6.11
Need of special attention *7 12,137 12,115 0.18
Normal *8 2,359,099 2,204,854 6.99
*5 Bankrupt and quasi-bankrupt These are loans to borrowers who are currently in legal bankruptcy procedures, including bankruptcy, liquidation, corporate reorganization, and rearrangement, and borrowers who are not currently in legal bankruptcy, but in quasi-bankruptcy.
*6 Doubtful These are loans to borrowers who are not currently in bankruptcy, but in difficult financial situations and with a possibility of higher default risk.
*7 Need of special attention These are accruing loans past due 3 months or more (excluding those under *5 and *6), and restructured loans (excluding those under *5 and *6 and accruing loans past due three months or more).
*8 Normal These are loans to borrowers not having particular problems regarding their financial situations and operating conditions, and excluding loans classified as “Bankrupt and quasi-bankrupt,” “Doubtful” and “Need of special attention.”
At March 31, 2017, the ratio of problem loans under the Financial Reconstruction Law was 2.57%.
(2017/3/31)
23
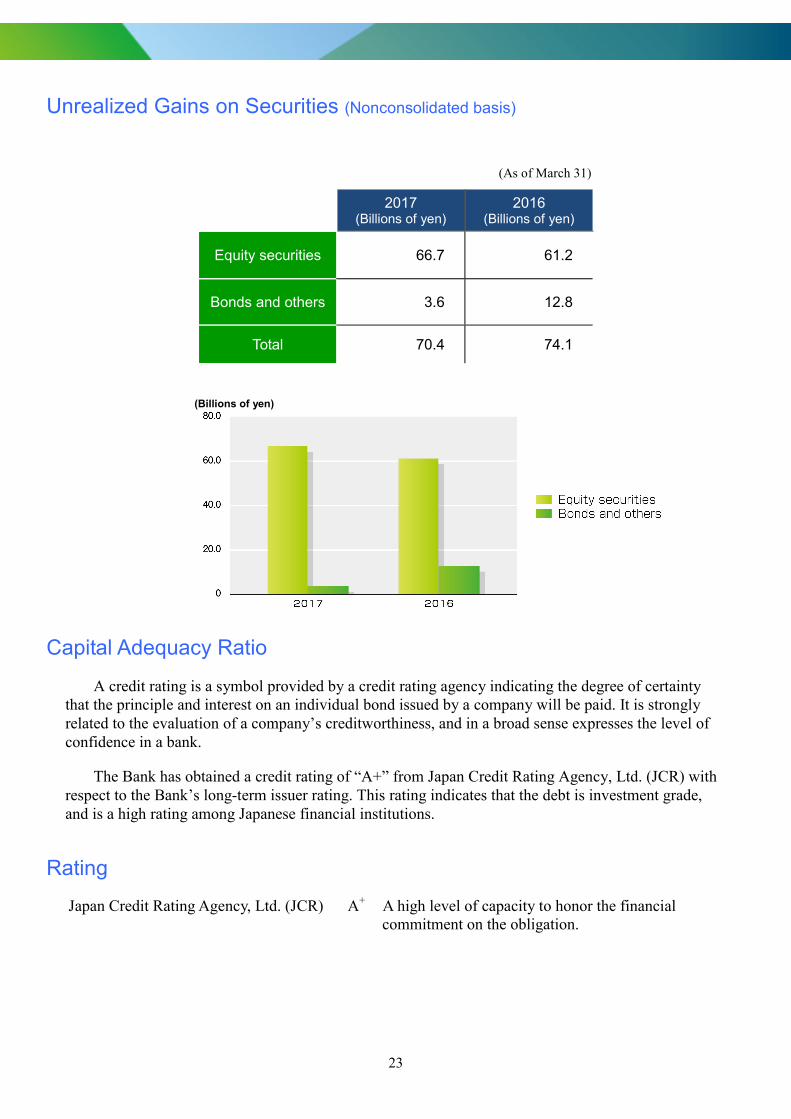
Unrealized Gains on Securities (Nonconsolidated basis)
(As of March 31)
2017 (Billions of yen)
2016 (Billions of yen)
Equity securities 66.7 61.2
Bonds and others 3.6 12.8
Total 70.4 74.1
(Billions of yen)
Capital Adequacy Ratio
A credit rating is a symbol provided by a credit rating agency indicating the degree of certainty that the principle and interest on an individual bond issued by a company will be paid. It is strongly related to the evaluation of a company’s creditworthiness, and in a broad sense expresses the level of confidence in a bank.
The Bank has obtained a credit rating of “A+” from Japan Credit Rating Agency, Ltd. (JCR) with respect to the Bank’s long-term issuer rating. This rating indicates that the debt is investment grade, and is a high rating among Japanese financial institutions.
Rating
Japan Credit Rating Agency, Ltd. (JCR) A+ A high level of capacity to honor the financial commitment on the obligation.
24
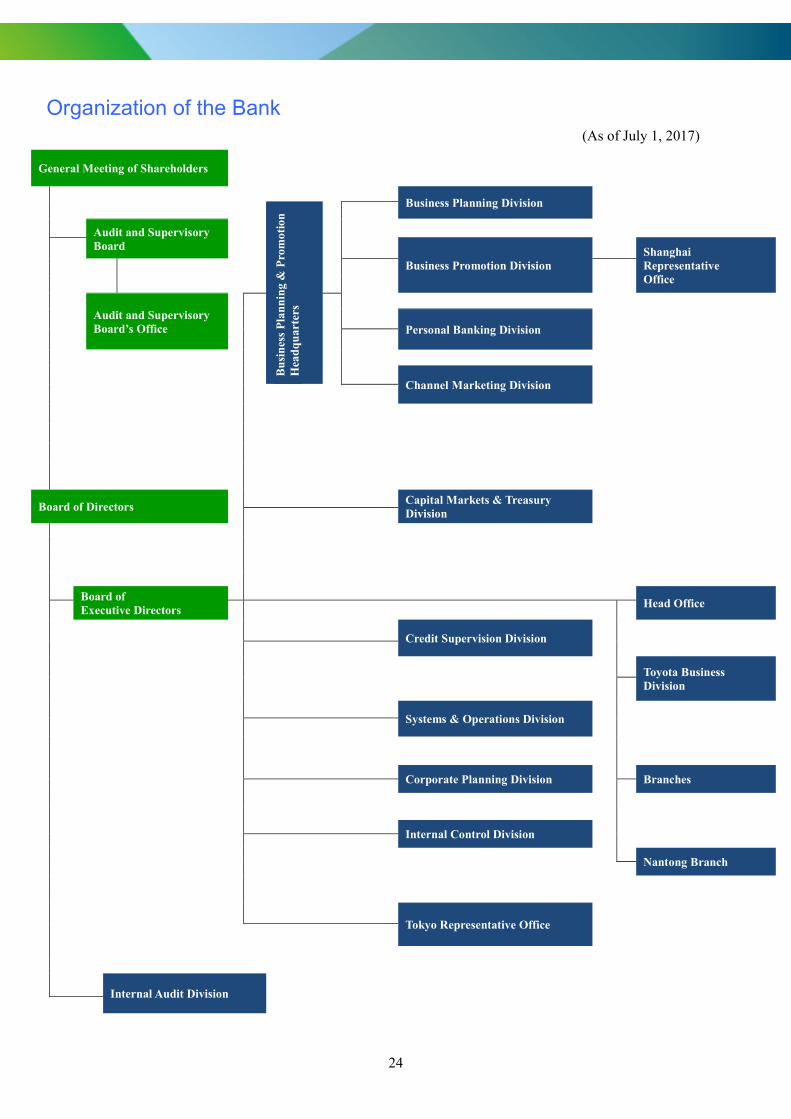
Organization of the Bank (As of July 1, 2017)
General Meeting of Shareholders
Business Planning Division
Bu
sin
ess
Pla
nnin
g &
Pro
mot
ion
Hea
dq
uar
ters
Audit and Supervisory
Board
Business Promotion Division
Shanghai Representative Office
Audit and Supervisory Board’s Office
Personal Banking Division
Channel Marketing Division
Board of Directors
Capital Markets & Treasury Division
Board of Executive Directors
Head Office
Credit Supervision Division
Toyota Business
Division
Systems & Operations Division
Corporate Planning Division
Branches
Internal Control Division
Nantong Branch
Tokyo Representative Office
Internal Audit Division

25
Principal Shareholders (As of March 31, 2017)
Sumitomo Mitsui Banking Corporation 5.22% Mizuho Bank, Ltd. 4.26% The Bank of Nagoya Employees’ Shareholding Association (Meigin Minori-kai) 3.71% Nippon Life Insurance Company 3.67% Meiji Yasuda Life Insurance Company 3.67% The Master Trust Bank of Japan, Ltd. (Toyota Motor Corporation Account) 2.95% SUMITOMO LIFE INSURANCE COMPANY 2.61% Japan Trustee Services Bank, Ltd. (Trust Account 4) 2.08% Mitsui Sumitomo Insurance Company, Limited 2.07% The Juroku Bank, Ltd. 2.06%
Notes: 1. Shares held by The Master Trust Bank of Japan, Ltd. (Toyota Motor Corporation Account) and Japan Trustee Services Bank, Ltd. (Trust Account 4) are shares in association with their trust business.
2. In addition to the above, the Bank holds 830,000 treasury shares. 3. In a report to amend a report of possession of large volume dated March 21, 2017, it is stated that Mitsubishi UFJ Trust and
Banking Corporation, along with joint holders, Mitsubishi UFJ Kokusai Asset Management Co., Ltd., Mitsubishi UFJ Morgan Stanley Securities Co., Ltd., and MU Investments Co., Ltd. are the owners of the following shares as of March 13, 2017. However, as the bank is unable to confirm the number of shares substantially owned as of the end of the fiscal year, the details of the shares recorded in the share register have been listed in the status of major shareholders above. Details included in the report to amend the report of possession of large volume are as follows:
Mitsubishi UFJ Trust and Banking Corporation 4.72% Mitsubishi UFJ Kokusai Asset Management Co., Ltd. 0.22% Mitsubishi UFJ Morgan Stanley Securities Co., Ltd. 0.47% MU Investments Co., Ltd. 0.82%
Board of Directors and Audit and Supervisory Board (As of June 23, 2017)
Chairman Kazumaro Kato
President Ichiro Fujiwara
Senior Managing Director Yasuhisa Yamamoto Directors Shougo Ukai Itaru Iyoda Naoto Sugita Shunji Asami Kiyoshi Imaoka Satoru Hattori Toshi Saeki*1 Takehisa Matsubara*1 *1 Outside director Executive Officers Takayuki Yogo Kenji Suzuki Isao Takami Tadashi Takahashi
Managing Directors Shinichi Yokota Hideharu Ishii Koji Kurachi Audit and Supervisory Board MembersTetsundo Nakamura*2 *2 Full-timeHaruhiko Asano Nobuyoshi Hasegawa Takao Kondo Toshiro Goto

hiroyuki.toritani
テキストボックス
26

27
The Bank of Nagoya, Ltd. and Consolidated Subsidiaries Consolidated Balance Sheets March 31, 2017 and 2016
Thousands of U.S. dollars Millions of yen
2017 2016 2017
Assets:
Cash and due from banks (Note 3) ¥ 249,635 ¥ 242,670 $ 2,225,109
Call loans and bills purchased (Note 3) 1,698 2,871 15,137
Securities (Notes 3, 4, 7, 12 and 20) 919,295 969,731 8,194,098
Loans and bills discounted (Notes 3, 5, 15 and 20) 2,389,465 2,241,953 21,298,383
Foreign exchange 3,748 2,845 33,409
Lease receivables and investments in leased assets
(Note 15) 28,593 26,444 254,868
Other assets (Note 7) 27,449 16,827 244,673
Tangible fixed assets (Note 6) 35,951 36,235 320,454
Intangible fixed assets 2,045 2,022 18,236
Employee retirement benefit assets (Note 11) 10,998 14,618 98,037
Deferred tax assets (Note 17) 758 811 6,760
Customers’ liabilities for acceptances and
guarantees (Note 12) 11,021 10,230 98,240
Reserve for possible loan losses (Note 3) (13,076) (12,951) (116,554)
Total assets ¥ 3,667,586 ¥ 3,554,311 $ 32,690,850
(Continued) See accompanying Notes to Consolidated Financial Statements.

28
The Bank of Nagoya, Ltd. and Consolidated Subsidiaries Consolidated Balance Sheets March 31, 2017 and 2016
Millions of yen
Thousands of U.S. dollars
2017 2016 2017
Liabilities:
Deposits (Notes 3, 7 and 8) ¥ 3,281,431 ¥ 3,199,702 $ 29,248,877
Call money and bills sold (Note 3) 12,340 10,141 110,000
Payables under securities lending transactions
(Notes 3 and 7) 31,088 18,488 277,109
Borrowed money (Notes 3, 7 and 9) 34,207 26,526 304,906 Foreign exchange 17 44 152 Bonds payable (Notes 3 and 10) 10,000 – 89,135
Bonds with stock acquisition rights (Notes 3 and 10) 11,219 11,268 100,000
Other liabilities (Note 17) 21,392 19,826 190,678
Reserve for employee bonuses 1,078 1,100 9,615
Reserve for executive bonuses 46 51 414
Employee retirement benefit liability (Note 11) 5,055 4,937 45,065
Reserve for executive retirement benefits 30 23 269
Reserve for losses on repayments of dormant bank
accounts 360 369 3,215
Reserve for contingent losses 2,157 1,834 19,234
Reserve for loss on interest repayments 184 199 1,644
Deferred tax liabilities (Note 17) 15,139 16,908 134,943
Deferred tax liabilities for revaluation (Note 6) 3,223 3,223 28,731
Acceptances and guarantees (Note 12) 11,021 10,230 98,240
Total liabilities 3,439,995 3,324,877 30,662,227
Net assets (Notes 13, 14 and 19):
Common stock 25,090 25,090 223,646
Capital surplus 18,810 18,810 167,666
Retained earnings 128,758 127,458 1,147,681
Less treasury stock, at cost (3,614) (3,592) (32,216)
Total shareholders’ equity 169,045 167,766 1,506,777
Accumulated other comprehensive income 54,037 57,430 481,663
Stock acquisition rights 102 76 911
Noncontrolling interests 4,405 4,161 39,272
Total net assets 227,591 229,434 2,028,623
Total liabilities and net assets ¥ 3,667,586 ¥ 3,554,311 $ 32,690,850

29
The Bank of Nagoya, Ltd. and Consolidated Subsidiaries Consolidated Statements of Income For the Years Ended March 31, 2017 and 2016
Thousands of U.S. dollars Millions of yen
2017 2016 2017
Income:
Interest income:
Interest on loans and discounts ¥ 23,560 ¥ 25,345 $ 210,007
Interest and dividends on securities 9,315 9,263 83,031
Other interest income 236 277 2,106
Total interest income 33,112 34,886 295,144
Fees and commissions 8,236 8,015 73,418
Other operating income 20,115 16,850 179,298
Reversal of provision for possible loan losses – 2,241 –
Gain on sales of stocks and other securities 1,130 677 10,078
Gain on return of assets from retirement benefit
trusts (Note 11) 712 – 6,354
Other income 534 1,191 4,762
Total income 63,842 63,862 569,054
Expenses:
Interest expense:
Interest on deposits 1,220 1,782 10,882
Interest on borrowings and rediscounts 326 205 2,912
Other interest expense 941 551 8,394
Total interest expense 2,489 2,539 22,188
Fees and commissions 2,404 2,486 21,436
Other operating expenses 15,514 12,895 138,291
General and administrative expenses (Notes 14 and
18) 32,033 32,653 285,531
Provision of reserve for possible loan losses 1,306 – 11,649
Loss on devaluation of stocks and other securities 0 4 5
Impairment loss on fixed assets 126 250 1,127
Other expenses 1,721 1,760 15,343
Total expenses 55,598 52,590 495,570
Profit before income taxes 8,244 11,272 73,484
Income taxes (Note 17) 2,047 3,984 18,249
Profit 6,196 7,287 55,235
Profit attributable to noncontrolling
interests 251 316 2,241
Profit attributable to owners of the
parent ¥ 5,945 ¥ 6,971 $ 52,994
Yen U.S. dollars
Earnings per share (Note 2(u)):
Basic ¥ 303.34 ¥ 353.71 $ 2.70
Diluted 265.02 288.67 2.36
Cash dividends 38.50 7.00 0.34See accompanying Notes to Consolidated Financial Statements.

30
The Bank of Nagoya, Ltd. and Consolidated Subsidiaries Consolidated Statements of Comprehensive Income For the Years Ended March 31, 2017 and 2016
Thousands of U.S. dollars Millions of yen
2017 2016 2017
Profit ¥ 6,196 ¥ 7,287 $ 55,235
Other comprehensive income (Note 19):
Net change in unrealized losses on available-for-sale
securities (2,533) (12,444) (22,578)
Net change in deferred (losses) gains on hedging
instruments (0) 0 (2)
Net change in land revaluation excess – 158 –
Retirement benefit adjustments (863) (4,926) (7,695)
Total other comprehensive income (3,396) (17,212) (30,275)
Comprehensive income ¥ 2,800 ¥ (9,924) $ 24,960
Comprehensive income attributable to: Owners of the parent ¥ 2,552 ¥ (10,237) $ 22,754
Noncontrolling interests 247 312 2,206
Total comprehensive income ¥ 2,800 ¥ (9,924) $ 24,960 See accompanying Notes to Consolidated Financial Statements.

31
The Bank of Nagoya, Ltd. and Consolidated Subsidiaries Consolidated Statements of Changes in Net Assets For the Years Ended March 31, 2017 and 2016
Millions of yen Shareholders’ equity Accumulated other comprehensive income
Common stock
Capital surplus
Retained earnings
Treasury stock
Total shareholders’
equity
Net unrealized gains on
available-for-sale securities
Net deferred (gains) losses on hedging instruments
Land revaluation
excess
Retirement benefit
adjustments
Total
accumulated other
comprehensive income
Stock acquisition
rights
Non- controlling
interestsTotal net
assets
Balance at March 31, 2015 ¥ 25,090
¥ 18,645
¥ 121,757
¥ (3,587)
¥ 161,907 ¥ 65,055 ¥ 0 ¥ 4,351 ¥ 5,341 ¥ 74,748
¥ 38 ¥ 4,288 ¥ 240,982
Profit attributable to owners of the parent – – 6,971 – 6,971 – – – – – – – 6,971
Cash dividends – – (1,379) – (1,379) – – – – – – – (1,379)
Purchases of treasury stock – – – (10) (10) – – – – – – – (10)
Disposition of treasury stock – (0) – 4 3 – – – – – – – 3
Changes in shareholders’ equity related to transactions with noncontrolling shareholders – 164 – – 164 – – – – – – – 164
Reversal of land revaluation excess – – 109 – 109 – – – – – – – 109
Transfer from retained earnings to capital surplus – 0 (0) – – – – – – – – – –
Net changes in items other than shareholders’ equity – – – – – (12,441) 0 49 (4,926) (17,318) 38 (127) (17,407)
Balance at March 31, 2016 25,090 18,810 127,458 (3,592) 167,766 52,614 0 4,400 415 57,430 76 4,161 229,434
Profit attributable to owners of the parent – – 5,945 – 5,945 – – – – – – – 5,945
Cash dividends – – (1,379) – (1,379) – – – – – – – (1,379)
Purchases of treasury stock – – – (3,297) (3,297) – – – – – – – (3,297)
Disposition of treasury stock – (1) – 11 10 – – – – – – – 10
Retirement of treasury stock – (3,264) – 3,264 – – – – – – – – –
Transfer from retained earnings to capital surplus – 3,265 (3,265) – – – – – – – – – –
Net changes in items other than shareholders’ equity – – – – – (2,529) (0) – (863) (3,392) 25 244 (3,121)
Balance at March 31, 2017 ¥ 25,090 ¥ 18,810 ¥ 128,758 ¥ (3,614) ¥ 169,045 ¥ 50,085 ¥ (0) ¥ 4,400 ¥ (447) ¥ 54,037 ¥ 102 ¥ 4,405 ¥ 227,591

32
The Bank of Nagoya, Ltd. and Consolidated Subsidiaries Consolidated Statements of Changes in Net Assets For the Years Ended March 31, 2017 and 2016
Thousands of U.S. dollars
Shareholders’ equity Accumulated other comprehensive income
Common
stock Capital surplus
Retained earnings
Treasury stock
Total shareholders’
equity
Net unrealized gains on
available-for-sale securities
Net deferred (gains) losses on hedging instruments
Land revaluation
excess
Retirement benefit
adjustments
Total accumulated
other comprehensive
income
Stock acquisition
rights
Non- controlling
interests Total net
assets
Balance at March 31, 2016 $ 223,646 $ 167,665 $ 1,136,091 $ (32,025) $ 1,495,377 $ 468,975 $ 2 $ 39,224 $ 3,702 $ 511,903 $ 679 $ 37,090 $ 2,045,049
Profit attributable to owners of the parent – – 52,994 – 52,994 – – – – – – – 52,994
Cash dividends – – (12,298) – (12,298) – – – – – – – (12,298)
Purchases of treasury stock – – – (29,388) (29,388) – – – – – – – (29,388)
Disposition of treasury stock – (12) – 104 92 – – – – – – – 92
Retirement of treasury stock – (29,093) – 29,093 – – – – – – – – –
Transfer from retained earnings to capital surplus – 29,106 (29,106) – – – – – –
– – – –
Net changes in items other than shareholders’ equity – – – – – (22,543) (2) – (7,695)
(30,240) 232 2,182 (27,826)
Balance at March 31, 2017 $ 223,646 $ 167,666 $ 1,147,681 $ (32,216) $ 1,506,777 $ 446,432 $ (0) $ 39,224 $ (3,993) $ 481,663 $ 911 $ 39,272 $ 2,028,623
See accompanying Notes to Consolidated Financial Statements.

33
The Bank of Nagoya, Ltd. and Consolidated Subsidiaries Consolidated Statements of Cash Flows For the Years Ended March 31, 2017 and 2016
Millions of yen Thousands of U.S. dollars
2017 2016 2017 Cash flows from operating activities:
Profit before income taxes ¥ 8,244 ¥ 11,272 $ 73,484Adjustments for:
Depreciation and amortization 2,647 2,497 23,597 Impairment loss on fixed assets 126 250 1,126 Stock option expenses 36 40 323 Increase (decrease) in reserve for possible loan losses 124 (3,629) 1,109 Decrease in employee retirement benefit assets 3,619 4,509 32,266 Increase in employee retirement benefit liability 118 1,112 1,056 Increase (decrease) in reserve for executive retirement benefits 6 (0) 56 Increase (decrease) in reserve for contingent losses 323 (611) 2,886 Interest income recognized on statement of income (33,112) (34,886) (295,144) Interest expense recognized on statement of income 2,489 2,539 22,188 Net gains on securities (2,283) (1,162) (20,350) Foreign exchange losses, net 1,410 5,263 12,571
Amortization of bond issuance cost 57 – 513
Net decrease (increase) in call loans and bills purchased and others 1,173 (2,223) 10,456 Net increase in loans and bills discounted (147,512) (100,068) (1,314,841) Net increase in lease receivables and investments in leased assets (2,149) (3,563) (19,157) Net increase in deposits 81,728 55,589 728,484 Net increase (decrease) in call money and bills sold 2,199 (73) 19,607 Net increase in payables under securities lending transactions 12,599 8,096 112,308 Net increase in borrowed money (excluding subordinated borrowings) 7,681 4,377 68,465 Interest income received 33,939 35,322 302,520 Interest expense paid (2,546) (2,164) (22,701) Others, net (12,517) (4,736) (111,570) Subtotal (41,594) (22,245) (370,748)
Income taxes paid (1,467) (1,684) (13,080) Net cash used in operating activities (43,061) (23,929) (383,828)Cash flows from investing activities: Purchases of securities (437,881) (313,906) (3,903,033) Proceeds from sales and maturities of securities 484,639 315,714 4,319,807 Purchases of tangible fixed assets (1,647) (2,570) (14,689) Proceeds from sales of tangible fixed assets 3 657 35 Purchases of intangible fixed assets (684) (627) (6,102) Net cash provided by (used in) investing activities 44,429 (732) 396,018Cash flows from financing activities:
Proceeds from issuance of subordinated bonds 9,942 – 88,622
Dividends paid to shareholders (1,380) (1,380) (12,306)
Dividends paid to noncontrolling shareholders (2) (2) (24) (Purchase) disposition of treasury stock, net (3,297) (8) (29,388) Purchases of stocks of subsidiaries not resulting in change in scope of consolidation – (272) –
Net cash provided by (used in) financing activities 5,262 (1,665) 46,904 Effect of exchange rate changes on cash and cash equivalents 6 (1) 54 Net increase (decrease) in cash and cash equivalents 6,635 (26,328) 59,148 Cash and cash equivalents at beginning of year 240,876 267,205 2,147,039 Cash and cash equivalents at end of year (Note 2(b)) ¥ 247,512 ¥ 240,876 $ 2,206,187
See accompanying Notes to Consolidated Financial Statements.

34
The Bank of Nagoya, Ltd. and Consolidated Subsidiaries Notes to Consolidated Financial Statements 1. Basis of Consolidated Financial Statements
The accompanying consolidated financial statements of The Bank of Nagoya, Ltd. (the “Bank”) and its consolidated subsidiaries (together with the Bank, the “Group”) have been prepared in conformity with accounting principles generally accepted in Japan (“Japanese GAAP”), which are different in certain respects as to application and disclosure requirements from the International Financial Reporting Standards. The accompanying consolidated financial statements have been restructured and translated into English from the consolidated financial statements of the Bank prepared in accordance with Japanese GAAP and filed with the appropriate Local Finance Bureau of the Ministry of Finance as required by the Financial Instruments and Exchange Act of Japan. Certain supplementary information included in the statutory Japanese language consolidated financial statements, but not required for fair presentation, has not been presented in the accompanying consolidated financial statements. The amounts in Japanese yen are presented in millions of yen and are rounded down to the nearest million. Accordingly, the totals shown in the accompanying consolidated financial statements and these notes may not equal the sum of the individual amounts. The translation of the Japanese yen amounts into U.S. dollar amounts is included solely for the convenience of readers outside Japan, using the prevailing exchange rate at March 31, 2017, which was ¥112.19 to US$1.00. The translation should not be construed as a representation that the Japanese yen amounts have been, could have been or could in the future be converted into U.S. dollars at this or any other rate of exchange. Certain comparative figures have been reclassified to conform to the current year’s presentation.
2. Summary of Significant Accounting Policies (a) Principles of consolidation
The accompanying consolidated financial statements include the accounts of the Bank and its significant subsidiaries. At both March 31, 2017 and 2016, the Bank had four consolidated subsidiaries, engaged primarily in the business of providing a wide range of financial services to customers. A subsidiary, Aichi-Jimoto Fund for Agriculture, Forestry and Fisheries Investment Limited Partnership, is excluded from the scope of consolidation and the scope of application of the equity method because its profit, retained earnings, accumulated other comprehensive income (each in proportion to the Bank’s interests) and assets are immaterial to the Group’s consolidated financial statements. The carrying amount of the investment in the subsidiary, which is included in “Securities” on the consolidated balance sheets, was ¥3 million ($32 thousand) and ¥0 million at March 31, 2017 and 2016, respectively. The Bank had no affiliates at March 31, 2017 or 2016. The difference between the cost of investments in subsidiaries and the underlying equity in their net assets, adjusted based on fair value at the time of acquisition, is deferred as goodwill and amortized over five years using the straight-line method. Negative goodwill resulting from an acquisition, measured as the excess of the underlying equity in the net assets over the acquisition cost, is charged to income. In consolidation, all intercompany transactions and accounts have been eliminated. In addition, all significant unrealized profits, included in assets, resulting from transactions within the Group have been eliminated.

35
(b) Cash and cash equivalents
For the purpose of the consolidated statements of cash flows, cash and cash equivalents consisted of cash and due from banks with an original maturity of three months or less at March 31, 2017 and 2016 as follows.
Thousands of
Millions of yen U.S. dollars
2017 2016 2017
Cash and due from banks ¥ 249,635 ¥ 242,670 $ 2,225,109 Less due from banks whose
period exceeds three months
(2,122) (1,794) (18,922)
Cash and cash equivalents ¥ 247,512 ¥ 240,876 $ 2,206,187
(c) Trading account securities
Trading account securities are stated at fair value at the fiscal year-end. Related gains and losses, both realized and unrealized, are included in current earnings. Accrued interest on trading account securities is included in “other assets.”
(d) Securities
Debt securities for which the Group has both the intent and the ability to hold to maturity are classified as held-to-maturity debt securities and are stated at amortized cost. In principle, available-for-sale securities other than those classified as trading or held-to-maturity debt securities are carried at fair value based on their market prices at the applicable fiscal year-end, with net unrealized gains and losses reported as a component of accumulated other comprehensive income in net assets, net of applicable income taxes. Available-for-sale securities whose fair values are extremely difficult to determine are stated at moving average cost. The carrying values of individual securities are reduced, if necessary, through write-downs to reflect other-than-temporary declines in value. Gains and losses on disposal of securities are computed based principally on the moving average method. Accrued interest on securities is included in “other assets.”
(e) Derivatives and hedge accounting
The Bank uses various derivative instruments. Derivatives are recorded at fair value, with changes in fair values included in the consolidated statements of income for the period in which they arise, except for derivatives that are designated as hedging instruments and qualify for hedge accounting. The Bank applies the deferral method of hedge accounting for hedging foreign exchange risks associated with various foreign currency denominated monetary assets and liabilities in accordance with the Industry Audit Committee Report No. 25 (July 29, 2002), entitled the “Treatment of Accounting and Auditing Concerning Accounting for Foreign Currency Transactions in Banking Industry,” issued by the Japanese Institute of Certified Public Accountants (“JICPA”). The effectiveness of the currency swap transactions, foreign exchange swap transactions and similar transactions that hedge foreign exchange risks of monetary receivables and payables denominated in foreign currencies as described above is assessed based on a comparison of the hedged monetary receivables and payables denominated in foreign currencies and the foreign currency positions of the corresponding hedging instruments.
(f) Loans and bills discounted and reserve for possible loan losses
A reserve for possible loan losses is maintained based on the Bank’s management’s judgment and assessment of future losses. The Bank implements a self-assessment system for asset quality. The
36
quality of all loans is assessed by each of the Bank’s branches and business units and is subsequently examined by the Bank’s Credit Supervision Division in accordance with the Bank’s policies and rules for self-assessment of asset quality. The Bank has established a credit rating system under which customers are classified into five categories. All loans are classified through self-assessment into the following categories: “legal bankruptcy,” “de facto bankruptcy,” “bankruptcy risk,” “under observation” and “normal.” The Bank provides a reserve for possible loan losses at an amount deemed necessary to cover possible future losses. For claims against borrowers in legal bankruptcy and de facto bankruptcy, a reserve is provided based on the amounts of such claims, net of the amounts expected to be collected through disposal of collateral or from guarantees. For claims against borrowers who have bankruptcy risk, a reserve is provided in the amount considered necessary based on a solvency assessment performed for the amounts of such claims, net of the amounts expected to be collected through disposal of collateral or from guarantees. For claims against borrowers in the “under observation” and “normal” category, a reserve is provided based on the historical loss experience of the Bank. Reserve amounts recorded by consolidated subsidiaries are provided at the aggregate amount of estimated credit losses based on an individual financial review approach for doubtful or troubled claims. For other claims, an amount deemed necessary is provided as reserve taking into consideration the historical loss experience.
(g) Tangible fixed assets and depreciation (except for leases)
Tangible fixed assets are principally stated at cost less accumulated depreciation. Depreciation is computed by the declining balance method over the estimated useful life of the asset, except for buildings (excluding facilities attached thereto) acquired on or after April 1, 1998, facilities attached thereto and structures acquired on or after April 1, 2016, which are depreciated using the straight-line method. For the years ended March 31, 2017 and 2016, the useful life of buildings ranged from 15 to 50 years, and the useful life of equipment and other tangible fixed assets ranged from 4 to 20 years. Tangible fixed assets of the consolidated subsidiaries are depreciated mainly using the straight-line method over the estimated useful life of the asset.
(h) Intangible fixed assets and amortization
Intangible fixed assets are amortized using the straight-line method. Costs of computer software developed or obtained for internal use are capitalized and amortized principally using the straight-line method over the estimated useful life of five years.
(i) Leases
(Accounting for leases as lessee) The Group, as lessee, capitalizes the assets used under finance leases that do not transfer ownership of the leased assets and whose commencement falls on or after April 1, 2008, except for certain immaterial or short-term finance leases accounted for as operating leases. Depreciation of leased assets capitalized in finance lease transactions is computed by the straight-line method over the lease term, as useful life, with the assumption of having no residual value unless residual value is guaranteed by the lease contract.

37
(Accounting for leases as lessor) A certain consolidated subsidiary engaged in leasing operations, as lessor, recognizes as “investments in leased assets” finance leases that do not transfer ownership of the leased assets to the lessee and recognizes as “lease receivables” finance leases that transfer ownership in a manner similar to the accounting treatment for ordinary sale transactions. The total amount equivalent to interest is allocated over the lease term using the interest method, and the subsidiary recognizes as income lease payments received from customers at the time of receipt and related costs, net of imputed interest, as permitted by the accounting standard. With respect to finance leases commenced prior to April 1, 2008, the book values of fixed assets, net of accumulated depreciation, as of March 31, 2008 are recognized as the value of the investments in such leased assets at April 1, 2008, and the total amount equivalent to interest is allocated over the lease term using the straight-line method. Although the revised accounting standard generally requires the use of the interest method as the principal method of calculation, it permits the use of the straight-line method during the transitional period. As a result, revenues from interests for the years ended March 31, 2017 and 2016 were ¥3 million ($34 thousand) and ¥8 million more, respectively, than the amount that would have been calculated using the interest method.
(j) Impairment of fixed assets A fixed asset is reviewed for impairment whenever events or changes in circumstances indicate that the carrying amount of the asset may not be recoverable. An impairment loss is recognized in the income statement by reducing the carrying amount of the impaired asset or a group of assets to the recoverable amount, measured at the higher of the asset’s net selling price or value in use. Fixed assets include land, buildings and other forms of property, including intangible assets, and are grouped at the lowest level at which there are identifiable cash flows separate from other groups of assets. For the purpose of recognition and measurement of an impairment loss, fixed assets of the Bank other than idle or unused property are grouped into cash generating units such as operating branches, and fixed assets of the consolidated subsidiaries are grouped into respective units which manage and determine income and expenses relating to such assets. The Group recognized impairment loss on fixed assets amounting to ¥126 million ($1,127 thousand) and ¥250 million for unprofitable operating branches for the years ended March 31, 2017 and 2016, respectively. Recoverable amounts of the assets were measured based on their net selling prices, which were based on appraisal values or expected selling amounts less estimated costs of disposal. Accumulated impairment loss is deducted from the net book value of each asset.
(k) Foreign currency translation
The Group’s assets and liabilities denominated in foreign currencies, including the accounts of its foreign branches, are translated into Japanese yen at the exchange rate prevailing at the fiscal year-end. Revenues and expenses are translated at the exchange rate prevailing on the applicable transaction dates. Gains and losses resulting from transactions are included in the determination of profit (loss).
(l) Reserve for employee bonuses A reserve for employee bonuses is provided based on the estimated amount of future payments attributable to the respective year.
(m) Reserve for executive bonuses
A reserve for executive bonuses is provided for the payment of bonuses to directors and audit and supervisory board members based on the estimated amount of the payments attributable to the respective year.
(n) Reserve for employee retirement benefits Employees who terminate their services with the Group are entitled to retirement benefits based generally on the basic rate of pay at the time of termination, length of service and the conditions under which the termination occurred.

38
The Group recognizes retirement benefits based principally on the actuarial present value of the retirement benefit obligation using the actuarial appraisal approach and the fair value of pension plan assets available for benefits at the respective fiscal year-end. In the calculation of retirement benefit obligation, the expected retirement benefits are attributed to periods up to the end of the respective fiscal year using the benefit formula method. Past service cost is amortized by the straight-line method over a certain period within the average remaining years of service of employees. Actuarial differences arising from changes in the retirement benefit obligation or value of plan assets not anticipated by previous assumptions or from changes in the assumptions themselves are amortized on a straight-line basis over a certain period within the average remaining years of service of employees, measured from the year following the year in which the differences arise. For the amortization of past service cost and actuarial differences, the Bank recognizes an amortization period of 13 years as the period within the average remaining years of services of employees. The consolidated subsidiaries use the simplified method in calculating employee retirement benefit liability and retirement benefit expenses. Under this method, the amount for severance payments required at the year-end for voluntary termination is deemed the retirement benefit obligation.
(o) Reserve for executive retirement benefits
For consolidated subsidiaries, a reserve for executive retirement benefits is provided based on the Group’s internal rules in the amount that would be payable assuming the directors and audit and supervisory board members of the consolidated subsidiaries terminated their services at the balance sheet date.
(p) Reserve for losses on repayments of dormant bank accounts
In order to cover possible losses on claims from customers for repayment of dormant bank accounts, the balances of which were previously recognized as income, the Bank provides a reserve to the extent of estimated losses based on historical loss experience and taking into consideration the repayment conditions for a certain past period. A reserve for losses on repayments of dormant bank accounts was included in “other expenses” and amounted to ¥114 million ($1,023 thousand) and ¥69 million for the years ended March 31, 2017 and 2016, respectively.
(q) Reserve for contingent losses
A reserve for contingent losses is provided at an amount deemed necessary to cover possible future losses from default of loans under the responsibility-sharing system on guarantees of loans with the Credit Guarantee Corporation based on historical default loss experience. For the years ended March 31, 2017 and 2016, a reversal of reserve for contingent losses of ¥323 million ($2,886 thousand) and ¥611 million, respectively, was included in “other income.”
(r) Reserve for loss on interest repayments In order to cover possible losses on the repayment of interest to be received from customers that exceeds the upper limit of interest rates prescribed under the Interest Rate Restriction Act, two consolidated subsidiaries provide a reserve for loss on interest repayments to the extent of the estimated losses that may be incurred from repayment claims against customers for whom court settlements have not been reached. Such estimated losses are based on historical loss experience taking into consideration the repayment conditions for a certain past period.

39
(s) Income taxes
Income taxes are accounted for by the asset-liability method. Deferred tax assets and liabilities are recognized as future tax consequences attributable to differences between the financial statement carrying amounts of existing assets and liabilities and their respective tax bases and operating loss carryforwards. Deferred tax assets and liabilities are measured using the enacted tax rates expected to apply to taxable income in the years in which those temporary differences are expected to be recovered or settled. The effect of a change in tax rates on deferred tax assets and liabilities is recognized in the period that includes the enactment date.
(t) Appropriation of retained earnings Cash dividends are recorded in the fiscal year when a proposed appropriation of retained earnings is approved by the Bank’s Board of Directors and/or shareholders.
(u) Per share data Basic earnings per share is computed by dividing profit attributable to common shareholders of the parent by the weighted average number of shares of common stock outstanding during the respective year. Diluted earnings per share is computed by reflecting the potential dilution that could occur if all dilutive securities were exercised or converted into common stock. Diluted earnings per share for the year ended March 31, 2017 was computed by taking into account 2,705 thousand potential shares of common stock in relation to bonds with stock acquisition rights of 2,680 thousand shares and bonds with stock acquisition rights of 24 thousand shares. In addition, diluted earnings per share for the year ended March 31, 2017 was computed by adjusting profit attributable to the owners of the parent by ¥(33) million ($(303) thousand), which was the adjustment to other operating income after tax effect. Diluted earnings per share for the year ended March 31, 2016 was computed by taking into account 2,696 thousand potential shares of common stock in relation to bonds with stock acquisition rights of 2,680 thousand shares and bonds with stock acquisition rights of 16 thousand shares. In addition, diluted earnings per share for the year ended March 31, 2016 was computed by adjusting profit attributable to the owners of the parent by ¥(503) million, which was the adjustment to other operating income after tax effect. Cash dividends per share shown in the accompanying consolidated statements of income represent dividends declared applicable to the respective years shown. The Bank implemented a consolidation of shares at a ratio of one share per 10 shares effective on October 1, 2016. Earnings per share were computed assuming that the share consolidation had been implemented at the beginning of fiscal year ended March 31, 2016.
(v) Changes in accounting policies Application of Practical Solution on a Change in Depreciation Method due to Tax Reform 2016 In accordance with the revision to the Corporation Tax Act, the Group has applied the “Practical Solution on a Change in Depreciation Method Due to Tax Reform 2016” (Accounting Standards Board of Japan (“ASBJ”) Practical Issues Task Force No. 32, June 17, 2016) effective from the year ended March 31, 2017 and changed the depreciation method for facilities attached to buildings and structures acquired on or after April 1, 2016 from the declining balance method to the straight-line method. The impact of these changes on the profit before income taxes for the year ended March 31, 2017 was immaterial.

40
(w) Additional information
(1) Application of Revised Implementation Guidance on Recoverability of Deferred Tax Assets
The Group has applied the “Revised Implementation Guidance on Recoverability of Deferred Tax Assets” (ASBJ Guidance No. 26, March 28, 2016) effective from the year ended March 31, 2017.
(2) Gain on Return of Assets from Retirement Benefit Trusts The Group has set up retirement benefit trusts to secure sound pension financing. In the year ended March 31, 2017, the Group received a partial refund from the retirement benefit trusts because the value of the pension assets exceeded the reserve for retirement benefit obligation and the situation was expected to continue. As a result, “gain on return of assets from retirement benefit trusts” of ¥712 million ($6,354 thousand) was recorded for the year ended March 31, 2017.
3. Financial Instruments and Related Disclosures (a) Qualitative information on financial instruments
(1) Group policy for financial instruments
The Group undertakes deposit, loan and investment operations. Since the Group has financial assets and liabilities which involve interest rate risk, the Bank has established an Asset Liability Management (“ALM”) system to avoid unfavorable effects of interest rate fluctuations. Derivative transactions are used as part of ALM.
(2) Nature of financial instruments and related risks Financial assets held by the Group comprise mainly loans to domestic corporate entities and individuals and securities. Loans are subject to customer credit risk arising from default by borrowers. There is a possibility that the borrowers will not perform their obligations in accordance with the applicable contract terms due to economic circumstances or other reasons. Securities, which primarily comprise equity securities, bonds and investment trusts, are held for investment and business promotion purposes. These securities are exposed to the credit risk of issuers, interest rate fluctuation risk and/or market price fluctuation risk. For securities denominated in foreign currencies, bonds denominated in foreign currencies are basically purchased at an amount up to the corresponding amount of deposits and funds are procured from the market in foreign currencies to avoid foreign exchange fluctuation risk. Financial liabilities include mainly deposits from customers and are subject to liquidity risk. There is an interest or maturity mismatch between assets such as loans and bills discounted and liabilities such as deposits that exposes these assets and liabilities to interest rate fluctuation risk. Derivative transactions include interest rate swaps and forward foreign exchange contracts. The Group uses derivative transactions in line with ALM in order to avoid interest rate fluctuation risk in relation to deposits and loans and to fulfill the customers’ hedging requirements for foreign exchange fluctuation risk. Hedge accounting is applied to certain transactions which offset market fluctuations or fix cash flows and fulfill preliminary and subsequent requirements. Derivative transactions which do not meet the hedge accounting criteria are exposed to foreign exchange fluctuation risk and interest rate fluctuation risk.
41
(3) Risk management for financial instruments
(i) Credit risk management
The Group manages its credit risk by maintaining a credit exposure management system in relation to loans in accordance with its “Credit Policy,” which stipulates the basic concepts in relation to its credit exposure management and administrative rules regarding credit risk. The system includes the credit administration of loans, credit lines, credit records and internal ratings and the establishment of guarantees and/or collateral and handling of doubtful loans. These credit exposure management procedures are performed by each of the Group’s sales branches and loan departments and are reported to the Board of Executive Directors and/or Board of Directors on a regular basis.
The credit risk of issuers of securities and the counterparty risk of derivative transactions are managed by the Bank’s Capital Markets and Treasury Division which monitors credit information and fair values on a regular basis.
(ii) Market risk management (a) Interest rate risk management
The Group has established the ALM committee for the purpose of recognizing and managing interest rate fluctuation risk comprehensively and implementing appropriate ALM. Risk control methods and procedures are stipulated in the ALM committee codes, and the ALM committee operates in accordance with the management policy of ALM determined at the Board of Directors’ meeting. The status of implementation is monitored and future actions are discussed at the Board of Directors’ meeting. On a daily basis, the Bank’s Risk Control Division checks interest rates and periods of financial assets and liabilities, monitors risks using gap analysis and interest rate sensitivity analysis and reports to the ALM committee and Board of Directors monthly. Interest rate swap transactions are also used under the ALM system to avoid interest rate fluctuation risk.
(b) Foreign exchange risk management
The Group manages foreign exchange fluctuation risk by transaction and enters into forward foreign exchange contracts to avoid foreign exchange fluctuation risk on transactions with customers.
(c) Market price fluctuation risk management The Group holds investment products, including securities based on marketable securities investment planning, determined by the Board of Executive Directors in accordance with the basic market fluctuation risk management rules of the Board of Directors. Since the Bank’s Capital Markets and Treasury Division purchases investment products from outside, market price fluctuation risk is reduced through effective monitoring after preliminary review and the establishment of investment limits. Most of the equity securities managed by the Bank’s Planning Division are for business promotion purposes, and market conditions and the financial status of customers are monitored and reported to the Board of Executive Directors on a regular basis.
(d) Derivative transactions
An internal checking system has been established through segregating functions related to derivative transactions, including trading functions such as entering into derivative contracts, operations functions such as the processing of transactions and the evaluation of hedge effectiveness.

42
(e) Quantitative information on market risk
i) Financial instruments for trading purposes
The Group uses the historical simulation method (based on the assumptions of a holding period of 120 business days, 99% confidence level and observation period of 1,200 business days) for the calculation of interest-related Value at Risk (VaR) for trading account securities. As of both March 31, 2017 and 2016, the market risk exposures (the expected maximum loss) of the Group’s trading operation amounted to zero.
ii) Financial instruments other than for trading purposes
Market risk is the primary risk to the Group. The major financial instruments subject to market risk are “loans and bills discounted,” debt and equity securities and investment trusts included in “securities” and “deposits” and interest rate swaps included in “derivatives.” The historical simulation method (based on the assumptions of a holding period of 120 business days, 99% confidence level and observation period of 1,200 business days) is used for the calculation of VaR of these financial assets and liabilities. As of March 31, 2017 and 2016, the market risk exposures (the expected maximum loss) of the Bank’s banking operations were as follows.
Value at Risk
Millions of yen
Thousands of U.S. dollars
2017 2016 2017
Securities for investment purposes (*1) ¥ 16,033 ¥ 10,640 $ 142,912Strategically held equity securities 20,904 18,914 186,328Loans and deposits (*2) 6,818 5,624 60,778Notes: (*1) Securities for investment purposes: yen bonds, foreign bonds, equity securities for
investment purposes, investment trusts and OTC options (*2) Loans and deposits: deposits, negotiable certificates of deposit, loans and bills discounted,
interest rate swaps for ALM hedging purposes, call loans, due from banks, bonds payable and bonds with stock acquisition rights
iii) Supplementary explanation about quantitative information on market risk
The Group evaluates the effectiveness of its measurement model by performing back-testing procedures to compare VaR calculated by the measurement system with actual gain or loss. VaR provides information regarding market risk exposure statistically calculated with certain probability based on historical market fluctuations. Therefore, VaR may not be able to measure risks under extreme situations in which the market environment changes extraordinarily.
(iii) Management of liquidity risk associated with fund raising
The Group regards the stable funding of its operations as its top priority and conducts effective fund management. In addition, the Group manages liquidity risk by diversifying the means of raising funds and adjusting the balance of long-term and short-term accounts taking into consideration market conditions.
(4) Supplementary explanation on fair values

43
The fair value of financial instruments is based on market price. If the market price is not available, alternative valuation techniques are used. Since assumptions must be made when using alternative methods to calculate fair values, different assumptions may lead to different fair values.

44
(b) Fair values of financial instruments
The carrying values and fair values of financial instruments at March 31, 2017 and 2016 were as follows.
Millions of yen
2017
Carrying
valueFair
value Difference
Cash and due from banks ¥ 249,635 ¥ 249,635 ¥ –Call loans and bills purchased 1,698 1,698 –Securities - available-for-sale securities (*1) 916,759 916,759 –Loans and bills discounted: 2,389,465 Reserve for possible loan losses (*2) (12,266)
Loans and bills discounted – subtotal 2,377,199 2,394,582 17,382
Total ¥ 3,545,291 ¥ 3,562,674 ¥ 17,382
Deposits ¥ 3,281,431 ¥ 3,282,370 ¥ 939Call money and bills sold 12,340 12,340 –Payables under securities lending transactions 31,088 31,088 –Borrowed money 34,207 34,245 38Bonds payable 10,000 9,998 (1)Bonds with stock acquisition rights 11,219 11,930 711
Total ¥ 3,380,287 ¥ 3,381,975 ¥ 1,688
Derivative transactions (*3):
Hedge accounting not applied ¥ (500) ¥ (500) ¥ –Hedge accounting applied 2 2 –
Total ¥ (497) ¥ (497) ¥ – Millions of yen
2016
Carrying
valueFair
value Difference
Cash and due from banks ¥ 242,670 ¥ 242,670 ¥ –Call loans and bills purchased 2,871 2,871 –Securities - available-for-sale securities (*1) 967,178 967,178 –Loans and bills discounted: 2,241,953 Reserve for possible loan losses (*2) (12,041)
Loans and bills discounted – subtotal 2,229,912 2,253,954 24,042
Total ¥ 3,442,632 ¥ 3,466,674 ¥ 24,042
Deposits ¥ 3,199,702 ¥ 3,201,375 ¥ 1,672Call money and bills sold 10,141 10,141 –Payables under securities lending transactions 18,488 18,488 –Borrowed money 26,526 26,562 36Bonds with stock acquisition rights 11,268 11,176 (91)
Total ¥ 3,266,127 ¥ 3,267,745 ¥ 1,618
Derivative transactions (*3): Hedge accounting not applied ¥ 796 ¥ 796 ¥ –Hedge accounting applied 12 12 –
Total ¥ 808 ¥ 808 ¥ –

45
Thousands of U.S. dollars
2017
Carrying
value Fair
value
Difference
Cash and due from banks $ 2,225,109 $ 2,225,109 $ –Call loans and bills purchased 15,137 15,137 –Securities - available-for-sale securities (*1) 8,171,488 8,171,488 –Loans and bills discounted: 21,298,383
Reserve for possible loan losses (*2) (109,333)
Loans and bills discounted – subtotal 21,189,050 21,343,989 154,939
Total $ 31,600,784 $ 31,755,723 $ 154,939
Deposits $ 29,248,877 $ 29,257,247 $ 8,370Call money and bills sold 110,000 110,000 –
Payables under securities lending transactions 277,109 277,109 –Borrowed money 304,906 305,249 343Bonds payable 89,135 89,123 (12)Bonds with stock acquisition rights 100,000 106,345 6,345
Total $ 30,130,027 $ 30,145,073 $ 15,046
Derivative transactions (*3): Hedge accounting not applied $ (4,457) $ (4,457) $ –Hedge accounting applied 19 19 –
Total $ (4,438) $ (4,438) $ –
Notes:
(*1) The following securities were excluded from the above tables because management of the Bank concluded that the fair value was virtually impossible to estimate.
Millions of yen
Thousands of U.S. dollars
2017 2016 2017
Unlisted stocks *1 ¥ 2,342 ¥ 2,442 $ 20,875
Investments in partnerships *2 and *3 111 1,735
Total ¥ 2,536 ¥ 2,553 $ 22,610
*1 The Group wrote off unlisted stocks amounting to ¥0 million ($5 thousand) and ¥4 million for the years ended March 31, 2017 and 2016, respectively.
*2 The fair value of investments in partnerships that comprised assets whose fair value could not be reliably determined were not disclosed.
*3 The Group wrote off investments in partnerships amounting to ¥10 million ($89 thousand) and none for the years ended March 31, 2017 and 2016, respectively.
(*2) General and individual reserves for possible loan losses corresponding to loans and bills discounted were
deducted. (*3) Derivative transactions show net amounts after offsetting related receivables and payables. Amounts in
parentheses denote net payables.
The methods and assumptions used to calculate fair values of financial instruments are summarized below.

46
Financial assets:
Cash and due from banks
Since the carrying value of due from banks on demand or with an original maturity of up to one year approximates the fair value, the carrying value is deemed the fair value. For due from banks with an original maturity exceeding one year, the present value is calculated by discounting the amount by the remaining term to maturity at the rate applicable to a similar new transaction. Call loans and bills purchased
The carrying value of call loans and bills purchased approximate fair value because of the short maturity (original maturities of up to one year). Securities
The fair value of equity securities, bonds and investment trusts is based on the quoted market price at the applicable exchange, the price published by JSDA or provided by the contracted financial institution and publicly available net asset value, respectively. The fair value of privately-placed bonds is determined by discounting the estimated future cash flows at the risk free rate plus the credit spread or the like. The fair value of securities issued by issuers in legal bankruptcy or de facto bankruptcy or who are at risk of bankruptcy are calculated based on the present value of estimated future cash flows or the amount expected to be collected through the disposal of collateral or from guarantees. Loans and bills discounted
The fair value of commercial bills, loans on bills and overdrafts, all of which have short maturities (original maturities of up to one year), approximate the carrying value unless the credit status of the borrower has changed dramatically after execution because of the quick reaction of market interest rates to such changes. Therefore, the carrying value of these instruments is deemed the fair value. The fair value of loans on deeds is determined by discounting the estimated future cash flows at the risk free rate plus the credit spread or the like at the rate for a similar new loan, depending on the nature of such loans. The fair value of structured loans is determined by considering the value calculated by using the option pricing model in addition to using the method applicable to measuring the fair value of loans on deeds as described above. For loans to borrowers in legal bankruptcy or de facto bankruptcy or who are at risk of bankruptcy, a reserve for possible loan losses is estimated based on the present value of estimated future cash flows or the amount expected to be collected through disposal of collateral or from guarantees. Thus, the fair value of such loans approximates the carrying amount of the receivables minus the corresponding reserve for possible loan losses on the consolidated balance sheets at the closing date. Therefore, such carrying amounts are deemed to be the fair value of such loans. The carrying value of loans and bills discounted without repayment terms due to characteristics such as limitations on loans to the limits of the collateral assets is deemed the fair value as the carrying values approximates the fair value when considering the expected repayment period and interest rate conditions for such loans and bills discounted without repayment terms.
Financial liabilities: Deposits
The fair value of demand deposits in Japanese yen is deemed the amount to be paid (carrying amount) assuming that the Group is demanded to pay on the consolidated balance sheet date. The fair value of time deposits in Japanese yen and negotiable certificates of deposit is determined by discounting future cash flows by the term to maturity at the rate used for a new deposit. For all deposits in foreign currencies, original maturities are short (within one year) and the carrying value approximates the fair value. Thus, the carrying value is deemed the fair value.

47
Call money and bills sold
The original maturities of call money and bills sold are short (within one year), and the carrying value approximates the fair value. Thus, the carrying value is deemed the fair value. Payables under securities lending transactions
The original maturities of payables under securities lending transactions are short (within one year), and their carrying values approximate their fair values. Thus, the carrying value is deemed the fair value.
Borrowed money
The carrying value of borrowed money with a variable interest rate is deemed the fair value since the carrying value approximates the fair value. This is due to the quick reaction of market interest rates and immaterial changes in the credit status of the Bank and its subsidiaries after execution of such borrowing. The fair value of borrowed money with a fixed interest rate is the present value determined by discounting the sum of principal and interest by the term to maturity at the rate for similar new borrowing. For borrowed money with a short maturity (original maturity of up to one year), the carrying value is deemed the fair value since the carrying value approximates the fair value. Bonds payable
The fair value of bonds payable issued by the Bank is based on market price.
Bonds with stock acquisition rights
The fair value of bonds with stock acquisition rights issued by the Bank is based on market price.

48
(c) Maturity analysis for monetary claims and securities with contractual maturities as of March 31, 2017
Millions of yen 2017
Due in one year or less
Due after one year through
three years
Due after three years
through five years
Due after five years through
seven years
Due after seven years
through ten years
Due after ten years
Due from banks ¥ 216,844 ¥ – ¥ – ¥ – ¥ – ¥ –Call loans and bills
purchased 1,698 – – – – –Securities: Available-for-sale securities with maturities (*1)
National government bonds 10,000 36,200 37,000 6,000 4,000 27,500
Local government bonds 14,417 24,483 26,284 5,008 54,316 1,900
Bonds and debentures 46,625 128,312 129,059 36,247 58,378 10,907
Others (*2) 4,112 27,099 44,693 12,901 16,581 –
Securities - total 75,155 216,094 237,036 60,158 133,277 40,307Loans and bills
discounted (*3) 717,094 440,091 315,246 187,477 197,658 481,829
Total ¥ 1,010,792 ¥ 656,185 ¥ 552,283 ¥ 247,635 ¥ 330,935 ¥ 522,137
Thousands of U.S. dollars
Due from banks $ 1,932,833 $ – $ – $ – $ – $ –Call loans and bills
purchased 15,137 – – – – –Securities:
Available-for-sale securities with maturities (*1) National
government bonds 89,135 322,667 329,798 53,481 35,654 245,120
Local government bonds 128,506 218,232 234,282 44,643 484,151 16,935
Bonds and debentures 415,598 1,143,703 1,150,364 323,092 520,355 97,222
Others (*2) 36,657 241,549 398,370 115,000 147,800 –
Securities - total 669,896 1,926,151 2,112,814 536,216 1,187,960 359,277Loans and bills
discounted (*3) 6,391,783 3,922,730 2,809,934 1,671,069 1,761,817 4,294,765
Total $ 9,009,649 $ 5,848,881 $ 4,922,748 $ 2,207,285 $ 2,949,777 $ 4,654,042
Notes:
(*1) Amounts of securities were stated on the basis of scheduled redemption amounts regarding the principal and do not match the amounts shown in the consolidated balance sheets.
(*2) “Others” include Samurai bonds, Euro-Yen bonds and other foreign bonds. (*3) The portion of loans and bills discounted whose timing of collection is unforeseeable, including loans to “legal bankruptcy”
borrowers, loans to “de facto bankruptcy” borrowers and loans to “bankruptcy risk” borrowers, amounting to ¥50,068 million ($446,285 thousand) was not included in the above table.
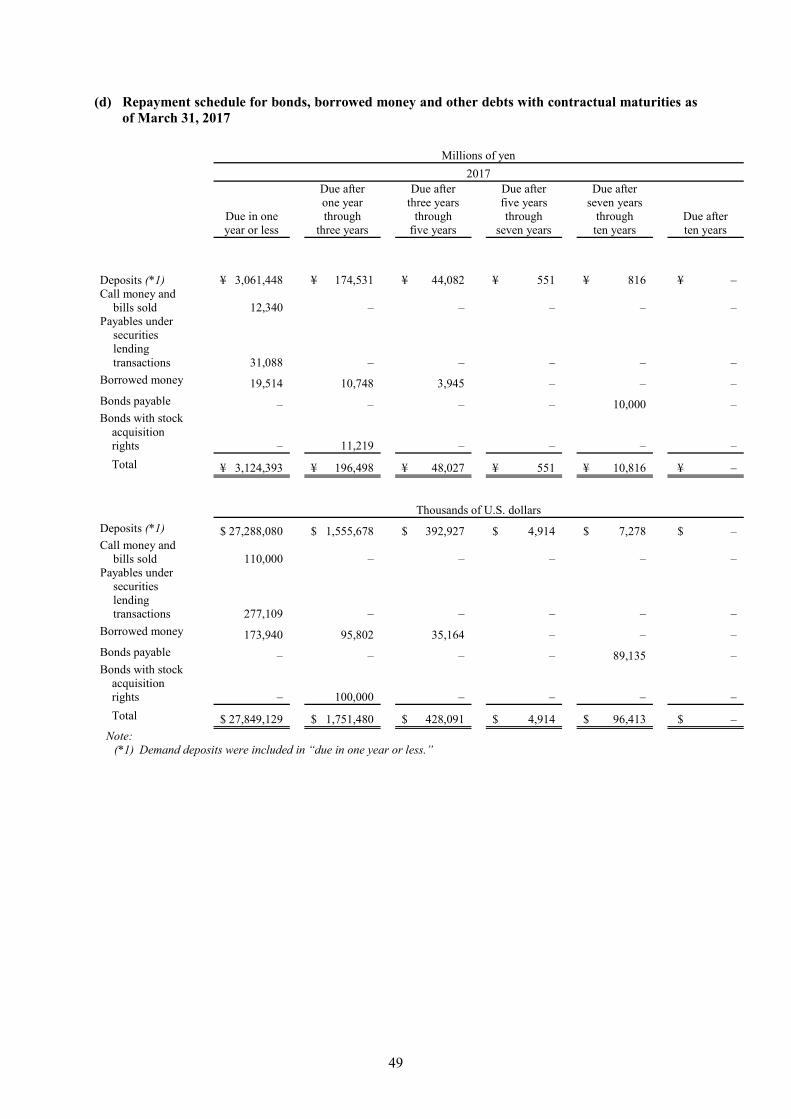
49
(d) Repayment schedule for bonds, borrowed money and other debts with contractual maturities as of March 31, 2017
Millions of yen
2017
Due in one year or less
Due after one year through
three years
Due after three years
through five years
Due after five years through
seven years
Due after seven years
through ten years
Due after ten years
Deposits (*1) ¥ 3,061,448 ¥ 174,531 ¥ 44,082 ¥ 551 ¥ 816 ¥ –Call money and
bills sold 12,340 – – – – –Payables under
securities lending transactions 31,088 – – – – –
Borrowed money 19,514 10,748 3,945 – – –
Bonds payable – – – – 10,000 –Bonds with stock
acquisition rights – 11,219 – – – –
Total ¥ 3,124,393 ¥ 196,498 ¥ 48,027 ¥ 551 ¥ 10,816 ¥ –
Thousands of U.S. dollars
Deposits (*1) $ 27,288,080 $ 1,555,678 $ 392,927 $ 4,914 $ 7,278 $ –Call money and
bills sold 110,000 – – – – –Payables under
securities lending transactions 277,109 – – – – –
Borrowed money 173,940 95,802 35,164 – – –
Bonds payable – – – – 89,135 –Bonds with stock
acquisition rights – 100,000 – – – –
Total $ 27,849,129 $ 1,751,480 $ 428,091 $ 4,914 $ 96,413 $ –
Note: (*1) Demand deposits were included in “due in one year or less.”

50
4. Securities
At March 31, 2017 and 2016, securities consisted of the following.
Thousands of
Millions of yen U.S. dollars
2017 2016 2017
National government bonds ¥ 129,926 ¥ 192,398 $ 1,158,082
Local government bonds 128,167 110,278 1,142,415
Bonds and debentures 414,001 425,427 3,690,184
Equity securities 120,955 115,253 1,078,129
Other securities 126,246 126,374 1,125,288
¥ 919,295 ¥ 969,731 $ 8,194,098 Securities are classified as trading, held-to-maturity or available-for-sale securities. Such classification determines the respective accounting method to be applied as stipulated under the accounting standard for financial instruments. Securities in the accompanying consolidated balance sheets include marketable securities traded on stock exchanges. Gross unrealized gains and losses on available-for-sale securities with fair values at March 31, 2017 and 2016 are summarized as follows.
Millions of yen
Acquisition Cost
Gross unrealized
gains
Gross unrealized
losses
Fair and carrying
value
Available-for-sale securities with fair values at March 31, 2017:
Equity securities ¥ 51,820 ¥ 66,923 ¥ (130) ¥ 118,612
Bonds:
National government bonds 128,598 2,000 (673) 129,925
Local government bonds 127,055 1,397 (284) 128,167
Bonds and debentures 411,741 2,907 (647) 414,001
Others 127,109 454 (1,512) 126,051
¥ 846,323 ¥ 73,683 ¥ (3,248) ¥ 916,759
Available-for-sale securities with fair values at March 31, 2016:
Equity securities ¥ 51,522 ¥ 61,570 ¥ (281) ¥ 112,811
Bonds:
National government bonds 188,402 3,995 – 192,398
Local government bonds 108,261 2,017 (0) 110,278
Bonds and debentures 419,689 5,758 (21) 425,427
Others 125,130 1,914 (782) 126,262
¥ 893,006 ¥ 75,257 ¥ (1,086) ¥ 967,178
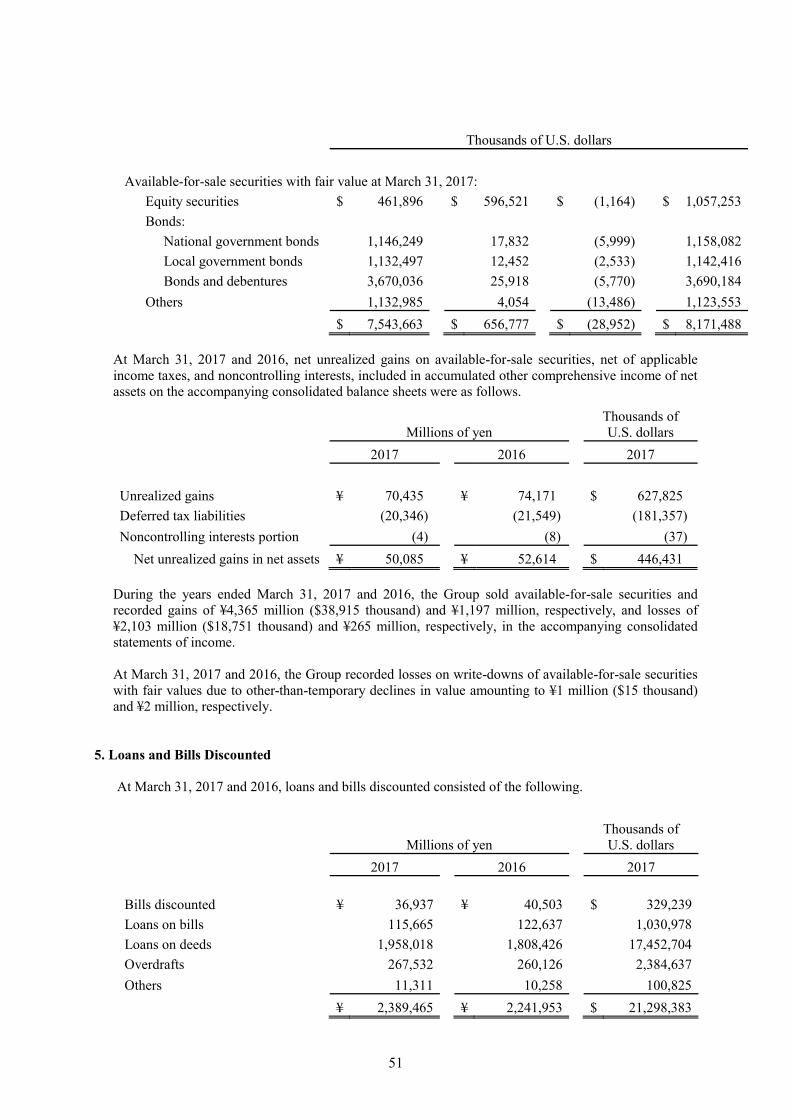
51
Thousands of U.S. dollars
Available-for-sale securities with fair value at March 31, 2017:
Equity securities $ 461,896 $ 596,521 $ (1,164) $ 1,057,253
Bonds:
National government bonds 1,146,249 17,832 (5,999) 1,158,082
Local government bonds 1,132,497 12,452 (2,533) 1,142,416
Bonds and debentures 3,670,036 25,918 (5,770) 3,690,184
Others 1,132,985 4,054 (13,486) 1,123,553
$ 7,543,663 $ 656,777 $ (28,952) $ 8,171,488
At March 31, 2017 and 2016, net unrealized gains on available-for-sale securities, net of applicable income taxes, and noncontrolling interests, included in accumulated other comprehensive income of net assets on the accompanying consolidated balance sheets were as follows.
Millions of yen Thousands of U.S. dollars
2017 2016 2017
Unrealized gains ¥ 70,435 ¥ 74,171 $ 627,825
Deferred tax liabilities (20,346) (21,549) (181,357)
Noncontrolling interests portion (4) (8) (37)
Net unrealized gains in net assets ¥ 50,085 ¥ 52,614 $ 446,431 During the years ended March 31, 2017 and 2016, the Group sold available-for-sale securities and recorded gains of ¥4,365 million ($38,915 thousand) and ¥1,197 million, respectively, and losses of ¥2,103 million ($18,751 thousand) and ¥265 million, respectively, in the accompanying consolidated statements of income. At March 31, 2017 and 2016, the Group recorded losses on write-downs of available-for-sale securities with fair values due to other-than-temporary declines in value amounting to ¥1 million ($15 thousand) and ¥2 million, respectively.
5. Loans and Bills Discounted
At March 31, 2017 and 2016, loans and bills discounted consisted of the following.
Thousands of U.S. dollars Millions of yen
2017 2016 2017
Bills discounted ¥ 36,937 ¥ 40,503 $ 329,239
Loans on bills 115,665 122,637 1,030,978
Loans on deeds 1,958,018 1,808,426 17,452,704
Overdrafts 267,532 260,126 2,384,637
Others 11,311 10,258 100,825
¥ 2,389,465 ¥ 2,241,953 $ 21,298,383
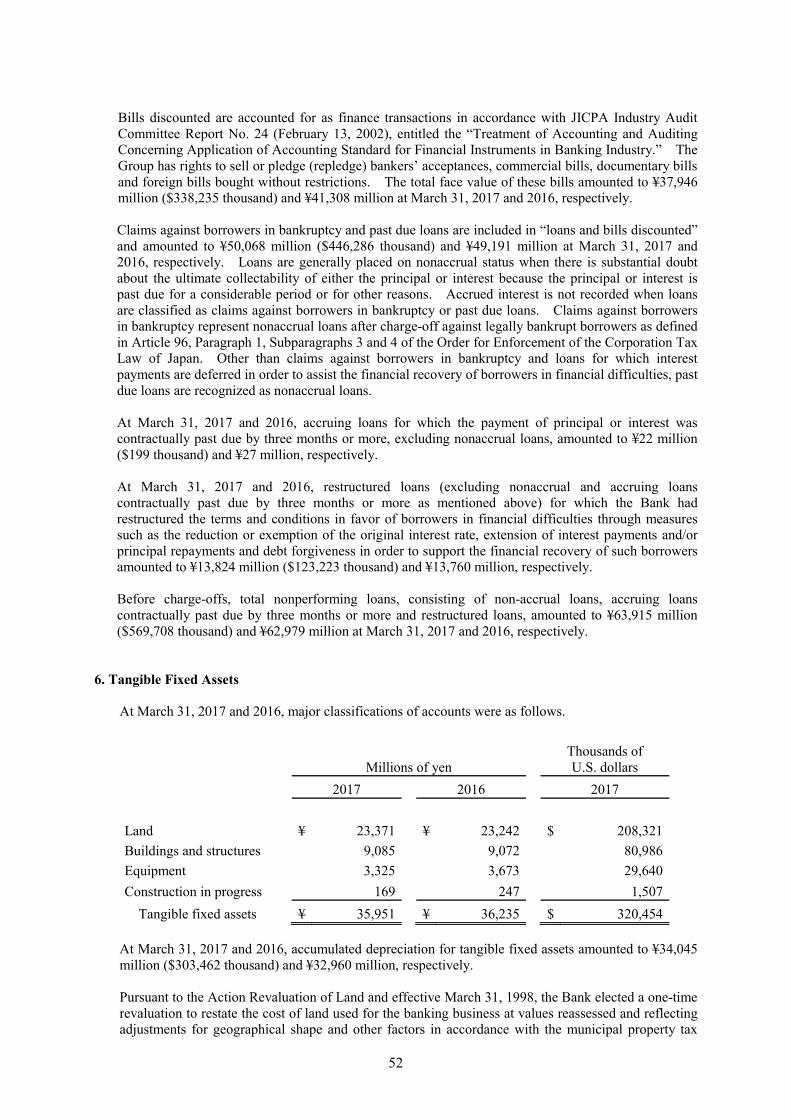
52
Bills discounted are accounted for as finance transactions in accordance with JICPA Industry Audit Committee Report No. 24 (February 13, 2002), entitled the “Treatment of Accounting and Auditing Concerning Application of Accounting Standard for Financial Instruments in Banking Industry.” The Group has rights to sell or pledge (repledge) bankers’ acceptances, commercial bills, documentary bills and foreign bills bought without restrictions. The total face value of these bills amounted to ¥37,946 million ($338,235 thousand) and ¥41,308 million at March 31, 2017 and 2016, respectively. Claims against borrowers in bankruptcy and past due loans are included in “loans and bills discounted” and amounted to ¥50,068 million ($446,286 thousand) and ¥49,191 million at March 31, 2017 and 2016, respectively. Loans are generally placed on nonaccrual status when there is substantial doubt about the ultimate collectability of either the principal or interest because the principal or interest is past due for a considerable period or for other reasons. Accrued interest is not recorded when loans are classified as claims against borrowers in bankruptcy or past due loans. Claims against borrowers in bankruptcy represent nonaccrual loans after charge-off against legally bankrupt borrowers as defined in Article 96, Paragraph 1, Subparagraphs 3 and 4 of the Order for Enforcement of the Corporation Tax Law of Japan. Other than claims against borrowers in bankruptcy and loans for which interest payments are deferred in order to assist the financial recovery of borrowers in financial difficulties, past due loans are recognized as nonaccrual loans. At March 31, 2017 and 2016, accruing loans for which the payment of principal or interest was contractually past due by three months or more, excluding nonaccrual loans, amounted to ¥22 million ($199 thousand) and ¥27 million, respectively. At March 31, 2017 and 2016, restructured loans (excluding nonaccrual and accruing loans contractually past due by three months or more as mentioned above) for which the Bank had restructured the terms and conditions in favor of borrowers in financial difficulties through measures such as the reduction or exemption of the original interest rate, extension of interest payments and/or principal repayments and debt forgiveness in order to support the financial recovery of such borrowers amounted to ¥13,824 million ($123,223 thousand) and ¥13,760 million, respectively. Before charge-offs, total nonperforming loans, consisting of non-accrual loans, accruing loans contractually past due by three months or more and restructured loans, amounted to ¥63,915 million ($569,708 thousand) and ¥62,979 million at March 31, 2017 and 2016, respectively.
6. Tangible Fixed Assets
At March 31, 2017 and 2016, major classifications of accounts were as follows.
Millions of yen Thousands of U.S. dollars
2017 2016 2017
Land ¥ 23,371 ¥ 23,242 $ 208,321
Buildings and structures 9,085 9,072 80,986
Equipment 3,325 3,673 29,640
Construction in progress 169 247 1,507
Tangible fixed assets ¥ 35,951 ¥ 36,235 $ 320,454 At March 31, 2017 and 2016, accumulated depreciation for tangible fixed assets amounted to ¥34,045 million ($303,462 thousand) and ¥32,960 million, respectively. Pursuant to the Action Revaluation of Land and effective March 31, 1998, the Bank elected a one-time revaluation to restate the cost of land used for the banking business at values reassessed and reflecting adjustments for geographical shape and other factors in accordance with the municipal property tax

53
bases. According to the Act, the amount equivalent to the tax effect on the excess of reassessed values over the original book values is to be recorded as “deferred tax liabilities for revaluation,” and the remainder of the excess, net of the tax effect, is to be recorded as “land revaluation excess” under accumulated other comprehensive income of net assets in the consolidated balance sheets. At March 31, 2017 and 2016, the differences in the carrying values of land used for the banking business after revaluation over market values amounted to ¥8,882 million ($79,175 thousand) and ¥8,878 million, respectively. As permitted by Japanese GAAP, deferred capital gains on the sale of real property are deducted from the original acquisition costs of property which is newly acquired for replacement purposes in the same line of business as the property sold. At March 31, 2017 and 2016, ¥1,750 million ($15,604 thousand) and ¥1,750 million, respectively, were directly deducted from the acquisition costs of such land.
7. Pledged Assets
The carrying amounts of assets pledged as collateral and related collateralized debt at March 31, 2017 and 2016 were as follows.
Thousands of U.S. dollars Millions of yen
2017 2016 2017
Assets pledged:
Securities ¥ 63,046 ¥ 50,418 $ 561,962
Other assets 20 20 182
Related collateralized debts:
Deposits ¥ 19,229 ¥ 16,790 $ 171,403
Payables under securities
lending transactions 31,088 18,488 277,109
Borrowed money 10,887 4,604 97,044 In addition, securities amounting to ¥54,796 million ($488,429 thousand) and ¥66,484 million at March 31, 2017 and 2016, respectively, were pledged as collateral for the settlement of exchange and other transactions.
8. Deposits
At March 31, 2017 and 2016, deposits consisted of the following.
Thousands of U.S. dollars Millions of yen
2017 2016 2017
Demand deposits ¥ 1,958,023 ¥ 1,828,675 $ 17,452,744
Time deposits 1,209,835 1,266,699 10,783,812
Other deposits 50,391 47,564 449,162
Subtotal 3,218,250 3,142,939 28,685,718Negotiable certificates of
deposit 63,180 56,763 563,159
¥ 3,281,431 ¥ 3,199,702 $ 29,248,877

54
9. Borrowed Money and Finance Lease Obligations Borrowed money consisted principally of borrowings from financial institutions due through February 2022 with average interest rates of 0.63% and 0.49% per annum at March 31, 2017 and 2016, respectively. There were no financial lease obligations outstanding at March 31, 2017. At March 31, 2017, the annual maturities of borrowed money were as follows.
Year ending March 31, Millions of yenThousands of U.S. dollars
2018 ¥ 19,514 $ 173,941
2019 6,128 54,622
2020 4,620 41,180
2021 3,095 27,587
2022 850 7,576
¥ 34,207 $ 304,906
10. Bonds
At March 31, 2017 and 2016, bonds consisted of the following.
Millions of yen
Thousands ofU.S. dollars
Interest rate Collateral Due 2017 2016 2017 U.S. dollar
denominated zero-coupon convertible bond-type bonds with stock acquisition rights, due in 2020 ¥ 11,219
¥ 11,268 $ 100,000 – – March 26, 2020
Unsecured bonds with early redemption clauses (with special contracts for exemption at time of de facto bankruptcy and subordination agreements)
¥ 10,000
¥ – $ 89,135
0.59% March 24, 2017
to March 24, 2022
0.48%
+6-month JPY LIBOR (*1) After March
24, 2022 – (*1) March 24, 2027
Note: (*1) This rate is based on “Interest Payment” Clause 2 of this bonds’ offering circular.

55
The following is a summary of the terms for conversion and redemption of convertible bonds with stock acquisition rights:
Issue price of stock
acquisition rights
Issue price of common stock
Total issue price Exercise period
U.S. dollar denominated zero-coupon convertible bond-type bonds with stock acquisition rights, due in 2020 Gratis $ 37.30 (*1)
$100,000 thousand
From April 9, 2015to March 12, 2020
Notes: (*1) Issue price of common stock is calculated with consideration for the effects of the consolidation of
shares effective October 1, 2016. (*2) The value of the assets to be invested at the exercise of the stock acquisition rights is equal to the face
value of the convertible bond. At March 31, 2017, the annual maturities of bonds with stock acquisitions rights were as follows.
Year ending March 31, Millions of yenThousands of U.S. dollars
2018 ¥ – $ –
2019 – –
2020 11,219 100,000
2021 – –
2022 – –
¥ 11,219 $ 100,000
11. Employee Retirement Benefits
The Bank maintains “funded and unfunded defined benefit plans” and “a selection of either a defined contribution plan or prepayment of retirement allowance” for employee retirement benefits. Eligible employees are entitled to receive lump-sum payments or pension payments based on the level of salary and the length of service under the defined benefit (“DB”) corporate pension plans, all of which are funded plans. The Bank has set up retirement benefit trusts for certain plans among the defined benefit corporate pension plans. Eligible employees are entitled to receive lump-sum payments based on the level of salary and the length of service under the lump-sum payment plans, most of which are funded as a result of establishing retirement benefit trusts; however, some are unfunded plans. One of the Bank’s consolidated subsidiaries participates in a multi-employer pension program under a certain public pension plan as part of the lump-sum retirement benefit plan. The Bank’s other three consolidated subsidiaries have each adopted only the lump-sum retirement benefit plan. The consolidated subsidiaries use the simplified method in calculating employee retirement defined benefit liability and retirement benefit expenses. Under this method, the amount for severance payments required at the year-end for voluntary termination is deemed the retirement benefit obligation.
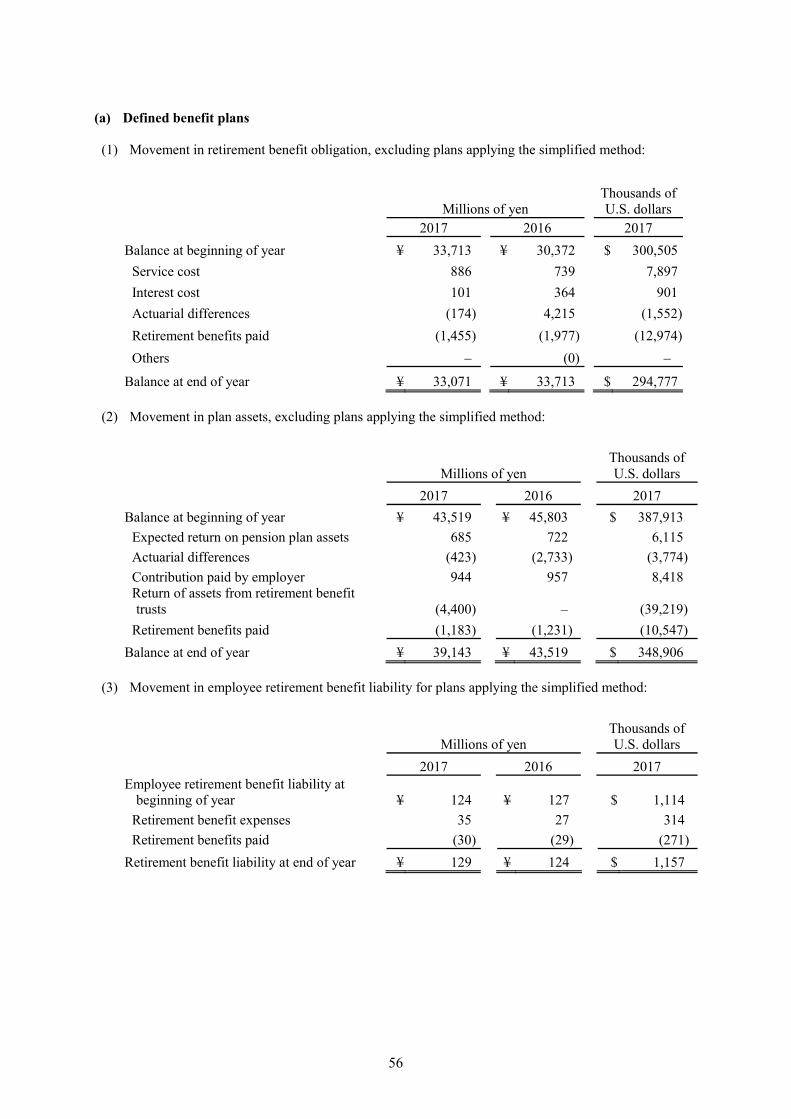
56
(a) Defined benefit plans
(1) Movement in retirement benefit obligation, excluding plans applying the simplified method:
Millions of yen
Thousands of U.S. dollars
2017 2016 2017
Balance at beginning of year ¥ 33,713 ¥ 30,372 $ 300,505
Service cost 886 739 7,897
Interest cost 101 364 901
Actuarial differences (174) 4,215 (1,552)
Retirement benefits paid (1,455) (1,977) (12,974)
Others – (0) –
Balance at end of year ¥ 33,071 ¥ 33,713 $ 294,777
(2) Movement in plan assets, excluding plans applying the simplified method:
Millions of yen Thousands of U.S. dollars
2017 2016 2017
Balance at beginning of year ¥ 43,519 ¥ 45,803 $ 387,913
Expected return on pension plan assets 685 722 6,115
Actuarial differences (423) (2,733) (3,774)
Contribution paid by employer 944 957 8,418 Return of assets from retirement benefit trusts (4,400) – (39,219)
Retirement benefits paid (1,183) (1,231) (10,547)
Balance at end of year ¥ 39,143 ¥ 43,519 $ 348,906
(3) Movement in employee retirement benefit liability for plans applying the simplified method:
Millions of yen Thousands of U.S. dollars
2017 2016 2017 Employee retirement benefit liability at
beginning of year ¥ 124 ¥ 127 $ 1,114
Retirement benefit expenses 35 27 314
Retirement benefits paid (30) (29) (271)
Retirement benefit liability at end of year ¥ 129 ¥ 124 $ 1,157

57
(4) Reconciliation from retirement benefit obligation and plan assets to retirement benefit (asset) liability
recognized in the consolidated balance sheets:
Millions of yen Thousands of U.S. dollars
2017 2016 2017
Funded retirement benefit obligation ¥ 33,143 ¥ 33,787 $ 295,425
Plan assets (39,143) (43,519) (348,906)
(6,000) (9,732) (53,481)
Unfunded retirement benefit obligation 57 51 509
Net retirement benefit (asset) liability ¥ (5,942) ¥ (9,681) $ (52,972)
Employee retirement benefit liability ¥ 5,055 ¥ 4,937 $ 45,065
Employee retirement benefit assets (10,998) (14,618) (98,037)
Net retirement benefit (asset) liability ¥ (5,942) ¥ (9,681) $ (52,972)
(5) Net periodic retirement benefit expense and its breakdown:
Millions of yen Thousands of U.S. dollars
2017 2016 2017
Service cost ¥ 886 ¥ 739 $ 7,897
Interest cost 101 364 901
Expected return on plan assets (685) (722) (6,115)
Amortization of actuarial differences (134) (164) (1,203)
Amortization of past service cost (144) (144) (1,292)Retirement benefit expense for plans applying the simplified method 35 27 314
Gain on return of assets from retirement benefit trusts (712) – (6,354)
Others 8 6 76 Net periodic retirement benefit expense
of defined benefit plans ¥ (647) ¥ 104 $ (5,776)
(6) Retirement benefit adjustments in other comprehensive income, before tax effects:
Millions of yen Thousands of U.S. dollars
2017 2016 2017
Past service cost ¥ (144) ¥ (144) $ (1,292)
Actuarial differences (1,097) (7,112) (9,779)
Total ¥ (1,242) ¥ (7,257) $ (11,071)
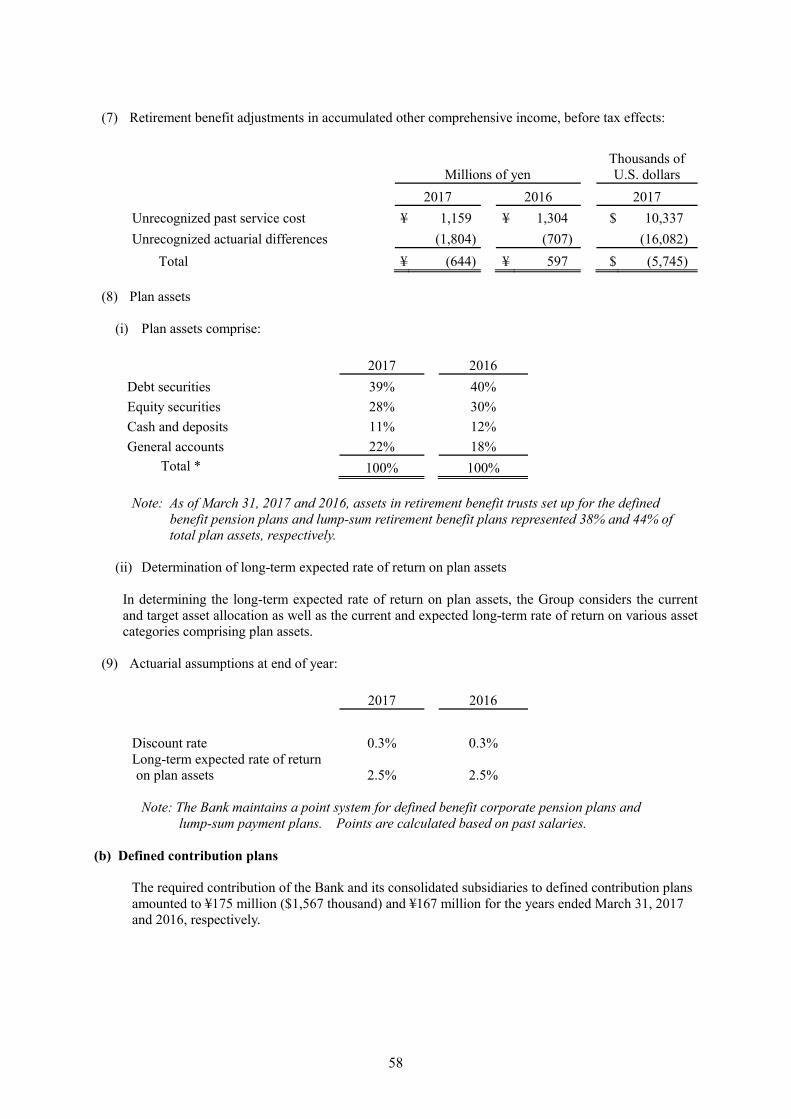
58
(7) Retirement benefit adjustments in accumulated other comprehensive income, before tax effects:
Millions of yen Thousands of U.S. dollars
2017 2016 2017
Unrecognized past service cost ¥ 1,159 ¥ 1,304 $ 10,337
Unrecognized actuarial differences (1,804) (707) (16,082)
Total ¥ (644) ¥ 597 $ (5,745)
(8) Plan assets
(i) Plan assets comprise:
2017 2016
Debt securities 39% 40%
Equity securities 28% 30%
Cash and deposits 11% 12%
General accounts 22% 18% Total * 100% 100%
Note: As of March 31, 2017 and 2016, assets in retirement benefit trusts set up for the defined
benefit pension plans and lump-sum retirement benefit plans represented 38% and 44% of total plan assets, respectively.
(ii) Determination of long-term expected rate of return on plan assets
In determining the long-term expected rate of return on plan assets, the Group considers the current and target asset allocation as well as the current and expected long-term rate of return on various asset categories comprising plan assets.
(9) Actuarial assumptions at end of year:
2017 2016
Discount rate 0.3% 0.3% Long-term expected rate of return on plan assets 2.5% 2.5%
Note: The Bank maintains a point system for defined benefit corporate pension plans and
lump-sum payment plans. Points are calculated based on past salaries. (b) Defined contribution plans
The required contribution of the Bank and its consolidated subsidiaries to defined contribution plans amounted to ¥175 million ($1,567 thousand) and ¥167 million for the years ended March 31, 2017 and 2016, respectively.

59
12. Acceptances and Guarantees
The Bank provides guarantees with respect to liabilities of its customers for payment of loans or other liabilities with other financial institutions. As a contra account, “customers’ liabilities for acceptances and guarantees” has been shown in assets on the accompanying consolidated balance sheets, indicating the Bank’s right of indemnity from customers.
Guarantees are provided on certain privately placed bonds included in securities in accordance with Article 2, Paragraph 3 of the Financial Instruments and Exchange Act of Japan. The guarantees amounted to ¥19,432 million ($173,213 thousand) and ¥13,316 million at March 31, 2017 and 2016, respectively.
13. Net Assets
At March 31, 2017 and 2016, the authorized number of shares of common stock without par value was 50 million shares and 500 million shares, respectively, and the number of shares of common stock issued was 19,755,487 shares and 205,054,873 shares, respectively. At March 31, 2017 and 2016, the number of shares of treasury stock held by the Group was 830 thousand and 7,974 thousand shares, respectively. The Group implemented a consolidation of shares at a ratio of one share per 10 shares effective on October 1, 2016. In connection with the consolidation, the number of shares of stock issued decreased by 185,299 thousand shares, representing a decrease of 184,549 thousand shares of outstanding common stock and a decrease of 750 thousand shares by retirement of treasury stock.
Under Japanese laws and regulations, the entire amount paid for new shares is required to be designated as common stock. However, a company may, by a resolution of the Board of Directors, designate an amount not exceeding one-half of the issue price of the new shares as additional paid-in capital, which is included in capital surplus.
Capital surplus consists principally of additional paid-in capital. The Banking Act of Japan provides that an amount equivalent to at least 20% of the cash payments as appropriation of retained earnings shall be appropriated as legal earnings reserve until the total amount of additional paid-in capital and legal earnings reserve equals 100% of common stock. The legal earnings reserve has been included in the retained earnings in the accompanying consolidated balance sheets. Under the Act, the legal earnings reserve and additional paid-in capital can be used to eliminate or reduce a deficit by a resolution at the shareholders’ meeting. The additional paid-in capital and legal earnings reserve may not be distributed as dividends. All additional paid-in capital and legal earnings reserve may be transferred to other capital surplus and retained earnings, respectively, which may become available for distribution as dividends. At both March 31, 2017 and 2016, the legal earnings reserve amounted to ¥8,029 million ($71,575 thousand).
The maximum amount that the Bank can distribute as dividends is calculated based on the nonconsolidated financial statements of the Bank in accordance with Japanese laws and regulations.

60
14. Stock Options (a) Stock option expenses
The Bank recorded stock option expenses of ¥36 million ($323 thousand) and ¥40 million in “General and administrative expenses” for the years ended March 31, 2017 and 2016, respectively.
(b) Outline of stock options i) Outline of stock options:
2014 stock options 2015 stock options 2016 stock options Position and number of grantees 13 directors of the
Bank (excluding outside directors)
13 directors of the Bank (excluding outside directors)
12 directors of the Bank (excluding outside directors)
Number of options granted* 10,980 common shares of the Bank
8,870 common shares of the Bank
12,280 common shares of the Bank
Grant date August 13, 2014 August 13, 2015 August 12, 2016 Conditions for vesting Not defined Not defined Not defined Requisite service period Not defined Not defined Not defined Exercise period August 14, 2014
to August 13, 2064
August 14, 2015 to
August 13, 2065
August 13, 2016 to
August 12, 2066
Note: * The Bank implemented a consolidation of shares at a ratio of one share per 10 shares effective on October 1, 2016. The number of shares in the table above is calculated considering the effect of the consolidation of shares.
ii) Size and changes in stock options:
The following describes the size of and changes in stock options that existed during the year ended March 31, 2017. The number of stock options is calculated in terms of the number of shares. a) Number of stock options 2014 stock options 2015 stock options 2016 stock options Nonvested
April 1, 2016 – Outstanding – – – Granted – – 12,280 sharesForfeited – – – Vested – – 12,280 sharesMarch 31, 2017 – Outstanding – – –
Vested April 1, 2016 – Outstanding 10,230 shares 8,870 shares – Vested – – 12,280 sharesExercised 1,430 shares 1,160 shares – Forfeited – – – March 31, 2017 –- Outstanding 8,800 shares 7,710 shares 12,280 shares
Note: The Bank implemented a consolidation of shares at a ratio of one share per 10 shares effective on October 1, 2016. The number of shares in the table above is calculated considering the effect of the consolidation of shares.
b) Price information:
2014 stock options 2015 stock options 2016 stock options Exercise price ¥1
($0.01) per share ¥1
($0.01) per share ¥1
($0.01) per share Average exercise price ¥4,870 ($43.41) per share ¥3,150 ($28.08) per share – Fair value at grant date ¥3,470 ($30.93) per share ¥4,590 ($40.91) per share ¥2,950 ($26.29) per share
Note: The Bank implemented a consolidation of shares at a ratio of one share per 10 shares effective on October 1, 2016. The prices in the table above are considered the effect of the consolidation of shares.

61
Valuation technique to estimate fair value of stock options
a) Valuation technique used: Black-Scholes model
b) Major assumptions and estimation method 2016 stock option Expected volatility (*1) 35.203% Expected life (*2) 5.6 years Expected dividends (*3) ¥7 ($0.06) per share Risk free interest rate (*4) (0.2)%
Notes: (*1) Expected volatility is calculated based on the actual stock prices on each trading day during the period from
January 12, 2011 to August 12, 2016. (*2) Expected life is estimated based on the average term of office of directors, etc., who retired during the past
10 years. (*3) Expected dividends are the actual dividends for the year ended March 31, 2016. (*4) Risk free interest rate is a Japanese government bond yield which corresponds to the expected life.
iii) Method of estimating number of stock options vested
Only the actual number of forfeited stock options is reflected because it is difficult to rationally estimate the number of stock options to be forfeited in the future.
15. Commitments
(a) Loan commitments
Overdraft facilities and loan commitment lines are contracts under which the Bank is obligated to advance funds up to a predetermined amount to a customer upon request, provided that the customer has met the terms and conditions of the applicable contract. At March 31, 2017 and 2016, the unused amounts of these contracts amounted to ¥728,787 million ($6,496,013 thousand) and ¥727,776 million, respectively. The unused contract amounts included amounts which originally expire within one year or are revocable by the Bank at any time without any conditions in the amount of ¥717,632 million ($6,396,582 thousand) and ¥716,291 million at March 31, 2017 and 2016, respectively. Since many of these commitments expire without being drawn down, the unused amount does not necessarily represent a future cash requirement. Most of these contracts have conditions that allow the Bank to refuse customers’ applications for loans or decrease the contract limits for appropriate reasons (e.g., changes in financial situation and deterioration in customers’ creditworthiness). At the execution of such contracts, the Bank obtains real estate, securities, etc., as collateral if considered necessary. Subsequently, the Bank performs periodic reviews of customers’ business results based on internal rules and may take necessary measures that include reconsidering the terms and conditions of such contracts and/or requiring additional collateral and/or guarantees.
(b) Lease commitments
(Lessee contracts) The Group leases certain office space and equipment as lessee under long-term noncancellable lease contracts. The aggregate future minimum lease commitments for noncancellable operating leases at March 31, 2017 and 2016 were as follows.

62
Thousands of
Millions of yen U.S. dollars
2017 2016 2017
Operating leases as lessee:
Due within one year ¥ 655 ¥ 663 $ 5,843
Due after one year 1,487 1,957 13,258
¥ 2,142 ¥ 2,620 $ 19,101 (Lessor contracts) A consolidated subsidiary engaged in leasing operations as lessor entered into long-term, noncancellable lease contracts with third parties which were categorized as finance leases. At March 31, 2017 and 2016, investments in the leased assets as lessor consisted of the following.
Thousands of
Millions of yen U.S. dollars
2017 2016 2017
Future minimum lease payments to be received ¥ 28,131 ¥ 26,309 $ 250,746
Estimated residual value 2,807 2,141 25,024
Imputed interest (2,451) (2,006) (21,849)
Investments in leased assets ¥ 28,487 ¥ 26,444 $ 253,921
The aggregate annual maturities of future minimum lease payments to be received related to lease receivables and investments in leased assets at March 31, 2017 were as follows.
Millions of yen Thousands of U.S. dollars
Year ending March 31, Lease
receivables Investments in leased assets
Lease receivables
Investments in leased assets
2018 ¥ 17 ¥ 8,469 $ 154 $ 75,490
2019 17 7,001 154 62,408
2020 17 5,387 154 48,021
2021 17 3,806 154 33,932
2022 17 2,062 154 18,384
2023 and thereafter 27 1,403 244 12,511
¥ 113 ¥ 28,131 $ 1,014 $ 250,746
At March 31, 2017 and 2016, future lease payments to be received for noncancellable operating leases were as follows.
Thousands of
Millions of yen U.S. dollars
2017 2016 2017
Operating leases as lessor:
Due within one year ¥ 107 ¥ 78 $ 959
Due after one year 182 129 1,627
¥ 290 ¥ 207 $ 2,586

63
16. Derivative Instruments
At March 31, 2017 and 2016, derivative instruments, other than those to which hedge accounting was applied, were stated at fair value with valuation gains and losses recognized as current earnings in the accompanying consolidated statements of income as follows.
Millions of yen
Notional principal or contract amounts
Fair value * Valuation gain (loss)
Over one year Total
March 31, 2017:
Interest rate swaps ¥ 20,000 ¥ – ¥ (304) ¥ (304)
Currency swaps 39,554 – (179) (179)
Forward foreign exchange contracts 2,734 – (16) (16)
March 31, 2016:
Interest rate swaps ¥ 20,000 ¥ 20,000 ¥ (671) ¥ (671)
Currency swaps 54,717 – 1,331 1,331
Forward foreign exchange contracts 4,540 – 136 136
Thousands of U.S. dollars
March 31, 2017:
Interest rate swaps $ 178,269 $ – $ (2,711) $ (2,711)
Currency swaps 352,566 – (1,599) (1,599)
Forward foreign exchange contracts 24,373 – (148) (147)
Note: *Fair values were calculated based on the discounted cash flow method, etc. Derivative instruments to which hedge accounting was applied at March 31, 2017 and 2016 were as follows.
Millions of yen
Hedged items
Notional principal or contract amounts
Fair value * Total
Over one year
Currency swap contracts:
March 31, 2017 Loans in foreign
currencies ¥ 74 ¥ – ¥ 2
March 31, 2016 Loans in foreign
currencies 275 – 12
Thousands of U.S. dollars
Currency swap contracts:
March 31, 2017 Loans in foreign
currencies $ 661 $ – $ 19
Note: *Fair values were calculated based on the discounted cash flow method, etc.

64
17. Income Taxes
Income taxes for the years ended March 31, 2017 and 2016 consisted of the following.
Thousands of U.S. dollars Millions of yen
2017 2016 2017
Income taxes:
Current ¥ 2,182 ¥ 1,668 $ 19,455
Deferred (135) 2,316 (1,206)
¥ 2,047 ¥ 3,984 $ 18,249 At March 31, 2017 and 2016, income taxes, including enterprise taxes, payable amounting to ¥1,381 million ($12,317 thousand) and ¥512 million, respectively, were included in “other liabilities” in the accompanying consolidated balance sheets. The tax effects of temporary differences that gave rise to a significant portion of deferred tax assets and liabilities at March 31, 2017 and 2016 were as follows.
Thousands of
Millions of yen U.S. dollars 2017 2016 2017
Deferred tax assets:
Reserve for possible loan losses ¥ 3,920 ¥ 3,791 $ 34,949 Employee retirement benefit (asset) liability 1,594 1,799 14,215 Loss on devaluation of stocks and other
securities 2,496 2,553 22,250 Reserve for contingent losses 658 561 5,874 Depreciation 945 652 8,430 Others 2,630 2,978 23,449 Less valuation allowance (3,992) (4,411) (35,587)
Subtotal 8,254 7,927 73,580
Deferred tax liabilities: Unrealized gains on available-for-sale
securities (20,346) (21,549) (181,357) Gain on transfer of securities to trusts for
retirement benefit plan (2,217) (2,403) (19,762) Others (72) (72) (644) Subtotal (22,635) (24,024) (201,763) Net deferred tax assets (liabilities) ¥ (14,380) ¥ (16,097) $ (128,183)
At March 31, 2017 and 2016, deferred tax assets and liabilities were as follows.
Thousands of
Millions of yen U.S. dollars 2017 2016 2017
Deferred tax assets ¥ 758 ¥ 811 $ 6,760
Deferred tax liabilities (15,139) (16,908) (134,943)

65
In assessing the realizability of deferred tax assets, management of the Group considers whether some portion or all of the deferred tax assets will not be realized. The ultimate realization of deferred tax assets is dependent upon the generation of future taxable income during the periods in which those temporary differences become deductible. At both March 31, 2017 and 2016, a valuation allowance was provided to reduce deferred tax assets to amounts that management believed would be realizable. The Group is subject to Japanese national and local income taxes which in the aggregate resulted in an effective statutory tax rate of approximately 30.7% and 32.8% for the years ended March 31, 2017 and 2016, respectively. Reconciliations between the Japanese statutory tax rate and the effective tax rate on pretax profit reflected in the accompanying consolidated statements of income for the years ended March 31, 2017 and 2016 were as follows.
Percentage of pre-tax profit
2017 2016
Japanese statutory tax rate 30.7 % 32.8 %
Increase (decrease) due to:
Permanently nondeductible expenses 0.7 0.5
Tax exempt income (2.4) (1.9)
Local minimum taxes - per capita basis 0.8 0.6
Changes in valuation allowance (5.1) 0.9
Changes in income tax rates – 2.0
Others 0.1 0.5
Effective tax rate 24.8 % 35.3 %
18. General and administrative expenses
General and administrative expenses for the years ended March 31, 2017 and 2016 included the following:
Millions of yen Thousands of U.S. dollars
2017 2016 2017 Salaries and allowances (including
bonuses) ¥ 15,369 ¥ 15,684 $ 136,995
Retirement benefit expenses 240 271 2,146

66
19. Comprehensive Income
Amounts reclassified to profit (loss) in the current period that were recognized in other comprehensive income in the current or previous periods and the tax effects for each component of other comprehensive income for the years ended March 31, 2017 and 2016 were as follows.
Millions of yen Thousands of U.S. dollars
2017 2016 2017 Net change in unrealized losses on
available-for-sale securities:
Decrease during the year ¥ (1,307) ¥ (18,344) $ (11,652) Reclassification adjustments (2,428) (1,262) (21,646) Pretax amount (3,735) (19,606) (33,298) Tax effect amount 1,202 7,161 10,720
Net change in unrealized losses on available-for-sale securities, net of tax (2,533) (12,444) (22,578)
Net change in deferred (losses) gains on hedging instruments:
Decrease during the year (41) (49) (370) Reclassification adjustments 41 49 367 Pretax amount (0) 0 (3) Tax effect amount 0 (0) 1
Net change in deferred (losses) gains on hedging instruments, net of tax (0) 0 (2)
Land revaluation excess: Tax effect amount – 158 –
Land revaluation excess, net of
tax – 158 –Retirement benefit adjustments: Decrease during the year (249) (6,948) (2,222) Reclassification adjustments (992) (309) (8,849) Pretax amount (1,242) (7,257) (11,071) Tax effect amount 378 2,331 3,376
Retirement benefit adjustments,
net of tax (863) (4,926) (7,695)
Total other comprehensive
income ¥ (3,396) ¥ (17,212) $ (30,275)

67
20. Related Party Transactions
During the years ended March 31, 2017 and 2016, the Bank had significant transactions with the Bank’s directors and audit and supervisory board members and their immediate family members and/or the companies in which they hold directly or indirectly a majority voting interest. A summary of the significant related party transactions as of and for the years ended March 31, 2017 and 2016 is as follows.
Millions of yen Thousands of U.S.
dollars
2017 2016 2017
For the year:
Number of related parties 12 12
Amount of loan transactions (average balance) ¥ 422 ¥ 368 $ 3,763
Underwriting private placement bonds (average balance) 50 80 447
At year-end:
Loans and bills discounted ¥ 417 ¥ 481 $ 3,722
Securities (bonds and debentures) 45 75 401
During the year ended March 31, 2017 the Bank received a partial refund from the retirement benefit trusts in the amount of ¥4,400 million ($39,219 thousand).

68
21. Subsequent Events
Appropriation of retained earnings
Shareholders of the Bank approved the following appropriation of retained earnings at the annual general meeting held on June 23, 2017.
Millions of yenThousands of U.S. dollars
Cash dividends at ¥35.0 per share ($0.31 per share) ¥ 662 $ 5,904 Transaction under common control Acquisition of additional shares of a subsidiary (a) Outline of the transaction
(1) Name and business of the company under the business combination
Name Business
Nagoya Lease Co., Ltd. Comprehensive finance leasing business Nagoya Card Co., Ltd. Credit card business and assurance business Nagoya MC Card Co., Ltd. Credit card business
(2) Date of the business combination
Name Date of the business combination Nagoya Lease Co., Ltd. May 19, 2017 Nagoya Card Co., Ltd. May 17, 2017 Nagoya MC Card Co., Ltd. May 17, 2017
(3) Legal form of the business combination
Acquisition of shares from noncontrolling shareholders
(4) Name of company after the business combination Unchanged
(5) Other matters related to the business combination The Bank acquired the shares to expand the profitability of the Bank and the Group as a result of greater synergy.
(b) Outline of accounting treatment
This transaction was accounted for as a transaction with noncontrolling shareholders under common control in accordance with the “Accounting Standard for Business Combinations” (ASBJ Statement No. 21, September 13, 2013) and the “Guidance on Accounting Standard for Business Combinations and Accounting Standard for Business Divestitures” (ASBJ Guidance No. 10, September 13, 2013).
(c) Acquisition cost and consideration paid
Consideration paid for acquisition: Cash and due from banks in the aggregate amount of ¥1,390 million ($12,393 thousand)

69
(d) Change in capital surplus of the Bank in connection with the transaction with noncontrolling
shareholders
(1) Major reason for change in capital surplus Acquisition of additional shares of subsidiaries
(2) Increase in capital surplus due to the transaction with noncontrolling shareholders ¥2,219 million ($19,785 thousand)
22. Segment Information (a) General information about reportable segments
The Group defines a reportable segment as a component of the Group for which separate financial information is available and whose operating results are regularly reviewed by the Board of Directors to make decisions about the allocation of resources and to assess performance. The Group engages in financial services primarily in banking and also in comprehensive finance leasing services and credit card services. The reportable segments of the Group are determined based on the types of financial services as follows.
“Banking” –– head office and branches
Deposits and loans Domestic and foreign exchange transactions Securities investments Trading of trading account securities Underwriting and registration of corporate bonds
“Leasing” –– Nagoya Lease Co., Ltd., a domestic subsidiary of the Bank
Comprehensive finance leasing business
“Credit Card” –– Nagoya Card Co., Ltd. and Nagoya MC Card Co., Ltd., domestic subsidiaries of the Bank
Credit card business
(b) Basis of measurement for segment profit, segment assets, segment liabilities and other material items for each reportable segment
The basis of measurement for reportable segment information follows the accounting principles used in the consolidated financial statements as described in Note 2, “Summary of Significant Accounting Policies.” Segment profit is based on “ordinary income,” which is defined as total income less certain special gains and special losses included in the accompanying consolidated statements of income. Intersegment income is accounted for based on prices of ordinary transactions with independent third parties.

70
(c) Information about reportable segment profit, segment assets, segment liabilities and other material items by reportable segment Segment information as of and for the years ended March 31, 2017 and 2016 was as follows. Millions of yen
2017
Reportable segment
Banking Leasing Credit Card Total Other (*2) Total
Ordinary income (*1):
External customers ¥ 46,355 ¥ 14,581 ¥ 2,189 ¥ 63,125 ¥ 0 ¥ 63,125Intersegment 204 226 198 629 127 756
Total ordinary income 46,560 14,807 2,387 63,754 127 63,881
Segment profit 6,595 359 717 7,672 6 7,679
Segment assets 3,629,073 43,389 16,608 3,689,072 378 3,689,450
Segment liabilities 3,411,188 37,360 10,112 3,458,661 16 3,458,677
Other material items: Depreciation and amortization (*3) 2,334 304 8 2,647 0 2,647Interest income 33,056 6 104 33,166 – 33,166Interest expense 2,405 149 3 2,558 – 2,558Provision for possible loan losses 1,166 49 90 1,306 – 1,306Increase in tangible and intangible fixed
assets
2,060 308 8 2,377 – 2,377 Millions of yen
2016
Reportable segment
Banking Leasing Credit Card Total Other (*2) Total
Ordinary income (*1):
External customers ¥ 47,874 ¥ 13,785 ¥ 2,185 ¥ 63,845 ¥ 0 ¥ 63,845Intersegment 163 219 198 582 345 927
Total ordinary income 48,038 14,004 2,384 64,427 345 64,772
Segment profit 10,103 490 853 11,447 92 11,539
Segment assets 3,516,111 39,753 15,797 3,571,663 380 3,572,043
Segment liabilities 3,296,525 33,964 9,768 3,340,257 22 3,340,280Other material items:
Depreciation and amortization (*3) 2,263 226 6 2,497 0 2,497Interest income 34,814 6 132 34,954 0 34,954Interest expense 2,450 169 3 2,623 – 2,623Provision for possible loan losses – – – – – –Increase in tangible and intangible fixed
assets
2,637 410
13 3,061 – 3,061

71
Notes: *1. “Ordinary income” represents total income less certain special gains included in the accompanying consolidated statements of income.
*2. The “other” business segment includes principally the clerical outsourcing business.
*3. Depreciation and amortization include amounts related to information technology investments.
Thousands of U.S. dollars
2017
Reportable segment
Banking Leasing Credit Card Total Other (*2) Total
Ordinary income (*1):
External customers $ 413,187 $ 129,969 $ 19,512 $ 562,668 $ 1 $ 562,669Intersegment 1,825 2,015 1,767 5,607 1,132 6,739
Total ordinary income 415,012 131,984 21,279 568,275 1,133 569,408
Segment profit 58,793 3,203 6,394 68,390 59 68,449
Segment assets 32,347,571 386,747 148,043 32,882,361 3,370 32,885,731
Segment liabilities 30,405,456 333,013 90,139 30,828,608 145 30,828,753Other material items:
Depreciation and amortization (*3) 20,808 2,716 72 23,596 1 23,597Interest income 294,648 56 927 295,631 – 295,631Interest expense 21,438 1,336 31 22,805 – 22,805Provision for possible loan losses 10,400 439 810 11,649 – 11,649Increase in tangible and intangible fixed
assets
18,364 2,749
77 21,190 – 21,190

72
(d) Reconciliations of the totals of each segment item to corresponding Group amounts
Thousands of U.S. dollars Millions of yen
2017 2016 2017
Ordinary income:
Total reportable segments ¥ 63,754 ¥ 64,427 $ 568,275
Other 127 345 1,133
Intersegment elimination (756) (927) (6,739)
63,125 63,845 562,669
Other gains 716 16 6,385 Total income on consolidated statements of income ¥ 63,842 ¥ 63,862 $ 569,054
Note: “Other gains” include gain on disposal of fixed assets and gain on return of assets from retirement benefit trusts.
Thousands of U.S. dollars Millions of yen
2017 2016 2017
Segment profit:
Total reportable segments ¥ 7,672 ¥ 11,447 $ 68,390
Other 6 92 59
Intersegment elimination (15) (14) (141)
7,663 11,525 68,308
Other gains (losses), net 580 (252) 5,176 Profit before income taxes on consolidated statements of income ¥ 8,244 ¥ 11,272 $ 73,484
Note: “Other gains (losses), net” include gain and loss on disposal of fixed assets, gain on return of assets from retirement
benefit trusts and impairment loss on fixed assets.

73
Thousands of U.S. dollars Millions of yen
2017 2016 2017
Segment assets:
Total reportable segments ¥ 3,689,072 ¥ 3,571,663 $ 32,882,361
Other 378 380 3,370
Intersegment elimination (21,877) (19,095) (195,008)
Adjustment of retirement benefit assets 14 1,363 127Total assets on consolidated balance sheets ¥ 3,667,586 ¥ 3,554,311 $ 32,690,850
Thousands of U.S. dollars Millions of yen
2017 2016 2017
Segment liabilities:
Total reportable segments ¥ 3,458,661 ¥ 3,340,257 $ 30,828,608
Other 16 22 145
Intersegment elimination (19,144) (16,350) (170,646)
Adjustment of retirement benefit liability 462 948 4,120Total liabilities on consolidated balance sheets ¥ 3,439,995 ¥ 3,324,877 $ 30,662,227

74
Millions of yen
2017
Other material items:
Total reportable segments Other Reconciliation Consolidated
Depreciation and amortization ¥ 2,647 ¥ 0 ¥ – ¥ 2,647
Interest income 33,166 – (54) 33,112
Interest expense 2,558 – (69) 2,489
Provision for possible loan losses 1,306 – – 1,306
Increase in tangible and intangible fixed assets 2,377
–
– 2,377
Millions of yen
2016
Other material items:
Total reportable segments Other Reconciliation Consolidated
Depreciation and amortization ¥ 2,497 ¥ 0 ¥ – ¥ 2,497
Interest income 34,954 0 (68) 34,886
Interest expense 2,623 – (84) 2,539
Increase in tangible and intangible fixed assets
3,061
–
–
3,061
Thousands of U.S. dollars
2017
Other material items:
Total reportable segments Other Reconciliation Consolidated
Depreciation and amortization $ 23,596 $ 1 $ – $ 23,597Interest income 295,631 – (487) 295,144Interest expense 22,805 – (617) 22,188Provision for possible loan losses 11,649 – – 11,649Increase in tangible and intangible fixed assets 21,190 – – 21,190

75
(e) Related information for enterprise-wide disclosure
(1) Information by service
Millions of yen
Service
Loans
Security investments Leasing Other Total
Ordinary income from external customers:
For the year ended March 31, 2017 ¥ 23,552 ¥ 13,665 ¥ 14,581 ¥ 11,326 ¥ 63,125
For the year ended March 31, 2016 27,447 10,696 13,785 11,916 63,845
Thousands of U.S. dollars
Ordinary income from external customers:
For the year ended March 31, 2017 $ 209,933 $ 121,807 $ 129,970 $ 100,959 $ 562,669
(2) Information by geographical area for the years ended March 31, 2017 and 2016 was omitted since
income. From operations in Japan accounted for more than 90% of total consolidated income, and tangible fixed assets in Japan were more than 90% of tangible fixed assets on the consolidated balance sheets.
(3) Information by major customer for the years ended March 31, 2017 and 2016 was omitted since there were no external customers accounting for 10% or more of consolidated income.
(f) Information about impairment loss on fixed assets by reportable segment
Millions of yen
Reportable segment
Other Total
Banking LeasingCredit Card Total
Impairment loss on fixed assets: For the year ended
March 31, 2017 ¥ 126 ¥ – ¥ – ¥ 126 ¥ – ¥ 126 For the year ended March 31, 2016 250 – – 250 – 250
Thousands of U.S. dollars
Impairment loss on fixed assets: For the year ended March 31, 2017 $ 1,127 $ – $ – $ 1,127 $ – $ 1,127
(g) Information with regard to goodwill by reportable segment: None.