TCL ELECTRONICS HOLDINGS LIMITED Incorporated in the...
39
1 1 2019 Interim Results TCL 電子控股有限公司 TCL ELECTRONICS HOLDINGS LIMITED ( Stock Code : 01070.HK) 2019 Interim Results X10 Incorporated in the Cayman Islands with Limited Liability
Transcript of TCL ELECTRONICS HOLDINGS LIMITED Incorporated in the...

112019 Interim Results
T C L 電 子 控 股 有 限 公 司T C L E L E C T R O N I C S H O L D I N G S L I M I T E D
( S t o c k C o d e : 0 1 0 7 0 . H K )
2019 In ter im Resul ts
X10
Incorporated in the Cayman Islands with Limited Liability

222019 Interim Results
Contents
Financial Highlights1.
2. Business Review
3. Outlook

332019 Interim Results
P8Financial Highlights
C3

442019 Interim Results
4. Including one-off gain of HK$166 million recorded as a result of the asset
transfer
5. One-off gain excluded
Turnover and Net Profit Continue to Rise Steadily
Total Sales Volume and the Proportion of Overseas Sales Volume Rising Year by Year Stringent Cost Control
1.Based on the principle of prudence, a full provision of HK$170
million for receivables of energy-saving subsidies was made duringthe period
2. Including one-off gain of HK$220 million from the completion of
capital increase of Falcon Network Technology
3. One-off gain excluded
Historical Results Highlights
(‘000 sets)
Leaps to Global Top 2*
FY2016 FY2017 FY2018
^Restated * Source: Sigmaintell
53.3% 47.2% 39.4% 36.3%
46.7% 52.8% 60.6%63.7%
17,343 19,956 23,232
28,606
2015 2016 2017 2018The PRC Market Overseas Markets
15.9%
15.2%
13.1%
12.7%
0.0%
5.0%
10.0%
15.0%
20.0%
2015 2016 2017 2018
^
552019 Interim Results
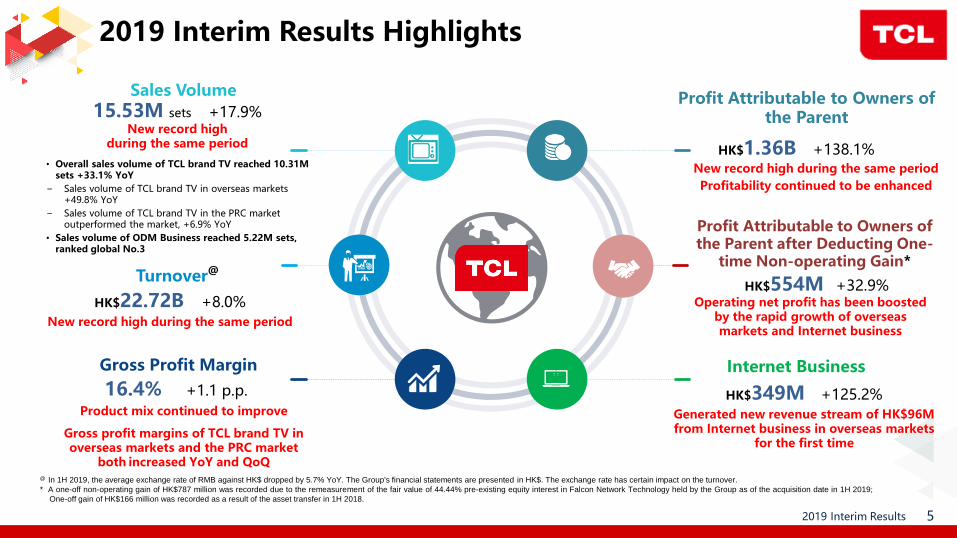
HK$1.36B +138.1%
Profit Attributable to Owners of the Parent
Sales Volume
15.53M sets +17.9%New record high
during the same period
Turnover@
HK$22.72B +8.0%New record high during the same period
Gross Profit Margin
16.4% +1.1 p.p.
New record high during the same period
Profitability continued to be enhanced
Internet Business
HK$349M +125.2%Generated new revenue stream of HK$96M from Internet business in overseas markets
for the first time
• Overall sales volume of TCL brand TV reached 10.31M sets +33.1% YoY
− Sales volume of TCL brand TV in overseas markets +49.8% YoY
− Sales volume of TCL brand TV in the PRC market outperformed the market, +6.9% YoY
• Sales volume of ODM Business reached 5.22M sets, ranked global No.3
Product mix continued to improve
Gross profit margins of TCL brand TV in overseas markets and the PRC market
both increased YoY and QoQ@ In 1H 2019, the average exchange rate of RMB against HK$ dropped by 5.7% YoY. The Group's financial statements are presented in HK$. The exchange rate has certain impact on the turnover.
* A one-off non-operating gain of HK$787 million was recorded due to the remeasurement of the fair value of 44.44% pre-existing equity interest in Falcon Network Technology held by the Group as of the acquisition date in 1H 2019;
One-off gain of HK$166 million was recorded as a result of the asset transfer in 1H 2018.
Operating net profit has been boosted by the rapid growth of overseas markets and Internet business
Profit Attributable to Owners of the Parent after Deducting One-
time Non-operating Gain*
HK$554M +32.9%
2019 Interim Results Highlights
662019 Interim Results
Financial Highlights
* In 1H 2019, the average exchange rate of RMB against HK$ dropped by 5.7% YoY. The Group's financial statements are presented in HK$. The exchange rate has certain impact on the turnover.@ EBITDA is defined as profit before deduction of finance costs, income tax, depreciation and amortization, excluding the Group's share of the profits and losses of the joint venture and associates.
^ A significant one-off non-operating gain of HK$787 million was recorded due to the remeasurement of the fair value of 44.44% pre-existing equity interest in Falcon Network Technology held by the
Group as of the acquisition date in 1H 2019; One-off gain of HK$166 million was recorded as a result of the asset transfer in 1H 2018.
# High dividend payout ratio after deducting one-time non-operating gain: 45%
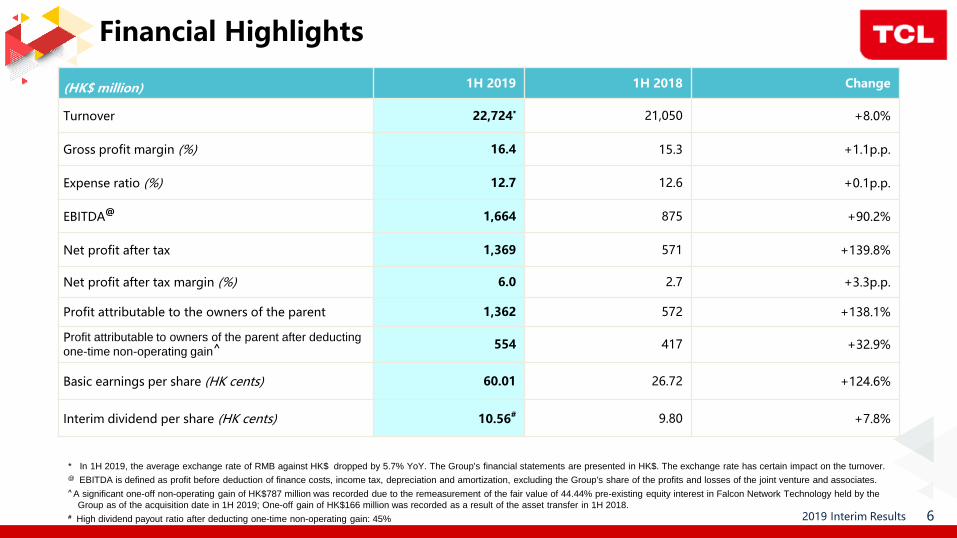
(HK$ million) 1H 2019 1H 2018 Change
Turnover 22,724* 21,050 +8.0%
Gross profit margin (%) 16.4 15.3 +1.1p.p.
Expense ratio (%) 12.7 12.6 +0.1p.p.
EBITDA@ 1,664 875 +90.2%
Net profit after tax 1,369 571 +139.8%
Net profit after tax margin (%) 6.0 2.7 +3.3p.p.
Profit attributable to the owners of the parent 1,362 572 +138.1%
Profit attributable to owners of the parent after deducting
one-time non-operating gain^ 554 417 +32.9%
Basic earnings per share (HK cents) 60.01 26.72 +124.6%
Interim dividend per share (HK cents) 10.56# 9.80 +7.8%

772019 Interim Results
The product mix continued to optimize,and the overall gross profit margin increased significantly
^ Restated
Gross profit margin(quarterly)
15.7%15.1% 14.2%
16.5% 15.8%14.7% 14.9% 15.5% 15.1%
18.0%
22.8%21.2%
20.3%
22.6%23.3% 23.8%
21.2%20.5%
23.7%25.3%
12.1% 12.1% 12.2%
15.0%13.6% 14.6% 15.3% 15.1%
13.8%
17.1%
8%
13%
18%
23%
28%
2017 Q1 2017 Q2 2017 Q3 2017 Q4 2018 Q1 2018 Q2 2018 Q3 2018 Q4 2019 Q1 2019 Q2
Overall gross profit margin (including ODM business)
The PRC market TV gross profit margin (TCL Brand)
Overseas markets TV gross profit margin (TCL Brand)
^
2019 Q2QoQ
Change(p.p.)
2019 Q2 YoY
Change (p.p.)
1H 2019 YoY
Change(p.p.)
+1.6 +1.5 +0.8
+2.9 +3.3 +1.1
+3.3 +2.5 +1.0
Gross profit margin 1H 2019 1H 2018 Change
Overall 16.4% 15.3% +1.1 p.p.
- Overseas markets (TCL Brand) 15.1% 14.1% +1.0 p.p.
- PRC market (TCL Brand) 24.3% 23.5% +0.8 p.p.
Gross Profit Margins
882019 Interim Results
15.9%
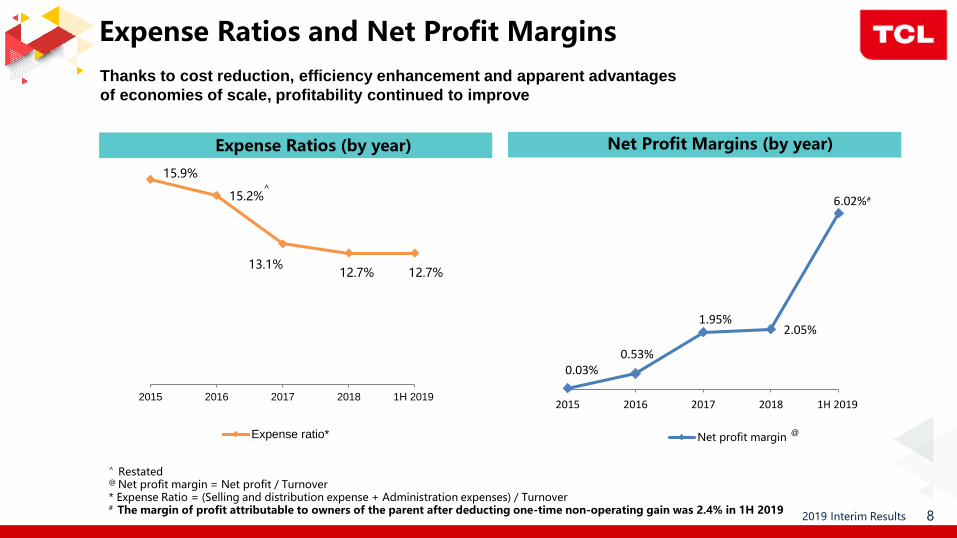
15.2%
13.1%12.7% 12.7%
2015 2016 2017 2018 1H 2019
Expense ratio*
Thanks to cost reduction, efficiency enhancement and apparent advantages
of economies of scale, profitability continued to improve
Expense Ratios (by year) Net Profit Margins (by year)
^ Restated@ Net profit margin = Net profit / Turnover* Expense Ratio = (Selling and distribution expense + Administration expenses) / Turnover# The margin of profit attributable to owners of the parent after deducting one-time non-operating gain was 2.4% in 1H 2019
^
Expense Ratios and Net Profit Margins
0.03%0.53%
1.95%2.05%
6.02%#
2015 2016 2017 2018 1H 2019
Net profit margin@
992019 Interim Results
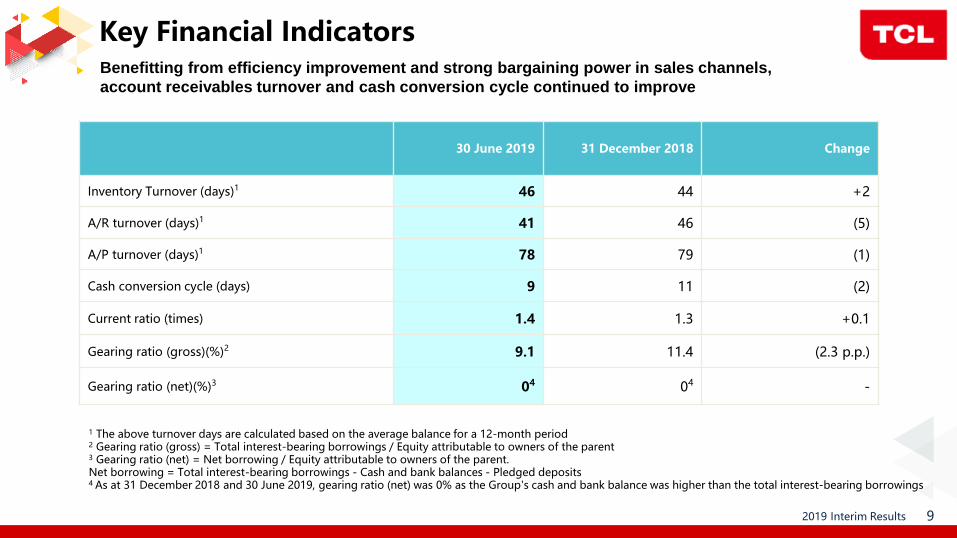
1 The above turnover days are calculated based on the average balance for a 12-month period2 Gearing ratio (gross) = Total interest-bearing borrowings / Equity attributable to owners of the parent3 Gearing ratio (net) = Net borrowing / Equity attributable to owners of the parent. Net borrowing = Total interest-bearing borrowings - Cash and bank balances - Pledged deposits4 As at 31 December 2018 and 30 June 2019, gearing ratio (net) was 0% as the Group's cash and bank balance was higher than the total interest-bearing borrowings
Benefitting from efficiency improvement and strong bargaining power in sales channels,
account receivables turnover and cash conversion cycle continued to improve
30 June 2019 31 December 2018 Change
Inventory Turnover (days)1 46 44 +2
A/R turnover (days)1 41 46 (5)
A/P turnover (days)1 78 79 (1)
Cash conversion cycle (days) 9 11 (2)
Current ratio (times) 1.4 1.3 +0.1
Gearing ratio (gross)(%)2 9.1 11.4 (2.3 p.p.)
Gearing ratio (net)(%)3 04 04 -
Key Financial Indicators

10102019 Interim Results
Sound financial position and sufficient cash
(HK$ million)30 June 2019 31 December 2018 Change
Non-current assets 5,220 4,230 +23.4%
Current assets 23,020 23,971 (4.0%)
- Trade receivables 5,111 4,882 +4.7%
- Cash and bank balances 6,818 6,742 +1.1%
Current liabilities 16,824 18,329 (8.2%)
Net current assets 6,196 5,642 +9.8%
Non-current liabilities 133 92 +44.6%
Net assets 11,283 9,780 +15.4%
Net assets value per share (HK$) 4.64 4.19 +10.7%
Consolidated Statement of Financial Position Highlights

11112019 Interim Results
P8Business Review
P8
12122019 Interim Results
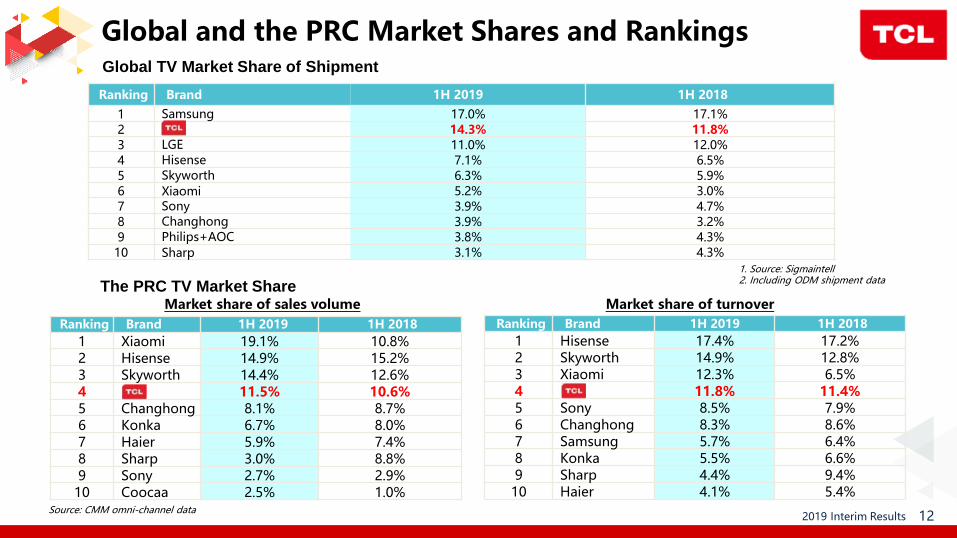
Global and the PRC Market Shares and Rankings
Ranking Brand 1H 2019 1H 2018
1 Samsung 17.0% 17.1%2 14.3% 11.8%3 LGE 11.0% 12.0%4 Hisense 7.1% 6.5%5 Skyworth 6.3% 5.9%6 Xiaomi 5.2% 3.0%7 Sony 3.9% 4.7%8 Changhong 3.9% 3.2%9 Philips+AOC 3.8% 4.3%10 Sharp 3.1% 4.3%
Global TV Market Share of Shipment
1. Source: Sigmaintell2. Including ODM shipment data
The PRC TV Market ShareMarket share of sales volume
Ranking Brand 1H 2019 1H 2018
1 Xiaomi 19.1% 10.8%2 Hisense 14.9% 15.2%3 Skyworth 14.4% 12.6%4 11.5% 10.6%5 Changhong 8.1% 8.7%6 Konka 6.7% 8.0%7 Haier 5.9% 7.4%8 Sharp 3.0% 8.8%9 Sony 2.7% 2.9%
10 Coocaa 2.5% 1.0%
Market share of turnover
Ranking Brand 1H 2019 1H 2018
1 Hisense 17.4% 17.2%2 Skyworth 14.9% 12.8%3 Xiaomi 12.3% 6.5%4 11.8% 11.4%5 Sony 8.5% 7.9%6 Changhong 8.3% 8.6%7 Samsung 5.7% 6.4%8 Konka 5.5% 6.6%9 Sharp 4.4% 9.4%10 Haier 4.1% 5.4%
Source: CMM omni-channel data

13132019 Interim Results
TV sales volume ('000 sets) 1H 2019 1H 2018 Change
Total 15,526 13,173 +17.9%
- Overseas markets (TCL Brand) 7,073 4,721 +49.8%
- PRC market (TCL Brand) 3,237 3,027 +6.9%
- ODM business 5,216 5,425 (3.9%)
Of which: Smart TV 12,371 9,383 +31.8%
4K TV 5,752 3,773 +52.5%
Taking advantage of the first-mover internationalization strategy,
and the overseas markets continued to grow strongly
TV Sales Volume
14142019 Interim Results
①Products Business
②Application Services
Business Review
C6

15152019 Interim Results
Sales volume growth
of TV with 55-inch
and above screen
1H 2019 1H 2018 Change
Turnover 10,768 8,127 +32.5%
Gross profit 1,628 1,145 +42.2%
Gross profit margin 15.1% 14.1% +1.0 p.p.
Proportion of High-end Productsand Average Size (HK$ million)
1H 18
1H 19
1H 18
1H 19
Successful implementation of globalization strategy, overseas markets sustained
strong growth momentum, operating results soared by 132.1% YoY
+30.5% YoY
Sales volume: In 1H 2019, the sales volume of TCL brand TV sets increased by 49.8% YoY to about 7.07 million sets, and large screens of 65 inches and above increased by 204.1% YoY.
✓ North American markets sustained competitive advantage in spite of China-US trade dispute, the sales volume was up by 75.0% YoY. Ranked top 2 in 1H 2019 and ranked No.1 in March in terms of sales volume.
✓ Emerging markets maintained a rapid growth trend with sales volume up by 28.8% YoY, with India (up by 216.8% YoY), Indonesia (up by 109.5% YoY), Argentina (up by 64.4%) and Russia (up by 52.0%) achieving rapid growth.
✓ European markets sales volume soared by 20.7% YoY, with sales volume in France (up by 57.4% YoY), Germany (up by 161.1% YoY) and Italy (up by196.9% YoY) significantly increased.
Turnover: rose by 32.5% YoY to HK$10.77 billion.
Gross profit margin: rose by 1.0 p.p. YoY to 15.1%. In 2019Q2, the gross profit margin rose by 3.3 p.p to 17.1%, sequentially.
Operating results:improved significantly by 132.1% YoY, and profitability significantly improved.
+0.9 inch
+5.8 p.p.88.2%
43.6%
82.4%
34.9%
Proportion of smart
products
Proportion of 4K products +8.7 p.p.
TCL Brand TV Business in Overseas Markets
41.3Average size (inch)
42.2
16162019 Interim Results
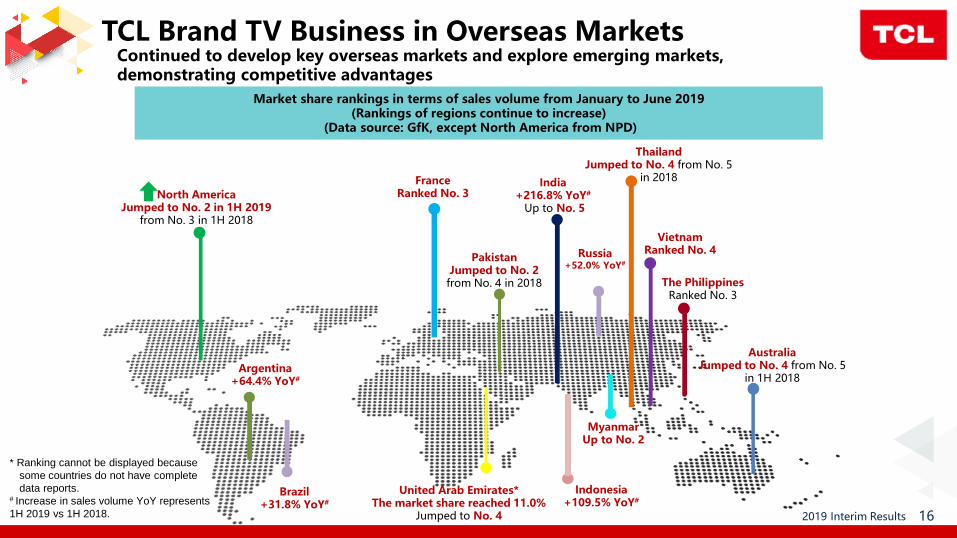
Market share rankings in terms of sales volume from January to June 2019 (Rankings of regions continue to increase)
(Data source: GfK, except North America from NPD)
North AmericaJumped to No. 2 in 1H 2019
from No. 3 in 1H 2018
FranceRanked No. 3
ThailandJumped to No. 4 from No. 5
in 2018
The PhilippinesRanked No. 3
AustraliaJumped to No. 4 from No. 5
in 1H 2018
VietnamRanked No. 4
India+216.8% YoY#
Up to No. 5
Continued to develop key overseas markets and explore emerging markets, demonstrating competitive advantages
PakistanJumped to No. 2
from No. 4 in 2018
United Arab Emirates*The market share reached 11.0%
Jumped to No. 4
* Ranking cannot be displayed because
some countries do not have complete
data reports.# Increase in sales volume YoY represents
1H 2019 vs 1H 2018.
Argentina+64.4% YoY#
Indonesia+109.5% YoY#
MyanmarUp to No. 2
Russia+52.0% YoY#
TCL Brand TV Business in Overseas Markets
Brazil+31.8% YoY#

17172019 Interim Results
Sales volume continued to rise strongly: ranked No. 1 in the U.S. in March 2019; ranked top 2 in NorthAmerican markets in 1H 2019, with market share up by 3.6 p.p. YoY.
In 1H 2019, the Group’s profitability of the North American markets improved significantly.
Accomplished full coverage of 6 major sales channels in the U.S. by extending to all branches of BestBuy across the U.S. in 2017, accompanied with the proportion of mid to high ends sales channelskept increasing.
The Company has been well prepared for the potential risks of the China-US trade dispute: well-established global manufacturing layout with factories in Mexico, Vietnam, India, etc.
20142011-2013
2015
2016 2017
TCL Brand TV Business in North AmericaSales volume continued to increase in North America,
full coverage of six major channels with increasing brand awareness.

18182019 Interim Results
Persist in localized marketing strategy targeting at the local consumer market:
➢ Signing the NBA Milwaukee Bucks Player—Giannis Antetokounmpo (The Alphabet) as the BrandAmbassador of TCL in North America.
➢ Continuous brand exposure in well-known movies, sports events and television programs (Ellen Show).
➢ Sponsored Rose Bowl Stadium, became the official TV partner of NBA team Minnesota Timberwolves,naming the home court of San Jose Earthquakes, a team of National Football League, and 4K Bar.
➢ Naming TCL Chinese Theater in San Diego, United States, and continued to promote the TCL ChineseTheater in Hollywood with IPs and hot topics.
Continuous rising of sales volume in North America,
full coverage of six major channels with increasing brand awareness.
Hand-print Ceremony of The Stars of Avengers 4 at TCL Chinese Theater in HollywoodIn 1H 2019, TCL R-series TVs were awarded by 26 third-party professional institutions (Forbes, CNET,
Digital Trends, tom's guide, gamesradar+, etc.), including the Best TV, Best 4K Ultra-HD TV, Best TV Deals.
TCL Brand TV Business in North America

19192019 Interim Results
TCL Brand TV Business in India
TV sales volume in the Indian market increased more than 200% YoY
Jointly built TCL's first integrated smart manufacturing industrial park with CSOT in overseas
According to GfK data, the current annual market size of Indian TVmarket is 12.50 million sets, which is only 1/4 of China TV market.Indian TV market has great potential in the future and enteringthe market is a significant strategic move for the Group’s
sustainable growth in overseas markets.
TCL TV entered the Indian market in 2016 and currently coversabout 3,000 offline outlets and multiple online channels, including:
1H 2019 1H 2018
TV sales volume in the Indian market increased by 216.8% YoY
Indian Market-Andhra Pradesh
By entering the Indian market with CSOT, TCL Electronics will further exert great
advantages of whole industrial chain. All-rounded coverage from production to
sales enhances its integrated competitiveness in the Indian market.
Annual production capacity of 8 million large-sized TV screens, 30 millionsmall-sized mobile screens and 6 million 32-inch to 65-inch TV sets
Serves the TCL brand and provides ODM services to other brands rooted inthe Indian market.
TCL India
Integrated Smart Manufacturing Industrial Park
20202019 Interim Results
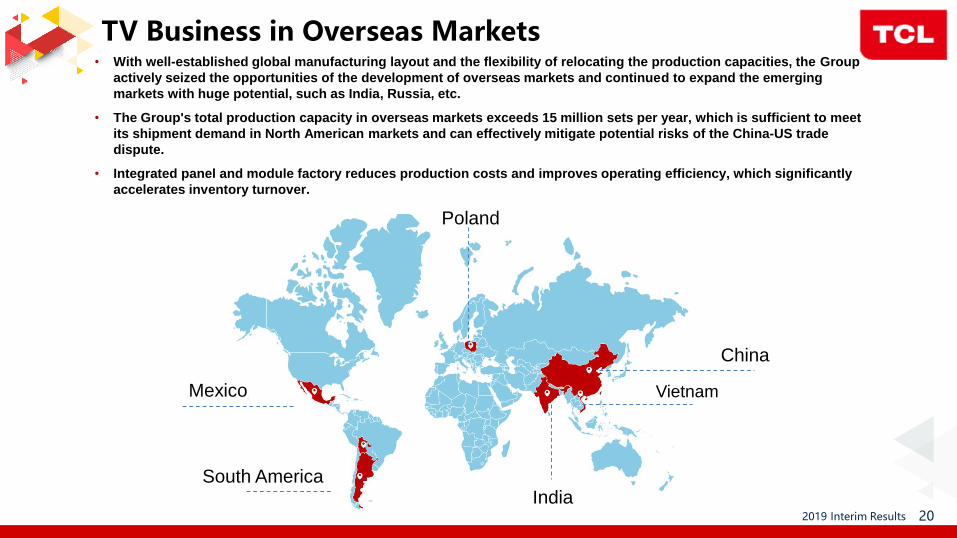
• With well-established global manufacturing layout and the flexibility of relocating the production capacities, the Group
actively seized the opportunities of the development of overseas markets and continued to expand the emerging
markets with huge potential, such as India, Russia, etc.
• The Group's total production capacity in overseas markets exceeds 15 million sets per year, which is sufficient to meet
its shipment demand in North American markets and can effectively mitigate potential risks of the China-US trade
dispute.
• Integrated panel and module factory reduces production costs and improves operating efficiency, which significantly
accelerates inventory turnover.
VietnamMexico
South America
Poland
India
China
TV Business in Overseas Markets

21212019 Interim Results
83.4%
58.0%
43.4%
81.5%
53.2%
42.7%
Smart TV
4K
55-inch and above
large-size screen
+4.8 p.p.
47.1 Average size (inch)
47.6
1H 2019 1H 2018 Change
Sales volume (‘000 sets) 3,237 3,027 +6.9%
-Proportion of online sales 37.7% 35.0% +2.7 p.p.
Turnover (HK$ million)* 6,218 7,308 (14.9%)
Gross profit margin 24.3% 23.5% +0.8 p.p.
Sales volume: According to the CMM's report, the industry retail sales volume of the PRC TV market in the 1H 2019 decreasedby 4.3% YoY, while the the Group’s sales volume increased by 6.9% YoY.
➢ Sales volume of super-large TV over 65-inch increased rapidly, up by 114.6% YoY.
➢ The proportion of online sales volume increased from 35.0% in 1H 2018 to 37.7% in 1H 2019.
Turnover: The turnover was HK$6.22 billion.
Gross profit margin: In 1H 2019, the gross profit margin was 24.3%, up by 0.8 p.p. YoY, and up by 1.6 p.p. QoQ to 25.3% in2019Q2. The operating result recorded quarter-on-quarter growth.
Proportion and average size of high-end products
+0.7 p.p.
+0.5 inch
1H 18
1H 19
1H 18
1H 19
Committed to premium product strategy, sales volume growth outperformed the market, the proportion of online sales continued to increase.
+1.9 p.p.
• In 1H 2019, the average exchange rate of RMB against HK$ dropped by 5.7% YoY. The Group's financial statements are presented in HK$.
The exchange rate has certain impact on the turnover.
TCL Brand TV Business in the PRC Market
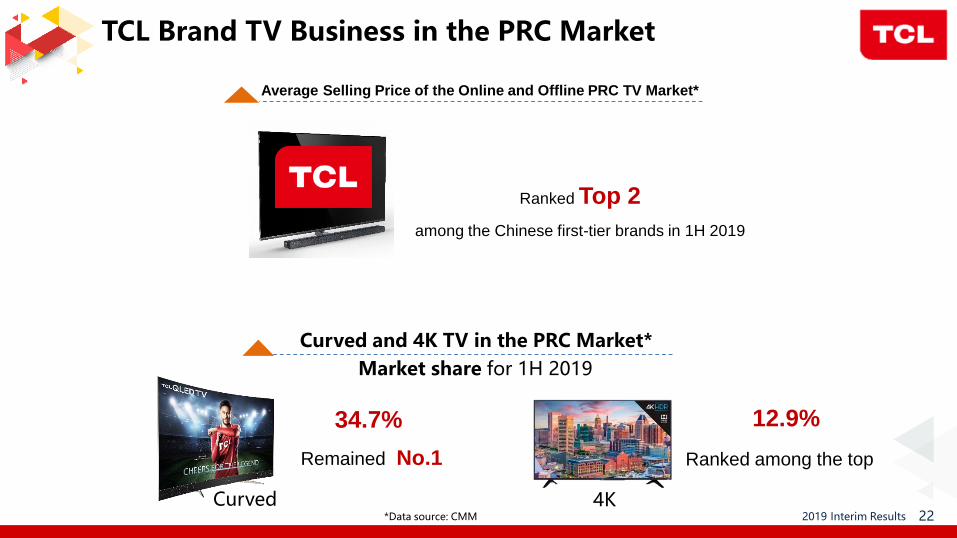
22222019 Interim Results
Average Selling Price of the Online and Offline PRC TV Market*
Curved and 4K TV in the PRC Market*
Market share for 1H 2019
Remained No.1
34.7%
*Data source: CMM
12.9%
Ranked among the top
Curved 4K
Ranked Top 2
among the Chinese first-tier brands in 1H 2019
TCL Brand TV Business in the PRC Market
23232019 Interim Results
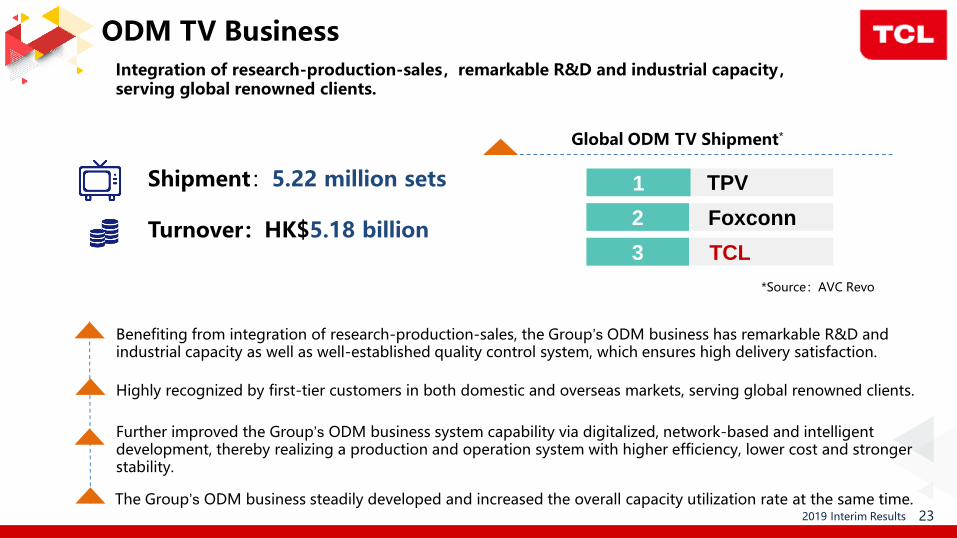
ODM TV Business
Global ODM TV Shipment*
1
2
3
Foxconn
TCL
TPV
*Source:AVC Revo
Benefiting from integration of research-production-sales, the Group’s ODM business has remarkable R&D and industrial capacity as well as well-established quality control system, which ensures high delivery satisfaction.
Further improved the Group’s ODM business system capability via digitalized, network-based and intelligent development, thereby realizing a production and operation system with higher efficiency, lower cost and stronger stability.
Highly recognized by first-tier customers in both domestic and overseas markets, serving global renowned clients.
The Group’s ODM business steadily developed and increased the overall capacity utilization rate at the same time.
Integration of research-production-sales,remarkable R&D and industrial capacity,serving global renowned clients.
Shipment:5.22 million sets
Turnover:HK$5.18 billion

24242019 Interim Results
①Products Business
②Application Services
Business Review
C6
25252019 Interim Results
29.3%
27.1%
27.5%
16.1%
Advertising business
Video-on-demand and Membership
Overseas Internet Business
Others
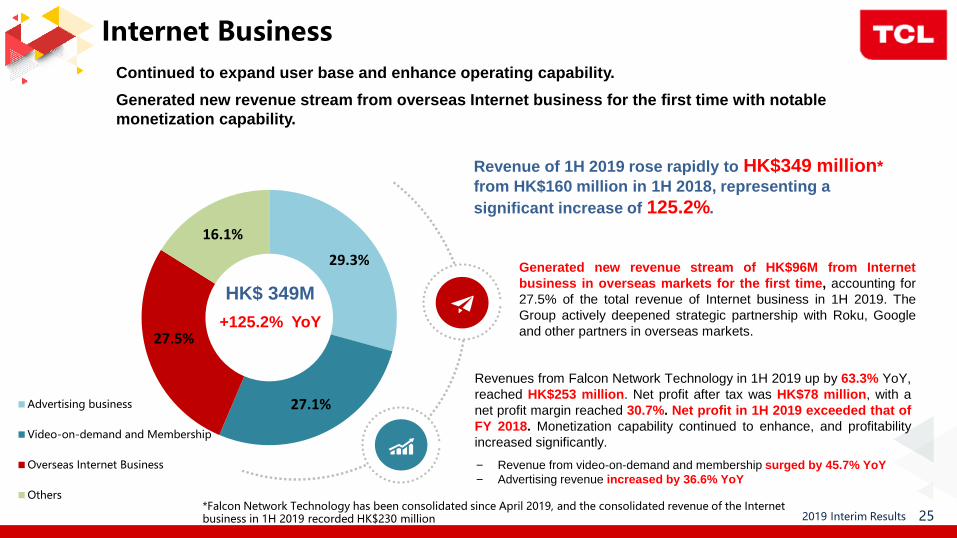
Internet Business
Revenue of 1H 2019 rose rapidly to HK$349 million*
from HK$160 million in 1H 2018, representing a
significant increase of 125.2%.
Continued to expand user base and enhance operating capability.
Generated new revenue stream from overseas Internet business for the first time with notable
monetization capability.
− Revenue from video-on-demand and membership surged by 45.7% YoY
− Advertising revenue increased by 36.6% YoY
Generated new revenue stream of HK$96M from Internet
business in overseas markets for the first time, accounting for
27.5% of the total revenue of Internet business in 1H 2019. The
Group actively deepened strategic partnership with Roku, Google
and other partners in overseas markets.
Revenues from Falcon Network Technology in 1H 2019 up by 63.3% YoY,
reached HK$253 million. Net profit after tax was HK$78 million, with a
net profit margin reached 30.7%. Net profit in 1H 2019 exceeded that of
FY 2018. Monetization capability continued to enhance, and profitability
increased significantly.
HK$ 349M
+125.2% YoY
*Falcon Network Technology has been consolidated since April 2019, and the consolidated revenue of the Internet business in 1H 2019 recorded HK$230 million
26262019 Interim Results
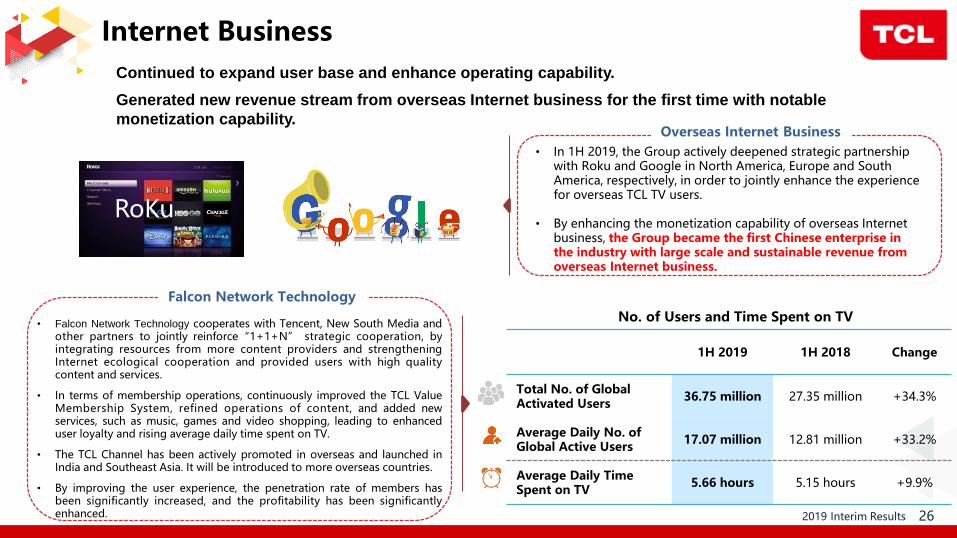
No. of Users and Time Spent on TV
1H 2019 1H 2018 Change
Total No. of GlobalActivated Users
36.75 million 27.35 million +34.3%
Average Daily No. of Global Active Users
17.07 million 12.81 million +33.2%
Average Daily Time Spent on TV
5.66 hours 5.15 hours +9.9%
• Falcon Network Technology cooperates with Tencent, New South Media andother partners to jointly reinforce“1+1+N” strategic cooperation, byintegrating resources from more content providers and strengtheningInternet ecological cooperation and provided users with high qualitycontent and services.
• In terms of membership operations, continuously improved the TCL ValueMembership System, refined operations of content, and added newservices, such as music, games and video shopping, leading to enhanceduser loyalty and rising average daily time spent on TV.
• The TCL Channel has been actively promoted in overseas and launched inIndia and Southeast Asia. It will be introduced to more overseas countries.
• By improving the user experience, the penetration rate of members hasbeen significantly increased, and the profitability has been significantlyenhanced.
• In 1H 2019, the Group actively deepened strategic partnershipwith Roku and Google in North America, Europe and South America, respectively, in order to jointly enhance the experience for overseas TCL TV users.
• By enhancing the monetization capability of overseas Internet business, the Group became the first Chinese enterprise in the industry with large scale and sustainable revenue from overseas Internet business.
RoKu
Falcon Network Technology
Overseas Internet Business
Internet Business
Continued to expand user base and enhance operating capability.
Generated new revenue stream from overseas Internet business for the first time with notable
monetization capability.

27272019 Interim Results
Business Diversification & AI x IoT Strategy
Reinforcing and upgrading its existing TV business while proactively expandingdiversified business, including Smart AV, Commercial Display and Smart Homebusinesses to open up new business growth opportunities.
Diversification Strategy Implemented in an Orderly Manner
Established TCL Entertainment Solutions
Limited (TES) to penetrate Smart AV
Market
- In 2019Q1, TCL brand earphones were
introduced to the U.S. market, which
were highly recognized. Sound bars
were also launched in the U.S. and
European markets and its ranking rose
rapidly
Self-developed smart home system based on
smart TV; manage and control all smart
household devices through interconnection
− T-Home: TCL Smart TV acts as a core access to a
various-range and multi-brand IoT platform. Smart door
lock, Smart security and smart control product have
been launched
− T-Lodge: For the hotel and apartment scenarios, the
SaaS enterprise cloud platform was built initially.
− T-Life: High-end XESS personal care products have
been launched in the market
TMALL No.3
JD.com No.4
SOCL100
Smart AV Commercial Display Smart Home
Broaden its business model from home
television (B2C) to commercial display
(B2B)
− Intelligentized smart terminal products
to improve the interactive experiences
between users and products
− New intelligent conference system
has been launched
28282019 Interim Results
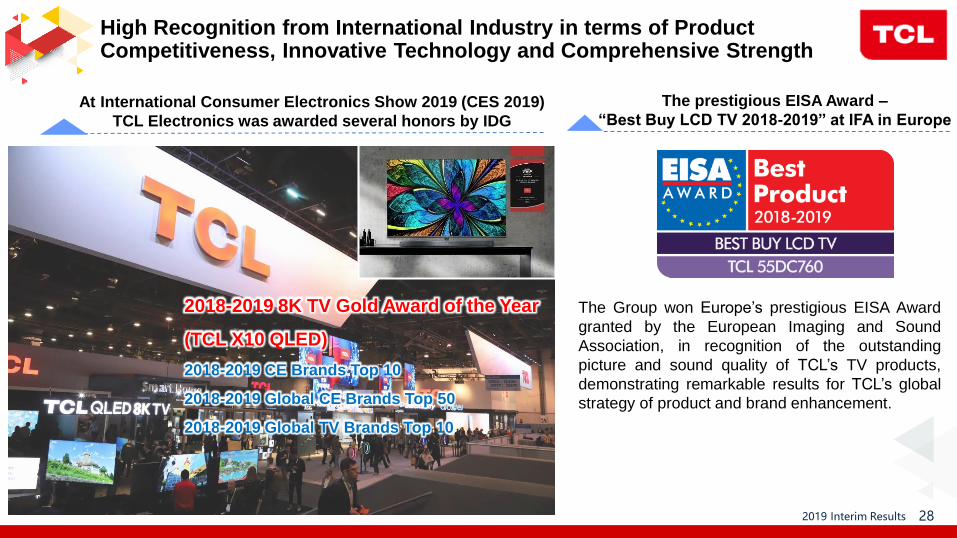
High Recognition from International Industry in terms of Product Competitiveness, Innovative Technology and Comprehensive Strength
2018-2019 8K TV Gold Award of the Year
(TCL X10 QLED)
2018-2019 CE Brands Top 10
2018-2019 Global CE Brands Top 50
2018-2019 Global TV Brands Top 10
The Group won Europe’s prestigious EISA Award
granted by the European Imaging and Sound
Association, in recognition of the outstanding
picture and sound quality of TCL’s TV products,
demonstrating remarkable results for TCL’s global
strategy of product and brand enhancement.
At International Consumer Electronics Show 2019 (CES 2019)
TCL Electronics was awarded several honors by IDG
The prestigious EISA Award –
“Best Buy LCD TV 2018-2019” at IFA in Europe

29292019 Interim Results
Neymar Appointed as TCL’s
Global Brand Ambassador
Sponsorship for
Brazil National Football Team
Appointed NBA Milwaukee Bucks Player—Giannis Antetokounmpo
(The Alphabet) as the Brand Ambassador for TCL in North America
Football
Basketball
Partnership with CONMEBOL
Copa América Brazil 2019
Officially Became the Global Partner of the
2019 FIBA Basketball World Cup
Sports Marketing Promotes Global Brand Building
30302019 Interim Results
C3Outlook
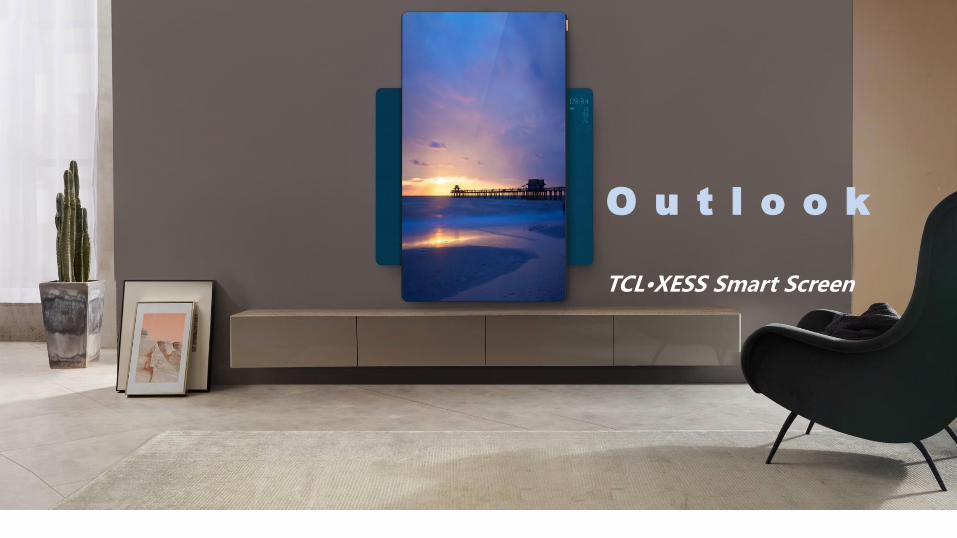
C6O u t l o o k
TCL•XESS Smart Screen
31312019 Interim Results
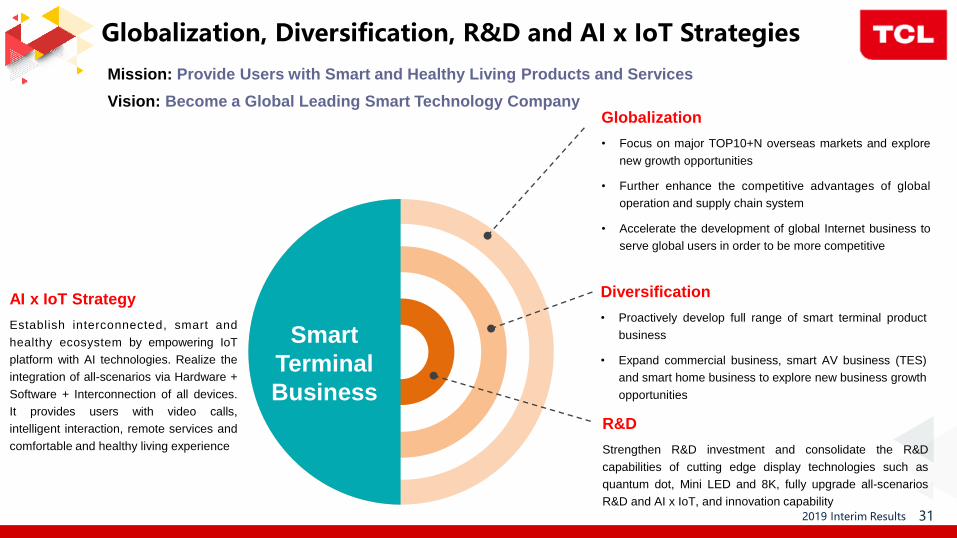
AI x IoT Strategy
Establish interconnected, smart and
healthy ecosystem by empowering IoT
platform with AI technologies. Realize the
integration of all-scenarios via Hardware +
Software + Interconnection of all devices.
It provides users with video calls,
intelligent interaction, remote services and
comfortable and healthy living experience
Smart
Terminal
Business
Diversification
• Proactively develop full range of smart terminal product
business
• Expand commercial business, smart AV business (TES)
and smart home business to explore new business growth
opportunities
Globalization
• Focus on major TOP10+N overseas markets and explore
new growth opportunities
• Further enhance the competitive advantages of global
operation and supply chain system
• Accelerate the development of global Internet business to
serve global users in order to be more competitive
R&D
Strengthen R&D investment and consolidate the R&D
capabilities of cutting edge display technologies such as
quantum dot, Mini LED and 8K, fully upgrade all-scenarios
R&D and AI x IoT, and innovation capability
Mission: Provide Users with Smart and Healthy Living Products and Services
Vision: Become a Global Leading Smart Technology Company
Globalization, Diversification, R&D and AI x IoT Strategies

32322019 Interim Results
Breaking boundaries, creating value through integration
➢ Hardware + software + interconnection of all devices and integration of various scenarios represent AI x IoT products for a new era
➢ The combination of different users' demands, functionality of IoT devices and AI capabilities will create exponential growth opportunities
The Triple Curve
M a n u f a c t u r i n g
S c a l e
S m a r t
I n t e r n e tA I x I o T
Hardware Hardware+So f twa re
Hardware + So f twa re+In te rconnec t i on + I n teg ra t i on
Solu t ions for
In terconnect ion
and In tegra t ionStep Forward to
Key Ent rance o f
In ternet F low
Manufac tur ing
Ef f i c iency
F u n c t i o n a l i t y /
Re l i a b i l i t y
Co n t e n t
Ap p l i ca t i on
I n t e r co n ne c t i o n
& I n t e g r a t i o n
AI × IoTAI + IoTFrom to
AI- e mp o we re d Ha rd wa re
AI- e mp o w e re d Ex c ha ng e
AI - e mp o w e re d Re s p o ns e
Us e rs ’ De ma nd
×
Io T De vi c e F unc t i onal i ty
×
AI Ca p a b i l i ty
AI
Integrat ion
TCL Full Spectrum AI
Al l Aspec ts
AI-empowered
Al l People
AI In terconnect ion
A l l o f the T ime
AI Response
Al l A reas o f
the Home AI
In tegra t ion
AI x loT Strategies

33332019 Interim Results
Scale Up
Raise Profitability
Market Expansion
Reinforce a d v a n t a g e s of
existing markets and actively
explore new markets (India,
Japan, Russia, etc.)
Strengthening Supply Chain
Further increase the production
capacity of Mexican factories
and set up new factories in
Vietnam and India
Contents and Services Expansion
Further deepen cooperation with
global content providers and
improve the integration of overseas
content resources
Overseas business has become a key driver and maintained strong growth momentum
Further enhance the competitive advantages of globalized business and supply chain
system, and actively strengthen the cooperation between content and services to
obtain new competitive advantages.
Deepen Globalization Strategies

34342019 Interim Results
Enrich user experience, increase the proportion of users of paid
business, explore overseas income from Internet business and enhance
the monetization capability of global Internet business
Hardware + software + service, optimize profit structure, create value
Future
Smart terminal products + Software +
Service profit structure
Components of Profit Growth
Internet business platform
Smart Home
A platform for various range of Smart products and services based on
artificial intelligence (AI) and Cloud Interconnection.
Commercial Information Technology
Leveraging on leading commercial display technologies of software
and systems with B2B, Internet of Things (IoT), AI, Cloud
Applications and Big Data, etc. to provide one-stop customized
service covering software, content and intelligent products
Smart Terminal Products
Consolidate and enhance TV business and develop Smart AV
market
Hardware
Software &
Service
Present
Ecosystem
Value
Product
Value
Continuously Accelerating Transformation through
Diversification Strategy

35352019 Interim Results
Industry – Global TV Market Forecast
*Source: TCL Industrial Research Institute
2017A 2018A 2019E
42.5” 43.6” 45.0”
Average
Size*
Forecasts 8%* YoY growth in TV dimension of global shipment in 2019
-0.7%
Strong Demand in Certain Regions
2.0 1.7 1.7
1.3 0.9
0.7 0.3 0.3
North
America
Western
Europe
Japan Latin
America
Eastern
Europe
PRC Mid-Eastern
Africa
Emerging
Markets
Only 80% of global households owned TVs in 2018
Panel TV(excluding CRT)average ownership (set) *
TCL overseas sales volume of LCD TVs soared by
34.5% in 1H 2019, significantly outpacing the global
average
✓ North America : +75.0% YoY
✓ Emerging Markets : +28.8% YoY
✓ European : +20.7% YoY
With the continuous enhancement in product
competitiveness and brand power, TCL expects to
sustain strong growth in overseas markets and
increase its global market share.
36362019 Interim Results
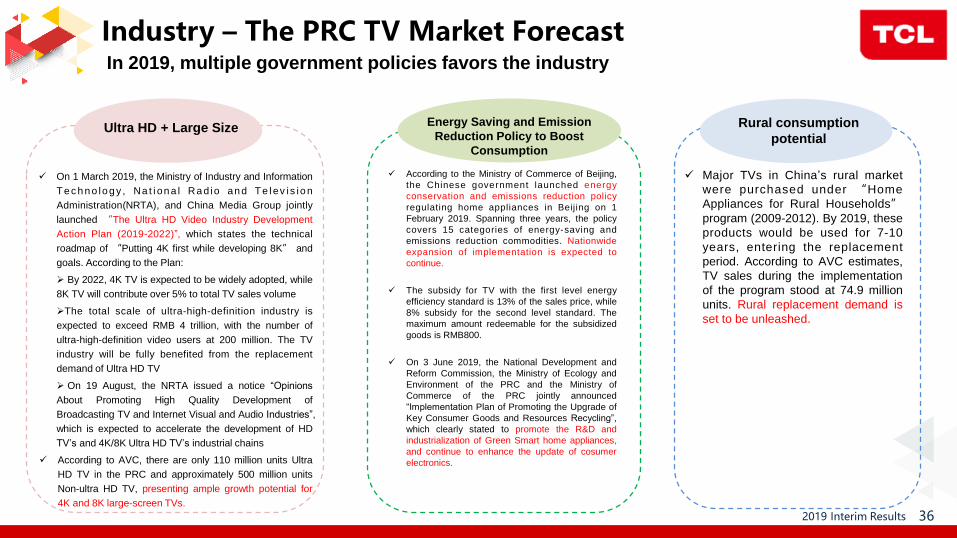
In 2019, multiple government policies favors the industry
Ultra HD + Large Size
✓ On 1 March 2019, the Ministry of Industry and Information
Te c h n o lo g y , Na t i on a l Ra d io an d Te l ev is io n
Administration(NRTA), and China Media Group jointly
launched “The Ultra HD Video Industry Development
Action Plan (2019-2022)”, which states the technical
roadmap of “Putting 4K first while developing 8K” and
goals. According to the Plan:
➢ By 2022, 4K TV is expected to be widely adopted, while
8K TV will contribute over 5% to total TV sales volume
➢The total scale of ultra-high-definition industry is
expected to exceed RMB 4 trillion, with the number of
ultra-high-definition video users at 200 million. The TV
industry will be fully benefited from the replacement
demand of Ultra HD TV
➢ On 19 August, the NRTA issued a notice “Opinions
About Promoting High Quality Development of
Broadcasting TV and Internet Visual and Audio Industries”,
which is expected to accelerate the development of HD
TV’s and 4K/8K Ultra HD TV’s industrial chains
✓ According to AVC, there are only 110 million units Ultra
HD TV in the PRC and approximately 500 million units
Non-ultra HD TV, presenting ample growth potential for
4K and 8K large-screen TVs.
Energy Saving and Emission
Reduction Policy to Boost
Consumption
✓ According to the Ministry of Commerce of Beijing,
the Chinese government launched energy
conservation and emissions reduction policy
regulating home appliances in Beijing on 1
February 2019. Spanning three years, the policy
covers 15 categories of energy-saving and
emissions reduction commodities. Nationwide
expansion of implementation is expected to
continue.
✓ The subsidy for TV with the first level energy
efficiency standard is 13% of the sales price, while
8% subsidy for the second level standard. The
maximum amount redeemable for the subsidized
goods is RMB800.
✓ On 3 June 2019, the National Development and
Reform Commission, the Ministry of Ecology and
Environment of the PRC and the Ministry of
Commerce of the PRC jointly announced
“Implementation Plan of Promoting the Upgrade of
Key Consumer Goods and Resources Recycling”,
which clearly stated to promote the R&D and
industrialization of Green Smart home appliances,
and continue to enhance the update of cosumer
electronics.
Rural consumption
potential
✓ Major TVs in China’s rural market
were purchased under “Home
Appliances for Rural Households”program (2009-2012). By 2019, these
products would be used for 7-10
years, entering the replacement
period. According to AVC estimates,
TV sales during the implementation
of the program stood at 74.9 million
units. Rural replacement demand is
set to be unleashed.
Industry – The PRC TV Market Forecast

37372019 Interim Results
Internet Business 1H 2018 Actual 1H 2019 Actual 2019 FY Target
Internet service revenue (HK$) 160M 349M 500M+
No. of TCL Global Activated Smart TV Users (Accumulated No. at Period
End)(Year-end/Quarter-end)1 27.35M 36.75M 40M
Average Daily Time Spent on TV (hours) 5.15 5.66 5.7
1. No. of TCL Activated Smart TV Users (Accumulated No. at Period End) = Accumulated No. of Activated TV Terminals
1H 2019 Actual 2019 FY Target
Overall
TCL Brand
TV Business
in the PRC
Market
TCL Brand TV
Business in
Overseas
Markets
ODM
BusinessOverall
TCL Brand TV
Business in
the PRC
Market
TCL Brand TV
Business in
Overseas
Markets
ODM
Business
TV Sales Volume (sets)15.53M
17.9%
3.24M
6.9%
7.07M
49.8%
5.22M
3.9%
32.00M
12%
7.20M
2.4%
13.50M
26.4%
11.30M
3.7%
Turnover (HK$)22.72B
8.0%
6.22B
14.9%
10.77B
32.5%5.18B
51.0B
12%
Profit attributable to owners of
the parent after deducting
one-time non-operating gain
554M
32.9%
The growth rate of operating profitability in 2H 2019
will exceed that of 1H 2019
1H 2019 Implementation Status and FY2019 Targets
38382019 Interim Results
Globalization Strategy and Leading Position in Overseas Markets
• Overall shipments ranked global top 2
• Sales volume of TCL brand TV ranked global top 3
• Overseas shipment remained No. 1 among Chinese TV brands for 10
consecutive years
• Cooperate with Roku and Google to deepen partnership in Internet business
and jointly enhance the experience for overseas TCL TV users
• The first Chinese company in the TV industry with large-scale and sustainable
revenue from overseas Internet business
• Realize synergy effect with CSOT in panel, module and assembly, become the
only Chinese company with a complete vertically integrated industrial chain
• Manufacturing bases in PRC, Mexico, Poland, Vietnam, India and South
America, establishing globalized industrial capacities
Vertically Integrated Industrial Chain
Product Innovation and Advantage of Internet TV Content
• Faster speed of innovation: Cutting edge display technologies such as quantum
dots(QLED), Mini LED and 8K, exclusive Q Engine for high quality audio and picture.
Accelerating the development of artificial intelligence and smart home
• Product mix: TCL TV has won lots of prestigious awards, including EISA Award,
CES Award and received high scores from many esteemed third-party websites
• Abundant Internet TV content: Self-developed and operating smart TV system,
building a smart TV platform of premium content to serve global users
Lower Operating Costs and Higher Efficiency
• The synergy effect of panel and smart TV manufacturing creates high efficiency and
stable supply of large sizes screen
• Intelligent factory and automated manufacturing reduce costs and enhance the
production efficiency
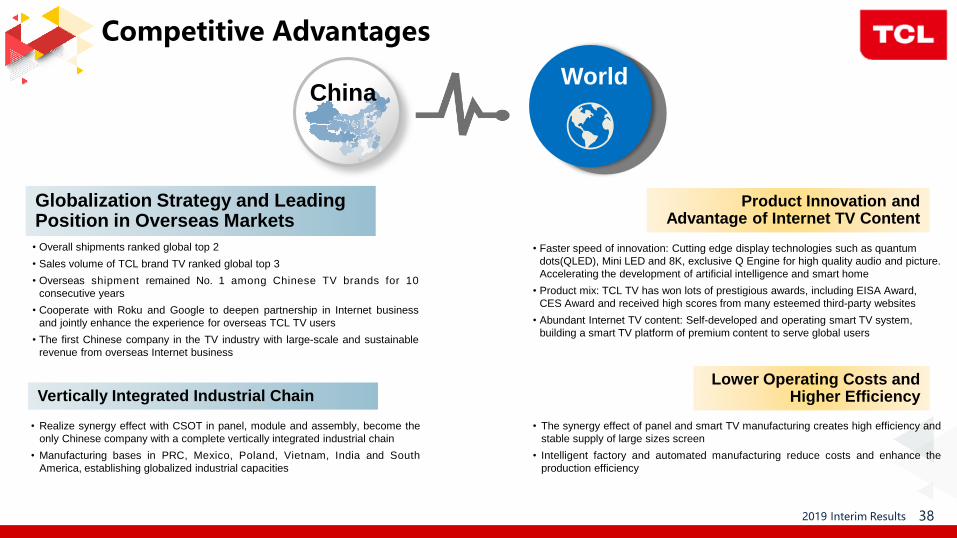
ChinaWorld
Competitive Advantages

39392019 Interim Results
⚫ The information contained herein should not be utilised for any legal purposes with regards to
any investor's investment decision or results. In particular, this document does not constitute
any recommendation or invitation for subscribing for or sale and purchase of any securities in
TCL Electronics Holdings Limited (the “Company”). The Company hereby expressly disclaims
any liability for any loss or damage resulting from or in connection with any reliance by any
investor on the information contained herein.
⚫ A number of forward-looking statements may be made from this presentation. Forward-looking
statements are statements that are not historical facts. These forward-looking statements are
based on the current expectations of the Company and there can be no assurance that such
expectations will prove to be correct. Because forward-looking statements involve risks and
uncertainties, the Company’s actual results could differ materially from these statements.
Disclaimer