
Sxsw presentation
30
www.kauffman.org © 2013 Ewing Marion Kauffman Foundation Measuring Entrepreneurial Ecosystems March 16, 2015 Jordan Bell-Masterson Colin Tomkins-Bergh
-
Upload
jordan-bell-masterson -
Category
Data & Analytics
-
view
358 -
download
1
Transcript of Sxsw presentation
© 2013 Ewing Marion Kauffman Foundation
www.kauffman.org© 2013 Ewing Marion Kauffman Foundation
Measuring Entrepreneurial Ecosystems
March 16, 2015Jordan Bell-Masterson
Colin Tomkins-Bergh
© 2013 Ewing Marion Kauffman Foundation
Indicators of Entrepreneurial Ecosystem Vibrancy
Kauffman synthesis of leading research to answer the question:
What do we measure and how do we measure it?
Why? To gauge progress, inform program design, and to guide resource and funding decisions
© 2013 Ewing Marion Kauffman Foundation
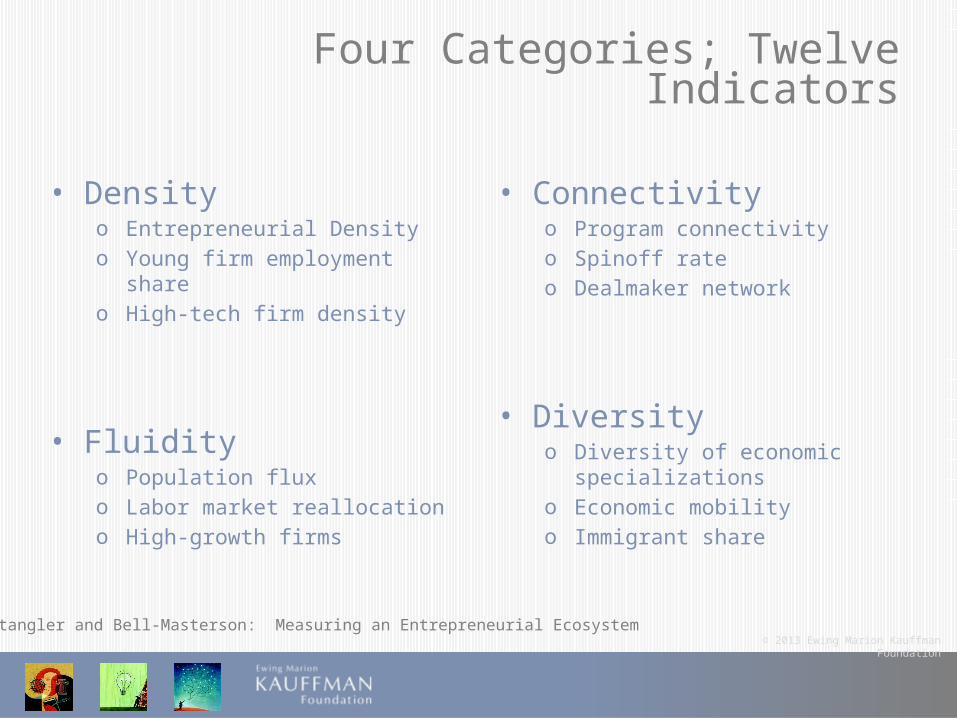
Four Categories; Twelve Indicators
• Connectivityo Program connectivityo Spinoff rateo Dealmaker network
• Diversityo Diversity of economic
specializationso Economic mobilityo Immigrant share
• Densityo Entrepreneurial Densityo Young firm employment shareo High-tech firm density
• Fluidityo Population fluxo Labor market reallocationo High-growth firms
Stangler and Bell-Masterson: Measuring an Entrepreneurial Ecosystem
© 2013 Ewing Marion Kauffman Foundation
Density
• We want to measure density, not volumeo By e.g., population, geography
• For example, Boulder is small, but clearly punching above its weight
© 2013 Ewing Marion Kauffman Foundation
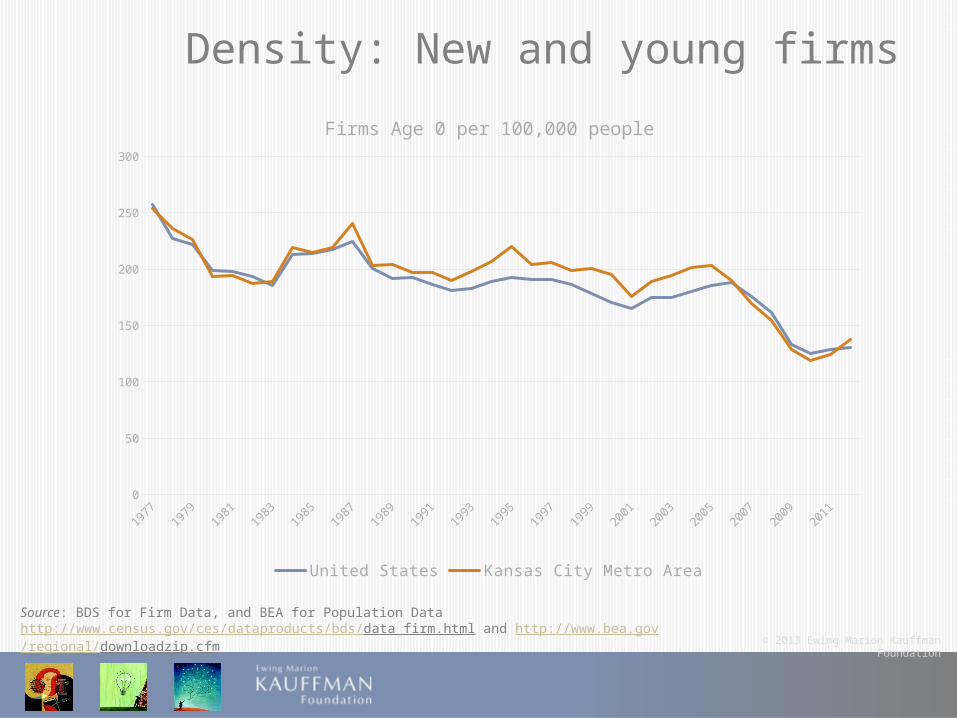
Density: New and young firms
1977
1978
1979
1980
1981
1982
1983
1984
1985
1986
1987
1988
1989
1990
1991
1992
1993
1994
1995
1996
1997
1998
1999
2000
2001
2002
2003
2004
2005
2006
2007
2008
2009
2010
2011
2012
0
50
100
150
200
250
300
Firms Age 0 per 100,000 people
United States Kansas City Metro Area
Source: BDS for Firm Data, and BEA for Population Datahttp://www.census.gov/ces/dataproducts/bds/data_firm.html and http://www.bea.gov/regional/downloadzip.cfm
© 2013 Ewing Marion Kauffman Foundation
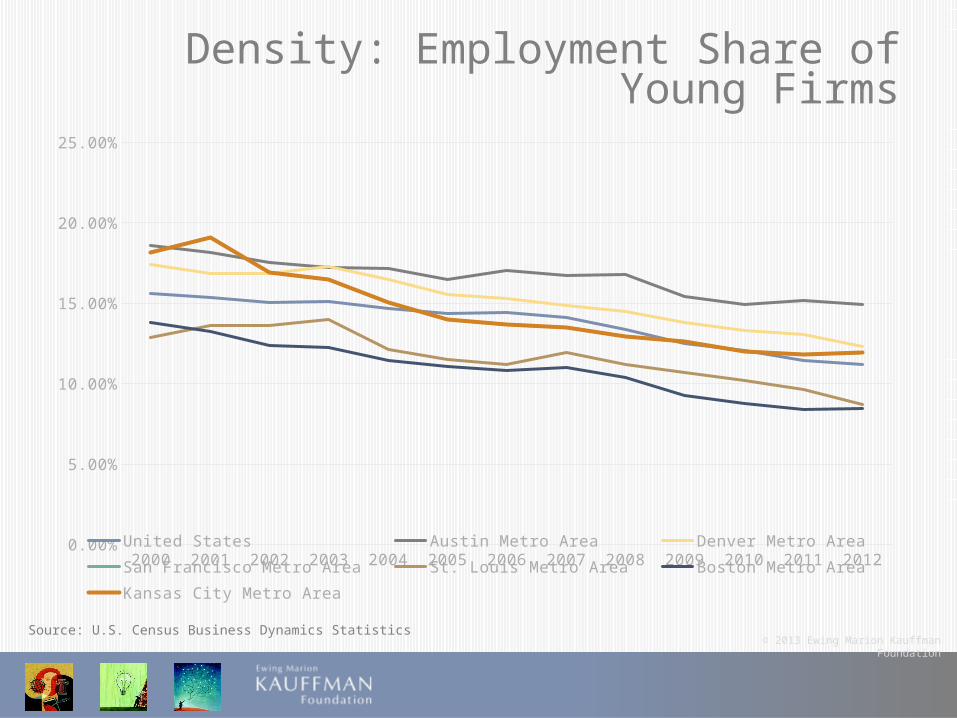
Density: Employment Share of Young Firms
Source: U.S. Census Business Dynamics Statistics
2000 2001 2002 2003 2004 2005 2006 2007 2008 2009 2010 2011 20120.00%
5.00%
10.00%
15.00%
20.00%
25.00%
United States Austin Metro Area Denver Metro Area San Francisco Metro Area
St. Louis Metro Area Boston Metro Area Kansas City Metro Area
© 2013 Ewing Marion Kauffman Foundation
Density: High-Tech
Kansas City has a high-tech firm creation rate of 11.188, which ranks 36 out of 365 metros.1
o High-tech = IT, biotech, and advanced manufacturing (per Hecker (2005), Bureau of Labor Statistics)
Source: Kauffman Foundationhttp://www.kauffman.org/~/media/kauffman_org/research%20reports%20and%20covers/2014/01/beyond_metropolitan_startup_rates.pdf
1 Using NETS high-tech over 2009-2010;Averaged over 2 years, then per 100,000 population
© 2013 Ewing Marion Kauffman Foundation
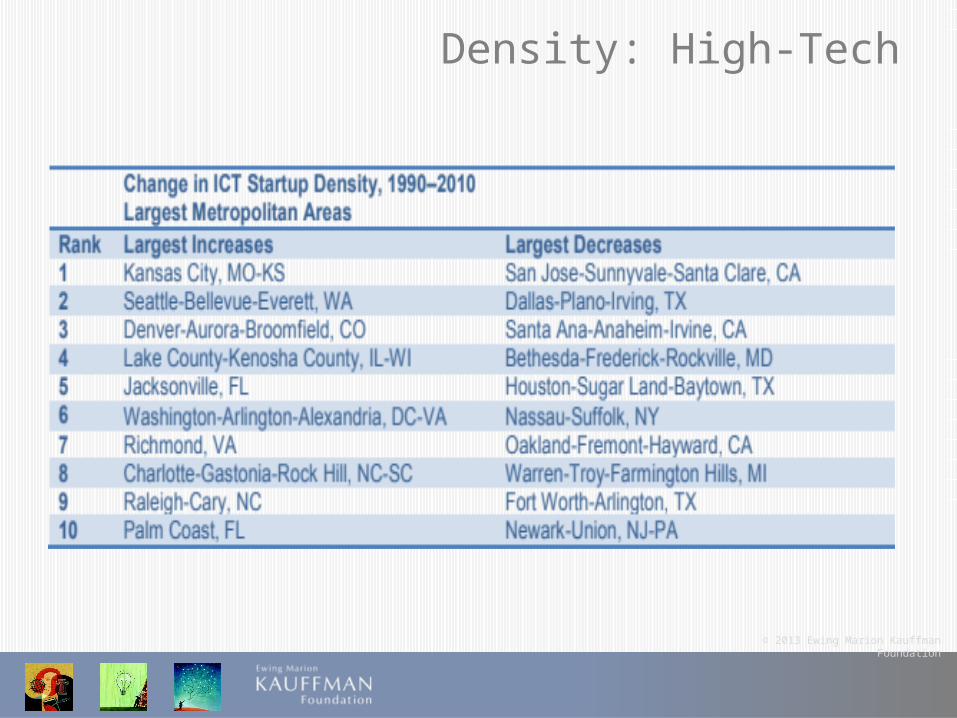
Density: High-Tech
© 2013 Ewing Marion Kauffman Foundation
Fluidity
• Reallocation – the process by which a resource becomes more and more efficiently deployedo E.g. Economic reallocation, demographic reallocation
• Perfect information only found in theory, so churn typically represents improvemento See Haltiwanger et al. (2012) for importance of labor market reallocation
© 2013 Ewing Marion Kauffman Foundation
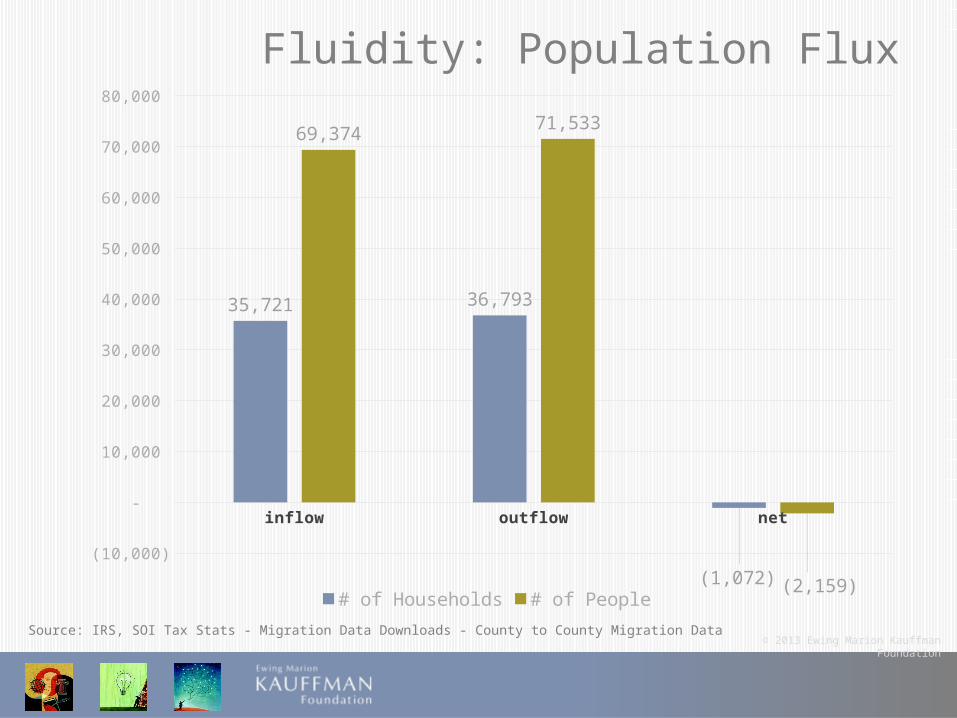
Fluidity: Population Flux
Source: IRS, SOI Tax Stats - Migration Data Downloads - County to County Migration Data
inflow outflow net
(10,000)
-
10,000
20,000
30,000
40,000
50,000
60,000
70,000
80,000
35,721 36,793
(1,072)
69,374 71,533
(2,159)# of Households # of People
© 2013 Ewing Marion Kauffman Foundation
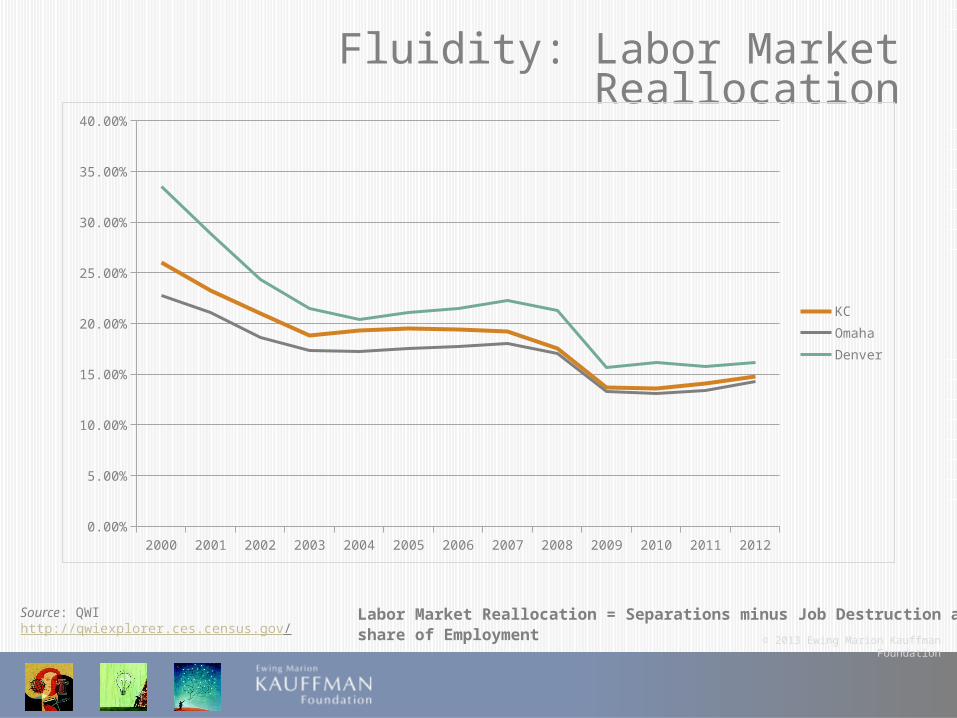
Fluidity: Labor Market Reallocation
Labor Market Reallocation = Separations minus Job Destruction as a share of EmploymentSource: QWIhttp://qwiexplorer.ces.census.gov/
2000 2001 2002 2003 2004 2005 2006 2007 2008 2009 2010 2011 20120.00%
5.00%
10.00%
15.00%
20.00%
25.00%
30.00%
35.00%
40.00%
KC
Omaha
Denver
© 2013 Ewing Marion Kauffman Foundation
Fluidity: High-Growth Firms
Kansas City has a high-growth firm creation rate of 24.846, which ranks 92nd out of 365 metros.1
1 Using Inc. high-growth companies over 2010-2012;Summed and divided by population in millions.
Source: Kauffman Foundationhttp://www.kauffman.org/~/media/kauffman_org/research%20reports%20and%20covers/2014/01/beyond_metropolitan_startup_rates.pdf
© 2013 Ewing Marion Kauffman Foundation
Connectivity
• Recipe, not just ingredientso How do entrepreneurs, investors, programs etc. get mixed?
• St. Louis example
© 2013 Ewing Marion Kauffman Foundation
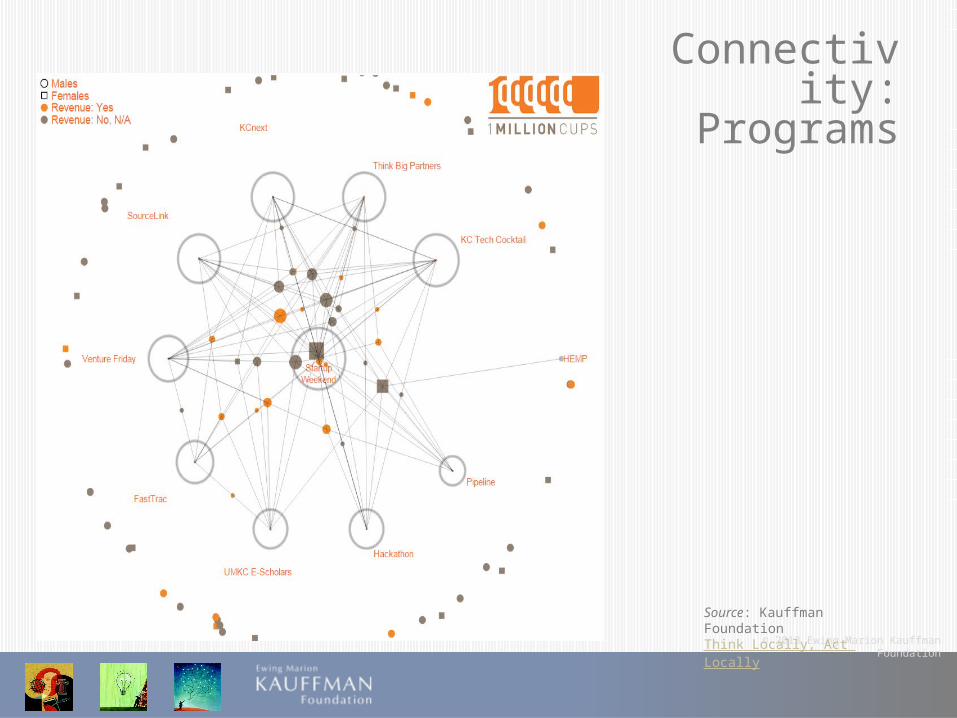
Connectivity:Programs
Source: Kauffman FoundationThink Locally, Act Locally
© 2013 Ewing Marion Kauffman Foundation
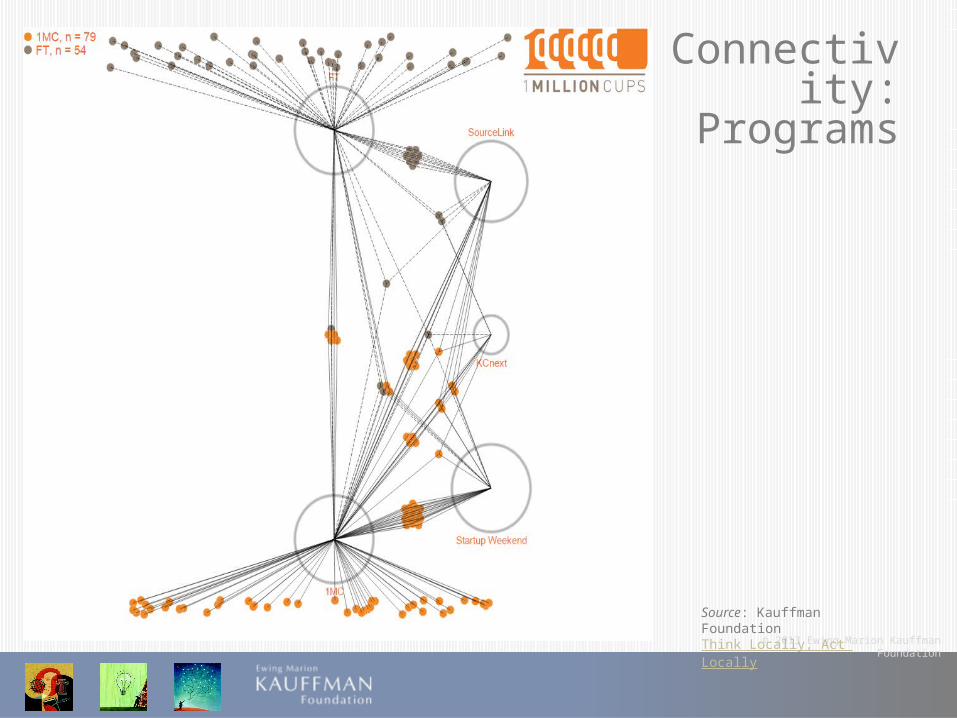
Source: Kauffman FoundationThink Locally, Act Locally
Connectivity:Programs
© 2013 Ewing Marion Kauffman Foundation
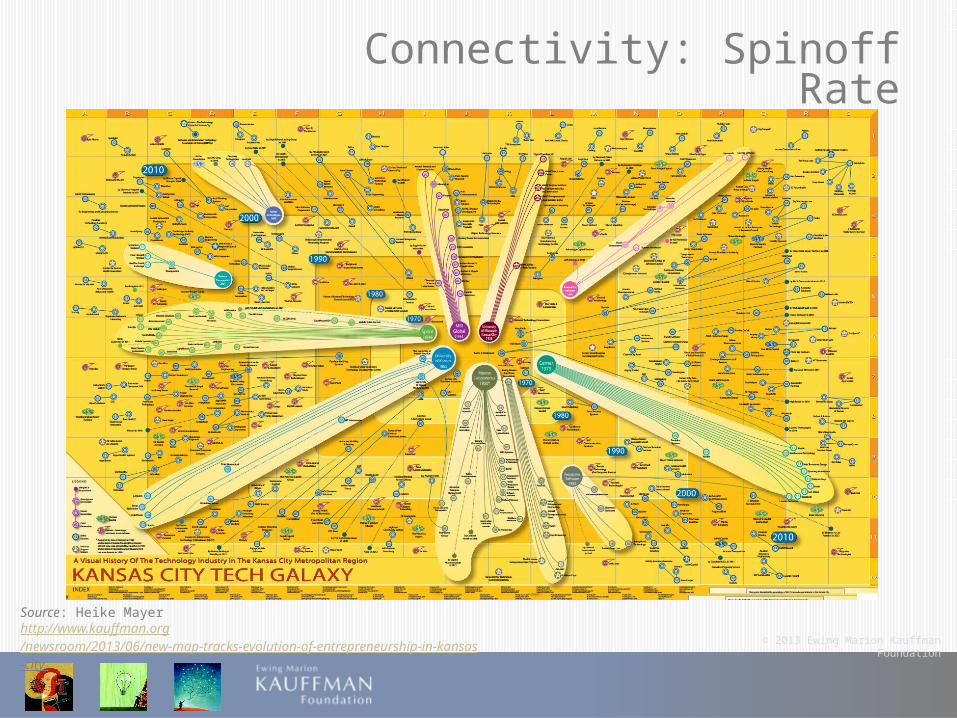
Connectivity: Spinoff Rate
Source: Heike Mayerhttp://www.kauffman.org/newsroom/2013/06/new-map-tracks-evolution-of-entrepreneurship-in-kansas-city
http://www.kauffman.org/newsroom/2013/06/new-map-tracks-evolution-of-entrepreneurship-in-kansas-city
http://www.kauffman.org/newsroom/2013/06/new-map-tracks-evolution-of-entrepreneurship-in-kansas-city
http://www.kauffman.org/newsroom/2013/06/new-map-tracks-evolution-of-entrepreneurship-in-kansas-city
© 2013 Ewing Marion Kauffman Foundation
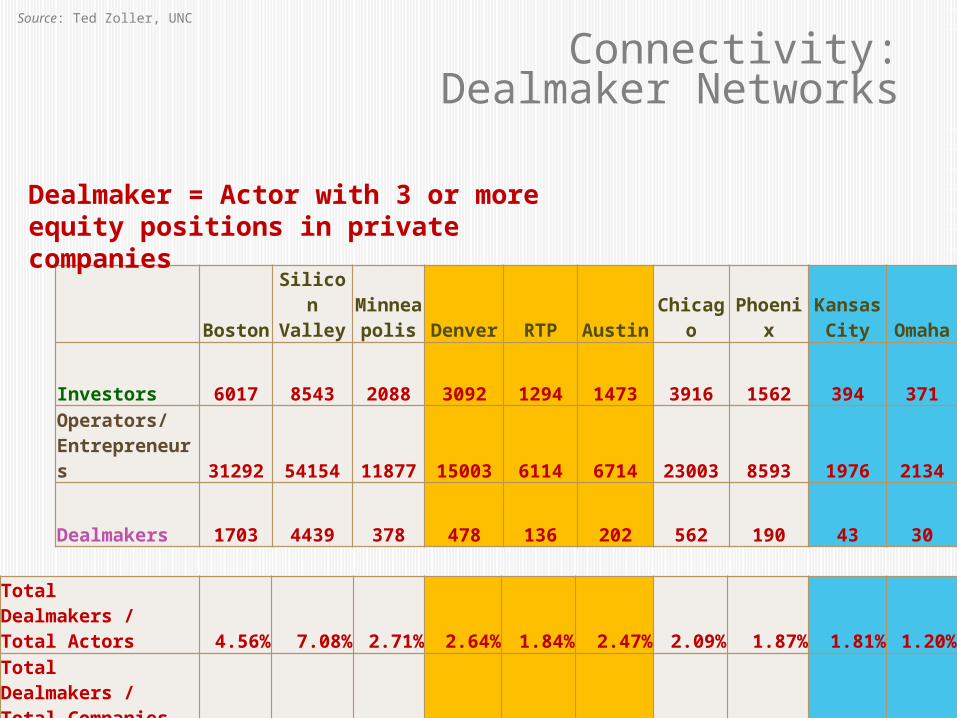
Connectivity:Dealmaker Networks
BostonSiliconValley
Minneapolis Denver RTP Austin Chicago Phoenix
Kansas City Omaha
Investors 6017 8543 2088 3092 1294 1473 3916 1562 394 371
Operators/ Entrepreneurs 31292 54154 11877 15003 6114 6714 23003 8593 1976 2134
Dealmakers 1703 4439 378 478 136 202 562 190 43 30
Total Dealmakers / Total Actors 4.56% 7.08% 2.71% 2.64% 1.84% 2.47% 2.09% 1.87% 1.81% 1.20%
Total Dealmakers /Total Companies 000s 136.9 226.3 56.6 68.4 50.3 68.6 39.9 33.1 25.1 21.8
Dealmaker = Actor with 3 or more equity positions in private companies
Source: Ted Zoller, UNC
© 2013 Ewing Marion Kauffman Foundation
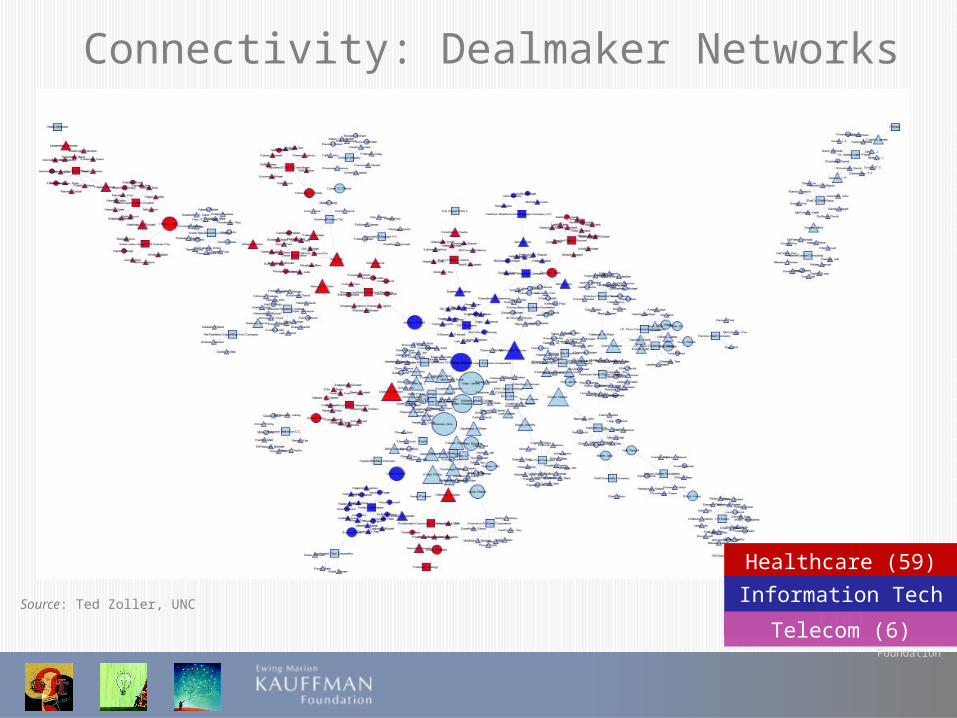
Connectivity: Dealmaker Networks
Healthcare (59)
Information Tech (44)Telecom (6)
Source: Ted Zoller, UNC
© 2013 Ewing Marion Kauffman Foundation
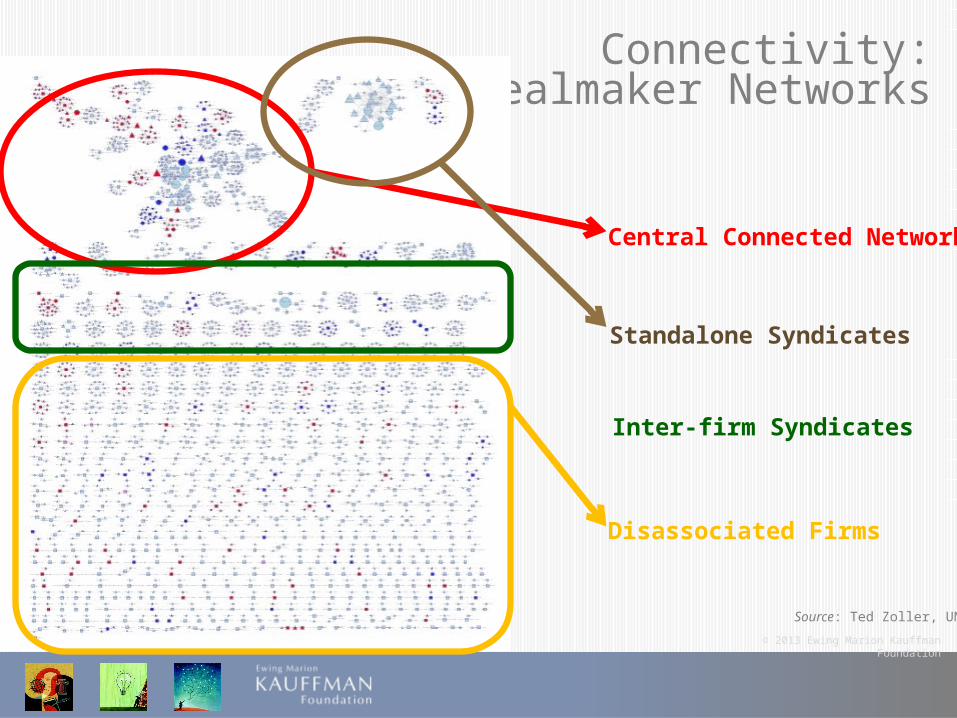
Connectivity:Dealmaker Networks
Central Connected Network
Standalone Syndicates
Inter-firm Syndicates
Disassociated Firms
Source: Ted Zoller, UNC
© 2013 Ewing Marion Kauffman Foundation
Diversity
• Avoid becoming a monocultureo E.g. Detroit vs. Seattle
• Both in terms of firm sectors, and types of people founding the firms
© 2013 Ewing Marion Kauffman Foundation
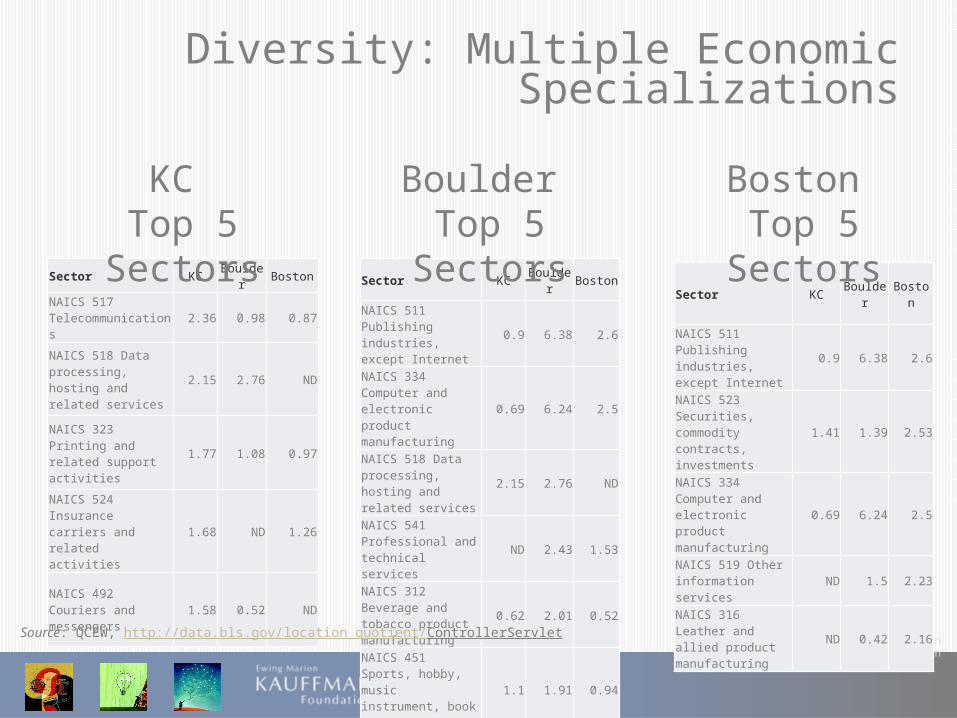
Diversity: Multiple Economic Specializations
Sector KC Boulder Boston
NAICS 517 Telecommunications
2.36 0.98 0.87
NAICS 518 Data processing, hosting and related services
2.15 2.76 ND
NAICS 323 Printing and related support activities
1.77 1.08 0.97
NAICS 524 Insurance carriers and related activities
1.68 ND 1.26
NAICS 492 Couriers and messengers
1.58 0.52 ND
Sector KCBoulde
rBoston
NAICS 511 Publishing industries, except Internet
0.9 6.38 2.6
NAICS 334 Computer and electronic product manufacturing
0.69 6.24 2.5
NAICS 518 Data processing, hosting and related services
2.15 2.76 ND
NAICS 541 Professional and technical services
ND 2.43 1.53
NAICS 312 Beverage and tobacco product manufacturing
0.62 2.01 0.52
NAICS 451 Sports, hobby, music instrument, book stores
1.1 1.91 0.94
Sector KCBoulde
rBoston
NAICS 511 Publishing industries, except Internet
0.9 6.38 2.6
NAICS 523 Securities, commodity contracts, investments
1.41 1.39 2.53
NAICS 334 Computer and electronic product manufacturing
0.69 6.24 2.5
NAICS 519 Other information services
ND 1.5 2.23
NAICS 316 Leather and allied product manufacturing
ND 0.42 2.16
KC Top 5 Sectors
Boulder Top 5 Sectors
Boston Top 5 Sectors
Source: QCEW, http://data.bls.gov/location_quotient/ControllerServlet
© 2013 Ewing Marion Kauffman Foundation
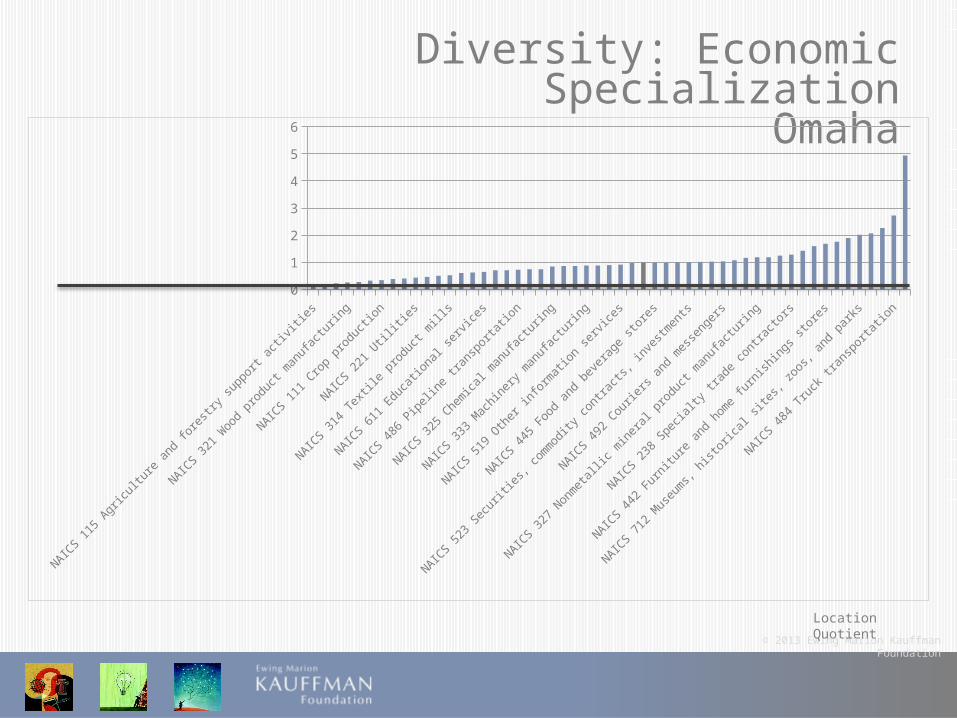
Diversity: Economic SpecializationOmaha
Location Quotient
NAICS 1
15 A
gricu
lture
and
fore
stry s
uppo
rt ac
tivitie
s
NAICS 4
81 A
ir tra
nspo
rtatio
n
NAICS 1
12 A
nim
al p
rodu
ction
and
aqu
acul
ture
NAICS 1
11 C
rop
prod
uctio
n
NAICS 3
12 B
ever
age
and
toba
cco
prod
uct m
anuf
actu
ring
NAICS 2
12 M
inin
g, e
xcep
t oil a
nd g
as
NAICS 3
14 T
extile
pro
duct
mills
NAICS 3
39 M
iscel
lane
ous m
anuf
actu
ring
NAICS 2
37 H
eavy
and
civil
eng
inee
ring
cons
tructi
on
NAICS 4
86 P
ipel
ine
trans
porta
tion
NAICS 4
48 C
loth
ing
and
cloth
ing
acce
ssor
ies s
tore
s
NAICS 4
52 G
ener
al m
erch
andi
se st
ores
NAICS 3
33 M
achi
nery
man
ufac
turin
g
NAICS 2
36 C
onstr
uctio
n of
bui
ldin
gs
NAICS 3
37 F
urni
ture
and
rela
ted
prod
uct m
anuf
actu
ring
NAICS 4
45 F
ood
and
beve
rage
stor
es
NAICS 3
26 P
lasti
cs a
nd ru
bber
pro
ducts
man
ufac
turin
g
NAICS 5
11 P
ublis
hing
indu
strie
s, ex
cept
Inte
rnet
NAICS 4
92 C
ourie
rs a
nd m
esse
nger
s
NAICS 4
93 W
areh
ousin
g an
d sto
rage
NAICS 6
23 N
ursin
g an
d re
siden
tial c
are
facil
ities
NAICS 2
38 S
pecia
lty tr
ade
cont
racto
rs
NAICS 3
23 P
rintin
g an
d re
late
d su
ppor
t acti
vitie
s
NAICS 5
15 B
road
casti
ng, e
xcep
t Inte
rnet
NAICS 7
12 M
useu
ms,
histo
rical
site
s, zo
os, a
nd p
arks
NAICS 3
11 F
ood
man
ufac
turin
g
NAICS 5
18 D
ata
proc
essin
g, h
ostin
g an
d re
late
d se
rvice
s
0
1
2
3
4
5
6
© 2013 Ewing Marion Kauffman Foundation
Location Quotient
NAICS 2
13 S
uppo
rt ac
tivitie
s fo
r mini
ng
NAICS 3
36 T
rans
porta
tion
equip
men
t man
ufac
turin
g
NAICS 2
37 H
eavy
and
civi
l eng
ineer
ing c
onst
ruct
ion
NAICS 7
12 M
useu
ms,
hist
orica
l site
s, z
oos,
and
par
ks
NAICS 1
11 C
rop
prod
uctio
n
NAICS 4
47 G
asoli
ne s
tatio
ns
NAICS 5
15 B
road
cast
ing, e
xcep
t Int
erne
t
NAICS 4
48 C
lothin
g an
d clo
thing
acc
esso
ries
stor
es
NAICS 5
32 R
enta
l and
leas
ing s
ervic
es
NAICS 3
27 N
onm
etall
ic m
inera
l pro
duct
man
ufac
turin
g
NAICS 2
12 M
ining
, exc
ept o
il and
gas
NAICS 4
46 H
ealth
and
per
sona
l car
e st
ores
NAICS 7
21 A
ccom
mod
ation
NAICS 5
61 A
dmini
stra
tive
and
supp
ort s
ervic
es
NAICS 5
22 C
redit
inte
rmed
iation
and
relat
ed a
ctivi
ties
NAICS 4
24 M
erch
ant w
holes
alers
, non
dura
ble g
oods
NAICS 4
44 B
uildin
g m
ater
ial a
nd g
arde
n su
pply
stor
es
NAICS 8
13 M
embe
rship
ass
ociat
ions
and
orga
nizat
ions
Base
Indu
stry
: Tot
al, a
ll ind
ustri
es
NAICS 5
31 R
eal e
stat
e
NAICS 7
22 F
ood
serv
ices
and
drink
ing p
laces
NAICS 4
53 M
iscell
aneo
us s
tore
reta
ilers
NAICS 3
15 A
ppar
el m
anuf
actu
ring
NAICS 5
19 O
ther
info
rmat
ion s
ervic
es
NAICS 4
51 S
ports
, hob
by, m
usic
instru
men
t, bo
ok s
tore
s
NAICS 5
18 D
ata
proc
essin
g, h
ostin
g an
d re
lated
ser
vices
0
1
2
3
4
5
6
7
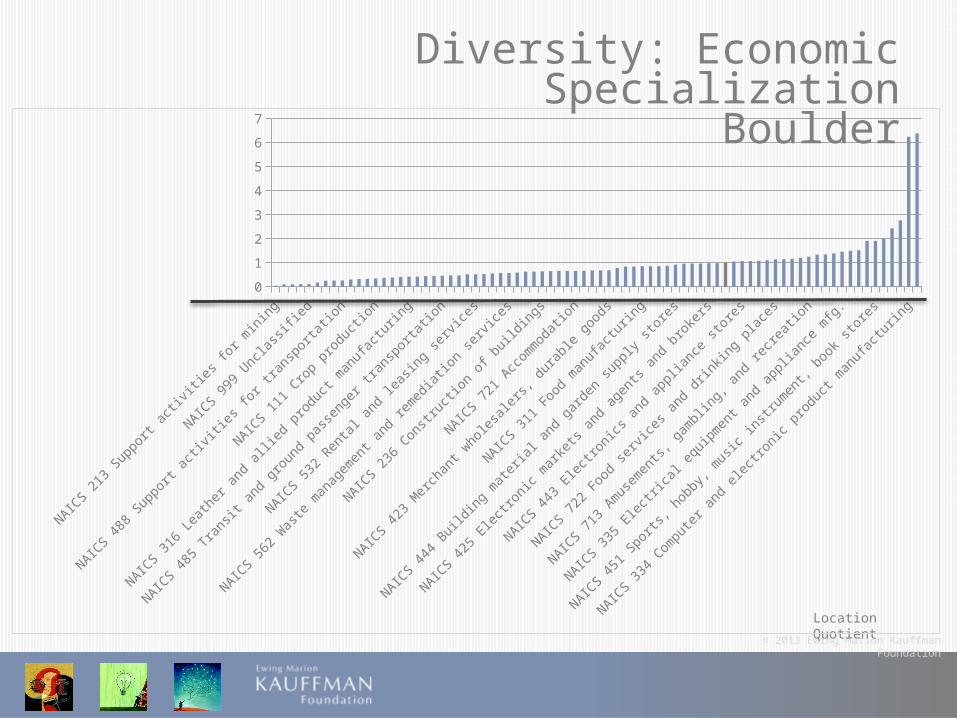
Diversity: Economic SpecializationBoulder
© 2013 Ewing Marion Kauffman Foundation
NAICS 2
13 S
uppo
rt ac
tivitie
s for
min
ing
NAICS 1
15 A
gricu
lture
and
fore
stry s
uppo
rt ac
tivitie
s
NAICS 2
11 O
il and
gas
extr
actio
n
NAICS 2
12 M
inin
g, e
xcep
t oil a
nd g
as
NAICS 4
81 A
ir tra
nspo
rtatio
n
NAICS 3
35 E
lectr
ical e
quip
men
t and
app
lianc
e m
fg.
NAICS 8
14 P
rivat
e ho
useh
olds
NAICS 3
15 A
ppar
el m
anuf
actu
ring
NAICS 3
12 B
ever
age
and
toba
cco
prod
uct m
anuf
actu
ring
NAICS 3
37 F
urni
ture
and
rela
ted
prod
uct m
anuf
actu
ring
NAICS 5
15 B
road
casti
ng, e
xcep
t Inte
rnet
NAICS 2
36 C
onstr
uctio
n of
bui
ldin
gs
NAICS 3
24 P
etro
leum
and
coal
pro
ducts
man
ufac
turin
g
NAICS 4
43 E
lectr
onics
and
app
lianc
e sto
res
NAICS 3
26 P
lasti
cs a
nd ru
bber
pro
ducts
man
ufac
turin
g
NAICS 4
47 G
asol
ine
statio
ns
NAICS 5
11 P
ublis
hing
indu
strie
s, ex
cept
Inte
rnet
NAICS 4
45 F
ood
and
beve
rage
stor
es
NAICS 5
62 W
aste
man
agem
ent a
nd re
med
iatio
n se
rvice
s
NAICS 4
52 G
ener
al m
erch
andi
se st
ores
Base
Indu
stry:
Tota
l, all i
ndus
tries
NAICS 6
23 N
ursin
g an
d re
siden
tial c
are
facil
ities
NAICS 3
36 T
rans
porta
tion
equi
pmen
t man
ufac
turin
g
NAICS 5
22 C
redi
t inte
rmed
iatio
n an
d re
late
d ac
tivitie
s
NAICS 4
51 S
ports
, hob
by, m
usic
instr
umen
t, boo
k sto
res
NAICS 2
21 U
tilitie
s
NAICS 7
11 P
erfo
rmin
g ar
ts an
d sp
ecta
tor s
ports
NAICS 3
22 P
aper
man
ufac
turin
g
NAICS 4
42 F
urni
ture
and
hom
e fu
rnish
ings
stor
es
NAICS 4
88 S
uppo
rt ac
tivitie
s for
tran
spor
tatio
n
NAICS 4
92 C
ourie
rs a
nd m
esse
nger
s
NAICS 3
23 P
rintin
g an
d re
late
d su
ppor
t acti
vitie
s
NAICS 5
17 T
elec
omm
unica
tions
0
0.5
1
1.5
2
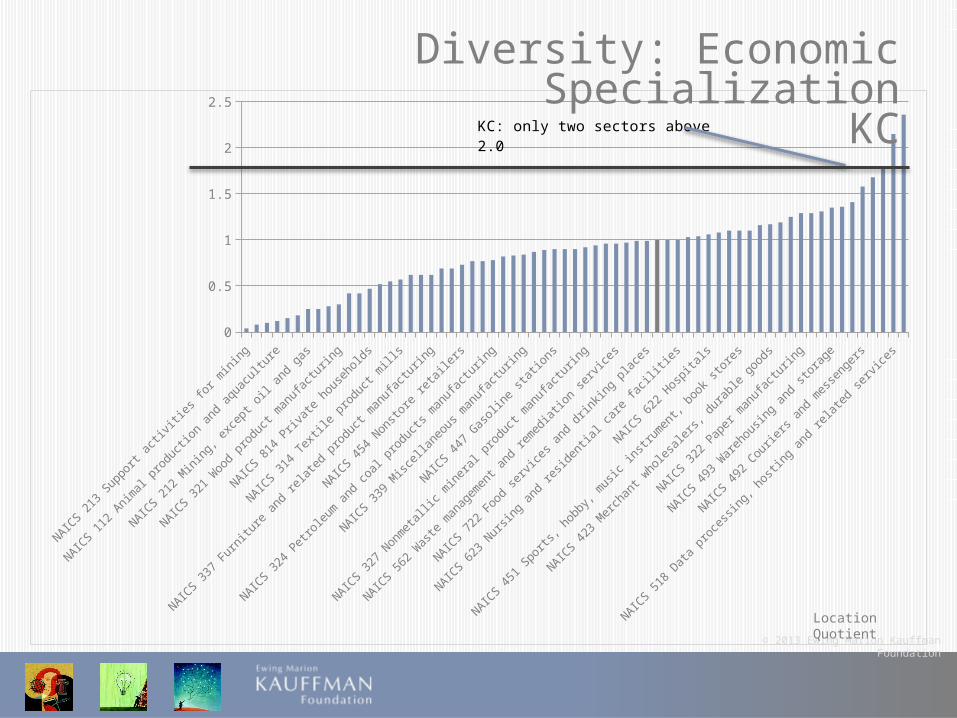
2.5KC: only two sectors above 2.0
Location Quotient
Diversity: Economic SpecializationKC
© 2013 Ewing Marion Kauffman Foundation
Diversity: Economic Mobility
• Kansas City’s “Absolute Mobility” measure is 40.2.1 o This ranks 231st out of 381 MSAs.
• If we take a look at the entire ladder, the picture that emerges is that Kansas City is slightly above average for the intergenerational mobility of wealthy families, and a little below average for poorer families.
1 “Absolute upward mobility (AM) is the expected rank of children whose parents are at the 25th percentile of the national income distribution”
Source: Equality of Opportunity Projecthttp://www.equality-of-opportunity.org/index.php/data
© 2013 Ewing Marion Kauffman Foundation
Diversity: Immigration
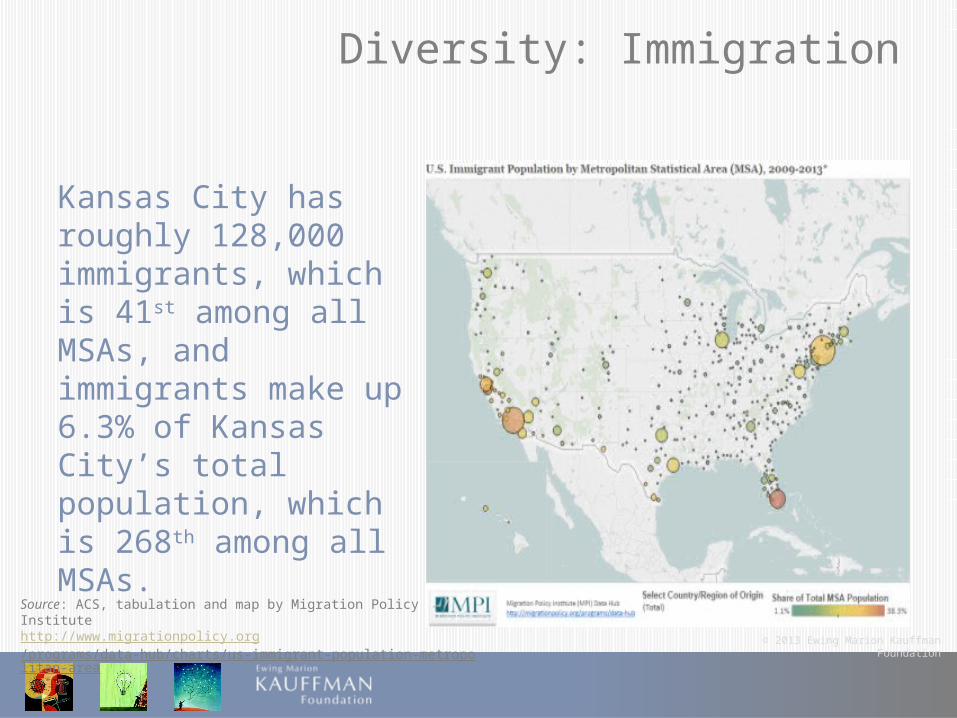
Kansas City has roughly 128,000 immigrants, which is 41st among all MSAs, and immigrants make up 6.3% of Kansas City’s total population, which is 268th among all MSAs.
Source: ACS, tabulation and map by Migration Policy Institutehttp://www.migrationpolicy.org/programs/data-hub/charts/us-immigrant-population-metropolitan-area
© 2013 Ewing Marion Kauffman Foundation
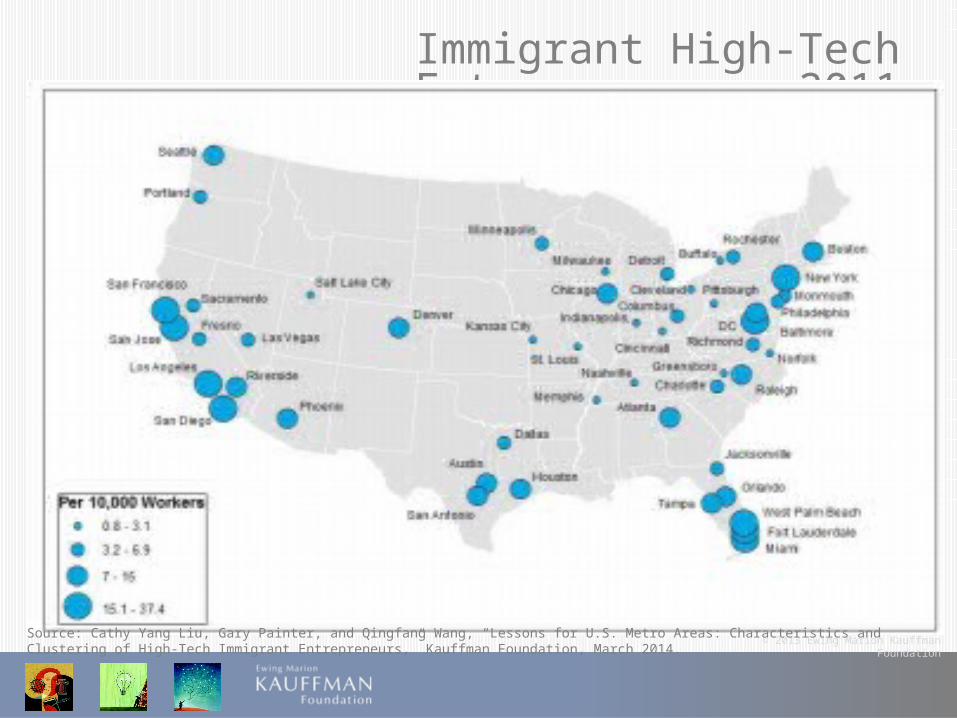
Immigrant High-Tech Entrepreneurs, 2011
Source: Cathy Yang Liu, Gary Painter, and Qingfang Wang, “Lessons for U.S. Metro Areas: Characteristics and Clustering of High-Tech Immigrant Entrepreneurs,” Kauffman Foundation, March 2014.
© 2013 Ewing Marion Kauffman Foundation
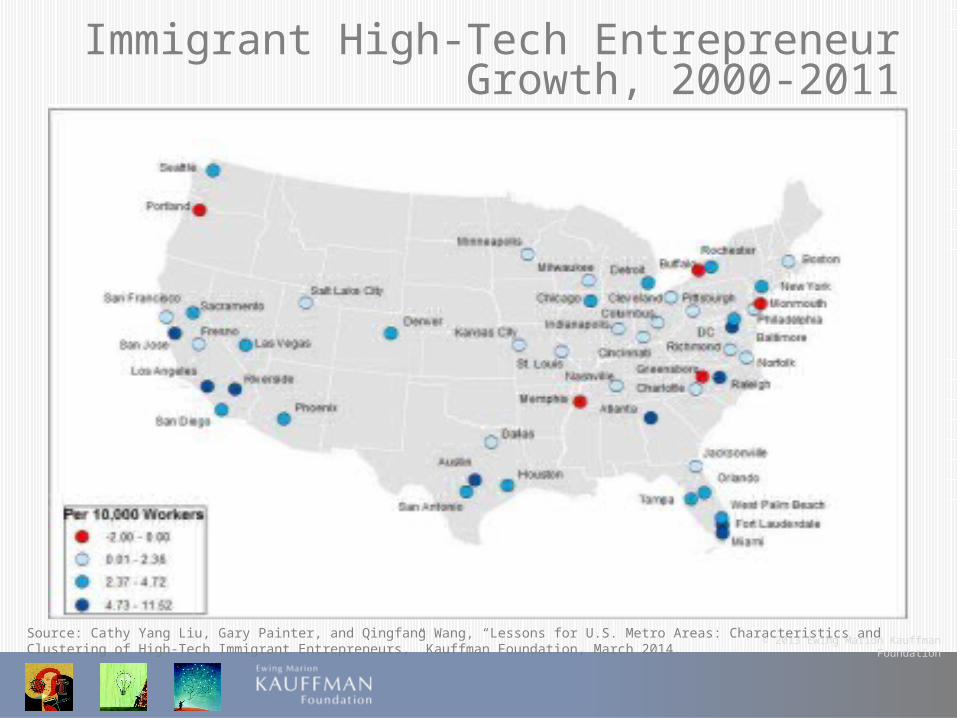
Immigrant High-Tech Entrepreneur Growth, 2000-2011
Source: Cathy Yang Liu, Gary Painter, and Qingfang Wang, “Lessons for U.S. Metro Areas: Characteristics and Clustering of High-Tech Immigrant Entrepreneurs,” Kauffman Foundation, March 2014.
© 2013 Ewing Marion Kauffman Foundation
Progressing the “measuring” conversation
• What new data can be developed?• Other theoretical frameworks?• How do we measure impact of specific programs,
policies, or interventions?
© 2013 Ewing Marion Kauffman Foundation
Thank you