
SWFs and cross-border investment
32
SWFs and Cross ‐border investment Ibrahim Elbadawi, Hoda Selim, Raimundo Soto and Chahir Zaki ERF‐World Bank Workshop on Sovereign Wealth Funds September 9‐10, 2016 Washington D.C.
-
Upload
economic-research-forum -
Category
Economy & Finance
-
view
123 -
download
1
Transcript of SWFs and cross-border investment
SWFs and Cross‐border investment
Ibrahim Elbadawi, Hoda Selim, Raimundo Soto and Chahir ZakiERF‐World Bank Workshop on Sovereign Wealth Funds
September 9‐10, 2016Washington D.C.
Motivation and Objective
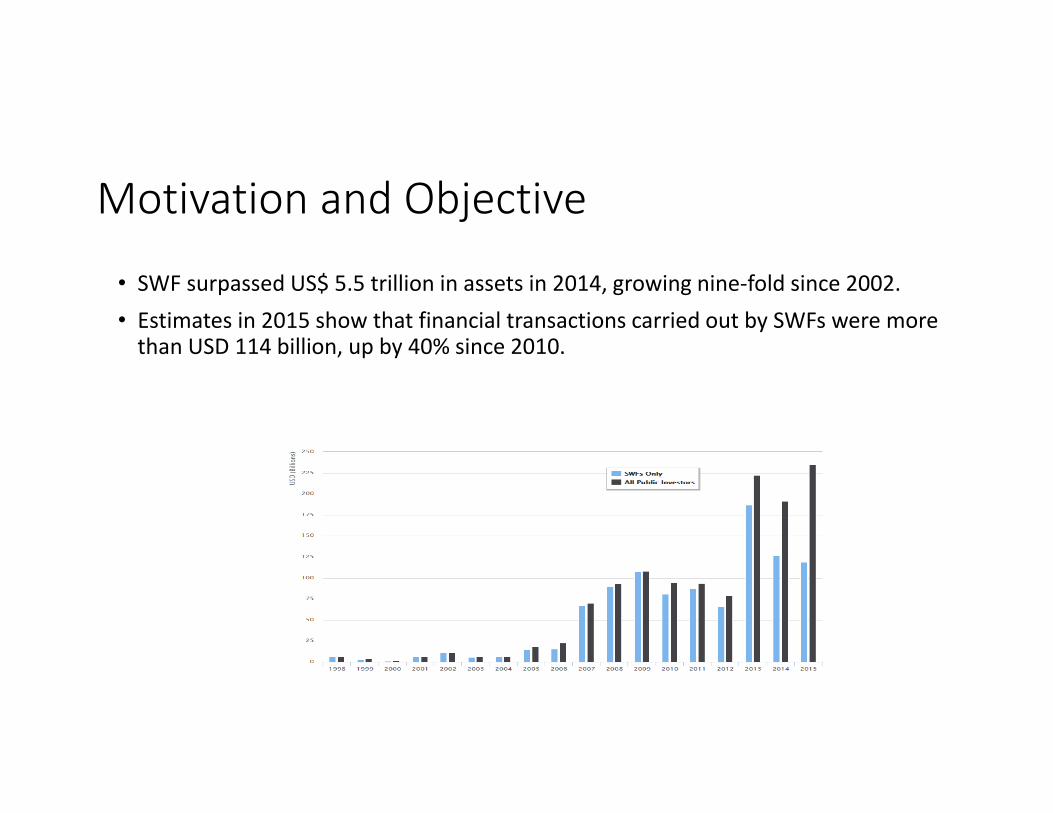
• SWF surpassed US$ 5.5 trillion in assets in 2014, growing nine‐fold since 2002.• Estimates in 2015 show that financial transactions carried out by SWFs were more than USD 114 billion, up by 40% since 2010.
Motivation and Objective
• Traditionally, SWFs save extra‐budgetary surpluses (from resource revenues,foreign exchange reserves, or pension contributions) to smooth public revenuevolatility and spending as well as to ensure intergenerational equity.
• Enjoying ample liquidity, some SWFs with deep pockets (with over US$ 30 billion inassets) have emerged as major global investors (of global equity), seeking long‐term investment opportunities,
• Typically, SWFs have the choice to pursue either domestic (home) investments orabroad.
Motivation and Objective
• The objective of this paper is to investigate the determinants of SWF capital allocation decisions between the home country and abroad.
• In particular, the paper asks the following questions:
• Do SWF investment decisions reflect profitability and economic objectives or other strategic considerations (such as geography, culture, or other geopolitical considerations)?
• Do sovereign wealth funds target strategic sectors for their investment?• What determines the SWF decision to invest in infrastructure outside of the home country?
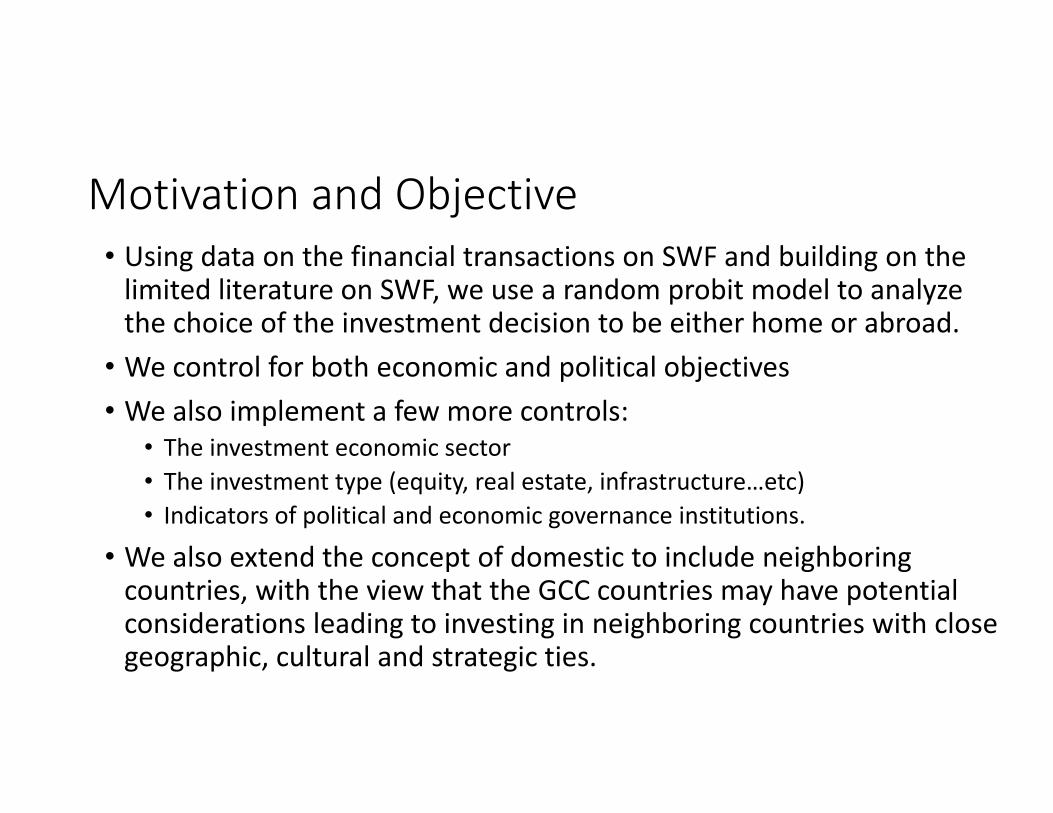
Motivation and Objective• Using data on the financial transactions on SWF and building on the limited literature on SWF, we use a random probit model to analyze the choice of the investment decision to be either home or abroad.
• We control for both economic and political objectives• We also implement a few more controls:
• The investment economic sector• The investment type (equity, real estate, infrastructure…etc)• Indicators of political and economic governance institutions.
• We also extend the concept of domestic to include neighboring countries, with the view that the GCC countries may have potential considerations leading to investing in neighboring countries with close geographic, cultural and strategic ties.
Outline
• Literature review•Data•Methodology •Descriptive statistics• Econometric results•Conclusion

Outline
• Literature review•Data•Methodology •Descriptive statistics• Econometric results•Conclusion
Literature review
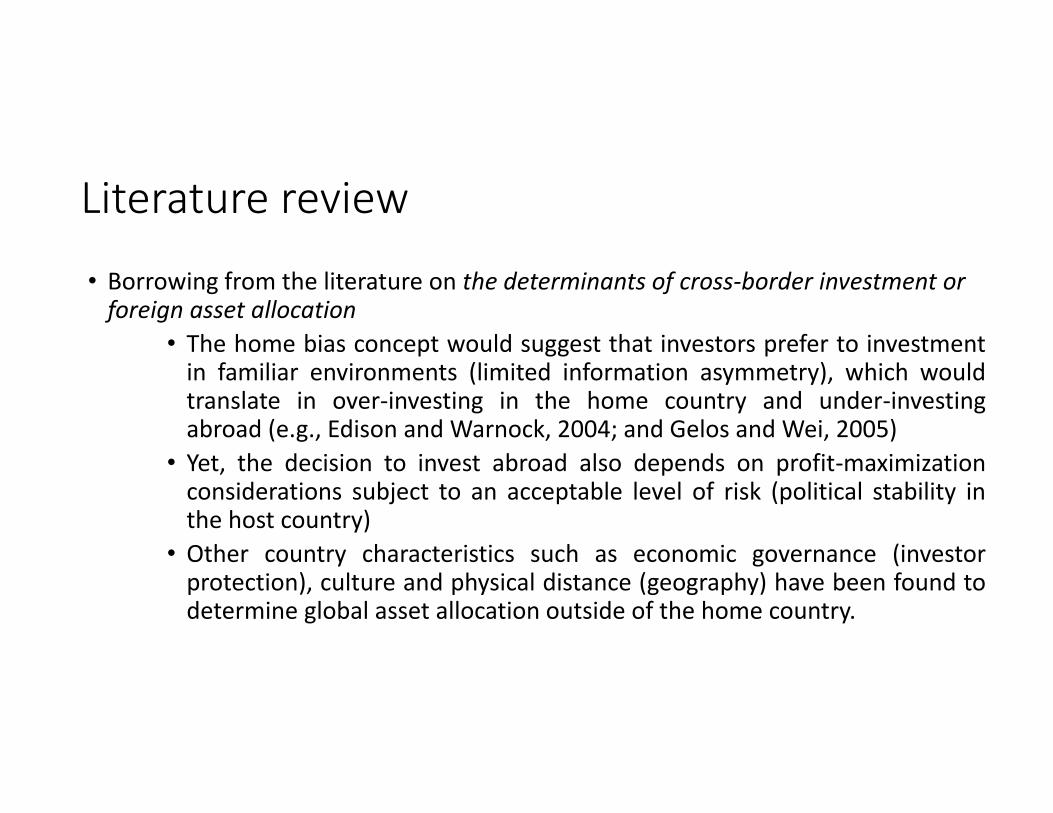
• Borrowing from the literature on the determinants of cross‐border investment or foreign asset allocation
• The home bias concept would suggest that investors prefer to investmentin familiar environments (limited information asymmetry), which wouldtranslate in over‐investing in the home country and under‐investingabroad (e.g., Edison and Warnock, 2004; and Gelos and Wei, 2005)
• Yet, the decision to invest abroad also depends on profit‐maximizationconsiderations subject to an acceptable level of risk (political stability inthe host country)
• Other country characteristics such as economic governance (investorprotection), culture and physical distance (geography) have been found todetermine global asset allocation outside of the home country.
Literature review
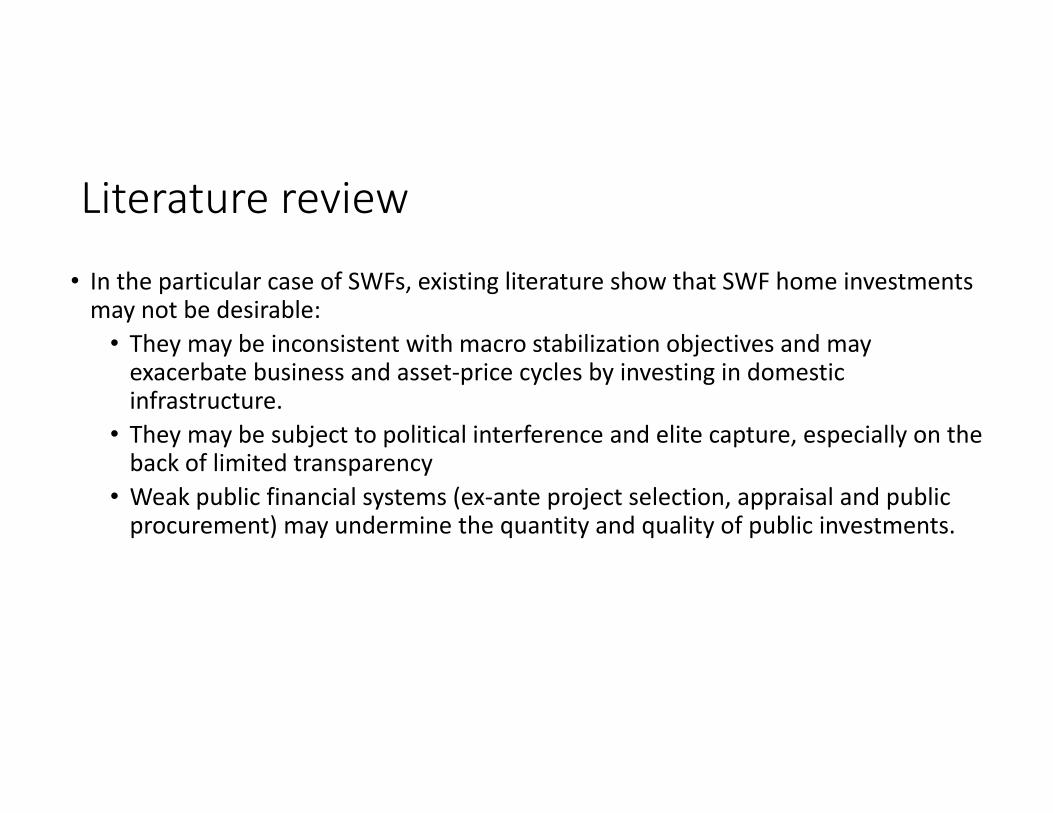
• In the particular case of SWFs, existing literature show that SWF home investments may not be desirable:• They may be inconsistent with macro stabilization objectives and may exacerbate business and asset‐price cycles by investing in domestic infrastructure.
• They may be subject to political interference and elite capture, especially on the back of limited transparency
• Weak public financial systems (ex‐ante project selection, appraisal and public procurement) may undermine the quantity and quality of public investments.
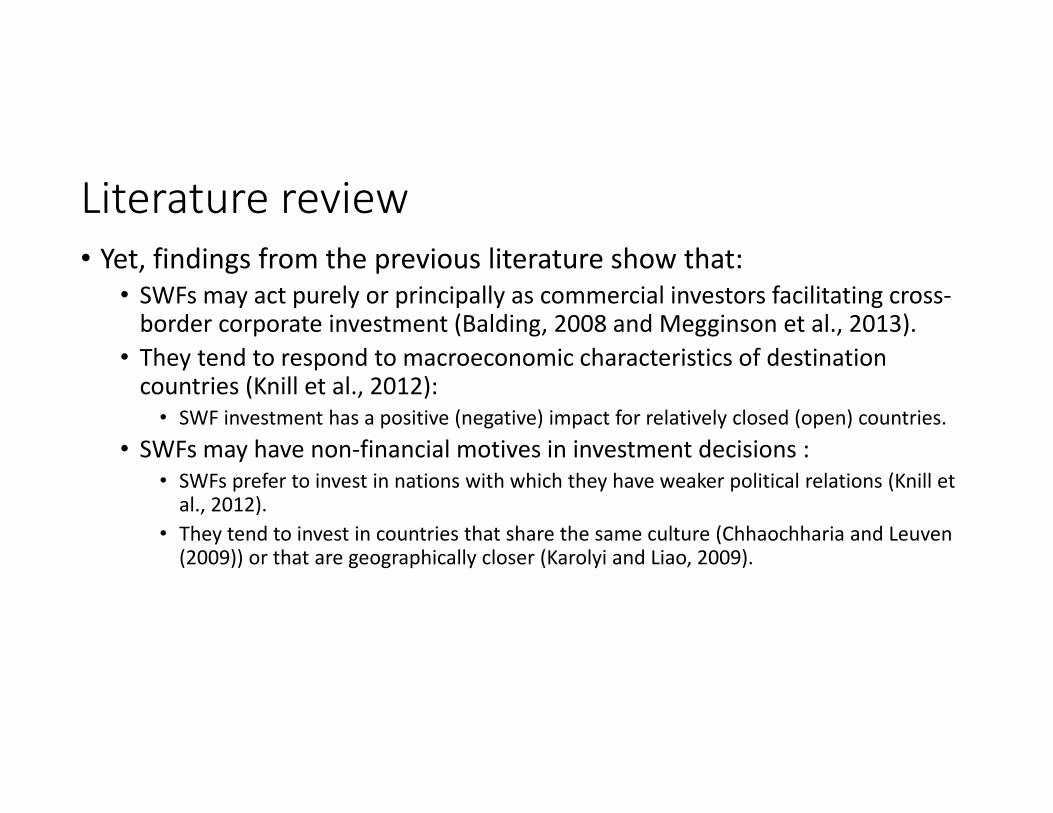
Literature review• Yet, findings from the previous literature show that:
• SWFs may act purely or principally as commercial investors facilitating cross‐border corporate investment (Balding, 2008 and Megginson et al., 2013).
• They tend to respond to macroeconomic characteristics of destination countries (Knill et al., 2012):• SWF investment has a positive (negative) impact for relatively closed (open) countries.
• SWFs may have non‐financial motives in investment decisions : • SWFs prefer to invest in nations with which they have weaker political relations (Knill et al., 2012).
• They tend to invest in countries that share the same culture (Chhaochharia and Leuven (2009)) or that are geographically closer (Karolyi and Liao, 2009).

Outline
• Literature review•Data•Methodology•Descriptive statistics• Econometric results•Conclusion
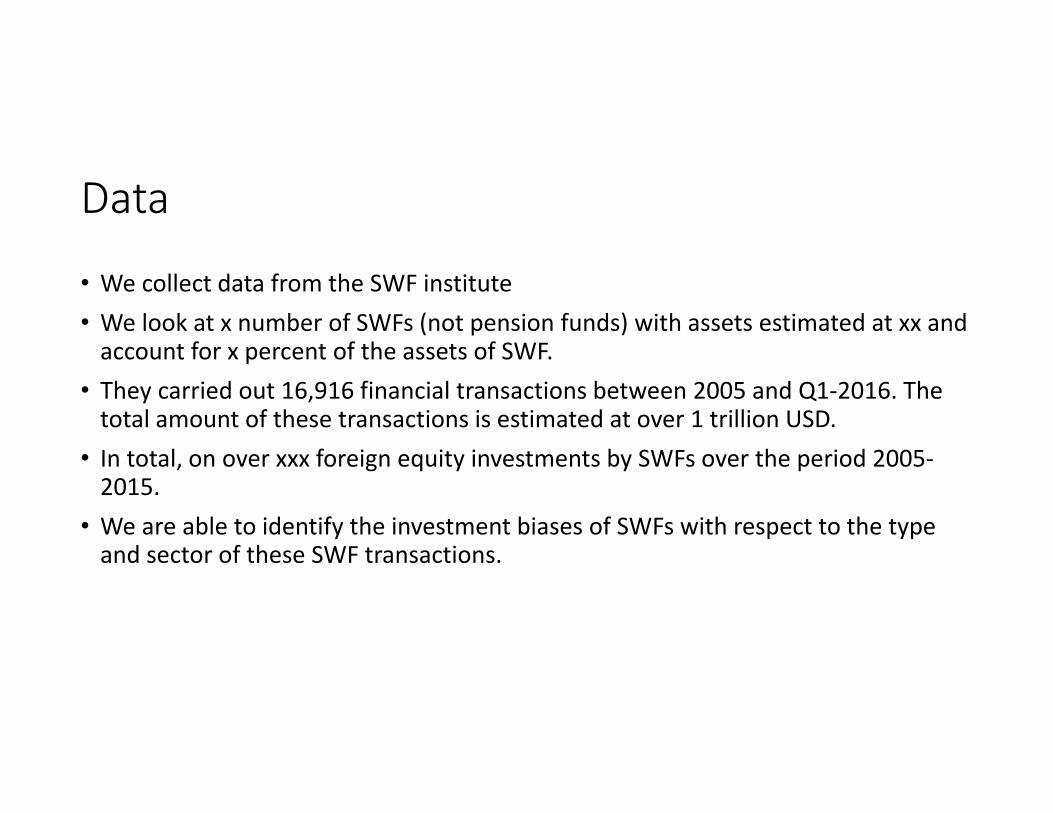
Data
• We collect data from the SWF institute • We look at x number of SWFs (not pension funds) with assets estimated at xx and account for x percent of the assets of SWF.
• They carried out 16,916 financial transactions between 2005 and Q1‐2016. The total amount of these transactions is estimated at over 1 trillion USD.
• In total, on over xxx foreign equity investments by SWFs over the period 2005‐2015.
• We are able to identify the investment biases of SWFs with respect to the type and sector of these SWF transactions.

Outline
• Literature review•Data•Methodology•Descriptive statistics• Econometric results•Conclusion
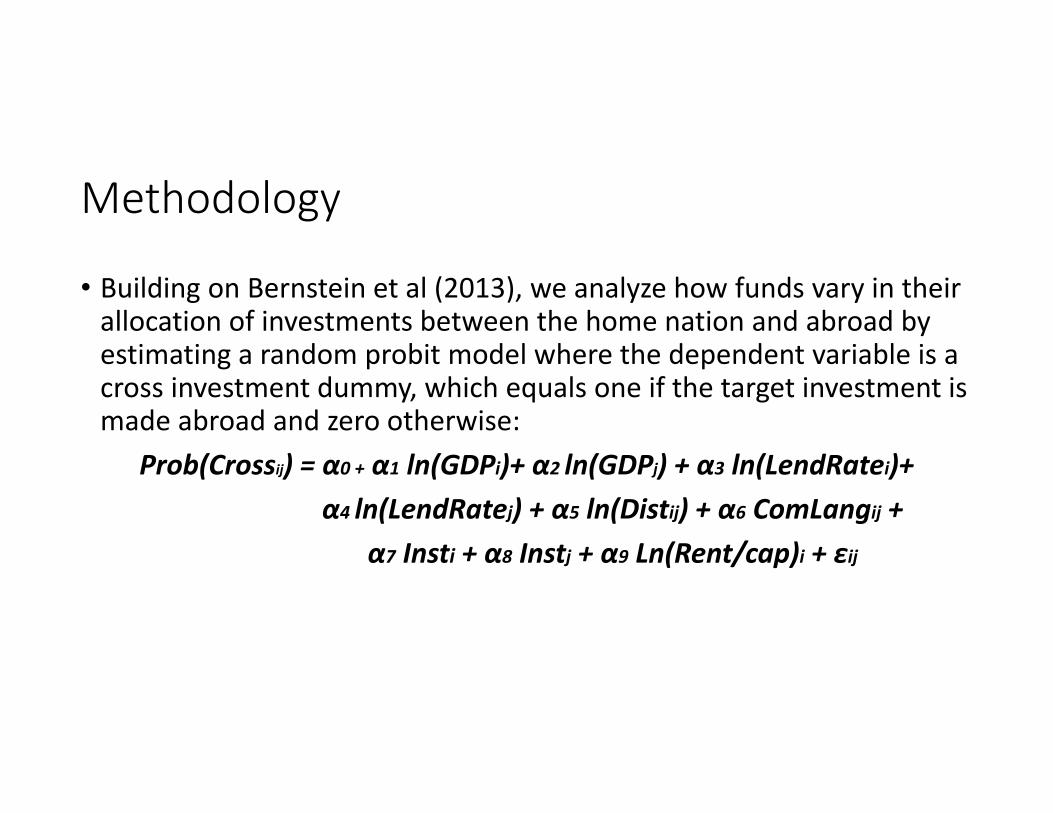
Methodology
• Building on Bernstein et al (2013), we analyze how funds vary in their allocation of investments between the home nation and abroad by estimating a random probit model where the dependent variable is a cross investment dummy, which equals one if the target investment is made abroad and zero otherwise:
Prob(Crossij) = α0 + α1 ln(GDPi)+ α2 ln(GDPj) + α3 ln(LendRatei)+ α4 ln(LendRatej) + α5 ln(Distij) + α6 ComLangij +
α7 Insti + α8 Instj + α9 Ln(Rent/cap)i + εij
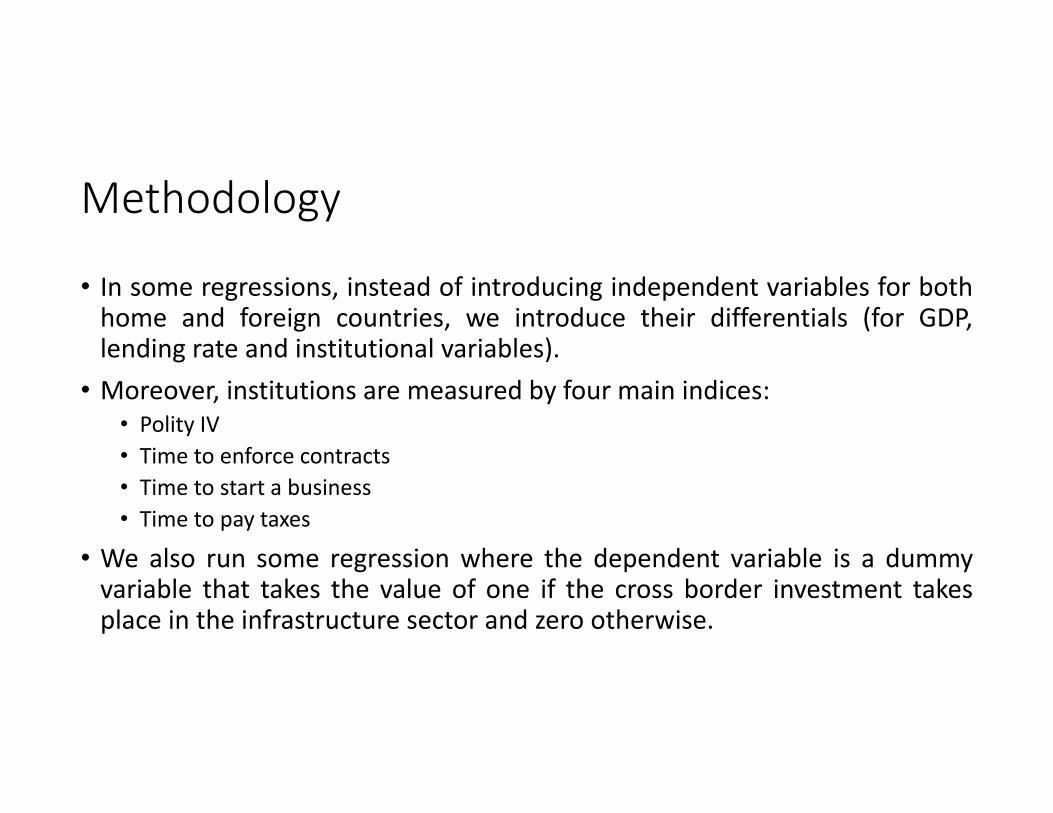
Methodology
• In some regressions, instead of introducing independent variables for bothhome and foreign countries, we introduce their differentials (for GDP,lending rate and institutional variables).
• Moreover, institutions are measured by four main indices:• Polity IV• Time to enforce contracts• Time to start a business• Time to pay taxes
• We also run some regression where the dependent variable is a dummyvariable that takes the value of one if the cross border investment takesplace in the infrastructure sector and zero otherwise.
Outline
• Literature review•Data•Methodology•Descriptive statistics• Econometric results•Conclusion
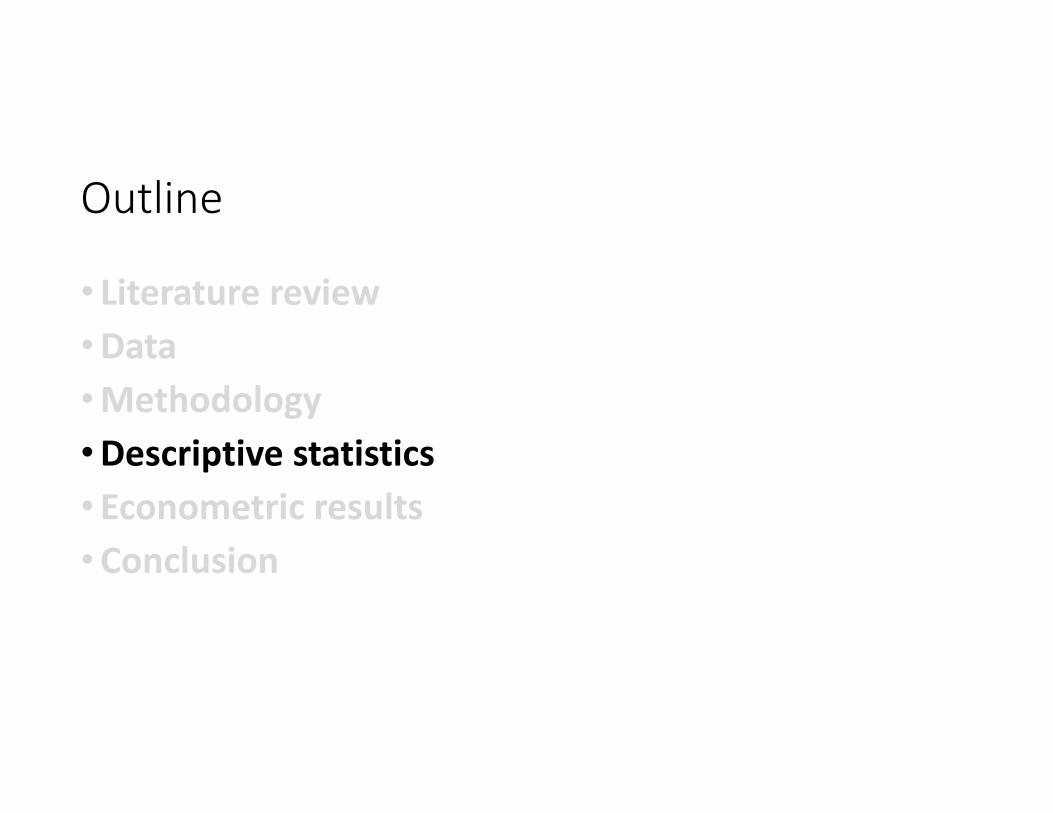
Descriptive statistics• Transactions of Arab SWFs are less than 12% of total transactions in terms of number.
11.6%
88.4%
Arab transactions Non‐Arab transactions
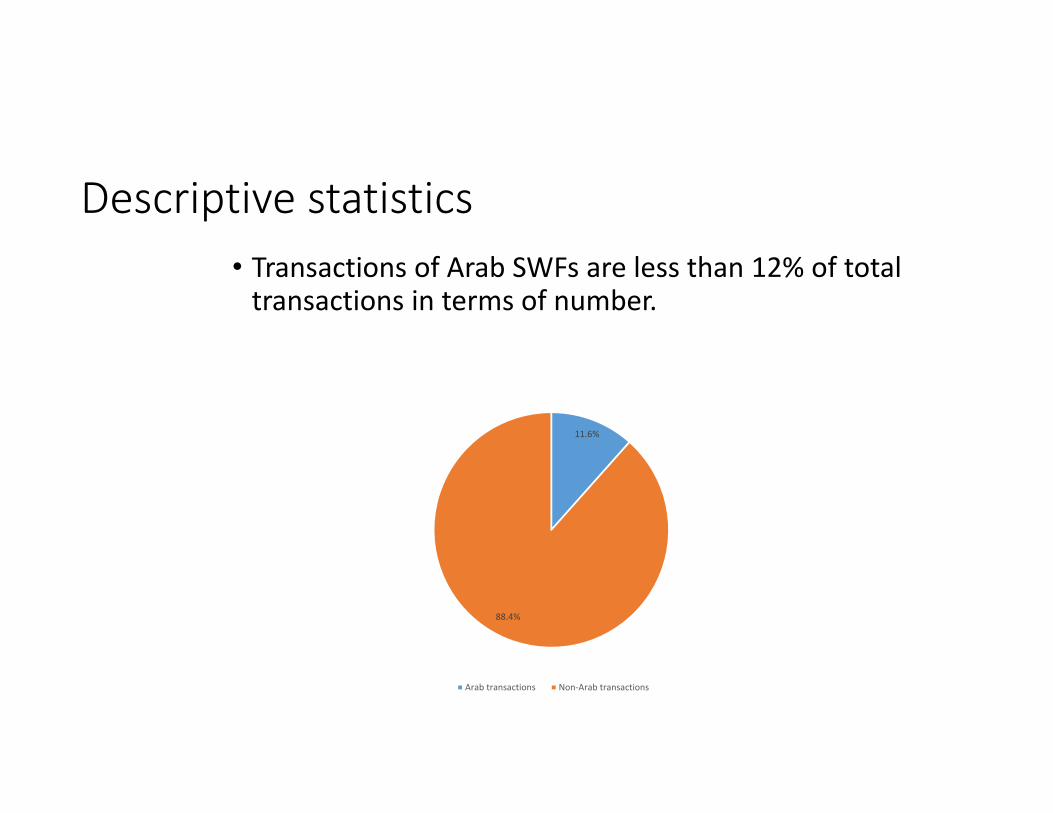
Descriptive statistics• Cross‐border investments account for 89% percent of total transactions .
• Cross‐border investments are most in the form of FDI (90% or more).
0
2000
4000
6000
8000
10000
12000
14000
GCC ROW
Domestic Investment FDI
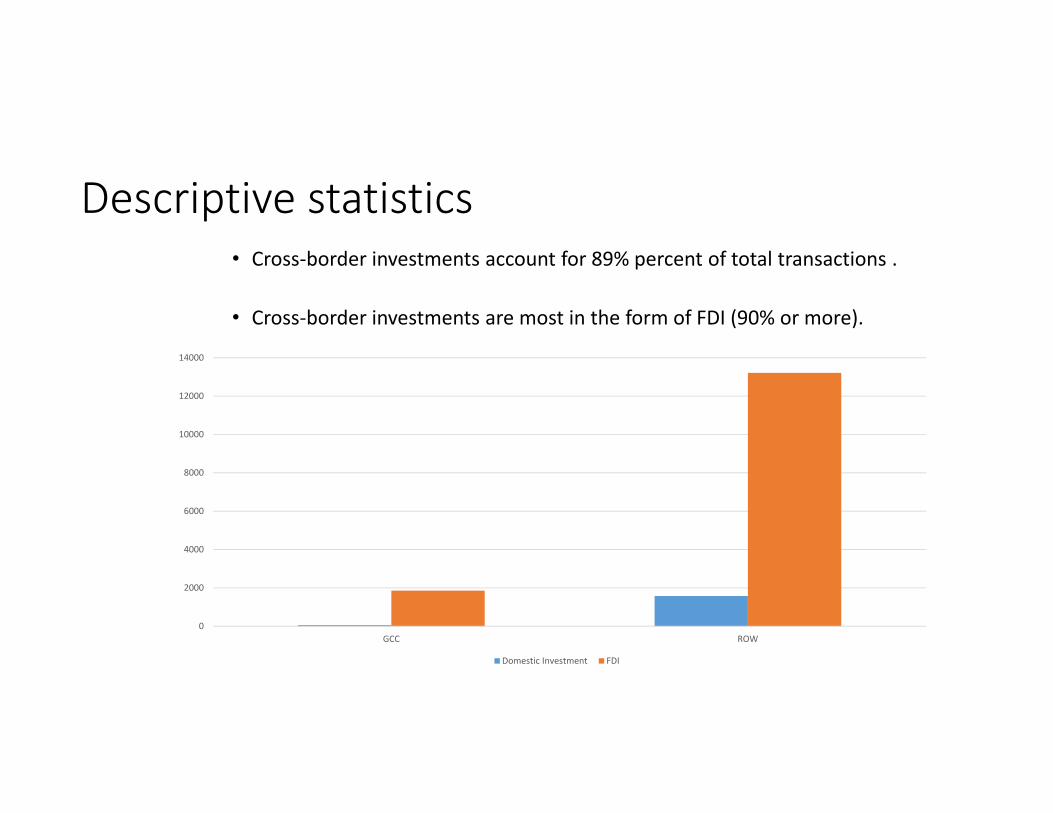
Descriptive statistics• Most GCC SWF transactions are in in the financial sector followed by the real estate and infrastructure sectors.
0
500
1000
1500
2000
2500
ConsumerDiscretionar
ConsumerStaples
Energy Financials Healthcare Industrials IT andtelecomm
Real estate andinfrastructure
Materials Media andEntertainme
Utilities
GCC ROW
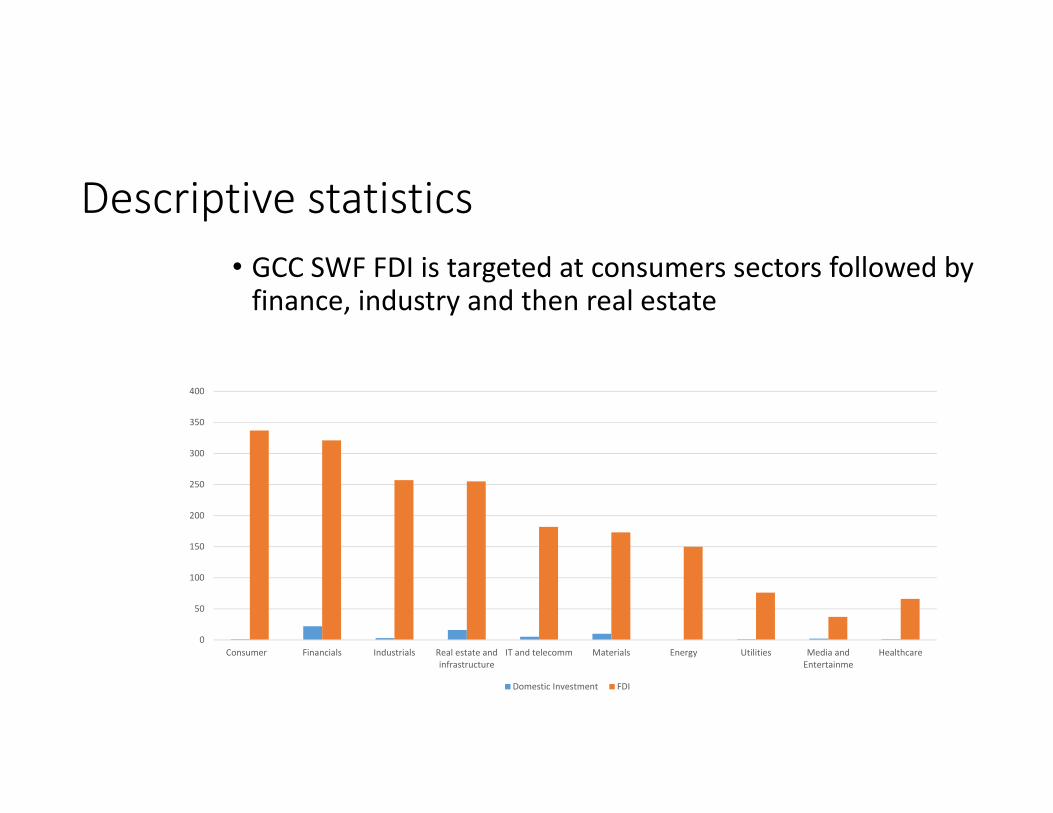
Descriptive statistics• GCC SWF FDI is targeted at consumers sectors followed by finance, industry and then real estate
0
50
100
150
200
250
300
350
400
Consumer Financials Industrials Real estate andinfrastructure
IT and telecomm Materials Energy Utilities Media andEntertainme
Healthcare
Domestic Investment FDI
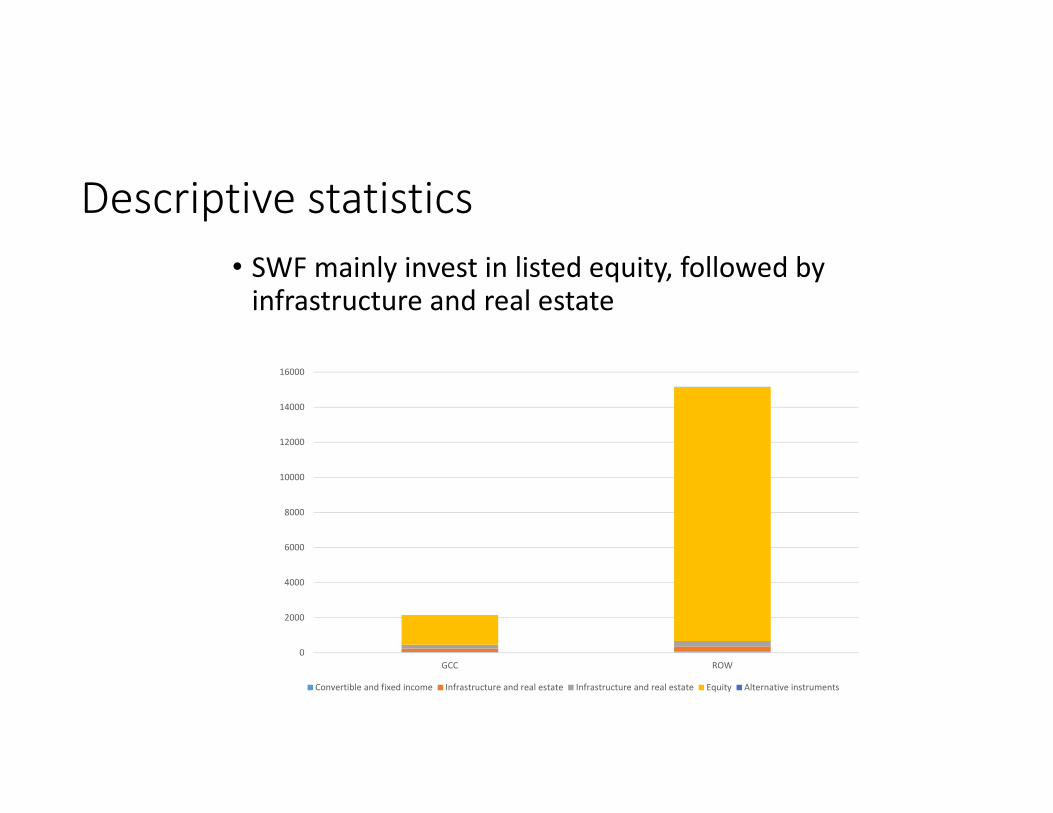
Descriptive statistics• SWF mainly invest in listed equity, followed by infrastructure and real estate
0
2000
4000
6000
8000
10000
12000
14000
16000
GCC ROW
Convertible and fixed income Infrastructure and real estate Infrastructure and real estate Equity Alternative instruments
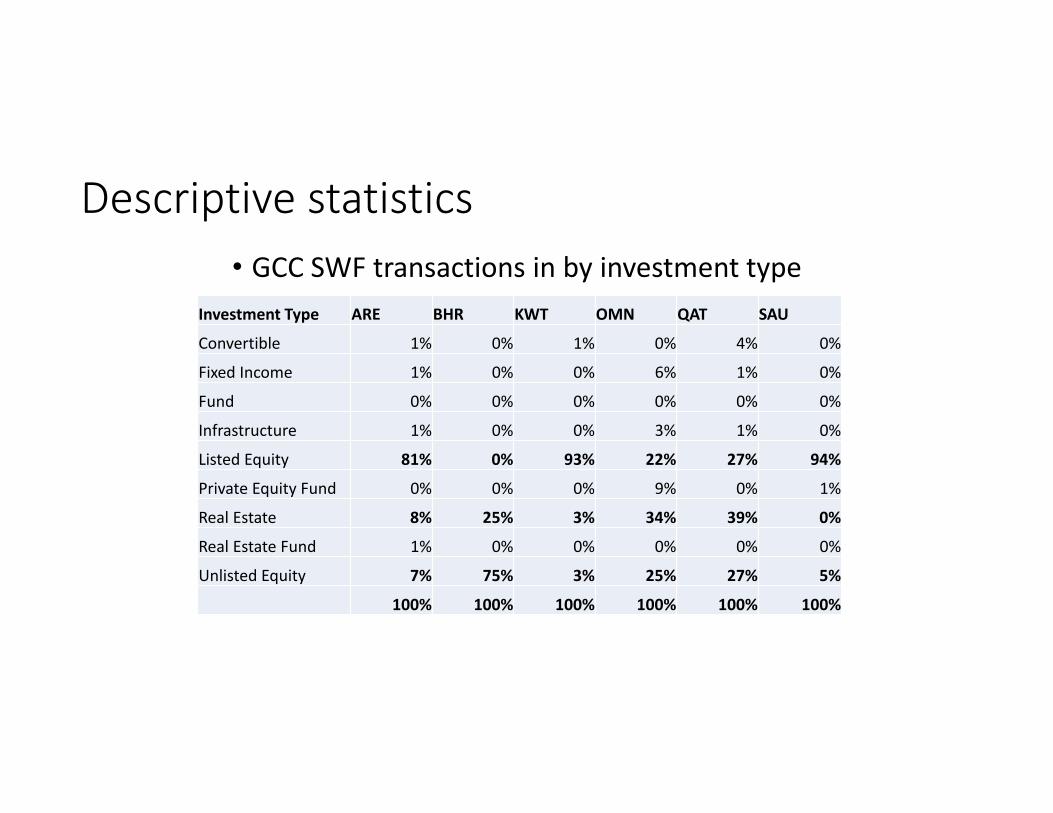
Descriptive statistics• GCC SWF transactions in by investment type
Investment Type ARE BHR KWT OMN QAT SAU
Convertible 1% 0% 1% 0% 4% 0%
Fixed Income 1% 0% 0% 6% 1% 0%
Fund 0% 0% 0% 0% 0% 0%
Infrastructure 1% 0% 0% 3% 1% 0%
Listed Equity 81% 0% 93% 22% 27% 94%
Private Equity Fund 0% 0% 0% 9% 0% 1%
Real Estate 8% 25% 3% 34% 39% 0%
Real Estate Fund 1% 0% 0% 0% 0% 0%
Unlisted Equity 7% 75% 3% 25% 27% 5%
100% 100% 100% 100% 100% 100%
Descriptive statistics
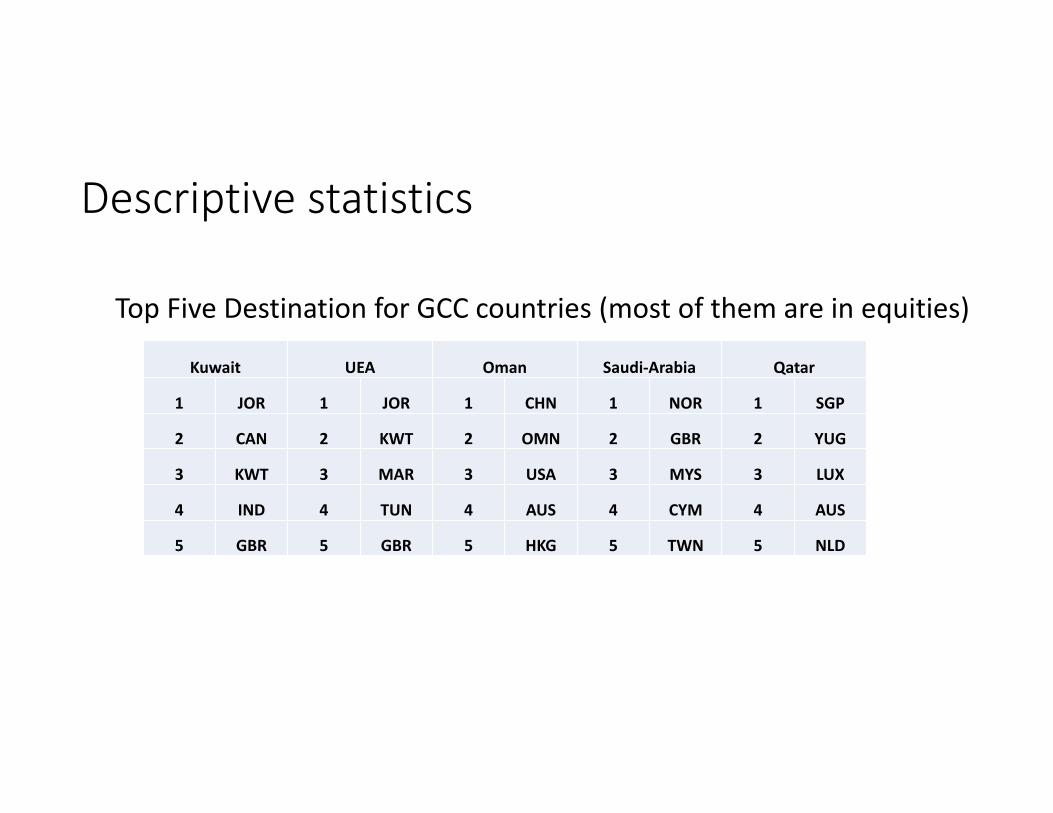
Top Five Destination for GCC countries (most of them are in equities)
Kuwait UEA Oman Saudi‐Arabia Qatar
1 JOR 1 JOR 1 CHN 1 NOR 1 SGP
2 CAN 2 KWT 2 OMN 2 GBR 2 YUG
3 KWT 3 MAR 3 USA 3 MYS 3 LUX
4 IND 4 TUN 4 AUS 4 CYM 4 AUS
5 GBR 5 GBR 5 HKG 5 TWN 5 NLD
Outline
• Literature review•Data•Methodology•Descriptive statistics• Econometric results•Conclusion
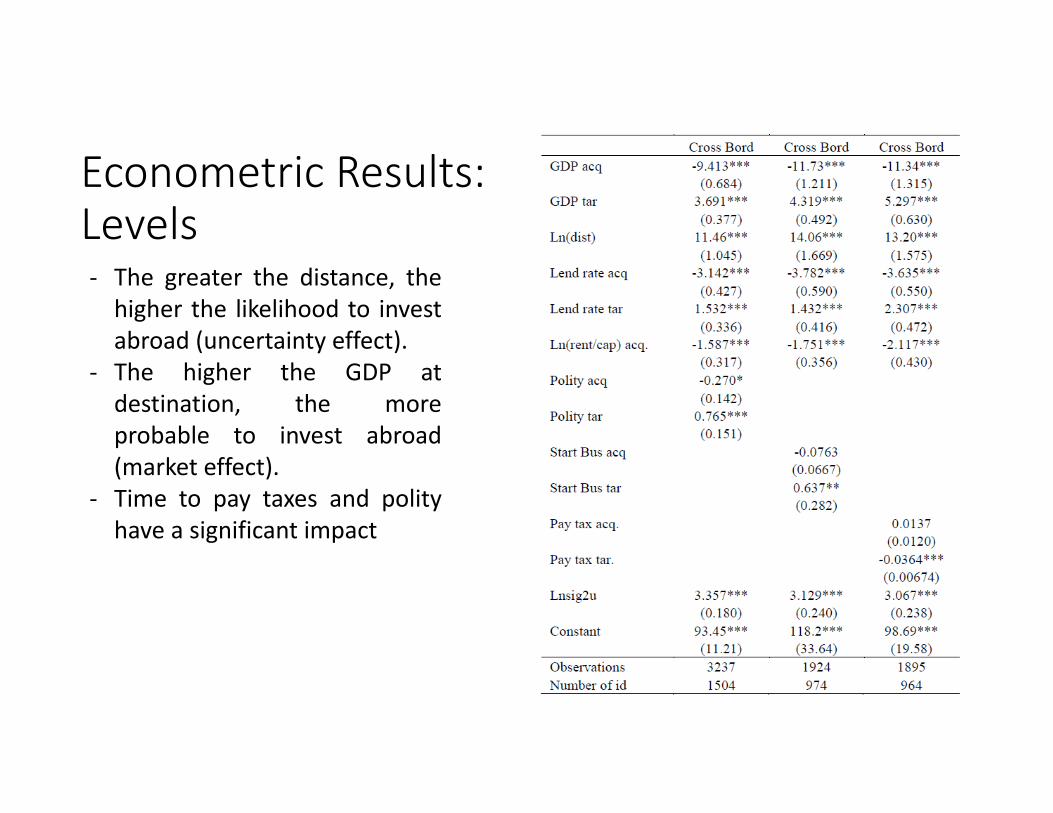
Econometric Results:Levels‐ The greater the distance, thehigher the likelihood to investabroad (uncertainty effect).
‐ The higher the GDP atdestination, the moreprobable to invest abroad(market effect).
‐ Time to pay taxes and polityhave a significant impact
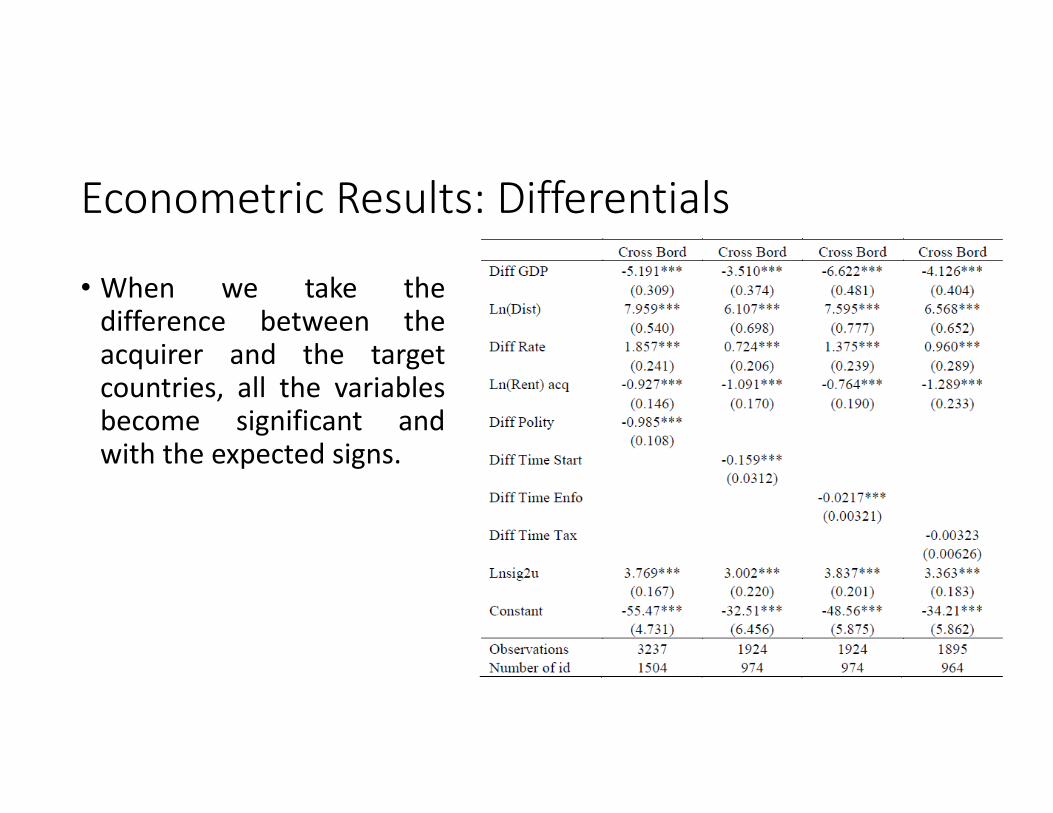
Econometric Results: Differentials
• When we take thedifference between theacquirer and the targetcountries, all the variablesbecome significant andwith the expected signs.
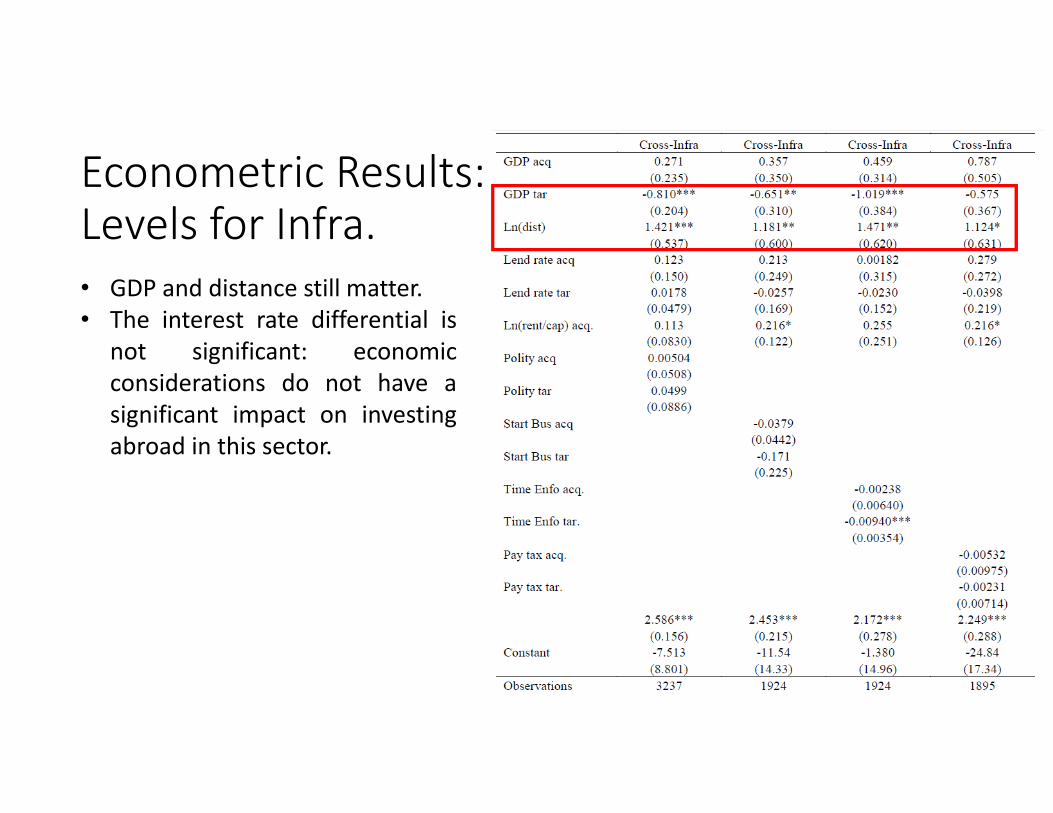
Econometric Results: Levels for Infra.• GDP and distance still matter.• The interest rate differential is
not significant: economicconsiderations do not have asignificant impact on investingabroad in this sector.
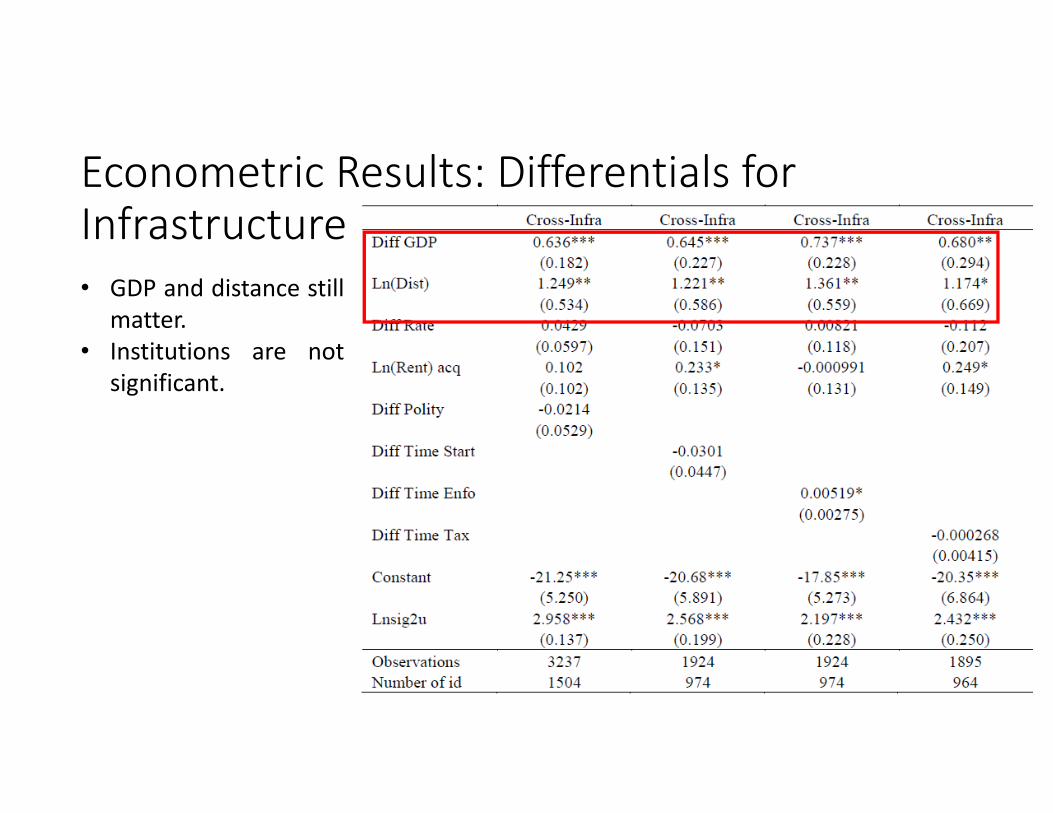
Econometric Results: Differentials for Infrastructure• GDP and distance still
matter.• Institutions are not
significant.
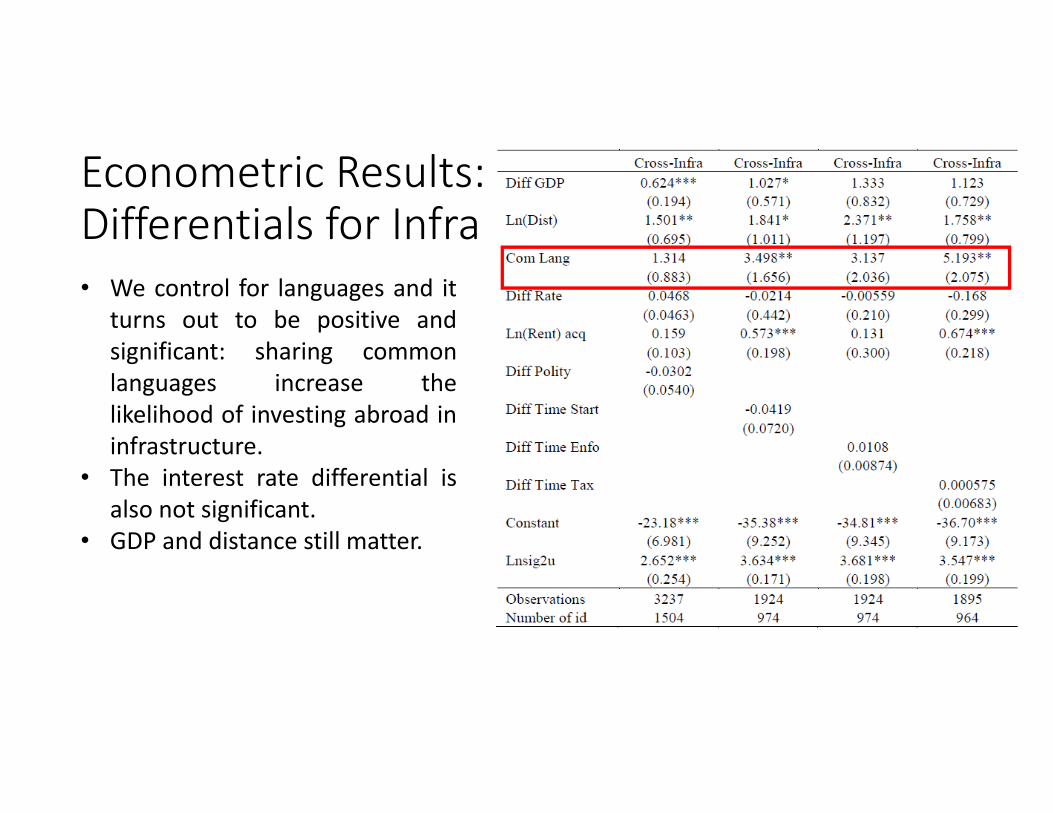
Econometric Results: Differentials for Infra• We control for languages and it
turns out to be positive andsignificant: sharing commonlanguages increase thelikelihood of investing abroad ininfrastructure.
• The interest rate differential isalso not significant.
• GDP and distance still matter.
Outline
• Literature review•Data•Methodology•Descriptive statistics• Econometric results•Conclusion
Conclusions
• Promising, yet very preliminary, results on determinants of cross‐border SWFs’ investment
• Plan to consider more econometric analysis, using:• Alternative sets of institutional variables• Measures of infrastructure deficits at home and abroad• Membership in regional economic or political groupings
• Account for SWFs institutional features, such as transparency, possiblyin a smaller sample for which data is available

Thanks for your attention