Suture Retention Strength of Expanded ... Retention Strength of Expanded Polytetrafluoroethylene...
8
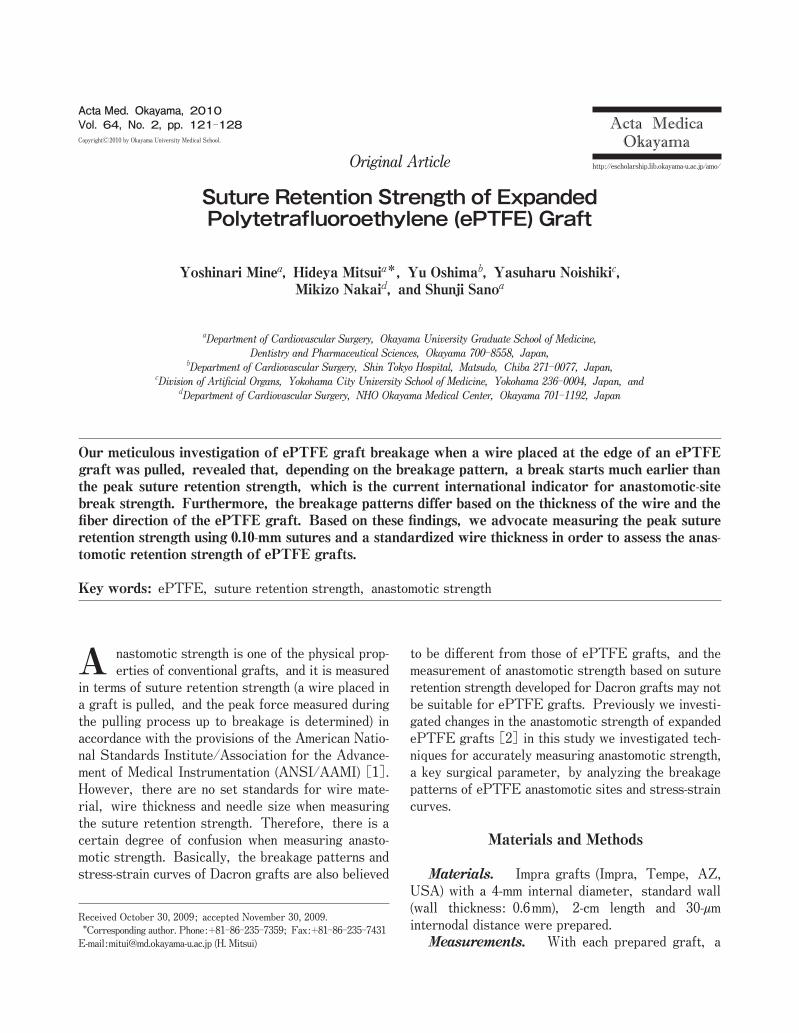
Suture Retention Strength of Expanded Polytetrafluoroethylene (ePTFE) Graft Yoshinari Mine a , Hideya Mitsui a* , Yu Oshima b , Yasuharu Noishiki c , Mikizo Nakai d , and Shunji Sano a a Department of Cardiovascular Surgery, Okayama University Graduate School of Medicine, Dentistry and Pharmaceutical Sciences, Okayama 700-8558, Japan, b Department of Cardiovascular Surgery, Shin Tokyo Hospital, Matsudo, Chiba 271-0077, Japan, c Division of Artificial Organs, Yokohama City University School of Medicine, Yokohama 236-0004, Japan, and d Department of Cardiovascular Surgery, NHO Okayama Medical Center, Okayama 701-1192, Japan Our meticulous investigation of ePTFE graft breakage when a wire placed at the edge of an ePTFE graft was pulled, revealed that, depending on the breakage pattern, a break starts much earlier than the peak suture retention strength, which is the current international indicator for anastomotic- site break strength. Furthermore, the breakage patterns differ based on the thickness of the wire and the fiber direction of the ePTFE graft. Based on these findings, we advocate measuring the peak suture retention strength using 0.10- mm sutures and a standardized wire thickness in order to assess the anas - tomotic retention strength of ePTFE grafts. Key words: ePTFE, suture retention strength, anastomotic strength nastomotic strength is one of the physical prop- erties of conventional grafts, and it is measured in terms of suture retention strength (a wire placed in a graft is pulled, and the peak force measured during the pulling process up to breakage is determined) in accordance with the provisions of the American Natio- nal Standards Institute/Association for the Advance- ment of Medical Instrumentation (ANSI/AAMI) [1]. However, there are no set standards for wire mate- rial, wire thickness and needle size when measuring the suture retention strength. Therefore, there is a certain degree of confusion when measuring anasto- motic strength. Basically, the breakage patterns and stress- strain curves of Dacron grafts are also believed to be different from those of ePTFE grafts, and the measurement of anastomotic strength based on suture retention strength developed for Dacron grafts may not be suitable for ePTFE grafts. Previously we investi- gated changes in the anastomotic strength of expanded ePTFE grafts [2] in this study we investigated tech- niques for accurately measuring anastomotic strength, a key surgical parameter, by analyzing the breakage patterns of ePTFE anastomotic sites and stress- strain curves. Materials and Methods Materials. Impra grafts (Impra, Tempe, AZ, USA) with a 4- mm internal diameter, standard wall (wall thickness: 0.6 mm), 2- cm length and 30- µm internodal distance were prepared. Measurements. With each prepared graft, a A Acta Med. Okayama, 2010 Vol. 64, No. 2, pp. 121ン128 CopyrightⒸ 2010 by Okayama University Medical School. Original Article http: // escholarship.lib.okayama-u.ac.jp / amo/ Received October 30, 2009 ; accepted November 30, 2009. * Corresponding author. Phone: + 81ン86ン235ン7359; Fax: + 81ン86ン235ン7431 E- mail:[email protected]- u.ac.jp (H. Mitsui)
-
Upload
hoangxuyen -
Category
Documents
-
view
219 -
download
0
Transcript of Suture Retention Strength of Expanded ... Retention Strength of Expanded Polytetrafluoroethylene...
Suture Retention Strength of Expanded Polytetrafluoroethylene (ePTFE) Graft
Yoshinari Minea, Hideya Mitsuia*, Yu Oshimab, Yasuharu Noishikic, Mikizo Nakaid, and Shunji Sanoa
aDepartment of Cardiovascular Surgery, Okayama University Graduate School of Medicine, Dentistry and Pharmaceutical Sciences, Okayama 700-8558, Japan,
bDepartment of Cardiovascular Surgery, Shin Tokyo Hospital, Matsudo, Chiba 271-0077, Japan, cDivision of Artificial Organs, Yokohama City University School of Medicine, Yokohama 236-0004, Japan, and
dDepartment of Cardiovascular Surgery, NHO Okayama Medical Center, Okayama 701-1192, Japan
Our meticulous investigation of ePTFE graft breakage when a wire placed at the edge of an ePTFE graft was pulled, revealed that, depending on the breakage pattern, a break starts much earlier than the peak suture retention strength, which is the current international indicator for anastomotic-site break strength. Furthermore, the breakage patterns differ based on the thickness of the wire and the fiber direction of the ePTFE graft. Based on these findings, we advocate measuring the peak suture retention strength using 0.10-mm sutures and a standardized wire thickness in order to assess the anas-tomotic retention strength of ePTFE grafts.
Key words: ePTFE, suture retention strength, anastomotic strength
nastomotic strength is one of the physical prop-erties of conventional grafts, and it is measured
in terms of suture retention strength (a wire placed in a graft is pulled, and the peak force measured during the pulling process up to breakage is determined) in accordance with the provisions of the American Natio-nal Standards Institute/Association for the Advance-ment of Medical Instrumentation (ANSI/AAMI) [1]. However, there are no set standards for wire mate-rial, wire thickness and needle size when measuring the suture retention strength. Therefore, there is a certain degree of confusion when measuring anasto-motic strength. Basically, the breakage patterns and stress-strain curves of Dacron grafts are also believed
to be different from those of ePTFE grafts, and the measurement of anastomotic strength based on suture retention strength developed for Dacron grafts may not be suitable for ePTFE grafts. Previously we investi-gated changes in the anastomotic strength of expanded ePTFE grafts [2] in this study we investigated tech-niques for accurately measuring anastomotic strength, a key surgical parameter, by analyzing the breakage patterns of ePTFE anastomotic sites and stress-strain curves.
Materials and Methods
Materials. Impra grafts (Impra, Tempe, AZ, USA) with a 4-mm internal diameter, standard wall (wall thickness: 0.6mm), 2-cm length and 30-µm internodal distance were prepared. Measurements. With each prepared graft, a
A
Acta Med. Okayama, 2010Vol. 64, No. 2, pp. 121ン128CopyrightⒸ 2010 by Okayama University Medical School.
Original Article http ://escholarship.lib.okayama-u.ac.jp/amo/
Received October 30, 2009 ; accepted November 30, 2009. *Corresponding author. Phone : +81ン86ン235ン7359; Fax : +81ン86ン235ン7431E-mail : [email protected] (H. Mitsui)
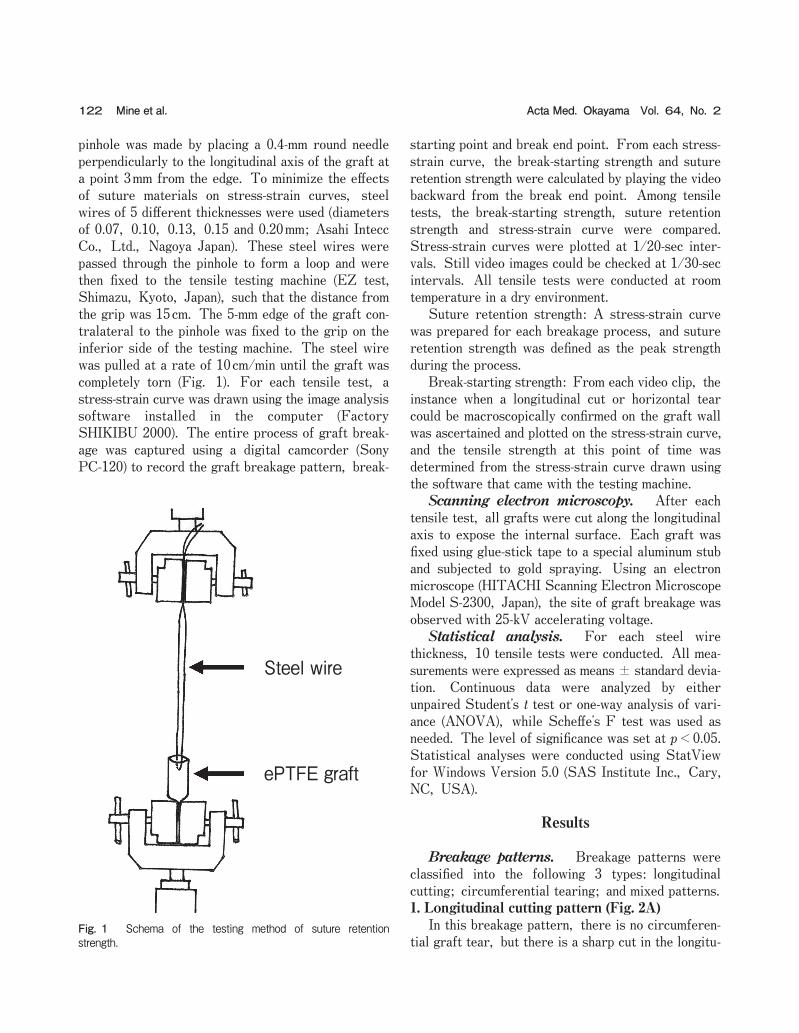
pinhole was made by placing a 0.4-mm round needle perpendicularly to the longitudinal axis of the graft at a point 3mm from the edge. To minimize the effects of suture materials on stress-strain curves, steel wires of 5 different thicknesses were used (diameters of 0.07, 0.10, 0.13, 0.15 and 0.20mm; Asahi Intecc Co., Ltd., Nagoya Japan). These steel wires were passed through the pinhole to form a loop and were then fixed to the tensile testing machine (EZ test, Shimazu, Kyoto, Japan), such that the distance from the grip was 15cm. The 5-mm edge of the graft con-tralateral to the pinhole was fixed to the grip on the inferior side of the testing machine. The steel wire was pulled at a rate of 10cm/min until the graft was completely torn (Fig. 1). For each tensile test, a stress-strain curve was drawn using the image analysis software installed in the computer (Factory SHIKIBU 2000). The entire process of graft break-age was captured using a digital camcorder (Sony PC-120) to record the graft breakage pattern, break-
starting point and break end point. From each stress-strain curve, the break-starting strength and suture retention strength were calculated by playing the video backward from the break end point. Among tensile tests, the break-starting strength, suture retention strength and stress-strain curve were compared. Stress-strain curves were plotted at 1/20-sec inter-vals. Still video images could be checked at 1/30-sec intervals. All tensile tests were conducted at room temperature in a dry environment. Suture retention strength: A stress-strain curve was prepared for each breakage process, and suture retention strength was defined as the peak strength during the process. Break-starting strength: From each video clip, the instance when a longitudinal cut or horizontal tear could be macroscopically confirmed on the graft wall was ascertained and plotted on the stress-strain curve, and the tensile strength at this point of time was determined from the stress-strain curve drawn using the software that came with the testing machine. Scanning electron microscopy. After each tensile test, all grafts were cut along the longitudinal axis to expose the internal surface. Each graft was fixed using glue-stick tape to a special aluminum stub and subjected to gold spraying. Using an electron microscope (HITACHI Scanning Electron Microscope Model S-2300, Japan), the site of graft breakage was observed with 25-kV accelerating voltage. Statistical analysis. For each steel wire thickness, 10 tensile tests were conducted. All mea-surements were expressed as means ± standard devia-tion. Continuous data were analyzed by either unpaired Studentʼs t test or one-way analysis of vari-ance (ANOVA), while Scheffeʼs F test was used as needed. The level of significance was set at p<0.05. Statistical analyses were conducted using StatView for Windows Version 5.0 (SAS Institute Inc., Cary, NC, USA).
Results
Breakage patterns. Breakage patterns were classified into the following 3 types: longitudinal cutting; circumferential tearing; and mixed patterns.1. Longitudinal cutting pattern (Fig. 2A) In this breakage pattern, there is no circumferen-tial graft tear, but there is a sharp cut in the longitu-
122 Acta Med. Okayama Vol. 64, No. 2Mine et al.
Steel wire
ePTFE graft
Fig. 1 Schema of the testing method of suture retention strength.
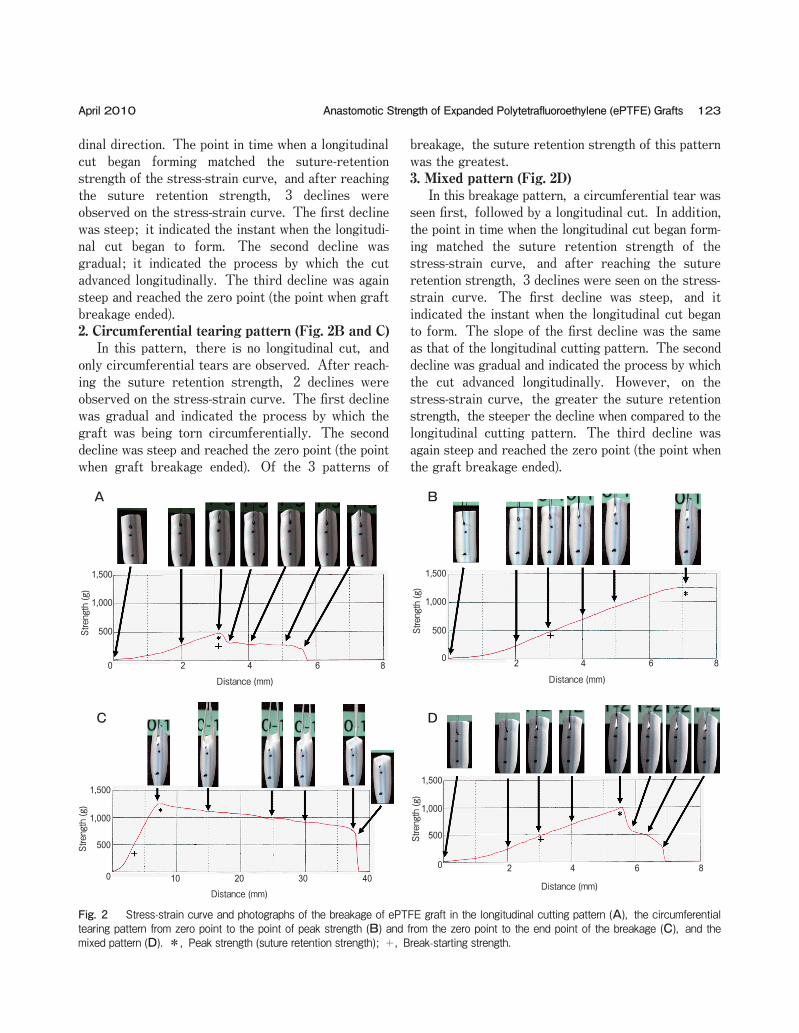
dinal direction. The point in time when a longitudinal cut began forming matched the suture-retention strength of the stress-strain curve, and after reaching the suture retention strength, 3 declines were observed on the stress-strain curve. The first decline was steep; it indicated the instant when the longitudi-nal cut began to form. The second decline was gradual; it indicated the process by which the cut advanced longitudinally. The third decline was again steep and reached the zero point (the point when graft breakage ended).2. Circumferential tearing pattern (Fig. 2B and C) In this pattern, there is no longitudinal cut, and only circumferential tears are observed. After reach-ing the suture retention strength, 2 declines were observed on the stress-strain curve. The first decline was gradual and indicated the process by which the graft was being torn circumferentially. The second decline was steep and reached the zero point (the point when graft breakage ended). Of the 3 patterns of
breakage, the suture retention strength of this pattern was the greatest.3. Mixed pattern (Fig. 2D) In this breakage pattern, a circumferential tear was seen first, followed by a longitudinal cut. In addition, the point in time when the longitudinal cut began form-ing matched the suture retention strength of the stress-strain curve, and after reaching the suture retention strength, 3 declines were seen on the stress-strain curve. The first decline was steep, and it indicated the instant when the longitudinal cut began to form. The slope of the first decline was the same as that of the longitudinal cutting pattern. The second decline was gradual and indicated the process by which the cut advanced longitudinally. However, on the stress-strain curve, the greater the suture retention strength, the steeper the decline when compared to the longitudinal cutting pattern. The third decline was again steep and reached the zero point (the point when the graft breakage ended).
123Anastomotic Strength of Expanded Polytetrafluoroethylene (ePTFE) GraftsApril 2010
A B
C D
1,500
1,000
500
0 2 4 6 8
Streng
th (g
)
Distance (mm)
1,500
1,000
500
0 10 20 30 40
Streng
th (g
)
Distance (mm)
1,500
1,000
500
0 2 4 6 8
Streng
th (g
)
Distance (mm)
1,500
1,000
500
0 2 4 6 8
Streng
th (g
)
Distance (mm)
Fig. 2 Stress-strain curve and photographs of the breakage of ePTFE graft in the longitudinal cutting pattern (A), the circumferential tearing pattern from zero point to the point of peak strength (B) and from the zero point to the end point of the breakage (C), and the mixed pattern (D). *, Peak strength (suture retention strength); +, Break-starting strength.
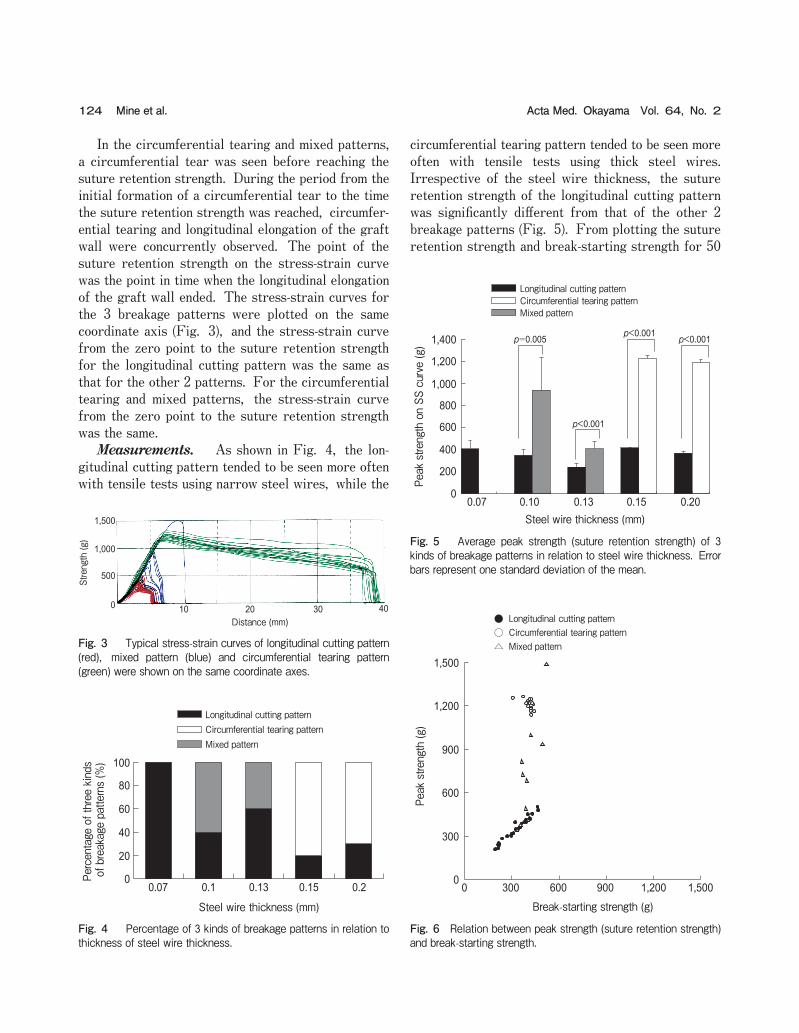
In the circumferential tearing and mixed patterns, a circumferential tear was seen before reaching the suture retention strength. During the period from the initial formation of a circumferential tear to the time the suture retention strength was reached, circumfer-ential tearing and longitudinal elongation of the graft wall were concurrently observed. The point of the suture retention strength on the stress-strain curve was the point in time when the longitudinal elongation of the graft wall ended. The stress-strain curves for the 3 breakage patterns were plotted on the same coordinate axis (Fig. 3), and the stress-strain curve from the zero point to the suture retention strength for the longitudinal cutting pattern was the same as that for the other 2 patterns. For the circumferential tearing and mixed patterns, the stress-strain curve from the zero point to the suture retention strength was the same. Measurements. As shown in Fig. 4, the lon-gitudinal cutting pattern tended to be seen more often with tensile tests using narrow steel wires, while the
circumferential tearing pattern tended to be seen more often with tensile tests using thick steel wires. Irrespective of the steel wire thickness, the suture retention strength of the longitudinal cutting pattern was significantly different from that of the other 2 breakage patterns (Fig. 5). From plotting the suture retention strength and break-starting strength for 50
124 Acta Med. Okayama Vol. 64, No. 2Mine et al.
1,500
1,000
500
0 10 20 30 40
Streng
th (g
)
Distance (mm)
Fig. 3 Typical stress-strain curves of longitudinal cutting pattern (red), mixed pattern (blue) and circumferential tearing pattern (green) were shown on the same coordinate axes.
Percentage of three kinds
of breakage patte
rns (%
)
Steel wire thickness (mm)
Longitudinal cutting pattern
Mixed patternCircumferential tearing pattern
100
80
60
40
20
00.07 0.1 0.13 0.15 0.2
Fig. 4 Percentage of 3 kinds of breakage patterns in relation to thickness of steel wire thickness.
0
300
600
900
1,200
1,500
0 300 600 900 1,200 1,500
Break-starting strength (g)
Peak stre
ngth (g
)
●
△○
Longitudinal cutting pattern
Mixed patternCircumferential tearing pattern
Fig. 6 Relation between peak strength (suture retention strength) and break-starting strength.
p=0.005
p<0.001
p<0.001 p<0.001
Peak stre
ngth on SS
curve (g
)
Steel wire thickness (mm)
Longitudinal cutting pattern
Mixed patternCircumferential tearing pattern
1,400
1,200
1,000
800
600
400
200
00.07 0.10 0.13 0.15 0.20
Fig. 5 Average peak strength (suture retention strength) of 3 kinds of breakage patterns in relation to steel wire thickness. Error bars represent one standard deviation of the mean.
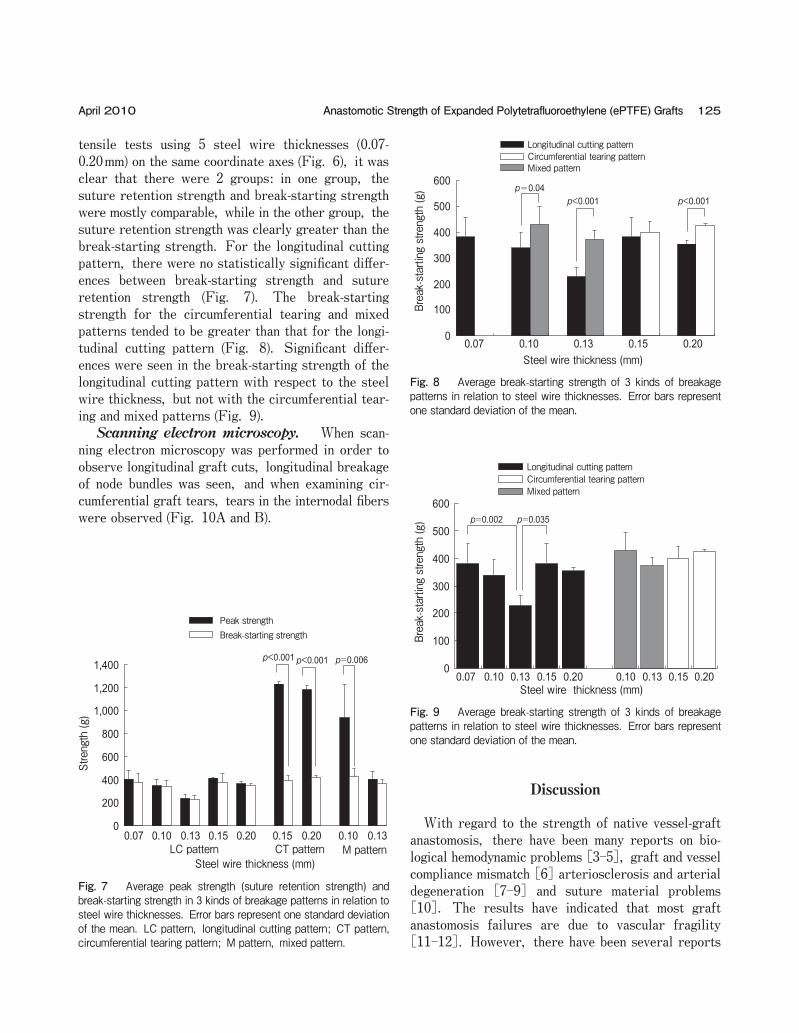
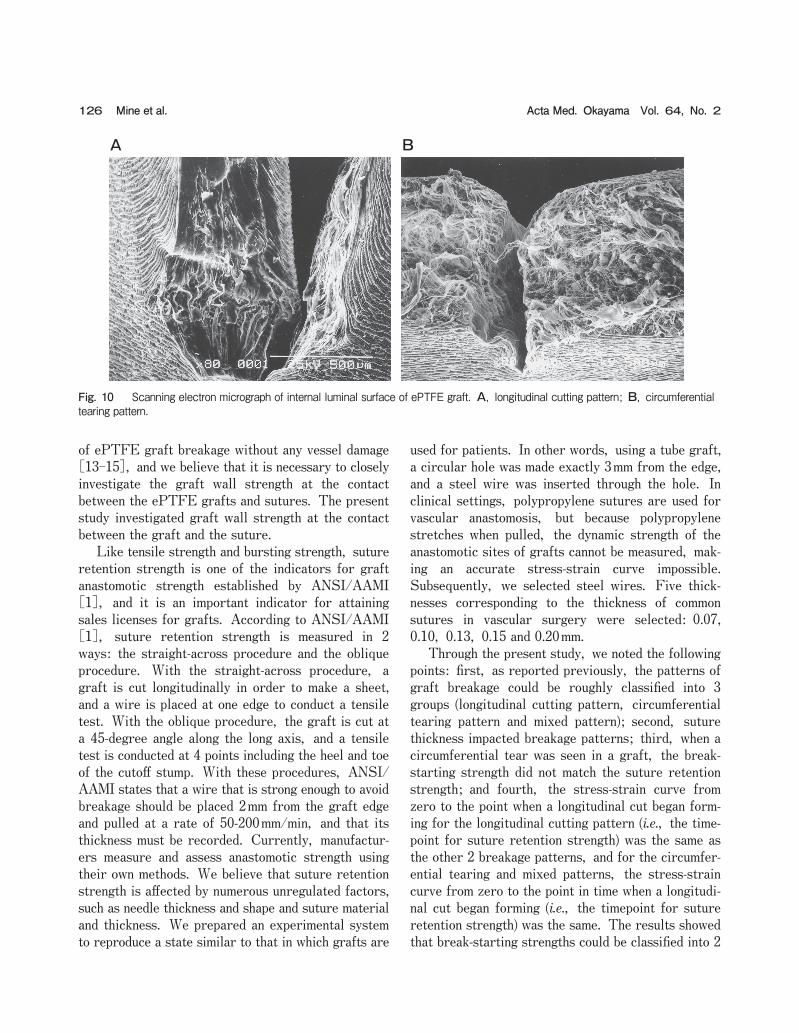
tensile tests using 5 steel wire thicknesses (0.07-0.20mm) on the same coordinate axes (Fig. 6), it was clear that there were 2 groups: in one group, the suture retention strength and break-starting strength were mostly comparable, while in the other group, the suture retention strength was clearly greater than the break-starting strength. For the longitudinal cutting pattern, there were no statistically significant differ-ences between break-starting strength and suture retention strength (Fig. 7). The break-starting strength for the circumferential tearing and mixed patterns tended to be greater than that for the longi-tudinal cutting pattern (Fig. 8). Significant differ-ences were seen in the break-starting strength of the longitudinal cutting pattern with respect to the steel wire thickness, but not with the circumferential tear-ing and mixed patterns (Fig. 9). Scanning electron microscopy. When scan-ning electron microscopy was performed in order to observe longitudinal graft cuts, longitudinal breakage of node bundles was seen, and when examining cir-cumferential graft tears, tears in the internodal fibers were observed (Fig. 10A and B).
Discussion
With regard to the strength of native vessel-graft anastomosis, there have been many reports on bio-logical hemodynamic problems [3-5], graft and vessel compliance mismatch [6] arteriosclerosis and arterial degeneration [7-9] and suture material problems [10]. The results have indicated that most graft anastomosis failures are due to vascular fragility [11-12]. However, there have been several reports
125Anastomotic Strength of Expanded Polytetrafluoroethylene (ePTFE) GraftsApril 2010
Steel wire thickness (mm)
p=0.04
0.07 0.10 0.13 0.15 0.20
p<0.001 p<0.001
Longitudinal cutting pattern
Mixed patternCircumferential tearing pattern
Break-startin
g strength (g
)
600
500
400
300
200
100
0
Fig. 8 Average break-starting strength of 3 kinds of breakage patterns in relation to steel wire thicknesses. Error bars represent one standard deviation of the mean.
0
200
400
600
800
1,000
1,200
1,400
Peak strengthBreak-starting strength
0.07 0.10 0.13 0.15 0.20 0.10 0.130.15 0.20
p=0.006p<0.001 p<0.001
Strength (g
)
Steel wire thickness (mm)LC pattern M patternCT pattern
Fig. 7 Average peak strength (suture retention strength) and break-starting strength in 3 kinds of breakage patterns in relation to steel wire thicknesses. Error bars represent one standard deviation of the mean. LC pattern, longitudinal cutting pattern; CT pattern, circumferential tearing pattern; M pattern, mixed pattern.
0
100
200
300
400
500
600
0.07 0.10 0.13 0.15 0.20 0.10 0.13 0.15 0.20
p=0.002 p=0.035
Steel wire thickness (mm)
Longitudinal cutting pattern
Mixed patternCircumferential tearing pattern
Break-startin
g strength (g
)
Fig. 9 Average break-starting strength of 3 kinds of breakage patterns in relation to steel wire thicknesses. Error bars represent one standard deviation of the mean.
of ePTFE graft breakage without any vessel damage [13-15], and we believe that it is necessary to closely investigate the graft wall strength at the contact between the ePTFE grafts and sutures. The present study investigated graft wall strength at the contact between the graft and the suture. Like tensile strength and bursting strength, suture retention strength is one of the indicators for graft anastomotic strength established by ANSI/AAMI [1], and it is an important indicator for attaining sales licenses for grafts. According to ANSI/AAMI [1], suture retention strength is measured in 2 ways: the straight-across procedure and the oblique procedure. With the straight-across procedure, a graft is cut longitudinally in order to make a sheet, and a wire is placed at one edge to conduct a tensile test. With the oblique procedure, the graft is cut at a 45-degree angle along the long axis, and a tensile test is conducted at 4 points including the heel and toe of the cutoff stump. With these procedures, ANSI/AAMI states that a wire that is strong enough to avoid breakage should be placed 2mm from the graft edge and pulled at a rate of 50-200mm/min, and that its thickness must be recorded. Currently, manufactur-ers measure and assess anastomotic strength using their own methods. We believe that suture retention strength is affected by numerous unregulated factors, such as needle thickness and shape and suture material and thickness. We prepared an experimental system to reproduce a state similar to that in which grafts are
used for patients. In other words, using a tube graft, a circular hole was made exactly 3mm from the edge, and a steel wire was inserted through the hole. In clinical settings, polypropylene sutures are used for vascular anastomosis, but because polypropylene stretches when pulled, the dynamic strength of the anastomotic sites of grafts cannot be measured, mak-ing an accurate stress-strain curve impossible. Subsequently, we selected steel wires. Five thick-nesses corresponding to the thickness of common sutures in vascular surgery were selected: 0.07, 0.10, 0.13, 0.15 and 0.20mm. Through the present study, we noted the following points: first, as reported previously, the patterns of graft breakage could be roughly classified into 3 groups (longitudinal cutting pattern, circumferential tearing pattern and mixed pattern); second, suture thickness impacted breakage patterns; third, when a circumferential tear was seen in a graft, the break-starting strength did not match the suture retention strength; and fourth, the stress-strain curve from zero to the point when a longitudinal cut began form-ing for the longitudinal cutting pattern (i.e., the time-point for suture retention strength) was the same as the other 2 breakage patterns, and for the circumfer-ential tearing and mixed patterns, the stress-strain curve from zero to the point in time when a longitudi-nal cut began forming (i.e., the timepoint for suture retention strength) was the same. The results showed that break-starting strengths could be classified into 2
126 Acta Med. Okayama Vol. 64, No. 2Mine et al.
A B
Fig. 10 Scanning electron micrograph of internal luminal surface of ePTFE graft. A, longitudinal cutting pattern; B, circumferential tearing pattern.
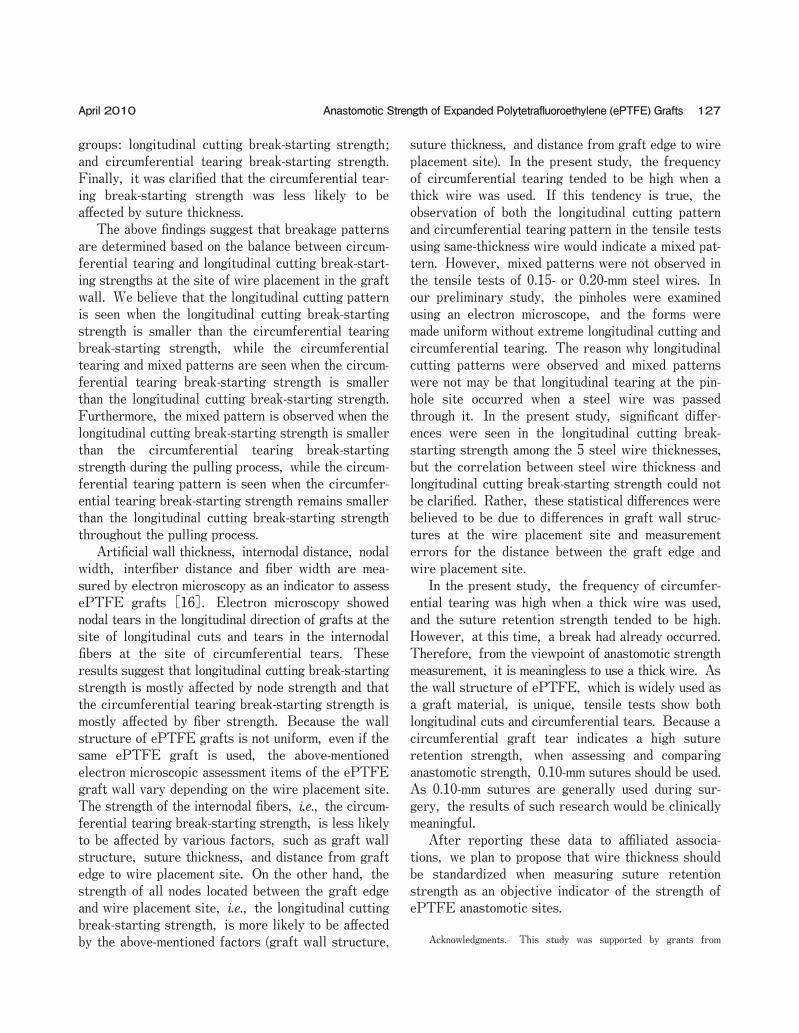
groups: longitudinal cutting break-starting strength; and circumferential tearing break-starting strength. Finally, it was clarified that the circumferential tear-ing break-starting strength was less likely to be affected by suture thickness. The above findings suggest that breakage patterns are determined based on the balance between circum-ferential tearing and longitudinal cutting break-start-ing strengths at the site of wire placement in the graft wall. We believe that the longitudinal cutting pattern is seen when the longitudinal cutting break-starting strength is smaller than the circumferential tearing break-starting strength, while the circumferential tearing and mixed patterns are seen when the circum-ferential tearing break-starting strength is smaller than the longitudinal cutting break-starting strength. Furthermore, the mixed pattern is observed when the longitudinal cutting break-starting strength is smaller than the circumferential tearing break-starting strength during the pulling process, while the circum-ferential tearing pattern is seen when the circumfer-ential tearing break-starting strength remains smaller than the longitudinal cutting break-starting strength throughout the pulling process. Artificial wall thickness, internodal distance, nodal width, interfiber distance and fiber width are mea-sured by electron microscopy as an indicator to assess ePTFE grafts [16]. Electron microscopy showed nodal tears in the longitudinal direction of grafts at the site of longitudinal cuts and tears in the internodal fibers at the site of circumferential tears. These results suggest that longitudinal cutting break-starting strength is mostly affected by node strength and that the circumferential tearing break-starting strength is mostly affected by fiber strength. Because the wall structure of ePTFE grafts is not uniform, even if the same ePTFE graft is used, the above-mentioned electron microscopic assessment items of the ePTFE graft wall vary depending on the wire placement site. The strength of the internodal fibers, i.e., the circum-ferential tearing break-starting strength, is less likely to be affected by various factors, such as graft wall structure, suture thickness, and distance from graft edge to wire placement site. On the other hand, the strength of all nodes located between the graft edge and wire placement site, i.e., the longitudinal cutting break-starting strength, is more likely to be affected by the above-mentioned factors (graft wall structure,
suture thickness, and distance from graft edge to wire placement site). In the present study, the frequency of circumferential tearing tended to be high when a thick wire was used. If this tendency is true, the observation of both the longitudinal cutting pattern and circumferential tearing pattern in the tensile tests using same-thickness wire would indicate a mixed pat-tern. However, mixed patterns were not observed in the tensile tests of 0.15- or 0.20-mm steel wires. In our preliminary study, the pinholes were examined using an electron microscope, and the forms were made uniform without extreme longitudinal cutting and circumferential tearing. The reason why longitudinal cutting patterns were observed and mixed patterns were not may be that longitudinal tearing at the pin-hole site occurred when a steel wire was passed through it. In the present study, significant differ-ences were seen in the longitudinal cutting break-starting strength among the 5 steel wire thicknesses, but the correlation between steel wire thickness and longitudinal cutting break-starting strength could not be clarified. Rather, these statistical differences were believed to be due to differences in graft wall struc-tures at the wire placement site and measurement errors for the distance between the graft edge and wire placement site. In the present study, the frequency of circumfer-ential tearing was high when a thick wire was used, and the suture retention strength tended to be high. However, at this time, a break had already occurred. Therefore, from the viewpoint of anastomotic strength measurement, it is meaningless to use a thick wire. As the wall structure of ePTFE, which is widely used as a graft material, is unique, tensile tests show both longitudinal cuts and circumferential tears. Because a circumferential graft tear indicates a high suture retention strength, when assessing and comparing anastomotic strength, 0.10-mm sutures should be used. As 0.10-mm sutures are generally used during sur-gery, the results of such research would be clinically meaningful. After reporting these data to affiliated associa-tions, we plan to propose that wire thickness should be standardized when measuring suture retention strength as an objective indicator of the strength of ePTFE anastomotic sites.
Acknowledgments. This study was supported by grants from
127Anastomotic Strength of Expanded Polytetrafluoroethylene (ePTFE) GraftsApril 2010
Terumo Life Science Foundation. There is no conflict of interest. The authors wish to thank Mr Takashi Kakazu (Advanced Research Institute for Science and Engineering, Waseda University) for the offer of experi-mental material.
References
1. Cardiovascular implants-vascular prostheses. Association for the Advancement of Medical Instrumentation, ANSI/AAMI VP20-1994. (Revision of ANSI/AAMI VP20-1986), Association for the Advance-ment of Medical Instrumentation, Arlington, VA, (1994).
2. Mine Y, Mitsui H, Oshima Y, Nakai M, Noishiki Y and Sano S: Anastomotic strength of expanded polytetrafluoroethylene graft. J Jpn Coll Angiol (2003) 43: 185-189 (in Japanese).
3. Yokobori AT, Yokobori T, Ouchi H and Sasaki H: The experimen-tal simulation of elastic model of artery system (some behavior of vascular substitute under repeated internal stress). Fracture mechanics and technology. Sih G ed, 1st Ed, the Netherland (1977) pp 623-638.
4. Yokobori AT, Maeyama T, Ohkuma T, Yokobori T, Ohuchi H, Nara S, Sasaki H and Kasai M: Bio-medico-mechanical behavior of natural artery blood vessel under constant and variable internal pulsatile pressure flow test in vitro. J Biomech Eng (1986) 108: 295-300.
5. Yokobori AT and Jian C: Stress analysis around the anastomotic site between vascular substitute and blood vessel. Seitaizairyo (1992) 10: 59-65 (in Japanese).
6. Mehigan DG, Fitzpatrick B, Browne HI and Bouchier-Hayes DJ: Is compliance mismatch the major cause of anastomotic arterial aneurysms? Analysis of 42 cases. J Cardiovasc Surg (1985) 26: 147-150.
7. Stoney RJ, Albo RJ and Wylie EJ: False aneurysms occurring after arterial grafting operations. Am J Surg (1965) 110: 153-161.
8. Sawyers JL, Jacobs JK and Sutton JP: Peripheral anastomotic aneurysms. Arch Surg (1967) 95: 802-809.
9. Gardner TJ, Brawley RK and Gott VL: Anastomotic false aneu-rysms. Surgery (1972) 72: 474-478.
10. Starr DS, Weatherford SC, Lawrie GM and Morris GC Jr: Suture material as a factor in the occurrence of anastomotic false aneu-rysms. Arch Surg (1979) 114: 412-415.
11. Clagett GP, Salander JM, Eddleman WL, Cabellon S Jr, Youkey JR, Olson DW, Hutton JE Jr and Rich NM: Dilation of knitted Dacron aortic prostheses and anastomotic false aneurysms: Etiologic considerations. Surgery (1983) 93: 9-16.
12. Szilagyi DE, Smith RF, Elliott JP, Hageman JH and DallʼOlmo CA: Anastomotic aneurysms after vascular reconstruction: Problems of incidence, etiology, and treatment. Surgery (1975) 78: 800-816.
13. Sullivan LP, Davidson PG, DʼAnna JA Jr and Sithian N: Disruption of the proximal anastomosis of axillobifemoral grafts: 2 case reports. J Vasc Surg (1989) 10: 190-192.
14. Brophy CM, Quist WC, Kwolek C and LoGerfo FW: Disruption of proximal axillobifemoral bypass graft anastomosis. J Vasc Surg (1992) 15: 218-220.
15. Taylor LM Jr, Park TC, Edwards JM, Yeager RA, McConnell DC, Moneta GA and Porter JM: Acute disruption of polytetrafluoroeth-ylene grafts adjacent to axillary anastomosis: A complication of axillofemoral grafting. J Vasc Surg (1994) 20: 520-528.
16. Salzmann DL, Yee DC, Roach DJ, Berman SS and Williams SK: Effects of balloon dilatation on ePTFE structural characteristics. J Biomed Mater Res(1997) 36: 498-507.
128 Acta Med. Okayama Vol. 64, No. 2Mine et al.