Supplementary Information for Distinct mechanisms for ... · Supplementary Information for Distinct...
78
Supplementary Information for Distinct mechanisms for spiro-carbon formation reveal biosynthetic pathway crosstalk Yuta Tsunematsu, 1 Noriyasu Ishikawa, 1 Daigo Wakana, 2 Yukihiro Goda, 2 Hiroshi Noguchi, 1 Hisao Moriya, 3 Kinya Hotta, 4 Kenji Watanabe 1* 1 Department of Pharmaceutical Sciences, University of Shizuoka, Shizuoka 422-8526, Japan 2 National Institute of Health Sciences, Tokyo 158-8501, Japan 3 Research Core for Interdisciplinary Sciences, Okayama University, Okayama 700-8530, Japan 4 School of Biosciences, The University of Nottingham Malaysia Campus, Selangor 43500, Malaysia *Correspondence e-mail: [email protected] Nature Chemical Biology: doi:10.1038/nchembio.1366
Transcript of Supplementary Information for Distinct mechanisms for ... · Supplementary Information for Distinct...

Supplementary Information for
Distinct mechanisms for spiro-carbon formation reveal biosynthetic pathway
crosstalk
Yuta Tsunematsu,1 Noriyasu Ishikawa,1 Daigo Wakana,2 Yukihiro Goda,2 Hiroshi Noguchi,1 Hisao Moriya,3 Kinya Hotta,4 Kenji Watanabe1*
1Department of Pharmaceutical Sciences, University of Shizuoka, Shizuoka 422-8526, Japan
2National Institute of Health Sciences, Tokyo 158-8501, Japan
3Research Core for Interdisciplinary Sciences, Okayama University, Okayama 700-8530, Japan
4School of Biosciences, The University of Nottingham Malaysia Campus,
Selangor 43500, Malaysia
*Correspondence e-mail: [email protected]
Nature Chemical Biology: doi:10.1038/nchembio.1366

- 2 -
Table of Contents
1. Supplementary Results ..................................................................................................... 4–47 1.1 UV trace from HPLC analysis of extracts of SCKW5/ftmA, and NMR
characterization of brevianamide F 1. ......................................................................... 4–6 1.2 UV trace from HPLC analysis of extracts of SCKW5/ftmA/ftmB, and NMR
characterization of tryprostatin B 2. ............................................................................ 7–9 1.3 UV trace from HPLC analysis of extracts of SCKW5/ftmC/ftmD for the
bioconversion of 2 to desmethyltryprostatin A 3 and 4. ......................................... 10–11 1.4 LC–HRMS analysis of extracts of A. fumigatus NBRC 4057, and UV/Vis and
NMR spectroscopic characterizations of tryprostatin A 4. ..................................... 12–14 1.5 UV trace from HPLC analysis of extracts of SCKW5/ftmA/ftmB/ftmE, and
NMR characterization of demethoxyfumitremorgin C 6. ....................................... 15–17 1.6 NMR characterization of tryprostatin B-indoline-2,3-diol 15. ................................ 18–21 1.7 NMR characterization of tryprostatin A-indoline-2,3-diol 17a. ............................. 22–25 1.8 NMR characterization of 17b, the diastereomer of 17a. ......................................... 26–27 1.9 NMR characterization of tryprostatin A-2-oxindole 18. ......................................... 28–31 1.10 NMR characterization of spirotryprostatin A 10. .................................................... 32–33 1.11 NMR characterization of spirotryprostatin B 9. ...................................................... 34–35 1.12 NMR characterization of demethoxyfumitremorgin C-monool 7. .......................... 36–39 1.13 NMR characterization of demethoxyfumitremorgin C-diol 8. ................................ 40–43 1.14 NMR characterization of spirotryprostatin G 11. .................................................... 44–47
2. Supplementary Notes ...................................................................................................... 48–81 2.1 Supplementary Note 1. Strain and plasmid preparation, gene expression
analysis and preliminary protein production and activity assays. ........................... 48–72 2.1.1 Construction of the S. cerevisiae expression vectors. ........................................ 48–56 2.1.1.1 S. cerevisiae BY4741 transformation and homologous recombination
protocol. ......................................................................................................... 48–49 2.1.1.2 Construction of base vectors pKW1250 and pKW5012 for expression of
heterologous genes in S. cerevisiae. .................................................................... 49 2.1.1.3 Cloning of the fumitremorgin biosynthetic genes. ........................................ 50–51 2.1.1.4 Construction of pKW5011 for expression of ftmB. ............................................. 51 2.1.1.5 Construction of pKW5038 for expression of ftmA. ....................................... 51–52 2.1.1.6 Construction of pKW5036 for expression of ftmB, ftmE and S. cerevisiae
NCP1. ............................................................................................................. 52–53 2.1.1.7 Construction of pKW5052 (ftmC), pKW5049 (ftmD) and pKW5054
(ftmA+ftmC+ftmD). ........................................................................................ 53–54 2.1.1.8 Construction of pKW1282 (ftmC) and pKW5067 (ftmD) for bioconversion
of 2 to 4. ......................................................................................................... 54–55 2.1.1.9 Construction of S. cerevisiae NCP1-expression vectors pKW9250 and
pKW5072 for bioconversion of 2 to 4. .......................................................... 55–56
Nature Chemical Biology: doi:10.1038/nchembio.1366

- 3 -
2.1.1.10 Construction of pKW8015 and pKW20006 for expression of fqzB. ................... 56
Supplementary Table 14. Oligonucleotide primer sequences. ....................................... 57–61
2.1.2 Confirmation of the expression of cloned fungal genes in S. cerevisiae. ................. 62 2.1.3 Construction of pKW5091 for expression of ftmD in E. coli. ............................ 63–64 2.1.4 Confirmation of the expression of ftmD in E. coli. .................................................. 64 2.1.5 Characterization of in vitro activity of FtmD prepared in E. coli. ............................ 65 2.1.6 Inspection of simultaneous expression of fumitremorgin and fumiquinazoline
biosynthetic genes in A. fumigatus A1159. .............................................................. 65 2.1.7 Construction of pKW20093, pKW20131, pKW20135, pKW20136,
pKW20137, pKW20142, pKW20144 and pKW20146 for de novo production of 1−10 in A. niger. ............................................................................................. 66–71
2.1.8 Construction of pKW20138 for expression of ftmG in S. cerevisiae. ...................... 72
2.2 Supplementary Note 2. FqzB protein preparation and analysis. ........................... 73–74 2.2.1 Protein production and purification of FqzB. ..................................................... 73–74 2.2.2 Preparative-scale in vitro reaction with FqzB for structure elucidation of 17a,
17b and 18. ............................................................................................................... 74
2.3 Supplementary Note 3. Heterologous de novo biosynthesis of 1–10 in A. niger. . 75–77 2.3.1 Transformation and cultivation of A. niger for de novo production of 1–10. . ... 75–77 2.3.2 Mass spectrometric characterization of 12 prepared in this study. ........................... 77
3. Supplementary References ................................................................................................... 78
Nature Chemical Biology: doi:10.1038/nchembio.1366
- 4 -
1. Supplementary Results
1.1 UV trace from HPLC analysis of extracts of SCKW5/ftmA, and NMR characterization of
brevianamide F 1.
Supplementary Figure 1. HPLC traces of metabolic extracts from the engineered yeast (a)
SCKW5/ftmA and (b) SCKW5 strains. All traces were monitored at 280 nm.
Nature Chemical Biology: doi:10.1038/nchembio.1366
- 5 -
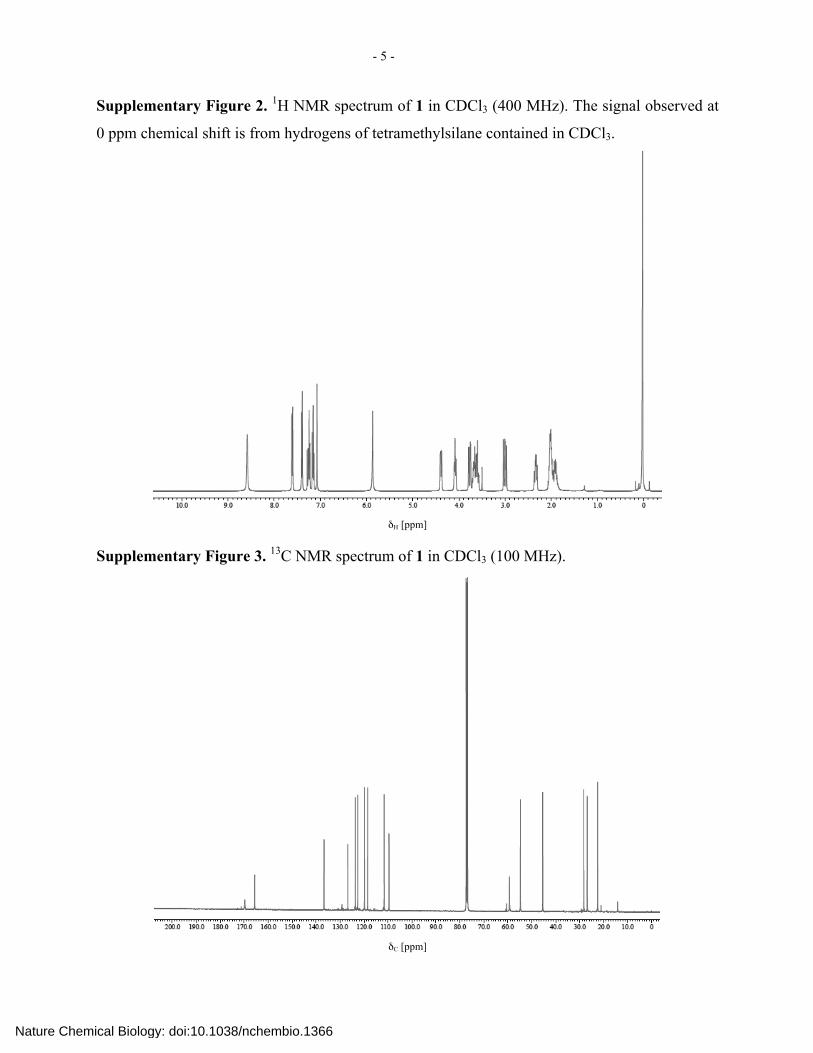
Supplementary Figure 2. 1H NMR spectrum of 1 in CDCl3 (400 MHz). The signal observed at
0 ppm chemical shift is from hydrogens of tetramethylsilane contained in CDCl3.
δH [ppm]
Supplementary Figure 3. 13C NMR spectrum of 1 in CDCl3 (100 MHz).
δC [ppm]
Nature Chemical Biology: doi:10.1038/nchembio.1366

- 6 -
Supplementary Table 1. NMR data of brevianamide F 1 in CDCl3. The molecular formula of 1
was established by mass data [ESI-MS: m/z 284 (M+H)+; HRESIMS: m/z 284.1396 (M+H)+,
calcd. for C16H18N3O2+, 284.1394, Δ = 0.2 mmu].
Position δH [ppm] mult. (J in Hz)1 δH [ppm] mult. (J in Hz) δC [ppm]2 δC [ppm] 1 (NH) 8.15 s 8.56 br s
2 7.10 d (2.0) 7.05 d(2.0) 123.3 123.7
3 109.9 109.7
3a 126.7 126.8
4 7.57 d (7.8) 7.59 d (7.8) 118.5 118.6
5 7.14 td (7.2, 1.0) 7.13 td (7.2, 1.0) 122.7 122.7
6 7.22 td (7.2, 1.2) 7.21 td (7.2, 1.2) 120.0 120.0
7 7.38 d (8.1) 7.38 d (7.8) 111.5 111.6
7a 136.6 136.8
8 2.95 dd (15.1, 10.9) 2.98 dd (15.0, 10.8) 26.8 27.0
3.75 ddd (15.1, 3.0, 0.6) 3.74 ddd (15.0. 2.8, 0.6)
9 4.36 dd (11.0, 2.8) 4.36 dd (10.8, 2.8) 54.5 54.8
10 (NH) 5.68 br s 5.85 br s
11 169.3 169.9
12 4.06 t (7.6) 4.06 t (7.6) 59.2 59.4
13
14 165.4 165.7
15 3.63 m 3.61 m 45.4 45.5
16 1.91 m 1.90 m 22.6 22.7
17 2.30 m 2.32 m 28.3 28.3
1.99 m 2.01 m 1H and 13C NMR spectra were recorded at 400 MHz and 100 MHz, respectively. 1) Reported 1H chemical shifts for 11. 2) Reported 13C chemical shifts for 12.
Nature Chemical Biology: doi:10.1038/nchembio.1366
- 7 -
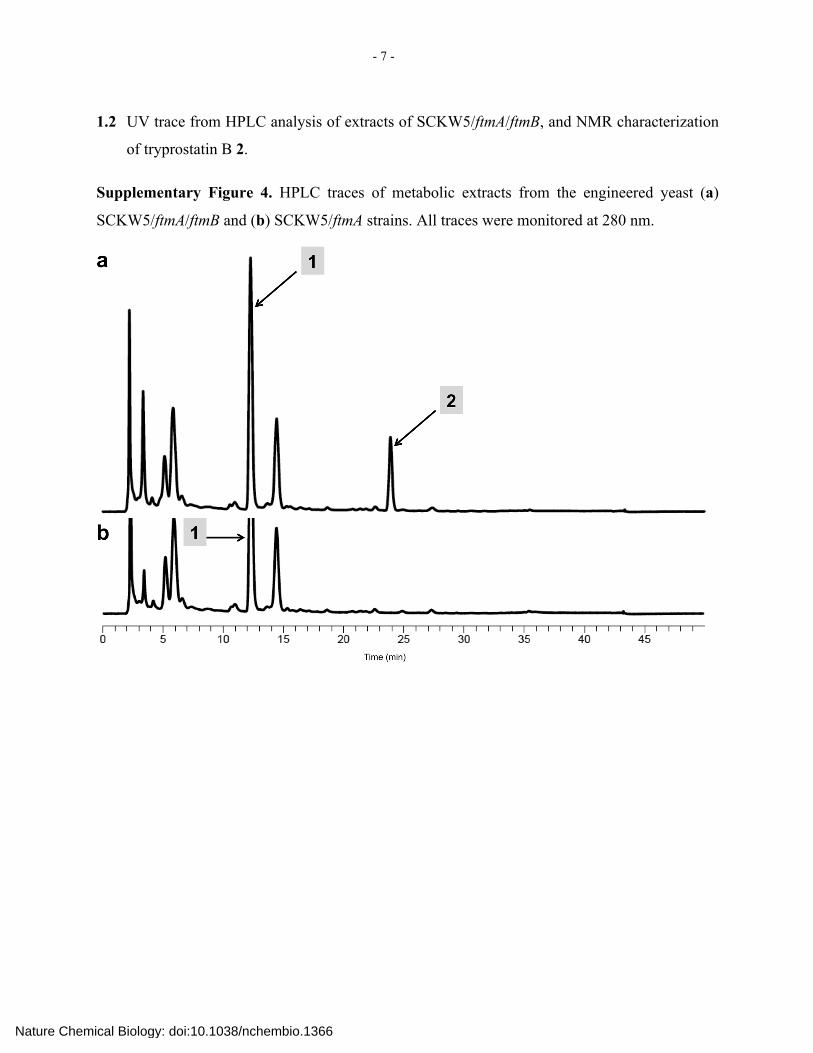
1.2 UV trace from HPLC analysis of extracts of SCKW5/ftmA/ftmB, and NMR characterization
of tryprostatin B 2.
Supplementary Figure 4. HPLC traces of metabolic extracts from the engineered yeast (a)
SCKW5/ftmA/ftmB and (b) SCKW5/ftmA strains. All traces were monitored at 280 nm.
Nature Chemical Biology: doi:10.1038/nchembio.1366
- 8 -
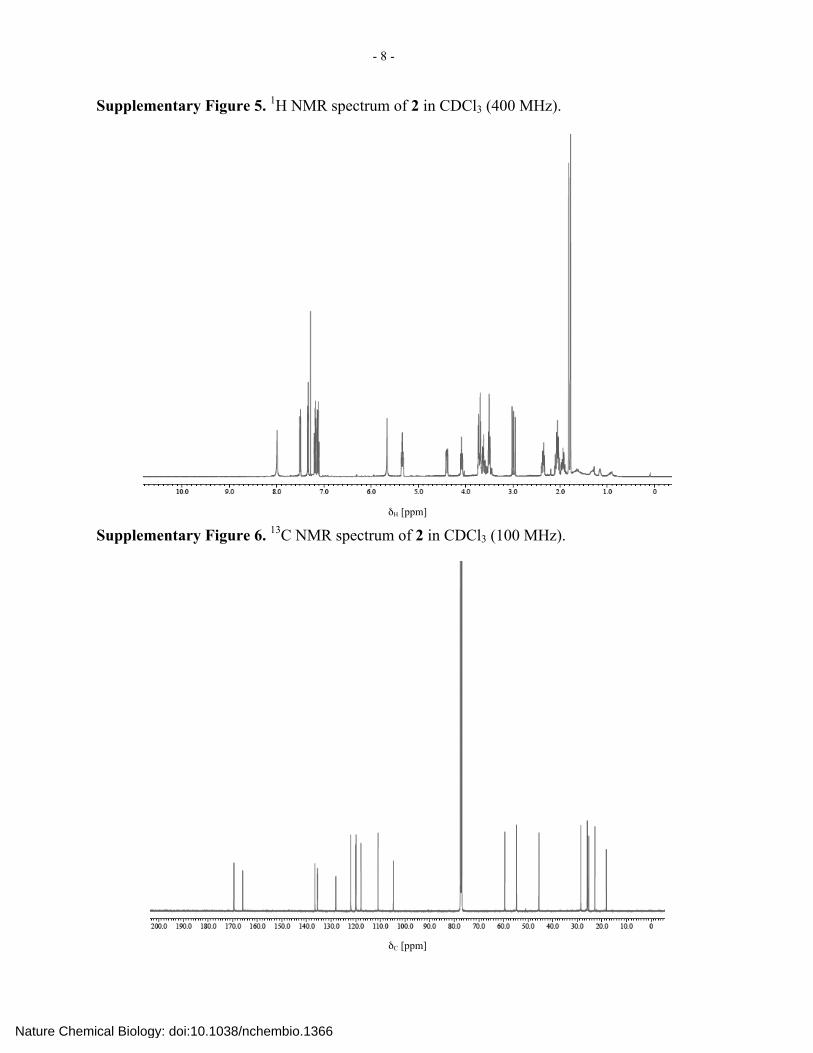
Supplementary Figure 5. 1H NMR spectrum of 2 in CDCl3 (400 MHz).
δH [ppm]
Supplementary Figure 6. 13C NMR spectrum of 2 in CDCl3 (100 MHz).
δC [ppm]
Nature Chemical Biology: doi:10.1038/nchembio.1366
- 9 -
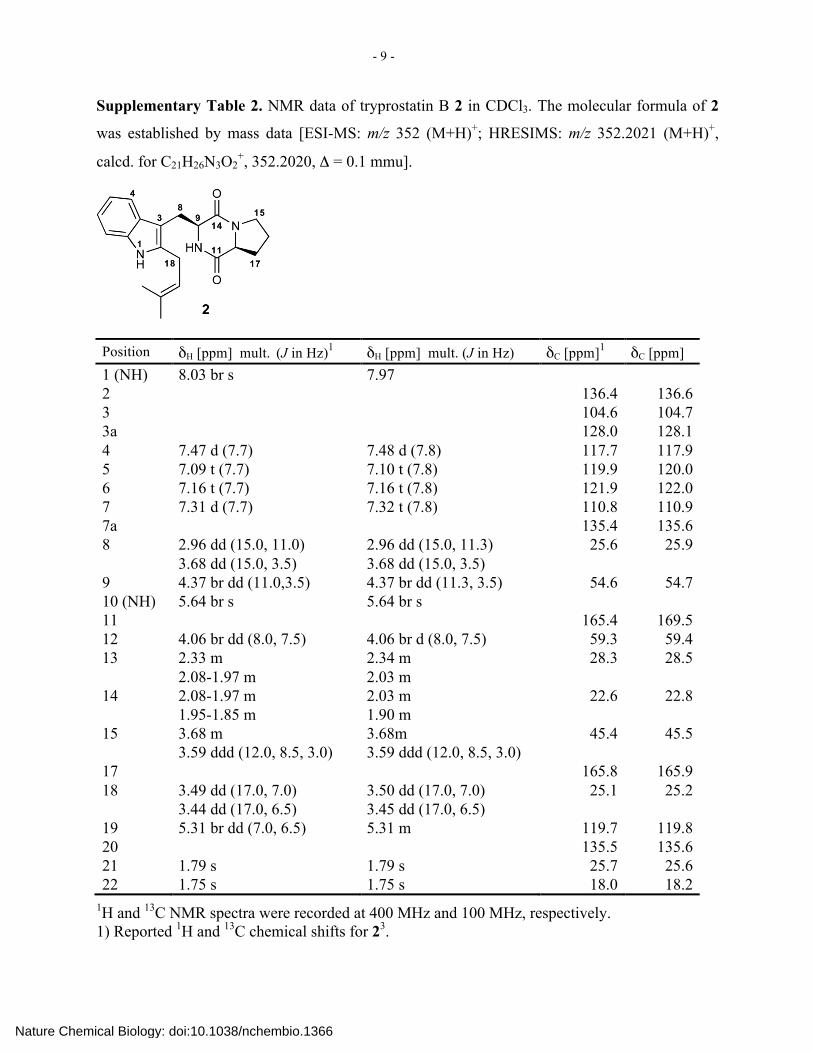
Supplementary Table 2. NMR data of tryprostatin B 2 in CDCl3. The molecular formula of 2
was established by mass data [ESI-MS: m/z 352 (M+H)+; HRESIMS: m/z 352.2021 (M+H)+,
calcd. for C21H26N3O2+, 352.2020, Δ = 0.1 mmu].
Position δH [ppm] mult. (J in Hz)1 δH [ppm] mult. (J in Hz) δC [ppm]1 δC [ppm] 1 (NH) 8.03 br s 7.97 2 136.4 136.6 3 104.6 104.7 3a 128.0 128.1 4 7.47 d (7.7) 7.48 d (7.8) 117.7 117.9 5 7.09 t (7.7) 7.10 t (7.8) 119.9 120.0 6 7.16 t (7.7) 7.16 t (7.8) 121.9 122.0 7 7.31 d (7.7) 7.32 t (7.8) 110.8 110.9 7a 135.4 135.6 8 2.96 dd (15.0, 11.0) 2.96 dd (15.0, 11.3) 25.6 25.9 3.68 dd (15.0, 3.5) 3.68 dd (15.0, 3.5) 9 4.37 br dd (11.0,3.5) 4.37 br dd (11.3, 3.5) 54.6 54.7 10 (NH) 5.64 br s 5.64 br s 11 165.4 169.5 12 4.06 br dd (8.0, 7.5) 4.06 br d (8.0, 7.5) 59.3 59.4 13 2.33 m 2.34 m 28.3 28.5 2.08-1.97 m 2.03 m 14 2.08-1.97 m 2.03 m 22.6 22.8 1.95-1.85 m 1.90 m 15 3.68 m 3.68m 45.4 45.5 3.59 ddd (12.0, 8.5, 3.0) 3.59 ddd (12.0, 8.5, 3.0) 17 165.8 165.9 18 3.49 dd (17.0, 7.0) 3.50 dd (17.0, 7.0) 25.1 25.2 3.44 dd (17.0, 6.5) 3.45 dd (17.0, 6.5) 19 5.31 br dd (7.0, 6.5) 5.31 m 119.7 119.8 20 135.5 135.6 21 1.79 s 1.79 s 25.7 25.6 22 1.75 s 1.75 s 18.0 18.2
1H and 13C NMR spectra were recorded at 400 MHz and 100 MHz, respectively. 1) Reported 1H and 13C chemical shifts for 23.
Nature Chemical Biology: doi:10.1038/nchembio.1366
- 10 -
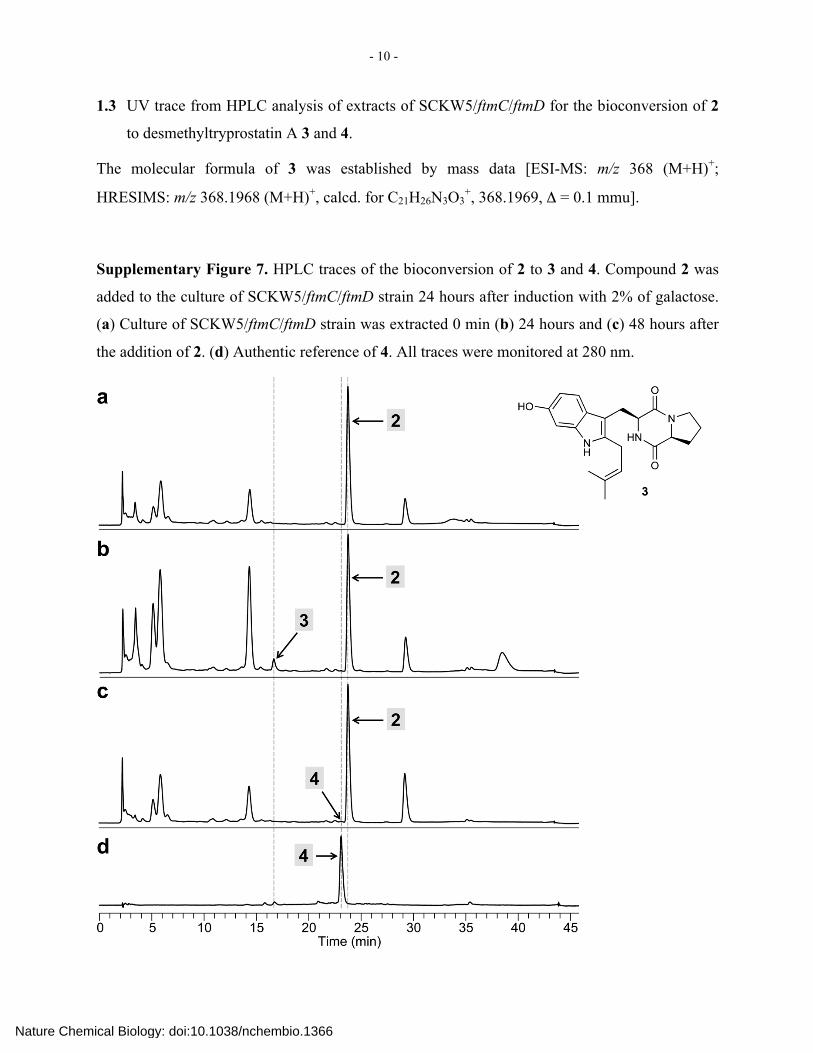
1.3 UV trace from HPLC analysis of extracts of SCKW5/ftmC/ftmD for the bioconversion of 2
to desmethyltryprostatin A 3 and 4.
The molecular formula of 3 was established by mass data [ESI-MS: m/z 368 (M+H)+;
HRESIMS: m/z 368.1968 (M+H)+, calcd. for C21H26N3O3+, 368.1969, Δ = 0.1 mmu].
Supplementary Figure 7. HPLC traces of the bioconversion of 2 to 3 and 4. Compound 2 was
added to the culture of SCKW5/ftmC/ftmD strain 24 hours after induction with 2% of galactose.
(a) Culture of SCKW5/ftmC/ftmD strain was extracted 0 min (b) 24 hours and (c) 48 hours after
the addition of 2. (d) Authentic reference of 4. All traces were monitored at 280 nm.
Nature Chemical Biology: doi:10.1038/nchembio.1366

- 11 -
Supplementary Figure 8. Selected ionization mass spectrum of (a) 2 (m/z = 352), (b) 3 (m/z =
368) and (c) 4 (m/z = 382), showing the presence of those compounds in the sample.
Supplementary Figure 9. Extracted LC trace corresponding to the m/z for (a) 2 (m/z = 352), (b)
3 (m/z = 368), (c) 4 (m/z = 382) and (d) authentic reference of 4 (m/z = 382). The raw LC trace
(as shown in Sup. Fig. 7) is shown in red for comparison. Peak heights are not to scale.
Nature Chemical Biology: doi:10.1038/nchembio.1366

- 12 -
1.4 LC–HRMS analysis of extracts of A. fumigatus NBRC 4057, and UV/Vis and NMR
spectroscopic characterizations of tryprostatin A 4.
Supplementary Figure 10. LC–HRMS analysis of extracts from A. fumigatus NBRC 4057 (a)
HPLC trace of metabolic extracts monitored at 280 nm, (b) HRMS spectrum and (c) UV
spectrum of 4.
Nature Chemical Biology: doi:10.1038/nchembio.1366

- 13 -
Supplementary Figure 11. 1H NMR spectrum of 4 in CDCl3 (400 MHz).
δH [ppm]
Supplementary Figure 12. 13C NMR spectrum of 4 in CDCl3 (100 MHz).
δC[ppm]
Nature Chemical Biology: doi:10.1038/nchembio.1366

- 14 -
Supplementary Table 3. NMR data of tryprostatin A 4 in CDCl3. The molecular formula of 4
was established by mass data [ESI-MS: m/z 382 (M+H)+; HRESIMS: m/z 382.2125 (M+H)+,
calcd. for C22H28N3O3+, 382.2131, Δ = 0.6 mmu].
Position δH [ppm] mult. (J in Hz)1 δH [ppm] mult. (J in Hz) δC [ppm]1 δC [ppm] 1 (NH) 7.88 br s 7.88 br s 2 135.1 135.2 3 104.5 104.6 3a 122.3 122.4 4 7.34 d (8.8) 7.33 d (8.6) 118.4 118.5 5 6.76 dd (8.8, 2.4) 6.76 dd (8.6, 2.2) 109.4 109.5 6 156.4 156.5 7 6.83 d (2.4) 6.83 d (2.2) 94.9 95.0 7a 136.3 136.4 8 2.91 dd (15.1, 11.2) 2.91 dd (15.0, 11.3) 25.7 25.8 3.63 dd (15.1, 3.5) 3.63 dd (15.0, 3.5) 9 4.34 br dd (11.2, 3.5) 4.34 br dd (11.5, 3.5) 54.6 54.7 10 (NH) 5.65 br s 5.65 br s 11 169.4 169.4 12 4.06 br dd (7.8, 7.3) 4.06 br dd (7.3, 7.3) 59.3 59.4 13 2.33 m 2.33 m 28.4 28.5 2.08-1.97 m 2.03 m 14 2.08-1.97 m 2.03 m 22.7 22.8 1.95-1.85 m 1.90 m 15 3.67 ddd (12.7, 8.3, 3.9) 3.67 ddd (12.7, 8.8, 3.9) 45.4 45.6 3.58 ddd (12.7, 8.8, 2.9) 3.58 ddd (12.7, 8.8, 2.9) 17 165.8 165.9 18 3.46 dd (16.5, 7.0) 3.46 dd (16.1, 7.0) 25.1 25.2 3.40 dd (16.5, 6.5) 3.40 dd (16.5, 6.5) 19 5.29 br dd (7.0, 6.5) 5.30 br dd (7.0, 6.5) 120.0 120.1 20 135.3 135.4 21 1.78 s 1.78 s 25.8 25.9 22 1.75 s 1.75 s 18.0 18.1 23 3.83 s 3.83 s 55.8 55.9 1H and 13C NMR spectra were recorded at 400 MHz and 100 MHz, respectively. 1) Reported 1H and 13C chemical shifts for 43.
Nature Chemical Biology: doi:10.1038/nchembio.1366

- 15 -
1.5 UV trace from HPLC analysis of extracts of SCKW5/ftmA/ftmB/ftmE, and NMR
characterization of demethoxyfumitremorgin C 6.
Supplementary Figure 13. HPLC traces of metabolic extracts from the engineered yeast. (a)
SCKW5/ftmA/ftmB/ftmE and (b) SCKW5/ftmA/ftmB strains. All traces were monitored at 280
nm.
Nature Chemical Biology: doi:10.1038/nchembio.1366

- 16 -
Supplementary Figure 14. 1H NMR spectrum of 6 in CDCl3 (400 MHz).
δH [ppm]
Supplementary Figure 15. 13C NMR spectrum of 6 in CDCl3 (100 MHz).
δC [ppm]
Nature Chemical Biology: doi:10.1038/nchembio.1366

- 17 -
Supplementary Table 4. NMR data of demethoxyfumitremorgin C 6 in CDCl3. The molecular
formula of 6 was established by mass data [ESI-MS: m/z 350 (M+H)+; HRESIMS: m/z 350.1865
(M+H)+, calcd. for C21H24N3O2+, 350.1863, Δ = 0.2 mmu].
Position δH [ppm] mult. (J in Hz)1 δH [ppm] mult. (J in Hz) δC [ppm]1 δC [ppm] 1 (NH) 7.92 br s 7.92 br s 2 133.5 133.6 3 6.03 br d (9.8) 6.03 br d (9.8) 51.0 51.1 5 169.5 169.7 6 4.12 br dd (8.0, 7.5) 4.12 br dd (8.0, 7.5) 59.3 59.4 7 2.41 m 2.42 m 28.6 28.7 2.24 m 2.25 m 8 2.06 m 2.08 m 23.1 23.2 1.94 m 1.95 m 9 3.64 m 3.64 m 45.4 45.6 11 165.7 169.9 12 4.19 br dd (11.7, 5.0) 4.20 br dd (11.7, 5.0) 56.8 57.0 13 3.57 dd (15.7, 5.0) 3.57 dd (15.7, 5.0) 21.9 22.0 3.13 br dd (15.7, 11.7) 3.13 br dd (15.7, 11.7) 14 106.4 106.5 15 126.3 126.4 16 7.58 br d (7.5) 7.57 br d (7.5) 118.3 118.5 17 7.15 br t (7.5) 7.15 br t (7.5) 120.1 120.2 18 7.20 br t (7.5) 7.20 br t (7.5) 122.2 122.3 19 7.34 br d (7.5) 7.34 br d (7.5) 111.2 111.3 20 136.2 136.3 21 4.92br d (9.8) 4.92br d (9.8) 124.0 124.0 22 134.3 134.5 23 1.65 s 1.65 s 25.7 25.8 24 2.01 s 2.00 s 18.2 18.3 1H and 13C NMR spectra were recorded at 400 MHz and 100 MHz, respectively. 1) Reported 1H and 13C chemical shifts for 63.
Nature Chemical Biology: doi:10.1038/nchembio.1366

- 18 -
1.6 NMR characterization of tryprostatin B-indoline-2,3-diol 15.
Supplementary Figure 16. 1H NMR spectrum of 15 in CDCl3 (500 MHz).
Supplementary Figure 17. 13C NMR spectrum of 15 in CDCl3 (125 MHz).
Nature Chemical Biology: doi:10.1038/nchembio.1366

- 19 -
Supplementary Figure 18. DQF–COSY spectrum of 15 in CDCl3 (500 MHz). DQF–COSY,
double quantum filtered–correlated spectroscopy.
Supplementary Figure 19. HMQC spectrum of 15 in CDCl3 (500 MHz). HMQC, heteronuclear
multiple quantum coherence.
Nature Chemical Biology: doi:10.1038/nchembio.1366
- 20 -
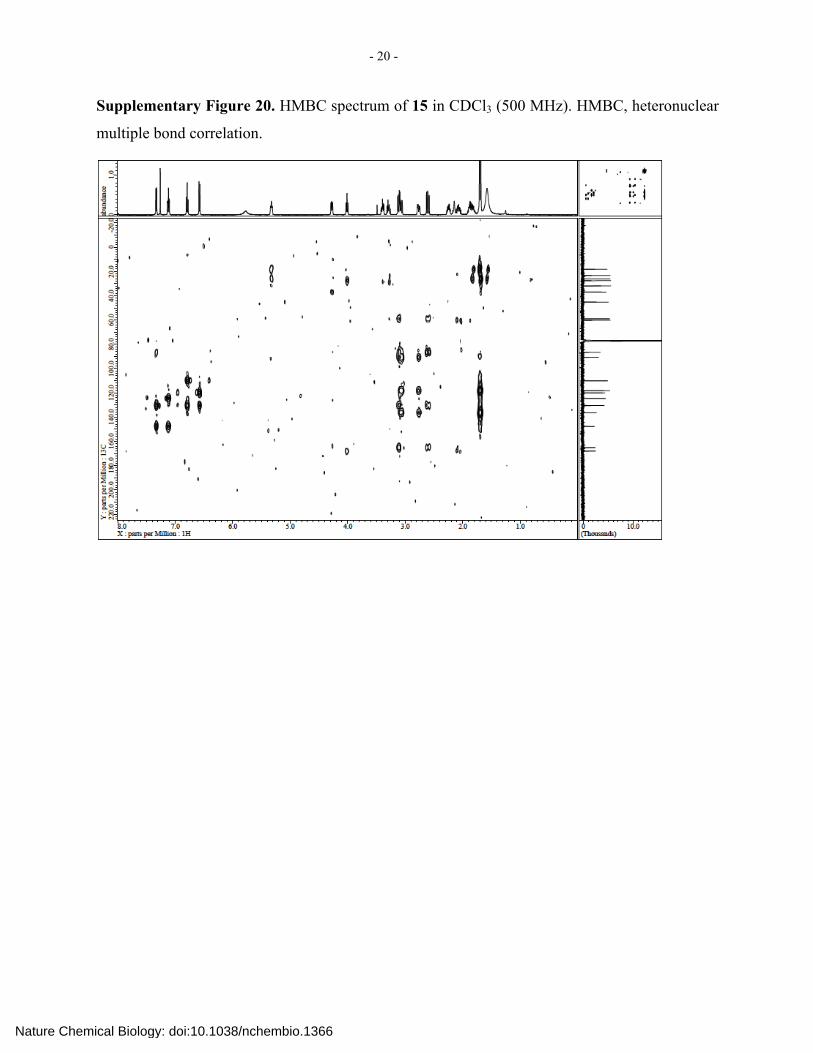
Supplementary Figure 20. HMBC spectrum of 15 in CDCl3 (500 MHz). HMBC, heteronuclear
multiple bond correlation.
Nature Chemical Biology: doi:10.1038/nchembio.1366

- 21 -
Supplementary Table 5. NMR data of 15 in CDCl3. The molecular formula of 15 was
established by mass data [ESI-MS: m/z 368 (M+H–H2O)+; HRESIMS: m/z 368.1973 (M+H–
H2O)+, calcd. for C21H26N3O3+, 368.1969, Δ = 0.4 mmu].
Position δHa) mult. (J in Hz) HMBCa) δC
b) 1 (NH) 2 90.7 3 86.6 3a 130.4 4 7.33 1H d (7.4) 3, 3a, 6, 7a 124.6 5 6.79 1H t (7.4) 3a, 6, 7 120.1 6 7.12 1H t (7.4) 4, 7a 130.5 7 6.58 1H d (7.4) 3a, 5, 6 110.1 7a 147.8 8 3.11 1H dd (5.5, 13.6) 2, 3, 3a, 9, 17 37.0 2.61 1H dd (9.6, 13.6) 3, 3a, 9, 17 9 4.28 1H dd (5.5, 9.6) 8 59.0 10 5.78 1H br s 11 168.0 12 4.01 1H t (7.9) 11, 13 60.3 13 2.25 1H m 27.6 2.07 1H m 11, 12 14 1.86 1H m 23.3 1.81 1H m 15 3.40 1H ddd (3.4, 7.9,
12.0) 45.2
3.28 1H m 17 165.2 18 3.08 1H dd (9.1, 14.5) 2, 19, 20 31.9 2.76 1H dd (5.9, 14.5) 2, 19, 20 19 5.32 1H m 21, 22 118.2 20 136.5 21 1.71 3H s 19, 20, 22 26.2 22 1.68 3H s 19, 20, 21 18.2
a) Recorded at 500 MHz. b) Recorded at 125 MHz.
Nature Chemical Biology: doi:10.1038/nchembio.1366

- 22 -
1.7 NMR characterization of tryprostatin A-indoline-2,3-diol 17a.
Supplementary Figure 21. 1H NMR spectrum of 17a in CD3OD (400 MHz).
Supplementary Figure 22. 13C NMR spectrum of 17a in CD3OD (100 MHz).
Nature Chemical Biology: doi:10.1038/nchembio.1366

- 23 -
Supplementary Figure 23. COSY spectrum of 17a in CD3OD (400 MHz).
Supplementary Figure 24. HMQC spectrum of 17a in CD3OD (400 MHz).
Nature Chemical Biology: doi:10.1038/nchembio.1366
- 24 -
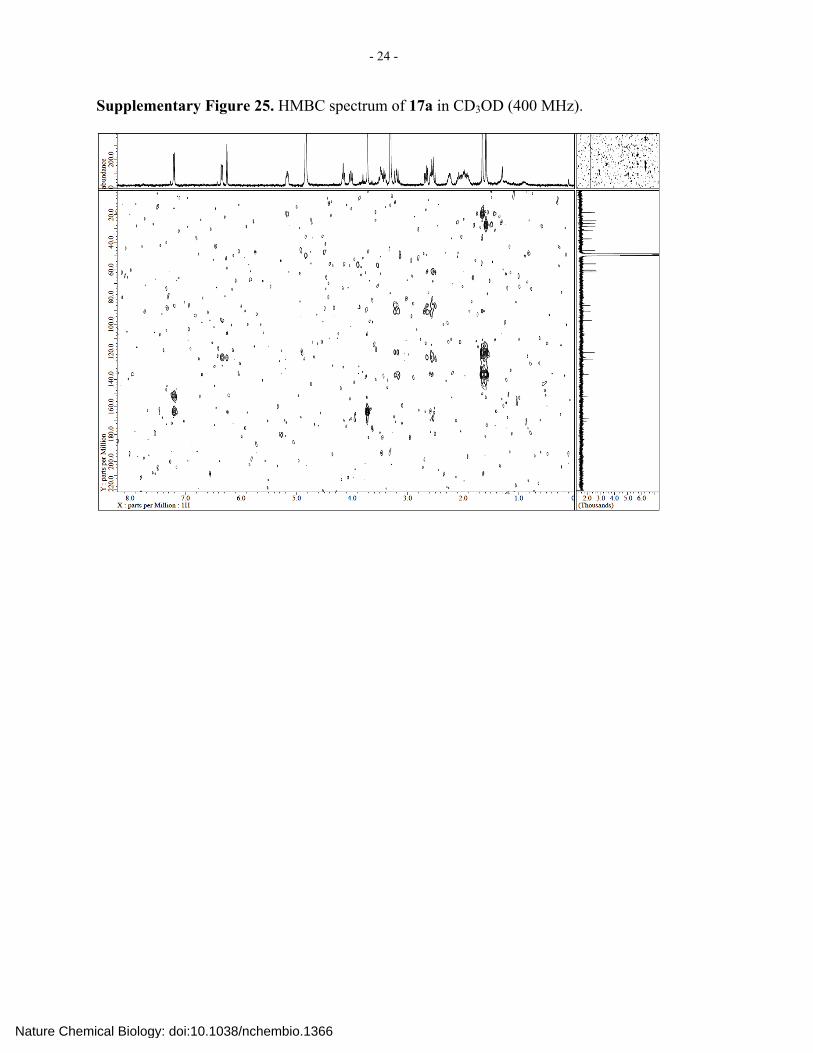
Supplementary Figure 25. HMBC spectrum of 17a in CD3OD (400 MHz).
Nature Chemical Biology: doi:10.1038/nchembio.1366

- 25 -
Supplementary Table 6. NMR data of 17a in CD3OD. The molecular formula of 17a was
established by mass data [ESI-MS: m/z 398 (M+H–H2O)+; HRESIMS: m/z 398.2074 (M+H–
H2O)+, calcd. for C22H28N3O4+, 398.2074, Δ = 0 mmu].
Position δHa) mult. (J in Hz) HMBCa) δC
b) 1 (NH) 2 90.2 3 86.1 3a 124.0 4 7.20 1H d (8.4) 6, 7a 125.7 5 6.34 1H d (8.4) 3a, 7 106.2 6 163.7 7 6.25 1H s 3a, 5, 6 97.0 7a 152.2 8 2.66 1H dd (6.9, 12.4) 2, 3, 3a 37.5 2.54 1H m 3, 9 9 4.01 1H t (8.9) 60.4 11 170.4 12 4.16 1H dd (6.5, 8.3) 61.7 13 2.24 1H m 28.4 2.07 1H m 14 2.00 1H m 24.4 1.92 1H m 15 3.47 1H m 46.2 3.42 1H m 17 168.3 18 3.20 1H dd (9.8, 14.0) 2, 3, 19, 20 31.6 2.57 1H m 19 5.17 1H m 22 120.3 20 136.3 21 1.66 3H s 19, 20, 22 26.3 22 1.59 3H s 19, 20, 21 18.3 23 3.72 3H s 6 55.8
a) Recorded at 400 MHz. b) Recorded at 100 MHz.
Nature Chemical Biology: doi:10.1038/nchembio.1366

- 26 -
1.8 NMR characterization of 17b, the diastereomer of 17a.
Supplementary Figure 26. 1H NMR spectrum of 17b in CDCl3 (500 MHz).
Supplementary Figure 27. DQF–COSY spectrum of 17b in CDCl3 (500 MHz).
Nature Chemical Biology: doi:10.1038/nchembio.1366

- 27 -
Supplementary Table 7. NMR data of 17b in CDCl3. The molecular formula of 17b was
established by mass data [ESI-MS: m/z 398 (M+H–H2O)+; HRESIMS: m/z 398.2072 (M+H–
H2O)+, calcd. for C22H28N3O4+, 398.2074, Δ = 0.2 mmu].
Position δHa) mult. (J in Hz)
1 (NH) 2 3 3a 4 7.22 1H d (8.5) 5 6.33 1H dd (2.0, 8.5) 6 7 6.13 1H d (2.0) 7a 8 3.13 1H dd (4.8, 13.6) 2.56 1H dd (9.6, 13.6) 9 4.24 1H dd (4.8, 9.6) 11 12 4.00 1H dd (7.4, 7.9) 13 2.25 1H m 2.08 1H m 14 1.89 1H m 1.83 1H m 15 3.40 1H ddd (3.4, 7.9, 11.3) 3.31 1H m 17 18 3.07 1H dd (9.1, 14.8) 2.73 1H dd (6.2, 15.0) 19 5.34 1H m 20 21 1.89 3H s 22 1.83 3H s 23 3.73 3H s
a) Recorded at 500 MHz.
Nature Chemical Biology: doi:10.1038/nchembio.1366

- 28 -
1.9 NMR characterization of tryprostatin A-2-oxindole 18.
Supplementary Figure 28. 1H NMR spectrum of 18 in CDCl3 (500 MHz).
Supplementary Figure 29. DQF-COSY spectrum of 18 in CDCl3 (500 MHz).
Nature Chemical Biology: doi:10.1038/nchembio.1366

- 29 -
Supplementary Figure 30. HMQC spectrum of 18 in CDCl3 (500 MHz).
Supplementary Figure 31. HMBC spectrum of 18 in CDCl3 (500 MHz).
Nature Chemical Biology: doi:10.1038/nchembio.1366

- 30 -
Supplementary Figure 32. NOESY spectrum of 18 in CDCl3 (500 MHz). NOESY, nuclear
Overhauser enhancement and exchange spectroscopy.
Nature Chemical Biology: doi:10.1038/nchembio.1366

- 31 -
Supplementary Table 8. NMR data of 18 in CDCl3. The molecular formula of 18 was
established by mass data [ESI-MS: m/z 398 (M+H)+; HRESIMS: m/z 398.2072 (M+H)+, calcd.
for C22H28N3O4+, 398.2074, Δ = 0.2 mmu].
Position δHa) mult. (J in Hz) HMBCa) δC
b) 1 (NH) 9.84c) 1H br s 2 183.5 3 51.0 3a 122.0 4 7.10 1H d (9.1) 3, 6, 7a 127.3 5 6.49 1H d (9.1) 3a, 7 106.9 6 160.1 7 6.50 1H s 3a, 5, 6, 7a 97.1 7a 141.9 8 2.85 1H m 36.9 2.71 1H d (5.7, 14.9) 2, 3, 3a, 9, 11 9 4.20 1H m 54.5 10 (NH) 7.84c) 1H br s 11 164.2 12 3.84 1H m 59.1 13 2.11 1H m n.d.d) 1.14 1H m 14 1.70 2H m 22.1 15 3.44 1H m 14 45.7 3.29 1H m 14 17 n.d.d) 18 2.46 1H dd (8.0, 13.7) 2, 3, 3a, 19, 20 38.0 2.36 1H dd (7.5, 13.7) 2, 3, 3a, 8, 19, 20 19 4.83 1H m 21, 22 116.8 20 136.4 21 1.56 3H s 19, 20, 22 25.9 22 1.44 3H s 19, 20, 21 18.4 23 3.78 3H s 6 56.2
a) Recorded at 500 MHz. b) δC values were determined from HMBC and HMQC spectra. c) Signals may be exchanged. d) n.d., not determined.
Nature Chemical Biology: doi:10.1038/nchembio.1366
- 32 -
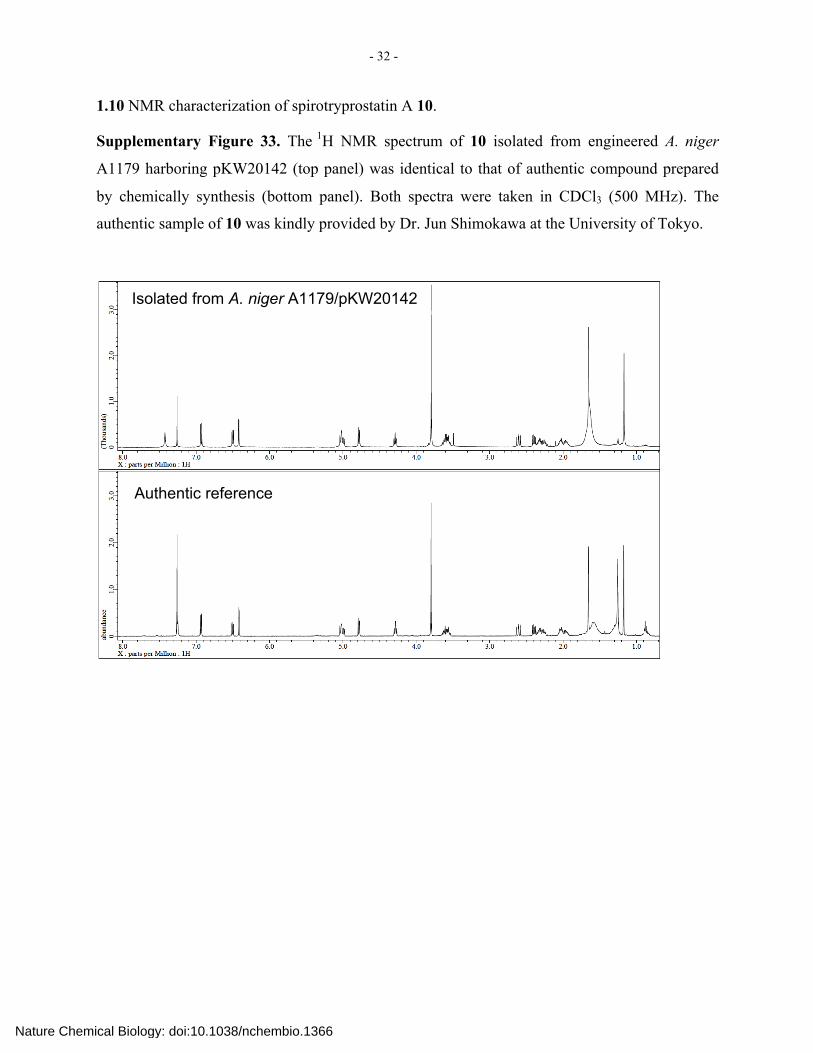
1.10 NMR characterization of spirotryprostatin A 10.
Supplementary Figure 33. The 1H NMR spectrum of 10 isolated from engineered A. niger
A1179 harboring pKW20142 (top panel) was identical to that of authentic compound prepared
by chemically synthesis (bottom panel). Both spectra were taken in CDCl3 (500 MHz). The
authentic sample of 10 was kindly provided by Dr. Jun Shimokawa at the University of Tokyo.
Isolated from A. niger A1179/pKW20142
Authentic reference
Nature Chemical Biology: doi:10.1038/nchembio.1366

- 33 -
Supplementary Table 9. NMR data of spirotryprostatin A 10 in CDCl3. The molecular formula
of 10 was established by mass data [ESI-MS: m/z 396 (M+H)+; HRESIMS: m/z 396.1914
(M+H)+, calcd. for C22H26N3O4+ 396.1918, Δ = 0.4 mmu].
Position δH [ppm] mult. (J in Hz)1 δH
a) [ppm] mult. (J in Hz) 1 (NH) 7.64 1H br s 7.42 1H br s 2 3 3a 4 6.93 1H d (8.5) 6.93 1H d (8.3) 5 6.50 1H dd (8.5, 2.4) 6.50 1H dd (8.3, 2.3) 6 7 6.43 1H d (2.4) 6.42 1H d (2.3) 7a 8a 2.39 1H dd (13.2, 6.8) 2.39 1H dd (14.0, 7.2) b 2.60 1H dd (13.2, 10.5) 2.60 1H dd (14.0, 10.8) 9 4.99 1H dd (10.5, 6.8) 5.00 1H dd (10.8, 7.2) 10 11 12 4.28 1H dd (8.3, 7.8) 4.29 1H t (8.0) 13a 2.27 1H m 2.25 1H m b 2.31 1H m 2.32 1H m 14a 1.97 1H m 1.96 1H m b 2.07 1H m 2.03 1H m 15a 3.57 1H m 3.58 1H m b 3.61 1H m 3.61 1H m 17 18 4.78 1H d (10.0) 4.78 1H d (10.0) 19 5.03 1H d (10.0) 5.03 1H d (10.0) 20 21 1.65 3H s 1.65 3H s 22 1.26 3H s 1.17 3H s 23 3.80 3H s 3.80 3H s a) Recorded at 500 MHz. 1) Reported 1H NMR data for 104.
Nature Chemical Biology: doi:10.1038/nchembio.1366
- 34 -
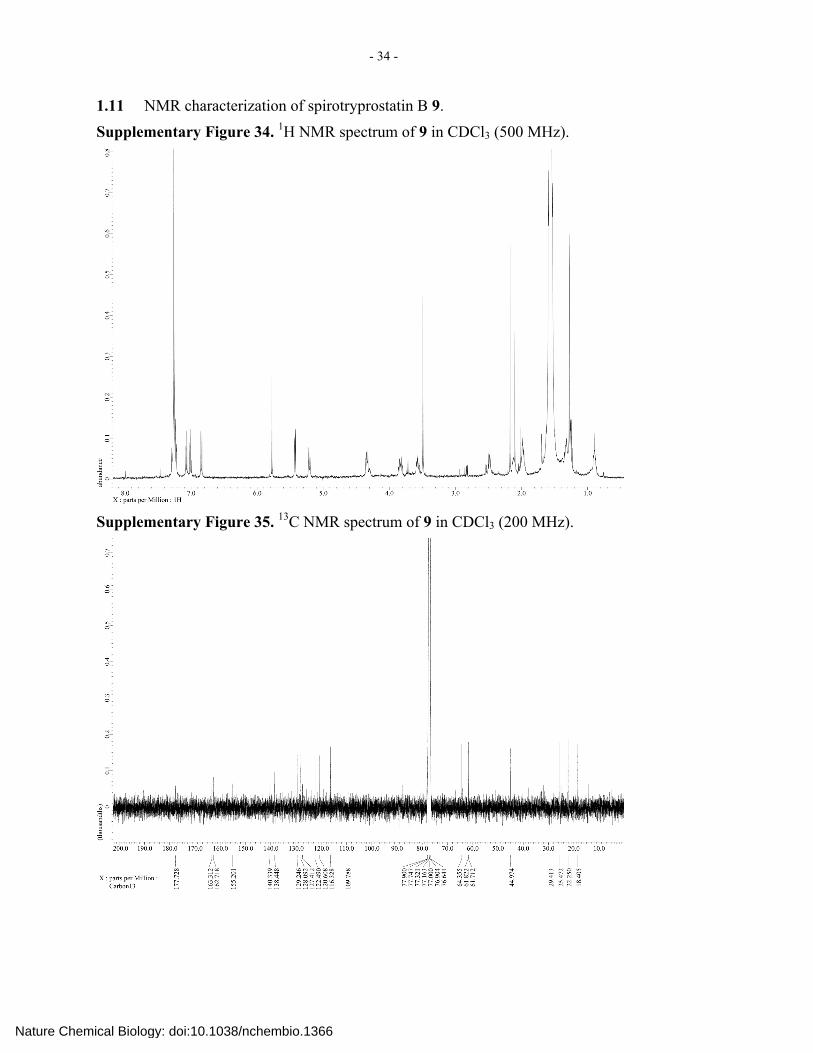
1.11 NMR characterization of spirotryprostatin B 9. Supplementary Figure 34. 1H NMR spectrum of 9 in CDCl3 (500 MHz).
Supplementary Figure 35. 13C NMR spectrum of 9 in CDCl3 (200 MHz).
Nature Chemical Biology: doi:10.1038/nchembio.1366

- 35 -
Supplementary Table 10. NMR data of spirotryprostatin B 9 in CDCl3. The molecular formula
of 9 was established by mass data [ESI-MS: m/z 364 (M+H)+; HRESIMS: m/z 364.1654 (M+H)+,
calcd. for C21H22N3O3+ 364.1656, Δ = 0.2 mmu].
spirotryprostatin B 9
N
N
O
O
HN
O
19
89
17
11
15
13
20
1814
1 2
3
5
64
7 3a
7a
Position δH [ppm] mult. (J in Hz)1) δH
a) [ppm] mult. (J in Hz) δC [ppm]1) δC
b) [ppm]
1 (NH) 8.67 br s n.d.c) 2 178.5 177.7 3 61.9 61.8 3a 127.2 127.4 4 7.06 1H br d (7.6) 7.06 1H d (7.4) 127.8 128.1 5 6.99 1H td (7.6, 1.0) 7.00 1H t (7.4) 122.2 122.5 6 7.23 1H td (7.6, 1.0) 7.24 1H t (7.4) 129.1 129.2 7 6.89 1H br d (7.6) 6.84 1H d (7.4) 110.1 109.8 7a 140.7 140.3 8 5.79 1H s 5.78 1H s 116.5 116.3 9 138.2 138.4 11 162.6 162.7 12 4.35 1H dd (10.5, 6.1) 4.34 1H dd (9.9, 6.5) 61.6 61.7 13a 2.49 1H m 2.48 1H m 29.3 29.4 b 1.99 1H m 1.99 1H m 14a 1.99 1H m 1.99 1H m 22.1 22.1 b 2.13 1H m 2.13 1H m 15a 3.58 1H ddd (12.2, 9.3, 2.9) 3.57 1H m 44.8 44.8 b 3.84 1H dt (12.2, 8.3) 3.83 1H m 17 155.1 155.2 18 5.44 1H d (8.8) 5.43 1H d (9.1) 64.1 64.4 19 5.22 1H dm (8.8) 5.21 1H d (9.1) 120.4 120.6 20 138.3 138.4 21 1.56 3H s 1.56 3H s 25.3 25.4 22 1.26 3H s 1.27 3H s 18.3 18.4 a) Recorded at 500 MHz. b) Recorded at 200 MHz. c) n.d., not determined. 1) Reported 1H and 13C NMR data for 94.
Nature Chemical Biology: doi:10.1038/nchembio.1366

- 36 -
1.12 NMR characterization of demethoxyfumitremorgin C-monool 7.
Supplementary Figure 36. 1H NMR spectrum of 7 in CDCl3 (500 MHz).
Supplementary Figure 37. 13C NMR spectrum of 7 in CDCl3 (200 MHz).
Nature Chemical Biology: doi:10.1038/nchembio.1366

- 37 -
Supplementary Figure 38. DQF–COSY spectrum of 7 in CDCl3 (500 MHz). DQF–COSY,
double quantum filtered–correlated spectroscopy.
Supplementary Figure 39. HMQC spectrum of 7 in CDCl3 (500 MHz). HMQC, heteronuclear
multiple quantum coherence.
Nature Chemical Biology: doi:10.1038/nchembio.1366

- 38 -
Supplementary Figure 40. HMBC spectrum of 7 in CDCl3 (500 MHz). HMBC, heteronuclear
multiple bond correlation.
Nature Chemical Biology: doi:10.1038/nchembio.1366

- 39 -
Supplementary Table 11. NMR data of 7 in CDCl3. The molecular formula of 7 was
established by mass data [ESI-MS: m/z 348 (M+H-H2O)+; HRESIMS: m/z 348.1705 (M+H-
H2O)+, calcd. for C21H22N3O2+ 348.1707, Δ = 0.2 mmu].
Position δHa) mult. (J in Hz) HMBCa) δC
b) 1 (NH) 7.93 1H br s 2 133.6 3 103.4 3a 127.5 4 7.60 1H d (8.0) 6, 7a 118.5 5 7.18 1H t (8.0) 3a 120.6 6 7.22 1H t (8.0) 4, 7a 122.7 7 7.38 1H d (8.0) 3a, 5 111.5 7a 136.8 8a 3.73 1H dd (16.3) 2, 3, 9 30.4 b 3.37 1H dd (16.3) 2, 3, 9 9 84.5 9-OH n.d.d) 11 170.9c) 12 4.45 1H dd (9.2, 6.9) 59.2 13a 2.46 1H m 29.2 b 2.10 1H m 14a 2.09 1H m 22.9 b 1.96 1H m 15 3.67 2H dd (9.1, 4.0) 45.8 17 163.9c) 18 6.06 1H d (9.7) 2, 3, 19 50.1 19 4.92 1H d (9.7) 21, 22 122.8 20 135.1 21 2.01 3H s 19, 20, 22 18.4 22 1.65 3H s 19, 20, 21 25.9
a) Recorded at 500 MHz. b) Recorded at 200 MHz. c) Signals may be exchanged. d) n.d., not determined.
Nature Chemical Biology: doi:10.1038/nchembio.1366

- 40 -
1.13 NMR characterization of demethoxyfumitremorgin C-diol 8.
Supplementary Figure 41. 1H NMR spectrum of 8 in CDCl3 (500 MHz).
Supplementary Figure 42. 13C NMR spectrum of 8 in CDCl3 (200 MHz).
Nature Chemical Biology: doi:10.1038/nchembio.1366

- 41 -
Supplementary Figure 43. DQF–COSY spectrum of 8 in CDCl3 (500 MHz).
Supplementary Figure 44. HMQC spectrum of 8 in CDCl3 (500 MHz).
Nature Chemical Biology: doi:10.1038/nchembio.1366

- 42 -
Supplementary Figure 45. HMBC spectrum of 8 in CDCl3 (500 MHz).
Nature Chemical Biology: doi:10.1038/nchembio.1366
- 43 -
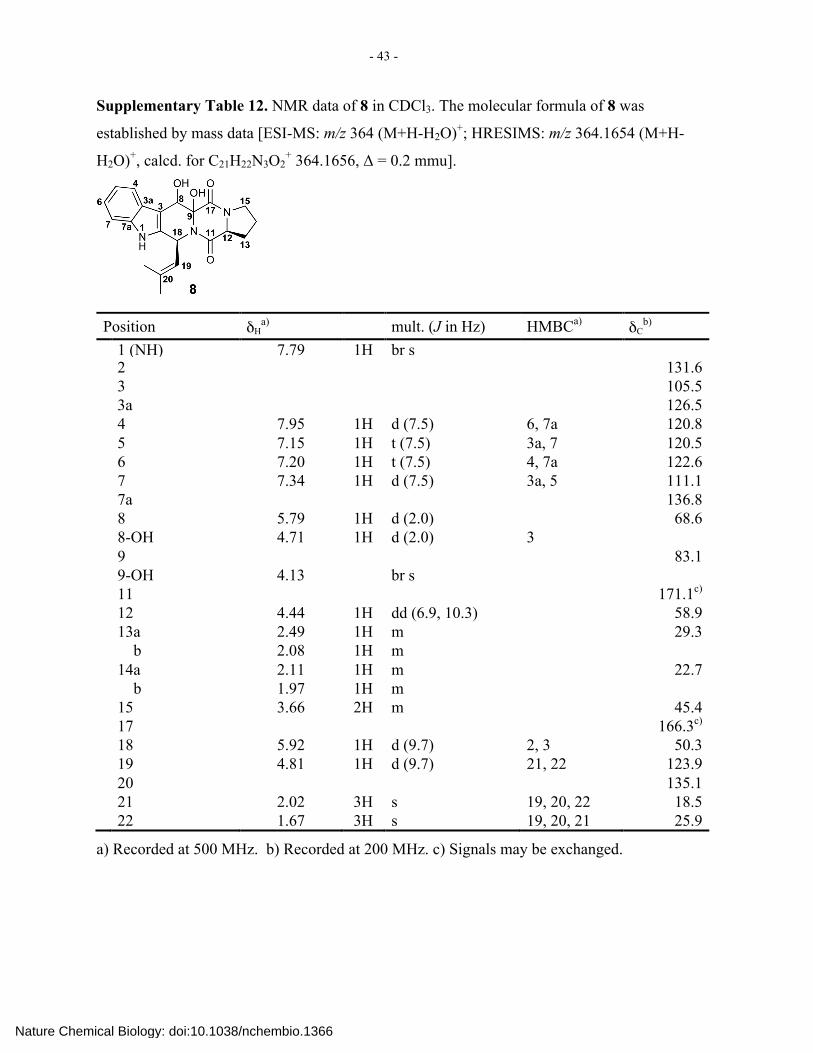
Supplementary Table 12. NMR data of 8 in CDCl3. The molecular formula of 8 was
established by mass data [ESI-MS: m/z 364 (M+H-H2O)+; HRESIMS: m/z 364.1654 (M+H-
H2O)+, calcd. for C21H22N3O2+ 364.1656, Δ = 0.2 mmu].
Position δHa) mult. (J in Hz) HMBCa) δC
b) 1 (NH) 7.79 1H br s 2 131.6 3 105.5 3a 126.5 4 7.95 1H d (7.5) 6, 7a 120.8 5 7.15 1H t (7.5) 3a, 7 120.5 6 7.20 1H t (7.5) 4, 7a 122.6 7 7.34 1H d (7.5) 3a, 5 111.1 7a 136.8 8 5.79 1H d (2.0) 68.6 8-OH 4.71 1H d (2.0) 3 9 83.1 9-OH 4.13 br s 11 171.1c) 12 4.44 1H dd (6.9, 10.3) 58.9 13a 2.49 1H m 29.3 b 2.08 1H m 14a 2.11 1H m 22.7 b 1.97 1H m 15 3.66 2H m 45.4 17 166.3c) 18 5.92 1H d (9.7) 2, 3 50.3 19 4.81 1H d (9.7) 21, 22 123.9 20 135.1 21 2.02 3H s 19, 20, 22 18.5 22 1.67 3H s 19, 20, 21 25.9
a) Recorded at 500 MHz. b) Recorded at 200 MHz. c) Signals may be exchanged.
Nature Chemical Biology: doi:10.1038/nchembio.1366
- 44 -
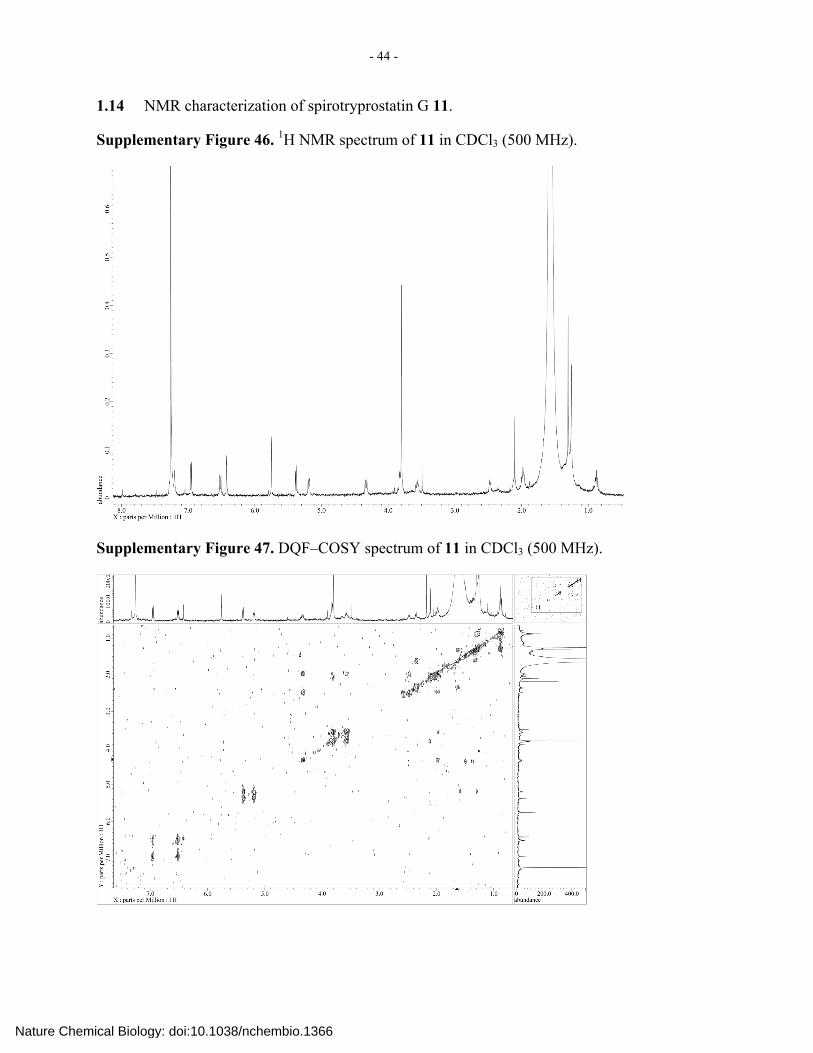
1.14 NMR characterization of spirotryprostatin G 11.
Supplementary Figure 46. 1H NMR spectrum of 11 in CDCl3 (500 MHz).
Supplementary Figure 47. DQF–COSY spectrum of 11 in CDCl3 (500 MHz).
Nature Chemical Biology: doi:10.1038/nchembio.1366
- 45 -
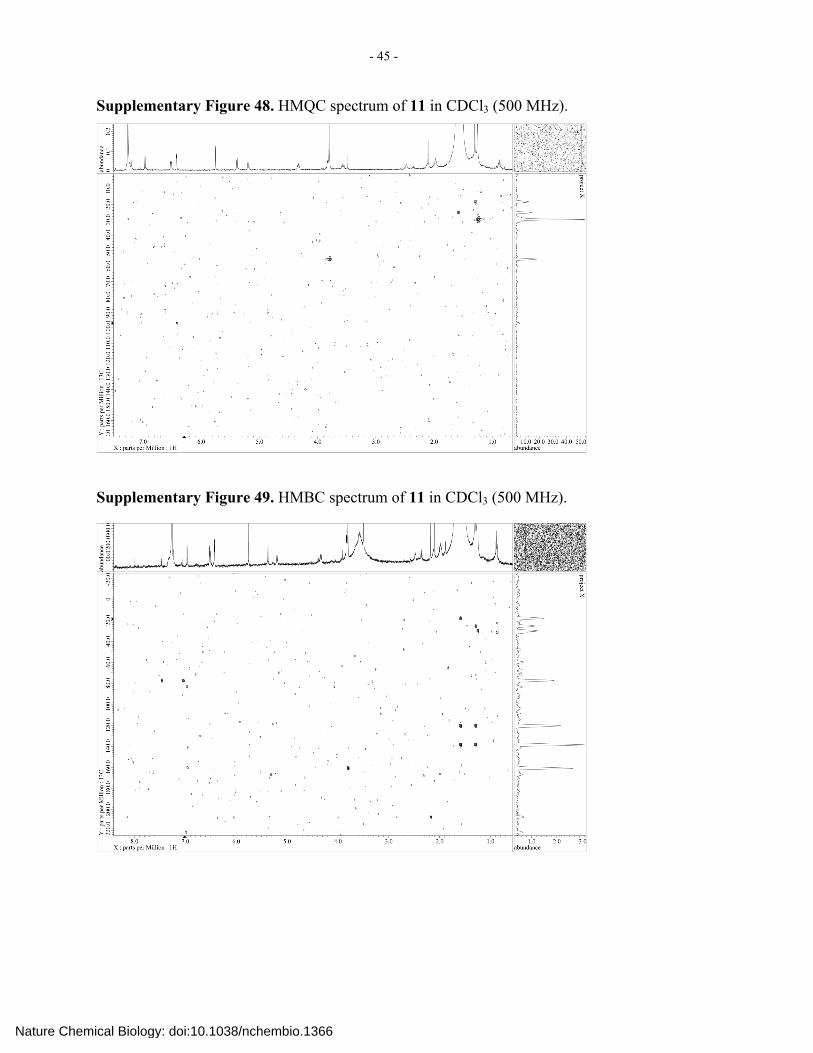
Supplementary Figure 48. HMQC spectrum of 11 in CDCl3 (500 MHz).
Supplementary Figure 49. HMBC spectrum of 11 in CDCl3 (500 MHz).
Nature Chemical Biology: doi:10.1038/nchembio.1366
- 46 -
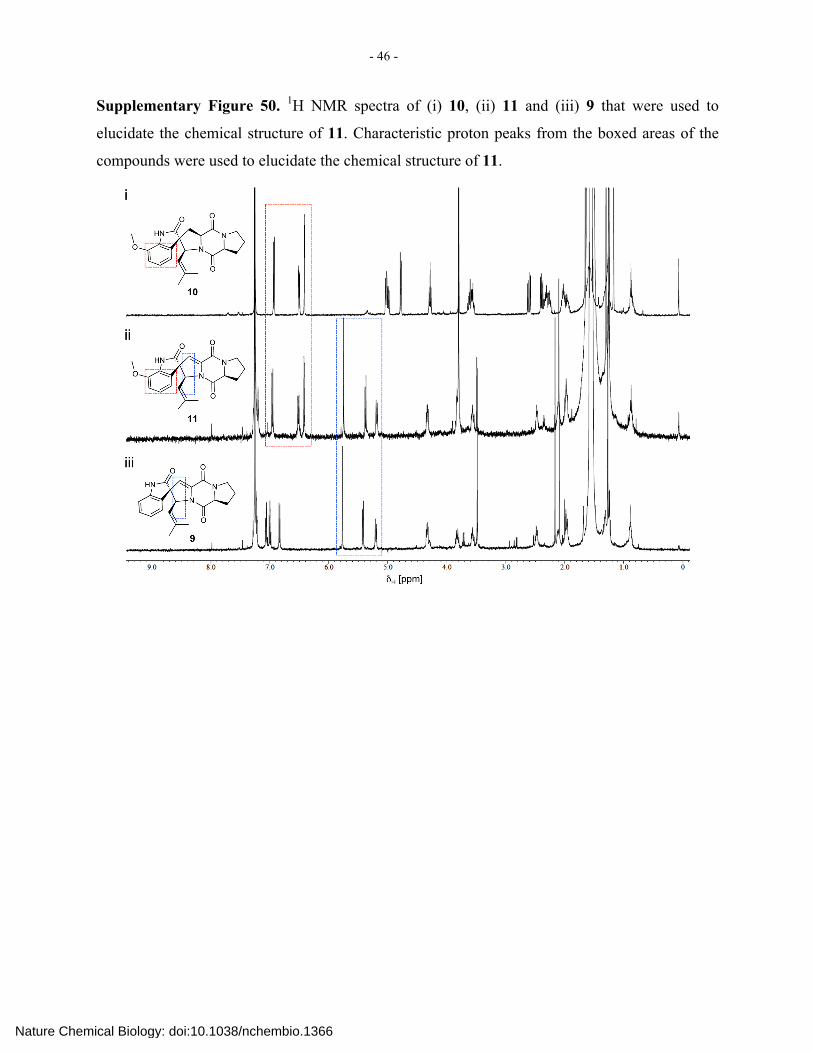
Supplementary Figure 50. 1H NMR spectra of (i) 10, (ii) 11 and (iii) 9 that were used to
elucidate the chemical structure of 11. Characteristic proton peaks from the boxed areas of the
compounds were used to elucidate the chemical structure of 11.
Nature Chemical Biology: doi:10.1038/nchembio.1366
- 47 -
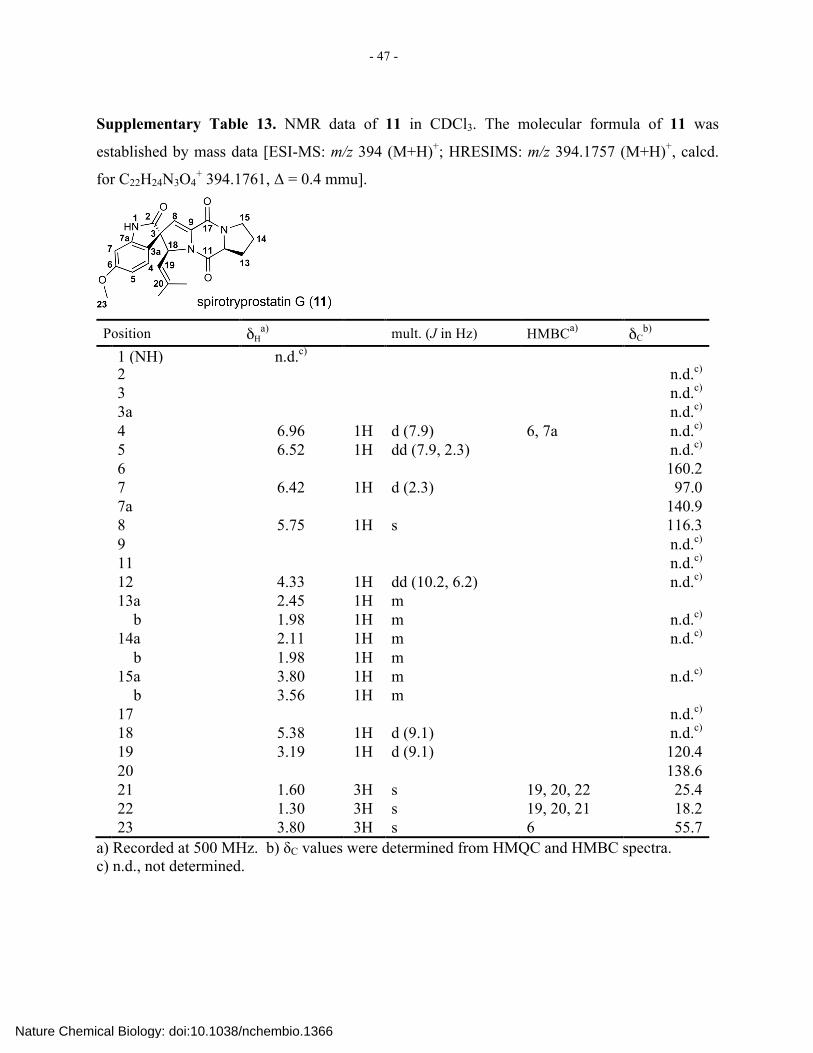
Supplementary Table 13. NMR data of 11 in CDCl3. The molecular formula of 11 was
established by mass data [ESI-MS: m/z 394 (M+H)+; HRESIMS: m/z 394.1757 (M+H)+, calcd.
for C22H24N3O4+ 394.1761, Δ = 0.4 mmu].
Position δHa) mult. (J in Hz) HMBCa) δC
b) 1 (NH) n.d.c) 2 n.d.c) 3 n.d.c) 3a n.d.c) 4 6.96 1H d (7.9) 6, 7a n.d.c) 5 6.52 1H dd (7.9, 2.3) n.d.c) 6 160.2 7 6.42 1H d (2.3) 97.0 7a 140.9 8 5.75 1H s 116.3 9 n.d.c) 11 n.d.c) 12 4.33 1H dd (10.2, 6.2) n.d.c) 13a 2.45 1H m b 1.98 1H m n.d.c) 14a 2.11 1H m n.d.c) b 1.98 1H m 15a 3.80 1H m n.d.c) b 3.56 1H m 17 n.d.c) 18 5.38 1H d (9.1) n.d.c) 19 3.19 1H d (9.1) 120.4 20 138.6 21 1.60 3H s 19, 20, 22 25.4 22 1.30 3H s 19, 20, 21 18.2 23 3.80 3H s 6 55.7
a) Recorded at 500 MHz. b) δC values were determined from HMQC and HMBC spectra. c) n.d., not determined.
Nature Chemical Biology: doi:10.1038/nchembio.1366

- 48 -
2.1 Supplementary Note 1. Strain and plasmid preparation, gene expression analysis and
preliminary protein production and activity assays.
2.1.1 Construction of the S. cerevisiae expression vectors.
2.1.1.1 S. cerevisiae BY4741 transformation and homologous recombination protocol.
Transformation of S. cerevisiae BY4741 for homologous recombination-based plasmid
construction was performed based on the following protocol. The cells were collected by
centrifugation from 1 ml of liquid culture incubated at 30 °C for 6 h, washed with a LiOAc
solution (0.1 M, 1 ml) and suspended in the transformation solution (50% PEG4,000, 240 µl; 1
M LiOAc, 36 µl, 2 mg ml–1; salmon sperm single-stranded DNA, 25 µl) along with the mixture
of DNA fragments to be joined, typically PCR amplicons and a linearlized vector, into a single,
intact plasmid. The reaction mixture was incubated at room temperature for 30 min and
subsequently incubated at 42 °C for 15 min. After the incubation, these cells were collected by
centrifugation and resuspended in 50 µl of sterilized water for plating on synthetic complete (SC)
medium agar plates lacking L-histidine (dextrose 20 g l–1, YNB with ammonium sulfate (MP
Biomedicals, LLC) 6.7 g l–1 and agar 20 g l–1 supplemented with a mixture comprised of L-
arginine 76 mg l–1, L-alanine 76 mg l–1, inositol 76 mg l–1, L-aspartic acid 76 mg l–1, L-asparagine
76 mg l–1, L-glutamic acid 76 mg l–1, L-glutamine 76 mg l–1, L-cysteine 76 mg l–1, glycine 76 mg
l–1, L-isoleucine 76 mg l–1, L-proline 76 mg l–1, L-leucine 395 mg l–1, L-lysine 76 mg l–1, L-
methionine 76 mg l–1, L-phenylalanine 76 mg l–1, L-serine 76 mg l–1, L-threonine 76 mg l–1, L-
tryptophan 76 mg l–1, L-proline 76 mg l–1, L-tyrosine 76 mg l–1, L-valine 76 mg l–1, adenine 19
mg l–1, p-aminobenzoic acid 7.6 mg l–1 and uracil 76 mg l–1). These plates were incubated at 30
°C for 2 days. The culture was centrifuged to collect the cells for isolating the plasmid assembled
in yeast by its homologous recombination activity. The cell pellet was mixed with 0.5 ml of
Solution 1 (1 M sorbitol, 0.1M Na2EDTA pH 7.5, 100 U ml-1 zymolyase) and incubated at 37 °C
for 1 h. The supernatant obtained by centrifuging the reaction mixture was mixed with 0.25 ml of
Solution 2 (50 mM Tris-HCl pH 7.4, 20 mM Na2EDTA, 0.5M EDTA pH8.0, 1% SDS) and
incubated at 65 °C for 30 min. After the lysis of the transformant cells, the reaction mixture was
mixed with 100 µl of 5 M KOAc and then incubated on ice for 1 h. The resultant solution was
centrifuged, and the supernatant was mixed with 500 µl of isopropanol and kept on ice for 10
min. The reaction mixture was centrifuged, and the collected pellet was washed with 100 µl of
Nature Chemical Biology: doi:10.1038/nchembio.1366

- 49 -
70% ethanol. The isolated pellet of plasmids was dried in vacuo and then dissolved in 50 µl of
RNaseA solution at a final concentration of 100 µg ml–1. The mixture was incubated at 65 °C for
10 min, and the resulting mixture was used to transform E. coli XL1-Blue (Stratagene Products
Division, Agilent Technologies, Inc.) for plasmid propagation by the standard procedures. The
isolated plasmid from the E. coli transformant was checked by restriction digestion, typically
followed by DNA sequencing.
2.1.1.2 Construction of base vectors pKW1250 and pKW5012 for expression of
heterologous genes in S. cerevisiae.
The HIS3 gene responsible for L-histidine biosynthesis was amplified from the wild type S.
cerevisiae X2180-1B genomic DNA using the pKW5012-Fw/pKW5012-Re primer set
(Supplementary Table 14). For replacing the URA3 selectable nutrition marker with HIS3 in
pKW1250, which is a derivative of pTOWug2-836 (Supplemental Fig. 51) containing a GAL1
promoter–ADH1 terminator cassette5, the HIS3-containing amplicon prepared as described
above (45 µl) was mixed with the linearlized delivery vector pKW1250 (2 µg) and incubated at
37 °C for 48 h prior to introduction into S. cerevisiae BY4741 for in vivo homologous
recombination, which is performed according to the method described earlier. Replacement of
URA3 by HIS3 in pKW1250 was confirmed by restriction analysis and DNA sequencing. This
plasmid was named pKW5012 (Supplemental Fig. 51). In pKW1250 and pKW5012, the
expressed ORFs will have at least one Flag- and hemagglutinin-tag at the C terminus, and an N-
terminal hexahistidine (His6)-tag-coding fragment and multiple cloning sites originating from
pET32a plasmid (Novagen product, EMD Millipore) were also present.
Supplementary Figure 51. Maps of plasmids pTOWug2-836, pKW1250 and pKW5012.
Nature Chemical Biology: doi:10.1038/nchembio.1366

- 50 -
2.1.1.3 Cloning of the fumitremorgin biosynthetic genes.
The open reading frame (ORF) of ftmA, ftmB, ftmC, ftmD and ftmE was predicted based on the A.
fumigatus Af293 genome sequence information available from the Broad Institute database, and
their predicted functions were determined by comparison to known proteins using the BLAST
peptide sequence database search program6 and the FFAS03 protein sequence profile-profile
alignment and fold recognition program7. To construct vectors for expression of these genes in
yeast, we isolated total RNA from A. fumigatus A1159 and NBRC 4057 using the Ambion
RNAqueous kit (Life Technologies Corporation). A High Capacity cDNA reverse transcription
kit (Life Technologies Corporation) was used for synthesizing cDNA according to the protocol
supplied by the manufacturer. The mycelia of wet cells weighing 100 mg were suspended in 100
µl of the elution buffer and 1 ml of the lysis/binding solution provided by the kit and
subsequently flash-frozen in liquid nitrogen. The frozen mixture was ground with a refrigerated
mortar and pestle for 2 min. The resulting cell powder was then allowed to thaw into a lysate
solution. This solution was centrifuged with 13,000 × g at 4 °C for 2 min. The supernatant was
mixed with 700 µl of 64% (v/v) ethanol to a final ethanol concentration of 32% and allowed to
stand for 30 sec on ice. The resulting supernatant was loaded onto a spin column, and the RNA
was eluted from the column with the elution buffer provided by the kit. To examine the quantity
and quality of the isolated total RNA, the RNA solution was checked by agarose gel
electrophoresis. Subsequently, DNase (3.0 units) was added to the isolated RNA to digest the
genomic DNA at 37 °C for 30 min. Finally, the digest was subjected to a treatment with
Oligotex–dT30 (TAKARA Bio Inc.) following the protocol provided by the manufacturer to
isolate the mRNAs.
The primers, except for the oligo(dT)20 Primer (Life Technologies Corporation), were
designed by the predicted cDNA sequence obtained from the Broad Institute database. Using a
SuperScript III First-Strand Synthesis SuperMix kit (Life Technologies Corporation), a full-
length cDNA of target gene was synthesized by a reverse transcriptase with a oligo(dT)20 Primer
using the mRNA isolated as described above as a template. To construct the yeast expression
vector carrying the target biosynthetic gene, the gene was amplified using the ExRec (overlap-
extension PCR–yeast homologous recombination) method we have developed earlier5. In this
method, multiple pairs of primers were used to prepare short double-stranded DNA fragments
Nature Chemical Biology: doi:10.1038/nchembio.1366

- 51 -
from cDNA, and those fragments were reconstituted into a full-length DNA coding for the
desired ORF by the overlap extension PCR method. Overlap extension PCR was performed with
pKW5038-1Fw/pKW5038-2Re primer pair for ftmA, pKW5049-Fw/pKW5049-Re primer pair
for ftmC, pKW5052-Fw/pKW5052-Re primer pair for ftmD, pKW5011-Fw-1/pKW5011-Re-1,
pKW5011-Fw-2/pKW5011-Re-2 and pKW5011-Fw-3/pKW5011-Re-3 primer sets for ftmB and
pKW5050-Fw-1/pKW5050-Re-6 primer pair for ftmE (Supplementary Table 14).
2.1.1.4 Construction of pKW5011 for expression of ftmB.
For constructing the vector to express ftmB in yeast, ftmB was amplified from A. fumigatus
NBRC 4057 genomic DNA as described above and cloned into pKW5012 using the same in vivo
homologous recombination method to yield pKW5011 (Supplemental Fig. 52).
Supplementary Figure 52. Map of plasmids pKW5011 and pKW5038.
2.1.1.5 Construction of pKW5038 for expression of ftmA.
Similarly, to construct the vector for expressing ftmA in yeast, ftmA ORF amplified from A.
fumigatus NBRC 4057 genomic DNA as described above (45 µl) was mixed with the delivery
vector pKW1250 (2 µg), which was digested with Sma I (10 units) and Sal I (10 units) (All
restriction endonucleases are from Fermentas Inc./Thermo Fisher Scientific Inc.) at 37 °C for 8 h,
for in vivo homologous recombination. The mixture was transformed into S. cerevisiae BY4741.
The two fragments were joined in situ by the endogenous homologous recombination activity of
S. cerevisiae through the 25-bp homologous sequences present in both DNA fragments. The
desired transformants were selected for the presence of the selection marker URA3 on a uracil-
deficient plate. The resulting plasmid pKW5038 (Supplemental Fig. 52) carrying the ftmA gene
was recovered from the yeast transformant and transferred to E. coli. The plasmid was amplified
Nature Chemical Biology: doi:10.1038/nchembio.1366

- 52 -
in E. coli for subsequent characterization by restriction enzyme digestion and DNA sequencing
to confirm its identity.
2.1.1.6 Construction of pKW5036 for expression of ftmB, ftmE and S. cerevisiae NCP1.
To construct a plasmid for expressing ftmE (cytochrome P450 gene) in yeast, ftmE was amplified
from A. fumigatus NBRC 4057 genomic DNA as described above. In addition, five more DNA
fragments, NCP1 (S. cerevisiae cytochrome P450 reductase) gene8, GAL1-10 promoter, two
alcohol dehydrogenase terminators and the L-tryptophan selection marker TRP1 gene, were
amplified from S. cerevisiae X2180-1B genomic DNA using the pKW5050-Fw-2/pKW5050-Re-
2, pKW5050-Fw-6/pKW5050-Re-1, pKW5050-Fw-3/pKW5050-Re-3 and pKW5050-Fw-
4/pKW5050-Re-4, and pKW5050-Fw-5/pKW5050-Re-5 primer sets (Supplementary Table 14).
These six DNA fragments were cloned into pTOWug2-836 following the in situ homologous
recombination method described above to yield pKW5050 (Supplemental Fig. 53). Similarly,
the DNA fragment containing NCP1, GAL1-10 promoter, ftmE and two flanking alcohol
dehydrogenase terminators in pKW5050 was amplified by PCR using the pKW5036-
Fw/pKW5036-Re primer set (Supplementary Table 14) and ligated with pKW5011 that was
digested with Not I (10 units) to yield pKW5036 (Supplemental Fig. 53). To construct
pKW1124, an empty expression vector equivalent of pKW5050 without the inserted NCP1 and
ftmE genes that is useful as a negative control for in vivo and in vitro assays, two plasmids,
pKW1000 and pK1114 were constructed first. To construct pKW1000, a GAL1-10 promoter and
a multiple cloning site was amplified from the genome of S. cerevisiae X2180-1B with the
Fw_Sal I-Gal I-10/Rv_Gal I-10-MCS primer set (Supplementary Table 14), and one alcohol
dehydrogenase terminator with 13Myc-tag was amplified from pKT2409 with the
cmyc1_F/cmyc1_2_R and cmyc2_2_F/cmyc2_R primer sets (Supplementary Table 14), and
another copy of alcohol dehydrogenase terminator with 3HA-tag was amplified from pKT2409
with the 425_3HA_F/425_3HA_R primer set (Supplementary Table 14). Those PCR
amplicons are mixed with pRS42510 digested with Sal I (10 units) and assembled into pKW1000
via in situ homologous recombination. Next, the TRP1 gene was amplified from the genome of S.
cerevisiae X2180-1B with the primer set pTOWug2-836-TRP1-Fw/pTOWug2-836-TRP1-Rv
(Supplementary Table 14) and combined with Nco I-digested pTOWug2-836 to yield
pKW1114 via yeast in situ homologous recombination. Lastly, the promoter–terminator
fragment in pKW1000 was amplified from pKW1000 with the Fw_pKW1000-
Nature Chemical Biology: doi:10.1038/nchembio.1366

- 53 -
TADH/Rv_TADH-pKW1000 primer set (Supplementary Table 14) and combined through
homologous recombination with Xho I-digested pKW1114 to yield pKW1124 (Supplemental
Fig. 53).
Supplementary Figure 53. Map of plasmids pKW5050, pKW5036 and pKW1124.
2.1.1.7 Construction of pKW5052 (ftmC), pKW5049 (ftmD) and pKW5054
(ftmA+ftmC+ftmD).
Before constructing the expression vector for ftmC and ftmD, two sets promoters/terminators
capable of transcribing genes in S. cerevisiae9 were amplified by PCR from S. cerevisiae X2180-
1B genomic DNA. A primers set TEFp-leu2d-Fw2/Flag-6His-SalI-MCS-Re was used for
isolating the TEF promoter. A primer set MCS-BamHI-6His-Fw/CYCt-pTOWugdownRv was
used for isolating the CYC terminator. A primer set HXT7pFw-pTOWugup/HXT7p-Flag-Sma-
6His-Rv was used for isolating the HXT7 promoter, and GAL7t_Fw/GAL7t-pTOWug836_Rv
was used for GAL7 terminator.
To construct the vector for expressing ftmC in yeast, ftmC, TEF promoter and CYC
terminator were amplified, and pKW5012 was linearized by restriction digestion with Nco I (10
units) and Spe I (10 units). These DNA fragments were then simultaneously introduced into S.
cerevisiae BY4741 to combine them into an intact plasmid in situ by the endogenous
homologous recombination activity of S. cerevisiae as described above. The resulting plasmid
was amplified in E. coli for restriction digestion analysis and later sequenced to confirm its
identity. This plasmid was named pKW5052 (Supplemental Fig. 54). The vector for ftmD
expression, pKW5049 (Supplemental Fig. 54), was prepared following essentially the same
Nature Chemical Biology: doi:10.1038/nchembio.1366

- 54 -
procedure used to construct pKW5052 from ftmD, HXT7 promoter and GAL7 terminator
fragments and the Nco I–Spe I fragment pKW5012. Subsequently, the TEF1
promoter/ftmC/CYC terminator cassette from pKW5052 and the HXT7 promoter/ftmD/GAL7
terminator cassette from pKW5049 were amplified by PCR using the pKW5054-1F/pKW5054-
1R primer pair and the pKW5054-2F/pKW5054-2R primer pair, respectively (Supplementary
Table 14). These two amplified DNA fragments and ftmA-containing pKW5038 linearized by
Not I (10 units) digestion were combined through homologous recombination in S. cerevisiae
BY4741. The resulting plasmid pKW5054 (Supplemental Fig. 54) carrying ftmA, ftmC and
ftmD was amplified for restriction analysis and DNA sequencing to confirm its identity.
Supplementary Figure 54. Map of plasmids pKW5052, pKW5049 and pKW5054.
2.1.1.8 Construction of pKW1282 (ftmC) and pKW5067 (ftmD) for bioconversion of 2 to 4.
For bioconversion of 2 into 4 for an increased production of 4, we constructed two vectors for
expressing ftmC and ftmD in yeast. ftmC was amplified from A. fumigatus NBRC 4057 genomic
DNA using the 1282-1F/1282-1R, 1282-2F/1282-2R, 1282-3F/1282-3R, 1282-4F/1282-4R and
1282-5F/1282-5R primer sets (Supplementary Table 14), and pKW1250 was linearized by
restriction digestion with Bgl II (10 units) and Hind III (10 units). These DNA fragments were
then simultaneously introduced into S. cerevisiae BY4741 to combine them into an intact
plasmid in situ by the endogenous homologous recombination activity of S. cerevisiae as
described above. The resulting plasmid was amplified in E. coli for restriction digestion analysis
and later sequenced to confirm its identity. This plasmid was named pKW1282 (Supplemental
Fig. 55).
Nature Chemical Biology: doi:10.1038/nchembio.1366

- 55 -
To construct vector for expression of ftmD in yeast, ftmD was amplified from the A.
fumigatus NBRC 4057 cDNA using the pKW5052-Fw/pKW5052-Re primer set
(Supplementary Table 14). pKW18105 was linearized by restriction digestion with Nco I (10
units) and Spe I (10 units). These DNA fragments were then simultaneously introduced into S.
cerevisiae BY4741 to combine them into an intact plasmid in situ by the endogenous
homologous recombination activity of S. cerevisiae as described above. The resulting plasmid
was amplified in E. coli for restriction digestion analysis and later sequenced to confirm its
identity. This plasmid was named pKW5067 (Supplemental Fig. 55).
Supplementary Figure 55. Map of plasmids pKW1282 and pKW5067.
2.1.1.9 Construction of S. cerevisiae NCP1-expression vectors pKW9250 and pKW5072
for bioconversion of 2 to 4.
The vector for NCP1 expression, pKW5072 (Supplemental Fig. 56), was prepared using
pKW9250, which was constructed as follows: GAL1 promoter, leu2d and 2µ replication origin
were amplified from pKW1250 using the primer set pKW9250-Fw/pKW9250-Rv
(Supplementary Table 14). Replication origin of pBR322, ampicillin resistant marker and
methionine/cysteine/homocysteine selection marker MET15 were amplified from pRS311hm
(Supplemental Fig. 56) using the primer set pKW9250-Fw2/pKW9250-Rv2 (Supplementary
Table 14). These DNA fragments were then simultaneously introduced into S. cerevisiae
BY4741 to combine them into an intact plasmid in situ by the endogenous homologous
recombination activity of S. cerevisiae as described above. The resulting plasmid was amplified
in E. coli for restriction digestion analysis and later sequenced to confirm its identity. This
plasmid was named pKW9250. Then, pKW9250 was linearized by restriction digestion with Bgl
II (10 units), and the NCP1 gene was amplified from S. cerevisiae X2180-1B genomic DNA
using the 5070-F/5070-RR primer sets (Supplementary Table 14). These DNA fragments were
Nature Chemical Biology: doi:10.1038/nchembio.1366
- 56 -
simultaneously introduced into S. cerevisiae BY4741 to combine them into an intact plasmid in
situ by the endogenous homologous recombination activity of S. cerevisiae as described above.
The resulting plasmid was amplified in E. coli for restriction digestion analysis and later
sequenced to confirm its identity. This plasmid was named pKW5072.
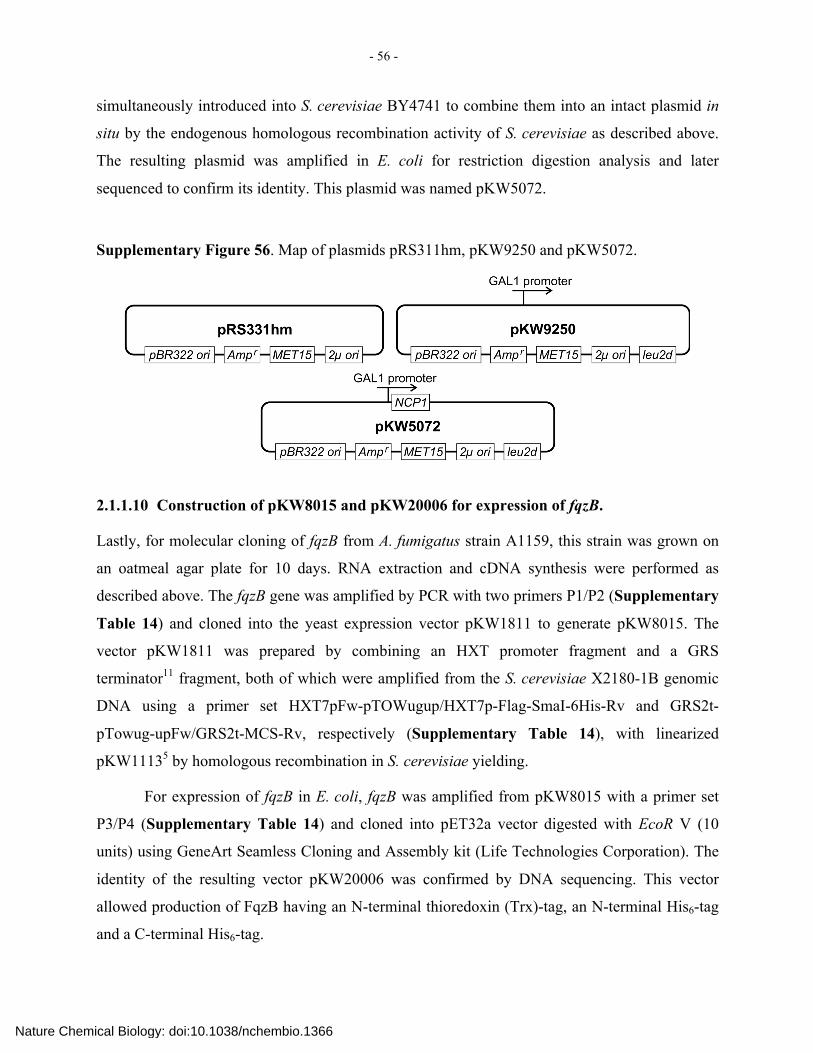
Supplementary Figure 56. Map of plasmids pRS311hm, pKW9250 and pKW5072.
2.1.1.10 Construction of pKW8015 and pKW20006 for expression of fqzB.
Lastly, for molecular cloning of fqzB from A. fumigatus strain A1159, this strain was grown on
an oatmeal agar plate for 10 days. RNA extraction and cDNA synthesis were performed as
described above. The fqzB gene was amplified by PCR with two primers P1/P2 (Supplementary
Table 14) and cloned into the yeast expression vector pKW1811 to generate pKW8015. The
vector pKW1811 was prepared by combining an HXT promoter fragment and a GRS
terminator11 fragment, both of which were amplified from the S. cerevisiae X2180-1B genomic
DNA using a primer set HXT7pFw-pTOWugup/HXT7p-Flag-SmaI-6His-Rv and GRS2t-
pTowug-upFw/GRS2t-MCS-Rv, respectively (Supplementary Table 14), with linearized
pKW11135 by homologous recombination in S. cerevisiae yielding.
For expression of fqzB in E. coli, fqzB was amplified from pKW8015 with a primer set
P3/P4 (Supplementary Table 14) and cloned into pET32a vector digested with EcoR V (10
units) using GeneArt Seamless Cloning and Assembly kit (Life Technologies Corporation). The
identity of the resulting vector pKW20006 was confirmed by DNA sequencing. This vector
allowed production of FqzB having an N-terminal thioredoxin (Trx)-tag, an N-terminal His6-tag
and a C-terminal His6-tag.
Nature Chemical Biology: doi:10.1038/nchembio.1366

- 57 -
Supplementary Table 14. Oligonucleotide primer sequences. DNA primers were designed on
the basis of sequence data obtained from the A. fumigatus Af293 genome sequencing database.
Oligonucleotides are listed in the order of appearance in the Supplementary Information.
Primer name Sequence
Online Methods Afu1g10910-RTPCR-F 5'- GGTTATCGATGTCGTCCGTCGTGAG -3' Afu1g10910-RTPCR-R 5'- GGAGACAGCACGGAAAGAGTGAGCA -3' Afu8g00170-RTPCR-F 5'- GTATCCGGCTGCGGGTCAGGTAGT -3' Afu8g00170-RTPCR-R 5'- CAGCAAACATGAACCCAACCCTCCT -3' Afu8g00190-RTPCR-F 5'- TGTTTCCCAGCTGGTTCTTCCGACT -3' Afu8g00190-RTPCR-R 5'- CCCATACTCCATTGCGGACTGAACA -3' Afu8g00200-RTPCR-F 5'- GACTCCTGTGGATCCGGAATTGCTT -3' Afu8g00200-RTPCR-R 5'- TTCTCGATGATTTCGGGCAGGTCTT -3' Afu8g00210-RTPCR-F 5'- GAAGTGTTGACGAGGAACGCTGGTG -3' Afu8g00210-RTPCR-R 5'- ATTTGGGCTGCGGGTAGAAATACGC -3' Afu8g00220-RTPCR-F 5'- GTCCGGTGGAAGAAGGACGCTGATA -3' Afu8g00220-RTPCR-R 5'- ATCAACTGCGGCAAGTCTGGGTTCT -3' Afu8g00230-RTPCR-F 5'- GTGCCTTTATCCTCAAGGGCCTGCT -3' Afu8g00230-RTPCR-R 5'- CCACACGCTGTCGTACAATGAGCAC -3' Afu8g00240-RTPCR-F 5'- TCCAGTGCGCCCGTAATATCATCCT -3' Afu8g00240-RTPCR-R 5'- CTCTCTCATCCGCTGGAACCGGTAG -3' Afu8g00250-RTPCR-F 5'- TGCAGCAACTGCTGGTTCCATACCT -3' Afu8g00250-RTPCR-R 5'- GTGATGCACGGGTTCCTTCAATCCT -3' Afu8g00260-RTPCR-F 5'- TCTCACCGACAACAAACTTCGCACA -3' Afu8g00260-RTPCR-R 5'- GGCAATACCAGGATCAACACCAGCA -3' Afu6g12060-RTPCR-F 5'- GAGCAGCTTTGCGAGGAGATCGAG -3' Afu6g12060-RTPCR-R 5'- CTGGCCCCTCTTCATCGTCATGATT -3' Section 2.1.1 pKW5012-Fw 5'- CTTTTTATTGTCAGTACTCTTAATATGAAATGCTTTTC -3' pKW5012-Re 5'- CGTATCACGAGGCCCTTTCGTCTTTAACACAGTCCTTTCCCG -3' pKW5038-1Fw 5’- TTAACGTCAAGGAGAAAAAACTATAATGGCGATGGCTCTTGCGGTAGGC -3’ pKW5038-2Re 5’- CTTATTTAGAAGTGGCGCGCCTCAGGTAGCGAAGGTATTTCCTATCAG -3’ pKW5049-Fw 5'- CAAAAAGTTTTTTTAATTTTAATCAAAAACCA
TGAAACCGAGTCACTCTGATACTCCCCTCATG -3' pKW5049-Re 5'- AAAAAATATGATATGAATGAATATTCCACTTTCTT
TTACTAATGGCGTCTGGTCAAAACGACCGGCATC -3' pKW5052-Fw 5'- GTTTTTTTAATTTTAATCAAAAACAATGTCCGA
TCTTCCCGAGGTTGCTACCAGGCTGAGC -3' pKW5052-Re 5'- TTACATGATATCGACAAAGGAAAAGGGGCCTGTA
CTACTCGCAGATCCAACTGAGCATACTAGCATGGC -3' pKW5011-Fw-1 5'- TCTTCTGGTCTGGTGCCACGCGGTTCTGGTATGTTTGTAACTAGTATGCT
TTGCTTGAAAATGAGACTAGAGGATGTGGGTGTCTTACATGCGCCTCGGG -3' pKW5011-Re-1 5'- CCTTCTCAAAGTCCTCATCGGGGTAGTTCGCTAGAAAATTCCCCTGGTAG -3' pKW5011-Fw-2 5'- CTACCAGGGGAATTTTCTAGCGAACTACCCCGATGAGGACTTTGAGAAGG -3' pKW5011-Re-2 5'- TGCGACGATTAAAGCAACGGCTCCATTGGGGAACGACACATCCCCGACAG -3' pKW5011-Fw-3 5'- CGTCAAGGAGAAAAAACTATAATGTTTGTAACTAGTATGC -3' pKW5011-Re-3 5'- CGCTTATTTAGAAGTGGCGCGCCTCAATTGGGGAACGACACATCCCCG -3' pKW5050-Fw-1 5'- GAAATTCGCTTATTTAGAAGTGGCGCGCCGAATTCACTTGTCATCGT
CATCTTTATAATCCGGAGTCGCAGAAATCGACAAGACATCCGGTAAC -3'
Nature Chemical Biology: doi:10.1038/nchembio.1366

- 58 -
PKW5050-Re-6 5'- GAATTTTTGAAAATTCAATATAAATGGAGCGACTCCCGCTGTCCCCCGC -3'
pKW5050-Fw-2 5'- CTTTAACGTCAAGGAGAAAAAACTATAATGCCGTTTGGAATAGACAACACC GAC -3' pKW5050-Re-2 5'- GATGTTAATTAACCCGGGAAAAGCTGGCCAGACATCTTCTTGGTATCTACCTG -
3' pKW5050-Fw-6 5'- GCGGGGGACAGCGGGAGTCGCTCCATTTATATTGAATTTTCAAAAATTC -3' pKW5050-Re-1 5'- GTCGGTGTTGTCTATTCCAAACGGCATTATAGT TTTTTCTCCTTGACGTTAAAG-
3' pKW5050-Fw-3 5'- CCAGTGAGCGCGCGCGTAATACGACACTATA
GCATATTACCCTGTTATCCCTAGCGGATCTGCC -3' pKW5050-Re-3 5'- CTTATCGATACCGTCGACCTCGAGGGGGGGCCCGGTA
CCCAATTCGCCCCCGGGTTAATTAACGGTGAACAAAAGC -3' pKW5050-Fw-4 5'- GTTCTAGAGCGGCCGCCACCGCGGTGGAGCTCCA
GCTTTTCCCGGGTTAATTAACATCTTTTACCCATACG -3' pKW5050-Re-4 5'- GCCAAGCGCGCAATTAACCCTCACTAAAGGGAA
CTATATTACCCTGTTATCCCTAGCGGATCTGCCGG -3' pKW5050-Fw-5 5'- AATAGGCGTATCACGAGGCCCTTTCGTCTTT
ACTATTAGCTGAATTGCCACTGCTATCGTTG -3' pKW5050-Re-5 5'- AAACAAGAATCTTTTTATTGTCAGTACTC
TTCTACAACCGCTAAATGTTTTTGTTCGAAAGACC -3' pKW5036-Fw 5'- CTAGGGATAACAGGGTAATATAGCGGCCGCTCTA
GAACTAGTGGATCCAAGTACGGATTAGAAGCCGCC -3' pKW5036-Re 5'- CAGATCCGCTAGGGATAACAGGGTAATAT
GGAGATTGATAAGACTTTTCTAGTTGCATA -3' cmyc2_2_F 5'- CCACTAGTTCTAGAGCGGCCGCCACCGCGGTGGAGC
TCCAGCTTTTGAATTGTACAAACCCGGGTTAATTAAC -3' cmyc2_R 5'- CCACTAGTTCTAGAGCGGCCGCCACCGCGGTGGAGC
TCCAGCTTTTGAATTGTACAAACCCGGGTTAATTAAC -3' cmyc1_F 5'- CCAGTGAGCGCGCGTAATACGACTCACTATAG
TATATTACCCTGTTATCCCTAGCGGATCTGCC -3' cmyc1_2_R 5'- CTTATCGATACCGTCGACCTCGAGGGGGGGCCCGGTA
CCCAATTCGCCGAATTGTACAAACCCGGGTTAATTAAC -3' 425_3HA_F 5'- GTTCTAGAGCGGCCGCCACCGCGGTGGAGCTCCAG
CTTTTCCCGGGTTAATTAACATCTTTTACCCATACG -3' 425_3HA_R 5'- GCCAAGCGCGCAATTAACCCTCACTAAAGGGAAC
TATATTACCCTGTTATCCCTAGCGGATCTGCCGG -3' Fw_SalI-GalI-10 5'- GGGTACCGGGCCCCCCCTCGAGGTCGACGGTATCGATA
AGTTATATTGAATTTTCAAAAATTCTTACTTTTTTTTTG -3' Rv_GalI-10-MCS 5'- TCCCCCGGGCTGCAGGAATTCGATATCAAGT
ATAGTTTTTTCTCCTTGACGTTAAAGTATAG -3' pTOWug2-836-TRP1-Fw 5'- AATAGGCGTATCACGAGGCCCTTTCGTCTTT
ACTATTAGCTGAATTGCCACTGCTATCGTTG -3' pTOWug2-836-TRP1-Rv 5'- AAACAAGAATCTTTTTATTGTCAGTACTCTTC
TACAACCGCTAAATGTTTTTGTTCGAAAGACC -3' Fw_pKW1000-TADH 5'- AGTGAGCGCGCGTAATACGACTCACTATAG
TATATTACCCTGTTATCCCTAGCGGATCTG -3' Rv_TADH-pKW1000 5'- AGCGCGCAATTAACCCTCACTAAAGGGAAC
TATATTACCCTGTTATCCCTAGCGGATCTG -3' TEFp-leu2d-Fw2 5'- CTCCACCGCGGTGGCCCCACACACCATAGCTTCAAAATG -3' Flag-6His-SalI-MCS-Re 5'- TCCTTGTAGTCGTCGACATGATGGTGGTG
ATGGTGCTTGTCATCGTCATCTTTATAATCC -3' MCS-BamHI-6His-Fw 5'- TCGACGACTACAAGGACGATGACGATA
AAGGATCCCATCACCATCACCATCACTAG -3' CYCt-pTOWugdownRv 5’- GGCCCCCCCTCGAGGGCGGCCGCAAAGCCTTCGAGCGTCCCAAAACC -3’ HXT7pFw-pTOWugup 5'- CTCCACCGCGGTGGCGTCGACCCGTGGAAATGAGGGGTATGCAGG -3' HXT7p-Flag-Sma-6His-Rv 5'- GCCCGGGCTTGTCATCGTCATCTTTATAA
Nature Chemical Biology: doi:10.1038/nchembio.1366

- 59 -
TCCATGGTTTTTGATTAAAATTAAAAAAAC -3' GAL7t_Fw 5'- ATGACAAGCCCGGGCATCACCATCACCATCA
CTAGTAAAAGAAAGTGGAATATTCATTCATATC -3' GAL7t-pTOWug836_Rv 5'- GGCCCCCCCTCGAGGTCCAGATTTTACTTACAAGCTGC -3' pKW5054-1F 5'- CCGGCAGATCCGCTAGGGATAACAGGGTAATAT
ACCGTGGAAATGAGGGGTATGCAGGAATTTGTGC -3' pKW5054-1R 5’- GGAGTAGAAACATTTTGAAGCTATGGTGTGTGG
GTCCAGATTTTACTTACAAGCTGCATTGTATTCC -3’ pKW5054-2F 5'- GGAATACAATGCAGCTTGTAAGTAAAATCTGGA
CCCACACACCATAGCTTCAAAATGTTTCTACTCC -3' pKW5054-2R 5'- GGGTACCGGGCCCCCCCTCGAGCACTAAAGGGA
ACAAAGCCTTCGAGCGTCCCAAAACCTTCTCAAGC -3' 1282-1F 5'- CTGGTCTGGTGCCACGCGGTTCTGGTATGAAACCGAGTCACTCTGATAC-3' 1282-1R 5'- GAAGATATCCGGAACATCCACTTGCTCACCCACGCGACGCAGCATGGTGTC-3' 1282-2F 5'- GACACCATGCTGCGTCGCGTGGGTGAGCAAGTGGATGTTCCGGATATCTTC-3' 1282-2R 5'- GTCAGGCTCGTTGCTGTGGTATCACTTCCTGCTGTGATGATGAGCATGGC-3' 1282-3F 5'- GCCATGCTCATCATCACAGCAGGAAGTGATACCACAGCAACGAGCCTGAC-3' 1282-3R 5'- CAGGATCAATGTACGCCGCTTCGGATCGACCCATACTCCATTGCGGACTG-3' 1282-4F 5'- CAGTCCGCAATGGAGTATGGGTCGATCCGAAGCGGCGTACATTGATCCTG-3' 1282-4R 5'- GAGTGGCTTTCCAATACATGAATAAGG
ACCGATGGAGAACGGGGCAAAGGCCG-3' 1282-5F 5'- CGGCCTTTGCCCCGTTCTCCATCGGTCCTTATTCATGTATTGGAAAGCCACTC-3' 1282-5R 5'- TGCGACGATTAAAGCAACGGCTCCATGGCGTCTGGTCAAAACGACCGGC-3' pKW5052-Fw 5'- GCAATCTAATCTAAGTTTTAATTACAAACCATGAC
ACAGGCAGTCGACATCGGCACGATCCAGACTTTG-3' pKW5052-Re 5'- TTACATGATATCGACAAAGGAAAAGGGGCCTGTA
CTACTCGCAGATCCAACTGAGCATACTAGCATGGC-3' pKW9250-Fw 5'- GCTTCTAATCCGTACTTGGATCCACTAGTTCTAG
AGCGGCCGTTTAATGCTATAATAGACATTTAAATC-3' pKW9250-Rv 5'- GTCATGTTGTTTCATATGATCTGGGTATCTAGAGA
AGAGTATGAGTATTCAACATTTCCGTGTCGCCC-3' pKW9250-Fw2 5'- GGGCGACACGGAAATGTTGAATACTCATACTCT
TCTCTAGATACCCAGATCATATGAAACAACATGAC-3' pKW9250-Rv2 5'- GATTTAAATGTCTATTATAGCATTAAACGGCCG CTCTAGAACTAGTGGATCCAAGTACGGATTAGAAGC-3' 5070-F 5'- CTTTAACGTCAAGGAGAAAAAACTATAA
TGATGCCGTTTGGAATAGACAACACCGAC-3' 5070-RR 5'- CGCTTATTTAGAAGTGGCGCGCCTCACCAGACATCTTCTTGGTATCTACCTG-3' P1 5'- GACGATGACAAGCCCATGACAATCAACACTGCTCTACCG -3' P2 5'- GTGATGGTGATGCCCCTCGGGACTATATGTGTCCTCC -3' HXT7pFw-pTOWugup 5'- CTCCACCGCGGTGGCGTCGACCCGTGGAAATGAGGGGTATGCAGG -3' HXT7p-Flag-SmaI-6His-Rv 5'- GCCCGGGCTTGTCATCGTCATCTTTATAA
TCCATGGTTTTTGATTAAAATTAAAAAAAC -3' GRS2t-pTowug-upFw 5'- CTCCACCGCGGTGGCGCATGCGGAGATTGATAAGACTTTTCTAG -3' GRS2t-MCS-Rv 5'- AGGACTAGGGTCACATCACCATCACCATCACG
TCGACTAGGTGAAAAAAGAGGGGAATTTTTAG -3' P3 5'- AGGCCATGGCTGATATGACAATCAACACTGCTC -3' P4 5'- ATTCGGATCCGATAACTCGGGACTATATGTGTC -3' Section 2.1.3 pKW5091-1F 5'- ATGTCCGATCTTCCCGAGGTTGCTACCAGG
CTGAGCAAAAATGTTGAGATTTTAGTGG-3' pKW5076-R 5'- AGCAGCCGGATCTCACTCGCAGATCCAACTGAGCATACTAGCATGGCTCCC-3' pKW5086-FR 5'- GGGAAGATCGGACATGTGATGATGATGATGATGGCTGCTGCCCATGG-3'
Nature Chemical Biology: doi:10.1038/nchembio.1366

- 60 -
pKW5076-RR 5'- TGAGATCCGGCTGCTAACAAAGCCCGAAAGGAAGC-3' Section 2.1.7 2micron+URA3_Fw3 5'- ACCATGATTACGCCACTGAACGAAGCATCTGTGCTTCATTTTG-3' 2micron+URA3_Rv4 5'- TCGAGCTCGGTACCCCACTCAACCCTATCTCGGTCTATTC-3' pKW20062-Fw1 5'- TGACGATGGCATCCTGCGGCCGCCCAGAAAATTACGGGTATGTC-3' pKW20062-Rv1 5'- GGCAATTGATTACGGGACAATGGCACCATCTGTTATC-3' pKW20093-F1 5'- TCGCGGGTGTTCTTGACGATGGCATCCTGCCCTGATCTTCCGAACTGGTC-3' pKW20093-R1 5'- CGCAAGAGCCATCGCCATTGCTGAGGTGTAATGATGCTG-3' pKW20093-F2 5'- CAGCATCATTACACCTCAGCAATGGCGATGGCTCTTGCG-3' pKW20093-R2 5'- ACAGTGGAGGACATACCCGTAATTTTCTGG
GCATTTAAATGTCGGTGTGACGTTGCATCG-3' amyB+trpC_Fw2 5'- GACCGAGATAGGGTTGAGTGGGGTACTA
AGCGCCGAAATCAGGCAGATAAAGCC-3' amyB+trpC_Rv2 5'- GTAAAACGACGGCCAGTGAATTCGAGCTCGG
TACACCGACAGCCAGCTTCTCCCTGCATAATG-3' pKW20096-F1 5'- TGAACAATAAACCCCACAGAAGGCAATGTTTGTAACTAGTATGCTTTGCTTG-3' pKW20096-R1 5'- GTAAACCCGAAACGCGTTTTATTCTGAT
TTAAATCTGGGTCAAGGAATTCTCCA-3' pKW20131-F1-2 5'- GTTCGACGATGCAACGTCACACCGACATTTGCCGAAATCAGGCAGATAAA-3' pKW20131-R1 5'- CATACCCGTAATTTTCTGGGCATTTGCGGCCGCCTGGGTCAAGGAATTCTCCA-3' pKW20119-F1 5'- CGGGTGTTCTTGACGATGGCATCCTGCGGCCGCACTCCGGTGAATTGATTTGG-3' pKW20119-R1 5'- CGCCTACCGCAAGAGCCATCGCCATTGTTTAGATGTGTCTATGTGGCG-3' pKW20097-F1 5'- TGAACAATAAACCCCACAGAAGGCAATGAAACCGAGTCACTCTGATACTC-3' pKW20097-R1 5'- GTAAACCCGAAACGCGTTTTATTCTGAT
TTAAATCTGCAGCACGAAGAATAGG-3' pKW20135-R1 5'- CCAAATCAATTCACCGGAGTCTGGGTCAAGGAATTCTCCA-3' pKW20135-F1 5'- TGGAGAATTCCTTGACCCAGACTCCGGTGAATTGATTTGG-3' pKW20135-R2 5'- GAGTATCAGAGTGACTCGGTTTCATTGTTTAGATGTGTCTATGTGGCG-3' pKW20135-F2 5'- CGCCACATAGACACATCTAAACAATGAAACCGAGTCACTCTGATACTC-3' pKW20135-R3 5'- GAGGACATACCCGTAATTTTCTGGGCATTT
GCGGCCGCCTGCAGCACGAAGAATAGGG-3' pKW20123-F1 5'- CGGGTGTTCTTGACGATGGCATCCTGCGGCCGCCTCCTTGTAGCGCTTGATCC-3' pKW20123-R1 5'- CGCCTACCGCAAGAGCCATCGCCATTTTGAAGATGGATGAGAAGTCG-3' pKW20136-R1 5'- GGATCAAGCGCTACAAGGAGCTGCAGCACGAAGAATAGGG-3' pKW20136-F1 5'- CCCTATTCTTCGTGCTGCAGCTCCTTGTAGCGCTTGATCC-3' pKW20136-R2 5'- CTCGGGAAGATCGGACATTTTGAAGATGGATGAGAAGTCG-3' pKW20136-F2 5'- CGACTTCTCATCCATCTTCAAAATGTCCGATCTTCCCGAG-3' pKW20136-R3 5'- GAGGACATACCCGTAATTTTCTGGGCATTT
GCGGCCGCGGACCAGGTGTCGATACAGC-3' pKW20095-F1 5'- TGAACAATAAACCCCACAGAAGGCAATGGAGCGACTCCCGCTG-3' pKW20095-R1 5'- GTAAACCCGAAACGCGTTTTATTCTGAT
TTAAATGCCAATCTGCAACGGTACATCG-3' pKW20094-F1 5'- TGAACAATAAACCCCACAGAAGGCAATGACAATCAACACTGCTCTACCG-3' pKW20094-R1 5'- GTAAACCCGAAACGCGTTTTATTCTGATTTAAATGGATTACCCTGGGTTCCGTA-
3' pKW20137-F1 5'- TCCCCAGCATCATTACACCTCAGCAATGGAGCGACTCCCGCTG-3' pKW20137-R1 5'- TTTATCTGCCTGATTTCGGCGCCAATCTGCAACGGTACATCG-3' pKW20137-F2 5'- CGATGTACCGTTGCAGATTGGCGCCGAAATCAGGCAGATAAA-3' pKW20137-R2 5'- AGGACATACCCGTAATTTTCTGGGCATTTAAATGGATTACCCTGGGTTCCGTA-3' pKW20142-F1 5'- GTCGCTGTATCGACACCTGGTCCGCGGATTACCCTGGGTTCCGTA-3' pKW20142-R1 5'- TACCCGTAATTTTCTGGGCATTTGCATTTAAATCCTGATCTTCCGAACTGGTC-3' pKW20144-F2 5'- CGACTTCTCATCCATCTTCAAAATGGAGCGACTCCCGCTG-3' pKW20144-R2 5'- TACCCGTAATTTTCTGGGCATTTGCATT
Nature Chemical Biology: doi:10.1038/nchembio.1366

- 61 -
TAAATGCCAATCTGCAACGGTACATCG-3' pKW20143-F1 5'- CCCGCCACATAGACACATCTAAACAATGGAAACCCTCGATGCG-3' pKW20144-R0 5'- GGATCAAGCGCTACAAGGAGGGTGTCCTGGGATCTTGCAG-3' pKW20144-F1 5'- CTGCAAGATCCCAGGACACCCTCCTTGTAGCGCTTGATCC-3' pKW20144-R1 5'- CAGCGGGAGTCGCTCCATTTTGAAGATGGATGAGAAGTCG-3' pKW20146-F2 5'- ACCCACCCACCAGGACAATGGAGCGACTCCCGCTG-3' pKW20146-R2 5'- TACCCGTAATTTTCTGGGCATTTGCATT
TAAATGCCAATCTGCAACGGTACATCG-3' pKW20146-F1 5'- GCTGTATCGACACCTGGTCCGCTGTGGAATCTCCTCCTTTGC-3' pKW20146-R1 5'- CAGCGGGAGTCGCTCCATTGTCCTGGTGGGTGGGT-3' Section 2.1.8 pKW20138-F1 5'- TTATTTAGAAGTGGCGCGCCGAATCTACCCATGCGGTGCAGTT-3' pKW20138-R1 5'- AAGAATTTTTGAAAATTCAATATAAATGGAAACCCTCGATGCG-3'
Nature Chemical Biology: doi:10.1038/nchembio.1366

- 62 -
2.1.2 Confirmation of the expression of cloned fungal genes in S. cerevisiae.
Supplementary Figure 57. Western blotting analyses for the expression of ftmA, npgA12 and
matB13 expressed in SCKW5, and ftmB, ftmE and NCP1, ftmC and ftmD expressed in S.
cerevisiae BY20447. Lane M: molecular weight marker; lane 1: FtmA (245 kDa), MatB (57
kDa) and NpgA (40 kDa); lane 2: FtmB (69 kDa); lane 3: FtmE (67 kDa); and lane 4: NCP1 (81
kDa); lane 5: FtmC (73 kDa); and lane 6: FtmD (47 kDa).
MW (-kDa)
220!
80!
60!
50!
40!
20
73 kDa!
47 kDa!
M 5 M 6
Nature Chemical Biology: doi:10.1038/nchembio.1366

- 63 -
2.1.3 Construction of pKW5091 for expression of ftmD in E. coli.
For expression of ftmD in E. coli, ftmD gene was amplified from cDNA that was synthesized
from mRNA isolated from A. fumigatus NBRC 4057 with a primer set pKW5091-1F/pKW5076-
R (Supplementary Table 14). The starting codon for ftmD was reassigned from the starting
codon deposited in the NCBI reference sequence XP_747184.1 based on the sequence alignment
of homologous fungal O-methyltransferases (Supplementary Fig. 58). A plasmid backbone was
also amplified from pET28b vector with a primer set pKW5086-FR/pKW5076-RR
(Supplementary Table 14). These DNA fragments were then simultaneously joined together by
using GeneArt Seamless Cloning and Assembly kit. The resulting plasmid was amplified in E.
coli for restriction digestion analysis by EcoR I (10 units) and later sequenced to confirm its
identity. This plasmid was named pKW5091 (Supplementary Fig. 59). This vector allowed
production of FtmD having an N-terminal His6-tag.
Supplementary Figure 58. Sequence alignment of the N-terminal of FtmD from A. fumigatus
NBRC 4057 with other fungal O-methyltransferases from A. fumigatus IFO 4057 (IFO4057), A.
fumigatus BM939 (BM939), A. fumigatus Af293 (Af293), A. fumigatus A1163 (A1163),
Nassarius fischeri (N.fischeri), A. terreus (A.terreus), Trichophyton rubrum (T.rubrum) and
Trichophyton equinum (T.equinum). The amino acid sequence of A. fumigatus NBRC 4057
FtmD is identical with that of A. fumigatus Af293. Sequence alignment was performed using
ClustalW. The start codon of ftmD was reassigned to that assigned to the homologous O-
methyltransferase gene from A. fumigatus A1163, and the expression vector for expressing the
revised ftmD was constructed accordingly.
Nature Chemical Biology: doi:10.1038/nchembio.1366
- 64 -
Supplementary Figure 59. Map of plasmid pKW5091 for the production of FtmD in E. coli.
2.1.4 Confirmation of the expression of ftmD in E. coli.
FtmD was prepared from E. coli BL21 (DE3) following essentially the same procedure used to
purify FqzB described in Section 2.2.1 given below. Purified protein sample was analyzed by
SDS–PAGE using Tris-HCl gel stained with Coomassie Brilliant Blue R-250 staining solution
(Supplementary Fig. 60).
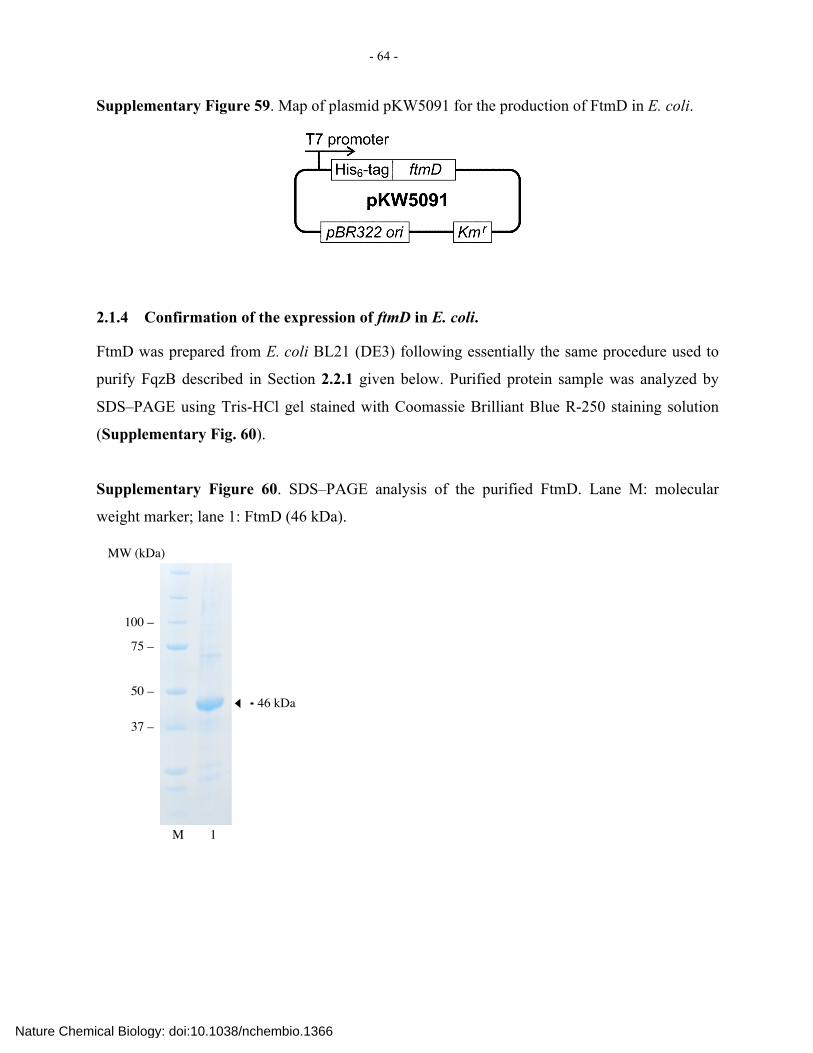
Supplementary Figure 60. SDS–PAGE analysis of the purified FtmD. Lane M: molecular
weight marker; lane 1: FtmD (46 kDa).
46 kDa!
100 –!
50 –!
75 –!
37 –!
MW (kDa)!
M 1!
Nature Chemical Biology: doi:10.1038/nchembio.1366

- 65 -
2.1.5 Characterization of in vitro activity of FtmD prepared in E. coli.
The condition of the in vitro reaction of FtmD with 3 and the subsequent workup procedure is
described in Online Methods. The result of LC–MS analysis is given below.
Supplementary Figure 61. Analyses of in vitro reaction of FtmD. (i) The HPLC profiles of
reaction mixtures showing the formation of 4 from 3. Compound 3 was added to the reaction
mixtures. (ii) Heat-inactivated FtmD was used in reaction as a negative control (denoted by (–)
within the plot). All traces were monitored at 280 nm.
Time (min)
i!
ii 3!
4!
(+)
(–)
2.1.6 Inspection of simultaneous expression of fumitremorgin and fumiquinazoline biosynthetic genes in A. fumigatus A1159.
Supplementary Figure 62. RT-PCR analysis for simultaneous expression of the fumitremorgin
biosynthetic genes and the fumiquinazoline biosynthetic gene fqzB in A. fumigatus A1159.
Nature Chemical Biology: doi:10.1038/nchembio.1366

- 66 -
2.1.7 Construction of pKW20093, pKW20131, pKW20135, pKW20136, pKW20137,
pKW20142, pKW20144 and pKW20146 for de novo production of 1–10 in A. niger.
For de novo production of 1–10 in A. niger, we constructed five vectors for expressing ftmA,
ftmB, ftmC, ftmD, ftmE and fqzB. The construction of those vectors was accomplished in situ
using the endogenous homologous recombination activity of S. cerevisiae. We made a plasmid
capable of propagating in yeast. The yeast genes of URA3 and 2µ replication origin were
amplified from pRS42610 using the primer set 2micron+URA3_Fw3/2micron+URA3_Rv4
(Supplementary Table 14), and pPTRII14 was linearized by restriction digestion with Hind III
(10 units) and Sma I (10 units). These DNA fragments were then simultaneously introduced into
S. cerevisiae BY4741 to combine them into an intact plasmid in situ by the endogenous
homologous recombination activity of S. cerevisiae as described above. The resulting plasmid
was amplified in E. coli for restriction digestion analysis and later sequenced to confirm its
identity. This plasmid was named pKW19030. Then, pKW19030 was linearized by restriction
digestion with Eag I (10 units), and the pyrG gene with promoter and terminator cassette was
amplified from A. fumigatus A1159 genomic DNA using the pKW20062-Fw1/pKW20062-Rv1
primer set (Supplementary Table 14). These DNA fragments were simultaneously introduced
into S. cerevisiae BY4741 to combine them into an intact plasmid in situ by homologous
recombination. The resulting plasmid was amplified in E. coli for restriction digestion analysis
and later sequenced to confirm its identity. This plasmid was named pKW20088. The resulting
pKW20088 was linearized by restriction digestion with Not I (10 units), and the glaA15 promoter
was amplified from A. niger genomic DNA using the pKW20093-F1/pKW20093-R1 primer set
(Supplementary Table 14). ftmA with its original terminator was amplified from A. fumigatus
A1159 genomic DNA using the pKW20093-F2/pKW20093-R2 primer set (Supplementary
Table 14). These DNA fragments were simultaneously introduced into S. cerevisiae BY4741 to
combine them into an intact plasmid in situ by homologous recombination. The resulting plasmid
was amplified in E. coli for restriction digestion analysis and later sequenced to confirm its
identity. This plasmid was named pKW20093 (Supplementary Fig. 63).
The amyB promoter and trpC terminator were amplified from pKW300016 using the
primer set amyB+trpC_Fw2/amyB+trpC_Rv2 (Supplementary Table 14), and pKW19030 was
linearized by restriction digestion with Kpn I (10 units). These DNA fragments were then
simultaneously introduced into S. cerevisiae BY4741 to combine them into an intact plasmid in
Nature Chemical Biology: doi:10.1038/nchembio.1366

- 67 -
situ by homologous recombination. The resulting plasmid was amplified in E. coli for restriction
digestion analysis and later sequenced to confirm its identity. This plasmid was named
pKW19023. pKW19023 was linearized by restriction digestion with Hind III (10 units) and Kpn
I (10 units), and ftmB with its original terminator was amplified from A. fumigatus A1159
genomic DNA using the pKW20096-F1/pKW20096-R1 primer set (Supplementary Table 14).
These DNA fragments were simultaneously introduced into S. cerevisiae BY4741 to combine
them into an intact plasmid in situ by the endogenous homologous recombination activity of S.
cerevisiae as described above. The resulting plasmid was amplified in E. coli for restriction
digestion analysis and later sequenced to confirm its identity. This plasmid was named
pKW20096.
The amyB15 promoter and ftmB with the terminator were amplified from pKW20096
using the pKW20131-F1-2/pKW20131-R1 primer set (Supplementary Table 14), and
pKW20093 was linearized by restriction digestion with Sma I (10 units). These DNA fragments
were then simultaneously introduced into S. cerevisiae BY4741 to combine them into an intact
plasmid in situ by homologous recombination. The resulting plasmid was amplified in E. coli for
restriction digestion analysis and later sequenced to confirm its identity. This plasmid was named
pKW20131 (Supplementary Fig. 63).
The gpdA15 promoter was amplified from A. niger A1179 genomic DNA using the
pKW20119-F1/pKW20119-R1 primer set (Supplementary Table 14), and pKW20093 was
linearized by restriction digestion with Mlu I (10 units) and Sma I (10 units). These DNA
fragments were simultaneously introduced into S. cerevisiae BY4741 to combine them into an
intact plasmid in situ by homologous recombination. The resulting plasmid was amplified in E.
coli for restriction digestion analysis and later sequenced to confirm its identity. This plasmid
was named pKW20119.
pKW19023 was linearized by restriction digestion with Hind III (10 units) and Kpn I (10
units), and ftmC with its original terminator was amplified from A. fumigatus A1159 genomic
DNA using the pKW20097-F1/pKW20097-R1 primer set (Supplementary Table 14). These
DNA fragments were simultaneously introduced into S. cerevisiae BY4741 to combine them into
an intact plasmid in situ by homologous recombination. The resulting plasmid was amplified in
E. coli for restriction digestion analysis and later sequenced to confirm its identity. This plasmid
Nature Chemical Biology: doi:10.1038/nchembio.1366

- 68 -
was named pKW20097. The amyB promoter and ftmB with the terminator were amplified from
pKW20096 using the pKW20131-F1-2/pKW20135-R1 primer set (Supplementary Table 14).
The gpdA promoter was amplified from pKW20119 using the pKW20135-F1/pKW20135-R2
primer set (Supplementary Table 14). ftmC with its original terminator was amplified from
pKW20097 using the pKW20135-F2/pKW20135-R3 primer set (Supplementary Table 14).
The pKW20093 was linearized by restriction digestion with Swa I (10 units). These DNA
fragments were simultaneously introduced into S. cerevisiae BY4741 to combine them into an
intact plasmid in situ by homologous recombination. The resulting plasmid was amplified in E.
coli for restriction digestion analysis and later sequenced to confirm its identity. This plasmid
was named pKW20135 (Supplementary Fig. 63).
The pKW20093 was linearized by restriction digestion with Mlu I (10 units) and Sma I
(10 units), and the gpdA promoter was amplified from A. niger A1179 genomic DNA using the
pKW20123-F1/pKW20123-R1 primer set (Supplementary Table 14). These DNA fragments
were simultaneously introduced into S. cerevisiae BY4741 to combine them into an intact
plasmid in situ by homologous recombination. The resulting plasmid was amplified in E. coli for
restriction digestion analysis and later sequenced to confirm its identity. This plasmid was named
pKW20123.
The amyB promoter and ftmB with the terminator were amplified from pKW20096 using
the pKW20131-F1-2/pKW20135-R1 primer set (Supplementary Table 14). The gpdA promoter
was amplified from pKW20119 using the pKW20135-F1/pKW20135-R2 primer set
(Supplementary Table 14). ftmC with its original terminator was amplified from pKW20097
using the pKW20135-F2/pKW20136-R1 primer set (Supplementary Table 14). The mbfA15
promoter was amplified from pKW20123 using the pKW20136-F1/pKW20136-R2 primer set
(Supplementary Table 14). ftmD with its original terminator was amplified from A. fumigatus
A1159 genomic DNA using the pKW20136-F2/pKW20136-R3 primer set (Supplementary
Table 14). The pKW20093 was linearized by restriction digestion with Swa I (10 units). These
DNA fragments were simultaneously introduced into S. cerevisiae BY4741 to combine them into
an intact plasmid in situ by homologous recombination. The resulting plasmid was amplified in
E. coli for restriction digestion analysis and later sequenced to confirm its identity. This plasmid
was named pKW20136 (Supplementary Fig. 63).
Nature Chemical Biology: doi:10.1038/nchembio.1366
- 69 -
ftmE with its original terminator was amplified from A. fumigatus A1159 genomic DNA
using the pKW20095-F1/pKW20095-R1 primer set (Supplementary Table 14), and pKW19023
was linearized by restriction digestion with Hind III (10 units) and Kpn I (10 units). These DNA
fragments were simultaneously introduced into S. cerevisiae BY4741 to combine them into an
intact plasmid in situ by homologous recombination. The resulting plasmid was amplified in E.
coli for restriction digestion analysis and later sequenced to confirm its identity. This plasmid
was named pKW20095.
fqzB with its original terminator was amplified from A. fumigatus A1159 genomic DNA
using the pKW20094-F1/pKW20094-R1 primer set (Supplementary Table 14), and pKW19023
was linearized by restriction digestion with Hind III (10 units) and Kpn I (10 units). These DNA
fragments were simultaneously introduced into S. cerevisiae BY4741 to combine them into an
intact plasmid in situ by homologous recombination. The resulting plasmid was amplified in E.
coli for restriction digestion analysis and later sequenced to confirm its identity. This plasmid
was named pKW20094.
ftmE with its original terminator was amplified from pKW20095 using the pKW20137-
F1/pKW20137-R1 primer set (Supplementary Table 14). The amyB promoter and fqzB with the
terminator were amplified from pKW20094 using the pKW20137-F2/pKW20137-R2 primer set
(Supplementary Table 14). pkW20093 was linearized by restriction digestion with Sph I (10
units). These DNA fragments were simultaneously introduced into S. cerevisiae BY4741 to
combine them into an intact plasmid in situ by homologous recombination. The resulting plasmid
was amplified in E. coli for restriction digestion analysis and later sequenced to confirm its
identity. This plasmid was named pKW20137 (Supplementary Fig. 63).
A contiguous fragment containing the cassette having the glaA promoter and ftmE with
its terminator, and the cassette with amyB promoter and fqzB with its terminator was amplified
from pKW20137 using the pKW20142-F1/pKW20142-R1 primer set (Supplementary Table
14). Separately, linearized pKW20136 was prepared by restriction digestion of the plasmid with
Not I (10 units). These DNA fragments were then simultaneously introduced into S. cerevisiae
BY4741 to combine them into an intact plasmid in situ by homologous recombination. The
resulting plasmid was amplified in E. coli for restriction digestion analysis and later sequenced to
confirm its identity. This plasmid was named pKW20142 (Supplementary Fig. 63).
Nature Chemical Biology: doi:10.1038/nchembio.1366

- 70 -
ftmE with its terminator was amplified from pKW20137 using the pKW20144-
F2/pKW20144-R2 primer set (Supplementary Table 14). In addition, ftmG with its original
terminator was amplified from A. fumigatus A1159 genomic DNA using the pKW20143-
F1/pKW20144-R0 primer set (Supplementary Table 14), and the mbfA promoter was amplified
from A. niger A1179 genomic DNA using the pKW20144-F1/pKW20144-R1 primer set
(Supplementary Table 14). Separately, linearized pKW20135 was prepared by restriction
digestion of the plasmid with Not I (10 units). These DNA fragments were then simultaneously
introduced into S. cerevisiae BY4741 to combine them into an intact plasmid in situ by
homologous recombination. The resulting plasmid was amplified in E. coli for restriction
digestion analysis and later sequenced to confirm its identity. This plasmid was named
pKW20144 (Supplementary Fig. 63).
A fragment containing ftmE with its terminator was amplified from pKW20137 using the
pKW20146-F2/pKW20146-R2 primer set (Supplementary Table 14), and the coxA promoter15
was amplified from A. niger A1179 genomic DNA using the pKW20146-F1/pKW20146-R1
primer set (Supplementary Table 14). Separately, linearized pKW20136 was prepared by
restriction digestion of the plasmid with Not I (10 units). These DNA fragments were then
simultaneously introduced into S. cerevisiae BY4741 to combine them into an intact plasmid in
situ by homologous recombination. The resulting plasmid was amplified in E. coli for restriction
digestion analysis and later sequenced to confirm its identity. This plasmid was named
pKW20146 (Supplementary Fig. 63).
Nature Chemical Biology: doi:10.1038/nchembio.1366

- 71 -
Supplementary Figure 63. Maps of plasmids pKW20093, pKW20131, pKW20135, pKW20136,
pKW20137, pKW20142, pKW20144 and pKW20146.
Nature Chemical Biology: doi:10.1038/nchembio.1366
- 72 -
2.1.8 Construction of pKW20138 for expression of ftmG in S. cerevisiae.
To construct the vector for expressing the ftmG gene in yeast, we isolated total RNA from A.
fumigatus A1159 using the Ambion RNAqueous kit (Life Technologies Corporation). A High
Capacity cDNA reverse transcription kit (Life Technologies Corporation) was used for
synthesizing cDNA according to the protocol supplied by the manufacturer following essentially
the same procedure described above. ftmG was amplified from the cDNA library using the
pKW20138-F1/pKW20138-R1 primer set (Supplementary Table 14). The amplified fragment
was cloned into pKW5050 (Supplemental Fig. 53), which was linearized by restriction
digestion with Xho I (10 units), by in situ homologous recombination in S. cerevisiae as
described above. The resulting plasmid was amplified in E. coli for restriction digestion analysis
and later sequenced to confirm its identity. This plasmid was named pKW20138.
Nature Chemical Biology: doi:10.1038/nchembio.1366

- 73 -
2.2 Supplementary Note 2. FqzB protein preparation and analysis.
2.2.1 Protein production and purification of FqzB.
Overexpression and subsequent protein purification of FqzB was performed as follows: E. coli
BL21 (DE3) harboring the plasmid pKW20006 was grown overnight in 20 ml of LB (lysogeny
broth) with 100 µg ml–1 carbenicillin at 37 °C. 9 liters of fresh LB with 100 µg ml–1 carbenicillin
was inoculated with 5 ml of the overnight culture and incubated at 37 °C until the optical density
at 600 nm reached 0.6. Then expression of each gene was induced with 100 µM isopropylthio-β-
D-galactoside at 15 °C. Incubation was continued for another 20 h, after which cells were
harvested by centrifugation at 2,500 × g. All subsequent procedures were performed at 4 °C or
on ice. Harvested cells were resuspended in disruption buffer (0.1 M Tris-HCl (pH 7.4), 100 mM
NaCl). Cells were disrupted by French press (Ohtake Works, Co. Ltd.), and the lysate was
clarified by centrifugation at 5,000 × g. The supernatant and precipitate were recovered as
soluble and insoluble fractions, respectively. The soluble fraction containing the protein of
interest was applied to 10 ml of Ni-NTA Sepharose resin (GE Healthcare Life Sciences)
previously equilibrated in the binding buffer, which is the disruption buffer supplemented with
10 mM imidazole. The column was washed with the binding buffer, then proteins were eluted
stepwise with 10 ml of binding buffer supplemented with 100, 250, 500 mM and 1 M of
imidazole. Fractions containing proteins having the target molecular weight were pooled and
dialyzed against 0.1 M Tris-HCl (pH 7.4), 0.1 M NaCl, and 20 % (v/v) glycerol. Protein
concentration was estimated using the Bio-Rad protein assay kit (Bio-Rad Laboratories) with
bovine immunoglobulin G as a standard. Purified protein samples were analyzed by SDS–PAGE
using Tris-HCl gel stained with Coomassie Brilliant Blue R-250 staining solution
(Supplementary Fig. 64). The purified protein was concentrated using a centrifugal filtration
device (30 kDa molecular weight cutoff Amicon Ultra centrifugal unit, EMD Millipore Corp.),
and was flash frozen in liquid nitrogen and stored at –80 °C until use for in vitro assays.
Nature Chemical Biology: doi:10.1038/nchembio.1366

- 74 -
Supplementary Figure 64. SDS–PAGE analysis of the purified FqzB. Lane M: molecular
weight marker; lane 1: FqzB (71 kDa).
2.2.2 Preparative-scale in vitro reaction with FqzB for structure elucidation of 17a, 17b
and 18.
Supplementary Figure 65. Preparative-scale in vitro reaction of FqzB for detailed
characterization of the resulting products. Preparative HPLC profile of the FqzB reaction,
showing the formation of 17a, 17b and 18 from 4. The UV trace was monitored at 210 nm.
Nature Chemical Biology: doi:10.1038/nchembio.1366

- 75 -
2.3 Supplementary Note 3. Heterologous de novo biosynthesis of 1–10 in A. niger.
2.3.1 Transformation and cultivation of A. niger for de novo production of 1–10.
Transformation of A. niger with desired plasmid (Supplementary Note 1) was performed as
described elsewhere17. The transformed A. niger strain was initially cultured on a CD agar plate
(Czapek Dox agar: NaNO3 6 g l–1, KCl 0.52 g l–1, KH2PO4 1.52 g l–1, glucose 10 g l–1, MgSO4・
7H2O 0.49 g l–1 and agar 20 g l–1 supplemented with a mixture comprised of FeSO4・7H2O 1 g l–1,
ZnSO4・7H2O 8.8 g l–1, CuSO4・7H2O 0.4 g l–1, Na2B4O7・10H2O 0.1 g l–1, (NH4)6Mo7O24・4H2O
0.05 g l–1 and adjusted to pH6.5 with 1 N KOH) supplemented with 10 mM uridine and 5 mM
uracil at 30 °C for 7 days. Conidia collected from a single plate were used to inoculate 200 ml of
CD medium supplemented with 10 mM uridine and 5 mM uracil, which was shaken for
additional 36 h at 30 °C. Grown cells were collected by filtration and washed with 0.8 M sodium
chloride. The cells were incubated with 1 ml of 10 mM sodium phosphate buffer (pH 8.0)
containing 0.8 M sodium chloride, 50 mg ml–1 Lysing Enzyme (Sigma-Aldrich) and 1,500 units
of β-glucuronidase at room temperature for 3 h. The resulting protoplasts were filtered and
subsequently centrifuged at 1,500 × g for 5 min at room temperature. The collected protoplasts
were washed with 0.8 M sodium chloride and centrifuged to remove the wash solution. The cells
were suspended in 200 µl of STC buffer at pH 8.0 (0.8 M sorbitol, 10 mM calcium chloride and
10 mM Tris-HCl). Then 40 µl of PEG solution at pH 8.0 (400 mg ml–1 polyethylene glycol 4,000,
50 mM calcium chloride and 10 mM Tris-HCl) was added to the protoplast suspension. The
mixture was subsequently combined with 4 µg of the DNA fragment with which the cells were
to be transformed. The mixture was incubated at 4 °C for 20 min to allow the transformation to
proceed. After incubation on ice, 1 ml of the PEG solution was added to the reaction mixture,
and the mixture was incubated at room temperature for additional 5 min. The resulting cells were
plated on a CD–NaCl agar medium (CD medium with 15 g l–1 agar and 0.8 M NaCl) with a
suitable selection agent. After incubating the plate at 30 °C for 5 h, the cells were overlaid with a
CD–NaCl soft agar medium. The transformants were transferred to fresh CD agar plates and
grown at 30 °C for another 7 days. The resultant cells were inoculated into 30 ml of liquid
medium without glucose (CD medium with 20 mg ml–1 soluble starch and 20 mg ml–1 tryptone)
at 30 °C for 5 days with 180 r.p.m. Product isolation and analysis were performed following
essentially the same procedure for isolating and characterizing the compounds prepared in our
Nature Chemical Biology: doi:10.1038/nchembio.1366

- 76 -
yeast system as described in Online Methods. Results are shown in Supplementary Figure 66
and 67.
Supplementary Figure 66. De novo production of 1–6 in A. niger. HPLC traces of extracts of
the culture of A. niger harboring (i) an empty vector pKW20088 as a negative control, (ii) ftmA,
(iii) ftmA/ftmB, (iv) ftmA/ftmB/ftmC, (v) ftmA/ftmB/ftmC/ftmD and (vi)
ftmA/ftmB/ftmC/ftmD/ftmE. All traces were monitored at 280 nm.
Nature Chemical Biology: doi:10.1038/nchembio.1366
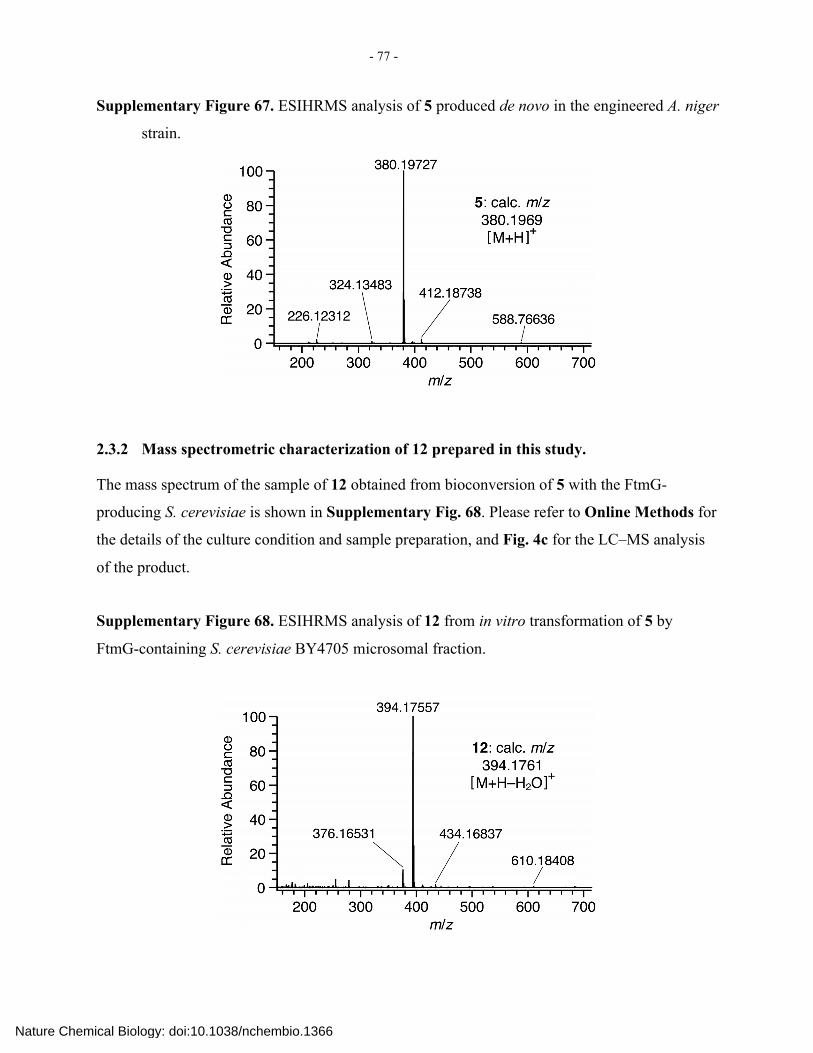
- 77 -
Supplementary Figure 67. ESIHRMS analysis of 5 produced de novo in the engineered A. niger
strain.
2.3.2 Mass spectrometric characterization of 12 prepared in this study.
The mass spectrum of the sample of 12 obtained from bioconversion of 5 with the FtmG-
producing S. cerevisiae is shown in Supplementary Fig. 68. Please refer to Online Methods for
the details of the culture condition and sample preparation, and Fig. 4c for the LC–MS analysis
of the product.
Supplementary Figure 68. ESIHRMS analysis of 12 from in vitro transformation of 5 by
FtmG-containing S. cerevisiae BY4705 microsomal fraction.
Nature Chemical Biology: doi:10.1038/nchembio.1366
- 78 -
3. Supplementary References
1 Grundmann, A. & Li, S.M. Overproduction, purification and characterization of FtmPT1, a brevianamide F prenyltransferase from Aspergillus fumigatus. Microbiology 151, 2199–2207 (2005).
2 Kobayashi, M. et al. Marine natural products. XXXIV. Trisindoline, a new antibiotic indole trimer, produced by a bacterium of Vibrio sp. separated from the marine sponge Hyrtios altum. Chem. Pharm. Bull. (Tokyo) 42, 2449–2451 (1994).
3 Cui, C.-B., Kakeya, H. & Osada, H. Spirotryprostatin B, a novel mammalian cell cycle inhibitor produced by Aspergillus fumigatus. J. Antibiot. (Tokyo) 49, 832–835 (1996).
4 Cui, C.-B., Kakeya, H. & Osada, H. Novel mammalian cell cycle inhibitors, spirotryprostatins A and B, produced by Aspergillus fumigatus, which inhibit mammalian cell cycle at G2/M phase. Tetrahedron 52, 12651–12666 (1996).
5 Ishiuchi, K. et al. Establishing a new methodology for genome mining and biosynthesis of polyketides and peptides through yeast molecular genetics. Chembiochem 13, 846–854 (2012).
6 Johnson, M. et al. NCBI BLAST: a better web interface. Nucleic Acids Res. 36, W5–9 (2008).
7 Jaroszewski, L., Rychlewski, L., Li, Z., Li, W. & Godzik, A. FFAS03: a server for profile–profile sequence alignments. Nucleic Acids Res. 33, W284–288 (2005).
8 Turi, T.G. & Loper, J.C. Multiple regulatory elements control expression of the gene encoding the Saccharomyces cerevisiae cytochrome P450, lanosterol 14 alpha-demethylase (ERG11). J. Biol. Chem. 267, 2046–2056 (1992).
9 Sheff, M.A. & Thorn, K.S. Optimized cassettes for fluorescent protein tagging in Saccharomyces cerevisiae. Yeast 21, 661–670 (2004).
10 Christianson, T.W., Sikorski, R.S., Dante, M., Shero, J.H. & Hieter, P. Multifunctional yeast high-copy-number shuttle vectors. Gene 110, 119–122 (1992).
11 Partow, S., Siewers, V., Bjorn, S., Nielsen, J. & Maury, J. Characterization of different promoters for designing a new expression vector in Saccharomyces cerevisiae. Yeast 27, 955–964 (2010).
12 Ma, S.M. et al. Complete reconstitution of a highly reducing iterative polyketide synthase. Science 326, 589–592 (2009).
13 An, J.H. & Kim, Y.S. A gene cluster encoding malonyl-CoA decarboxylase (MatA), malonyl-CoA synthetase (MatB) and a putative dicarboxylate carrier protein (MatC) in Rhizobium trifolii — cloning, sequencing, and expression of the enzymes in Escherichia coli. Eur. J. Biochem. 257, 395–402 (1998).
14 Kubodera, T., Yamashita, N. & Nishimura, A. Transformation of Aspergillus sp. and Trichoderma reesei using the pyrithiamine resistance gene (ptrA) of Aspergillus oryzae. Biosci. Biotechnol. Biochem. 66, 404–406 (2002).
15 Blumhoff, M., Steiger, M.G., Marx, H., Mattanovich, D. & Sauer, M. Six novel constitutive promoters for metabolic engineering of Aspergillus niger. Appl. Microbiol. Biotechnol. 97, 259–267 (2013).
16 Nakazawa, T. et al. Overexpressing transcriptional regulator in Aspergillus oryzae activates a silent biosynthetic pathway to produce a novel polyketide. Chembiochem 13, 855–861 (2012).
17 Shibuya, I. et al. Molecular cloning of the glucoamylase gene of Aspergillus shirousami and its expression in Aspergillus oryzae. Agric. Biol. Chem. 54, 1905–1914 (1990).
Nature Chemical Biology: doi:10.1038/nchembio.1366