Sun Valley and Snow-dump Study Area - Amazon Web Services
28
Sun Valley and Snow-dump Study Area Fauna Inventory and Assessment November, 2009
Transcript of Sun Valley and Snow-dump Study Area - Amazon Web Services
Sun Valley and Snow-dump Study Area
Fauna Inventory and Assessment
November, 2009

SS uu nn VV aa ll ll ee yy aa nn dd SS nn oo ww -- dd uu mm pp SS tt uu dd yy AA rr ee aa November 2009
Report prepared by: Paul Prior, Fauna Biologist Patricia Moleirinho, GIS Technologist Reviewed by: Sue Hayes, Project Manager, Terrestrial Monitoring
and Field Inventories Scott Jarvie, Manager, Watershed Monitoring and Reporting Section
This report may be referenced as:
Toronto and Region Conservation Authority (TRCA). 2009. Sun Valley and Snow Dump Study Area, Fauna Inventory and Assessment.
SS uu nn VV aa ll ll ee yy aa nn dd SS nn oo ww -- dd uu mm pp SS tt uu dd yy AA rr ee aa November 2009
Table of Contents
pp aa gg ee
1.0 Introduction............................................................................................1 1.1 The Terrestrial Natural Heritage Program .......................................................................1
1.1.1 Landscape Indicators....................................................................................................... 2 1.1.2 The Region Today............................................................................................................ 4 1.1.3 The Region in 100 Years .................................................................................................. 4 1.1.4 Fauna Species ................................................................................................................. 4
1.2 Inventory Methodology ..................................................................................................5
2.0 Results and Discussion..........................................................................5 2.1 Site Location; Floristic and Physiographic Regions........................................................5 2.2 Habitat Patch Findings for Sun Valley and Snow-dump Study Area .............................5
2.2.1 Quality Distribution of Natural Cover................................................................................ 5 2.2.2. Quantity of Natural Cover................................................................................................ 6
2.3 Fauna Findings for Sun Valley and Snow-dump Study Area..........................................6 2.3.1 Fauna Species Representation....................................................................................... 6 2.3.2 Fauna Species of Concern................................................................................................... 6
3.0 Recommendations...............................................................................10 3.1 Summary of Site Highlights ..........................................................................................11 3.2 Site Recommendations.................................................................................................11
4.0 References ...........................................................................................15
SS uu nn VV aa ll ll ee yy aa nn dd SS nn oo ww -- dd uu mm pp SS tt uu dd yy AA rr ee aa November 2009
pp aa gg ee
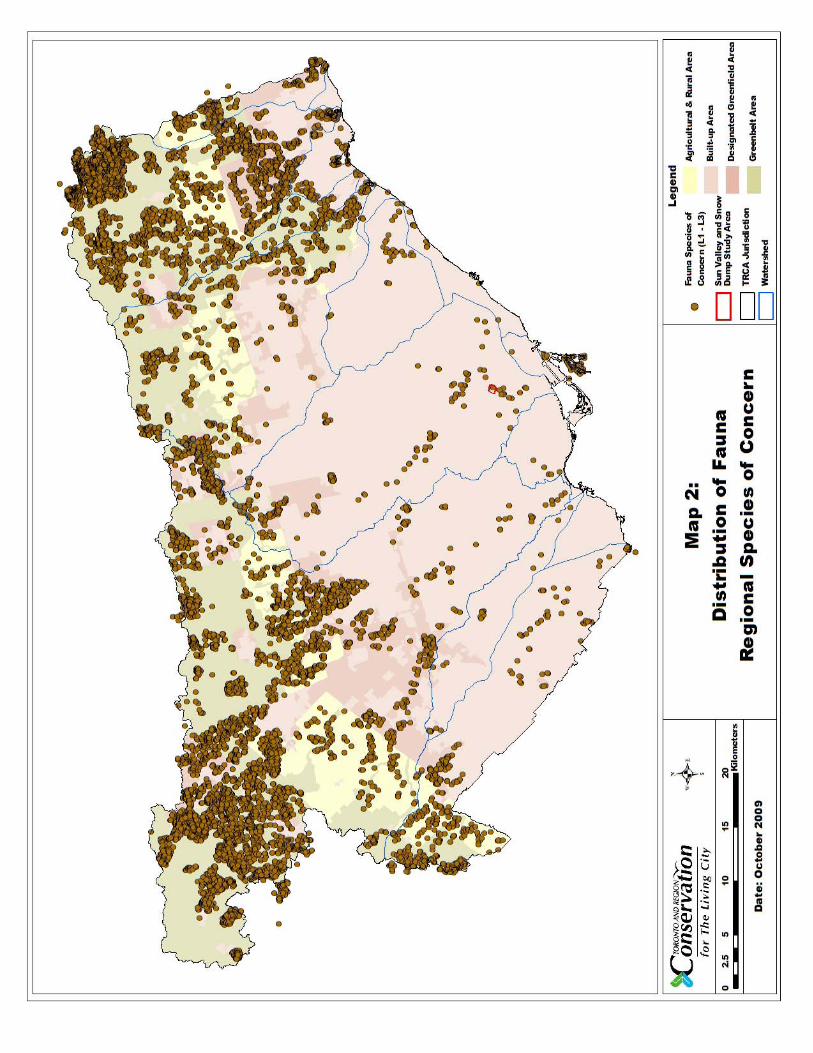
Lis t o f Tab les Table 1: Habitat patch quality, rank and species response ................................................... 3 L is t o f Maps Map 1: Regional Natural System Habitat Patch Quality................................................... 16 Map 2: Distribution of Fauna Regional Species of Concern............................................ 17 Map 3: Sun Valley and Snow-dump Study Area in the Context of Regional Natural ..... 18 Map 4: Sun Valley and Snow-dump Study Area .............................................................. 19 Map 5: Habitat Patch Quality ............................................................................................ 20 Map 6: Location of Fauna Species of Concern ................................................................ 21
List of Appendices Appendix A: List of Fauna Species .................................................................................... 22
SS uu nn VV aa ll ll ee yy aa nn dd SS nn oo ww -- dd uu mm pp SS tt uu dd yy AA rr ee aa November 2009
1.0 Introduction This report presents the results of the breeding bird inventory conducted at the Sun Valley and Snow-dump study area during the 2009 field season. The intention of this report is to provide managers with information that will inform any future restoration or land management decisions on the site. Data collected during the 2009 breeding season is augmented by all other fauna data available from the Toronto and Region Conservation Authority (TRCA) archives referring to the subject site. The TRCA maintains a large database of vertebrate fauna observations which is primarily populated by data collected through site inventories which are conducted following the Terrestrial Natural Heritage (TNH) data collection field protocol (TRCA, 2007c). The TRCA field inventories provide a snapshot of the breeding bird community that is utilizing the natural habitat associated with the site. The bird species assessed are almost exclusively those that are considered to be breeding (possible, probable or confirmed) within the site boundaries. No attempt is made to document the use of the site as either a migratory stopover or winter foraging habitat. This report is divided into several sections that include background information on the TNH ranking and scoring process. Also included is the data collection methodology along with the results and analysis of the information collected through field surveys. Finally, recommendations designed to protect or improve the TNH features of the site are provided. 1.1 The Terrestrial Natural Heritage Program
Rapid urban expansion in the TRCA jurisdiction has led to continuous and incremental loss of natural cover and species. In a landscape that probably supported 95% forest cover prior to European settlement, current mapping (2002) shows that only 17% forest and wetland cover remains. Agricultural and natural lands are increasingly being urbanized while species continue to disappear. This represents a substantial loss of ecological integrity and ecosystem function that would be exacerbated in the future according to current urbanization trends. In the late 1990s the TRCA initiated the TNH Program to address the loss of terrestrial biodiversity within the nine watersheds that compose its jurisdiction. It based this work on two landscape-level indicators: the quality distribution of natural cover and the quantity of natural cover. These indicators summarize changes that occurred to the historical natural system. The aim of the program is to create a conservation strategy that protects elements of the natural system (vegetation communities, flora and fauna species) before they become rare and to promote greater ecological function of the natural system as a whole. These aims are accomplished through a Terrestrial Natural Heritage Systems Strategy (TNHSS) by setting targets – both short and long term (100 years) – for the two landscape indicators to provide direction in planning at all scales (TRCA, 2007d).
1
SS uu nn VV aa ll ll ee yy aa nn dd SS nn oo ww -- dd uu mm pp SS tt uu dd yy AA rr ee aa November 2009
One example of the stress placed on the natural system in urban situations is illustrated by a continent-wide study undertaken by the Cornell Laboratory of Ornithology. The study showed that scarlet tanagers (Piranga olivaceus) (a bird species that requires mature deciduous forests), are less area sensitive in a landscape that still has a high percentage of forest cover than in a landscape where overall forest cover has been greatly reduced (Rosenburg et al., 1999). This example demonstrates how important it is to view development and management at the broader regional scale rather than solely at the site-specific level. The important issue is the cumulative loss of natural cover in the TRCA region that has resulted from innumerable site-specific decisions. 1.1.1 Landscape Indicators
The quality distribution and quantity of natural cover in a region are important determinants of the species distribution, vegetation community health and the provision of ecosystem services in that region. As agricultural and urban land uses replace natural cover, diminishing proportions of various natural vegetation communities and reduced populations of native species remain. Unforeseen stresses are then exerted on the remaining flora and fauna in the natural heritage system and they become rarer and may eventually be at risk of extirpation. This pattern ultimately lowers the ability of the land to support biodiversity and to maintain or enhance the quality of human life (e.g. through increased pollution and decreased space for recreation). Base Mapping The first step in evaluating a natural system or an individual habitat patch is to interpret and map land cover using aerial photographs. The basic unit for the evaluation at all scales is the habitat patch in the region, which are then combined and evaluated as a system at any scale. A habitat patch is a continuous piece of habitat, as determined from aerial photo interpretation. TRCA maps habitat according to four broad categories: forest, wetland, meadow, and coastal (beach, dune, or bluff). At the regional level, the TRCA jurisdiction is made up of thousands of habitat patches. This mapping of habitat patches in broad categories is conducted through remote–sensing and is used in the evaluation of quality, distribution and quantity of natural cover. It should not be confused with the more detailed mapping of vegetation communities that is obtained through field surveys and that is used to ground-truth the evaluation. Quality Distribution of Natural Cover Quality is not just viewed on its own across the watershed, distribution of this quality is considered at the same time. If the distribution of quality habitat is poor, then the distribution of species of concern will also be poor. Where these species occur there is often a high correlation to the range and quality of ecosystem services provided. Therefore, for a watershed to deliver the range of ecosystem services equally across the watershed and provide the habitat necessary to maintain a complex and dynamic terrestrial system, good quality habitat must be distributed evenly. By examining the quality of habitat across each subunit or subwatershed the distribution of quality habitat or ‘quality distribution’ can be ascertained.
2

SS uu nn VV aa ll ll ee yy aa nn dd SS nn oo ww -- dd uu mm pp SS tt uu dd yy AA rr ee aa November 2009
Each habitat patch is evaluated according to three criteria: size (the number of hectares occupied by the patch), shape (edge-to-area ratio), and matrix influence (measure of the positive and negative impacts from surrounding land use) (TRCA, 2007a). A total score for each patch is obtained through a weighted average of the scores for the three criteria. This total score is used as a surrogate for the ‘quality’ of a habitat patch and is translated into a local rank (L-rank) ranging from L1 to L5 based on the range of possible total scores from three to 15 points. Of these L-ranks, L1 represents the highest quality habitat and L5 the poorest. Species presence or absence correlates to habitat patch size, shape and matrix influence (patch quality) (Kilgour, 2003). The quality target is based on attaining a quality of habitat patch throughout the natural system that would support in the very long term a broad range of biodiversity, more specifically a quality that would support the region’s fauna Species of Conservation Concern (Table 1). Table 1: Habitat patch quality, rank and species response
Size, Shape and Matrix Influence
Patch Rank Fauna Species of Conservation
Concern Excellent L1 Generally found Good L2 Generally found Fair L3 Generally found Poor L4 Generally not found Very Poor L5 Generally not found
In addition to the three criteria that make up the total habitat patch score, another important measure to consider in assessing habitat patch quality is forest interior, i.e. the amount of forest habitat that is greater than 100 meters from the edge of the forest patch, using 100 meter increments. A recognized distance for deep interior conditions occurs at 400 meters from the patch edge. Such conditions are a habitat requirement for several sensitive fauna species. Quantity The quantity target is the amount of natural cover which needs to exist in the landscape in order to accommodate and achieve the quality distribution targets described above (TRCA, 2007b). The two targets are therefore linked to each other: it will be impossible to achieve the required distribution of natural heritage quality without the appropriate quantity of natural cover. This target has been set at 30% for the TRCA jurisdiction. Based on 2002 orthophotography, 25% of the land area in the TRCA jurisdiction consists of natural cover but this figure includes meadow and old field. Although historically, the region would have consisted of up to 95% forest cover, today (i.e. 2002) only about 17% is covered by forest and wetland. Of the non-natural cover (i.e. the remaining 75%), 48% is urban and 27% is rural / agricultural.
3

SS uu nn VV aa ll ll ee yy aa nn dd SS nn oo ww -- dd uu mm pp SS tt uu dd yy AA rr ee aa November 2009
1.1.2 The Region Today
The regional level analysis of habitat patches shows that the present average patch quality across the TRCA jurisdiction is “fair” (L3); forest and wetland cover is contained largely in the northern half of the TRCA jurisdiction, especially on the Oak Ridges Moraine; and the quantity is 17% of the surface area of the jurisdiction (Map 1). Thus the existing natural system stands below the quantity target that has been set for the region (30%). It becomes increasingly important to recognize that all site-based decisions contribute to the condition of a region. 1.1.3 The Region in 100 Years
The targets for quality distribution and quantity fall short of the historic pre-settlement condition, which was likely an “excellent” patch quality (L1 rank) on average, with an even distribution and close to 100% natural cover. Those historical conditions are not the regional vision any more than 100% urban is desirable; rather, the goal is to promote natural cover in a city region where urban communities, agriculture and natural cover function together as an ecosystem. The targets represent an important move toward the sustainability of regional biodiversity. Achieving the targets would reverse the current trend of declining species and vegetation communities and would improve the system’s quality sufficiently to offset many impacts from further urban growth and intensification. 1.1.4 Fauna Species
While the targets for the natural heritage system are derived from regional-scale information, the site surveys at the ground-truthing scale provide important information that can be used in conjunction with the targets to plan decisions at the site level. A key component of the ground-truthing surveys is the scoring and ranking of fauna species to generate local (L) ranks (L1 to L5) (TRCA, 2007e). Fauna species are scored based on seven criteria: local occurrence, local population trend, continent-wide population trend, habitat dependence, sensitivity to development, area-sensitivity, and patch isolation sensitivity. With the use of this ranking system species of regional concern (ranked L1 to L3), now replace the idea of rare species. Rarity (local occurrence) is still considered but is now one of many criteria that make up the L-ranks, making it possible to recognize species of regional concern before they have become rare. As shown in Map 2, fauna species of regional concern are generally absent from the urban matrix. Conservation efforts need to be exercised before a species becomes rare, since much of the damage is irreversible once a species becomes rare in the landscape.. This is why the regional targets are relevant at the site scale where cumulative impacts occur. In addition to the L1 to L3 species, a large number of currently common or secure species at the regional level are considered of concern in the urban context. These are the species identified with a conservation rank of L4. Although L4 species are widespread and frequently occur in relatively intact urban sites, they are vulnerable to long-term declines. Given the location of the Sun Valley and Snow-dump study area, an assessment of the occurrence of L4 species is important.
4
SS uu nn VV aa ll ll ee yy aa nn dd SS nn oo ww -- dd uu mm pp SS tt uu dd yy AA rr ee aa November 2009
1.2 Inventory Methodology
A biological inventory of the breeding birds at the Sun Valley and Snow-dump study area was conducted according to the TRCA data collection methodology (TRCA, 2007c). Habitat patch mapping was excerpted from the regional 2002 mapping of broadly-defined patch categories (forest, wetland, meadow and coastal) and digitized using ArcView GIS software. Fauna data were collected by the TRCA on May 31st, June 29th and July 5th. These surveys were concerned primarily with the mapping of breeding bird species of regional concern. Songbirds are surveyed in the period late-May to early-July in order to obtain breeding bird data and to exclude migrants. Reports of any herptile and mammal fauna are incidental observations, acquired during the breeding bird surveys. The methodology for identifying confirmed and possible breeding birds follows Cadman et al., (2007). Fauna species of both regional and urban concern (species ranked L1 to L4) were mapped as point data. In addition, a list of all fauna species observed at the site was documented (See Appendix A). It is important to understand the scope of the TRCA inventory protocol which is geared primarily to the reporting of vocal fauna taxa such as birds. Audio-based protocols such as those used by the TRCA, are considerably less labour-intensive than other recording protocols. This is important to consider when comparing TRCA inventory data with data from other agencies either from the same or separate sites. 2.0 Results and Discussion This section provides the information collected and its analysis in the context of the TNH Strategy. 2.1 Site Location; Floristic and Physiographic Regions
The Sun Valley and Snow-dump study area is located within the lower reaches of the Don watershed (Maps 1 and 2). The site lies entirely within the Carolinian floristic region, composed of primarily deciduous forest accommodating many southern flora species. 2.2 Habitat Patch Findings for Sun Valley and Snow-dump Study Area
The following details the study area according to the two natural system indicators used in designing the Terrestrial Natural Heritage System Strategy: the quality distribution and quantity of natural cover. Analysis was based on 2002 ortho-photos. 2.2.1 Quality Distribution of Natural Cover
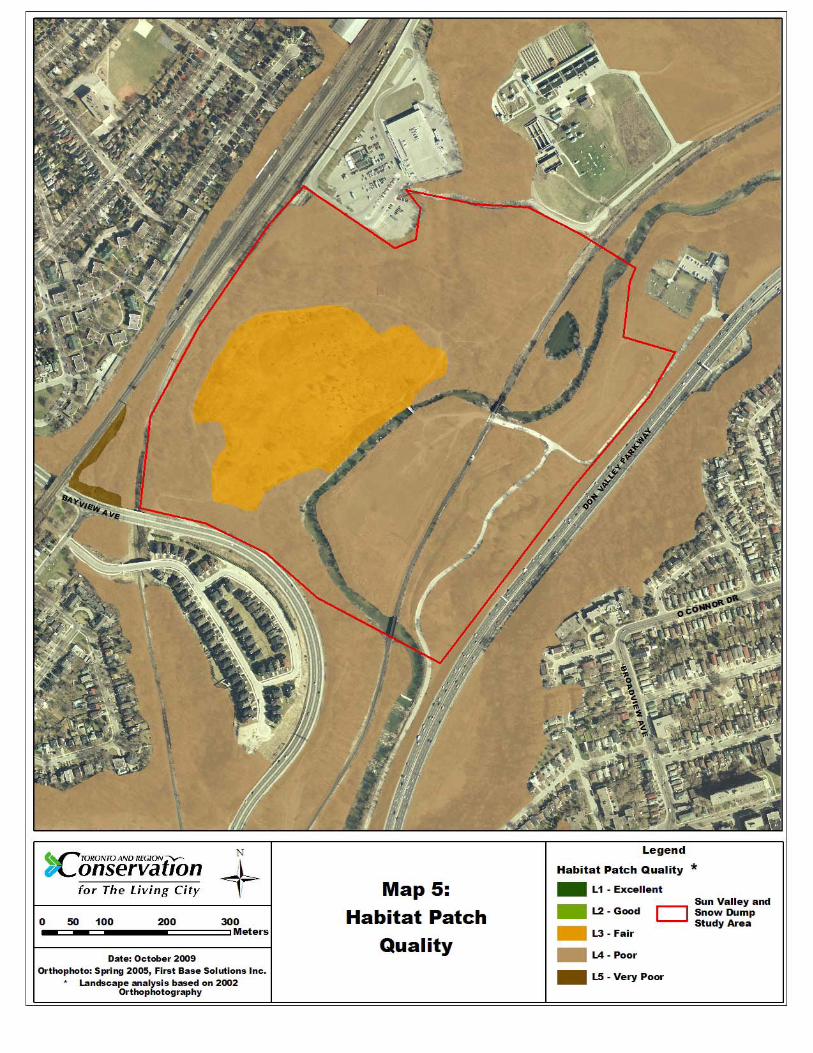
The results for quality distribution bring together the remote-sensed assessment of habitat patch size, habitat patch shape and matrix influence scores. The habitat on the site is split fairly evenly between open meadow and closed forest habitat types. However, since patch size is assessed on
5

SS uu nn VV aa ll ll ee yy aa nn dd SS nn oo ww -- dd uu mm pp SS tt uu dd yy AA rr ee aa November 2009
continuous patch size and is influenced by the continuation of a patch beyond the site boundaries the two habitat types score slightly differently. The forest patch is situated largely on the west side of the Don River and as such constitutes a fairly large continuous patch, scoring “fair” for size, while the meadow habitat is divided by the Don River, thereby scoring as “poor” for size. This ratio of scores is reversed when considering shape since the meadow blocks are rather compact in shape (scoring “good” for patch shape) as opposed to the rather more linear shape of the forest patch (scoring “poor”). As should be expected for an urban site such as this, matrix influence scores as “poor” and “very poor”. The combination of these scores for the various patches within the site results in an over all “poor” (L4) total patch score (Maps 4 and 5) with the central meadow patch scoring slightly higher (“fair” or L3) due to its compact shape. 2.2.2. Quantity of Natural Cover
The area of the Don watershed is approximately 35,806 ha containing 16.5% natural cover, including 3223 ha as forest (9%), 2603 ha as meadow (7.3%) and 82 ha as wetland (0.2%). The surveyed area makes up 39.7 ha of which 35.9 ha are natural cover including 17 ha of forest (including successional), and 18.9 ha of meadow. This amounts to 0.6% of the total natural cover in the Don watershed. 2.3 Fauna Findings for Sun Valley and Snow-dump Study Area
2.3.1 Fauna Species Representation
The TRCA fauna surveys at Sun Valley and Snow-dump in 2009, documented a total of 36 bird species, three mammals, and one herpetofauna species, for a total number of 40 possible breeding fauna species identified by the TRCA. This total is very similar to vertebrate fauna totals from other similarly sized urban sites inventoried by the TRCA. The TRCA database also shows that an extra fauna species has been previously reported from the site: observations in 1995 recorded meadow vole (Microtus pennsylvanicus) on the central meadow patch. It is possible that this common species persists on the site but the TRCA inventory protocol is not designed to report small mammals on anything other than an incidental basis. More labour-intensive protocols utilizing traps would likely reveal other small mammal species on the site. Refer to Appendix A for a list of the fauna species and their corresponding L-ranks. 2.3.2 Fauna Species of Concern
Fauna species are considered of regional concern if they rank L1 to L3 based on their scores for the seven criteria mentioned in Section 1.1.4. In the urban context, L4 ranked species need also to be considered since this rank indicates a species that is not entirely secure within the urban landscape. This is a proactive, preventive approach, as it identifies those species that are sensitive to urban pressures. Conservation efforts can then focus on the requirements or needs of these species and address these issues before the species becomes rare in the landscape.
6
SS uu nn VV aa ll ll ee yy aa nn dd SS nn oo ww -- dd uu mm pp SS tt uu dd yy AA rr ee aa November 2009
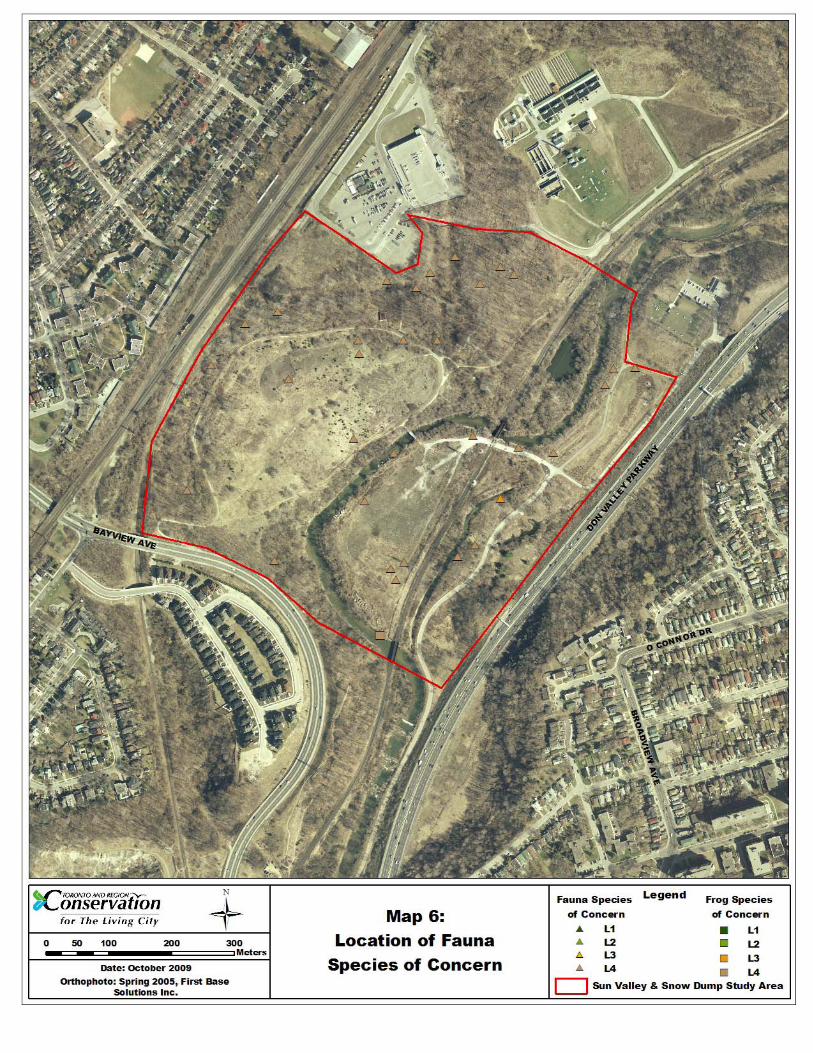
Fauna surveys at the Sun Valley and Snow-dump study area reported just one L3 ranked bird species: a group of five young wood ducks (Aix sponsa) were observed on one of the backwater pools on the east side of the main river. A total of 13 L4 ranked bird species were reported from the site with grey catbird (Dumetella carolinensis) occurring in particularly high numbers (eight territories). In addition, there was one herpetofauna of urban concern (green frog, Rana clamitans) and one mammal species of urban concern (eastern chipmunk, Tamias striatus). The report of meadow vole dates from 1995 and therefore falls outside of the time period (the previous ten years) covered by this inventory, thus the total fauna species of regional and urban concern at the site is 16. Locations of these breeding fauna are depicted on Map 6. Local occurrence is one of seven scoring criteria for fauna species and is based on TRCA data and information from the Natural Heritage Information Centre (NHIC) of the Ontario Ministry of Natural Resources (OMNR). Using local occurrence as a measure of regional rarity, any species that is reported as a probable or confirmed breeder in fewer than 10 of the 44 10x10 km grid squares in the TRCA jurisdiction is considered regionally rare (i.e. scores three to five points for this criterion). At the Sun Valley and Snow-dump study area there no vertebrate fauna species that are considered regionally rare. Most regionally rare fauna species have other associated factors that explain their vulnerability and need to be taken into account in conservation strategies. It should be noted however that the site accommodates two swallow species (tree swallow, Tachycineta bicolor, and barn swallow, Hirundo rustica), a group that has come under close scrutiny in recent years as national and international trends indicate very significant declines in the populations of these abundant aerial foragers. If declines of these species continue then it is entirely possible that their local occurrence scores will be considerably reduced. Sensitivity to development is another criterion used to determine the L-rank of fauna species. A large number of impacts that result from local land use, both urban and agricultural, can affect the local fauna. These impacts – considered separately from the issue of actual habitat loss – can be divided into two distinct categories. The first category involves changes that arise from local urbanization that directly affect the breeding habitat of the species in question. These changes alter the composition and structure of the vegetation communities; for example, the clearing and manicuring of the habitat (e.g. by removal of dead wood and clearance of shrub understorey). The second category of impacts involves changes that directly affect individuals of the species in question. Examples include increased predation from an increase in the local population of predator species that thrive alongside human developments (e.g. blue jays, Cyanocitta cristata; American crows, Corvus brachyrhynchos; squirrels, raccoons and house cats); parasitism (from facilitating the access of brown-headed cowbirds, Molothrus ater, a species which prefers more open, edge-type habitat); competition (for nest-cavities with bird species such as house sparrows, Passer domesticus; and European starlings, Sturnus vulgaris); flushing (causing disturbance and abandonment of nest); and, sensitivity to pesticides. Fauna species are considered to have a high sensitivity to development if they score three or more points (out of a possible five) for this criterion. At the Sun Valley and Snow-dump study area, ten of the species that are ranked L1 to L4 receive this score and are therefore considered sensitive to one or more of the impacts associated with development. These species are currently
7
SS uu nn VV aa ll ll ee yy aa nn dd SS nn oo ww -- dd uu mm pp SS tt uu dd yy AA rr ee aa November 2009
at this site because despite the largely negative matrix influence associated with the surrounding urban landscape and the proximity to the Don Valley Parkway, the size of the combined patches of natural habitat allows some dissipation of the intensity of urban impacts. It does not fall within the scope of the TNH inventory protocol to assess the success (productivity, survivorship, recruitment) of those fauna elements found on the site, but the fact that at least two of the sensitive L4 species (eastern kingbird, Tyrannus tyrannus, and grey catbird) have established multiple territories suggests that some of these species are viable at this location. However, it is important to understand that negative matrix influences are not solely associated with the proximity of urban and suburban developments; many of the negative influences can be transferred deep within an otherwise intact natural matrix by extensive trail networks used by large numbers of people originating from quite distant urban and suburban centres. Extensive public use of a natural habitat can have substantial negative impact through the cumulative effects of hiking, dog-walking and biking on the site. The tendency for local urbanization to be accompanied by the clearing and maintenance of woodlands and thickets in the vicinity dramatically disrupts any species that is dependent on such scrub cover for nesting or foraging, and certainly many of the sensitive species at the Sun Valley and Snow-dump study area have such specific requirements (e.g. grey catbird and indigo bunting, Passerina cyanea – species that are dependent on relatively undisturbed shrub understorey and edge habitat). Many sensitive bird species nest low in the ground vegetation and as such are highly susceptible both to increased predation from ground-foraging predators that are subsidized by local residences (house cats, raccoons) and to repeated flushing from the nest (by pedestrians, off-trail bikers and dogs) resulting in abandonment and failed breeding attempts. Such sensitive bird species – often much associated with open, meadow habitats - are seemingly entirely absent from the subject site. Various studies have shown that many bird species react negatively to human intrusion (i.e. the mere presence of people) to the extent that nest-abandonment and decreased nest-attentiveness lead to reduced reproduction and survival. One example of such a study showed that abundance was 48% lower for hermit thrushes (a ground-nesting/foraging species) in intruded sites than in the control sites (Gutzwiller and Anderson, 1999). Elsewhere, a recent study reported that dog-walking in natural habitats caused a 35% reduction in bird diversity and a 41% reduction in abundance, with even higher impacts on ground-nesting species (Banks and Bryant, 2007). Area sensitivity is a scoring criterion that can be closely related to the latter issue of a species need for isolation. Fauna species are scored for area sensitivity based on their requirement for a certain minimum size of preferred habitat. Species that require large tracts of habitat (> 100 ha in total) score the maximum five points, while species that either show no minimum habitat requirement, or require < 1 ha in total, score one point. Species scoring three points or more (require 5+ ha in total) are deemed area sensitive species. Researchers have shown that for some species of birds, area sensitivity is a rather fluid factor, dependent and varying inversely with the
8

SS uu nn VV aa ll ll ee yy aa nn dd SS nn oo ww -- dd uu mm pp SS tt uu dd yy AA rr ee aa November 2009
overall percentage forest cover within the landscape surrounding the site where those species are found (Rosenburg et al., 1999). Four of the fauna species of regional and urban concern that were identified on the subject site are considered area sensitive.
Species’ patch-size constraints are due to a variety of factors including foraging requirements and the need for isolation within a habitat block during nesting. In the latter case, regardless of the provision of a habitat patch of sufficient size, if that block is seriously and frequently disturbed by human intrusion, such species will be liable to abandon the site. Such a variety of habitat needs are more likely satisfied within a larger extent of natural cover. Three of the four area sensitive species at the subject site are cavity nesting species and as such their area dependence is driven by the availability of relatively large standing deadwood, or mature trees that provide such cavities. Such opportunities are often only available in larger forest tracts but can also be managed for in more restricted patches. The provision of nest boxes can, to some extent, off-set the lack of suitable natural opportunities. The remaining area sensitive species - Cooper’s hawk, Accipiter cooperii – was until quite recently considered very sensitive to urban disturbance but in the past decade appears to have adapted well to urban habitats in order to benefit from the large concentrations of urban tolerant prey-species (e.g. pigeons, doves, starlings and robins) that frequent urban gardens and parks. Cooper’s hawk still requires a certain degree of isolation for its nest but such conditions are available in many of Toronto’s ravines. Patch isolation sensitivity in fauna measures the overall response of fauna species to fragmentation and isolation of habitat patches. One of the two main aspects of this scoring criterion is the physical ability or the predisposition of a species to move about within the landscape and is related to the connectivity of habitat within a landscape. The second main aspect is the potential impact that roads have on fauna species that are known to be mobile. Thus most bird species score fairly low for this criterion (although they prefer to forage and move along connecting corridors) whereas many herpetofauna score very high (since their life cycle requires them to move between different habitat types which may increase likelihood of roadkill). One example of how this criterion affects species populations is the need for adult birds to forage for food during the nestling and fledgling stage of the breeding season. By maintaining and improving the connectivity of natural cover within the landscape (e.g. by reforestation of intervening lands) we are able to positively influence the populations of such species, improving their foraging and dispersal potential. At the subject site the TNH inventory reported four fauna species that score three or more points for patch isolation sensitivity, two of these are species of urban concern (green frog and eastern chipmunk). The remaining two species are L5 species and as such, despite their sensitivity to some of the issues associated with patch isolation, their populations are able to withstand, for example, the impacts of road-kill. Both green frog and eastern chipmunk are susceptible to road-kill and roads to the east and west of the site no doubt have considerable impact on population dynamics, however, the site is well connected both to the north and south via the river corridor and populations are therefore not as isolated as might otherwise be the case.
9
SS uu nn VV aa ll ll ee yy aa nn dd SS nn oo ww -- dd uu mm pp SS tt uu dd yy AA rr ee aa November 2009
Fauna species that score greater than three points under the habitat dependence criterion are considered habitat specialists. These species exhibit a combination of very specific habitat requirements that range from their microhabitat (e.g. decaying logs, aquatic vegetation) and requirements for particular moisture conditions, vegetation structure or spatial landscape structures, to preferences for certain community series and macro-habitat types. Of the 40 fauna species that occur at the subject site only Cooper’s hawk is considered a habitat specialist, showing a specific requirement for mature trees to accommodate their nest structures. The species has a particular preference for tall mature trees – generally conifers, but will choose deciduous trees – on a steep slope, such as for example the ravine slopes at the Sun Valley and Snow-dump site. Although no nest was actually located in the 2009 survey it is quite likely that the species nested either on the site or in similar habitat nearby. Representation is essentially the presence or absence of a species at a site. However, beyond mere representation of single species is the idea that a natural system can be considered as a healthy functioning system if there is an association of several species thriving within that system. Each habitat type supports particular species associations. As the quality of the habitat patch improves so will the representation of flora and fauna species within that habitat. In this way representative biodiversity is an excellent measure of the health of a natural system. The absence of any habitat dependent species indicates that the forest and meadow habitat at the subject site is not functioning at a particularly high level, indeed the majority of the fauna species breeding at the site are somewhat generalist in their habitat requirements. This is much as expected for an urban location such as this where even if the preferred habitat types are available many other factors work to diminish the suitability of the location as a breeding site. Forest habitat types in urban locations are especially compromised since one entire structural layer – the ground layer - becomes functionally diminished due to excessive human and dog traffic. Meadows are even more compromised since they are effectively comprised of only one structural layer – the ground layer. Since meadow and forest are the two components of this site it therefore follows that the fauna list is somewhat depauperate. However, even with a considerably compromised ground layer, the forest canopies – both upper and middle - still provide nesting opportunities for species that are not dependent on ground layer foraging. It is therefore surprising that two forest species – red-eyed vireo (Vireo olivaceous) and eastern wood-pewee (Contopus virens) – are so poorly represented in the 2009 inventory results. Other factors, perhaps even the timing of survey visits, may be responsible for the low territory counts. 3.0 Recommendations The recommendations for improving the fauna community at the Sun Valley and Snow-dump study area are given in relation to the regional targets for natural heritage in the TRCA jurisdiction and with consideration for the site’s local context. To reach the regional targets for quality distribution and quantity of natural cover, every site will require its own individualized plan of action. Following is a short summary of the site highlights, followed by specific management recommendations.
10

SS uu nn VV aa ll ll ee yy aa nn dd SS nn oo ww -- dd uu mm pp SS tt uu dd yy AA rr ee aa November 2009
3.1 Summary of Site Highlights
total of 40 vertebrate fauna species observed presence of a pair of Cooper’s hawks presence of a seemingly healthy population (eight territories) of the L4 ranked grey
catbird presence of four cavity nesting forest species including the L3 ranked wood duck no regionally rare vertebrate fauna found site ranks as “poor” for habitat patch total score 35.9 ha of natural cover present (0.6% of Don watershed natural cover) the site is situated within a major natural corridor that serves significant numbers of
migrating songbirds
3.2 Site Recommendations
Optimize Patch Size & Shape The larger a habitat block, the more resilient the associated fauna communities are to either developments within the landscape or increased user pressure. Specific recommendations:
• Extend and enhance the most easterly wetland feature (between the cycle path and the Don Valley Parkway) west toward the cycle path.
• Enhance the wetland feature that is located between the railway track and the cycle path
by decreasing the severity of the sloping banks and increasing the channel width. • Extend the native thicket buffers around both of these wetland features, enlarging the
overall habitat patch area. Minimize Negative Matrix Influence Matrix influence works at different intensities depending on the type of natural habitat that is being impacted. A simple hierarchy can be suggested which places the four broad natural habitat types in the following order with regards to how effectively each habitat type is able to support its associated fauna in the urban landscape:
1. Wetland habitat - although highly susceptible to some of the issues associated with urban
matrix influence (pollution and noise), possesses its own built-in buffering against the more direct influences of human-traffic.
2. Woodland habitat - fares quite well since there are structural elements that are not as
intensely impacted by the urban matrix influence as others, namely the middle and upper canopy layers. Human and dog disturbance is reduced or absent in these layers and
11
SS uu nn VV aa ll ll ee yy aa nn dd SS nn oo ww -- dd uu mm pp SS tt uu dd yy AA rr ee aa November 2009
species associated with these layers (red-eyed vireo, eastern wood-pewee, Contopus virens) are therefore more likely to succeed in urban situations than meadow species.
3. Successional habitat - primarily shrub dominated and often at the forest/meadow
interface. Recent research has stressed the importance of considering forest-edge and early successional habitats (including shrub-sapling dominated habitats) in conservation plans for migratory landbirds (Rodewald and Brittingham, 2004).
4. Meadow habitat is the least successful at providing effective nesting opportunities in
urban locations since unrestricted dog and hiker access disrupts ground-nesting bird species (such as savannah sparrow, Passerculus sandwichensis and eastern meadowlark, Sturnella magna).
Referring to this hierarchy it will be possible to steer management in a direction that might reduce the impacts of negative matrix influence by concentrating restoration efforts on the habitat types that are appropriate for the immediate landscape. Any opportunity to create wetland habitat to replace the extensive but currently rather depauperate meadow habitat at the centre of this site, would considerably improve the foraging opportunities for migrating birds and simultaneously provide less-disturbed breeding opportunities for wetland bird species. With respect to birds, the replacement of the meadow habitat with extensive wetland habitat would result in an over all increase in avian diversity. However, this portion of the study area is the site of a capped garbage-dump, taken out of service in the early 1980s. The history of this location makes it inappropriate to install a wetland. Therefore, the preferred second option is to create extensive shrub habitat across this section. Specific Recommendations:
• Plant native herbaceous species and shrubs across the central open habitat section of the site to create foraging opportunities for migrant songbirds.
• Restore the currently open habitat on the east bank of the main meander of the Don River
with native riparian tree species, creating an extensive block of foraging habitat for migrant songbirds and potential breeding habitat.
• Restrict dog access to meadow and shrub habitat (including all restoration areas) on the
site either by diligent enforcement of the existing dogs-on-leash by-law, or by imposing a more restrictive no pets policy as has been implemented at Tommy Thompson Park. Such action will facilitate improved nesting opportunities and success for ground-nesting and shrub-nesting species.
• Decommission any informal trail system so that hikers and dog-walkers are steered away
from newly planted areas, e.g. within the east bank meander.
12

SS uu nn VV aa ll ll ee yy aa nn dd SS nn oo ww -- dd uu mm pp SS tt uu dd yy AA rr ee aa November 2009
• Maintain a simple loop trail that skirts the suggested restoration area at the centre of the site, complete with detailed interpretive signage detailing the history and proposed restoration.
• Management of invasive, non-native flora should be given a high priority. • Introduction of non-native fauna species should be prevented and interpretive signs
explaining the consequences of such introductions (introduction of non-native pathogens, competition with native species, and destruction of microhabitats) should be incorporated into the trail design.
Improve Connectivity to Nearby Habitat Given the site’s situation on the lower reaches of the Don River – a major natural corridor north to south across the huge urban area of the City of Toronto – the site is of considerable significance to migrating birds. It is unlikely that there will be any significant change in the matrix influence impacting the natural habitats at this site and therefore the absence of important ground-nesting elements is unlikely to change. However, transient populations of migrant species are less likely to be as profoundly effected by such matrix disturbances since in many cases the disturbed fauna will simply move on to less disturbed areas within the habitat patch or elsewhere in the corridor. Of course, such disturbance needs still to be kept to a minimum since undisturbed foraging is of considerable importance to migrating birds. Specific Recommendations:
• Enhance the foraging and shelter options on the banks of the wetlands and elsewhere on the site to improve the potential use by migrating song-birds. Dense stands of native fruiting shrubs around the wetlands will well serve the large numbers of migrants which use the Don Valley as a corridor, north in the spring and south in the fall.
• Increasing the density of the shrub cover will improve the nesting opportunities for shrub-
nesting species such as willow flycatcher (Empidonax traillii), grey catbird and indigo bunting.
Improve Habitat Quality The quality of habitat on any given site can be improved by managing at two quite different levels. The site habitat quality can be improved by working at both the level of vegetation community and local topography, and at the more fine-detailed microhabitat level, such as providing actual nesting opportunities. The first two of the following recommendations work at the broader scale of the vegetation community level, while the latter four are applications at the microhabitat level. Specific Recommendations:
13

SS uu nn VV aa ll ll ee yy aa nn dd SS nn oo ww -- dd uu mm pp SS tt uu dd yy AA rr ee aa November 2009
• Maintain shrub and thicket habitat on the site of the decommissioned garbage dump at an early successional stage by implementing a permanent program of pruning and tree removal.
• All active management projects will need to be carefully designed so as to have minimal
impact on the existing fauna.
• Snake hibernacula should be installed at specific locations throughout the site (augmenting any natural ones that already exist). These structures need to be provided in locations that will not require migration across any type of road way.
• Turtle basking structures should be installed in the wetlands on the east-side of the site. • Opportunities for nesting turtles should be provided and maintained in the vicinity of the
wetlands. The extent of nest-predation at these locations should be monitored (Toronto Zoo, 2008).
• A carefully managed and monitored nest-box program should be initiated on the site,
providing nesting opportunities for tree swallows in both the wetland and open meadow habitats.
All of the above recommendations are made entirely from a vertebrate fauna management perspective and it should be understood that specific flora, vegetation community and invertebrate considerations will need to be assessed as part of any over all site management design.
14
SS uu nn VV aa ll ll ee yy aa nn dd SS nn oo ww -- dd uu mm pp SS tt uu dd yy AA rr ee aa November 2009
4.0 References
Banks, Peter B., and Jessica V.Bryant. 2007. Four-legged friend or foe? Dog walking displaces native birds from natural areas. Biology Letters. (2007) 3. 611-613. Published online.
Cadman, M.D., D.A. Sutherland, G.G. Beck, D. Lepage, and A.R. Couturier (eds.). 2007. Atlas of
the Breeding Birds of Ontario, 2001 – 2005. Bird Studies Canada, Environment Canada, Ontario Field Ornithologists, Ontario Ministry of Natural Resources, and Ontario Nature, Toronto, xxii + 706pp.
Gutzwiller, K.J. and S.H. Anderson. 1999. Spatial extent of human-intrusion effects on
subalpine bird distributions. Condor 101:378-389. Kilgour, B. 2003. Landscape and patch character as a determinant of occurrence of eighty
selected bird species in the Toronto area. A report prepared for the TRCA. Jacques-Whitford Ltd.,2003
NHIC (Ontario Natural Heritage Information Centre), 2008. Natural Heritage Information website:
http://nhic.mnr.gov.on.ca/nhic_.cfm Rosenburg, K.V., R.W. Rohrbaugh, Jr., S.E. Barker, R.S. Hames and A.A. Dhondt. 1999. A land
manager’s guide to improving habitat for scarlet tanagers and other forest-interior birds. Ithaca, NY: The Cornell Lab of Ornithology.
Rodewald, Paul G. and Brittingham, Margaret C. 2004. Stopover Habitats of Landbirds during
Fall: Use of Edge-dominated and Early-successional Forests. The Auk, Vol. 121, No. 4, pp 1040-1055
Toronto Zoo. 2008. Consructing Artificial Turtle Nests. Retrieved November 13th, 2009, from
www.torontozoo.com. TRCA, 2007a. Setting terrestrial natural heritage system targets. Toronto Region Conservation
Authority. TRCA, 2007b. Evaluating and designing terrestrial natural heritage systems. Toronto Region
Conservation Authority. TRCA, 2007c. Terrestrial natural heritage program data collection methodology. Toronto
Region Conservation Authority. TRCA, 2007d. The terrestrial natural heritage system strategy. Toronto Region Conservation
Authority.
15

SS uu nn VV aa ll ll ee yy aa nn dd SS nn oo ww -- dd uu mm pp SS tt uu dd yy AA rr ee aa November 2009
TRCA, 2007e. Vegetation community and species ranking and scoring method. Toronto Region Conservation Authority.
16


Appendix 1: Fauna List for Sun Valley/Snow Dump Study Area.
Common Name Code Scientific Namenumber of territories LO PTn PTt AS PIS HD StD + TS L-Rank
Survey Species: species for which the TRCA protocol effectively surveys.
Birdswood duck WODU Aix sponsa 1 1 2 1 3 2 2 4 0 15 L3barn swallow BARS Hirundo rustica 2 0 2 3 1 1 2 1 0 10 L4belted kingfisher BEKI Ceryle alcyon 1 0 3 2 2 1 2 2 0 12 L4Cooper's hawk COHA Accipiter cooperii 1 0 2 1 4 1 3 2 0 13 L4eastern kingbird EAKI Tyrannus tyrannus 3 0 4 2 2 1 1 3 0 13 L4eastern wood-pewee EAWP Contopus virens 1 0 4 2 2 1 1 3 0 13 L4great-crested flycatcher GCFL Myiarchus crinitus 1 0 2 2 3 1 2 2 0 12 L4grey catbird GRCA Dumetella carolinensis 8 0 2 2 1 1 1 3 0 10 L4hairy woodpecker HAWO Picoides villosus 2 0 2 2 3 1 2 2 0 12 L4indigo bunting INBU Passerina cyanea 2 0 2 2 1 1 2 4 0 12 L4northern flicker NOFL Colaptes auratus 2 0 3 2 1 1 2 3 0 12 L4red-eyed vireo REVI Vireo olivaceus 1 0 2 2 2 1 1 3 0 11 L4tree swallow TRES Tachycineta bicolor 2 0 2 2 1 1 2 2 0 10 L4willow flycatcher WIFL Empidonax traillii 1 0 4 2 1 1 1 3 0 12 L4American goldfinch AMGO Carduelis tristis x 0 2 2 1 1 0 1 0 7 L5American robin AMRO Turdus migratorius x 0 1 2 1 1 0 1 0 6 L5Baltimore oriole BAOR Icterus galbula x 0 2 2 1 1 0 1 0 7 L5black-capped chickadee BCCH Parus atricapillus x 0 1 2 1 1 0 1 0 6 L5blue jay BLJA Cyanocitta cristata x 0 4 2 1 1 0 1 0 9 L5brown-headed cowbird BHCO Molothrus ater x 0 2 2 1 1 0 1 0 7 L5cedar waxwing CEDW Bombycilla cedrorum x 0 1 2 1 1 0 1 0 6 L5common grackle COGR Quiscalus quiscula x 0 3 2 1 1 0 1 0 8 L5downy woodpecker DOWO Picoides pubescens x 0 3 2 1 1 1 1 0 9 L5eastern phoebe EAPH Sayornis phoebe x 0 2 2 1 1 2 1 0 9 L5house wren HOWR Troglodytes aedon x 0 2 2 1 2 1 1 0 9 L5mallard MALL Anas platyrhynchos x 0 2 2 1 2 0 1 0 8 L5mourning dove MODO Zenaida macroura x 0 2 2 1 1 0 0 0 6 L5northern cardinal NOCA Cardinalis cardinalis x 0 2 2 1 1 1 2 0 9 L5red-tailed hawk RTHA Buteo jamaicensis x 0 2 2 2 1 1 1 0 9 L5red-winged blackbird RWBL Agelaius phoeniceus x 0 2 2 1 1 0 2 0 8 L5song sparrow SOSP Melospiza melodia x 0 2 2 1 2 0 2 0 9 L5warbling vireo WAVI Vireo gilvus x 0 1 2 1 1 1 2 0 8 L5

Appendix 1: Fauna List for Sun Valley/Snow Dump Study Area.
Common Name Code Scientific Namenumber of territories LO PTn PTt AS PIS HD StD + TS L-Rank
yellow warbler YWAR Dendroica petechia x 0 1 2 1 1 1 3 0 9 L5European starling EUST Sturnus vulgaris x L+house finch HOFI Carpodacus mexicanus x L+rock dove ROPI Columba livia x L+
Herpetofaunagreen frog GRFR Rana clamitans 1 0 2 2 1 3 1 4 0 13 L4
Incidental Species: species that are reported on as incidental to the TRCA protocol.
Mammalseastern chipmunk EACH Tamias striatus 1 0 2 2 2 3 1 3 0 13 L4meadow vole MEVO Microtus pennsylvanicus 1 2 2 2 1 2 1 2 0 12 L4grey squirrel GRSQ Sciurus carolinensis x 0 2 2 1 3 0 0 0 8 L5raccoon RACC Procyon lotor x 0 2 2 1 3 1 0 0 9 L5
LEGENDLO = local occurrence PIS = Patch Isolation SensitivityPTn = population trend, continent-wide STD = sensitivity to developmentPTt = population trend, TRCA + = additional pointsHD = habitat dependence TS = total scoreAS = area sensitivity L-rank = TRCA Rank, October, 2008


![RED BULL SNOW CHARGE MAIKO SNOW RESORT ......RED BULL SNOW CHARGE MAIKO SNOW RESORT 2019/5/7 [RESULT] SNOW BOARD OVERALL PLACE BIB NAME GENDER TEAM TIME 31 78 オンダ マサユキ](https://static.fdocument.pub/doc/165x107/5f45535a20fb882c7d702293/red-bull-snow-charge-maiko-snow-resort-red-bull-snow-charge-maiko-snow-resort.jpg)