
Sub Grade pavement
15
3/4/2015 4.2 Materials Subgrade http://classes.engr.oregonstate.edu/cce/spring2014/ce492/Modules/04_design_parameters/042_body.htm 1/15 Major Topics on this Page 2.1 Subgrade Performance 2.2 Stiffness/Strength Tests 2.3 Modulus of Subgrade Reaction 2.4 Summary 2 SUBGRADE Although a pavement's wearing course is most prominent, the success or failure of a pavement is more often than not dependent upon the underlying subgrade (see Figures 4.1 and 4.2) the material upon which the pavement structure is built. Subgrades be composed of a wide range of materials although some are much better than others. This subsection discusses a few of the aspects of subgrade materials that make them either desirable or undesirable and the typical tests used to characterize subgrades. Figure 4.1: Subgrade Preparation Figure 4.2: Subgrade Failure Crack 2.1 Subgrade Performance A subgrade�s performance generally depends on three of its basic characteristics (all of which are interrelated): 1. Load bearing capacity. The subgrade must be able to support loads transmitted from the pavement structure. This load bearing capacity is often affected by degree of compaction, moisture content, and soil type. A subgrade that can support a high amount of loading without excessive deformation is considered good. 2. Moisture content. Moisture tends to affect a number of subgrade properties including load bearing capacity, shrinkage and swelling. Moisture content can be influenced by a number of things such as drainage, groundwater table elevation, infiltration, or pavement porosity (which can be assisted by cracks in the pavement). Generally, excessively wet subgrades will deform excessively under load. 3. Shrinkage and/or swelling . Some soils shrink or swell depending upon their moisture content. Additionally, soils with excessive fines content may be susceptible to frost heave in northern climates. Shrinkage, swelling and frost heave will tend to deform and crack any
-
Upload
junatienza23 -
Category
Documents
-
view
29 -
download
0
description
soil subgrade
Transcript of Sub Grade pavement
3/4/2015 4.2 Materials Subgrade
http://classes.engr.oregonstate.edu/cce/spring2014/ce492/Modules/04_design_parameters/042_body.htm 1/15
Major Topics on this Page
2.1 Subgrade Performance
2.2 Stiffness/Strength Tests
2.3 Modulus of Subgrade Reaction
2.4 Summary
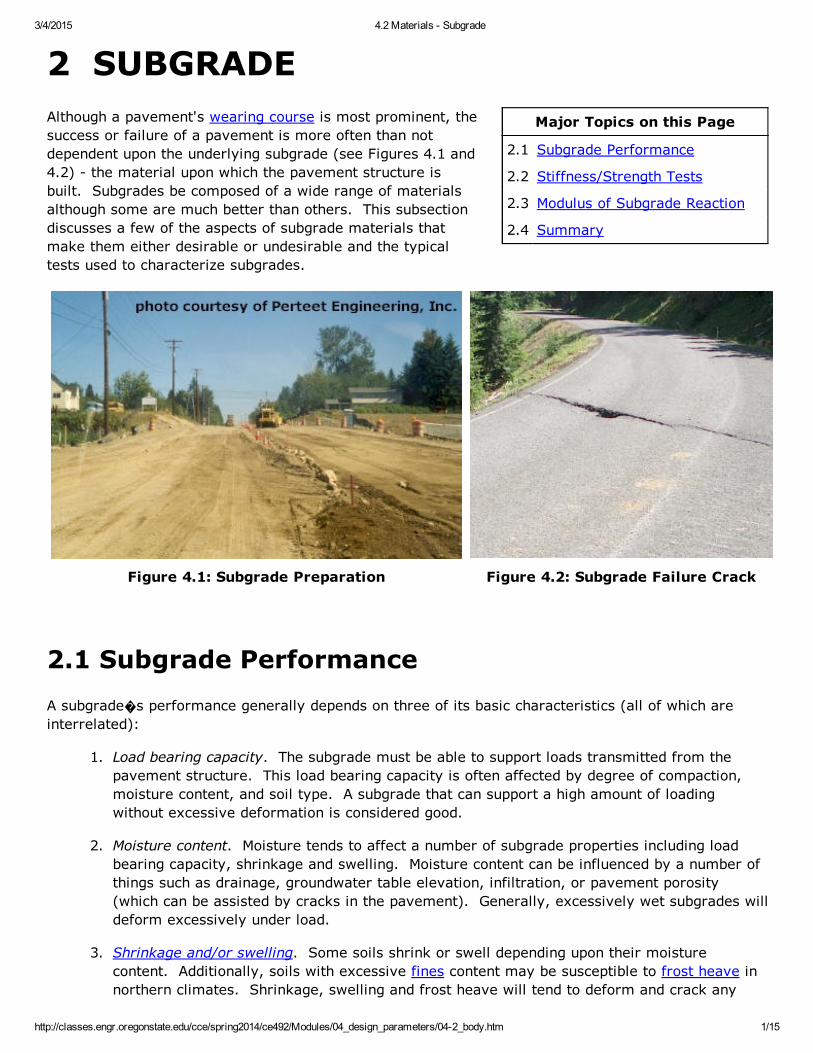
2 SUBGRADEAlthough a pavement's wearing course is most prominent, thesuccess or failure of a pavement is more often than notdependent upon the underlying subgrade (see Figures 4.1 and4.2) the material upon which the pavement structure isbuilt. Subgrades be composed of a wide range of materialsalthough some are much better than others. This subsectiondiscusses a few of the aspects of subgrade materials thatmake them either desirable or undesirable and the typicaltests used to characterize subgrades.
Figure 4.1: Subgrade Preparation Figure 4.2: Subgrade Failure Crack
2.1 Subgrade PerformanceA subgrades performance generally depends on three of its basic characteristics (all of which areinterrelated):
1. Load bearing capacity. The subgrade must be able to support loads transmitted from thepavement structure. This load bearing capacity is often affected by degree of compaction,moisture content, and soil type. A subgrade that can support a high amount of loadingwithout excessive deformation is considered good.
2. Moisture content. Moisture tends to affect a number of subgrade properties including loadbearing capacity, shrinkage and swelling. Moisture content can be influenced by a number ofthings such as drainage, groundwater table elevation, infiltration, or pavement porosity(which can be assisted by cracks in the pavement). Generally, excessively wet subgrades willdeform excessively under load.
3. Shrinkage and/or swelling. Some soils shrink or swell depending upon their moisturecontent. Additionally, soils with excessive fines content may be susceptible to frost heave innorthern climates. Shrinkage, swelling and frost heave will tend to deform and crack any
3/4/2015 4.2 Materials Subgrade
http://classes.engr.oregonstate.edu/cce/spring2014/ce492/Modules/04_design_parameters/042_body.htm 2/15
pavement type constructed over them.
Poor subgrade should be avoided if possible, but when it is necessary to build over weak soils there areseveral methods available to improve subgrade performance:
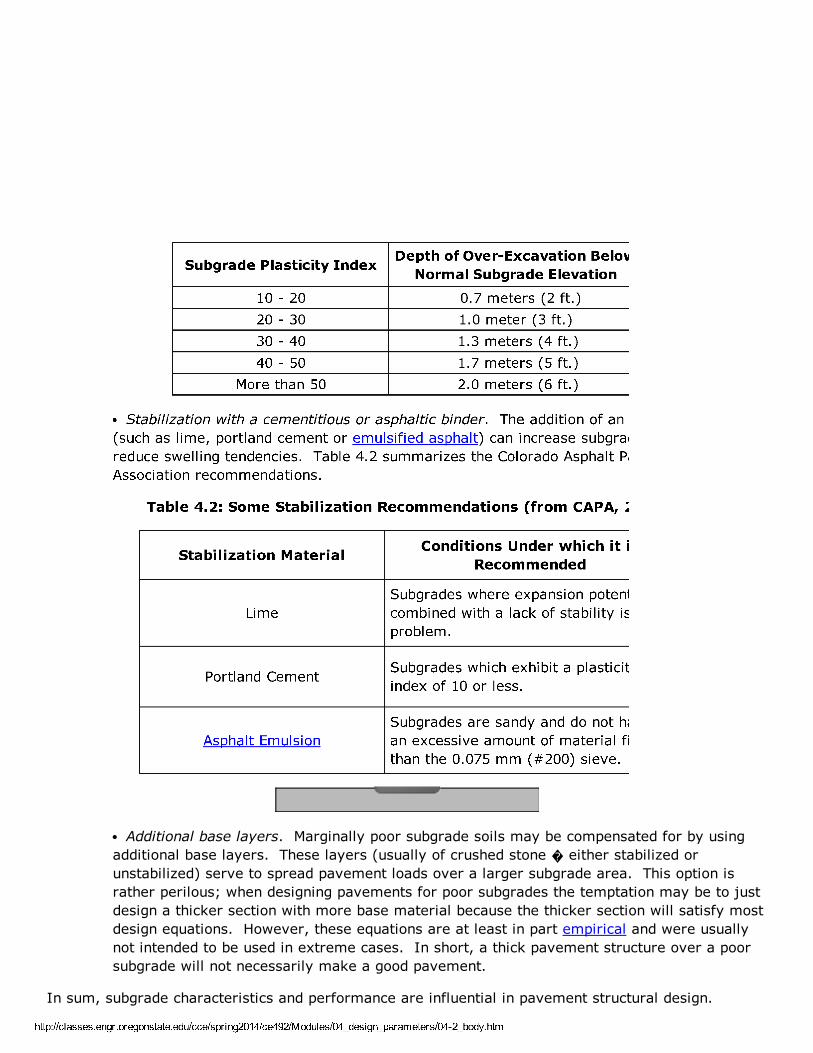
Removal and replacement (overexcavation). Poor subgrade soil can simply be removed andreplaced with high quality fill. Although this is simple in concept, it can be expensive. Table4.1 shows typical overexcavation depths recommended by the Colorado Asphalt PavementAssociation (CAPA).
Table 4.1: OverExcavation Recommendations (from CAPA, 2000)
Subgrade Plasticity IndexDepth of OverExcavation BelowNormal Subgrade Elevation
10 20 0.7 meters (2 ft.)20 30 1.0 meter (3 ft.)30 40 1.3 meters (4 ft.)40 50 1.7 meters (5 ft.)
More than 50 2.0 meters (6 ft.)
Stabilization with a cementitious or asphaltic binder. The addition of an appropriate binder(such as lime, portland cement or emulsified asphalt) can increase subgrade stiffness and/orreduce swelling tendencies. Table 4.2 summarizes the Colorado Asphalt PavementAssociation recommendations.
Table 4.2: Some Stabilization Recommendations (from CAPA, 2000)
Stabilization Material Conditions Under which it isRecommended
LimeSubgrades where expansion potentialcombined with a lack of stability is aproblem.
Portland Cement Subgrades which exhibit a plasticityindex of 10 or less.
Asphalt EmulsionSubgrades are sandy and do not havean excessive amount of material finerthan the 0.075 mm (#200) sieve.
Additional base layers. Marginally poor subgrade soils may be compensated for by usingadditional base layers. These layers (usually of crushed stone either stabilized orunstabilized) serve to spread pavement loads over a larger subgrade area. This option israther perilous; when designing pavements for poor subgrades the temptation may be to justdesign a thicker section with more base material because the thicker section will satisfy mostdesign equations. However, these equations are at least in part empirical and were usuallynot intended to be used in extreme cases. In short, a thick pavement structure over a poorsubgrade will not necessarily make a good pavement.
In sum, subgrade characteristics and performance are influential in pavement structural design.
3/4/2015 4.2 Materials Subgrade
http://classes.engr.oregonstate.edu/cce/spring2014/ce492/Modules/04_design_parameters/042_body.htm 3/15
Characteristics such as load bearing capacity, moisture content and expansiveness will influence notonly structural design but also longterm performance and cost.
2.2 Stiffness/Strength TestsSubgrade materials are typically characterized by their resistance to deformation under load, which canbe either a measure of their strength (the stress needed to break or rupture a material) or stiffness(the relationship between stress and strain in the elastic range or how well a material is able to returnto its original shape and size after being stressed). In general, the more resistant to deformation asubgrade is, the more load it can support before reaching a critical deformation value. Three basicsubgrade stiffness/strength characterizations are commonly used in the U.S.: California Bearing Ratio(CBR), Resistance Value (Rvalue) and elastic (resilient) modulus. Although there are other factorsinvolved when evaluating subgrade materials (such as swell in the case of certain clays), stiffness isthe most common characterization and thus CBR, Rvalue and resilient modulus are discussed here.
WSDOT Strength/Stiffness Tests
WSDOT uses a modified version of AASHTO T 292 (Resilient Modulus of SubgradeSoils and Untreated Base/Subbase Materials) to characterize subgrade soil anduntreated base/subbase material stiffness. Therefore, WSDOT uses the resilientmodulus rather than CBR or Rvalue for design purposes. WSDOT uses Rvalueto characterize aggregate pit sources for material approval.
2.2.1 California Bearing Ratio (CBR)
The California Bearing Ratio (CBR) test is a simple strength test that compares the bearing capacity ofa material with that of a wellgraded crushed stone (thus, a high quality crushed stone material shouldhave a CBR 100%). It is primarily intended for, but not limited to, evaluating the strength ofcohesive materials having maximum particle sizes less than 19 mm (0.75 in.) (AASHTO, 2000). It wasdeveloped by the California Division of Highways around 1930 and was subsequently adopted bynumerous states, counties, U.S. federal agencies and internationally. As a result, most agency andcommercial geotechnical laboratories in the U.S. are equipped to perform CBR tests.
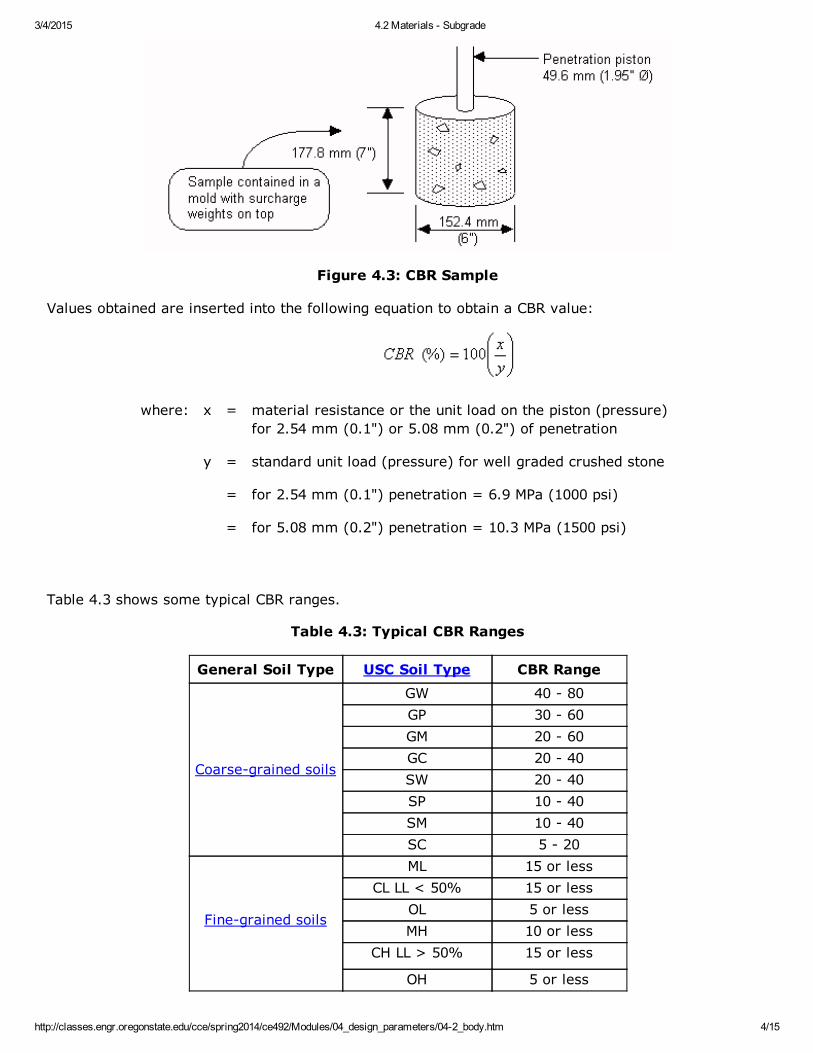
The basic CBR test involves applying load to a small penetration piston at a rate of 1.3 mm (0.05") perminute and recording the total load at penetrations ranging from 0.64 mm (0.025 in.) up to 7.62 mm(0.300 in.). Figure 4.3 is a sketch of a typical CBR sample.
0
3/4/2015 4.2 Materials Subgrade
http://classes.engr.oregonstate.edu/cce/spring2014/ce492/Modules/04_design_parameters/042_body.htm 4/15
Figure 4.3: CBR Sample
Values obtained are inserted into the following equation to obtain a CBR value:
where: x = material resistance or the unit load on the piston (pressure)for 2.54 mm (0.1") or 5.08 mm (0.2") of penetration
y = standard unit load (pressure) for well graded crushed stone
= for 2.54 mm (0.1") penetration = 6.9 MPa (1000 psi)
= for 5.08 mm (0.2") penetration = 10.3 MPa (1500 psi)
Table 4.3 shows some typical CBR ranges.
Table 4.3: Typical CBR Ranges
General Soil Type USC Soil Type CBR Range
Coarsegrained soils
GW 40 80GP 30 60GM 20 60GC 20 40SW 20 40SP 10 40SM 10 40SC 5 20
Finegrained soils
ML 15 or lessCL LL < 50% 15 or less
OL 5 or lessMH 10 or less
CH LL > 50% 15 or less
OH 5 or less
http://classes.engr.oregonstate.edu/cce/spring2014/ce492/Modules/04_design_parameters/astm_terms.htm
3/4/2015 4.2 Materials Subgrade
http://classes.engr.oregonstate.edu/cce/spring2014/ce492/Modules/04_design_parameters/042_body.htm 5/15
Standard CBR test methods are:
AASHTO T 193: The California Bearing Ratio
ASTM D 1883: Bearing Ratio of Laboratory Compacted Soils
2.2.2 Resistance Value (Rvalue)
The Resistance Value (Rvalue) test is a material stiffness test. The test procedure expresses amaterial's resistance to deformation as a function of the ratio of transmitted lateral pressure to appliedvertical pressure. It is essentially a modified triaxial compression test. Materials tested are assignedan Rvalue.
The Rvalue test was developed by F.N. Hveem and R.M. Carmany of the California Division ofHighways and first reported in the late 1940's. During this time rutting (or shoving) in the wheel trackswas a primary concern and the Rvalue test was developed as an improvement on the CBR test. Presently, the Rvalue is used mostly by State Highway Agencies (SHAs) on the west coast of the U.S.
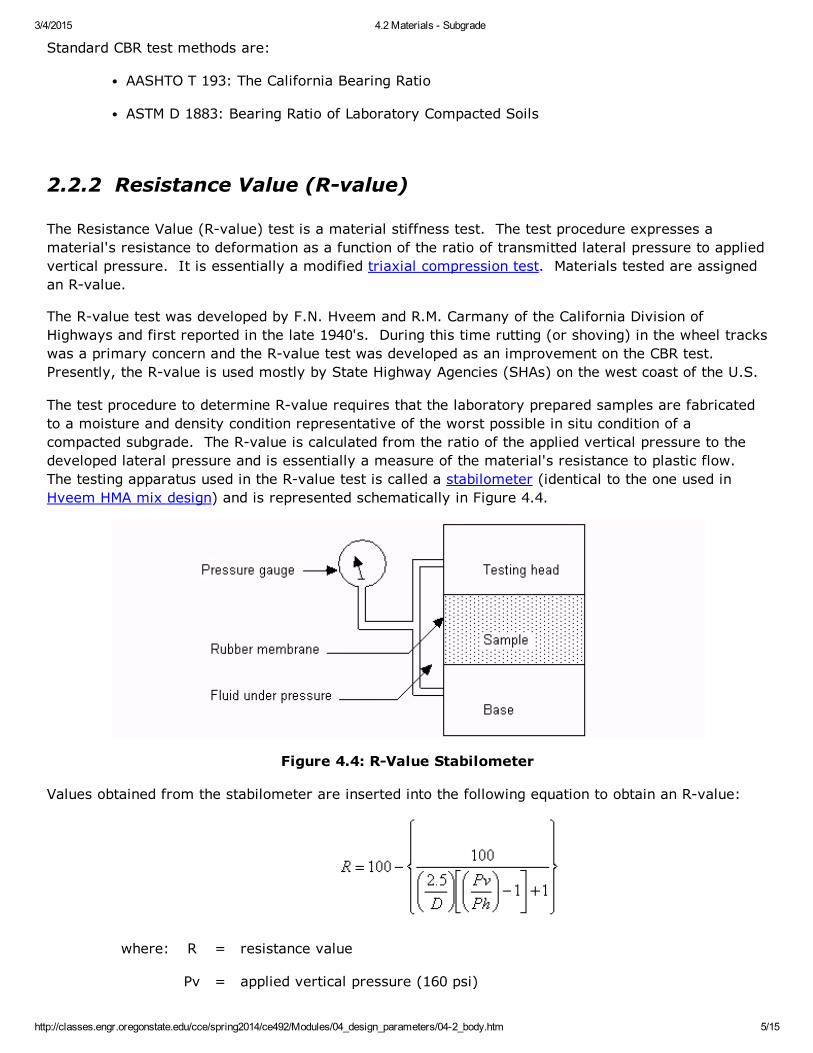
The test procedure to determine Rvalue requires that the laboratory prepared samples are fabricatedto a moisture and density condition representative of the worst possible in situ condition of acompacted subgrade. The Rvalue is calculated from the ratio of the applied vertical pressure to thedeveloped lateral pressure and is essentially a measure of the material's resistance to plastic flow. The testing apparatus used in the Rvalue test is called a stabilometer (identical to the one used inHveem HMA mix design) and is represented schematically in Figure 4.4.
Figure 4.4: RValue Stabilometer
Values obtained from the stabilometer are inserted into the following equation to obtain an Rvalue:
where: R = resistance value
Pv = applied vertical pressure (160 psi)
3/4/2015 4.2 Materials Subgrade
http://classes.engr.oregonstate.edu/cce/spring2014/ce492/Modules/04_design_parameters/042_body.htm 6/15
Ph = transmitted horizontal pressure at Pv = 160 psi
D = displacement of stabilometer fluid necessary to increasehorizontal pressure from 5 to 100 psi.
Some typical Rvalues are:
Wellgraded (dense gradation) crushed stone base course: 80+
MH silts: 1530
Standard RValue test methods are:
AASHTO T 190 and ASTM D 2844: Resistance RValue and Expansion Pressure of CompactedSoils
WSDOT RValue Test
WSDOT uses Rvalue to characterize aggregate pit sources for material approval. WSDOT Test Method 611 is very similar to AASHTO T 190. However, WSDOT uses a300 psi exudation pressure while AASHTO T 190 uses a 400 psi exudation pressure. WSDOT and AASHTO T 190 Rvalues may differ due to this exudation pressuredifference.
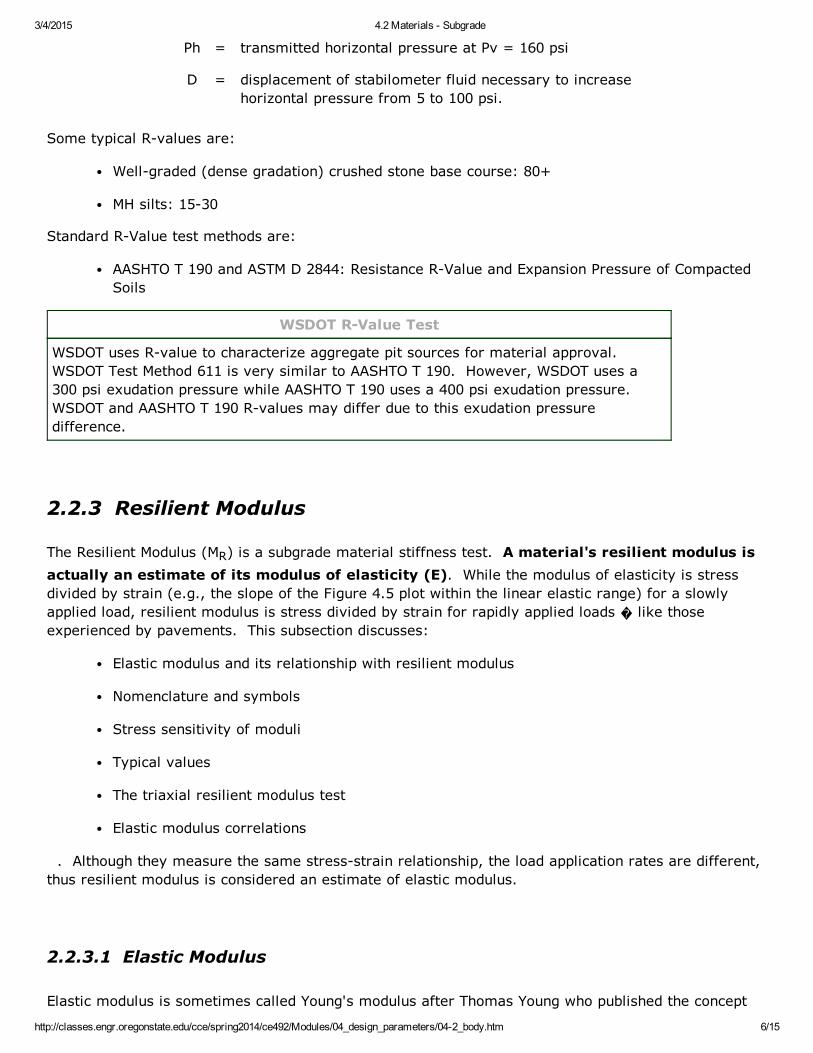
2.2.3 Resilient Modulus
The Resilient Modulus (MR) is a subgrade material stiffness test. A material's resilient modulus isactually an estimate of its modulus of elasticity (E). While the modulus of elasticity is stressdivided by strain (e.g., the slope of the Figure 4.5 plot within the linear elastic range) for a slowlyapplied load, resilient modulus is stress divided by strain for rapidly applied loads like thoseexperienced by pavements. This subsection discusses:
Elastic modulus and its relationship with resilient modulus
Nomenclature and symbols
Stress sensitivity of moduli
Typical values
The triaxial resilient modulus test
Elastic modulus correlations
. Although they measure the same stressstrain relationship, the load application rates are different,thus resilient modulus is considered an estimate of elastic modulus.
2.2.3.1 Elastic Modulus
Elastic modulus is sometimes called Young's modulus after Thomas Young who published the concept
3/4/2015 4.2 Materials Subgrade
http://classes.engr.oregonstate.edu/cce/spring2014/ce492/Modules/04_design_parameters/042_body.htm 7/15
back in 1807. An elastic modulus (E) can be determined for any solid material and represents aconstant ratio of stress and strain (a stiffness):
A material is elastic if it is able to return to its original shape or size immediately after being stretchedor squeezed. Almost all materials are elastic to some degree as long as the applied load does notcause it to deform permanently. Thus, the "flexibility" of any object or structure depends on its elasticmodulus and geometric shape.
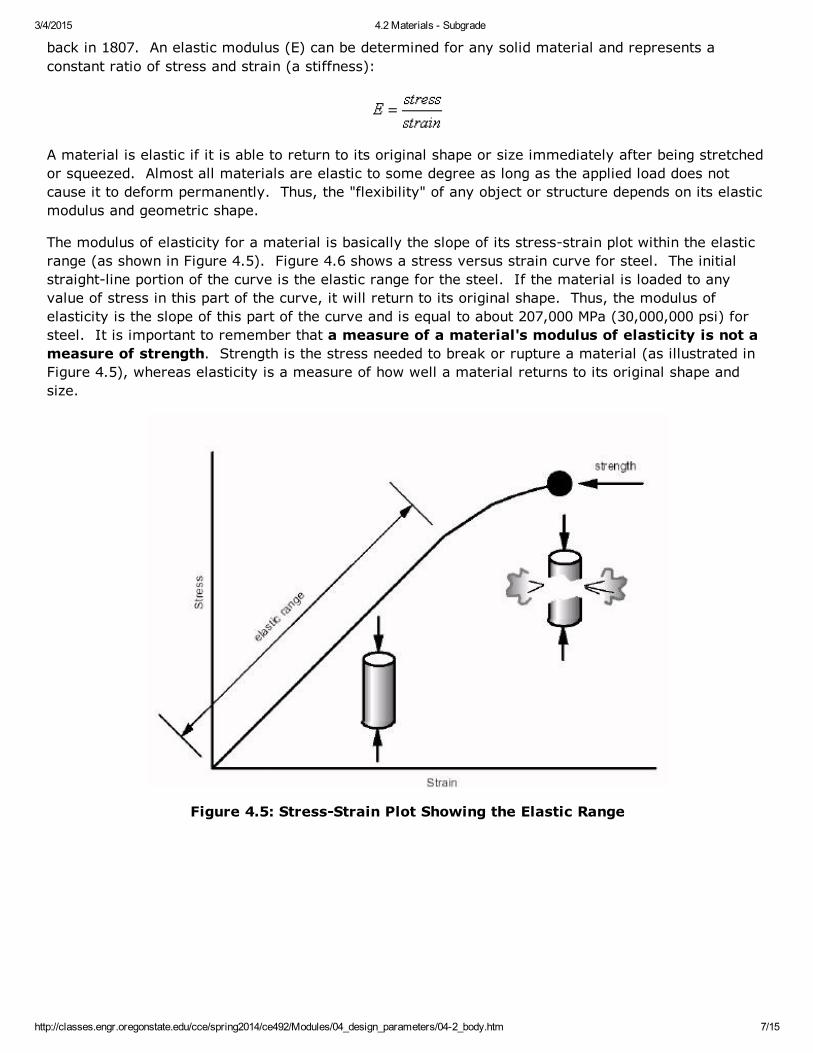
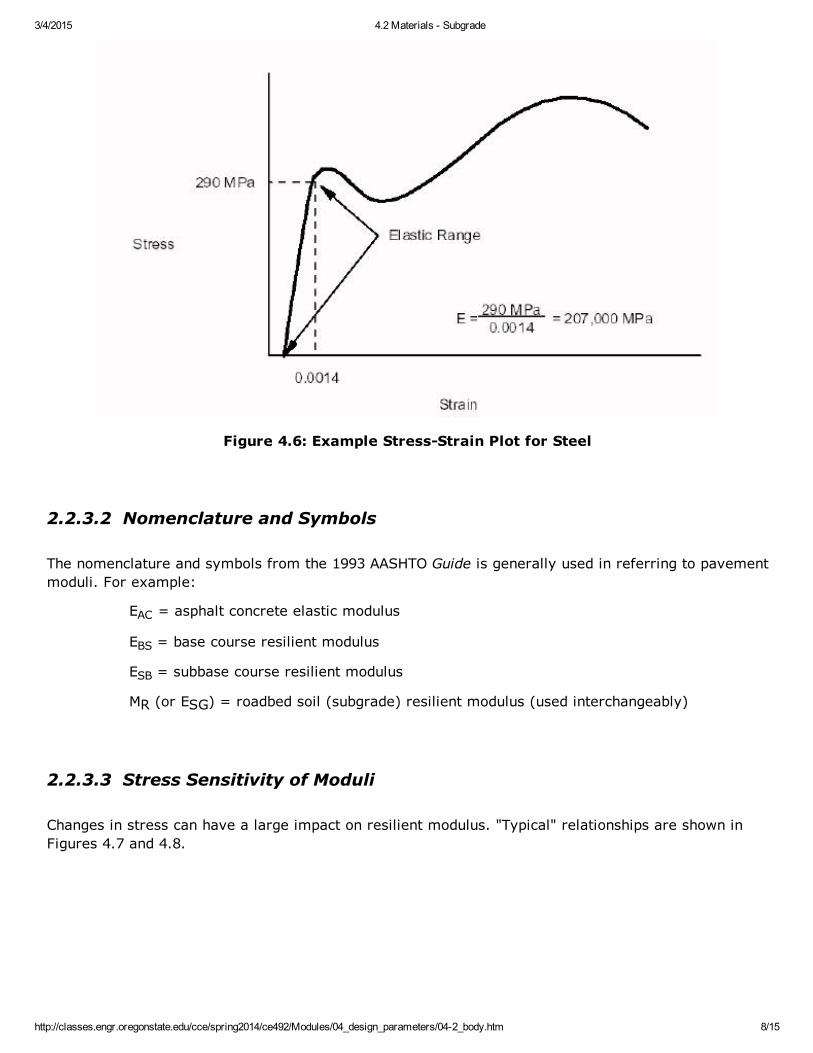
The modulus of elasticity for a material is basically the slope of its stressstrain plot within the elasticrange (as shown in Figure 4.5). Figure 4.6 shows a stress versus strain curve for steel. The initialstraightline portion of the curve is the elastic range for the steel. If the material is loaded to anyvalue of stress in this part of the curve, it will return to its original shape. Thus, the modulus ofelasticity is the slope of this part of the curve and is equal to about 207,000 MPa (30,000,000 psi) forsteel. It is important to remember that a measure of a material's modulus of elasticity is not ameasure of strength. Strength is the stress needed to break or rupture a material (as illustrated inFigure 4.5), whereas elasticity is a measure of how well a material returns to its original shape andsize.
Figure 4.5: StressStrain Plot Showing the Elastic Range
3/4/2015 4.2 Materials Subgrade
http://classes.engr.oregonstate.edu/cce/spring2014/ce492/Modules/04_design_parameters/042_body.htm 8/15
Figure 4.6: Example StressStrain Plot for Steel
2.2.3.2 Nomenclature and Symbols
The nomenclature and symbols from the 1993 AASHTO Guide is generally used in referring to pavementmoduli. For example:
EAC = asphalt concrete elastic modulus
EBS = base course resilient modulus
ESB = subbase course resilient modulus
MR (or ESG) = roadbed soil (subgrade) resilient modulus (used interchangeably)
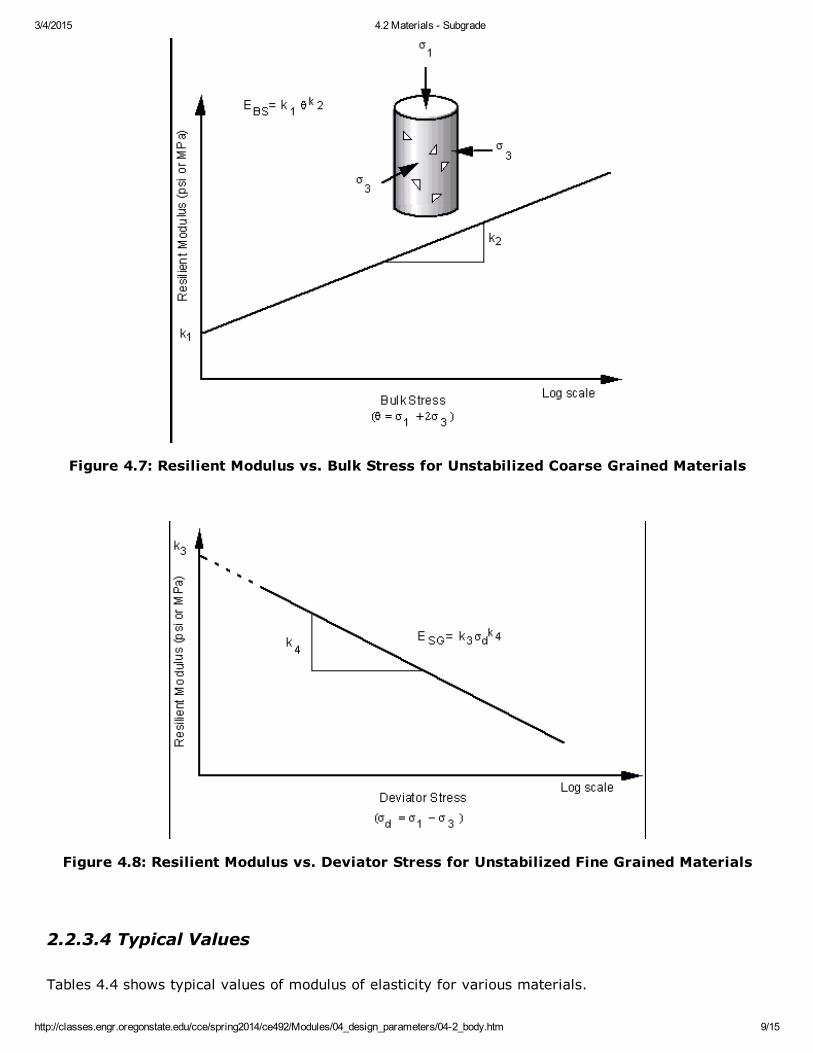
2.2.3.3 Stress Sensitivity of Moduli
Changes in stress can have a large impact on resilient modulus. "Typical" relationships are shown inFigures 4.7 and 4.8.
3/4/2015 4.2 Materials Subgrade
http://classes.engr.oregonstate.edu/cce/spring2014/ce492/Modules/04_design_parameters/042_body.htm 9/15
Figure 4.7: Resilient Modulus vs. Bulk Stress for Unstabilized Coarse Grained Materials
Figure 4.8: Resilient Modulus vs. Deviator Stress for Unstabilized Fine Grained Materials
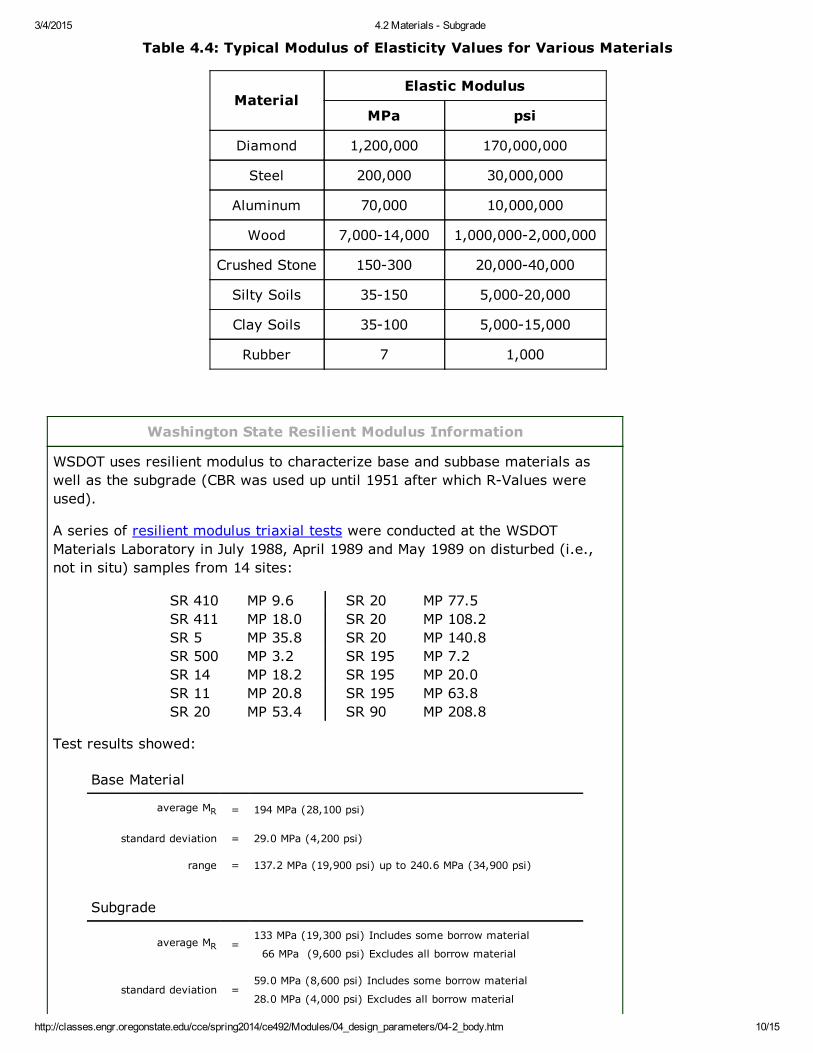
2.2.3.4 Typical Values
Tables 4.4 shows typical values of modulus of elasticity for various materials.
3/4/2015 4.2 Materials Subgrade
http://classes.engr.oregonstate.edu/cce/spring2014/ce492/Modules/04_design_parameters/042_body.htm 10/15
Table 4.4: Typical Modulus of Elasticity Values for Various Materials
MaterialElastic Modulus
MPa psi
Diamond 1,200,000 170,000,000
Steel 200,000 30,000,000
Aluminum 70,000 10,000,000
Wood 7,00014,000 1,000,0002,000,000
Crushed Stone 150300 20,00040,000
Silty Soils 35150 5,00020,000
Clay Soils 35100 5,00015,000
Rubber 7 1,000
Washington State Resilient Modulus Information
WSDOT uses resilient modulus to characterize base and subbase materials aswell as the subgrade (CBR was used up until 1951 after which RValues wereused).
A series of resilient modulus triaxial tests were conducted at the WSDOTMaterials Laboratory in July 1988, April 1989 and May 1989 on disturbed (i.e.,not in situ) samples from 14 sites:
SR 410 MP 9.6 SR 20 MP 77.5SR 411 MP 18.0 SR 20 MP 108.2SR 5 MP 35.8 SR 20 MP 140.8SR 500 MP 3.2 SR 195 MP 7.2SR 14 MP 18.2 SR 195 MP 20.0SR 11 MP 20.8 SR 195 MP 63.8SR 20 MP 53.4 SR 90 MP 208.8
Test results showed:
Base Material
average MR = 194 MPa (28,100 psi)
standard deviation = 29.0 MPa (4,200 psi)
range = 137.2 MPa (19,900 psi) up to 240.6 MPa (34,900 psi)
Subgrade
average MR =133 MPa (19,300 psi) Includes some borrow material
66 MPa (9,600 psi) Excludes all borrow material
standard deviation =59.0 MPa (8,600 psi) Includes some borrow material
28.0 MPa (4,000 psi) Excludes all borrow material
3/4/2015 4.2 Materials Subgrade
http://classes.engr.oregonstate.edu/cce/spring2014/ce492/Modules/04_design_parameters/042_body.htm 11/15
range = 47.6 MPa (6,900 psi) up to 260.6 MPa (37,800 psi)
Keep in mind that this was not a comprehensive study of all Washington Stategranular materials but it does give an idea of the range and typical values ofbase and subgrade stiffness in Washington State.
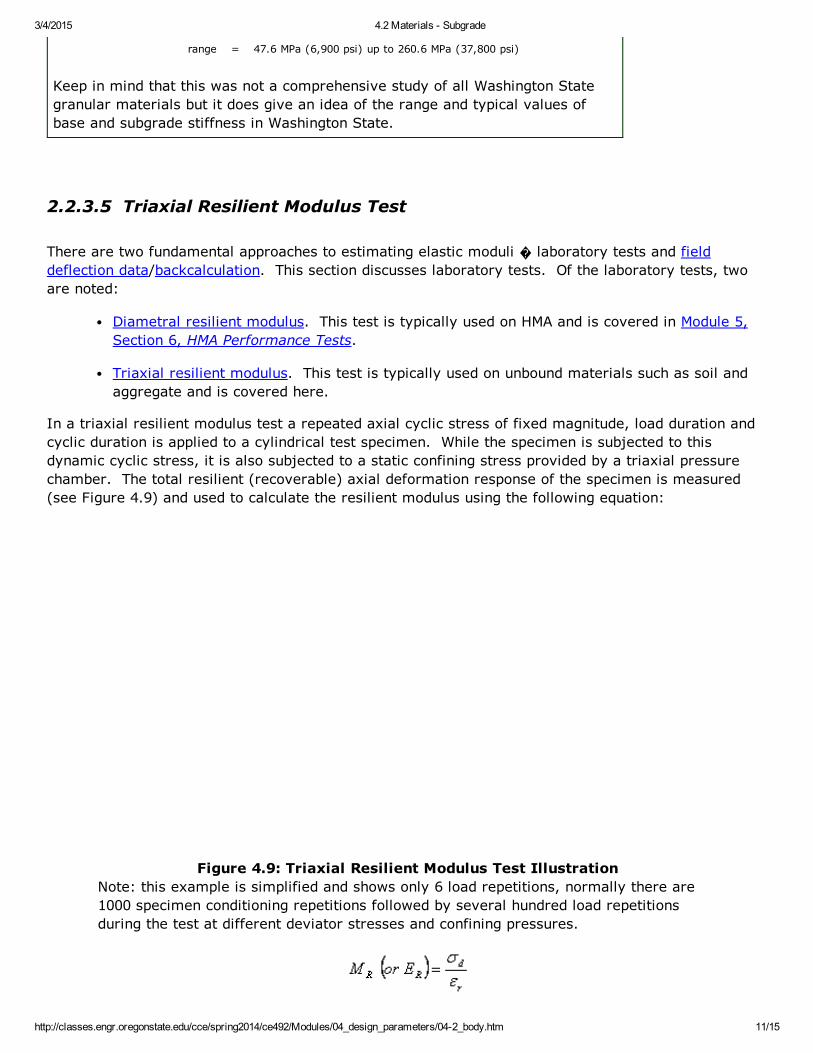
2.2.3.5 Triaxial Resilient Modulus Test
There are two fundamental approaches to estimating elastic moduli laboratory tests and fielddeflection data/backcalculation. This section discusses laboratory tests. Of the laboratory tests, twoare noted:
Diametral resilient modulus. This test is typically used on HMA and is covered in Module 5,Section 6, HMA Performance Tests.
Triaxial resilient modulus. This test is typically used on unbound materials such as soil andaggregate and is covered here.
In a triaxial resilient modulus test a repeated axial cyclic stress of fixed magnitude, load duration andcyclic duration is applied to a cylindrical test specimen. While the specimen is subjected to thisdynamic cyclic stress, it is also subjected to a static confining stress provided by a triaxial pressurechamber. The total resilient (recoverable) axial deformation response of the specimen is measured(see Figure 4.9) and used to calculate the resilient modulus using the following equation:
Figure 4.9: Triaxial Resilient Modulus Test IllustrationNote: this example is simplified and shows only 6 load repetitions, normally there are1000 specimen conditioning repetitions followed by several hundred load repetitionsduring the test at different deviator stresses and confining pressures.
3/4/2015 4.2 Materials Subgrade
http://classes.engr.oregonstate.edu/cce/spring2014/ce492/Modules/04_design_parameters/042_body.htm 12/15
where: MR (orER)
= resilient modulus (or elastic modulus since resilient modulus isjust an estimate of elastic modulus)
σd = stress (applied load / sample cross sectional area)
εr = recoverable axial strain = L/L
L = gauge length over which the sample deformation is measured
L = change in sample length due to applied load
The standard triaxial resilient modulus test is:
AASHTO T 292: Resilient Modulus of Subgrade Soils and Untreated Base/Subbase Materials
2.2.4 Strength/Stiffness Correlations
A widely used empirical relationship developed by Heukelom and Klomp (1962) and used in the 1993AASHTO Guide is:
ESG (or MR) = (1500) (CBR)
This equation is restricted to fine grained materials with soaked CBR values of 10 or less. Like all suchcorrelations, it should be used with caution.
The proposed new AASHTO Design Guide will likely use the following relationship:
MR = 2555 x CBR0.64
The 1993 AASHTO Guide offers the following correlation equation between Rvalue and elastic modulusfor finegrained soils with Rvalues less than or equal to 20.
ESG (or MR) = 1,000 + (555)(Rvalue)
Washington State Resilient Modulus vs. RValue Correlation
A WSDOT developed relationship between the Rvalue and resilient modulus isshown below. This graph was developed using WSDOT samples which rangedfrom silty materials (A7) to coarse aggregate (A1). The samples were testedaccording to Washington Test Method 611 (Determination of the Resistance (RValue) of Untreated Bases, Subbases, and Basement Soils by the Stabilometer)and AASHTO T 274. Note that WSDOT Test Method 611 design RValues aredetermined at an exudation pressure of 400 psi. AASHTO T 190 allows the useof a 300 psi exudation pressure. Thus, RValues may differ due to the exudationpressure.
3/4/2015 4.2 Materials Subgrade
http://classes.engr.oregonstate.edu/cce/spring2014/ce492/Modules/04_design_parameters/042_body.htm 13/15
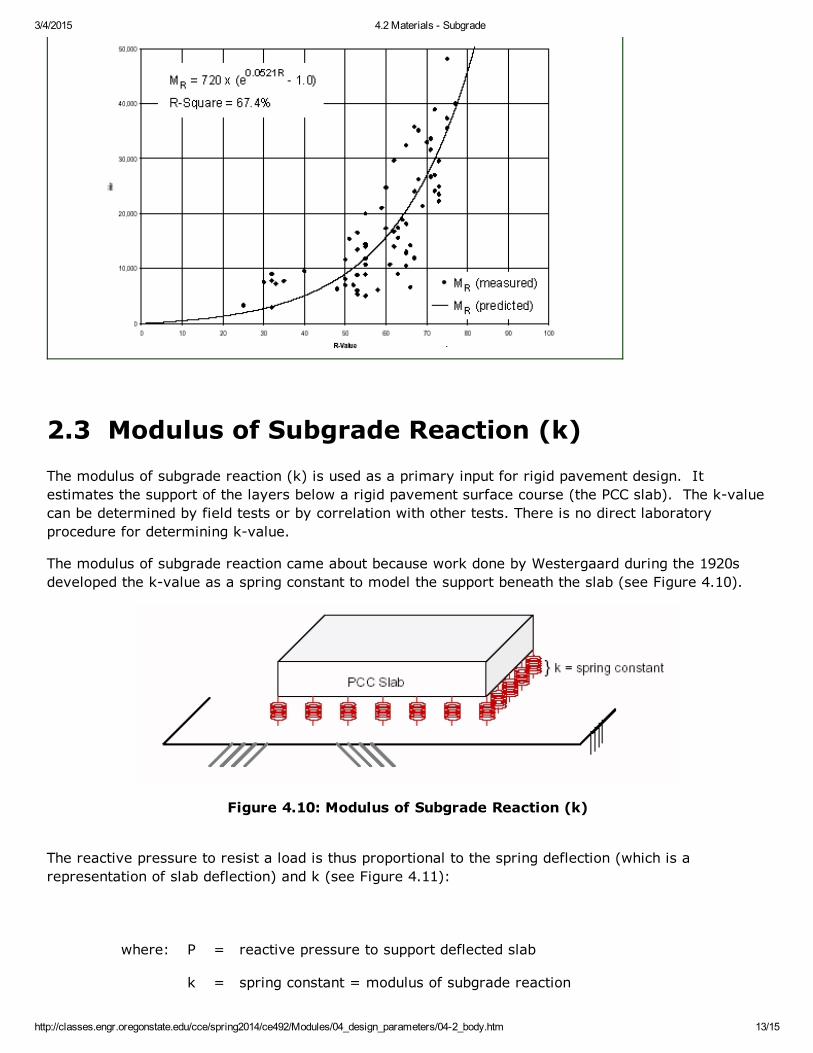
2.3 Modulus of Subgrade Reaction (k)The modulus of subgrade reaction (k) is used as a primary input for rigid pavement design. Itestimates the support of the layers below a rigid pavement surface course (the PCC slab). The kvaluecan be determined by field tests or by correlation with other tests. There is no direct laboratoryprocedure for determining kvalue.
The modulus of subgrade reaction came about because work done by Westergaard during the 1920sdeveloped the kvalue as a spring constant to model the support beneath the slab (see Figure 4.10).
Figure 4.10: Modulus of Subgrade Reaction (k)
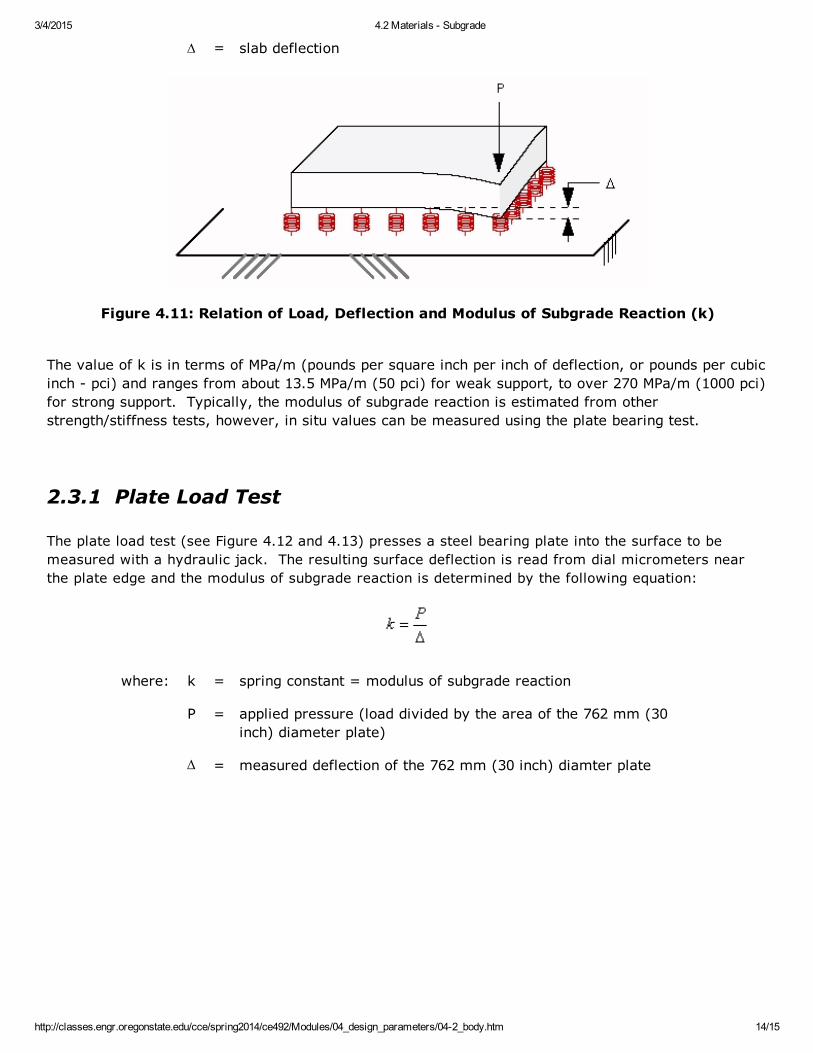
The reactive pressure to resist a load is thus proportional to the spring deflection (which is arepresentation of slab deflection) and k (see Figure 4.11):
where: P = reactive pressure to support deflected slab
k = spring constant = modulus of subgrade reaction
3/4/2015 4.2 Materials Subgrade
http://classes.engr.oregonstate.edu/cce/spring2014/ce492/Modules/04_design_parameters/042_body.htm 14/15
= slab deflection
Figure 4.11: Relation of Load, Deflection and Modulus of Subgrade Reaction (k)
The value of k is in terms of MPa/m (pounds per square inch per inch of deflection, or pounds per cubicinch pci) and ranges from about 13.5 MPa/m (50 pci) for weak support, to over 270 MPa/m (1000 pci)for strong support. Typically, the modulus of subgrade reaction is estimated from otherstrength/stiffness tests, however, in situ values can be measured using the plate bearing test.
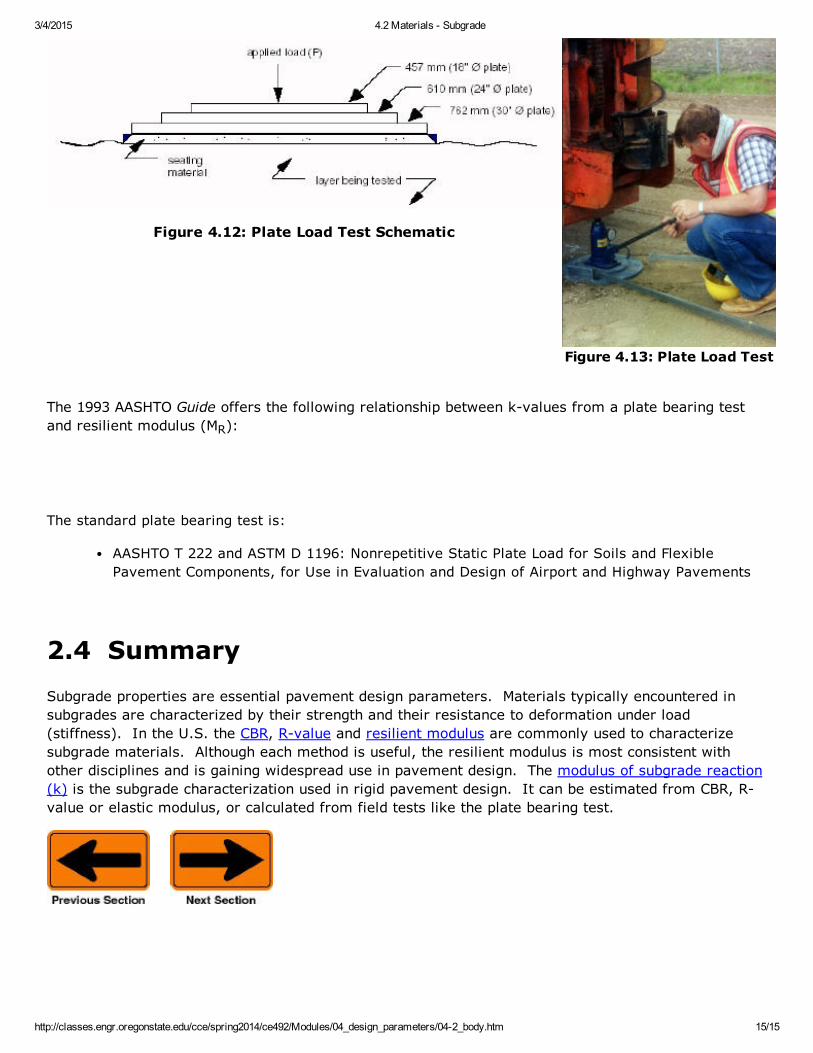
2.3.1 Plate Load Test
The plate load test (see Figure 4.12 and 4.13) presses a steel bearing plate into the surface to bemeasured with a hydraulic jack. The resulting surface deflection is read from dial micrometers nearthe plate edge and the modulus of subgrade reaction is determined by the following equation:
where: k = spring constant = modulus of subgrade reaction
P = applied pressure (load divided by the area of the 762 mm (30inch) diameter plate)
Δ = measured deflection of the 762 mm (30 inch) diamter plate
3/4/2015 4.2 Materials Subgrade
http://classes.engr.oregonstate.edu/cce/spring2014/ce492/Modules/04_design_parameters/042_body.htm 15/15
Figure 4.12: Plate Load Test Schematic
Figure 4.13: Plate Load Test
The 1993 AASHTO Guide offers the following relationship between kvalues from a plate bearing testand resilient modulus (MR):
The standard plate bearing test is:
AASHTO T 222 and ASTM D 1196: Nonrepetitive Static Plate Load for Soils and FlexiblePavement Components, for Use in Evaluation and Design of Airport and Highway Pavements
2.4 SummarySubgrade properties are essential pavement design parameters. Materials typically encountered insubgrades are characterized by their strength and their resistance to deformation under load(stiffness). In the U.S. the CBR, Rvalue and resilient modulus are commonly used to characterizesubgrade materials. Although each method is useful, the resilient modulus is most consistent withother disciplines and is gaining widespread use in pavement design. The modulus of subgrade reaction(k) is the subgrade characterization used in rigid pavement design. It can be estimated from CBR, Rvalue or elastic modulus, or calculated from field tests like the plate bearing test.


![Robinson Kim Stanley - [CAPITAL CODE] 02 - 50 de Grade Sub Zero](https://static.fdocument.pub/doc/165x107/55cf9b9c550346d033a6b944/robinson-kim-stanley-capital-code-02-50-de-grade-sub-zero.jpg)