STUDY ON CUSTOMER SATISFACTION TOWARDS SPLENDOR …
15
www.ijcrt.org © 2021 IJCRT | Volume 9, Issue 4 April 2021 | ISSN: 2320-2882 IJCRT2104421 International Journal of Creative Research Thoughts (IJCRT) www.ijcrt.org 3381 STUDY ON CUSTOMER SATISFACTION TOWARDS SPLENDOR BIKES IN VADODARA CITY 1 Rakeshkumar Parmar, 2 Akash Narang, 3 Jayesh Chawla, 4 Rahul Sharma, 1 M.B.A. student, 2 M.B.A. student, 3 M.B.A. student, 4 M.B.A. student 1 Parul Institute of management and research, Parul university Waghodia, Vadodara, India Abstract: This study has been undertaken to investigate the satisfaction of the customers in Vadodara city towards Splendor bikes using survey through questionnaire. The study is based on primary data by using self made questionnaire on google form. This study includes Splendor bikes like Hero Honda Splendor Plus, Super Splendor, Her India is a country where most of the people comes from middle class family and they use bikes for travelling because it is affordable for them and they use it on daily basis. They use bike to go on job and they try to have two Wheeler with good mileage and comfortable with low cost of maintenance so that I see around me most of office going people, college going students and workers have Splendor bike so we undertake this project work because it is helpful to know they satisfaction level. This study includes 200 responses from Vadodara city. Key words: Customer Expectation, Customer Relations, Customer Satisfaction, Splendor bike model, Style. I. INTRODUCTION In this paper we will examine the customer satisfaction towards Splendor Bikes Vadodara city regarding various factors like demographic factors and socioeconomic factors. The two-wheeler industry has been going progressively over the years all over the world. India is not exclusion for that. Today India is the second largest manufacture of two wheelers in the world. It stands next only to Japan and China in terms of number of two wheelers produced and sold. Today the customer preferences have shift from geared scooters and motorcycles and also to an extent customer used to buy a two-wheeler based on its consistency and price comfort and utility were the two wheelers. Now with the opening up of the economy and accessibility of new design and technology the consumer is increasingly according greater priority to power and style. Bikes are large multiplicity of two wheelers are available in the market, known for the latest technology and superior mileage. Indian bikes, mopeds represent style and class for both men and women in India. Ride bikes in all areas lead the bike riders to experience discomfort under some conditions because of lack of pick up capability in their bike. Hero Motocorp Ltd., formerly Hero Honda, is an Indian motorcycle and scooter manufacturer based in New Delhi, India. The company is the largest two-wheeler manufacturer in the world, and also in India, where it has a market share of about 46% in the two-wheeler category Hero MotocorpLtd.,formerly Hero is an Indian motorcycle and scooter manufacturer based in New Delhi, India. The company is the largest two-wheeler manufacturer in the world, and also in India, where it has a market share of about 46% in the two-wheeler category. The 2006 Forbes list of the 200 World's Most Respected Companies has Hero Honda Motors ranked at #108. On 31 March 2013, the market capitalization of the company was ₹308 billion (US$4.3 billion). Customer satisfaction is defined as a measurement that determines how happy customers are with a company’s products, services, and capabilities. Customer satisfaction information, including surveys and ratings, can help a company determine how to best improve or changes its products and services. An organization’s main focus must be to satisfy its customers.
Transcript of STUDY ON CUSTOMER SATISFACTION TOWARDS SPLENDOR …
www.ijcrt.org © 2021 IJCRT | Volume 9, Issue 4 April 2021 | ISSN: 2320-2882
IJCRT2104421 International Journal of Creative Research Thoughts (IJCRT) www.ijcrt.org 3381
STUDY ON CUSTOMER SATISFACTION
TOWARDS SPLENDOR BIKES IN VADODARA
CITY
1 Rakeshkumar Parmar, 2 Akash Narang, 3 Jayesh Chawla, 4 Rahul Sharma,
1 M.B.A. student, 2 M.B.A. student, 3 M.B.A. student, 4 M.B.A. student
1 Parul Institute of management and research,
Parul university Waghodia, Vadodara, India
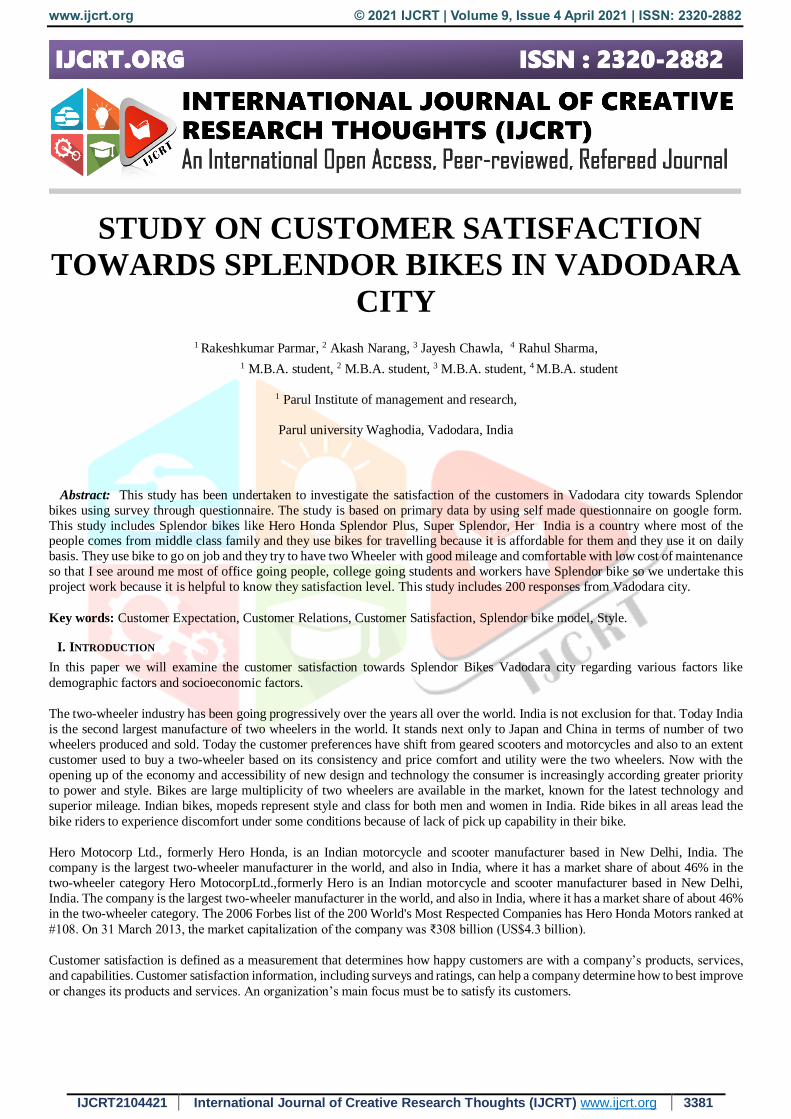
Abstract: This study has been undertaken to investigate the satisfaction of the customers in Vadodara city towards Splendor
bikes using survey through questionnaire. The study is based on primary data by using self made questionnaire on google form.
This study includes Splendor bikes like Hero Honda Splendor Plus, Super Splendor, Her India is a country where most of the people comes from middle class family and they use bikes for travelling because it is affordable for them and they use it on daily
basis. They use bike to go on job and they try to have two Wheeler with good mileage and comfortable with low cost of maintenance
so that I see around me most of office going people, college going students and workers have Splendor bike so we undertake this
project work because it is helpful to know they satisfaction level. This study includes 200 responses from Vadodara city.
Key words: Customer Expectation, Customer Relations, Customer Satisfaction, Splendor bike model, Style.
I. INTRODUCTION
In this paper we will examine the customer satisfaction towards Splendor Bikes Vadodara city regarding various factors like
demographic factors and socioeconomic factors.
The two-wheeler industry has been going progressively over the years all over the world. India is not exclusion for that. Today India
is the second largest manufacture of two wheelers in the world. It stands next only to Japan and China in terms of number of two
wheelers produced and sold. Today the customer preferences have shift from geared scooters and motorcycles and also to an extent
customer used to buy a two-wheeler based on its consistency and price comfort and utility were the two wheelers. Now with the
opening up of the economy and accessibility of new design and technology the consumer is increasingly according greater priority
to power and style. Bikes are large multiplicity of two wheelers are available in the market, known for the latest technology and
superior mileage. Indian bikes, mopeds represent style and class for both men and women in India. Ride bikes in all areas lead the
bike riders to experience discomfort under some conditions because of lack of pick up capability in their bike.
Hero Motocorp Ltd., formerly Hero Honda, is an Indian motorcycle and scooter manufacturer based in New Delhi, India. The
company is the largest two-wheeler manufacturer in the world, and also in India, where it has a market share of about 46% in the
two-wheeler category Hero MotocorpLtd.,formerly Hero is an Indian motorcycle and scooter manufacturer based in New Delhi,
India. The company is the largest two-wheeler manufacturer in the world, and also in India, where it has a market share of about 46%
in the two-wheeler category. The 2006 Forbes list of the 200 World's Most Respected Companies has Hero Honda Motors ranked at
#108. On 31 March 2013, the market capitalization of the company was ₹308 billion (US$4.3 billion).
Customer satisfaction is defined as a measurement that determines how happy customers are with a company’s products, services,
and capabilities. Customer satisfaction information, including surveys and ratings, can help a company determine how to best improve
or changes its products and services. An organization’s main focus must be to satisfy its customers.
www.ijcrt.org © 2021 IJCRT | Volume 9, Issue 4 April 2021 | ISSN: 2320-2882
IJCRT2104421 International Journal of Creative Research Thoughts (IJCRT) www.ijcrt.org 3382
II. LITERATURE REVIEW
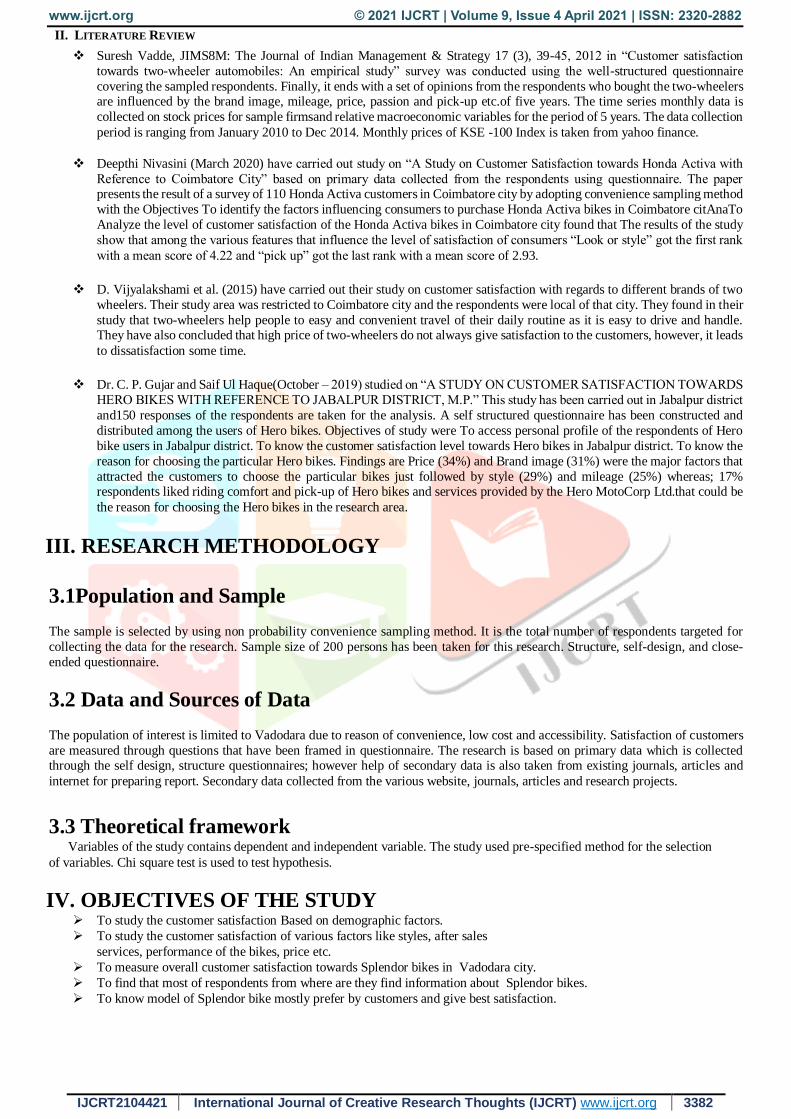
Suresh Vadde, JIMS8M: The Journal of Indian Management & Strategy 17 (3), 39-45, 2012 in “Customer satisfaction
towards two-wheeler automobiles: An empirical study” survey was conducted using the well-structured questionnaire
covering the sampled respondents. Finally, it ends with a set of opinions from the respondents who bought the two-wheelers are influenced by the brand image, mileage, price, passion and pick-up etc.of five years. The time series monthly data is
collected on stock prices for sample firmsand relative macroeconomic variables for the period of 5 years. The data collection
period is ranging from January 2010 to Dec 2014. Monthly prices of KSE -100 Index is taken from yahoo finance.
Deepthi Nivasini (March 2020) have carried out study on “A Study on Customer Satisfaction towards Honda Activa with
Reference to Coimbatore City” based on primary data collected from the respondents using questionnaire. The paper presents the result of a survey of 110 Honda Activa customers in Coimbatore city by adopting convenience sampling method
with the Objectives To identify the factors influencing consumers to purchase Honda Activa bikes in Coimbatore citAnaTo
Analyze the level of customer satisfaction of the Honda Activa bikes in Coimbatore city found that The results of the study
show that among the various features that influence the level of satisfaction of consumers “Look or style” got the first rank
with a mean score of 4.22 and “pick up” got the last rank with a mean score of 2.93.
D. Vijyalakshami et al. (2015) have carried out their study on customer satisfaction with regards to different brands of two
wheelers. Their study area was restricted to Coimbatore city and the respondents were local of that city. They found in their
study that two-wheelers help people to easy and convenient travel of their daily routine as it is easy to drive and handle. They have also concluded that high price of two-wheelers do not always give satisfaction to the customers, however, it leads
to dissatisfaction some time.
Dr. C. P. Gujar and Saif Ul Haque(October – 2019) studied on “A STUDY ON CUSTOMER SATISFACTION TOWARDS
HERO BIKES WITH REFERENCE TO JABALPUR DISTRICT, M.P.” This study has been carried out in Jabalpur district
and150 responses of the respondents are taken for the analysis. A self structured questionnaire has been constructed and
distributed among the users of Hero bikes. Objectives of study were To access personal profile of the respondents of Hero
bike users in Jabalpur district. To know the customer satisfaction level towards Hero bikes in Jabalpur district. To know the
reason for choosing the particular Hero bikes. Findings are Price (34%) and Brand image (31%) were the major factors that
attracted the customers to choose the particular bikes just followed by style (29%) and mileage (25%) whereas; 17% respondents liked riding comfort and pick-up of Hero bikes and services provided by the Hero MotoCorp Ltd.that could be
the reason for choosing the Hero bikes in the research area.
III. RESEARCH METHODOLOGY
3.1Population and Sample
The sample is selected by using non probability convenience sampling method. It is the total number of respondents targeted for
collecting the data for the research. Sample size of 200 persons has been taken for this research. Structure, self-design, and close-
ended questionnaire.
3.2 Data and Sources of Data
The population of interest is limited to Vadodara due to reason of convenience, low cost and accessibility. Satisfaction of customers
are measured through questions that have been framed in questionnaire. The research is based on primary data which is collected through the self design, structure questionnaires; however help of secondary data is also taken from existing journals, articles and
internet for preparing report. Secondary data collected from the various website, journals, articles and research projects.
3.3 Theoretical framework Variables of the study contains dependent and independent variable. The study used pre-specified method for the selection
of variables. Chi square test is used to test hypothesis.
IV. OBJECTIVES OF THE STUDY To study the customer satisfaction Based on demographic factors.
To study the customer satisfaction of various factors like styles, after sales
services, performance of the bikes, price etc.
To measure overall customer satisfaction towards Splendor bikes in Vadodara city.
To find that most of respondents from where are they find information about Splendor bikes.
To know model of Splendor bike mostly prefer by customers and give best satisfaction.
www.ijcrt.org © 2021 IJCRT | Volume 9, Issue 4 April 2021 | ISSN: 2320-2882
IJCRT2104421 International Journal of Creative Research Thoughts (IJCRT) www.ijcrt.org 3383
V. ANALYSIS OF DATA
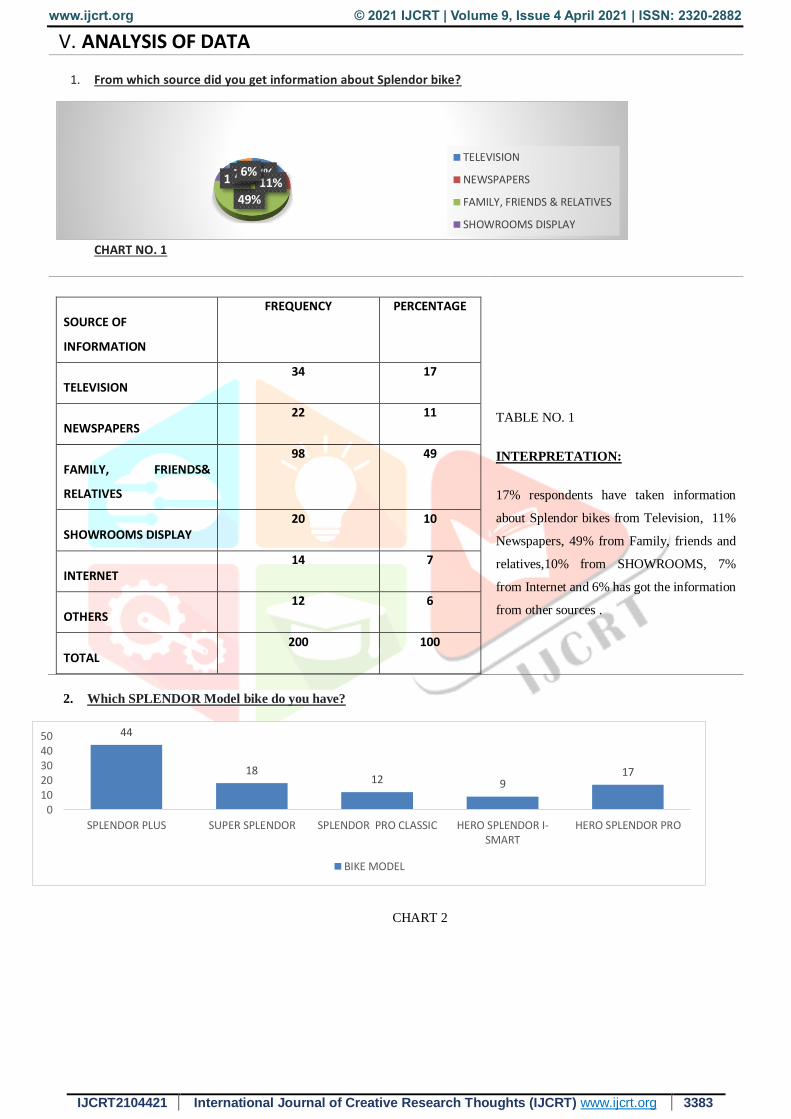
1. From which source did you get information about Splendor bike?
CHART NO. 1
SOURCE OF
INFORMATION
FREQUENCY PERCENTAGE
TELEVISION 34 17
NEWSPAPERS 22 11
FAMILY, FRIENDS&
RELATIVES
98 49
SHOWROOMS DISPLAY 20 10
INTERNET 14 7
OTHERS 12 6
TOTAL 200 100
TABLE NO. 1
INTERPRETATION:
17% respondents have taken information
about Splendor bikes from Television, 11%
Newspapers, 49% from Family, friends and
relatives,10% from SHOWROOMS, 7%
from Internet and 6% has got the information
from other sources .
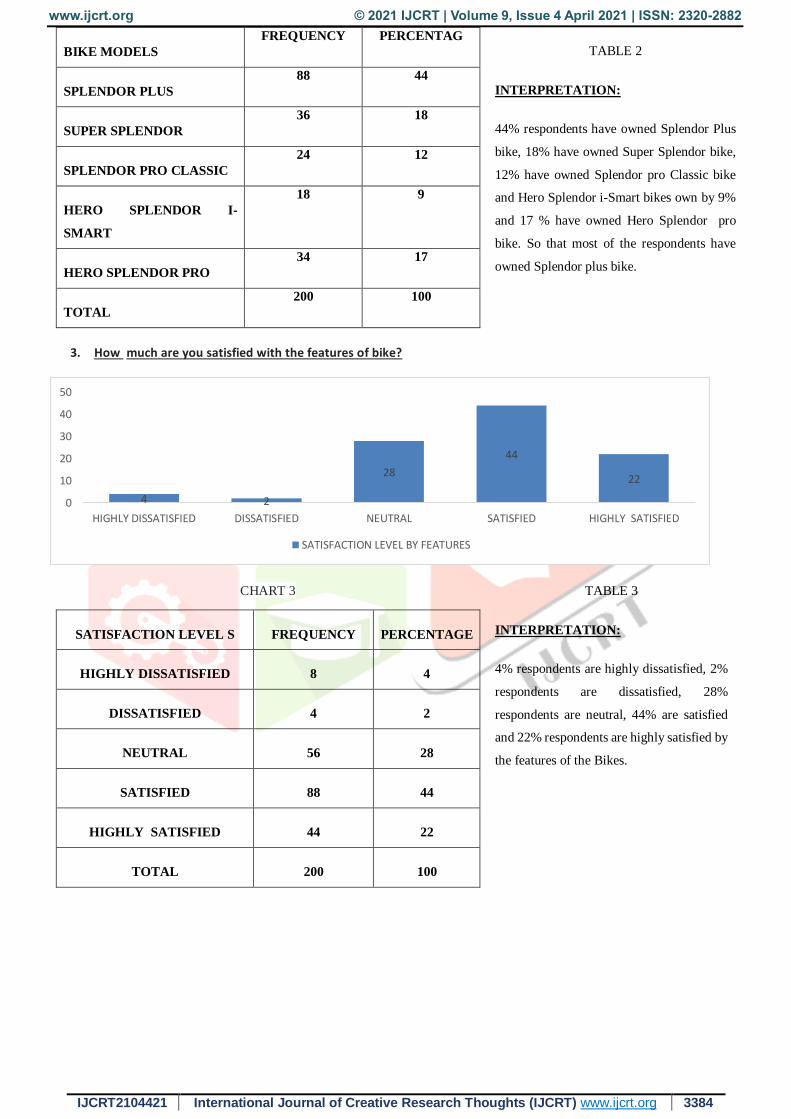
2. Which SPLENDOR Model bike do you have?
CHART 2
17%11%
49%
10%7%6%TELEVISION
NEWSPAPERS
FAMILY, FRIENDS & RELATIVES
SHOWROOMS DISPLAY
44
1812 9
17
01020304050
SPLENDOR PLUS SUPER SPLENDOR SPLENDOR PRO CLASSIC HERO SPLENDOR I-SMART
HERO SPLENDOR PRO
BIKE MODEL
www.ijcrt.org © 2021 IJCRT | Volume 9, Issue 4 April 2021 | ISSN: 2320-2882
IJCRT2104421 International Journal of Creative Research Thoughts (IJCRT) www.ijcrt.org 3384
BIKE MODELS
FREQUENCY PERCENTAG
SPLENDOR PLUS
88 44
SUPER SPLENDOR
36 18
SPLENDOR PRO CLASSIC
24 12
HERO SPLENDOR I-
SMART
18 9
HERO SPLENDOR PRO
34 17
TOTAL
200 100
TABLE 2
INTERPRETATION:
44% respondents have owned Splendor Plus
bike, 18% have owned Super Splendor bike,
12% have owned Splendor pro Classic bike
and Hero Splendor i-Smart bikes own by 9%
and 17 % have owned Hero Splendor pro
bike. So that most of the respondents have
owned Splendor plus bike.
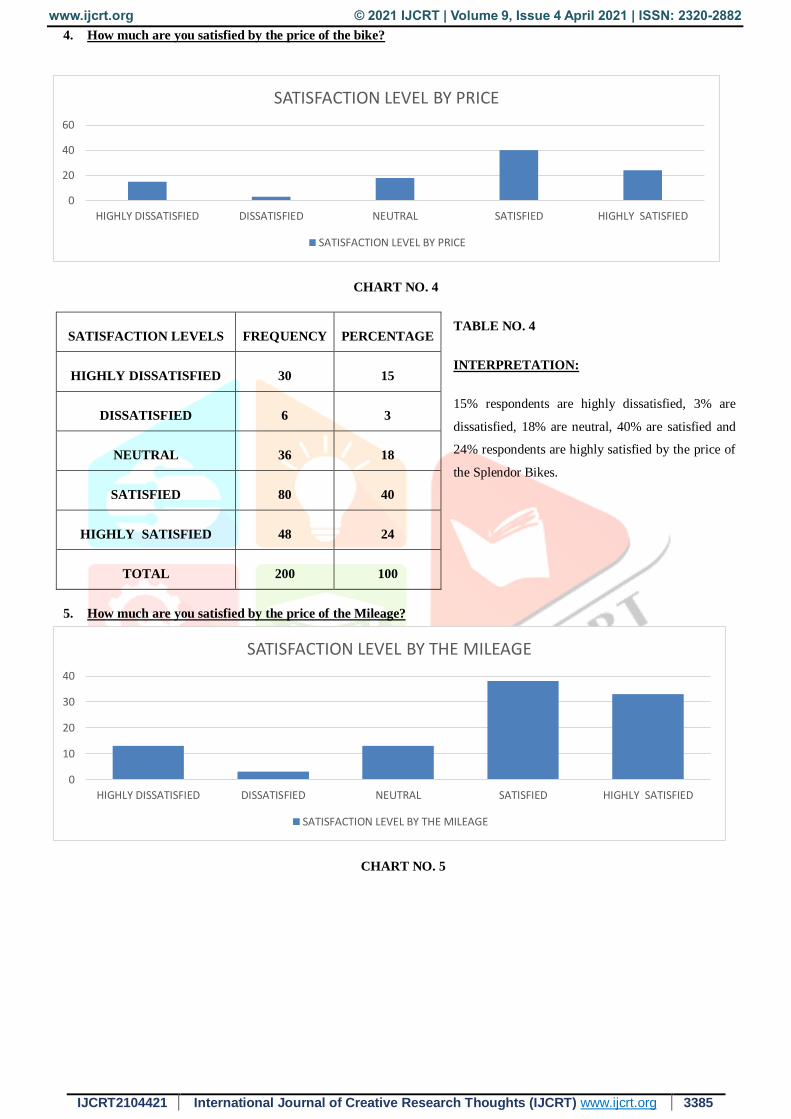
3. How much are you satisfied with the features of bike?
CHART 3
SATISFACTION LEVEL S FREQUENCY PERCENTAGE
HIGHLY DISSATISFIED 8 4
DISSATISFIED 4 2
NEUTRAL 56 28
SATISFIED 88 44
HIGHLY SATISFIED 44 22
TOTAL 200 100
TABLE 3
INTERPRETATION:
4% respondents are highly dissatisfied, 2%
respondents are dissatisfied, 28%
respondents are neutral, 44% are satisfied
and 22% respondents are highly satisfied by
the features of the Bikes.
4 2
28
44
22
0
10
20
30
40
50
HIGHLY DISSATISFIED DISSATISFIED NEUTRAL SATISFIED HIGHLY SATISFIED
SATISFACTION LEVEL BY FEATURES
www.ijcrt.org © 2021 IJCRT | Volume 9, Issue 4 April 2021 | ISSN: 2320-2882
IJCRT2104421 International Journal of Creative Research Thoughts (IJCRT) www.ijcrt.org 3385
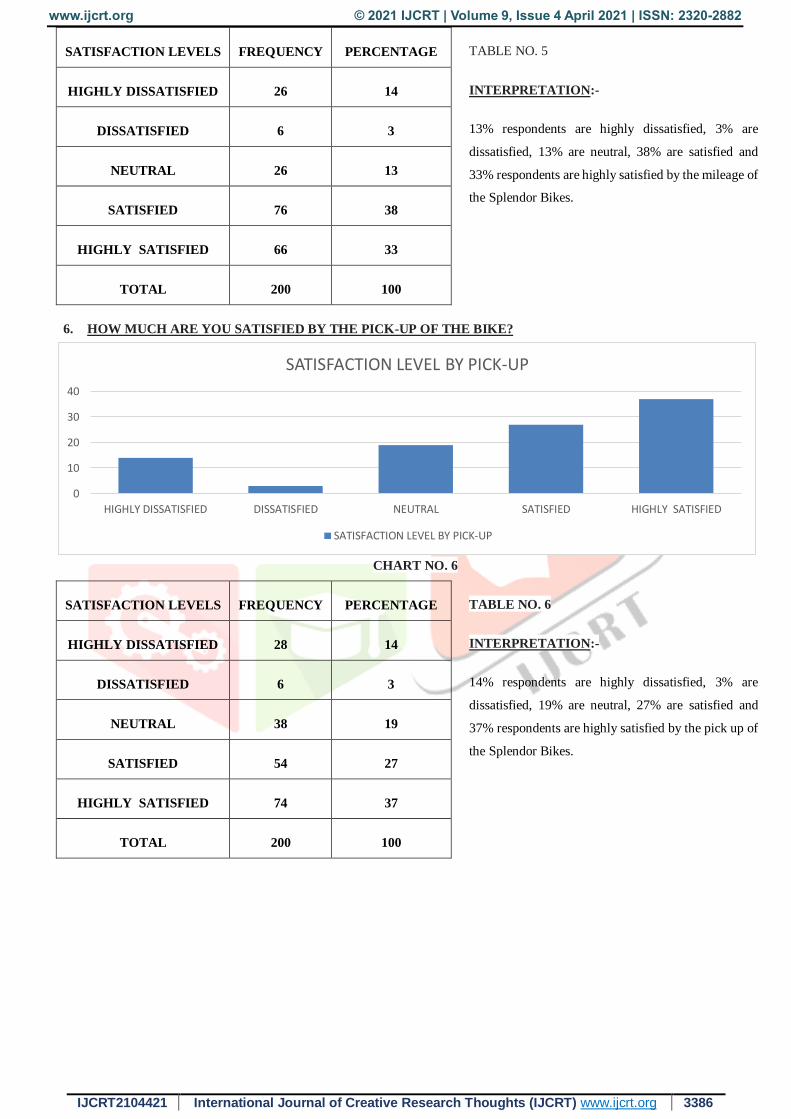
4. How much are you satisfied by the price of the bike?
CHART NO. 4
TABLE NO. 4
INTERPRETATION:
15% respondents are highly dissatisfied, 3% are
dissatisfied, 18% are neutral, 40% are satisfied and
24% respondents are highly satisfied by the price of
the Splendor Bikes.
SATISFACTION LEVELS FREQUENCY PERCENTAGE
HIGHLY DISSATISFIED 30 15
DISSATISFIED 6 3
NEUTRAL 36 18
SATISFIED 80 40
HIGHLY SATISFIED 48 24
TOTAL 200 100
5. How much are you satisfied by the price of the Mileage?
CHART NO. 5
0
20
40
60
HIGHLY DISSATISFIED DISSATISFIED NEUTRAL SATISFIED HIGHLY SATISFIED
SATISFACTION LEVEL BY PRICE
SATISFACTION LEVEL BY PRICE
0
10
20
30
40
HIGHLY DISSATISFIED DISSATISFIED NEUTRAL SATISFIED HIGHLY SATISFIED
SATISFACTION LEVEL BY THE MILEAGE
SATISFACTION LEVEL BY THE MILEAGE
www.ijcrt.org © 2021 IJCRT | Volume 9, Issue 4 April 2021 | ISSN: 2320-2882
IJCRT2104421 International Journal of Creative Research Thoughts (IJCRT) www.ijcrt.org 3386
SATISFACTION LEVELS FREQUENCY PERCENTAGE
HIGHLY DISSATISFIED 26 14
DISSATISFIED 6 3
NEUTRAL 26 13
SATISFIED 76 38
HIGHLY SATISFIED 66 33
TOTAL 200 100
TABLE NO. 5
INTERPRETATION:-
13% respondents are highly dissatisfied, 3% are
dissatisfied, 13% are neutral, 38% are satisfied and
33% respondents are highly satisfied by the mileage of
the Splendor Bikes.
6. HOW MUCH ARE YOU SATISFIED BY THE PICK-UP OF THE BIKE?
CHART NO. 6
SATISFACTION LEVELS FREQUENCY PERCENTAGE
HIGHLY DISSATISFIED 28 14
DISSATISFIED 6 3
NEUTRAL 38 19
SATISFIED 54 27
HIGHLY SATISFIED 74 37
TOTAL 200 100
TABLE NO. 6
INTERPRETATION:-
14% respondents are highly dissatisfied, 3% are
dissatisfied, 19% are neutral, 27% are satisfied and
37% respondents are highly satisfied by the pick up of
the Splendor Bikes.
0
10
20
30
40
HIGHLY DISSATISFIED DISSATISFIED NEUTRAL SATISFIED HIGHLY SATISFIED
SATISFACTION LEVEL BY PICK-UP
SATISFACTION LEVEL BY PICK-UP
www.ijcrt.org © 2021 IJCRT | Volume 9, Issue 4 April 2021 | ISSN: 2320-2882
IJCRT2104421 International Journal of Creative Research Thoughts (IJCRT) www.ijcrt.org 3387
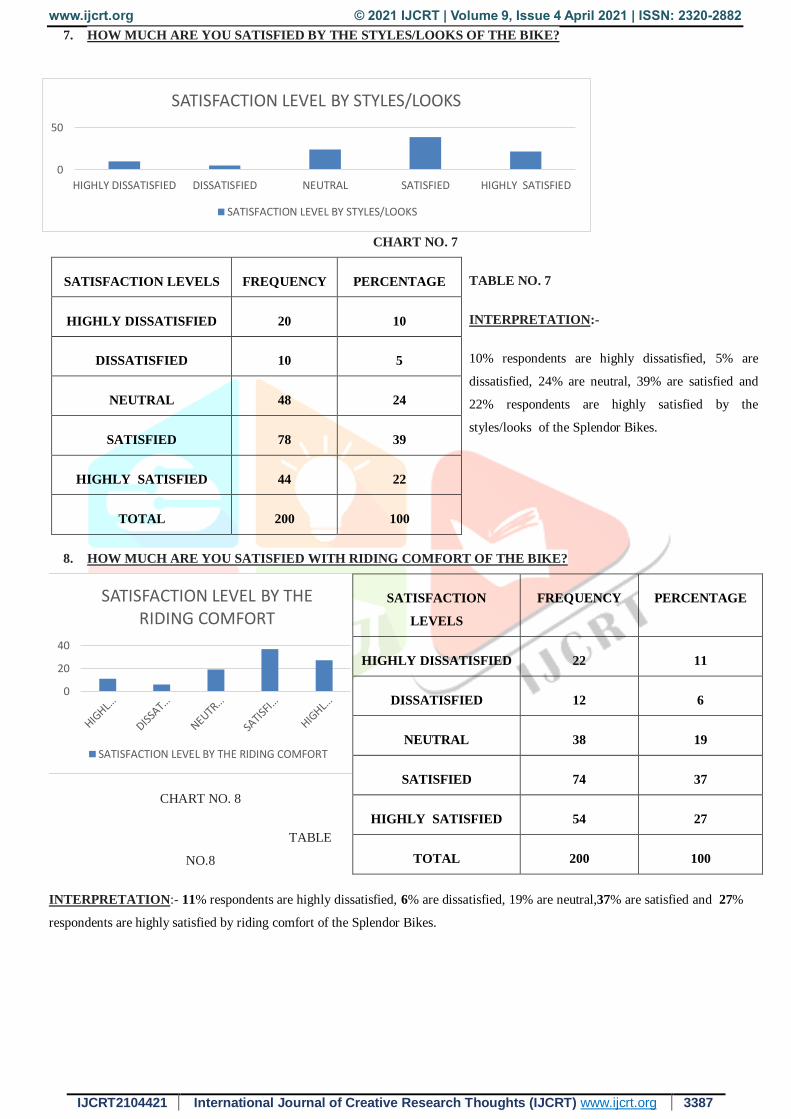
7. HOW MUCH ARE YOU SATISFIED BY THE STYLES/LOOKS OF THE BIKE?
CHART NO. 7
SATISFACTION LEVELS FREQUENCY PERCENTAGE
HIGHLY DISSATISFIED 20 10
DISSATISFIED 10 5
NEUTRAL 48 24
SATISFIED 78 39
HIGHLY SATISFIED 44 22
TOTAL 200 100
TABLE NO. 7
INTERPRETATION:-
10% respondents are highly dissatisfied, 5% are
dissatisfied, 24% are neutral, 39% are satisfied and
22% respondents are highly satisfied by the
styles/looks of the Splendor Bikes.
8. HOW MUCH ARE YOU SATISFIED WITH RIDING COMFORT OF THE BIKE?
CHART NO. 8
TABLE
NO.8
SATISFACTION
LEVELS
FREQUENCY PERCENTAGE
HIGHLY DISSATISFIED 22 11
DISSATISFIED 12 6
NEUTRAL 38 19
SATISFIED 74 37
HIGHLY SATISFIED 54 27
TOTAL 200 100
INTERPRETATION:- 11% respondents are highly dissatisfied, 6% are dissatisfied, 19% are neutral,37% are satisfied and 27%
respondents are highly satisfied by riding comfort of the Splendor Bikes.
0
50
HIGHLY DISSATISFIED DISSATISFIED NEUTRAL SATISFIED HIGHLY SATISFIED
SATISFACTION LEVEL BY STYLES/LOOKS
SATISFACTION LEVEL BY STYLES/LOOKS
0
20
40
SATISFACTION LEVEL BY THE RIDING COMFORT
SATISFACTION LEVEL BY THE RIDING COMFORT
www.ijcrt.org © 2021 IJCRT | Volume 9, Issue 4 April 2021 | ISSN: 2320-2882
IJCRT2104421 International Journal of Creative Research Thoughts (IJCRT) www.ijcrt.org 3388
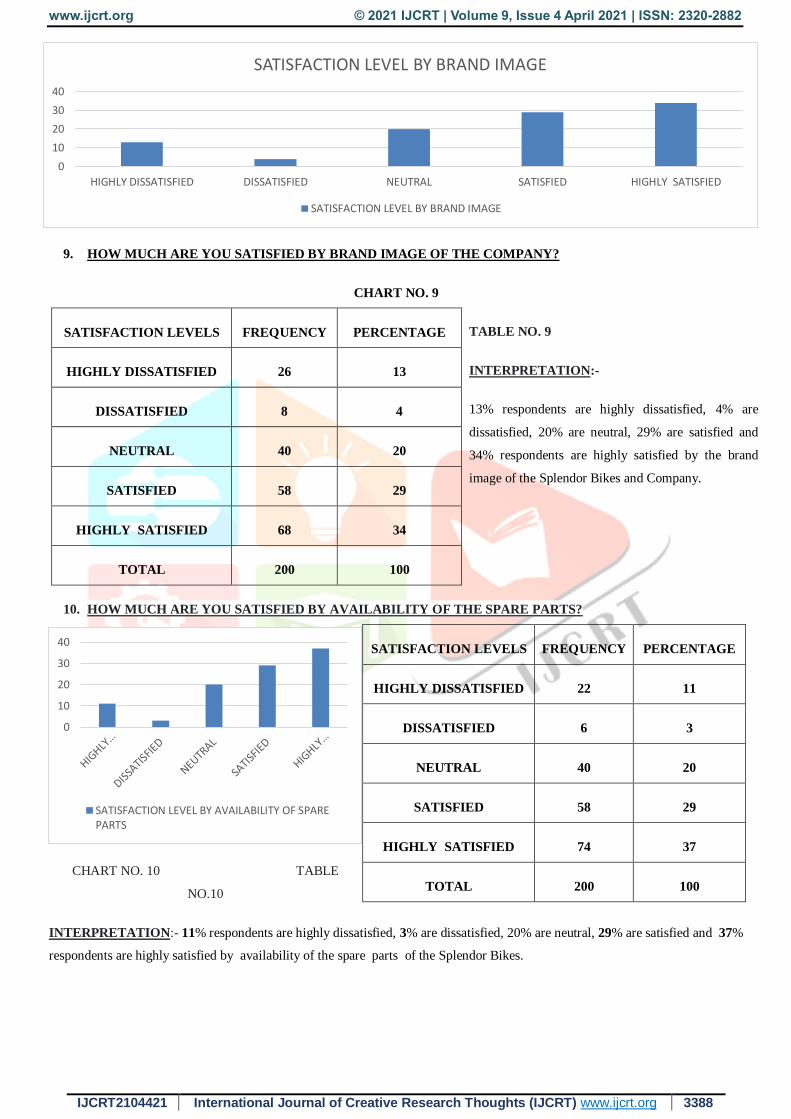
9. HOW MUCH ARE YOU SATISFIED BY BRAND IMAGE OF THE COMPANY?
CHART NO. 9
SATISFACTION LEVELS FREQUENCY PERCENTAGE
HIGHLY DISSATISFIED 26 13
DISSATISFIED 8 4
NEUTRAL 40 20
SATISFIED 58 29
HIGHLY SATISFIED 68 34
TOTAL 200 100
TABLE NO. 9
INTERPRETATION:-
13% respondents are highly dissatisfied, 4% are
dissatisfied, 20% are neutral, 29% are satisfied and
34% respondents are highly satisfied by the brand
image of the Splendor Bikes and Company.
10. HOW MUCH ARE YOU SATISFIED BY AVAILABILITY OF THE SPARE PARTS?
CHART NO. 10 TABLE
NO.10
SATISFACTION LEVELS FREQUENCY PERCENTAGE
HIGHLY DISSATISFIED 22 11
DISSATISFIED 6 3
NEUTRAL 40 20
SATISFIED 58 29
HIGHLY SATISFIED 74 37
TOTAL 200 100
INTERPRETATION:- 11% respondents are highly dissatisfied, 3% are dissatisfied, 20% are neutral, 29% are satisfied and 37%
respondents are highly satisfied by availability of the spare parts of the Splendor Bikes.
0
10
20
30
40
HIGHLY DISSATISFIED DISSATISFIED NEUTRAL SATISFIED HIGHLY SATISFIED
SATISFACTION LEVEL BY BRAND IMAGE
SATISFACTION LEVEL BY BRAND IMAGE
0
10
20
30
40
SATISFACTION LEVEL BY AVAILABILITY OF SPAREPARTS
www.ijcrt.org © 2021 IJCRT | Volume 9, Issue 4 April 2021 | ISSN: 2320-2882
IJCRT2104421 International Journal of Creative Research Thoughts (IJCRT) www.ijcrt.org 3389
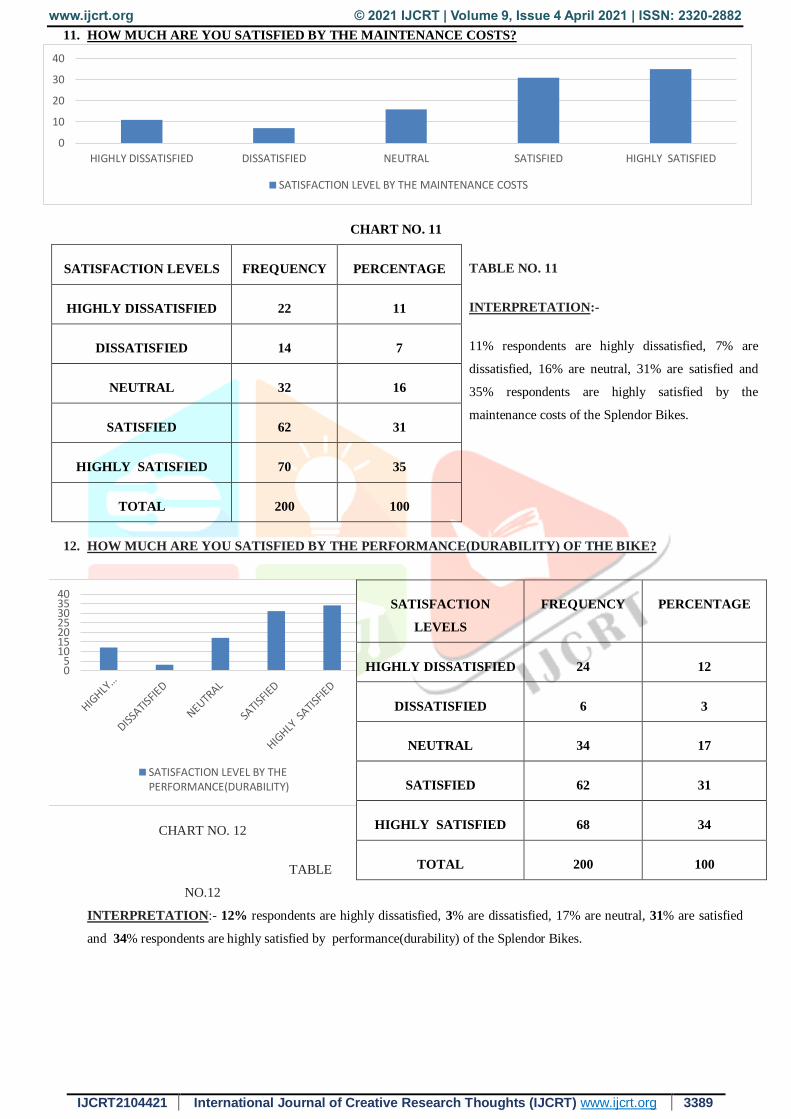
11. HOW MUCH ARE YOU SATISFIED BY THE MAINTENANCE COSTS?
CHART NO. 11
SATISFACTION LEVELS FREQUENCY PERCENTAGE
HIGHLY DISSATISFIED 22 11
DISSATISFIED 14 7
NEUTRAL 32 16
SATISFIED 62 31
HIGHLY SATISFIED 70 35
TOTAL 200 100
TABLE NO. 11
INTERPRETATION:-
11% respondents are highly dissatisfied, 7% are
dissatisfied, 16% are neutral, 31% are satisfied and
35% respondents are highly satisfied by the
maintenance costs of the Splendor Bikes.
12. HOW MUCH ARE YOU SATISFIED BY THE PERFORMANCE(DURABILITY) OF THE BIKE?
INTERPRETATION:- 12% respondents are highly dissatisfied, 3% are dissatisfied, 17% are neutral, 31% are satisfied
and 34% respondents are highly satisfied by performance(durability) of the Splendor Bikes.
CHART NO. 12
TABLE
NO.12
SATISFACTION
LEVELS
FREQUENCY PERCENTAGE
HIGHLY DISSATISFIED 24 12
DISSATISFIED 6 3
NEUTRAL 34 17
SATISFIED 62 31
HIGHLY SATISFIED 68 34
TOTAL 200 100
0
10
20
30
40
HIGHLY DISSATISFIED DISSATISFIED NEUTRAL SATISFIED HIGHLY SATISFIED
SATISFACTION LEVEL BY THE MAINTENANCE COSTS
05
10152025303540
SATISFACTION LEVEL BY THEPERFORMANCE(DURABILITY)
www.ijcrt.org © 2021 IJCRT | Volume 9, Issue 4 April 2021 | ISSN: 2320-2882
IJCRT2104421 International Journal of Creative Research Thoughts (IJCRT) www.ijcrt.org 3390
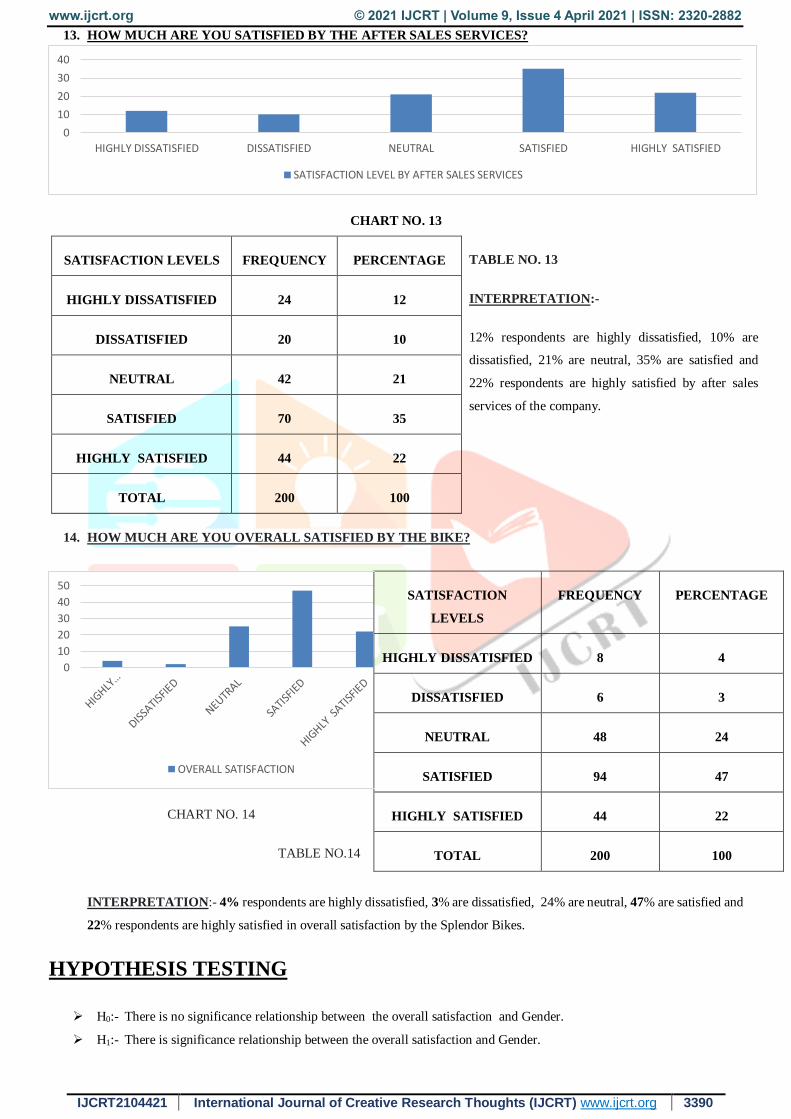
13. HOW MUCH ARE YOU SATISFIED BY THE AFTER SALES SERVICES?
CHART NO. 13
SATISFACTION LEVELS FREQUENCY PERCENTAGE
HIGHLY DISSATISFIED 24 12
DISSATISFIED 20 10
NEUTRAL 42 21
SATISFIED 70 35
HIGHLY SATISFIED 44 22
TOTAL 200 100
TABLE NO. 13
INTERPRETATION:-
12% respondents are highly dissatisfied, 10% are
dissatisfied, 21% are neutral, 35% are satisfied and
22% respondents are highly satisfied by after sales
services of the company.
14. HOW MUCH ARE YOU OVERALL SATISFIED BY THE BIKE?
INTERPRETATION:- 4% respondents are highly dissatisfied, 3% are dissatisfied, 24% are neutral, 47% are satisfied and
22% respondents are highly satisfied in overall satisfaction by the Splendor Bikes.
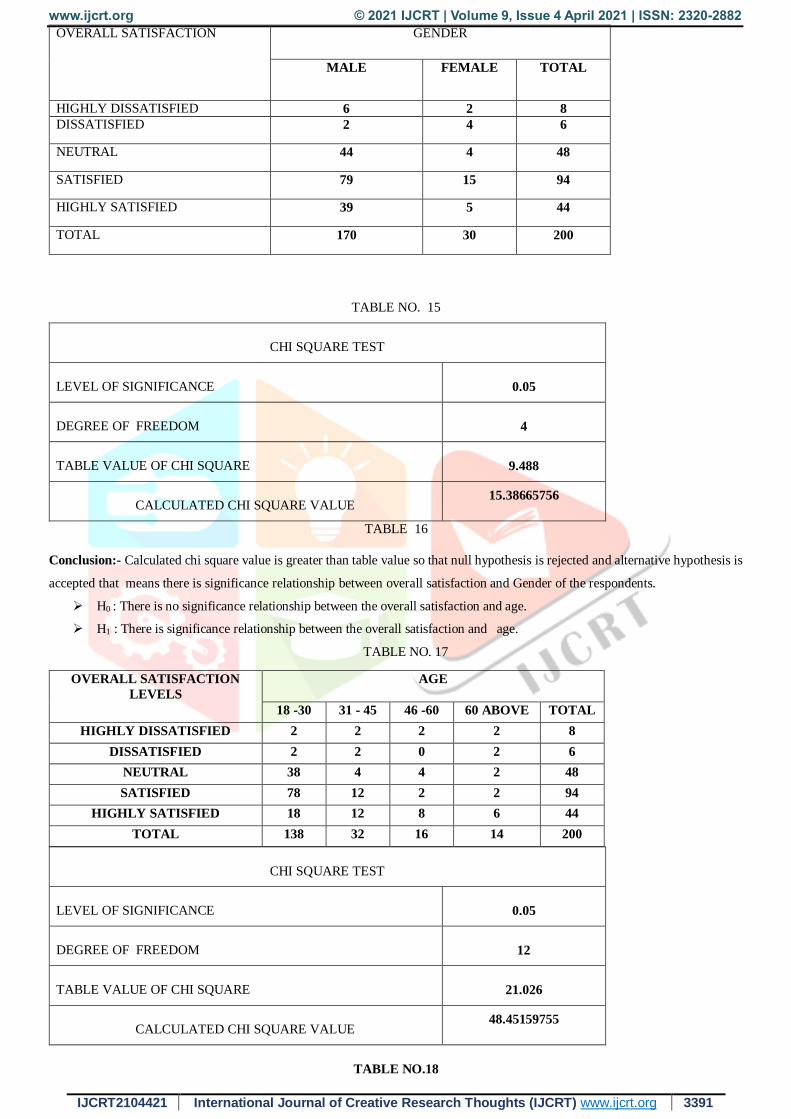
HYPOTHESIS TESTING
H0:- There is no significance relationship between the overall satisfaction and Gender.
H1:- There is significance relationship between the overall satisfaction and Gender.
CHART NO. 14
TABLE NO.14
SATISFACTION
LEVELS
FREQUENCY PERCENTAGE
HIGHLY DISSATISFIED 8 4
DISSATISFIED 6 3
NEUTRAL 48 24
SATISFIED 94 47
HIGHLY SATISFIED 44 22
TOTAL 200 100
0
10
20
30
40
HIGHLY DISSATISFIED DISSATISFIED NEUTRAL SATISFIED HIGHLY SATISFIED
SATISFACTION LEVEL BY AFTER SALES SERVICES
0
10
20
30
40
50
OVERALL SATISFACTION
www.ijcrt.org © 2021 IJCRT | Volume 9, Issue 4 April 2021 | ISSN: 2320-2882
IJCRT2104421 International Journal of Creative Research Thoughts (IJCRT) www.ijcrt.org 3391
TABLE NO. 15
CHI SQUARE TEST
LEVEL OF SIGNIFICANCE 0.05
DEGREE OF FREEDOM 4
TABLE VALUE OF CHI SQUARE 9.488
CALCULATED CHI SQUARE VALUE 15.38665756
TABLE 16
Conclusion:- Calculated chi square value is greater than table value so that null hypothesis is rejected and alternative hypothesis is
accepted that means there is significance relationship between overall satisfaction and Gender of the respondents.
H0 : There is no significance relationship between the overall satisfaction and age.
H1 : There is significance relationship between the overall satisfaction and age.
TABLE NO. 17
CHI SQUARE TEST
LEVEL OF SIGNIFICANCE 0.05
DEGREE OF FREEDOM 12
TABLE VALUE OF CHI SQUARE 21.026
CALCULATED CHI SQUARE VALUE 48.45159755
TABLE NO.18
OVERALL SATISFACTION GENDER
MALE FEMALE TOTAL
HIGHLY DISSATISFIED 6 2 8
DISSATISFIED 2 4 6
NEUTRAL 44 4 48
SATISFIED 79 15 94
HIGHLY SATISFIED 39 5 44
TOTAL 170 30 200
OVERALL SATISFACTION
LEVELS
AGE
18 -30 31 - 45 46 -60 60 ABOVE TOTAL
HIGHLY DISSATISFIED 2 2 2 2 8
DISSATISFIED 2 2 0 2 6
NEUTRAL 38 4 4 2 48
SATISFIED 78 12 2 2 94
HIGHLY SATISFIED 18 12 8 6 44
TOTAL 138 32 16 14 200
www.ijcrt.org © 2021 IJCRT | Volume 9, Issue 4 April 2021 | ISSN: 2320-2882
IJCRT2104421 International Journal of Creative Research Thoughts (IJCRT) www.ijcrt.org 3392
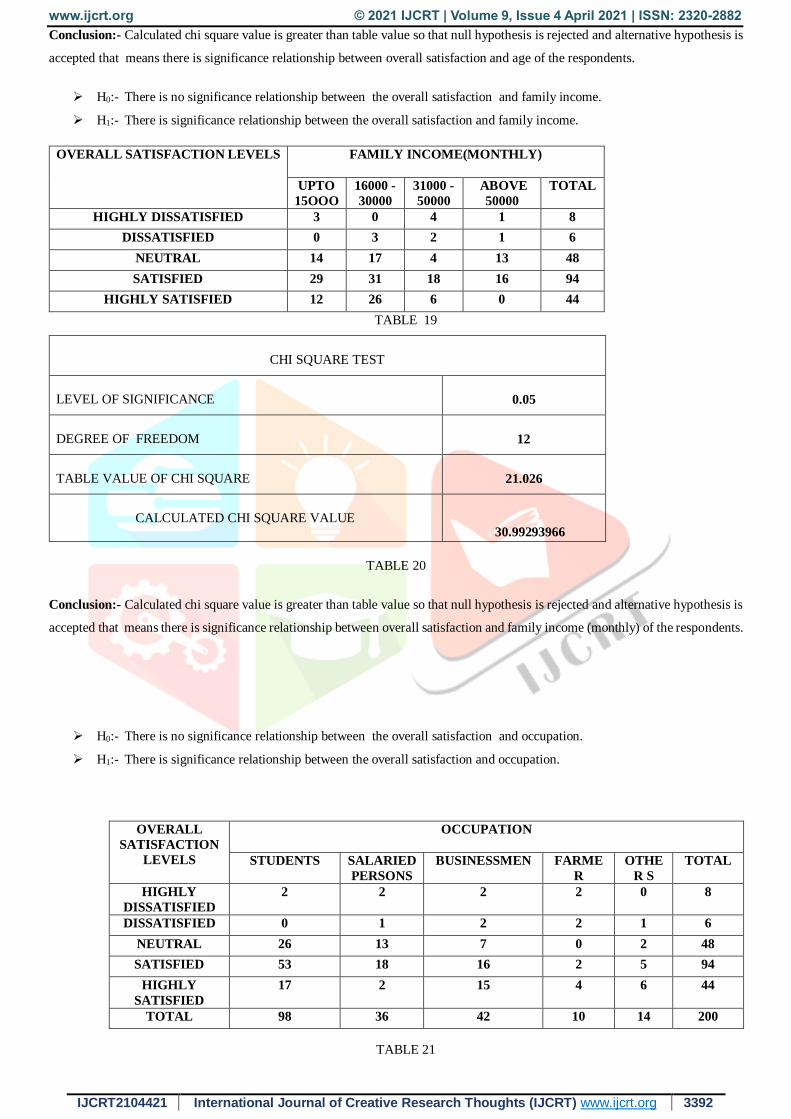
Conclusion:- Calculated chi square value is greater than table value so that null hypothesis is rejected and alternative hypothesis is
accepted that means there is significance relationship between overall satisfaction and age of the respondents.
H0:- There is no significance relationship between the overall satisfaction and family income.
H1:- There is significance relationship between the overall satisfaction and family income.
OVERALL SATISFACTION LEVELS FAMILY INCOME(MONTHLY)
UPTO
15OOO
16000 -
30000
31000 -
50000
ABOVE
50000
TOTAL
HIGHLY DISSATISFIED 3 0 4 1 8
DISSATISFIED 0 3 2 1 6
NEUTRAL 14 17 4 13 48
SATISFIED 29 31 18 16 94
HIGHLY SATISFIED 12 26 6 0 44
TABLE 19
CHI SQUARE TEST
LEVEL OF SIGNIFICANCE 0.05
DEGREE OF FREEDOM 12
TABLE VALUE OF CHI SQUARE 21.026
CALCULATED CHI SQUARE VALUE 30.99293966
TABLE 20
Conclusion:- Calculated chi square value is greater than table value so that null hypothesis is rejected and alternative hypothesis is
accepted that means there is significance relationship between overall satisfaction and family income (monthly) of the respondents.
H0:- There is no significance relationship between the overall satisfaction and occupation.
H1:- There is significance relationship between the overall satisfaction and occupation.
TABLE 21
OVERALL
SATISFACTION
LEVELS
OCCUPATION
STUDENTS SALARIED
PERSONS
BUSINESSMEN FARME
R
OTHE
R S
TOTAL
HIGHLY
DISSATISFIED
2 2 2 2 0 8
DISSATISFIED 0 1 2 2 1 6
NEUTRAL 26 13 7 0 2 48
SATISFIED 53 18 16 2 5 94
HIGHLY
SATISFIED
17 2 15 4 6 44
TOTAL 98 36 42 10 14 200
www.ijcrt.org © 2021 IJCRT | Volume 9, Issue 4 April 2021 | ISSN: 2320-2882
IJCRT2104421 International Journal of Creative Research Thoughts (IJCRT) www.ijcrt.org 3393
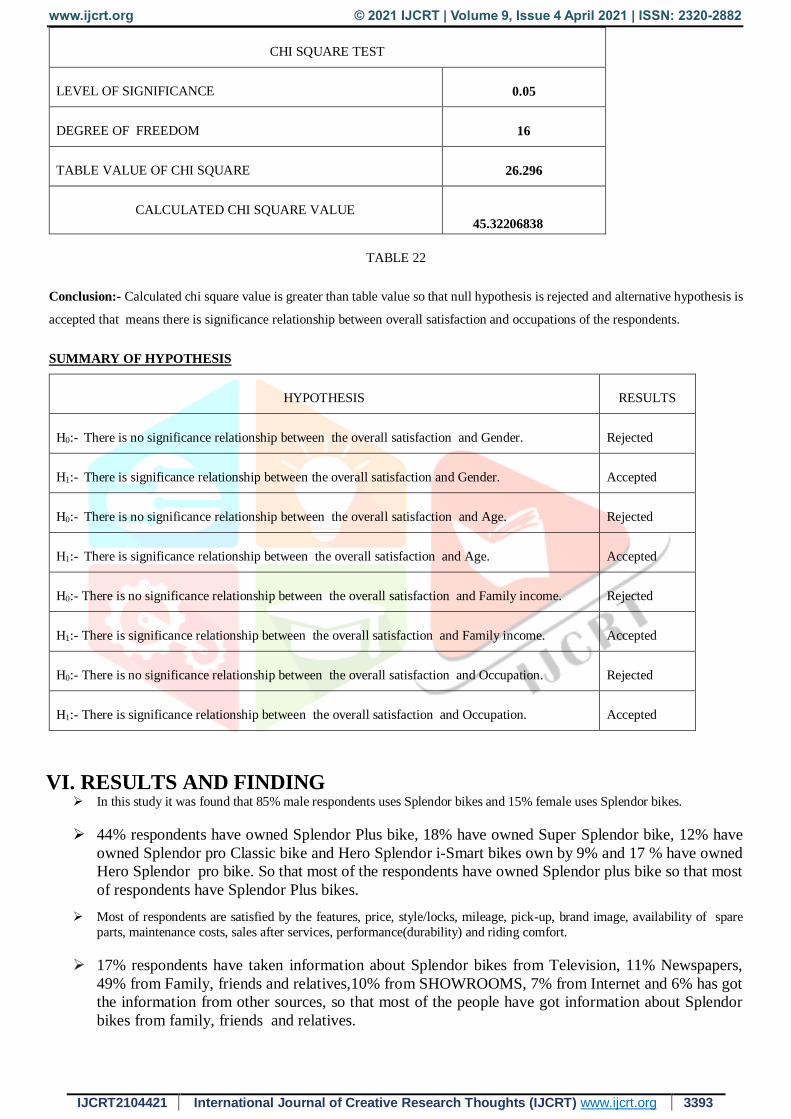
CHI SQUARE TEST
LEVEL OF SIGNIFICANCE 0.05
DEGREE OF FREEDOM 16
TABLE VALUE OF CHI SQUARE 26.296
CALCULATED CHI SQUARE VALUE 45.32206838
TABLE 22
Conclusion:- Calculated chi square value is greater than table value so that null hypothesis is rejected and alternative hypothesis is
accepted that means there is significance relationship between overall satisfaction and occupations of the respondents.
SUMMARY OF HYPOTHESIS
HYPOTHESIS RESULTS
H0:- There is no significance relationship between the overall satisfaction and Gender. Rejected
H1:- There is significance relationship between the overall satisfaction and Gender. Accepted
H0:- There is no significance relationship between the overall satisfaction and Age. Rejected
H1:- There is significance relationship between the overall satisfaction and Age. Accepted
H0:- There is no significance relationship between the overall satisfaction and Family income. Rejected
H1:- There is significance relationship between the overall satisfaction and Family income. Accepted
H0:- There is no significance relationship between the overall satisfaction and Occupation. Rejected
H1:- There is significance relationship between the overall satisfaction and Occupation. Accepted
VI. RESULTS AND FINDING In this study it was found that 85% male respondents uses Splendor bikes and 15% female uses Splendor bikes.
44% respondents have owned Splendor Plus bike, 18% have owned Super Splendor bike, 12% have
owned Splendor pro Classic bike and Hero Splendor i-Smart bikes own by 9% and 17 % have owned
Hero Splendor pro bike. So that most of the respondents have owned Splendor plus bike so that most
of respondents have Splendor Plus bikes.
Most of respondents are satisfied by the features, price, style/locks, mileage, pick-up, brand image, availability of spare
parts, maintenance costs, sales after services, performance(durability) and riding comfort.
17% respondents have taken information about Splendor bikes from Television, 11% Newspapers,
49% from Family, friends and relatives,10% from SHOWROOMS, 7% from Internet and 6% has got
the information from other sources, so that most of the people have got information about Splendor
bikes from family, friends and relatives.
www.ijcrt.org © 2021 IJCRT | Volume 9, Issue 4 April 2021 | ISSN: 2320-2882
IJCRT2104421 International Journal of Creative Research Thoughts (IJCRT) www.ijcrt.org 3394
Family income wise distribution of the respondent is 29% have up to 15000, 38.5% have 16000-30000
17% have 31000-50000 and 15.5% have above 50000 income level, so that most of Splendor bikes
users fall into the income group of 16000-30000 and upto 15000.
In the overall satisfaction 4% respondents are highly dissatisfied, 3%are dissatisfied, 24% are neutral,
47% are satisfied and 22% are highly satisfied, so that most of respondents are satisfied by the
Splendor Bikes.
VII. LIMITATIONS OF THE STUDY AND FUTURE SCOPE
This study was conducted only in Vadodara city and taken sample size is 200 only is a very limited sample to generalize the
results of the study;
results may differ from using any other sample.
Apart from this it is a confined study to one country so change in population selection results may vary. It is also a fact that
respondents may rate their preference according to their own liking and disliking.
FUTURE SCOPE The study can be conducted in some other cities with increase in
sample size.
A comparison between/among cities will be better prospect for this study.
The study can be conducted by taking other model of Bikes and by taking other company rather than Hero.
VIII. CONCLUSION / SUGGESTIONS
Customers have a intense relation with the bike which they use. Splendor Bikes are bikes which can be affordable by
middle class people and lower middle class.
In India most of the families fall in these class so that Splendor Bikes are the most suitable Bikes with affordable price,
mileage, easy availability of spare parts, lower maintenance costs etc.
47% are satisfied and 22% are highly satisfied, so that most of respondents are satisfied by the
Splendor Bikes.
Most of the people had got information about Splendor bikes from family, friends and relatives so
that most of the people get information by from trusted sources. there is a need to fulfill the needs
of the customer’s needs and satisfaction. The level of satisfaction towards quality of selected five
brands is highly satisfied. Hence, the company manager must concentrate on measuring and understanding the factors, which
affect customer satisfaction, thus goes long way building superior brand for the selected brand of
two wheelers.
www.ijcrt.org © 2021 IJCRT | Volume 9, Issue 4 April 2021 | ISSN: 2320-2882
IJCRT2104421 International Journal of Creative Research Thoughts (IJCRT) www.ijcrt.org 3395
BIBLIOGRAPHY
1. Philip Kotler and Kevin Keller – “Marketing Management” 15th Edition, Pearson, 2016.
2. Ken Black – “ Business Statistics – For Contemporary Decision Making” 5th Edition, Wiley India
2006-07
3. Dr. C. P. Gujar and Saif Ul Haque(October – 2019) “A STUDY ONCUSTOMER SATISFACTION
TOWARDS HERO BIKES WITH REFERENCE TO JABALPUR DISTRICT, M.P.” .Journal of
Business Research.
4. Debasis Tripathy & Dr. Ronald Mani(August-2014) have carried out research study on “ A Study on
Consumer Satisfaction of Two Wheeler Bikes” in the city of Allahabad, Journal of Business Research.
5. M. Arutselvi (2011), “A study on customer satisfaction towards TVS Bikes”, International Journal of
Management Research and Review, Vol-1, Article No-16/250-265.
6. DugganiYuvaraju and DurgaRao (2014), “Customer Satisfaction towards Honda Two wheelers: A
Case Study in Tirupati”, Journal of Business and Management, Vol.16, Issue 5, Vol. I, pp. 65 – 74.
7. Lakshmi periya (2016),”Customer satisfaction Towards Honda two wheeler- A study in Palakkad
district, Kerala. International conference on “Research avenues in Social Science” Organize by
SNGC,Coimbatore.
8. Mukesh Kumar, SRM University, 2010 in “Customer Preference Regarding Hero Honda Bikes in
India”
9. Suresh Vadde, JIMS8M: The Journal of Indian Management & Strategy 17 (3), 39-45, 2012 in
“Customer satisfaction towards two-wheeler automobiles: An empirical study”
10. Spreng and Mackoy (1996)“Addressing the relationship between service quality and customer
satisfaction.
11. D. Vijyalakshami et al. (2015) have carried out their study on customer satisfaction with regards to
different brands of two wheelers.
WEBILIOGRAPHY
1. https://www-questionpro-com.cdn.ampproject.org
2. m.heromotocorp.com
3. https://www.globenewswire.com
4. Www.allsubjectjournal.com
5. Http://www.granthaalayah.com