Structure of Human Tripeptidyl Peptidase II determined by a Hybrid ...
111
TECHNISCHE UNIVERSITÄT MÜNCHEN Max-Planck-Institut für Biochemie Abteilung für Molekulare Strukturbiologie Structure of Human Tripeptidyl Peptidase II determined by a Hybrid Approach Anne-Marie Schönegge Vollständiger Abdruck der von der Fakultät für Chemie der Technischen Universität München zur Erlangung des akademischen Grades eines Doktors der Naturwissenschaften genehmigten Dissertation. Vorsitzender: Univ.-Prof. Dr. J. Buchner Prüfer der Dissertation: 1. Hon.-Prof. Dr. W. Baumeister 2. Univ.-Prof. Dr. S. Weinkauf Die Dissertation wurde am 12.01.2012 bei der Technischen Universität München eingereicht und durch die Fakultät für Chemie am 28.03.2012 angenommen.
Transcript of Structure of Human Tripeptidyl Peptidase II determined by a Hybrid ...
TECHNISCHE UNIVERSITÄT MÜNCHEN
Max-Planck-Institut für Biochemie
Abteilung für Molekulare Strukturbiologie
Structure of Human Tripeptidyl Peptidase II determined by
a Hybrid Approach
Anne-Marie Schönegge
Vollständiger Abdruck der von der Fakultät für Chemie der Technischen
Universität München zur Erlangung des akademischen Grades eines
Doktors der Naturwissenschaften genehmigten Dissertation.
Vorsitzender: Univ.-Prof. Dr. J. Buchner
Prüfer der Dissertation:
1. Hon.-Prof. Dr. W. Baumeister
2. Univ.-Prof. Dr. S. Weinkauf
Die Dissertation wurde am 12.01.2012 bei der Technischen Universität
München eingereicht und durch die Fakultät für Chemie am 28.03.2012
angenommen.

Zusammenfassung
i
Tripeptidyl peptidase II (TPPII) ist eine Serinprotease der Subtilisin-Familie. Sie bildet den
größten eukaryotischen Proteasekomplex, und seine Aktivität steigt während der
Assemblierung. Es wurde postuliert, dass während dieser Aktivierung ein Segment von ‚Loop
L2‘ aus der Substratbindestelle herausbewegt wird und damit das Serin des aktiven
Zentrums in eine katalytisch-aktive Konformation gebracht wird. TPPII spielt eine
bedeutende Rolle in verschiedenen physiologischen Prozessen, unter anderem beim
zytosolischen Proteinabbau, bei der Antigen-Prozessierung, bei der Kontrolle des
Sättigungsgefühls, bei der Fettspeicherung, bei Apoptose, beim Zellwachstum, und bei der
Reparatur von DNA-Schäden. Zudem ist TPPII an einigen Krankheiten, wie beispielsweise
Muskelschwund, Fettleibigkeit und Krebs, beteiligt. Jedoch ist bis jetzt noch nicht bekannt,
welche Rolle TPPII in diesen Prozessen spielt.
In der vorliegenden Arbeit wurde die Struktur von humanem TPPII (HsTPPII) mittels
Elektronenmikroskopie und Einzelpartikelanalyse zu Subnanometer-Auflösung bestimmt.
TPPII besteht aus zwei Strängen, die eine spindelförmige Struktur bilden, welche ein
komplexes System innerer Höhlen umschließt. HsTPPII-Partikel zeigen einen gewissen
Polymorphismus; es treten Komplexe mit neun und mit acht Dimeren pro Strang auf. Um die
Architektur und Funktionsweise von TPPII genauer zu verstehen, wurde ein pseudo-
atomares Modell der Spindel durch molekular-dynamisches flexibles Einpassen eines
Homologie-Modells der HsTPPII-Dimere erstellt. Die Analyse dieses Hybrid-Modells zeigte
Konformationsunterschiede zwischen den Dimeren, die innerhalb eines Stranges liegen, und
den Dimeren, die am Ende eines Stranges liegen. Die dabei gefundenen
Positionsveränderungen einiger α-Helices könnten einerseits die Feinjustierung der
Konformation des Eingangsbereiches zum Kavitätensystem einleiten, und andererseits als
Sensor des Assemblierungszustandes der Dimere dienen und damit deren Aktivierung
auslösen.
Die systematische Mutationsanalyse von ‚Loop L2‘ (ein Segment an dessen C-terminalem
Ende das Serin des aktiven Zentrums liegt), ‚Loop L1‘ (ein Segment in der Nähe von ‚Loop
L2‘) und von deren postulierte Interaktionsbereiche wies die Bedeutung dieser Bereiche für
die Assemblierung und Aktivierung von TPPII nach. Die Ergebnisse zeigten, dass ‚Loop L1‘
eine größere Rolle bei der Assemblierung des Komplexes spielt, während ‚Loop L2‘ von
größerer Bedeutung für die Aktivierung von TPPII ist.
Diese Arbeit unterstreicht die Bedeutung der Dimer-Dimer Grenzfläche für Struktur und
Funktionsweise von TPPII: Kontakte zwischen den Dimeren bestimmen die Morphologie des
Spindelkomplexes und lösen vermutlich Konformationsänderungen im katalytischen Zentrum
und im Eingangsbereich des Kavitätensystems aus. Die hier präsentierte Hybridstruktur von
HsTPPII-Spindeln könnte als Basis für Untersuchungen der zellulären Funktion von TPPII
dienen.

Summary
ii
Tripeptidyl peptidase II (TPPII) is a serine protease of the subtilisin family. It forms the largest
known eukaryotic protease complex, the activity of which increases upon assembly. It has
been proposed that during TPPII activation a segment of loop L2 is removed from the active-
site cleft and concomitantly the active-site serine is positioned in a catalytically active
conformation. TPPII plays a critical role in various biological processes such as cytosolic
protein degradation, antigen processing, satiety control, fat storage, apoptosis, cell
replication, or DNA damage repair, and it is involved in diseases like muscle wasting,
obesity, and in cancer. However, the exact function of TPPII in these processes awaits
further clarification.
In the present study, the structure of human TPPII (HsTPPII) has been determined to
subnanometer resolution by cryo electron microscopy and single-particle analysis. TPPII is
built of two strands forming a spindle-shaped structure harboring a complex system of inner
cavities. HsTPPII particles exhibit some polymorphism resulting in complexes consisting of
nine or of eight dimers per strand. To obtain deeper insights into the architecture and
function of TPPII, a pseudo-atomic model of the spindle was created by using a comparative
model of HsTPPII dimers and molecular dynamics flexible fitting. The analysis of the
resulting hybrid structure pointed at conformational differences between in-strand and end-
of-strand dimers. The change in position detected for several α-helices might on the one
hand induce conformational fine-tuning of the entrance region to the cavity system and on
the other hand serves as sensor for the assembly state of dimers and trigger their activation.
A systematic mutational analysis of loop L2 (which is connected to the active-site serine),
loop L1 (which is proximal to loop L2), and their proposed interaction sites demonstrated the
importance of these regions for the assembly and activation of the TPPII complex. The data
suggest that loop L1 plays a major role in the assembly of the complex, whereas loop L2 is of
greater significance for the activation of TPPII.
The work presented here highlights the importance of the dimer-dimer interface for structure
and functionality of TPPII: Contacts between dimers determine the morphology of the spindle
complex and supposedly trigger conformational changes involving the catalytic center and
the entrance to the cavity system. The hybrid structure of HsTPPII spindles could be the
basis for studies that shed light on the cellular functions of TPPII.

Table of Content
iii
1 Introduction .................................................................................................................. 1
1.1 Peptidases ............................................................................................................................... 1
1.2 Principle of Self-compartmentalization .................................................................................... 3
1.3 Tripeptidyl Peptidase II ............................................................................................................ 5
1.3.1 Biological Functions ........................................................................................................................... 5
1.3.1.1 Protein Turnover ....................................................................................................................... 5
1.3.1.2 Antigen Processing ................................................................................................................... 6
1.3.1.3 Cellular Pathways ..................................................................................................................... 7
1.3.2 Localization and Biochemical Characterization .................................................................................. 9
1.3.3 Domain Structure ............................................................................................................................. 10
1.3.4 The Spindle Complex ...................................................................................................................... 11
1.3.5 Activation Mechanism ...................................................................................................................... 13
1.4 Aim of this work ..................................................................................................................... 16
2 Results .........................................................................................................................17
2.1 Structure Determination of HsTPPII ...................................................................................... 17
2.1.1 Purification and Electron Microscopy of HsTPPII Spindles .............................................................. 17
2.1.2 3D-Structure of HsTPPII .................................................................................................................. 19
2.1.3 Hybrid Structure of HsTPPII ............................................................................................................. 20
2.1.4 The DH-Insert at the Dimer-Dimer Interface .................................................................................... 22
2.1.5 Conformations of In-strand vs. End-of-strand Dimers ...................................................................... 24
2.2 Length Variations of TPPII spindles ...................................................................................... 26
2.2.1 Polymorphism of HsTPPII spindles .................................................................................................. 26
2.2.2 Helix Parameters of TPPII Spindles ................................................................................................. 28
2.2.3 Strand-Strand and Dimer-Dimer Interfaces...................................................................................... 29
2.3 Structural Elements in TPPII Activation ................................................................................. 34
2.3.1 DmTPPII-Subtilisin Chimeras .......................................................................................................... 34
2.3.2 Helix H13 ......................................................................................................................................... 35
2.3.3 Loop L2 ............................................................................................................................................ 37
2.3.4 Loop L1 ............................................................................................................................................ 38
2.4 Mutational Analysis of the Dimer-Dimer Interactions ............................................................ 41
2.4.1 Loop L2 ............................................................................................................................................ 41
2.4.2 Loop L1 ............................................................................................................................................ 45
2.4.3 Putative Interaction Regions of loop L2 and loop L1 ........................................................................ 48
2.5 Stabilization of Tetramers by Crosslinking ............................................................................ 52
2.5.1 Bpa in Loop L2 ................................................................................................................................. 52
2.5.2 Bpa at the Dimer-Dimer Interface .................................................................................................... 53
3 Discussion ...................................................................................................................56
3.1 Activation of TPPII ................................................................................................................. 56
3.2 Assembly as Trigger for Activation ........................................................................................ 57
3.3 The DH-Insert as Sensor of the TPPII Assembly State......................................................... 58
3.4 Functional Relevance of the Spindle Complex ...................................................................... 59
3.5 Outlook .................................................................................................................................. 60
3.5.1 Crystal Structure of Tetramers ......................................................................................................... 60
Table of Content
iv
3.5.2 Cellular Localization ......................................................................................................................... 60
3.5.3 Interaction partners .......................................................................................................................... 61
3.5.4 Heterologous Expression in S. pombe ............................................................................................. 62
4 Experimental Procedures ...........................................................................................63
4.1 Methods ................................................................................................................................. 63
4.1.1 DNA-Methods .................................................................................................................................. 63
4.1.1.1 Mutagenesis ............................................................................................................................ 63
4.1.1.2 Heat Shock Transformation of E. coli ...................................................................................... 63
4.1.1.3 Isolation of Plasmid DNA from E. coli...................................................................................... 64
4.1.1.4 Agarose Gel Electrophoresis .................................................................................................. 64
4.1.1.5 Sequencing of Plasmid DNA ................................................................................................... 64
4.1.2 Proteinbiochemistry ......................................................................................................................... 64
4.1.2.1 Large Scale Recombinant Expression of TPPII ...................................................................... 64
4.1.2.2 Small Scale Recombinant Expression of TPPII ...................................................................... 64
4.1.2.3 Large Scale Purification of HsTPPII ........................................................................................ 65
4.1.2.4 Small Scale Purification of TPPII ............................................................................................ 65
4.1.2.5 Activity Measurement .............................................................................................................. 65
4.1.2.6 SDS-PAGE ............................................................................................................................. 66
4.1.2.7 Western Blotting ...................................................................................................................... 66
4.1.2.8 Determination of Specific Activity ............................................................................................ 66
4.1.2.9 Bpa-Incorporation ................................................................................................................... 67
4.1.2.10 Bpa-Crosslinking ..................................................................................................................... 67
4.1.3 Electron microscopy ........................................................................................................................ 67
4.1.3.1 Negative-stain EM ................................................................................................................... 67
4.1.3.2 Cryo-EM .................................................................................................................................. 67
4.1.3.3 Image Processing ................................................................................................................... 68
4.1.3.4 Determination of Helix Parameters ......................................................................................... 68
4.1.3.5 Comparative Modeling and Flexible Fitting ............................................................................. 69
4.1.3.6 Determination of Interaction Areas and Steric Clashes ........................................................... 69
4.2 Materials ................................................................................................................................ 70
4.2.1 Chemicals ........................................................................................................................................ 70
4.2.2 Buffers and Solutions ....................................................................................................................... 71
4.2.3 Media ............................................................................................................................................... 72
4.2.4 Vectors............................................................................................................................................. 73
4.2.5 Bacteria............................................................................................................................................ 74
4.2.6 Kit-systems ...................................................................................................................................... 74
4.2.7 Enzymes .......................................................................................................................................... 75
4.2.8 Standards ........................................................................................................................................ 75
4.2.9 Columns........................................................................................................................................... 75
4.3 Primer .................................................................................................................................... 76
4.4 Settings for the 3D-reconstructions ....................................................................................... 82
4.4.1 All particles ...................................................................................................................................... 82
4.4.2 HsTPPII9 .......................................................................................................................................... 84
4.4.3 HsTPPII8 .......................................................................................................................................... 85

Table of Content
v
5 References ...................................................................................................................86
6 Abbreviations ..............................................................................................................94
7 Acknowledgements .....................................................................................................96
8 Publication List............................................................................................................97

Figure Index
vi
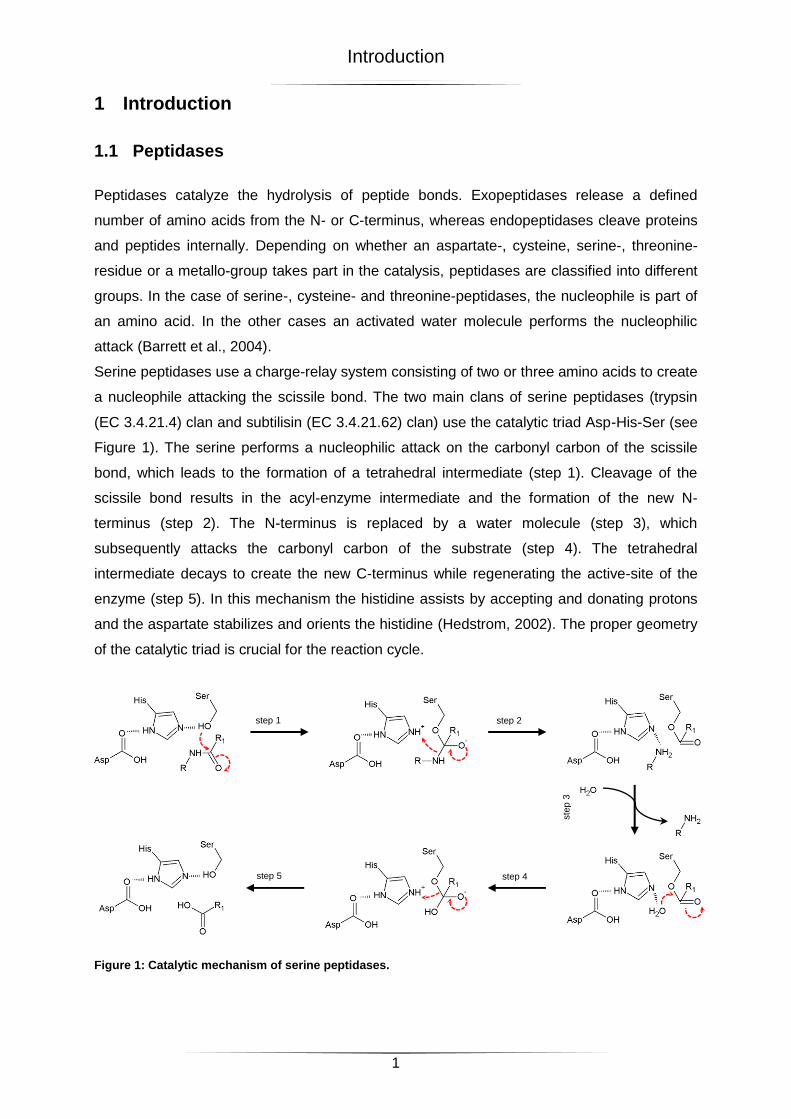
Figure 1: Catalytic mechanism of serine peptidases. ............................................................. 1
Figure 2: Activation Mechanism of Subtilisin. ......................................................................... 2
Figure 3: Structures of self-compartmentalizing proteases. ................................................... 4
Figure 4: Schematic overview of TPPII functions. .................................................................. 5
Figure 5: Crystal structure of the DmTPPII dimer .................................................................11
Figure 6: Studies of the quaternary structure of TPPII ..........................................................12
Figure 7: The spindle complex of DmTPPII ..........................................................................13
Figure 8: Specific activity and active-site conformation of TPPII ...........................................14
Figure 9: Proposed activation mechanism of TPPII ..............................................................15
Figure 10: Purification of recombinant HsTPPII spindles ......................................................18
Figure 11: Cryo-EM and 3D-reconstruction of HsTPPII spindles ..........................................19
Figure 12: 3D-reconstruction of HsTPPII ..............................................................................20
Figure 13: Hybrid structure of HsTPPII .................................................................................21
Figure 14: Discerning α-helices in the hybrid model .............................................................22
Figure 15: Sequence alignment of regions proximal to the DH-insert ....................................23
Figure 16: Domain topology of the dimer-dimer interface ......................................................23
Figure 17: Conformations of in-strand and end-of-strand dimers ..........................................25
Figure 18: Polymorphism of TPPII spindles ..........................................................................26
Figure 19: Separation and reconstruction of HsTPPII spindles .............................................27
Figure 20: Positions of dimers in TPPII spindles ...................................................................29
Figure 21: Strand-strand interaction areas ............................................................................31
Figure 22: Dimer-dimer interaction areas ..............................................................................32
Figure 23: Residues at the dimer-dimer interface of short and long HsTPPII spindles ..........33
Figure 24: DmTPPII-subtilisin chimeras ................................................................................35
Figure 25: Conformation of helix H13 ...................................................................................36
Figure 26: Sequence alignment in the region of loop L2 .......................................................37
Figure 27: Loop L2 at the dimer-dimer interface ...................................................................38
Figure 28: Sequence alignment in the region of loop L1 .......................................................39
Figure 29: Loop L1 at the dimer-dimer interface ...................................................................40
Figure 30: L2-DmTPPII mutants ...........................................................................................42
Figure 31: Electron micrographs of L2-DmTPPII mutants .....................................................43
Figure 32: L2-HsTPPII mutants ............................................................................................44
Figure 33: Electron micrographs of L2-HsTPPII mutants ......................................................45
Figure 34: ΔL1-DmTPPII mutant ..........................................................................................46
Figure 35: L1-HsTPPII mutants ............................................................................................47
Figure 36: Electron micrographs of L1-HsTPPII mutants ......................................................48
Figure 37: Mutations in the potential loop interaction region of DmTPPII ..............................49
Figure Index
vii
Figure 38: Mutations in the potential loop interaction regions of HsTPPII .............................51
Figure 39: L2-Bpa DmTPPII Mutants ....................................................................................53
Figure 40: Bpa at the dimer-dimer interface of DmTPPII Mutants .........................................54
Figure 41: Photo-crosslinking of F602Bpa in DmTPPII .........................................................55

Table Index
vii
Table 1: Helix parameters of dimers in TPPII spindles ..........................................................28
Table 2: Strand-strand interaction areas ...............................................................................30
Table 3: Dimer-dimer interaction areas .................................................................................31

Introduction
1
1 Introduction
1.1 Peptidases
Peptidases catalyze the hydrolysis of peptide bonds. Exopeptidases release a defined
number of amino acids from the N- or C-terminus, whereas endopeptidases cleave proteins
and peptides internally. Depending on whether an aspartate-, cysteine, serine-, threonine-
residue or a metallo-group takes part in the catalysis, peptidases are classified into different
groups. In the case of serine-, cysteine- and threonine-peptidases, the nucleophile is part of
an amino acid. In the other cases an activated water molecule performs the nucleophilic
attack (Barrett et al., 2004).
Serine peptidases use a charge-relay system consisting of two or three amino acids to create
a nucleophile attacking the scissile bond. The two main clans of serine peptidases (trypsin
(EC 3.4.21.4) clan and subtilisin (EC 3.4.21.62) clan) use the catalytic triad Asp-His-Ser (see
Figure 1). The serine performs a nucleophilic attack on the carbonyl carbon of the scissile
bond, which leads to the formation of a tetrahedral intermediate (step 1). Cleavage of the
scissile bond results in the acyl-enzyme intermediate and the formation of the new N-
terminus (step 2). The N-terminus is replaced by a water molecule (step 3), which
subsequently attacks the carbonyl carbon of the substrate (step 4). The tetrahedral
intermediate decays to create the new C-terminus while regenerating the active-site of the
enzyme (step 5). In this mechanism the histidine assists by accepting and donating protons
and the aspartate stabilizes and orients the histidine (Hedstrom, 2002). The proper geometry
of the catalytic triad is crucial for the reaction cycle.
Figure 1: Catalytic mechanism of serine peptidases.
step 1 step 2
step 5 step 4
ste
p 3
Introduction
2
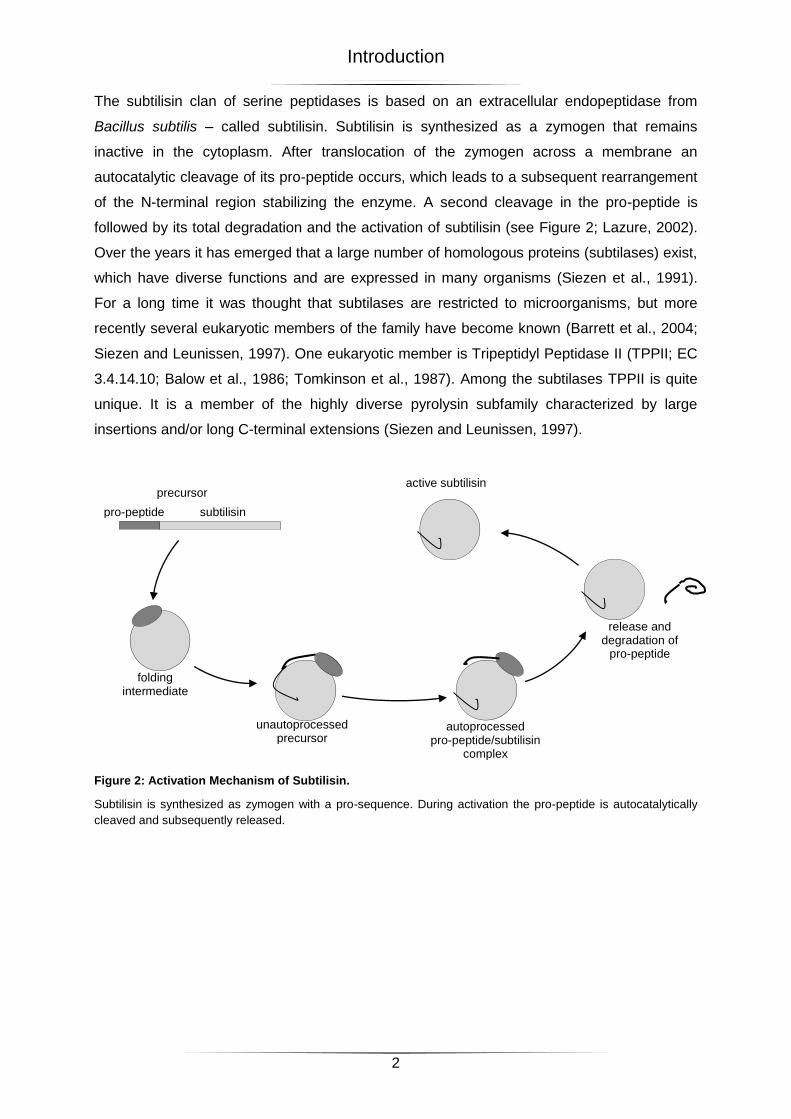
The subtilisin clan of serine peptidases is based on an extracellular endopeptidase from
Bacillus subtilis – called subtilisin. Subtilisin is synthesized as a zymogen that remains
inactive in the cytoplasm. After translocation of the zymogen across a membrane an
autocatalytic cleavage of its pro-peptide occurs, which leads to a subsequent rearrangement
of the N-terminal region stabilizing the enzyme. A second cleavage in the pro-peptide is
followed by its total degradation and the activation of subtilisin (see Figure 2; Lazure, 2002).
Over the years it has emerged that a large number of homologous proteins (subtilases) exist,
which have diverse functions and are expressed in many organisms (Siezen et al., 1991).
For a long time it was thought that subtilases are restricted to microorganisms, but more
recently several eukaryotic members of the family have become known (Barrett et al., 2004;
Siezen and Leunissen, 1997). One eukaryotic member is Tripeptidyl Peptidase II (TPPII; EC
3.4.14.10; Balow et al., 1986; Tomkinson et al., 1987). Among the subtilases TPPII is quite
unique. It is a member of the highly diverse pyrolysin subfamily characterized by large
insertions and/or long C-terminal extensions (Siezen and Leunissen, 1997).
Figure 2: Activation Mechanism of Subtilisin.
Subtilisin is synthesized as zymogen with a pro-sequence. During activation the pro-peptide is autocatalytically
cleaved and subsequently released.
pro-peptide subtilisin
precursor
folding intermediate
unautoprocessed precursor
autoprocessed pro-peptide/subtilisin
complex
release and degradation of
pro-peptide
active subtilisin
Introduction
3
1.2 Principle of Self-compartmentalization
Temporal and spatial control of cellular proteolysis is vital for every cell. Temporal control can
be achieved by expressing peptidases as inactive zymogens and tightly controlling their
activation or by regulating the interaction of peptidases with inhibitory proteins. Spatial
control can occur in two ways: either the active enzyme is segregated in special
compartments, e.g. lysosomes, or the enzyme is localized in the cytosol but its active-sites
are sequestered. The principle of active-site sequestration within a complex is called self-
compartmentalization and has evolved several times independently (Baumeister et al., 1998;
Lupas et al., 1997).
The prime example for self-compartmentalization is the 26S proteasome. This 2.5 MDa
complex is composed of the 20S core particle and one or two regulatory 19S particles. The
19S particles consist of 18 different subunits and they are responsible for the recognition,
deubiquitination and unfolding of substrates. Moreover, their interactions with the α-subunits
of the core complex regulate the entry to the proteolytic chamber (Glickman and
Ciechanover, 2002; Glickman et al., 1998; Yu et al., 2010). The 20S particle is composed of
four stacked heptameric rings. Two catalytic active β-rings enclose the catalytic chamber and
are sandwiched by two α-rings. At the α-β-interfaces two antechambers reside (see Figure
3A; Baumeister et al., 1998; Lupas et al., 1997; Walz et al., 1998; Yoshimura et al., 1993).
The assembly of the proteasome triggers its activation: After assembly of two half-
proteasomes an inhibitory pro-peptide is autocatalytically removed from the β-subunit (Chen
and Hochstrasser, 1996; Witt et al., 2006).
A similar architecture is found for the bacterial protease ClpP. ClpP forms a barrel-shaped
complex of two heptameric rings that enclose the catalytic chamber, which can be assessed
through the central pores of the rings (see Figure 3B; Kessel et al., 1995; Wang et al., 1997).
Entry to the catalytic chamber is regulated via the ATPase ClpA, which is also responsible for
substrate unfolding (Kessel et al., 1995; Yao and Cohen, 2002). Despite the structural
similarity between ClpAP and the 26S proteasome, they are neither related at the level of
sequence nor structure (Baumeister et al., 1998).
Several archaeal proteases are self-compartmentalized. Examples are the peptidases tricorn
(TRI) and tetrahedral protease (TET), which degrade peptides downstream of the
proteasome (Borissenko and Groll, 2005). Both have been observed in different high
oligomeric states (Schoehn et al., 2006; Walz et al., 1997). TRI from Thermoplasma
acidophilum is a hexamer consisting of three dimers when expressed in E. coli. In
Thermoplasma, TRI forms a higher oligomer of twenty hexamers assembled into an
icosahedral capsid (see Figure 3C; Brandstetter et al., 2001; Tamura et al., 1996; Walz et al.,
1997). TET from Pyrococcus horikoshii exists either as a tetrahedron built of twelve subunits
Introduction
4
or as an octahedron consisting of 24 subunits. Both complexes enclose a catalytic chamber
the entry of which is provided by several channels (see Figure 3D; Borissenko and Groll,
2005; Schoehn et al., 2006). For these archaeal proteases a relationship between assembly
and activity has been described: in the case of TRI, D936 of one subunit reaches into the P1
pocket of the next subunit, and there it acts as a switch between P1 specificity for basic and
for hydrophobic residues (Brandstetter et al., 2002). Disassembled dimers of TET cleave
fluorogenic substrates with approximately 40-50% lower activity than its oligomeric form
(Borissenko and Groll, 2005).
In Eukarya, the function of TRI and TET is presumably performed by TPPII. TPPII exhibits a
unique architecture that leads to self-compartmentalization. It forms a spindle-shaped
complex consisting of two twisted strands. Each strand harbors a cavity system consisting of
a longitudinal channel from which, at every dimer-dimer interface, catalytic chambers branch
off. This network of channels and chambers leads to the sequestration of multiple active-sites
along a strand (Chuang et al., 2010; Rockel et al., 2005).
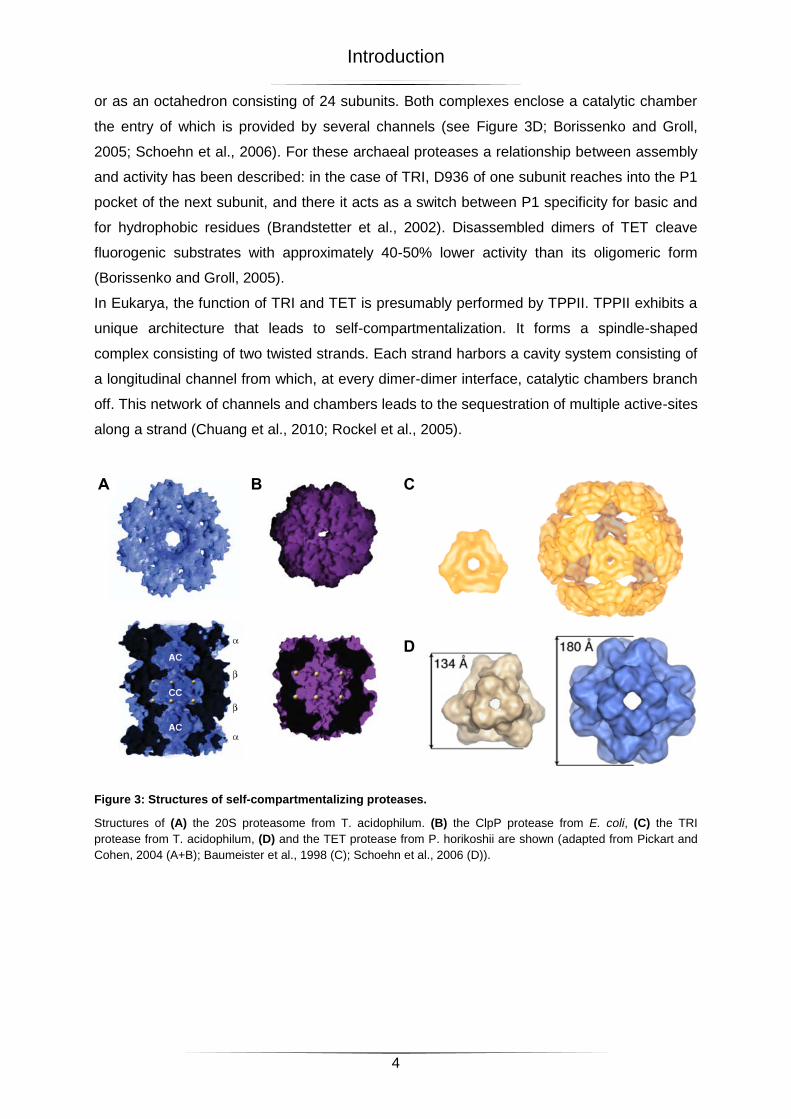
Figure 3: Structures of self-compartmentalizing proteases.
Structures of (A) the 20S proteasome from T. acidophilum. (B) the ClpP protease from E. coli, (C) the TRI
protease from T. acidophilum, (D) and the TET protease from P. horikoshii are shown (adapted from Pickart and
Cohen, 2004 (A+B); Baumeister et al., 1998 (C); Schoehn et al., 2006 (D)).
A B C
D
Introduction
5
1.3 Tripeptidyl Peptidase II
1.3.1 Biological Functions
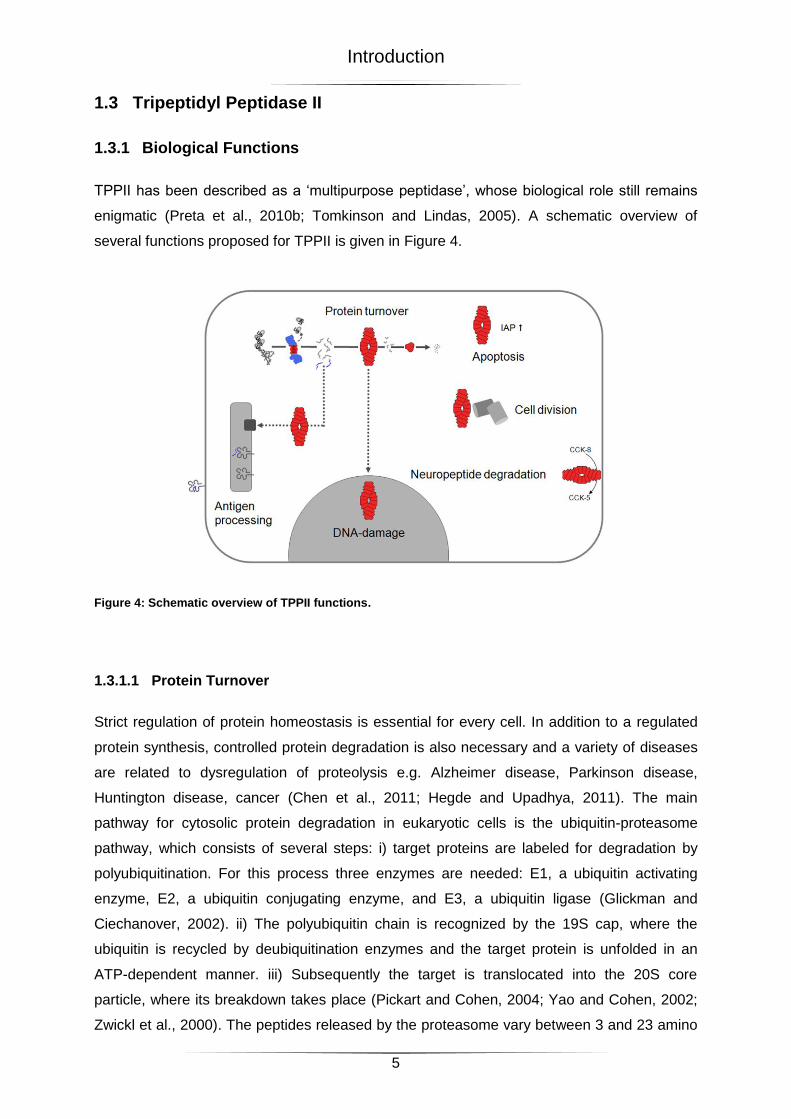
TPPII has been described as a ‘multipurpose peptidase’, whose biological role still remains
enigmatic (Preta et al., 2010b; Tomkinson and Lindas, 2005). A schematic overview of
several functions proposed for TPPII is given in Figure 4.
Figure 4: Schematic overview of TPPII functions.
1.3.1.1 Protein Turnover
Strict regulation of protein homeostasis is essential for every cell. In addition to a regulated
protein synthesis, controlled protein degradation is also necessary and a variety of diseases
are related to dysregulation of proteolysis e.g. Alzheimer disease, Parkinson disease,
Huntington disease, cancer (Chen et al., 2011; Hegde and Upadhya, 2011). The main
pathway for cytosolic protein degradation in eukaryotic cells is the ubiquitin-proteasome
pathway, which consists of several steps: i) target proteins are labeled for degradation by
polyubiquitination. For this process three enzymes are needed: E1, a ubiquitin activating
enzyme, E2, a ubiquitin conjugating enzyme, and E3, a ubiquitin ligase (Glickman and
Ciechanover, 2002). ii) The polyubiquitin chain is recognized by the 19S cap, where the
ubiquitin is recycled by deubiquitination enzymes and the target protein is unfolded in an
ATP-dependent manner. iii) Subsequently the target is translocated into the 20S core
particle, where its breakdown takes place (Pickart and Cohen, 2004; Yao and Cohen, 2002;
Zwickl et al., 2000). The peptides released by the proteasome vary between 3 and 23 amino
Introduction
6
acids in length and are on average 7 to 9 amino acids long (Kisselev et al., 1999; Nussbaum
et al., 1998). Further degradation of the peptides is performed by Leucin-Aminopeptidase
(LAP; Beninga et al., 1998), Thimet-Oligopeptidase (TOP; York et al., 2003), Bleomycin-
Hydrolase (BH; Stoltze et al., 2000) and Tripeptidyl Peptidase II (TPPII; Tomkinson, 1999).
However, the processing of peptides longer than 15 amino acids appears to depend entirely
on TPPII (Reits et al., 2004). Subsequently, the resulting peptides are broken up into amino
acids by aminopeptidases e.g. dipeptidylpeptidases (Baumeister et al., 1998; Tomkinson,
1999).
Inhibition of the proteasome is lethal for most cells. Since elevated levels of TPPII have been
found in cells adapted to proteasome inhibition (Duensing et al., 2010; Geier et al., 1999;
Glas et al., 1998; Wang et al., 2000), it was proposed that TPPII could take over some tasks
of the proteasome (Geier et al., 1999; Wang et al., 2000). However, most inhibitors of the
proteasome do not inhibit the proteasome completely, but merely reduce its activity (Gavioli
et al., 2001; Princiotta et al., 2001; Wang et al., 2000). In addition, cells are thought to exhibit
feedback loops to cope with reduced proteasome activity. These feedback loops include the
upregulation of the expression and assembly of proteasome subunits (Meiners et al., 2003;
Mitsiades et al., 2002). Moreover, the accumulation of polyubiquitinated proteins caused by
proteasome inhibition might be avoided by residual proteasome activity and/or other
proteases. For instance, an AAF-CMK-sensitive activity, which could not be attributed to
TPPII, was demonstrated to take part in the removal of polyubiquitinated proteins (Villasevil
et al., 2010). Hence, it is under debate, whether high levels of TPPII suffice to ensure cell
survival in the absence of proteasome activity (Princiotta et al., 2001; Villasevil et al., 2010).
1.3.1.2 Antigen Processing
In addition to perceiving and clearing pathogen invasions, the immune system keeps the
body under surveillance for malignant, damaged, infected, or dead cells. To protect an
organism, the immune system needs to distinguish ‘self’ from ‘non-self’. In vertebrates, the
constant display of intracellular epitopes on the cell surface by the major histocompatibility
complex (MHC) class I is the basis for the recognition of ‘self’ and ‘non-self’. Detection of a
“non-self” epitope by CD8+ cytotoxic T-cell results in the induction of apoptosis in the
respective cell.
In general, MHC class I epitopes are produced during regular cytosolic protein degradation.
Approximately 10% of the peptides produced by the proteasome are 8 to 10 amino acids
long and can be loaded on the MHC class I directly. An additional 10% of the peptides are
too long for direct loading (Kisselev et al., 1999; van Endert, 2008). Most of these peptides
already possess the correct C-terminus, and N-terminal trimming adjusts their length for
Introduction
7
MHC class I binding. This N-terminal trimming either occurs in the endoplasmic reticulum
(ER) by the ER aminopeptidase associated with antigen processing (ERAP; Saric et al.,
2002; Shastri et al., 2005; York et al., 2002) or in the cytosol by various aminopeptidases.
Several cytosolic aminopeptidases have been reported to be involved in antigen processing,
such as Leucin-Aminopeptidase (LAP; Beninga et al., 1998), Bleomycin-Hydrolase (BH;
Stoltze et al., 2000), Puromycin-sensitive Aminopeptidase (PSA; Stoltze et al., 2000; York et
al., 2003), Thimet-Oligipeptidase (TOP; Saric et al., 2002; York et al., 2003) and also TPPII
(Geier et al., 1999; Reits et al., 2004; Seifert et al., 2003).
However, the role of TPPII in antigen processing is discussed controversially. Despite
several reports about the ability of TPPII to generate epitopes (RU134-42-epitop, Levy et al.,
2002; SIINFEKL, York et al., 2006; gp100, Burri et al., 2002), the majority of reports suggest
a destructive effect of TPPII on epitopes (see van Endert, 2011 for review).
1.3.1.3 Cellular Pathways
Functional studies of mammalian TPPII hint at roles of the peptidase in a variety of
metabolic, cancer-related and pathology-related pathways. Over-expression of TPPII is
thought to have several consequences for cells: i) increased proliferation rate and enhanced
growth under starvation conditions (Hong et al., 2003; Stavropoulou et al., 2006); ii)
chromosomal instability due to multipolar mitosis with spindle abnormalities (Stavropoulou et
al., 2006; Stavropoulou et al., 2005); iii) evasion of apoptosis as a result of overexpression
and slow degradation of anti-apoptotic proteins (c-IAP1, c-IAP2, Bl-2, Bcl-XL, and XIAP;
Hong et al., 2003; Stavropoulou et al., 2006). In combination, these effects allude to a
possible association of TPPII to cancer promotion. An involvement of TPPII in tumor
progression has already been proposed in the case of Burkitt’s lymphoma (BL). These B-cell
tumors are characterized by the overexpression of c-myc, reduced adherence of the cells
and low amounts of B-cell markers and MHC class I molecules on the cell surface (Klein,
1983; Masucci, 2004; Rowe et al., 1987). Protein degradation in these cells seems to be
independent of the proteasome and is sustained by the overexpression of both
deubiquitinating enzymes and TPPII (Gavioli et al., 2001). Consequently, it has been
suggested that a combination of γ-irradiation and selective inhibition of TPPII might be a
promising tumor therapy for Burkitt’s lymphoma (Duensing et al., 2010).
A differential, tissue-specific regulation of cytosolic protein degradation has also been
reported to occur during sepsis – a systemic inflammatory state that is associated with
muscle wasting (Hasselgren and Fischer, 2001; Tiao et al., 1994): an increase of TPPII
expression level was observed in white muscle, whereas in liver a decrease of TPPII
Introduction
8
expression level was found. Thus, the increased protein degradation in white muscle cells is
possibly linked to TPPII upregulation (Wray et al., 2002).
TPPII activity has also been shown to modulate the infectivity of pathogens. Cytosolic protein
degradation by the ubiquitin-proteasome pathway is supposedly essential for the intracellular
replication of coxsackiviruses, which can cause a variety of illnesses ranging from mild
gastrointestinal distress to myocarditis. Inhibition of the proteasome leads to a severe
decrease in viral infectivity (Gao et al., 2008). Infectivity is further reduced when a
combination of proteasome- and TPPII-inhibitors is applied (Zhang et al., 2011). Apparently,
the virus not only employs the proteasome for its replication but also requires downstream
components of the proteasome-ubiquitin pathway.
TPPII might also influence apoptosis as shown during Shigella infection. Shigella flexneri
infections of humans can cause tissue destruction in the colon resulting in dysentery.
Clearance of the infection is predominantly mediated by macrophages. As a survival strategy
Shigella evolved an escape mechanism from the phagolysosome that involves caspase-1-
dependent apoptosis of macrophages. TPPII-dependency of this essential mechanism of
pathogen survival was suggested in in vitro experiments (Hilbi et al., 1998; Hilbi et al., 2000).
Further indications for the involvement of TPPII in apoptotic processes were obtained
through the analysis of TPPII KO-mice. These mice displayed a CD8+ T cell- and fibroblast-
specific induction of cell death, which led to an immunosenescene-like phenotype and
decreased life span (Huai et al., 2008). However, mice with a gene-trap disrupting the tpp2
gene, which resulted in a 90%-reduced TPPII level, showed no phenotype (Kawahara et al.,
2009).
Studies using γ-radiation and DNA-damaging agents in a murine cell culture model provided
additional evidence for a role of TPPII in cell death- and DNA-damage-related processes.
Initial studies proposed a translocation of TPPII into the nucleus and a TPPII-dependent
stabilization of p53 (Preta et al., 2010a; Preta et al., 2009). However, this is controversially
discussed as only the general participation of TPPII in DNA-damage response and cell death
but not the translocation into the nucleus and the p53-stabilization could be confirmed (Firat
et al., 2009).
Rose et al. identified a membrane-bound version of TPPII, which degrads the satiety
hormone CCK8. Inhibition of TPPII reduced the food intake of both rats and mice (Rose et
al., 1996). Additionally, it was reported that TPPII not only influences food intake but can also
regulate fat storage in both C. elegans and mice. Fat storage regulation by TPPII seems to
be independent of its proteolytic activity (McKay et al., 2007). The potential connection with
satiety makes TPPII an interesting target for the treatment of obesity.
Introduction
9
1.3.2 Localization and Biochemical Characterization
Most eukarya express TPPII and it has been isolated from Schizosaccharomyces pombe
(Osmulski and Gaczynska, 1998), Rattus norvegicus (Balow et al., 1983; Balow et al., 1986;
Rose et al., 1996), Mus musculus (Bermingham et al., 1996), Drosophila melanogaster
(Renn et al., 1998), Arabidopsis thaliana (Book et al., 2005) and Homo sapiens (Balow et al.,
1986; Lees et al., 1990; Wilson et al., 1993). TPPII is a cytosolic protease expressed in most
organs such as testis, brain, spleen, kidney, liver, or heart (Rose et al., 1996). By
immunofluorescence staining in COS7 (Firat et al., 2007) and EL4 cells (Firat et al., 2009;
Preta et al., 2010a; Preta et al., 2009) TPPII was shown to be mainly cytosolic. In addition, a
membrane-bound variant, which is thought to be attached to the lipid-bilayer by a glycosyl-
phosphatidly-inositol (GPI) anchor, was identified (Rose et al., 1996). The relative amount of
this membrane-bound TPPII is tissue-dependent and varies between 31% (brain) and 4%
(liver) of total TPPII content. This distribution might reflect different biological functions of
TPPII in these tissues (cytosolic: general protein degradation; membrane-bound: degradation
of neurotransmitters; (Rose et al., 1996).
The catalytic triad of TPPII was identified for both mouse TPPII (N44, H264, S449) and fly
TPPII (N44, H272, S462). The oxyanion formed during catalysis is stabilized by N362 in
mouse or N374 in fly (Chuang et al., 2010; Hilbi et al., 2002). Optimal conditions for the
exopeptidase activity of HsTPPII are neutral pH (Balow et al., 1983; Balow et al., 1986) and a
temperature of ~44°C (Schönegge, 2007). Furthermore, sensitivity of the activity towards
chloride was described (Schönegge, 2007; Tomkinson, 2004).
TPPII cleaves tripeptides from the free N-terminus of peptides (Balow et al., 1983; Balow et
al., 1986) and a so-called “double- glu” motif in the active-site binding cleft is thought to act
as molecular ruler (Chuang et al., 2010; Lindas et al., 2008). This type of motif is known to
convey cleavage fidelity to N-terminal exopeptidases after one, two or three residues,
respectively. The negatively charged glutamates form charge bridges with the positively
charged N-terminus of the substrate (Addlagatta et al., 2006; Engel et al., 2003; Goettig et
al., 2002; Xu et al., 2008). For TPPII from Drosophila melanogaster (DmTPPII), the existence
of a double-glu motif consisting of E312 and E343 was verified by enzymological studies.
The main determinant of exopeptidase selectivity is E312, whereas E343 has an auxiliary
function (Peters et al., 2011). Cleavage rates are sequence-dependant; proline in the P1 or
P1’ position reduces the cleavage rate drastically (Balow et al., 1986). In addition to the
exopeptidase activity, a weak endopeptidase activity was reported for TPPII (Geier et al.,
1999; Seifert et al., 2003). However, owing to the dominant role of the double-glu motif in
substrate alignment the endopeptidolytic cleavage rates are extremely low (Peters et al.,
2011).
Introduction
10
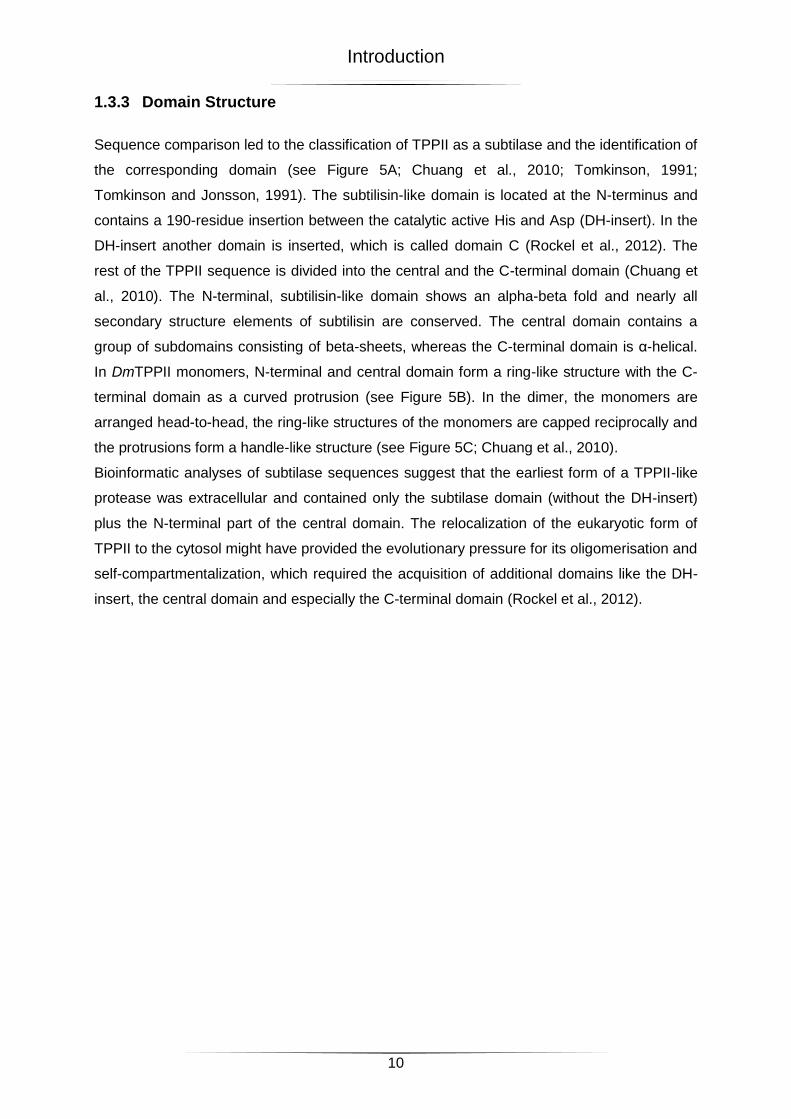
1.3.3 Domain Structure
Sequence comparison led to the classification of TPPII as a subtilase and the identification of
the corresponding domain (see Figure 5A; Chuang et al., 2010; Tomkinson, 1991;
Tomkinson and Jonsson, 1991). The subtilisin-like domain is located at the N-terminus and
contains a 190-residue insertion between the catalytic active His and Asp (DH-insert). In the
DH-insert another domain is inserted, which is called domain C (Rockel et al., 2012). The
rest of the TPPII sequence is divided into the central and the C-terminal domain (Chuang et
al., 2010). The N-terminal, subtilisin-like domain shows an alpha-beta fold and nearly all
secondary structure elements of subtilisin are conserved. The central domain contains a
group of subdomains consisting of beta-sheets, whereas the C-terminal domain is α-helical.
In DmTPPII monomers, N-terminal and central domain form a ring-like structure with the C-
terminal domain as a curved protrusion (see Figure 5B). In the dimer, the monomers are
arranged head-to-head, the ring-like structures of the monomers are capped reciprocally and
the protrusions form a handle-like structure (see Figure 5C; Chuang et al., 2010).
Bioinformatic analyses of subtilase sequences suggest that the earliest form of a TPPII-like
protease was extracellular and contained only the subtilase domain (without the DH-insert)
plus the N-terminal part of the central domain. The relocalization of the eukaryotic form of
TPPII to the cytosol might have provided the evolutionary pressure for its oligomerisation and
self-compartmentalization, which required the acquisition of additional domains like the DH-
insert, the central domain and especially the C-terminal domain (Rockel et al., 2012).
Introduction
11
Figure 5: Crystal structure of the DmTPPII dimer
(A) Schematic representation of the primary structure of Drosophila TPP II (DmTPPII) depicting the domains
found in the crystal structure. The subtilisin-like domain is colored in yellow (residues 1–522) contains the active-
site residues (red stars), loop L2 (residues 441–460), loop L1 (residues 408–417) and the DH-insert (I) with
domain C, which are colored in orange (residues 75–266) or red orange (residues 137-201), respectively; the
central domain (residues 523–1098) in green containing L3 loop (residues 1027–1098), C-terminal domain in blue
(residues 1099–1354, blue). (B) Ribbon diagram of a monomer (color scheme as in A). The active-site residues
are shown in stick format (red). (C) Surface representation of a TPP II dimer (color scheme as in A); red, active-
site. The two monomers are oriented head-to-head; the ring-like structure of one monomer is closed off by the
adjoining monomer (white arrow). The protrusions of the two bowls meet to form a handle (adapted from Chuang
et al., 2010).
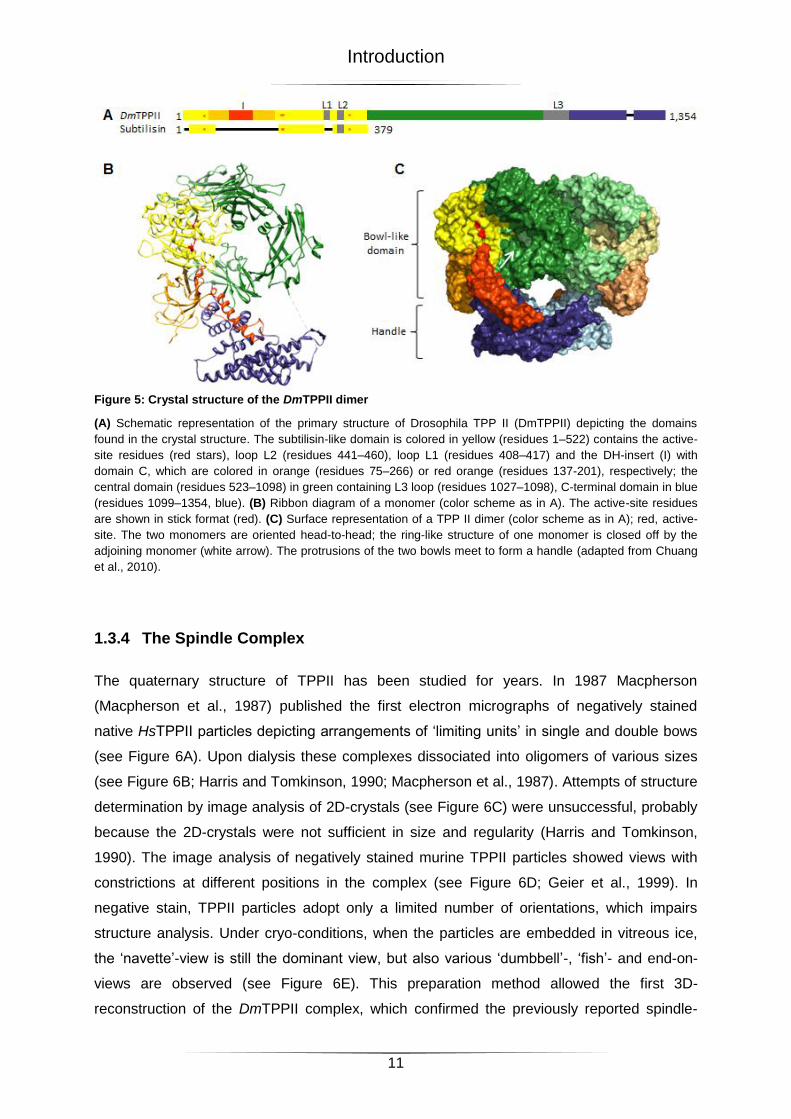
1.3.4 The Spindle Complex
The quaternary structure of TPPII has been studied for years. In 1987 Macpherson
(Macpherson et al., 1987) published the first electron micrographs of negatively stained
native HsTPPII particles depicting arrangements of ‘limiting units’ in single and double bows
(see Figure 6A). Upon dialysis these complexes dissociated into oligomers of various sizes
(see Figure 6B; Harris and Tomkinson, 1990; Macpherson et al., 1987). Attempts of structure
determination by image analysis of 2D-crystals (see Figure 6C) were unsuccessful, probably
because the 2D-crystals were not sufficient in size and regularity (Harris and Tomkinson,
1990). The image analysis of negatively stained murine TPPII particles showed views with
constrictions at different positions in the complex (see Figure 6D; Geier et al., 1999). In
negative stain, TPPII particles adopt only a limited number of orientations, which impairs
structure analysis. Under cryo-conditions, when the particles are embedded in vitreous ice,
the ‘navette’-view is still the dominant view, but also various ‘dumbbell’-, ‘fish’- and end-on-
views are observed (see Figure 6E). This preparation method allowed the first 3D-
reconstruction of the DmTPPII complex, which confirmed the previously reported spindle-
Introduction
12
shaped architecture with two strands twisted around each other (Rockel et al., 2002). In
DmTPPII, both strands consist of 10 stacked dimers (see Figure 7A; Chuang et al., 2010;
Rockel et al., 2005) and the molecular weight of the complex is ~5-6 MDa (Rockel et al.,
2002).
Figure 6: Studies of the quaternary structure of TPPII
(A) Electron micrograph of negatively stained native HsTPPII with 1, double-bow structure of two different kinds,
and 2, single-bow structure. Bar indicates 100 nm. (B) Schematic representation of varying oligomeric states of
native HsTPPII in curved higher oligomers or a single-bow complex (upper row) and in the double bow structure
together or the linear arrangements of the dimers (lower row). (C) Electron micrograph of native HsTPPII 2D-
crystals. Bar indicates 100 nm. (D) Class averages of 1365 negatively stained murine TPPII particles (E) Class
averages of DmTPPII particles in vitreous ice. Background: electron micrograph of DmTPPII particles in vitreous
ice (adapted from Macpherson et al., 1987 (A); Harris and Tomkinson, 1990 (B+C); Geier et al., 1999 (D); Rockel
et al., 2002 (E)).
Introduction
13
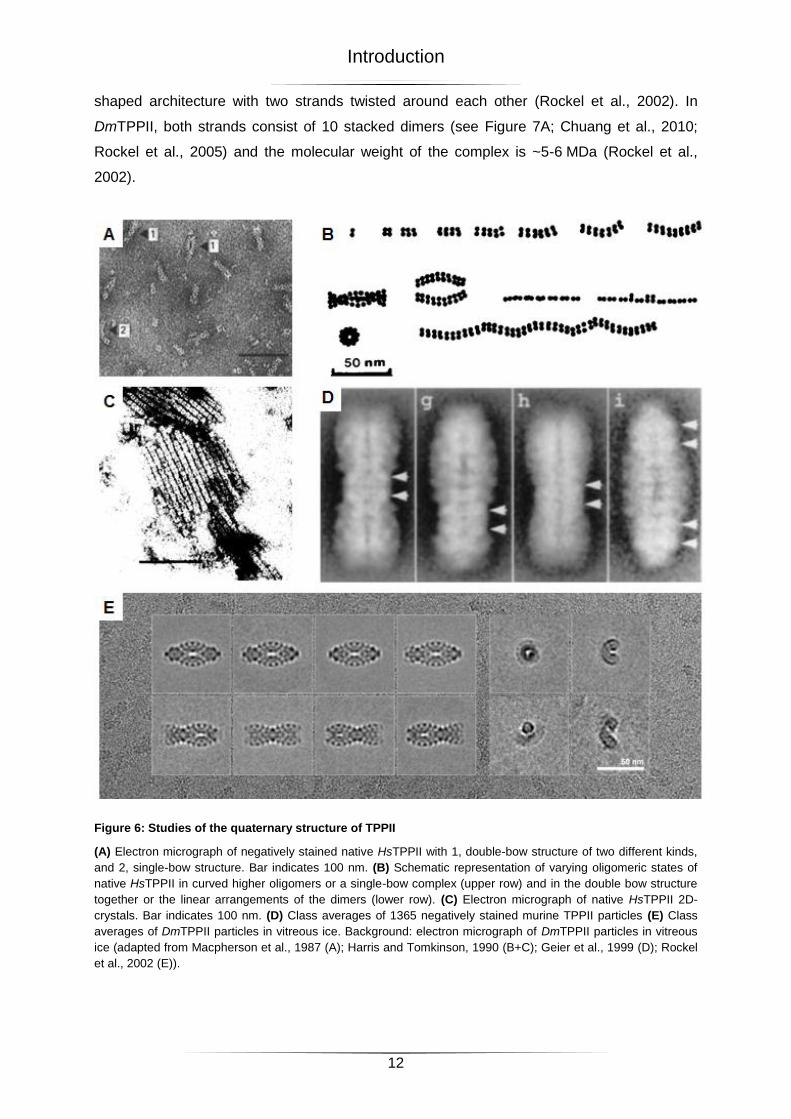
Recently the hybrid structure of DmTPPII was obtained and the positions of the domains
within the TPPII spindle could be determined: N-terminal domains plus central domains form
the corpus of the strands and C-terminal domains build the handles at the convex side (see
Figure 7B; Chuang et al., 2010; Rockel et al., 2012). The active-sites are sequestered within
a cavity system. The system consists of a longitudinal channel traversing the strands, an
antechamber and two catalytic chambers at each dimer-dimer interface (see Figure 7C/D/E).
To reach any of the sequestered active-site, a substrate has to cover a distance of ~ 120 Å
(Chuang et al., 2010).
Figure 7: The spindle complex of DmTPPII
(A) 3D-map of DmTPPII spindle with a resolution of ~14Å (FSC0.5). (B) The X-ray structure of DmTPPII dimers
fitted in the 3D map. The N-terminal domain is colored in yellow, the DH-insert in orange, the central domain in
green, the C-terminal domain in blue; the EM map is shown in mesh. (C) Surface model of a single strand low-
pass filtered to 12-Å resolution showing both the external surface (in transparent mesh and internal surface (solid
gray) to aid visualization of the chamber system. (D) Zoom into box in C. Red spheres, Ser462 residues. (E)
Schematic layout of TPP II chambers. H, handle; F, foyer; AC, antechamber; CC, catalytic chamber. Active-sites
are represented as red dots within catalytic chambers in the plane of the figure and as pale red dots for the
catalytic chambers closest to the viewer (outlined by white dashed lines). Black arrows, multiple pathways to
reach the active-sites; black dashed line, route to the catalytic chamber closest to the viewer (adapted from
Rockel et al., 2012 (A+B); Chuang et al., 2010 (C-E)).
1.3.5 Activation Mechanism
The proteolytic activity of TPPII is assembly-dependent and correlated to the number of
dimer-dimer interfaces (see Figure 8A; Seyit et al., 2006; Tomkinson, 2000). TPPII dimers
exhibit approximately 10% of the activity of fully assembled spindles (Seyit et al., 2006;
Tomkinson, 2000). This low activity of TPPII dimers was attributed to i) three loop residues of
loop L2 that are bound in the active-site cleft and to ii) the displacement of the active-site
serine by ~5 Å from the catalytically active position. The displacement of the active-site
serine is accompanied by a difference in secondary structure between TPPII and subtilisin in
A B
AC
AC CC
CC
CC CC
CC CC
AC
E
E
C D E
F
F
AC CC
CC
CC
CC F
AC
AC CC
CC
H
H
F
- 1
- 2
- 3
- 4
- 5
6 -
7 -
8 -
9 -
10 -
Introduction
14
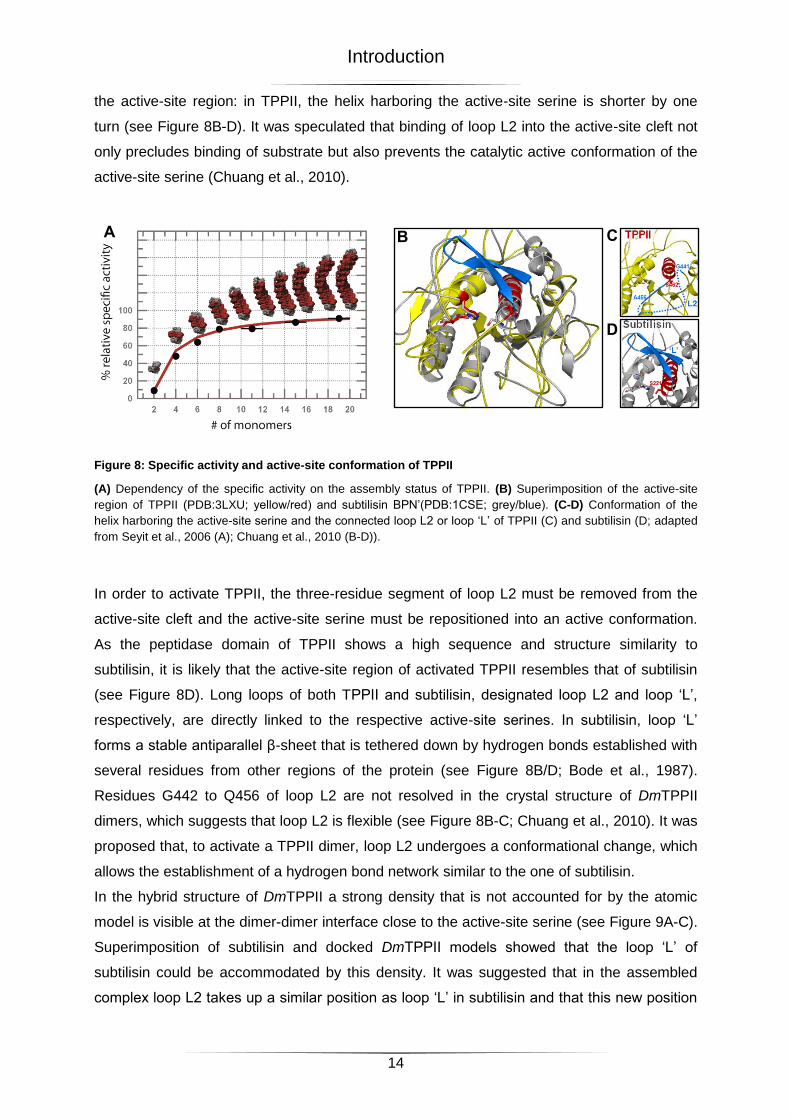
the active-site region: in TPPII, the helix harboring the active-site serine is shorter by one
turn (see Figure 8B-D). It was speculated that binding of loop L2 into the active-site cleft not
only precludes binding of substrate but also prevents the catalytic active conformation of the
active-site serine (Chuang et al., 2010).
Figure 8: Specific activity and active-site conformation of TPPII
(A) Dependency of the specific activity on the assembly status of TPPII. (B) Superimposition of the active-site
region of TPPII (PDB:3LXU; yellow/red) and subtilisin BPN’(PDB:1CSE; grey/blue). (C-D) Conformation of the
helix harboring the active-site serine and the connected loop L2 or loop ‘L’ of TPPII (C) and subtilisin (D; adapted
from Seyit et al., 2006 (A); Chuang et al., 2010 (B-D)).
In order to activate TPPII, the three-residue segment of loop L2 must be removed from the
active-site cleft and the active-site serine must be repositioned into an active conformation.
As the peptidase domain of TPPII shows a high sequence and structure similarity to
subtilisin, it is likely that the active-site region of activated TPPII resembles that of subtilisin
(see Figure 8D). Long loops of both TPPII and subtilisin, designated loop L2 and loop ‘L’,
respectively, are directly linked to the respective active-site serines. In subtilisin, loop ‘L’
forms a stable antiparallel β-sheet that is tethered down by hydrogen bonds established with
several residues from other regions of the protein (see Figure 8B/D; Bode et al., 1987).
Residues G442 to Q456 of loop L2 are not resolved in the crystal structure of DmTPPII
dimers, which suggests that loop L2 is flexible (see Figure 8B-C; Chuang et al., 2010). It was
proposed that, to activate a TPPII dimer, loop L2 undergoes a conformational change, which
allows the establishment of a hydrogen bond network similar to the one of subtilisin.
In the hybrid structure of DmTPPII a strong density that is not accounted for by the atomic
model is visible at the dimer-dimer interface close to the active-site serine (see Figure 9A-C).
Superimposition of subtilisin and docked DmTPPII models showed that the loop ‘L’ of
subtilisin could be accommodated by this density. It was suggested that in the assembled
complex loop L2 takes up a similar position as loop ‘L’ in subtilisin and that this new position
C
A B
D
Introduction
15
is stabilized by interactions of loop L2 with residues of the neighboring dimer (Chuang et al.,
2010).
Based on these assumptions a model for assembly-dependent activation was proposed:
TPPII dimers show a low activity because the active-site serine is displaced and a three-
residue segment of loop L2 is bound to the active-site cleft. As dimers stack to form strands,
loop L2 leaves the active-site cleft and establishes new interactions with residues from the
neighboring dimer at the roof of the catalytic chamber. Concomitantly, a hydrogen bond
network similar to that in subtilisin is established at the active-site region, which positions the
active-site serine in an active conformation (see Figure 9D; Chuang et al., 2010).
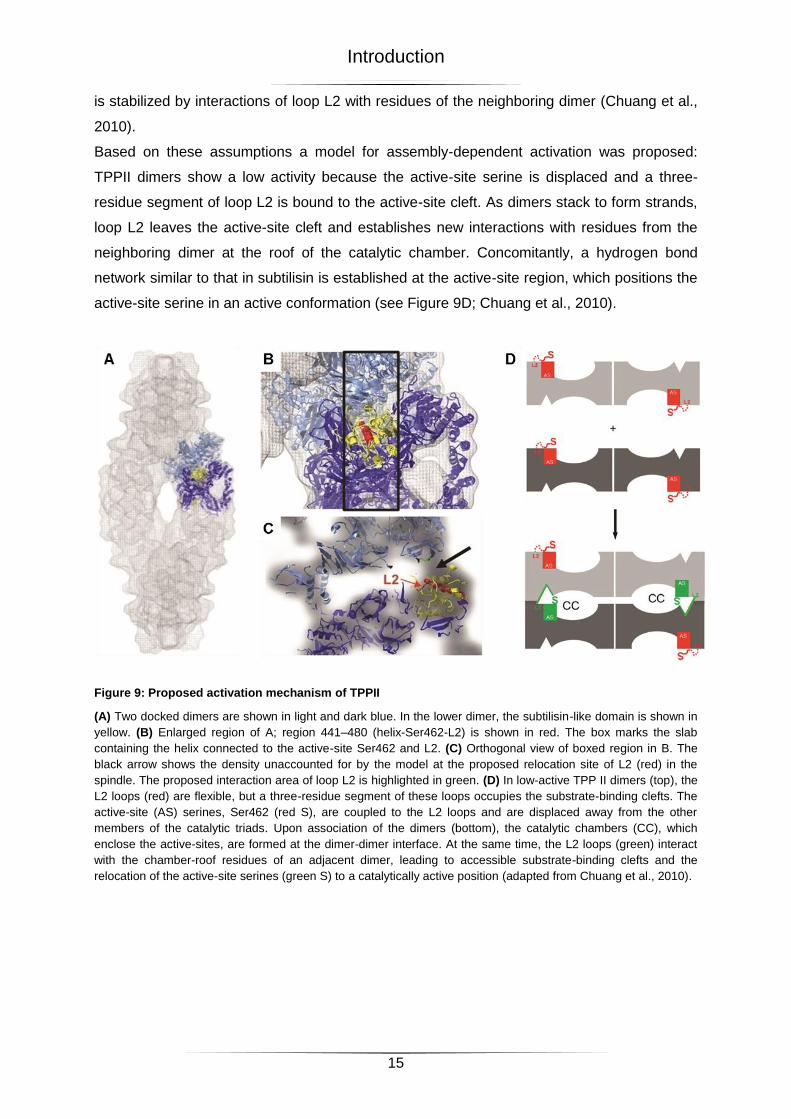
Figure 9: Proposed activation mechanism of TPPII
(A) Two docked dimers are shown in light and dark blue. In the lower dimer, the subtilisin-like domain is shown in
yellow. (B) Enlarged region of A; region 441–480 (helix-Ser462-L2) is shown in red. The box marks the slab
containing the helix connected to the active-site Ser462 and L2. (C) Orthogonal view of boxed region in B. The
black arrow shows the density unaccounted for by the model at the proposed relocation site of L2 (red) in the
spindle. The proposed interaction area of loop L2 is highlighted in green. (D) In low-active TPP II dimers (top), the
L2 loops (red) are flexible, but a three-residue segment of these loops occupies the substrate-binding clefts. The
active-site (AS) serines, Ser462 (red S), are coupled to the L2 loops and are displaced away from the other
members of the catalytic triads. Upon association of the dimers (bottom), the catalytic chambers (CC), which
enclose the active-sites, are formed at the dimer-dimer interface. At the same time, the L2 loops (green) interact
with the chamber-roof residues of an adjacent dimer, leading to accessible substrate-binding clefts and the
relocation of the active-site serines (green S) to a catalytically active position (adapted from Chuang et al., 2010).
Introduction
16
1.4 Aim of this work
Up to now, all high resolution structural data has been obtained with DmTPPII, whereas the
biological functions of TPPII have mainly been studied in mammalian systems. DmTPPII and
human TPPII (HsTPPII) differ in several properties such as specific activity, complex stability,
sequence length, and sequence identity. To enable results of functional studies of
mammalian TPPII to be correlated with its structure, one goal of this work was to obtain the
high-resolution structure of HsTPPII spindles.
Since the activation model proposed earlier had postulated conformational changes at the
dimer-dimer interface (Chuang et al., 2010), another goal was to analyze these interfaces in
the structures of HsTPPII and DmTPPII spindles and to probe regions potentially critical for
activation by a profound mutational analysis.
Results
17
2 Results
2.1 Structure Determination of HsTPPII
2.1.1 Purification and Electron Microscopy of HsTPPII Spindles
So far, all published purification protocols of native mammalian TPPII have yielded rather
small amounts of protein, which was not suitable for detailed structural analysis (Harris and
Tomkinson, 1990; Macpherson et al., 1987). In order to overcome the obstacle of limited
access to HsTPPII, a recombinant expression system was established in E. coli. An initial
attempt to adapt the purification procedure of recombinant DmTPPII to HsTPPII yielded pure
HsTPPII spindles, which was, however, not suitable for cryo electron microscopy (cryo-EM)
in quality and concentration (Schönegge, 2007).
The main problem in the purification of HsTPPII was that the first step in the purification
procedure of DmTPPII – Polyethyleneimine (PEI)-precipitation under conditions causing
disassembly of the TPPII complex into smaller oligomers (pH 8.9; Seyit et al., 2006) – could
not be applied to HsTPPII. Without a prior PEI-precipitation step, the losses occurring in all
following purification steps were much higher than for DmTPPII. Hence, a different
enrichement step had to be introduced as the first step of the purification procedure. An N-
terminal His6-tag had shown not to interfere with folding and assembly of murine TPPII during
expression in HEK-293 cells and Pichia pastoris (Lindas et al., 2008) and of DmTPPII during
expression in E. coli (Seyit, 2006). Therefore, to improve the yield of recombinant HsTPPII
from E. coli, a His6-tag was added to the N-terminus of HsTPPII (see Figure 10A) and a
modified purification procedure was developed (see Figure 10B). After lysis of the E. coli
cells, the lysate was filtered and subjected to immobilized metal ion affinity chromatography
(IMAC). The majority of the His6-tagged protein was bound to the nickel-ions of the HisTrap-
column (see Figure 10C). To reduce non-specific binding, all buffers contained 300 mM NaCl
and a wash step with 50 mM imidazole was introduced. The target protein was eluted by a
step gradient; HsTPPII eluted at 200 mM imidazole. As TPPII activity is sensitive to imidazole
(J. Peters; personal communication), the imidazole was removed by buffer exchange via a
PD10 column. Further purification was achieved by an ion exchange chromatography (IEX)
step using an ANX-column. The activity of the fractions was monitored by measuring Amc-
release from the fluorogenic substrate AAF-Amc. Fractions showing high activity were
combined and concentrated by ammonium sulfate (AS) precipitation. The final purification
step, which yielded homogeneous, high molecular weight complexes of TPPII, was size
exclusion chromatography (SEC) on a Superose 6. This procedure reproducibly yielded pure
HsTPPII in large amounts (~2.5 - 3.5 g HsTPPII from ~45 - 75 g E. coli lysate; see Figure
10C). Integrity and homogeneity of the purified protein were monitored by electron
Results
18
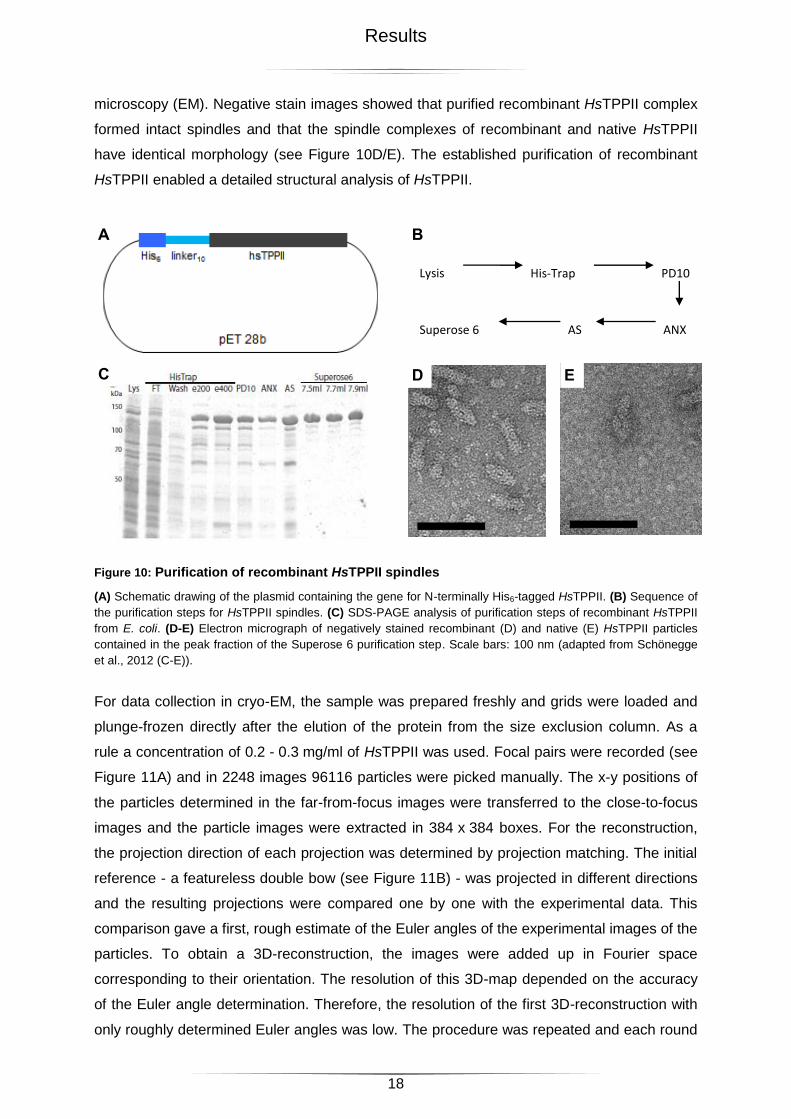
microscopy (EM). Negative stain images showed that purified recombinant HsTPPII complex
formed intact spindles and that the spindle complexes of recombinant and native HsTPPII
have identical morphology (see Figure 10D/E). The established purification of recombinant
HsTPPII enabled a detailed structural analysis of HsTPPII.
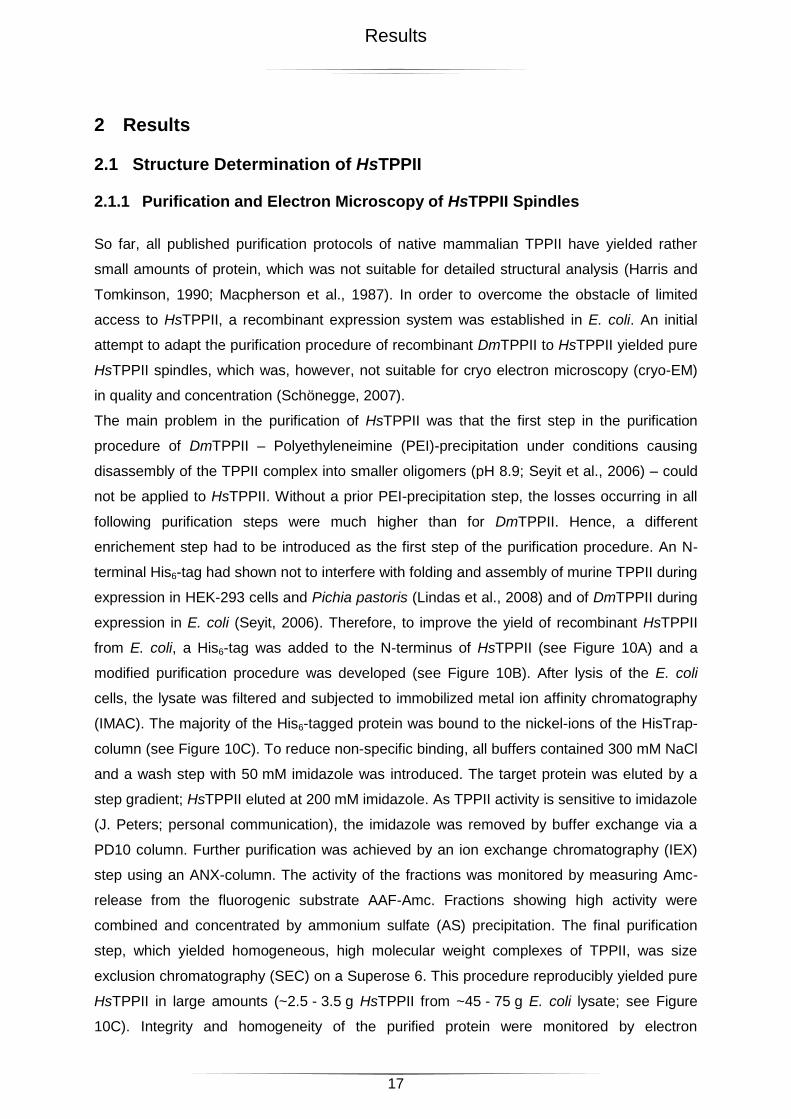
Figure 10: Purification of recombinant HsTPPII spindles
(A) Schematic drawing of the plasmid containing the gene for N-terminally His6-tagged HsTPPII. (B) Sequence of
the purification steps for HsTPPII spindles. (C) SDS-PAGE analysis of purification steps of recombinant HsTPPII
from E. coli. (D-E) Electron micrograph of negatively stained recombinant (D) and native (E) HsTPPII particles
contained in the peak fraction of the Superose 6 purification step. Scale bars: 100 nm (adapted from Schönegge
et al., 2012 (C-E)).
For data collection in cryo-EM, the sample was prepared freshly and grids were loaded and
plunge-frozen directly after the elution of the protein from the size exclusion column. As a
rule a concentration of 0.2 - 0.3 mg/ml of HsTPPII was used. Focal pairs were recorded (see
Figure 11A) and in 2248 images 96116 particles were picked manually. The x-y positions of
the particles determined in the far-from-focus images were transferred to the close-to-focus
images and the particle images were extracted in 384 x 384 boxes. For the reconstruction,
the projection direction of each projection was determined by projection matching. The initial
reference - a featureless double bow (see Figure 11B) - was projected in different directions
and the resulting projections were compared one by one with the experimental data. This
comparison gave a first, rough estimate of the Euler angles of the experimental images of the
particles. To obtain a 3D-reconstruction, the images were added up in Fourier space
corresponding to their orientation. The resolution of this 3D-map depended on the accuracy
of the Euler angle determination. Therefore, the resolution of the first 3D-reconstruction with
only roughly determined Euler angles was low. The procedure was repeated and each round
B
C D
Lysis His-Trap PD10
ANX AS Superose 6
A
E
Results
19
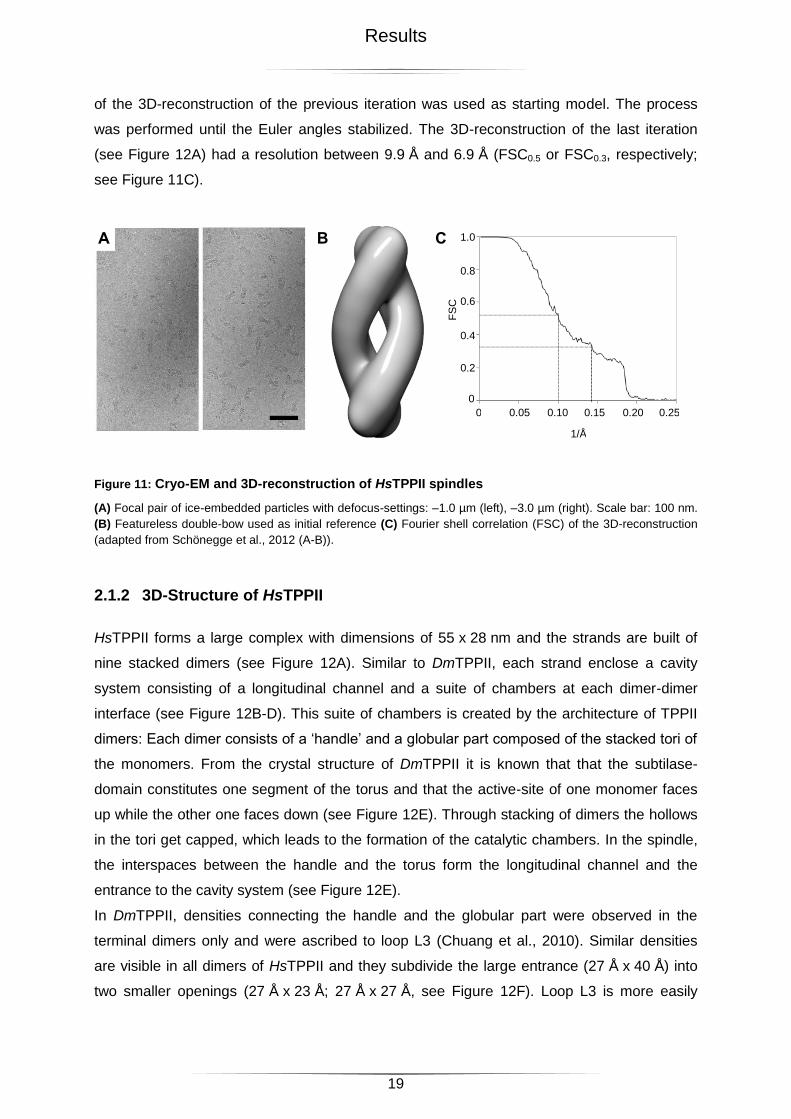
of the 3D-reconstruction of the previous iteration was used as starting model. The process
was performed until the Euler angles stabilized. The 3D-reconstruction of the last iteration
(see Figure 12A) had a resolution between 9.9 Å and 6.9 Å (FSC0.5 or FSC0.3, respectively;
see Figure 11C).
Figure 11: Cryo-EM and 3D-reconstruction of HsTPPII spindles
(A) Focal pair of ice-embedded particles with defocus-settings: –1.0 µm (left), –3.0 µm (right). Scale bar: 100 nm.
(B) Featureless double-bow used as initial reference (C) Fourier shell correlation (FSC) of the 3D-reconstruction
(adapted from Schönegge et al., 2012 (A-B)).
2.1.2 3D-Structure of HsTPPII
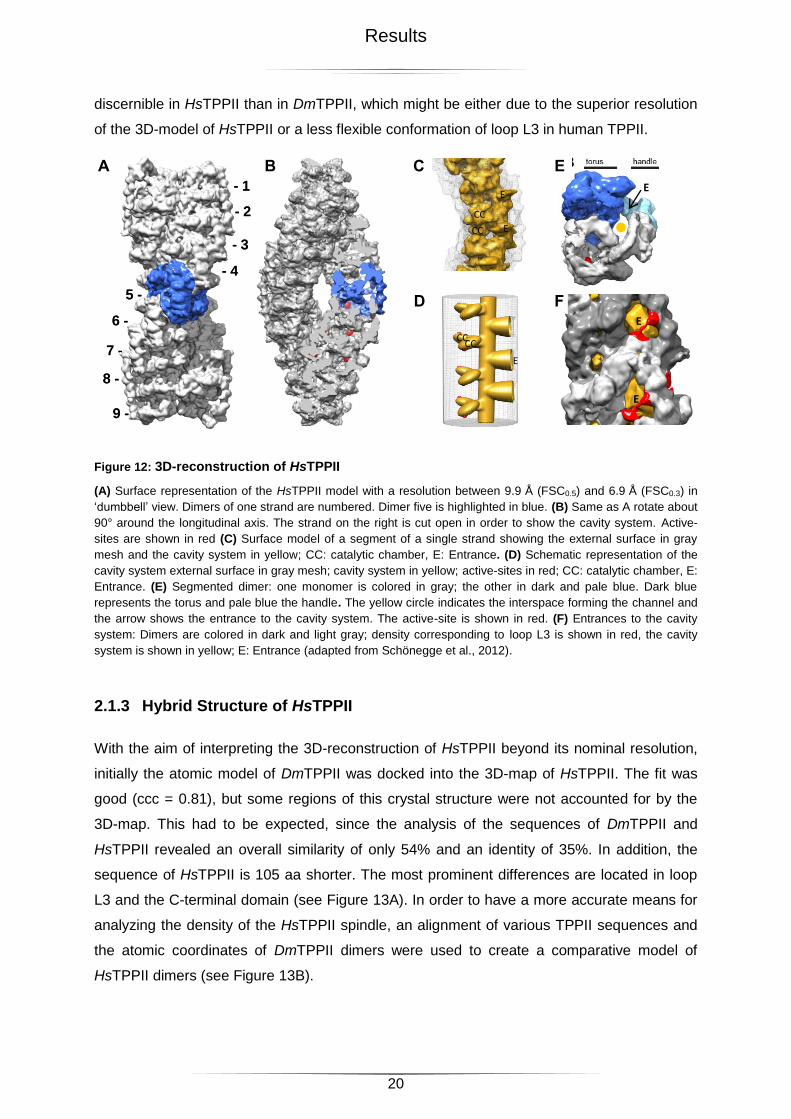
HsTPPII forms a large complex with dimensions of 55 x 28 nm and the strands are built of
nine stacked dimers (see Figure 12A). Similar to DmTPPII, each strand enclose a cavity
system consisting of a longitudinal channel and a suite of chambers at each dimer-dimer
interface (see Figure 12B-D). This suite of chambers is created by the architecture of TPPII
dimers: Each dimer consists of a ‘handle’ and a globular part composed of the stacked tori of
the monomers. From the crystal structure of DmTPPII it is known that that the subtilase-
domain constitutes one segment of the torus and that the active-site of one monomer faces
up while the other one faces down (see Figure 12E). Through stacking of dimers the hollows
in the tori get capped, which leads to the formation of the catalytic chambers. In the spindle,
the interspaces between the handle and the torus form the longitudinal channel and the
entrance to the cavity system (see Figure 12E).
In DmTPPII, densities connecting the handle and the globular part were observed in the
terminal dimers only and were ascribed to loop L3 (Chuang et al., 2010). Similar densities
are visible in all dimers of HsTPPII and they subdivide the large entrance (27 Å x 40 Å) into
two smaller openings (27 Å x 23 Å; 27 Å x 27 Å, see Figure 12F). Loop L3 is more easily
B C A
1.0
0.8
0.6
0.4
0.2
0 0.25 0 0.05 0.15 0.10 0.20
1/Å F
SC
Results
20
discernible in HsTPPII than in DmTPPII, which might be either due to the superior resolution
of the 3D-model of HsTPPII or a less flexible conformation of loop L3 in human TPPII.
Figure 12: 3D-reconstruction of HsTPPII
(A) Surface representation of the HsTPPII model with a resolution between 9.9 Å (FSC0.5) and 6.9 Å (FSC0.3) in
‘dumbbell’ view. Dimers of one strand are numbered. Dimer five is highlighted in blue. (B) Same as A rotate about
90° around the longitudinal axis. The strand on the right is cut open in order to show the cavity system. Active-
sites are shown in red (C) Surface model of a segment of a single strand showing the external surface in gray
mesh and the cavity system in yellow; CC: catalytic chamber, E: Entrance. (D) Schematic representation of the
cavity system external surface in gray mesh; cavity system in yellow; active-sites in red; CC: catalytic chamber, E:
Entrance. (E) Segmented dimer: one monomer is colored in gray; the other in dark and pale blue. Dark blue
represents the torus and pale blue the handle. The yellow circle indicates the interspace forming the channel and
the arrow shows the entrance to the cavity system. The active-site is shown in red. (F) Entrances to the cavity
system: Dimers are colored in dark and light gray; density corresponding to loop L3 is shown in red, the cavity
system is shown in yellow; E: Entrance (adapted from Schönegge et al., 2012).
2.1.3 Hybrid Structure of HsTPPII
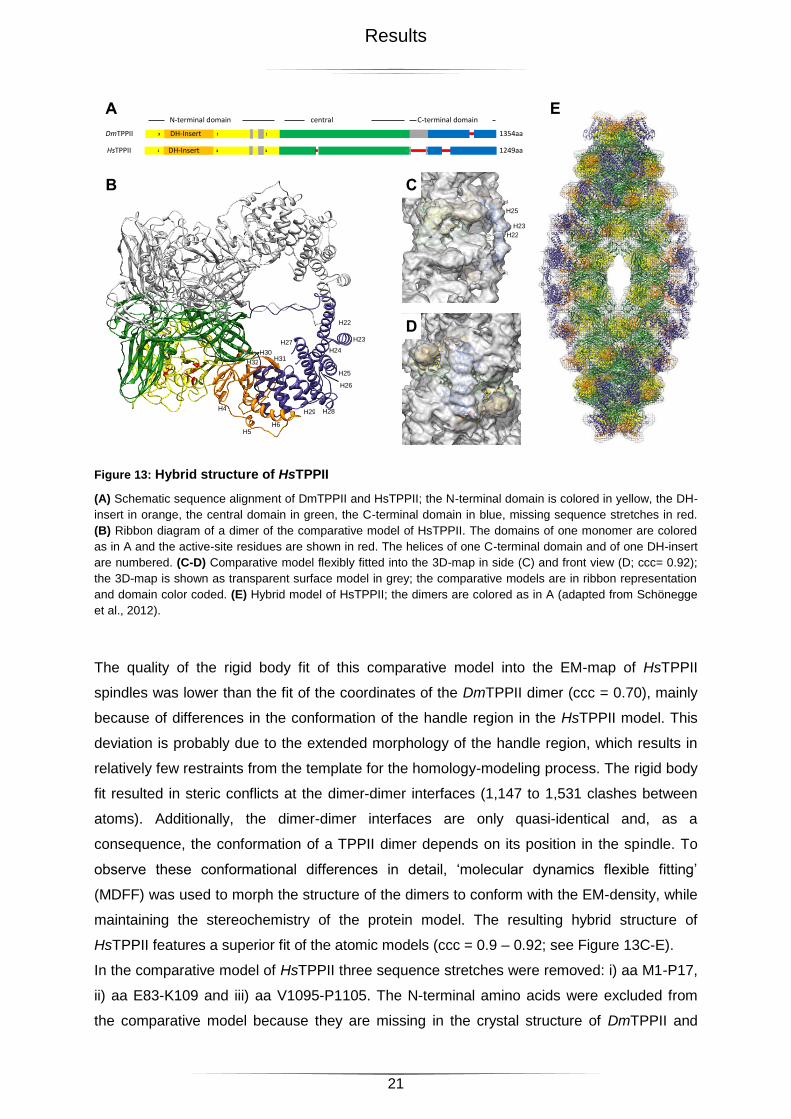
With the aim of interpreting the 3D-reconstruction of HsTPPII beyond its nominal resolution,
initially the atomic model of DmTPPII was docked into the 3D-map of HsTPPII. The fit was
good (ccc = 0.81), but some regions of this crystal structure were not accounted for by the
3D-map. This had to be expected, since the analysis of the sequences of DmTPPII and
HsTPPII revealed an overall similarity of only 54% and an identity of 35%. In addition, the
sequence of HsTPPII is 105 aa shorter. The most prominent differences are located in loop
L3 and the C-terminal domain (see Figure 13A). In order to have a more accurate means for
analyzing the density of the HsTPPII spindle, an alignment of various TPPII sequences and
the atomic coordinates of DmTPPII dimers were used to create a comparative model of
HsTPPII dimers (see Figure 13B).
A
- 1
- 2
- 3
- 4
5 -
6 -
7 -
8 -
9 -
B B C E
CC CC
E
CC CC
E
E
E
E E
A
- 1
- 2
- 3
- 4
5 -
6 -
7 -
8 -
9 -
B B C
D
CC CC
E
CC CC
E
E
E
E
F
E
E
Results
21
Figure 13: Hybrid structure of HsTPPII
(A) Schematic sequence alignment of DmTPPII and HsTPPII; the N-terminal domain is colored in yellow, the DH-
insert in orange, the central domain in green, the C-terminal domain in blue, missing sequence stretches in red.
(B) Ribbon diagram of a dimer of the comparative model of HsTPPII. The domains of one monomer are colored
as in A and the active-site residues are shown in red. The helices of one C-terminal domain and of one DH-insert
are numbered. (C-D) Comparative model flexibly fitted into the 3D-map in side (C) and front view (D; ccc= 0.92);
the 3D-map is shown as transparent surface model in grey; the comparative models are in ribbon representation
and domain color coded. (E) Hybrid model of HsTPPII; the dimers are colored as in A (adapted from Schönegge
et al., 2012).
The quality of the rigid body fit of this comparative model into the EM-map of HsTPPII
spindles was lower than the fit of the coordinates of the DmTPPII dimer (ccc = 0.70), mainly
because of differences in the conformation of the handle region in the HsTPPII model. This
deviation is probably due to the extended morphology of the handle region, which results in
relatively few restraints from the template for the homology-modeling process. The rigid body
fit resulted in steric conflicts at the dimer-dimer interfaces (1,147 to 1,531 clashes between
atoms). Additionally, the dimer-dimer interfaces are only quasi-identical and, as a
consequence, the conformation of a TPPII dimer depends on its position in the spindle. To
observe these conformational differences in detail, ‘molecular dynamics flexible fitting’
(MDFF) was used to morph the structure of the dimers to conform with the EM-density, while
maintaining the stereochemistry of the protein model. The resulting hybrid structure of
HsTPPII features a superior fit of the atomic models (ccc = 0.9 – 0.92; see Figure 13C-E).
In the comparative model of HsTPPII three sequence stretches were removed: i) aa M1-P17,
ii) aa E83-K109 and iii) aa V1095-P1105. The N-terminal amino acids were excluded from
the comparative model because they are missing in the crystal structure of DmTPPII and
H4
H5
H22
H6
H23 H24
H25 H26
H27
H28 H29
H32 H30
H31
B C
D
A
DmTPPII HsTPPII
1354aa 1249aa * * *
* * * DH-Insert DH-Insert
N-terminal domain C-terminal domain central domain
H25 H23
H22
E
Results
22
cannot be modeled reliably. The loop regions E83-K109 and V1095-P1105 were modeled.
However, after rigid body fitting of the dimers into the EM-map they were entangled. Since
this problem could not be solved by MDFF these regions were deleted from the model.
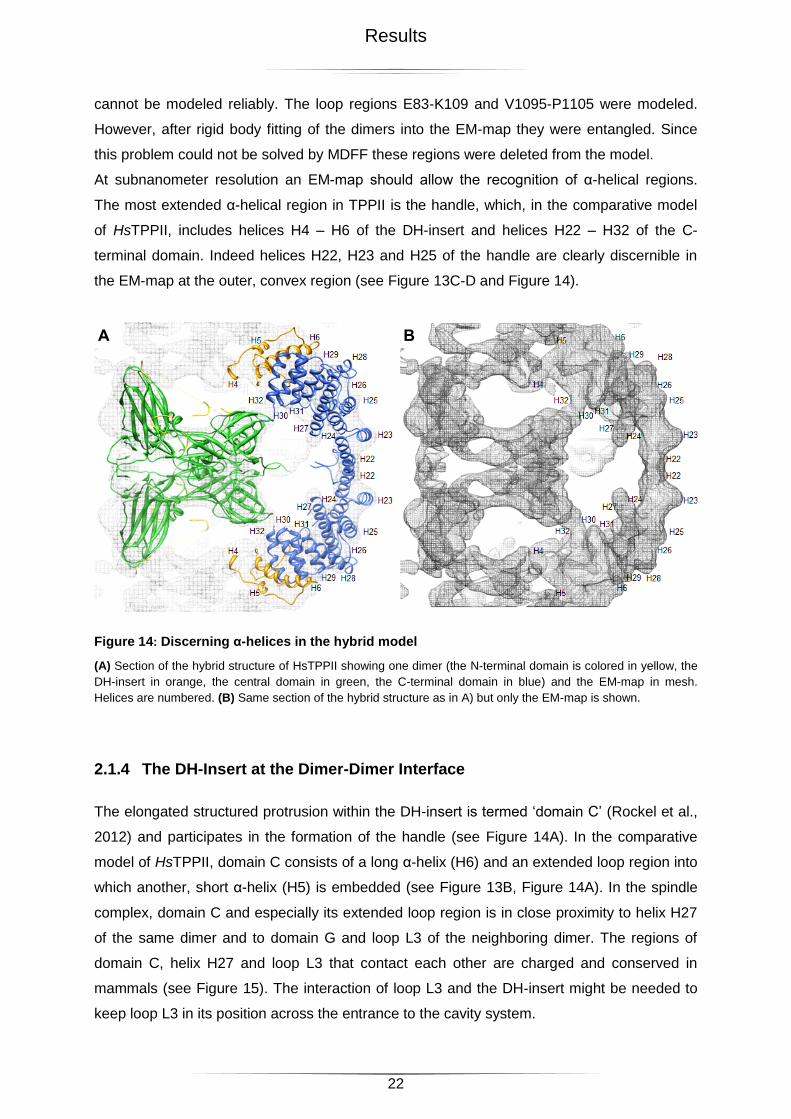
At subnanometer resolution an EM-map should allow the recognition of α-helical regions.
The most extended α-helical region in TPPII is the handle, which, in the comparative model
of HsTPPII, includes helices H4 – H6 of the DH-insert and helices H22 – H32 of the C-
terminal domain. Indeed helices H22, H23 and H25 of the handle are clearly discernible in
the EM-map at the outer, convex region (see Figure 13C-D and Figure 14).
Figure 14: Discerning α-helices in the hybrid model
(A) Section of the hybrid structure of HsTPPII showing one dimer (the N-terminal domain is colored in yellow, the
DH-insert in orange, the central domain in green, the C-terminal domain in blue) and the EM-map in mesh.
Helices are numbered. (B) Same section of the hybrid structure as in A) but only the EM-map is shown.
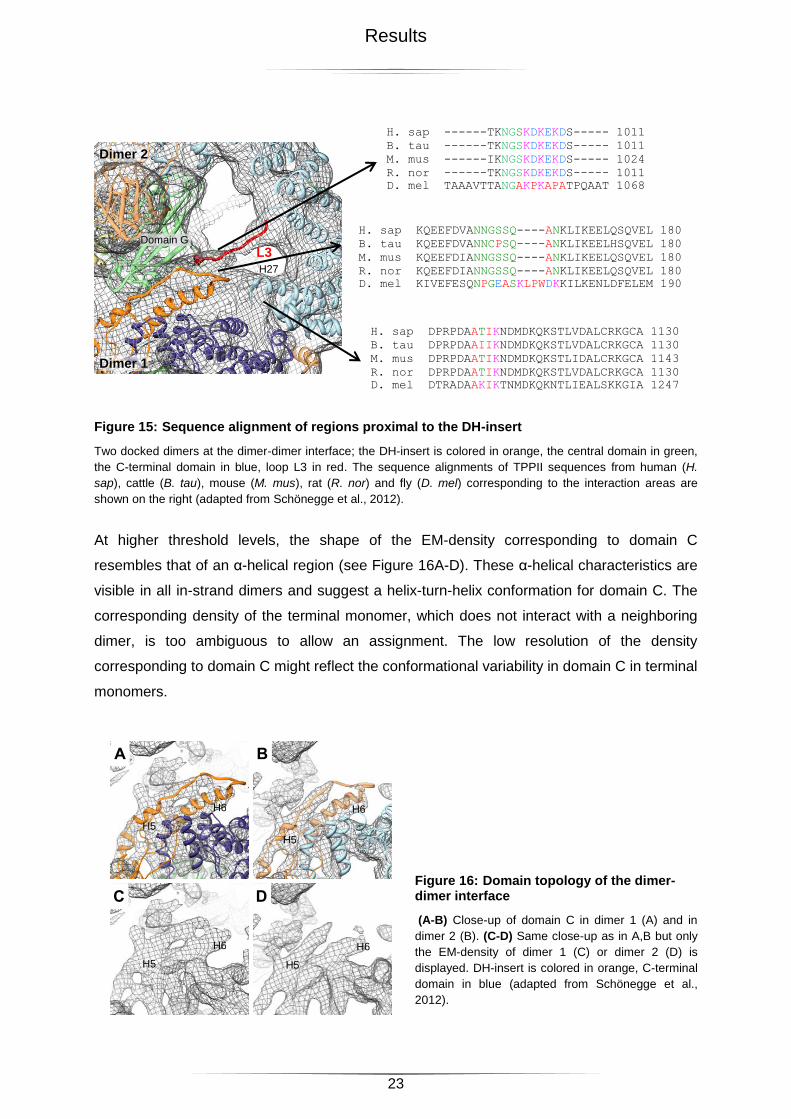
2.1.4 The DH-Insert at the Dimer-Dimer Interface
The elongated structured protrusion within the DH-insert is termed ‘domain C’ (Rockel et al.,
2012) and participates in the formation of the handle (see Figure 14A). In the comparative
model of HsTPPII, domain C consists of a long α-helix (H6) and an extended loop region into
which another, short α-helix (H5) is embedded (see Figure 13B, Figure 14A). In the spindle
complex, domain C and especially its extended loop region is in close proximity to helix H27
of the same dimer and to domain G and loop L3 of the neighboring dimer. The regions of
domain C, helix H27 and loop L3 that contact each other are charged and conserved in
mammals (see Figure 15). The interaction of loop L3 and the DH-insert might be needed to
keep loop L3 in its position across the entrance to the cavity system.
A B
Results
23
Figure 15: Sequence alignment of regions proximal to the DH-insert
Two docked dimers at the dimer-dimer interface; the DH-insert is colored in orange, the central domain in green,
the C-terminal domain in blue, loop L3 in red. The sequence alignments of TPPII sequences from human (H.
sap), cattle (B. tau), mouse (M. mus), rat (R. nor) and fly (D. mel) corresponding to the interaction areas are
shown on the right (adapted from Schönegge et al., 2012).
At higher threshold levels, the shape of the EM-density corresponding to domain C
resembles that of an α-helical region (see Figure 16A-D). These α-helical characteristics are
visible in all in-strand dimers and suggest a helix-turn-helix conformation for domain C. The
corresponding density of the terminal monomer, which does not interact with a neighboring
dimer, is too ambiguous to allow an assignment. The low resolution of the density
corresponding to domain C might reflect the conformational variability in domain C in terminal
monomers.
Figure 16: Domain topology of the dimer-dimer interface
(A-B) Close-up of domain C in dimer 1 (A) and in
dimer 2 (B). (C-D) Same close-up as in A,B but only
the EM-density of dimer 1 (C) or dimer 2 (D) is
displayed. DH-insert is colored in orange, C-terminal
domain in blue (adapted from Schönegge et al.,
2012).
L3
Dimer 1
Dimer 2
H27
Domain G
H. sap ------TKNGSKDKEKDS----- 1011 B. tau ------TKNGSKDKEKDS----- 1011 M. mus ------IKNGSKDKEKDS----- 1024 R. nor ------TKNGSKDKEKDS----- 1011 D. mel TAAAVTTANGAKPKAPATPQAAT 1068
H. sap KQEEFDVANNGSSQ----ANKLIKEELQSQVEL 180 B. tau KQEEFDVANNCPSQ----ANKLIKEELHSQVEL 180 M. mus KQEEFDIANNGSSQ----ANKLIKEELQSQVEL 180 R. nor KQEEFDIANNGSSQ----ANKLIKEELQSQVEL 180 D. mel KIVEFESQNPGEASKLPWDKKILKENLDFELEM 190
H. sap DPRPDAATIKNDMDKQKSTLVDALCRKGCA 1130 B. tau DPRPDAAIIKNDMDKQKSTLVDALCRKGCA 1130 M. mus DPRPDAATIKNDMDKQKSTLIDALCRKGCA 1143 R. nor DPRPDAATIKNDMDKQKSTLVDALCRKGCA 1130 D. mel DTRADAAKIKTNMDKQKNTLIEALSKKGIA 1247
H6
H5 H5
H6
A B
C D
H6
H5 H6
H5
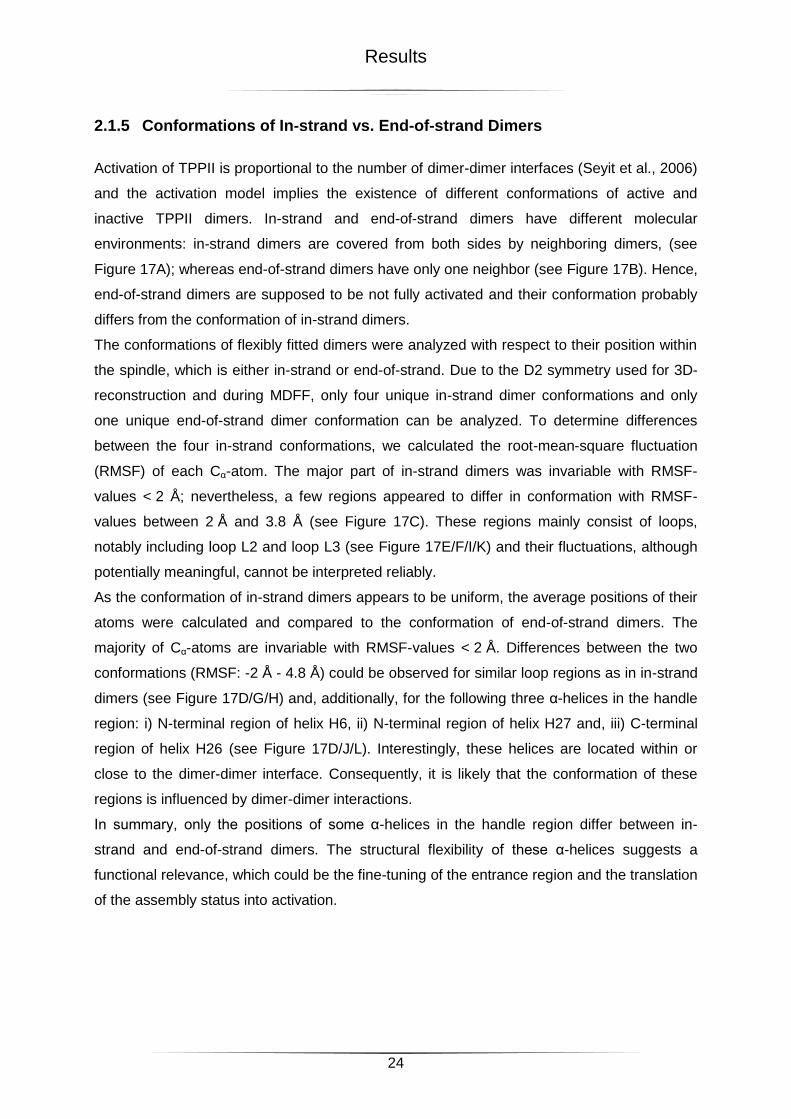
Results
24
2.1.5 Conformations of In-strand vs. End-of-strand Dimers
Activation of TPPII is proportional to the number of dimer-dimer interfaces (Seyit et al., 2006)
and the activation model implies the existence of different conformations of active and
inactive TPPII dimers. In-strand and end-of-strand dimers have different molecular
environments: in-strand dimers are covered from both sides by neighboring dimers, (see
Figure 17A); whereas end-of-strand dimers have only one neighbor (see Figure 17B). Hence,
end-of-strand dimers are supposed to be not fully activated and their conformation probably
differs from the conformation of in-strand dimers.
The conformations of flexibly fitted dimers were analyzed with respect to their position within
the spindle, which is either in-strand or end-of-strand. Due to the D2 symmetry used for 3D-
reconstruction and during MDFF, only four unique in-strand dimer conformations and only
one unique end-of-strand dimer conformation can be analyzed. To determine differences
between the four in-strand conformations, we calculated the root-mean-square fluctuation
(RMSF) of each Cα-atom. The major part of in-strand dimers was invariable with RMSF-
values < 2 Å; nevertheless, a few regions appeared to differ in conformation with RMSF-
values between 2 Å and 3.8 Å (see Figure 17C). These regions mainly consist of loops,
notably including loop L2 and loop L3 (see Figure 17E/F/I/K) and their fluctuations, although
potentially meaningful, cannot be interpreted reliably.
As the conformation of in-strand dimers appears to be uniform, the average positions of their
atoms were calculated and compared to the conformation of end-of-strand dimers. The
majority of Cα-atoms are invariable with RMSF-values < 2 Å. Differences between the two
conformations (RMSF: -2 Å - 4.8 Å) could be observed for similar loop regions as in in-strand
dimers (see Figure 17D/G/H) and, additionally, for the following three α-helices in the handle
region: i) N-terminal region of helix H6, ii) N-terminal region of helix H27 and, iii) C-terminal
region of helix H26 (see Figure 17D/J/L). Interestingly, these helices are located within or
close to the dimer-dimer interface. Consequently, it is likely that the conformation of these
regions is influenced by dimer-dimer interactions.
In summary, only the positions of some α-helices in the handle region differ between in-
strand and end-of-strand dimers. The structural flexibility of these α-helices suggests a
functional relevance, which could be the fine-tuning of the entrance region and the translation
of the assembly status into activation.
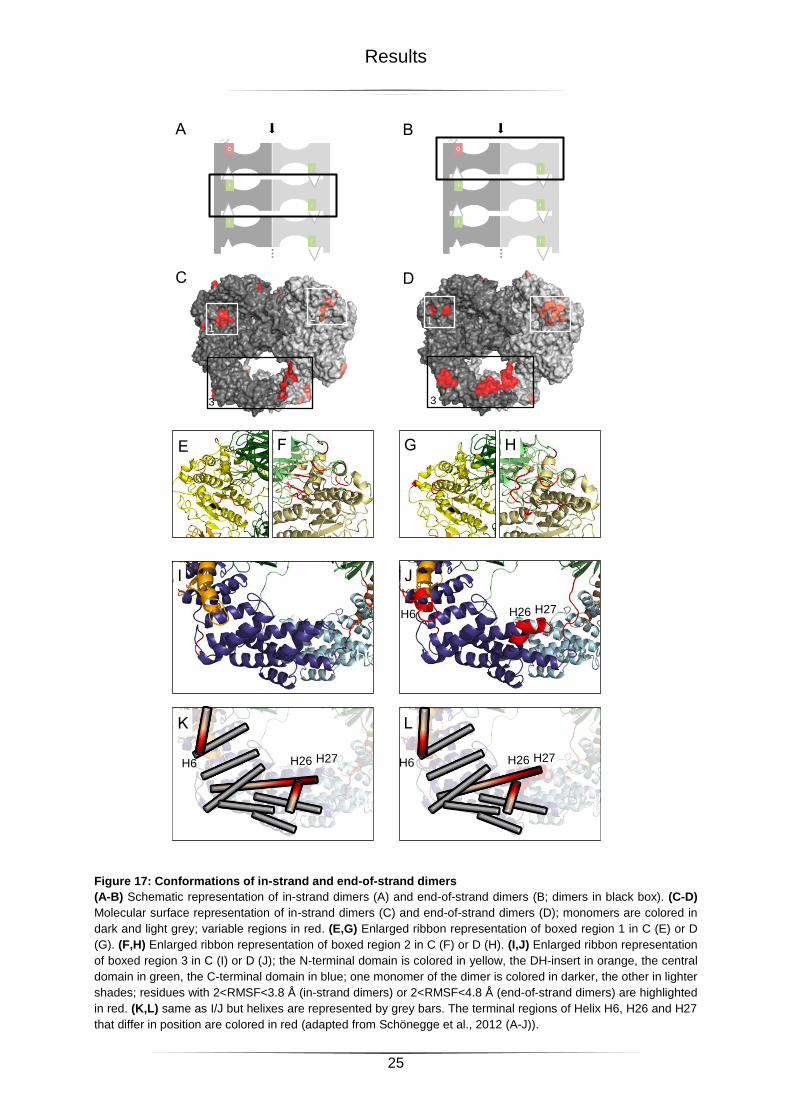
Results
25
Figure 17: Conformations of in-strand and end-of-strand dimers
(A-B) Schematic representation of in-strand dimers (A) and end-of-strand dimers (B; dimers in black box). (C-D)
Molecular surface representation of in-strand dimers (C) and end-of-strand dimers (D); monomers are colored in
dark and light grey; variable regions in red. (E,G) Enlarged ribbon representation of boxed region 1 in C (E) or D
(G). (F,H) Enlarged ribbon representation of boxed region 2 in C (F) or D (H). (I,J) Enlarged ribbon representation
of boxed region 3 in C (I) or D (J); the N-terminal domain is colored in yellow, the DH-insert in orange, the central
domain in green, the C-terminal domain in blue; one monomer of the dimer is colored in darker, the other in lighter
shades; residues with 2<RMSF<3.8 Å (in-strand dimers) or 2<RMSF<4.8 Å (end-of-strand dimers) are highlighted
in red. (K,L) same as I/J but helixes are represented by grey bars. The terminal regions of Helix H6, H26 and H27
that differ in position are colored in red (adapted from Schönegge et al., 2012 (A-J)).
A
C D
1 2
3
1
2
3
B
H6 H27 H26
G H
J
E
I
F
K
H6 H27 H26 H27 H26 H6
L
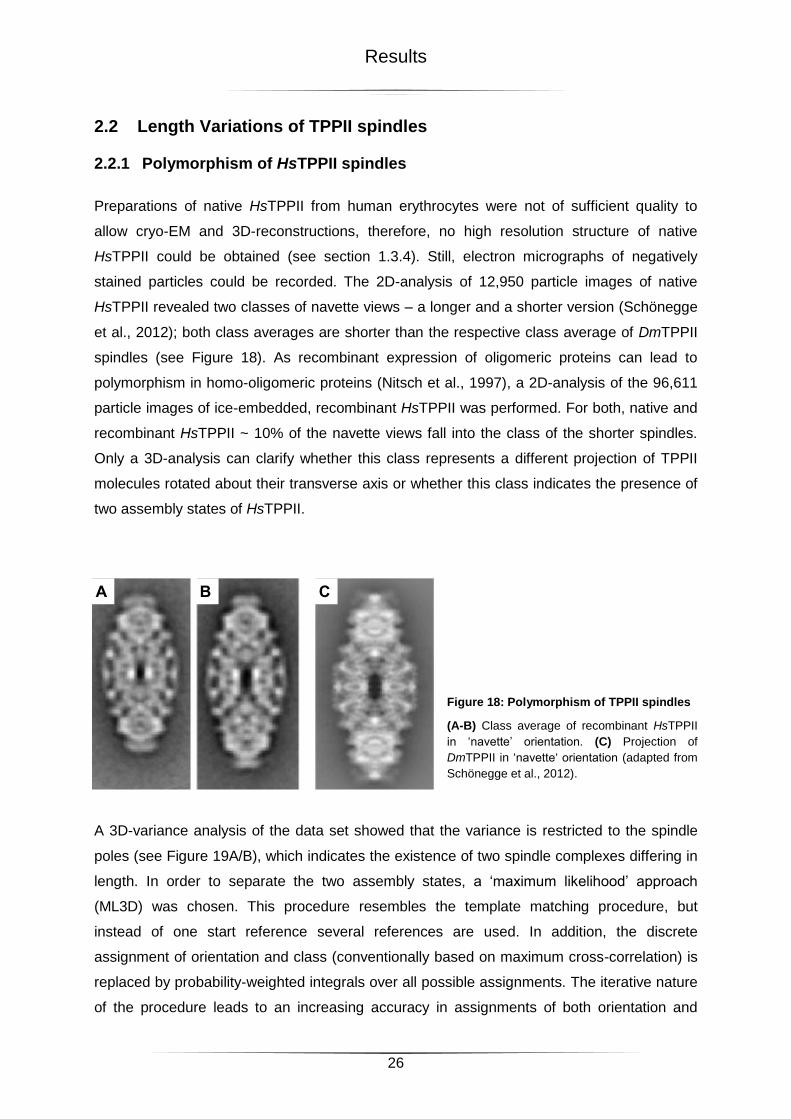
Results
26
2.2 Length Variations of TPPII spindles
2.2.1 Polymorphism of HsTPPII spindles
Preparations of native HsTPPII from human erythrocytes were not of sufficient quality to
allow cryo-EM and 3D-reconstructions, therefore, no high resolution structure of native
HsTPPII could be obtained (see section 1.3.4). Still, electron micrographs of negatively
stained particles could be recorded. The 2D-analysis of 12,950 particle images of native
HsTPPII revealed two classes of navette views – a longer and a shorter version (Schönegge
et al., 2012); both class averages are shorter than the respective class average of DmTPPII
spindles (see Figure 18). As recombinant expression of oligomeric proteins can lead to
polymorphism in homo-oligomeric proteins (Nitsch et al., 1997), a 2D-analysis of the 96,611
particle images of ice-embedded, recombinant HsTPPII was performed. For both, native and
recombinant HsTPPII ~ 10% of the navette views fall into the class of the shorter spindles.
Only a 3D-analysis can clarify whether this class represents a different projection of TPPII
molecules rotated about their transverse axis or whether this class indicates the presence of
two assembly states of HsTPPII.
Figure 18: Polymorphism of TPPII spindles
(A-B) Class average of recombinant HsTPPII
in ‘navette’ orientation. (C) Projection of
DmTPPII in ‘navette‘ orientation (adapted from
Schönegge et al., 2012).
A 3D-variance analysis of the data set showed that the variance is restricted to the spindle
poles (see Figure 19A/B), which indicates the existence of two spindle complexes differing in
length. In order to separate the two assembly states, a ‘maximum likelihood’ approach
(ML3D) was chosen. This procedure resembles the template matching procedure, but
instead of one start reference several references are used. In addition, the discrete
assignment of orientation and class (conventionally based on maximum cross-correlation) is
replaced by probability-weighted integrals over all possible assignments. The iterative nature
of the procedure leads to an increasing accuracy in assignments of both orientation and
B C A
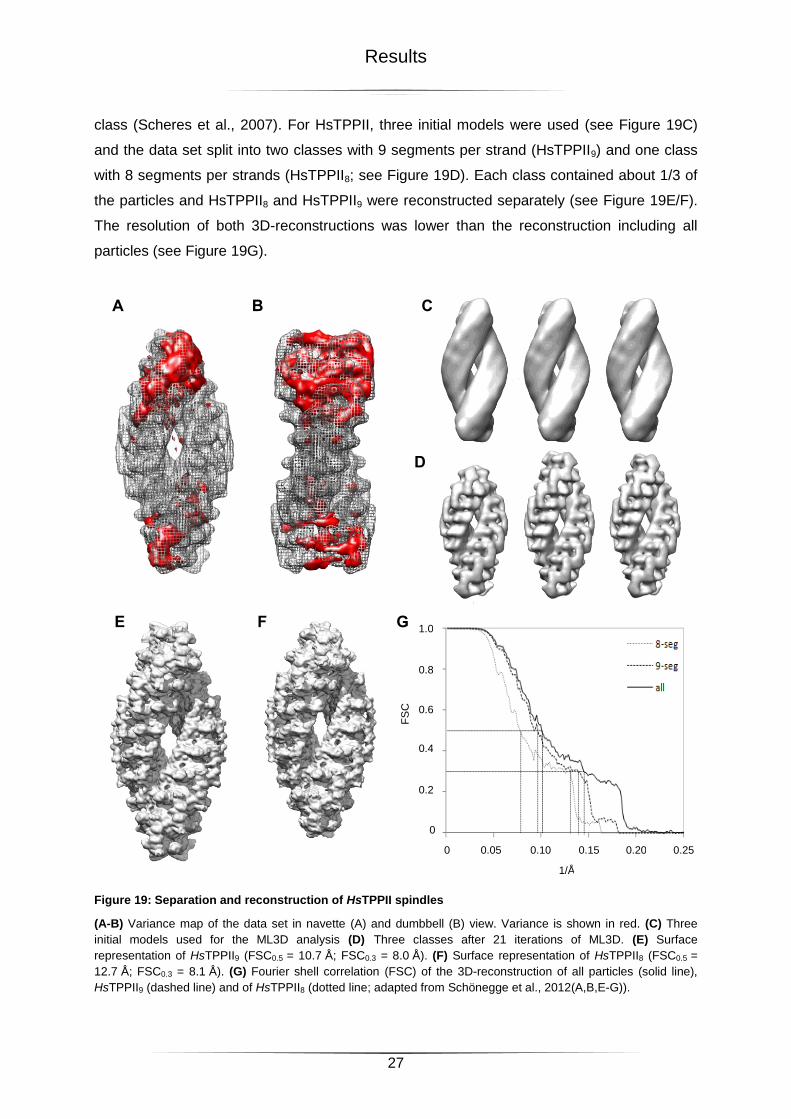
Results
27
class (Scheres et al., 2007). For HsTPPII, three initial models were used (see Figure 19C)
and the data set split into two classes with 9 segments per strand (HsTPPII9) and one class
with 8 segments per strands (HsTPPII8; see Figure 19D). Each class contained about 1/3 of
the particles and HsTPPII8 and HsTPPII9 were reconstructed separately (see Figure 19E/F).
The resolution of both 3D-reconstructions was lower than the reconstruction including all
particles (see Figure 19G).
Figure 19: Separation and reconstruction of HsTPPII spindles
(A-B) Variance map of the data set in navette (A) and dumbbell (B) view. Variance is shown in red. (C) Three
initial models used for the ML3D analysis (D) Three classes after 21 iterations of ML3D. (E) Surface
representation of HsTPPII9 (FSC0.5 = 10.7 Å; FSC0.3 = 8.0 Å). (F) Surface representation of HsTPPII8 (FSC0.5 =
12.7 Å; FSC0.3 = 8.1 Å). (G) Fourier shell correlation (FSC) of the 3D-reconstruction of all particles (solid line),
HsTPPII9 (dashed line) and of HsTPPII8 (dotted line; adapted from Schönegge et al., 2012(A,B,E-G)).
C
D
A B
E F
1.0
0.8
0.6
0.4
0.2
0
0.25 0 0.05 0.15 0.10 0.20
G
1/Å
FS
C
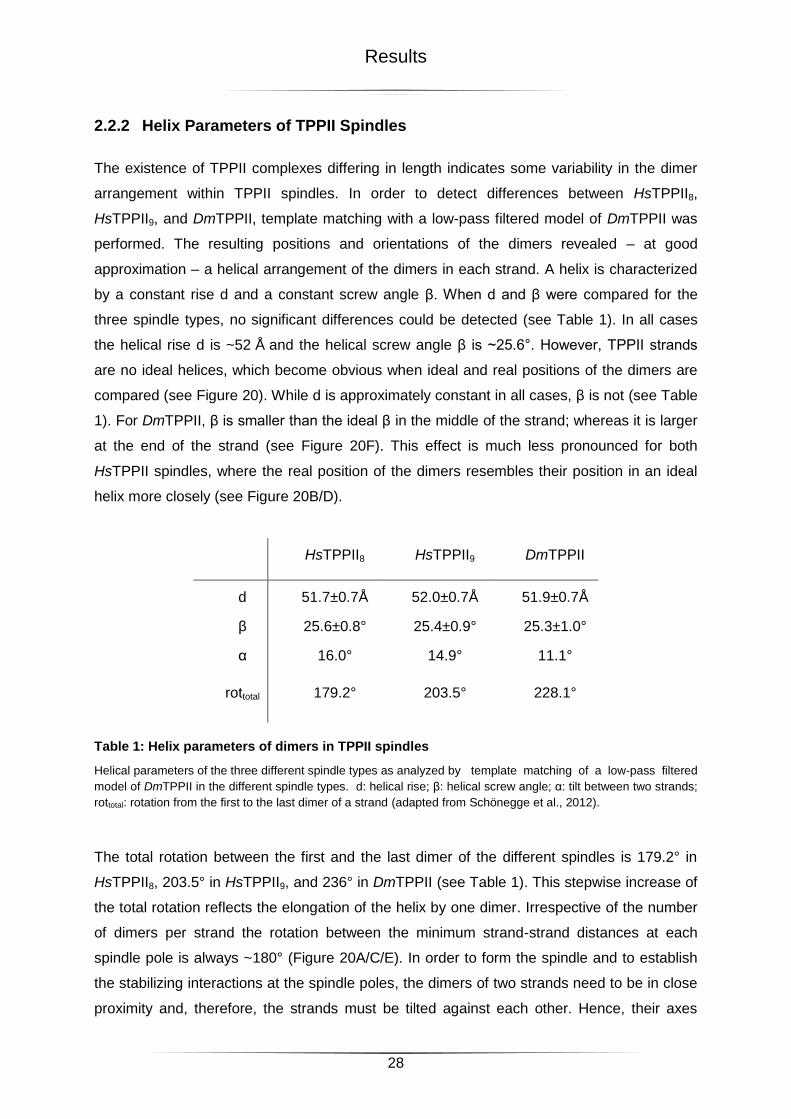
Results
28
2.2.2 Helix Parameters of TPPII Spindles
The existence of TPPII complexes differing in length indicates some variability in the dimer
arrangement within TPPII spindles. In order to detect differences between HsTPPII8,
HsTPPII9, and DmTPPII, template matching with a low-pass filtered model of DmTPPII was
performed. The resulting positions and orientations of the dimers revealed – at good
approximation – a helical arrangement of the dimers in each strand. A helix is characterized
by a constant rise d and a constant screw angle β. When d and β were compared for the
three spindle types, no significant differences could be detected (see Table 1). In all cases
the helical rise d is ~52 Å and the helical screw angle β is ~25.6°. However, TPPII strands
are no ideal helices, which become obvious when ideal and real positions of the dimers are
compared (see Figure 20). While d is approximately constant in all cases, β is not (see Table
1). For DmTPPII, β is smaller than the ideal β in the middle of the strand; whereas it is larger
at the end of the strand (see Figure 20F). This effect is much less pronounced for both
HsTPPII spindles, where the real position of the dimers resembles their position in an ideal
helix more closely (see Figure 20B/D).
HsTPPII8 HsTPPII9 DmTPPII
d 51.7±0.7Å 52.0±0.7Å 51.9±0.7Å
β 25.6±0.8° 25.4±0.9° 25.3±1.0°
α 16.0° 14.9° 11.1°
rottotal 179.2° 203.5° 228.1°
Table 1: Helix parameters of dimers in TPPII spindles
Helical parameters of the three different spindle types as analyzed by template matching of a low-pass filtered
model of DmTPPII in the different spindle types. d: helical rise; β: helical screw angle; α: tilt between two strands;
rottotal: rotation from the first to the last dimer of a strand (adapted from Schönegge et al., 2012).
The total rotation between the first and the last dimer of the different spindles is 179.2° in
HsTPPII8, 203.5° in HsTPPII9, and 236° in DmTPPII (see Table 1). This stepwise increase of
the total rotation reflects the elongation of the helix by one dimer. Irrespective of the number
of dimers per strand the rotation between the minimum strand-strand distances at each
spindle pole is always ~180° (Figure 20A/C/E). In order to form the spindle and to establish
the stabilizing interactions at the spindle poles, the dimers of two strands need to be in close
proximity and, therefore, the strands must be tilted against each other. Hence, their axes
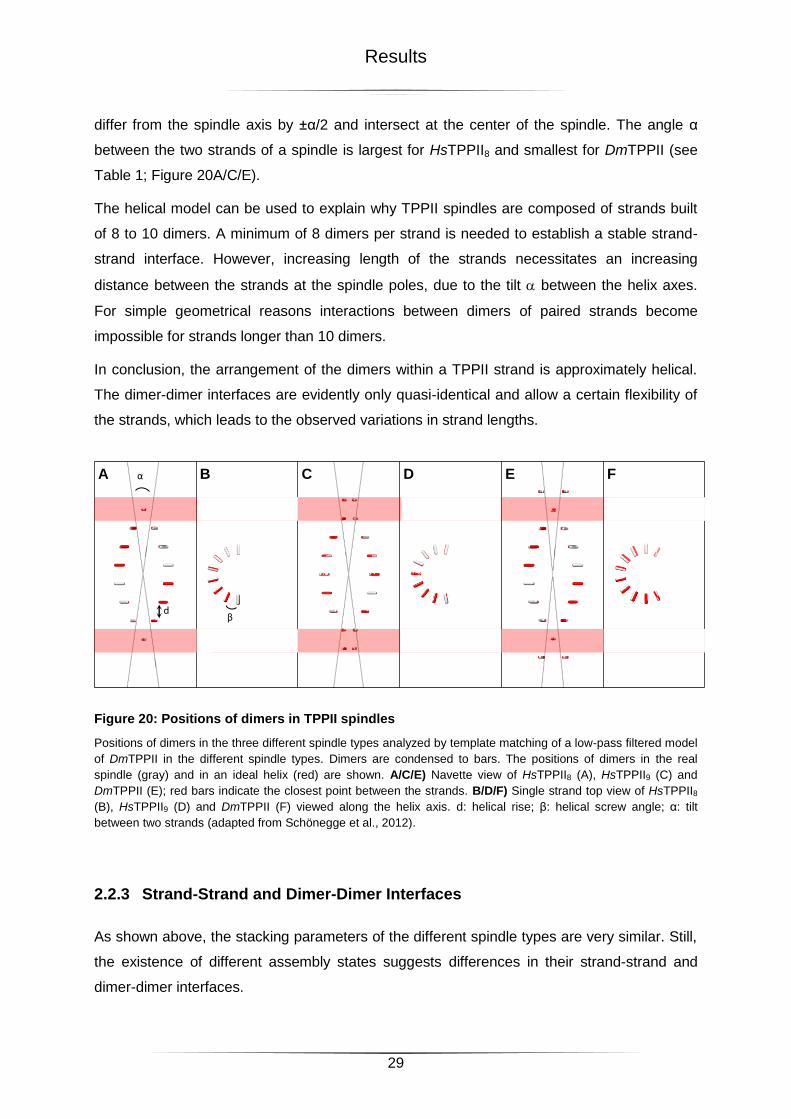
Results
29
differ from the spindle axis by ±α/2 and intersect at the center of the spindle. The angle α
between the two strands of a spindle is largest for HsTPPII8 and smallest for DmTPPII (see
Table 1; Figure 20A/C/E).
The helical model can be used to explain why TPPII spindles are composed of strands built
of 8 to 10 dimers. A minimum of 8 dimers per strand is needed to establish a stable strand-
strand interface. However, increasing length of the strands necessitates an increasing
distance between the strands at the spindle poles, due to the tilt between the helix axes.
For simple geometrical reasons interactions between dimers of paired strands become
impossible for strands longer than 10 dimers.
In conclusion, the arrangement of the dimers within a TPPII strand is approximately helical.
The dimer-dimer interfaces are evidently only quasi-identical and allow a certain flexibility of
the strands, which leads to the observed variations in strand lengths.
Figure 20: Positions of dimers in TPPII spindles
Positions of dimers in the three different spindle types analyzed by template matching of a low-pass filtered model
of DmTPPII in the different spindle types. Dimers are condensed to bars. The positions of dimers in the real
spindle (gray) and in an ideal helix (red) are shown. A/C/E) Navette view of HsTPPII8 (A), HsTPPII9 (C) and
DmTPPII (E); red bars indicate the closest point between the strands. B/D/F) Single strand top view of HsTPPII8
(B), HsTPPII9 (D) and DmTPPII (F) viewed along the helix axis. d: helical rise; β: helical screw angle; α: tilt
between two strands (adapted from Schönegge et al., 2012).
2.2.3 Strand-Strand and Dimer-Dimer Interfaces
As shown above, the stacking parameters of the different spindle types are very similar. Still,
the existence of different assembly states suggests differences in their strand-strand and
dimer-dimer interfaces.
A B C D E F α
β d
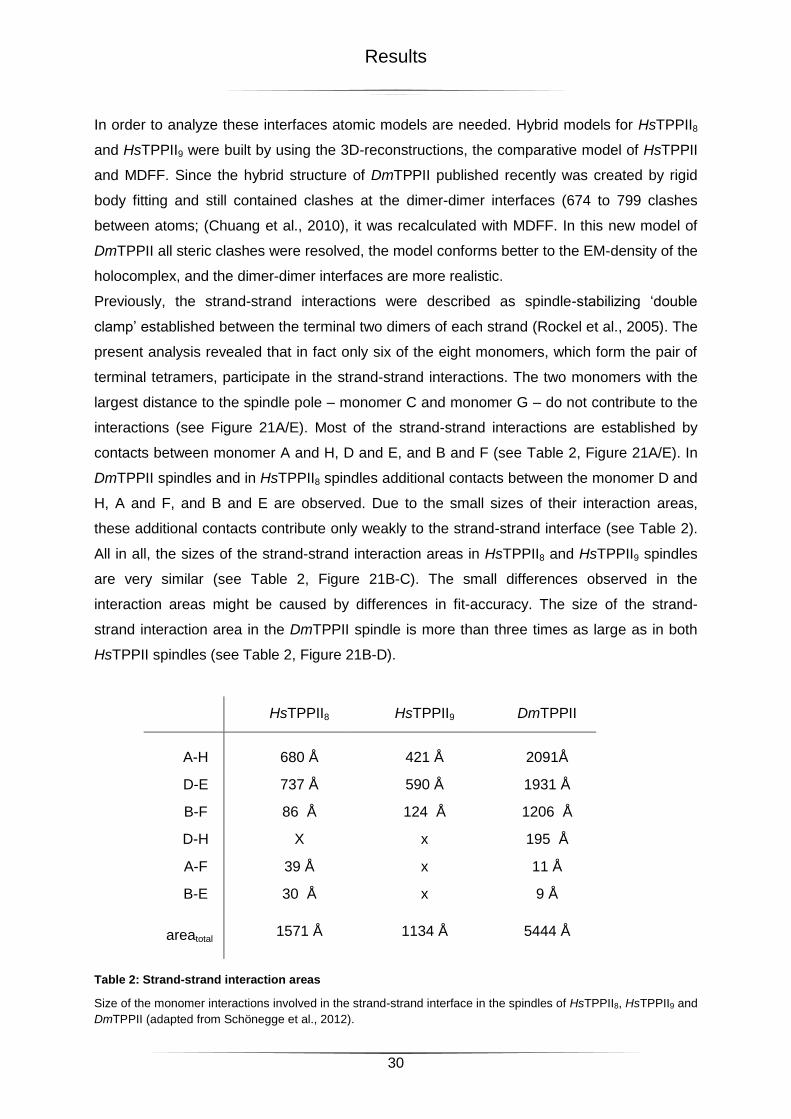
Results
30
In order to analyze these interfaces atomic models are needed. Hybrid models for HsTPPII8
and HsTPPII9 were built by using the 3D-reconstructions, the comparative model of HsTPPII
and MDFF. Since the hybrid structure of DmTPPII published recently was created by rigid
body fitting and still contained clashes at the dimer-dimer interfaces (674 to 799 clashes
between atoms; (Chuang et al., 2010), it was recalculated with MDFF. In this new model of
DmTPPII all steric clashes were resolved, the model conforms better to the EM-density of the
holocomplex, and the dimer-dimer interfaces are more realistic.
Previously, the strand-strand interactions were described as spindle-stabilizing ‘double
clamp’ established between the terminal two dimers of each strand (Rockel et al., 2005). The
present analysis revealed that in fact only six of the eight monomers, which form the pair of
terminal tetramers, participate in the strand-strand interactions. The two monomers with the
largest distance to the spindle pole – monomer C and monomer G – do not contribute to the
interactions (see Figure 21A/E). Most of the strand-strand interactions are established by
contacts between monomer A and H, D and E, and B and F (see Table 2, Figure 21A/E). In
DmTPPII spindles and in HsTPPII8 spindles additional contacts between the monomer D and
H, A and F, and B and E are observed. Due to the small sizes of their interaction areas,
these additional contacts contribute only weakly to the strand-strand interface (see Table 2).
All in all, the sizes of the strand-strand interaction areas in HsTPPII8 and HsTPPII9 spindles
are very similar (see Table 2, Figure 21B-C). The small differences observed in the
interaction areas might be caused by differences in fit-accuracy. The size of the strand-
strand interaction area in the DmTPPII spindle is more than three times as large as in both
HsTPPII spindles (see Table 2, Figure 21B-D).
HsTPPII8 HsTPPII9 DmTPPII
A-H 680 Å 421 Å 2091Å
D-E 737 Å 590 Å 1931 Å
B-F 86 Å 124 Å 1206 Å
D-H X x 195 Å
A-F 39 Å x 11 Å
B-E 30 Å x 9 Å
areatotal 1571 Å 1134 Å 5444 Å
Table 2: Strand-strand interaction areas
Size of the monomer interactions involved in the strand-strand interface in the spindles of HsTPPII8, HsTPPII9 and
DmTPPII (adapted from Schönegge et al., 2012).
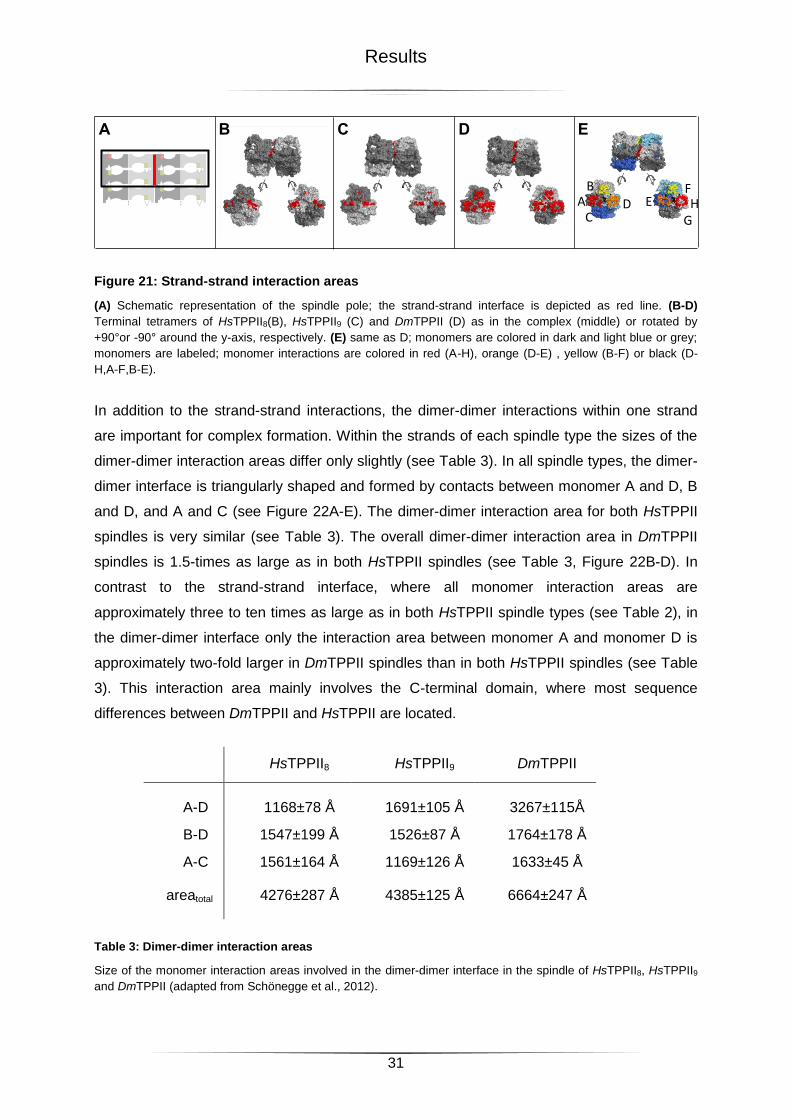
Results
31
Figure 21: Strand-strand interaction areas
(A) Schematic representation of the spindle pole; the strand-strand interface is depicted as red line. (B-D)
Terminal tetramers of HsTPPII8(B), HsTPPII9 (C) and DmTPPII (D) as in the complex (middle) or rotated by
+90°or -90° around the y-axis, respectively. (E) same as D; monomers are colored in dark and light blue or grey;
monomers are labeled; monomer interactions are colored in red (A-H), orange (D-E) , yellow (B-F) or black (D-
H,A-F,B-E).
In addition to the strand-strand interactions, the dimer-dimer interactions within one strand
are important for complex formation. Within the strands of each spindle type the sizes of the
dimer-dimer interaction areas differ only slightly (see Table 3). In all spindle types, the dimer-
dimer interface is triangularly shaped and formed by contacts between monomer A and D, B
and D, and A and C (see Figure 22A-E). The dimer-dimer interaction area for both HsTPPII
spindles is very similar (see Table 3). The overall dimer-dimer interaction area in DmTPPII
spindles is 1.5-times as large as in both HsTPPII spindles (see Table 3, Figure 22B-D). In
contrast to the strand-strand interface, where all monomer interaction areas are
approximately three to ten times as large as in both HsTPPII spindle types (see Table 2), in
the dimer-dimer interface only the interaction area between monomer A and monomer D is
approximately two-fold larger in DmTPPII spindles than in both HsTPPII spindles (see Table
3). This interaction area mainly involves the C-terminal domain, where most sequence
differences between DmTPPII and HsTPPII are located.
HsTPPII8 HsTPPII9 DmTPPII
A-D 1168±78 Å 1691±105 Å 3267±115Å
B-D 1547±199 Å 1526±87 Å 1764±178 Å
A-C 1561±164 Å 1169±126 Å 1633±45 Å
areatotal 4276±287 Å 4385±125 Å 6664±247 Å
Table 3: Dimer-dimer interaction areas
Size of the monomer interaction areas involved in the dimer-dimer interface in the spindle of HsTPPII8, HsTPPII9
and DmTPPII (adapted from Schönegge et al., 2012).
C B D E
C D
B A E
G H
F
A
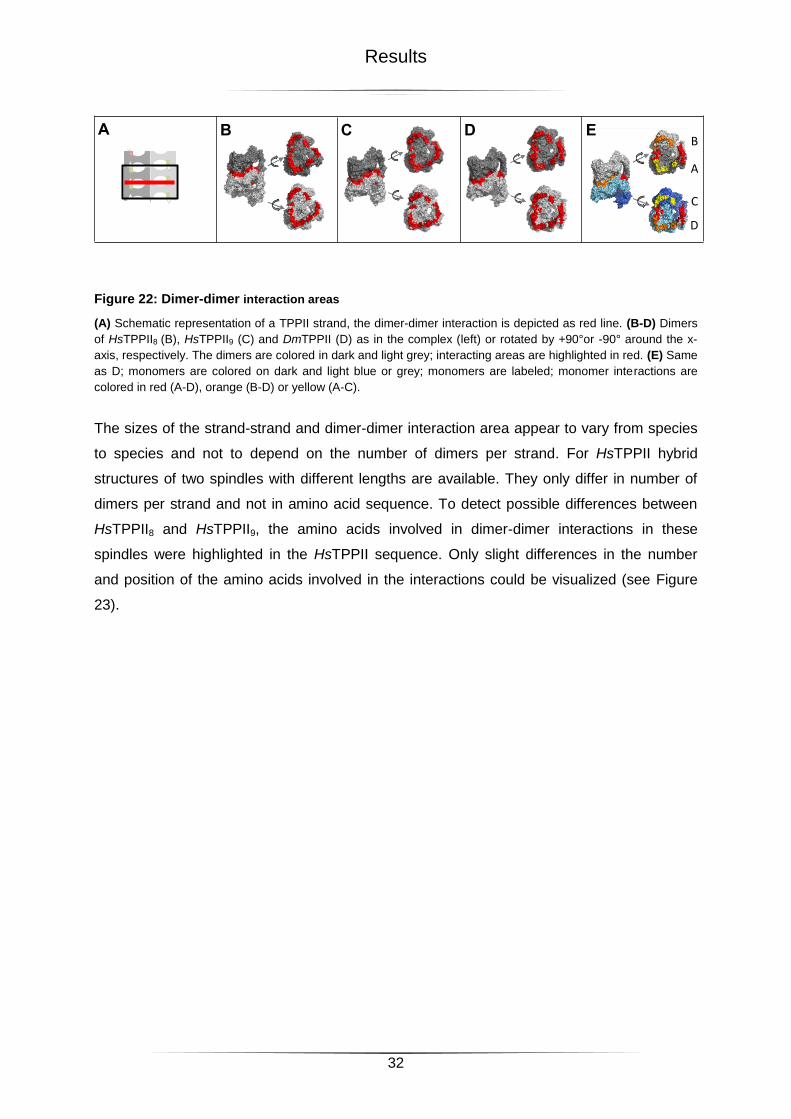
Results
32
Figure 22: Dimer-dimer interaction areas
(A) Schematic representation of a TPPII strand, the dimer-dimer interaction is depicted as red line. (B-D) Dimers
of HsTPPII8 (B), HsTPPII9 (C) and DmTPPII (D) as in the complex (left) or rotated by +90°or -90° around the x-
axis, respectively. The dimers are colored in dark and light grey; interacting areas are highlighted in red. (E) Same
as D; monomers are colored on dark and light blue or grey; monomers are labeled; monomer interactions are
colored in red (A-D), orange (B-D) or yellow (A-C).
The sizes of the strand-strand and dimer-dimer interaction area appear to vary from species
to species and not to depend on the number of dimers per strand. For HsTPPII hybrid
structures of two spindles with different lengths are available. They only differ in number of
dimers per strand and not in amino acid sequence. To detect possible differences between
HsTPPII8 and HsTPPII9, the amino acids involved in dimer-dimer interactions in these
spindles were highlighted in the HsTPPII sequence. Only slight differences in the number
and position of the amino acids involved in the interactions could be visualized (see Figure
23).
A
B
C
D
B D E C A
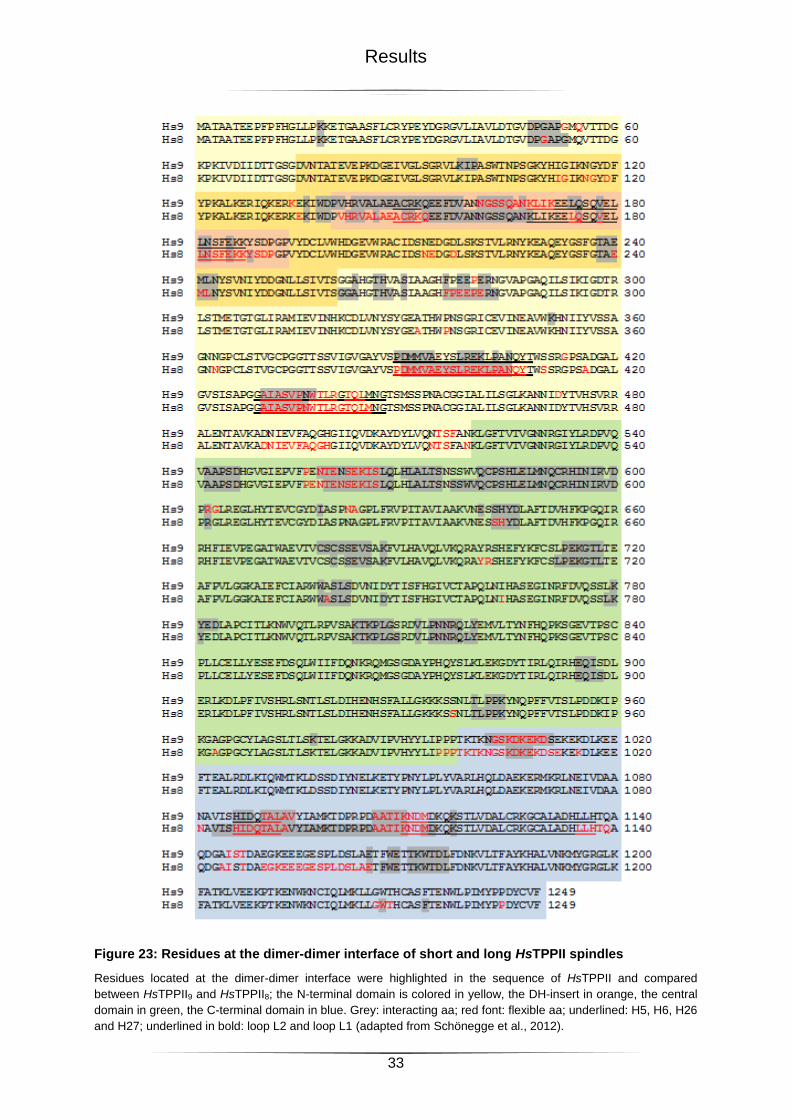
Results
33
Figure 23: Residues at the dimer-dimer interface of short and long HsTPPII spindles
Residues located at the dimer-dimer interface were highlighted in the sequence of HsTPPII and compared
between HsTPPII9 and HsTPPII8; the N-terminal domain is colored in yellow, the DH-insert in orange, the central
domain in green, the C-terminal domain in blue. Grey: interacting aa; red font: flexible aa; underlined: H5, H6, H26
and H27; underlined in bold: loop L2 and loop L1 (adapted from Schönegge et al., 2012).
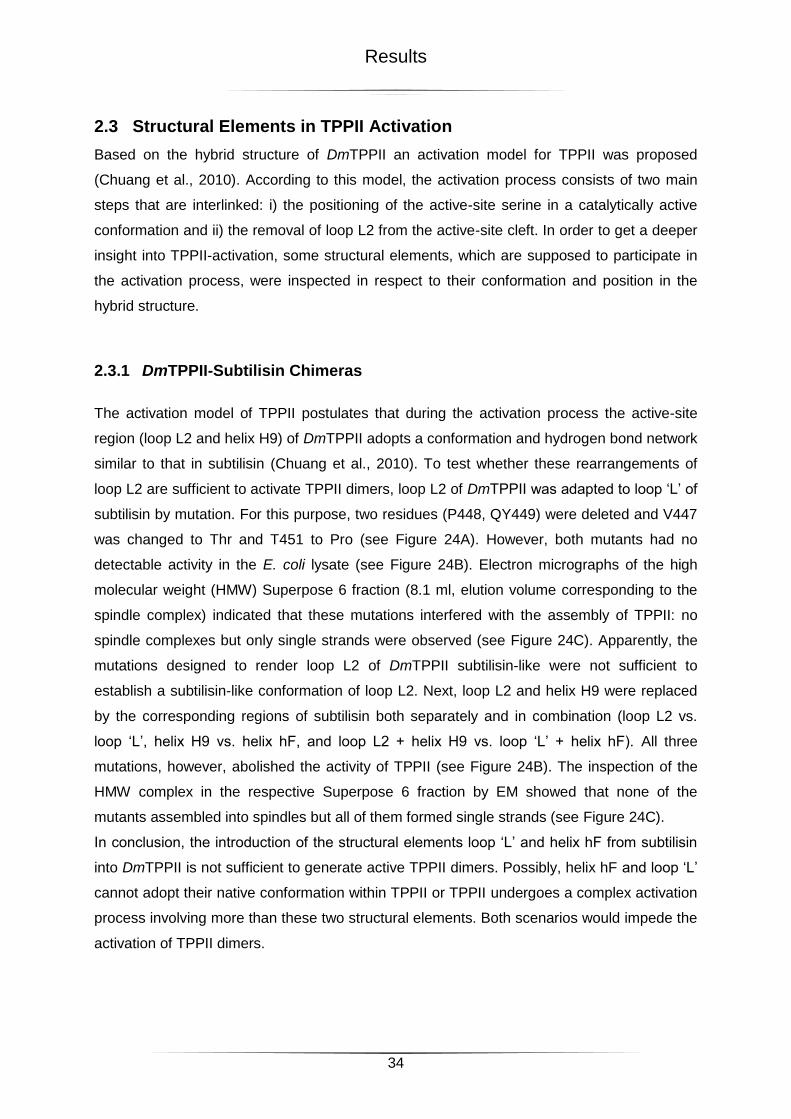
Results
34
2.3 Structural Elements in TPPII Activation
Based on the hybrid structure of DmTPPII an activation model for TPPII was proposed
(Chuang et al., 2010). According to this model, the activation process consists of two main
steps that are interlinked: i) the positioning of the active-site serine in a catalytically active
conformation and ii) the removal of loop L2 from the active-site cleft. In order to get a deeper
insight into TPPII-activation, some structural elements, which are supposed to participate in
the activation process, were inspected in respect to their conformation and position in the
hybrid structure.
2.3.1 DmTPPII-Subtilisin Chimeras
The activation model of TPPII postulates that during the activation process the active-site
region (loop L2 and helix H9) of DmTPPII adopts a conformation and hydrogen bond network
similar to that in subtilisin (Chuang et al., 2010). To test whether these rearrangements of
loop L2 are sufficient to activate TPPII dimers, loop L2 of DmTPPII was adapted to loop ‘L’ of
subtilisin by mutation. For this purpose, two residues (P448, QY449) were deleted and V447
was changed to Thr and T451 to Pro (see Figure 24A). However, both mutants had no
detectable activity in the E. coli lysate (see Figure 24B). Electron micrographs of the high
molecular weight (HMW) Superpose 6 fraction (8.1 ml, elution volume corresponding to the
spindle complex) indicated that these mutations interfered with the assembly of TPPII: no
spindle complexes but only single strands were observed (see Figure 24C). Apparently, the
mutations designed to render loop L2 of DmTPPII subtilisin-like were not sufficient to
establish a subtilisin-like conformation of loop L2. Next, loop L2 and helix H9 were replaced
by the corresponding regions of subtilisin both separately and in combination (loop L2 vs.
loop ‘L’, helix H9 vs. helix hF, and loop L2 + helix H9 vs. loop ‘L’ + helix hF). All three
mutations, however, abolished the activity of TPPII (see Figure 24B). The inspection of the
HMW complex in the respective Superpose 6 fraction by EM showed that none of the
mutants assembled into spindles but all of them formed single strands (see Figure 24C).
In conclusion, the introduction of the structural elements loop ‘L’ and helix hF from subtilisin
into DmTPPII is not sufficient to generate active TPPII dimers. Possibly, helix hF and loop ‘L’
cannot adopt their native conformation within TPPII or TPPII undergoes a complex activation
process involving more than these two structural elements. Both scenarios would impede the
activation of TPPII dimers.
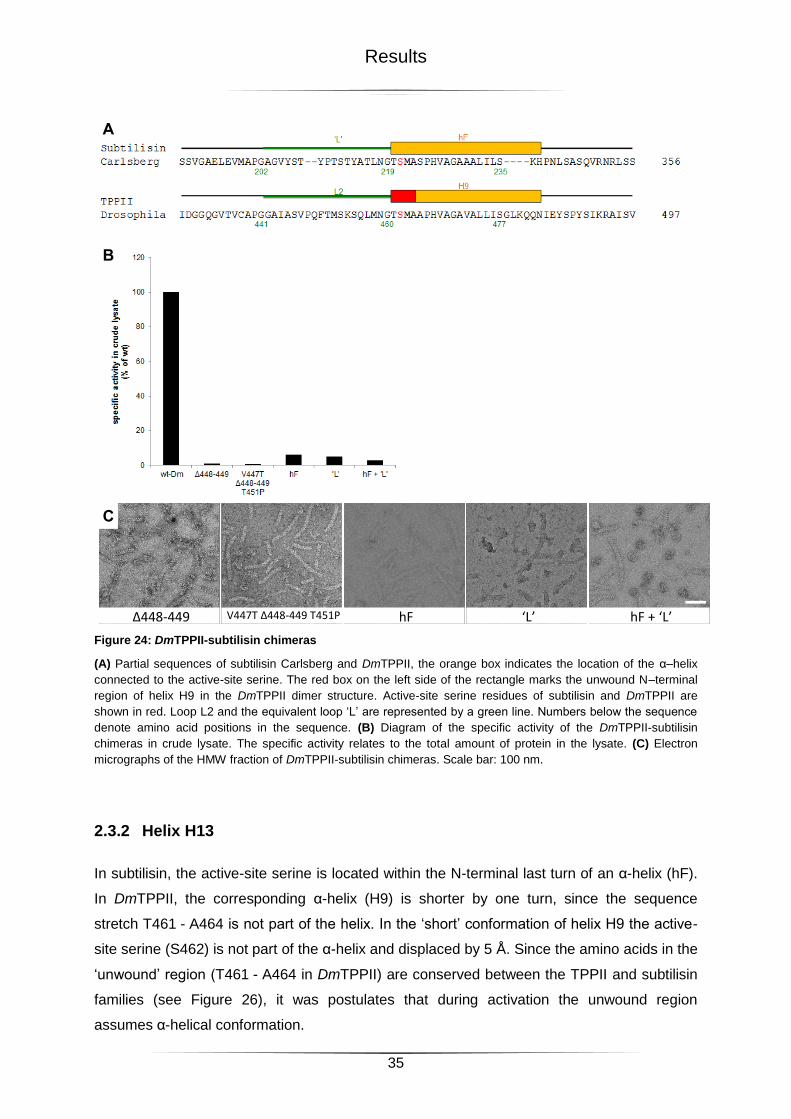
Results
35
Figure 24: DmTPPII-subtilisin chimeras
(A) Partial sequences of subtilisin Carlsberg and DmTPPII, the orange box indicates the location of the α–helix
connected to the active-site serine. The red box on the left side of the rectangle marks the unwound N–terminal
region of helix H9 in the DmTPPII dimer structure. Active-site serine residues of subtilisin and DmTPPII are
shown in red. Loop L2 and the equivalent loop ‘L’ are represented by a green line. Numbers below the sequence
denote amino acid positions in the sequence. (B) Diagram of the specific activity of the DmTPPII-subtilisin
chimeras in crude lysate. The specific activity relates to the total amount of protein in the lysate. (C) Electron
micrographs of the HMW fraction of DmTPPII-subtilisin chimeras. Scale bar: 100 nm.
2.3.2 Helix H13
In subtilisin, the active-site serine is located within the N-terminal last turn of an α-helix (hF).
In DmTPPII, the corresponding α-helix (H9) is shorter by one turn, since the sequence
stretch T461 - A464 is not part of the helix. In the ‘short’ conformation of helix H9 the active-
site serine (S462) is not part of the α-helix and displaced by 5 Å. Since the amino acids in the
‘unwound’ region (T461 - A464 in DmTPPII) are conserved between the TPPII and subtilisin
families (see Figure 26), it was postulates that during activation the unwound region
assumes α-helical conformation.
Δ448-449 V447T Δ448-449 T451P hF ‘L’ hF + ‘L’
A
B
C
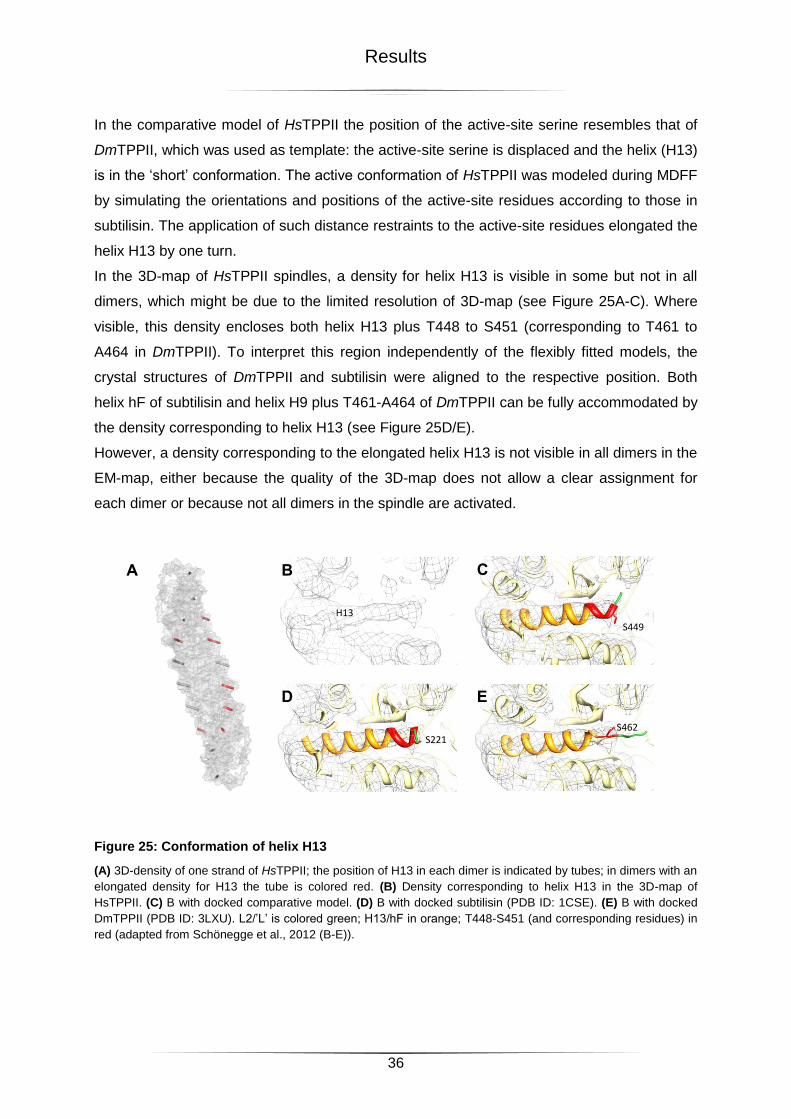
Results
36
In the comparative model of HsTPPII the position of the active-site serine resembles that of
DmTPPII, which was used as template: the active-site serine is displaced and the helix (H13)
is in the ‘short’ conformation. The active conformation of HsTPPII was modeled during MDFF
by simulating the orientations and positions of the active-site residues according to those in
subtilisin. The application of such distance restraints to the active-site residues elongated the
helix H13 by one turn.
In the 3D-map of HsTPPII spindles, a density for helix H13 is visible in some but not in all
dimers, which might be due to the limited resolution of 3D-map (see Figure 25A-C). Where
visible, this density encloses both helix H13 plus T448 to S451 (corresponding to T461 to
A464 in DmTPPII). To interpret this region independently of the flexibly fitted models, the
crystal structures of DmTPPII and subtilisin were aligned to the respective position. Both
helix hF of subtilisin and helix H9 plus T461-A464 of DmTPPII can be fully accommodated by
the density corresponding to helix H13 (see Figure 25D/E).
However, a density corresponding to the elongated helix H13 is not visible in all dimers in the
EM-map, either because the quality of the 3D-map does not allow a clear assignment for
each dimer or because not all dimers in the spindle are activated.
Figure 25: Conformation of helix H13
(A) 3D-density of one strand of HsTPPII; the position of H13 in each dimer is indicated by tubes; in dimers with an
elongated density for H13 the tube is colored red. (B) Density corresponding to helix H13 in the 3D-map of
HsTPPII. (C) B with docked comparative model. (D) B with docked subtilisin (PDB ID: 1CSE). (E) B with docked
DmTPPII (PDB ID: 3LXU). L2/’L’ is colored green; H13/hF in orange; T448-S451 (and corresponding residues) in
red (adapted from Schönegge et al., 2012 (B-E)).
C
D
B
E
S449
S462 S221
H13
A
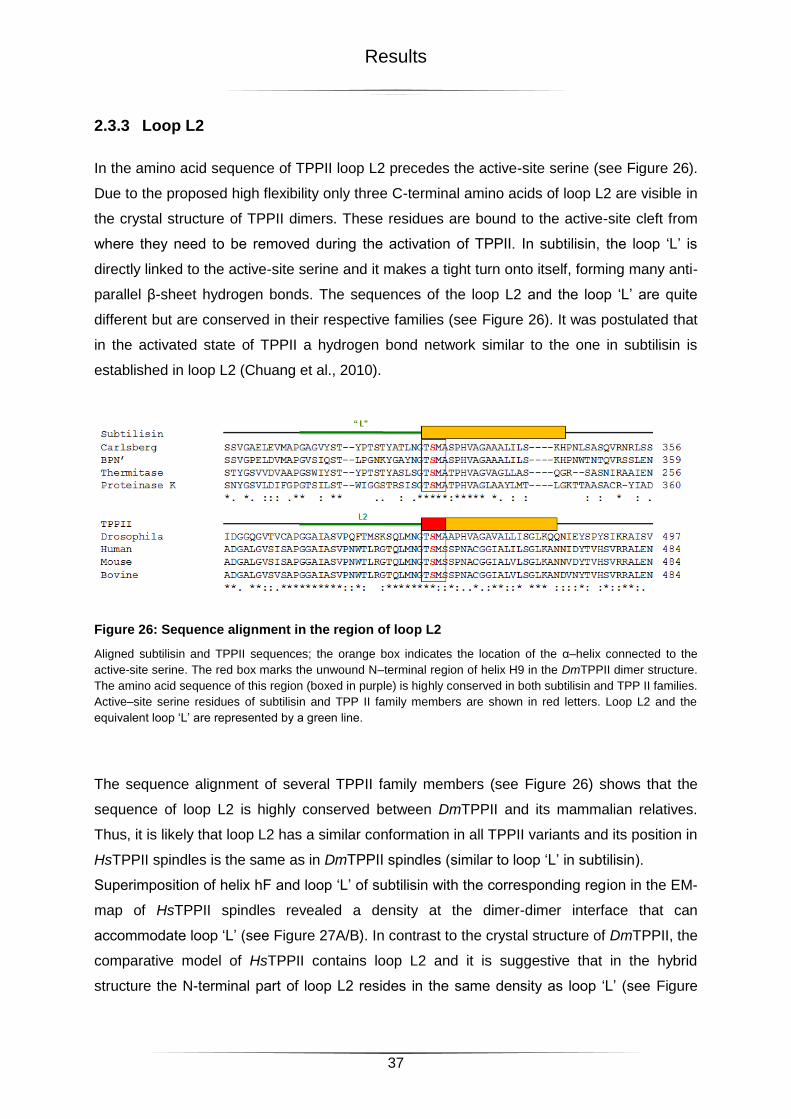
Results
37
2.3.3 Loop L2
In the amino acid sequence of TPPII loop L2 precedes the active-site serine (see Figure 26).
Due to the proposed high flexibility only three C-terminal amino acids of loop L2 are visible in
the crystal structure of TPPII dimers. These residues are bound to the active-site cleft from
where they need to be removed during the activation of TPPII. In subtilisin, the loop ‘L’ is
directly linked to the active-site serine and it makes a tight turn onto itself, forming many anti-
parallel β-sheet hydrogen bonds. The sequences of the loop L2 and the loop ‘L’ are quite
different but are conserved in their respective families (see Figure 26). It was postulated that
in the activated state of TPPII a hydrogen bond network similar to the one in subtilisin is
established in loop L2 (Chuang et al., 2010).
Figure 26: Sequence alignment in the region of loop L2
Aligned subtilisin and TPPII sequences; the orange box indicates the location of the α–helix connected to the
active-site serine. The red box marks the unwound N–terminal region of helix H9 in the DmTPPII dimer structure.
The amino acid sequence of this region (boxed in purple) is highly conserved in both subtilisin and TPP II families.
Active–site serine residues of subtilisin and TPP II family members are shown in red letters. Loop L2 and the
equivalent loop ‘L’ are represented by a green line.
The sequence alignment of several TPPII family members (see Figure 26) shows that the
sequence of loop L2 is highly conserved between DmTPPII and its mammalian relatives.
Thus, it is likely that loop L2 has a similar conformation in all TPPII variants and its position in
HsTPPII spindles is the same as in DmTPPII spindles (similar to loop ‘L’ in subtilisin).
Superimposition of helix hF and loop ‘L’ of subtilisin with the corresponding region in the EM-
map of HsTPPII spindles revealed a density at the dimer-dimer interface that can
accommodate loop ‘L’ (see Figure 27A/B). In contrast to the crystal structure of DmTPPII, the
comparative model of HsTPPII contains loop L2 and it is suggestive that in the hybrid
structure the N-terminal part of loop L2 resides in the same density as loop ‘L’ (see Figure
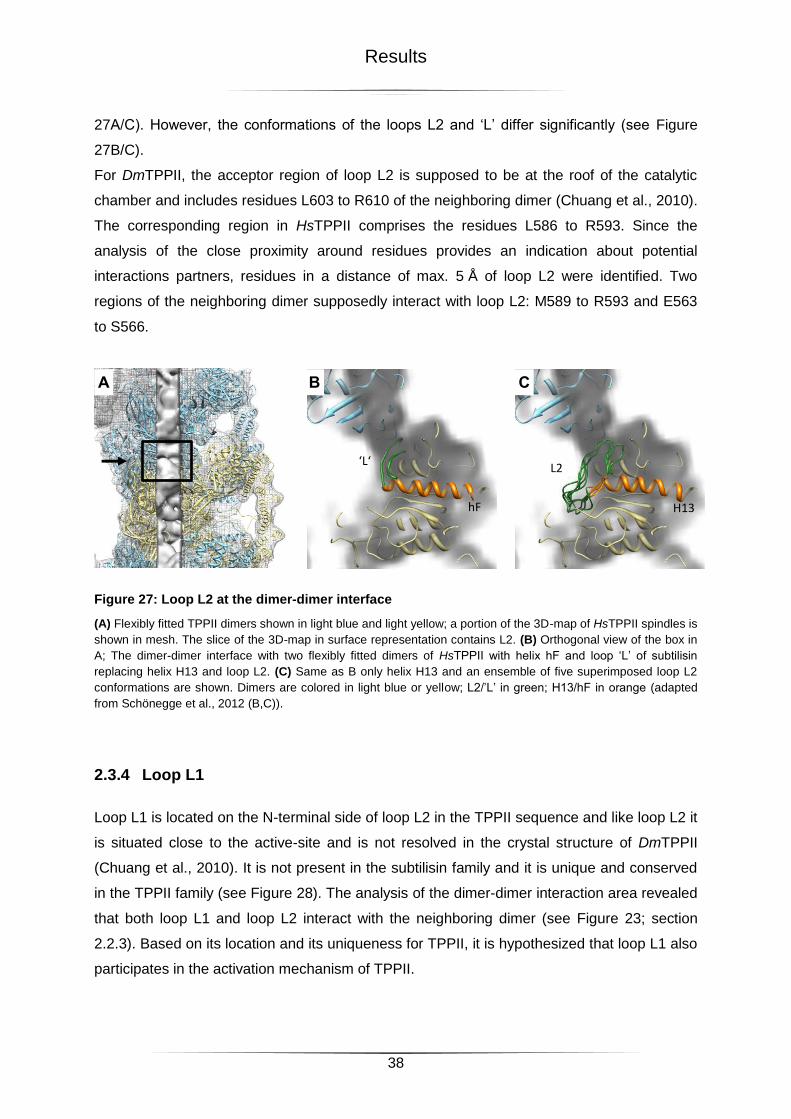
Results
38
27A/C). However, the conformations of the loops L2 and ‘L’ differ significantly (see Figure
27B/C).
For DmTPPII, the acceptor region of loop L2 is supposed to be at the roof of the catalytic
chamber and includes residues L603 to R610 of the neighboring dimer (Chuang et al., 2010).
The corresponding region in HsTPPII comprises the residues L586 to R593. Since the
analysis of the close proximity around residues provides an indication about potential
interactions partners, residues in a distance of max. 5 Å of loop L2 were identified. Two
regions of the neighboring dimer supposedly interact with loop L2: M589 to R593 and E563
to S566.
Figure 27: Loop L2 at the dimer-dimer interface
(A) Flexibly fitted TPPII dimers shown in light blue and light yellow; a portion of the 3D-map of HsTPPII spindles is
shown in mesh. The slice of the 3D-map in surface representation contains L2. (B) Orthogonal view of the box in
A; The dimer-dimer interface with two flexibly fitted dimers of HsTPPII with helix hF and loop ‘L’ of subtilisin
replacing helix H13 and loop L2. (C) Same as B only helix H13 and an ensemble of five superimposed loop L2
conformations are shown. Dimers are colored in light blue or yellow; L2/’L’ in green; H13/hF in orange (adapted
from Schönegge et al., 2012 (B,C)).
2.3.4 Loop L1
Loop L1 is located on the N-terminal side of loop L2 in the TPPII sequence and like loop L2 it
is situated close to the active-site and is not resolved in the crystal structure of DmTPPII
(Chuang et al., 2010). It is not present in the subtilisin family and it is unique and conserved
in the TPPII family (see Figure 28). The analysis of the dimer-dimer interaction area revealed
that both loop L1 and loop L2 interact with the neighboring dimer (see Figure 23; section
2.2.3). Based on its location and its uniqueness for TPPII, it is hypothesized that loop L1 also
participates in the activation mechanism of TPPII.
L2
H13
‘L‘
hF
A B C
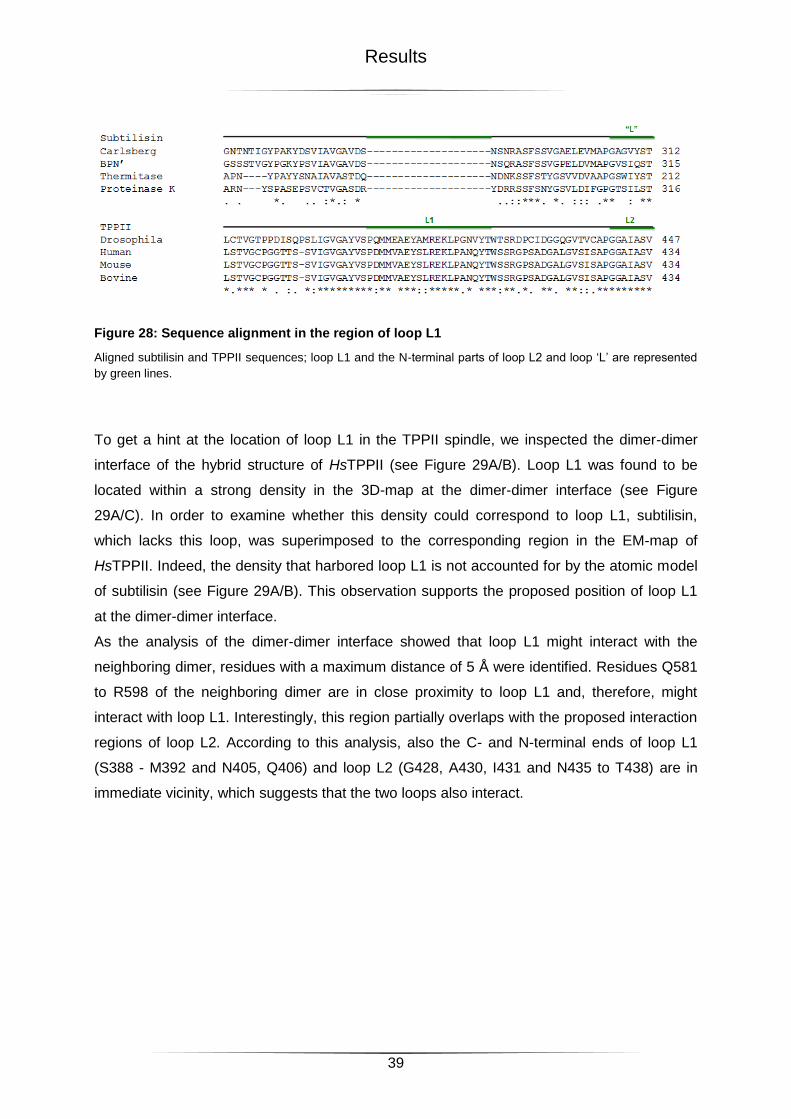
Results
39
Figure 28: Sequence alignment in the region of loop L1
Aligned subtilisin and TPPII sequences; loop L1 and the N-terminal parts of loop L2 and loop ‘L’ are represented
by green lines.
To get a hint at the location of loop L1 in the TPPII spindle, we inspected the dimer-dimer
interface of the hybrid structure of HsTPPII (see Figure 29A/B). Loop L1 was found to be
located within a strong density in the 3D-map at the dimer-dimer interface (see Figure
29A/C). In order to examine whether this density could correspond to loop L1, subtilisin,
which lacks this loop, was superimposed to the corresponding region in the EM-map of
HsTPPII. Indeed, the density that harbored loop L1 is not accounted for by the atomic model
of subtilisin (see Figure 29A/B). This observation supports the proposed position of loop L1
at the dimer-dimer interface.
As the analysis of the dimer-dimer interface showed that loop L1 might interact with the
neighboring dimer, residues with a maximum distance of 5 Å were identified. Residues Q581
to R598 of the neighboring dimer are in close proximity to loop L1 and, therefore, might
interact with loop L1. Interestingly, this region partially overlaps with the proposed interaction
regions of loop L2. According to this analysis, also the C- and N-terminal ends of loop L1
(S388 - M392 and N405, Q406) and loop L2 (G428, A430, I431 and N435 to T438) are in
immediate vicinity, which suggests that the two loops also interact.
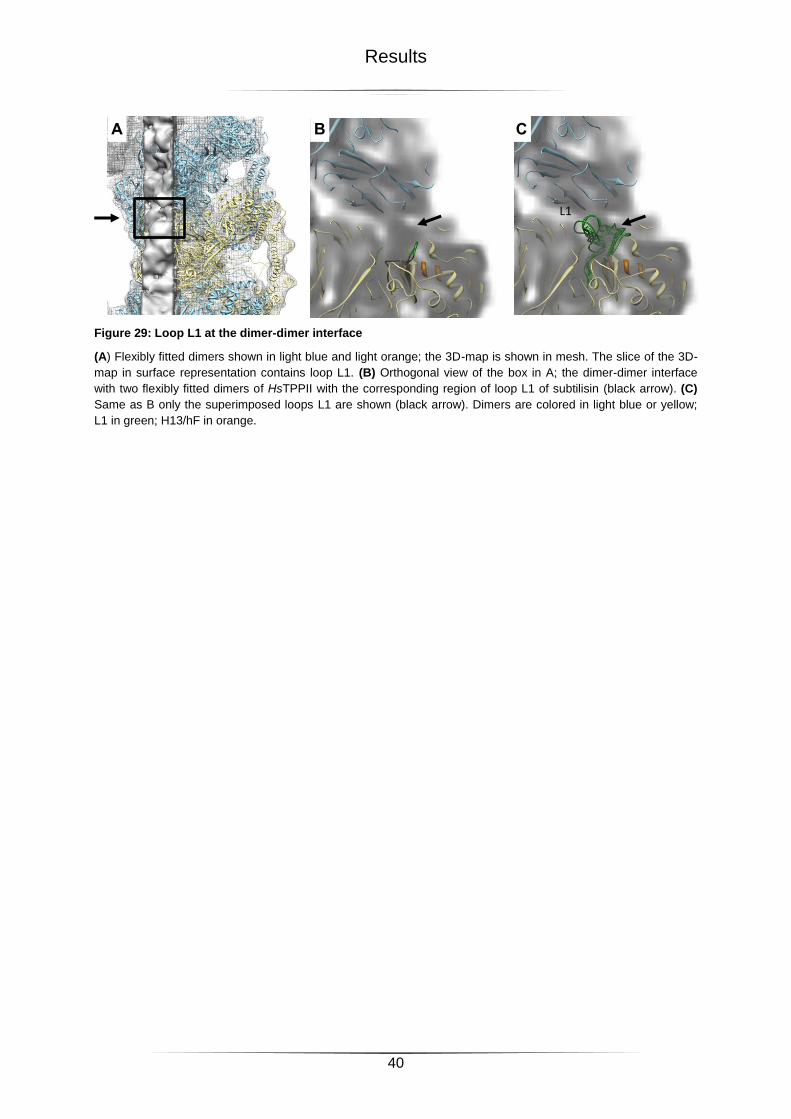
Results
40
Figure 29: Loop L1 at the dimer-dimer interface
(A) Flexibly fitted dimers shown in light blue and light orange; the 3D-map is shown in mesh. The slice of the 3D-
map in surface representation contains loop L1. (B) Orthogonal view of the box in A; the dimer-dimer interface
with two flexibly fitted dimers of HsTPPII with the corresponding region of loop L1 of subtilisin (black arrow). (C)
Same as B only the superimposed loops L1 are shown (black arrow). Dimers are colored in light blue or yellow;
L1 in green; H13/hF in orange.
A B C
L1
Results
41
2.4 Mutational Analysis of the Dimer-Dimer Interactions
As shown in the present and in other studies, the native conformation of the dimer-dimer
interface is important for both assembly and activity of TPPII (Chuang et al., 2010; Seyit et
al., 2006; Tomkinson, 2000). So far no information about the nature of the dimer-dimer
interactions is available. The activation model proposes interactions between loop L2 and its
acceptor region that are functionally relevant (Chuang et al., 2010). The data presented
above (see section 2.3.3 and 2.3.4) supports the idea of the localization and participation of
loop L2 at dimer-dimer interactions in the spindle complex and indicates that loop L1 also
takes part in these interactions. In order to get a clue about the exact roles of loop L2 and
loop L1 in the activation process, a mutational analysis of sequence stretches putatively
involved in dimer-dimer interactions and in the activation process was performed. All
mutations introduced were designed to abolish specific interactions: i) deletion of the whole
loop regions to exam their importance, and ii) systematic exchange of single amino acids for
alanine (Ala-screen) to identify single interaction pairs.
2.4.1 Loop L2
The deletion of loop L2 (ΔG442-N459) in DmTPPII strongly decreased the specific activity in
crude lysate of E. coli cells expressing the mutated TPPII (see Figure 30A-C). In order to
examine whether the mutation also affected the morphology of the TPPII complex, the
protein was purified by SEC as final step and the high molecular weight (HMW) fraction (8.1
ml; elution volume corresponding to the spindle complex) was scrutinized by EM. In the
HMW fraction of ΔL2DmTPPII only single strands but no spindle complex was observed (see
Figure 31).
In order to investigate which residue of loop L2 is critical for TPPII activation, an Ala-screen
was performed. The exchange of each amino acid to alanine had various effects on activity
(see Figure 30A-C) and assembly (see Figure 31) of TPPII and, according to these effects,
the mutants were classified in four groups: i) mutants that form spindles and show more than
50% specific activity (in figures: A), ii) mutants that form spindles and show less than 50%
specific activity (in figures: A), iii) mutants that form single strands only and show more than
50% specific activity (in figures: N), and iv) mutants that form single strands only and show
less than 50% specific activity (in figures: N).
Of the thirteen mutants of the Ala-screen three fell into goup i, two into group ii, two into
group iii, and seven into group iv (see Figure 30A-D and Figure 31).
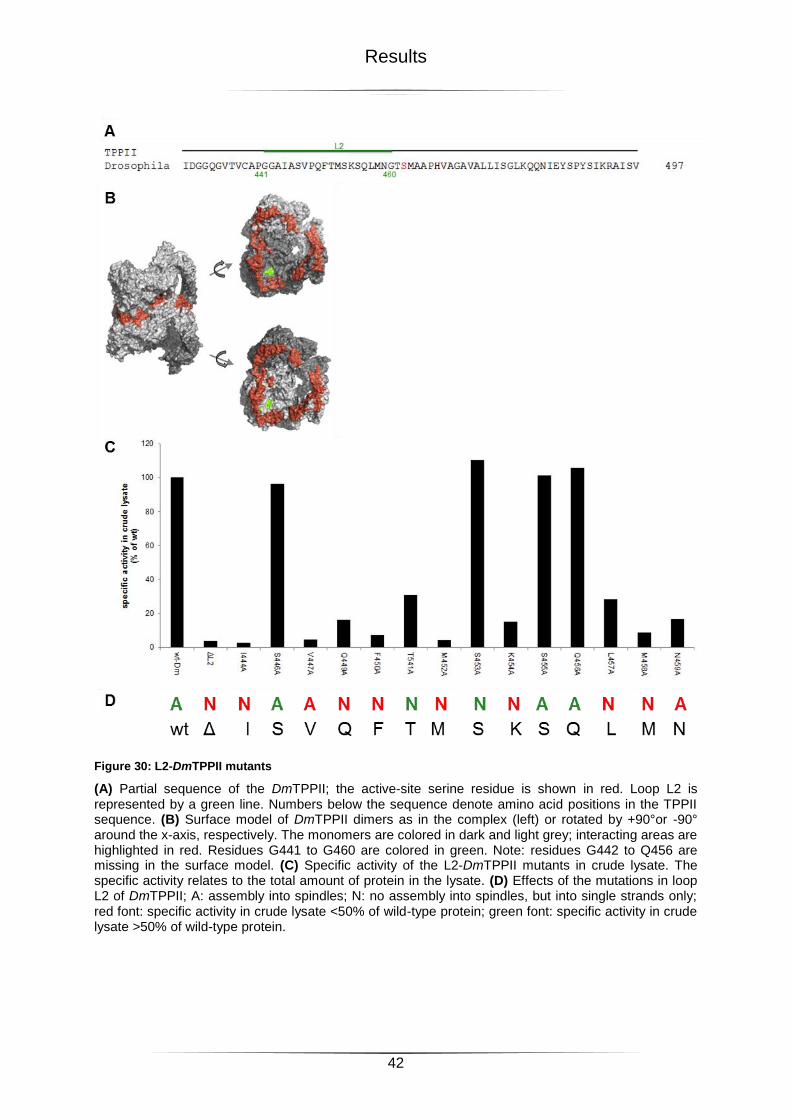
Results
42
Figure 30: L2-DmTPPII mutants
(A) Partial sequence of the DmTPPII; the active-site serine residue is shown in red. Loop L2 is represented by a green line. Numbers below the sequence denote amino acid positions in the TPPII sequence. (B) Surface model of DmTPPII dimers as in the complex (left) or rotated by +90°or -90° around the x-axis, respectively. The monomers are colored in dark and light grey; interacting areas are highlighted in red. Residues G441 to G460 are colored in green. Note: residues G442 to Q456 are missing in the surface model. (C) Specific activity of the L2-DmTPPII mutants in crude lysate. The specific activity relates to the total amount of protein in the lysate. (D) Effects of the mutations in loop L2 of DmTPPII; A: assembly into spindles; N: no assembly into spindles, but into single strands only; red font: specific activity in crude lysate <50% of wild-type protein; green font: specific activity in crude lysate >50% of wild-type protein.
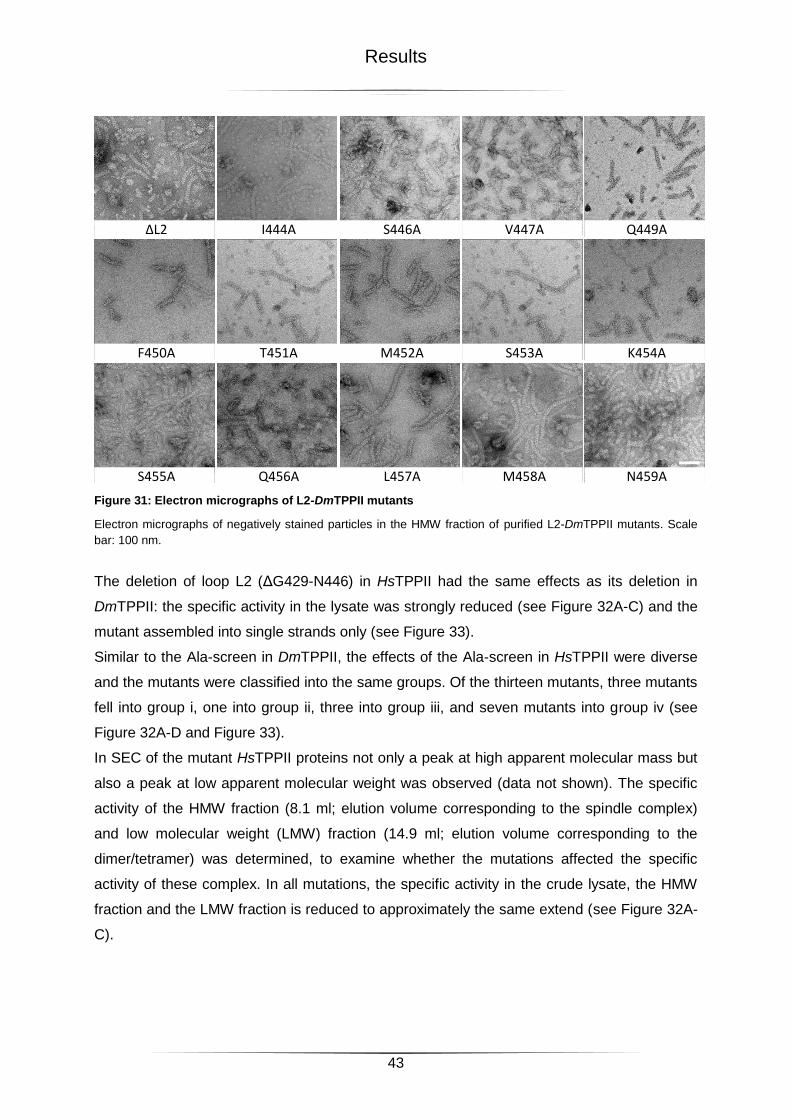
Results
43
Figure 31: Electron micrographs of L2-DmTPPII mutants
Electron micrographs of negatively stained particles in the HMW fraction of purified L2-DmTPPII mutants. Scale
bar: 100 nm.
The deletion of loop L2 (ΔG429-N446) in HsTPPII had the same effects as its deletion in
DmTPPII: the specific activity in the lysate was strongly reduced (see Figure 32A-C) and the
mutant assembled into single strands only (see Figure 33).
Similar to the Ala-screen in DmTPPII, the effects of the Ala-screen in HsTPPII were diverse
and the mutants were classified into the same groups. Of the thirteen mutants, three mutants
fell into group i, one into group ii, three into group iii, and seven mutants into group iv (see
Figure 32A-D and Figure 33).
In SEC of the mutant HsTPPII proteins not only a peak at high apparent molecular mass but
also a peak at low apparent molecular weight was observed (data not shown). The specific
activity of the HMW fraction (8.1 ml; elution volume corresponding to the spindle complex)
and low molecular weight (LMW) fraction (14.9 ml; elution volume corresponding to the
dimer/tetramer) was determined, to examine whether the mutations affected the specific
activity of these complex. In all mutations, the specific activity in the crude lysate, the HMW
fraction and the LMW fraction is reduced to approximately the same extend (see Figure 32A-
C).
I444A S446A V447A Q449A
F450A T451A M452A S453A K454A
S455A Q456A L457A M458A
ΔL2
N459A
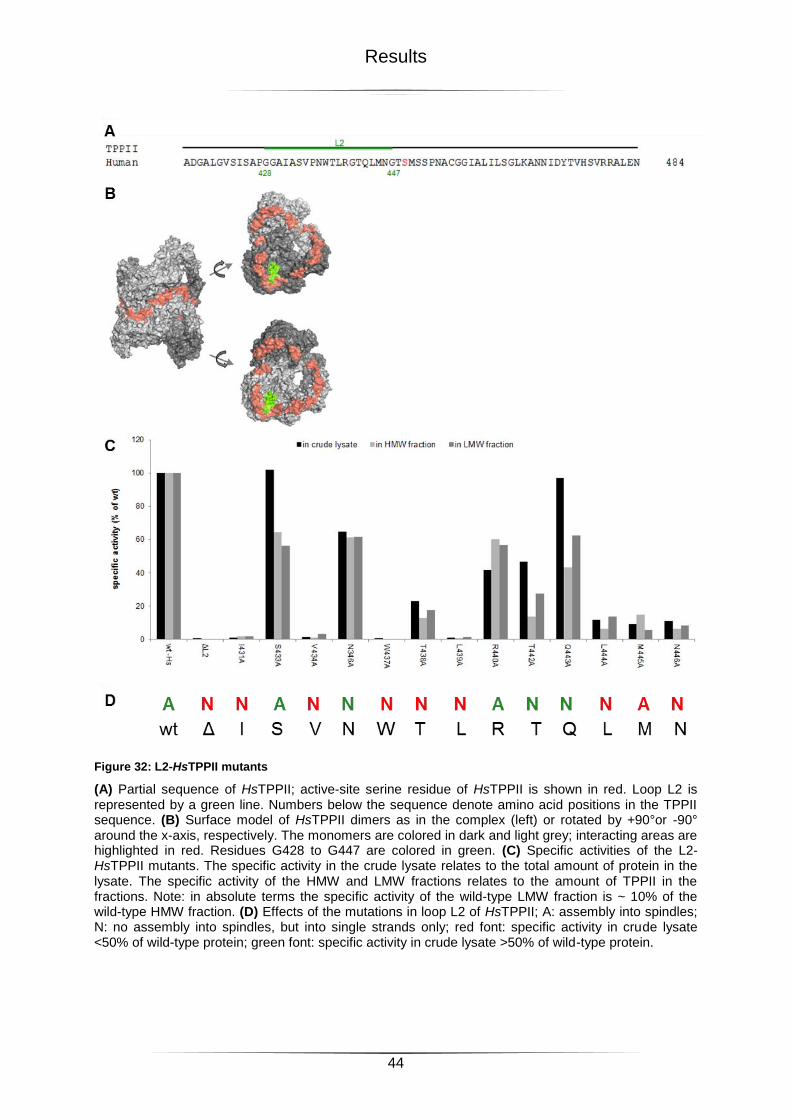
Results
44
Figure 32: L2-HsTPPII mutants
(A) Partial sequence of HsTPPII; active-site serine residue of HsTPPII is shown in red. Loop L2 is represented by a green line. Numbers below the sequence denote amino acid positions in the TPPII sequence. (B) Surface model of HsTPPII dimers as in the complex (left) or rotated by +90°or -90° around the x-axis, respectively. The monomers are colored in dark and light grey; interacting areas are highlighted in red. Residues G428 to G447 are colored in green. (C) Specific activities of the L2-HsTPPII mutants. The specific activity in the crude lysate relates to the total amount of protein in the lysate. The specific activity of the HMW and LMW fractions relates to the amount of TPPII in the fractions. Note: in absolute terms the specific activity of the wild-type LMW fraction is ~ 10% of the wild-type HMW fraction. (D) Effects of the mutations in loop L2 of HsTPPII; A: assembly into spindles; N: no assembly into spindles, but into single strands only; red font: specific activity in crude lysate <50% of wild-type protein; green font: specific activity in crude lysate >50% of wild-type protein.
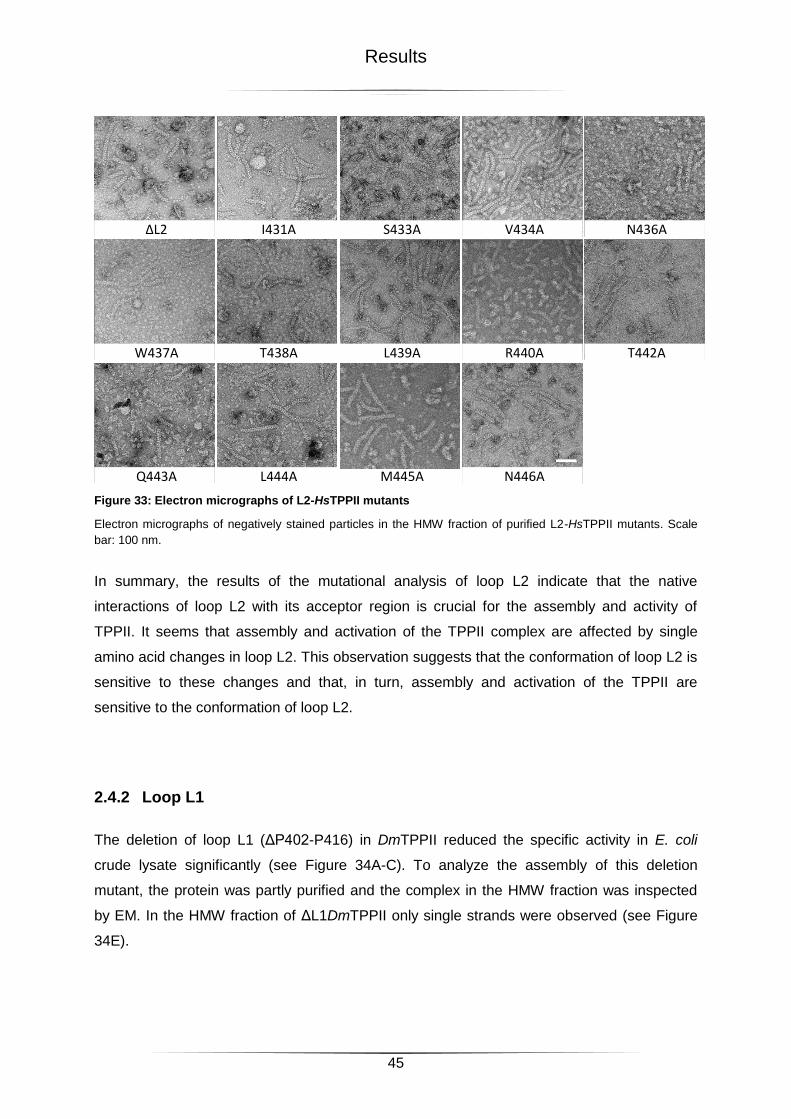
Results
45
Figure 33: Electron micrographs of L2-HsTPPII mutants
Electron micrographs of negatively stained particles in the HMW fraction of purified L2-HsTPPII mutants. Scale
bar: 100 nm.
In summary, the results of the mutational analysis of loop L2 indicate that the native
interactions of loop L2 with its acceptor region is crucial for the assembly and activity of
TPPII. It seems that assembly and activation of the TPPII complex are affected by single
amino acid changes in loop L2. This observation suggests that the conformation of loop L2 is
sensitive to these changes and that, in turn, assembly and activation of the TPPII are
sensitive to the conformation of loop L2.
2.4.2 Loop L1
The deletion of loop L1 (ΔP402-P416) in DmTPPII reduced the specific activity in E. coli
crude lysate significantly (see Figure 34A-C). To analyze the assembly of this deletion
mutant, the protein was partly purified and the complex in the HMW fraction was inspected
by EM. In the HMW fraction of ΔL1DmTPPII only single strands were observed (see Figure
34E).
I431A S433A V434A N436A
W437A T438A L439A R440A T442A
Q443A L444A M445A N446A
ΔL2
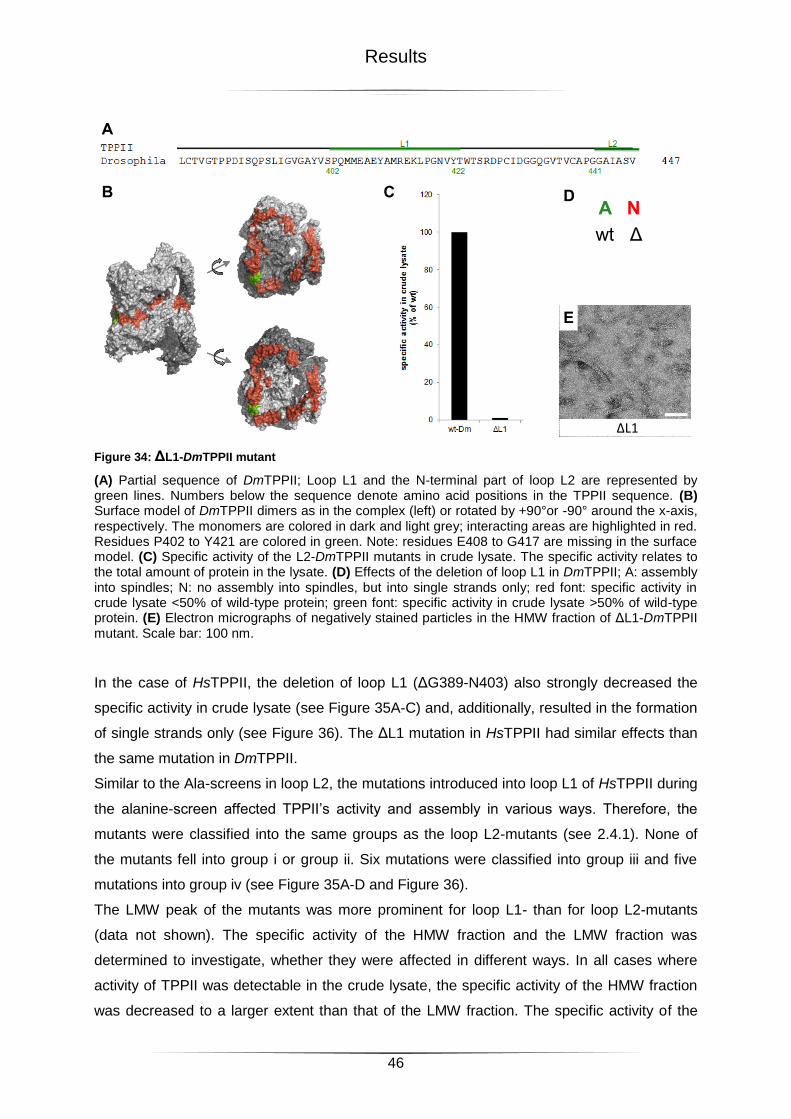
Results
46
Figure 34: ΔL1-DmTPPII mutant
(A) Partial sequence of DmTPPII; Loop L1 and the N-terminal part of loop L2 are represented by green lines. Numbers below the sequence denote amino acid positions in the TPPII sequence. (B) Surface model of DmTPPII dimers as in the complex (left) or rotated by +90°or -90° around the x-axis, respectively. The monomers are colored in dark and light grey; interacting areas are highlighted in red. Residues P402 to Y421 are colored in green. Note: residues E408 to G417 are missing in the surface model. (C) Specific activity of the L2-DmTPPII mutants in crude lysate. The specific activity relates to the total amount of protein in the lysate. (D) Effects of the deletion of loop L1 in DmTPPII; A: assembly into spindles; N: no assembly into spindles, but into single strands only; red font: specific activity in crude lysate <50% of wild-type protein; green font: specific activity in crude lysate >50% of wild-type protein. (E) Electron micrographs of negatively stained particles in the HMW fraction of ΔL1-DmTPPII mutant. Scale bar: 100 nm.
In the case of HsTPPII, the deletion of loop L1 (ΔG389-N403) also strongly decreased the
specific activity in crude lysate (see Figure 35A-C) and, additionally, resulted in the formation
of single strands only (see Figure 36). The ΔL1 mutation in HsTPPII had similar effects than
the same mutation in DmTPPII.
Similar to the Ala-screens in loop L2, the mutations introduced into loop L1 of HsTPPII during
the alanine-screen affected TPPII’s activity and assembly in various ways. Therefore, the
mutants were classified into the same groups as the loop L2-mutants (see 2.4.1). None of
the mutants fell into group i or group ii. Six mutations were classified into group iii and five
mutations into group iv (see Figure 35A-D and Figure 36).
The LMW peak of the mutants was more prominent for loop L1- than for loop L2-mutants
(data not shown). The specific activity of the HMW fraction and the LMW fraction was
determined to investigate, whether they were affected in different ways. In all cases where
activity of TPPII was detectable in the crude lysate, the specific activity of the HMW fraction
was decreased to a larger extent than that of the LMW fraction. The specific activity of the
ΔL1
A
B
E
C
wt Δ
D A N
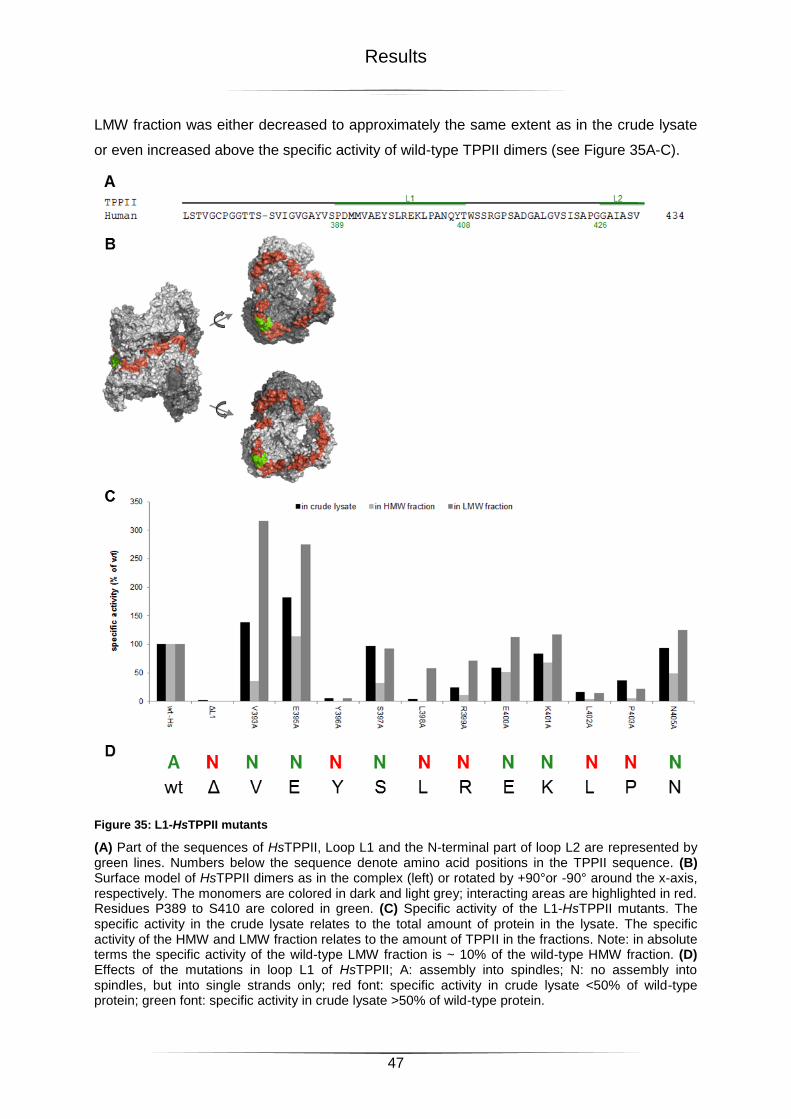
Results
47
LMW fraction was either decreased to approximately the same extent as in the crude lysate
or even increased above the specific activity of wild-type TPPII dimers (see Figure 35A-C).
Figure 35: L1-HsTPPII mutants
(A) Part of the sequences of HsTPPII, Loop L1 and the N-terminal part of loop L2 are represented by green lines. Numbers below the sequence denote amino acid positions in the TPPII sequence. (B) Surface model of HsTPPII dimers as in the complex (left) or rotated by +90°or -90° around the x-axis, respectively. The monomers are colored in dark and light grey; interacting areas are highlighted in red. Residues P389 to S410 are colored in green. (C) Specific activity of the L1-HsTPPII mutants. The specific activity in the crude lysate relates to the total amount of protein in the lysate. The specific activity of the HMW and LMW fraction relates to the amount of TPPII in the fractions. Note: in absolute terms the specific activity of the wild-type LMW fraction is ~ 10% of the wild-type HMW fraction. (D) Effects of the mutations in loop L1 of HsTPPII; A: assembly into spindles; N: no assembly into spindles, but into single strands only; red font: specific activity in crude lysate <50% of wild-type protein; green font: specific activity in crude lysate >50% of wild-type protein.
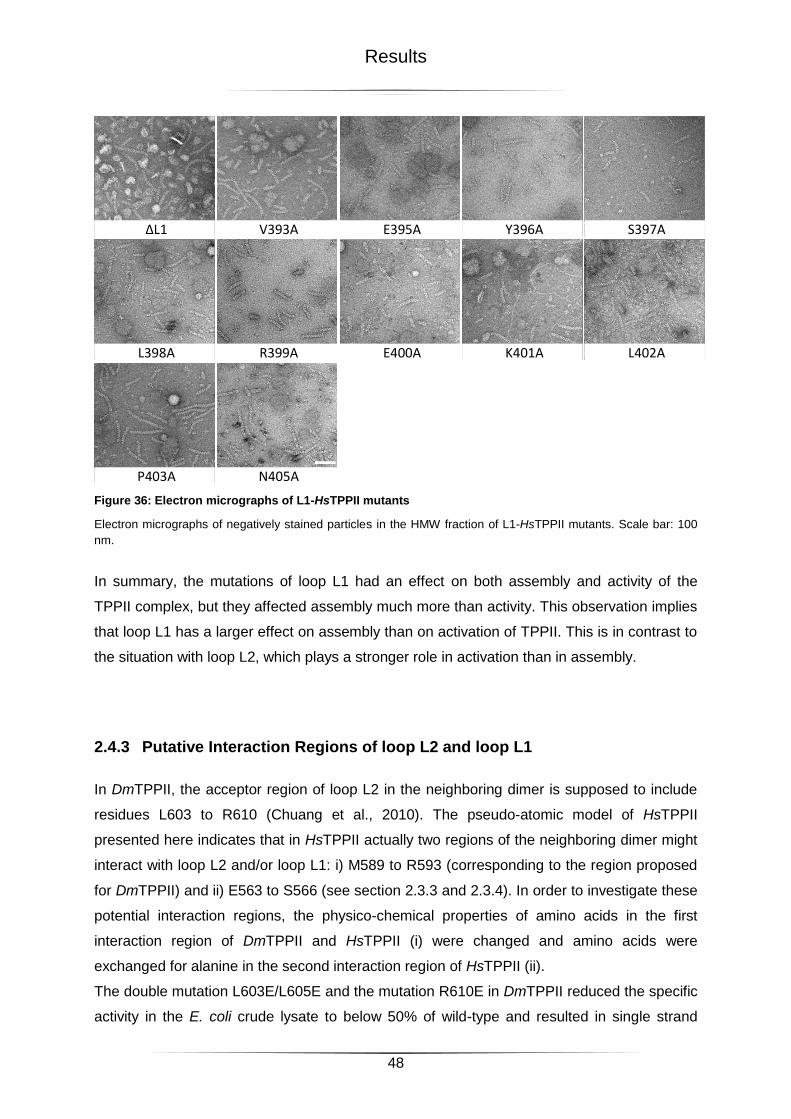
Results
48
Figure 36: Electron micrographs of L1-HsTPPII mutants
Electron micrographs of negatively stained particles in the HMW fraction of L1-HsTPPII mutants. Scale bar: 100
nm.
In summary, the mutations of loop L1 had an effect on both assembly and activity of the
TPPII complex, but they affected assembly much more than activity. This observation implies
that loop L1 has a larger effect on assembly than on activation of TPPII. This is in contrast to
the situation with loop L2, which plays a stronger role in activation than in assembly.
2.4.3 Putative Interaction Regions of loop L2 and loop L1
In DmTPPII, the acceptor region of loop L2 in the neighboring dimer is supposed to include
residues L603 to R610 (Chuang et al., 2010). The pseudo-atomic model of HsTPPII
presented here indicates that in HsTPPII actually two regions of the neighboring dimer might
interact with loop L2 and/or loop L1: i) M589 to R593 (corresponding to the region proposed
for DmTPPII) and ii) E563 to S566 (see section 2.3.3 and 2.3.4). In order to investigate these
potential interaction regions, the physico-chemical properties of amino acids in the first
interaction region of DmTPPII and HsTPPII (i) were changed and amino acids were
exchanged for alanine in the second interaction region of HsTPPII (ii).
The double mutation L603E/L605E and the mutation R610E in DmTPPII reduced the specific
activity in the E. coli crude lysate to below 50% of wild-type and resulted in single strand
V393A E395A Y396A S397A
L398A E400A K401A L402A
P403A N405A
ΔL1
R399A
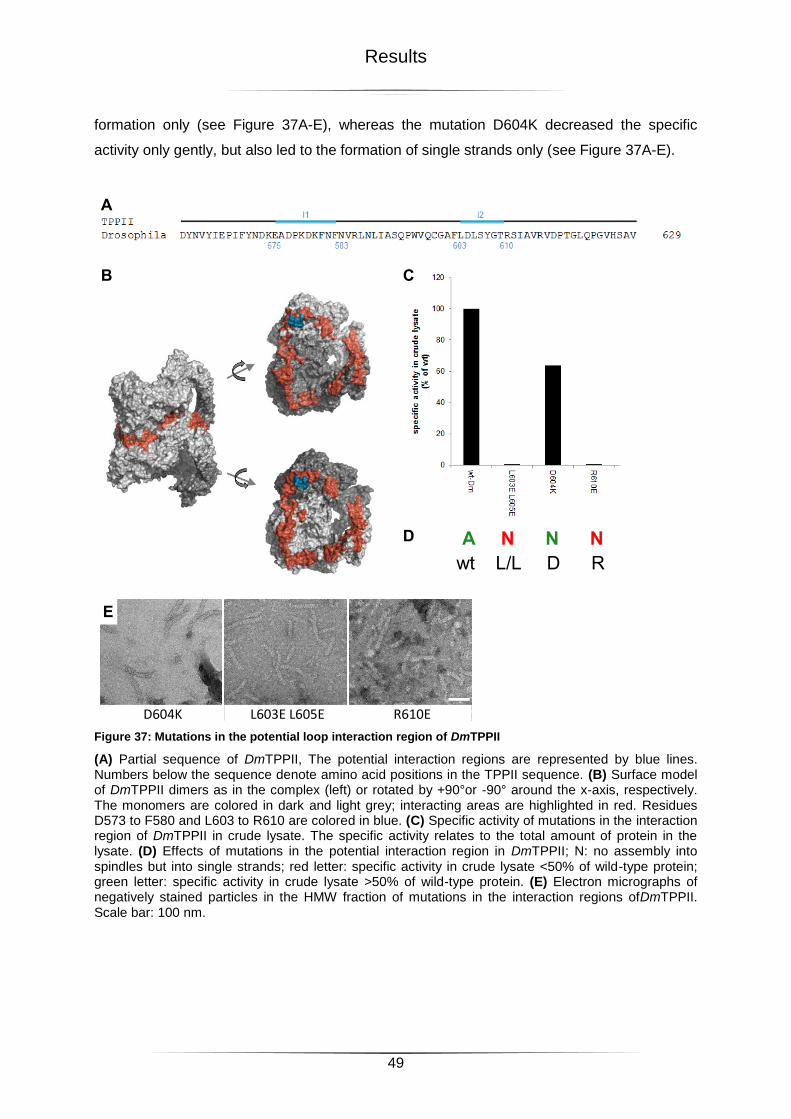
Results
49
formation only (see Figure 37A-E), whereas the mutation D604K decreased the specific
activity only gently, but also led to the formation of single strands only (see Figure 37A-E).
Figure 37: Mutations in the potential loop interaction region of DmTPPII
(A) Partial sequence of DmTPPII, The potential interaction regions are represented by blue lines. Numbers below the sequence denote amino acid positions in the TPPII sequence. (B) Surface model of DmTPPII dimers as in the complex (left) or rotated by +90°or -90° around the x-axis, respectively. The monomers are colored in dark and light grey; interacting areas are highlighted in red. Residues D573 to F580 and L603 to R610 are colored in blue. (C) Specific activity of mutations in the interaction region of DmTPPII in crude lysate. The specific activity relates to the total amount of protein in the lysate. (D) Effects of mutations in the potential interaction region in DmTPPII; N: no assembly into spindles but into single strands; red letter: specific activity in crude lysate <50% of wild-type protein; green letter: specific activity in crude lysate >50% of wild-type protein. (E) Electron micrographs of negatively stained particles in the HMW fraction of mutations in the interaction regions ofDmTPPII. Scale bar: 100 nm.
D604K L603E L605E R610E
A
B
E
C
wt L/L D R
D A N N N
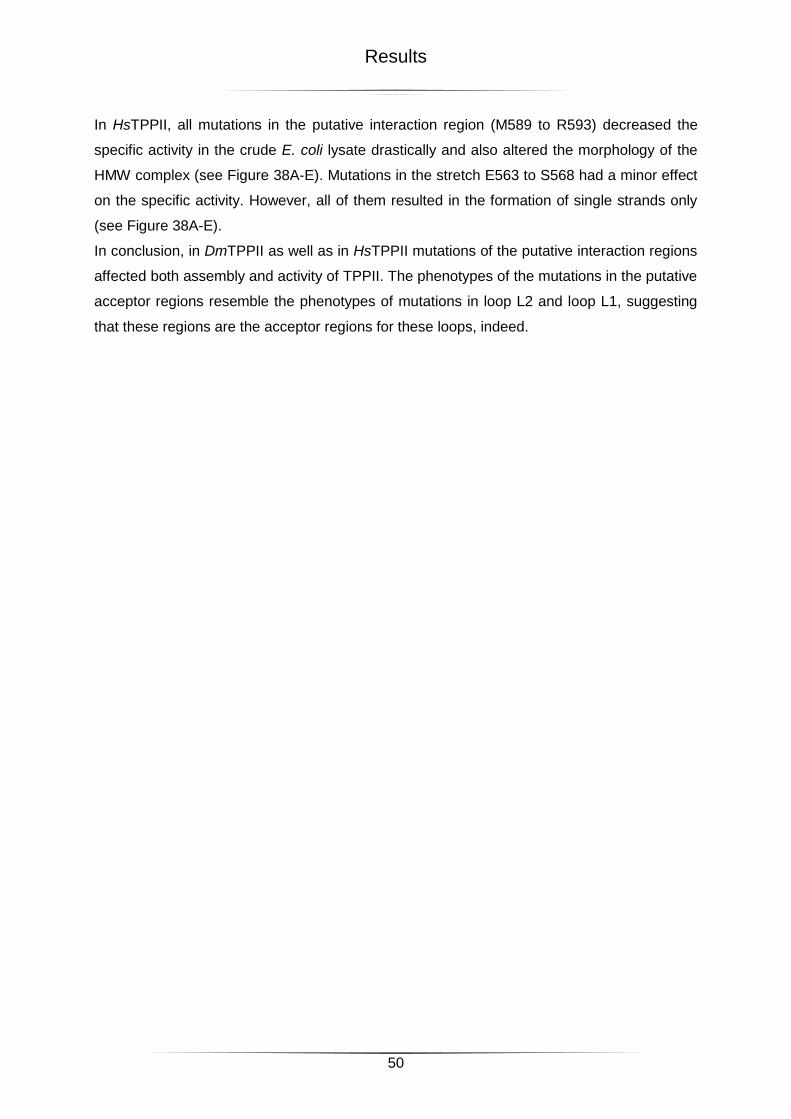
Results
50
In HsTPPII, all mutations in the putative interaction region (M589 to R593) decreased the
specific activity in the crude E. coli lysate drastically and also altered the morphology of the
HMW complex (see Figure 38A-E). Mutations in the stretch E563 to S568 had a minor effect
on the specific activity. However, all of them resulted in the formation of single strands only
(see Figure 38A-E).
In conclusion, in DmTPPII as well as in HsTPPII mutations of the putative interaction regions
affected both assembly and activity of TPPII. The phenotypes of the mutations in the putative
acceptor regions resemble the phenotypes of mutations in loop L2 and loop L1, suggesting
that these regions are the acceptor regions for these loops, indeed.
Results
51
Figure 38: Mutations in the potential loop interaction regions of HsTPPII
(A) Partial sequence of HsTPPII; the potential interaction regions are represented by blue lines. Numbers below the sequence denote amino acid positions in the TPPII sequence. (B) Surface model of HsTPPII dimers as in the complex (left) or rotated by +90°or -90° around the x-axis, respectively. The monomers are colored in dark and light grey; interacting areas are highlighted in red. Residues D573 to F580 and L603 to R610 are colored in blue. (C) Specific activity of mutations in the interaction regions of HsTPPII in crude lysate. The specific activity relates to the total amount of protein in the lysate. (D) Effects of the mutations in the potential interaction region in HsTPPII; N: no assembly into spindles but into single strands; red letter: specific activity in crude lysate <50% of wild-type protein; green letter: specific activity in crude lysate >50% of wild-type protein. (E) Electron micrograph negatively stained particles in the HMW fraction of mutations in the interaction regions of HsTPPII. Scale bar: 100 nm.
E587K L586D L588D R593E
K564A I565A S566A L567A Q568A
A
B
E
C
wt L/L E R K I S L Q
D A N N N N N N N N
Results
52
2.5 Stabilization of Tetramers by Crosslinking
The systematic mutational analysis of the dimer-dimer interactions presented above did not
allow the identification of contacts between specific residues. Therefore, detailed high
resolution structural data is needed. A crystal structure of a small oligomer of TPPII would be
ideal. The smallest oligomer suitable for this purpose is a tetramer, since it contains one
dimer-dimer interface. So far, no procedure to disassemble HsTPPII in a controlled manner
has been developed. Although the purification of DmTPPII tetramers is possible (Seyit et al.,
2006); the crystal structure obtained is one of DmTPPII dimers (Chuang et al., 2010). One
approach to generate stable teramers is to crosslink its subunits. As bifunctional crosslinking
agents cause microheterogeneity, which is detrimental to crystallization, the elegant
approach of the group of Schultz (Chin et al., 2002) was adopted: The photoreactive
corsslinker benzo-phenylalanine (Bpa) is incorporated into the growing peptide chain during
protein expression in E. coli and UV-treatment results in site-specific crosslinking (Chin et al.,
2002).
2.5.1 Bpa in Loop L2
In order to obtain information about its exact position at the dimer-dimer interface, the Bpa-
crosslinker was initially incorporated into loop L2. A crosslink of loop L2 interacting with its
acceptor region would have two advantages: on the one hand the interacting regions could
be identified by mass spectrometry and on the other hand the tetramer would be stabilized.
Three positions (N-terminal, middle, and C-terminal) for the incorporation of Bpa were
selected: i) F450, since it is a conservative exchange, and ii) S446 and S455, since their
exchange for alanine affected neither activity nor assembly (see 2.4.1). The incorporation of
Bpa at all three positions in loop L2, however, abolished the activity in the crude lysate (see
Figure 39A-D) and also led to the formation of single strands only (see Figure 39D-E).
In summary, the incorporation of Bpa into loop L2 affects activity and assembly of the TPPII
complex to an even larger extend than the exchange for alanine at the corresponding
position. Moreover, in addition to the Ala-screen, the results demonstrate the sensitivity of
the TPPII complex to single amino acid exchanges in loop L2.
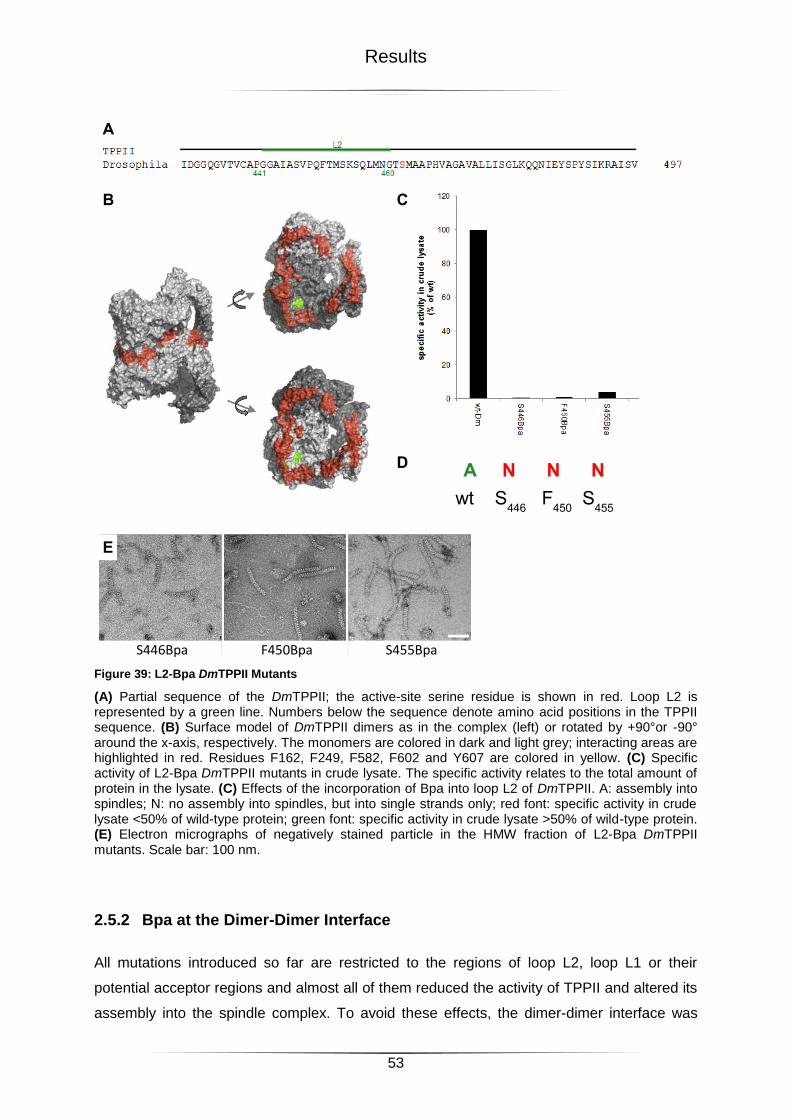
Results
53
Figure 39: L2-Bpa DmTPPII Mutants
(A) Partial sequence of the DmTPPII; the active-site serine residue is shown in red. Loop L2 is represented by a green line. Numbers below the sequence denote amino acid positions in the TPPII sequence. (B) Surface model of DmTPPII dimers as in the complex (left) or rotated by +90°or -90° around the x-axis, respectively. The monomers are colored in dark and light grey; interacting areas are highlighted in red. Residues F162, F249, F582, F602 and Y607 are colored in yellow. (C) Specific activity of L2-Bpa DmTPPII mutants in crude lysate. The specific activity relates to the total amount of protein in the lysate. (C) Effects of the incorporation of Bpa into loop L2 of DmTPPII. A: assembly into spindles; N: no assembly into spindles, but into single strands only; red font: specific activity in crude lysate <50% of wild-type protein; green font: specific activity in crude lysate >50% of wild-type protein. (E) Electron micrographs of negatively stained particle in the HMW fraction of L2-Bpa DmTPPII mutants. Scale bar: 100 nm.
2.5.2 Bpa at the Dimer-Dimer Interface
All mutations introduced so far are restricted to the regions of loop L2, loop L1 or their
potential acceptor regions and almost all of them reduced the activity of TPPII and altered its
assembly into the spindle complex. To avoid these effects, the dimer-dimer interface was
S446Bpa F450Bpa S455Bpa
B
E
C
wt S446
F450
S455
D A N N N
A

Results
54
screened for phenylalanines that are not located in these sensitive regions and four
candidates were identified: F162, F249, F582, and F602. In addition, Y607 was chosen to be
replaced by Bpa, since though it is located close to the sensitive region it is not part of loop
L2, loop L1 or of their potential interaction region. F162 and F249 are located far away from
the sensitive region and, indeed, the incorporation of Bpa did affect neither activity nor
assembly (see Figure 40A-D). F582, F602 and Y607 are closer to the sensitive regions and,
the closer Bpa was incorporated to the sensitive region, the more it reduced the activity of
TPPII. However, only the mutation Y607Bpa led to the formation of single strands only (see
Figure 40A-D).
Figure 40: Bpa at the dimer-dimer interface of DmTPPII Mutants
(A) Surface model of DmTPPII dimers as in the complex (left) or rotated by +90°or -90° around the x-axis, respectively. The monomers are colored in dark and light grey; interacting areas are highlighted in red. Residues F162, F249, F582, F602 and Y607 are colored in yellow. (B) Specific activity of the dimer-dimer interface DmTPPII mutants in crude lysate. The specific activity relates to the total amount of protein in the lysate. (C) Effects of the incorporation of Bpa at the dimer-dimer interface of DmTPPII on in HsTPPII A: assembly into spindles; N: no assembly into spindles, but into single strands only; red font: specific activity in crude lysate <50% of wild-type protein; green font: specific activity in crude lysate >50% of wild-type protein. (E) Electron micrographs of negatively stained particle in the HMW fraction of Bpa-interface DmTPPII mutants. Scale bar: 100 nm.
F249Bpa F582Bpa F602Bpa F162Bpa Y607Bpa
F162 F249
Y607
F602 F582
A
D
B
wt F162
F249
F582
F602
Y607
C A A A A A N
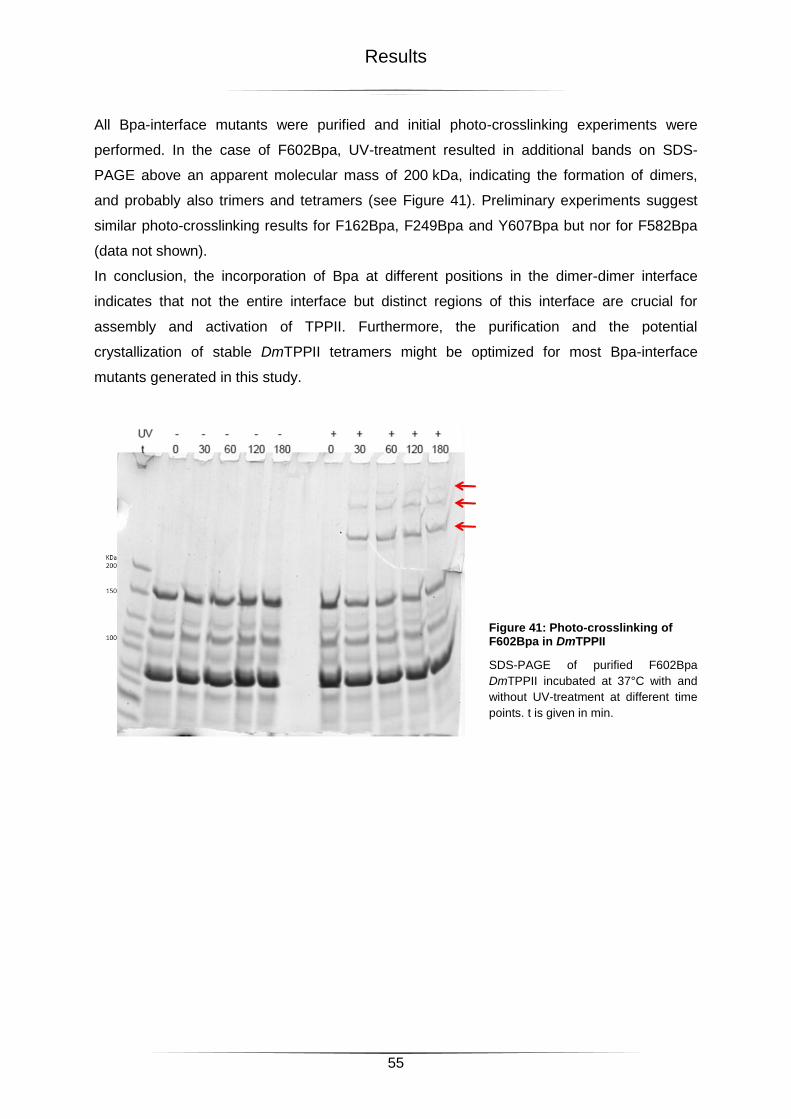
Results
55
All Bpa-interface mutants were purified and initial photo-crosslinking experiments were
performed. In the case of F602Bpa, UV-treatment resulted in additional bands on SDS-
PAGE above an apparent molecular mass of 200 kDa, indicating the formation of dimers,
and probably also trimers and tetramers (see Figure 41). Preliminary experiments suggest
similar photo-crosslinking results for F162Bpa, F249Bpa and Y607Bpa but nor for F582Bpa
(data not shown).
In conclusion, the incorporation of Bpa at different positions in the dimer-dimer interface
indicates that not the entire interface but distinct regions of this interface are crucial for
assembly and activation of TPPII. Furthermore, the purification and the potential
crystallization of stable DmTPPII tetramers might be optimized for most Bpa-interface
mutants generated in this study.
Figure 41: Photo-crosslinking of F602Bpa in DmTPPII
SDS-PAGE of purified F602Bpa
DmTPPII incubated at 37°C with and
without UV-treatment at different time
points. t is given in min.
Discussion
56
3 Discussion
This study describes the structure of HsTPPII, a giant cytosolic serine-peptidase. A 3D-map
with subnanometer resolution of the HsTPPII spindle complex was obtained by single particle
cryo-EM. The 3D-map showed a spindle complex consisting of two strands built of eight or
nine stacked dimers. The strands twist around each other and harbor a cavity system. To be
able to interpret the 3D-reconstruction of HsTPPII beyond the nominal resolution we
combined it with comparative modeling and MDFF. The reliability of the results obtained by
this combination depends on the quality of both the initial atomic model and the 3D-map.
Ideally, the initial atomic model used in this study should be one obtained by crystallization of
small HsTPPII oligomers; however, no method is available for the dissociation of HsTPPII
into small oligomers that do not reassemble at high protein concentrations necessary for
crystallization. Since the resolution of the 3D-map of HsTPPII is between 6.9 and 9.9 Å, it is
certainly not possible to assign or interpret loop regions. However, secondary structure
elements like α-helices are discernible and some interpretations such as the determination of
interfaces, the existence and positions of α-helices are feasible.
Analysis of the hybrid model allowed the localization of several regions that were considered
functionally important: i) helix H13 in the subtilase domain, ii) helix H5, and helix H6 in the
DH-insert, and iii) helix H26, helix H27, and loop L3 in th C-terminal region.
3.1 Activation of TPPII
The assembly of TPPII dimers into the spindle complex increases its protease activity. Non-
assembled dimers of TPPII exhibit ~10% activity of the fully assembly spindle (Seyit et al.,
2006; Tomkinson, 2000). Based the crystal structure of DmTPPII dimers this low activity was
attributed to the binding of three residues of loop L2 to the active-site cleft and the resulting
displacement of the active-site serine by 5 Å (Chuang et al., 2010). It was postulated that
during assembly i) loop L2 is removed from the active-site cleft and interacts with a region at
the roof of the catalytic chamber, and ii) a hydrogen bond network similar to the one in
subtilisin is established in the active-site region, which leads to the catalytically active
conformation of the active-site serine (Chuang et al., 2010).
The 3D-map of HsTPPII suggests that in HsTPPII spindles helix H13 is longer than the
corresponding helix in the crystal structure of DmTPPII dimers, since in HsTPPII this helix
also includes the actives-site serine S449. Forcing the active-site serine into an active
conformation during MDFF, also results in the elongation of helix H13. These observations
indicate that the conformation of helix H13 and the catalytically active conformation of the
active-site serine are interlinked. In the hybrid model of HsTPPII, loop L2 is located at the
Discussion
57
dimer-dimer interface in close proximity to the roof of the catalytic chambers. The
observations about the positions and/or conformation of helix H13 and loop L2 support the
recently proposed activation mechanism (Chuang et al., 2010).
To investigate, whether the establishment of a hydrogen bond network similar to the one in
subtilisin is sufficient to render TPPII active, loop L2 and/or helix H13 were replaced by the
corresponding elements of subtilisin (loop ‘L’ and helix hF). All replacements carried out
yielded inactive dimers, which assembled into inactive single strands only. These findings
suggest that during assembly TPPII undergoes a complex activation process involving more
regions than just loop L2 and helix H13. For example, loop L1, which is unique to TPPII and
is located close to the active-site, might be involved.
In the hybrid model of HsTPPII, the positions of loop L2 and loop L1 are not very reliable.
Therefore potential interaction partners cannot be identified by analysis of the dimer-dimer
interface. However, interactions of loop L2 and loop L1 were assessed by (i) deletion, (ii)
alanyl-permutation or (iii) site-specific crosslinking with Bpa. Whereas most mutations in loop
L2 resulted in inactive single strands, most mutations in loop L1 yielded single strands with
reduced activity. Since most mutations did not only affect the activity but also the assembly
of the TPPII strands into spindles, no conclusions about the interaction partners of loop L2
and loop L1 could be drawn. However, the results of the mutational studies suggest that
even single amino acid exchanges in the dimer-dimer interface can alter the activity and the
assembly of the TPPII complex. Mutations at different positions in the dimer-dimer interface
showed that activity and assembly of the complex do not depend on the entire dimer-dimer
interface, but they depend only on certain regions of the dimer-dimer interface. These
functionally relevant regions could be attributed to loop L2, loop L1 and their potential
interaction regions, which include M589 to R593 and E563 to I565.
3.2 Assembly as Trigger for Activation
One way to control the spatial and temporal activity of proteases is to express the protease
as a zymogen and tightly control its activation. Various mechanisms to achieve this have
been described (Lazure, 2002). For some multimeric proteases a relationship between
assembly and activation has been reported: Activation of the 20S-proteaseome – the
paradigm of self-compartmentalization – occurs after assembly of two half-proteasomes and
involves the autocatalytical cleavage of the inhibitory propeptide from the β-subunits (Chen
and Hochstrasser, 1996; Witt et al., 2006). Other proteases were shown to be activated
through dimerization: For intracellular subtilisin, it was proposed that dimerization opens a
metal ion site, which, once occupied, lead to the rearrangement and cleavage of the
inhibitory N-terminus (Gamble et al., 2011; Vevodova et al., 2010). In case of the chlamydial
Discussion
58
protease CPAF, transient dimerization triggers conformational changes that lead to the
formation of the active-site and to the autocatalytic processing and removal of an inhibitory
segment (Huang et al., 2008; Paschen et al., 2008). All these mechanisms include the
cleavage and removal of an inhibitory peptide from the active-site, thereby rendering
activation irreversible.
The activation mechanism of the bacterial protease/chaperone HtrA also involves the
removal of an inhibitory loop region from the active-site cleft, however, without its cleavage:
In the periplasm of gram-negative bacteria HtrA is present as an inactive hexamer. In this
complex, a loop from one subunit interacts with a loop of the active-site region in a second,
neighboring subunit, thereby distorting the active-site. High temperatures or binding of
substrates to PDZ-domains lead to a transition from the hexamer to a 12- or 24-mer. In this
12- or 24-mer the inhibitory loop is removed without cleavage and subsequently, the active
conformation of the active-site is restored (Krojer et al., 2010).
Activation mechanisms that involve removal of an inhibitory peptide without its cleavage,
such as the ones of HtrA and TPPII, have the advantage of being reversible. In principle, the
protease can be turned on and off on demand. However, it appears unlikely that
assembly/disassembly of the TPPII complex is the regulator of its activity in vivo as these
processes occur in minutes to hours in vitro (Seyit et al., 2006). It cannot be excluded that
assembly/disassembly-accelerating factors exist in vivo that facilitate the regulation of TPPII
activity by assembly/disassembly.
3.3 The DH-Insert as Sensor of the TPPII Assembly State
The activation model published was based on the hybrid structure of DmTPPII, which was
constructed using rigid body fitting (Chuang et al., 2010). Therefore, the conformations of all
dimers in the spindle were identical. By using MDFF in the construction of the HsTPPII hybrid
model, variations in the dimer conformations were taken into account and this model allowed
the detection of potential conformational differences between activated in-strand and non-
activated end-of strand dimers. Such conformational differences were found for helix H26
and helix H27 in the C-terminal domain and for helix H6 in domain C of the DH-insert. The
new position of these α-helices might stabilize the continuous stretch of TPRs at the convex
side of the spindle. In this way, fine-tuning of the potential protein-protein interaction site
would be coupled to complex assembly (Rockel et al., 2012). Additionally, the change in
position in could initiate the interaction of helix H6 with loop L3, which connects the central
and C-terminal domain. These interactions could arrest the loop L3 at its position spanning
the entrance to the cavity system and thereby influence the selection of substrates. In the
3D-map of HsTPPII a density corresponding to loop L3 is visible in all dimer, whereas in the
Discussion
59
3D-map of DmTPPII it is only visible in terminal dimers (Chuang et al., 2010). Loop L3 in
DmTPPII is 57 amino acids shorter than in HsTPPII and is more prone to nicking (J. Peters,
personal communication). Presumably, a cleaved loop L3 is more flexible and in turn is
invisible in in-strand dimers, implying that in DmTPPII loop L3 is of minor functional
importance.
In the comparative model of HsTPPII, which is based on the non-activated DmTPPII dimer,
domain C consists of helix H6 and a long loop, into which the short helix H5 is embedded.
The shape of the corresponding density in the assembled HsTPPII spindle reveals the
presence of two long α-helices. Accordingly, domain C of activated dimers would consist of
two long, antiparallel α-helices that are connected by a short loop.
Since the variable helices H6, H26 and H27 are located in or close to the dimer-dimer
interface, it is likely that their change in position is directly caused by dimer-dimer
interactions. These interactions, plus the movement of helix H6 might also induce the helix-
turn-helix conformation in domain C of the DH-insert. The DH-insert is a connector between
the C-terminal region and the subtilase domain, which both undergo conformational changes
upon assembly and assembly-dependent activation, respectively. It hypothesized that the
DH-insert is a sensor for the assembly-state of TPPII and triggers the conformational
changes necessary for activation.
3.4 Functional Relevance of the Spindle Complex
Correct stacking of the dimers is essential for the activation of TPPII. Still, small differences
between the dimer-dimer interfaces appear to be tolerable. Both the variation in spindle
length and the deviation of the strand geometry from an ideal helix show that contacts
between dimers within a strand are only quasi-identical. A detailed analysis of the interface
would be desirable, but the resolution of the 3D-map does not allow the interpretations of
exact locations and orientations of the residues in the flexibly fitted HsTPPII dimers.
However, dimer-dimer interfaces within the different spindle complexes were analyzed in
terms of the size of their areas, which appear to vary from species to species and which
appear not to depend on the number of dimers per strand.
From a functional point of view, it is plausible to assume that the number of dimers per strand
is of minor importance as long as the spindle complex is formed. To ensure the formation of
the stabilizing double-clamp structure at the spindle poles, a minimum of eight dimers per
strand is required. The double clamp stabilizes the spindle complex (Seyit et al., 2006) and
thereby also the dimer-dimer contacts.
Discussion
60
3.5 Outlook
The hybrid structure of HsTPPII presented in this study provides new insights into the
mechanism of maturation and activation of TPPII. However, several open questions remain,
such as i) which residues participate in the interactions at the dimer-dimer interface, ii) where
is TPPII located in a cell, iii) what are the interaction partners of TPPII in a cellular
environment, and iv) is there a single system suitable to perform enzymological, localization,
and interaction studies?
3.5.1 Crystal Structure of Tetramers
The establishment of the native dimer-dimer interface is crucial for the functionality and
structure of TPPII. However, the structural analysis and the profound mutational analysis of
the dimer-dimer interface performed here did not allow drawing any conclusions on the
residues and type of interactions that are involved in the dimer-dimer interface. In order to
obtain this information, a crystal structure of small oligomers that contain at least one dimer-
dimer interface is needed. So far the crystallization of TPPII has been aggravated by the
inherent structural heterogeneity attributable to the linear architecture of the complex.
However, crystallization of DmTPPII dimers was possible (Chuang et al., 2010). Although a
method to purify DmTPPII tetramers is available (Seyit et al., 2006), tetramers need to be
stabilized for crystallization to prevent both decay into dimers and assembly at high protein
concentrations. In this study a start was made to stabilize tetramers by site-specific
crosslinking of subunits with benzo-phenylalanine (Bpa). Whereas the incorporation of Bpa
into loop L2 interferes with the correct assembly and activation of the spindle complex, its
incorporation at several other positions within the dimer-dimer interface has no such effect.
The DmTPPII mutants F162Bpa, F248Bpa, F582, and F602Bpa might be candidates for
crystallization of TPPII tetramers.
3.5.2 Cellular Localization
Functional and structural analysis of TPPII in vitro can only serve as a starting point for the
investigation of its biological role, which is still enigmatic. To understand this biological
function, the unambiguous cellular localization of TPPII is necessary. Previous localization
studies via immunofluorescence staining had led to confusion about TPPII’s potential nuclear
translocation upon DNA damage (Firat et al., 2009; Preta et al., 2010a; Preta et al., 2009).
Therefore, antibody-independent fluorescence staining would be preferable. TPPII has been
labeled with an N-terminal green fluorescence protein (GFP) (Firat et al., 2007; McKay et al.,
Discussion
61
2007); however, the addition of a large, N-terminal tag prevents spindle formation, as shown
for maltose-binding protein (MBP; Rockel et al., 2005) or for GFP (data not shown).
Hence, smaller protein tags, such as the SNAP-tag, or dye-binding peptide sequences, like
the FlAsh system, might be a better choice. In either case, it needs to be verified that the
addition/insertion of the tag does not interfere with the assembly and/or activity of the spindle
complex.
Instead of using a genetically encoded tag, a TPPII-specific activity-based probe (ABP) could
be used. ABPs are small molecules that consist of three basic elements: a reactive ‘warhead’
that reacts selectively with the catalytically active species of the target and remains
covalently bound, a tag that facilitates enrichment and/or visualization, and a spacer that
both separates the other two elements and influences the selectivity of the ‘warhead’
(Edgington et al., 2011; Fonovic and Bogyo, 2008; Heal et al., 2011). The tag of this ABP
could either be a fluorescence dye or an electron-dense marker. As the ABPs are designed
to react with the catalytic active form of an enzyme only, they would only react with
assembled, active TPPII. Therefore, if binding, ABPs would probably not interfere with the
assembly of the TPPII spindle complex.
3.5.3 Interaction partners
A suitable fluorescence tag could also be used for correlative microscopy of TPPII-containing
cells. In correlative microscopy the area of interest is first identified by light- or fluorescence
microscopy and subsequently analyzed by (cryo-) EM (Lucic et al., 2007; Lucic et al., 2008).
Having an image of TPPII in a cell could provide information on possible interaction partners
and/or regulatory proteins of TPPII.
The question of interacting and/or regulatory proteins of TPPII could also be addressed by
co-immuno-precipitation in human or Drosophila cell lines that heterologously express
(tagged) TPPII. However, these expression systems have several drawbacks: i) interference
of expressed TPPII protein with the native protein cannot be excluded (e.g. assembly,
localization) ii) an antibody having a quality suitable for co-immuno-precipitation is only
available for DmTPPII and not for HsTPPII. To prevent any interference with native TPPII,
one could rescue TPPII-KO-cells with transient transfections of TPPII. In these rescue-
experiments as well as in the heterologous expression TPPII tagged with an epitope tag (c-
myc, HA, HSV, or Flag), for which suitable antibodies are commercially available, could be
used.
In order to identify interactions that are only transient, weak interaction chromatography with
recombinant HsTPPII or DmTPPII and lysate from human or Drosophila cells could be
performed.
Discussion
62
3.5.4 Heterologous Expression in S. pombe
To be able to correlate all information obtained, it would be desirable to perform such
localization, interaction and enzymological studies of TPPII in a single cellular system. Such
a system should offer the possibility of convenient genetic manipulations and, in addition, be
suitable for light and electron microscopy. One interesting candidate appears to be
Saccharomyces pombe. In contrast to Saccharomyces cervisiae, S. pombe expresses TPPII
and its genetic manipulation is routinely performed in several laboratories. Trial purifications
have shown that TPPII from S. pombe (SpTPPII) also forms a spindle complex, but quality
and amount of purified SpTPPII were not suitable for functional or structural studies. An
affinity tag to aid the purification of SpTPPII could help to solve this problem. Furthermore,
such a tag could be helpful in identifying native interaction partners by co-immuno-
precipitation and weak interaction chromatography.
Experimental Procedures
63
4 Experimental Procedures
4.1 Methods
4.1.1 DNA-Methods
4.1.1.1 Mutagenesis
To introduce position-specific mutations into DmTPPII and HsTPPII, the QuikChange Site-
Directed Mutagenesis Kit was employed. The primers used are specified in section 4.3 and
the vectors produced are listed in section 4.2.4.
A typical PCR reaction composed as following:
3 µl 10x Puffer 1 µl dNTPs 1 µl (ca. 90 ng) Template-Plasmid 1 µl forward bzw. reverse Primer 2 µl PfuUltra DNA-Polymerase ad 30 µl H2OMilli-Q
Two separate reactions, including either the forward or the reverse primer, were set up. After
6 cycles of amplification, 15 µl of each reaction were pooled and 1 µl PfuUltra DNA-
polymerase was added. The amplification was continued for 18 cycles. The amplification was
performed in a PCR-Thermocycler GeneAmp PCR System 2400 from Perkin Elmer with the
following program:
30 sec 95°C 30 sec 95°C 1 min 55°C 6x bzw. 18x 10 min 68°C 11 min 68°C
To remove the template DNA 1µl DpnI was added to the PCR product and the mixture was
incubated at 37 °C for 1 h.
4.1.1.2 Heat Shock Transformation of E. coli
50 µl of competent cell (XL1-Blue or Top10) were thawed on ice. 5 µl of the DpnI-digested
PCR reaction or 0.5 µl to1 µl of purified plasmid was added to chemocompetent XL1-Blue or
Top10 bacteria, respectively. The reaction mixture was incubated on ice for 30 min. A heat
shock was performed for 45 sec at 42 °C, followed by 2 min incubation on ice. 500 µl of SOC
was added to the cells, which were subsequently incubated at 37 °C for 1 h with constant
shaking. Afterwards the cells were plated on LB-plates with the corresponding selection
marker.
Experimental Procedures
64
4.1.1.3 Isolation of Plasmid DNA from E. coli
One single colony from an agar plate was used to inoculate 4 ml LB-media. The culture was
grown over night. Cells were sedimented by centrifugation (13,000xg, 2 min, RT) and their
plasmid DNA was isolated employing the QIAPrep Spin Miniprep Kit (QIAGEN).The plasmid
DNA was analyzed by agarose gel electrophoresis and sequencing.
4.1.1.4 Agarose Gel Electrophoresis
Plasmid DNA with loading dye was loaded on a 0.8% agarose gel and separated at 100 V.
Afterwards the gel was incubated in an ethidium bromide solution for 10 min with gentle
shaking and bands were visualized by UV light of 312 nm.
4.1.1.5 Sequencing of Plasmid DNA
For DNA sequencing 300 ng of DNA were mixed with 5 pmol of primer and the volume was
adjusted to 7.5 µl. Sequencing was performed by the Microchemistry Core Facility of the Max
Planck Institute of Biochemistry.
4.1.2 Proteinbiochemistry
4.1.2.1 Large Scale Recombinant Expression of TPPII
Large scale expression of DmTPPII and HsTPPII in a 1 l continuous feeding fermentation
system was performed by the Microchemistry Core Facility of the Max Planck Institute of
Biochemistry.
4.1.2.2 Small Scale Recombinant Expression of TPPII
For the recombinant expression of DmTPPII 50 ml TBKan-medium was inoculated and
grown until an OD600 2 – 3 was reached. The expression was induced by the addition
of 0.1 mM IPTG and carried out over night at 18 °C for DmTPPII and at 24 °C for
HsTPPII.
Experimental Procedures
65
4.1.2.3 Large Scale Purification of HsTPPII
Cells expressing HsTPPII were harvested by centrifugation (10 min at 4000xg).
Resuspended cells were subjected to two passages through a cell disrupter EmulsiFlex-C5
(Avestin) and centrifuged for 20 min at 30000xg. The pellet was suspended in resuspension
buffer and passed through the cell disrupter again. After centrifugation for 20 min at 30000xg
the His-tagged protein was purified from the supernatant by affinity chromatography using
HisTrapTM HP Columns. The column was equilibrated with HisTrap loading buffer. Washing
was performed with the HisTrap washing buffer. The proteins were eluted by an imidazol
step gradient ranging from 200 mM to 400 mM imidazole using the HisTrap elution buffer.
Subsequently, the imidazole was removed using PD10 desalting columns. Further
purification was achieved by applying the sample to a HiTrapTM ANX FF Column equilibrated
with ANX binding buffer. Elution was carried out by an ammonium sulfate step gradient of
100 mM to 400 mM AS using the ANX elution buffer. The fractions showing TPPII activity
were collected and subjected to precipitation at 55% (w/v) saturated AS at pH 7.5–7.7. The
precipitate was collected by centrifugation at 30000xg for 20 min, dissolved in resuspension
buffer, and loaded on a Superose 6 10/300 size exclusion column with resuspension buffer
as eluent.
4.1.2.4 Small Scale Purification of TPPII
Cells expressing wild type TPPII or TPPII mutants were harvested by centrifugation (10 min
at 4000xg), resuspended in 3 volumes resuspension buffer and lysed by sonication. The
samples were centrifuged at 21000xg for 10 min. DNA was removed by addition of 0.3% PEI
and centrifugation at 21000xg for 2 min. Subsequently proteins were precipitated by addition
of 1 volume 4 M AS. The solution was incubated on ice for 30 min and then centrifuged at
21000xg for 10 min. The pellet was dissolved in 1 ml resuspension buffer and loaded on a
Superose 6 10/300 size exclusion column. Fractions of 0.75 ml were collected and analyzed
via SDS-PAGE and activity measurements.
4.1.2.5 Activity Measurement
The activity of TPPII was determined by measuring the fluorescence emission of Amc
released by the cleavage of the fluorogenic substrate AAF-Amc in a Kontron Fluorimeter
(excitation: 360 nm; emission: 460 nm). As reference the fluorescence of 0.2 mM free Amc
was used. To inhibit cleavage of the substrate by other proteases the non-specific
aminopeptidase inhibitor bestatin was included in the reaction. The assay was performed at
30 °C for DmTPPII and at 37 °C for HsTPPII.
Experimental Procedures
66
The assay volume was 50 µl. For the activity measurement of crude lysate 2 µl of a 1/10
dilution were added to the assay and the mixture was incubated for 30 sec before the
reaction was stopped by adjusting the volume to 500 µl with Stop buffer.
The activity of Superose 6 fractions was determined after the addition of 1 to 20 µl sample to
the assay mix and incubation between 30 sec and 10 min. The reaction was stopped by
adjusting the volume to 500 µl with Stop buffer.
The counts of the fluorescence measurements are correlated to the TPPII concentration by
the following equation:
[ ]
;where ‘counts’ is the measured fluorogenic signal, ‘specific activity’ is 6000 ⁄
for DmTPPII and 13000 ⁄ for HsTPPII; V is the volume added in µl and t is
the time incubated in min. TPPII concentration is calculated in ⁄ .
4.1.2.6 SDS-PAGE
For SDS-PAGE the buffer system of Schägger und von Jagow (Schagger and von Jagow,
1987) was used. The acrylamide concentration was 9%. Samples were mixed with
0.2 volumes of sample buffer and solubilized at 70°C for 5 min. Electrophoretic separation
was performed at 100 V for ~40 min. Gels were washed in H2O three times for 2 min. Then
the gel incubated in Comassie staining solution for at least 1 h with gentle shaking.
Destaining occurred in H2O overnight.
4.1.2.7 Western Blotting
After SDS-PAGE, the proteins were transferred to a nitrocellulose membrane by wet blotting
for 3 h at 90 V. Completion of the transfer was controlled by Ponceau S staining. Western
Blot was performed using the ONE-HOUR WesternTM Detection Kit. The primary antiserum
α-HsTPPII was diluted 1:500 and the antiserum α-DmTPPII was diluted 1:2000. Both
antisera were produced in the Animal Facility of the Max Planck Institute of Biochemistry.
4.1.2.8 Determination of Specific Activity
For the determination of the specific activity of the HMW and LMW complexes of TPPII, the
activity of the fractions eluted at 8.1 ml and 14.9 ml, respectively, was measured. The
amount of TPPII in these fractions was detected densitometrically after separating the
proteins via SDS-PAGE.
Experimental Procedures
67
4.1.2.9 Bpa-Incorporation
For the incorporation of Bpa the system introduced by Prof. Schultz (Scripps Research
Institute, La Jolla) , which incorporates Bpa at the position of the amber stop codon in the
growing amino acid chain, the plasmid pSub-Bpa (Chin et al., 2002) and the plasmid
containing TPPII with an amber stop codon (TAG) were cotransformed in BL21 (DH3) Gold.
The expression was performed as described in section 4.1.2.2.
4.1.2.10 Bpa-Crosslinking
TPPII containing Bpa was purified as described in section 4.1.2.3 or in (Seyit et al., 2006).
The purified proteins were UV-treated in a 37 °C-tempered UV-cage for 3 h. Controls were
incubated at 37°C without UV-treatment. Crosslinking was examined by SDS-PAGE.
4.1.3 Electron microscopy
4.1.3.1 Negative-stain EM
Copper grids (PLANO W. Plannet GmbH, 100x400 mesh) were carbon coated and glow-
discharged for 25 sec with a plasma cleaner (Harrick Scientific Corporation). The grid was
put on a drop of 5 µl sample and incubated for 1 min at room temperature. Next, the grid was
transferred twice to drops of 20 µl 40 mM AS, pH 7.5. Subsequently, staining was performed
with 2% uranylacetat for 45 sec. Electron microscopic images were acquired at a CM200
transmission electron microscope (Philips) operated at 160 kV equipped with a TVIPS CCD
camera (camera pixel size 15 µm; 4096x4096 px). The final magnification was 69500x
resulting in an object pixel size of 2.2 Å. The nominal focus of the images was -2 to -3 µm.
4.1.3.2 Cryo-EM
5µl of freshly purified protein solution was applied to glow-discharged C-flat 4/1 grids
(Protochips, Inc.), which were covered with a thin carbon film. The grids were washed twice
with buffer (40 mM ammonium sulfate, pH 7.5), blotted and plunge-frozen in liquid ethane.
Using a Tecnai F20 microscope (FEI) operated at 200 kV and equipped with an Eagle CCD
camera (camera pixel size 15 µm; 4096x4096 px), 2248 focal pairs were recorded semi-
automatically (SerialEM, (Mastronarde, 2005) at a calibrated magnification of 84270x,
resulting in an object pixel size of 1.78 Å on specimen level. Focus values of the close-to-
focus images ranged from -0.3 to -4.7 µm.
Experimental Procedures
68
4.1.3.3 Image Processing
Prior to single-particle analysis, all micrographs were visually screened for drift, astigmatism,
and visibility of Thon rings in the power spectrum. Subsequently, the contrast transfer
function was determined and micrographs were deconvoluted by phase flipping and
compensation for the modulation transfer function of the CCD camera using the TOM-
software (Nickell et al., 2005). The positions of 96116 particles were determined on the far-
to-focus images and particles were extracted in 384 x 384 boxes from the close-to-focus
images (EMAN-software; Ludtke et al., 1999). For the reconstruction of all particles a
featureless double bow was used as initial reference. The settings for the iterative alignment
process are listed in section 4.4.1.
2D-classification of the data was performed using the EM-Package (Hegerl, 1996) and
XMIPP (Scheres et al., 2008). The 3D-variance map was calculated according to Penczek et
al., 2006. Seeds for a ML3D classification were generated based on a featureless double
bow. The ML3D classification was performed with 2x-binned particles and imposing C2
symmetry using XMIPP (Scheres et al., 2008). For the reconstruction of the two classes the
3D-models from the ML3D-runs were centered and used as initial references. The angular
assignments from the ML3D-runs were used as starting point for the reconstructions. The
settings during the iterative alignment processes for the 3D-reconstructions are summarized
in 4.4.2 and 4.4.3. The temperature factor was determined (Rosenthal and Henderson, 2003)
and applied to the final reconstructions (all: ~ -100 Å2; HsTPPII9: ~ -330 Å2; HsTPPII8: ~ -610
Å2).
4.1.3.4 Determination of Helix Parameters
Additional image analysis of the 3D-reconstruction was carried out by using the EM software
package (Hegerl, 1996). A low-pass filtered model of the atomic model of DmTPPII dimers
(smoothed to a resolution similar to that of the 3D-reconstructions) was used to perform
template-matching of dimers in the 3D-reconstructions. The resulting positions and Euler
angles were converted to equivalent representations, which describe the relative movement
of dimern to dimern+1 by a simple shift and a rotation around an individual axis. For one
strand, these axes have nearly the same orientation and the corresponding rotation angles
as well as the shifts are nearly constant. Subsequently, each strand was then approximately
represented as a helix using the average of the individual rotation axes as helical axis. This
analysis was performed by Dr. Reiner Hegerl (Max Planck Institute of Biochemistry,
Martinsried).
Experimental Procedures
69
4.1.3.5 Comparative Modeling and Flexible Fitting
A comparative model of HsTPPII was built using DmTPPII as structural template (PDB ID
3LXU; 36% sequence identity). The model was built using MODELLER (Sali and Blundell,
1993) with multiple sequence alignments from T-COFFEE (Notredame and Suhre, 2004).
This model was produced by Dr. Friedrich Förster (Max Planck Institute of Biochemistry,
Martinsried).
An initial atomic model of HsTPPII8 and HsTPP9 was created by rigid body fitting of
comparative models of the dimer into the respective EM-maps using situs (Wriggers et al.,
1999). Steric clashes were resolved with an in-house interactive version of MDFF
implemented in VMD (Humphrey et al., 1996). The spindle models resulted in systems of
605,122 and 680,762 atoms, including hydrogens, for HsTPPII8 and HsTPP9, respectively.
MDFF simulations were ran with default parameters and restraints (Trabuco et al., 2008),
plus three extra restraints per monomer enforcing the conformation of the active-site
residues to mimic their conformation in the crystal structure of subtilisin (Bode et al., 1987).
Additionally, implicit-solvent simulations were used, and the D2 symmetry observed in the
EM data was imposed into the simulated structures using a custom TclForces
implementation. Simulations of each spindle were run for 2 ns. The root-mean-squared
fluctuation (RMSF) and dimer-dimer interaction analysis considered the last nanosecond of
the trajectory, where the ensemble of structures produced all conformed to the EM data.
Correlation coefficients were determined using the ‘fit in map’ option in Chimera with a
simulated map of the dimer at a resolution of 10 Å (Pettersen et al., 2004). RMSF values
were calculated using VMD (Humphrey et al., 1996) Fitting of the atomic models to the 3D-
reconstructions was performed by Dr. Elizabeth Villa (Max Planck Institute of Biochemistry,
Martinsried).
4.1.3.6 Determination of Interaction Areas and Steric Clashes
Interaction areas were calculated using the EBI (European Bioinformatics Institute) online
server PISA (Protein Interfaces, Surfaces and Assemblies; Krissinel and Henrick, 2007).
Clashes between dimers were determined using the ‘find clashes’ option in Chimera
(Pettersen et al., 2004) with standard settings.
Experimental Procedures
70
4.2 Materials
4.2.1 Chemicals
7-Amino-4-Methylcoumarin (Amc) Bachem
Acetic acid Merck
Acrylamid Protogel 30 % (w/v) National Diagnostics
Agarose Sigma
Ala-Ala-Phe-Amc (AAF-Amc) Bachem
Ammoniumperoxidsulfat (APS) Merck
Ammoniumsulfat (AS) Merck
Ammoniumsulfate-16-hydrate Roth
Bacto Tryptone Difco
Bacto Agar Difco
Bacto Yeast Extract Difco
Bestatin Sigma
Bromphenol blue Serva
Chloramphenicol Serva
Comassie Brilliant Blue G 250 (cbb g259) Serva
Dimethylsulfoxid (DMSO) Merck
1,4-Dithiothreitol (DTT) Merck
Ethylenediaminetetraacetic acid (EDTA) Merck
Ethanol p.a. Merck
Ethidiumbromid Merck
Glycin Sigma
Glycerol 86-88% Riedel-de Haen
Guanidinhydrochloride Merck
Hydrochloric acid Merck
Imidazol Merck
Kanamycin Sigma
3-Hydroxy-4-[2-Sulfo-4-(4-Sulfophenylazo)-
Phenylazo]-2,7-Phtalindisulfonic acid (Ponceau S) Sigma
lsopropyl--D-Thiogalactopyranosid (IPTG) Biomol
NZ Amine Difco
Phosphoric acid Merck
Polyethyleneimine (PEI) Sigma
Potassiumhydroxid Merck
Potassiumdihydrophosphat (KH2PO4) Merck
Dipotassiumhydrogenphosphat (K2HPO4) Merck
Protein-Assay Reagent Bio-Rad
Sodiumchloride (NaCl) Merck
Sodiumdodecylsulfat (SDS) Bio-Rad
Trizma® Base (Tris) Sigma
Trichloressigsäure (TCA) Merck
N,N,N‘,N‘-Tetramethylethylendiamin (TEMED) Serva
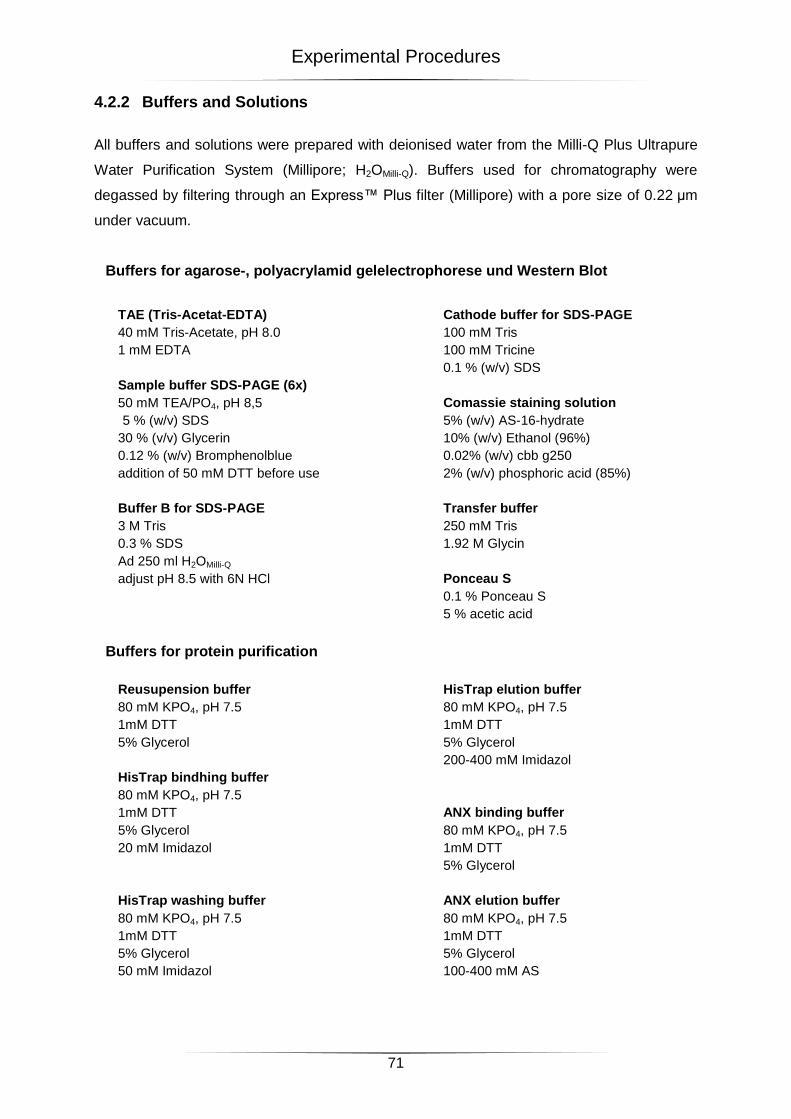
Experimental Procedures
71
4.2.2 Buffers and Solutions
All buffers and solutions were prepared with deionised water from the Milli-Q Plus Ultrapure
Water Purification System (Millipore; H2OMilli-Q). Buffers used for chromatography were
degassed by filtering through an Express™ Plus filter (Millipore) with a pore size of 0.22 μm
under vacuum.
Buffers for agarose-, polyacrylamid gelelectrophorese und Western Blot
TAE (Tris-Acetat-EDTA)
40 mM Tris-Acetate, pH 8.0
1 mM EDTA
Sample buffer SDS-PAGE (6x)
50 mM TEA/PO4, pH 8,5
5 % (w/v) SDS
30 % (v/v) Glycerin
0.12 % (w/v) Bromphenolblue
addition of 50 mM DTT before use
Buffer B for SDS-PAGE
3 M Tris
0.3 % SDS
Ad 250 ml H2OMilli-Q
adjust pH 8.5 with 6N HCl
Cathode buffer for SDS-PAGE
100 mM Tris
100 mM Tricine
0.1 % (w/v) SDS
Comassie staining solution
5% (w/v) AS-16-hydrate
10% (w/v) Ethanol (96%)
0.02% (w/v) cbb g250
2% (w/v) phosphoric acid (85%)
Transfer buffer
250 mM Tris
1.92 M Glycin
Ponceau S
0.1 % Ponceau S
5 % acetic acid
Buffers for protein purification
Reusupension buffer
80 mM KPO4, pH 7.5
1mM DTT
5% Glycerol
HisTrap bindhing buffer
80 mM KPO4, pH 7.5
1mM DTT
5% Glycerol
20 mM Imidazol
HisTrap washing buffer
80 mM KPO4, pH 7.5
1mM DTT
5% Glycerol
50 mM Imidazol
HisTrap elution buffer
80 mM KPO4, pH 7.5
1mM DTT
5% Glycerol
200-400 mM Imidazol
ANX binding buffer
80 mM KPO4, pH 7.5
1mM DTT
5% Glycerol
ANX elution buffer
80 mM KPO4, pH 7.5
1mM DTT
5% Glycerol
100-400 mM AS
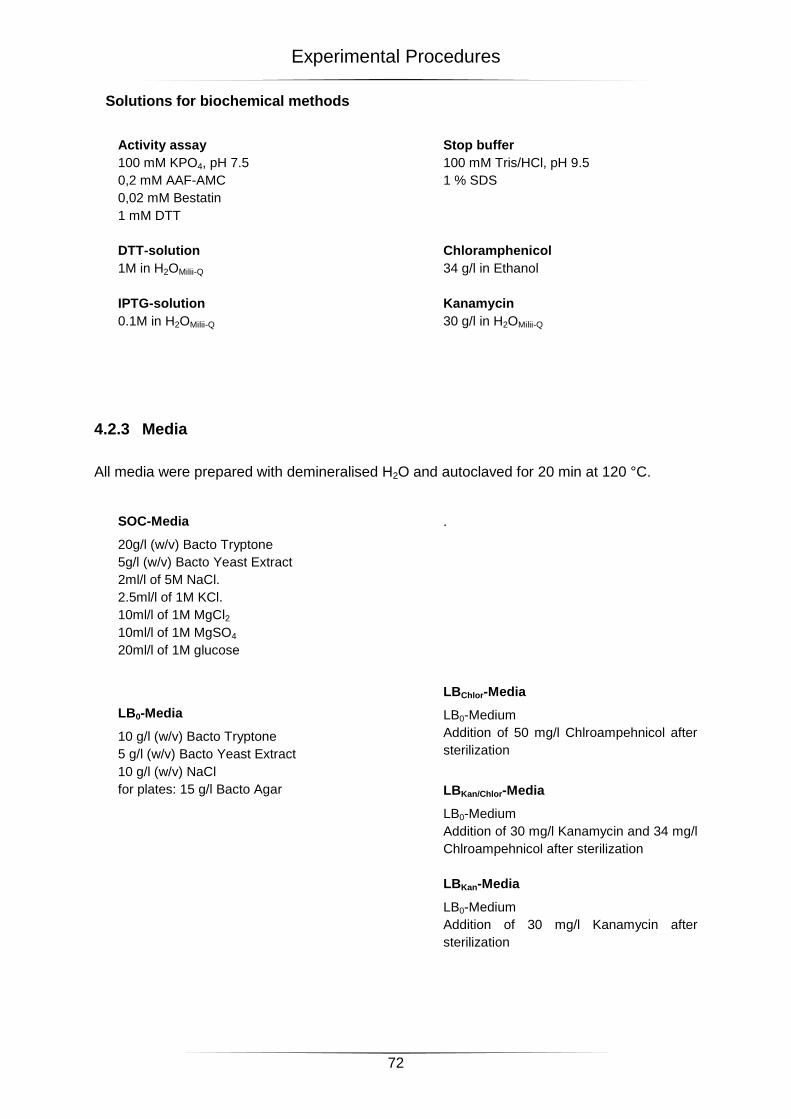
Experimental Procedures
72
Solutions for biochemical methods
Activity assay
100 mM KPO4, pH 7.5
0,2 mM AAF-AMC
0,02 mM Bestatin
1 mM DTT
DTT-solution
1M in H2OMilii-Q
IPTG-solution
0.1M in H2OMilii-Q
Stop buffer
100 mM Tris/HCl, pH 9.5
1 % SDS
Chloramphenicol
34 g/l in Ethanol
Kanamycin
30 g/l in H2OMilii-Q
4.2.3 Media
All media were prepared with demineralised H2O and autoclaved for 20 min at 120 °C.
SOC-Media
20g/l (w/v) Bacto Tryptone
5g/l (w/v) Bacto Yeast Extract
2ml/l of 5M NaCl.
2.5ml/l of 1M KCl.
10ml/l of 1M MgCl2
10ml/l of 1M MgSO4
20ml/l of 1M glucose
LB0-Media
10 g/l (w/v) Bacto Tryptone
5 g/l (w/v) Bacto Yeast Extract
10 g/l (w/v) NaCl
for plates: 15 g/l Bacto Agar
.
LBChlor-Media
LB0-Medium
Addition of 50 mg/l Chlroampehnicol after
sterilization
LBKan/Chlor-Media
LB0-Medium
Addition of 30 mg/l Kanamycin and 34 mg/l
Chlroampehnicol after sterilization
LBKan-Media
LB0-Medium
Addition of 30 mg/l Kanamycin after
sterilization
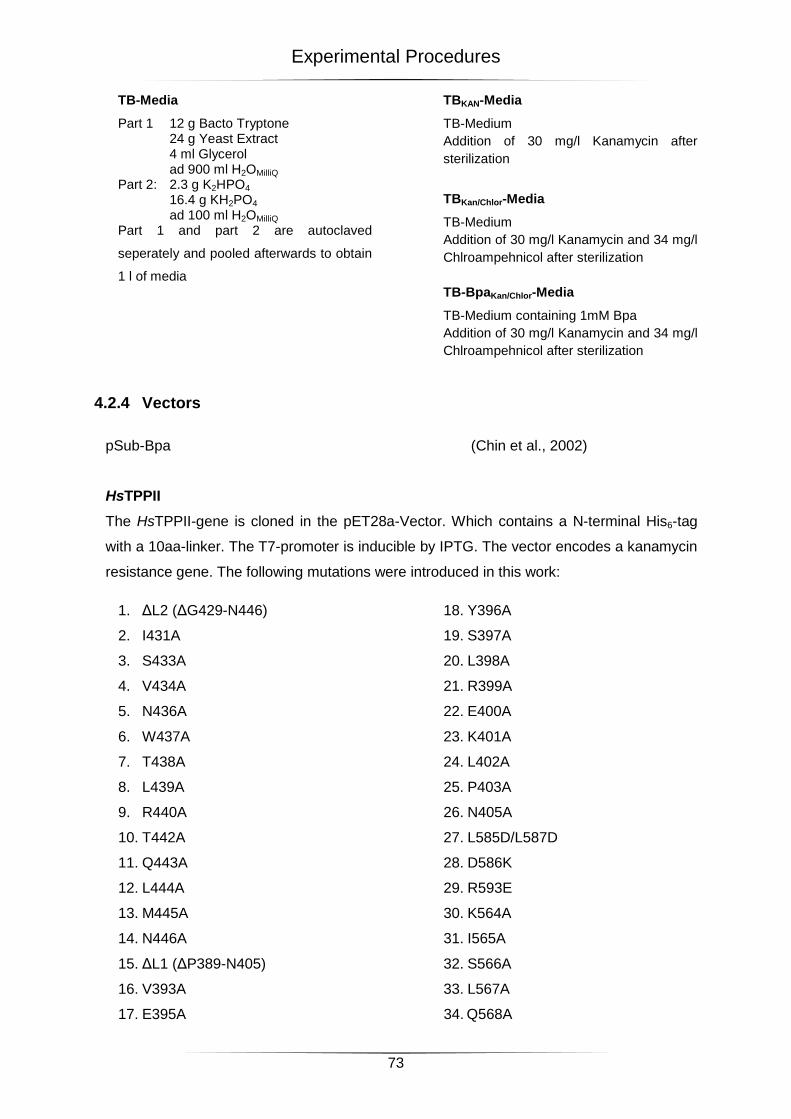
Experimental Procedures
73
TB-Media
Part 1 12 g Bacto Tryptone 24 g Yeast Extract 4 ml Glycerol ad 900 ml H2OMilliQ Part 2: 2.3 g K2HPO4
16.4 g KH2PO4
ad 100 ml H2OMilliQ
Part 1 and part 2 are autoclaved
seperately and pooled afterwards to obtain
1 l of media
TBKAN-Media
TB-Medium
Addition of 30 mg/l Kanamycin after
sterilization
TBKan/Chlor-Media
TB-Medium
Addition of 30 mg/l Kanamycin and 34 mg/l
Chlroampehnicol after sterilization
TB-BpaKan/Chlor-Media
TB-Medium containing 1mM Bpa
Addition of 30 mg/l Kanamycin and 34 mg/l
Chlroampehnicol after sterilization
4.2.4 Vectors
pSub-Bpa (Chin et al., 2002)
HsTPPII
The HsTPPII-gene is cloned in the pET28a-Vector. Which contains a N-terminal His6-tag
with a 10aa-linker. The T7-promoter is inducible by IPTG. The vector encodes a kanamycin
resistance gene. The following mutations were introduced in this work:
1. ΔL2 (ΔG429-N446)
2. I431A
3. S433A
4. V434A
5. N436A
6. W437A
7. T438A
8. L439A
9. R440A
10. T442A
11. Q443A
12. L444A
13. M445A
14. N446A
15. ΔL1 (ΔP389-N405)
16. V393A
17. E395A
18. Y396A
19. S397A
20. L398A
21. R399A
22. E400A
23. K401A
24. L402A
25. P403A
26. N405A
27. L585D/L587D
28. D586K
29. R593E
30. K564A
31. I565A
32. S566A
33. L567A
34. Q568A
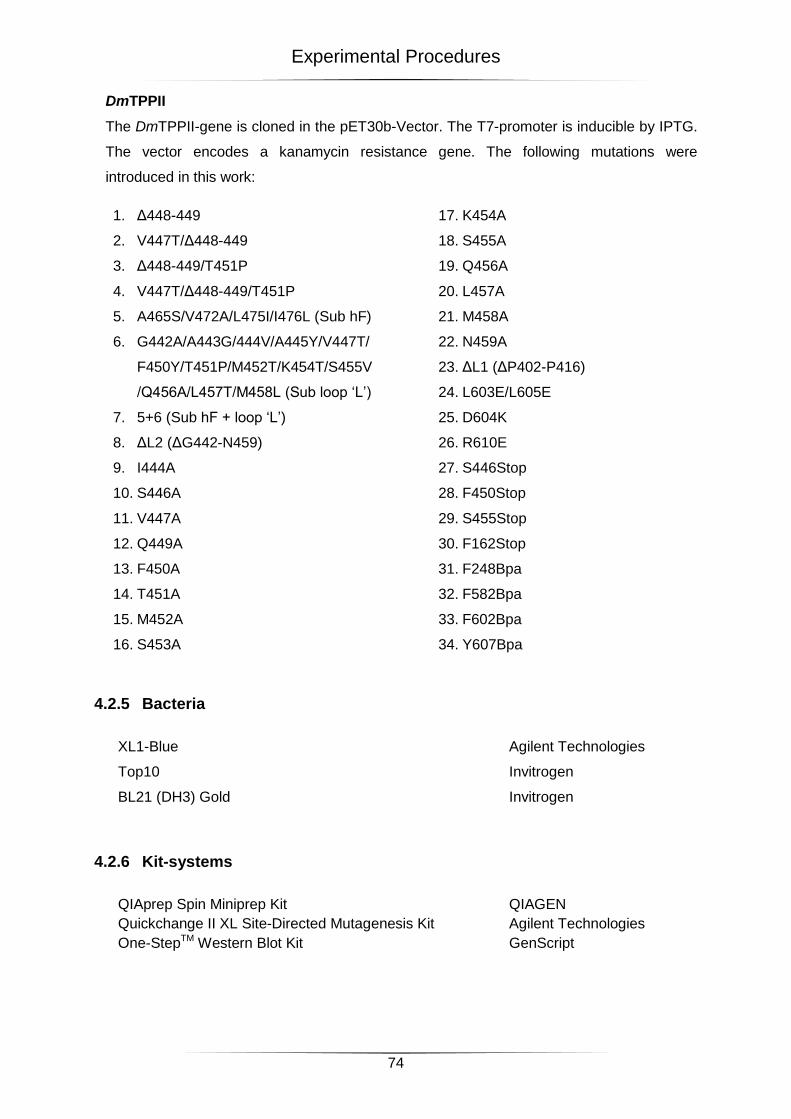
Experimental Procedures
74
DmTPPII
The DmTPPII-gene is cloned in the pET30b-Vector. The T7-promoter is inducible by IPTG.
The vector encodes a kanamycin resistance gene. The following mutations were
introduced in this work:
1. Δ448-449
2. V447T/Δ448-449
3. Δ448-449/T451P
4. V447T/Δ448-449/T451P
5. A465S/V472A/L475I/I476L (Sub hF)
6. G442A/A443G/444V/A445Y/V447T/
F450Y/T451P/M452T/K454T/S455V
/Q456A/L457T/M458L (Sub loop ‘L’)
7. 5+6 (Sub hF + loop ‘L’)
8. ΔL2 (ΔG442-N459)
9. I444A
10. S446A
11. V447A
12. Q449A
13. F450A
14. T451A
15. M452A
16. S453A
17. K454A
18. S455A
19. Q456A
20. L457A
21. M458A
22. N459A
23. ΔL1 (ΔP402-P416)
24. L603E/L605E
25. D604K
26. R610E
27. S446Stop
28. F450Stop
29. S455Stop
30. F162Stop
31. F248Bpa
32. F582Bpa
33. F602Bpa
34. Y607Bpa
4.2.5 Bacteria
XL1-Blue Agilent Technologies
Top10 Invitrogen
BL21 (DH3) Gold Invitrogen
4.2.6 Kit-systems
QIAprep Spin Miniprep Kit QIAGEN
Quickchange II XL Site-Directed Mutagenesis Kit Agilent Technologies
One-StepTM Western Blot Kit GenScript
Experimental Procedures
75
4.2.7 Enzymes
Pfu Ultra DNA-Polymerase (2,5 U/µl) Agilent Technologies
DpnI (10 U/µl) Agilent Technologies
Restriktionsenzyme (NotI, NcoI, NdeI, XhoI) Fermentas
Lysozyme Sigma
4.2.8 Standards
GeneRuler™ 1kb DNA Ladder Fermentas
PageRuler™ Unstained Protein Ladder Fermentas
PageRuler™ Prestained Protein Ladder Fermentas
4.2.9 Columns
Affinity chromatography HisTrapTM HP 5ml (GE Healthcare)
Ion exchange chromatography: HiTrap ANX FF (high sub) 1 ml (GE Healthcare)
HiTrap ANX FF (high sub) 5 ml (GE Healthcare)
Size exclusion chromatography: Superose™ 6 10/30 GL (Säulenvolumen 24 ml)
(Amersham Biosciences)
Desalting coloums PD-10 desalting columns (GE Healthcare)
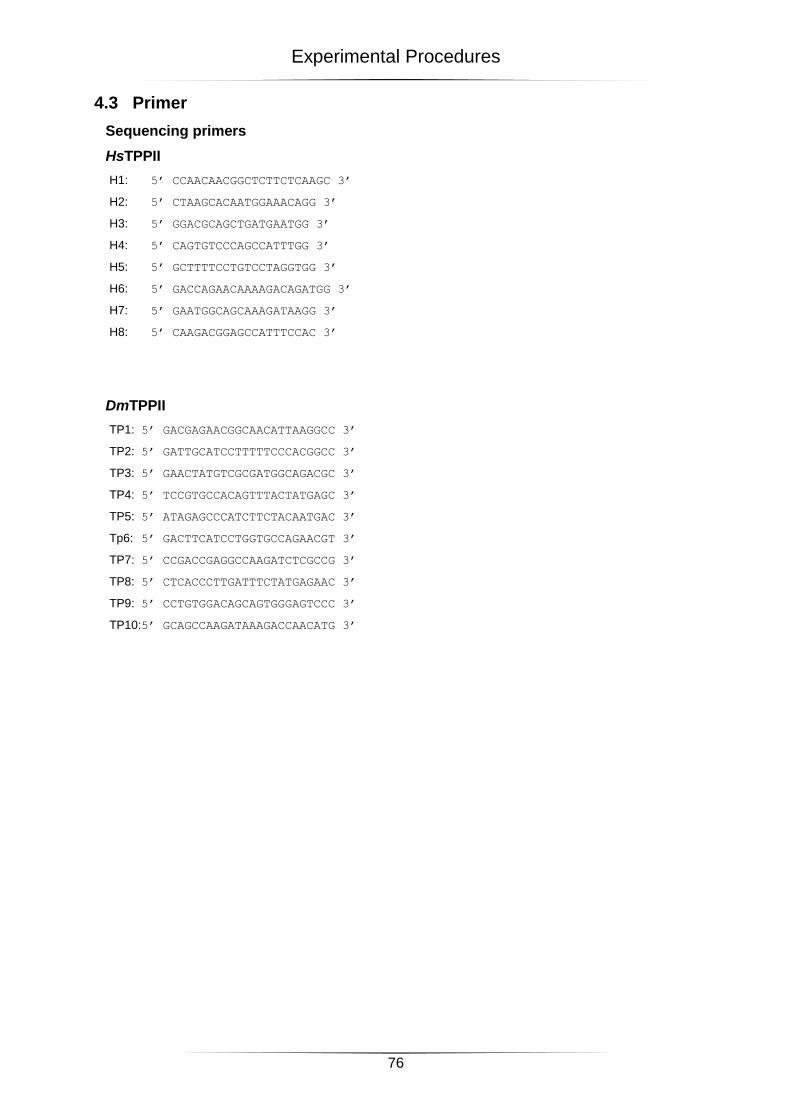
Experimental Procedures
76
4.3 Primer
Sequencing primers
HsTPPII
H1: 5’ CCAACAACGGCTCTTCTCAAGC 3’
H2: 5’ CTAAGCACAATGGAAACAGG 3’
H3: 5’ GGACGCAGCTGATGAATGG 3’
H4: 5’ CAGTGTCCCAGCCATTTGG 3’
H5: 5’ GCTTTTCCTGTCCTAGGTGG 3’
H6: 5’ GACCAGAACAAAAGACAGATGG 3’
H7: 5’ GAATGGCAGCAAAGATAAGG 3’
H8: 5’ CAAGACGGAGCCATTTCCAC 3’
DmTPPII
TP1: 5’ GACGAGAACGGCAACATTAAGGCC 3’
TP2: 5’ GATTGCATCCTTTTTCCCACGGCC 3’
TP3: 5’ GAACTATGTCGCGATGGCAGACGC 3’
TP4: 5’ TCCGTGCCACAGTTTACTATGAGC 3’
TP5: 5’ ATAGAGCCCATCTTCTACAATGAC 3’
Tp6: 5’ GACTTCATCCTGGTGCCAGAACGT 3’
TP7: 5’ CCGACCGAGGCCAAGATCTCGCCG 3’
TP8: 5’ CTCACCCTTGATTTCTATGAGAAC 3’
TP9: 5’ CCTGTGGACAGCAGTGGGAGTCCC 3’
TP10:5’ GCAGCCAAGATAAAGACCAACATG 3’
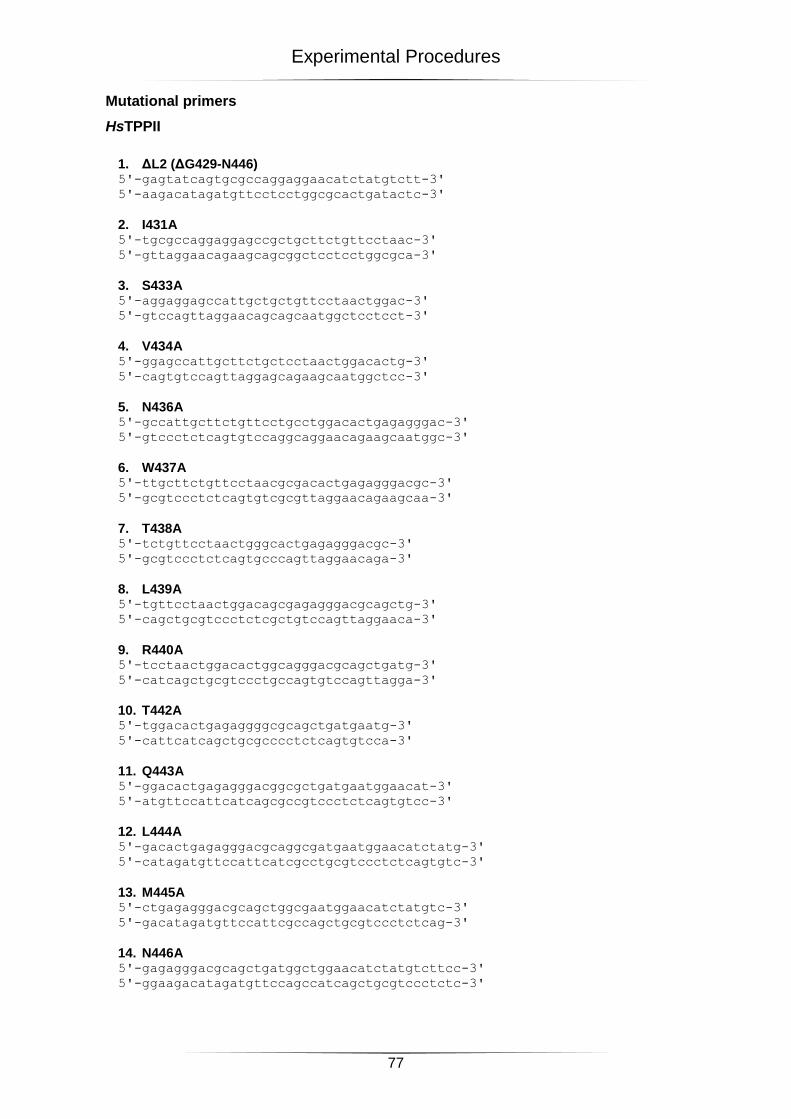
Experimental Procedures
77
Mutational primers
HsTPPII
1. ΔL2 (ΔG429-N446) 5'-gagtatcagtgcgccaggaggaacatctatgtctt-3'
5'-aagacatagatgttcctcctggcgcactgatactc-3'
2. I431A 5'-tgcgccaggaggagccgctgcttctgttcctaac-3'
5'-gttaggaacagaagcagcggctcctcctggcgca-3'
3. S433A 5'-aggaggagccattgctgctgttcctaactggac-3'
5'-gtccagttaggaacagcagcaatggctcctcct-3'
4. V434A 5'-ggagccattgcttctgctcctaactggacactg-3'
5'-cagtgtccagttaggagcagaagcaatggctcc-3'
5. N436A 5'-gccattgcttctgttcctgcctggacactgagagggac-3'
5'-gtccctctcagtgtccaggcaggaacagaagcaatggc-3'
6. W437A 5'-ttgcttctgttcctaacgcgacactgagagggacgc-3'
5'-gcgtccctctcagtgtcgcgttaggaacagaagcaa-3'
7. T438A 5'-tctgttcctaactgggcactgagagggacgc-3'
5'-gcgtccctctcagtgcccagttaggaacaga-3'
8. L439A 5'-tgttcctaactggacagcgagagggacgcagctg-3'
5'-cagctgcgtccctctcgctgtccagttaggaaca-3'
9. R440A 5'-tcctaactggacactggcagggacgcagctgatg-3'
5'-catcagctgcgtccctgccagtgtccagttagga-3'
10. T442A 5'-tggacactgagaggggcgcagctgatgaatg-3'
5'-cattcatcagctgcgcccctctcagtgtcca-3'
11. Q443A 5'-ggacactgagagggacggcgctgatgaatggaacat-3'
5'-atgttccattcatcagcgccgtccctctcagtgtcc-3'
12. L444A 5'-gacactgagagggacgcaggcgatgaatggaacatctatg-3'
5'-catagatgttccattcatcgcctgcgtccctctcagtgtc-3'
13. M445A 5'-ctgagagggacgcagctggcgaatggaacatctatgtc-3'
5'-gacatagatgttccattcgccagctgcgtccctctcag-3'
14. N446A 5'-gagagggacgcagctgatggctggaacatctatgtcttcc-3'
5'-ggaagacatagatgttccagccatcagctgcgtccctctc-3'
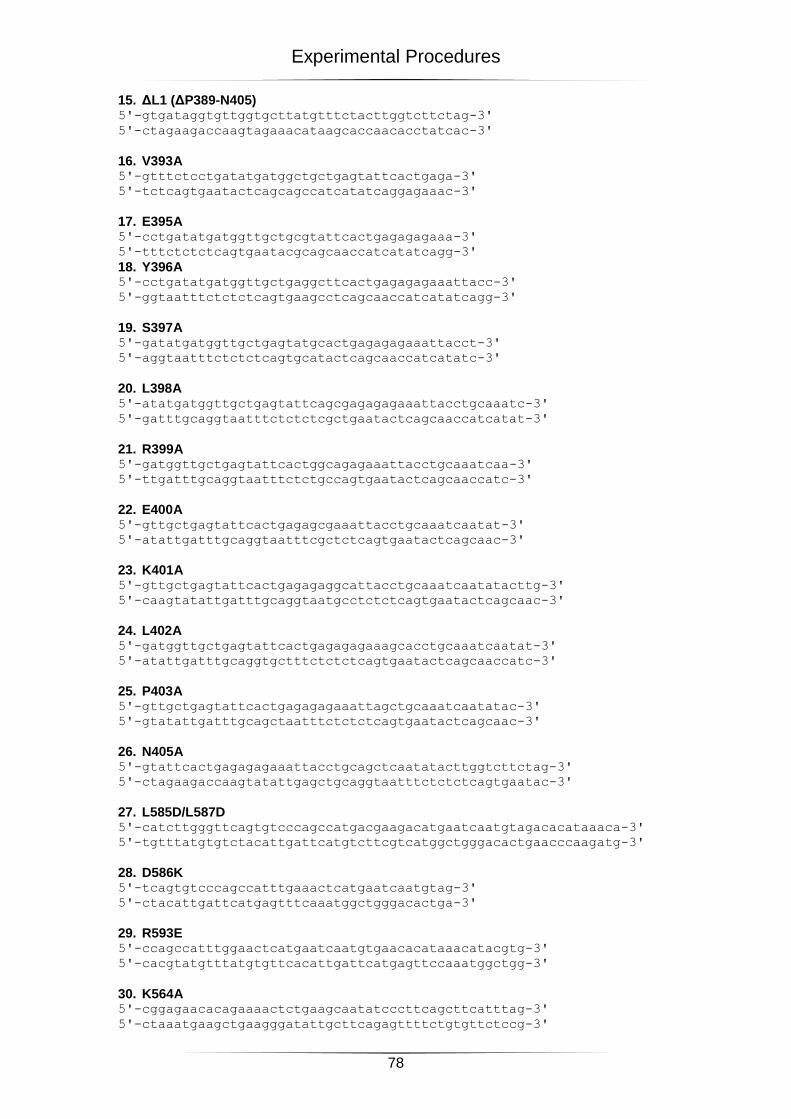
Experimental Procedures
78
15. ΔL1 (ΔP389-N405) 5'-gtgataggtgttggtgcttatgtttctacttggtcttctag-3'
5'-ctagaagaccaagtagaaacataagcaccaacacctatcac-3'
16. V393A 5'-gtttctcctgatatgatggctgctgagtattcactgaga-3'
5'-tctcagtgaatactcagcagccatcatatcaggagaaac-3'
17. E395A 5'-cctgatatgatggttgctgcgtattcactgagagagaaa-3'
5'-tttctctctcagtgaatacgcagcaaccatcatatcagg-3'
18. Y396A 5'-cctgatatgatggttgctgaggcttcactgagagagaaattacc-3'
5'-ggtaatttctctctcagtgaagcctcagcaaccatcatatcagg-3'
19. S397A 5'-gatatgatggttgctgagtatgcactgagagagaaattacct-3'
5'-aggtaatttctctctcagtgcatactcagcaaccatcatatc-3'
20. L398A 5'-atatgatggttgctgagtattcagcgagagagaaattacctgcaaatc-3'
5'-gatttgcaggtaatttctctctcgctgaatactcagcaaccatcatat-3'
21. R399A 5'-gatggttgctgagtattcactggcagagaaattacctgcaaatcaa-3'
5'-ttgatttgcaggtaatttctctgccagtgaatactcagcaaccatc-3'
22. E400A 5'-gttgctgagtattcactgagagcgaaattacctgcaaatcaatat-3'
5'-atattgatttgcaggtaatttcgctctcagtgaatactcagcaac-3'
23. K401A 5'-gttgctgagtattcactgagagaggcattacctgcaaatcaatatacttg-3'
5'-caagtatattgatttgcaggtaatgcctctctcagtgaatactcagcaac-3'
24. L402A 5'-gatggttgctgagtattcactgagagagaaagcacctgcaaatcaatat-3'
5'-atattgatttgcaggtgctttctctctcagtgaatactcagcaaccatc-3'
25. P403A 5'-gttgctgagtattcactgagagagaaattagctgcaaatcaatatac-3'
5'-gtatattgatttgcagctaatttctctctcagtgaatactcagcaac-3'
26. N405A 5'-gtattcactgagagagaaattacctgcagctcaatatacttggtcttctag-3'
5'-ctagaagaccaagtatattgagctgcaggtaatttctctctcagtgaatac-3'
27. L585D/L587D 5'-catcttgggttcagtgtcccagccatgacgaagacatgaatcaatgtagacacataaaca-3'
5'-tgtttatgtgtctacattgattcatgtcttcgtcatggctgggacactgaacccaagatg-3'
28. D586K 5'-tcagtgtcccagccatttgaaactcatgaatcaatgtag-3'
5'-ctacattgattcatgagtttcaaatggctgggacactga-3'
29. R593E 5'-ccagccatttggaactcatgaatcaatgtgaacacataaacatacgtg-3'
5'-cacgtatgtttatgtgttcacattgattcatgagttccaaatggctgg-3'
30. K564A 5'-cggagaacacagaaaactctgaagcaatatcccttcagcttcatttag-3'
5'-ctaaatgaagctgaagggatattgcttcagagttttctgtgttctccg-3'
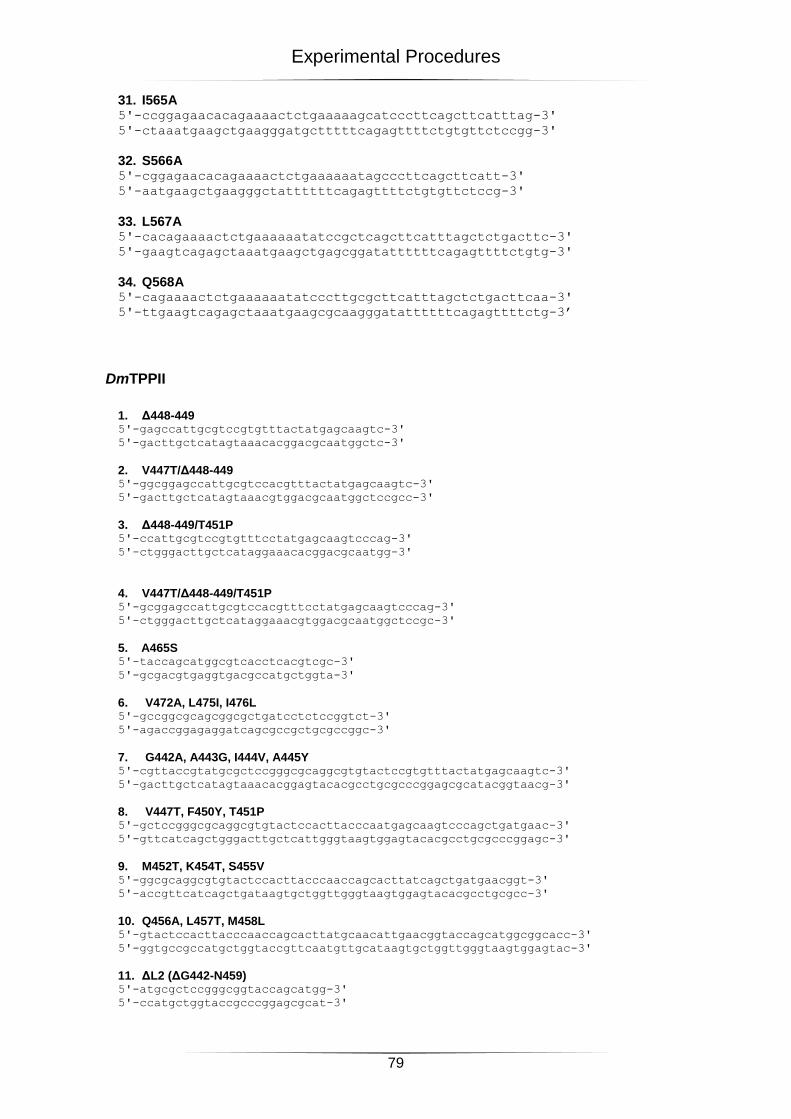
Experimental Procedures
79
31. I565A 5'-ccggagaacacagaaaactctgaaaaagcatcccttcagcttcatttag-3'
5'-ctaaatgaagctgaagggatgctttttcagagttttctgtgttctccgg-3'
32. S566A 5'-cggagaacacagaaaactctgaaaaaatagcccttcagcttcatt-3'
5'-aatgaagctgaagggctattttttcagagttttctgtgttctccg-3'
33. L567A 5'-cacagaaaactctgaaaaaatatccgctcagcttcatttagctctgacttc-3'
5'-gaagtcagagctaaatgaagctgagcggatattttttcagagttttctgtg-3'
34. Q568A 5'-cagaaaactctgaaaaaatatcccttgcgcttcatttagctctgacttcaa-3'
5'-ttgaagtcagagctaaatgaagcgcaagggatattttttcagagttttctg-3’
DmTPPII
1. Δ448-449 5'-gagccattgcgtccgtgtttactatgagcaagtc-3'
5'-gacttgctcatagtaaacacggacgcaatggctc-3'
2. V447T/Δ448-449 5'-ggcggagccattgcgtccacgtttactatgagcaagtc-3'
5'-gacttgctcatagtaaacgtggacgcaatggctccgcc-3'
3. Δ448-449/T451P 5'-ccattgcgtccgtgtttcctatgagcaagtcccag-3'
5'-ctgggacttgctcataggaaacacggacgcaatgg-3'
4. V447T/Δ448-449/T451P 5'-gcggagccattgcgtccacgtttcctatgagcaagtcccag-3'
5'-ctgggacttgctcataggaaacgtggacgcaatggctccgc-3'
5. A465S 5'-taccagcatggcgtcacctcacgtcgc-3'
5'-gcgacgtgaggtgacgccatgctggta-3'
6. V472A, L475I, I476L 5'-gccggcgcagcggcgctgatcctctccggtct-3'
5'-agaccggagaggatcagcgccgctgcgccggc-3'
7. G442A, A443G, I444V, A445Y 5'-cgttaccgtatgcgctccgggcgcaggcgtgtactccgtgtttactatgagcaagtc-3'
5'-gacttgctcatagtaaacacggagtacacgcctgcgcccggagcgcatacggtaacg-3'
8. V447T, F450Y, T451P 5'-gctccgggcgcaggcgtgtactccacttacccaatgagcaagtcccagctgatgaac-3'
5'-gttcatcagctgggacttgctcattgggtaagtggagtacacgcctgcgcccggagc-3'
9. M452T, K454T, S455V 5'-ggcgcaggcgtgtactccacttacccaaccagcacttatcagctgatgaacggt-3'
5'-accgttcatcagctgataagtgctggttgggtaagtggagtacacgcctgcgcc-3'
10. Q456A, L457T, M458L 5'-gtactccacttacccaaccagcacttatgcaacattgaacggtaccagcatggcggcacc-3'
5'-ggtgccgccatgctggtaccgttcaatgttgcataagtgctggttgggtaagtggagtac-3'
11. ΔL2 (ΔG442-N459) 5'-atgcgctccgggcggtaccagcatgg-3'
5'-ccatgctggtaccgcccggagcgcat-3'
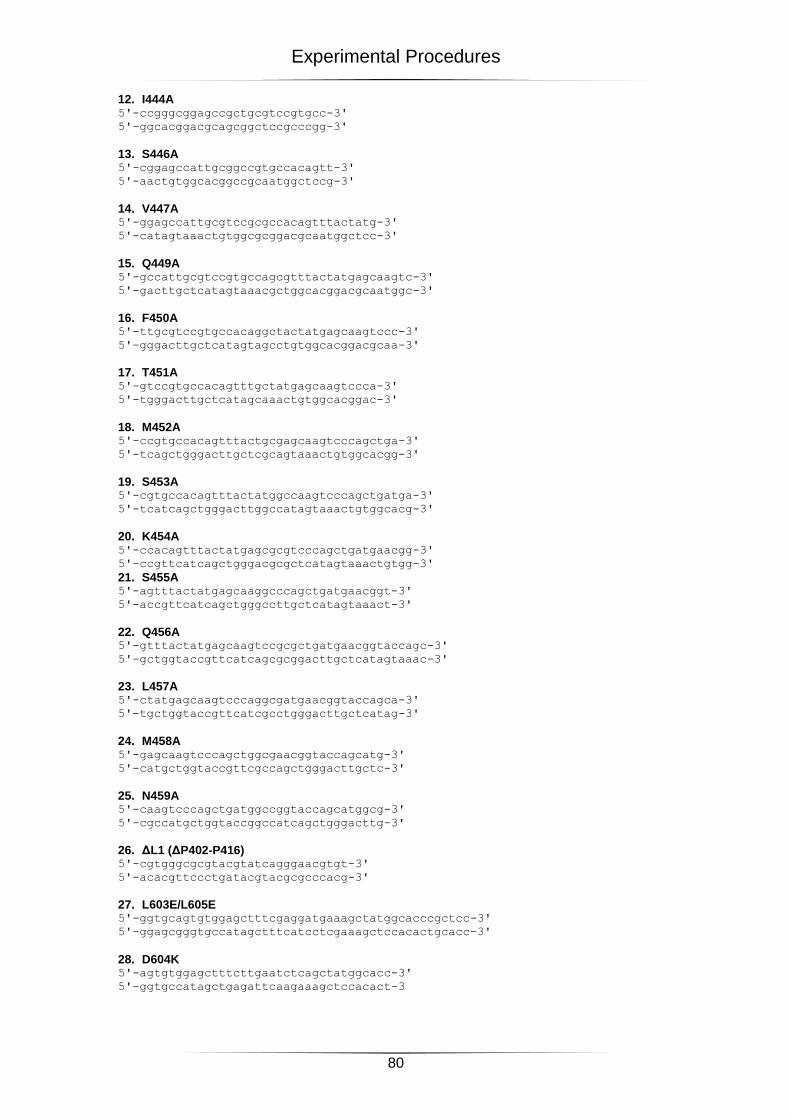
Experimental Procedures
80
12. I444A 5'-ccgggcggagccgctgcgtccgtgcc-3'
5'-ggcacggacgcagcggctccgcccgg-3'
13. S446A 5'-cggagccattgcggccgtgccacagtt-3'
5'-aactgtggcacggccgcaatggctccg-3'
14. V447A 5'-ggagccattgcgtccgcgccacagtttactatg-3'
5'-catagtaaactgtggcgcggacgcaatggctcc-3'
15. Q449A 5'-gccattgcgtccgtgccagcgtttactatgagcaagtc-3'
5'-gacttgctcatagtaaacgctggcacggacgcaatggc-3'
16. F450A 5'-ttgcgtccgtgccacaggctactatgagcaagtccc-3'
5'-gggacttgctcatagtagcctgtggcacggacgcaa-3'
17. T451A 5'-gtccgtgccacagtttgctatgagcaagtccca-3'
5'-tgggacttgctcatagcaaactgtggcacggac-3'
18. M452A 5'-ccgtgccacagtttactgcgagcaagtcccagctga-3'
5'-tcagctgggacttgctcgcagtaaactgtggcacgg-3'
19. S453A 5'-cgtgccacagtttactatggccaagtcccagctgatga-3'
5'-tcatcagctgggacttggccatagtaaactgtggcacg-3'
20. K454A 5'-ccacagtttactatgagcgcgtcccagctgatgaacgg-3'
5'-ccgttcatcagctgggacgcgctcatagtaaactgtgg-3'
21. S455A 5'-agtttactatgagcaaggcccagctgatgaacggt-3'
5'-accgttcatcagctgggccttgctcatagtaaact-3'
22. Q456A 5'-gtttactatgagcaagtccgcgctgatgaacggtaccagc-3'
5'-gctggtaccgttcatcagcgcggacttgctcatagtaaac-3'
23. L457A 5'-ctatgagcaagtcccaggcgatgaacggtaccagca-3'
5'-tgctggtaccgttcatcgcctgggacttgctcatag-3'
24. M458A 5'-gagcaagtcccagctggcgaacggtaccagcatg-3'
5'-catgctggtaccgttcgccagctgggacttgctc-3'
25. N459A 5'-caagtcccagctgatggccggtaccagcatggcg-3'
5'-cgccatgctggtaccggccatcagctgggacttg-3'
26. ΔL1 (ΔP402-P416) 5'-cgtgggcgcgtacgtatcagggaacgtgt-3'
5'-acacgttccctgatacgtacgcgcccacg-3'
27. L603E/L605E 5'-ggtgcagtgtggagctttcgaggatgaaagctatggcacccgctcc-3'
5'-ggagcgggtgccatagctttcatcctcgaaagctccacactgcacc-3'
28. D604K 5'-agtgtggagctttcttgaatctcagctatggcacc-3'
5'-ggtgccatagctgagattcaagaaagctccacact-3
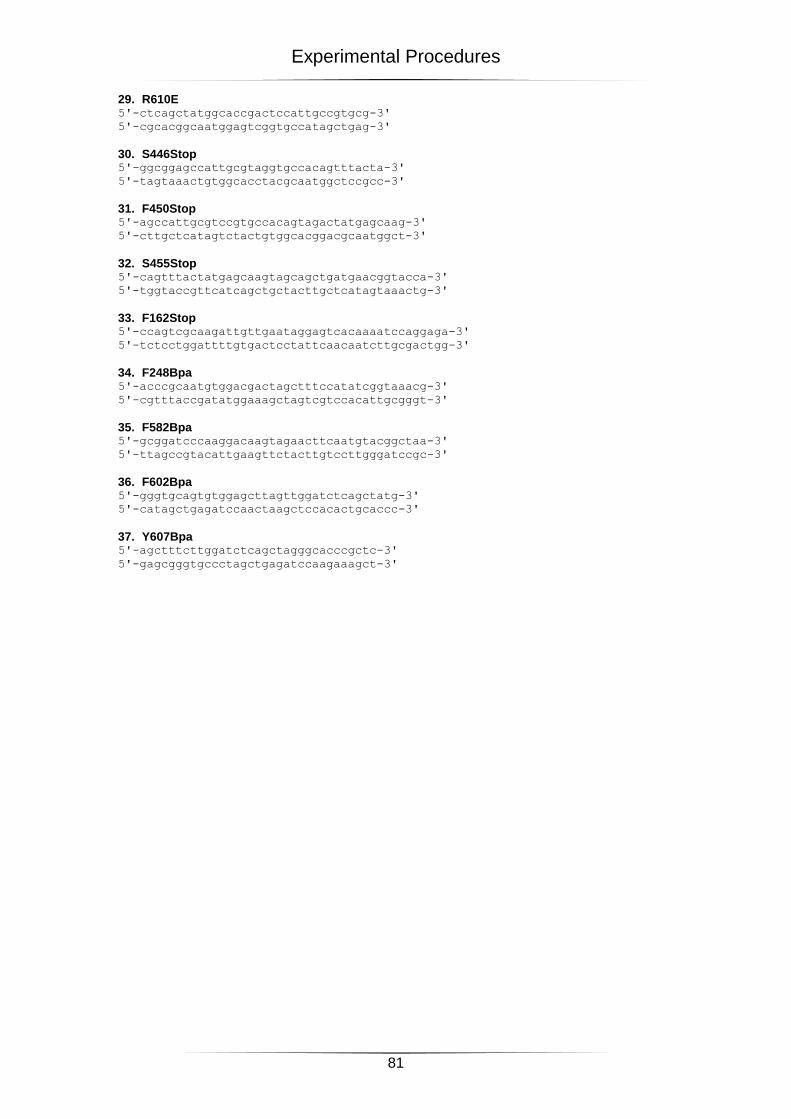
Experimental Procedures
81
29. R610E 5'-ctcagctatggcaccgactccattgccgtgcg-3'
5'-cgcacggcaatggagtcggtgccatagctgag-3'
30. S446Stop 5'-ggcggagccattgcgtaggtgccacagtttacta-3'
5'-tagtaaactgtggcacctacgcaatggctccgcc-3'
31. F450Stop 5'-agccattgcgtccgtgccacagtagactatgagcaag-3'
5'-cttgctcatagtctactgtggcacggacgcaatggct-3'
32. S455Stop 5'-cagtttactatgagcaagtagcagctgatgaacggtacca-3'
5'-tggtaccgttcatcagctgctacttgctcatagtaaactg-3'
33. F162Stop 5'-ccagtcgcaagattgttgaataggagtcacaaaatccaggaga-3'
5'-tctcctggattttgtgactcctattcaacaatcttgcgactgg-3'
34. F248Bpa 5'-acccgcaatgtggacgactagctttccatatcggtaaacg-3'
5'-cgtttaccgatatggaaagctagtcgtccacattgcgggt-3'
35. F582Bpa 5'-gcggatcccaaggacaagtagaacttcaatgtacggctaa-3'
5'-ttagccgtacattgaagttctacttgtccttgggatccgc-3'
36. F602Bpa 5'-gggtgcagtgtggagcttagttggatctcagctatg-3'
5'-catagctgagatccaactaagctccacactgcaccc-3'
37. Y607Bpa 5'-agctttcttggatctcagctagggcacccgctc-3'
5'-gagcgggtgccctagctgagatccaagaaagct-3'
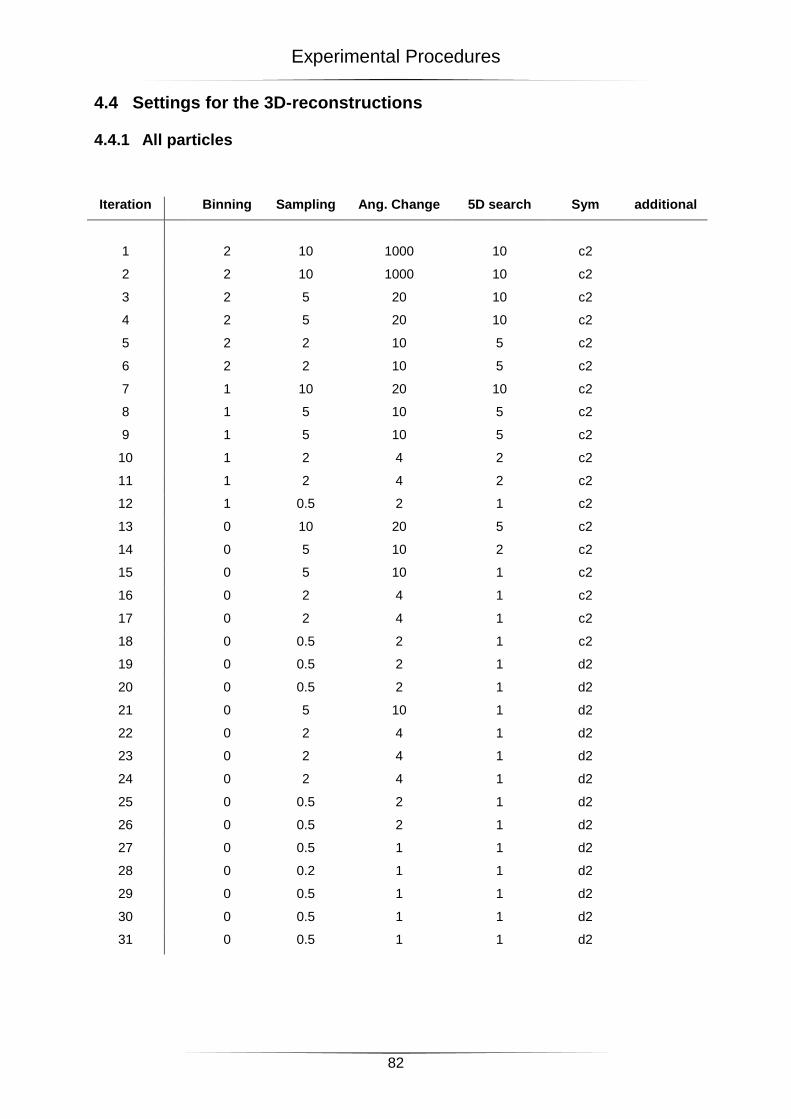
Experimental Procedures
82
4.4 Settings for the 3D-reconstructions
4.4.1 All particles
Iteration Binning Sampling Ang. Change 5D search Sym additional
1 2 10 1000 10 c2
2 2 10 1000 10 c2
3 2 5 20 10 c2
4 2 5 20 10 c2
5 2 2 10 5 c2
6 2 2 10 5 c2
7 1 10 20 10 c2
8 1 5 10 5 c2
9 1 5 10 5 c2
10 1 2 4 2 c2
11 1 2 4 2 c2
12 1 0.5 2 1 c2
13 0 10 20 5 c2
14 0 5 10 2 c2
15 0 5 10 1 c2
16 0 2 4 1 c2
17 0 2 4 1 c2
18 0 0.5 2 1 c2
19 0 0.5 2 1 d2
20 0 0.5 2 1 d2
21 0 5 10 1 d2
22 0 2 4 1 d2
23 0 2 4 1 d2
24 0 2 4 1 d2
25 0 0.5 2 1 d2
26 0 0.5 2 1 d2
27 0 0.5 1 1 d2
28 0 0.2 1 1 d2
29 0 0.5 1 1 d2
30 0 0.5 1 1 d2
31 0 0.5 1 1 d2
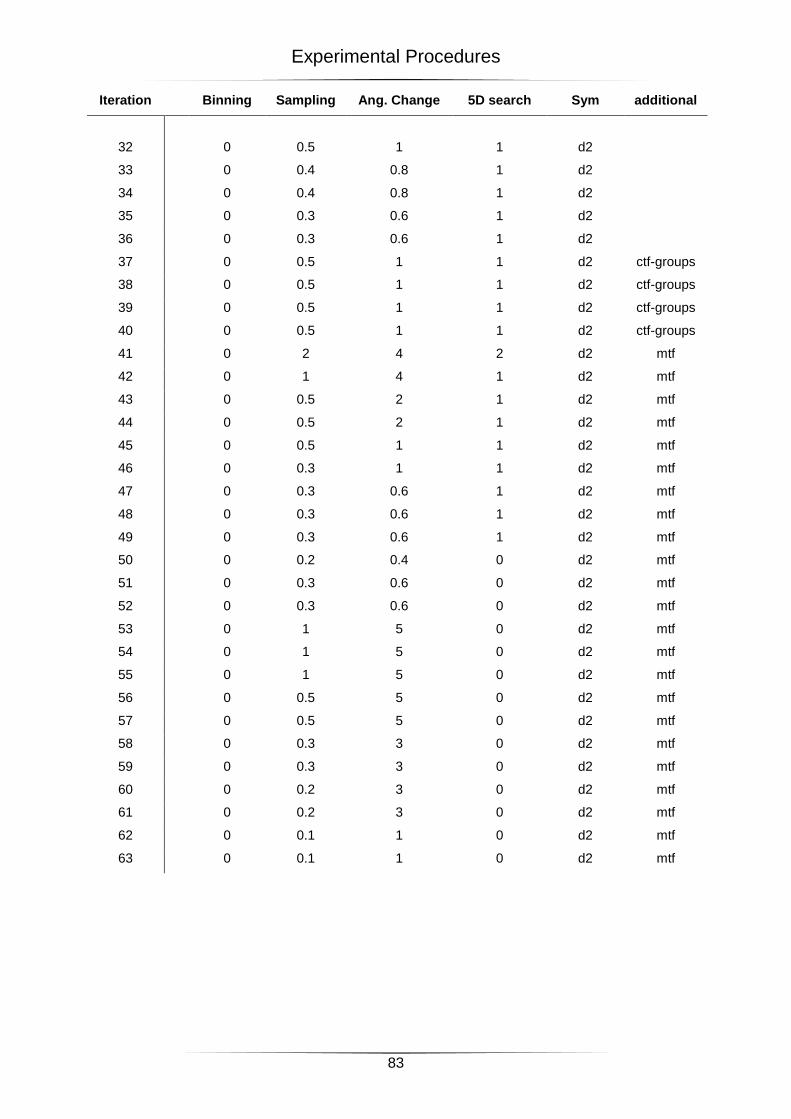
Experimental Procedures
83
Iteration Binning Sampling Ang. Change 5D search Sym additional
32 0 0.5 1 1 d2
33 0 0.4 0.8 1 d2
34 0 0.4 0.8 1 d2
35 0 0.3 0.6 1 d2
36 0 0.3 0.6 1 d2
37 0 0.5 1 1 d2 ctf-groups
38 0 0.5 1 1 d2 ctf-groups
39 0 0.5 1 1 d2 ctf-groups
40 0 0.5 1 1 d2 ctf-groups
41 0 2 4 2 d2 mtf
42 0 1 4 1 d2 mtf
43 0 0.5 2 1 d2 mtf
44 0 0.5 2 1 d2 mtf
45 0 0.5 1 1 d2 mtf
46 0 0.3 1 1 d2 mtf
47 0 0.3 0.6 1 d2 mtf
48 0 0.3 0.6 1 d2 mtf
49 0 0.3 0.6 1 d2 mtf
50 0 0.2 0.4 0 d2 mtf
51 0 0.3 0.6 0 d2 mtf
52 0 0.3 0.6 0 d2 mtf
53 0 1 5 0 d2 mtf
54 0 1 5 0 d2 mtf
55 0 1 5 0 d2 mtf
56 0 0.5 5 0 d2 mtf
57 0 0.5 5 0 d2 mtf
58 0 0.3 3 0 d2 mtf
59 0 0.3 3 0 d2 mtf
60 0 0.2 3 0 d2 mtf
61 0 0.2 3 0 d2 mtf
62 0 0.1 1 0 d2 mtf
63 0 0.1 1 0 d2 mtf
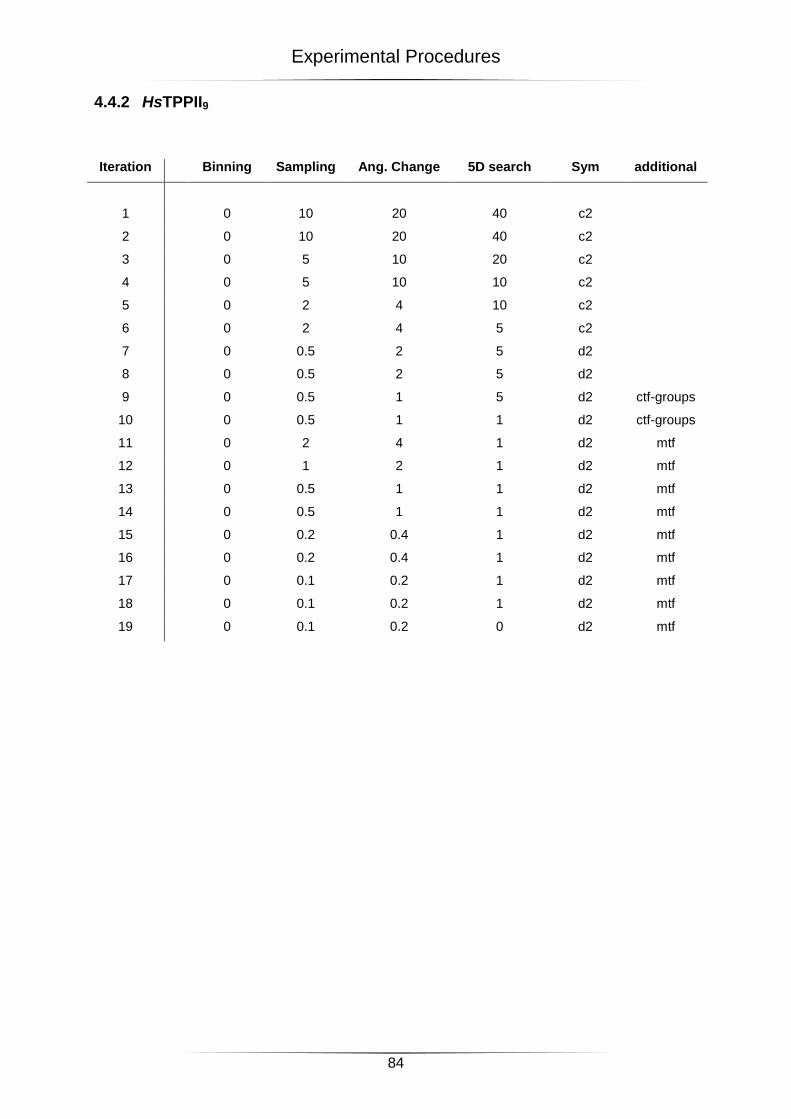
Experimental Procedures
84
4.4.2 HsTPPII9
Iteration Binning Sampling Ang. Change 5D search Sym additional
1 0 10 20 40 c2
2 0 10 20 40 c2
3 0 5 10 20 c2
4 0 5 10 10 c2
5 0 2 4 10 c2
6 0 2 4 5 c2
7 0 0.5 2 5 d2
8 0 0.5 2 5 d2
9 0 0.5 1 5 d2 ctf-groups
10 0 0.5 1 1 d2 ctf-groups
11 0 2 4 1 d2 mtf
12 0 1 2 1 d2 mtf
13 0 0.5 1 1 d2 mtf
14 0 0.5 1 1 d2 mtf
15 0 0.2 0.4 1 d2 mtf
16 0 0.2 0.4 1 d2 mtf
17 0 0.1 0.2 1 d2 mtf
18 0 0.1 0.2 1 d2 mtf
19 0 0.1 0.2 0 d2 mtf
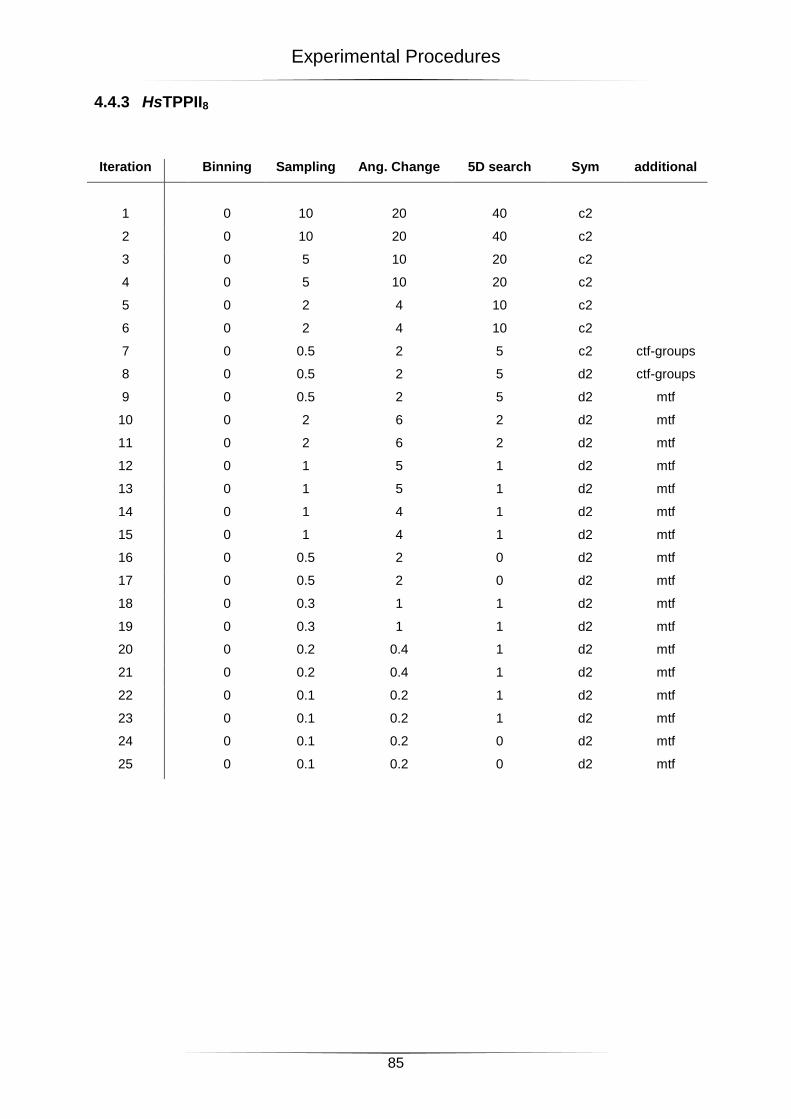
Experimental Procedures
85
4.4.3 HsTPPII8
Iteration Binning Sampling Ang. Change 5D search Sym additional
1 0 10 20 40 c2
2 0 10 20 40 c2
3 0 5 10 20 c2
4 0 5 10 20 c2
5 0 2 4 10 c2
6 0 2 4 10 c2
7 0 0.5 2 5 c2 ctf-groups
8 0 0.5 2 5 d2 ctf-groups
9 0 0.5 2 5 d2 mtf
10 0 2 6 2 d2 mtf
11 0 2 6 2 d2 mtf
12 0 1 5 1 d2 mtf
13 0 1 5 1 d2 mtf
14 0 1 4 1 d2 mtf
15 0 1 4 1 d2 mtf
16 0 0.5 2 0 d2 mtf
17 0 0.5 2 0 d2 mtf
18 0 0.3 1 1 d2 mtf
19 0 0.3 1 1 d2 mtf
20 0 0.2 0.4 1 d2 mtf
21 0 0.2 0.4 1 d2 mtf
22 0 0.1 0.2 1 d2 mtf
23 0 0.1 0.2 1 d2 mtf
24 0 0.1 0.2 0 d2 mtf
25 0 0.1 0.2 0 d2 mtf
References
86
5 References
Addlagatta, A., Gay, L., and Matthews, B.W. (2006). Structure of aminopeptidase N from Escherichia coli suggests a compartmentalized, gated active site. Proc Natl Acad Sci U S A 103,
13339-13344.
Balow, R.M., Ragnarsson, U., and Zetterqvist, O. (1983). Tripeptidyl aminopeptidase in the extralysosomal fraction of rat liver. J Biol Chem 258, 11622-11628.
Balow, R.M., Tomkinson, B., Ragnarsson, U., and Zetterqvist, O. (1986). Purification, substrate specificity, and classification of tripeptidyl peptidase II. J Biol Chem 261, 2409-2417.
Barrett, A.J., Rawling, N.D., and Woessner, J.F., eds. (2004). Handbook of Proteolytic Enzymes, 2
edn (Elsevier Ltd).
Baumeister, W., Walz, J., Zühl, F., and Seemüller, E. (1998). The proteasome: Paradigm of a self-compartmentalizing protease. Cell 92, 367-380.
Beninga, J., Rock, K.L., and Goldberg, A.L. (1998). Interferon-gamma can stimulate post-proteasomal trimming of the N terminus of an antigenic peptide by inducing leucine aminopeptidase. J Biol Chem 273, 18734-18742.
Bermingham, N.A., McKay, T., Hoyle, J., Hernandez, D., Martin, J.E., and Fisher, E.M. (1996). The gene encoding tripeptidyl peptidase II maps to chromosome 1 in the mouse. Mamm Genome 7, 390.
Bode, W., Papamokos, E., and Musil, D. (1987). The high-resolution X-ray crystal structure of the complex formed between subtilisin Carlsberg and eglin c, an elastase inhibitor from the leech Hirudo medicinalis. Structural analysis, subtilisin structure and interface geometry. Eur J Biochem 166, 673-
692.
Book, A.J., Yang, P.Z., Scalf, M., Smith, L.M., and Vierstra, R.D. (2005). Tripeptidyl peptidase II. An oligomeric protease complex from Arabidopsis. Plant Physiol 138, 1046-1057.
Borissenko, L., and Groll, M. (2005). Crystal structure of TET protease reveals complementary protein degradation pathways in prokaryotes. J Mol Biol 346, 1207-1219.
Brandstetter, H., Kim, J.S., Groll, M., Gottig, P., and Huber, R. (2002). Structural basis for the processive protein degradation by tricorn protease. Biol Chem 383, 1157-1165.
Brandstetter, H., Kim, J.S., Groll, M., and Huber, R. (2001). Crystal structure of the tricorn protease reveals a protein disassembly line. Nature 414, 466-470.
Burri, L., Servis, C., Chapatte, L., and Levy, F. (2002). A recyclable assay to analyze the NH(2)-terminal trimming of antigenic peptide precursors. Protein Expr Purif 26, 19-27.
Chen, D., Frezza, M., Schmitt, S., Kanwar, J., and Q, P.D. (2011). Bortezomib as the first proteasome inhibitor anticancer drug: current status and future perspectives. Curr Cancer Drug Targets 11, 239-253.
Chen, P., and Hochstrasser, M. (1996). Autocatalytic subunit processing couples active site formation in the 20S proteasome to completion of assembly. Cell 86, 961-972.
Chin, J.W., Martin, A.B., King, D.S., Wang, L., and Schultz, P.G. (2002). Addition of a photocrosslinking amino acid to the genetic code of Escherichiacoli. Proc Natl Acad Sci U S A 99,
11020-11024.
Chuang, C.K., Rockel, B., Seyit, G., Walian, P.J., Schonegge, A.M., Peters, J., Zwart, P.H., Baumeister, W., and Jap, B.K. (2010). Hybrid molecular structure of the giant protease tripeptidyl peptidase II. Nat Struct Mol Biol 17, 990-996.
Duensing, S., Darr, S., Cuevas, R., Melquiot, N., Brickner, A.G., Duensing, A., and Munger, K. (2010). Tripeptidyl Peptidase II Is Required for c-MYC-Induced Centriole Overduplication and a Novel Therapeutic Target in c-MYC-Associated Neoplasms. Genes Cancer 1, 883-892.
Edgington, L.E., Verdoes, M., and Bogyo, M. (2011). Functional imaging of proteases: recent advances in the design and application of substrate-based and activity-based probes. Curr Opin Chem Biol.
Engel, M., Hoffmann, T., Wagner, L., Wermann, M., Heiser, U., Kiefersauer, R., Huber, R., Bode, W., Demuth, H.U., and Brandstetter, H. (2003). The crystal structure of dipeptidyl peptidase IV (CD26) reveals its functional regulation and enzymatic mechanism. Proc Natl Acad Sci U S A 100,
5063-5068.
References
87
Firat, E., Huai, J., Saveanu, L., Gaedicke, S., Aichele, P., Eichmann, K., van Endert, P., and Niedermann, G. (2007). Analysis of direct and cross-presentation of antigens in TPPII knockout mice. J Immunol 179, 8137-8145.
Firat, E., Tsurumi, C., Gaedicke, S., Huai, J., and Niedermann, G. (2009). Tripeptidyl peptidase II plays a role in the radiation response of selected primary cell types but not based on nuclear translocation and p53 stabilization. Cancer Res 69, 3325-3331.
Fonovic, M., and Bogyo, M. (2008). Activity-based probes as a tool for functional proteomic analysis of proteases. Expert Rev Proteomics 5, 721-730.
Gamble, M., Kunze, G., Dodson, E.J., Wilson, K.S., and Jones, D.D. (2011). Regulation of an intracellular subtilisin protease activity by a short propeptide sequence through an original combined dual mechanism. Proc Natl Acad Sci U S A 108, 3536-3541.
Gao, G., Zhang, J., Si, X., Wong, J., Cheung, C., McManus, B., and Luo, H. (2008). Proteasome inhibition attenuates coxsackievirus-induced myocardial damage in mice. Am J Physiol Heart Circ Physiol 295, H401-408.
Gavioli, R., Frisan, T., Vertuani, S., Bornkamm, G.W., and Masucci, M.G. (2001). c-myc overexpression activates alternative pathways for intracellular proteolysis in lymphoma cells. Nat Cell Biol 3, 283-288.
Geier, E., Pfeifer, G., Wilm, M., Lucchiari-Hartz, M., Baumeister, W., Eichmann, K., and Niedermann, G. (1999). A giant protease with potential to substitute for some functions of the proteasome. Science 283, 978-981.
Glas, R., Bogyo, M., McMaster, J.S., Gaczynska, M., and Ploegh, H.L. (1998). A proteolytic system that compensates for loss of proteasome function. Nature 392, 618-622.
Glickman, M.H., and Ciechanover, A. (2002). The ubiquitin-proteasome proteolytic pathway: destruction for the sake of construction. Physiol Rev 82, 373-428.
Glickman, M.H., Rubin, D.M., Coux, O., Wefes, I., Pfeifer, G., Cjeka, Z., Baumeister, W., Fried, V.A., and Finley, D. (1998). A subcomplex of the proteasome regulatory particle required for ubiquitin-conjugate degradation and related to the COP9-signalosome and eIF3. Cell 94, 615-623.
Goettig, P., Groll, M., Kim, J.S., Huber, R., and Brandstetter, H. (2002). Structures of the tricorn-interacting aminopeptidase F1 with different ligands explain its catalytic mechanism. The EMBO journal 21, 5343-5352.
Harris, J., and Tomkinson, B. (1990). Electron microscopical and biochemical studies on the oligomeric state of human erythrocyte tripeptidyl peptidase II. Micron Microsc Acta 21, 77-89.
Hasselgren, P.O., and Fischer, J.E. (2001). Muscle cachexia: current concepts of intracellular mechanisms and molecular regulation. Ann Surg 233, 9-17.
Heal, W.P., Dang, T.H., and Tate, E.W. (2011). Activity-based probes: discovering new biology and new drug targets. Chem Soc Rev 40, 246-257.
Hedstrom, L. (2002). Serine protease mechanism and specificity. Chem Rev 102, 4501-4524.
Hegde, A.N., and Upadhya, S.C. (2011). Role of ubiquitin-proteasome-mediated proteolysis in nervous system disease. Biochim Biophys Acta 1809, 128-140.
Hegerl, R. (1996). The EM Program Package: A Platform for Image Processing in Biological Electron Microscopy. J Struct Biol 116, 30-34.
Hilbi, H., Jozsa, E., and Tomkinson, B. (2002). Identification of the catalytic triad in tripeptidyl-peptidase II through site-directed mutagenesis. Biochim Biophys Acta 1601, 149-154.
Hilbi, H., Moss, J.E., Hersh, D., Chen, Y., Arondel, J., Banerjee, S., Flavell, R.A., Yuan, J., Sansonetti, P.J., and Zychlinsky, A. (1998). Shigella-induced apoptosis is dependent on caspase-1 which binds to IpaB. J Biol Chem 273, 32895-32900.
Hilbi, H., Puro, R.J., and Zychlinsky, A. (2000). Tripeptidyl peptidase II promotes maturation of caspase-1 in Shigella flexneri-induced macrophage apoptosis. Infection and immunity 68, 5502-5508.
Hong, X., Lei, L., and Glas, R. (2003). Tumors acquire inhibitor of apoptosis protein (IAP)-mediated apoptosis resistance through altered specificity of cytosolic proteolysis. J Exp Med 197, 1731-1743.
Huai, J., Firat, E., Nil, A., Million, D., Gaedicke, S., Kanzler, B., Freudenberg, M., van Endert, P., Kohler, G., Pahl, H.L., et al. (2008). Activation of cellular death programs associated with immunosenescence-like phenotype in TPPII knockout mice. Proc Natl Acad Sci U S A 105, 5177-
5182.
References
88
Huang, Z., Feng, Y., Chen, D., Wu, X., Huang, S., Wang, X., Xiao, X., Li, W., Huang, N., Gu, L., et al. (2008). Structural basis for activation and inhibition of the secreted chlamydia protease CPAF. Cell Host Microbe 4, 529-542.
Kawahara, M., York, I.A., Hearn, A., Farfan, D., and Rock, K.L. (2009). Analysis of the role of tripeptidyl peptidase II in MHC class I antigen presentation in vivo. J Immunol 183, 6069-6077.
Kessel, M., Maurizi, M.R., Kim, B., Kocsis, E., Trus, B.L., Singh, S.K., and Steven, A.C. (1995). Homology in structural organization between E. coli ClpAP protease and the eukaryotic 26 S proteasome. J Mol Biol 250, 587-594.
Kisselev, A.F., Akopian, T.N., Woo, K.M., and Goldberg, A.L. (1999). The sizes of peptides generated from protein by mammalian 26 and 20 S proteasomes. Implications for understanding the degradative mechanism and antigen presentation. J Biol Chem 274, 3363-3371.
Klein, G. (1983). Specific chromosomal translocations and the genesis of B-cell-derived tumors in mice and men. Cell 32, 311-315.
Krissinel, E., and Henrick, K. (2007). Inference of macromolecular assemblies from crystalline state. J Mol Biol 372, 774-797.
Krojer, T., Sawa, J., Huber, R., and Clausen, T. (2010). HtrA proteases have a conserved activation mechanism that can be triggered by distinct molecular cues. Nat Struct Mol Biol 17, 844-852.
Lazure, C. (2002). The peptidase zymogen proregions: nature's way of preventing undesired activation and proteolysis. Curr Pharm Des 8, 511-531.
Lees, T., Lauffart, B., McDermott, J., Gibson, A., and Mantle, D. (1990). Purification and characterization of tripeptidyl-aminopeptidase from human cerebral cortex. Biochem Soc Trans 18, 667.
Levy, F., Burri, L., Morel, S., Peitrequin, A.L., Levy, N., Bachi, A., Hellman, U., Van den Eynde, B.J., and Servis, C. (2002). The final N-terminal trimming of a subaminoterminal proline-containing HLA class I-restricted antigenic peptide in the cytosol is mediated by two peptidases. J Immunol 169,
4161-4171.
Lindas, A.C., Eriksson, S., Jozsa, E., and Tomkinson, B. (2008). Investigation of a role for Glu-331 and Glu-305 in substrate binding of tripeptidyl-peptidase II. Biochim Biophys Acta 1784, 1899-1907.
Lucic, V., Kossel, A.H., Yang, T., Bonhoeffer, T., Baumeister, W., and Sartori, A. (2007). Multiscale imaging of neurons grown in culture: from light microscopy to cryo-electron tomography. J Struct Biol 160, 146-156.
Lucic, V., Leis, A., and Baumeister, W. (2008). Cryo-electron tomography of cells: connecting structure and function. Histochem Cell Biol 130, 185-196.
Ludtke, S.J., Baldwin, P.R., and Chiu, W. (1999). EMAN: semiautomated software for high-resolution single-particle reconstructions. J Struct Biol 128, 82-97.
Lupas, A., Flanagan, J.M., Tamura, T., and Baumeister, W. (1997). Self-compartmentalizing proteases. Trends Biochem Sci 22, 399-404.
Macpherson, E., Tomkinson, B., Balow, R.M., Hoglund, S., and Zetterqvist, O. (1987). Supramolecular Structure of Tripeptidyl Peptidase-Ii from Human-Erythrocytes as Studied by Electron-Microscopy, and Its Correlation to Enzyme-Activity. Biochem J 248, 259-263.
Mastronarde, D.N. (2005). Automated electron microscope tomography using robust prediction of specimen movements. J Struct Biol 152, 36-51.
Masucci, M.G. (2004). Epstein-Barr virus oncogenesis and the ubiquitin-proteasome system. Oncogene 23, 2107-2115.
McKay, R.M., McKay, J.P., Suh, J.M., Avery, L., and Graff, J.M. (2007). Tripeptidyl peptidase II promotes fat formation in a conserved fashion. EMBO Rep 8, 1183-1189.
Meiners, S., Heyken, D., Weller, A., Ludwig, A., Stangl, K., Kloetzel, P.M., and Kruger, E. (2003). Inhibition of proteasome activity induces concerted expression of proteasome genes and de novo formation of Mammalian proteasomes. J Biol Chem 278, 21517-21525.
Mitsiades, N., Mitsiades, C.S., Poulaki, V., Chauhan, D., Fanourakis, G., Gu, X., Bailey, C., Joseph, M., Libermann, T.A., Treon, S.P., et al. (2002). Molecular sequelae of proteasome inhibition in human multiple myeloma cells. Proc Natl Acad Sci U S A 99, 14374-14379.
References
89
Nickell, S., Forster, F., Linaroudis, A., Net, W.D., Beck, F., Hegerl, R., Baumeister, W., and Plitzko, J.M. (2005). TOM software toolbox: acquisition and analysis for electron tomography. J Struct Biol 149, 227-234.
Nitsch, M., Klumpp, M., Lupas, A., and Baumeister, W. (1997). The thermosome: alternating alpha and beta-subunits within the chaperonin of the archaeon Thermoplasma acidophilum. J Mol Biol 267,
142-149.
Nussbaum, A.K., Dick, T.P., Keilholz, W., Schirle, M., Stevanovic, S., Dietz, K., Heinemeyer, W., Groll, M., Wolf, D.H., Huber, R., et al. (1998). Cleavage motifs of the yeast 20S proteasome beta subunits deduced from digests of enolase 1. Proc Natl Acad Sci U S A 95, 12504-12509.
Osmulski, P.A., and Gaczynska, M. (1998). A new large proteolytic complex distinct from the proteasome is present in the cytosol of fission yeast. Curr Biol 8, 1023-1026.
Paschen, S.A., Christian, J.G., Vier, J., Schmidt, F., Walch, A., Ojcius, D.M., and Hacker, G. (2008). Cytopathicity of Chlamydia is largely reproduced by expression of a single chlamydial protease. J Cell Biol 182, 117-127.
Penczek, P.A., Yang, C., Frank, J., and Spahn, C.M. (2006). Estimation of variance in single-particle reconstruction using the bootstrap technique. J Struct Biol 154, 168-183.
Peters, J., Schönegge, A.M., Rockel, B., and Baumeister, W. (2011). Molecular ruler of tripeptidylpeptidase II: Mechanistic principle of exopeptidase selectivity. Biochem Biophys Res Co 414,
209-214.
Pettersen, E.F., Goddard, T.D., Huang, C.C., Couch, G.S., Greenblatt, D.M., Meng, E.C., and Ferrin, T.E. (2004). UCSF Chimera--a visualization system for exploratory research and analysis. J Comput Chem 25, 1605-1612.
Pickart, C.M., and Cohen, R.E. (2004). Proteasomes and their kin: Proteases in the machine age. Nat Rev Mol Cell B 5, 177-187.
Preta, G., de Klark, R., Chakraborti, S., and Glas, R. (2010a). MAP kinase-signaling controls nuclear translocation of tripeptidyl-peptidase II in response to DNA damage and oxidative stress. Biochem Biophys Res Commun 399, 324-330.
Preta, G., de Klark, R., Gavioli, R., and Glas, R. (2010b). The Enigma of Tripeptidyl-Peptidase II: Dual Roles in Housekeeping and Stress. J Oncol 2010.
Preta, G., de Klark, R., and Glas, R. (2009). A role for nuclear translocation of tripeptidyl-peptidase II in reactive oxygen species-dependent DNA damage responses. Biochem Biophys Res Commun 389,
575-579.
Princiotta, M.F., Schubert, U., Chen, W.S., Bennink, J.R., Myung, J., Crews, C.M., and Yewdell, J.W. (2001). Cells adapted to the proteasome inhibitor 4-hydroxy5-iodo-3-nitrophenylacetyl-Leu-Leu-leucinal-vinyl sulfone require enzymatically active proteasomes for continued survival. Proc Natl Acad Sci U S A 98, 513-518.
Reits, E., Neijssen, J., Herberts, C., Benckhuijsen, W., Janssen, L., Drijfhout, J.W., and Neefjes, J. (2004). A major role for TPPII in trimming proteasomal degradation products for MHC class I antigen presentation. Immunity 20, 495-506.
Renn, S.C., Tomkinson, B., and Taghert, P.H. (1998). Characterization and cloning of tripeptidyl peptidase II from the fruit fly, Drosophila melanogaster. J Biol Chem 273, 19173-19182.
Rockel, B., Kopec, K.O., Lupas, A.N., and Baumeister, W. (2012). Structure and function of tripeptidyl peptidase II, a giant cytosolic protease. Biochim Biophys Acta 1824, 237-245.
Rockel, B., Peters, J., Kühlmorgen, B., Glaeser, R.M., and Baumeister, W. (2002). A giant protease with a twist: the TPP II complex from Drosophila studied by electron microscopy. EMBO J 21,
5979-5984.
Rockel, B., Peters, J., Müller, S.A., Seyit, G., Ringler, P., Hegerl, R., Glaeser, R.M., and Baumeister, W. (2005). Molecular architecture and assembly mechanism of Drosophila tripeptidyl peptidase II. Proc Natl Acad Sci U S A 102, 10135-10140.
Rose, C., Vargas, F., Facchinetti, P., Bourgeat, P., Bambal, R.B., Bishop, P.B., Chan, S.M., Moore, A.N., Ganellin, C.R., and Schwartz, J.C. (1996). Characterization and inhibition of a cholecystokinin-inactivating serine peptidase. Nature 380, 403-409.
Rosenthal, P.B., and Henderson, R. (2003). Optimal determination of particle orientation, absolute hand, and contrast loss in single-particle electron cryomicroscopy. J Mol Biol 333, 721-745.
References
90
Rowe, M., Rowe, D.T., Gregory, C.D., Young, L.S., Farrell, P.J., Rupani, H., and Rickinson, A.B. (1987). Differences in B cell growth phenotype reflect novel patterns of Epstein-Barr virus latent gene expression in Burkitt's lymphoma cells. Embo J 6, 2743-2751.
Saric, T., Chang, S.C., Hattori, A., York, I.A., Markant, S., Rock, K.L., Tsujimoto, M., and Goldberg, A.L. (2002). An IFN-gamma-induced aminopeptidase in the ER, ERAP1, trims precursors to MHC class I-presented peptides. Nat Immunol 3, 1169-1176.
Schagger, H., and von Jagow, G. (1987). Tricine-sodium dodecyl sulfate-polyacrylamide gel electrophoresis for the separation of proteins in the range from 1 to 100 kDa. Anal Biochem 166, 368-
379.
Scheres, S.H., Gao, H., Valle, M., Herman, G.T., Eggermont, P.P., Frank, J., and Carazo, J.M. (2007). Disentangling conformational states of macromolecules in 3D-EM through likelihood optimization. Nat Methods 4, 27-29.
Scheres, S.H., Nunez-Ramirez, R., Sorzano, C.O., Carazo, J.M., and Marabini, R. (2008). Image processing for electron microscopy single-particle analysis using XMIPP. Nat Protoc 3, 977-990.
Schoehn, G., Vellieux, F.M., Asuncion Dura, M., Receveur-Brechot, V., Fabry, C.M., Ruigrok, R.W., Ebel, C., Roussel, A., and Franzetti, B. (2006). An archaeal peptidase assembles into two different quaternary structures: A tetrahedron and a giant octahedron. J Biol Chem 281, 36327-36337.
Schönegge, A. (2007). Recombinant Expression and Characterization of the human Tripeptidyl
Peptidase II. M. Sc., Technische Universität München
Schönegge, A., Villa, E., Förster, F., Hegerl, R., Peters, J., Baumeister, W., and Rockel, B. (2012). The structure of human Tripeptidyl peptidase II as deteremined by a hybrid approach. submitted.
Seifert, U., Maranon, C., Shmueli, A., Desoutter, J.F., Wesoloski, L., Janek, K., Henklein, P., Diescher, S., Andrieu, M., de la Salle, H., et al. (2003). An essential role for tripeptidyl peptidase in the generation of an MHC class I epitope. Nat Immunol 4, 375-379.
Seyit, G. (2006). Structural Studies of Tripeptidylpeptidase II: Expression and Crystallization Trials. Dr.
rer. nat, Technische Universität München
Seyit, G., Rockel, B., Baumeister, W., and Peters, J. (2006). Size matters for the tripeptidylpeptidase II complex from Drosophila - The 6-MDa spindle form stabilizes the activated state. J Biol Chem 281, 25723-25733.
Shastri, N., Cardinaud, S., Schwab, S.R., Serwold, T., and Kunisawa, J. (2005). All the peptides that fit: the beginning, the middle, and the end of the MHC class I antigen-processing pathway. Immunol Rev 207, 31-41.
Siezen, R.J., de Vos, W.M., Leunissen, J.A., and Dijkstra, B.W. (1991). Homology modelling and protein engineering strategy of subtilases, the family of subtilisin-like serine proteinases. Protein Eng 4, 719-737.
Siezen, R.J., and Leunissen, J.A. (1997). Subtilases: the superfamily of subtilisin-like serine proteases. Protein Sci 6, 501-523.
Stavropoulou, V., Vasquez, V., Cereser, B., Freda, E., and Masucci, M.G. (2006). TPPII promotes genetic instability by allowing the escape from apoptosis of cells with activated mitotic checkpoints. Biochem Biophys Res Commun 346, 415-425.
Stavropoulou, V., Xie, J., Henriksson, M., Tomkinson, B., Imreh, S., and Masucci, M.G. (2005). Mitotic infidelity and centrosome duplication errors in cells overexpressing tripeptidyl-peptidase II. Cancer Res 65, 1361-1368.
Stoltze, L., Schirle, M., Schwarz, G., Schroter, C., Thompson, M.W., Hersh, L.B., Kalbacher, H., Stevanovic, S., Rammensee, H.G., and Schild, H. (2000). Two new proteases in the MHC class I processing pathway. Nat Immunol 1, 413-418.
Tamura, T., Tamura, N., Cejka, Z., Hegerl, R., Lottspeich, F., and Baumeister, W. (1996). Tricorn protease - the core of a modular proteolytic system. Science 274, 1385-1389.
Tiao, G., Fagan, J.M., Samuels, N., James, J.H., Hudson, K., Lieberman, M., Fischer, J.E., and Hasselgren, P.O. (1994). Sepsis stimulates nonlysosomal, energy-dependent proteolysis and increases ubiquitin mRNA levels in rat skeletal muscle. J Clin Invest 94, 2255-2264.
Tomkinson, B. (1991). Nucleotide sequence of cDNA covering the N-terminus of human tripeptidyl peptidase II. Biomed Biochim Acta 50, 727-729.
References
91
Tomkinson, B. (1999). Tripeptidyl peptidases: enzymes that count. Trends Biochem Sci 24, 355-359.
Tomkinson, B. (2000). Association and dissociation of the tripeptidyl-peptidase II complex as a way of regulating the enzyme activity. Arch Biochem Biophys 376, 275-280.
Tomkinson, B., ed. (2004). Handbook of Proteolytic Enzymes, 2 edn (Elsevier Ltd).
Tomkinson, B., and Jonsson, A.K. (1991). Characterization of cDNA for human tripeptidyl peptidase II: the N-terminal part of the enzyme is similar to subtilisin. Biochemistry 30, 168-174.
Tomkinson, B., and Lindas, A.C. (2005). Tripeptidyl-peptidase II: a multi-purpose peptidase. Int J Biochem Cell Biol 37, 1933-1937.
Tomkinson, B., Wernstedt, C., Hellman, U., and Zetterqvist, O. (1987). Active site of tripeptidyl peptidase II from human erythrocytes is of the subtilisin type. Proc Natl Acad Sci U S A 84, 7508-7512.
van Endert, P. (2008). Role of tripeptidyl peptidase II in MHC class I antigen processing - the end of controversies? Eur J Immunol 38, 609-613.
van Endert, P. (2011). Post-proteasomal and proteasome-independent generation of MHC class I ligands. Cell Mol Life Sci 68, 1553-1567.
Vevodova, J., Gamble, M., Kunze, G., Ariza, A., Dodson, E., Jones, D.D., and Wilson, K.S. (2010). Crystal structure of an intracellular subtilisin reveals novel structural features unique to this subtilisin family. Structure 18, 744-755.
Villasevil, E.M., Guil, S., Lopez-Ferreras, L., Sanchez, C., Del Val, M., and Anton, L.C. (2010). Accumulation of polyubiquitylated proteins in response to Ala-Ala-Phe-chloromethylketone is independent of the inhibition of Tripeptidyl peptidase II. Biochim Biophys Acta 1803, 1094-1105.
Walz, J., Erdmann, A., Kania, M., Typke, D., Koster, A.J., and Baumeister, W. (1998). 26S proteasome structure revealed by three-dimensional electron microscopy. J Struct Biol 121, 19-29.
Walz, J., Tamura, T., Tamura, N., Grimm, R., Baumeister, W., and Koster, A.J. (1997). Tricorn protease exists as an icosahedral supermolecule in vivo. Mol Cell 1, 59-65.
Wang, E.W., Kessler, B.M., Borodovsky, A., Cravatt, B.F., Bogyo, M., Ploegh, H.L., and Glas, R. (2000). Integration of the ubiquitin-proteasome pathway with a cytosolic oligopeptidase activity. Proc Natl Acad Sci U S A 97, 9990-9995.
Wang, J., Hartling, J.A., and Flanagan, J.M. (1997). The structure of ClpP at 2.3 A resolution suggests a model for ATP-dependent proteolysis. Cell 91, 447-456.
Wilson, C., Gibson, A.M., and McDermott, J.R. (1993). Purification and Characterization of Tripeptidylpeptidase-Ii from Postmortem Human Brain. Neurochem Res 18, 743-749.
Witt, S., Kwon, Y.D., Sharon, M., Felderer, K., Beuttler, M., Robinson, C.V., Baumeister, W., and Jap, B.K. (2006). Proteasome assembly triggers a switch required for active-site maturation. Structure 14, 1179-1188.
Wray, C.J., Tomkinson, B., Robb, B.W., and Hasselgren, P.O. (2002). Tripeptidyl-peptidase II expression and activity are increased in skeletal muscle during sepsis. Biochem Biophys Res Commun 296, 41-47.
Xu, Y., Nakajima, Y., Ito, K., Zheng, H., Oyama, H., Heiser, U., Hoffmann, T., Gartner, U.T., Demuth, H.U., and Yoshimoto, T. (2008). Novel inhibitor for prolyl tripeptidyl aminopeptidase from Porphyromonas gingivalis and details of substrate-recognition mechanism. J Mol Biol 375, 708-719.
Yao, T., and Cohen, R.E. (2002). A cryptic protease couples deubiquitination and degradation by the proteasome. Nature 419, 403-407.
York, I.A., Bhutani, N., Zendzian, S., Goldberg, A.L., and Rock, K.L. (2006). Tripeptidyl peptidase II is the major peptidase needed to trim long antigenic precursors, but is not required for most MHC class I antigen presentation. J Immunol 177, 1434-1443.
York, I.A., Chang, S.C., Saric, T., Keys, J.A., Favreau, J.M., Goldberg, A.L., and Rock, K.L. (2002). The ER aminopeptidase ERAP1 enhances or limits antigen presentation by trimming epitopes to 8-9 residues. Nat Immunol 3, 1177-1184.
York, I.A., Mo, A.X., Lemerise, K., Zeng, W., Shen, Y., Abraham, C.R., Saric, T., Goldberg, A.L., and Rock, K.L. (2003). The cytosolic endopeptidase, thimet oligopeptidase, destroys antigenic peptides and limits the extent of MHC class I antigen presentation. Immunity 18, 429-440.
Yoshimura, T., Kameyama, K., Takagi, T., Ikai, A., Tokunaga, F., Koide, T., Tanahashi, N., Tamura, T., Cejka, Z., Baumeister, W., et al. (1993). Molecular Characterization of the 26S Proteasome Complex from Rat-Liver. J Struct Biol 111, 200-211.
References
92
Yu, Y., Smith, D.M., Kim, H.M., Rodriguez, V., Goldberg, A.L., and Cheng, Y. (2010). Interactions of PAN's C-termini with archaeal 20S proteasome and implications for the eukaryotic proteasome-ATPase interactions. EMBO J 29, 692-702.
Zhang, J., Wong, J., Gao, G., and Luo, H. (2011). Tripeptidyl peptidase II serves as an alternative to impaired proteasome to maintain viral growth in the host cells. FEBS Lett 585, 261-265.
Zwickl, P., Baumeister, W., and Steven, A. (2000). Dis-assembly lines: the proteasome and related ATPase-assisted proteases. Curr Opin Struct Biol 10, 242-250.
Abbreviations
94
6 Abbreviations
2D two-dimensional
3D three-dimensional
Å Ångström
aa amino acid
ABP activity-based probes
AAF-Amc Ala-Ala-Phe-Amc
Amc 7-amino-4methylcoumarin
AS ammoniumsulfate
BL Burkitt’s Lymphoma
Bpa benzophenyllalanine
cbb coomassie brilliant blue
° C degree Celsius
ccc cross correlation coefficient
CCD charges-coupled device
Chlor chloramphenicol
CPAF Chlamydial protease-like activity factor
cryo-EM cryo electron microscopy
ctf contrast transfer function
DNA deoxyribonucleic acid
DmTPPII Drosophila melanogaster TPPII
DTT dithiothreitol
E. coli Escherichia coli
EM electronmicropscpy
FSC Fourier shell correlation
g standard gravity
g gram
GFP green fluorescence protein
H hour
HsTPPII Homo sapiens TPPII
HtrA protease high temperature requirement A protease
HMW high molecular weight
IEX ion exchange Chromatography
IMAC immobilized metal ion affinity chromatography
IPTG isopropyl β-D-1- thiolgalactopyranoside
Kan kanamycin
Abbreviations
95
kDa kilo dalton
KO kock-out
kV kilo volts
LMW low molecular weight
l litre
M molar
mM millimolar
mg milligram
ml millilitre
µl microlitre
min minute
MBP maltose binding protein
MDFF molecular dynamics flexible fitting
ML3D maximum likelihood in 3D
Mtf modulation transfer function
nm nanometer
ng nanogram
pmol picocolar
PCR polymerase chain reaction
PEI polyethyleneimine
Pro proline
RMSF root-mean-square fluctuation
S. pombe Schizosaccharomyces pombe
sec second
SDS sodium dodecyl sulfate
SDS-PAGE SDS-polyacrylamide gel electrophoresis
SEC size exclusion chromatography
SpTPPII Schizosaccharomyces pombe TPPII
Thr threonine
TPPII tripeptidyl peptidase II
Tris Tris(hydroxymethyl)-aminomethan
UV ultraviolet
V volts

Acknowledgements
96
7 Acknowledgements
ICH WIDME DIESE ARBEIT MEINEM VATER († 23.05.2011)
I DEDICATE THIS WORK TO MY FATHER († 23.05.2011)
First and foremost, I would like to thank Prof. Wolfgang Baumeister for having given me the
opportunity to perform my Ph.D. thesis in his group and for his guidance and support
throughout my studies.
My direct supervisors Dr. Beate Rockel and Dr. Jürgen Peters deserve my deepest
gratitude for their constant support, for their help and inspiration as well as for the fruitful
discussions and proof reading of the thesis.
Together with Marietta, the members of the TPPII group have always contributed to a great
work atmosphere full of collegiality, mutual support and help, which I enjoyed very much
throughout my graduate studies. I thank everyone for the stimulating conversations,
suggestions and support during both the good and the hard times.
I also want to acknowledge all my co-workers and office neighbors who have created the
great work atmosphere in the department by giving helpful ideas and offering a helping hand
whenever needed.
Special thanks to Birgit, Sabina, Inga and Tim for their help with a lot of little things, which
made my life a lot easier.
The collaboration with Dr. Bing Jap provided new insights into our work and I am very
thankful for his ideas and his help during the various phases of my project.
Furthermore, I thank Dr. Richard Leduc and his lab for discussions and help by
establishing a photocrosslinking technique in attempts to further study TPPII structure.
I am very grateful for the love, inspiration and support of my family that allowed me to start,
continue and finish my studies and my thesis. Finally, I express my profound gratitude to Jan,
my partner and his family have supported and encouraged me throughout my Ph.D.
studies. Last but not least I would like to thank old and new friends for having great times
with me after long lab days. Each of you has greatly enriched my life.

Publication List
97
8 Publication List
Chuang, C. K., Rockel, B., Seyit, G., Walian, P. J., Schönegge, A. M., Peters, J., Zwart, P. H., Baumeister, W. and Jap, B. K. (2010). "Hybrid molecular structure of the giant protease tripeptidyl peptidase II." Nat Struct Mol Biol 17(8): 990-996.
Peters, J., Schönegge, A. M., Rockel, B. and Baumeister, W. (2011). "Molecular ruler of tripeptidylpeptidase II: mechanistic principle of exopeptidase selectivity." Biochem Biophys Res Co 414(1): 209-214.
Schönegge, A. M., Villa, E., Hegerl, R., Peters, J., Förster, F., Baumeister, W. and Rockel, B. (2012). "The structure of human tripeptidyl peptidase II as determined by a hybrid approach." Structure 20(4):593-603.
Peters, J., Schönegge, A. M., Rockel, B. and Baumeister, W. "Cleavage specificity of Tripeptidylpeptidase II." in preparation.
Peters, J., Schönegge, A. M., Rockel, B. and Baumeister, W. "Potential biological role or irrelevant side activity? A critical assessment of the endopeptidase activity of Tripeptidylpeptidase II." in preparation.