

STRATEGO - EIHP | Energy Institute Hrvoje Požar€¦ · thermal power plants, industry, ... Heat...
38
STRATEGO Multi-level actions for enhanced Heating & Cooling plans
Transcript of STRATEGO - EIHP | Energy Institute Hrvoje Požar€¦ · thermal power plants, industry, ... Heat...

STRATEGO
Multi-level actions for enhanced Heating & Cooling plans

Content
STRATEGO
Methodology
Results
Cooling
2
3
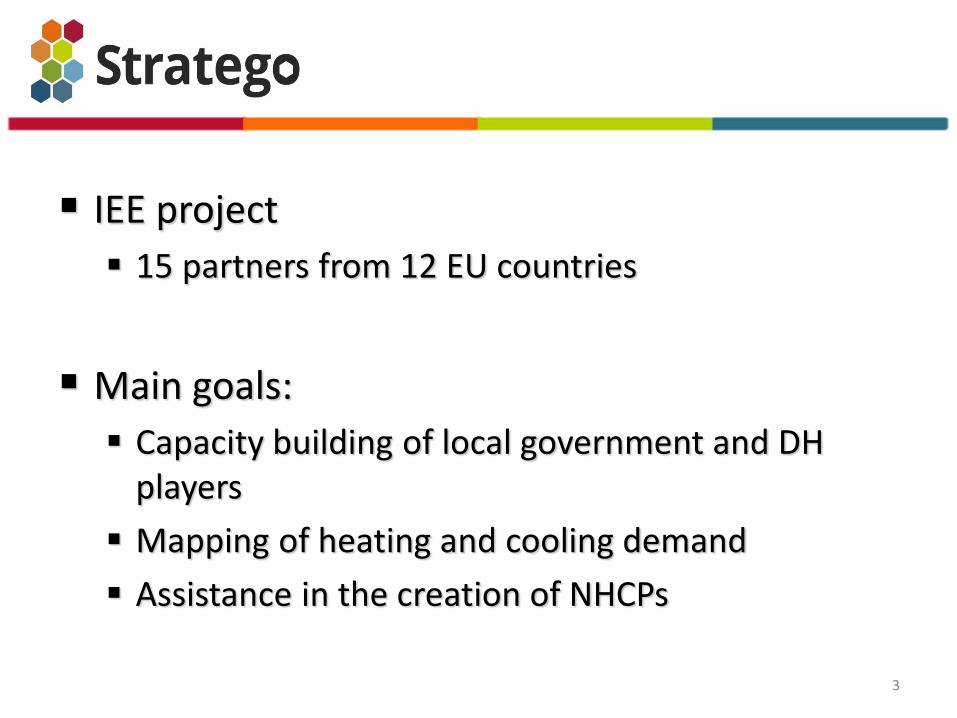
IEE project
15 partners from 12 EU countries
Main goals:
Capacity building of local government and DH players
Mapping of heating and cooling demand
Assistance in the creation of NHCPs
4
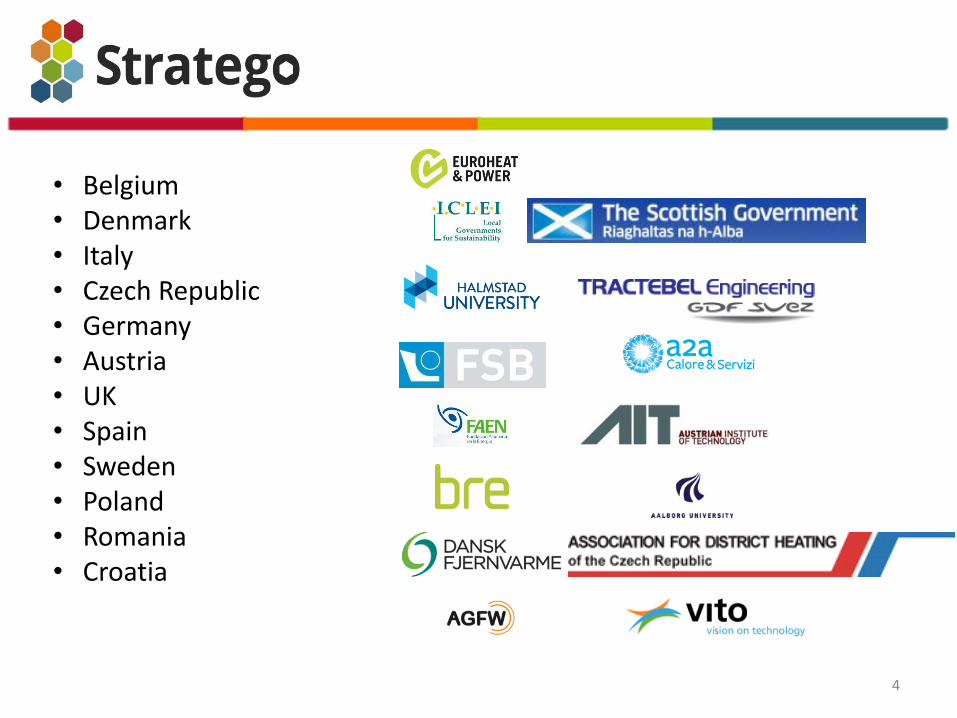
• Belgium • Denmark • Italy • Czech Republic • Germany • Austria • UK • Spain • Sweden • Poland • Romania • Croatia

METHODOLOGY
5

Today’s Energy System
Heat-Only Boilers
Mobility
Electricity
Cooling
Heating
Fuels Power Plants
Power Exchange
Resources Conversion Exchange and Storage
Demand
Engines
6
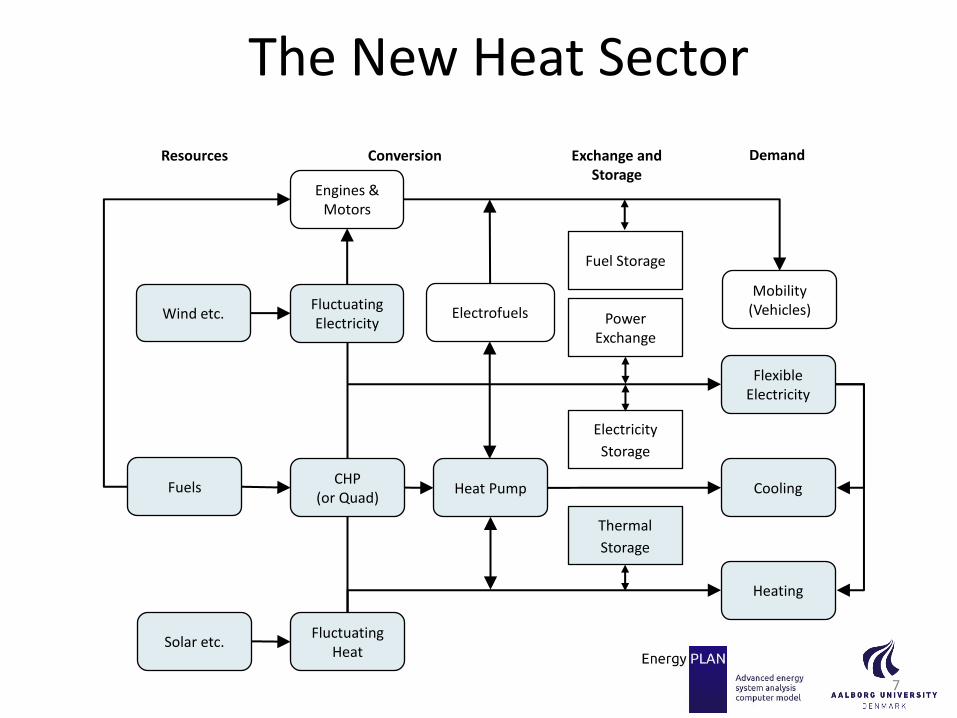
The New Heat Sector
Mobility (Vehicles)
Flexible Electricity
Cooling
Heating
Solar etc.
Fuels CHP
(or Quad)
Power Exchange
Resources Conversion Exchange and Storage
Demand
Heat Pump
Fluctuating Heat
Fluctuating Electricity
Electricity
Storage
Thermal
Storage
Wind etc.
Fuel Storage
Electrofuels
Engines & Motors
7
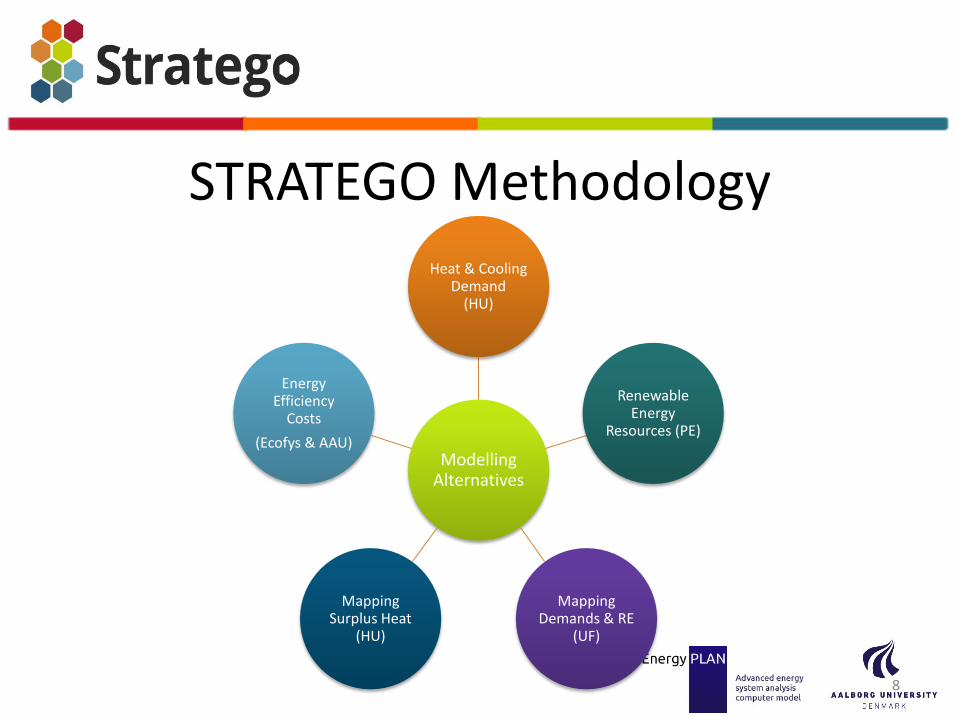
STRATEGO Methodology
Modelling Alternatives
Heat & Cooling Demand
(HU)
Renewable Energy
Resources (PE)
Mapping Demands & RE
(UF)
Mapping Surplus Heat
(HU)
Energy Efficiency
Costs
(Ecofys & AAU)
8

Nine Background Reports
1. Creating National Energy Models for 2010 and 2050 2. Creating Hourly Profiles to Model both Demand and
Supply 3. Quantifying the Cost of Heat Savings in EU Member
States 4. Quantifying the Heating and Cooling Demand in Europe 5. Mapping the Heating and Cooling Demand in Europe 6. Quantifying the Potential for District Heating and
Cooling in EU Member States 7. Quantifying the Excess Heat Available for District
Heating in Europe 8. Estimating the Renewable Energy Resources Available
in EU Member States 9. Mapping the Renewable Heat Resources in Europe
9

Czech Republic Croatia
Italy Romania United Kingdom
http://maps.heatroadmap.eu/
10

Combine Inputs in Modelling
Modelling DHC Strategies
Energy Savings
Potentials
Renewable Energy
Potentials
Mapping
11

Modelling Steps
Results
(Energy, Environment,
Economy)
Energy Efficiency
Alternatives
Forecast for the Future (BAU 2050)
Starting Point
(2010)
• Extra Heat Savings • Extra District Heating • Different Individual Heating Options
12

Modelling Steps for Each Country in STRATEGO (i.e. Alternatives in STRATEGO)
Step Technologies
0a. 2010 2010 historical model (Calibration)
0b. BAU 2050 2050 business-as-usual scenario based on the latest
European Commission forecasts
1: Heat savings ADD: Heat savings
2: Heat networks COMPARE: Gas and water (i.e. district heating)
networks
3: Individual heating COMPARE: Oil boilers, Biomass boilers, heat pumps,
electric heating
4: Renewable Heat ADD: Geothermal, waste incineration, excess industrial
heat, large-scale solar thermal
5: Renewable Electricity ADD: Large heat pumps, electric boilers
6. Heat Roadmap OPTIMISE: Synergies in the new efficient heat sector
7. Cooling COMPARE: Individual and District Cooling for the
services sector in urban areas 13

Tools Name Purpose Output Reports
EnergyPLAN To simulate the electricity, heating, cooling, transport sectors on an
hourly basis
Energy, economic, and environmental impact of
different energy scenarios
This Report, BR1,
BR2
PETA (Pan-European Thermal Atlas) –
ArcGIS + ArcMap (GIS Mapping)
To create maps with the location and scale of heat demand, cooling
demand, excess heat, and renewable heat
Technical and economic potential of district
heating and district cooling networks. Quantify the
heat available for district heating and cooling from
thermal power plants, industry, waste incineration,
geothermal, and solar thermal heat
BR5, BR6, BR7, BR9
BEAM
To simulate how the building stock will evolve over time based on
different energy efficiency targets and different changes to the building
stock (e.g. demolition, renovations, etc.)
Heating demand, cooling demand, and investment
cost for different levels of heat savings BR3
Meteonorm Meteorological data necessary for developing hourly renewable energy
distributions (e.g. wind, solar, etc.) Meteorological data BR2
MATSim Agent based modelling to create a distribution for energy consumption in
transportation
Hourly energy consumption data for transportation
in Croatia also applied in other STRATEGO
countries
BR2
Methodologies Name Purpose Primary Tool(s) Considered Reports
Creating National Energy Models Based
on Historical Data
Converting energy statistics into a suitable format for the EnergyPLAN
tool Inputs for EnergyPLAN BR1
Creating National Energy Models Based
on Future Projections of the Energy
System
Converting energy statistics from a future projection of the energy system
into a suitable format for the EnergyPLAN tool
Outputs from the software used by the European
Commission [25], PRIMES, and Inputs for
EnergyPLAN
BR1
Creating Hourly Distribution Data Creating an hourly profile for electricity, heating, cooling, and transport
demands, as well as wind, wave, and solar production. Inputs for EnergyPLAN BR2
Designing the scenarios to quantify the
impact of a high-efficiency heating and
cooling sector
The inputs from all of the Background Reports are combined to design
new scenarios in EnergyPLAN for the heating and cooling sectors. For
example, what resources are available and how much of each solution can
be implemented.
Inputs for EnergyPLAN Main Report
Quantifying the impact of increased
energy efficiency in the heating and
cooling sectors
Simulating various renewable energy scenarios and quantifying the
impact of different measures/technologies. Outputs from EnergyPLAN Main Report
Quantifying the Current Heating Demand
in Europe Estimating the existing heat demand in Europe based on historical data Input for the GIS Mapping BR4
Quantifying the Future Heating Demand
in Europe
Calculating how the heating and cooling demand will evolve in the
residential and services building stock
Output from the BEAM tool and Inputs for the
EnergyPLAN tool BR3
Quantifying the Current and Potential
Future Cooling Demand in Europe
Calculating the existing cooling demand in buildings based on historical
data and estimating the maximum cooling demand in the future if all
buildings are cooled to a comfortable level
Input for the GIS Mapping BR4
Mapping the Heat Demand in Europe To identify the technical and economic potential of developing district
heating networks
Output from the GIS Mapping and Input for the
EnergyPLAN Tool BR5
Mapping the Cooling Demand in Europe To identify the technical and economic potential of developing district
cooling networks
Output from the GIS Mapping and Input for the
EnergyPLAN Tool BR5
Calculating the Excess Heat available to
Supply District Heating in Europe
Locating and quantifying the potential heat available from thermal power
plants, industrial excess heat, and existing waste incineration plants in
Europe
Inputs for the GIS Mapping and EnergyPLAN tool BR7
Quantifying the renewable energy
resources available
Review of existing studies to identify the renewable energy resources
available in each country Inputs for the GIS Mapping and EnergyPLAN tool BR8
Mapping the Renewable Energy
Resources
Locating and quantifying the amount of solar, geothermal, biomass, and
heat for large-scale heat pumps available for district heating systems in
Europe
Output from the GIS Mapping and Inputs for the
EnergyPLAN tool BR9
Different Tools and Methodologies in this Study
14
5 Tools:
EnergyPLAN
PETA
BEAM
Meteonorm
MATSim
13 Methodologies
(See Table 16 of the Main Report)
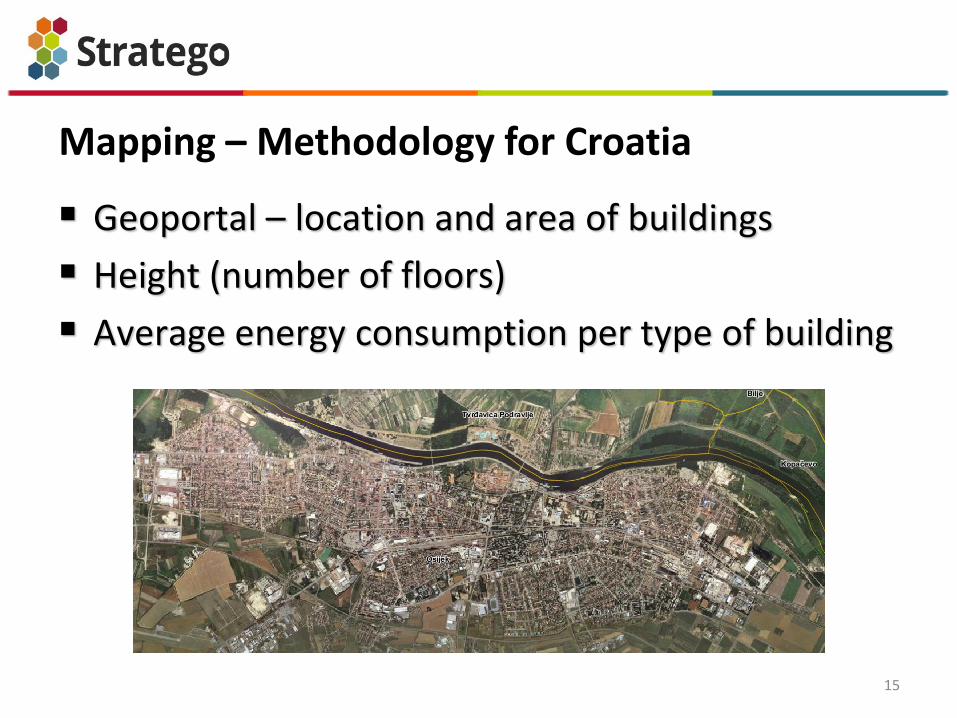
Mapping – Methodology for Croatia
15
Geoportal – location and area of buildings
Height (number of floors)
Average energy consumption per type of building
16
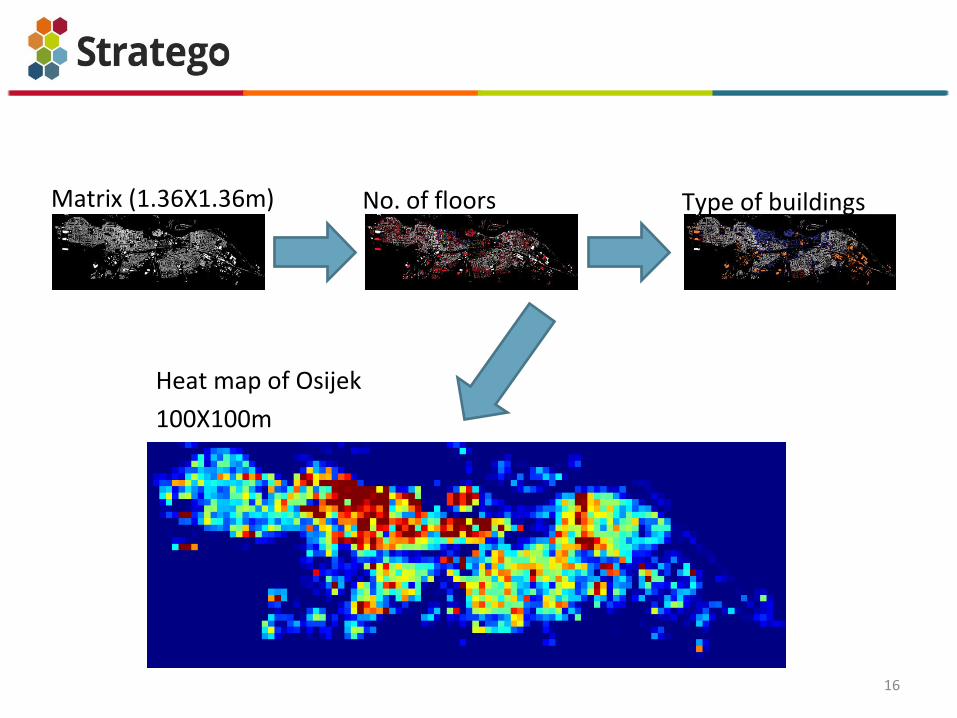
Matrix (1.36X1.36m) No. of floors
Heat map of Osijek
100X100m
Type of buildings

17

RESULTS
18

Final Levels of Each Energy Efficiency Measure in the Low-Carbon Heating and Cooling Strategies
19
Heat Roadmaps Heat Savings District Heating Individual Heating
Technology
District Heat Supply
form Renewable
Heat & Excess Heat*
Reduction as a
Percentage of the BAU
2050 Heat Demand
% of Total Heat
Demand after Heat
Savings (vs. % today)
Primary Technology % of District Heat
Production
Czech Republic 40% 40% (25%) Heat pumps are
recommended as
the primary
technology with
small shares for
biomass boilers, and
solar thermal. The
exact mix of each
technology is not
optimised.
60%
Croatia 40% 40% (15%) 45%
Italy 30% 60% (<5%) 35%
Romania 50% 40% (20%) 45%
United Kingdom 40% 70% (<5%) 40%
*Doesn’t include excess heat from thermal power plants.

Change in HR Scenarios
-80%
-70%
-60%
-50%
-40%
-30%
-20%
-10%
0%
Primary Energy Supply Carbon Dioxide Emissions Total Annual Costs
Ch
ange
fo
r th
e H
eati
ng,
Co
olin
g, a
nd
Ele
ctri
city
Sec
tors
Heat Roadmap Scenario in 2050 Compared to a Business-As-Usual Energy System for the Year 2050
Czech Republic Croatia Italy Romania United Kingdom
20

Changes for Heating, Cooling, and Electricity
Heating, Cooling
and Electricity
Sectors Only
Energy Environment Economy
Heat Roadmap vs.
BAU 2050
Change in Primary
Energy Supply
Change in Carbon
Dioxide
Change in Energy
System Costs
(excludes vehicle costs)
Unit TWh/year % Mt/year % Billion
€/year %
Czech Republic -109 -30% -35 -73% -3 -14%
Croatia -18 -32% -5 -47% -1 -12%
Italy -380 -32% -101 -46% -13 -13%
Romania -118 -38% -36 -75% -3 -14%
United Kingdom -444 -35% -109 -49% -15 -14%
All Five Countries -1069 -34% -286 -52% -35 -14% 21
Contextualising the Changes
In total, the energy demand is reduced by ~1000 TWh/year if the Heat Roadmap scenarios are
implemented in all five STRATEGO countries, which is the same as all of the energy required today in the Czech
Republic, Croatia, and Romania combined.
Similarly, the combined reductions in carbon dioxide emissions of almost 300 Mt/year is more than all of the
carbon dioxide emissions emitted from the Czech Republic, Croatia, and Romania today (which is ~225
Mt/year).
22

Heat Savings ~€600 Billion
District Heating
~€275 Billion
Individual Heat Pumps ~€225 Billion
Total Additional Energy Efficiency
Investments Between 2010 &
2050
~€1.1 Trillion
Energy -30%
Carbon Dioxide
-50%
Costs -15%
All Five STRATEGO Countries
Energy Efficiency Investments
Annual Change for Heating, Cooling, & Electricity Sectors
Main Results for WP2
23
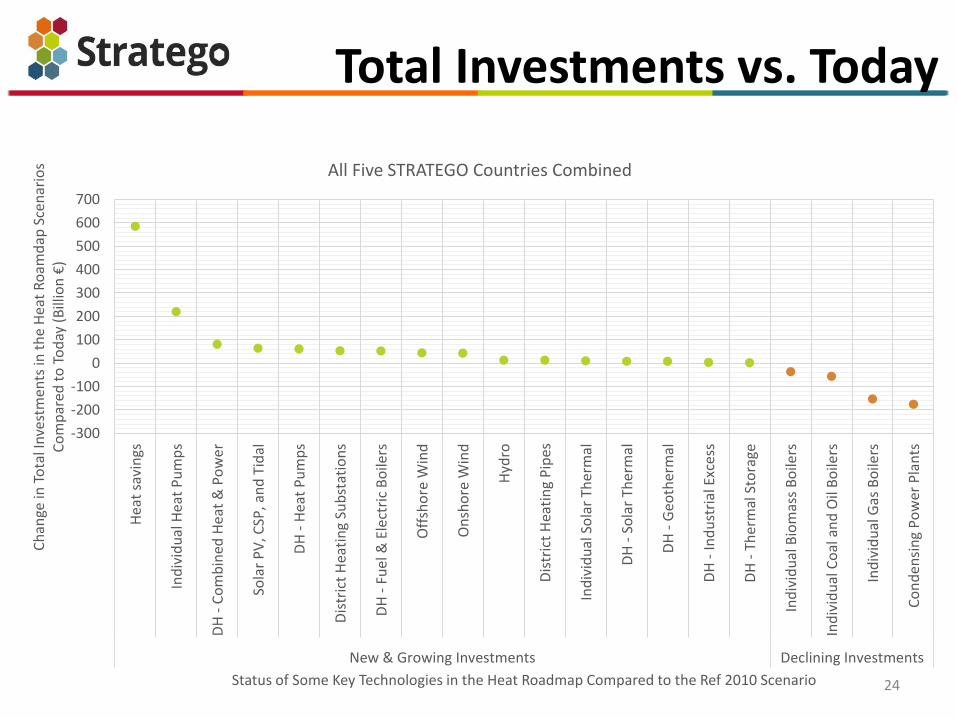
Total Investments vs. Today
-300
-200
-100
0
100
200
300
400
500
600
700
Hea
t sa
vin
gs
Ind
ivid
ual
Hea
t P
um
ps
DH
- C
om
bin
ed H
eat
& P
ow
er
Sola
r P
V, C
SP, a
nd
Tid
al
DH
- H
eat
Pu
mp
s
Dis
tric
t H
eati
ng
Sub
stat
ion
s
DH
- F
uel
& E
lect
ric
Bo
ilers
Off
sho
re W
ind
On
sho
re W
ind
Hyd
ro
Dis
tric
t H
eati
ng
Pip
es
Ind
ivid
ual
So
lar
Ther
mal
DH
- S
ola
r Th
erm
al
DH
- G
eoth
erm
al
DH
- In
du
stri
al E
xces
s
DH
- T
her
mal
Sto
rage
Ind
ivid
ual
Bio
mas
s B
oile
rs
Ind
ivid
ual
Co
al a
nd
Oil
Bo
ilers
Ind
ivid
ual
Gas
Bo
ilers
Co
nd
ensi
ng
Po
wer
Pla
nts
New & Growing Investments Declining Investments
Ch
ange
in T
ota
l In
vest
men
ts in
th
e H
eat
Ro
amd
ap S
cen
ario
s C
om
par
ed t
o T
od
ay (
Bill
ion
€)
Status of Some Key Technologies in the Heat Roadmap Compared to the Ref 2010 Scenario
All Five STRATEGO Countries Combined
24

Key Messages: Heating
25
Heat savings should begin today and be strongly supported to the point where their total heat demand is reduced to 60-90 kWh/m2
In existing buildings while they are undergoing other refurbishments and in new buildings,
Share of district heating can be expanded significantly in all countries
Urban Areas
Electric heat pumps are the most sustainable option for individual heating
Rural Areas
In all the countries there are large amounts of renewable and excess heat
available, but there is a limited supply of renewable electricity, while there is likely to be a shortfall of biomass if the aim is to decarbonise the entire energy system.
The results are extremely sensitive to cost assumptions, but the conclusions are very robust
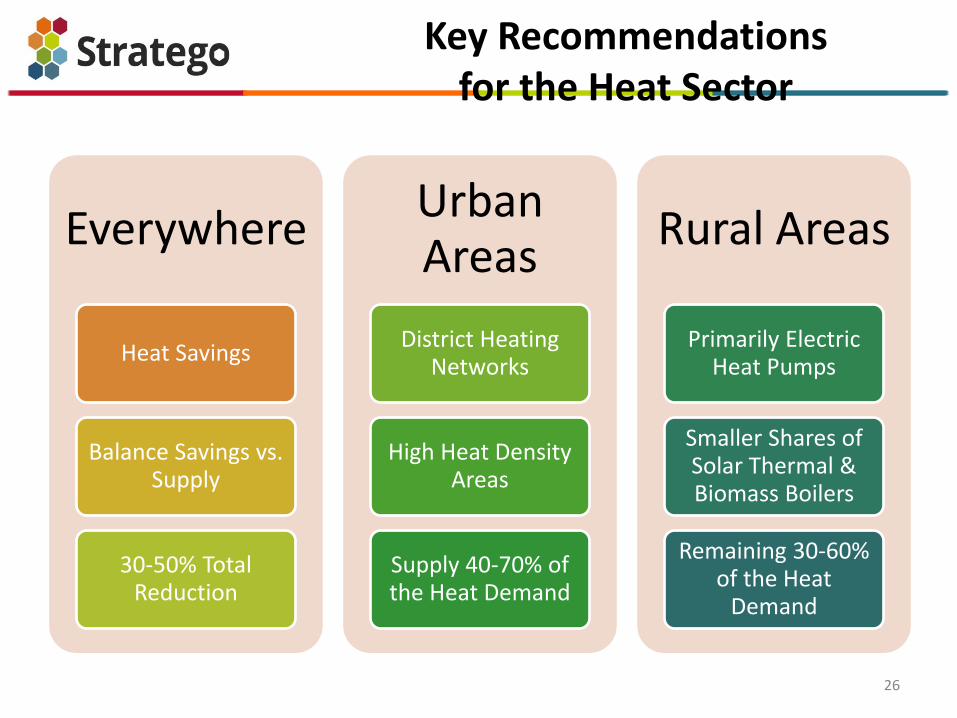
Key Recommendations for the Heat Sector
Everywhere
Heat Savings
Balance Savings vs. Supply
30-50% Total Reduction
Urban Areas
District Heating Networks
High Heat Density Areas
Supply 40-70% of the Heat Demand
Rural Areas
Primarily Electric Heat Pumps
Smaller Shares of Solar Thermal & Biomass Boilers
Remaining 30-60% of the Heat
Demand
26

Adding Cooling to the Heat Roadmaps
27

Cooling Demand is Much Lower
28
0%
10%
20%
30%
40%
50%
60%
70%
80%
% of Current HeatDemand
% of HR 2050 HeatDemand
% of Current HeatDemand
% of HR 2050 HeatDemand
Current Cooling Demand Max Potential Cooling Demand
CZ HR IT RO UK

Cooling Options: Assume 35% Cooling Converted from Individual to District Cooling
29
Conventional District Cooling (Using Cold Pipes)
Hybrid District Cooling (Using Warm and Cold Pipes)
Could also be Sorption DC, using warm pipes only
Individual Cooling: IEE RESCURE Project (‘Roof-Top’ Chillers)
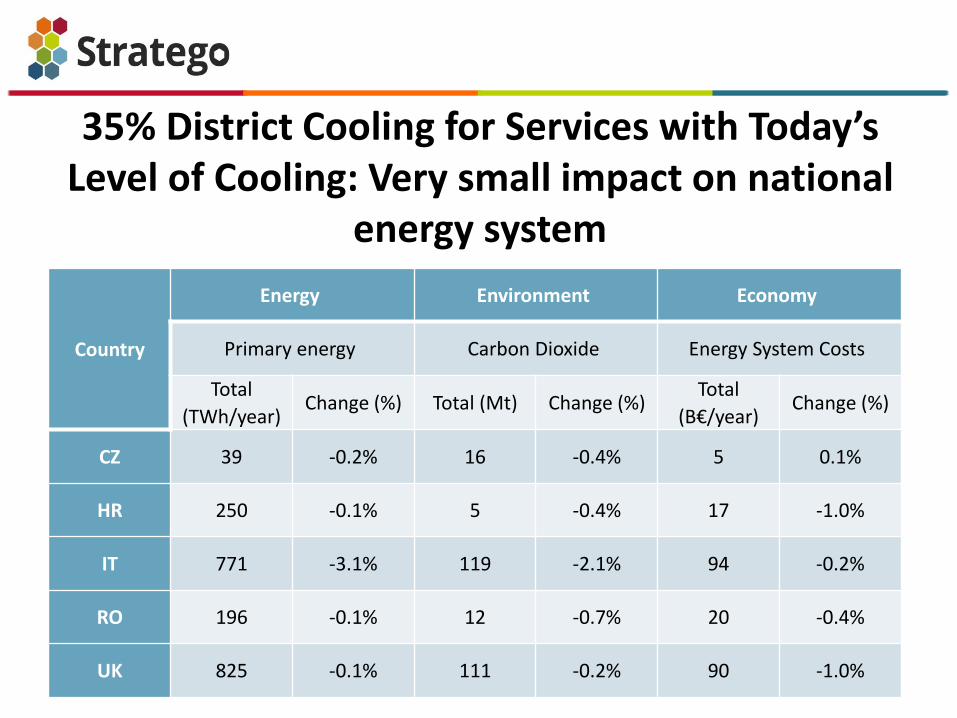
35% District Cooling for Services with Today’s Level of Cooling: Very small impact on national
energy system
30
Country
Energy Environment Economy
Primary energy Carbon Dioxide Energy System Costs
Total
(TWh/year) Change (%) Total (Mt) Change (%)
Total
(B€/year) Change (%)
CZ 39 -0.2% 16 -0.4% 5 0.1%
HR 250 -0.1% 5 -0.4% 17 -1.0%
IT 771 -3.1% 119 -2.1% 94 -0.2%
RO 196 -0.1% 12 -0.7% 20 -0.4%
UK 825 -0.1% 111 -0.2% 90 -1.0%
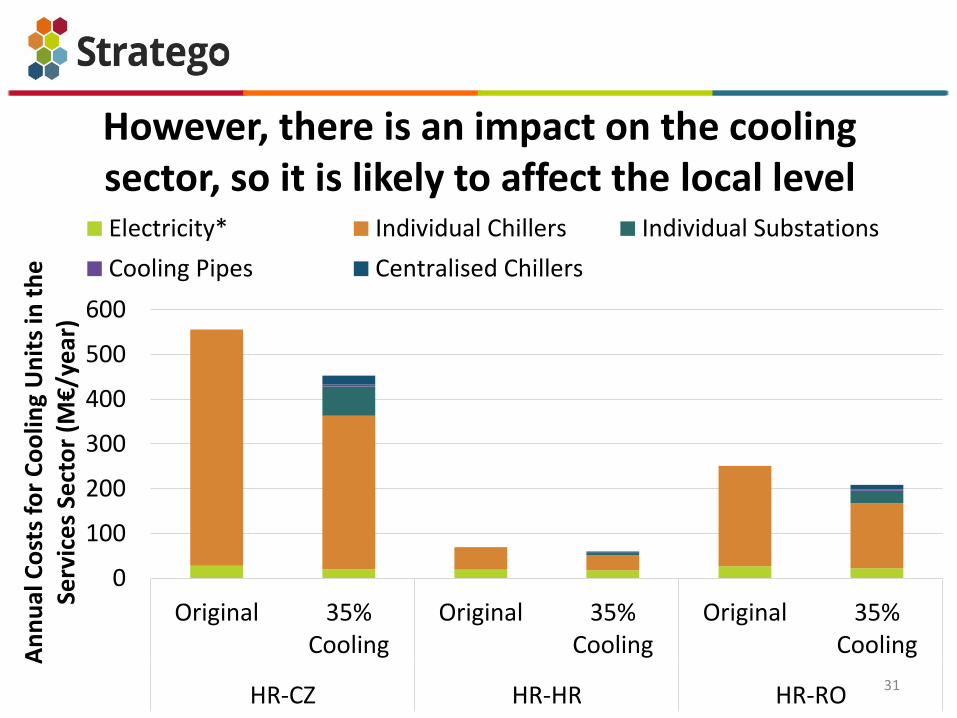
However, there is an impact on the cooling sector, so it is likely to affect the local level
31
0
100
200
300
400
500
600
Original 35%Cooling
Original 35%Cooling
Original 35%Cooling
HR-CZ HR-HR HR-RO
An
nu
al C
ost
s fo
r C
oo
ling
Un
its
in t
he
Se
rvic
es
Sect
or
(M€
/ye
ar)
Electricity* Individual Chillers Individual Substations
Cooling Pipes Centralised Chillers

If we cool the buildings in Europe to the level they ‘ideally’ require, then 35% district cooling has an
impact on the national energy system
32
0
20
40
60
80
100
120
140
160
Individual Cooling Individual Cooling 35% District Cooling
25% Cooling (HeatRoadmap)
100% Cooling (Max Potential)Soci
o-e
con
om
ic c
ost
s (B
illio
n €
/ye
ar)
Socio-economic costs: Heating, cooling, electricity

Today, the cooling demand is too small to have a major influence at national level
However, implementing district cooling is likely to have a positive impact at the local level
If buildings meet their cooling needs in the future, then the cooling sector will start influencing the national energy system
More research is required to identify an optimal level of district cooling: mapping and local modelling is most urgent in the short term
Cooling: Key Messages
33

Tools Name Purpose Output Reports
EnergyPLAN To simulate the electricity, heating, cooling, transport sectors on an
hourly basis
Energy, economic, and environmental impact of
different energy scenarios
This Report, BR1,
BR2
PETA (Pan-European Thermal Atlas) –
ArcGIS + ArcMap (GIS Mapping)
To create maps with the location and scale of heat demand, cooling
demand, excess heat, and renewable heat
Technical and economic potential of district
heating and district cooling networks. Quantify the
heat available for district heating and cooling from
thermal power plants, industry, waste incineration,
geothermal, and solar thermal heat
BR5, BR6, BR7, BR9
BEAM
To simulate how the building stock will evolve over time based on
different energy efficiency targets and different changes to the building
stock (e.g. demolition, renovations, etc.)
Heating demand, cooling demand, and investment
cost for different levels of heat savings BR3
Meteonorm Meteorological data necessary for developing hourly renewable energy
distributions (e.g. wind, solar, etc.) Meteorological data BR2
MATSim Agent based modelling to create a distribution for energy consumption in
transportation
Hourly energy consumption data for transportation
in Croatia also applied in other STRATEGO
countries
BR2
Methodologies Name Purpose Primary Tool(s) Considered Reports
Creating National Energy Models Based
on Historical Data
Converting energy statistics into a suitable format for the EnergyPLAN
tool Inputs for EnergyPLAN BR1
Creating National Energy Models Based
on Future Projections of the Energy
System
Converting energy statistics from a future projection of the energy system
into a suitable format for the EnergyPLAN tool
Outputs from the software used by the European
Commission [25], PRIMES, and Inputs for
EnergyPLAN
BR1
Creating Hourly Distribution Data Creating an hourly profile for electricity, heating, cooling, and transport
demands, as well as wind, wave, and solar production. Inputs for EnergyPLAN BR2
Designing the scenarios to quantify the
impact of a high-efficiency heating and
cooling sector
The inputs from all of the Background Reports are combined to design
new scenarios in EnergyPLAN for the heating and cooling sectors. For
example, what resources are available and how much of each solution can
be implemented.
Inputs for EnergyPLAN Main Report
Quantifying the impact of increased
energy efficiency in the heating and
cooling sectors
Simulating various renewable energy scenarios and quantifying the
impact of different measures/technologies. Outputs from EnergyPLAN Main Report
Quantifying the Current Heating Demand
in Europe Estimating the existing heat demand in Europe based on historical data Input for the GIS Mapping BR4
Quantifying the Future Heating Demand
in Europe
Calculating how the heating and cooling demand will evolve in the
residential and services building stock
Output from the BEAM tool and Inputs for the
EnergyPLAN tool BR3
Quantifying the Current and Potential
Future Cooling Demand in Europe
Calculating the existing cooling demand in buildings based on historical
data and estimating the maximum cooling demand in the future if all
buildings are cooled to a comfortable level
Input for the GIS Mapping BR4
Mapping the Heat Demand in Europe To identify the technical and economic potential of developing district
heating networks
Output from the GIS Mapping and Input for the
EnergyPLAN Tool BR5
Mapping the Cooling Demand in Europe To identify the technical and economic potential of developing district
cooling networks
Output from the GIS Mapping and Input for the
EnergyPLAN Tool BR5
Calculating the Excess Heat available to
Supply District Heating in Europe
Locating and quantifying the potential heat available from thermal power
plants, industrial excess heat, and existing waste incineration plants in
Europe
Inputs for the GIS Mapping and EnergyPLAN tool BR7
Quantifying the renewable energy
resources available
Review of existing studies to identify the renewable energy resources
available in each country Inputs for the GIS Mapping and EnergyPLAN tool BR8
Mapping the Renewable Energy
Resources
Locating and quantifying the amount of solar, geothermal, biomass, and
heat for large-scale heat pumps available for district heating systems in
Europe
Output from the GIS Mapping and Inputs for the
EnergyPLAN tool BR9
Different Tools and Methodologies in this Study
34
5 Tools:
EnergyPLAN
PETA
BEAM
Meteonorm
MATSim
13 Methodologies
(See Table 16 of the Main Report)

AIM: The overall aim in STRATEGO WP2 is to develop low-carbon heating
and cooling strategies, which are called Heat Roadmaps, and subsequently to quantify the impact of implementing them at a
national level for five EU Member States, which are Czech Republic, Croatia, Italy, Romania, and the United Kingdom.
CONCLUSION:
The overall conclusion is that a combination of energy efficiency measures, in the form of heat savings, district heating in the urban
areas, and heat pumps in the rural areas, reduces the energy system costs, energy demand, and carbon dioxide emissions in all five
STRATEGO countries for the year 2050 compared to a ‘Business-As-Usual’ projection.
STRATEGO WP2: Aim and Conclusion
35

20 Recommendations in the Main Report, divided by:
Heat Savings
Heat Networks in Urban Areas
Individual Heating in Rural Areas
Cooling
Resources
Methodology and Tools
Recommendations
36

37
Financial support from the European Union’s Intelligent Energy Europe project STRATEGO
(grant agreement EE/13/650) is gratefully acknowledged.