Stephen A. Wandner Senior Economist U.S. Department of Labor Michael Wiseman Research Professor...
17
Stephen A. Wandner Senior Economist U.S. Department of Labor Michael Wiseman Research Professor George Washington University
-
Upload
keegan-allread -
Category
Documents
-
view
215 -
download
0
Transcript of Stephen A. Wandner Senior Economist U.S. Department of Labor Michael Wiseman Research Professor...

Stephen A. WandnerSenior EconomistU.S. Department of Labor
Michael WisemanResearch Professor George Washington University
What can the European Social Fund learn from the American experience with operation of training programs under the Workforce Investment Act?
This question has many facets WIA attempts to increase effectiveness and
efficiency through performance “bonuses” This paper (in progress!) expands the
perspective to include the TANF and SNAP High Performance Bonuses
Federal-state program, operated by the states through local “one-stop career centers”
Supported by formula-based grants to states
Beyond the formula allocations, “High Performance Bonuses” are paid states on the basis of measures of achievement
Bonuses are small and, over time, have gotten smaller
Performance targets are set through negotiations between the (6) federal government regional offices and the states
Final targets depend on negotiation techniques and skills of regions and states
Performance targets cover many program outcomes
States have some control over measurement implementation
Regional DOL office strategies, capabilities, and enthusiasm differ
States vary in analytical capabilities for response to regional targeting proposals.
Measures adopted offer numerous opportunities for “gaming” by states
Results have been uneven, regionally and by state
Connection of HPB accomplishment to actual achievement challenged by research
▶ Negotiation may be useful, but attention must be paid to leveling playing field
▶ Should start with control for variation in characteristics of clients served, economic environment
▶ Addressing problems of motivation essentialBottom line: No evidence of significant
positive effects Watch developments with reauthorization
TANF famously replaced Aid to Families with Dependent Children beginning in 2007
Enabling legislation called for “high performance”
Employment targets—job entry, job retention, earnings gain—have “face validity”
Goals multiplied over time, as did winners Like WIA, stakes were small Program died, unmourned, in 2005
Began with data available to states, but it was clear procedures were not uniform and states lacked access to some data
Introduced a new resource, the “National Directory of New Hires”
Ultimately major measures wholly computed at federal level, with substantial lag between reference “performance year” and award
Federal computation not always intelligible, reliable

What to measureHow to measureControl for contextStrategic responseMissing feedback
Give thought to the objectivesBe cautious about statistical inference
Plan for improvement Institutional development may be an important by-product of performance assessment effort
SNAP is a national negative income tax operated outside of the tax system. Does not purport to be adequate for minimum subsistence
Delivered by electronic benefits transfer (EBT) and collected when recipients purchase food
Arguably the nation’s most important means-tested benefit
Plays a significant role in economic stimulus
SNAP is operated by states Benefits are wholly federally funded;
administration costs are split between states and federal government
Incentive problems addressed by sample-based quality control system
States liable for cost of errors, but attempts made to reduce emphasis on penalty and shift to rewards
Result (2002) was --
Based on QC audit, other sources Four bonus categories:o Payment accuracyoNegative error rateoApplication processing timelinesso Program access
Only $48 million (total state administrative costs were about $3 billion in FY 2007)
Awards delivered by September of following year
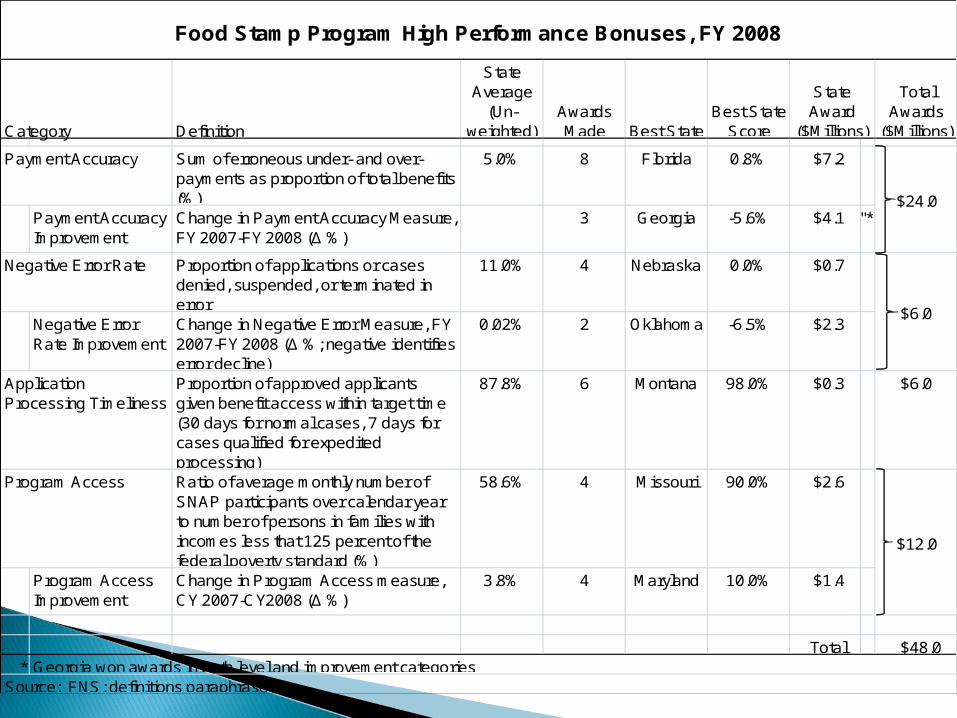
Category Definition
State Average
(Un-weighted)
Awards Made Best State
Best State Score
Total Awards
($Millions)
Payment Accuracy Sum of erroneous under- and over-payments as proportion of total benefits (%)
5.0% 8 Florida 0.8% $7.2
Payment Accuracy Improvement
Change in Payment Accuracy Measure, FY 2007-FY 2008 (Δ %)
3 Georgia -5.6% $4.1 "*"
Negative Error Rate Proportion of applications or cases denied, suspended, or terminated in error
11.0% 4 Nebraska 0.0% $0.7
Negative Error Rate Improvement
Change in Negative Error Measure, FY 2007-FY 2008 (Δ %; negative identifies error decline)
0.02% 2 Oklahoma -6.5% $2.3
Proportion of approved applicants given benefit access within target time (30 days for normal cases, 7 days for cases qualified for expedited processing)
87.8% 6 Montana 98.0% $0.3 $6.0
Program Access Ratio of average monthly number of SNAP participants over calendar year to number of persons in families with incomes less that 125 percent of the federal poverty standard (%)
58.6% 4 Missouri 90.0% $2.6
Program Access Improvement
Change in Program Access measure, CY 2007-CY2008 (Δ %)
3.8% 4 Maryland 10.0% $1.4
Total $48.0*
Application Processing Timeliness
State Award
($Millions)
Source: FNS; definitions paraphrased.Georgia won awards in both level and improvement categories
Food Stamp Program High Performance Bonuses, FY 2008
$24.0
$6.0
$12.0
Assessing sample-based penalties
Program access measuresChange versus levelsTechnical assistanceNet effect
Link to ground-level operations Audit the outcomes Take care with statistics Link to better practice
But don’t get carried away: Task is relatively simple: Deliver a well-
defined benefit to a target population each month
Outcome immediate Broad political support
Take in the museumsKeep watchGet back to the “Open Method”Start on the groundReward process