StatsD DevOps Boulder 7/20/15
26
Hello Quick observation: Been going to these meeting for almost a year and almost all the presentations are geared toward Ops. I’m here to represent the ‘dev’ side of ‘devops’. How many of you self-identify as Developers? As, a developer, I find a few faults with the way I do things - especially when it comes to DevOps.
-
Upload
mark-morris -
Category
Software
-
view
607 -
download
1
Transcript of StatsD DevOps Boulder 7/20/15

Hello
Quick observation: Been going to these meeting for almost a year and almost all the presentations are geared toward Ops.
I’m here to represent the ‘dev’ side of ‘devops’. How many of you self-identify as Developers? As, a developer, I find a few faults with the way I do things - especially when it comes to DevOps.
Uh…
On Call!
First, Stealing VictorOps catch-phrase here - “being on call sucks!” Who has ever heard this? “I fully support the code that I’ve written but getting context around other developer’s code takes time. I’m not a good candidate for being on call.”
Lazy
As a developer, I also know this about myself. I’m Lazy. Lazy in the sense that I’m more likely to look for a solution that someone else has written before re-inventing the wheel. I don’t like to do things more than once. Lazy in the sense that I’m going to choose the easy tool - before the hard one.

#YOLO
At my previous job, I learned my lessons about Friday afternoon deploys. What’s that old joke? Famous last words: “Hey Ya’ll — Watch This!”. But when under the gun, I know this about myself - I’m not above: “yolo deployments”. (I heard the term “yolo deployment” at DoD MSP and just had to fit it in somewhere.) Honestly, I’ve never had the luxury of a supporting Ops team, but I can understand the instances in which “yolo deployments” occur.
Hug it out
Dev Ops
So, even with all those faults (and a ton more that aren’t listed) - I still show up at these meetings. I’m trying to get “it” - and see the entire process. I have a tremendous amount of respect for what Ops teams do. I realize that code just sitting on Github is worthless. It has to be put into production to generate value - and that’s why I dig the “DevOps” process - and as Trent says, we need to Hug it Out.
STATSD
Tonight, I want to talk to you about one of the tools that helps “hug it out”, build some bridges on your team, and maybe even help re-align your work flow.
So who has heard of StatsD? Who’s using it? Keep me on track.What is StatsD? It’s Open Source Project by Etsy. Technically a daemon that listens for metrics, aggregates them and sends them on to a backend service.
Gateway Drugs into DevOps:
Heroku : Deployment :: StatsD : Monitoring
So just like Heroku turned every developer into a deployment expert. StatsD has about the same complexity level for developers with monitoring and metrics. It’s really easy to implement - but with great power comes great responsibility.
Emitters
Collector
StatsD is a bit of an overloaded term - it’s really two pieces.
There’s an emitter: This is going to be your application, command line, etc - basically something that generates a metric.
There’s a collector: Collects and processes the metrics for later processing.
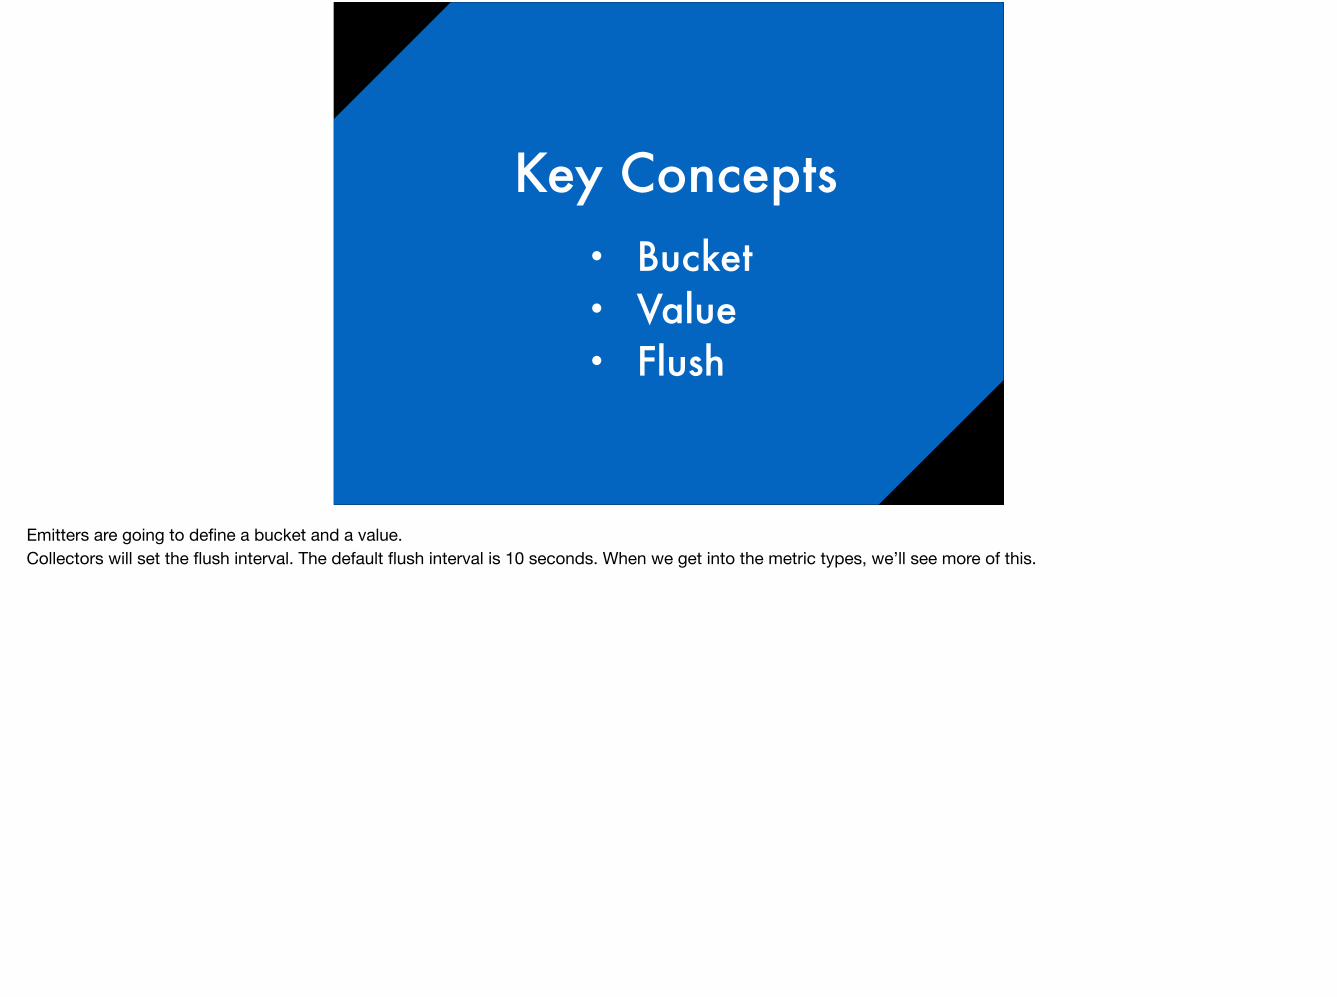
• Bucket • Value • Flush
Key Concepts
Emitters are going to define a bucket and a value.Collectors will set the flush interval. The default flush interval is 10 seconds. When we get into the metric types, we’ll see more of this.
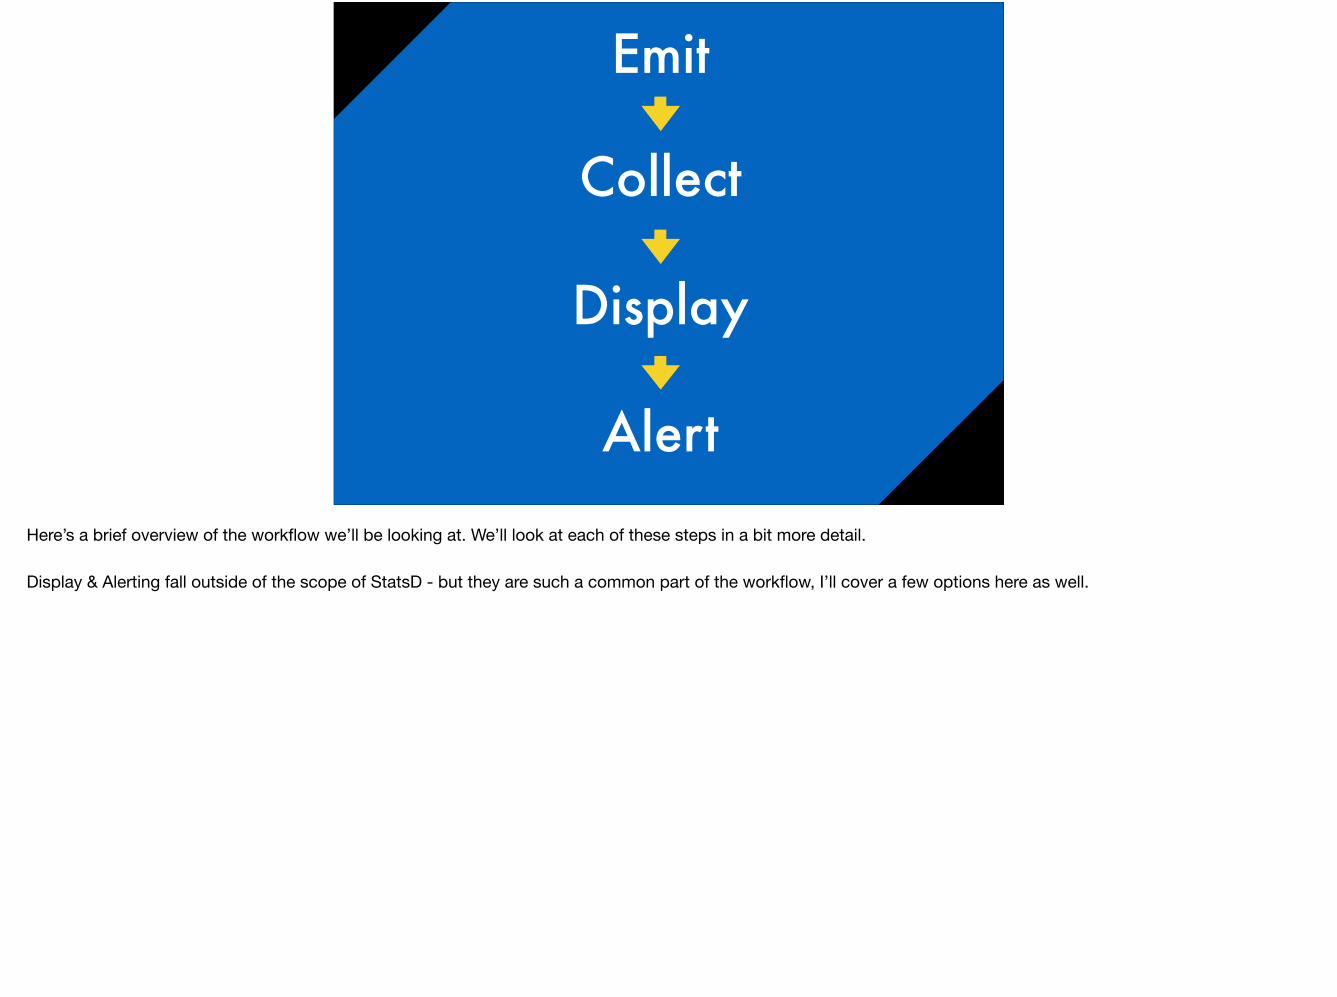
Emit
Collect
Display
Alert
Here’s a brief overview of the workflow we’ll be looking at. We’ll look at each of these steps in a bit more detail.
Display & Alerting fall outside of the scope of StatsD - but they are such a common part of the workflow, I’ll cover a few options here as well.

<metricname>:<value>|<type>
Let’s jump into emitters. Here’s the basic format of a StatsD metric. Metric name is the bucket. Value is an integer - and types we’ll cover those in a sec.
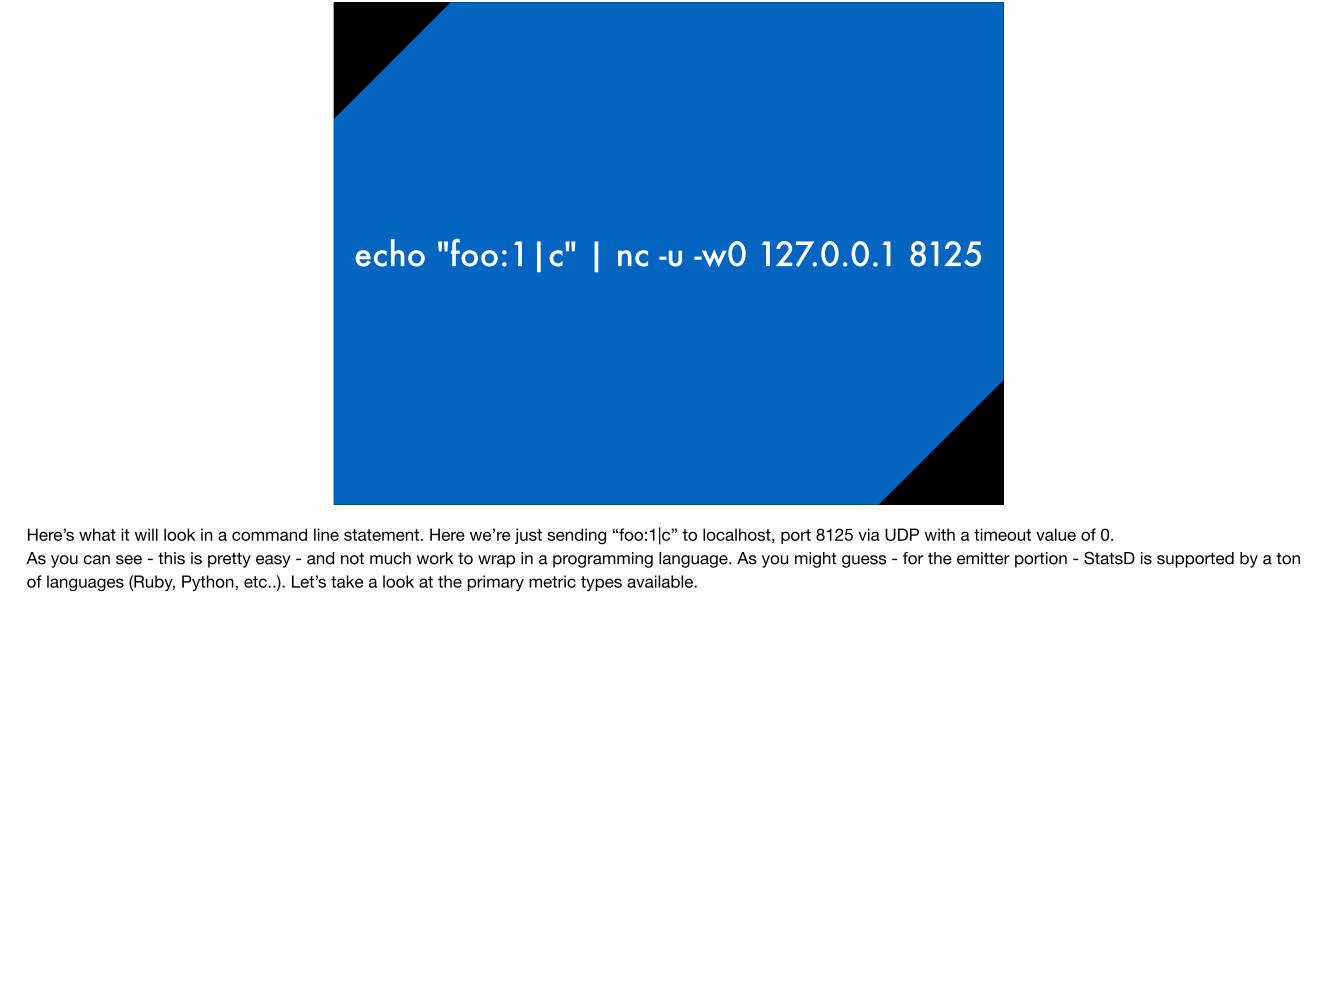
echo "foo:1|c" | nc -u -w0 127.0.0.1 8125
Here’s what it will look in a command line statement. Here we’re just sending “foo:1|c” to localhost, port 8125 via UDP with a timeout value of 0.As you can see - this is pretty easy - and not much work to wrap in a programming language. As you might guess - for the emitter portion - StatsD is supported by a ton of languages (Ruby, Python, etc..). Let’s take a look at the primary metric types available.

Counterbucket: ernog value: 1 type: c
ernog:1|cecho "ernog:1|c" | nc -u -w0 127.0.0.1 8125
$statsd.increment ‘ernog’
Our first type is a counter. Remember the flush interval I had previously mentioned? Well, a counter is a metric used to count something over a flush interval. After each flush - the counter is reset to 0. Both the count and the rate will be sent at each flush.
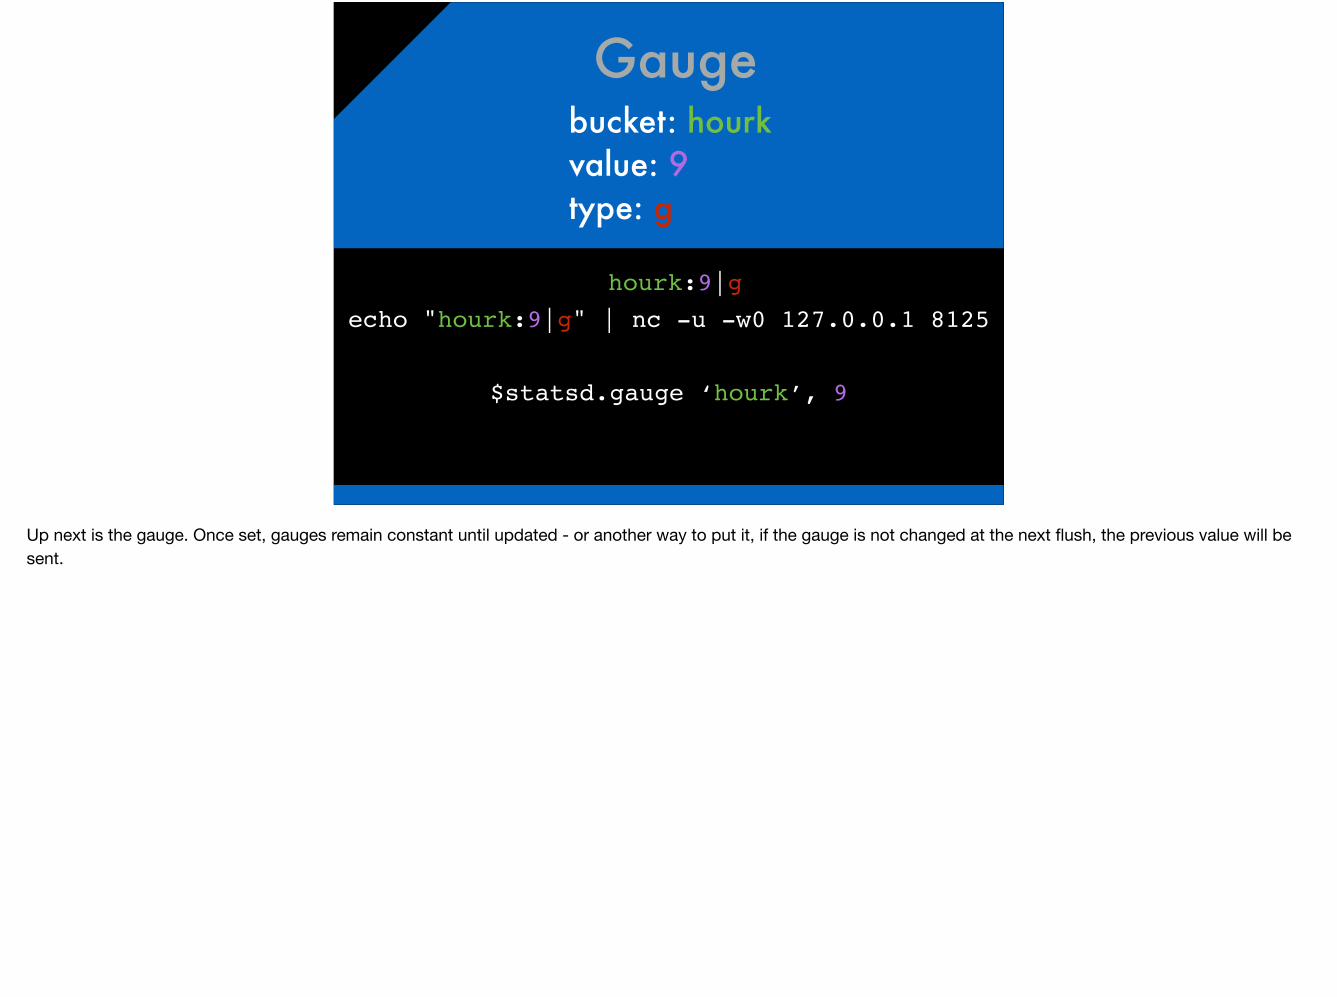
Gaugebucket: hourk value: 9 type: g
hourk:9|gecho "hourk:9|g" | nc -u -w0 127.0.0.1 8125
$statsd.gauge ‘hourk’, 9
Up next is the gauge. Once set, gauges remain constant until updated - or another way to put it, if the gauge is not changed at the next flush, the previous value will be sent.
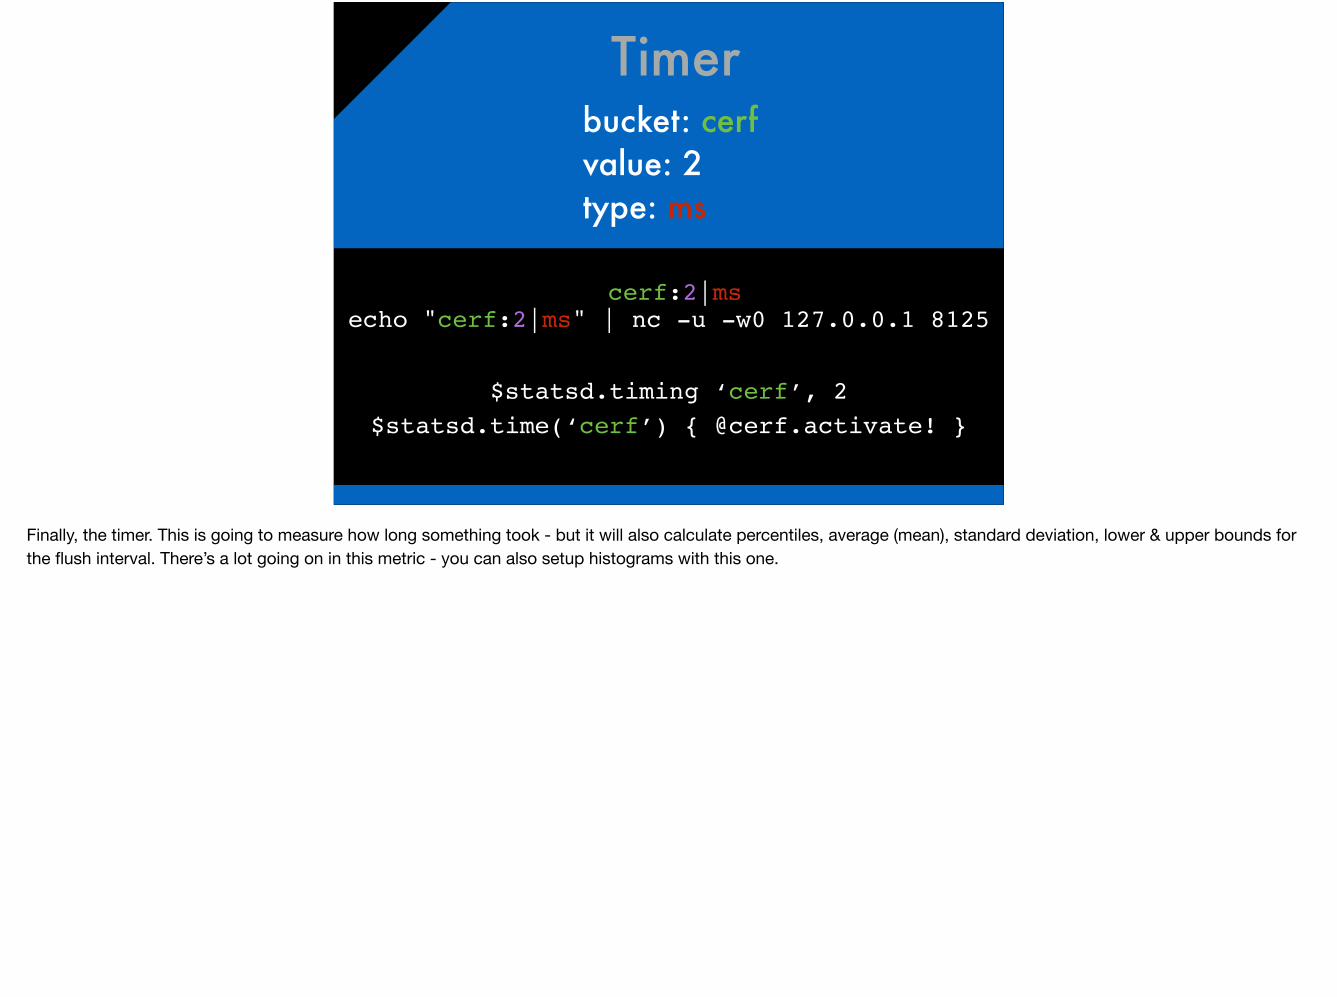
Timerbucket: cerf value: 2 type: ms
cerf:2|msecho "cerf:2|ms" | nc -u -w0 127.0.0.1 8125
$statsd.timing ‘cerf’, 2$statsd.time(‘cerf’) { @cerf.activate! }
Finally, the timer. This is going to measure how long something took - but it will also calculate percentiles, average (mean), standard deviation, lower & upper bounds for the flush interval. There’s a lot going on in this metric - you can also setup histograms with this one.
Strategies
Now that we understand the types of metrics available to us - we need to instrument our code. It’s time for developers to shine. So let’s talk about some strategies that might be used: Logging: As a developer, I often use log statements to catch “stuff” in my code. For a long standing application, probably have a bunch of these types of statements - these make ideal candidates for placing a StatsD metric. The next thing to think about is pull vs. push. StatsD is awesome for pushing events as they occur. Once you get used to the metric types - I’m sure you’ll find lots of places where they are applicable. The message that I sent the Meetup group had an example of monitoring Docker events - simple start, stop, destroy events - but lined up with StatsD.

Before we jump into the next piece of our workflow - I think it’s worth reviewing what we’re really doing here. We’re giving developers the tools they need to measure their own code. Who else has a better idea of the trouble spots? But it’s not just for Devs either, what about our business friends? Business metrics are also great for StatsD.
Collect
As we knows StatsD is a network daemon that sits in the background and aggregates metrics that are sent to it.We also mentioned that metrics are usually sent via UDP - basically fire and forget. You can use TCP for those metrics that HAVE to be collected, but you’ll add a bit of overhead.Collectors are where you’ll define your flush interval. It’s also responsible for doing the calculations on counters and timers. StatsD is technically a NodeJS project - but there are alternatives. The StatsD wiki has a pretty good list of alternates. Brubeck is a recent one released by Github and is written C.
Display
What’s next in our work flow - Display. The de-facto tool is Graphite. One thing about setting up graphite is that it’s a little dependency heavy. It uses Whisper for a DB. Python-Django based front end. Carbon is thrown in caching and managing message flow. I’m a Ruby & Rails guy so.. it takes a little head space to get used to the new stack. Again, the wiki also lists a bunch of tools that can be used for displaying metrics. Grafana is one example.

Another pause, to take a look at where we are at. We’ve got developers adding metrics for themselves and perhaps the business as well. Now we’ve got those metrics being display on graphs - and depending on how you’ve got things setup - on the same graphing platform you’re using to monitor the infrastructure. Potentially, we’ve got dev and ops looking at the same platform for data. What might that lead to? Maybe a little cooperation, a little collaboration?

Alert
The final piece of the puzzle. Alerting. Going back to the graphite tools list - for alerting they mention a project named Cabot. Honestly, I’ve got zero experience with this - any suggestions/recommendations from the audience?
Another pause, if we’ve got alerting tied to metrics generated by the developers - who should get those alerts? Well, the developers of course. This is what I mean about re-aligning your work flow. If you’ve got developer’s receiving alerts and seeing the impact of their code to the overall system - looks like more cooperation & collaboration.
Easy Way
So to be honest - I know it seems like I glossed over Display and Alerts pretty quickly. There’s a reason tho - there’s a couple easier ways.
https://registry.hub.docker.com/u/hopsoft/graphite-statsd/
First, to try out StatsD and Graphite - you can use a container. If you find it fits the needs within your team, at that point it might be worth setting up a new stack.
Or..another way..I work at Scout and we’re a Colorado based hosted monitoring solution. We support StatsD with our agent. Our StatsD ‘collector’ is written in Go - so it’s super fast and able to handle WAY more metrics than NodeJs. Once your code is instrumented and you are emitting metrics, you can access both graphing and alerting without setting up a new stack. Integrate with all your tools. No dependencies to maintain. Zero to Hero in about 5 minutes.
Conclusion
So whether you go with a SaaS based solution like Scout, use a container or roll your own - I hope you see a bit of the awesomeness that StatsD can provide not just to your Ops Team and your Dev Team - but to your entire business. I started out by saying that I identify as a developer. Here’s how StatsD helps me fit into the DevOps process:1. With my own alerts in place - I WANT to be added to the alert list. With easy tools available for monitoring, it’s at the top of my mind vs. an after thought.2. I’ve got a reliable and repeatable way to add custom metrics.3. When I’m using the same graphs as the ops team for metrics, I’m more likely to work with them on deploys. Maybe just 6 yolo deploys instead of 14.Thanks for your time - questions?