Statistical Bulletin of Civil Aviation Industry ...€¦ · CAAC 26 2016 In 2016, China’s civil...
8
CAAC 26 中国民航年刊2016 In 2016, China’s civil aviation industry acted upon the guiding principles of the 18th National Congress of CPC, its 6th Plenary Session and Central Economic Work Conference, and earnestly implemented the instructions of CPC Central Committee and the State Council Opinions on Promoting Civil Aviation Development. Under the guidance of the overarching strategy of “One, Two, Three, Three and Four” (practice one concept, promote the development of public transport aviation and general aviation, safeguard three bottom lines, improve three networks and make up for four weaknesses), the whole industry adhered to the principle of Safety First, made progress while maintaining stability, deepened reform, and recorded fruitful results in various fronts of work, realizing a good start to the 13th Five-Year Plan period. I. Total Transport Aviation In 2016, despite the lowest growth rates of the world economy and trade in 7 years and the growing downward pressure on the domestic economy, China’s civil aviation industry continued to maintain steady and rapid growth in the performance of key transport indicators. 1. Transport Turnover In 2016, the whole industry recorded a total transport turnover of 96.251 Statistical Bulletin of Civil Aviation Industry Development in 2016 100 million ton-km Total Transport Turnover Year-on-year Increase Figure 1 Total Transport Turnover of Civil Aviation 2012-2016 1 200 1 000 800 600 400 200 0 2012 2013 2014 2015 2016 20.0 15.0 10.0 5.0 0.0 % 5.7 10.1 11.4 610.3 748.1 851.7 962.5 13.8 13.0 671.7 100 million passengers Passenger Turnover Year-on-year Increase Figure 2 Passenger Turnover of Civil Aviation 2012-2016 6 000.00 7 000.00 8 000.00 9 000.00 5 000.00 4 000.00 3 000.00 2 000.00 1 000.00 0 2012 2013 2014 2015 2016 20.0 15.0 10.0 5.0 0.0 % 10.8 12.6 12.0 5 025.74 5 656.76 6 334.19 7 282.55 8 378.13 15.0 15.0 100 million ton-km Cargo and Mail Turnover Year-on-year Increase Figure 3 Cargo and Mail Turnover of Civil Aviation 2012-2016 250.00 200.00 150.00 100.00 50.00 0 2012 2013 2014 2015 2016 20.0 15.0 10.0 5.0 -10.0 -5.0 0.0 % -5.8 3.9 10.3 163.89 187.77 208.07 222.45 10.8 6.9 170.29
Transcript of Statistical Bulletin of Civil Aviation Industry ...€¦ · CAAC 26 2016 In 2016, China’s civil...
CAAC
26 中 国 民 航 年 刊 2 0 1 6
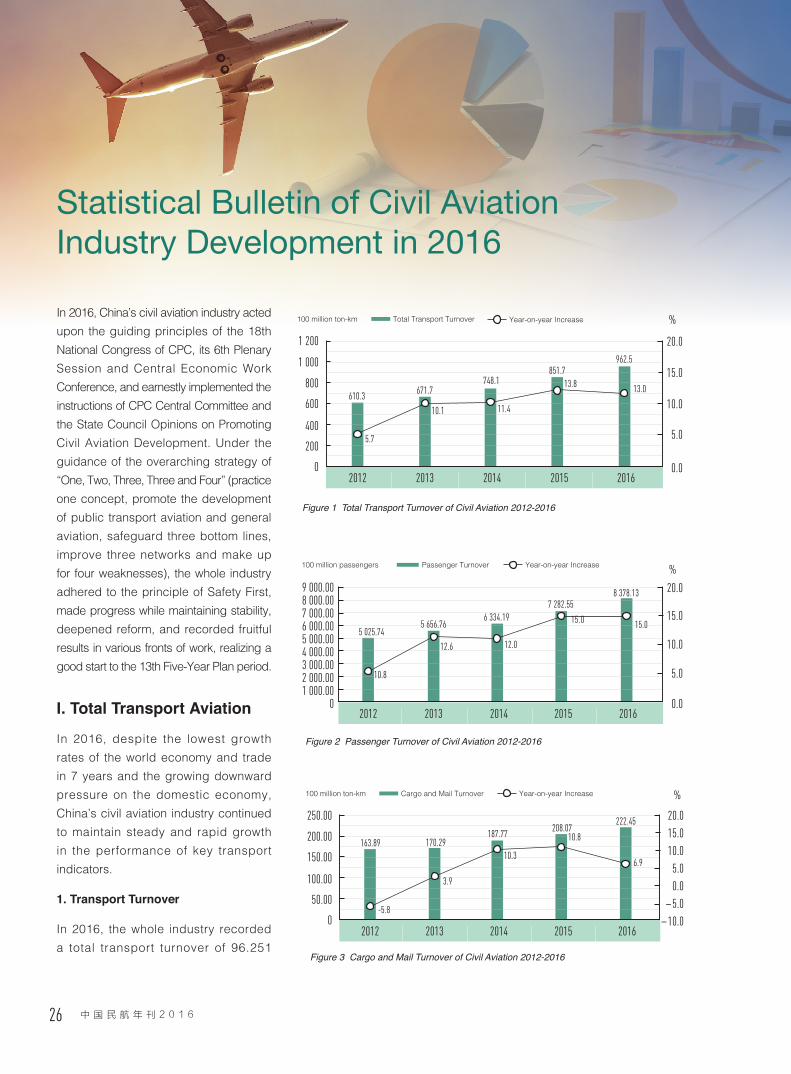
In 2016, China’s civil aviation industry acted upon the guiding principles of the 18th National Congress of CPC, its 6th Plenary Session and Central Economic Work Conference, and earnestly implemented the instructions of CPC Central Committee and the State Council Opinions on Promoting Civil Aviation Development. Under the guidance of the overarching strategy of “One, Two, Three, Three and Four” (practice one concept, promote the development of public transport aviation and general aviation, safeguard three bottom lines, improve three networks and make up for four weaknesses), the whole industry adhered to the principle of Safety First, made progress while maintaining stability, deepened reform, and recorded fruitful results in various fronts of work, realizing a good start to the 13th Five-Year Plan period.
I. Total Transport Aviation
In 2016, despite the lowest growth rates of the world economy and trade in 7 years and the growing downward pressure on the domestic economy, China’s civil aviation industry continued to maintain steady and rapid growth in the performance of key transport indicators.
1. Transport Turnover
In 2016, the whole industry recorded a total transport turnover of 96.251
Statistical Bulletin of Civil Aviation Industry Development in 2016
100 million ton-km Total Transport Turnover Year-on-year Increase
Figure 1 Total Transport Turnover of Civil Aviation 2012-2016
1 200
1 000
800
600
400
200
02012 2013 2014 2015 2016
20.0
15.0
10.0
5.0
0.0
%
5.7
10.1 11.4610.3
748.1851.7
962.5
13.8 13.0671.7
100 million passengers Passenger Turnover Year-on-year Increase
Figure 2 Passenger Turnover of Civil Aviation 2012-2016
6 000.007 000.008 000.009 000.00
5 000.004 000.003 000.002 000.001 000.00
02012 2013 2014 2015 2016
20.0
15.0
10.0
5.0
0.0
%
10.8
12.6 12.05 025.74
5 656.766 334.19
7 282.558 378.13
15.0 15.0
100 million ton-km Cargo and Mail Turnover Year-on-year Increase
Figure 3 Cargo and Mail Turnover of Civil Aviation 2012-2016
250.00
200.00
150.00
100.00
50.00
02012 2013 2014 2015 2016
20.015.010.05.0
-10.0-5.0
0.0
%
-5.8
3.9
10.3163.89
187.77208.07
222.45
10.8
6.9
170.29
CHINA CIVIL AVIATIONA N N U A L R E P O R T2016
中 国 民 航 年 刊
27China Civil Aviation Annual Report 2016
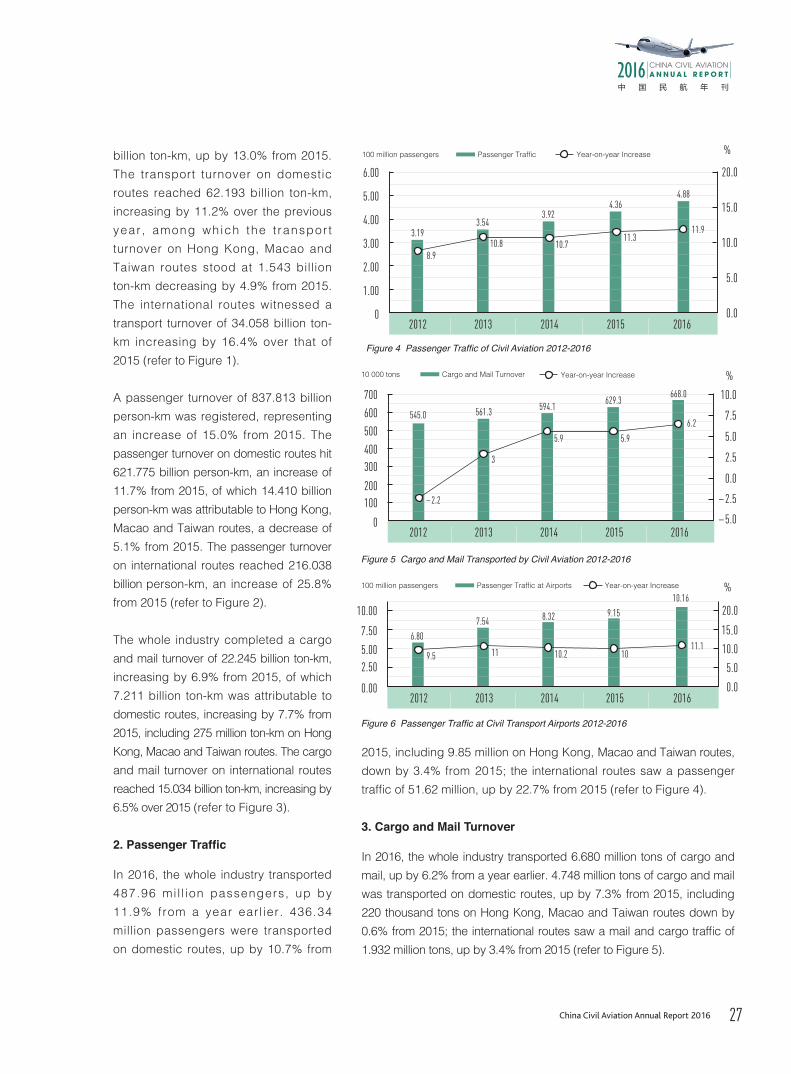
2015, including 9.85 million on Hong Kong, Macao and Taiwan routes, down by 3.4% from 2015; the international routes saw a passenger traffic of 51.62 million, up by 22.7% from 2015 (refer to Figure 4).
3. Cargo and Mail Turnover
In 2016, the whole industry transported 6.680 million tons of cargo and mail, up by 6.2% from a year earlier. 4.748 million tons of cargo and mail was transported on domestic routes, up by 7.3% from 2015, including 220 thousand tons on Hong Kong, Macao and Taiwan routes down by 0.6% from 2015; the international routes saw a mail and cargo traffic of 1.932 million tons, up by 3.4% from 2015 (refer to Figure 5).
2012
6.00
5.00
4.00
3.00
2.00
1.00
02013 2014 2015 2016
8.910.8 10.7
11.311.93.19
3.92
4.884.36
3.54
%
20.0
15.0
10.0
5.0
0.0
100 million passengers Passenger Traffic Year-on-year Increase
Figure 4 Passenger Traffic of Civil Aviation 2012-2016
100 million passengers Passenger Traffic at Airports Year-on-year Increase
Figure 6 Passenger Traffic at Civil Transport Airports 2012-2016
2012
7.50
2.50
10.00
5.00
0.002013 2014 2015 2016
9.5 11 10.2 1011.1
6.80
7.54 8.32 9.15
10.16%
20.0
15.0
10.0
5.0
0.0
10 000 tons Cargo and Mail Turnover Year-on-year Increase
Figure 5 Cargo and Mail Transported by Civil Aviation 2012-2016
2012
700 10.0
7.5
5.0
2.5
0.0
-2.5
-5.0
600
500
400300
200100
02013 2014 2015 2016
%
-2.2
545.0 561.3 594.1629.3
668.0
3
5.9
6.2
5.9
billion ton-km, up by 13.0% from 2015. The transport turnover on domestic routes reached 62.193 billion ton-km, increasing by 11.2% over the previous year , among which the t ranspor t turnover on Hong Kong, Macao and Taiwan routes stood at 1.543 billion ton-km decreasing by 4.9% from 2015. The international routes witnessed a transport turnover of 34.058 billion ton-km increasing by 16.4% over that of 2015 (refer to Figure 1).
A passenger turnover of 837.813 billion person-km was registered, representing an increase of 15.0% from 2015. The passenger turnover on domestic routes hit 621.775 billion person-km, an increase of 11.7% from 2015, of which 14.410 billion person-km was attributable to Hong Kong, Macao and Taiwan routes, a decrease of 5.1% from 2015. The passenger turnover on international routes reached 216.038 billion person-km, an increase of 25.8% from 2015 (refer to Figure 2).
The whole industry completed a cargo and mail turnover of 22.245 billion ton-km, increasing by 6.9% from 2015, of which 7.211 billion ton-km was attributable to domestic routes, increasing by 7.7% from 2015, including 275 million ton-km on Hong Kong, Macao and Taiwan routes. The cargo and mail turnover on international routes reached 15.034 billion ton-km, increasing by 6.5% over 2015 (refer to Figure 3).
2. Passenger Traffic
In 2016, the whole industry transported 487.96 mi l l ion passengers, up by 11.9% from a year earl ier. 436.34 million passengers were transported on domestic routes, up by 10.7% from
CAAC
28 中 国 民 航 年 刊 2 0 1 6
4. Traffic at AirportsIn 2016, the civil transport airports nationwide realized a passenger traffic of 1.016 billion, up by 11.1% from 2015 (refer to Figure 6).
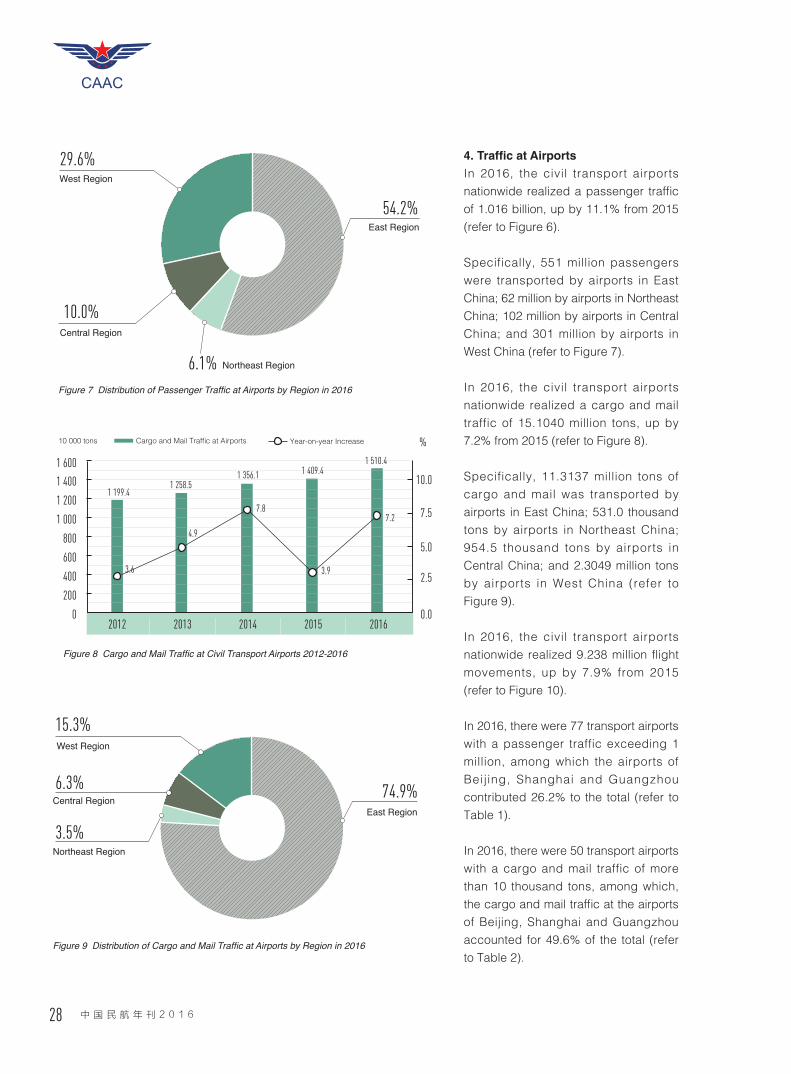
Specifically, 551 million passengers were transported by airports in East China; 62 million by airports in Northeast China; 102 million by airports in Central China; and 301 million by airports in West China (refer to Figure 7).
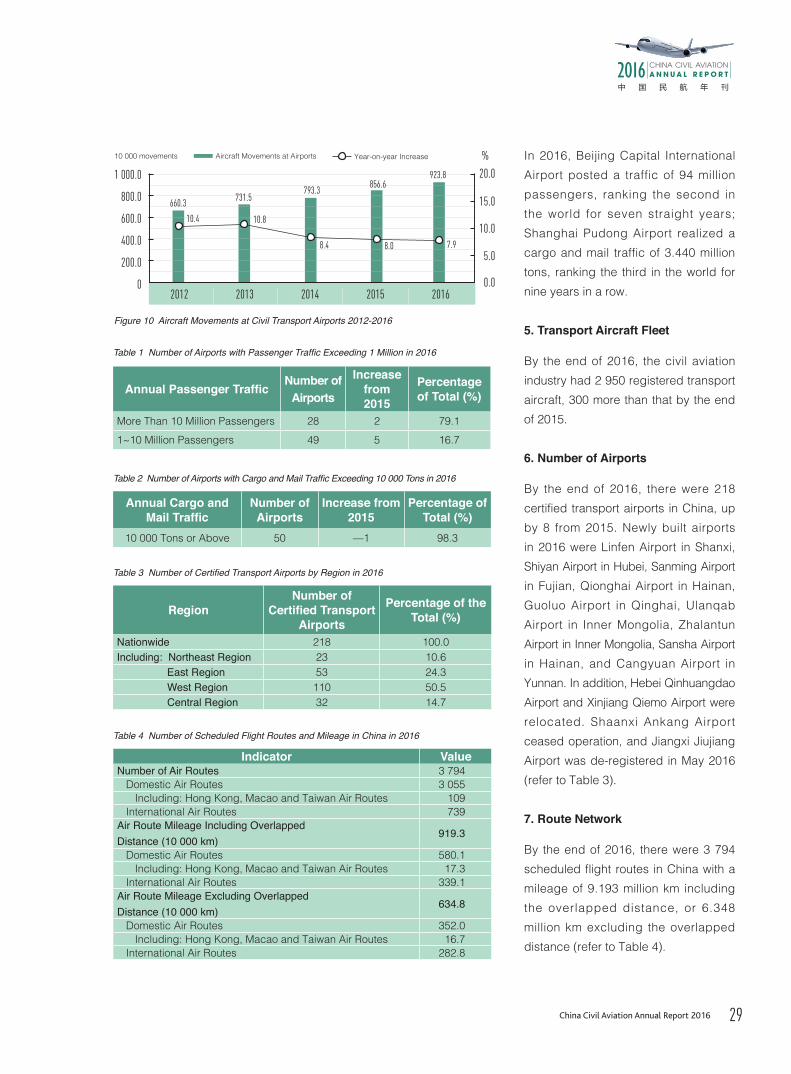
In 2016, the civil transport airports nationwide realized a cargo and mail traffic of 15.1040 million tons, up by 7.2% from 2015 (refer to Figure 8).
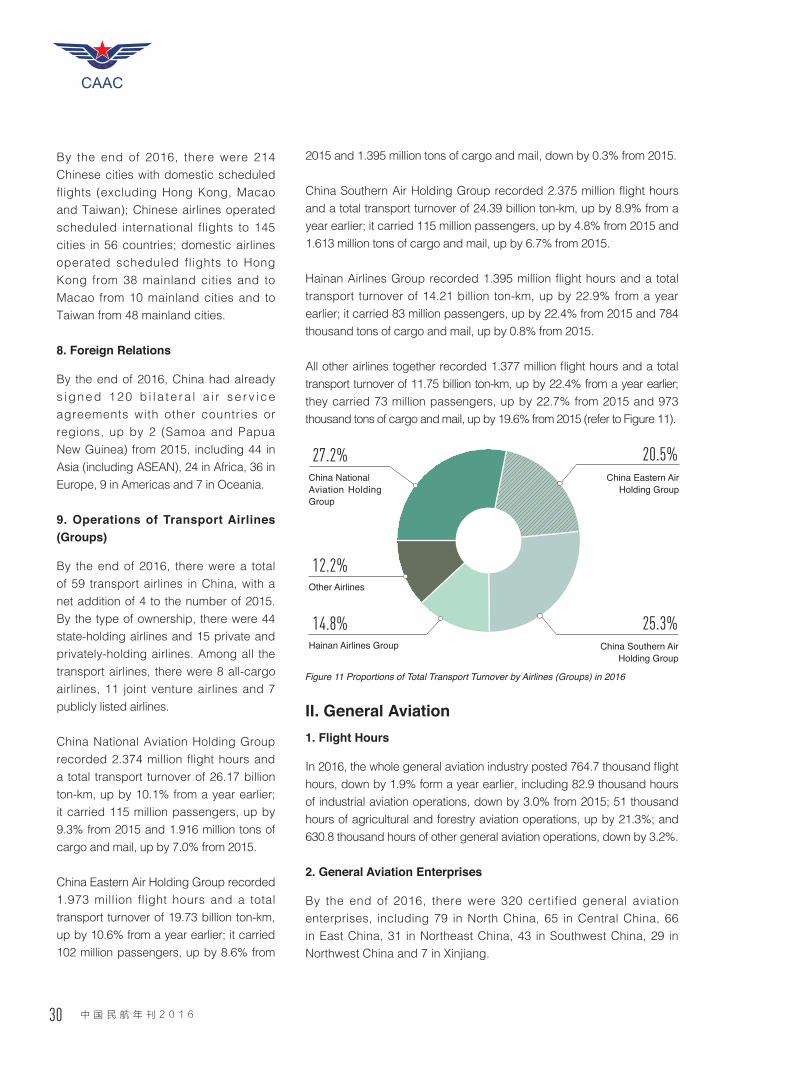
Specifically, 11.3137 million tons of cargo and mail was transported by airports in East China; 531.0 thousand tons by airports in Northeast China; 954.5 thousand tons by airports in Central China; and 2.3049 million tons by airports in West China (refer to Figure 9).
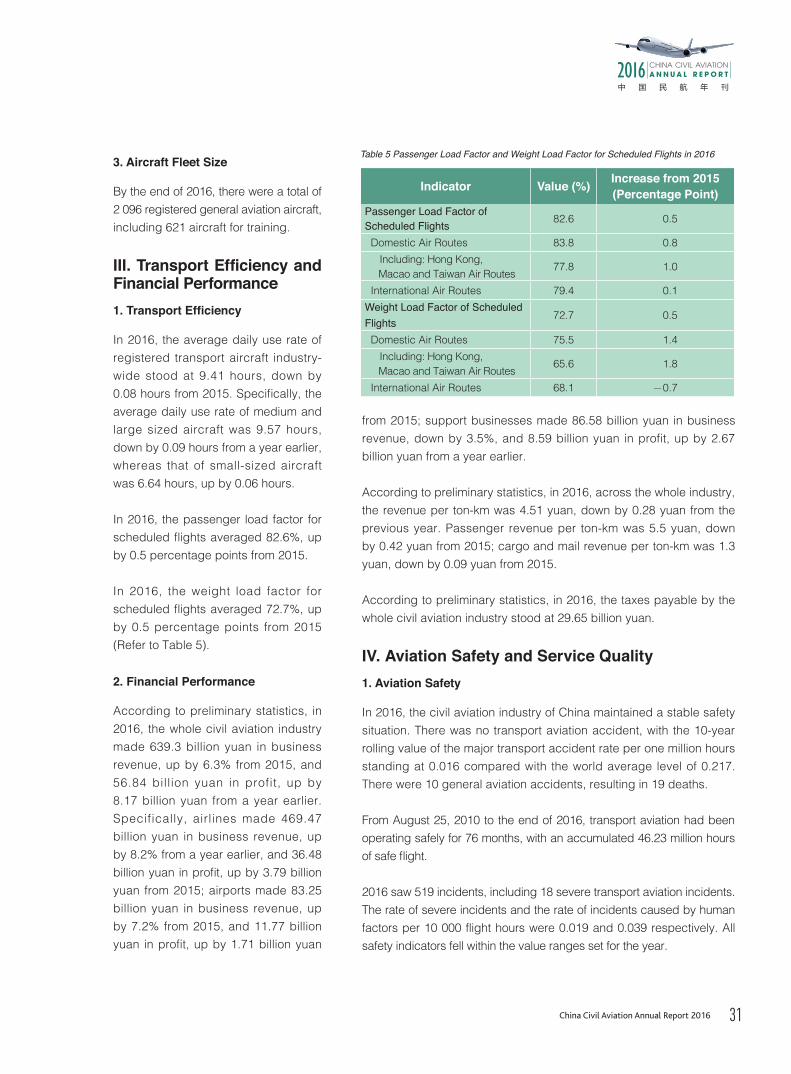
In 2016, the civil transport airports nationwide realized 9.238 million flight movements, up by 7.9% from 2015 (refer to Figure 10).
In 2016, there were 77 transport airports with a passenger traffic exceeding 1 million, among which the airports of Beijing, Shanghai and Guangzhou contributed 26.2% to the total (refer to Table 1).
In 2016, there were 50 transport airports with a cargo and mail traffic of more than 10 thousand tons, among which, the cargo and mail traffic at the airports of Beijing, Shanghai and Guangzhou accounted for 49.6% of the total (refer to Table 2).
15.3%
6.3% 74.9%
3.5%
West Region
Central Region
Northeast Region
East Region
Figure 9 Distribution of Cargo and Mail Traffic at Airports by Region in 2016
Figure 7 Distribution of Passenger Traffic at Airports by Region in 2016
29.6%
10.0%
6.1%
54.2%
West Region
Central Region
Northeast Region
East Region
Figure 8 Cargo and Mail Traffic at Civil Transport Airports 2012-2016
2012
10.0
7.5
5.0
2.5
0.0
800
400
02013 2014 2015 2016
%
3.6
4.9
7.8
3.9
7.2
1 199.41 258.5
1 356.1 1 409.41 510.4
200
600
1 000
1 400
1 600
1 200
10 000 tons Cargo and Mail Traffic at Airports Year-on-year Increase
CHINA CIVIL AVIATIONA N N U A L R E P O R T2016
中 国 民 航 年 刊
29China Civil Aviation Annual Report 2016
In 2016, Beijing Capital International Airport posted a traffic of 94 million passengers, ranking the second in the world for seven straight years; Shanghai Pudong Airport realized a cargo and mail traffic of 3.440 million tons, ranking the third in the world for nine years in a row.
5. Transport Aircraft Fleet
By the end of 2016, the civil aviation industry had 2 950 registered transport aircraft, 300 more than that by the end of 2015.
6. Number of Airports
By the end of 2016, there were 218 certified transport airports in China, up by 8 from 2015. Newly built airports in 2016 were Linfen Airport in Shanxi, Shiyan Airport in Hubei, Sanming Airport in Fujian, Qionghai Airport in Hainan, Guoluo Airport in Qinghai, Ulanqab Airport in Inner Mongolia, Zhalantun Airport in Inner Mongolia, Sansha Airport in Hainan, and Cangyuan Airport in Yunnan. In addition, Hebei Qinhuangdao Airport and Xinjiang Qiemo Airport were relocated. Shaanxi Ankang Airport ceased operation, and Jiangxi Jiujiang Airport was de-registered in May 2016 (refer to Table 3).
7. Route Network
By the end of 2016, there were 3 794 scheduled flight routes in China with a mileage of 9.193 million km including the overlapped distance, or 6.348 million km excluding the overlapped distance (refer to Table 4).
Table 1 Number of Airports with Passenger Traffic Exceeding 1 Million in 2016
Annual Passenger TrafficNumber of
Airports
Increase from 2015
Percentage of Total (%)
More Than 10 Million Passengers 28 2 79.11~10 Million Passengers 49 5 16.7
Annual Cargo and Mail Traffic
Number of Airports
Increase from 2015
Percentage of Total (%)
10 000 Tons or Above 50 —1 98.3
Table 2 Number of Airports with Cargo and Mail Traffic Exceeding 10 000 Tons in 2016
RegionNumber of
Certified Transport Airports
Percentage of the Total (%)
Nationwide 218 100.0Including: Northeast Region 23 10.6 East Region 53 24.3 West Region 110 50.5 Central Region 32 14.7
Table 3 Number of Certified Transport Airports by Region in 2016
Indicator ValueNumber of Air Routes 3 794 Domestic Air Routes 3 055 Including: Hong Kong, Macao and Taiwan Air Routes 109 International Air Routes 739Air Route Mileage Including OverlappedDistance (10 000 km)
919.3
Domestic Air Routes 580.1 Including: Hong Kong, Macao and Taiwan Air Routes 17.3 International Air Routes 339.1Air Route Mileage Excluding Overlapped Distance (10 000 km)
634.8
Domestic Air Routes 352.0 Including: Hong Kong, Macao and Taiwan Air Routes 16.7 International Air Routes 282.8
Table 4 Number of Scheduled Flight Routes and Mileage in China in 2016
10 000 movements Aircraft Movements at Airports Year-on-year Increase
Figure 10 Aircraft Movements at Civil Transport Airports 2012-2016
2012
20.0
15.0
10.0
0.0
5.0
1 000.0
800.0
600.0
400.0
200.0
02013 2014 2015 2016
%
10.4 10.8
8.4 8.0 7.9
660.3 731.5793.3
856.6923.8
CAAC
30 中 国 民 航 年 刊 2 0 1 6
By the end of 2016, there were 214 Chinese cities with domestic scheduled flights (excluding Hong Kong, Macao and Taiwan); Chinese airlines operated scheduled international flights to 145 cities in 56 countries; domestic airlines operated scheduled flights to Hong Kong from 38 mainland cities and to Macao from 10 mainland cities and to Taiwan from 48 mainland cities.
8. Foreign Relations
By the end of 2016, China had already s igned 120 b i l a te ra l a i r se rv i ce agreements with other countries or regions, up by 2 (Samoa and Papua New Guinea) from 2015, including 44 in Asia (including ASEAN), 24 in Africa, 36 in Europe, 9 in Americas and 7 in Oceania.
9. Operations of Transport Airlines (Groups)
By the end of 2016, there were a total of 59 transport airlines in China, with a net addition of 4 to the number of 2015. By the type of ownership, there were 44 state-holding airlines and 15 private and privately-holding airlines. Among all the transport airlines, there were 8 all-cargo airlines, 11 joint venture airlines and 7 publicly listed airlines.
China National Aviation Holding Group recorded 2.374 million flight hours and a total transport turnover of 26.17 billion ton-km, up by 10.1% from a year earlier; it carried 115 million passengers, up by 9.3% from 2015 and 1.916 million tons of cargo and mail, up by 7.0% from 2015.
China Eastern Air Holding Group recorded 1.973 million flight hours and a total transport turnover of 19.73 billion ton-km, up by 10.6% from a year earlier; it carried 102 million passengers, up by 8.6% from
China NationalAviation Holding Group
China Eastern Air Holding Group
Other Airlines
Hainan Airlines Group China Southern Air Holding Group
Figure 11 Proportions of Total Transport Turnover by Airlines (Groups) in 2016
27.2%
12.2%
14.8%
20.5%
25.3%
II. General Aviation1. Flight Hours
In 2016, the whole general aviation industry posted 764.7 thousand flight hours, down by 1.9% form a year earlier, including 82.9 thousand hours of industrial aviation operations, down by 3.0% from 2015; 51 thousand hours of agricultural and forestry aviation operations, up by 21.3%; and 630.8 thousand hours of other general aviation operations, down by 3.2%.
2. General Aviation Enterprises
By the end of 2016, there were 320 certified general aviation enterprises, including 79 in North China, 65 in Central China, 66 in East China, 31 in Northeast China, 43 in Southwest China, 29 in Northwest China and 7 in Xinjiang.
2015 and 1.395 million tons of cargo and mail, down by 0.3% from 2015.
China Southern Air Holding Group recorded 2.375 million flight hours and a total transport turnover of 24.39 billion ton-km, up by 8.9% from a year earlier; it carried 115 million passengers, up by 4.8% from 2015 and 1.613 million tons of cargo and mail, up by 6.7% from 2015.
Hainan Airlines Group recorded 1.395 million flight hours and a total transport turnover of 14.21 billion ton-km, up by 22.9% from a year earlier; it carried 83 million passengers, up by 22.4% from 2015 and 784 thousand tons of cargo and mail, up by 0.8% from 2015.
All other airlines together recorded 1.377 million flight hours and a total transport turnover of 11.75 billion ton-km, up by 22.4% from a year earlier; they carried 73 million passengers, up by 22.7% from 2015 and 973 thousand tons of cargo and mail, up by 19.6% from 2015 (refer to Figure 11).
CHINA CIVIL AVIATIONA N N U A L R E P O R T2016
中 国 民 航 年 刊
31China Civil Aviation Annual Report 2016
3. Aircraft Fleet Size
By the end of 2016, there were a total of 2 096 registered general aviation aircraft, including 621 aircraft for training.
III. Transport Efficiency and Financial Performance1. Transport Efficiency
In 2016, the average daily use rate of registered transport aircraft industry-wide stood at 9.41 hours, down by 0.08 hours from 2015. Specifically, the average daily use rate of medium and large sized aircraft was 9.57 hours, down by 0.09 hours from a year earlier, whereas that of small-sized aircraft was 6.64 hours, up by 0.06 hours.
In 2016, the passenger load factor for scheduled flights averaged 82.6%, up by 0.5 percentage points from 2015.
In 2016, the weight load factor for scheduled flights averaged 72.7%, up by 0.5 percentage points from 2015 (Refer to Table 5). 2. Financial Performance
According to preliminary statistics, in 2016, the whole civil aviation industry made 639.3 billion yuan in business revenue, up by 6.3% from 2015, and 56.84 billion yuan in profit, up by 8.17 billion yuan from a year earlier. Specifically, airlines made 469.47 billion yuan in business revenue, up by 8.2% from a year earlier, and 36.48 billion yuan in profit, up by 3.79 billion yuan from 2015; airports made 83.25 billion yuan in business revenue, up by 7.2% from 2015, and 11.77 billion yuan in profit, up by 1.71 billion yuan
Indicator Value (%) Increase from 2015 (Percentage Point)
Passenger Load Factor of Scheduled Flights 82.6 0.5
Domestic Air Routes 83.8 0.8 Including: Hong Kong, Macao and Taiwan Air Routes 77.8 1.0
International Air Routes 79.4 0.1 Weight Load Factor of Scheduled Flights
72.7 0.5
Domestic Air Routes 75.5 1.4 Including: Hong Kong, Macao and Taiwan Air Routes 65.6 1.8
International Air Routes 68.1 -0.7
Table 5 Passenger Load Factor and Weight Load Factor for Scheduled Flights in 2016
from 2015; support businesses made 86.58 billion yuan in business revenue, down by 3.5%, and 8.59 billion yuan in profit, up by 2.67 billion yuan from a year earlier.
According to preliminary statistics, in 2016, across the whole industry, the revenue per ton-km was 4.51 yuan, down by 0.28 yuan from the previous year. Passenger revenue per ton-km was 5.5 yuan, down by 0.42 yuan from 2015; cargo and mail revenue per ton-km was 1.3 yuan, down by 0.09 yuan from 2015.
According to preliminary statistics, in 2016, the taxes payable by the whole civil aviation industry stood at 29.65 billion yuan.
IV. Aviation Safety and Service Quality 1. Aviation Safety
In 2016, the civil aviation industry of China maintained a stable safety situation. There was no transport aviation accident, with the 10-year rolling value of the major transport accident rate per one million hours standing at 0.016 compared with the world average level of 0.217. There were 10 general aviation accidents, resulting in 19 deaths.
From August 25, 2010 to the end of 2016, transport aviation had been operating safely for 76 months, with an accumulated 46.23 million hours of safe flight.
2016 saw 519 incidents, including 18 severe transport aviation incidents. The rate of severe incidents and the rate of incidents caused by human factors per 10 000 flight hours were 0.019 and 0.039 respectively. All safety indicators fell within the value ranges set for the year.
CAAC
32 中 国 民 航 年 刊 2 0 1 6
In 2016, 37 transport airlines of the industry were free of human factor incidents.
2. Aviation Security
In 2016, the civi l aviation security inspection departments screened 515 million passengers, 292 million items of checked baggage, 389 million items of air cargo (excluding mails and express deliveries), and 156 million mails and express deliveries, and handled 14 740 cases of infractions and unruly behaviors and 75 cases of unlawful interferences involv ing fa ls i f ied ter ror is t threat information.
3. Flight Regularity Rate
In 2016, passenger airlines in China operated 3.679 million flights in total, among which 2.824 mil l ion f l ights were regular, with an average flight regularity rate of 76.76%.
In 2016, major airlines operated 2.846 million flights in total, among which 2.178 million flights were regular, with an average fl ight regularity rate of 76.54% (refer to Table 6).
In 2016, the average delay time of passenger f l ights in China was 16 minutes, down by 5 minutes on a year-on-year basis.
4. Passenger Complaints
I n 2 0 1 6 , C A A C , i t s r e g i o n a l administ rat ions, CAAC Consumer Affairs Center and China Air Transport Association accepted 19 952 aviation consumer complaints in total, up by 10 849, representing an increase of 84%.
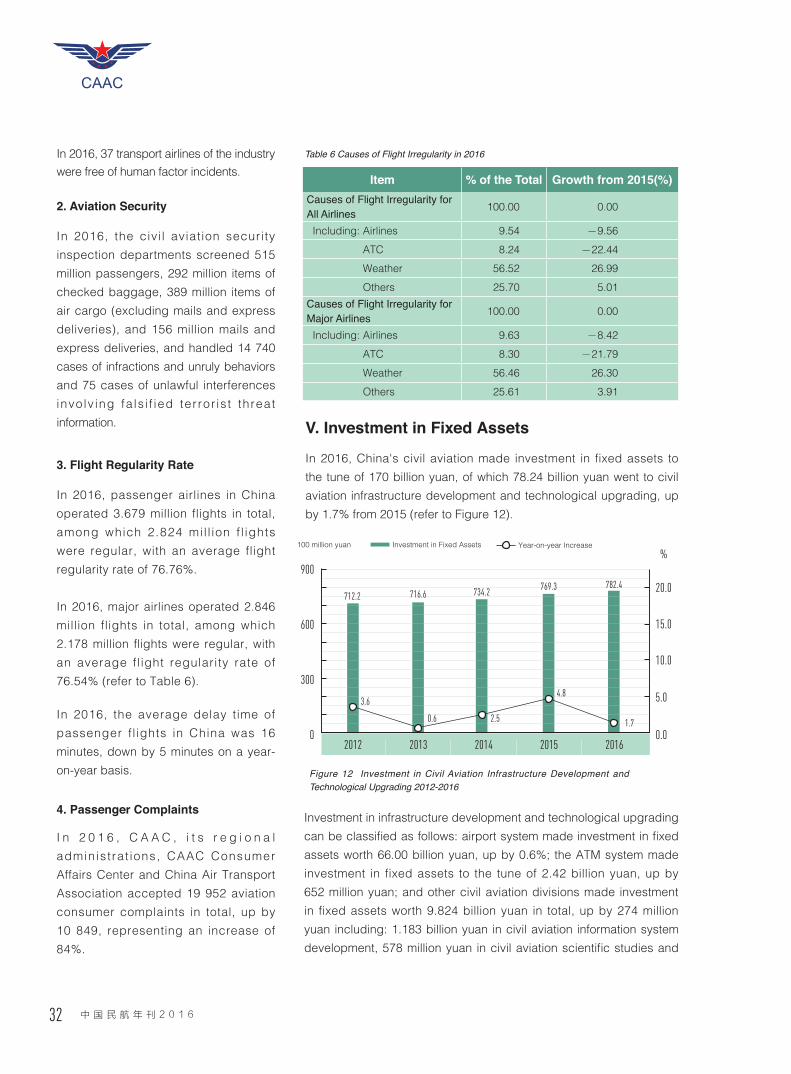
V. Investment in Fixed Assets
In 2016, China's civil aviation made investment in fixed assets to the tune of 170 billion yuan, of which 78.24 billion yuan went to civil aviation infrastructure development and technological upgrading, up by 1.7% from 2015 (refer to Figure 12).
Item % of the Total Growth from 2015(%)Causes of Flight Irregularity for All Airlines 100.00 0.00
Including: Airlines 9.54 -9.56 ATC 8.24 -22.44 Weather 56.52 26.99 Others 25.70 5.01
Causes of Flight Irregularity for Major Airlines 100.00 0.00
Including: Airlines 9.63 -8.42
ATC 8.30 -21.79 Weather 56.46 26.30 Others 25.61 3.91
Table 6 Causes of Flight Irregularity in 2016
100 million yuan Investment in Fixed Assets Year-on-year Increase
Figure 12 Investment in Civil Aviation Infrastructure Development and Technological Upgrading 2012-2016
2012
900
20.0
15.0
10.0
5.0
0.0
600
300
02013 2014 2015 2016
%
3.6
0.6 2.5
4.8
1.7
712.2 716.6 734.2 769.3 782.4
Investment in infrastructure development and technological upgrading can be classified as follows: airport system made investment in fixed assets worth 66.00 billion yuan, up by 0.6%; the ATM system made investment in fixed assets to the tune of 2.42 billion yuan, up by 652 million yuan; and other civil aviation divisions made investment in fixed assets worth 9.824 billion yuan in total, up by 274 million yuan including: 1.183 billion yuan in civil aviation information system development, 578 million yuan in civil aviation scientific studies and
CHINA CIVIL AVIATIONA N N U A L R E P O R T2016
中 国 民 航 年 刊
33China Civil Aviation Annual Report 2016
education system, 302 million yuan in civil aviation security system, 233 million yuan in civil aviation mechanic maintenance system, 1.477 billion yuan in transport service system, 1.113 billion yuan in public facility investment and 4.929 billion yuan in other systems.
VI. Energy Conservation and Emissions ReductionIn 2016, the ton-km energy consumption of China’s civil aviation stood at 0.293 kg, down by 13.82% from 2005 (the base year for the industry’s energy conservation and emissions reduction target); the energy consumption per passenger at airports fell by 8.4% from the end of the 12th Five-Year Plan period.
In 2016, CAAC actively promoted efforts across the whole industry to control and reduce energy consumption and emissions, and supported 67 projects meeting the requirements of Guide for Civil Aviation Energy Conservation and Emissions Reduction Fund Projects.
By the end of 2016, 90% of the airports with an annual traffic volume of over 5 million passengers completed the APU alternative equipment installation and put them into operation. 326 thousand flights used temporary routes, reducing a flight distance of 9.79 million km, saving fuel consumption of 53 thousand tons and cutting carbon dioxide emissions by 166 thousand tons.
VII. Education and Science and TechnologyIn 2016, the enrollment by universities and colleges directly under CAAC
totaled 20 633, among which, 970 were postgraduate students, 17 948 undergraduates and junior college students, and 1 715 adult students.
In 2016, the number of registered students at universities and colleges directly under CAAC stood at 71 078, among which 3 435 were postgraduate students, 60 598 undergraduates and junior college students, 7 045 were adult students.
In 2016, 16 843 students graduated from universities and colleges directly under CAAC in total, among which, there were 919 postgraduates, 14 006 undergraduates and junior college students, and 1 918 adult students.
In 2016, CAAC inspected and accepted a total of 28 scientific and technological achievements, and elected 26 for the awards for science and technology of CATA.
VIII. Number of PilotsBy the end of 2016, there were 50 504 licensed pilots in the industry, up by 4 981 from 2015 (refer to Table 7).
Table 7 Statistics of Civil Aviation Pilots of China in 2016
Type of License Number Year-on-year Increase
Aircraft
Private Pilot License 2 460 10Commercial Pilot License 25 244 2 374Airline Transport Pilot License 19 693 2 091
Multi-crew Pilot License 104 69Helicopter Pilot License 2 400 347Other Aircraft Pilot Licernse 708 99
IX. The Work of Trade UnionThrough the filing of National Civil Aviation Trade Union, 2 entities were awarded the National May 1st Prize for Labors, 5 outstanding individuals were awarded the National May 1st Medal for Labors, and 10 outstanding task forces were awarded the Honorary Title of Pioneering Worker.
In 2016, 411 entities, 26 632 task forces and 547 899 workers participated in the industrial competition of Safety and Health Cup.
In 2016, 135 outstanding entities and 44 outstanding individuals were commended in the activities of Safety and Health Cup 2014-2015.